North Miami, FL Map & Demographics
North Miami Map
North Miami Overview
$25,885
PER CAPITA INCOME
$53,001
AVG FAMILY INCOME
$49,069
AVG HOUSEHOLD INCOME
14.4%
WAGE / INCOME GAP [ % ]
85.6¢/ $1
WAGE / INCOME GAP [ $ ]
$8,874
FAMILY INCOME DEFICIT
0.48
INEQUALITY / GINI INDEX
59,854
TOTAL POPULATION
29,286
MALE POPULATION
30,568
FEMALE POPULATION
95.81
MALES / 100 FEMALES
104.38
FEMALES / 100 MALES
37.2
MEDIAN AGE
3.6
AVG FAMILY SIZE
2.9
AVG HOUSEHOLD SIZE
30,760
LABOR FORCE [ PEOPLE ]
64.1%
PERCENT IN LABOR FORCE
6.1%
UNEMPLOYMENT RATE
Income in North Miami
Income Overview in North Miami
Per Capita Income in North Miami is $25,885, while median incomes of families and households are $53,001 and $49,069 respectively.
| Characteristic | Number | Measure |
| Per Capita Income | 59,854 | $25,885 |
| Median Family Income | 13,230 | $53,001 |
| Mean Family Income | 13,230 | $79,220 |
| Median Household Income | 20,214 | $49,069 |
| Mean Household Income | 20,214 | $72,054 |
| Income Deficit | 13,230 | $8,874 |
| Wage / Income Gap (%) | 59,854 | 14.39% |
| Wage / Income Gap ($) | 59,854 | 85.61¢ per $1 |
| Gini / Inequality Index | 59,854 | 0.48 |
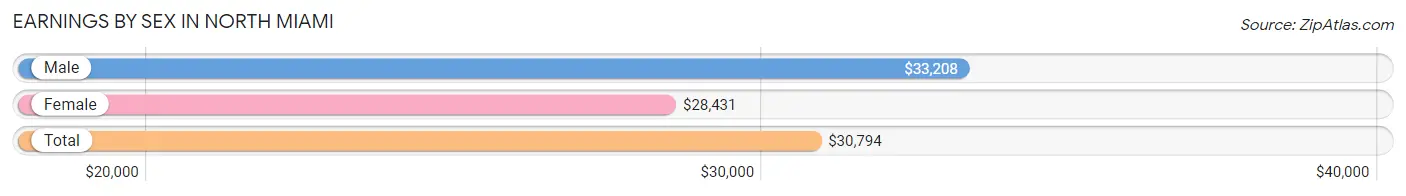
Earnings by Sex in North Miami
Average Earnings in North Miami are $30,794, $33,208 for men and $28,431 for women, a difference of 14.4%.
| Sex | Number | Average Earnings |
| Male | 16,081 (51.9%) | $33,208 |
| Female | 14,900 (48.1%) | $28,431 |
| Total | 30,981 (100.0%) | $30,794 |
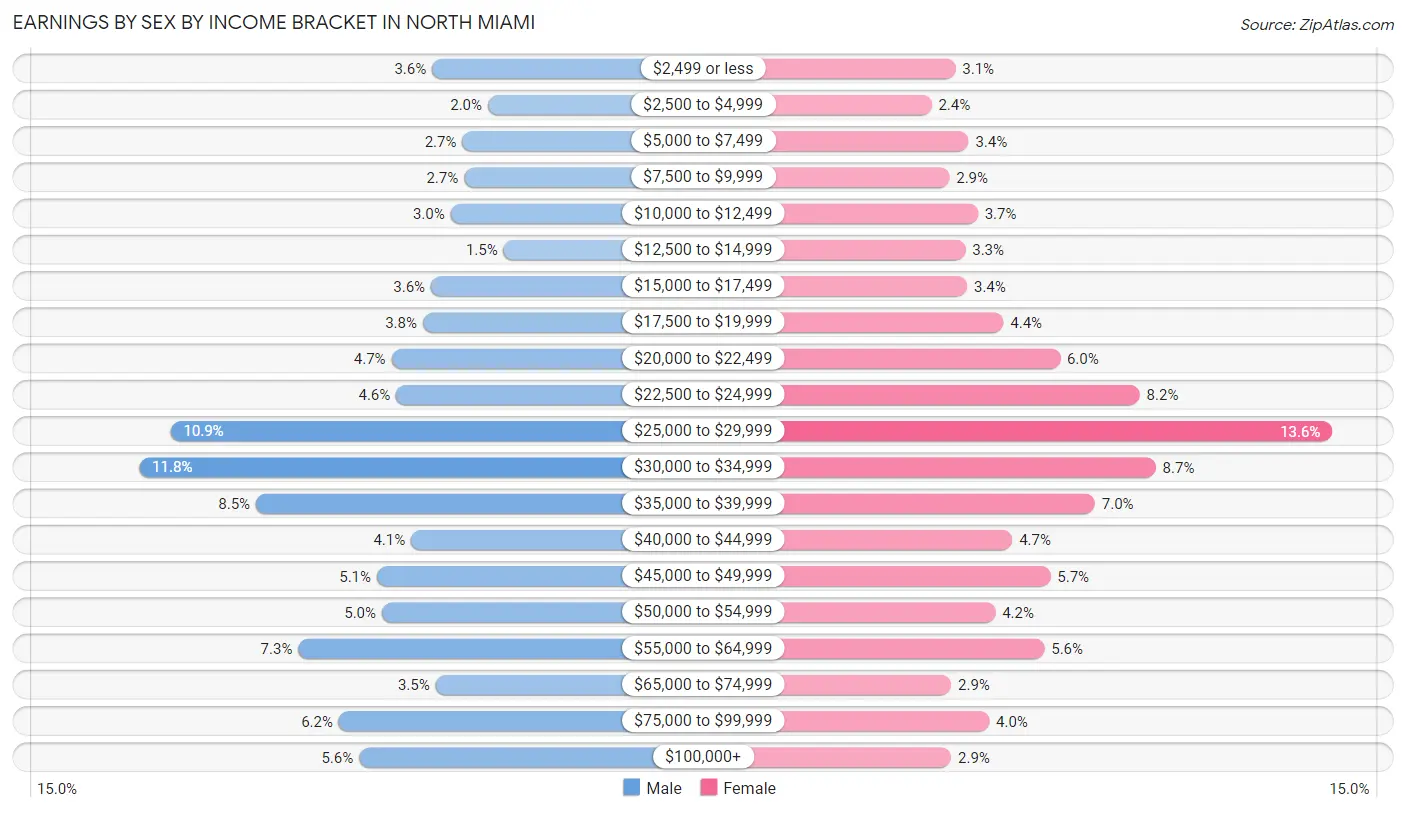
Earnings by Sex by Income Bracket in North Miami
The most common earnings brackets in North Miami are $30,000 to $34,999 for men (1,895 | 11.8%) and $25,000 to $29,999 for women (2,032 | 13.6%).
| Income | Male | Female |
| $2,499 or less | 571 (3.5%) | 455 (3.0%) |
| $2,500 to $4,999 | 318 (2.0%) | 354 (2.4%) |
| $5,000 to $7,499 | 434 (2.7%) | 510 (3.4%) |
| $7,500 to $9,999 | 426 (2.6%) | 429 (2.9%) |
| $10,000 to $12,499 | 488 (3.0%) | 548 (3.7%) |
| $12,500 to $14,999 | 247 (1.5%) | 496 (3.3%) |
| $15,000 to $17,499 | 575 (3.6%) | 504 (3.4%) |
| $17,500 to $19,999 | 613 (3.8%) | 656 (4.4%) |
| $20,000 to $22,499 | 754 (4.7%) | 893 (6.0%) |
| $22,500 to $24,999 | 734 (4.6%) | 1,227 (8.2%) |
| $25,000 to $29,999 | 1,753 (10.9%) | 2,032 (13.6%) |
| $30,000 to $34,999 | 1,895 (11.8%) | 1,294 (8.7%) |
| $35,000 to $39,999 | 1,367 (8.5%) | 1,039 (7.0%) |
| $40,000 to $44,999 | 666 (4.1%) | 693 (4.6%) |
| $45,000 to $49,999 | 820 (5.1%) | 852 (5.7%) |
| $50,000 to $54,999 | 797 (5.0%) | 622 (4.2%) |
| $55,000 to $64,999 | 1,175 (7.3%) | 827 (5.6%) |
| $65,000 to $74,999 | 555 (3.5%) | 437 (2.9%) |
| $75,000 to $99,999 | 993 (6.2%) | 596 (4.0%) |
| $100,000+ | 900 (5.6%) | 436 (2.9%) |
| Total | 16,081 (100.0%) | 14,900 (100.0%) |
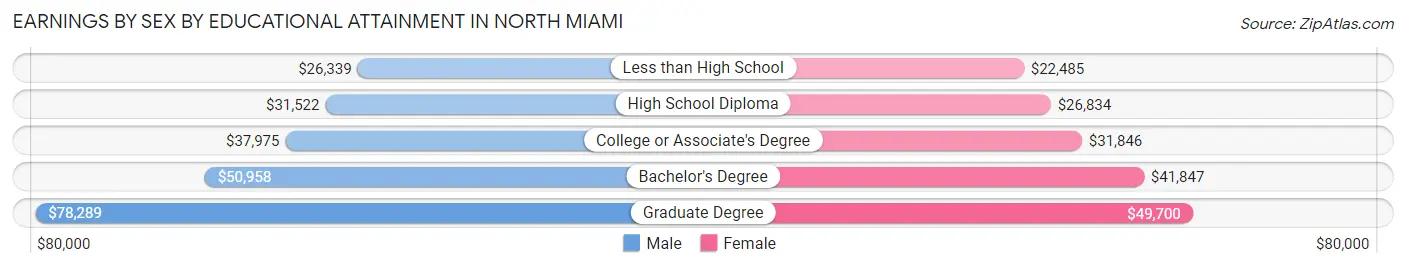
Earnings by Sex by Educational Attainment in North Miami
Average earnings in North Miami are $34,505 for men and $29,697 for women, a difference of 13.9%. Men with an educational attainment of graduate degree enjoy the highest average annual earnings of $78,289, while those with less than high school education earn the least with $26,339. Women with an educational attainment of graduate degree earn the most with the average annual earnings of $49,700, while those with less than high school education have the smallest earnings of $22,485.
| Educational Attainment | Male Income | Female Income |
| Less than High School | $26,339 | $22,485 |
| High School Diploma | $31,522 | $26,834 |
| College or Associate's Degree | $37,975 | $31,846 |
| Bachelor's Degree | $50,958 | $41,847 |
| Graduate Degree | $78,289 | $49,700 |
| Total | $34,505 | $29,697 |
Family Income in North Miami
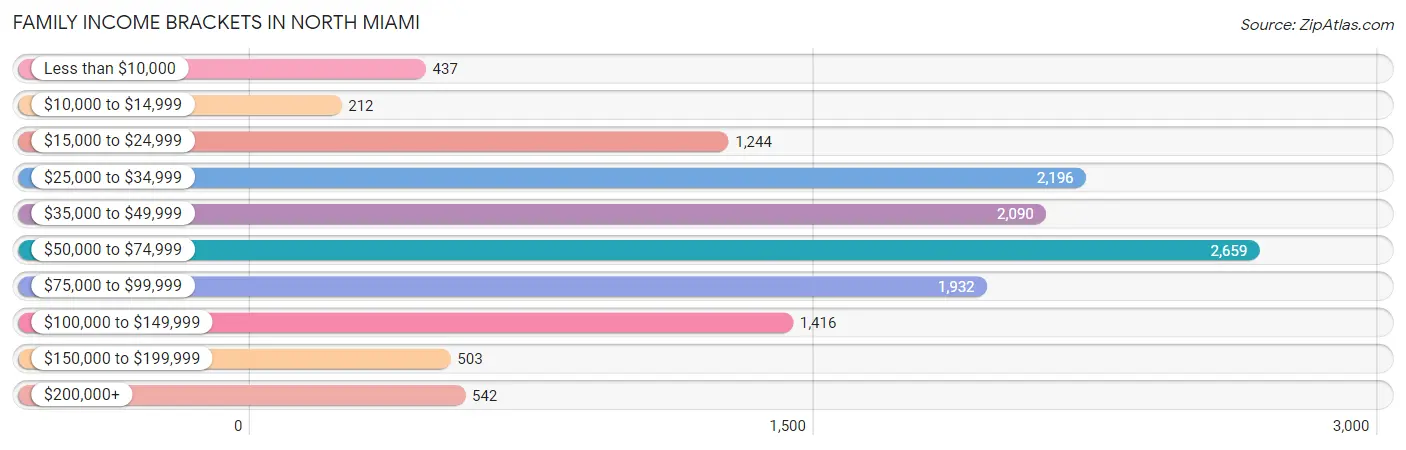
Family Income Brackets in North Miami
According to the North Miami family income data, there are 2,659 families falling into the $50,000 to $74,999 income range, which is the most common income bracket and makes up 20.1% of all families. Conversely, the $10,000 to $14,999 income bracket is the least frequent group with only 212 families (1.6%) belonging to this category.
| Income Bracket | # Families | % Families |
| Less than $10,000 | 437 | 3.3% |
| $10,000 to $14,999 | 212 | 1.6% |
| $15,000 to $24,999 | 1,244 | 9.4% |
| $25,000 to $34,999 | 2,196 | 16.6% |
| $35,000 to $49,999 | 2,090 | 15.8% |
| $50,000 to $74,999 | 2,659 | 20.1% |
| $75,000 to $99,999 | 1,932 | 14.6% |
| $100,000 to $149,999 | 1,416 | 10.7% |
| $150,000 to $199,999 | 503 | 3.8% |
| $200,000+ | 542 | 4.1% |
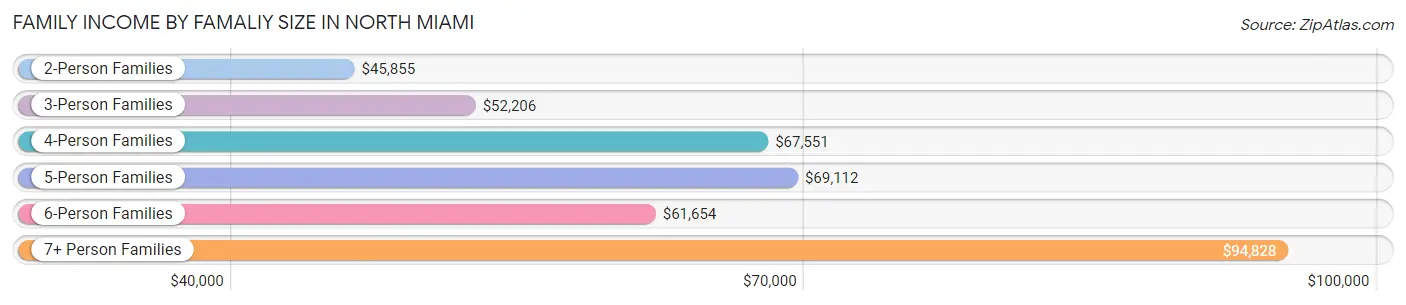
Family Income by Famaliy Size in North Miami
7+ person families (240 | 1.8%) account for the highest median family income in North Miami with $94,828 per family, while 2-person families (5,087 | 38.5%) have the highest median income of $22,928 per family member.
| Income Bracket | # Families | Median Income |
| 2-Person Families | 5,087 (38.5%) | $45,855 |
| 3-Person Families | 3,571 (27.0%) | $52,206 |
| 4-Person Families | 2,136 (16.2%) | $67,551 |
| 5-Person Families | 1,303 (9.9%) | $69,112 |
| 6-Person Families | 893 (6.8%) | $61,654 |
| 7+ Person Families | 240 (1.8%) | $94,828 |
| Total | 13,230 (100.0%) | $53,001 |
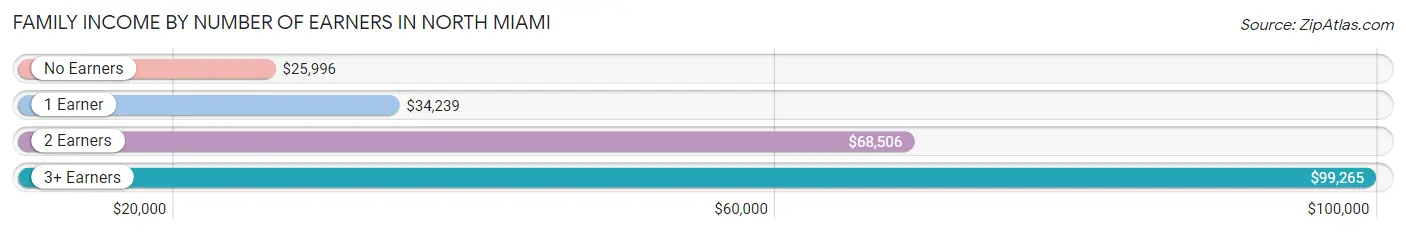
Family Income by Number of Earners in North Miami
The median family income in North Miami is $53,001, with families comprising 3+ earners (1,730) having the highest median family income of $99,265, while families with no earners (1,142) have the lowest median family income of $25,996, accounting for 13.1% and 8.6% of families, respectively.
| Number of Earners | # Families | Median Income |
| No Earners | 1,142 (8.6%) | $25,996 |
| 1 Earner | 5,219 (39.5%) | $34,239 |
| 2 Earners | 5,139 (38.8%) | $68,506 |
| 3+ Earners | 1,730 (13.1%) | $99,265 |
| Total | 13,230 (100.0%) | $53,001 |
Household Income in North Miami
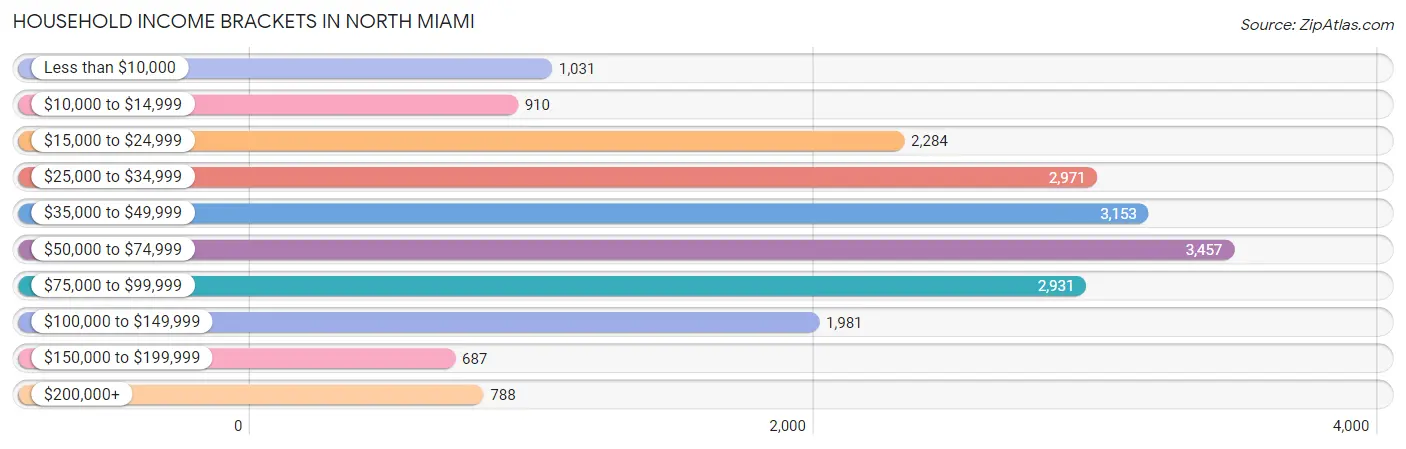
Household Income Brackets in North Miami
With 3,457 households falling in the category, the $50,000 to $74,999 income range is the most frequent in North Miami, accounting for 17.1% of all households. In contrast, only 687 households (3.4%) fall into the $150,000 to $199,999 income bracket, making it the least populous group.
| Income Bracket | # Households | % Households |
| Less than $10,000 | 1,031 | 5.1% |
| $10,000 to $14,999 | 910 | 4.5% |
| $15,000 to $24,999 | 2,284 | 11.3% |
| $25,000 to $34,999 | 2,971 | 14.7% |
| $35,000 to $49,999 | 3,153 | 15.6% |
| $50,000 to $74,999 | 3,457 | 17.1% |
| $75,000 to $99,999 | 2,931 | 14.5% |
| $100,000 to $149,999 | 1,981 | 9.8% |
| $150,000 to $199,999 | 687 | 3.4% |
| $200,000+ | 788 | 3.9% |
Household Income by Householder Age in North Miami
The median household income in North Miami is $49,069, with the highest median household income of $58,708 found in the 45 to 64 years age bracket for the primary householder. A total of 8,007 households (39.6%) fall into this category. Meanwhile, the 65+ years age bracket for the primary householder has the lowest median household income of $34,909, with 4,030 households (19.9%) in this group.
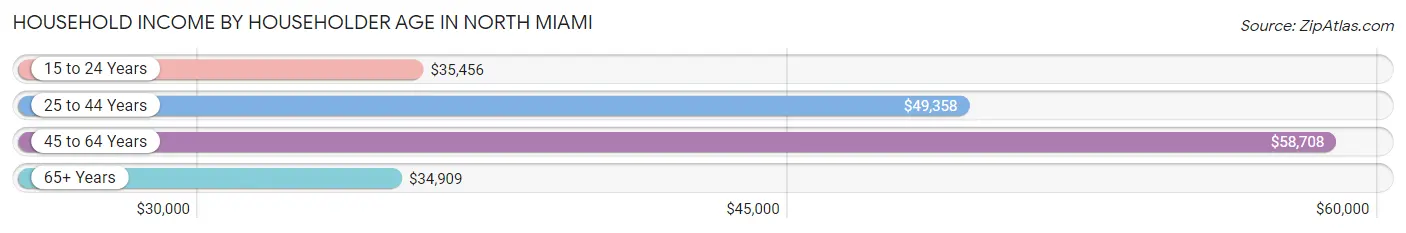
| Income Bracket | # Households | Median Income |
| 15 to 24 Years | 782 (3.9%) | $35,456 |
| 25 to 44 Years | 7,395 (36.6%) | $49,358 |
| 45 to 64 Years | 8,007 (39.6%) | $58,708 |
| 65+ Years | 4,030 (19.9%) | $34,909 |
| Total | 20,214 (100.0%) | $49,069 |
Poverty in North Miami
Income Below Poverty by Sex and Age in North Miami
With 17.1% poverty level for males and 20.6% for females among the residents of North Miami, 15 year old males and 12 to 14 year old females are the most vulnerable to poverty, with 217 males (58.2%) and 381 females (34.1%) in their respective age groups living below the poverty level.
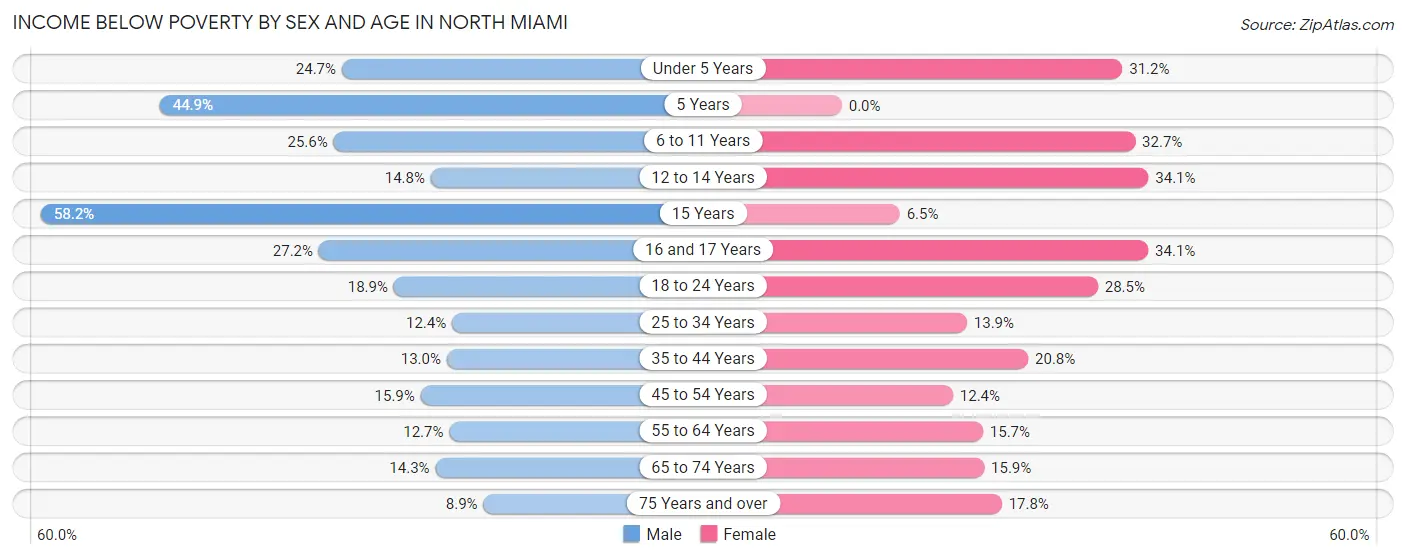
| Age Bracket | Male | Female |
| Under 5 Years | 487 (24.7%) | 693 (31.2%) |
| 5 Years | 244 (44.9%) | 0 (0.0%) |
| 6 to 11 Years | 568 (25.6%) | 593 (32.7%) |
| 12 to 14 Years | 152 (14.8%) | 381 (34.1%) |
| 15 Years | 217 (58.2%) | 22 (6.5%) |
| 16 and 17 Years | 217 (27.2%) | 216 (34.1%) |
| 18 to 24 Years | 441 (18.9%) | 942 (28.5%) |
| 25 to 34 Years | 540 (12.4%) | 583 (13.9%) |
| 35 to 44 Years | 545 (13.0%) | 1,014 (20.7%) |
| 45 to 54 Years | 601 (15.9%) | 374 (12.4%) |
| 55 to 64 Years | 434 (12.7%) | 600 (15.7%) |
| 65 to 74 Years | 302 (14.2%) | 401 (15.9%) |
| 75 Years and over | 122 (8.9%) | 276 (17.8%) |
| Total | 4,870 (17.1%) | 6,095 (20.6%) |
Income Above Poverty by Sex and Age in North Miami
According to the poverty statistics in North Miami, males aged 75 years and over and females aged 5 years are the age groups that are most secure financially, with 91.1% of males and 100.0% of females in these age groups living above the poverty line.
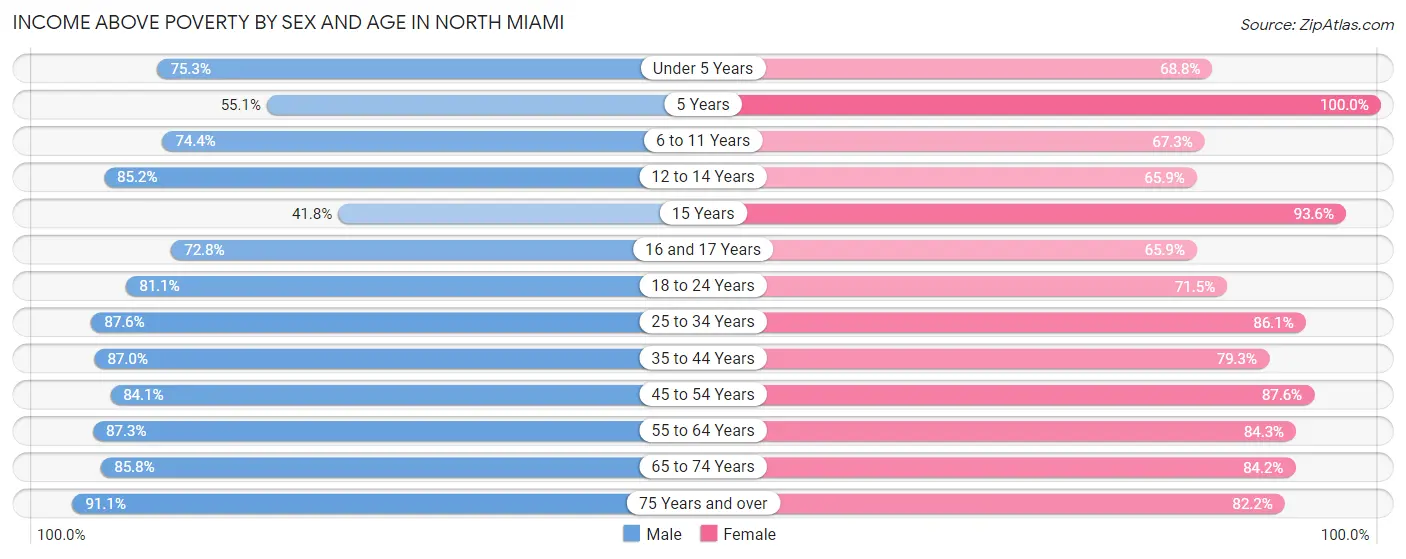
| Age Bracket | Male | Female |
| Under 5 Years | 1,487 (75.3%) | 1,525 (68.8%) |
| 5 Years | 299 (55.1%) | 122 (100.0%) |
| 6 to 11 Years | 1,652 (74.4%) | 1,222 (67.3%) |
| 12 to 14 Years | 878 (85.2%) | 735 (65.9%) |
| 15 Years | 156 (41.8%) | 319 (93.5%) |
| 16 and 17 Years | 580 (72.8%) | 417 (65.9%) |
| 18 to 24 Years | 1,895 (81.1%) | 2,362 (71.5%) |
| 25 to 34 Years | 3,816 (87.6%) | 3,603 (86.1%) |
| 35 to 44 Years | 3,653 (87.0%) | 3,873 (79.2%) |
| 45 to 54 Years | 3,178 (84.1%) | 2,649 (87.6%) |
| 55 to 64 Years | 2,982 (87.3%) | 3,220 (84.3%) |
| 65 to 74 Years | 1,818 (85.8%) | 2,129 (84.2%) |
| 75 Years and over | 1,249 (91.1%) | 1,274 (82.2%) |
| Total | 23,643 (82.9%) | 23,450 (79.4%) |
Income Below Poverty Among Married-Couple Families in North Miami
The poverty statistics for married-couple families in North Miami show that 10.2% or 774 of the total 7,601 families live below the poverty line. Families with 5 or more children have the highest poverty rate of 100.0%, comprising of 2 families. On the other hand, families with no children have the lowest poverty rate of 4.5%, which includes 178 families.
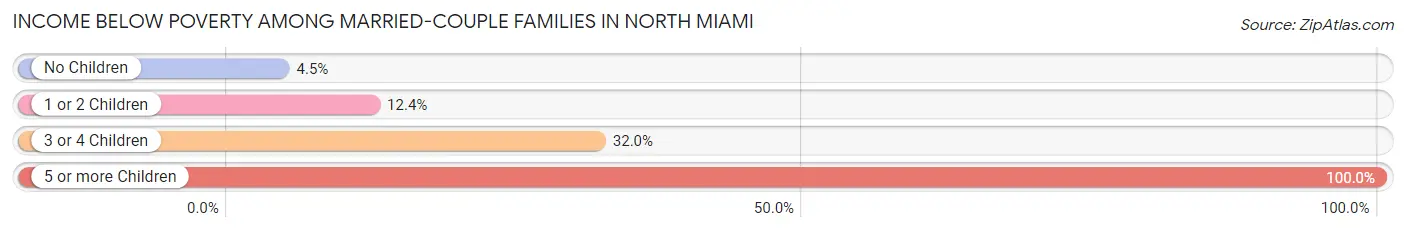
| Children | Above Poverty | Below Poverty |
| No Children | 3,785 (95.5%) | 178 (4.5%) |
| 1 or 2 Children | 2,543 (87.6%) | 359 (12.4%) |
| 3 or 4 Children | 499 (68.0%) | 235 (32.0%) |
| 5 or more Children | 0 (0.0%) | 2 (100.0%) |
| Total | 6,827 (89.8%) | 774 (10.2%) |
Income Below Poverty Among Single-Parent Households in North Miami
According to the poverty data in North Miami, 16.3% or 292 single-father households and 24.1% or 926 single-mother households are living below the poverty line. Among single-father households, those with 3 or 4 children have the highest poverty rate, with 135 households (64.0%) experiencing poverty. Likewise, among single-mother households, those with 3 or 4 children have the highest poverty rate, with 175 households (70.6%) falling below the poverty line.
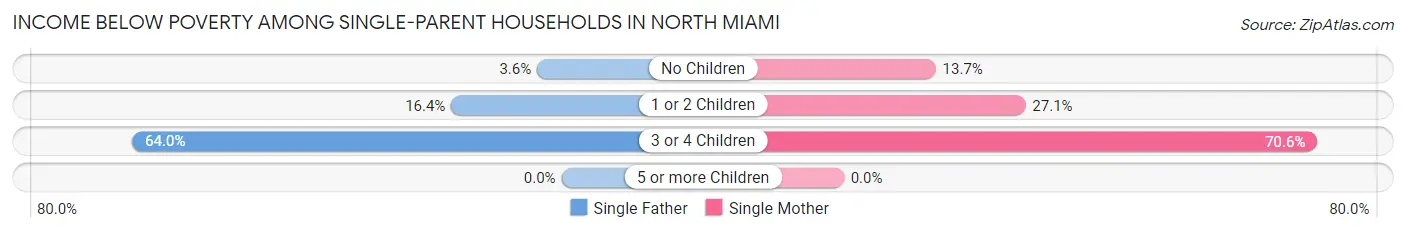
| Children | Single Father | Single Mother |
| No Children | 29 (3.6%) | 228 (13.7%) |
| 1 or 2 Children | 128 (16.4%) | 523 (27.1%) |
| 3 or 4 Children | 135 (64.0%) | 175 (70.6%) |
| 5 or more Children | 0 (0.0%) | 0 (0.0%) |
| Total | 292 (16.3%) | 926 (24.1%) |
Income Below Poverty Among Married-Couple vs Single-Parent Households in North Miami
The poverty data for North Miami shows that 774 of the married-couple family households (10.2%) and 1,218 of the single-parent households (21.6%) are living below the poverty level. Within the married-couple family households, those with 5 or more children have the highest poverty rate, with 2 households (100.0%) falling below the poverty line. Among the single-parent households, those with 3 or 4 children have the highest poverty rate, with 310 household (67.5%) living below poverty.
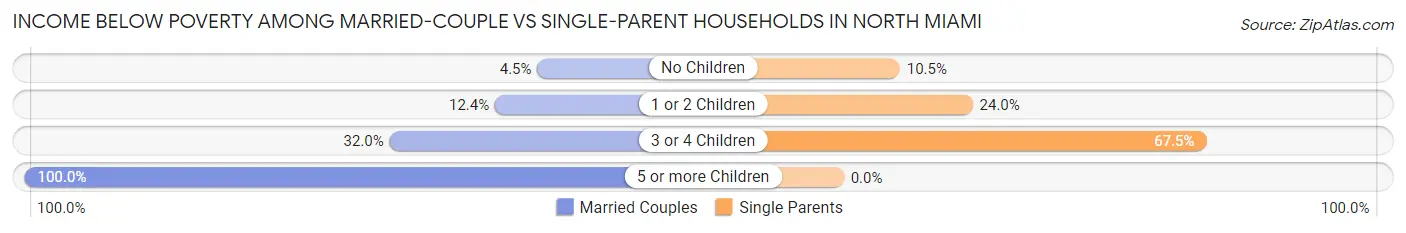
| Children | Married-Couple Families | Single-Parent Households |
| No Children | 178 (4.5%) | 257 (10.4%) |
| 1 or 2 Children | 359 (12.4%) | 651 (24.0%) |
| 3 or 4 Children | 235 (32.0%) | 310 (67.5%) |
| 5 or more Children | 2 (100.0%) | 0 (0.0%) |
| Total | 774 (10.2%) | 1,218 (21.6%) |
Race in North Miami
The most populous races in North Miami are Black / African American (33,600 | 56.1%), Hispanic or Latino (19,205 | 32.1%), and White / Caucasian (14,958 | 25.0%).
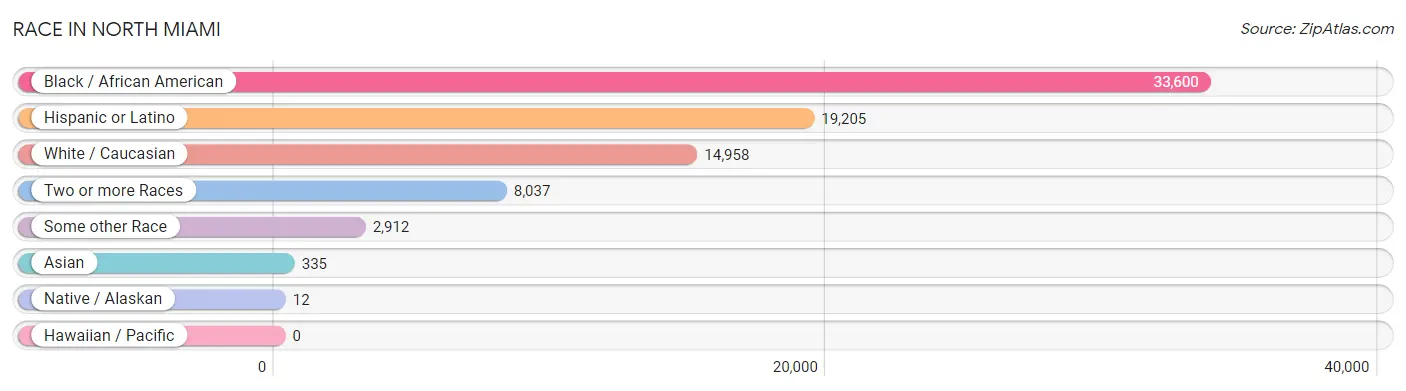
| Race | # Population | % Population |
| Asian | 335 | 0.6% |
| Black / African American | 33,600 | 56.1% |
| Hawaiian / Pacific | 0 | 0.0% |
| Hispanic or Latino | 19,205 | 32.1% |
| Native / Alaskan | 12 | 0.0% |
| White / Caucasian | 14,958 | 25.0% |
| Two or more Races | 8,037 | 13.4% |
| Some other Race | 2,912 | 4.9% |
| Total | 59,854 | 100.0% |
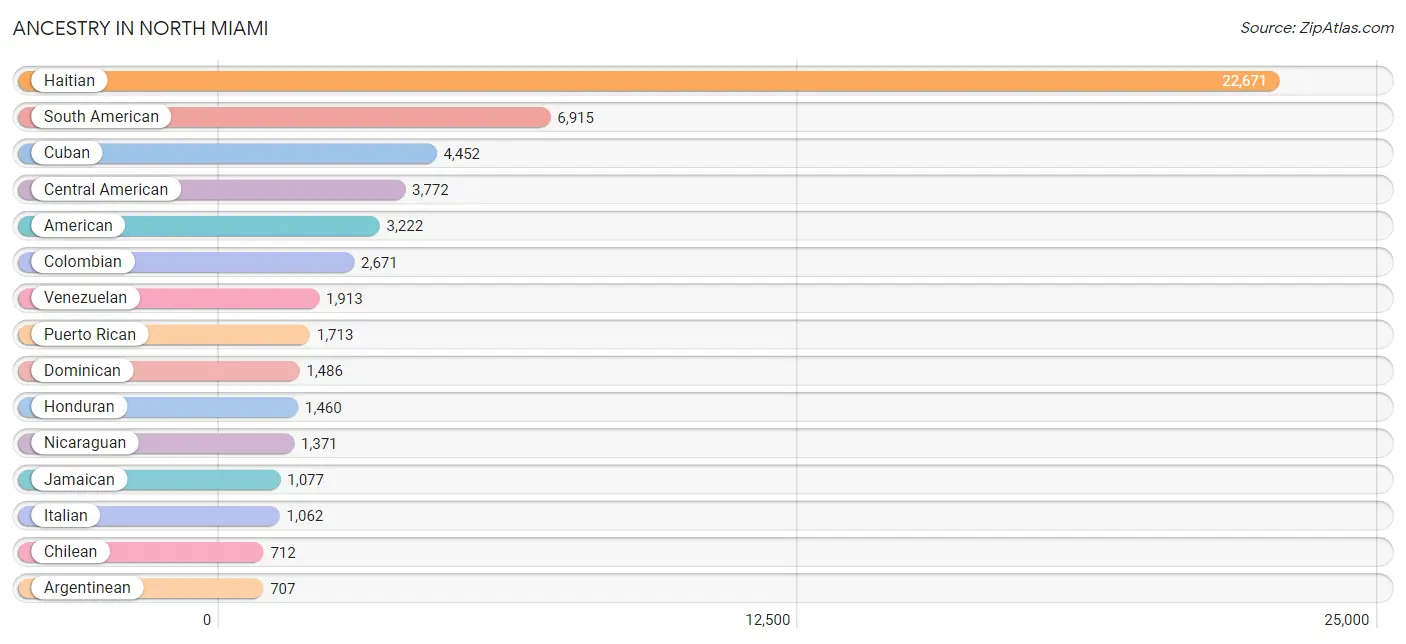
Ancestry in North Miami
The most populous ancestries reported in North Miami are Haitian (22,671 | 37.9%), South American (6,915 | 11.6%), Cuban (4,452 | 7.4%), Central American (3,772 | 6.3%), and American (3,222 | 5.4%), together accounting for 68.5% of all North Miami residents.
| Ancestry | # Population | % Population |
| Afghan | 4 | 0.0% |
| African | 277 | 0.5% |
| American | 3,222 | 5.4% |
| Arab | 319 | 0.5% |
| Argentinean | 707 | 1.2% |
| Austrian | 20 | 0.0% |
| Bahamian | 477 | 0.8% |
| Barbadian | 37 | 0.1% |
| Belizean | 11 | 0.0% |
| Bhutanese | 24 | 0.0% |
| Bolivian | 70 | 0.1% |
| Brazilian | 548 | 0.9% |
| British | 100 | 0.2% |
| British West Indian | 72 | 0.1% |
| Bulgarian | 52 | 0.1% |
| Burmese | 10 | 0.0% |
| Canadian | 7 | 0.0% |
| Central American | 3,772 | 6.3% |
| Central American Indian | 52 | 0.1% |
| Cherokee | 21 | 0.0% |
| Chilean | 712 | 1.2% |
| Colombian | 2,671 | 4.5% |
| Costa Rican | 64 | 0.1% |
| Croatian | 27 | 0.1% |
| Cuban | 4,452 | 7.4% |
| Czech | 16 | 0.0% |
| Czechoslovakian | 8 | 0.0% |
| Danish | 16 | 0.0% |
| Dominican | 1,486 | 2.5% |
| Dutch | 56 | 0.1% |
| Dutch West Indian | 22 | 0.0% |
| Eastern European | 35 | 0.1% |
| Ecuadorian | 255 | 0.4% |
| Egyptian | 42 | 0.1% |
| English | 382 | 0.6% |
| Estonian | 10 | 0.0% |
| European | 289 | 0.5% |
| Filipino | 12 | 0.0% |
| Finnish | 3 | 0.0% |
| French | 511 | 0.9% |
| French Canadian | 10 | 0.0% |
| German | 515 | 0.9% |
| Greek | 26 | 0.0% |
| Guatemalan | 329 | 0.5% |
| Guyanese | 56 | 0.1% |
| Haitian | 22,671 | 37.9% |
| Honduran | 1,460 | 2.4% |
| Hungarian | 43 | 0.1% |
| Indian (Asian) | 184 | 0.3% |
| Irish | 305 | 0.5% |
| Israeli | 78 | 0.1% |
| Italian | 1,062 | 1.8% |
| Jamaican | 1,077 | 1.8% |
| Japanese | 16 | 0.0% |
| Korean | 81 | 0.1% |
| Latvian | 3 | 0.0% |
| Lebanese | 121 | 0.2% |
| Lithuanian | 6 | 0.0% |
| Mexican | 399 | 0.7% |
| Mongolian | 49 | 0.1% |
| Moroccan | 107 | 0.2% |
| Nicaraguan | 1,371 | 2.3% |
| Nigerian | 143 | 0.2% |
| Norwegian | 42 | 0.1% |
| Ottawa | 10 | 0.0% |
| Palestinian | 5 | 0.0% |
| Panamanian | 332 | 0.5% |
| Paraguayan | 36 | 0.1% |
| Peruvian | 460 | 0.8% |
| Polish | 210 | 0.4% |
| Portuguese | 70 | 0.1% |
| Puerto Rican | 1,713 | 2.9% |
| Romanian | 13 | 0.0% |
| Russian | 345 | 0.6% |
| Salvadoran | 111 | 0.2% |
| Scandinavian | 10 | 0.0% |
| Scotch-Irish | 3 | 0.0% |
| Scottish | 87 | 0.2% |
| Serbian | 26 | 0.0% |
| Slovak | 14 | 0.0% |
| South African | 28 | 0.1% |
| South American | 6,915 | 11.6% |
| South American Indian | 12 | 0.0% |
| Spaniard | 90 | 0.2% |
| Spanish | 95 | 0.2% |
| Sri Lankan | 2 | 0.0% |
| Subsaharan African | 448 | 0.7% |
| Swedish | 4 | 0.0% |
| Swiss | 11 | 0.0% |
| Thai | 48 | 0.1% |
| Trinidadian and Tobagonian | 60 | 0.1% |
| Turkish | 31 | 0.1% |
| Ukrainian | 6 | 0.0% |
| Uruguayan | 91 | 0.2% |
| Venezuelan | 1,913 | 3.2% |
| Welsh | 18 | 0.0% |
| West Indian | 20 | 0.0% | View All 97 Rows |
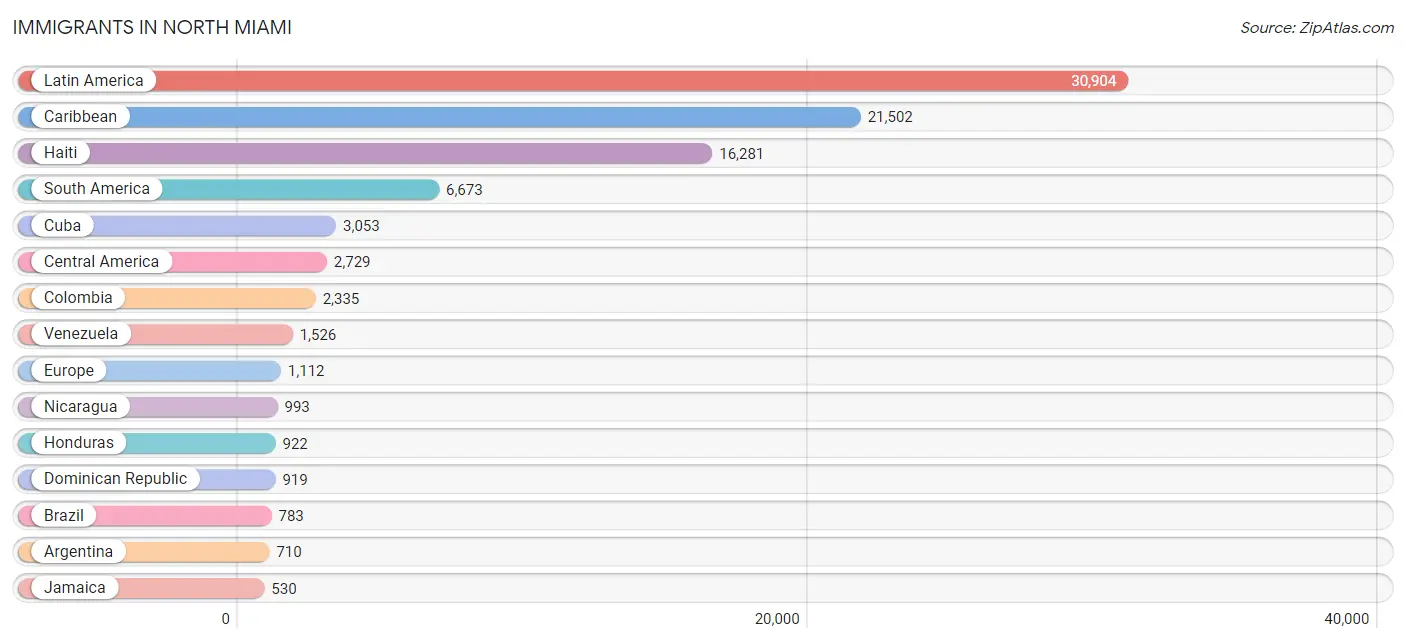
Immigrants in North Miami
The most numerous immigrant groups reported in North Miami came from Latin America (30,904 | 51.6%), Caribbean (21,502 | 35.9%), Haiti (16,281 | 27.2%), South America (6,673 | 11.2%), and Cuba (3,053 | 5.1%), together accounting for 131.0% of all North Miami residents.
| Immigration Origin | # Population | % Population |
| Afghanistan | 4 | 0.0% |
| Africa | 221 | 0.4% |
| Argentina | 710 | 1.2% |
| Asia | 446 | 0.7% |
| Australia | 13 | 0.0% |
| Bahamas | 502 | 0.8% |
| Barbados | 24 | 0.0% |
| Belarus | 4 | 0.0% |
| Bolivia | 38 | 0.1% |
| Bosnia and Herzegovina | 21 | 0.0% |
| Brazil | 783 | 1.3% |
| Bulgaria | 84 | 0.1% |
| Cambodia | 9 | 0.0% |
| Canada | 129 | 0.2% |
| Caribbean | 21,502 | 35.9% |
| Central America | 2,729 | 4.6% |
| Chile | 471 | 0.8% |
| China | 81 | 0.1% |
| Colombia | 2,335 | 3.9% |
| Costa Rica | 88 | 0.2% |
| Cuba | 3,053 | 5.1% |
| Czechoslovakia | 30 | 0.1% |
| Dominica | 29 | 0.1% |
| Dominican Republic | 919 | 1.5% |
| Eastern Africa | 5 | 0.0% |
| Eastern Asia | 105 | 0.2% |
| Eastern Europe | 391 | 0.6% |
| Ecuador | 218 | 0.4% |
| Egypt | 22 | 0.0% |
| El Salvador | 43 | 0.1% |
| England | 160 | 0.3% |
| Europe | 1,112 | 1.9% |
| France | 102 | 0.2% |
| Germany | 82 | 0.1% |
| Guatemala | 224 | 0.4% |
| Guyana | 52 | 0.1% |
| Haiti | 16,281 | 27.2% |
| Honduras | 922 | 1.5% |
| Hungary | 13 | 0.0% |
| India | 91 | 0.2% |
| Iraq | 6 | 0.0% |
| Israel | 34 | 0.1% |
| Italy | 182 | 0.3% |
| Jamaica | 530 | 0.9% |
| Japan | 24 | 0.0% |
| Latin America | 30,904 | 51.6% |
| Lebanon | 7 | 0.0% |
| Malaysia | 43 | 0.1% |
| Mexico | 227 | 0.4% |
| Morocco | 15 | 0.0% |
| Netherlands | 24 | 0.0% |
| Nicaragua | 993 | 1.7% |
| Nigeria | 137 | 0.2% |
| Northern Africa | 44 | 0.1% |
| Northern Europe | 241 | 0.4% |
| Norway | 17 | 0.0% |
| Oceania | 13 | 0.0% |
| Panama | 168 | 0.3% |
| Peru | 389 | 0.6% |
| Philippines | 98 | 0.2% |
| Poland | 39 | 0.1% |
| Russia | 148 | 0.3% |
| Serbia | 5 | 0.0% |
| South Africa | 35 | 0.1% |
| South America | 6,673 | 11.2% |
| South Central Asia | 99 | 0.2% |
| South Eastern Asia | 164 | 0.3% |
| Southern Europe | 272 | 0.4% |
| Spain | 90 | 0.2% |
| Sudan | 7 | 0.0% |
| Taiwan | 13 | 0.0% |
| Trinidad and Tobago | 27 | 0.1% |
| Turkey | 31 | 0.1% |
| Uganda | 5 | 0.0% |
| Ukraine | 47 | 0.1% |
| Uruguay | 108 | 0.2% |
| Uzbekistan | 4 | 0.0% |
| Venezuela | 1,526 | 2.5% |
| Vietnam | 14 | 0.0% |
| Western Africa | 137 | 0.2% |
| Western Asia | 78 | 0.1% |
| Western Europe | 208 | 0.4% | View All 82 Rows |
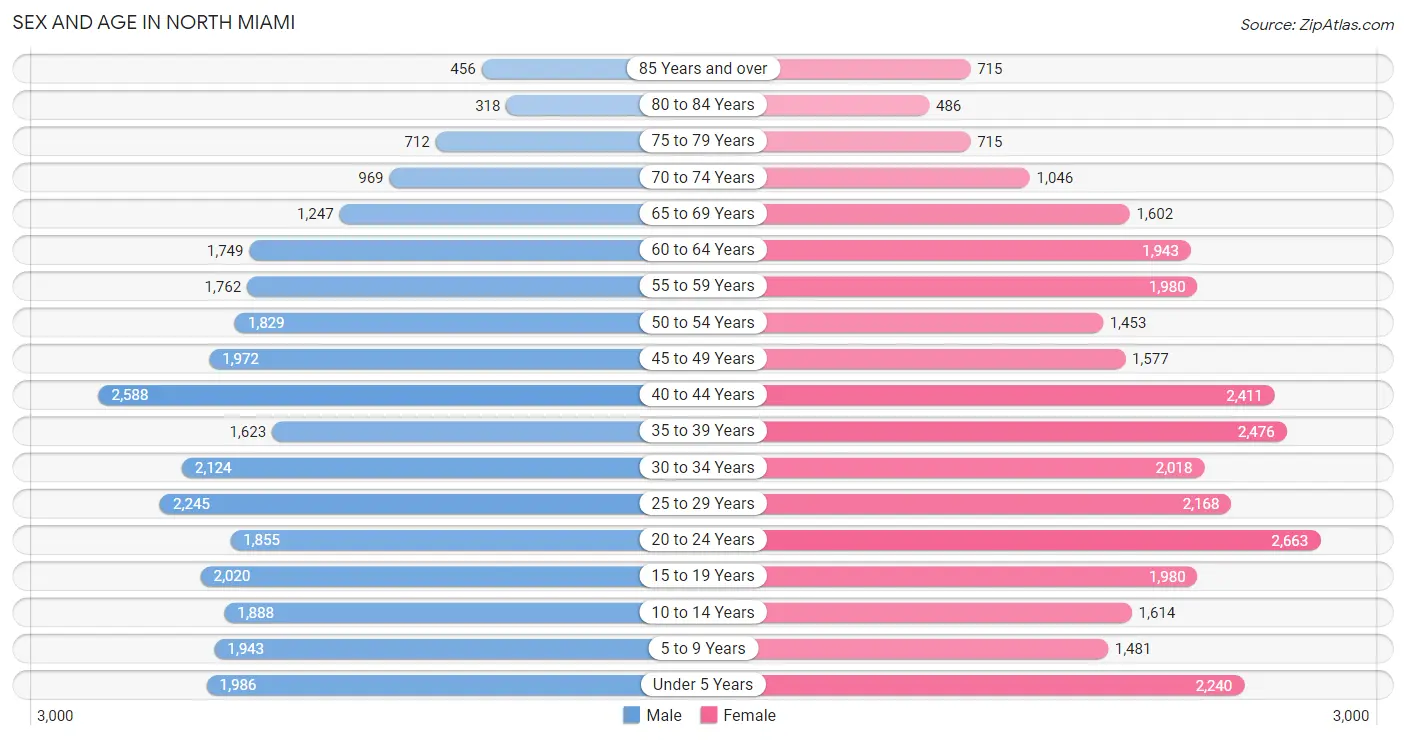
Sex and Age in North Miami
Sex and Age in North Miami
The most populous age groups in North Miami are 40 to 44 Years (2,588 | 8.8%) for men and 20 to 24 Years (2,663 | 8.7%) for women.
| Age Bracket | Male | Female |
| Under 5 Years | 1,986 (6.8%) | 2,240 (7.3%) |
| 5 to 9 Years | 1,943 (6.6%) | 1,481 (4.8%) |
| 10 to 14 Years | 1,888 (6.5%) | 1,614 (5.3%) |
| 15 to 19 Years | 2,020 (6.9%) | 1,980 (6.5%) |
| 20 to 24 Years | 1,855 (6.3%) | 2,663 (8.7%) |
| 25 to 29 Years | 2,245 (7.7%) | 2,168 (7.1%) |
| 30 to 34 Years | 2,124 (7.2%) | 2,018 (6.6%) |
| 35 to 39 Years | 1,623 (5.5%) | 2,476 (8.1%) |
| 40 to 44 Years | 2,588 (8.8%) | 2,411 (7.9%) |
| 45 to 49 Years | 1,972 (6.7%) | 1,577 (5.2%) |
| 50 to 54 Years | 1,829 (6.2%) | 1,453 (4.8%) |
| 55 to 59 Years | 1,762 (6.0%) | 1,980 (6.5%) |
| 60 to 64 Years | 1,749 (6.0%) | 1,943 (6.4%) |
| 65 to 69 Years | 1,247 (4.3%) | 1,602 (5.2%) |
| 70 to 74 Years | 969 (3.3%) | 1,046 (3.4%) |
| 75 to 79 Years | 712 (2.4%) | 715 (2.3%) |
| 80 to 84 Years | 318 (1.1%) | 486 (1.6%) |
| 85 Years and over | 456 (1.6%) | 715 (2.3%) |
| Total | 29,286 (100.0%) | 30,568 (100.0%) |
Families and Households in North Miami
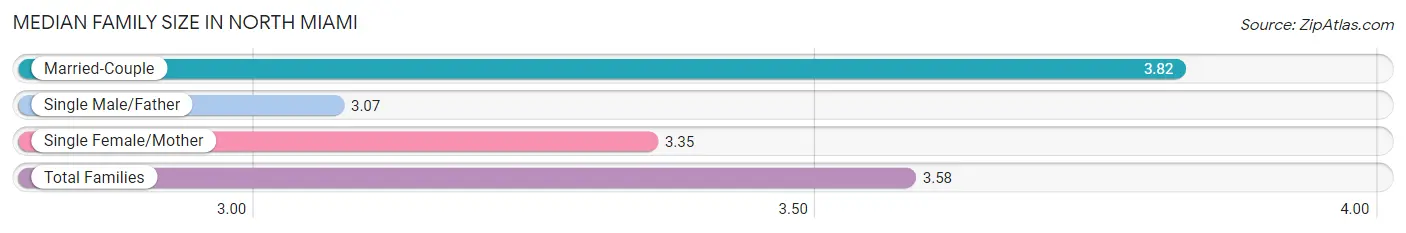
Median Family Size in North Miami
The median family size in North Miami is 3.58 persons per family, with married-couple families (7,601 | 57.5%) accounting for the largest median family size of 3.82 persons per family. On the other hand, single male/father families (1,787 | 13.5%) represent the smallest median family size with 3.07 persons per family.
| Family Type | # Families | Family Size |
| Married-Couple | 7,601 (57.5%) | 3.82 |
| Single Male/Father | 1,787 (13.5%) | 3.07 |
| Single Female/Mother | 3,842 (29.0%) | 3.35 |
| Total Families | 13,230 (100.0%) | 3.58 |
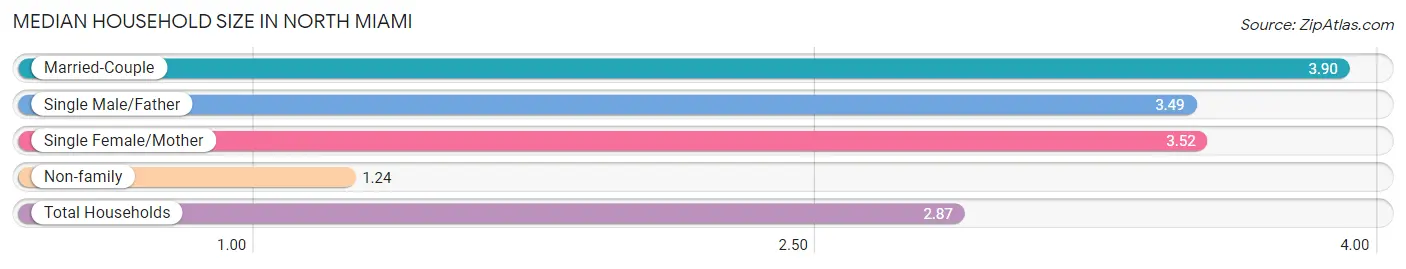
Median Household Size in North Miami
The median household size in North Miami is 2.87 persons per household, with married-couple households (7,601 | 37.6%) accounting for the largest median household size of 3.9 persons per household. non-family households (6,984 | 34.5%) represent the smallest median household size with 1.24 persons per household.
| Household Type | # Households | Household Size |
| Married-Couple | 7,601 (37.6%) | 3.90 |
| Single Male/Father | 1,787 (8.8%) | 3.49 |
| Single Female/Mother | 3,842 (19.0%) | 3.52 |
| Non-family | 6,984 (34.5%) | 1.24 |
| Total Households | 20,214 (100.0%) | 2.87 |
Household Size by Marriage Status in North Miami
Out of a total of 20,214 households in North Miami, 13,230 (65.4%) are family households, while 6,984 (34.5%) are nonfamily households. The most numerous type of family households are 2-person households, comprising 4,446, and the most common type of nonfamily households are 1-person households, comprising 5,765.
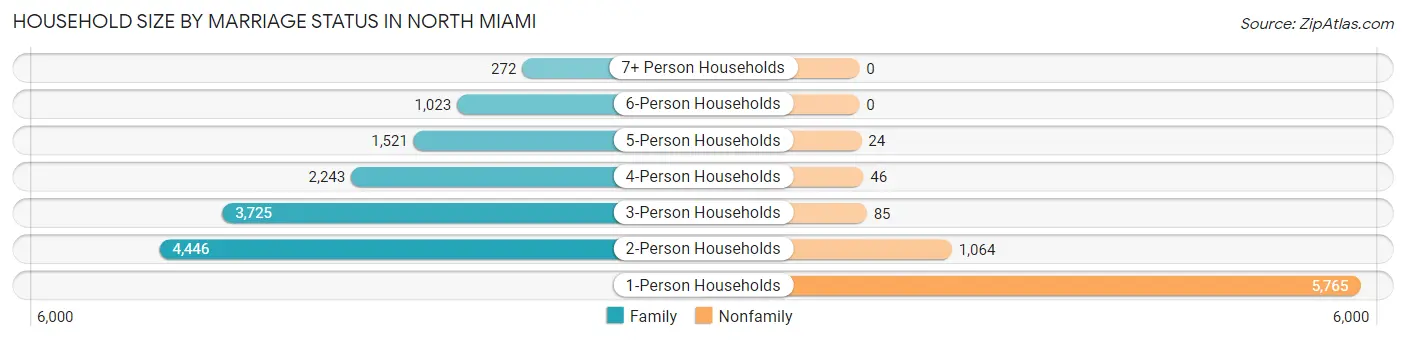
| Household Size | Family Households | Nonfamily Households |
| 1-Person Households | - | 5,765 (28.5%) |
| 2-Person Households | 4,446 (22.0%) | 1,064 (5.3%) |
| 3-Person Households | 3,725 (18.4%) | 85 (0.4%) |
| 4-Person Households | 2,243 (11.1%) | 46 (0.2%) |
| 5-Person Households | 1,521 (7.5%) | 24 (0.1%) |
| 6-Person Households | 1,023 (5.1%) | 0 (0.0%) |
| 7+ Person Households | 272 (1.3%) | 0 (0.0%) |
| Total | 13,230 (65.4%) | 6,984 (34.5%) |
Female Fertility in North Miami
Fertility by Age in North Miami
Average fertility rate in North Miami is 45.0 births per 1,000 women. Women in the age bracket of 20 to 34 years have the highest fertility rate with 57.0 births per 1,000 women. Women in the age bracket of 20 to 34 years acount for 55.2% of all women with births.
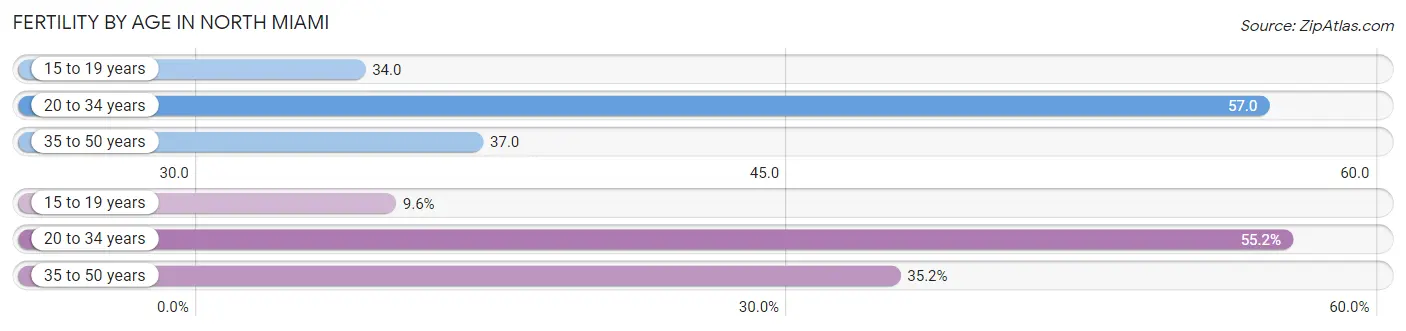
| Age Bracket | Women with Births | Births / 1,000 Women |
| 15 to 19 years | 67 (9.6%) | 34.0 |
| 20 to 34 years | 387 (55.2%) | 57.0 |
| 35 to 50 years | 247 (35.2%) | 37.0 |
| Total | 701 (100.0%) | 45.0 |
Fertility by Age by Marriage Status in North Miami
60.3% of women with births (701) in North Miami are married. The highest percentage of unmarried women with births falls into 15 to 19 years age bracket with 100.0% of them unmarried at the time of birth, while the lowest percentage of unmarried women with births belong to 35 to 50 years age bracket with 15.8% of them unmarried.
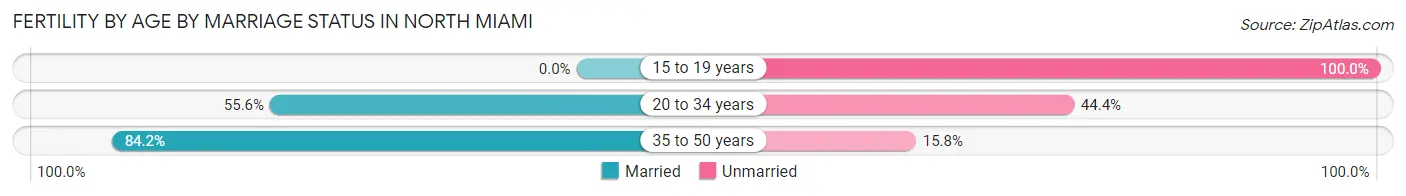
| Age Bracket | Married | Unmarried |
| 15 to 19 years | 0 (0.0%) | 67 (100.0%) |
| 20 to 34 years | 215 (55.6%) | 172 (44.4%) |
| 35 to 50 years | 208 (84.2%) | 39 (15.8%) |
| Total | 423 (60.3%) | 278 (39.7%) |
Fertility by Education in North Miami
Average fertility rate in North Miami is 45.0 births per 1,000 women. Women with the education attainment of less than high school have the highest fertility rate of 72.0 births per 1,000 women, while women with the education attainment of college or associate's degree have the lowest fertility at 23.0 births per 1,000 women. Women with the education attainment of high school diploma represent 31.0% of all women with births.
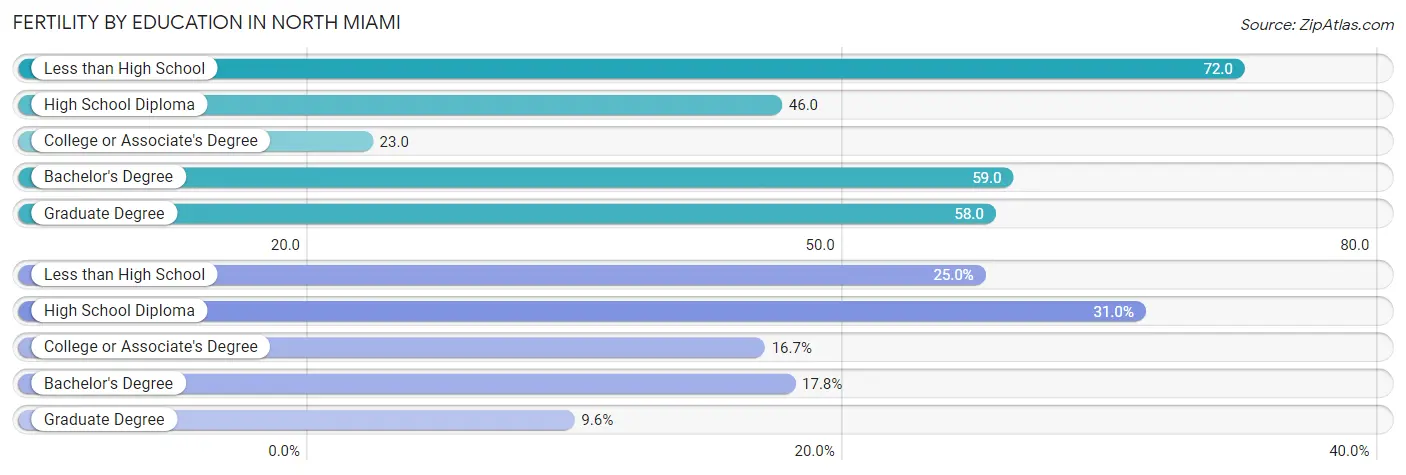
| Educational Attainment | Women with Births | Births / 1,000 Women |
| Less than High School | 175 (25.0%) | 72.0 |
| High School Diploma | 217 (31.0%) | 46.0 |
| College or Associate's Degree | 117 (16.7%) | 23.0 |
| Bachelor's Degree | 125 (17.8%) | 59.0 |
| Graduate Degree | 67 (9.6%) | 58.0 |
| Total | 701 (100.0%) | 45.0 |
Fertility by Education by Marriage Status in North Miami
39.7% of women with births in North Miami are unmarried. Women with the educational attainment of college or associate's degree are most likely to be married with 95.7% of them married at childbirth, while women with the educational attainment of graduate degree are least likely to be married with 100.0% of them unmarried at childbirth.
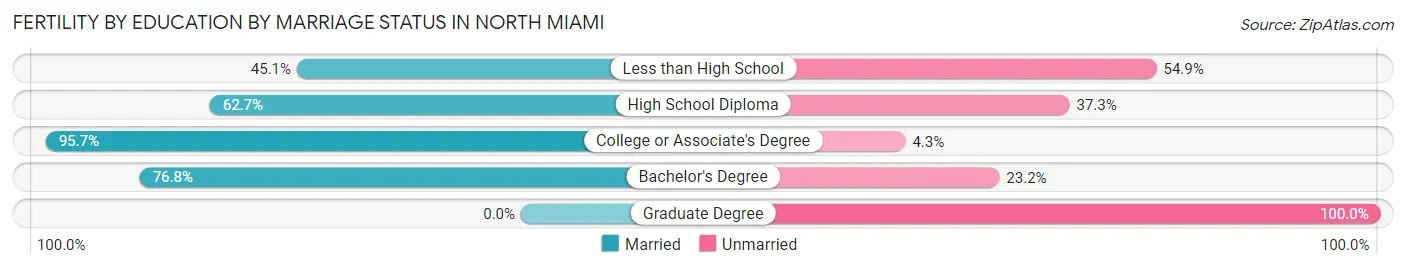
| Educational Attainment | Married | Unmarried |
| Less than High School | 79 (45.1%) | 96 (54.9%) |
| High School Diploma | 136 (62.7%) | 81 (37.3%) |
| College or Associate's Degree | 112 (95.7%) | 5 (4.3%) |
| Bachelor's Degree | 96 (76.8%) | 29 (23.2%) |
| Graduate Degree | 0 (0.0%) | 67 (100.0%) |
| Total | 423 (60.3%) | 278 (39.7%) |
Employment Characteristics in North Miami
Employment by Class of Employer in North Miami
Among the 28,206 employed individuals in North Miami, private company employees (21,012 | 74.5%), self-employed (not incorporated) (1,929 | 6.8%), and not-for-profit organizations (1,474 | 5.2%) make up the most common classes of employment.
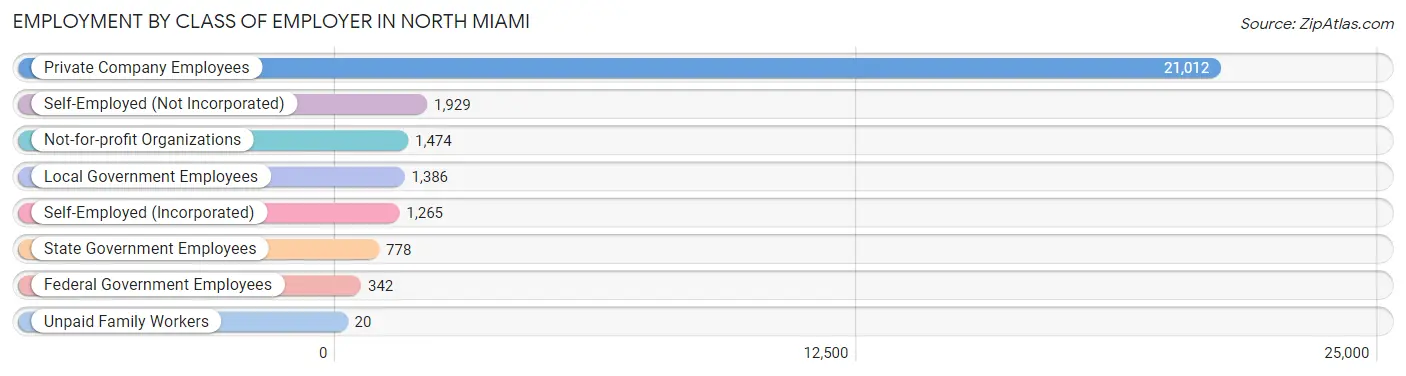
| Employer Class | # Employees | % Employees |
| Private Company Employees | 21,012 | 74.5% |
| Self-Employed (Incorporated) | 1,265 | 4.5% |
| Self-Employed (Not Incorporated) | 1,929 | 6.8% |
| Not-for-profit Organizations | 1,474 | 5.2% |
| Local Government Employees | 1,386 | 4.9% |
| State Government Employees | 778 | 2.8% |
| Federal Government Employees | 342 | 1.2% |
| Unpaid Family Workers | 20 | 0.1% |
| Total | 28,206 | 100.0% |
Employment Status by Age in North Miami
According to the labor force statistics for North Miami, out of the total population over 16 years of age (47,988), 64.1% or 30,760 individuals are in the labor force, with 6.1% or 1,876 of them unemployed. The age group with the highest labor force participation rate is 35 to 44 years, with 85.6% or 7,788 individuals in the labor force. Within the labor force, the 16 to 19 years age range has the highest percentage of unemployed individuals, with 25.6% or 165 of them being unemployed.
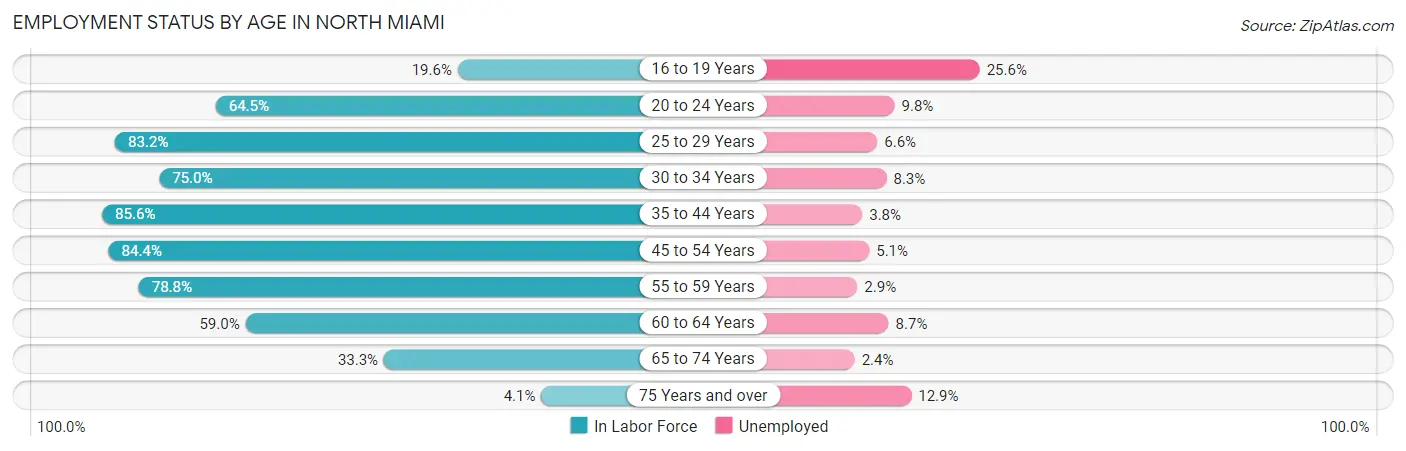
| Age Bracket | In Labor Force | Unemployed |
| 16 to 19 Years | 644 (19.6%) | 165 (25.6%) |
| 20 to 24 Years | 2,914 (64.5%) | 286 (9.8%) |
| 25 to 29 Years | 3,672 (83.2%) | 242 (6.6%) |
| 30 to 34 Years | 3,106 (75.0%) | 258 (8.3%) |
| 35 to 44 Years | 7,788 (85.6%) | 296 (3.8%) |
| 45 to 54 Years | 5,765 (84.4%) | 294 (5.1%) |
| 55 to 59 Years | 2,949 (78.8%) | 86 (2.9%) |
| 60 to 64 Years | 2,178 (59.0%) | 189 (8.7%) |
| 65 to 74 Years | 1,620 (33.3%) | 39 (2.4%) |
| 75 Years and over | 139 (4.1%) | 18 (12.9%) |
| Total | 30,760 (64.1%) | 1,876 (6.1%) |
Employment Status by Educational Attainment in North Miami
According to labor force statistics for North Miami, 79.8% of individuals (25,471) out of the total population between 25 and 64 years of age (31,918) are in the labor force, with 5.4% or 1,375 of them being unemployed. The group with the highest labor force participation rate are those with the educational attainment of bachelor's degree or higher, with 87.0% or 6,273 individuals in the labor force. Within the labor force, individuals with high school diploma education have the highest percentage of unemployment, with 6.9% or 633 of them being unemployed.
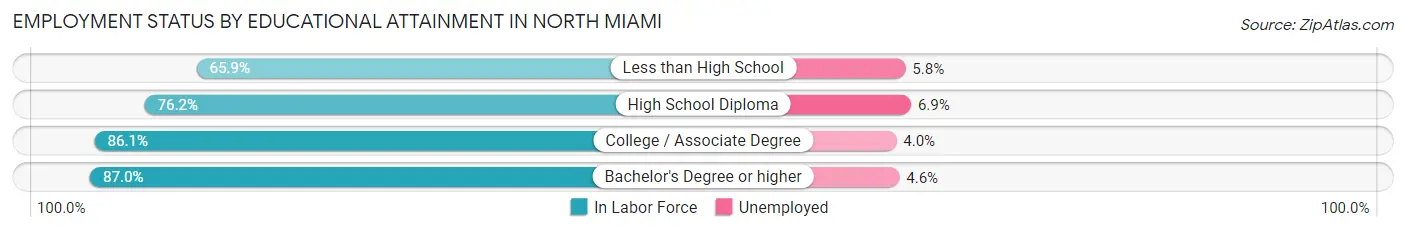
| Educational Attainment | In Labor Force | Unemployed |
| Less than High School | 2,913 (65.9%) | 256 (5.8%) |
| High School Diploma | 9,178 (76.2%) | 831 (6.9%) |
| College / Associate Degree | 7,098 (86.1%) | 330 (4.0%) |
| Bachelor's Degree or higher | 6,273 (87.0%) | 332 (4.6%) |
| Total | 25,471 (79.8%) | 1,724 (5.4%) |
Employment Occupations by Sex in North Miami
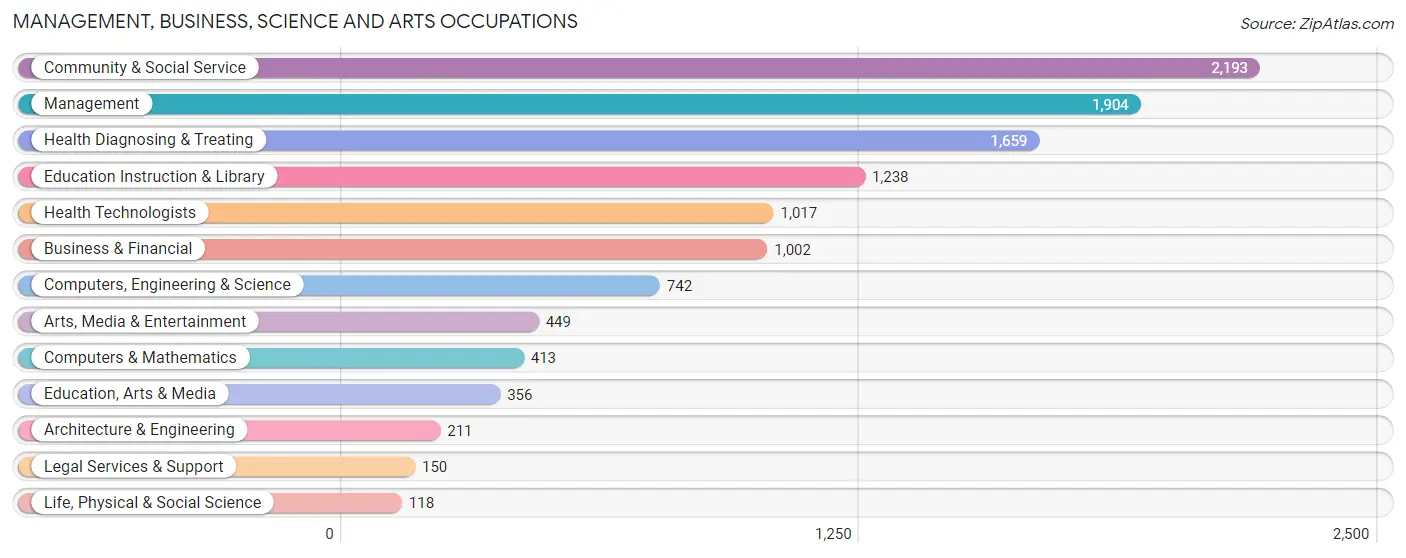
Management, Business, Science and Arts Occupations
The most common Management, Business, Science and Arts occupations in North Miami are Community & Social Service (2,193 | 7.6%), Management (1,904 | 6.6%), Health Diagnosing & Treating (1,659 | 5.7%), Education Instruction & Library (1,238 | 4.3%), and Health Technologists (1,017 | 3.5%).
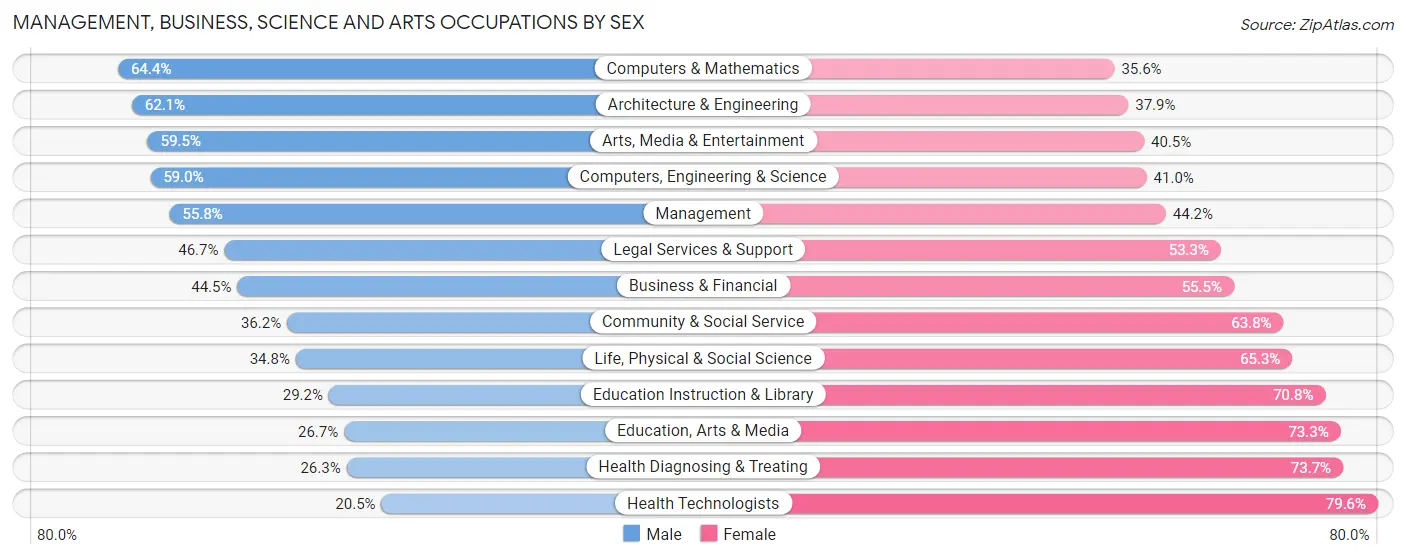
Management, Business, Science and Arts Occupations by Sex
Within the Management, Business, Science and Arts occupations in North Miami, the most male-oriented occupations are Computers & Mathematics (64.4%), Architecture & Engineering (62.1%), and Arts, Media & Entertainment (59.5%), while the most female-oriented occupations are Health Technologists (79.5%), Health Diagnosing & Treating (73.7%), and Education, Arts & Media (73.3%).
| Occupation | Male | Female |
| Management | 1,063 (55.8%) | 841 (44.2%) |
| Business & Financial | 446 (44.5%) | 556 (55.5%) |
| Computers, Engineering & Science | 438 (59.0%) | 304 (41.0%) |
| Computers & Mathematics | 266 (64.4%) | 147 (35.6%) |
| Architecture & Engineering | 131 (62.1%) | 80 (37.9%) |
| Life, Physical & Social Science | 41 (34.7%) | 77 (65.2%) |
| Community & Social Service | 794 (36.2%) | 1,399 (63.8%) |
| Education, Arts & Media | 95 (26.7%) | 261 (73.3%) |
| Legal Services & Support | 70 (46.7%) | 80 (53.3%) |
| Education Instruction & Library | 362 (29.2%) | 876 (70.8%) |
| Arts, Media & Entertainment | 267 (59.5%) | 182 (40.5%) |
| Health Diagnosing & Treating | 436 (26.3%) | 1,223 (73.7%) |
| Health Technologists | 208 (20.4%) | 809 (79.5%) |
| Total (Category) | 3,177 (42.4%) | 4,323 (57.6%) |
| Total (Overall) | 14,989 (51.9%) | 13,916 (48.1%) |
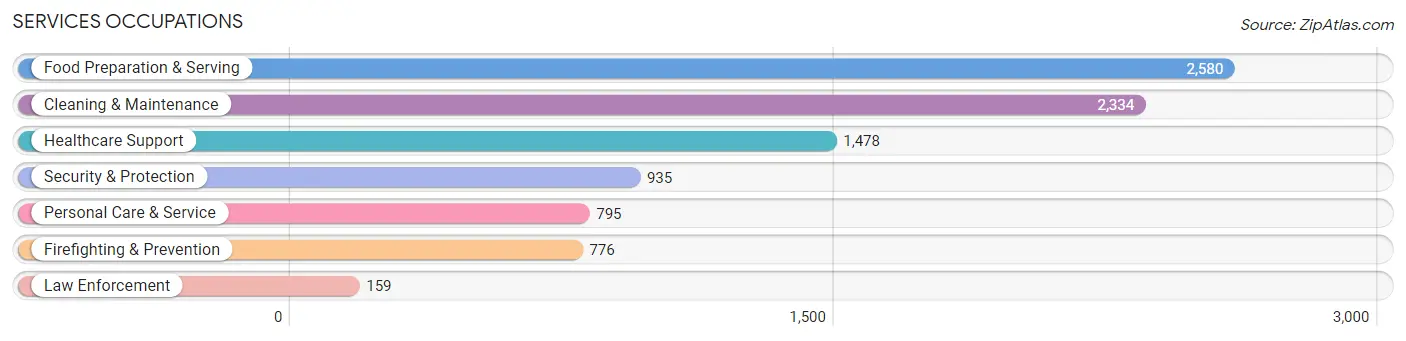
Services Occupations
The most common Services occupations in North Miami are Food Preparation & Serving (2,580 | 8.9%), Cleaning & Maintenance (2,334 | 8.1%), Healthcare Support (1,478 | 5.1%), Security & Protection (935 | 3.2%), and Personal Care & Service (795 | 2.8%).
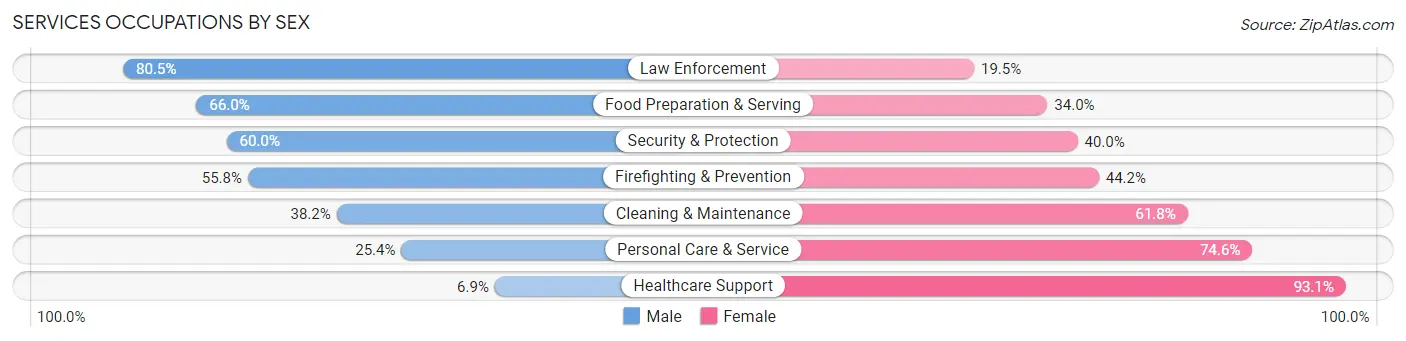
Services Occupations by Sex
Within the Services occupations in North Miami, the most male-oriented occupations are Law Enforcement (80.5%), Food Preparation & Serving (66.0%), and Security & Protection (60.0%), while the most female-oriented occupations are Healthcare Support (93.1%), Personal Care & Service (74.6%), and Cleaning & Maintenance (61.8%).
| Occupation | Male | Female |
| Healthcare Support | 102 (6.9%) | 1,376 (93.1%) |
| Security & Protection | 561 (60.0%) | 374 (40.0%) |
| Firefighting & Prevention | 433 (55.8%) | 343 (44.2%) |
| Law Enforcement | 128 (80.5%) | 31 (19.5%) |
| Food Preparation & Serving | 1,702 (66.0%) | 878 (34.0%) |
| Cleaning & Maintenance | 892 (38.2%) | 1,442 (61.8%) |
| Personal Care & Service | 202 (25.4%) | 593 (74.6%) |
| Total (Category) | 3,459 (42.6%) | 4,663 (57.4%) |
| Total (Overall) | 14,989 (51.9%) | 13,916 (48.1%) |
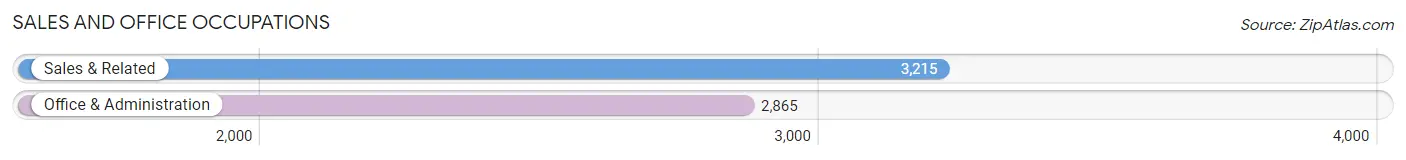
Sales and Office Occupations
The most common Sales and Office occupations in North Miami are Sales & Related (3,215 | 11.1%), and Office & Administration (2,865 | 9.9%).
Sales and Office Occupations by Sex
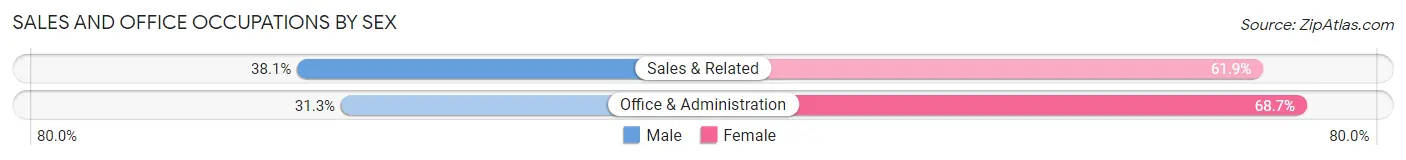
| Occupation | Male | Female |
| Sales & Related | 1,224 (38.1%) | 1,991 (61.9%) |
| Office & Administration | 898 (31.3%) | 1,967 (68.7%) |
| Total (Category) | 2,122 (34.9%) | 3,958 (65.1%) |
| Total (Overall) | 14,989 (51.9%) | 13,916 (48.1%) |
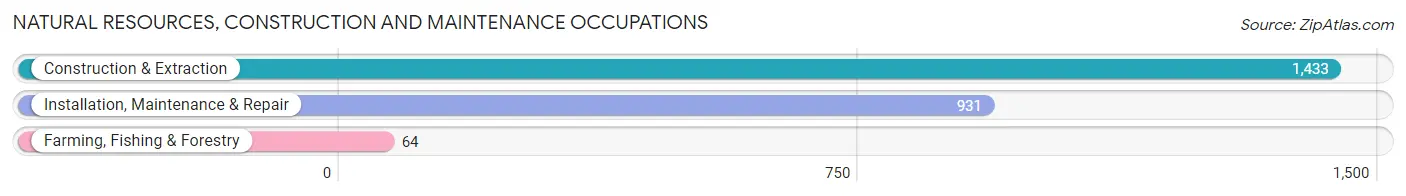
Natural Resources, Construction and Maintenance Occupations
The most common Natural Resources, Construction and Maintenance occupations in North Miami are Construction & Extraction (1,433 | 5.0%), Installation, Maintenance & Repair (931 | 3.2%), and Farming, Fishing & Forestry (64 | 0.2%).
Natural Resources, Construction and Maintenance Occupations by Sex
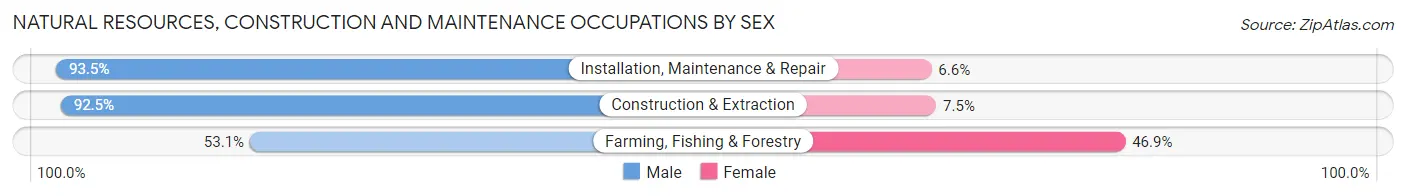
| Occupation | Male | Female |
| Farming, Fishing & Forestry | 34 (53.1%) | 30 (46.9%) |
| Construction & Extraction | 1,325 (92.5%) | 108 (7.5%) |
| Installation, Maintenance & Repair | 870 (93.4%) | 61 (6.6%) |
| Total (Category) | 2,229 (91.8%) | 199 (8.2%) |
| Total (Overall) | 14,989 (51.9%) | 13,916 (48.1%) |
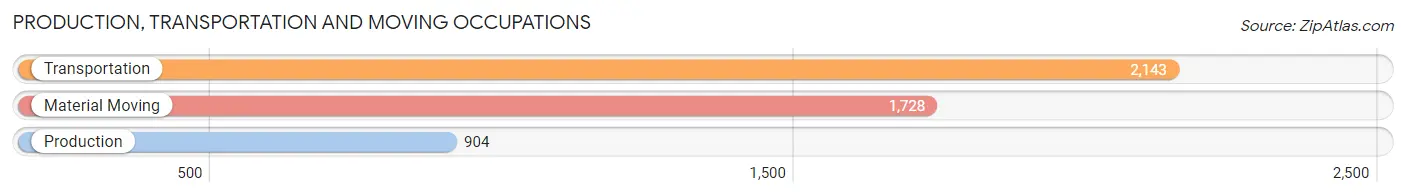
Production, Transportation and Moving Occupations
The most common Production, Transportation and Moving occupations in North Miami are Transportation (2,143 | 7.4%), Material Moving (1,728 | 6.0%), and Production (904 | 3.1%).
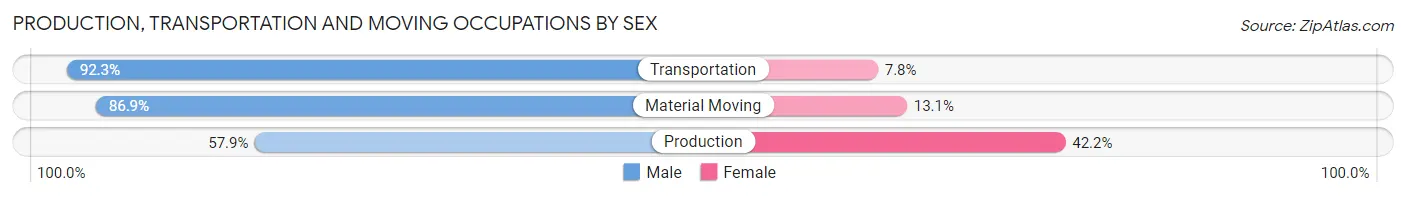
Production, Transportation and Moving Occupations by Sex
| Occupation | Male | Female |
| Production | 523 (57.9%) | 381 (42.1%) |
| Transportation | 1,977 (92.2%) | 166 (7.7%) |
| Material Moving | 1,502 (86.9%) | 226 (13.1%) |
| Total (Category) | 4,002 (83.8%) | 773 (16.2%) |
| Total (Overall) | 14,989 (51.9%) | 13,916 (48.1%) |
Employment Industries by Sex in North Miami
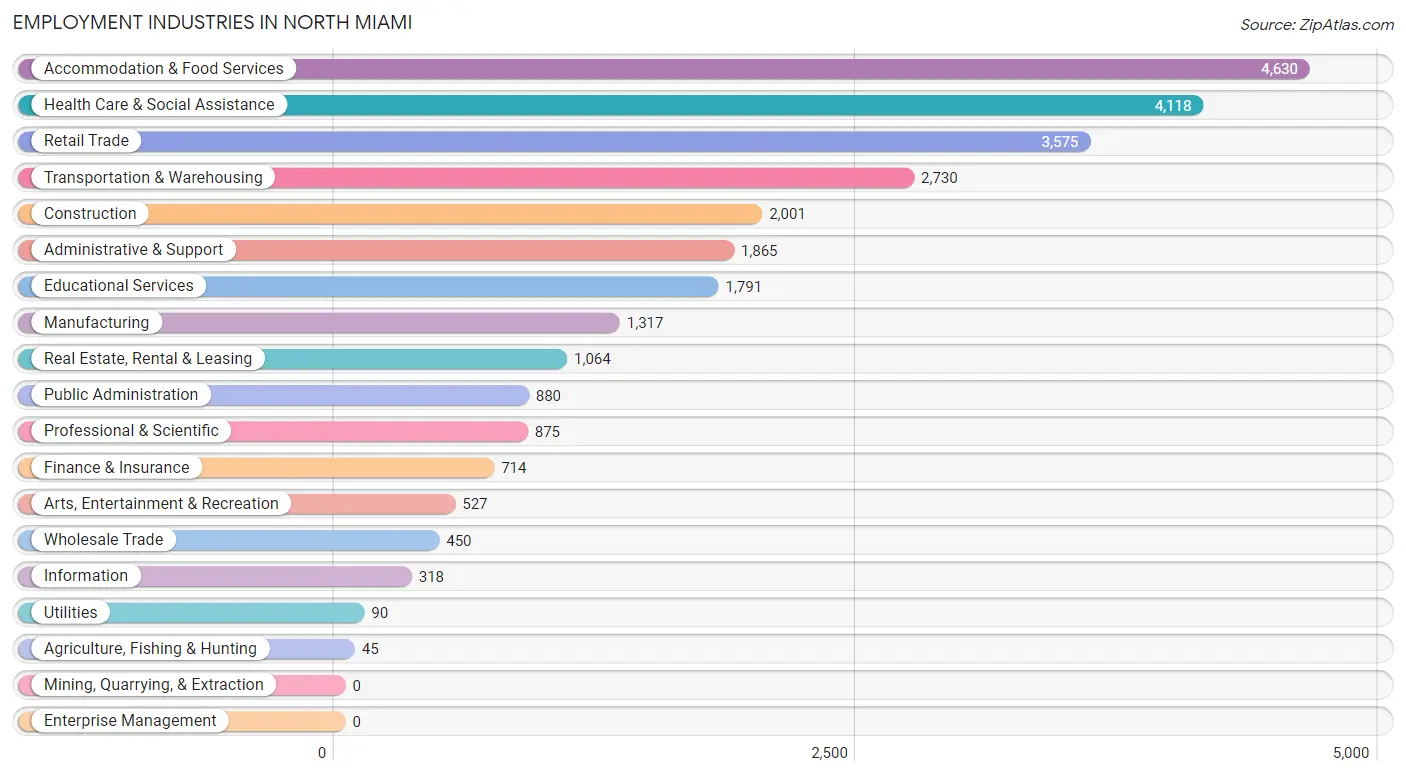
Employment Industries in North Miami
The major employment industries in North Miami include Accommodation & Food Services (4,630 | 16.0%), Health Care & Social Assistance (4,118 | 14.2%), Retail Trade (3,575 | 12.4%), Transportation & Warehousing (2,730 | 9.4%), and Construction (2,001 | 6.9%).
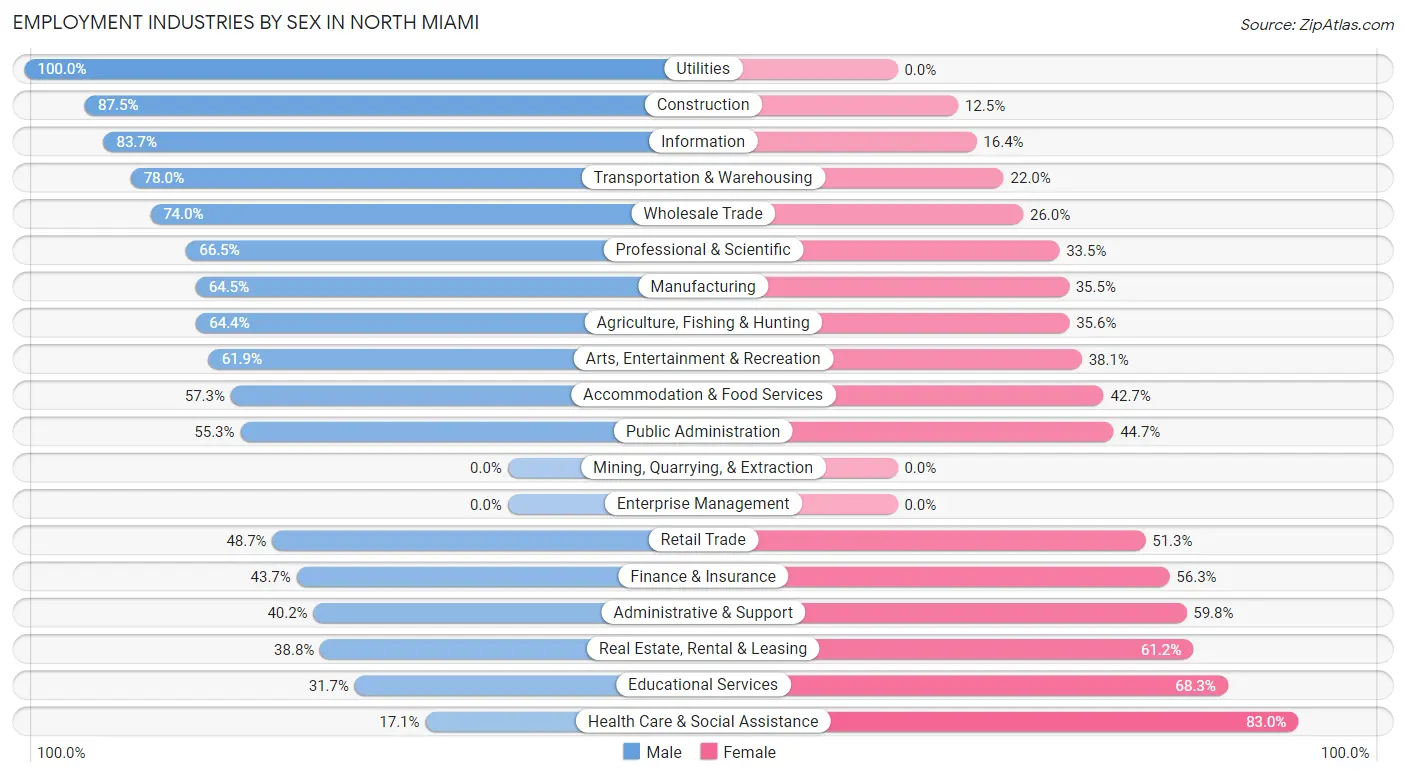
Employment Industries by Sex in North Miami
The North Miami industries that see more men than women are Utilities (100.0%), Construction (87.5%), and Information (83.7%), whereas the industries that tend to have a higher number of women are Health Care & Social Assistance (83.0%), Educational Services (68.3%), and Real Estate, Rental & Leasing (61.2%).
| Industry | Male | Female |
| Agriculture, Fishing & Hunting | 29 (64.4%) | 16 (35.6%) |
| Mining, Quarrying, & Extraction | 0 (0.0%) | 0 (0.0%) |
| Construction | 1,750 (87.5%) | 251 (12.5%) |
| Manufacturing | 850 (64.5%) | 467 (35.5%) |
| Wholesale Trade | 333 (74.0%) | 117 (26.0%) |
| Retail Trade | 1,741 (48.7%) | 1,834 (51.3%) |
| Transportation & Warehousing | 2,130 (78.0%) | 600 (22.0%) |
| Utilities | 90 (100.0%) | 0 (0.0%) |
| Information | 266 (83.7%) | 52 (16.4%) |
| Finance & Insurance | 312 (43.7%) | 402 (56.3%) |
| Real Estate, Rental & Leasing | 413 (38.8%) | 651 (61.2%) |
| Professional & Scientific | 582 (66.5%) | 293 (33.5%) |
| Enterprise Management | 0 (0.0%) | 0 (0.0%) |
| Administrative & Support | 750 (40.2%) | 1,115 (59.8%) |
| Educational Services | 567 (31.7%) | 1,224 (68.3%) |
| Health Care & Social Assistance | 702 (17.1%) | 3,416 (83.0%) |
| Arts, Entertainment & Recreation | 326 (61.9%) | 201 (38.1%) |
| Accommodation & Food Services | 2,654 (57.3%) | 1,976 (42.7%) |
| Public Administration | 487 (55.3%) | 393 (44.7%) |
| Total | 14,989 (51.9%) | 13,916 (48.1%) |
Education in North Miami
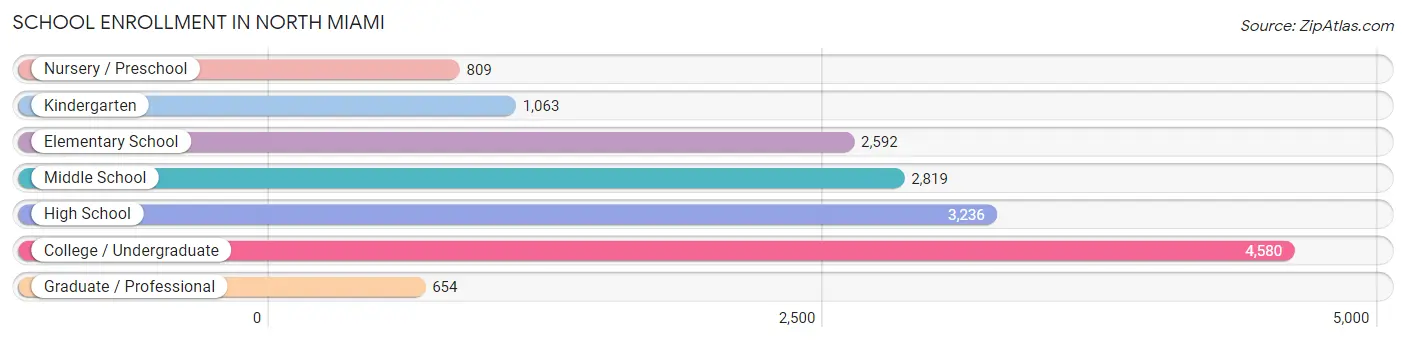
School Enrollment in North Miami
The most common levels of schooling among the 15,753 students in North Miami are college / undergraduate (4,580 | 29.1%), high school (3,236 | 20.5%), and middle school (2,819 | 17.9%).
| School Level | # Students | % Students |
| Nursery / Preschool | 809 | 5.1% |
| Kindergarten | 1,063 | 6.8% |
| Elementary School | 2,592 | 16.5% |
| Middle School | 2,819 | 17.9% |
| High School | 3,236 | 20.5% |
| College / Undergraduate | 4,580 | 29.1% |
| Graduate / Professional | 654 | 4.2% |
| Total | 15,753 | 100.0% |
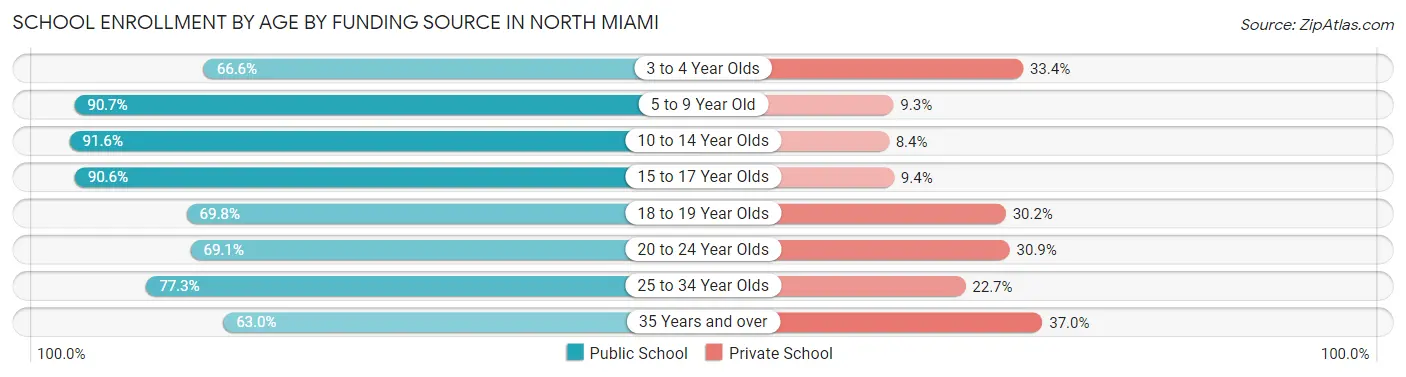
School Enrollment by Age by Funding Source in North Miami
Out of a total of 15,753 students who are enrolled in schools in North Miami, 2,914 (18.5%) attend a private institution, while the remaining 12,839 (81.5%) are enrolled in public schools. The age group of 35 years and over has the highest likelihood of being enrolled in private schools, with 407 (37.0% in the age bracket) enrolled. Conversely, the age group of 10 to 14 year olds has the lowest likelihood of being enrolled in a private school, with 3,165 (91.6% in the age bracket) attending a public institution.
| Age Bracket | Public School | Private School |
| 3 to 4 Year Olds | 662 (66.6%) | 332 (33.4%) |
| 5 to 9 Year Old | 3,010 (90.7%) | 307 (9.3%) |
| 10 to 14 Year Olds | 3,165 (91.6%) | 290 (8.4%) |
| 15 to 17 Year Olds | 1,850 (90.6%) | 191 (9.4%) |
| 18 to 19 Year Olds | 1,085 (69.8%) | 469 (30.2%) |
| 20 to 24 Year Olds | 1,473 (69.1%) | 659 (30.9%) |
| 25 to 34 Year Olds | 897 (77.3%) | 263 (22.7%) |
| 35 Years and over | 693 (63.0%) | 407 (37.0%) |
| Total | 12,839 (81.5%) | 2,914 (18.5%) |
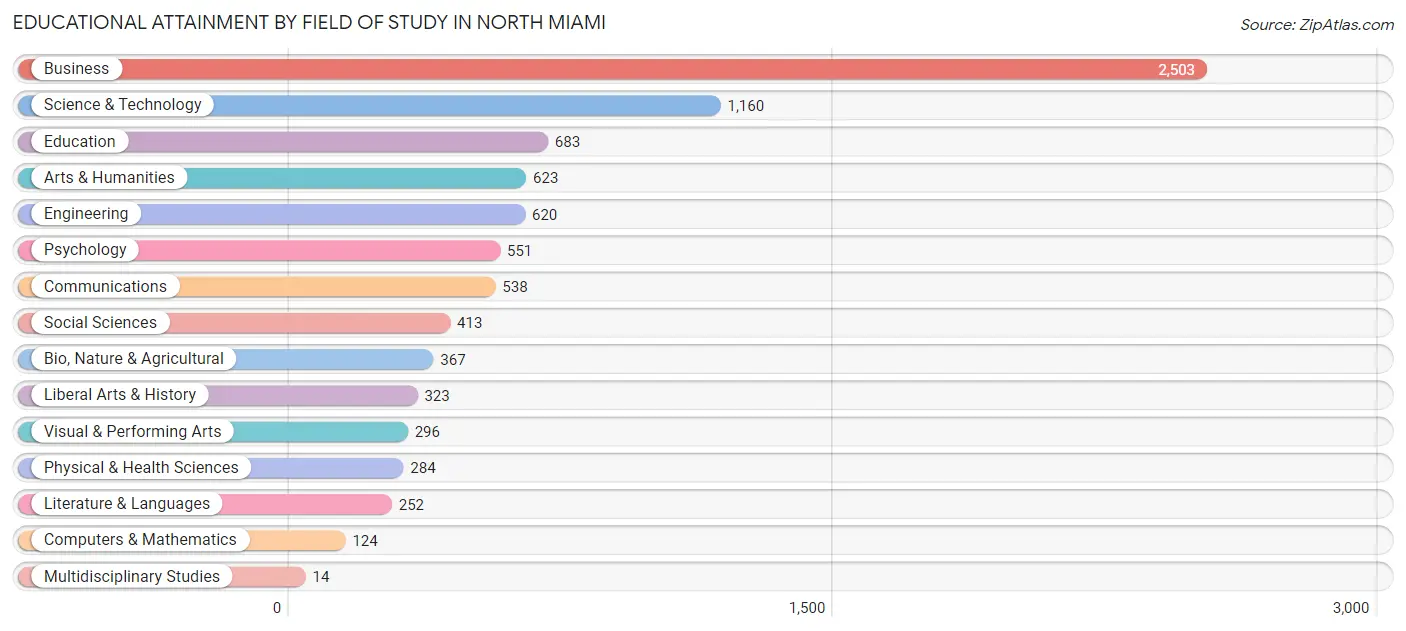
Educational Attainment by Field of Study in North Miami
Business (2,503 | 28.6%), science & technology (1,160 | 13.3%), education (683 | 7.8%), arts & humanities (623 | 7.1%), and engineering (620 | 7.1%) are the most common fields of study among 8,751 individuals in North Miami who have obtained a bachelor's degree or higher.
| Field of Study | # Graduates | % Graduates |
| Computers & Mathematics | 124 | 1.4% |
| Bio, Nature & Agricultural | 367 | 4.2% |
| Physical & Health Sciences | 284 | 3.3% |
| Psychology | 551 | 6.3% |
| Social Sciences | 413 | 4.7% |
| Engineering | 620 | 7.1% |
| Multidisciplinary Studies | 14 | 0.2% |
| Science & Technology | 1,160 | 13.3% |
| Business | 2,503 | 28.6% |
| Education | 683 | 7.8% |
| Literature & Languages | 252 | 2.9% |
| Liberal Arts & History | 323 | 3.7% |
| Visual & Performing Arts | 296 | 3.4% |
| Communications | 538 | 6.1% |
| Arts & Humanities | 623 | 7.1% |
| Total | 8,751 | 100.0% |
Transportation & Commute in North Miami
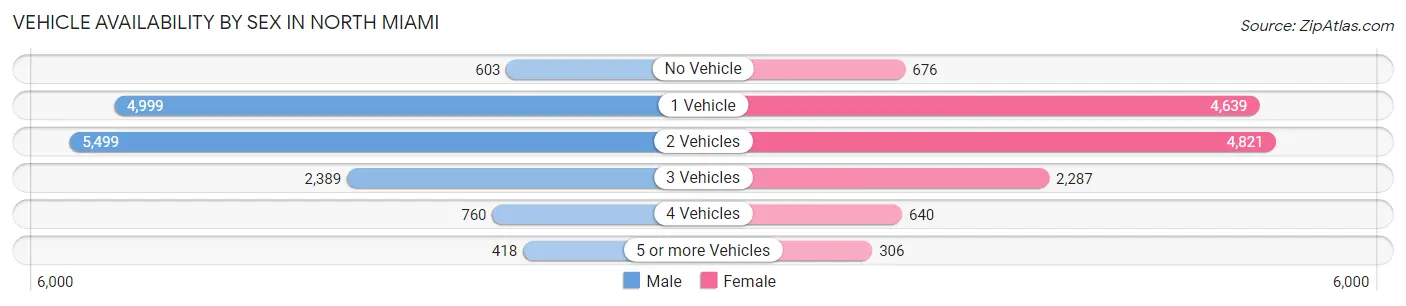
Vehicle Availability by Sex in North Miami
The most prevalent vehicle ownership categories in North Miami are males with 2 vehicles (5,499, accounting for 37.5%) and females with 2 vehicles (4,821, making up 41.1%).
| Vehicles Available | Male | Female |
| No Vehicle | 603 (4.1%) | 676 (5.1%) |
| 1 Vehicle | 4,999 (34.1%) | 4,639 (34.7%) |
| 2 Vehicles | 5,499 (37.5%) | 4,821 (36.1%) |
| 3 Vehicles | 2,389 (16.3%) | 2,287 (17.1%) |
| 4 Vehicles | 760 (5.2%) | 640 (4.8%) |
| 5 or more Vehicles | 418 (2.9%) | 306 (2.3%) |
| Total | 14,668 (100.0%) | 13,369 (100.0%) |
Commute Time in North Miami
The most frequently occuring commute durations in North Miami are 30 to 34 minutes (6,803 commuters, 25.7%), 20 to 24 minutes (3,156 commuters, 11.9%), and 45 to 59 minutes (3,006 commuters, 11.3%).
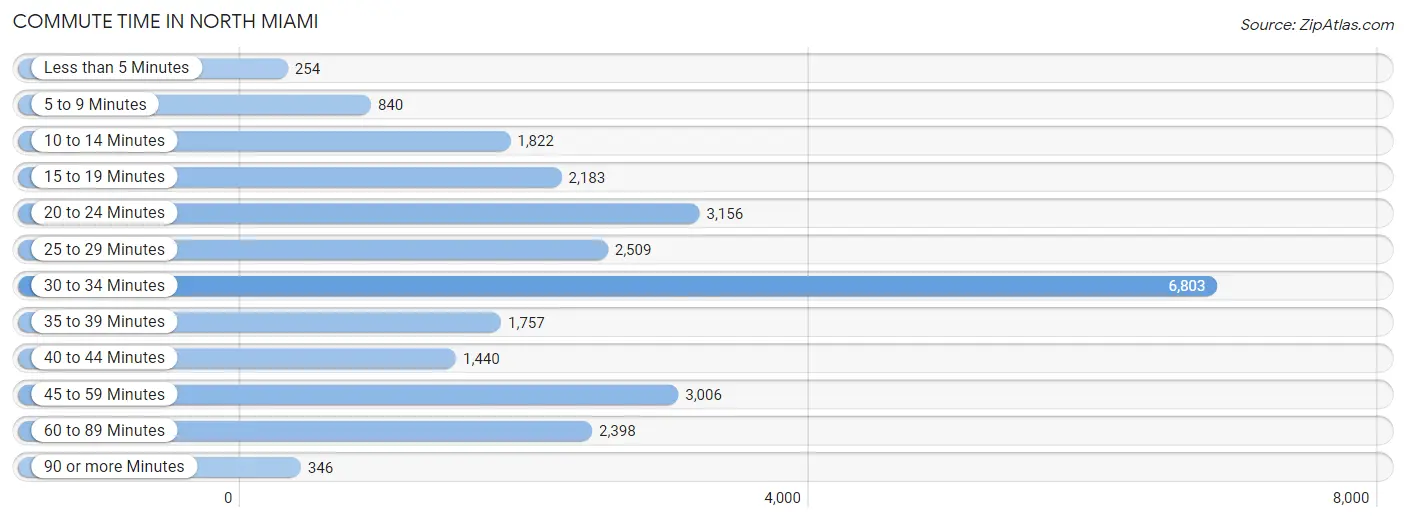
| Commute Time | # Commuters | % Commuters |
| Less than 5 Minutes | 254 | 1.0% |
| 5 to 9 Minutes | 840 | 3.2% |
| 10 to 14 Minutes | 1,822 | 6.9% |
| 15 to 19 Minutes | 2,183 | 8.2% |
| 20 to 24 Minutes | 3,156 | 11.9% |
| 25 to 29 Minutes | 2,509 | 9.5% |
| 30 to 34 Minutes | 6,803 | 25.7% |
| 35 to 39 Minutes | 1,757 | 6.6% |
| 40 to 44 Minutes | 1,440 | 5.4% |
| 45 to 59 Minutes | 3,006 | 11.3% |
| 60 to 89 Minutes | 2,398 | 9.0% |
| 90 or more Minutes | 346 | 1.3% |
Commute Time by Sex in North Miami
The most common commute times in North Miami are 30 to 34 minutes (3,495 commuters, 24.9%) for males and 30 to 34 minutes (3,308 commuters, 26.5%) for females.
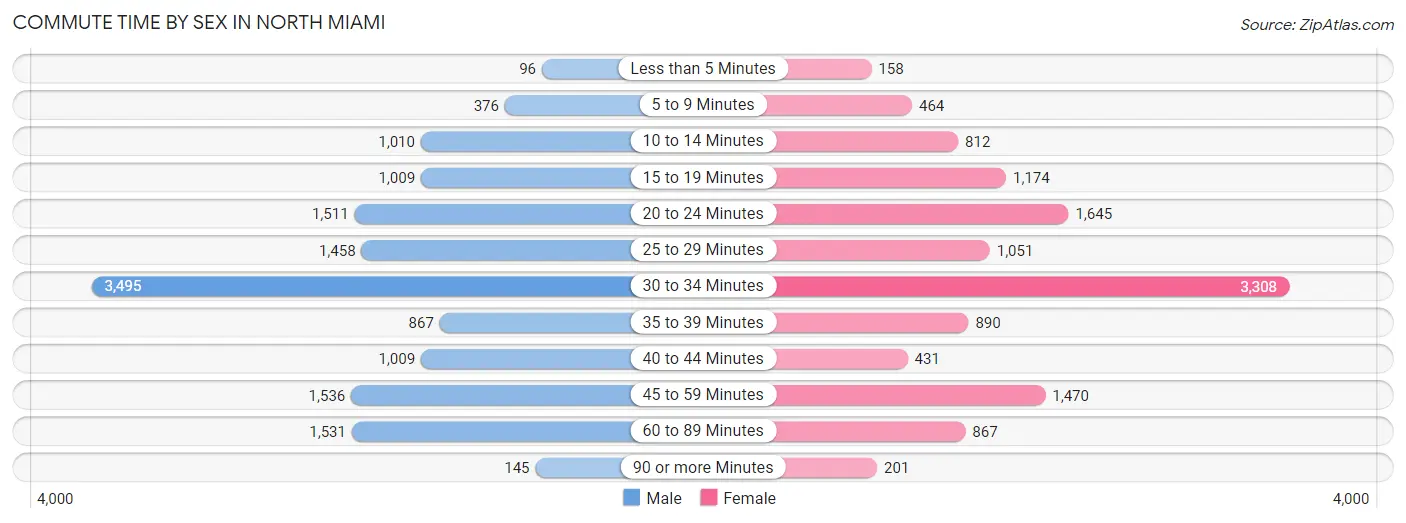
| Commute Time | Male | Female |
| Less than 5 Minutes | 96 (0.7%) | 158 (1.3%) |
| 5 to 9 Minutes | 376 (2.7%) | 464 (3.7%) |
| 10 to 14 Minutes | 1,010 (7.2%) | 812 (6.5%) |
| 15 to 19 Minutes | 1,009 (7.2%) | 1,174 (9.4%) |
| 20 to 24 Minutes | 1,511 (10.8%) | 1,645 (13.2%) |
| 25 to 29 Minutes | 1,458 (10.4%) | 1,051 (8.4%) |
| 30 to 34 Minutes | 3,495 (24.9%) | 3,308 (26.5%) |
| 35 to 39 Minutes | 867 (6.2%) | 890 (7.1%) |
| 40 to 44 Minutes | 1,009 (7.2%) | 431 (3.5%) |
| 45 to 59 Minutes | 1,536 (10.9%) | 1,470 (11.8%) |
| 60 to 89 Minutes | 1,531 (10.9%) | 867 (7.0%) |
| 90 or more Minutes | 145 (1.0%) | 201 (1.6%) |
Time of Departure to Work by Sex in North Miami
The most frequent times of departure to work in North Miami are 7:00 AM to 7:29 AM (2,420, 17.2%) for males and 8:00 AM to 8:29 AM (2,426, 19.5%) for females.
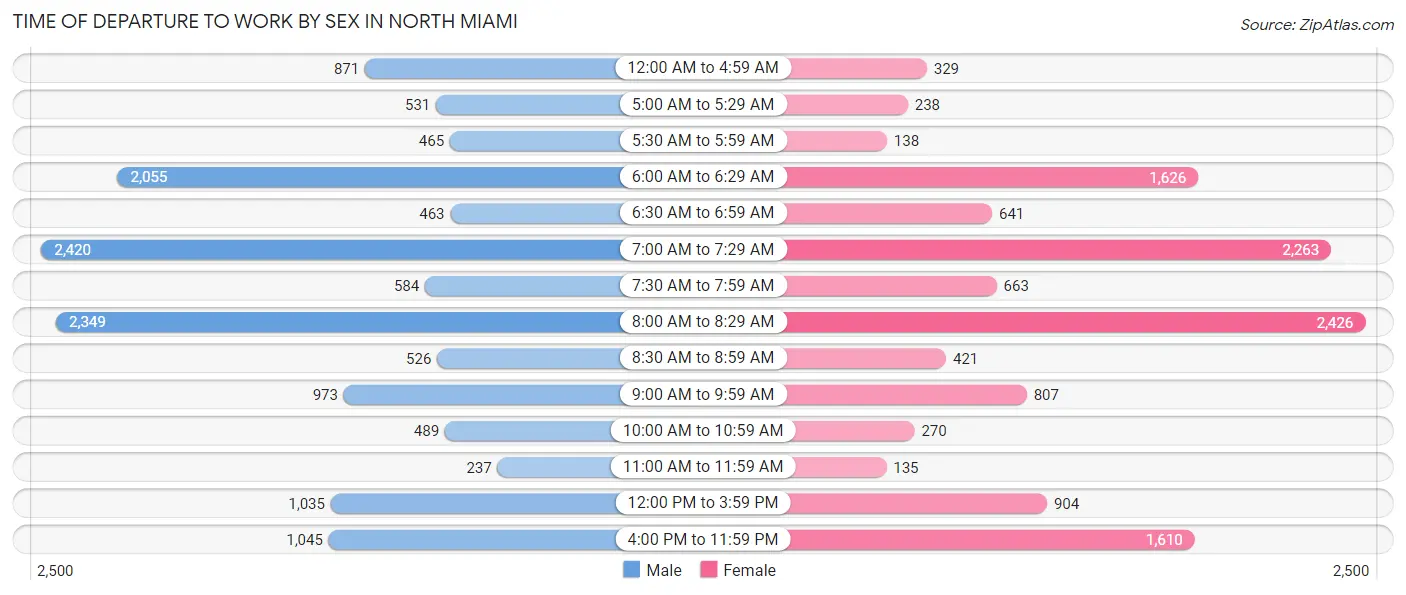
| Time of Departure | Male | Female |
| 12:00 AM to 4:59 AM | 871 (6.2%) | 329 (2.6%) |
| 5:00 AM to 5:29 AM | 531 (3.8%) | 238 (1.9%) |
| 5:30 AM to 5:59 AM | 465 (3.3%) | 138 (1.1%) |
| 6:00 AM to 6:29 AM | 2,055 (14.6%) | 1,626 (13.0%) |
| 6:30 AM to 6:59 AM | 463 (3.3%) | 641 (5.1%) |
| 7:00 AM to 7:29 AM | 2,420 (17.2%) | 2,263 (18.1%) |
| 7:30 AM to 7:59 AM | 584 (4.2%) | 663 (5.3%) |
| 8:00 AM to 8:29 AM | 2,349 (16.7%) | 2,426 (19.5%) |
| 8:30 AM to 8:59 AM | 526 (3.7%) | 421 (3.4%) |
| 9:00 AM to 9:59 AM | 973 (6.9%) | 807 (6.5%) |
| 10:00 AM to 10:59 AM | 489 (3.5%) | 270 (2.2%) |
| 11:00 AM to 11:59 AM | 237 (1.7%) | 135 (1.1%) |
| 12:00 PM to 3:59 PM | 1,035 (7.4%) | 904 (7.2%) |
| 4:00 PM to 11:59 PM | 1,045 (7.4%) | 1,610 (12.9%) |
| Total | 14,043 (100.0%) | 12,471 (100.0%) |
Housing Occupancy in North Miami
Occupancy by Ownership in North Miami
Of the total 20,214 dwellings in North Miami, owner-occupied units account for 8,783 (43.4%), while renter-occupied units make up 11,431 (56.6%).
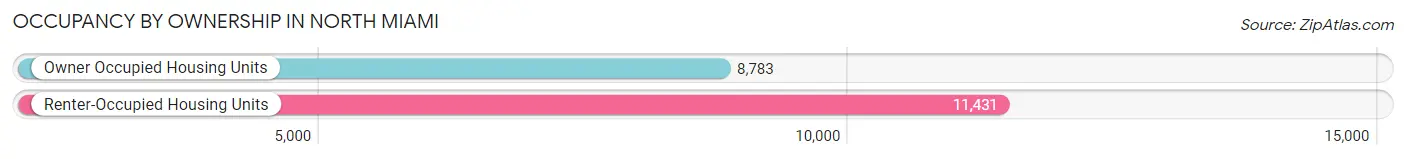
| Occupancy | # Housing Units | % Housing Units |
| Owner Occupied Housing Units | 8,783 | 43.4% |
| Renter-Occupied Housing Units | 11,431 | 56.6% |
| Total Occupied Housing Units | 20,214 | 100.0% |
Occupancy by Household Size in North Miami
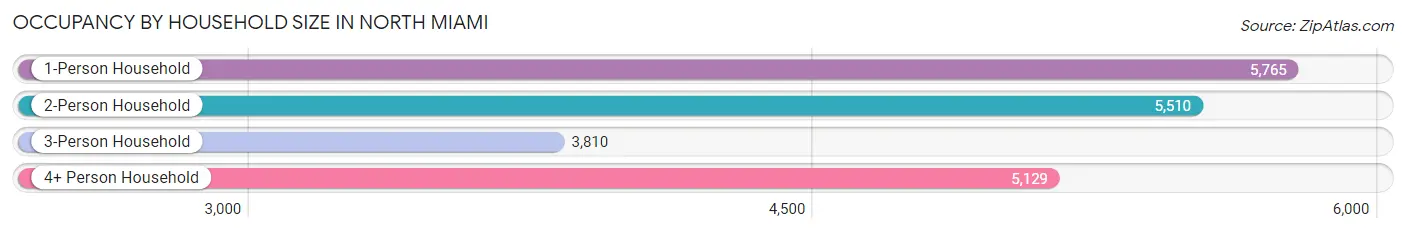
| Household Size | # Housing Units | % Housing Units |
| 1-Person Household | 5,765 | 28.5% |
| 2-Person Household | 5,510 | 27.3% |
| 3-Person Household | 3,810 | 18.9% |
| 4+ Person Household | 5,129 | 25.4% |
| Total Housing Units | 20,214 | 100.0% |
Occupancy by Ownership by Household Size in North Miami
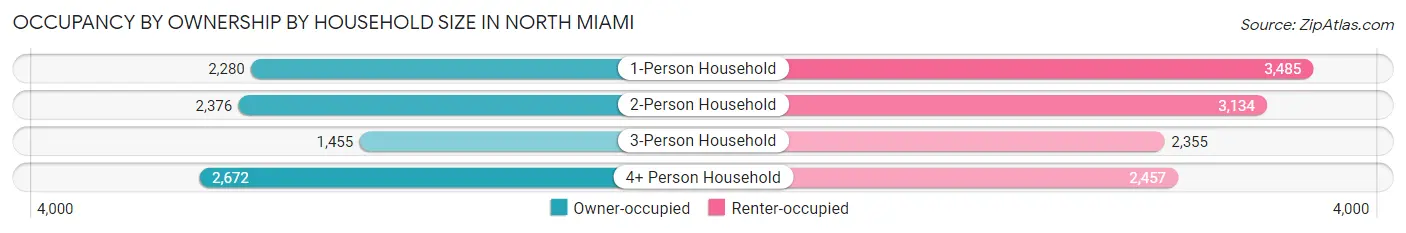
| Household Size | Owner-occupied | Renter-occupied |
| 1-Person Household | 2,280 (39.6%) | 3,485 (60.5%) |
| 2-Person Household | 2,376 (43.1%) | 3,134 (56.9%) |
| 3-Person Household | 1,455 (38.2%) | 2,355 (61.8%) |
| 4+ Person Household | 2,672 (52.1%) | 2,457 (47.9%) |
| Total Housing Units | 8,783 (43.4%) | 11,431 (56.6%) |
Occupancy by Educational Attainment in North Miami
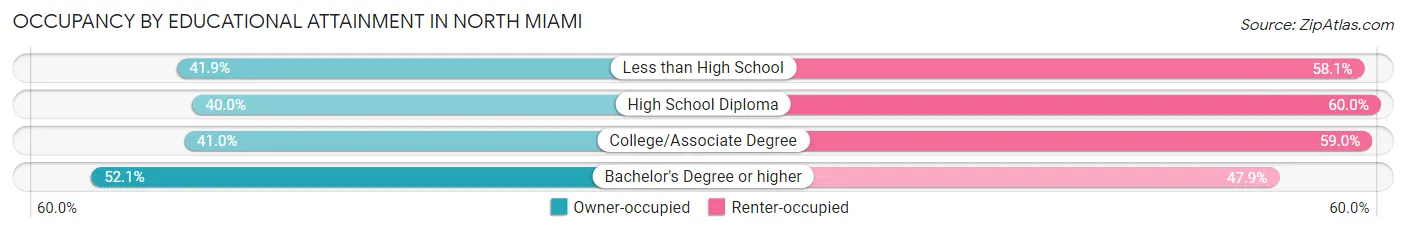
| Household Size | Owner-occupied | Renter-occupied |
| Less than High School | 1,248 (41.9%) | 1,729 (58.1%) |
| High School Diploma | 2,746 (40.0%) | 4,118 (60.0%) |
| College/Associate Degree | 2,273 (41.0%) | 3,268 (59.0%) |
| Bachelor's Degree or higher | 2,516 (52.1%) | 2,316 (47.9%) |
Occupancy by Age of Householder in North Miami
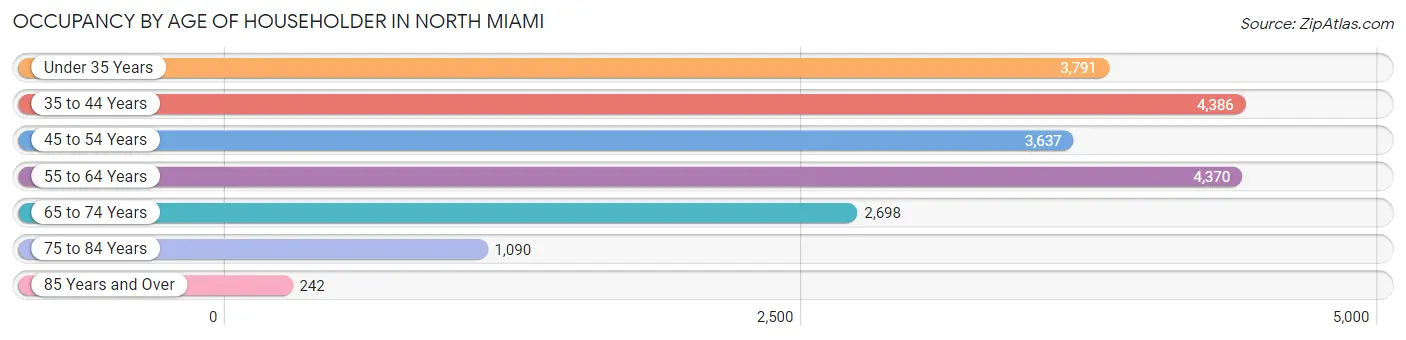
| Age Bracket | # Households | % Households |
| Under 35 Years | 3,791 | 18.8% |
| 35 to 44 Years | 4,386 | 21.7% |
| 45 to 54 Years | 3,637 | 18.0% |
| 55 to 64 Years | 4,370 | 21.6% |
| 65 to 74 Years | 2,698 | 13.4% |
| 75 to 84 Years | 1,090 | 5.4% |
| 85 Years and Over | 242 | 1.2% |
| Total | 20,214 | 100.0% |
Housing Finances in North Miami
Median Income by Occupancy in North Miami
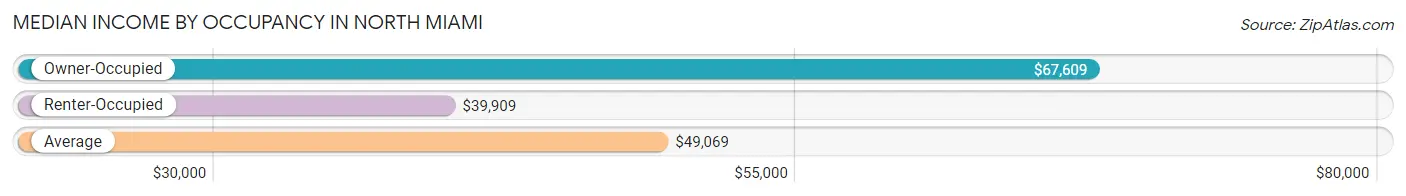
| Occupancy Type | # Households | Median Income |
| Owner-Occupied | 8,783 (43.4%) | $67,609 |
| Renter-Occupied | 11,431 (56.6%) | $39,909 |
| Average | 20,214 (100.0%) | $49,069 |
Occupancy by Householder Income Bracket in North Miami
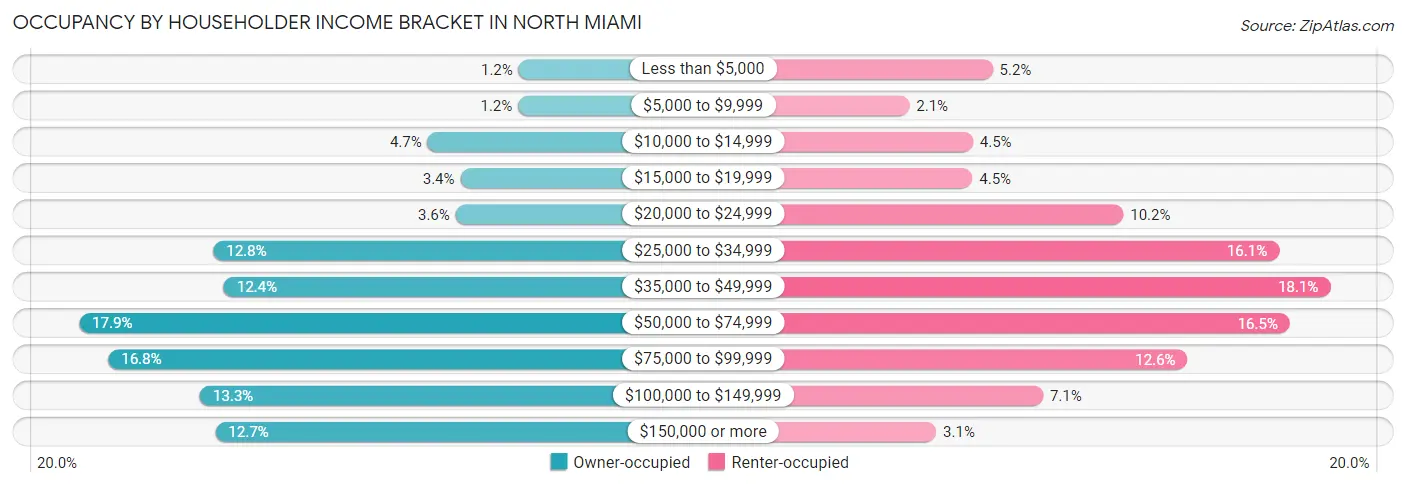
| Income Bracket | Owner-occupied | Renter-occupied |
| Less than $5,000 | 104 (1.2%) | 597 (5.2%) |
| $5,000 to $9,999 | 105 (1.2%) | 234 (2.1%) |
| $10,000 to $14,999 | 408 (4.6%) | 511 (4.5%) |
| $15,000 to $19,999 | 299 (3.4%) | 509 (4.4%) |
| $20,000 to $24,999 | 314 (3.6%) | 1,166 (10.2%) |
| $25,000 to $34,999 | 1,125 (12.8%) | 1,844 (16.1%) |
| $35,000 to $49,999 | 1,090 (12.4%) | 2,067 (18.1%) |
| $50,000 to $74,999 | 1,574 (17.9%) | 1,891 (16.5%) |
| $75,000 to $99,999 | 1,476 (16.8%) | 1,445 (12.6%) |
| $100,000 to $149,999 | 1,170 (13.3%) | 816 (7.1%) |
| $150,000 or more | 1,118 (12.7%) | 351 (3.1%) |
| Total | 8,783 (100.0%) | 11,431 (100.0%) |
Monthly Housing Cost Tiers in North Miami
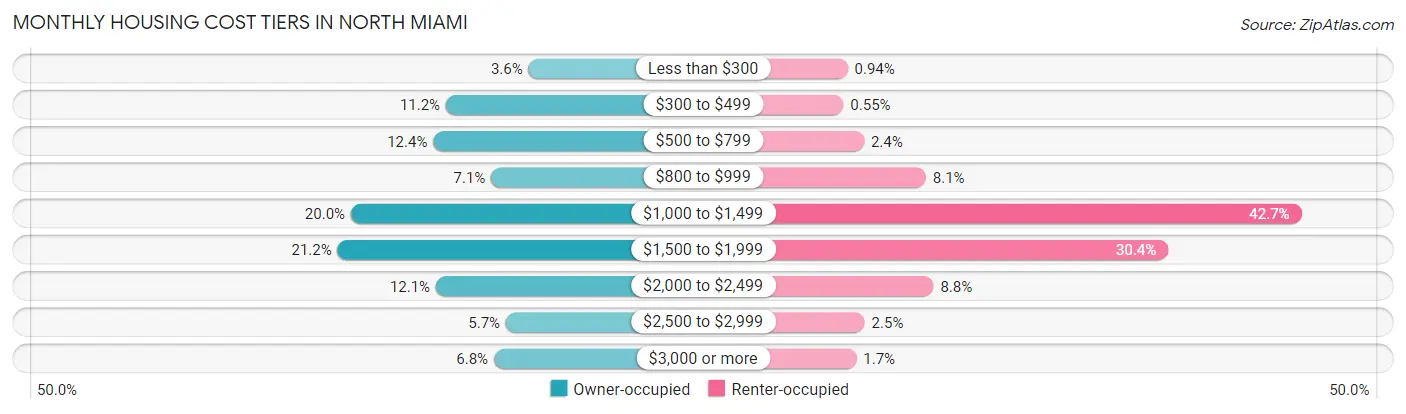
| Monthly Cost | Owner-occupied | Renter-occupied |
| Less than $300 | 317 (3.6%) | 107 (0.9%) |
| $300 to $499 | 985 (11.2%) | 63 (0.5%) |
| $500 to $799 | 1,087 (12.4%) | 279 (2.4%) |
| $800 to $999 | 619 (7.0%) | 931 (8.1%) |
| $1,000 to $1,499 | 1,753 (20.0%) | 4,882 (42.7%) |
| $1,500 to $1,999 | 1,861 (21.2%) | 3,480 (30.4%) |
| $2,000 to $2,499 | 1,065 (12.1%) | 1,010 (8.8%) |
| $2,500 to $2,999 | 500 (5.7%) | 287 (2.5%) |
| $3,000 or more | 596 (6.8%) | 199 (1.7%) |
| Total | 8,783 (100.0%) | 11,431 (100.0%) |
Physical Housing Characteristics in North Miami
Housing Structures in North Miami
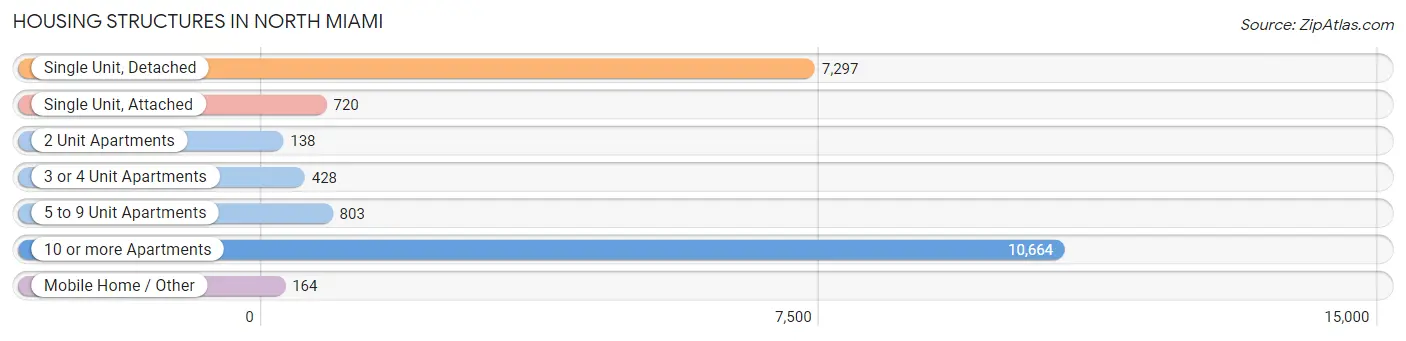
| Structure Type | # Housing Units | % Housing Units |
| Single Unit, Detached | 7,297 | 36.1% |
| Single Unit, Attached | 720 | 3.6% |
| 2 Unit Apartments | 138 | 0.7% |
| 3 or 4 Unit Apartments | 428 | 2.1% |
| 5 to 9 Unit Apartments | 803 | 4.0% |
| 10 or more Apartments | 10,664 | 52.8% |
| Mobile Home / Other | 164 | 0.8% |
| Total | 20,214 | 100.0% |
Housing Structures by Occupancy in North Miami
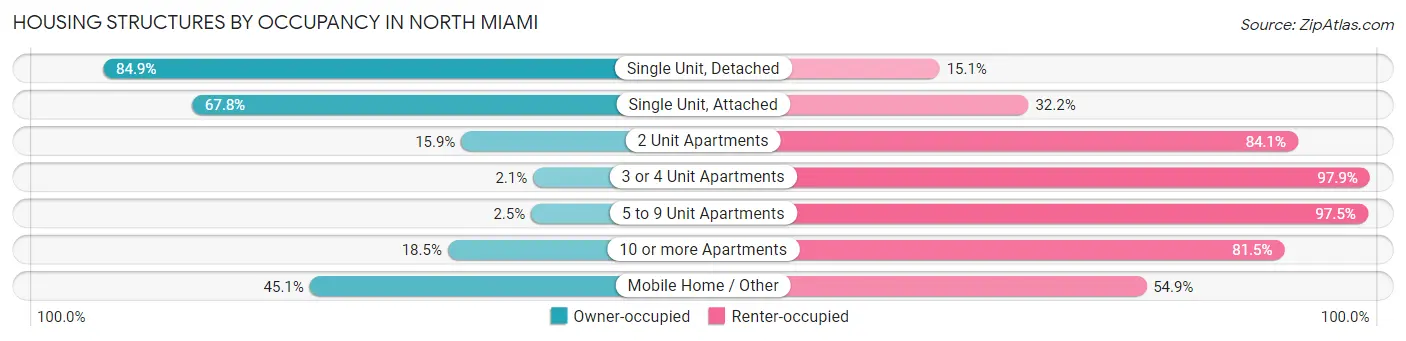
| Structure Type | Owner-occupied | Renter-occupied |
| Single Unit, Detached | 6,194 (84.9%) | 1,103 (15.1%) |
| Single Unit, Attached | 488 (67.8%) | 232 (32.2%) |
| 2 Unit Apartments | 22 (15.9%) | 116 (84.1%) |
| 3 or 4 Unit Apartments | 9 (2.1%) | 419 (97.9%) |
| 5 to 9 Unit Apartments | 20 (2.5%) | 783 (97.5%) |
| 10 or more Apartments | 1,976 (18.5%) | 8,688 (81.5%) |
| Mobile Home / Other | 74 (45.1%) | 90 (54.9%) |
| Total | 8,783 (43.4%) | 11,431 (56.6%) |
Housing Structures by Number of Rooms in North Miami
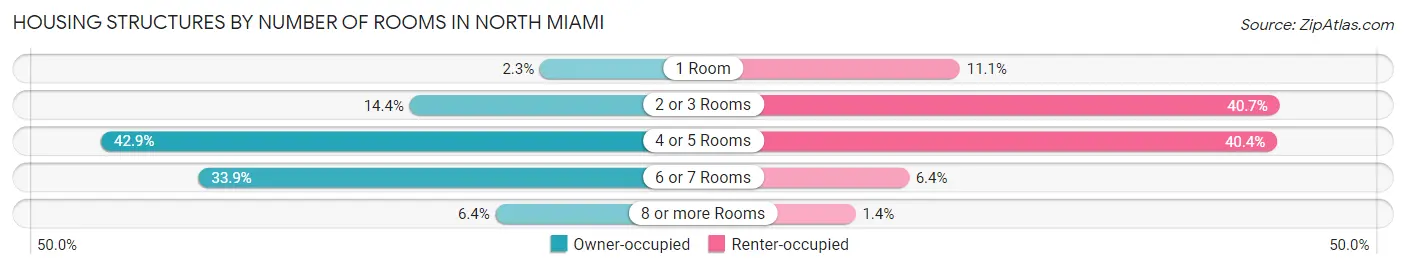
| Number of Rooms | Owner-occupied | Renter-occupied |
| 1 Room | 205 (2.3%) | 1,268 (11.1%) |
| 2 or 3 Rooms | 1,263 (14.4%) | 4,648 (40.7%) |
| 4 or 5 Rooms | 3,770 (42.9%) | 4,623 (40.4%) |
| 6 or 7 Rooms | 2,979 (33.9%) | 727 (6.4%) |
| 8 or more Rooms | 566 (6.4%) | 165 (1.4%) |
| Total | 8,783 (100.0%) | 11,431 (100.0%) |
Housing Structure by Heating Type in North Miami
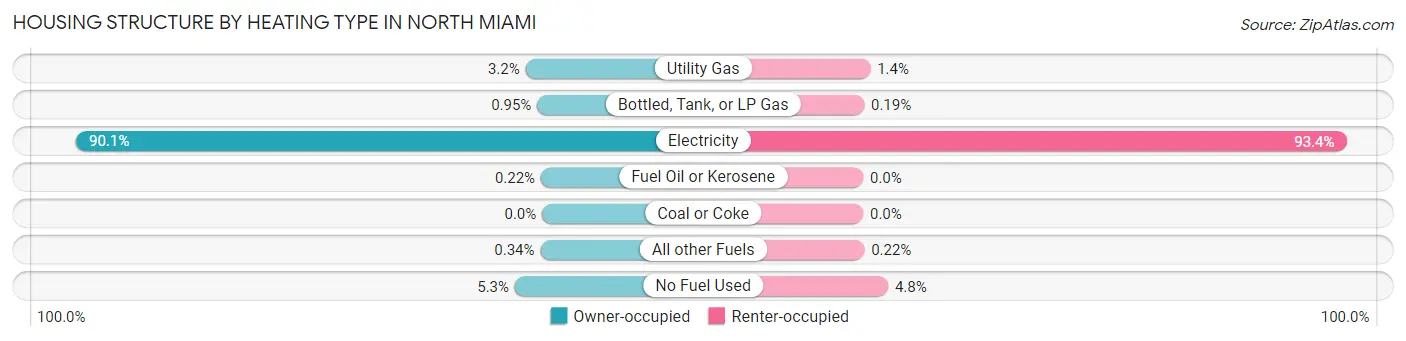
| Heating Type | Owner-occupied | Renter-occupied |
| Utility Gas | 280 (3.2%) | 158 (1.4%) |
| Bottled, Tank, or LP Gas | 83 (0.9%) | 22 (0.2%) |
| Electricity | 7,909 (90.0%) | 10,675 (93.4%) |
| Fuel Oil or Kerosene | 19 (0.2%) | 0 (0.0%) |
| Coal or Coke | 0 (0.0%) | 0 (0.0%) |
| All other Fuels | 30 (0.3%) | 25 (0.2%) |
| No Fuel Used | 462 (5.3%) | 551 (4.8%) |
| Total | 8,783 (100.0%) | 11,431 (100.0%) |
Household Vehicle Usage in North Miami
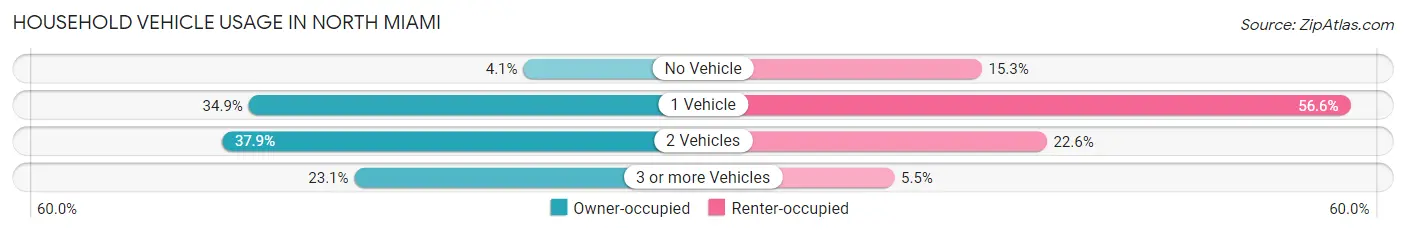
| Vehicles per Household | Owner-occupied | Renter-occupied |
| No Vehicle | 363 (4.1%) | 1,749 (15.3%) |
| 1 Vehicle | 3,065 (34.9%) | 6,471 (56.6%) |
| 2 Vehicles | 3,330 (37.9%) | 2,581 (22.6%) |
| 3 or more Vehicles | 2,025 (23.1%) | 630 (5.5%) |
| Total | 8,783 (100.0%) | 11,431 (100.0%) |
Real Estate & Mortgages in North Miami
Real Estate and Mortgage Overview in North Miami
| Characteristic | Without Mortgage | With Mortgage |
| Housing Units | 3,200 | 5,583 |
| Median Property Value | $250,600 | $319,500 |
| Median Household Income | $51,525 | $685 |
| Monthly Housing Costs | $603 | $547 |
| Real Estate Taxes | $1,549 | $253 |
Property Value by Mortgage Status in North Miami
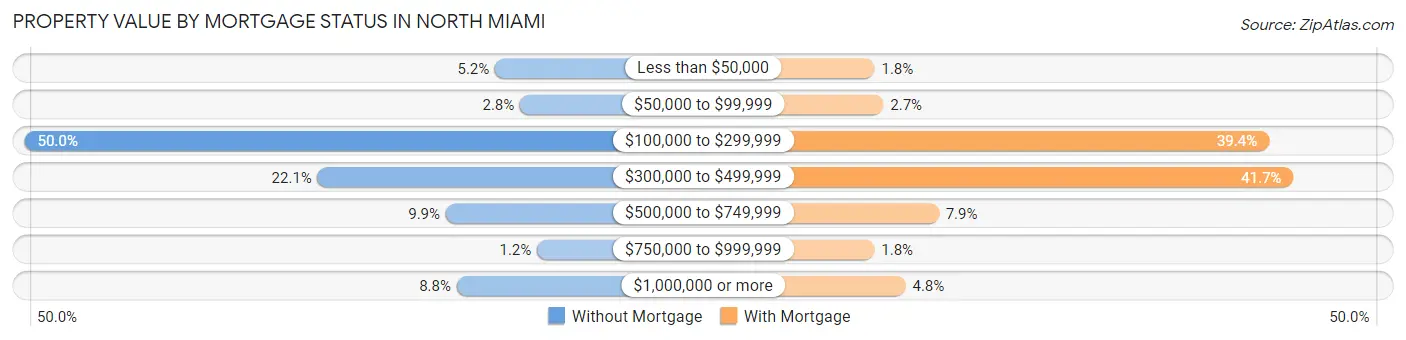
| Property Value | Without Mortgage | With Mortgage |
| Less than $50,000 | 166 (5.2%) | 101 (1.8%) |
| $50,000 to $99,999 | 90 (2.8%) | 148 (2.6%) |
| $100,000 to $299,999 | 1,600 (50.0%) | 2,198 (39.4%) |
| $300,000 to $499,999 | 707 (22.1%) | 2,328 (41.7%) |
| $500,000 to $749,999 | 316 (9.9%) | 442 (7.9%) |
| $750,000 to $999,999 | 38 (1.2%) | 100 (1.8%) |
| $1,000,000 or more | 283 (8.8%) | 266 (4.8%) |
| Total | 3,200 (100.0%) | 5,583 (100.0%) |
Household Income by Mortgage Status in North Miami
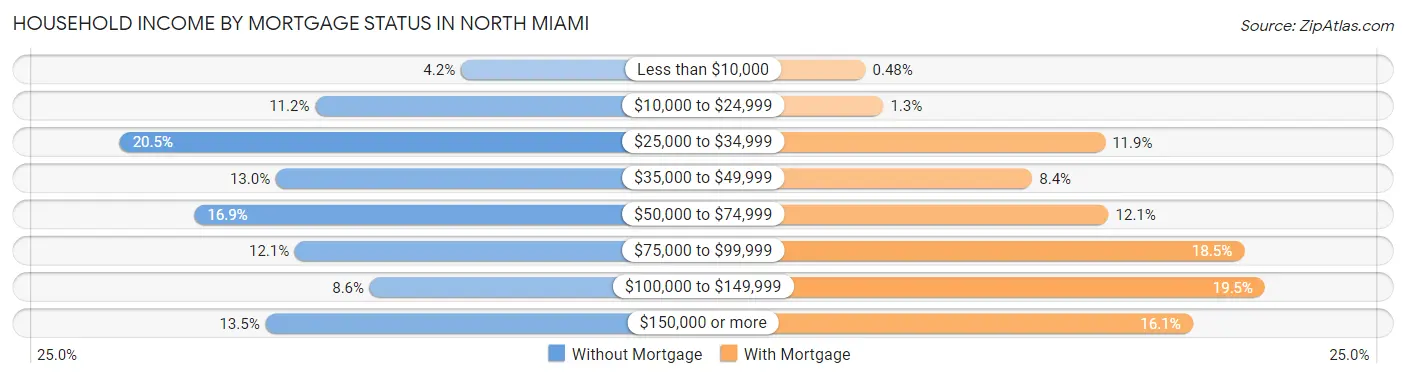
| Household Income | Without Mortgage | With Mortgage |
| Less than $10,000 | 135 (4.2%) | 27 (0.5%) |
| $10,000 to $24,999 | 357 (11.2%) | 74 (1.3%) |
| $25,000 to $34,999 | 655 (20.5%) | 664 (11.9%) |
| $35,000 to $49,999 | 417 (13.0%) | 470 (8.4%) |
| $50,000 to $74,999 | 541 (16.9%) | 673 (12.0%) |
| $75,000 to $99,999 | 388 (12.1%) | 1,033 (18.5%) |
| $100,000 to $149,999 | 274 (8.6%) | 1,088 (19.5%) |
| $150,000 or more | 433 (13.5%) | 896 (16.1%) |
| Total | 3,200 (100.0%) | 5,583 (100.0%) |
Property Value to Household Income Ratio in North Miami
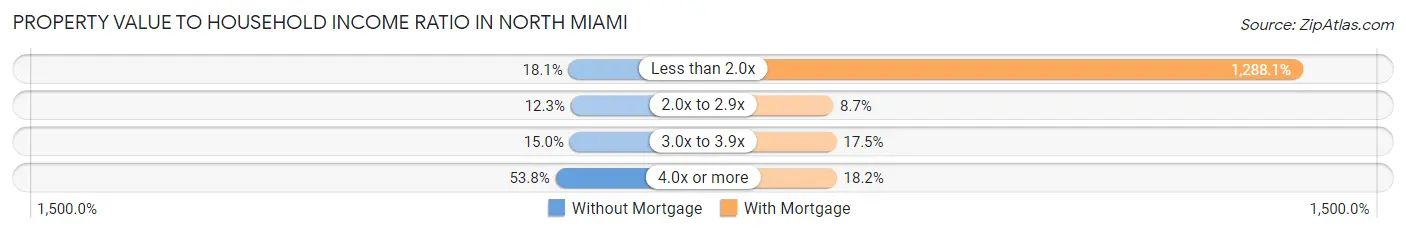
| Value-to-Income Ratio | Without Mortgage | With Mortgage |
| Less than 2.0x | 578 (18.1%) | 71,912 (1,288.0%) |
| 2.0x to 2.9x | 393 (12.3%) | 486 (8.7%) |
| 3.0x to 3.9x | 479 (15.0%) | 979 (17.5%) |
| 4.0x or more | 1,723 (53.8%) | 1,015 (18.2%) |
| Total | 3,200 (100.0%) | 5,583 (100.0%) |
Real Estate Taxes by Mortgage Status in North Miami
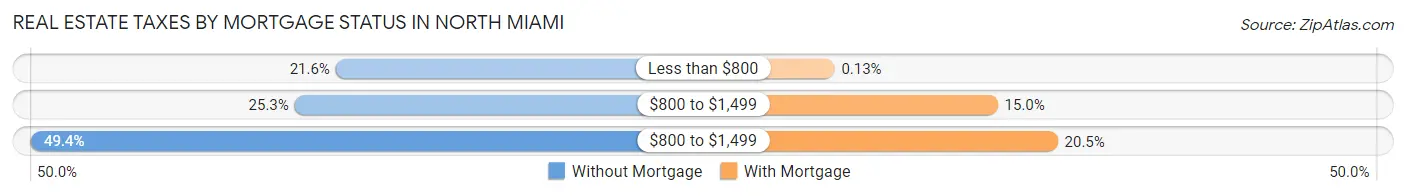
| Property Taxes | Without Mortgage | With Mortgage |
| Less than $800 | 691 (21.6%) | 7 (0.1%) |
| $800 to $1,499 | 811 (25.3%) | 839 (15.0%) |
| $800 to $1,499 | 1,581 (49.4%) | 1,145 (20.5%) |
| Total | 3,200 (100.0%) | 5,583 (100.0%) |
Health & Disability in North Miami
Health Insurance Coverage by Age in North Miami
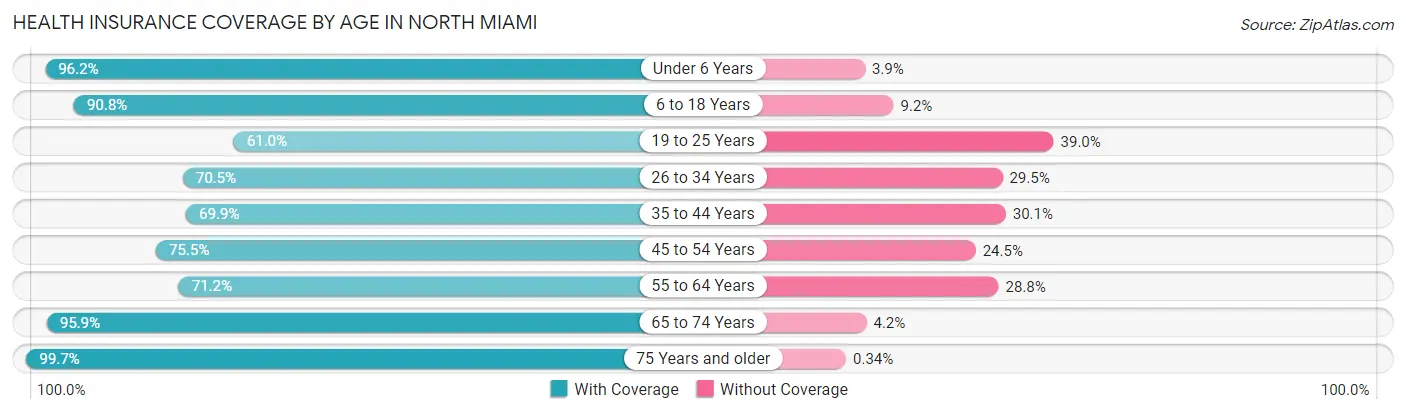
| Age Bracket | With Coverage | Without Coverage |
| Under 6 Years | 4,721 (96.2%) | 189 (3.8%) |
| 6 to 18 Years | 8,443 (90.8%) | 855 (9.2%) |
| 19 to 25 Years | 3,595 (61.0%) | 2,301 (39.0%) |
| 26 to 34 Years | 5,716 (70.5%) | 2,392 (29.5%) |
| 35 to 44 Years | 6,349 (69.9%) | 2,736 (30.1%) |
| 45 to 54 Years | 5,135 (75.5%) | 1,667 (24.5%) |
| 55 to 64 Years | 5,155 (71.2%) | 2,081 (28.8%) |
| 65 to 74 Years | 4,457 (95.9%) | 193 (4.2%) |
| 75 Years and older | 2,911 (99.7%) | 10 (0.3%) |
| Total | 46,482 (78.9%) | 12,424 (21.1%) |
Health Insurance Coverage by Citizenship Status in North Miami
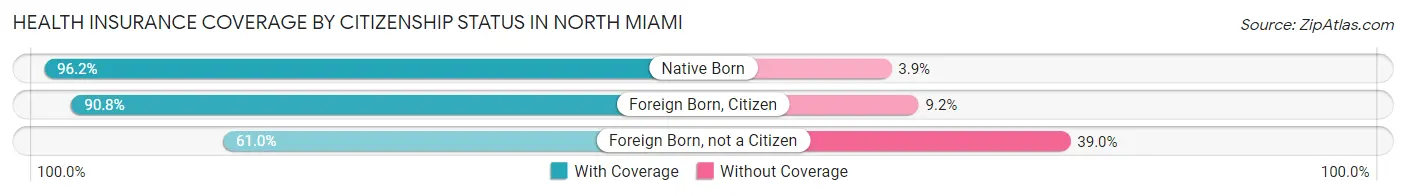
| Citizenship Status | With Coverage | Without Coverage |
| Native Born | 4,721 (96.2%) | 189 (3.8%) |
| Foreign Born, Citizen | 8,443 (90.8%) | 855 (9.2%) |
| Foreign Born, not a Citizen | 3,595 (61.0%) | 2,301 (39.0%) |
Health Insurance Coverage by Household Income in North Miami
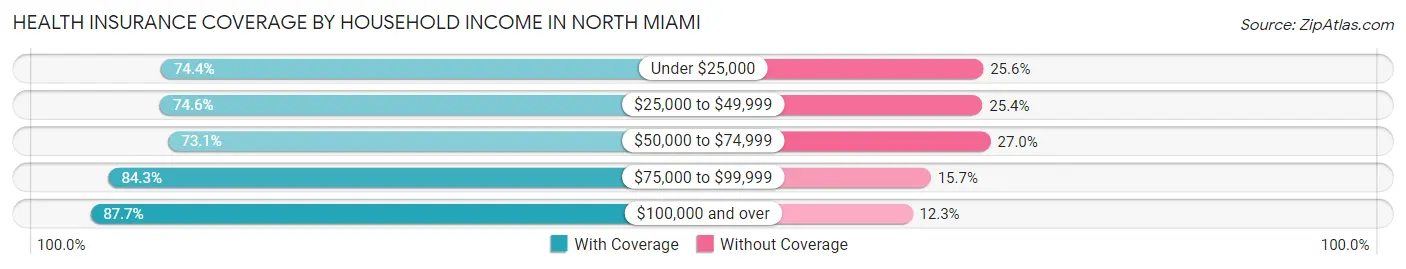
| Household Income | With Coverage | Without Coverage |
| Under $25,000 | 6,164 (74.4%) | 2,116 (25.6%) |
| $25,000 to $49,999 | 12,558 (74.6%) | 4,276 (25.4%) |
| $50,000 to $74,999 | 7,734 (73.1%) | 2,853 (27.0%) |
| $75,000 to $99,999 | 7,821 (84.3%) | 1,460 (15.7%) |
| $100,000 and over | 11,454 (87.7%) | 1,606 (12.3%) |
Public vs Private Health Insurance Coverage by Age in North Miami
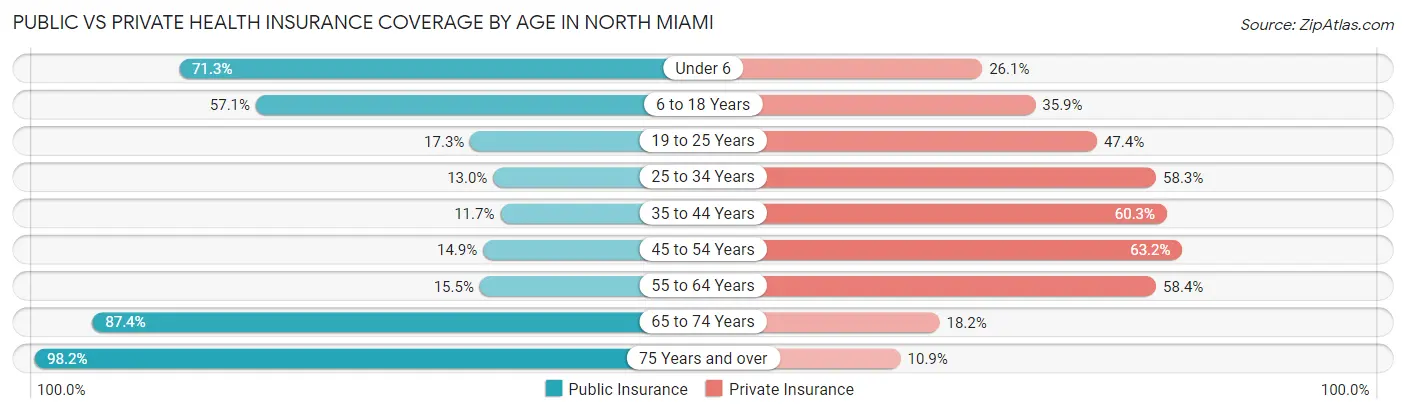
| Age Bracket | Public Insurance | Private Insurance |
| Under 6 | 3,503 (71.3%) | 1,280 (26.1%) |
| 6 to 18 Years | 5,306 (57.1%) | 3,341 (35.9%) |
| 19 to 25 Years | 1,020 (17.3%) | 2,793 (47.4%) |
| 25 to 34 Years | 1,056 (13.0%) | 4,730 (58.3%) |
| 35 to 44 Years | 1,065 (11.7%) | 5,481 (60.3%) |
| 45 to 54 Years | 1,014 (14.9%) | 4,298 (63.2%) |
| 55 to 64 Years | 1,123 (15.5%) | 4,222 (58.4%) |
| 65 to 74 Years | 4,065 (87.4%) | 844 (18.1%) |
| 75 Years and over | 2,869 (98.2%) | 319 (10.9%) |
| Total | 21,021 (35.7%) | 27,308 (46.4%) |
Disability Status by Sex by Age in North Miami
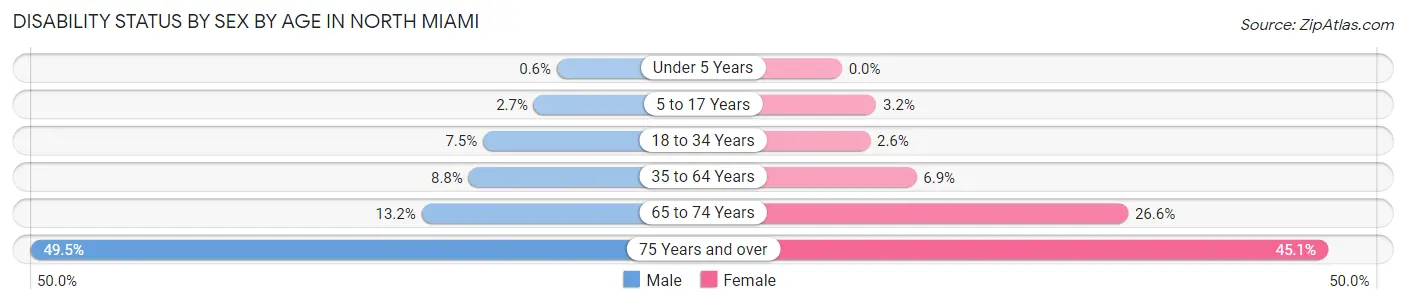
| Age Bracket | Male | Female |
| Under 5 Years | 12 (0.6%) | 0 (0.0%) |
| 5 to 17 Years | 137 (2.7%) | 130 (3.2%) |
| 18 to 34 Years | 526 (7.4%) | 206 (2.6%) |
| 35 to 64 Years | 1,001 (8.8%) | 812 (6.9%) |
| 65 to 74 Years | 279 (13.2%) | 672 (26.6%) |
| 75 Years and over | 678 (49.4%) | 699 (45.1%) |
Disability Class by Sex by Age in North Miami
Disability Class: Hearing Difficulty
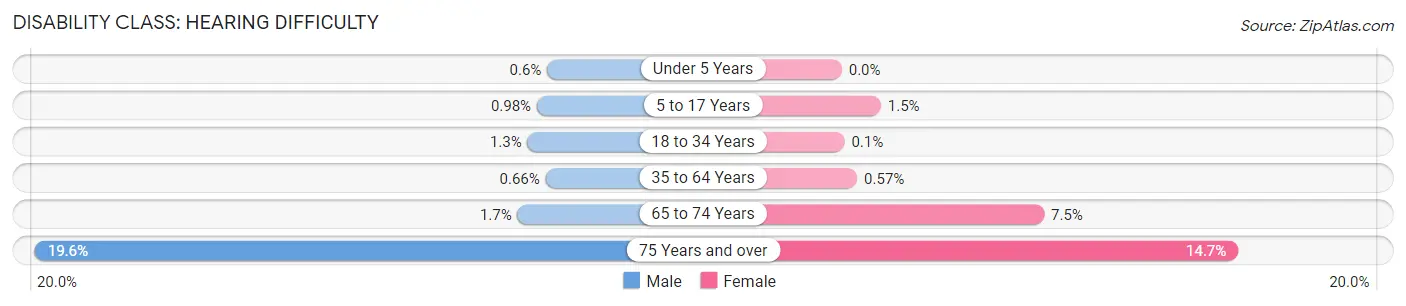
| Age Bracket | Male | Female |
| Under 5 Years | 12 (0.6%) | 0 (0.0%) |
| 5 to 17 Years | 49 (1.0%) | 59 (1.5%) |
| 18 to 34 Years | 94 (1.3%) | 8 (0.1%) |
| 35 to 64 Years | 75 (0.7%) | 67 (0.6%) |
| 65 to 74 Years | 36 (1.7%) | 190 (7.5%) |
| 75 Years and over | 269 (19.6%) | 228 (14.7%) |
Disability Class: Vision Difficulty
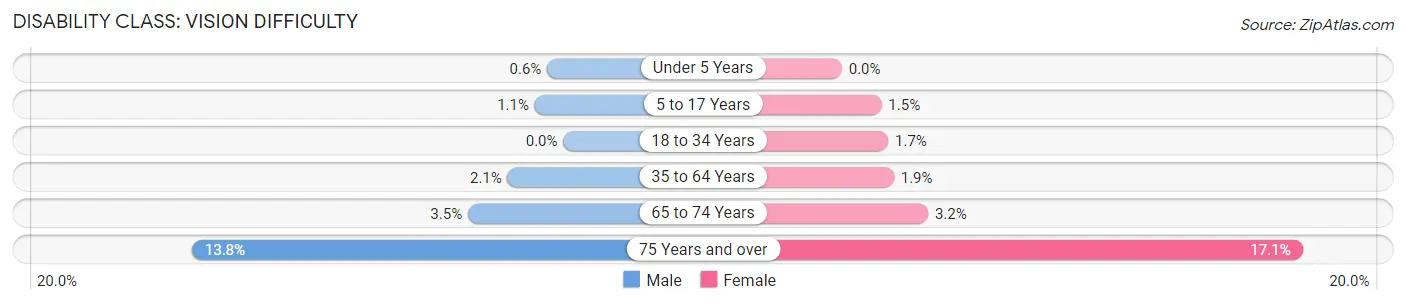
| Age Bracket | Male | Female |
| Under 5 Years | 12 (0.6%) | 0 (0.0%) |
| 5 to 17 Years | 53 (1.1%) | 60 (1.5%) |
| 18 to 34 Years | 0 (0.0%) | 135 (1.7%) |
| 35 to 64 Years | 236 (2.1%) | 226 (1.9%) |
| 65 to 74 Years | 75 (3.5%) | 81 (3.2%) |
| 75 Years and over | 189 (13.8%) | 265 (17.1%) |
Disability Class: Cognitive Difficulty
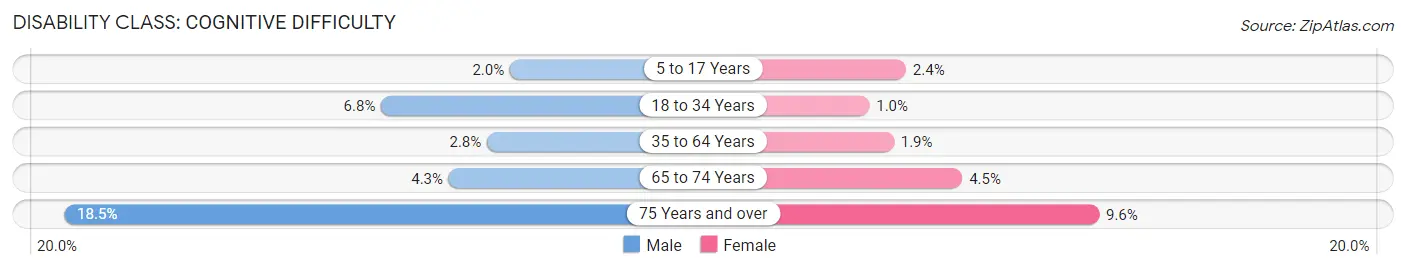
| Age Bracket | Male | Female |
| 5 to 17 Years | 99 (2.0%) | 97 (2.4%) |
| 18 to 34 Years | 477 (6.8%) | 80 (1.0%) |
| 35 to 64 Years | 322 (2.8%) | 226 (1.9%) |
| 65 to 74 Years | 90 (4.3%) | 113 (4.5%) |
| 75 Years and over | 254 (18.5%) | 148 (9.6%) |
Disability Class: Ambulatory Difficulty
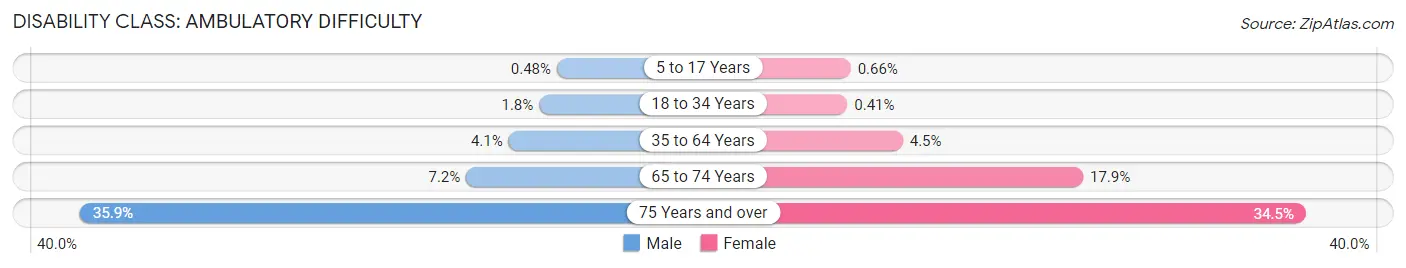
| Age Bracket | Male | Female |
| 5 to 17 Years | 24 (0.5%) | 27 (0.7%) |
| 18 to 34 Years | 127 (1.8%) | 32 (0.4%) |
| 35 to 64 Years | 464 (4.1%) | 531 (4.5%) |
| 65 to 74 Years | 153 (7.2%) | 453 (17.9%) |
| 75 Years and over | 492 (35.9%) | 534 (34.4%) |
Disability Class: Self-Care Difficulty
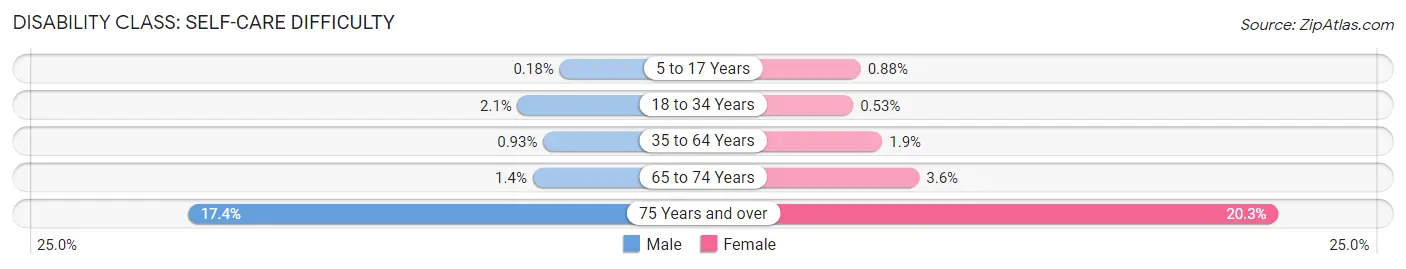
| Age Bracket | Male | Female |
| 5 to 17 Years | 9 (0.2%) | 36 (0.9%) |
| 18 to 34 Years | 150 (2.1%) | 42 (0.5%) |
| 35 to 64 Years | 106 (0.9%) | 220 (1.9%) |
| 65 to 74 Years | 30 (1.4%) | 91 (3.6%) |
| 75 Years and over | 239 (17.4%) | 314 (20.3%) |
Technology Access in North Miami
Computing Device Access in North Miami
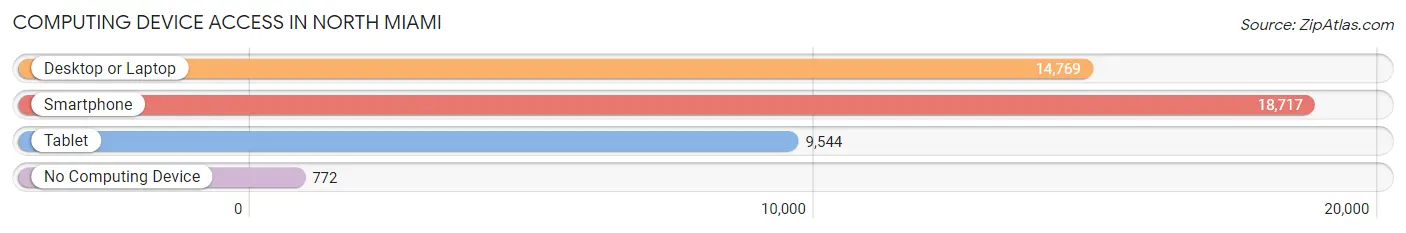
| Device Type | # Households | % Households |
| Desktop or Laptop | 14,769 | 73.1% |
| Smartphone | 18,717 | 92.6% |
| Tablet | 9,544 | 47.2% |
| No Computing Device | 772 | 3.8% |
| Total | 20,214 | 100.0% |
Internet Access in North Miami
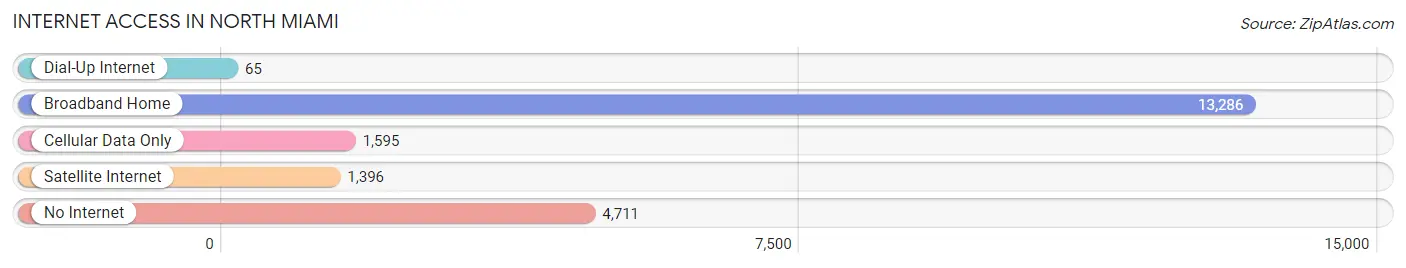
| Internet Type | # Households | % Households |
| Dial-Up Internet | 65 | 0.3% |
| Broadband Home | 13,286 | 65.7% |
| Cellular Data Only | 1,595 | 7.9% |
| Satellite Internet | 1,396 | 6.9% |
| No Internet | 4,711 | 23.3% |
| Total | 20,214 | 100.0% |
North Miami Summary
Miami-Dade County, Florida, is home to the city of North Miami, located in the northeastern corner of the county. North Miami is a diverse and vibrant city with a population of approximately 61,000 people. The city is bordered by the cities of Miami Shores, El Portal, and Miami Gardens, and is situated between Biscayne Bay and the Everglades.
History
North Miami was founded in 1926 by a group of developers who wanted to create a residential community for middle-class families. The city was originally known as “Town of Miami Shores” and was incorporated in 1931. The city was renamed “North Miami” in 1932.
In the 1950s, North Miami experienced a population boom as many people moved to the area from other parts of the country. This influx of people led to the development of many new businesses and neighborhoods.
In the 1960s, North Miami became a popular destination for Cuban immigrants fleeing the Cuban Revolution. This influx of Cuban immigrants led to the development of a vibrant Cuban-American community in North Miami.
In the 1970s, North Miami experienced a period of economic decline as many businesses closed and the population decreased. However, the city was able to rebound in the 1980s and 1990s with the development of new businesses and neighborhoods.
Geography
North Miami is located in the northeastern corner of Miami-Dade County, Florida. The city is bordered by the cities of Miami Shores, El Portal, and Miami Gardens, and is situated between Biscayne Bay and the Everglades.
The city has a total area of 8.3 square miles, of which 7.9 square miles is land and 0.4 square miles is water. The city is located at an elevation of 6 feet above sea level.
The city is divided into several distinct neighborhoods, including Biscayne Park, Biscayne Gardens, Biscayne Heights, Biscayne Point, Biscayne Village, and Biscayne Shores.
Economy
North Miami’s economy is largely based on tourism, retail, and healthcare. The city is home to several major hospitals, including Jackson North Medical Center, North Shore Medical Center, and Aventura Hospital and Medical Center.
The city is also home to several major shopping centers, including the Mall at 163rd Street, the Shops at 163rd Street, and the Shops at North Miami.
Demographics
As of the 2010 census, North Miami had a population of 61,254 people. The racial makeup of the city was 57.2% African American, 28.2% White, 8.3% Hispanic or Latino, 2.2% Asian, and 0.2% Native American.
The median household income in North Miami was $37,845 in 2010. The median age of the population was 37.7 years.
Conclusion
North Miami is a vibrant and diverse city located in Miami-Dade County, Florida. The city has a rich history, and has experienced periods of both growth and decline. North Miami’s economy is largely based on tourism, retail, and healthcare, and the city is home to several major hospitals and shopping centers. The population of North Miami is largely African American and Hispanic or Latino, and the median household income is $37,845. North Miami is a great place to live, work, and visit.
Common Questions
What is Per Capita Income in North Miami?
Per Capita income in North Miami is $25,885.
What is the Median Family Income in North Miami?
Median Family Income in North Miami is $53,001.
What is the Median Household income in North Miami?
Median Household Income in North Miami is $49,069.
What is Income or Wage Gap in North Miami?
Income or Wage Gap in North Miami is 14.4%.
Women in North Miami earn 85.6 cents for every dollar earned by a man.
What is Family Income Deficit in North Miami?
Family Income Deficit in North Miami is $8,874.
Families that are below poverty line in North Miami earn $8,874 less on average than the poverty threshold level.
What is Inequality or Gini Index in North Miami?
Inequality or Gini Index in North Miami is 0.48.
What is the Total Population of North Miami?
Total Population of North Miami is 59,854.
What is the Total Male Population of North Miami?
Total Male Population of North Miami is 29,286.
What is the Total Female Population of North Miami?
Total Female Population of North Miami is 30,568.
What is the Ratio of Males per 100 Females in North Miami?
There are 95.81 Males per 100 Females in North Miami.
What is the Ratio of Females per 100 Males in North Miami?
There are 104.38 Females per 100 Males in North Miami.
What is the Median Population Age in North Miami?
Median Population Age in North Miami is 37.2 Years.
What is the Average Family Size in North Miami
Average Family Size in North Miami is 3.6 People.
What is the Average Household Size in North Miami
Average Household Size in North Miami is 2.9 People.
How Large is the Labor Force in North Miami?
There are 30,760 People in the Labor Forcein in North Miami.
What is the Percentage of People in the Labor Force in North Miami?
64.1% of People are in the Labor Force in North Miami.
What is the Unemployment Rate in North Miami?
Unemployment Rate in North Miami is 6.1%.