Delray Beach, FL Map & Demographics
Delray Beach Map
Delray Beach Overview
$52,879
PER CAPITA INCOME
$91,111
AVG FAMILY INCOME
$76,558
AVG HOUSEHOLD INCOME
24.9%
WAGE / INCOME GAP [ % ]
75.1¢/ $1
WAGE / INCOME GAP [ $ ]
$9,028
FAMILY INCOME DEFICIT
0.53
INEQUALITY / GINI INDEX
66,646
TOTAL POPULATION
32,056
MALE POPULATION
34,590
FEMALE POPULATION
92.67
MALES / 100 FEMALES
107.90
FEMALES / 100 MALES
50.7
MEDIAN AGE
3.1
AVG FAMILY SIZE
2.3
AVG HOUSEHOLD SIZE
35,455
LABOR FORCE [ PEOPLE ]
60.4%
PERCENT IN LABOR FORCE
5.8%
UNEMPLOYMENT RATE
Delray Beach Area Codes
Income in Delray Beach
Income Overview in Delray Beach
Per Capita Income in Delray Beach is $52,879, while median incomes of families and households are $91,111 and $76,558 respectively.
| Characteristic | Number | Measure |
| Per Capita Income | 66,646 | $52,879 |
| Median Family Income | 15,060 | $91,111 |
| Mean Family Income | 15,060 | $141,960 |
| Median Household Income | 28,592 | $76,558 |
| Mean Household Income | 28,592 | $118,064 |
| Income Deficit | 15,060 | $9,028 |
| Wage / Income Gap (%) | 66,646 | 24.92% |
| Wage / Income Gap ($) | 66,646 | 75.08¢ per $1 |
| Gini / Inequality Index | 66,646 | 0.53 |
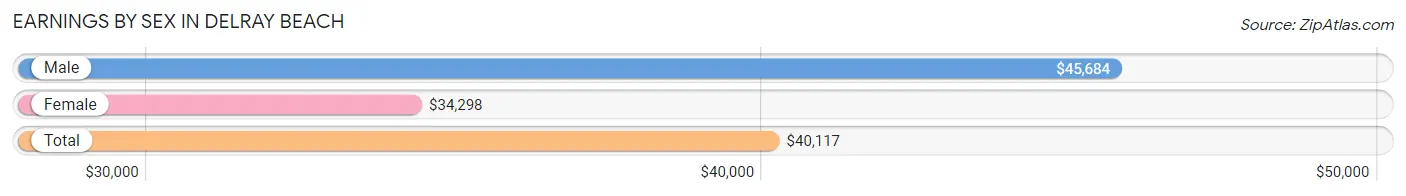
Earnings by Sex in Delray Beach
Average Earnings in Delray Beach are $40,117, $45,684 for men and $34,298 for women, a difference of 24.9%.
| Sex | Number | Average Earnings |
| Male | 18,811 (51.7%) | $45,684 |
| Female | 17,593 (48.3%) | $34,298 |
| Total | 36,404 (100.0%) | $40,117 |
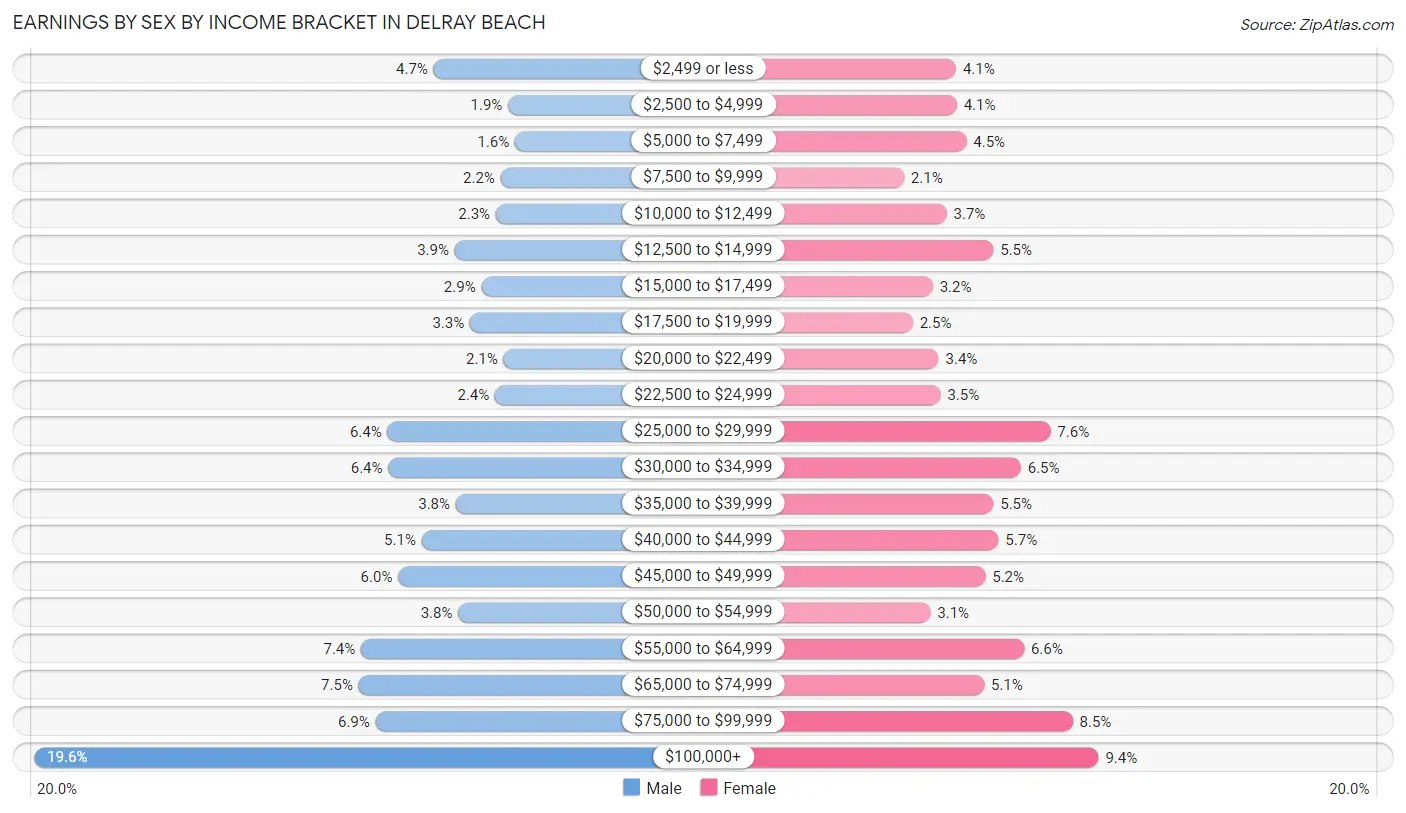
Earnings by Sex by Income Bracket in Delray Beach
The most common earnings brackets in Delray Beach are $100,000+ for men (3,695 | 19.6%) and $100,000+ for women (1,659 | 9.4%).
| Income | Male | Female |
| $2,499 or less | 878 (4.7%) | 719 (4.1%) |
| $2,500 to $4,999 | 354 (1.9%) | 724 (4.1%) |
| $5,000 to $7,499 | 304 (1.6%) | 788 (4.5%) |
| $7,500 to $9,999 | 406 (2.2%) | 376 (2.1%) |
| $10,000 to $12,499 | 441 (2.3%) | 658 (3.7%) |
| $12,500 to $14,999 | 730 (3.9%) | 965 (5.5%) |
| $15,000 to $17,499 | 542 (2.9%) | 567 (3.2%) |
| $17,500 to $19,999 | 622 (3.3%) | 435 (2.5%) |
| $20,000 to $22,499 | 385 (2.1%) | 606 (3.4%) |
| $22,500 to $24,999 | 445 (2.4%) | 617 (3.5%) |
| $25,000 to $29,999 | 1,204 (6.4%) | 1,342 (7.6%) |
| $30,000 to $34,999 | 1,199 (6.4%) | 1,147 (6.5%) |
| $35,000 to $39,999 | 722 (3.8%) | 966 (5.5%) |
| $40,000 to $44,999 | 963 (5.1%) | 999 (5.7%) |
| $45,000 to $49,999 | 1,129 (6.0%) | 913 (5.2%) |
| $50,000 to $54,999 | 705 (3.7%) | 550 (3.1%) |
| $55,000 to $64,999 | 1,391 (7.4%) | 1,168 (6.6%) |
| $65,000 to $74,999 | 1,408 (7.5%) | 905 (5.1%) |
| $75,000 to $99,999 | 1,288 (6.9%) | 1,489 (8.5%) |
| $100,000+ | 3,695 (19.6%) | 1,659 (9.4%) |
| Total | 18,811 (100.0%) | 17,593 (100.0%) |
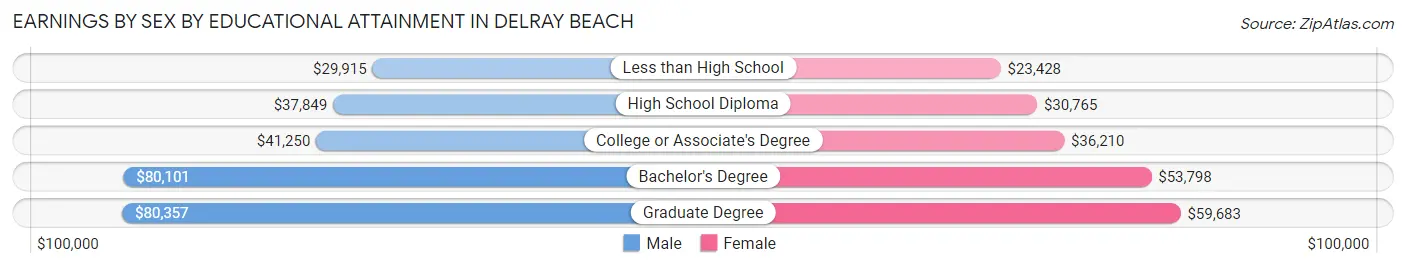
Earnings by Sex by Educational Attainment in Delray Beach
Average earnings in Delray Beach are $49,050 for men and $38,753 for women, a difference of 21.0%. Men with an educational attainment of graduate degree enjoy the highest average annual earnings of $80,357, while those with less than high school education earn the least with $29,915. Women with an educational attainment of graduate degree earn the most with the average annual earnings of $59,683, while those with less than high school education have the smallest earnings of $23,428.
| Educational Attainment | Male Income | Female Income |
| Less than High School | $29,915 | $23,428 |
| High School Diploma | $37,849 | $30,765 |
| College or Associate's Degree | $41,250 | $36,210 |
| Bachelor's Degree | $80,101 | $53,798 |
| Graduate Degree | $80,357 | $59,683 |
| Total | $49,050 | $38,753 |
Family Income in Delray Beach
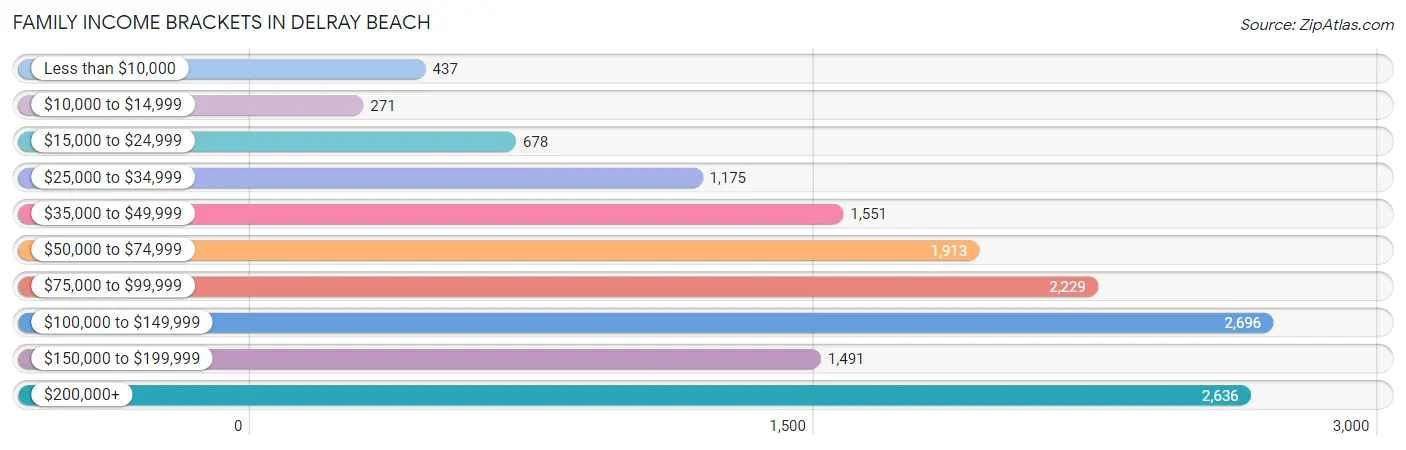
Family Income Brackets in Delray Beach
According to the Delray Beach family income data, there are 2,696 families falling into the $100,000 to $149,999 income range, which is the most common income bracket and makes up 17.9% of all families. Conversely, the $10,000 to $14,999 income bracket is the least frequent group with only 271 families (1.8%) belonging to this category.
| Income Bracket | # Families | % Families |
| Less than $10,000 | 437 | 2.9% |
| $10,000 to $14,999 | 271 | 1.8% |
| $15,000 to $24,999 | 678 | 4.5% |
| $25,000 to $34,999 | 1,175 | 7.8% |
| $35,000 to $49,999 | 1,551 | 10.3% |
| $50,000 to $74,999 | 1,913 | 12.7% |
| $75,000 to $99,999 | 2,229 | 14.8% |
| $100,000 to $149,999 | 2,696 | 17.9% |
| $150,000 to $199,999 | 1,491 | 9.9% |
| $200,000+ | 2,636 | 17.5% |
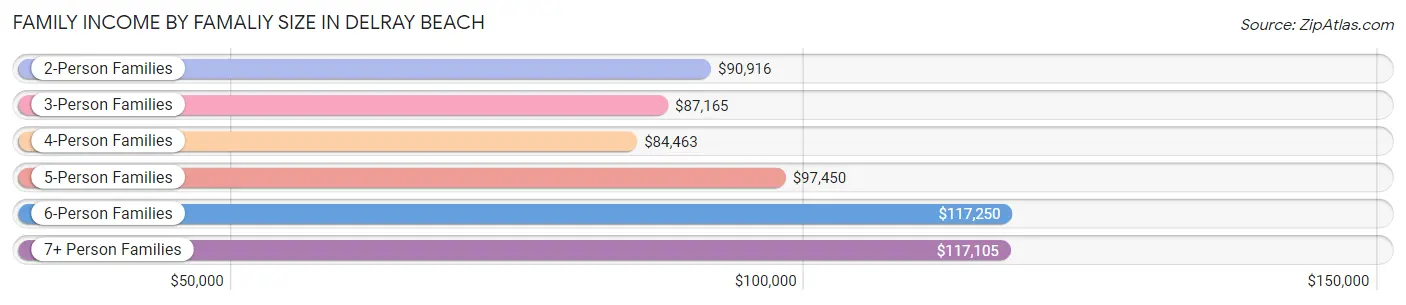
Family Income by Famaliy Size in Delray Beach
6-person families (349 | 2.3%) account for the highest median family income in Delray Beach with $117,250 per family, while 2-person families (8,960 | 59.5%) have the highest median income of $45,458 per family member.
| Income Bracket | # Families | Median Income |
| 2-Person Families | 8,960 (59.5%) | $90,916 |
| 3-Person Families | 2,595 (17.2%) | $87,165 |
| 4-Person Families | 2,113 (14.0%) | $84,463 |
| 5-Person Families | 791 (5.2%) | $97,450 |
| 6-Person Families | 349 (2.3%) | $117,250 |
| 7+ Person Families | 252 (1.7%) | $117,105 |
| Total | 15,060 (100.0%) | $91,111 |
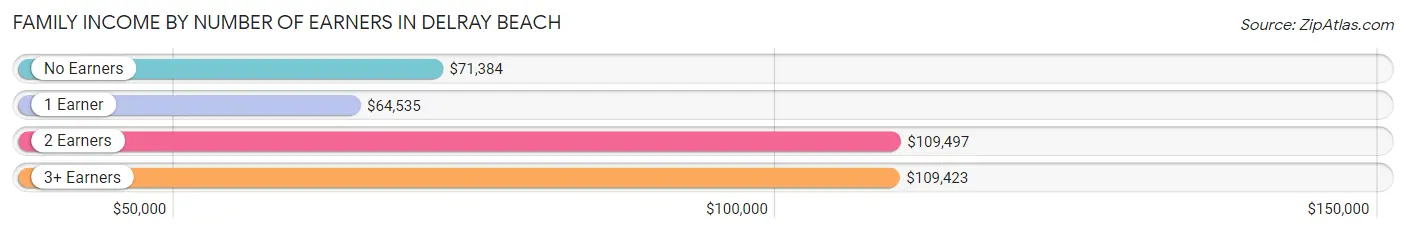
Family Income by Number of Earners in Delray Beach
The median family income in Delray Beach is $91,111, with families comprising 2 earners (5,539) having the highest median family income of $109,497, while families with 1 earner (4,241) have the lowest median family income of $64,535, accounting for 36.8% and 28.2% of families, respectively.
| Number of Earners | # Families | Median Income |
| No Earners | 3,418 (22.7%) | $71,384 |
| 1 Earner | 4,241 (28.2%) | $64,535 |
| 2 Earners | 5,539 (36.8%) | $109,497 |
| 3+ Earners | 1,862 (12.4%) | $109,423 |
| Total | 15,060 (100.0%) | $91,111 |
Household Income in Delray Beach
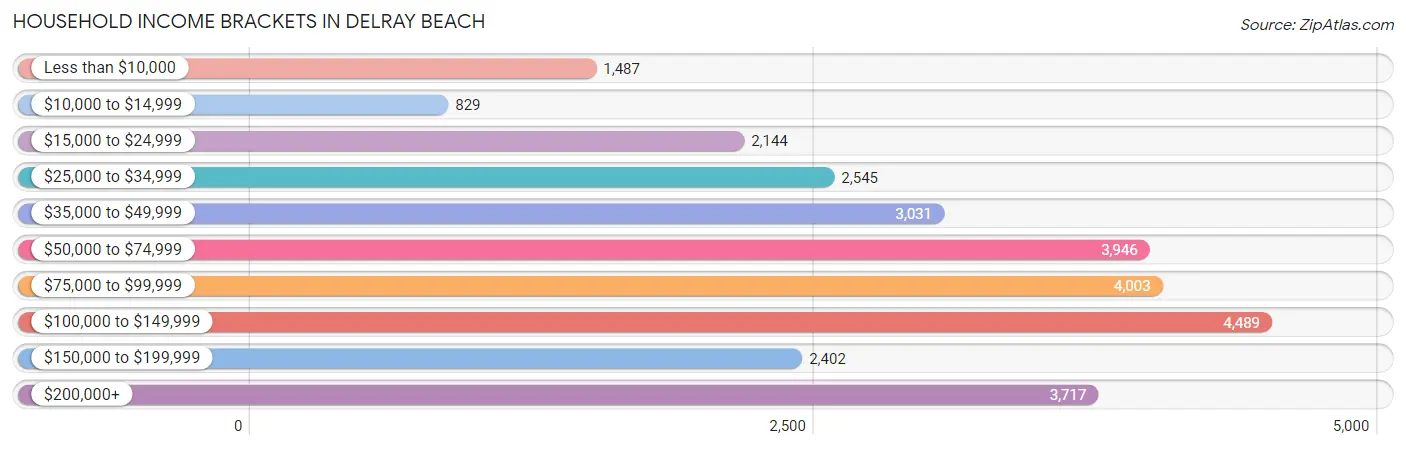
Household Income Brackets in Delray Beach
With 4,489 households falling in the category, the $100,000 to $149,999 income range is the most frequent in Delray Beach, accounting for 15.7% of all households. In contrast, only 829 households (2.9%) fall into the $10,000 to $14,999 income bracket, making it the least populous group.
| Income Bracket | # Households | % Households |
| Less than $10,000 | 1,487 | 5.2% |
| $10,000 to $14,999 | 829 | 2.9% |
| $15,000 to $24,999 | 2,144 | 7.5% |
| $25,000 to $34,999 | 2,545 | 8.9% |
| $35,000 to $49,999 | 3,031 | 10.6% |
| $50,000 to $74,999 | 3,946 | 13.8% |
| $75,000 to $99,999 | 4,003 | 14.0% |
| $100,000 to $149,999 | 4,489 | 15.7% |
| $150,000 to $199,999 | 2,402 | 8.4% |
| $200,000+ | 3,717 | 13.0% |
Household Income by Householder Age in Delray Beach
The median household income in Delray Beach is $76,558, with the highest median household income of $88,933 found in the 45 to 64 years age bracket for the primary householder. A total of 9,727 households (34.0%) fall into this category. Meanwhile, the 15 to 24 years age bracket for the primary householder has the lowest median household income of $54,539, with 613 households (2.1%) in this group.
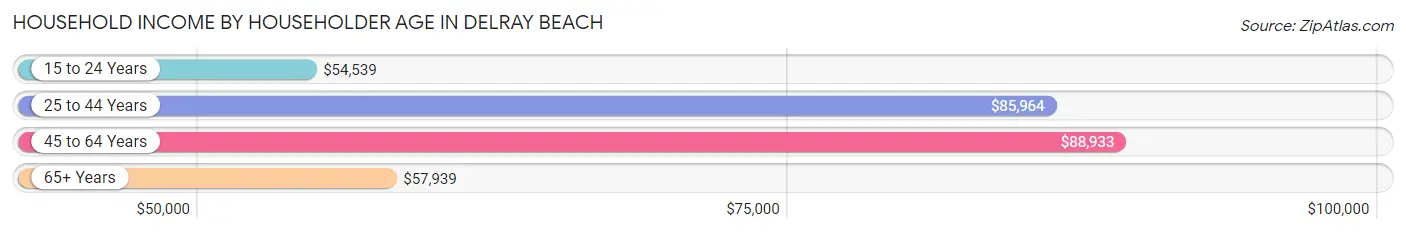
| Income Bracket | # Households | Median Income |
| 15 to 24 Years | 613 (2.1%) | $54,539 |
| 25 to 44 Years | 6,416 (22.4%) | $85,964 |
| 45 to 64 Years | 9,727 (34.0%) | $88,933 |
| 65+ Years | 11,836 (41.4%) | $57,939 |
| Total | 28,592 (100.0%) | $76,558 |
Poverty in Delray Beach
Income Below Poverty by Sex and Age in Delray Beach
With 11.2% poverty level for males and 13.1% for females among the residents of Delray Beach, 15 year old males and 5 year old females are the most vulnerable to poverty, with 65 males (34.0%) and 191 females (66.5%) in their respective age groups living below the poverty level.
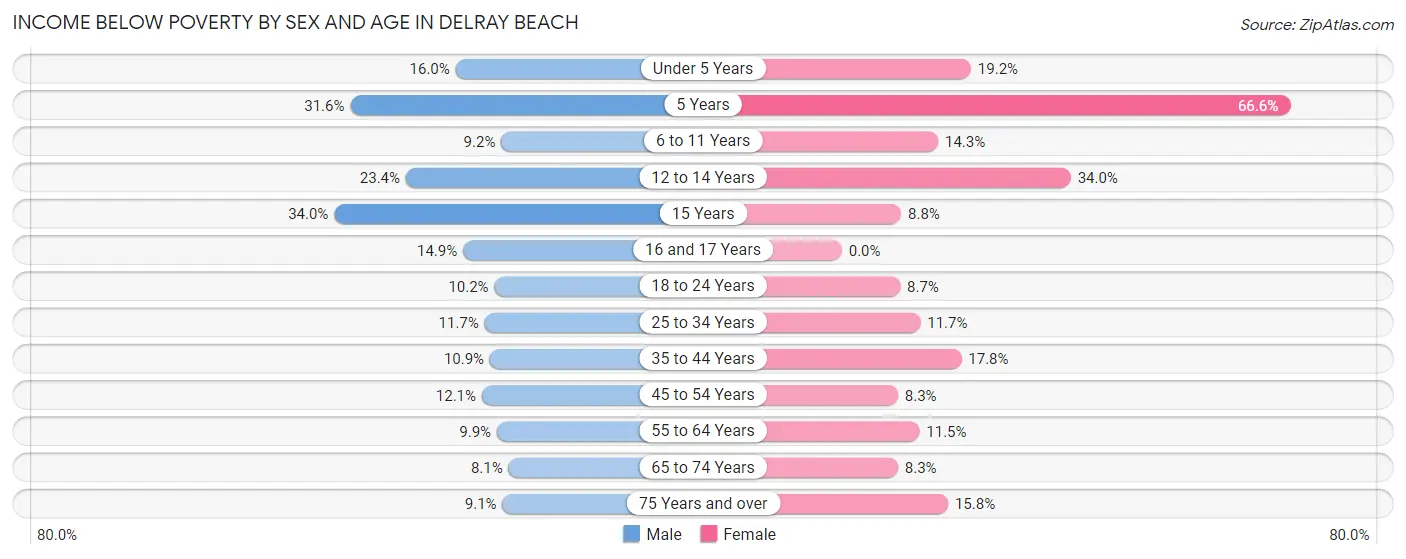
| Age Bracket | Male | Female |
| Under 5 Years | 189 (16.0%) | 299 (19.2%) |
| 5 Years | 131 (31.6%) | 191 (66.5%) |
| 6 to 11 Years | 81 (9.2%) | 183 (14.3%) |
| 12 to 14 Years | 160 (23.4%) | 241 (34.0%) |
| 15 Years | 65 (34.0%) | 29 (8.8%) |
| 16 and 17 Years | 66 (14.9%) | 0 (0.0%) |
| 18 to 24 Years | 225 (10.2%) | 218 (8.7%) |
| 25 to 34 Years | 558 (11.7%) | 503 (11.7%) |
| 35 to 44 Years | 396 (10.9%) | 611 (17.7%) |
| 45 to 54 Years | 441 (12.1%) | 291 (8.3%) |
| 55 to 64 Years | 529 (9.9%) | 704 (11.5%) |
| 65 to 74 Years | 384 (8.1%) | 377 (8.3%) |
| 75 Years and over | 319 (9.0%) | 802 (15.8%) |
| Total | 3,544 (11.2%) | 4,449 (13.1%) |
Income Above Poverty by Sex and Age in Delray Beach
According to the poverty statistics in Delray Beach, males aged 65 to 74 years and females aged 16 and 17 years are the age groups that are most secure financially, with 91.9% of males and 100.0% of females in these age groups living above the poverty line.
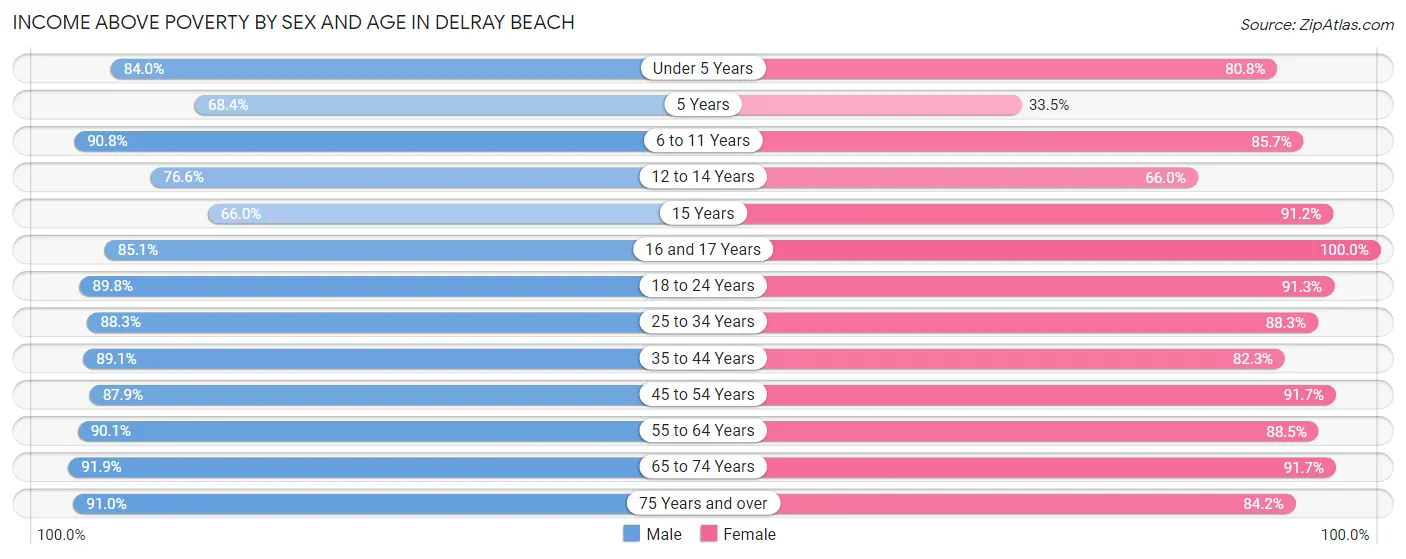
| Age Bracket | Male | Female |
| Under 5 Years | 992 (84.0%) | 1,261 (80.8%) |
| 5 Years | 283 (68.4%) | 96 (33.5%) |
| 6 to 11 Years | 798 (90.8%) | 1,098 (85.7%) |
| 12 to 14 Years | 524 (76.6%) | 468 (66.0%) |
| 15 Years | 126 (66.0%) | 300 (91.2%) |
| 16 and 17 Years | 377 (85.1%) | 389 (100.0%) |
| 18 to 24 Years | 1,975 (89.8%) | 2,300 (91.3%) |
| 25 to 34 Years | 4,217 (88.3%) | 3,812 (88.3%) |
| 35 to 44 Years | 3,236 (89.1%) | 2,832 (82.3%) |
| 45 to 54 Years | 3,203 (87.9%) | 3,205 (91.7%) |
| 55 to 64 Years | 4,837 (90.1%) | 5,409 (88.5%) |
| 65 to 74 Years | 4,336 (91.9%) | 4,152 (91.7%) |
| 75 Years and over | 3,204 (90.9%) | 4,282 (84.2%) |
| Total | 28,108 (88.8%) | 29,604 (86.9%) |
Income Below Poverty Among Married-Couple Families in Delray Beach
The poverty statistics for married-couple families in Delray Beach show that 4.5% or 486 of the total 10,826 families live below the poverty line. Families with 5 or more children have the highest poverty rate of 100.0%, comprising of 5 families. On the other hand, families with 1 or 2 children have the lowest poverty rate of 2.1%, which includes 48 families.
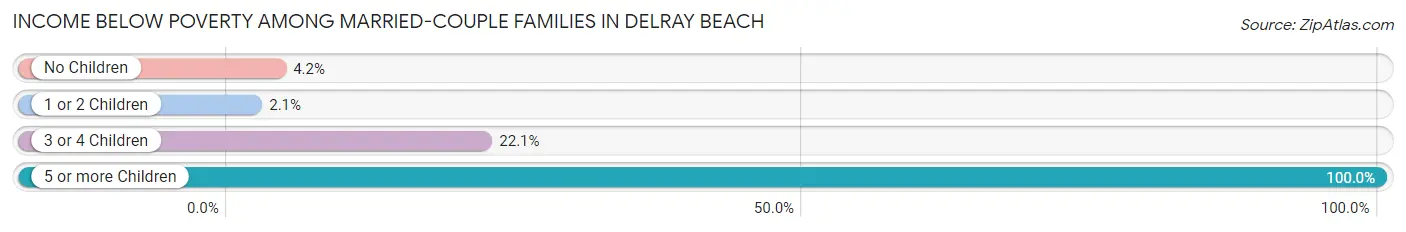
| Children | Above Poverty | Below Poverty |
| No Children | 7,782 (95.8%) | 340 (4.2%) |
| 1 or 2 Children | 2,231 (97.9%) | 48 (2.1%) |
| 3 or 4 Children | 327 (77.9%) | 93 (22.1%) |
| 5 or more Children | 0 (0.0%) | 5 (100.0%) |
| Total | 10,340 (95.5%) | 486 (4.5%) |
Income Below Poverty Among Single-Parent Households in Delray Beach
According to the poverty data in Delray Beach, 19.7% or 219 single-father households and 18.0% or 561 single-mother households are living below the poverty line. Among single-father households, those with 1 or 2 children have the highest poverty rate, with 138 households (34.2%) experiencing poverty. Likewise, among single-mother households, those with 3 or 4 children have the highest poverty rate, with 163 households (86.2%) falling below the poverty line.
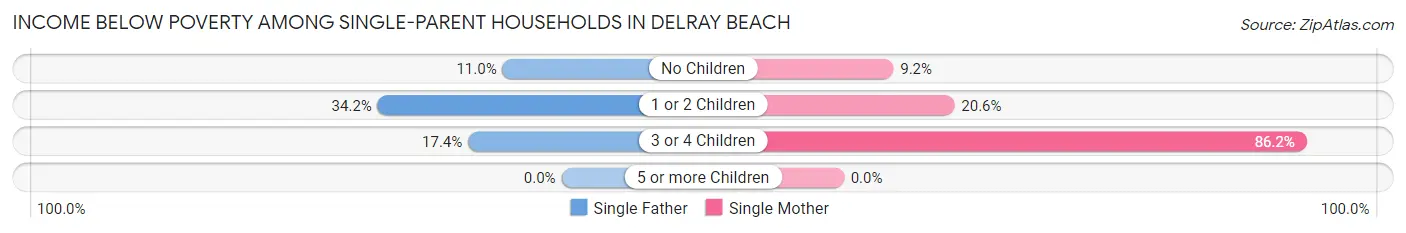
| Children | Single Father | Single Mother |
| No Children | 73 (11.0%) | 166 (9.2%) |
| 1 or 2 Children | 138 (34.2%) | 232 (20.6%) |
| 3 or 4 Children | 8 (17.4%) | 163 (86.2%) |
| 5 or more Children | 0 (0.0%) | 0 (0.0%) |
| Total | 219 (19.7%) | 561 (18.0%) |
Income Below Poverty Among Married-Couple vs Single-Parent Households in Delray Beach
The poverty data for Delray Beach shows that 486 of the married-couple family households (4.5%) and 780 of the single-parent households (18.4%) are living below the poverty level. Within the married-couple family households, those with 5 or more children have the highest poverty rate, with 5 households (100.0%) falling below the poverty line. Among the single-parent households, those with 3 or 4 children have the highest poverty rate, with 171 household (72.8%) living below poverty.
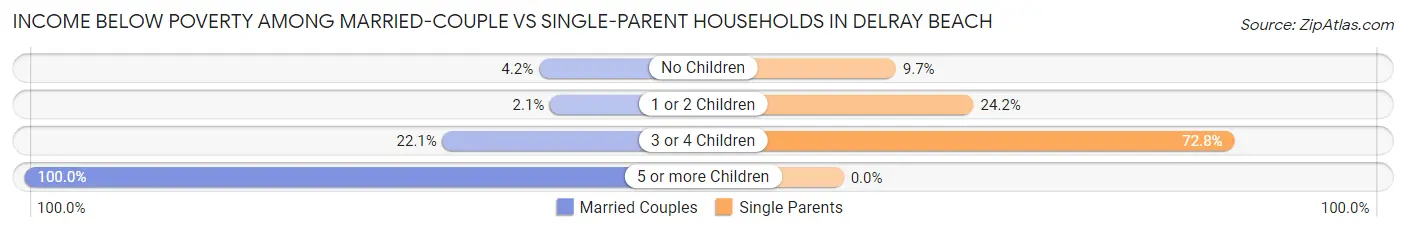
| Children | Married-Couple Families | Single-Parent Households |
| No Children | 340 (4.2%) | 239 (9.7%) |
| 1 or 2 Children | 48 (2.1%) | 370 (24.2%) |
| 3 or 4 Children | 93 (22.1%) | 171 (72.8%) |
| 5 or more Children | 5 (100.0%) | 0 (0.0%) |
| Total | 486 (4.5%) | 780 (18.4%) |
Race in Delray Beach
The most populous races in Delray Beach are White / Caucasian (38,366 | 57.6%), Black / African American (19,966 | 30.0%), and Hispanic or Latino (7,537 | 11.3%).
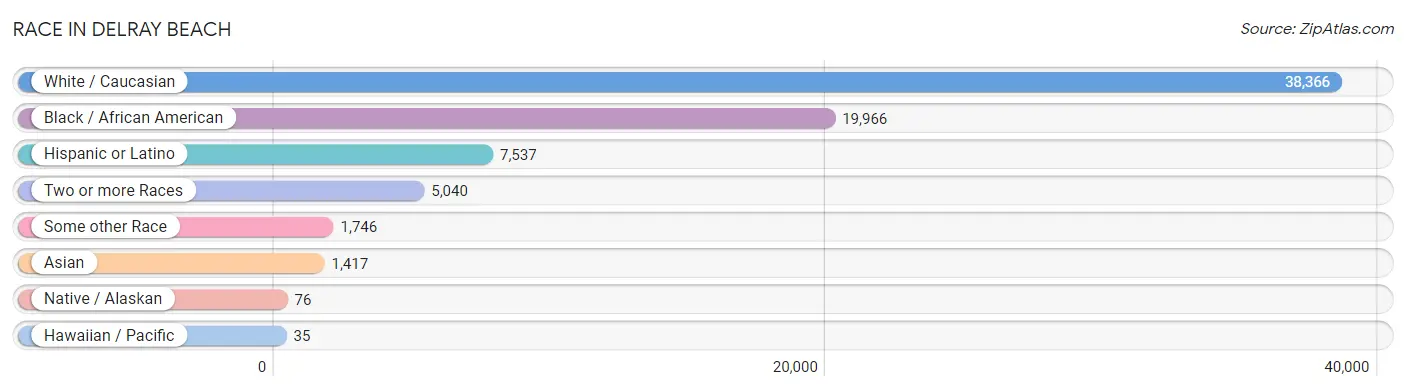
| Race | # Population | % Population |
| Asian | 1,417 | 2.1% |
| Black / African American | 19,966 | 30.0% |
| Hawaiian / Pacific | 35 | 0.1% |
| Hispanic or Latino | 7,537 | 11.3% |
| Native / Alaskan | 76 | 0.1% |
| White / Caucasian | 38,366 | 57.6% |
| Two or more Races | 5,040 | 7.6% |
| Some other Race | 1,746 | 2.6% |
| Total | 66,646 | 100.0% |
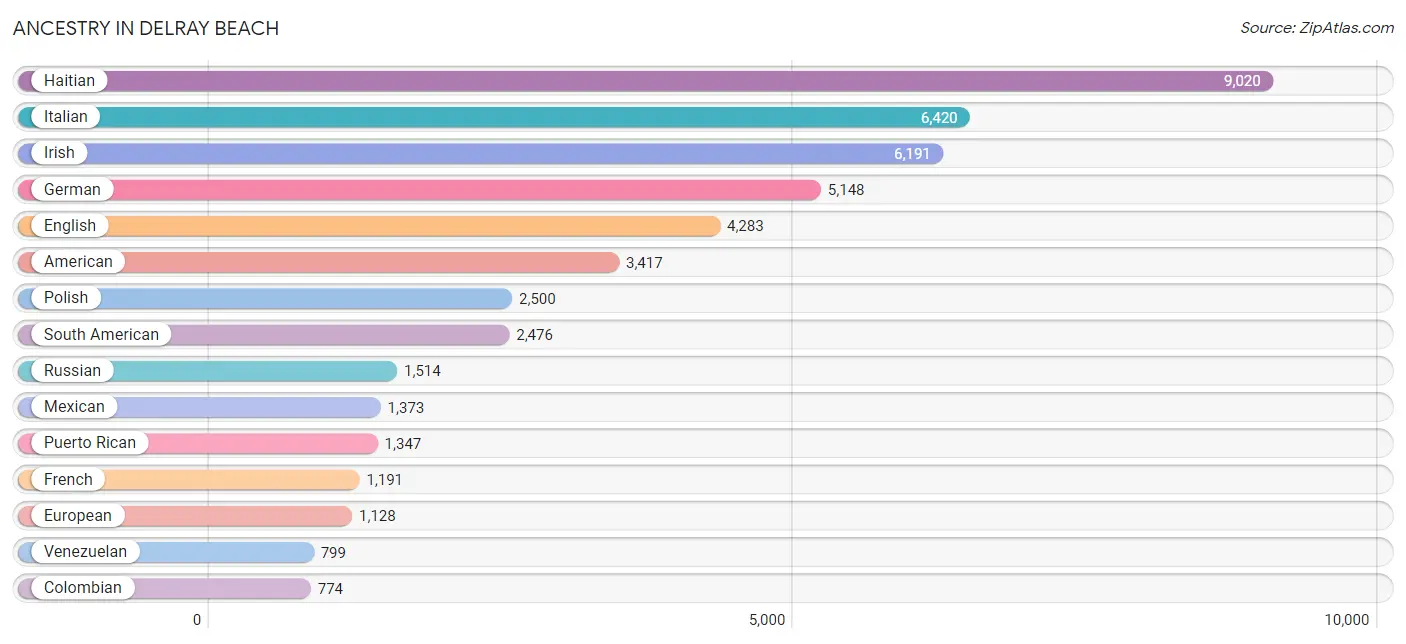
Ancestry in Delray Beach
The most populous ancestries reported in Delray Beach are Haitian (9,020 | 13.5%), Italian (6,420 | 9.6%), Irish (6,191 | 9.3%), German (5,148 | 7.7%), and English (4,283 | 6.4%), together accounting for 46.6% of all Delray Beach residents.
| Ancestry | # Population | % Population |
| African | 201 | 0.3% |
| Albanian | 42 | 0.1% |
| American | 3,417 | 5.1% |
| Arab | 336 | 0.5% |
| Argentinean | 53 | 0.1% |
| Armenian | 46 | 0.1% |
| Australian | 7 | 0.0% |
| Austrian | 340 | 0.5% |
| Bahamian | 52 | 0.1% |
| Belgian | 12 | 0.0% |
| Bhutanese | 75 | 0.1% |
| Blackfeet | 2 | 0.0% |
| Bolivian | 25 | 0.0% |
| Brazilian | 521 | 0.8% |
| British | 440 | 0.7% |
| British West Indian | 5 | 0.0% |
| Bulgarian | 23 | 0.0% |
| Burmese | 198 | 0.3% |
| Canadian | 176 | 0.3% |
| Celtic | 9 | 0.0% |
| Central American | 699 | 1.1% |
| Central American Indian | 35 | 0.1% |
| Cherokee | 83 | 0.1% |
| Chilean | 38 | 0.1% |
| Chippewa | 7 | 0.0% |
| Colombian | 774 | 1.2% |
| Costa Rican | 15 | 0.0% |
| Croatian | 17 | 0.0% |
| Cuban | 700 | 1.1% |
| Czech | 141 | 0.2% |
| Czechoslovakian | 19 | 0.0% |
| Danish | 158 | 0.2% |
| Dominican | 512 | 0.8% |
| Dutch | 495 | 0.7% |
| Eastern European | 714 | 1.1% |
| Ecuadorian | 189 | 0.3% |
| Egyptian | 22 | 0.0% |
| English | 4,283 | 6.4% |
| Estonian | 26 | 0.0% |
| European | 1,128 | 1.7% |
| Finnish | 153 | 0.2% |
| French | 1,191 | 1.8% |
| French American Indian | 12 | 0.0% |
| French Canadian | 272 | 0.4% |
| German | 5,148 | 7.7% |
| Greek | 535 | 0.8% |
| Guamanian / Chamorro | 15 | 0.0% |
| Guatemalan | 226 | 0.3% |
| Guyanese | 25 | 0.0% |
| Haitian | 9,020 | 13.5% |
| Honduran | 232 | 0.4% |
| Hopi | 15 | 0.0% |
| Hungarian | 394 | 0.6% |
| Indian (Asian) | 387 | 0.6% |
| Iranian | 118 | 0.2% |
| Irish | 6,191 | 9.3% |
| Israeli | 238 | 0.4% |
| Italian | 6,420 | 9.6% |
| Jamaican | 560 | 0.8% |
| Kenyan | 28 | 0.0% |
| Korean | 373 | 0.6% |
| Laotian | 33 | 0.1% |
| Latvian | 47 | 0.1% |
| Lebanese | 186 | 0.3% |
| Lithuanian | 218 | 0.3% |
| Luxembourger | 13 | 0.0% |
| Macedonian | 11 | 0.0% |
| Mexican | 1,373 | 2.1% |
| Mongolian | 3 | 0.0% |
| Moroccan | 53 | 0.1% |
| Native Hawaiian | 9 | 0.0% |
| Navajo | 38 | 0.1% |
| New Zealander | 10 | 0.0% |
| Nicaraguan | 76 | 0.1% |
| Northern European | 14 | 0.0% |
| Norwegian | 387 | 0.6% |
| Pakistani | 31 | 0.1% |
| Palestinian | 13 | 0.0% |
| Panamanian | 63 | 0.1% |
| Pennsylvania German | 10 | 0.0% |
| Peruvian | 407 | 0.6% |
| Polish | 2,500 | 3.7% |
| Portuguese | 435 | 0.6% |
| Pueblo | 2 | 0.0% |
| Puerto Rican | 1,347 | 2.0% |
| Romanian | 310 | 0.5% |
| Russian | 1,514 | 2.3% |
| Salvadoran | 87 | 0.1% |
| Samoan | 86 | 0.1% |
| Scandinavian | 28 | 0.0% |
| Scotch-Irish | 482 | 0.7% |
| Scottish | 740 | 1.1% |
| Seminole | 49 | 0.1% |
| Serbian | 64 | 0.1% |
| Sioux | 14 | 0.0% |
| Slavic | 10 | 0.0% |
| Slovak | 60 | 0.1% |
| Slovene | 38 | 0.1% |
| South African | 5 | 0.0% |
| South American | 2,476 | 3.7% |
| South American Indian | 20 | 0.0% |
| Spaniard | 112 | 0.2% |
| Spanish | 109 | 0.2% |
| Sri Lankan | 185 | 0.3% |
| Subsaharan African | 234 | 0.4% |
| Swedish | 337 | 0.5% |
| Swiss | 67 | 0.1% |
| Syrian | 10 | 0.0% |
| Thai | 540 | 0.8% |
| Trinidadian and Tobagonian | 49 | 0.1% |
| Turkish | 115 | 0.2% |
| U.S. Virgin Islander | 15 | 0.0% |
| Ukrainian | 257 | 0.4% |
| Uruguayan | 55 | 0.1% |
| Venezuelan | 799 | 1.2% |
| Welsh | 281 | 0.4% | View All 116 Rows |
Immigrants in Delray Beach
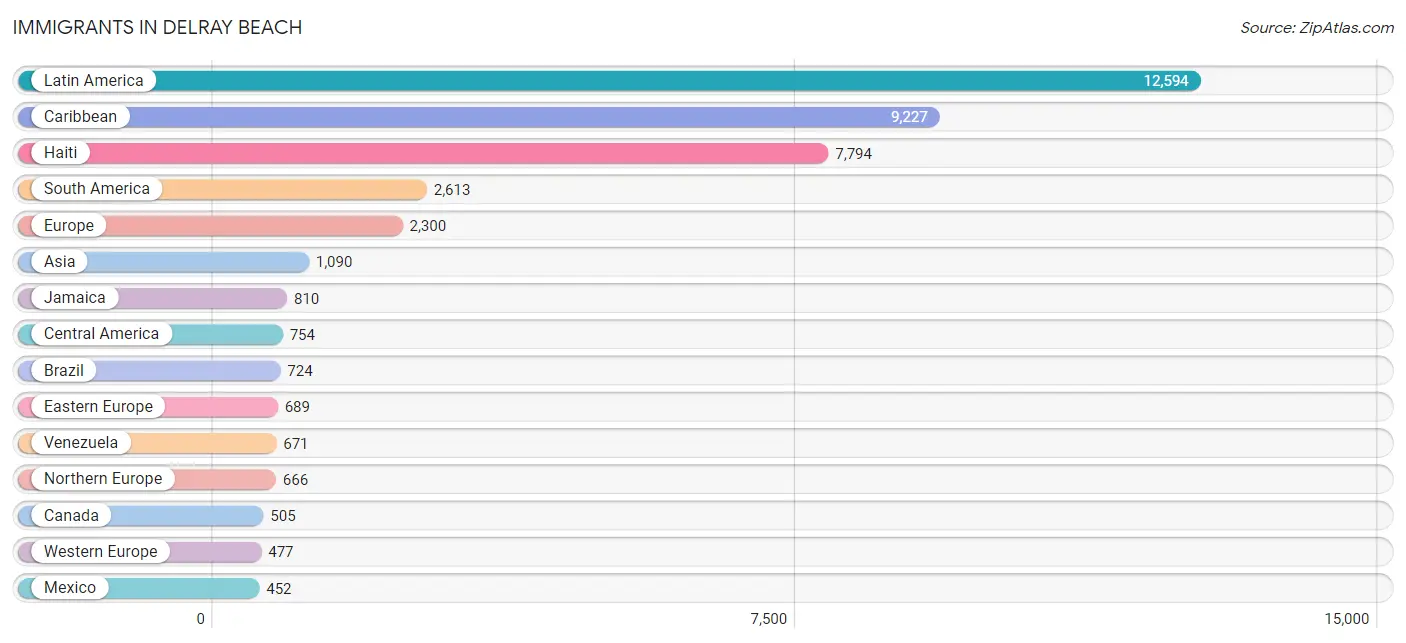
The most numerous immigrant groups reported in Delray Beach came from Latin America (12,594 | 18.9%), Caribbean (9,227 | 13.8%), Haiti (7,794 | 11.7%), South America (2,613 | 3.9%), and Europe (2,300 | 3.5%), together accounting for 51.8% of all Delray Beach residents.
| Immigration Origin | # Population | % Population |
| Africa | 163 | 0.2% |
| Albania | 42 | 0.1% |
| Argentina | 60 | 0.1% |
| Armenia | 8 | 0.0% |
| Asia | 1,090 | 1.6% |
| Australia | 34 | 0.1% |
| Austria | 9 | 0.0% |
| Bahamas | 93 | 0.1% |
| Bangladesh | 23 | 0.0% |
| Belgium | 30 | 0.1% |
| Bolivia | 25 | 0.0% |
| Brazil | 724 | 1.1% |
| Cambodia | 29 | 0.0% |
| Canada | 505 | 0.8% |
| Caribbean | 9,227 | 13.8% |
| Central America | 754 | 1.1% |
| Chile | 71 | 0.1% |
| China | 67 | 0.1% |
| Colombia | 401 | 0.6% |
| Cuba | 250 | 0.4% |
| Czechoslovakia | 48 | 0.1% |
| Denmark | 45 | 0.1% |
| Dominican Republic | 158 | 0.2% |
| Eastern Africa | 49 | 0.1% |
| Eastern Asia | 204 | 0.3% |
| Eastern Europe | 689 | 1.0% |
| Ecuador | 188 | 0.3% |
| Egypt | 19 | 0.0% |
| El Salvador | 37 | 0.1% |
| England | 295 | 0.4% |
| Europe | 2,300 | 3.5% |
| France | 195 | 0.3% |
| Germany | 157 | 0.2% |
| Greece | 81 | 0.1% |
| Guatemala | 123 | 0.2% |
| Guyana | 10 | 0.0% |
| Haiti | 7,794 | 11.7% |
| Honduras | 101 | 0.2% |
| Hong Kong | 7 | 0.0% |
| Hungary | 142 | 0.2% |
| India | 186 | 0.3% |
| Indonesia | 33 | 0.1% |
| Iran | 19 | 0.0% |
| Iraq | 7 | 0.0% |
| Ireland | 50 | 0.1% |
| Israel | 35 | 0.1% |
| Italy | 184 | 0.3% |
| Jamaica | 810 | 1.2% |
| Japan | 12 | 0.0% |
| Kazakhstan | 6 | 0.0% |
| Kenya | 38 | 0.1% |
| Korea | 125 | 0.2% |
| Latin America | 12,594 | 18.9% |
| Latvia | 10 | 0.0% |
| Lebanon | 85 | 0.1% |
| Lithuania | 32 | 0.1% |
| Mexico | 452 | 0.7% |
| Moldova | 25 | 0.0% |
| Morocco | 65 | 0.1% |
| Netherlands | 65 | 0.1% |
| Nicaragua | 25 | 0.0% |
| North Macedonia | 11 | 0.0% |
| Northern Africa | 89 | 0.1% |
| Northern Europe | 666 | 1.0% |
| Norway | 20 | 0.0% |
| Oceania | 62 | 0.1% |
| Pakistan | 1 | 0.0% |
| Panama | 16 | 0.0% |
| Peru | 382 | 0.6% |
| Philippines | 230 | 0.4% |
| Poland | 159 | 0.2% |
| Portugal | 114 | 0.2% |
| Romania | 64 | 0.1% |
| Russia | 22 | 0.0% |
| Scotland | 26 | 0.0% |
| Serbia | 17 | 0.0% |
| South Africa | 25 | 0.0% |
| South America | 2,613 | 3.9% |
| South Central Asia | 235 | 0.4% |
| South Eastern Asia | 373 | 0.6% |
| Southern Europe | 432 | 0.6% |
| Spain | 53 | 0.1% |
| Sweden | 7 | 0.0% |
| Switzerland | 14 | 0.0% |
| Syria | 9 | 0.0% |
| Trinidad and Tobago | 56 | 0.1% |
| Turkey | 114 | 0.2% |
| Uganda | 11 | 0.0% |
| Ukraine | 52 | 0.1% |
| Uruguay | 6 | 0.0% |
| Venezuela | 671 | 1.0% |
| Vietnam | 81 | 0.1% |
| Western Asia | 266 | 0.4% |
| Western Europe | 477 | 0.7% | View All 94 Rows |
Sex and Age in Delray Beach
Sex and Age in Delray Beach
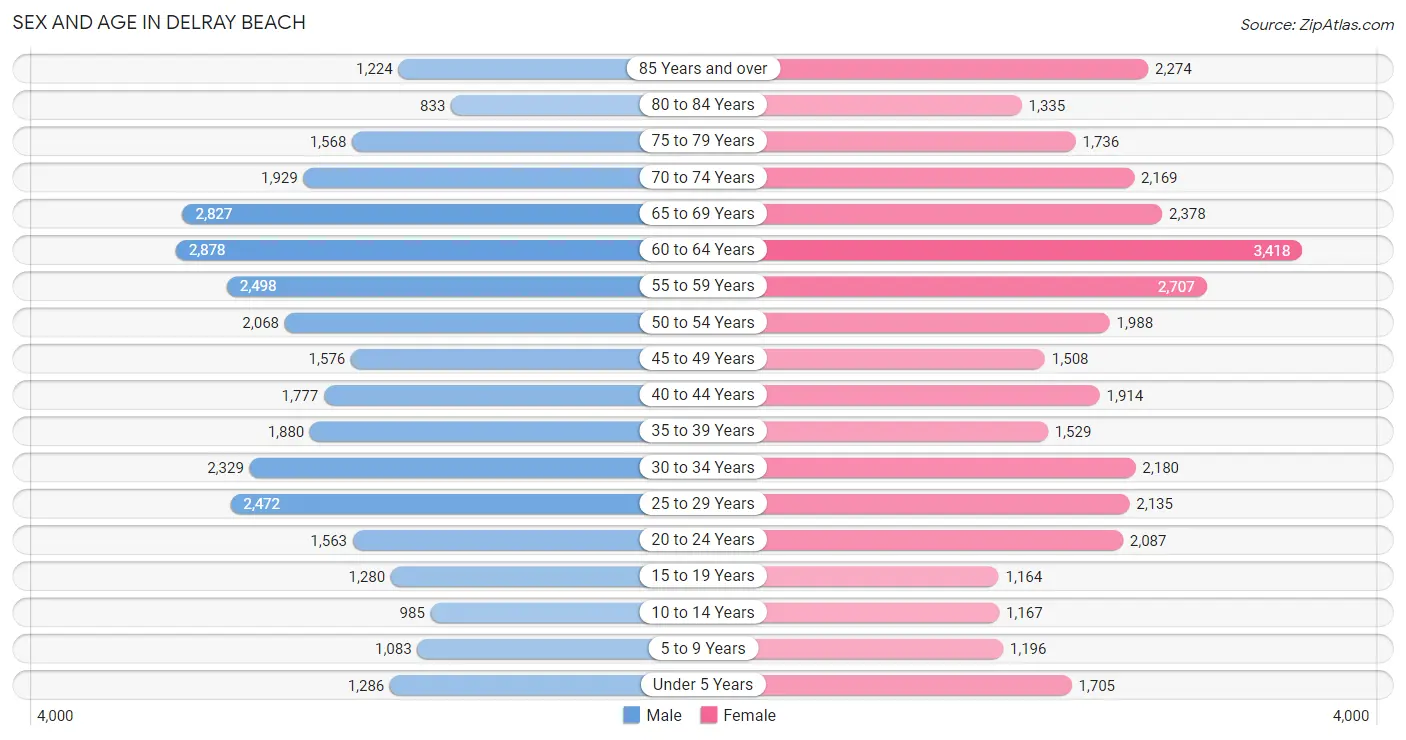
The most populous age groups in Delray Beach are 60 to 64 Years (2,878 | 9.0%) for men and 60 to 64 Years (3,418 | 9.9%) for women.
| Age Bracket | Male | Female |
| Under 5 Years | 1,286 (4.0%) | 1,705 (4.9%) |
| 5 to 9 Years | 1,083 (3.4%) | 1,196 (3.5%) |
| 10 to 14 Years | 985 (3.1%) | 1,167 (3.4%) |
| 15 to 19 Years | 1,280 (4.0%) | 1,164 (3.4%) |
| 20 to 24 Years | 1,563 (4.9%) | 2,087 (6.0%) |
| 25 to 29 Years | 2,472 (7.7%) | 2,135 (6.2%) |
| 30 to 34 Years | 2,329 (7.3%) | 2,180 (6.3%) |
| 35 to 39 Years | 1,880 (5.9%) | 1,529 (4.4%) |
| 40 to 44 Years | 1,777 (5.5%) | 1,914 (5.5%) |
| 45 to 49 Years | 1,576 (4.9%) | 1,508 (4.4%) |
| 50 to 54 Years | 2,068 (6.5%) | 1,988 (5.8%) |
| 55 to 59 Years | 2,498 (7.8%) | 2,707 (7.8%) |
| 60 to 64 Years | 2,878 (9.0%) | 3,418 (9.9%) |
| 65 to 69 Years | 2,827 (8.8%) | 2,378 (6.9%) |
| 70 to 74 Years | 1,929 (6.0%) | 2,169 (6.3%) |
| 75 to 79 Years | 1,568 (4.9%) | 1,736 (5.0%) |
| 80 to 84 Years | 833 (2.6%) | 1,335 (3.9%) |
| 85 Years and over | 1,224 (3.8%) | 2,274 (6.6%) |
| Total | 32,056 (100.0%) | 34,590 (100.0%) |
Families and Households in Delray Beach
Median Family Size in Delray Beach
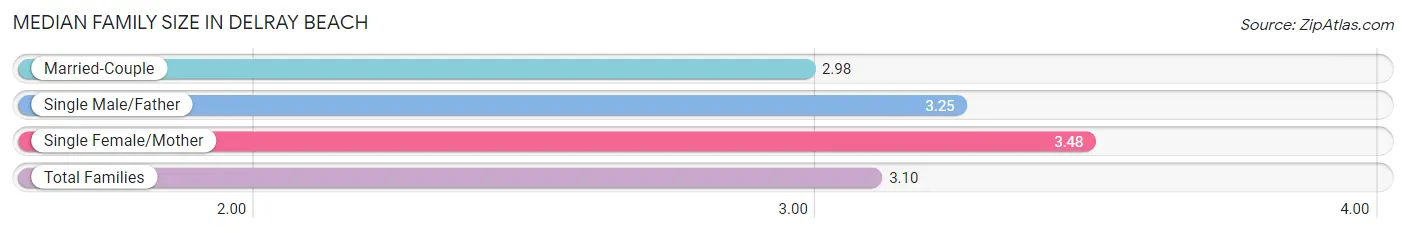
The median family size in Delray Beach is 3.10 persons per family, with single female/mother families (3,121 | 20.7%) accounting for the largest median family size of 3.48 persons per family. On the other hand, married-couple families (10,826 | 71.9%) represent the smallest median family size with 2.98 persons per family.
| Family Type | # Families | Family Size |
| Married-Couple | 10,826 (71.9%) | 2.98 |
| Single Male/Father | 1,113 (7.4%) | 3.25 |
| Single Female/Mother | 3,121 (20.7%) | 3.48 |
| Total Families | 15,060 (100.0%) | 3.10 |
Median Household Size in Delray Beach
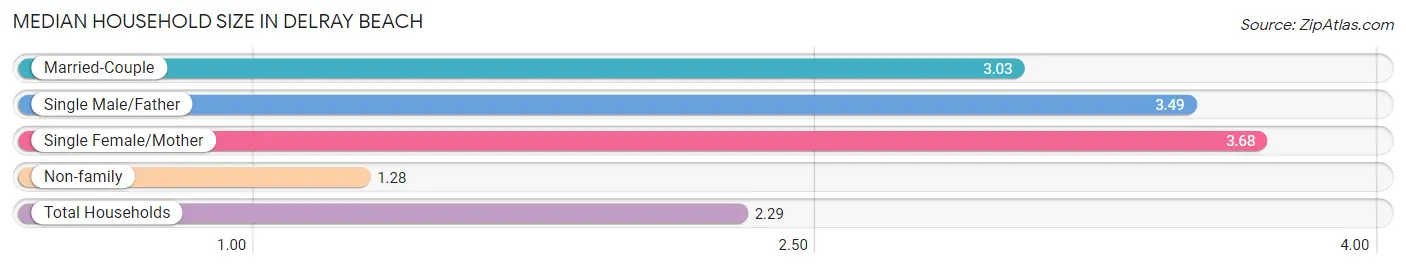
The median household size in Delray Beach is 2.29 persons per household, with single female/mother households (3,121 | 10.9%) accounting for the largest median household size of 3.68 persons per household. non-family households (13,532 | 47.3%) represent the smallest median household size with 1.28 persons per household.
| Household Type | # Households | Household Size |
| Married-Couple | 10,826 (37.9%) | 3.03 |
| Single Male/Father | 1,113 (3.9%) | 3.49 |
| Single Female/Mother | 3,121 (10.9%) | 3.68 |
| Non-family | 13,532 (47.3%) | 1.28 |
| Total Households | 28,592 (100.0%) | 2.29 |
Household Size by Marriage Status in Delray Beach
Out of a total of 28,592 households in Delray Beach, 15,060 (52.7%) are family households, while 13,532 (47.3%) are nonfamily households. The most numerous type of family households are 2-person households, comprising 8,642, and the most common type of nonfamily households are 1-person households, comprising 10,778.
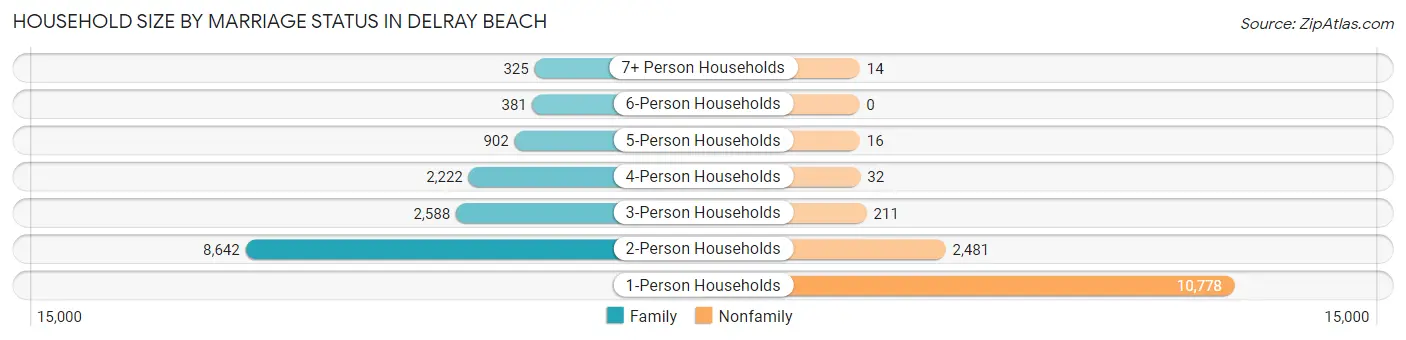
| Household Size | Family Households | Nonfamily Households |
| 1-Person Households | - | 10,778 (37.7%) |
| 2-Person Households | 8,642 (30.2%) | 2,481 (8.7%) |
| 3-Person Households | 2,588 (9.0%) | 211 (0.7%) |
| 4-Person Households | 2,222 (7.8%) | 32 (0.1%) |
| 5-Person Households | 902 (3.2%) | 16 (0.1%) |
| 6-Person Households | 381 (1.3%) | 0 (0.0%) |
| 7+ Person Households | 325 (1.1%) | 14 (0.1%) |
| Total | 15,060 (52.7%) | 13,532 (47.3%) |
Female Fertility in Delray Beach
Fertility by Age in Delray Beach
Average fertility rate in Delray Beach is 26.0 births per 1,000 women. Women in the age bracket of 35 to 50 years have the highest fertility rate with 40.0 births per 1,000 women. Women in the age bracket of 35 to 50 years acount for 62.8% of all women with births.
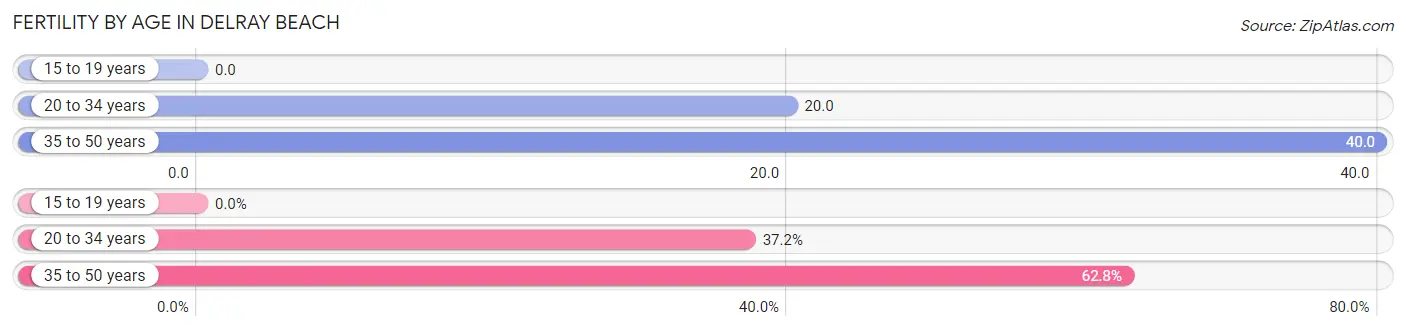
| Age Bracket | Women with Births | Births / 1,000 Women |
| 15 to 19 years | 0 (0.0%) | 0.0 |
| 20 to 34 years | 126 (37.2%) | 20.0 |
| 35 to 50 years | 213 (62.8%) | 40.0 |
| Total | 339 (100.0%) | 26.0 |
Fertility by Age by Marriage Status in Delray Beach
82.0% of women with births (339) in Delray Beach are married. The highest percentage of unmarried women with births falls into 20 to 34 years age bracket with 30.9% of them unmarried at the time of birth, while the lowest percentage of unmarried women with births belong to 35 to 50 years age bracket with 10.3% of them unmarried.
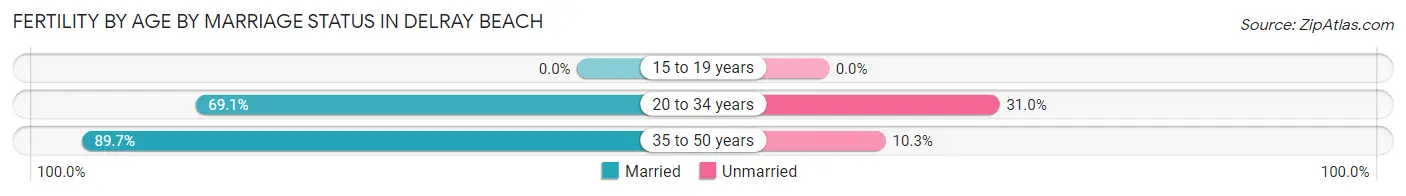
| Age Bracket | Married | Unmarried |
| 15 to 19 years | 0 (0.0%) | 0 (0.0%) |
| 20 to 34 years | 87 (69.1%) | 39 (30.9%) |
| 35 to 50 years | 191 (89.7%) | 22 (10.3%) |
| Total | 278 (82.0%) | 61 (18.0%) |
Fertility by Education in Delray Beach
Average fertility rate in Delray Beach is 26.0 births per 1,000 women. Women with the education attainment of graduate degree have the highest fertility rate of 69.0 births per 1,000 women, while women with the education attainment of college or associate's degree have the lowest fertility at 15.0 births per 1,000 women. Women with the education attainment of graduate degree represent 31.0% of all women with births.
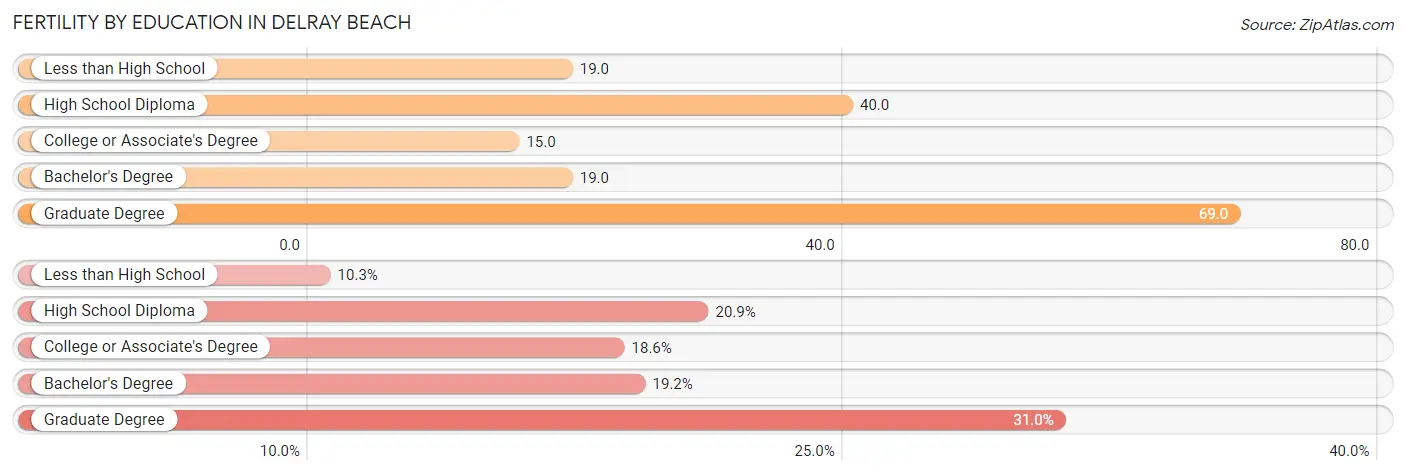
| Educational Attainment | Women with Births | Births / 1,000 Women |
| Less than High School | 35 (10.3%) | 19.0 |
| High School Diploma | 71 (20.9%) | 40.0 |
| College or Associate's Degree | 63 (18.6%) | 15.0 |
| Bachelor's Degree | 65 (19.2%) | 19.0 |
| Graduate Degree | 105 (31.0%) | 69.0 |
| Total | 339 (100.0%) | 26.0 |
Fertility by Education by Marriage Status in Delray Beach
18.0% of women with births in Delray Beach are unmarried. Women with the educational attainment of bachelor's degree are most likely to be married with 100.0% of them married at childbirth, while women with the educational attainment of college or associate's degree are least likely to be married with 44.4% of them unmarried at childbirth.
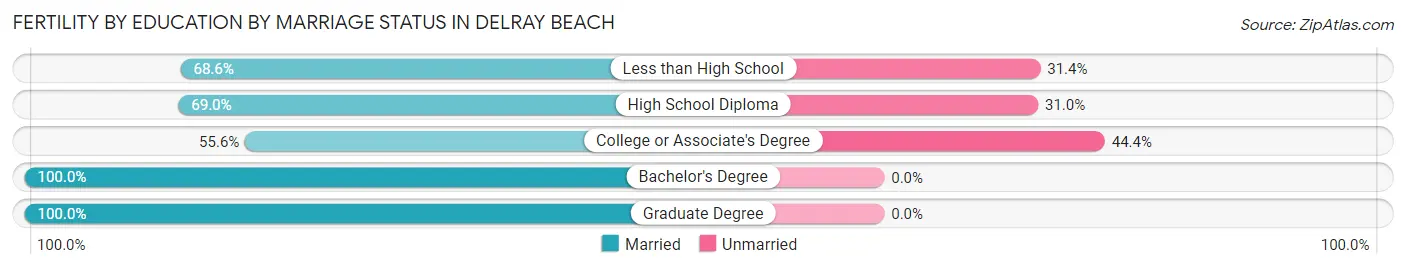
| Educational Attainment | Married | Unmarried |
| Less than High School | 24 (68.6%) | 11 (31.4%) |
| High School Diploma | 49 (69.0%) | 22 (31.0%) |
| College or Associate's Degree | 35 (55.6%) | 28 (44.4%) |
| Bachelor's Degree | 65 (100.0%) | 0 (0.0%) |
| Graduate Degree | 105 (100.0%) | 0 (0.0%) |
| Total | 278 (82.0%) | 61 (18.0%) |
Employment Characteristics in Delray Beach
Employment by Class of Employer in Delray Beach
Among the 32,743 employed individuals in Delray Beach, private company employees (23,164 | 70.7%), self-employed (incorporated) (2,746 | 8.4%), and self-employed (not incorporated) (2,123 | 6.5%) make up the most common classes of employment.
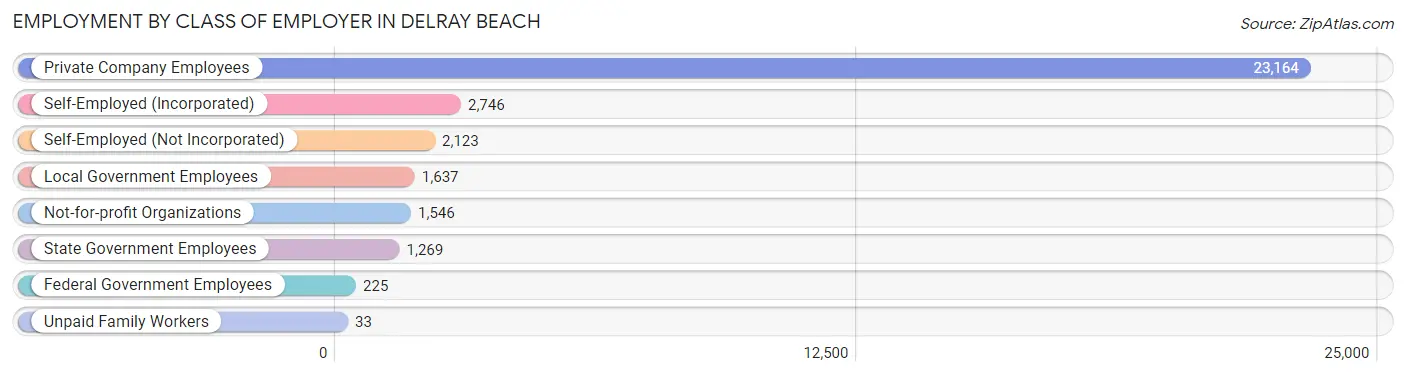
| Employer Class | # Employees | % Employees |
| Private Company Employees | 23,164 | 70.7% |
| Self-Employed (Incorporated) | 2,746 | 8.4% |
| Self-Employed (Not Incorporated) | 2,123 | 6.5% |
| Not-for-profit Organizations | 1,546 | 4.7% |
| Local Government Employees | 1,637 | 5.0% |
| State Government Employees | 1,269 | 3.9% |
| Federal Government Employees | 225 | 0.7% |
| Unpaid Family Workers | 33 | 0.1% |
| Total | 32,743 | 100.0% |
Employment Status by Age in Delray Beach
According to the labor force statistics for Delray Beach, out of the total population over 16 years of age (58,700), 60.4% or 35,455 individuals are in the labor force, with 5.8% or 2,056 of them unemployed. The age group with the highest labor force participation rate is 20 to 24 years, with 88.2% or 3,219 individuals in the labor force. Within the labor force, the 16 to 19 years age range has the highest percentage of unemployed individuals, with 16.2% or 145 of them being unemployed.
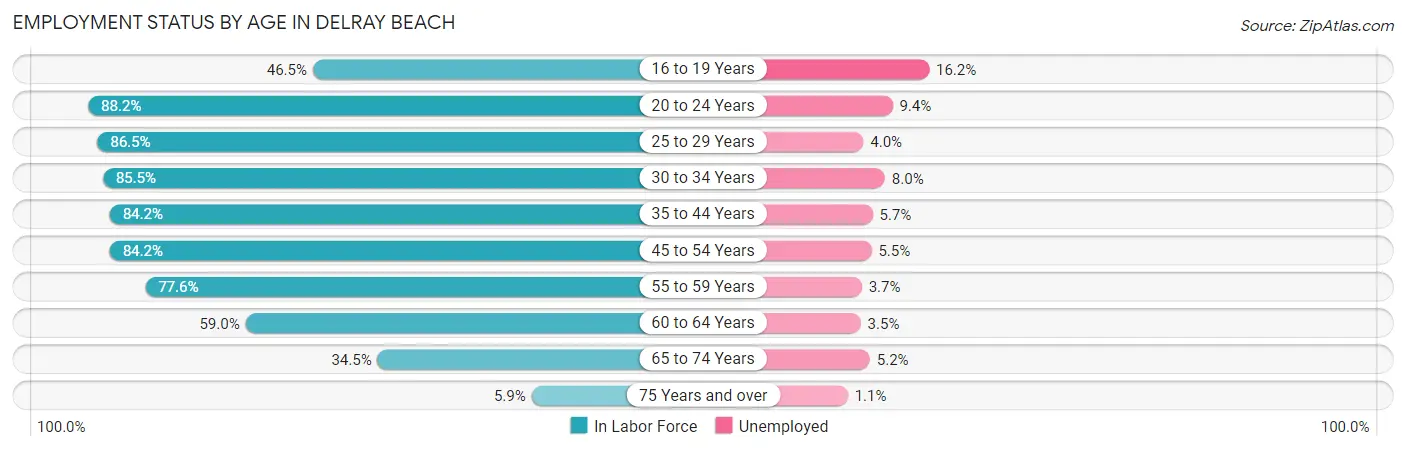
| Age Bracket | In Labor Force | Unemployed |
| 16 to 19 Years | 893 (46.5%) | 145 (16.2%) |
| 20 to 24 Years | 3,219 (88.2%) | 303 (9.4%) |
| 25 to 29 Years | 3,985 (86.5%) | 159 (4.0%) |
| 30 to 34 Years | 3,855 (85.5%) | 308 (8.0%) |
| 35 to 44 Years | 5,978 (84.2%) | 341 (5.7%) |
| 45 to 54 Years | 6,012 (84.2%) | 331 (5.5%) |
| 55 to 59 Years | 4,039 (77.6%) | 149 (3.7%) |
| 60 to 64 Years | 3,715 (59.0%) | 130 (3.5%) |
| 65 to 74 Years | 3,210 (34.5%) | 167 (5.2%) |
| 75 Years and over | 529 (5.9%) | 6 (1.1%) |
| Total | 35,455 (60.4%) | 2,056 (5.8%) |
Employment Status by Educational Attainment in Delray Beach
According to labor force statistics for Delray Beach, 79.2% of individuals (27,607) out of the total population between 25 and 64 years of age (34,857) are in the labor force, with 5.1% or 1,408 of them being unemployed. The group with the highest labor force participation rate are those with the educational attainment of bachelor's degree or higher, with 84.1% or 11,636 individuals in the labor force. Within the labor force, individuals with high school diploma education have the highest percentage of unemployment, with 7.9% or 425 of them being unemployed.
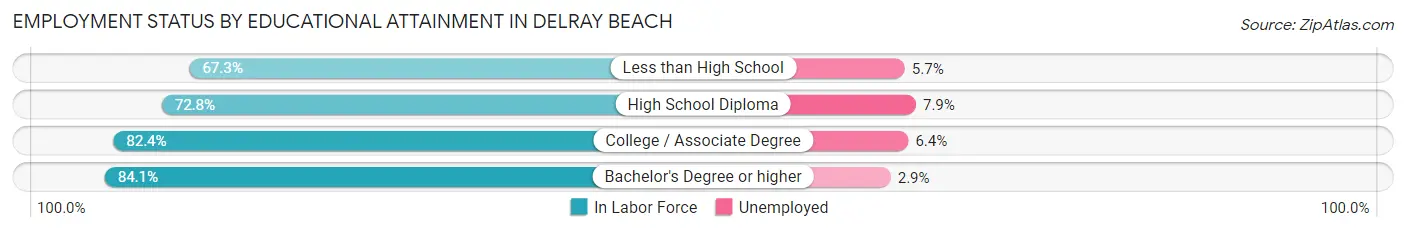
| Educational Attainment | In Labor Force | Unemployed |
| Less than High School | 2,921 (67.3%) | 247 (5.7%) |
| High School Diploma | 5,378 (72.8%) | 584 (7.9%) |
| College / Associate Degree | 7,657 (82.4%) | 595 (6.4%) |
| Bachelor's Degree or higher | 11,636 (84.1%) | 401 (2.9%) |
| Total | 27,607 (79.2%) | 1,778 (5.1%) |
Employment Occupations by Sex in Delray Beach
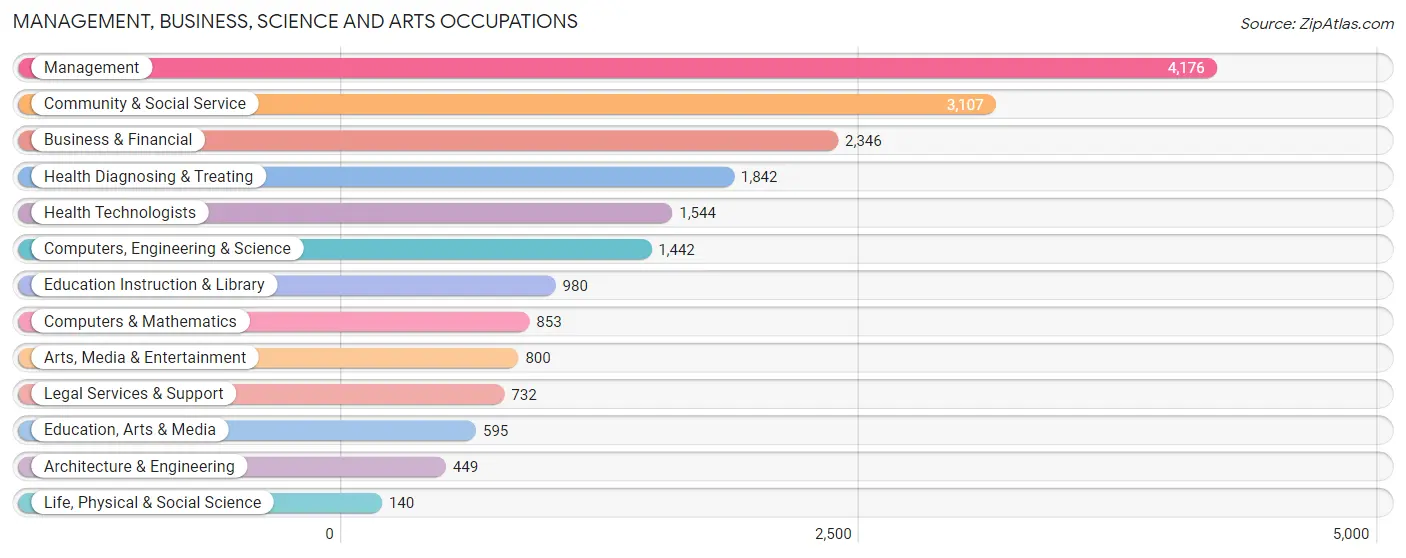
Management, Business, Science and Arts Occupations
The most common Management, Business, Science and Arts occupations in Delray Beach are Management (4,176 | 12.5%), Community & Social Service (3,107 | 9.3%), Business & Financial (2,346 | 7.0%), Health Diagnosing & Treating (1,842 | 5.5%), and Health Technologists (1,544 | 4.6%).
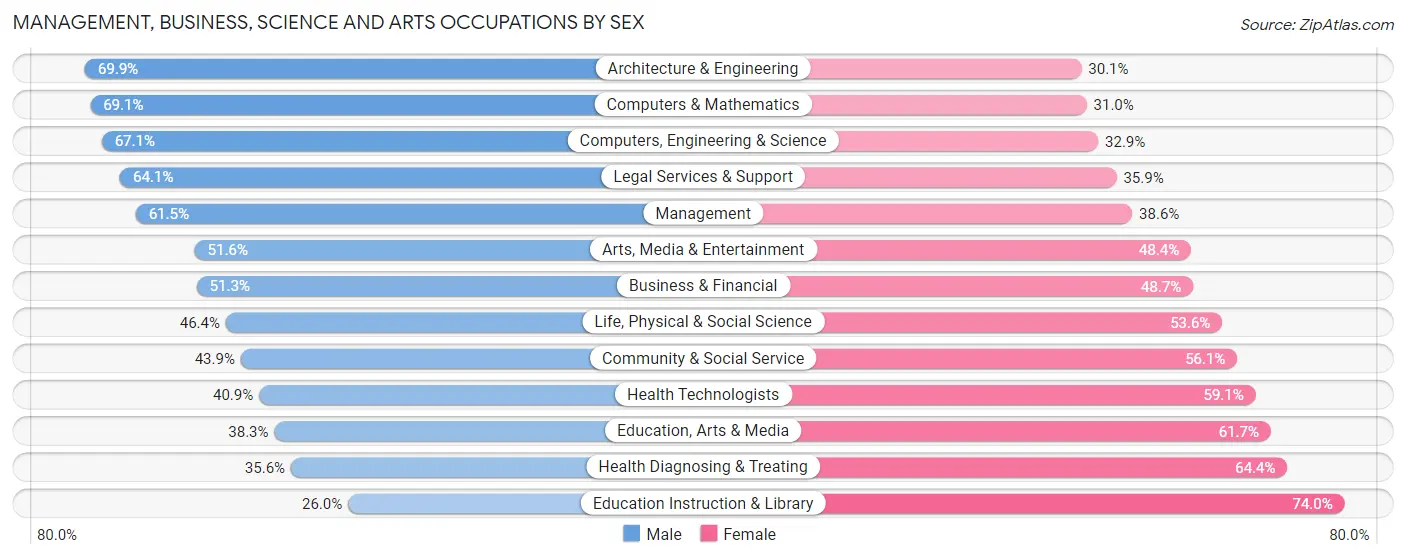
Management, Business, Science and Arts Occupations by Sex
Within the Management, Business, Science and Arts occupations in Delray Beach, the most male-oriented occupations are Architecture & Engineering (69.9%), Computers & Mathematics (69.1%), and Computers, Engineering & Science (67.1%), while the most female-oriented occupations are Education Instruction & Library (74.0%), Health Diagnosing & Treating (64.4%), and Education, Arts & Media (61.7%).
| Occupation | Male | Female |
| Management | 2,566 (61.5%) | 1,610 (38.6%) |
| Business & Financial | 1,203 (51.3%) | 1,143 (48.7%) |
| Computers, Engineering & Science | 968 (67.1%) | 474 (32.9%) |
| Computers & Mathematics | 589 (69.1%) | 264 (30.9%) |
| Architecture & Engineering | 314 (69.9%) | 135 (30.1%) |
| Life, Physical & Social Science | 65 (46.4%) | 75 (53.6%) |
| Community & Social Service | 1,365 (43.9%) | 1,742 (56.1%) |
| Education, Arts & Media | 228 (38.3%) | 367 (61.7%) |
| Legal Services & Support | 469 (64.1%) | 263 (35.9%) |
| Education Instruction & Library | 255 (26.0%) | 725 (74.0%) |
| Arts, Media & Entertainment | 413 (51.6%) | 387 (48.4%) |
| Health Diagnosing & Treating | 655 (35.6%) | 1,187 (64.4%) |
| Health Technologists | 631 (40.9%) | 913 (59.1%) |
| Total (Category) | 6,757 (52.3%) | 6,156 (47.7%) |
| Total (Overall) | 17,223 (51.6%) | 16,146 (48.4%) |
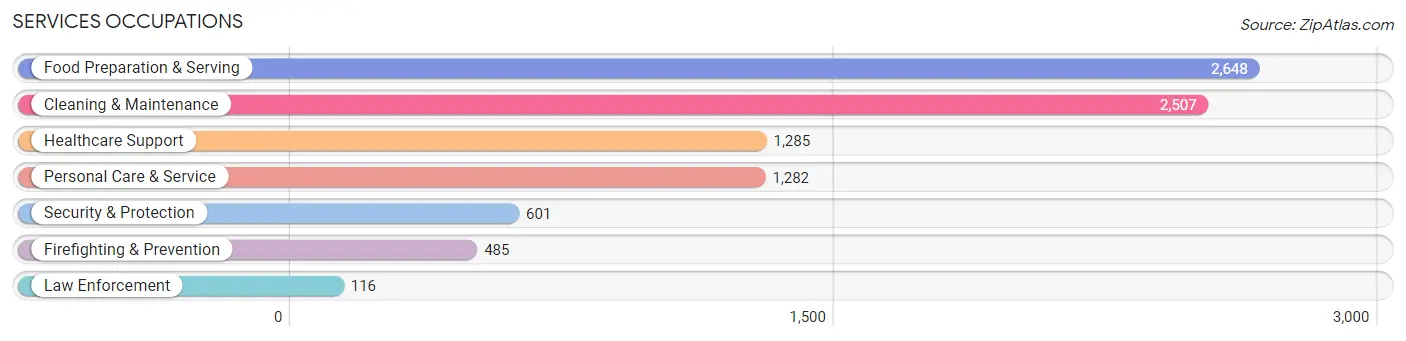
Services Occupations
The most common Services occupations in Delray Beach are Food Preparation & Serving (2,648 | 7.9%), Cleaning & Maintenance (2,507 | 7.5%), Healthcare Support (1,285 | 3.8%), Personal Care & Service (1,282 | 3.8%), and Security & Protection (601 | 1.8%).
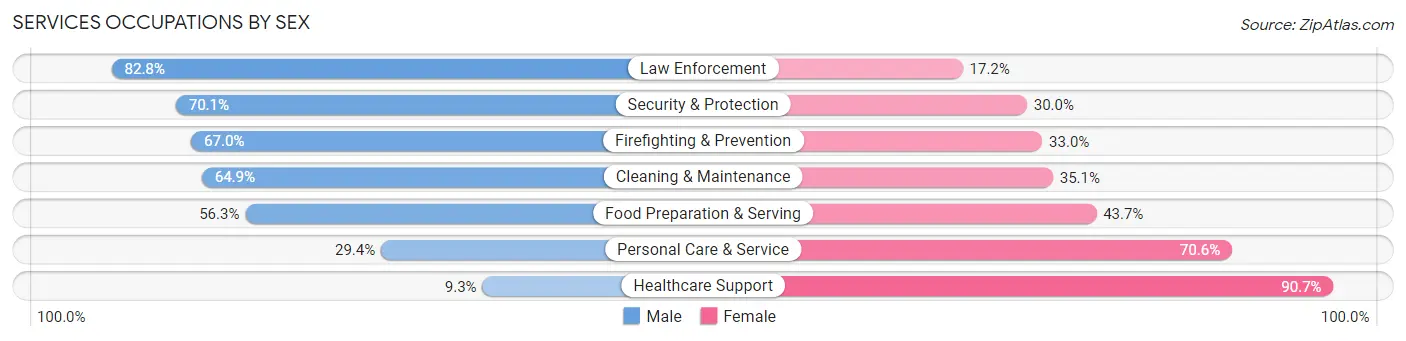
Services Occupations by Sex
Within the Services occupations in Delray Beach, the most male-oriented occupations are Law Enforcement (82.8%), Security & Protection (70.1%), and Firefighting & Prevention (67.0%), while the most female-oriented occupations are Healthcare Support (90.7%), Personal Care & Service (70.6%), and Food Preparation & Serving (43.7%).
| Occupation | Male | Female |
| Healthcare Support | 120 (9.3%) | 1,165 (90.7%) |
| Security & Protection | 421 (70.1%) | 180 (29.9%) |
| Firefighting & Prevention | 325 (67.0%) | 160 (33.0%) |
| Law Enforcement | 96 (82.8%) | 20 (17.2%) |
| Food Preparation & Serving | 1,491 (56.3%) | 1,157 (43.7%) |
| Cleaning & Maintenance | 1,627 (64.9%) | 880 (35.1%) |
| Personal Care & Service | 377 (29.4%) | 905 (70.6%) |
| Total (Category) | 4,036 (48.5%) | 4,287 (51.5%) |
| Total (Overall) | 17,223 (51.6%) | 16,146 (48.4%) |
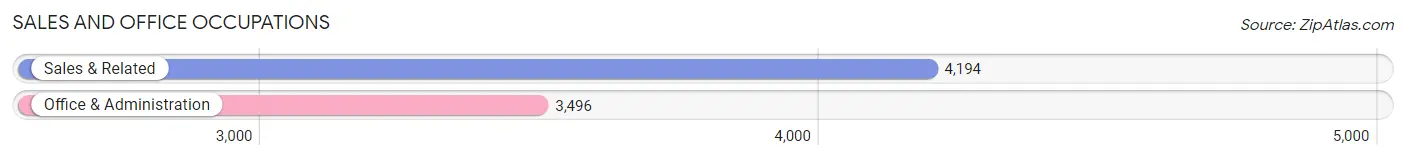
Sales and Office Occupations
The most common Sales and Office occupations in Delray Beach are Sales & Related (4,194 | 12.6%), and Office & Administration (3,496 | 10.5%).
Sales and Office Occupations by Sex
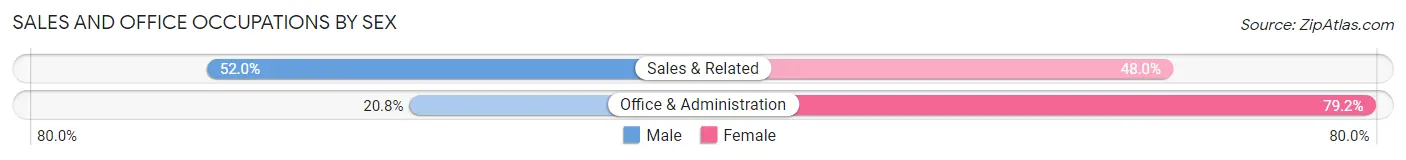
| Occupation | Male | Female |
| Sales & Related | 2,179 (52.0%) | 2,015 (48.0%) |
| Office & Administration | 728 (20.8%) | 2,768 (79.2%) |
| Total (Category) | 2,907 (37.8%) | 4,783 (62.2%) |
| Total (Overall) | 17,223 (51.6%) | 16,146 (48.4%) |
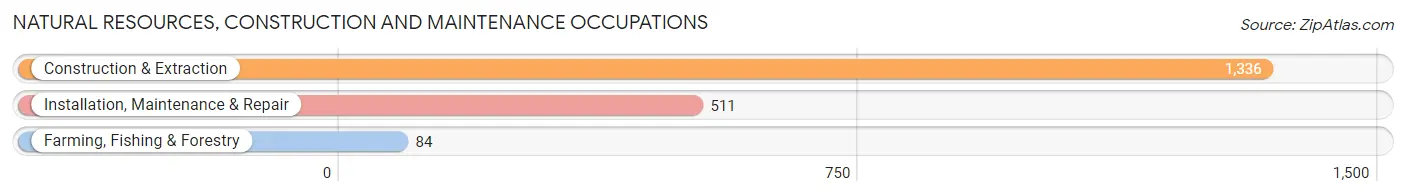
Natural Resources, Construction and Maintenance Occupations
The most common Natural Resources, Construction and Maintenance occupations in Delray Beach are Construction & Extraction (1,336 | 4.0%), Installation, Maintenance & Repair (511 | 1.5%), and Farming, Fishing & Forestry (84 | 0.3%).
Natural Resources, Construction and Maintenance Occupations by Sex
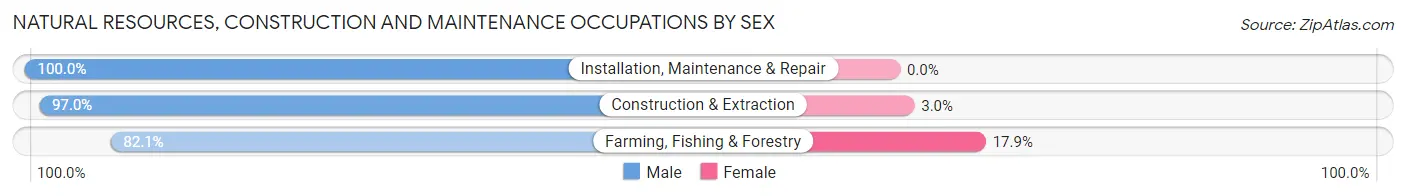
| Occupation | Male | Female |
| Farming, Fishing & Forestry | 69 (82.1%) | 15 (17.9%) |
| Construction & Extraction | 1,296 (97.0%) | 40 (3.0%) |
| Installation, Maintenance & Repair | 511 (100.0%) | 0 (0.0%) |
| Total (Category) | 1,876 (97.2%) | 55 (2.9%) |
| Total (Overall) | 17,223 (51.6%) | 16,146 (48.4%) |
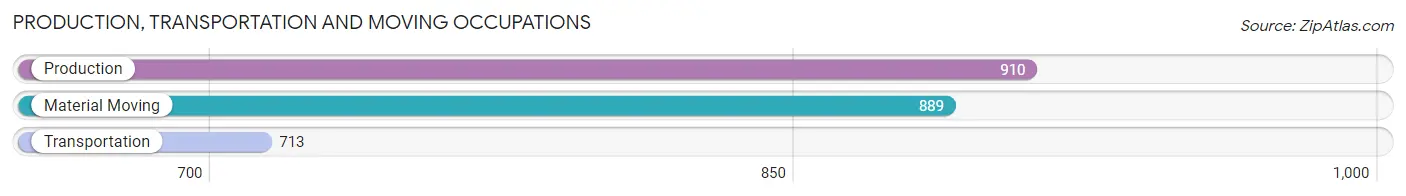
Production, Transportation and Moving Occupations
The most common Production, Transportation and Moving occupations in Delray Beach are Production (910 | 2.7%), Material Moving (889 | 2.7%), and Transportation (713 | 2.1%).
Production, Transportation and Moving Occupations by Sex
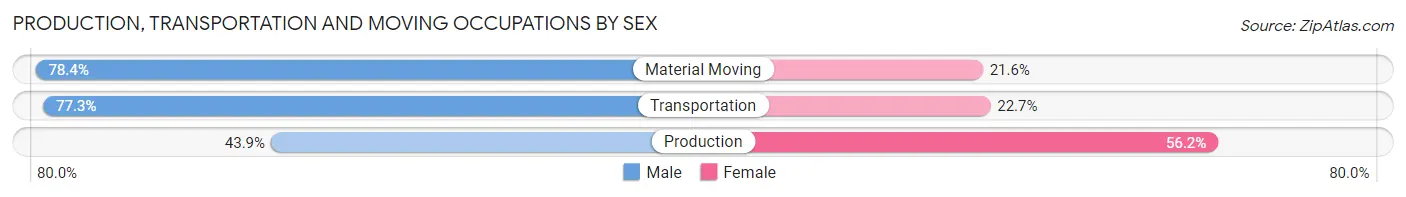
| Occupation | Male | Female |
| Production | 399 (43.9%) | 511 (56.1%) |
| Transportation | 551 (77.3%) | 162 (22.7%) |
| Material Moving | 697 (78.4%) | 192 (21.6%) |
| Total (Category) | 1,647 (65.6%) | 865 (34.4%) |
| Total (Overall) | 17,223 (51.6%) | 16,146 (48.4%) |
Employment Industries by Sex in Delray Beach
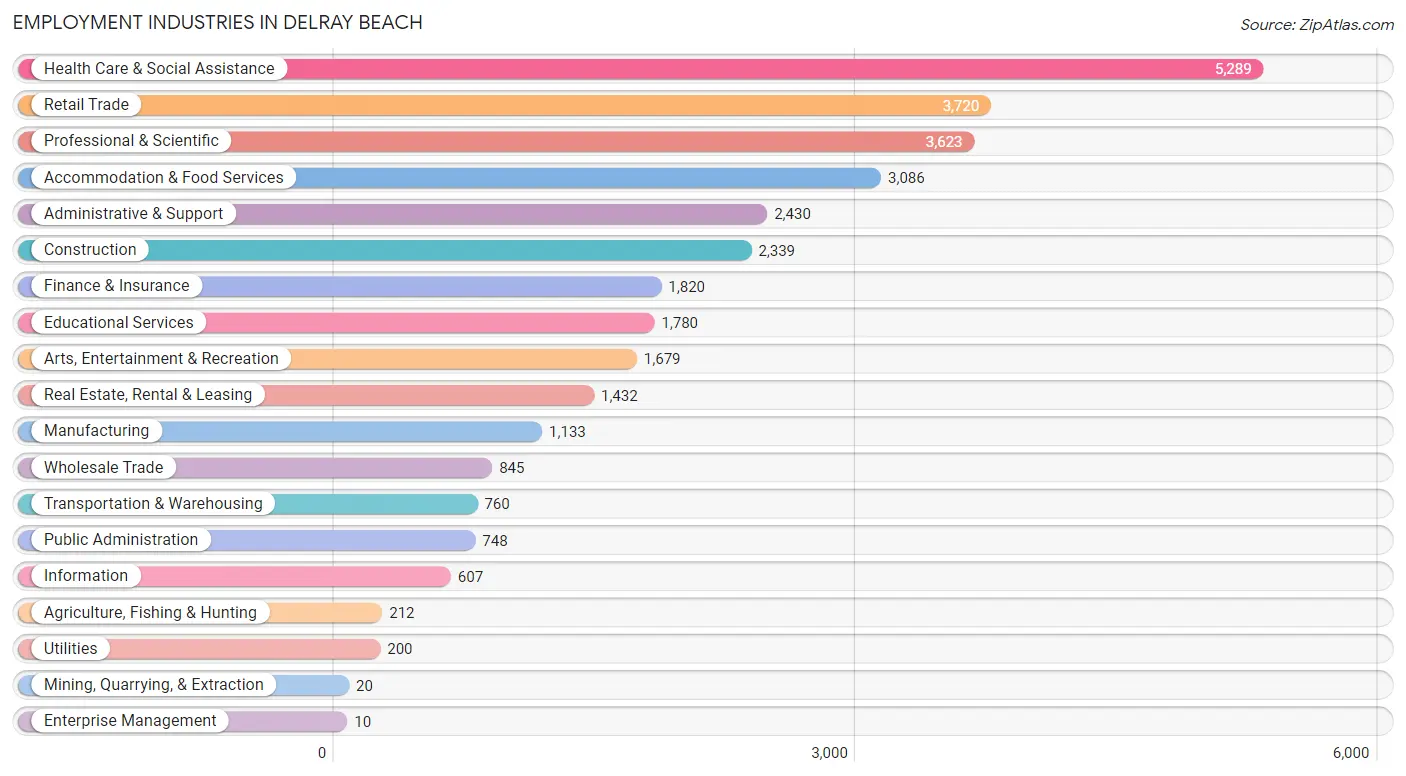
Employment Industries in Delray Beach
The major employment industries in Delray Beach include Health Care & Social Assistance (5,289 | 15.9%), Retail Trade (3,720 | 11.2%), Professional & Scientific (3,623 | 10.9%), Accommodation & Food Services (3,086 | 9.2%), and Administrative & Support (2,430 | 7.3%).
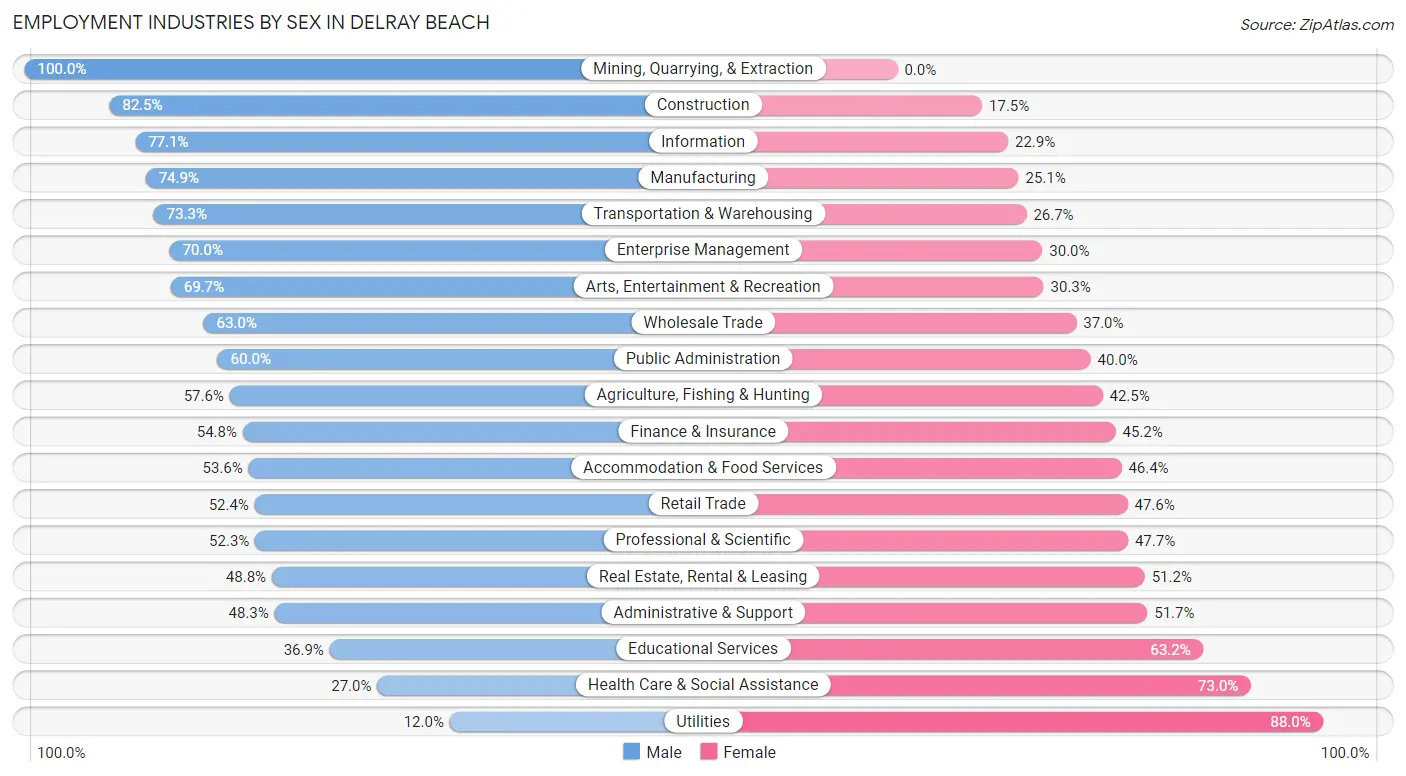
Employment Industries by Sex in Delray Beach
The Delray Beach industries that see more men than women are Mining, Quarrying, & Extraction (100.0%), Construction (82.5%), and Information (77.1%), whereas the industries that tend to have a higher number of women are Utilities (88.0%), Health Care & Social Assistance (73.0%), and Educational Services (63.1%).
| Industry | Male | Female |
| Agriculture, Fishing & Hunting | 122 (57.6%) | 90 (42.4%) |
| Mining, Quarrying, & Extraction | 20 (100.0%) | 0 (0.0%) |
| Construction | 1,929 (82.5%) | 410 (17.5%) |
| Manufacturing | 849 (74.9%) | 284 (25.1%) |
| Wholesale Trade | 532 (63.0%) | 313 (37.0%) |
| Retail Trade | 1,948 (52.4%) | 1,772 (47.6%) |
| Transportation & Warehousing | 557 (73.3%) | 203 (26.7%) |
| Utilities | 24 (12.0%) | 176 (88.0%) |
| Information | 468 (77.1%) | 139 (22.9%) |
| Finance & Insurance | 998 (54.8%) | 822 (45.2%) |
| Real Estate, Rental & Leasing | 699 (48.8%) | 733 (51.2%) |
| Professional & Scientific | 1,894 (52.3%) | 1,729 (47.7%) |
| Enterprise Management | 7 (70.0%) | 3 (30.0%) |
| Administrative & Support | 1,173 (48.3%) | 1,257 (51.7%) |
| Educational Services | 656 (36.8%) | 1,124 (63.1%) |
| Health Care & Social Assistance | 1,428 (27.0%) | 3,861 (73.0%) |
| Arts, Entertainment & Recreation | 1,171 (69.7%) | 508 (30.3%) |
| Accommodation & Food Services | 1,655 (53.6%) | 1,431 (46.4%) |
| Public Administration | 449 (60.0%) | 299 (40.0%) |
| Total | 17,223 (51.6%) | 16,146 (48.4%) |
Education in Delray Beach
School Enrollment in Delray Beach
The most common levels of schooling among the 11,295 students in Delray Beach are college / undergraduate (3,543 | 31.4%), high school (2,025 | 17.9%), and middle school (1,667 | 14.8%).
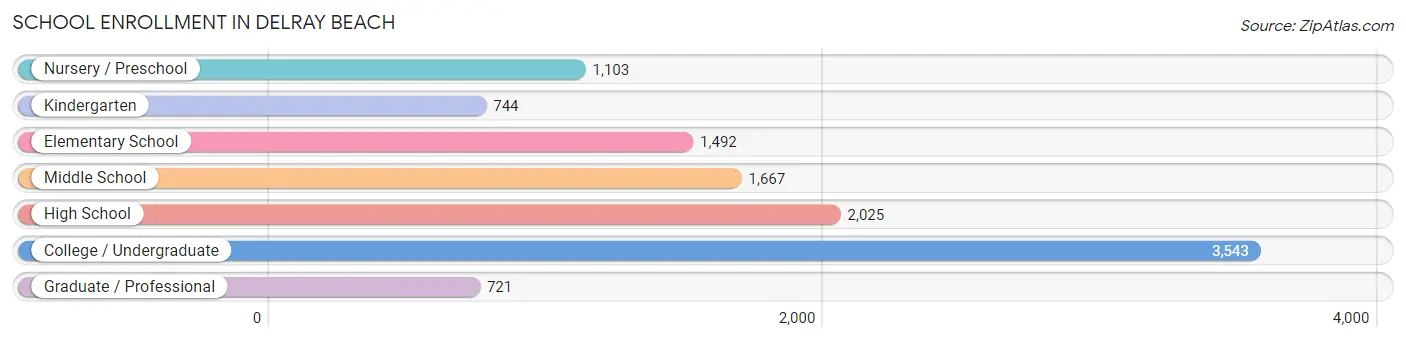
| School Level | # Students | % Students |
| Nursery / Preschool | 1,103 | 9.8% |
| Kindergarten | 744 | 6.6% |
| Elementary School | 1,492 | 13.2% |
| Middle School | 1,667 | 14.8% |
| High School | 2,025 | 17.9% |
| College / Undergraduate | 3,543 | 31.4% |
| Graduate / Professional | 721 | 6.4% |
| Total | 11,295 | 100.0% |
School Enrollment by Age by Funding Source in Delray Beach
Out of a total of 11,295 students who are enrolled in schools in Delray Beach, 2,722 (24.1%) attend a private institution, while the remaining 8,573 (75.9%) are enrolled in public schools. The age group of 3 to 4 year olds has the highest likelihood of being enrolled in private schools, with 472 (49.5% in the age bracket) enrolled. Conversely, the age group of 18 to 19 year olds has the lowest likelihood of being enrolled in a private school, with 826 (93.0% in the age bracket) attending a public institution.
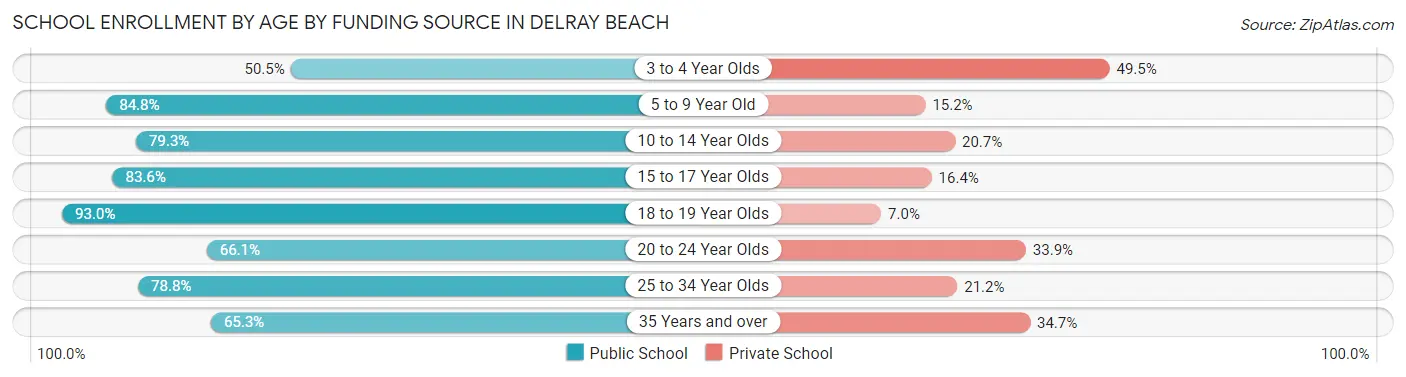
| Age Bracket | Public School | Private School |
| 3 to 4 Year Olds | 481 (50.5%) | 472 (49.5%) |
| 5 to 9 Year Old | 1,737 (84.8%) | 312 (15.2%) |
| 10 to 14 Year Olds | 1,682 (79.3%) | 440 (20.7%) |
| 15 to 17 Year Olds | 1,127 (83.6%) | 221 (16.4%) |
| 18 to 19 Year Olds | 826 (93.0%) | 62 (7.0%) |
| 20 to 24 Year Olds | 1,415 (66.1%) | 727 (33.9%) |
| 25 to 34 Year Olds | 805 (78.8%) | 216 (21.2%) |
| 35 Years and over | 504 (65.3%) | 268 (34.7%) |
| Total | 8,573 (75.9%) | 2,722 (24.1%) |
Educational Attainment by Field of Study in Delray Beach
Business (6,089 | 26.7%), education (2,771 | 12.1%), science & technology (2,171 | 9.5%), social sciences (2,167 | 9.5%), and engineering (1,191 | 5.2%) are the most common fields of study among 22,810 individuals in Delray Beach who have obtained a bachelor's degree or higher.
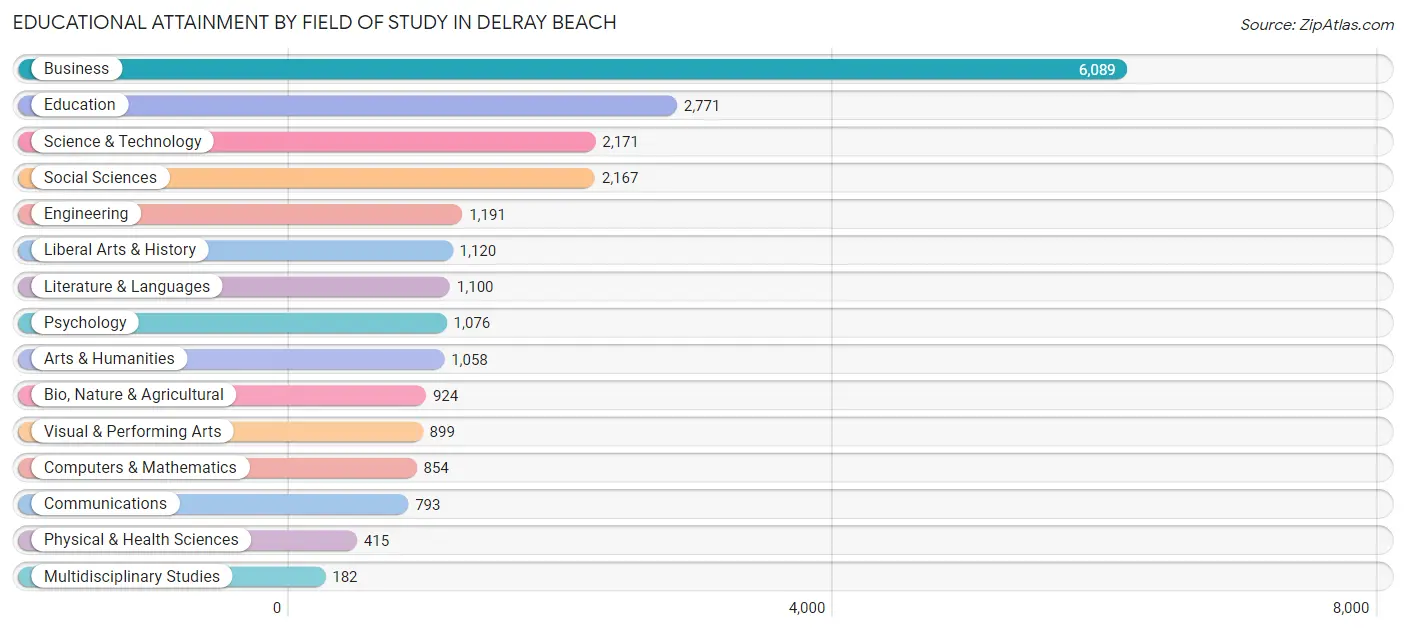
| Field of Study | # Graduates | % Graduates |
| Computers & Mathematics | 854 | 3.7% |
| Bio, Nature & Agricultural | 924 | 4.1% |
| Physical & Health Sciences | 415 | 1.8% |
| Psychology | 1,076 | 4.7% |
| Social Sciences | 2,167 | 9.5% |
| Engineering | 1,191 | 5.2% |
| Multidisciplinary Studies | 182 | 0.8% |
| Science & Technology | 2,171 | 9.5% |
| Business | 6,089 | 26.7% |
| Education | 2,771 | 12.1% |
| Literature & Languages | 1,100 | 4.8% |
| Liberal Arts & History | 1,120 | 4.9% |
| Visual & Performing Arts | 899 | 3.9% |
| Communications | 793 | 3.5% |
| Arts & Humanities | 1,058 | 4.6% |
| Total | 22,810 | 100.0% |
Transportation & Commute in Delray Beach
Vehicle Availability by Sex in Delray Beach
The most prevalent vehicle ownership categories in Delray Beach are males with 2 vehicles (6,991, accounting for 41.2%) and females with 2 vehicles (5,934, making up 44.6%).
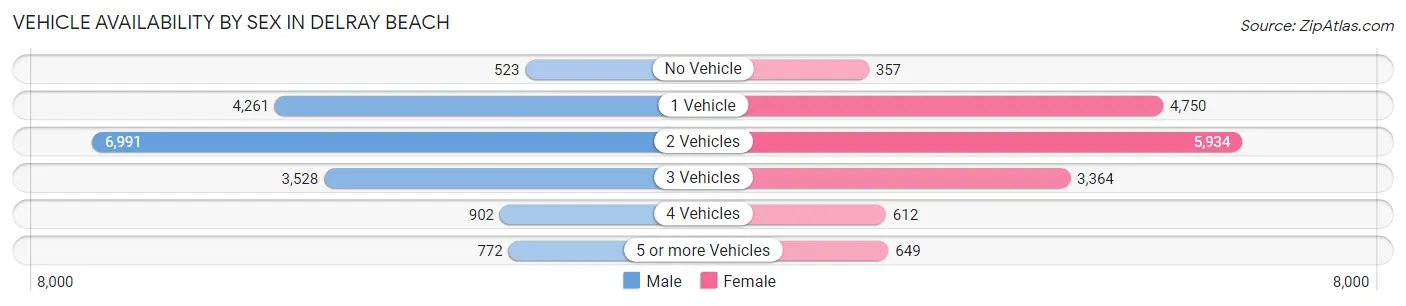
| Vehicles Available | Male | Female |
| No Vehicle | 523 (3.1%) | 357 (2.3%) |
| 1 Vehicle | 4,261 (25.1%) | 4,750 (30.3%) |
| 2 Vehicles | 6,991 (41.2%) | 5,934 (37.9%) |
| 3 Vehicles | 3,528 (20.8%) | 3,364 (21.5%) |
| 4 Vehicles | 902 (5.3%) | 612 (3.9%) |
| 5 or more Vehicles | 772 (4.5%) | 649 (4.1%) |
| Total | 16,977 (100.0%) | 15,666 (100.0%) |
Commute Time in Delray Beach
The most frequently occuring commute durations in Delray Beach are 15 to 19 minutes (5,513 commuters, 20.1%), 20 to 24 minutes (4,426 commuters, 16.1%), and 10 to 14 minutes (4,386 commuters, 16.0%).
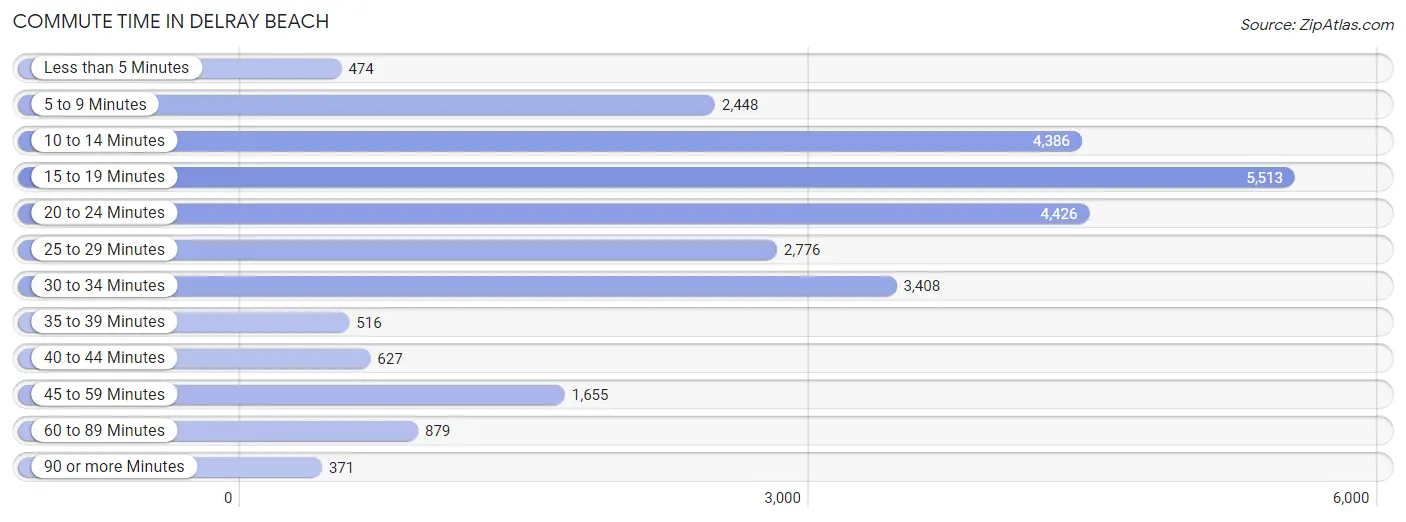
| Commute Time | # Commuters | % Commuters |
| Less than 5 Minutes | 474 | 1.7% |
| 5 to 9 Minutes | 2,448 | 8.9% |
| 10 to 14 Minutes | 4,386 | 16.0% |
| 15 to 19 Minutes | 5,513 | 20.1% |
| 20 to 24 Minutes | 4,426 | 16.1% |
| 25 to 29 Minutes | 2,776 | 10.1% |
| 30 to 34 Minutes | 3,408 | 12.4% |
| 35 to 39 Minutes | 516 | 1.9% |
| 40 to 44 Minutes | 627 | 2.3% |
| 45 to 59 Minutes | 1,655 | 6.0% |
| 60 to 89 Minutes | 879 | 3.2% |
| 90 or more Minutes | 371 | 1.3% |
Commute Time by Sex in Delray Beach
The most common commute times in Delray Beach are 15 to 19 minutes (2,492 commuters, 17.4%) for males and 15 to 19 minutes (3,021 commuters, 23.0%) for females.
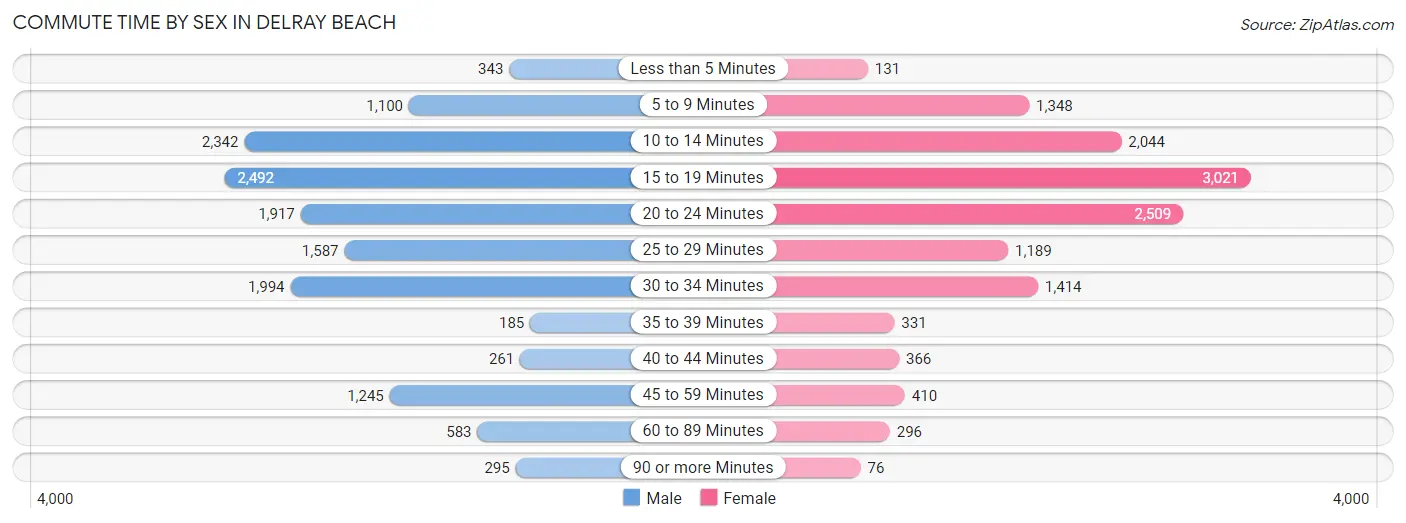
| Commute Time | Male | Female |
| Less than 5 Minutes | 343 (2.4%) | 131 (1.0%) |
| 5 to 9 Minutes | 1,100 (7.7%) | 1,348 (10.3%) |
| 10 to 14 Minutes | 2,342 (16.3%) | 2,044 (15.6%) |
| 15 to 19 Minutes | 2,492 (17.4%) | 3,021 (23.0%) |
| 20 to 24 Minutes | 1,917 (13.4%) | 2,509 (19.1%) |
| 25 to 29 Minutes | 1,587 (11.1%) | 1,189 (9.0%) |
| 30 to 34 Minutes | 1,994 (13.9%) | 1,414 (10.8%) |
| 35 to 39 Minutes | 185 (1.3%) | 331 (2.5%) |
| 40 to 44 Minutes | 261 (1.8%) | 366 (2.8%) |
| 45 to 59 Minutes | 1,245 (8.7%) | 410 (3.1%) |
| 60 to 89 Minutes | 583 (4.1%) | 296 (2.2%) |
| 90 or more Minutes | 295 (2.1%) | 76 (0.6%) |
Time of Departure to Work by Sex in Delray Beach
The most frequent times of departure to work in Delray Beach are 8:00 AM to 8:29 AM (1,994, 13.9%) for males and 8:00 AM to 8:29 AM (2,419, 18.4%) for females.
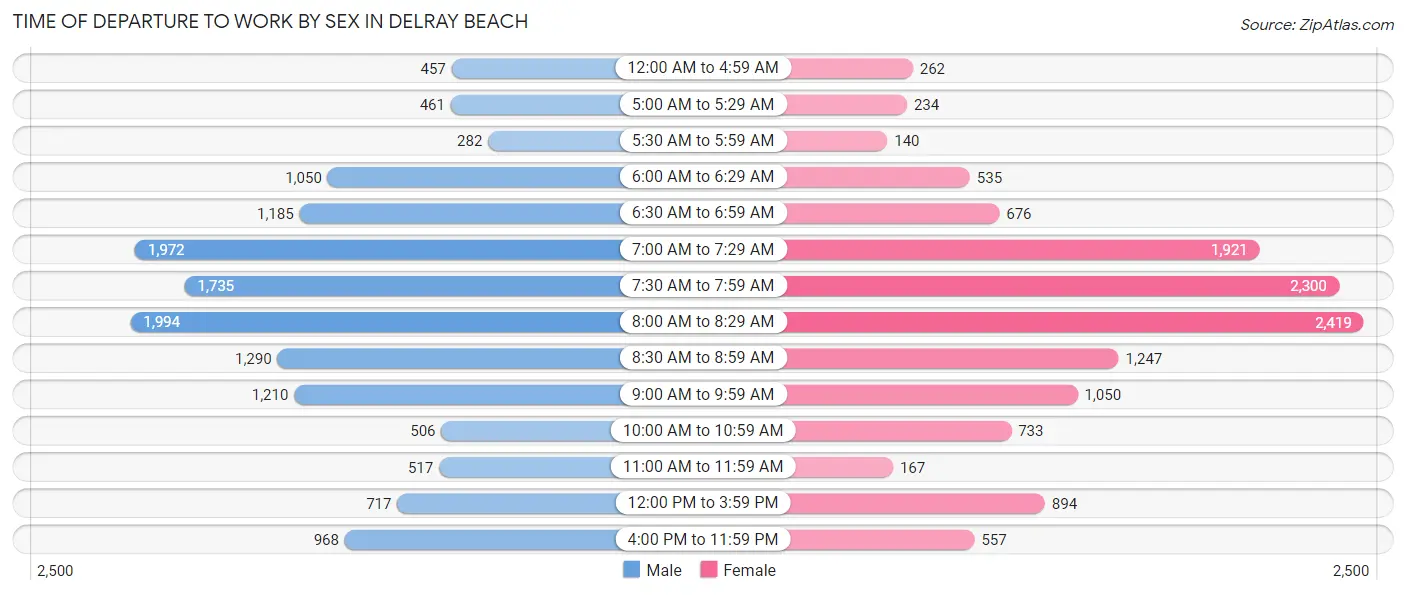
| Time of Departure | Male | Female |
| 12:00 AM to 4:59 AM | 457 (3.2%) | 262 (2.0%) |
| 5:00 AM to 5:29 AM | 461 (3.2%) | 234 (1.8%) |
| 5:30 AM to 5:59 AM | 282 (2.0%) | 140 (1.1%) |
| 6:00 AM to 6:29 AM | 1,050 (7.3%) | 535 (4.1%) |
| 6:30 AM to 6:59 AM | 1,185 (8.3%) | 676 (5.1%) |
| 7:00 AM to 7:29 AM | 1,972 (13.8%) | 1,921 (14.6%) |
| 7:30 AM to 7:59 AM | 1,735 (12.1%) | 2,300 (17.5%) |
| 8:00 AM to 8:29 AM | 1,994 (13.9%) | 2,419 (18.4%) |
| 8:30 AM to 8:59 AM | 1,290 (9.0%) | 1,247 (9.5%) |
| 9:00 AM to 9:59 AM | 1,210 (8.4%) | 1,050 (8.0%) |
| 10:00 AM to 10:59 AM | 506 (3.5%) | 733 (5.6%) |
| 11:00 AM to 11:59 AM | 517 (3.6%) | 167 (1.3%) |
| 12:00 PM to 3:59 PM | 717 (5.0%) | 894 (6.8%) |
| 4:00 PM to 11:59 PM | 968 (6.8%) | 557 (4.2%) |
| Total | 14,344 (100.0%) | 13,135 (100.0%) |
Housing Occupancy in Delray Beach
Occupancy by Ownership in Delray Beach
Of the total 28,592 dwellings in Delray Beach, owner-occupied units account for 18,491 (64.7%), while renter-occupied units make up 10,101 (35.3%).
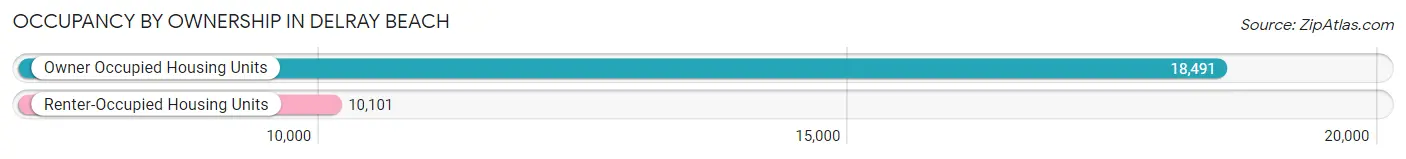
| Occupancy | # Housing Units | % Housing Units |
| Owner Occupied Housing Units | 18,491 | 64.7% |
| Renter-Occupied Housing Units | 10,101 | 35.3% |
| Total Occupied Housing Units | 28,592 | 100.0% |
Occupancy by Household Size in Delray Beach
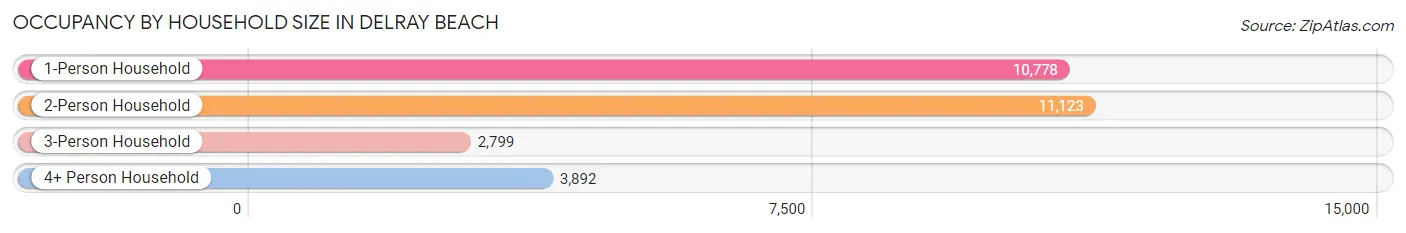
| Household Size | # Housing Units | % Housing Units |
| 1-Person Household | 10,778 | 37.7% |
| 2-Person Household | 11,123 | 38.9% |
| 3-Person Household | 2,799 | 9.8% |
| 4+ Person Household | 3,892 | 13.6% |
| Total Housing Units | 28,592 | 100.0% |
Occupancy by Ownership by Household Size in Delray Beach
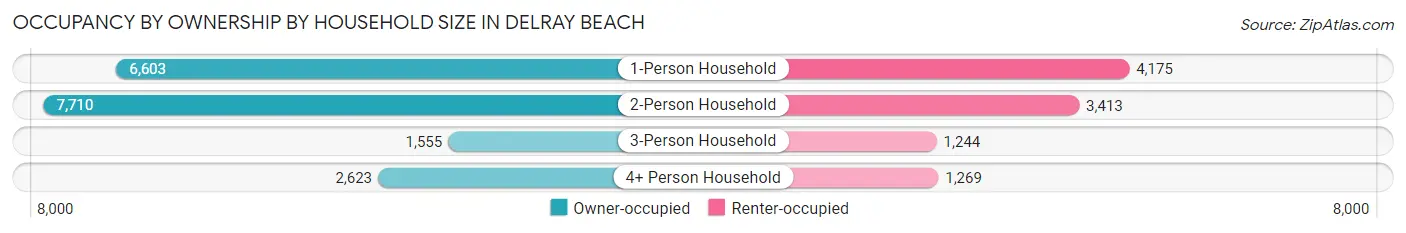
| Household Size | Owner-occupied | Renter-occupied |
| 1-Person Household | 6,603 (61.3%) | 4,175 (38.7%) |
| 2-Person Household | 7,710 (69.3%) | 3,413 (30.7%) |
| 3-Person Household | 1,555 (55.6%) | 1,244 (44.4%) |
| 4+ Person Household | 2,623 (67.4%) | 1,269 (32.6%) |
| Total Housing Units | 18,491 (64.7%) | 10,101 (35.3%) |
Occupancy by Educational Attainment in Delray Beach
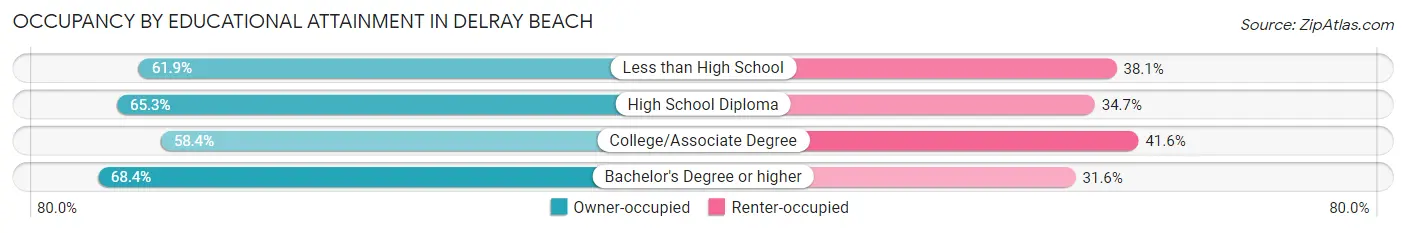
| Household Size | Owner-occupied | Renter-occupied |
| Less than High School | 1,432 (61.9%) | 882 (38.1%) |
| High School Diploma | 3,595 (65.3%) | 1,909 (34.7%) |
| College/Associate Degree | 4,324 (58.4%) | 3,081 (41.6%) |
| Bachelor's Degree or higher | 9,140 (68.4%) | 4,229 (31.6%) |
Occupancy by Age of Householder in Delray Beach
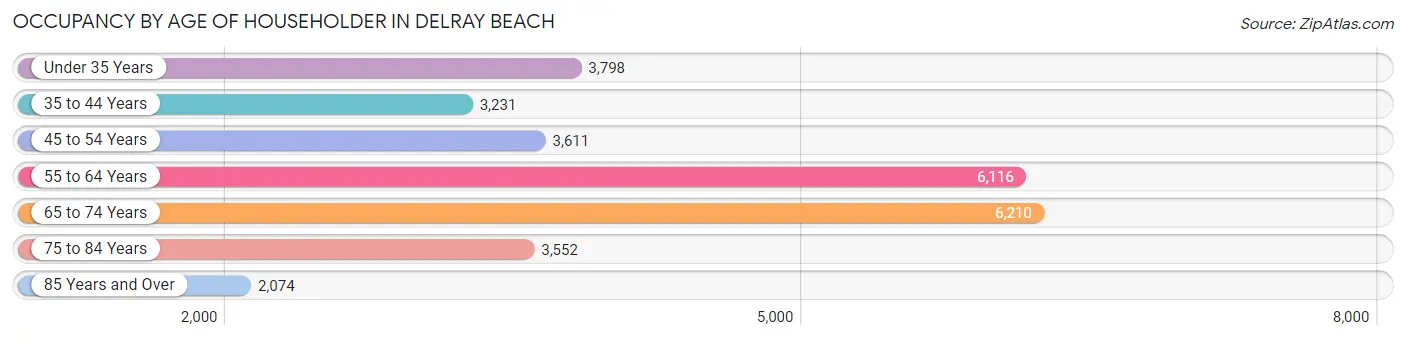
| Age Bracket | # Households | % Households |
| Under 35 Years | 3,798 | 13.3% |
| 35 to 44 Years | 3,231 | 11.3% |
| 45 to 54 Years | 3,611 | 12.6% |
| 55 to 64 Years | 6,116 | 21.4% |
| 65 to 74 Years | 6,210 | 21.7% |
| 75 to 84 Years | 3,552 | 12.4% |
| 85 Years and Over | 2,074 | 7.2% |
| Total | 28,592 | 100.0% |
Housing Finances in Delray Beach
Median Income by Occupancy in Delray Beach
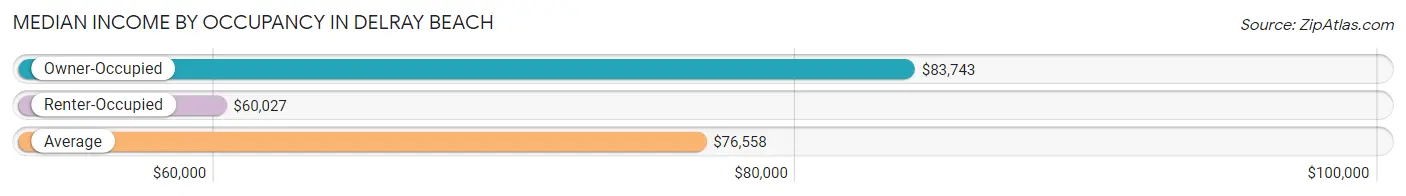
| Occupancy Type | # Households | Median Income |
| Owner-Occupied | 18,491 (64.7%) | $83,743 |
| Renter-Occupied | 10,101 (35.3%) | $60,027 |
| Average | 28,592 (100.0%) | $76,558 |
Occupancy by Householder Income Bracket in Delray Beach
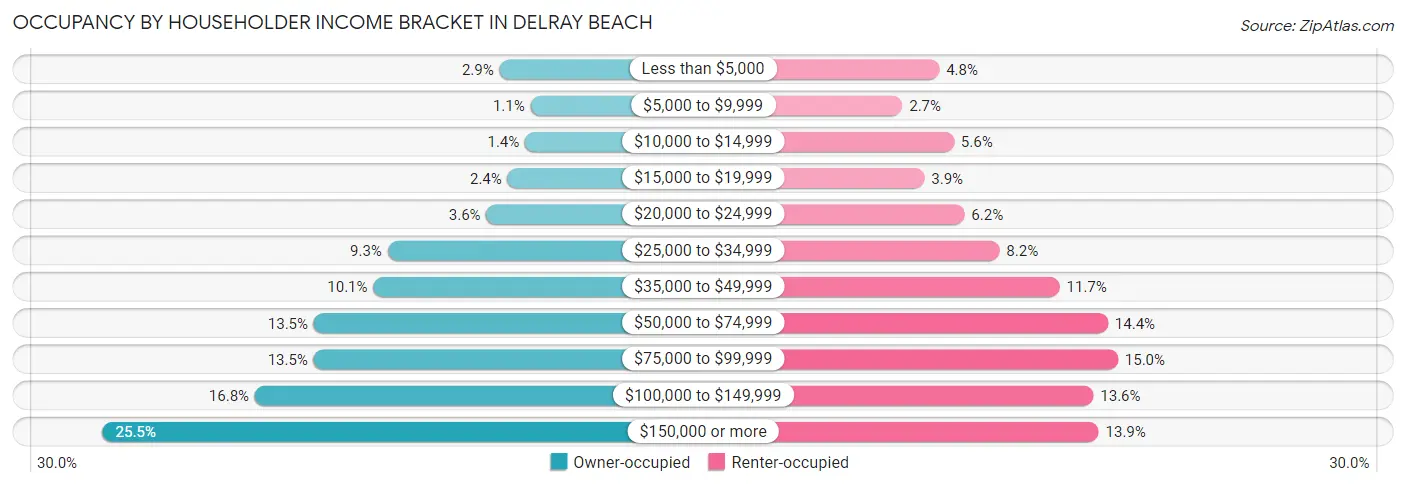
| Income Bracket | Owner-occupied | Renter-occupied |
| Less than $5,000 | 528 (2.9%) | 483 (4.8%) |
| $5,000 to $9,999 | 202 (1.1%) | 270 (2.7%) |
| $10,000 to $14,999 | 259 (1.4%) | 568 (5.6%) |
| $15,000 to $19,999 | 444 (2.4%) | 397 (3.9%) |
| $20,000 to $24,999 | 667 (3.6%) | 628 (6.2%) |
| $25,000 to $34,999 | 1,711 (9.2%) | 830 (8.2%) |
| $35,000 to $49,999 | 1,862 (10.1%) | 1,178 (11.7%) |
| $50,000 to $74,999 | 2,491 (13.5%) | 1,457 (14.4%) |
| $75,000 to $99,999 | 2,492 (13.5%) | 1,514 (15.0%) |
| $100,000 to $149,999 | 3,113 (16.8%) | 1,373 (13.6%) |
| $150,000 or more | 4,722 (25.5%) | 1,403 (13.9%) |
| Total | 18,491 (100.0%) | 10,101 (100.0%) |
Monthly Housing Cost Tiers in Delray Beach
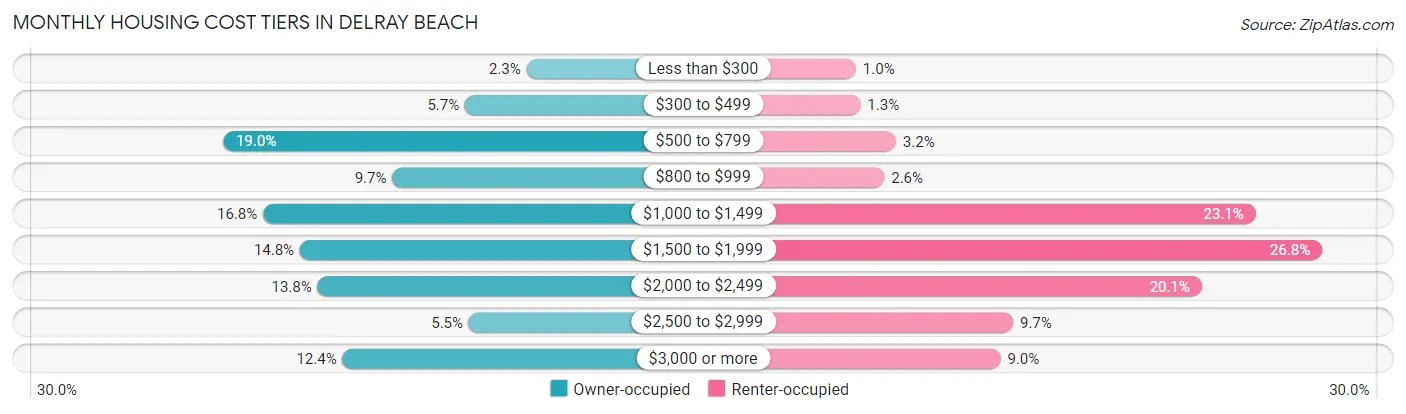
| Monthly Cost | Owner-occupied | Renter-occupied |
| Less than $300 | 419 (2.3%) | 103 (1.0%) |
| $300 to $499 | 1,048 (5.7%) | 128 (1.3%) |
| $500 to $799 | 3,521 (19.0%) | 326 (3.2%) |
| $800 to $999 | 1,791 (9.7%) | 262 (2.6%) |
| $1,000 to $1,499 | 3,112 (16.8%) | 2,333 (23.1%) |
| $1,500 to $1,999 | 2,734 (14.8%) | 2,704 (26.8%) |
| $2,000 to $2,499 | 2,556 (13.8%) | 2,032 (20.1%) |
| $2,500 to $2,999 | 1,009 (5.5%) | 980 (9.7%) |
| $3,000 or more | 2,301 (12.4%) | 910 (9.0%) |
| Total | 18,491 (100.0%) | 10,101 (100.0%) |
Physical Housing Characteristics in Delray Beach
Housing Structures in Delray Beach
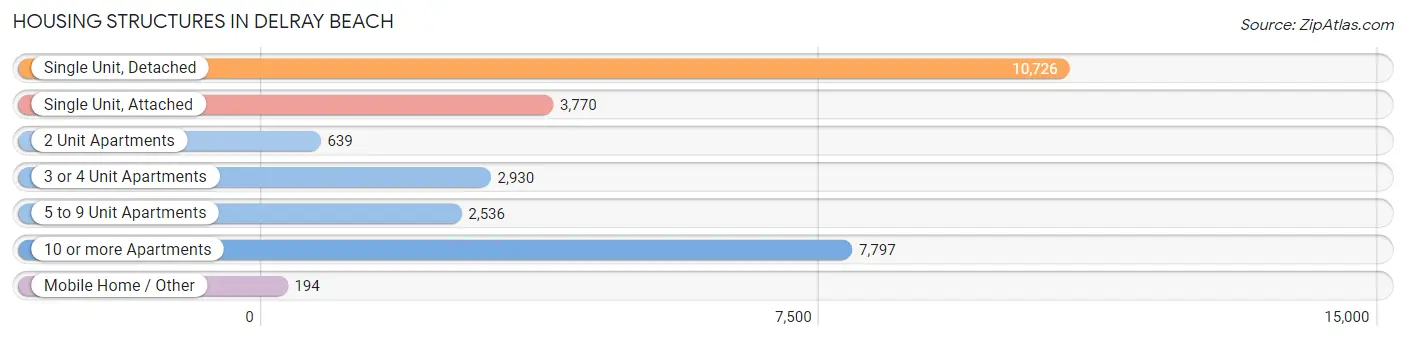
| Structure Type | # Housing Units | % Housing Units |
| Single Unit, Detached | 10,726 | 37.5% |
| Single Unit, Attached | 3,770 | 13.2% |
| 2 Unit Apartments | 639 | 2.2% |
| 3 or 4 Unit Apartments | 2,930 | 10.2% |
| 5 to 9 Unit Apartments | 2,536 | 8.9% |
| 10 or more Apartments | 7,797 | 27.3% |
| Mobile Home / Other | 194 | 0.7% |
| Total | 28,592 | 100.0% |
Housing Structures by Occupancy in Delray Beach
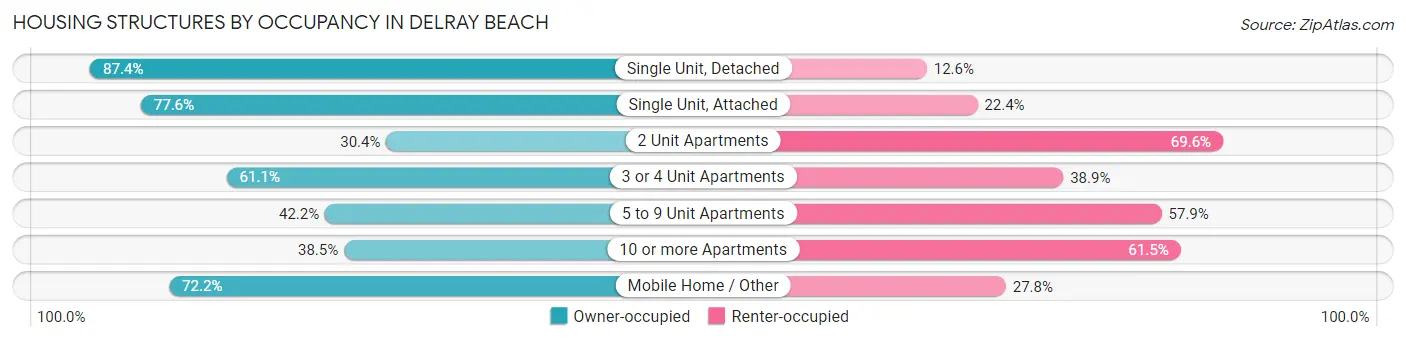
| Structure Type | Owner-occupied | Renter-occupied |
| Single Unit, Detached | 9,371 (87.4%) | 1,355 (12.6%) |
| Single Unit, Attached | 2,926 (77.6%) | 844 (22.4%) |
| 2 Unit Apartments | 194 (30.4%) | 445 (69.6%) |
| 3 or 4 Unit Apartments | 1,790 (61.1%) | 1,140 (38.9%) |
| 5 to 9 Unit Apartments | 1,069 (42.1%) | 1,467 (57.9%) |
| 10 or more Apartments | 3,001 (38.5%) | 4,796 (61.5%) |
| Mobile Home / Other | 140 (72.2%) | 54 (27.8%) |
| Total | 18,491 (64.7%) | 10,101 (35.3%) |
Housing Structures by Number of Rooms in Delray Beach
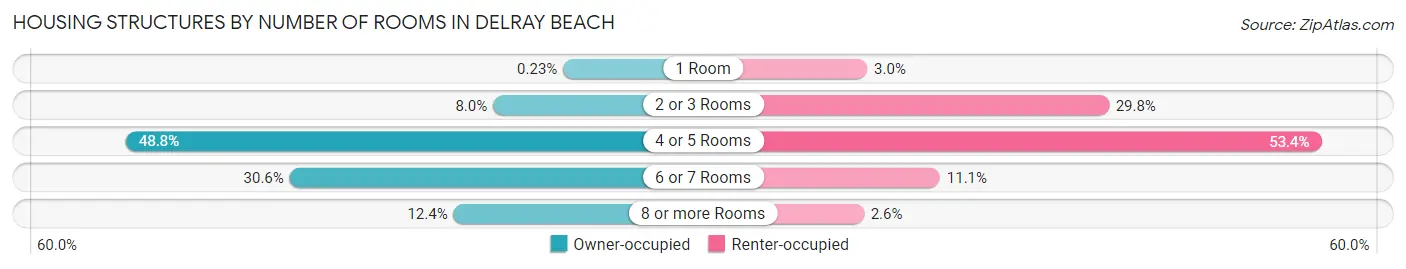
| Number of Rooms | Owner-occupied | Renter-occupied |
| 1 Room | 43 (0.2%) | 305 (3.0%) |
| 2 or 3 Rooms | 1,482 (8.0%) | 3,013 (29.8%) |
| 4 or 5 Rooms | 9,017 (48.8%) | 5,396 (53.4%) |
| 6 or 7 Rooms | 5,657 (30.6%) | 1,120 (11.1%) |
| 8 or more Rooms | 2,292 (12.4%) | 267 (2.6%) |
| Total | 18,491 (100.0%) | 10,101 (100.0%) |
Housing Structure by Heating Type in Delray Beach
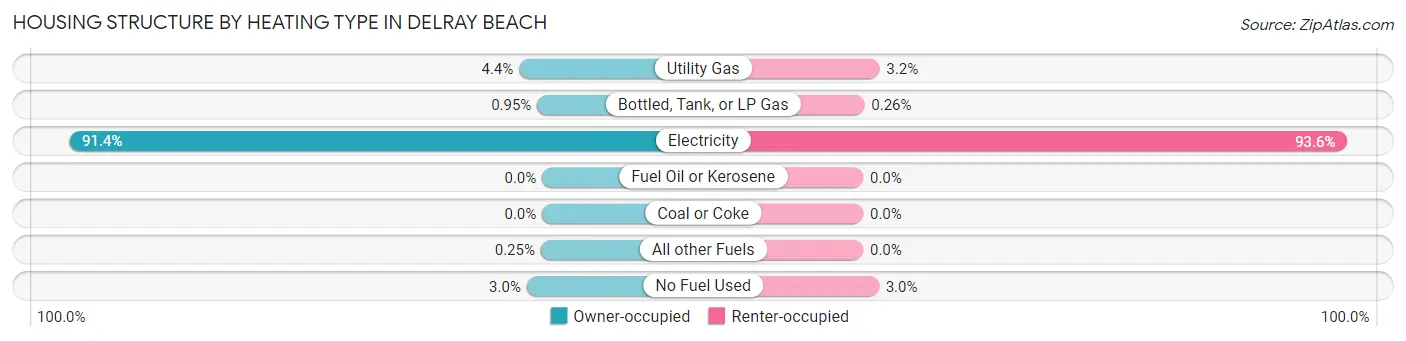
| Heating Type | Owner-occupied | Renter-occupied |
| Utility Gas | 821 (4.4%) | 319 (3.2%) |
| Bottled, Tank, or LP Gas | 176 (0.9%) | 26 (0.3%) |
| Electricity | 16,899 (91.4%) | 9,451 (93.6%) |
| Fuel Oil or Kerosene | 0 (0.0%) | 0 (0.0%) |
| Coal or Coke | 0 (0.0%) | 0 (0.0%) |
| All other Fuels | 46 (0.3%) | 0 (0.0%) |
| No Fuel Used | 549 (3.0%) | 305 (3.0%) |
| Total | 18,491 (100.0%) | 10,101 (100.0%) |
Household Vehicle Usage in Delray Beach
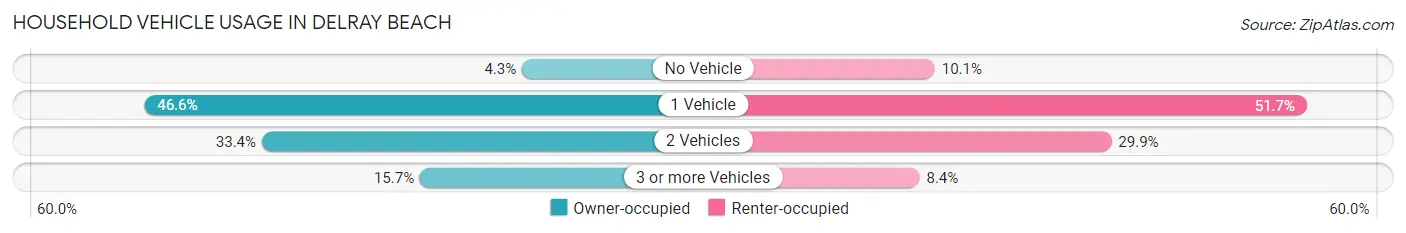
| Vehicles per Household | Owner-occupied | Renter-occupied |
| No Vehicle | 792 (4.3%) | 1,017 (10.1%) |
| 1 Vehicle | 8,615 (46.6%) | 5,225 (51.7%) |
| 2 Vehicles | 6,179 (33.4%) | 3,015 (29.8%) |
| 3 or more Vehicles | 2,905 (15.7%) | 844 (8.4%) |
| Total | 18,491 (100.0%) | 10,101 (100.0%) |
Real Estate & Mortgages in Delray Beach
Real Estate and Mortgage Overview in Delray Beach
| Characteristic | Without Mortgage | With Mortgage |
| Housing Units | 8,943 | 9,548 |
| Median Property Value | $314,900 | $375,100 |
| Median Household Income | $64,452 | $3,144 |
| Monthly Housing Costs | $776 | $1,934 |
| Real Estate Taxes | $2,631 | $185 |
Property Value by Mortgage Status in Delray Beach
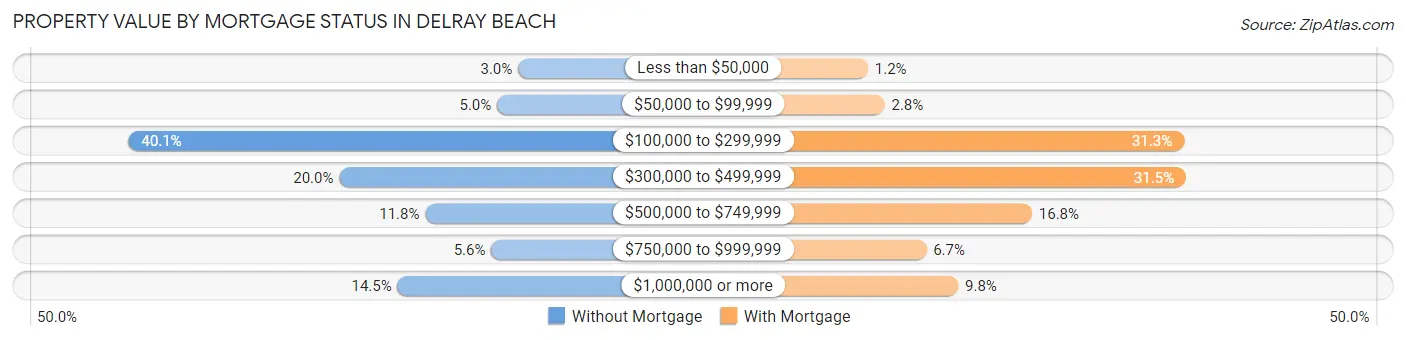
| Property Value | Without Mortgage | With Mortgage |
| Less than $50,000 | 268 (3.0%) | 112 (1.2%) |
| $50,000 to $99,999 | 447 (5.0%) | 264 (2.8%) |
| $100,000 to $299,999 | 3,587 (40.1%) | 2,988 (31.3%) |
| $300,000 to $499,999 | 1,791 (20.0%) | 3,005 (31.5%) |
| $500,000 to $749,999 | 1,059 (11.8%) | 1,603 (16.8%) |
| $750,000 to $999,999 | 496 (5.6%) | 643 (6.7%) |
| $1,000,000 or more | 1,295 (14.5%) | 933 (9.8%) |
| Total | 8,943 (100.0%) | 9,548 (100.0%) |
Household Income by Mortgage Status in Delray Beach
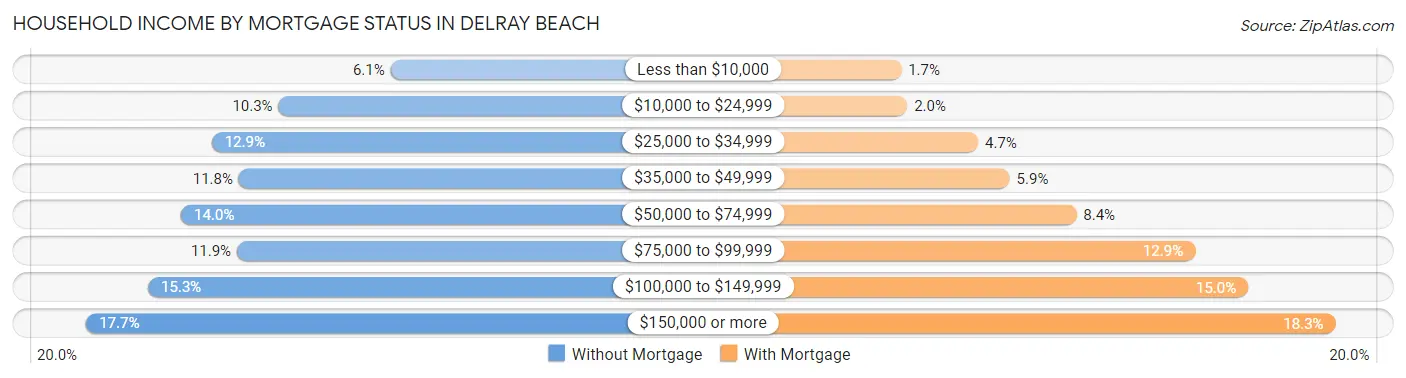
| Household Income | Without Mortgage | With Mortgage |
| Less than $10,000 | 542 (6.1%) | 166 (1.7%) |
| $10,000 to $24,999 | 924 (10.3%) | 188 (2.0%) |
| $25,000 to $34,999 | 1,151 (12.9%) | 446 (4.7%) |
| $35,000 to $49,999 | 1,059 (11.8%) | 560 (5.9%) |
| $50,000 to $74,999 | 1,256 (14.0%) | 803 (8.4%) |
| $75,000 to $99,999 | 1,065 (11.9%) | 1,235 (12.9%) |
| $100,000 to $149,999 | 1,368 (15.3%) | 1,427 (14.9%) |
| $150,000 or more | 1,578 (17.6%) | 1,745 (18.3%) |
| Total | 8,943 (100.0%) | 9,548 (100.0%) |
Property Value to Household Income Ratio in Delray Beach
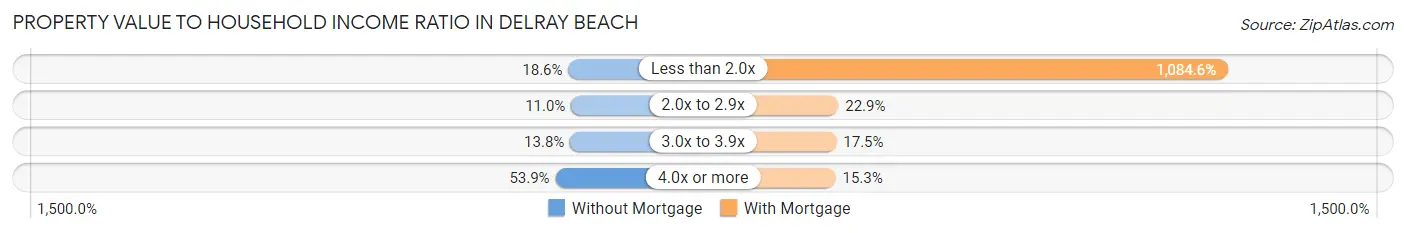
| Value-to-Income Ratio | Without Mortgage | With Mortgage |
| Less than 2.0x | 1,667 (18.6%) | 103,553 (1,084.5%) |
| 2.0x to 2.9x | 983 (11.0%) | 2,182 (22.9%) |
| 3.0x to 3.9x | 1,231 (13.8%) | 1,675 (17.5%) |
| 4.0x or more | 4,823 (53.9%) | 1,459 (15.3%) |
| Total | 8,943 (100.0%) | 9,548 (100.0%) |
Real Estate Taxes by Mortgage Status in Delray Beach
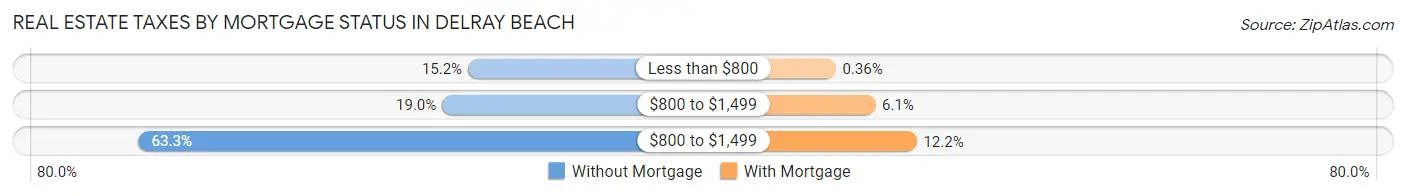
| Property Taxes | Without Mortgage | With Mortgage |
| Less than $800 | 1,361 (15.2%) | 34 (0.4%) |
| $800 to $1,499 | 1,698 (19.0%) | 586 (6.1%) |
| $800 to $1,499 | 5,664 (63.3%) | 1,164 (12.2%) |
| Total | 8,943 (100.0%) | 9,548 (100.0%) |
Health & Disability in Delray Beach
Health Insurance Coverage by Age in Delray Beach
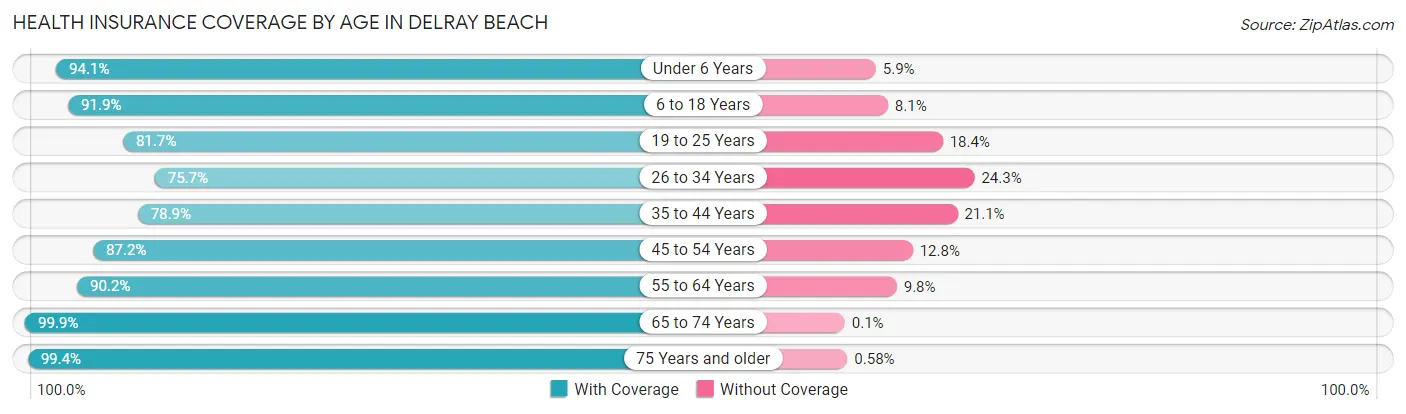
| Age Bracket | With Coverage | Without Coverage |
| Under 6 Years | 3,521 (94.1%) | 220 (5.9%) |
| 6 to 18 Years | 4,961 (91.9%) | 439 (8.1%) |
| 19 to 25 Years | 4,209 (81.7%) | 946 (18.3%) |
| 26 to 34 Years | 6,253 (75.7%) | 2,005 (24.3%) |
| 35 to 44 Years | 5,576 (78.9%) | 1,491 (21.1%) |
| 45 to 54 Years | 6,229 (87.2%) | 911 (12.8%) |
| 55 to 64 Years | 10,355 (90.2%) | 1,124 (9.8%) |
| 65 to 74 Years | 9,240 (99.9%) | 9 (0.1%) |
| 75 Years and older | 8,557 (99.4%) | 50 (0.6%) |
| Total | 58,901 (89.1%) | 7,195 (10.9%) |
Health Insurance Coverage by Citizenship Status in Delray Beach
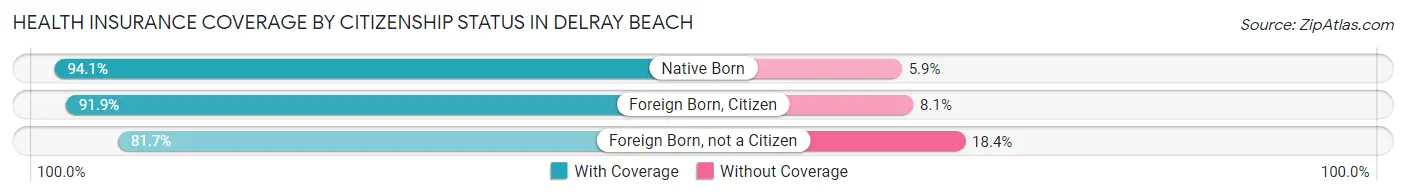
| Citizenship Status | With Coverage | Without Coverage |
| Native Born | 3,521 (94.1%) | 220 (5.9%) |
| Foreign Born, Citizen | 4,961 (91.9%) | 439 (8.1%) |
| Foreign Born, not a Citizen | 4,209 (81.7%) | 946 (18.3%) |
Health Insurance Coverage by Household Income in Delray Beach
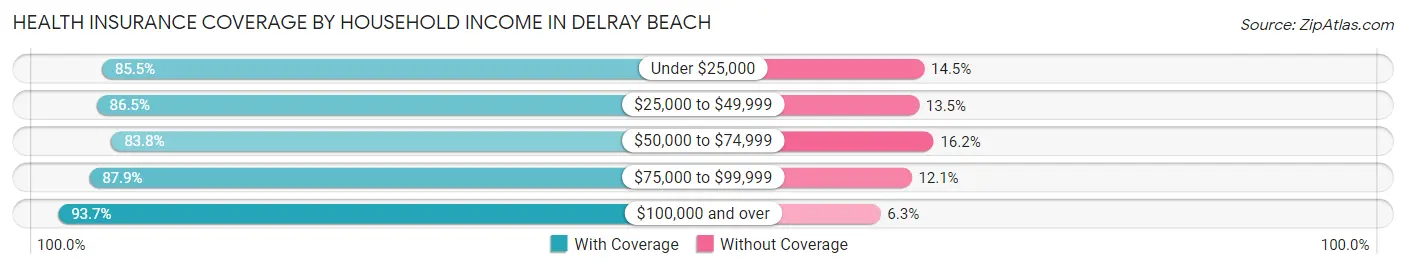
| Household Income | With Coverage | Without Coverage |
| Under $25,000 | 6,575 (85.5%) | 1,113 (14.5%) |
| $25,000 to $49,999 | 9,364 (86.5%) | 1,462 (13.5%) |
| $50,000 to $74,999 | 7,548 (83.8%) | 1,463 (16.2%) |
| $75,000 to $99,999 | 8,800 (87.9%) | 1,213 (12.1%) |
| $100,000 and over | 26,155 (93.7%) | 1,759 (6.3%) |
Public vs Private Health Insurance Coverage by Age in Delray Beach
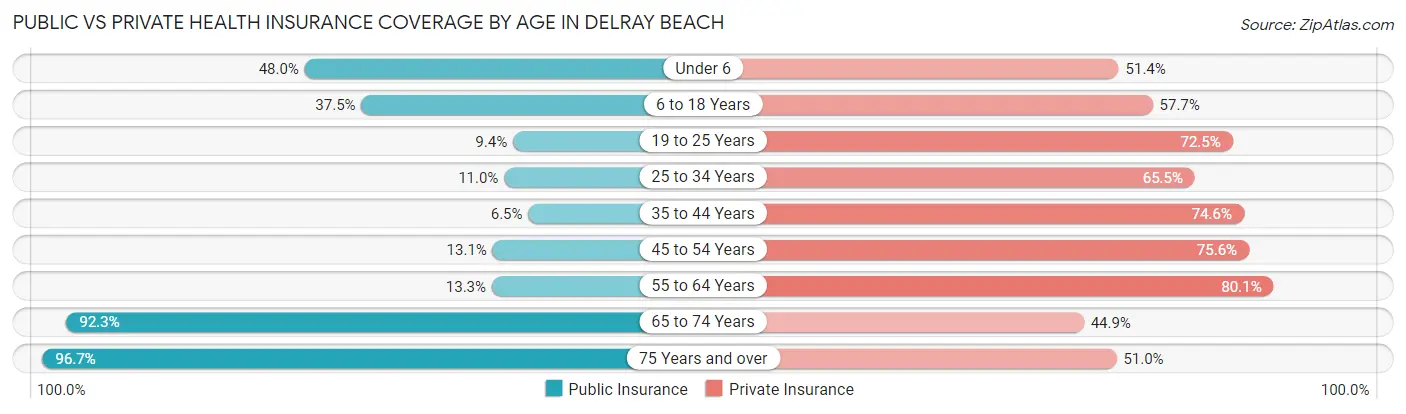
| Age Bracket | Public Insurance | Private Insurance |
| Under 6 | 1,796 (48.0%) | 1,922 (51.4%) |
| 6 to 18 Years | 2,024 (37.5%) | 3,115 (57.7%) |
| 19 to 25 Years | 482 (9.3%) | 3,739 (72.5%) |
| 25 to 34 Years | 907 (11.0%) | 5,411 (65.5%) |
| 35 to 44 Years | 459 (6.5%) | 5,273 (74.6%) |
| 45 to 54 Years | 937 (13.1%) | 5,395 (75.6%) |
| 55 to 64 Years | 1,523 (13.3%) | 9,197 (80.1%) |
| 65 to 74 Years | 8,533 (92.3%) | 4,153 (44.9%) |
| 75 Years and over | 8,322 (96.7%) | 4,388 (51.0%) |
| Total | 24,983 (37.8%) | 42,593 (64.4%) |
Disability Status by Sex by Age in Delray Beach
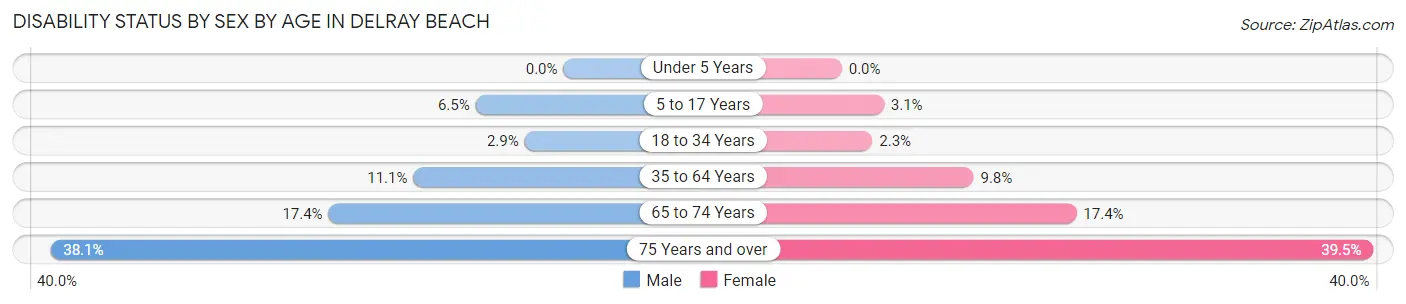
| Age Bracket | Male | Female |
| Under 5 Years | 0 (0.0%) | 0 (0.0%) |
| 5 to 17 Years | 176 (6.5%) | 96 (3.1%) |
| 18 to 34 Years | 200 (2.9%) | 155 (2.3%) |
| 35 to 64 Years | 1,407 (11.1%) | 1,277 (9.8%) |
| 65 to 74 Years | 823 (17.4%) | 789 (17.4%) |
| 75 Years and over | 1,342 (38.1%) | 2,006 (39.5%) |
Disability Class by Sex by Age in Delray Beach
Disability Class: Hearing Difficulty
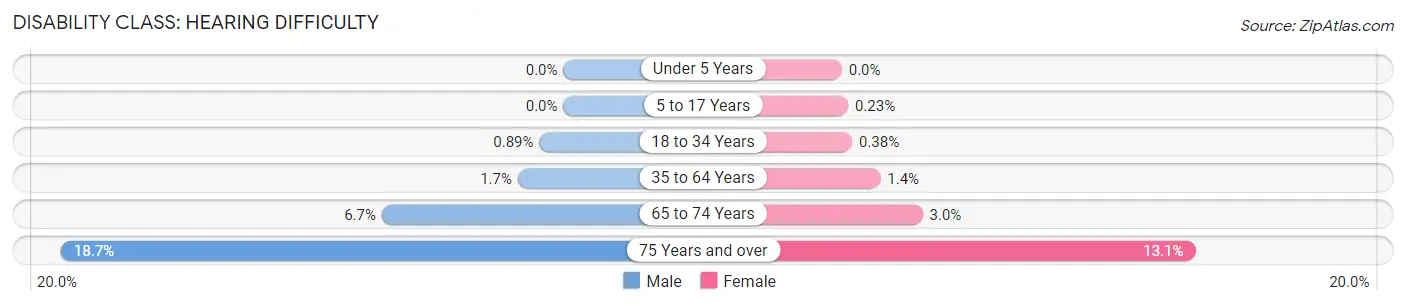
| Age Bracket | Male | Female |
| Under 5 Years | 0 (0.0%) | 0 (0.0%) |
| 5 to 17 Years | 0 (0.0%) | 7 (0.2%) |
| 18 to 34 Years | 62 (0.9%) | 26 (0.4%) |
| 35 to 64 Years | 213 (1.7%) | 187 (1.4%) |
| 65 to 74 Years | 318 (6.7%) | 136 (3.0%) |
| 75 Years and over | 657 (18.6%) | 667 (13.1%) |
Disability Class: Vision Difficulty
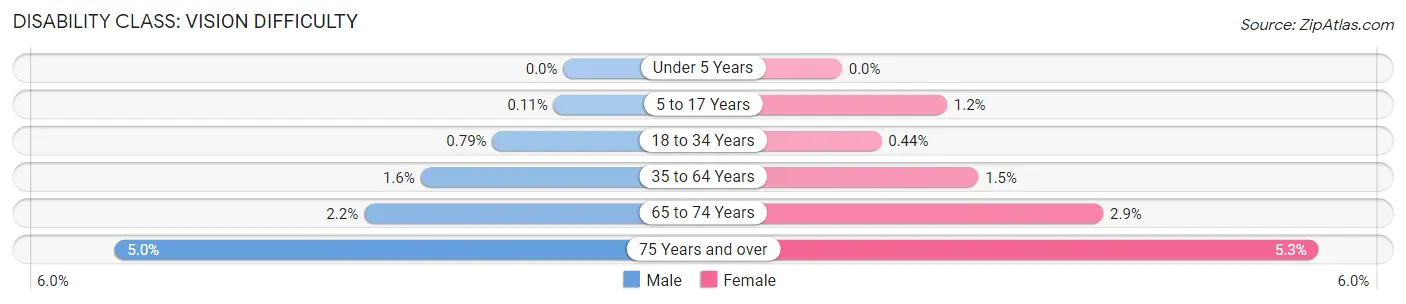
| Age Bracket | Male | Female |
| Under 5 Years | 0 (0.0%) | 0 (0.0%) |
| 5 to 17 Years | 3 (0.1%) | 36 (1.2%) |
| 18 to 34 Years | 55 (0.8%) | 30 (0.4%) |
| 35 to 64 Years | 201 (1.6%) | 199 (1.5%) |
| 65 to 74 Years | 105 (2.2%) | 132 (2.9%) |
| 75 Years and over | 176 (5.0%) | 270 (5.3%) |
Disability Class: Cognitive Difficulty
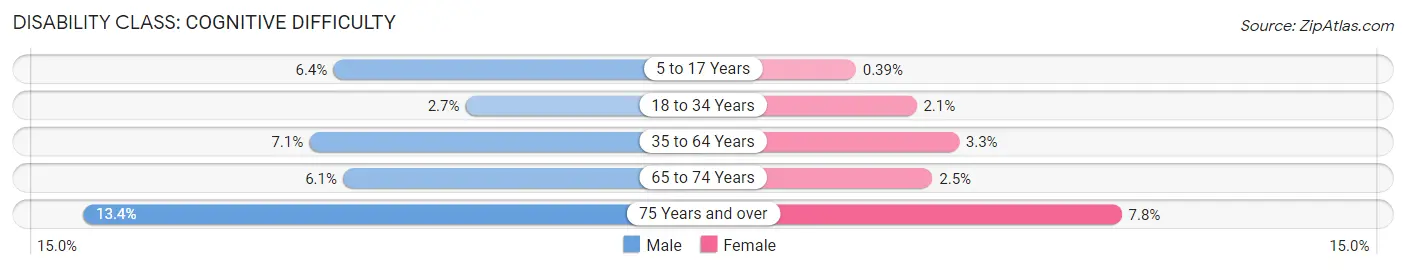
| Age Bracket | Male | Female |
| 5 to 17 Years | 173 (6.4%) | 12 (0.4%) |
| 18 to 34 Years | 190 (2.7%) | 142 (2.1%) |
| 35 to 64 Years | 894 (7.1%) | 425 (3.3%) |
| 65 to 74 Years | 290 (6.1%) | 114 (2.5%) |
| 75 Years and over | 471 (13.4%) | 396 (7.8%) |
Disability Class: Ambulatory Difficulty
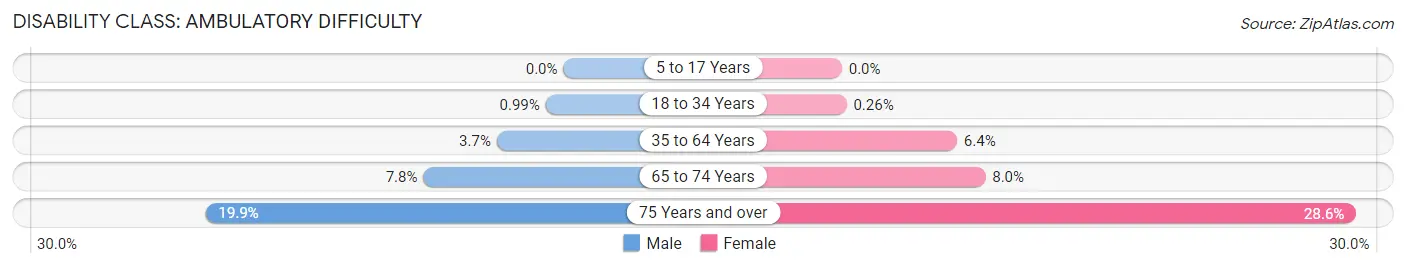
| Age Bracket | Male | Female |
| 5 to 17 Years | 0 (0.0%) | 0 (0.0%) |
| 18 to 34 Years | 69 (1.0%) | 18 (0.3%) |
| 35 to 64 Years | 469 (3.7%) | 837 (6.4%) |
| 65 to 74 Years | 368 (7.8%) | 362 (8.0%) |
| 75 Years and over | 702 (19.9%) | 1,456 (28.6%) |
Disability Class: Self-Care Difficulty
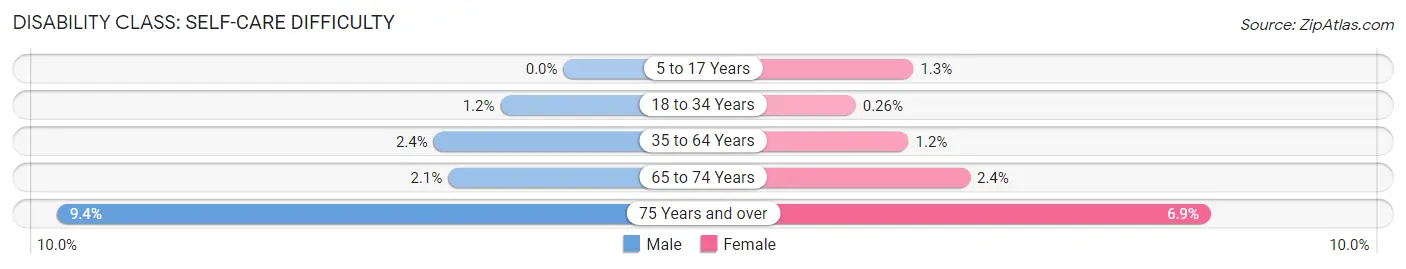
| Age Bracket | Male | Female |
| 5 to 17 Years | 0 (0.0%) | 41 (1.3%) |
| 18 to 34 Years | 81 (1.2%) | 18 (0.3%) |
| 35 to 64 Years | 305 (2.4%) | 162 (1.2%) |
| 65 to 74 Years | 101 (2.1%) | 108 (2.4%) |
| 75 Years and over | 331 (9.4%) | 348 (6.9%) |
Technology Access in Delray Beach
Computing Device Access in Delray Beach
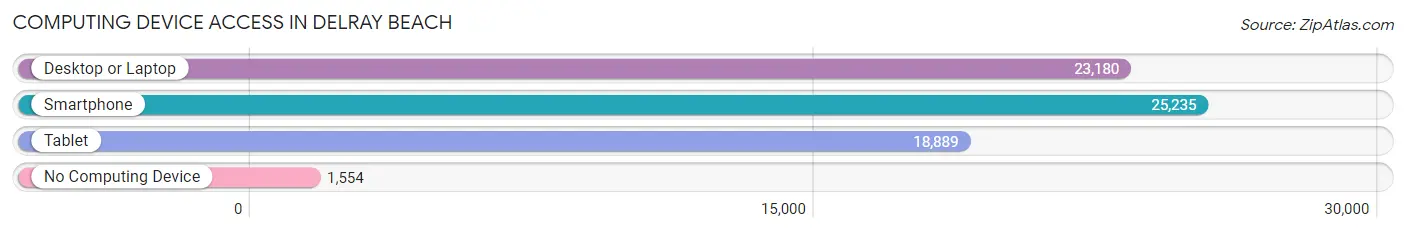
| Device Type | # Households | % Households |
| Desktop or Laptop | 23,180 | 81.1% |
| Smartphone | 25,235 | 88.3% |
| Tablet | 18,889 | 66.1% |
| No Computing Device | 1,554 | 5.4% |
| Total | 28,592 | 100.0% |
Internet Access in Delray Beach
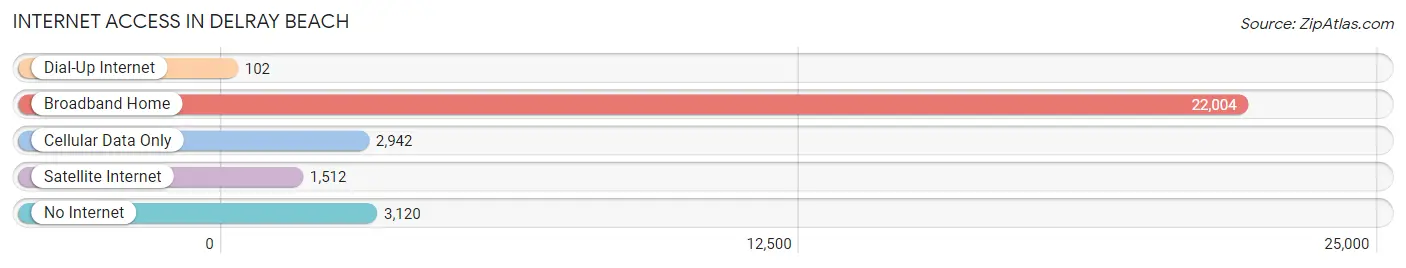
| Internet Type | # Households | % Households |
| Dial-Up Internet | 102 | 0.4% |
| Broadband Home | 22,004 | 77.0% |
| Cellular Data Only | 2,942 | 10.3% |
| Satellite Internet | 1,512 | 5.3% |
| No Internet | 3,120 | 10.9% |
| Total | 28,592 | 100.0% |
Delray Beach Summary
Delray Beach is a city located in Palm Beach County, Florida, United States. It is situated on the Atlantic Ocean, between Boca Raton and Boynton Beach. The city is known for its vibrant downtown area, which is filled with shops, restaurants, and art galleries. It is also home to a number of cultural attractions, including the Morikami Museum and Japanese Gardens, the Cornell Museum of Art and American Culture, and the Spady Cultural Heritage Museum.
History
Delray Beach was originally inhabited by the Tequesta Indians, who lived in the area for thousands of years before the arrival of Europeans. The first Europeans to settle in the area were the Spanish, who established a mission in the area in the late 1700s. The area was later settled by the United States in the early 1800s, and the town of Delray was established in 1894.
The city was named after a Spanish land grant given to Major Nathan S. Boynton, who was one of the first settlers in the area. The city was incorporated in 1911, and it quickly grew in population and size. By the 1920s, Delray Beach had become a popular tourist destination, and it was known for its beautiful beaches and resorts.
Geography
Delray Beach is located in southeastern Florida, on the Atlantic Ocean. It is situated between Boca Raton and Boynton Beach, and it is about 30 miles north of Miami. The city covers an area of 16.3 square miles, and it has a population of 68,749 people, according to the 2020 U.S. Census.
The city is divided into several distinct neighborhoods, including the Downtown District, the Beach District, and the West Atlantic Avenue District. The city is also home to several parks, including the Delray Beach Tennis Center, the Delray Beach Golf Club, and the Delray Beach Nature Center.
Economy
Delray Beach has a diverse economy, with a variety of industries represented. The city is home to a number of corporate headquarters, including Office Depot, ADT Security Services, and the Delray Beach Medical Center. The city is also home to a number of small businesses, including restaurants, retail stores, and art galleries.
The city is also home to a number of educational institutions, including the Atlantic Technical College, the Delray Beach Public Library, and the Delray Beach Historical Society. The city is also home to a number of cultural attractions, including the Morikami Museum and Japanese Gardens, the Cornell Museum of Art and American Culture, and the Spady Cultural Heritage Museum.
Demographics
According to the 2020 U.S. Census, Delray Beach has a population of 68,749 people. The city has a median age of 44.7 years, and the median household income is $54,945. The city is majority white (63.2%), followed by African American (20.2%), Hispanic (9.3%), and Asian (4.2%).
Delray Beach is a diverse city, with a variety of cultures and backgrounds represented. The city is home to a number of religious institutions, including churches, synagogues, and mosques. The city is also home to a number of festivals and events, including the Delray Beach Garlic Fest, the Delray Beach Arts Festival, and the Delray Beach Music Festival.
Common Questions
What is Per Capita Income in Delray Beach?
Per Capita income in Delray Beach is $52,879.
What is the Median Family Income in Delray Beach?
Median Family Income in Delray Beach is $91,111.
What is the Median Household income in Delray Beach?
Median Household Income in Delray Beach is $76,558.
What is Income or Wage Gap in Delray Beach?
Income or Wage Gap in Delray Beach is 24.9%.
Women in Delray Beach earn 75.1 cents for every dollar earned by a man.
What is Family Income Deficit in Delray Beach?
Family Income Deficit in Delray Beach is $9,028.
Families that are below poverty line in Delray Beach earn $9,028 less on average than the poverty threshold level.
What is Inequality or Gini Index in Delray Beach?
Inequality or Gini Index in Delray Beach is 0.53.
What is the Total Population of Delray Beach?
Total Population of Delray Beach is 66,646.
What is the Total Male Population of Delray Beach?
Total Male Population of Delray Beach is 32,056.
What is the Total Female Population of Delray Beach?
Total Female Population of Delray Beach is 34,590.
What is the Ratio of Males per 100 Females in Delray Beach?
There are 92.67 Males per 100 Females in Delray Beach.
What is the Ratio of Females per 100 Males in Delray Beach?
There are 107.90 Females per 100 Males in Delray Beach.
What is the Median Population Age in Delray Beach?
Median Population Age in Delray Beach is 50.7 Years.
What is the Average Family Size in Delray Beach
Average Family Size in Delray Beach is 3.1 People.
What is the Average Household Size in Delray Beach
Average Household Size in Delray Beach is 2.3 People.
How Large is the Labor Force in Delray Beach?
There are 35,455 People in the Labor Forcein in Delray Beach.
What is the Percentage of People in the Labor Force in Delray Beach?
60.4% of People are in the Labor Force in Delray Beach.
What is the Unemployment Rate in Delray Beach?
Unemployment Rate in Delray Beach is 5.8%.