Lauderhill, FL Map & Demographics
Lauderhill Map
Lauderhill Overview
$24,883
PER CAPITA INCOME
$60,005
AVG FAMILY INCOME
$48,523
AVG HOUSEHOLD INCOME
5.6%
WAGE / INCOME GAP [ % ]
94.4¢/ $1
WAGE / INCOME GAP [ $ ]
$10,829
FAMILY INCOME DEFICIT
0.44
INEQUALITY / GINI INDEX
73,987
TOTAL POPULATION
34,723
MALE POPULATION
39,264
FEMALE POPULATION
88.43
MALES / 100 FEMALES
113.08
FEMALES / 100 MALES
37.0
MEDIAN AGE
3.5
AVG FAMILY SIZE
2.8
AVG HOUSEHOLD SIZE
37,096
LABOR FORCE [ PEOPLE ]
65.7%
PERCENT IN LABOR FORCE
8.6%
UNEMPLOYMENT RATE
Lauderhill Area Codes
Income in Lauderhill
Income Overview in Lauderhill
Per Capita Income in Lauderhill is $24,883, while median incomes of families and households are $60,005 and $48,523 respectively.
| Characteristic | Number | Measure |
| Per Capita Income | 73,987 | $24,883 |
| Median Family Income | 17,357 | $60,005 |
| Mean Family Income | 17,357 | $74,920 |
| Median Household Income | 26,464 | $48,523 |
| Mean Household Income | 26,464 | $65,990 |
| Income Deficit | 17,357 | $10,829 |
| Wage / Income Gap (%) | 73,987 | 5.63% |
| Wage / Income Gap ($) | 73,987 | 94.37¢ per $1 |
| Gini / Inequality Index | 73,987 | 0.44 |
Earnings by Sex in Lauderhill
Average Earnings in Lauderhill are $32,923, $33,735 for men and $31,835 for women, a difference of 5.6%.

| Sex | Number | Average Earnings |
| Male | 17,582 (47.2%) | $33,735 |
| Female | 19,640 (52.8%) | $31,835 |
| Total | 37,222 (100.0%) | $32,923 |
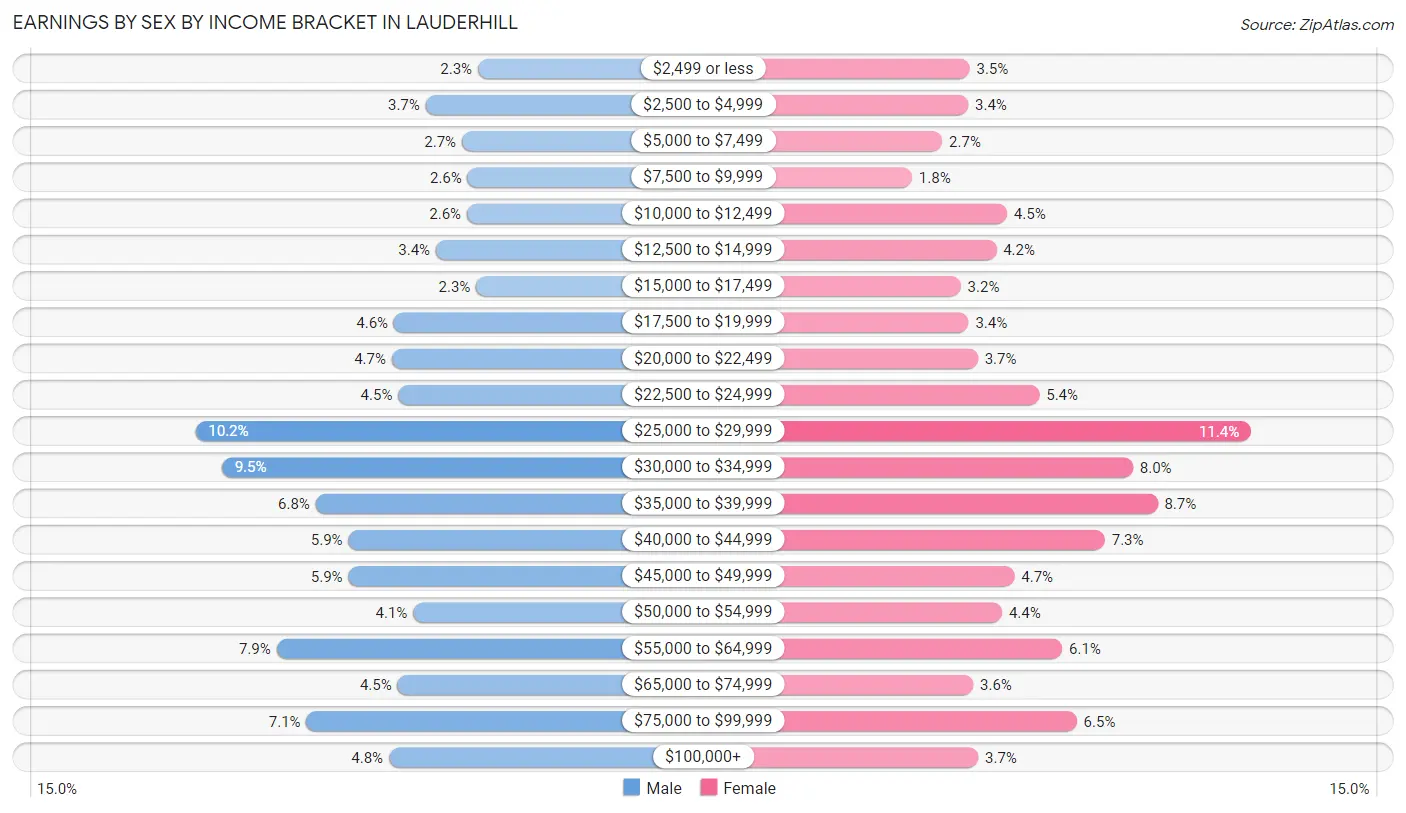
Earnings by Sex by Income Bracket in Lauderhill
The most common earnings brackets in Lauderhill are $25,000 to $29,999 for men (1,794 | 10.2%) and $25,000 to $29,999 for women (2,231 | 11.4%).
| Income | Male | Female |
| $2,499 or less | 397 (2.3%) | 678 (3.5%) |
| $2,500 to $4,999 | 655 (3.7%) | 669 (3.4%) |
| $5,000 to $7,499 | 477 (2.7%) | 527 (2.7%) |
| $7,500 to $9,999 | 448 (2.5%) | 360 (1.8%) |
| $10,000 to $12,499 | 451 (2.6%) | 884 (4.5%) |
| $12,500 to $14,999 | 605 (3.4%) | 824 (4.2%) |
| $15,000 to $17,499 | 407 (2.3%) | 629 (3.2%) |
| $17,500 to $19,999 | 813 (4.6%) | 672 (3.4%) |
| $20,000 to $22,499 | 822 (4.7%) | 723 (3.7%) |
| $22,500 to $24,999 | 791 (4.5%) | 1,063 (5.4%) |
| $25,000 to $29,999 | 1,794 (10.2%) | 2,231 (11.4%) |
| $30,000 to $34,999 | 1,663 (9.5%) | 1,580 (8.0%) |
| $35,000 to $39,999 | 1,199 (6.8%) | 1,714 (8.7%) |
| $40,000 to $44,999 | 1,038 (5.9%) | 1,424 (7.2%) |
| $45,000 to $49,999 | 1,037 (5.9%) | 926 (4.7%) |
| $50,000 to $54,999 | 718 (4.1%) | 857 (4.4%) |
| $55,000 to $64,999 | 1,392 (7.9%) | 1,188 (6.0%) |
| $65,000 to $74,999 | 794 (4.5%) | 698 (3.5%) |
| $75,000 to $99,999 | 1,244 (7.1%) | 1,268 (6.5%) |
| $100,000+ | 837 (4.8%) | 725 (3.7%) |
| Total | 17,582 (100.0%) | 19,640 (100.0%) |
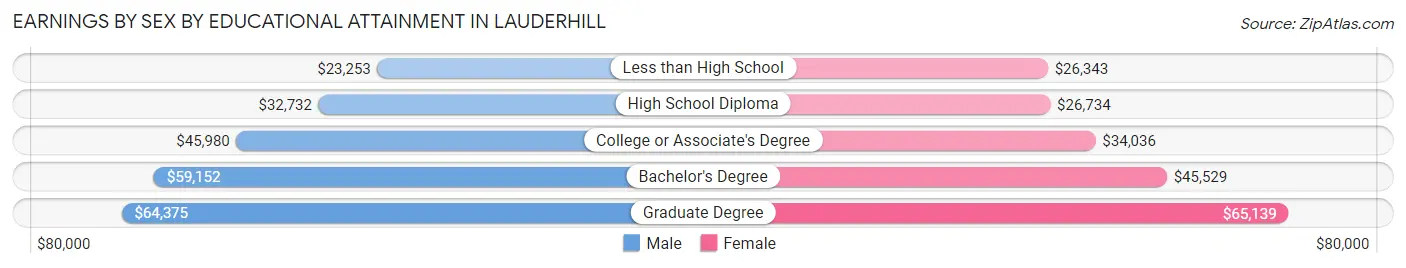
Earnings by Sex by Educational Attainment in Lauderhill
Average earnings in Lauderhill are $36,001 for men and $34,598 for women, a difference of 3.9%. Men with an educational attainment of graduate degree enjoy the highest average annual earnings of $64,375, while those with less than high school education earn the least with $23,253. Women with an educational attainment of graduate degree earn the most with the average annual earnings of $65,139, while those with less than high school education have the smallest earnings of $26,343.
| Educational Attainment | Male Income | Female Income |
| Less than High School | $23,253 | $26,343 |
| High School Diploma | $32,732 | $26,734 |
| College or Associate's Degree | $45,980 | $34,036 |
| Bachelor's Degree | $59,152 | $45,529 |
| Graduate Degree | $64,375 | $65,139 |
| Total | $36,001 | $34,598 |
Family Income in Lauderhill
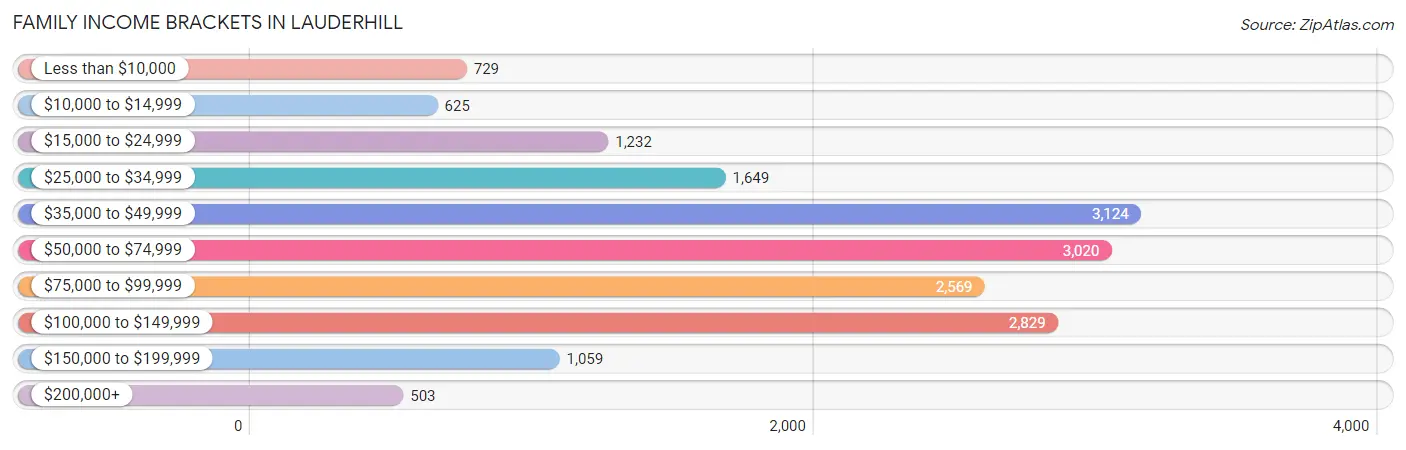
Family Income Brackets in Lauderhill
According to the Lauderhill family income data, there are 3,124 families falling into the $35,000 to $49,999 income range, which is the most common income bracket and makes up 18.0% of all families. Conversely, the $200,000+ income bracket is the least frequent group with only 503 families (2.9%) belonging to this category.
| Income Bracket | # Families | % Families |
| Less than $10,000 | 729 | 4.2% |
| $10,000 to $14,999 | 625 | 3.6% |
| $15,000 to $24,999 | 1,232 | 7.1% |
| $25,000 to $34,999 | 1,649 | 9.5% |
| $35,000 to $49,999 | 3,124 | 18.0% |
| $50,000 to $74,999 | 3,020 | 17.4% |
| $75,000 to $99,999 | 2,569 | 14.8% |
| $100,000 to $149,999 | 2,829 | 16.3% |
| $150,000 to $199,999 | 1,059 | 6.1% |
| $200,000+ | 503 | 2.9% |
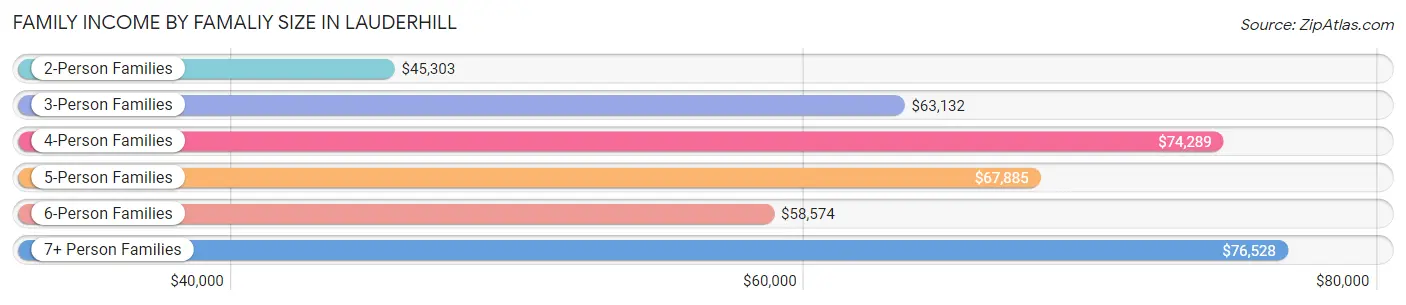
Family Income by Famaliy Size in Lauderhill
7+ person families (285 | 1.6%) account for the highest median family income in Lauderhill with $76,528 per family, while 2-person families (7,637 | 44.0%) have the highest median income of $22,652 per family member.
| Income Bracket | # Families | Median Income |
| 2-Person Families | 7,637 (44.0%) | $45,303 |
| 3-Person Families | 3,788 (21.8%) | $63,132 |
| 4-Person Families | 3,468 (20.0%) | $74,289 |
| 5-Person Families | 1,452 (8.4%) | $67,885 |
| 6-Person Families | 727 (4.2%) | $58,574 |
| 7+ Person Families | 285 (1.6%) | $76,528 |
| Total | 17,357 (100.0%) | $60,005 |
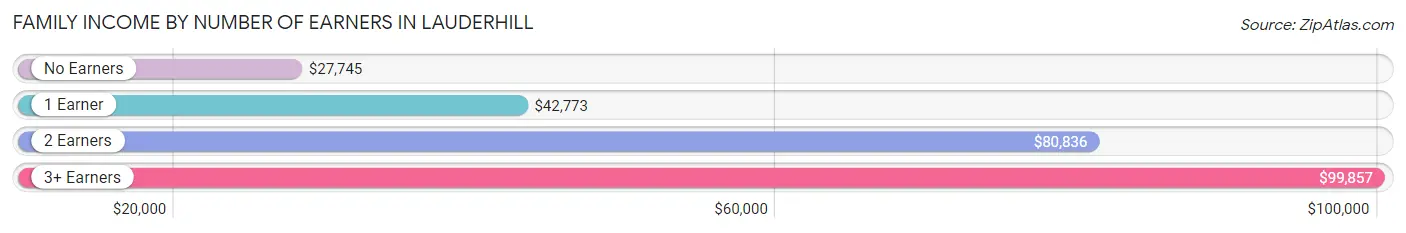
Family Income by Number of Earners in Lauderhill
The median family income in Lauderhill is $60,005, with families comprising 3+ earners (2,479) having the highest median family income of $99,857, while families with no earners (2,414) have the lowest median family income of $27,745, accounting for 14.3% and 13.9% of families, respectively.
| Number of Earners | # Families | Median Income |
| No Earners | 2,414 (13.9%) | $27,745 |
| 1 Earner | 6,513 (37.5%) | $42,773 |
| 2 Earners | 5,951 (34.3%) | $80,836 |
| 3+ Earners | 2,479 (14.3%) | $99,857 |
| Total | 17,357 (100.0%) | $60,005 |
Household Income in Lauderhill
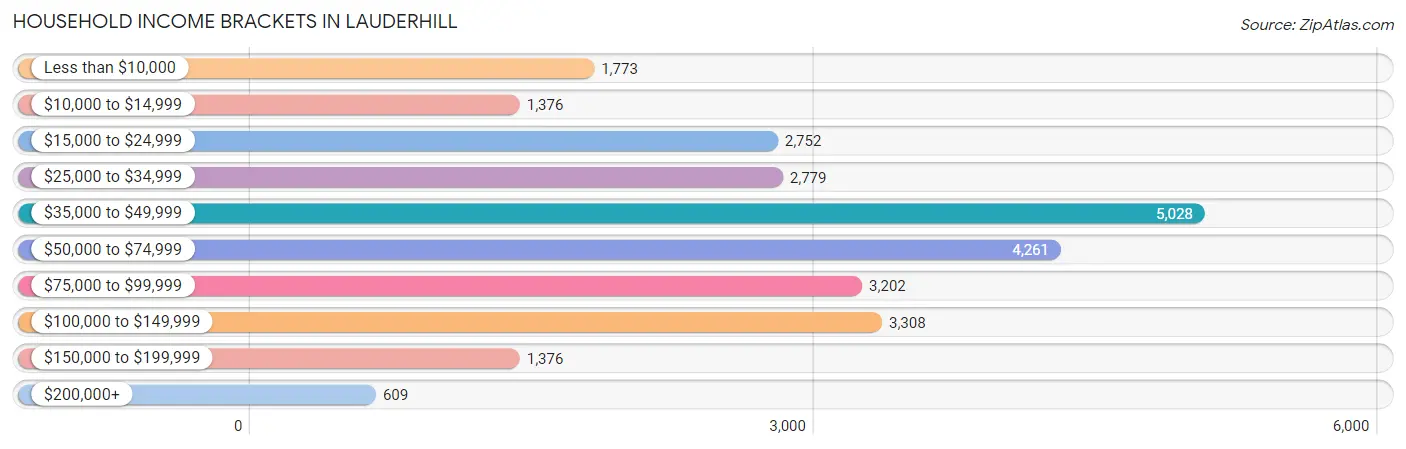
Household Income Brackets in Lauderhill
With 5,028 households falling in the category, the $35,000 to $49,999 income range is the most frequent in Lauderhill, accounting for 19.0% of all households. In contrast, only 609 households (2.3%) fall into the $200,000+ income bracket, making it the least populous group.
| Income Bracket | # Households | % Households |
| Less than $10,000 | 1,773 | 6.7% |
| $10,000 to $14,999 | 1,376 | 5.2% |
| $15,000 to $24,999 | 2,752 | 10.4% |
| $25,000 to $34,999 | 2,779 | 10.5% |
| $35,000 to $49,999 | 5,028 | 19.0% |
| $50,000 to $74,999 | 4,261 | 16.1% |
| $75,000 to $99,999 | 3,202 | 12.1% |
| $100,000 to $149,999 | 3,308 | 12.5% |
| $150,000 to $199,999 | 1,376 | 5.2% |
| $200,000+ | 609 | 2.3% |
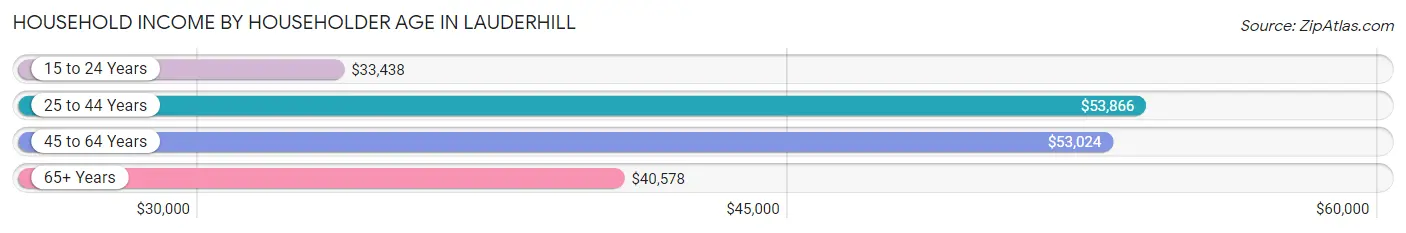
Household Income by Householder Age in Lauderhill
The median household income in Lauderhill is $48,523, with the highest median household income of $53,866 found in the 25 to 44 years age bracket for the primary householder. A total of 8,086 households (30.5%) fall into this category. Meanwhile, the 15 to 24 years age bracket for the primary householder has the lowest median household income of $33,438, with 491 households (1.9%) in this group.
| Income Bracket | # Households | Median Income |
| 15 to 24 Years | 491 (1.9%) | $33,438 |
| 25 to 44 Years | 8,086 (30.5%) | $53,866 |
| 45 to 64 Years | 10,773 (40.7%) | $53,024 |
| 65+ Years | 7,114 (26.9%) | $40,578 |
| Total | 26,464 (100.0%) | $48,523 |
Poverty in Lauderhill
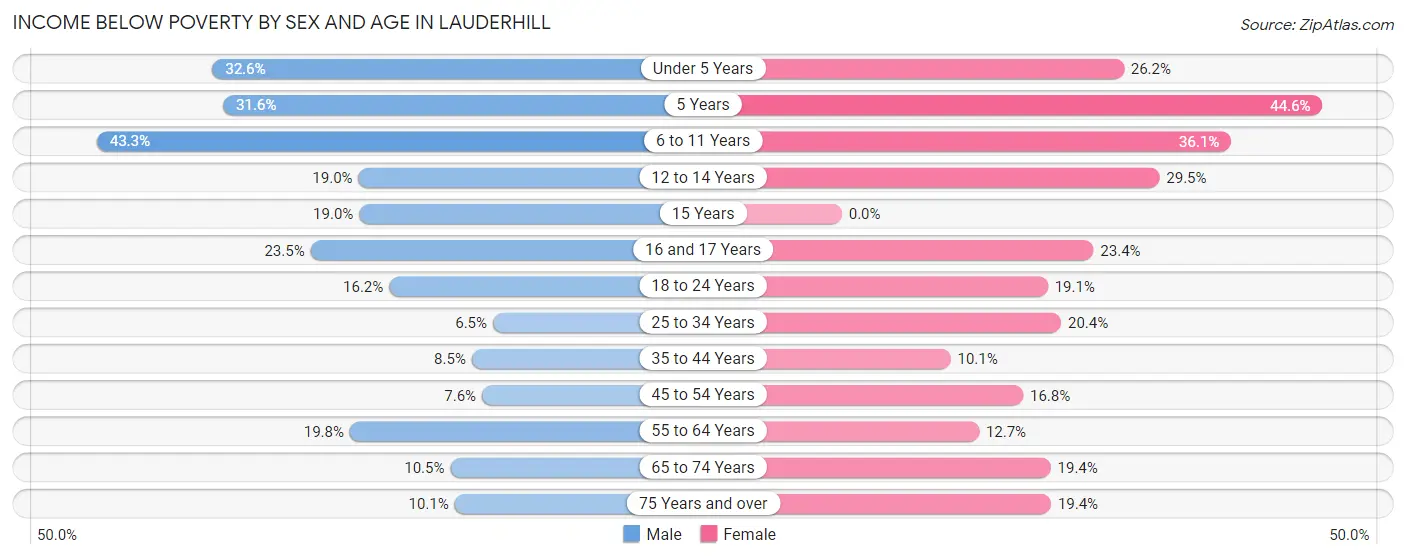
Income Below Poverty by Sex and Age in Lauderhill
With 17.4% poverty level for males and 19.7% for females among the residents of Lauderhill, 6 to 11 year old males and 5 year old females are the most vulnerable to poverty, with 1,492 males (43.3%) and 186 females (44.6%) in their respective age groups living below the poverty level.
| Age Bracket | Male | Female |
| Under 5 Years | 876 (32.6%) | 685 (26.2%) |
| 5 Years | 252 (31.6%) | 186 (44.6%) |
| 6 to 11 Years | 1,492 (43.3%) | 1,250 (36.1%) |
| 12 to 14 Years | 358 (19.0%) | 437 (29.5%) |
| 15 Years | 72 (19.0%) | 0 (0.0%) |
| 16 and 17 Years | 199 (23.5%) | 166 (23.4%) |
| 18 to 24 Years | 462 (16.2%) | 501 (19.1%) |
| 25 to 34 Years | 322 (6.5%) | 1,142 (20.3%) |
| 35 to 44 Years | 331 (8.5%) | 513 (10.1%) |
| 45 to 54 Years | 281 (7.6%) | 899 (16.8%) |
| 55 to 64 Years | 911 (19.8%) | 618 (12.7%) |
| 65 to 74 Years | 300 (10.5%) | 695 (19.4%) |
| 75 Years and over | 171 (10.1%) | 554 (19.4%) |
| Total | 6,027 (17.4%) | 7,646 (19.7%) |
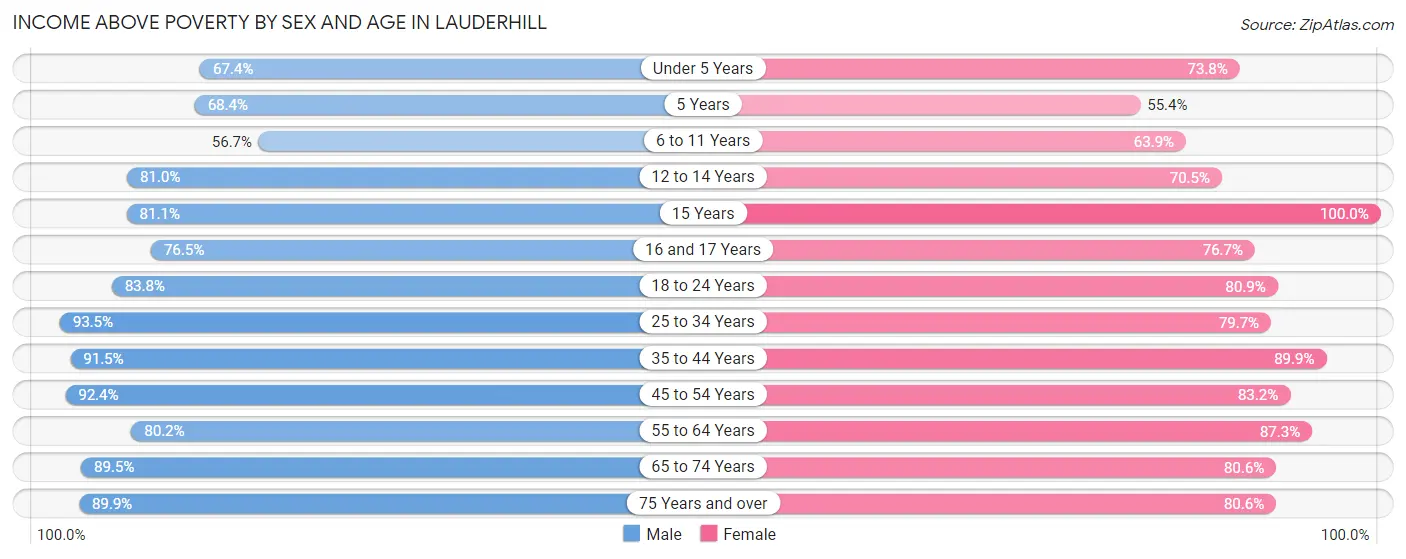
Income Above Poverty by Sex and Age in Lauderhill
According to the poverty statistics in Lauderhill, males aged 25 to 34 years and females aged 15 years are the age groups that are most secure financially, with 93.5% of males and 100.0% of females in these age groups living above the poverty line.
| Age Bracket | Male | Female |
| Under 5 Years | 1,813 (67.4%) | 1,933 (73.8%) |
| 5 Years | 546 (68.4%) | 231 (55.4%) |
| 6 to 11 Years | 1,954 (56.7%) | 2,210 (63.9%) |
| 12 to 14 Years | 1,524 (81.0%) | 1,046 (70.5%) |
| 15 Years | 308 (81.0%) | 268 (100.0%) |
| 16 and 17 Years | 649 (76.5%) | 545 (76.6%) |
| 18 to 24 Years | 2,395 (83.8%) | 2,121 (80.9%) |
| 25 to 34 Years | 4,603 (93.5%) | 4,470 (79.6%) |
| 35 to 44 Years | 3,564 (91.5%) | 4,571 (89.9%) |
| 45 to 54 Years | 3,436 (92.4%) | 4,445 (83.2%) |
| 55 to 64 Years | 3,686 (80.2%) | 4,236 (87.3%) |
| 65 to 74 Years | 2,559 (89.5%) | 2,891 (80.6%) |
| 75 Years and over | 1,523 (89.9%) | 2,300 (80.6%) |
| Total | 28,560 (82.6%) | 31,267 (80.3%) |
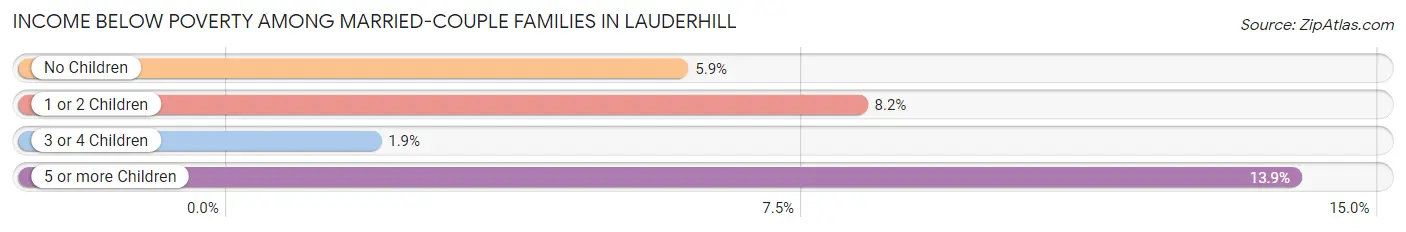
Income Below Poverty Among Married-Couple Families in Lauderhill
The poverty statistics for married-couple families in Lauderhill show that 6.4% or 549 of the total 8,573 families live below the poverty line. Families with 5 or more children have the highest poverty rate of 13.9%, comprising of 5 families. On the other hand, families with 3 or 4 children have the lowest poverty rate of 1.9%, which includes 11 families.
| Children | Above Poverty | Below Poverty |
| No Children | 4,837 (94.1%) | 302 (5.9%) |
| 1 or 2 Children | 2,578 (91.8%) | 231 (8.2%) |
| 3 or 4 Children | 578 (98.1%) | 11 (1.9%) |
| 5 or more Children | 31 (86.1%) | 5 (13.9%) |
| Total | 8,024 (93.6%) | 549 (6.4%) |
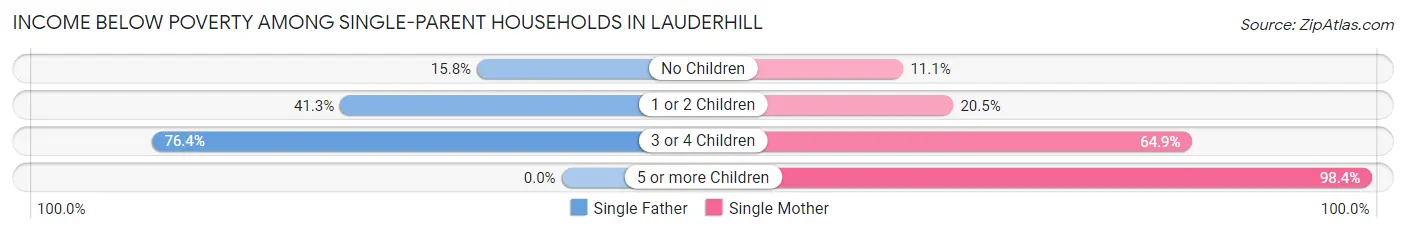
Income Below Poverty Among Single-Parent Households in Lauderhill
According to the poverty data in Lauderhill, 29.5% or 430 single-father households and 23.1% or 1,690 single-mother households are living below the poverty line. Among single-father households, those with 3 or 4 children have the highest poverty rate, with 84 households (76.4%) experiencing poverty. Likewise, among single-mother households, those with 5 or more children have the highest poverty rate, with 184 households (98.4%) falling below the poverty line.
| Children | Single Father | Single Mother |
| No Children | 129 (15.8%) | 327 (11.1%) |
| 1 or 2 Children | 217 (41.2%) | 714 (20.4%) |
| 3 or 4 Children | 84 (76.4%) | 465 (64.9%) |
| 5 or more Children | 0 (0.0%) | 184 (98.4%) |
| Total | 430 (29.5%) | 1,690 (23.1%) |
Income Below Poverty Among Married-Couple vs Single-Parent Households in Lauderhill
The poverty data for Lauderhill shows that 549 of the married-couple family households (6.4%) and 2,120 of the single-parent households (24.1%) are living below the poverty level. Within the married-couple family households, those with 5 or more children have the highest poverty rate, with 5 households (13.9%) falling below the poverty line. Among the single-parent households, those with 5 or more children have the highest poverty rate, with 184 household (98.4%) living below poverty.
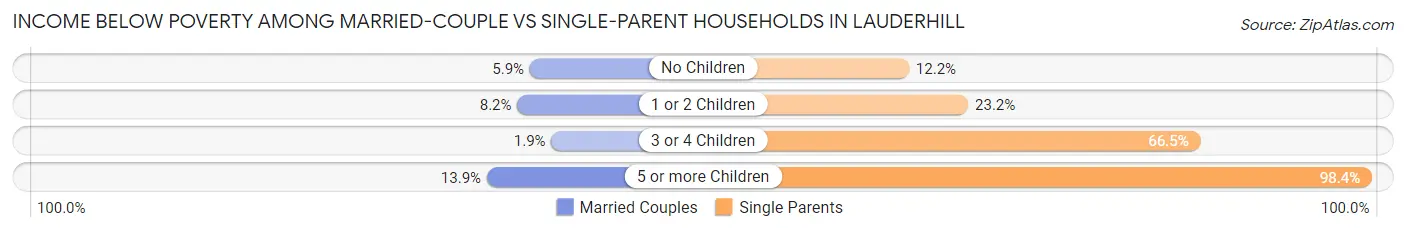
| Children | Married-Couple Families | Single-Parent Households |
| No Children | 302 (5.9%) | 456 (12.1%) |
| 1 or 2 Children | 231 (8.2%) | 931 (23.2%) |
| 3 or 4 Children | 11 (1.9%) | 549 (66.5%) |
| 5 or more Children | 5 (13.9%) | 184 (98.4%) |
| Total | 549 (6.4%) | 2,120 (24.1%) |
Race in Lauderhill
The most populous races in Lauderhill are Black / African American (58,670 | 79.3%), White / Caucasian (7,761 | 10.5%), and Hispanic or Latino (6,362 | 8.6%).
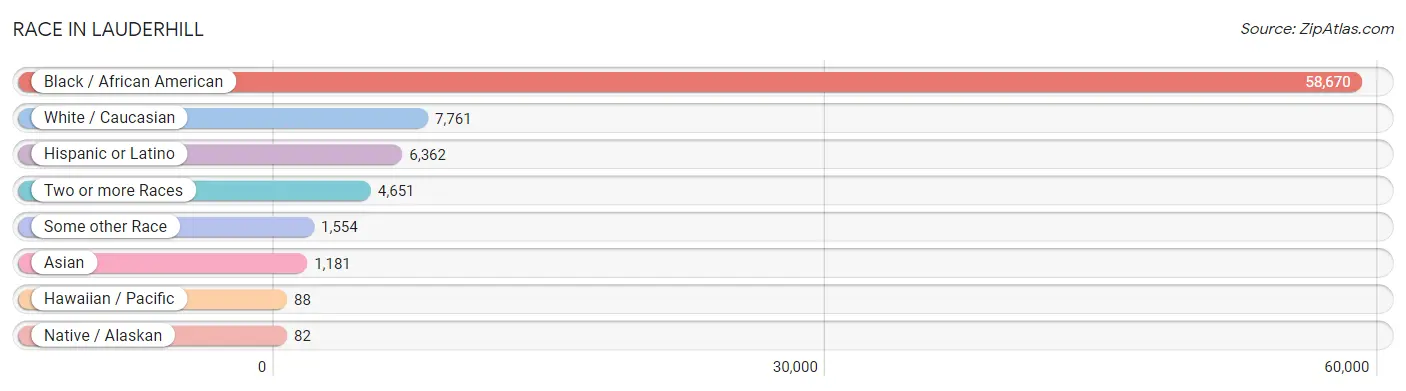
| Race | # Population | % Population |
| Asian | 1,181 | 1.6% |
| Black / African American | 58,670 | 79.3% |
| Hawaiian / Pacific | 88 | 0.1% |
| Hispanic or Latino | 6,362 | 8.6% |
| Native / Alaskan | 82 | 0.1% |
| White / Caucasian | 7,761 | 10.5% |
| Two or more Races | 4,651 | 6.3% |
| Some other Race | 1,554 | 2.1% |
| Total | 73,987 | 100.0% |
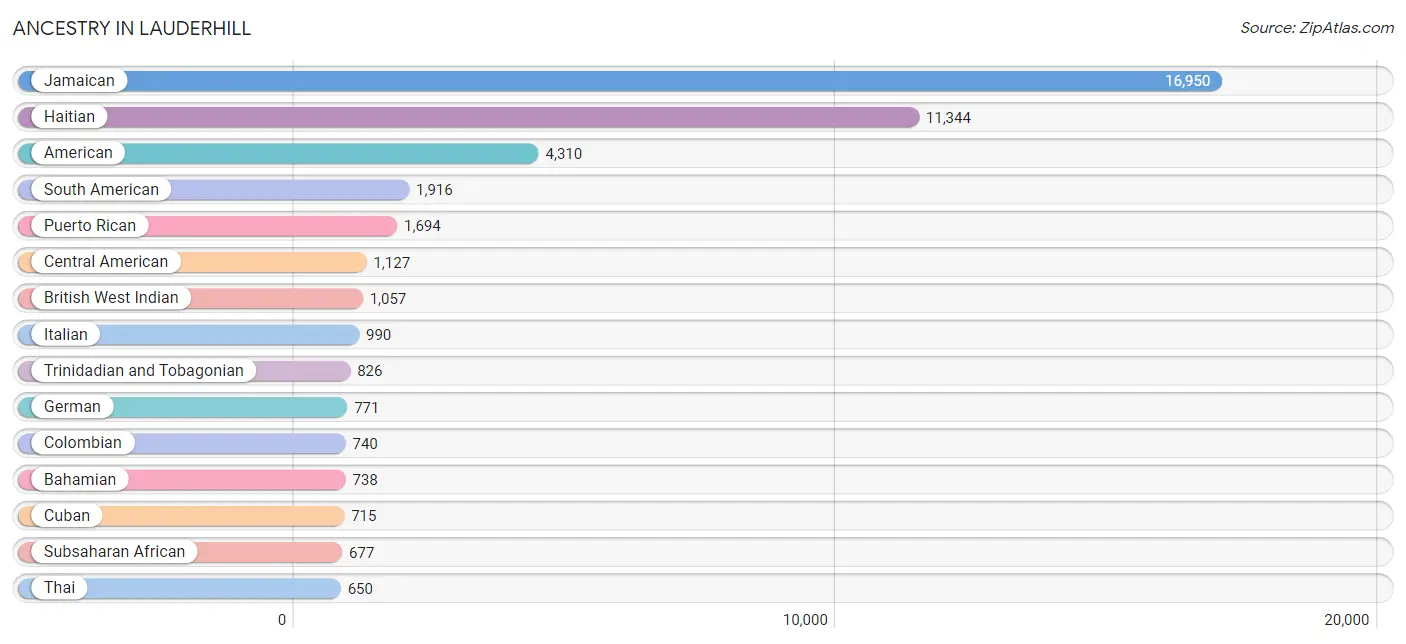
Ancestry in Lauderhill
The most populous ancestries reported in Lauderhill are Jamaican (16,950 | 22.9%), Haitian (11,344 | 15.3%), American (4,310 | 5.8%), South American (1,916 | 2.6%), and Puerto Rican (1,694 | 2.3%), together accounting for 48.9% of all Lauderhill residents.
| Ancestry | # Population | % Population |
| African | 515 | 0.7% |
| American | 4,310 | 5.8% |
| Arab | 54 | 0.1% |
| Argentinean | 232 | 0.3% |
| Armenian | 17 | 0.0% |
| Austrian | 22 | 0.0% |
| Bahamian | 738 | 1.0% |
| Barbadian | 232 | 0.3% |
| Belgian | 16 | 0.0% |
| Belizean | 66 | 0.1% |
| Bhutanese | 23 | 0.0% |
| Blackfeet | 9 | 0.0% |
| Brazilian | 25 | 0.0% |
| British | 25 | 0.0% |
| British West Indian | 1,057 | 1.4% |
| Burmese | 76 | 0.1% |
| Canadian | 149 | 0.2% |
| Central American | 1,127 | 1.5% |
| Central American Indian | 68 | 0.1% |
| Cherokee | 37 | 0.1% |
| Colombian | 740 | 1.0% |
| Costa Rican | 116 | 0.2% |
| Creek | 18 | 0.0% |
| Croatian | 15 | 0.0% |
| Cuban | 715 | 1.0% |
| Czech | 10 | 0.0% |
| Dominican | 180 | 0.2% |
| Dutch | 49 | 0.1% |
| Eastern European | 93 | 0.1% |
| Ecuadorian | 23 | 0.0% |
| English | 414 | 0.6% |
| European | 381 | 0.5% |
| Filipino | 23 | 0.0% |
| French | 170 | 0.2% |
| French American Indian | 5 | 0.0% |
| French Canadian | 177 | 0.2% |
| German | 771 | 1.0% |
| Greek | 79 | 0.1% |
| Guatemalan | 43 | 0.1% |
| Guyanese | 155 | 0.2% |
| Haitian | 11,344 | 15.3% |
| Honduran | 402 | 0.5% |
| Hungarian | 83 | 0.1% |
| Indian (Asian) | 460 | 0.6% |
| Iranian | 21 | 0.0% |
| Irish | 322 | 0.4% |
| Iroquois | 39 | 0.1% |
| Israeli | 87 | 0.1% |
| Italian | 990 | 1.3% |
| Jamaican | 16,950 | 22.9% |
| Korean | 111 | 0.2% |
| Latvian | 8 | 0.0% |
| Lebanese | 7 | 0.0% |
| Lithuanian | 49 | 0.1% |
| Mexican | 258 | 0.4% |
| Moroccan | 5 | 0.0% |
| Nicaraguan | 39 | 0.1% |
| Nigerian | 99 | 0.1% |
| Norwegian | 130 | 0.2% |
| Panamanian | 16 | 0.0% |
| Peruvian | 434 | 0.6% |
| Polish | 386 | 0.5% |
| Portuguese | 47 | 0.1% |
| Puerto Rican | 1,694 | 2.3% |
| Russian | 286 | 0.4% |
| Salvadoran | 511 | 0.7% |
| Scotch-Irish | 52 | 0.1% |
| Scottish | 109 | 0.2% |
| Serbian | 9 | 0.0% |
| Slavic | 12 | 0.0% |
| South American | 1,916 | 2.6% |
| South American Indian | 26 | 0.0% |
| Spaniard | 70 | 0.1% |
| Spanish | 10 | 0.0% |
| Sri Lankan | 64 | 0.1% |
| Subsaharan African | 677 | 0.9% |
| Swedish | 17 | 0.0% |
| Syrian | 49 | 0.1% |
| Thai | 650 | 0.9% |
| Tlingit-Haida | 36 | 0.1% |
| Trinidadian and Tobagonian | 826 | 1.1% |
| U.S. Virgin Islander | 615 | 0.8% |
| Ukrainian | 95 | 0.1% |
| Uruguayan | 11 | 0.0% |
| Venezuelan | 476 | 0.6% |
| Vietnamese | 86 | 0.1% |
| Welsh | 71 | 0.1% |
| West Indian | 202 | 0.3% | View All 88 Rows |
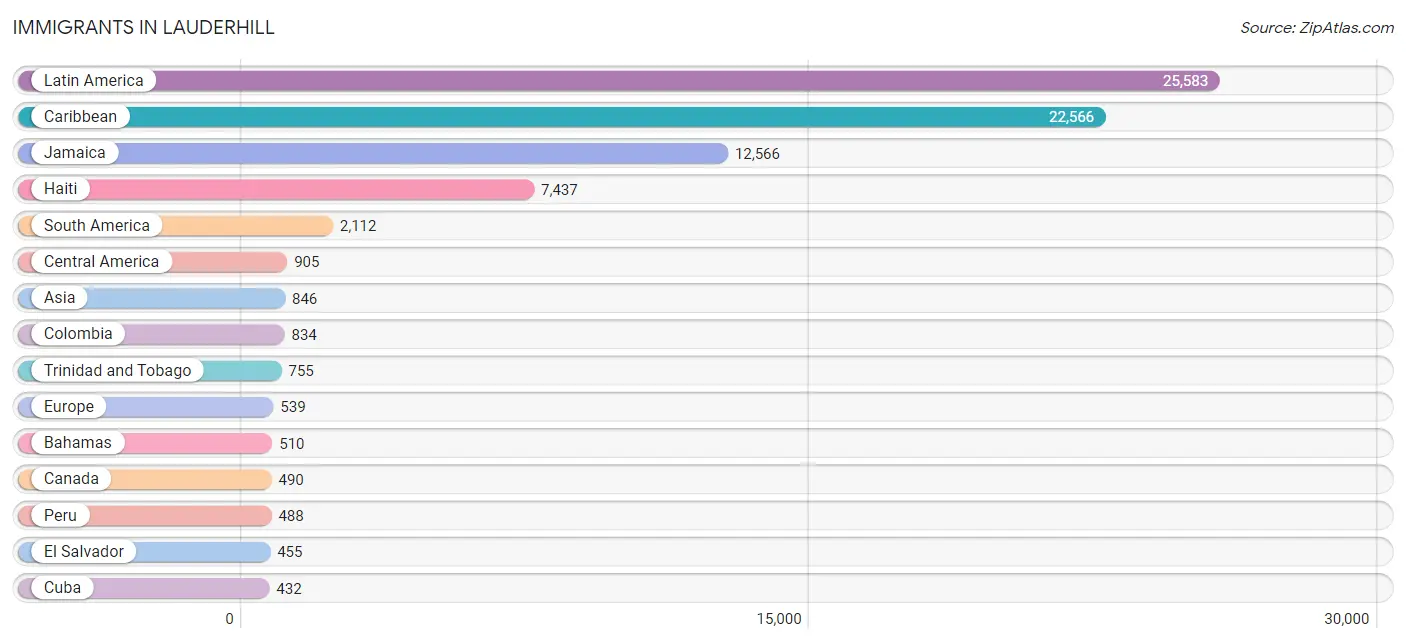
Immigrants in Lauderhill
The most numerous immigrant groups reported in Lauderhill came from Latin America (25,583 | 34.6%), Caribbean (22,566 | 30.5%), Jamaica (12,566 | 17.0%), Haiti (7,437 | 10.1%), and South America (2,112 | 2.9%), together accounting for 95.0% of all Lauderhill residents.
| Immigration Origin | # Population | % Population |
| Africa | 113 | 0.2% |
| Argentina | 182 | 0.3% |
| Asia | 846 | 1.1% |
| Bahamas | 510 | 0.7% |
| Bangladesh | 86 | 0.1% |
| Barbados | 62 | 0.1% |
| Belarus | 42 | 0.1% |
| Belize | 37 | 0.1% |
| Brazil | 121 | 0.2% |
| Canada | 490 | 0.7% |
| Caribbean | 22,566 | 30.5% |
| Central America | 905 | 1.2% |
| China | 168 | 0.2% |
| Colombia | 834 | 1.1% |
| Costa Rica | 104 | 0.1% |
| Cuba | 432 | 0.6% |
| Czechoslovakia | 8 | 0.0% |
| Dominica | 250 | 0.3% |
| Dominican Republic | 175 | 0.2% |
| Eastern Asia | 243 | 0.3% |
| Eastern Europe | 207 | 0.3% |
| Ecuador | 21 | 0.0% |
| El Salvador | 455 | 0.6% |
| England | 174 | 0.2% |
| Europe | 539 | 0.7% |
| France | 14 | 0.0% |
| Germany | 76 | 0.1% |
| Guatemala | 17 | 0.0% |
| Guyana | 199 | 0.3% |
| Haiti | 7,437 | 10.1% |
| Honduras | 204 | 0.3% |
| Hong Kong | 6 | 0.0% |
| Hungary | 6 | 0.0% |
| India | 229 | 0.3% |
| Iran | 21 | 0.0% |
| Israel | 35 | 0.1% |
| Italy | 31 | 0.0% |
| Jamaica | 12,566 | 17.0% |
| Japan | 21 | 0.0% |
| Jordan | 28 | 0.0% |
| Korea | 54 | 0.1% |
| Latin America | 25,583 | 34.6% |
| Mexico | 88 | 0.1% |
| Nigeria | 84 | 0.1% |
| Northern Europe | 211 | 0.3% |
| Pakistan | 10 | 0.0% |
| Peru | 488 | 0.7% |
| Philippines | 82 | 0.1% |
| Poland | 129 | 0.2% |
| Serbia | 10 | 0.0% |
| South America | 2,112 | 2.9% |
| South Central Asia | 350 | 0.5% |
| South Eastern Asia | 190 | 0.3% |
| Southern Europe | 31 | 0.0% |
| St. Vincent and the Grenadines | 10 | 0.0% |
| Sweden | 15 | 0.0% |
| Taiwan | 23 | 0.0% |
| Trinidad and Tobago | 755 | 1.0% |
| Ukraine | 6 | 0.0% |
| Uruguay | 11 | 0.0% |
| Uzbekistan | 4 | 0.0% |
| Venezuela | 256 | 0.4% |
| Vietnam | 108 | 0.2% |
| Western Africa | 113 | 0.2% |
| Western Asia | 63 | 0.1% |
| Western Europe | 90 | 0.1% | View All 66 Rows |
Sex and Age in Lauderhill
Sex and Age in Lauderhill
The most populous age groups in Lauderhill are 10 to 14 Years (3,254 | 9.4%) for men and 10 to 14 Years (3,120 | 8.0%) for women.
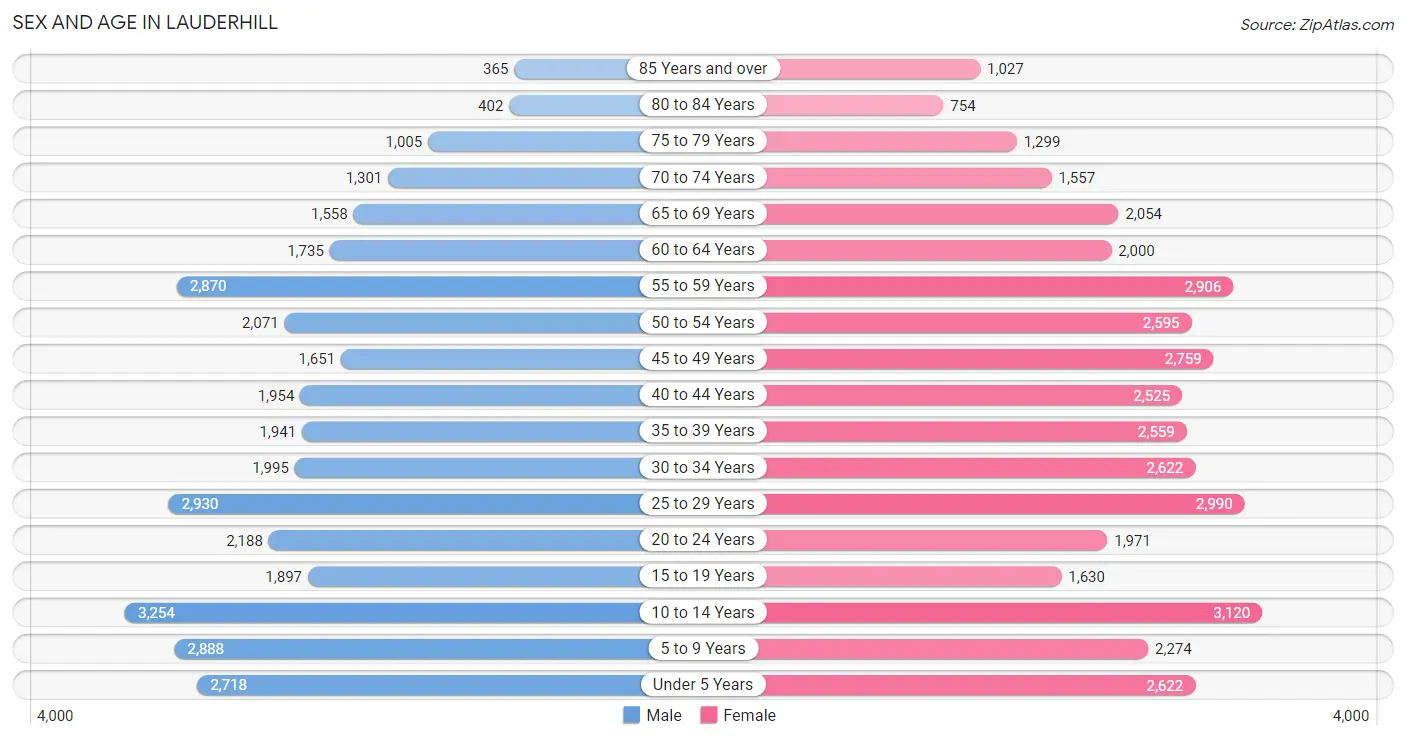
| Age Bracket | Male | Female |
| Under 5 Years | 2,718 (7.8%) | 2,622 (6.7%) |
| 5 to 9 Years | 2,888 (8.3%) | 2,274 (5.8%) |
| 10 to 14 Years | 3,254 (9.4%) | 3,120 (8.0%) |
| 15 to 19 Years | 1,897 (5.5%) | 1,630 (4.2%) |
| 20 to 24 Years | 2,188 (6.3%) | 1,971 (5.0%) |
| 25 to 29 Years | 2,930 (8.4%) | 2,990 (7.6%) |
| 30 to 34 Years | 1,995 (5.8%) | 2,622 (6.7%) |
| 35 to 39 Years | 1,941 (5.6%) | 2,559 (6.5%) |
| 40 to 44 Years | 1,954 (5.6%) | 2,525 (6.4%) |
| 45 to 49 Years | 1,651 (4.8%) | 2,759 (7.0%) |
| 50 to 54 Years | 2,071 (6.0%) | 2,595 (6.6%) |
| 55 to 59 Years | 2,870 (8.3%) | 2,906 (7.4%) |
| 60 to 64 Years | 1,735 (5.0%) | 2,000 (5.1%) |
| 65 to 69 Years | 1,558 (4.5%) | 2,054 (5.2%) |
| 70 to 74 Years | 1,301 (3.7%) | 1,557 (4.0%) |
| 75 to 79 Years | 1,005 (2.9%) | 1,299 (3.3%) |
| 80 to 84 Years | 402 (1.2%) | 754 (1.9%) |
| 85 Years and over | 365 (1.1%) | 1,027 (2.6%) |
| Total | 34,723 (100.0%) | 39,264 (100.0%) |
Families and Households in Lauderhill
Median Family Size in Lauderhill
The median family size in Lauderhill is 3.51 persons per family, with single female/mother families (7,329 | 42.2%) accounting for the largest median family size of 3.69 persons per family. On the other hand, single male/father families (1,455 | 8.4%) represent the smallest median family size with 2.83 persons per family.
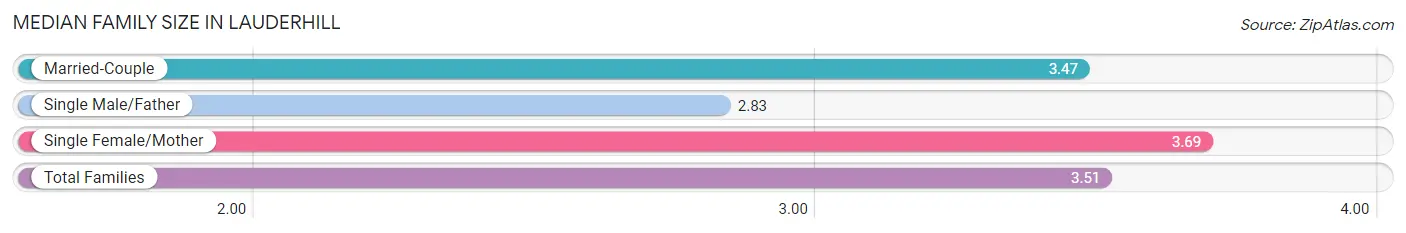
| Family Type | # Families | Family Size |
| Married-Couple | 8,573 (49.4%) | 3.47 |
| Single Male/Father | 1,455 (8.4%) | 2.83 |
| Single Female/Mother | 7,329 (42.2%) | 3.69 |
| Total Families | 17,357 (100.0%) | 3.51 |
Median Household Size in Lauderhill
The median household size in Lauderhill is 2.77 persons per household, with single female/mother households (7,329 | 27.7%) accounting for the largest median household size of 3.81 persons per household. non-family households (9,107 | 34.4%) represent the smallest median household size with 1.19 persons per household.
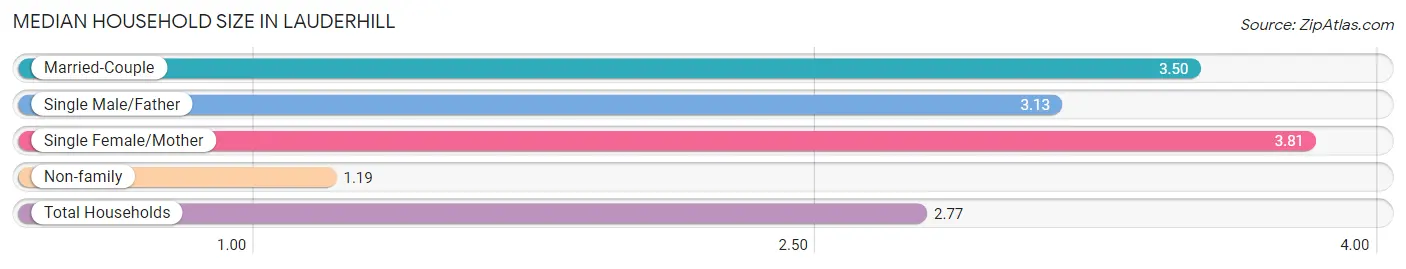
| Household Type | # Households | Household Size |
| Married-Couple | 8,573 (32.4%) | 3.50 |
| Single Male/Father | 1,455 (5.5%) | 3.13 |
| Single Female/Mother | 7,329 (27.7%) | 3.81 |
| Non-family | 9,107 (34.4%) | 1.19 |
| Total Households | 26,464 (100.0%) | 2.77 |
Household Size by Marriage Status in Lauderhill
Out of a total of 26,464 households in Lauderhill, 17,357 (65.6%) are family households, while 9,107 (34.4%) are nonfamily households. The most numerous type of family households are 2-person households, comprising 7,067, and the most common type of nonfamily households are 1-person households, comprising 7,794.
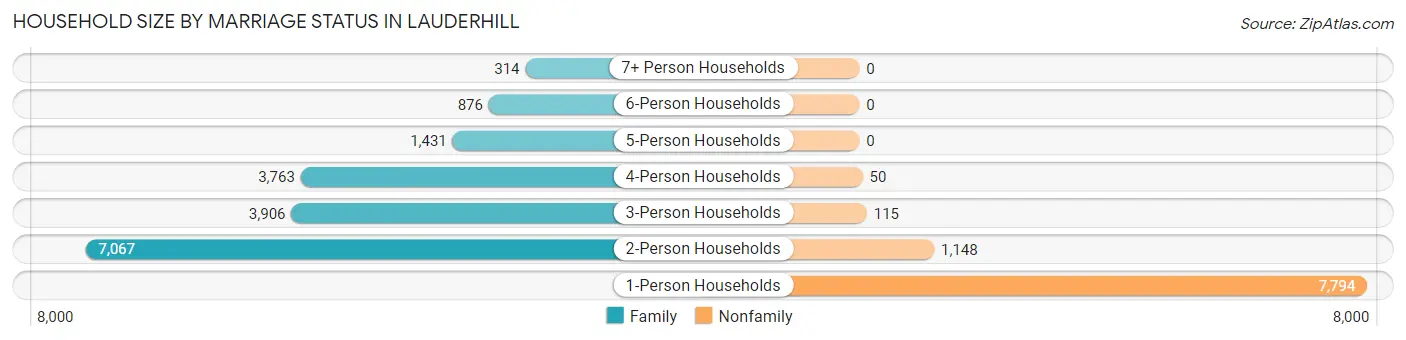
| Household Size | Family Households | Nonfamily Households |
| 1-Person Households | - | 7,794 (29.4%) |
| 2-Person Households | 7,067 (26.7%) | 1,148 (4.3%) |
| 3-Person Households | 3,906 (14.8%) | 115 (0.4%) |
| 4-Person Households | 3,763 (14.2%) | 50 (0.2%) |
| 5-Person Households | 1,431 (5.4%) | 0 (0.0%) |
| 6-Person Households | 876 (3.3%) | 0 (0.0%) |
| 7+ Person Households | 314 (1.2%) | 0 (0.0%) |
| Total | 17,357 (65.6%) | 9,107 (34.4%) |
Female Fertility in Lauderhill
Fertility by Age in Lauderhill
Average fertility rate in Lauderhill is 69.0 births per 1,000 women. Women in the age bracket of 20 to 34 years have the highest fertility rate with 101.0 births per 1,000 women. Women in the age bracket of 20 to 34 years acount for 62.6% of all women with births.
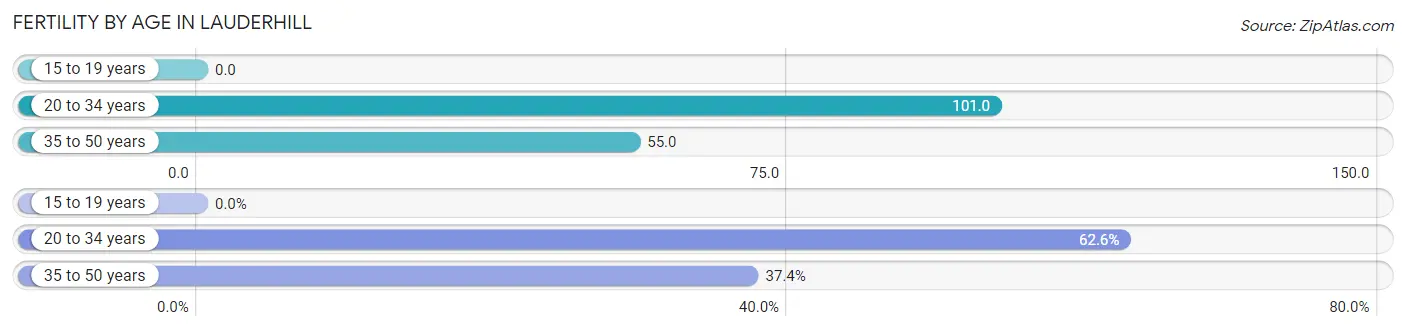
| Age Bracket | Women with Births | Births / 1,000 Women |
| 15 to 19 years | 0 (0.0%) | 0.0 |
| 20 to 34 years | 763 (62.6%) | 101.0 |
| 35 to 50 years | 455 (37.4%) | 55.0 |
| Total | 1,218 (100.0%) | 69.0 |
Fertility by Age by Marriage Status in Lauderhill
71.2% of women with births (1,218) in Lauderhill are married. The highest percentage of unmarried women with births falls into 20 to 34 years age bracket with 33.6% of them unmarried at the time of birth, while the lowest percentage of unmarried women with births belong to 35 to 50 years age bracket with 20.9% of them unmarried.
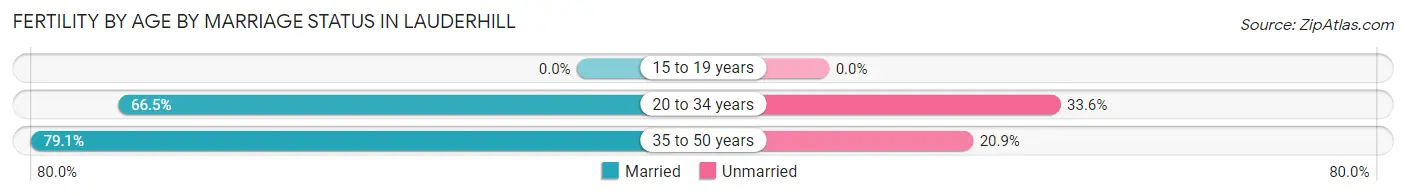
| Age Bracket | Married | Unmarried |
| 15 to 19 years | 0 (0.0%) | 0 (0.0%) |
| 20 to 34 years | 507 (66.4%) | 256 (33.6%) |
| 35 to 50 years | 360 (79.1%) | 95 (20.9%) |
| Total | 867 (71.2%) | 351 (28.8%) |
Fertility by Education in Lauderhill
Average fertility rate in Lauderhill is 69.0 births per 1,000 women. Women with the education attainment of college or associate's degree have the highest fertility rate of 90.0 births per 1,000 women, while women with the education attainment of bachelor's degree have the lowest fertility at 12.0 births per 1,000 women. Women with the education attainment of college or associate's degree represent 41.8% of all women with births.
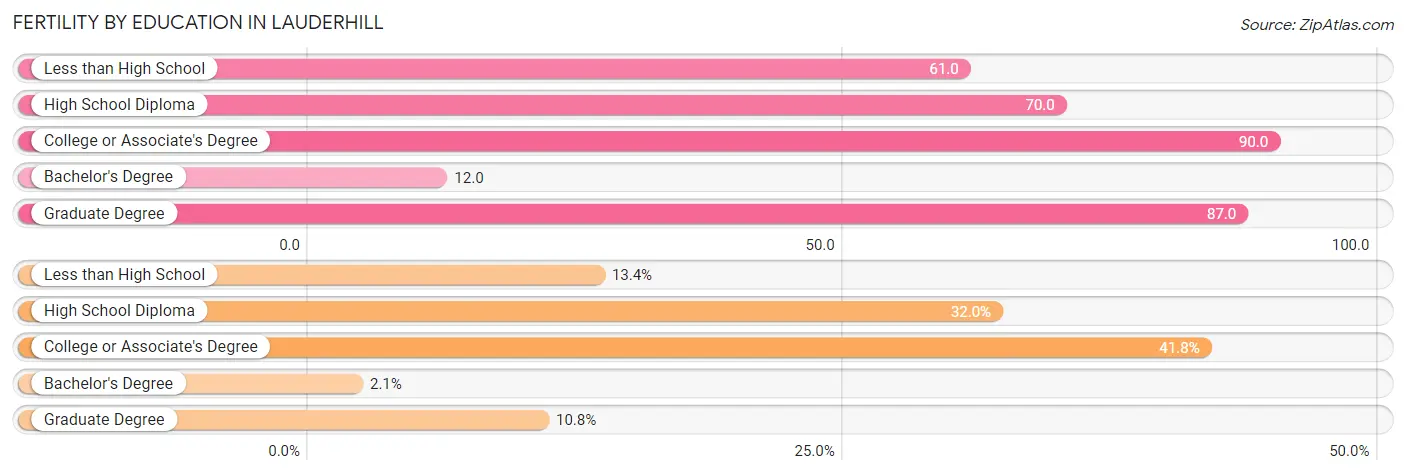
| Educational Attainment | Women with Births | Births / 1,000 Women |
| Less than High School | 163 (13.4%) | 61.0 |
| High School Diploma | 390 (32.0%) | 70.0 |
| College or Associate's Degree | 509 (41.8%) | 90.0 |
| Bachelor's Degree | 25 (2.1%) | 12.0 |
| Graduate Degree | 131 (10.8%) | 87.0 |
| Total | 1,218 (100.0%) | 69.0 |
Fertility by Education by Marriage Status in Lauderhill
28.8% of women with births in Lauderhill are unmarried. Women with the educational attainment of bachelor's degree are most likely to be married with 100.0% of them married at childbirth, while women with the educational attainment of high school diploma are least likely to be married with 56.4% of them unmarried at childbirth.
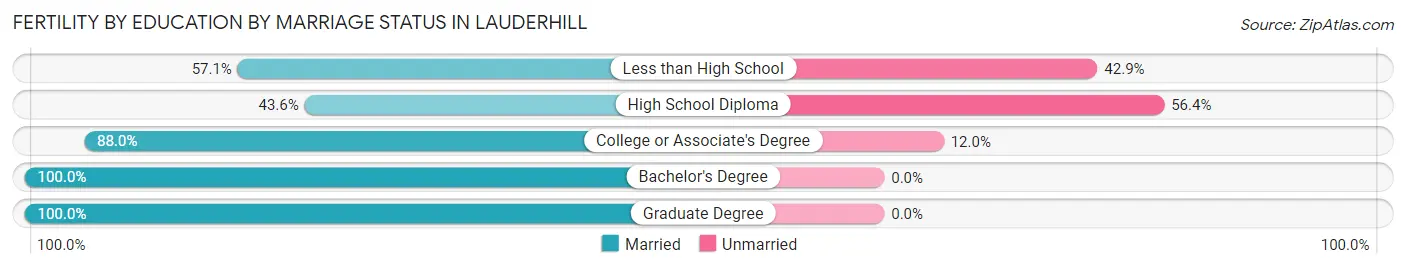
| Educational Attainment | Married | Unmarried |
| Less than High School | 93 (57.1%) | 70 (42.9%) |
| High School Diploma | 170 (43.6%) | 220 (56.4%) |
| College or Associate's Degree | 448 (88.0%) | 61 (12.0%) |
| Bachelor's Degree | 25 (100.0%) | 0 (0.0%) |
| Graduate Degree | 131 (100.0%) | 0 (0.0%) |
| Total | 867 (71.2%) | 351 (28.8%) |
Employment Characteristics in Lauderhill
Employment by Class of Employer in Lauderhill
Among the 33,160 employed individuals in Lauderhill, private company employees (24,538 | 74.0%), local government employees (2,435 | 7.3%), and not-for-profit organizations (2,348 | 7.1%) make up the most common classes of employment.
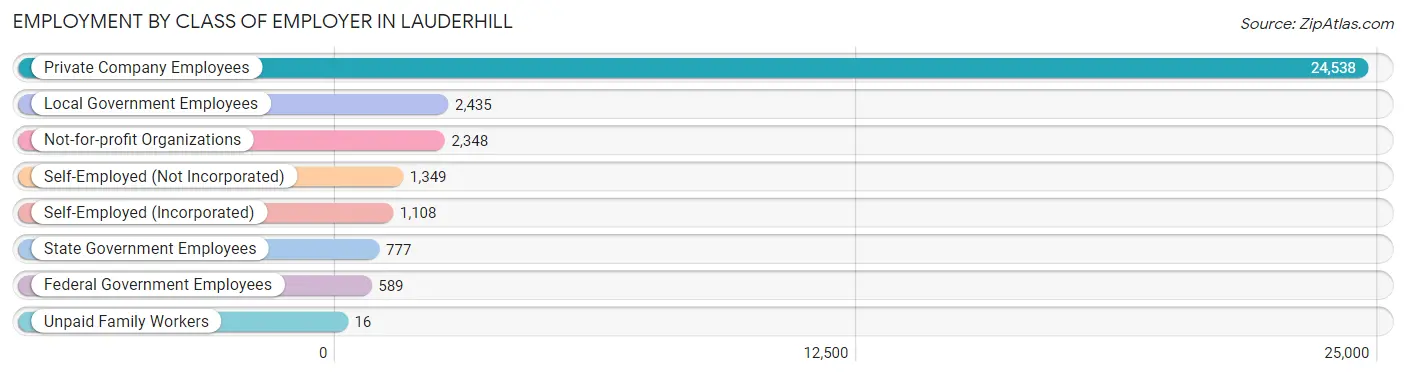
| Employer Class | # Employees | % Employees |
| Private Company Employees | 24,538 | 74.0% |
| Self-Employed (Incorporated) | 1,108 | 3.3% |
| Self-Employed (Not Incorporated) | 1,349 | 4.1% |
| Not-for-profit Organizations | 2,348 | 7.1% |
| Local Government Employees | 2,435 | 7.3% |
| State Government Employees | 777 | 2.3% |
| Federal Government Employees | 589 | 1.8% |
| Unpaid Family Workers | 16 | 0.1% |
| Total | 33,160 | 100.0% |
Employment Status by Age in Lauderhill
According to the labor force statistics for Lauderhill, out of the total population over 16 years of age (56,463), 65.7% or 37,096 individuals are in the labor force, with 8.6% or 3,190 of them unemployed. The age group with the highest labor force participation rate is 25 to 29 years, with 86.7% or 5,133 individuals in the labor force. Within the labor force, the 75 years and over age range has the highest percentage of unemployed individuals, with 20.0% or 34 of them being unemployed.
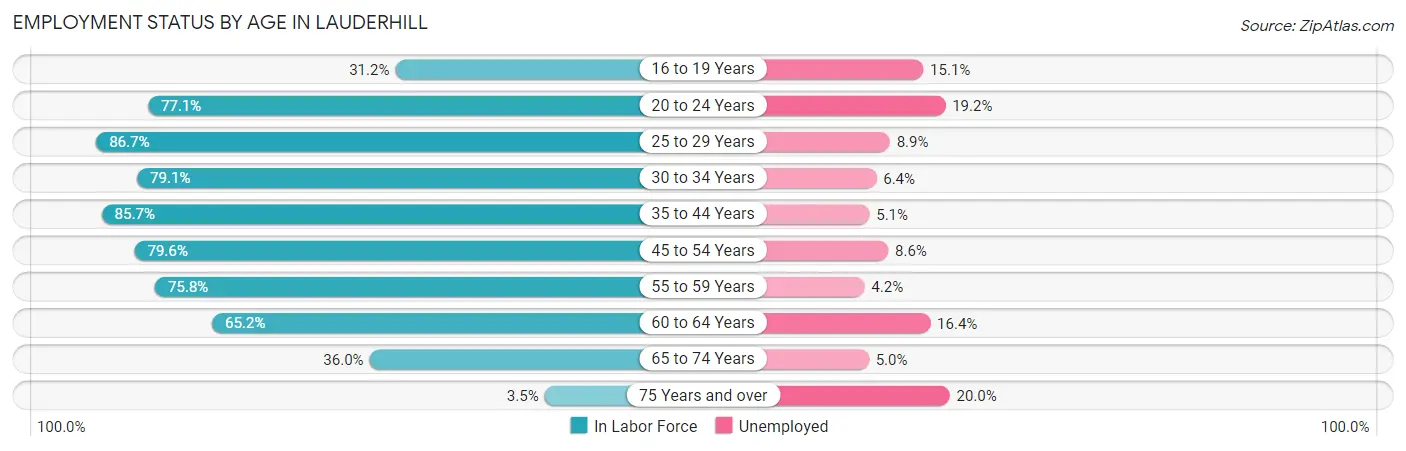
| Age Bracket | In Labor Force | Unemployed |
| 16 to 19 Years | 898 (31.2%) | 136 (15.1%) |
| 20 to 24 Years | 3,207 (77.1%) | 616 (19.2%) |
| 25 to 29 Years | 5,133 (86.7%) | 457 (8.9%) |
| 30 to 34 Years | 3,652 (79.1%) | 234 (6.4%) |
| 35 to 44 Years | 7,695 (85.7%) | 392 (5.1%) |
| 45 to 54 Years | 7,224 (79.6%) | 621 (8.6%) |
| 55 to 59 Years | 4,378 (75.8%) | 184 (4.2%) |
| 60 to 64 Years | 2,435 (65.2%) | 399 (16.4%) |
| 65 to 74 Years | 2,329 (36.0%) | 116 (5.0%) |
| 75 Years and over | 170 (3.5%) | 34 (20.0%) |
| Total | 37,096 (65.7%) | 3,190 (8.6%) |
Employment Status by Educational Attainment in Lauderhill
According to labor force statistics for Lauderhill, 80.1% of individuals (30,521) out of the total population between 25 and 64 years of age (38,103) are in the labor force, with 7.5% or 2,289 of them being unemployed. The group with the highest labor force participation rate are those with the educational attainment of bachelor's degree or higher, with 91.5% or 6,381 individuals in the labor force. Within the labor force, individuals with less than high school education have the highest percentage of unemployment, with 13.0% or 413 of them being unemployed.

| Educational Attainment | In Labor Force | Unemployed |
| Less than High School | 3,174 (67.2%) | 614 (13.0%) |
| High School Diploma | 11,028 (75.1%) | 1,248 (8.5%) |
| College / Associate Degree | 9,940 (84.8%) | 703 (6.0%) |
| Bachelor's Degree or higher | 6,381 (91.5%) | 356 (5.1%) |
| Total | 30,521 (80.1%) | 2,858 (7.5%) |
Employment Occupations by Sex in Lauderhill
Management, Business, Science and Arts Occupations
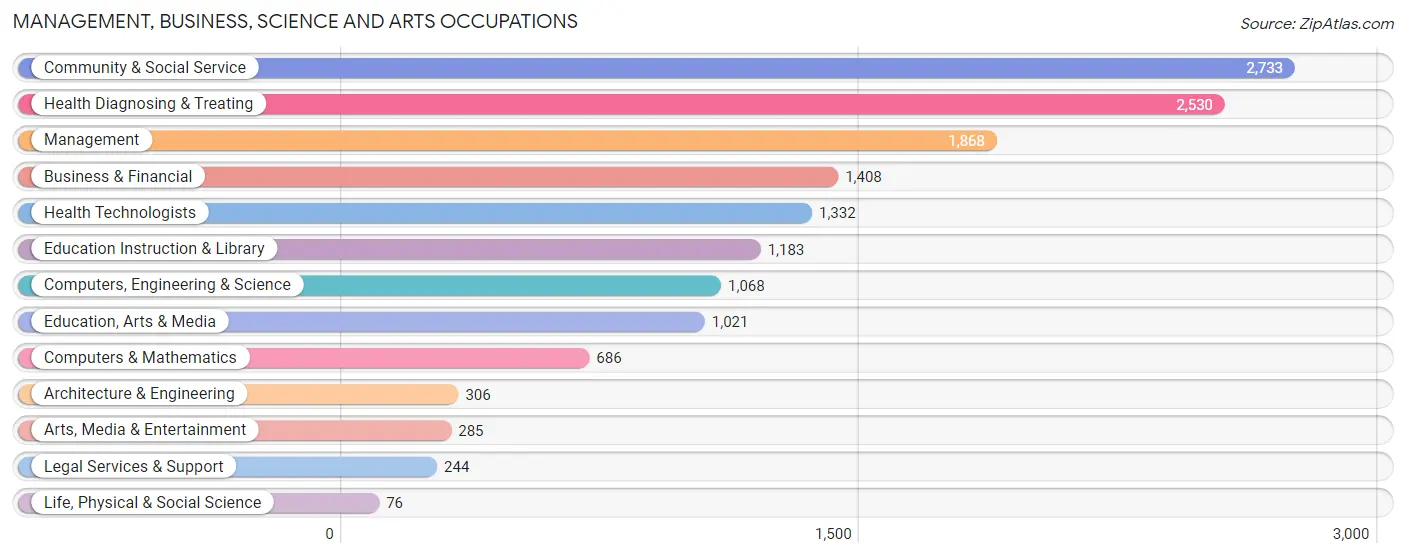
The most common Management, Business, Science and Arts occupations in Lauderhill are Community & Social Service (2,733 | 8.1%), Health Diagnosing & Treating (2,530 | 7.5%), Management (1,868 | 5.5%), Business & Financial (1,408 | 4.2%), and Health Technologists (1,332 | 3.9%).
Management, Business, Science and Arts Occupations by Sex
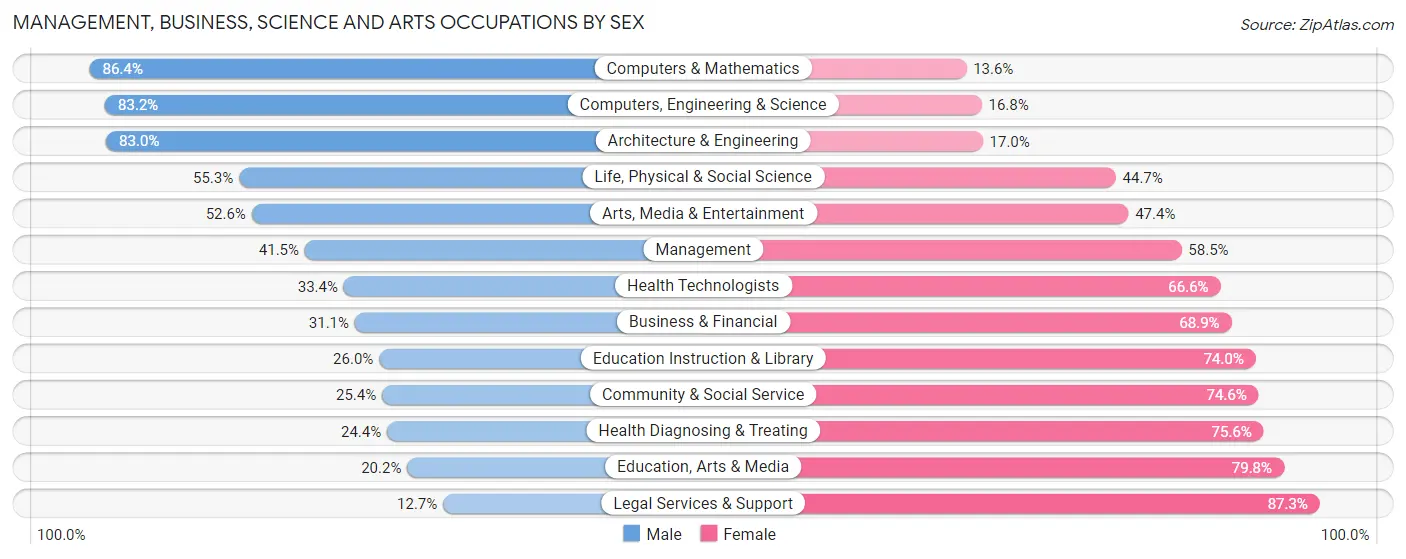
Within the Management, Business, Science and Arts occupations in Lauderhill, the most male-oriented occupations are Computers & Mathematics (86.4%), Computers, Engineering & Science (83.2%), and Architecture & Engineering (83.0%), while the most female-oriented occupations are Legal Services & Support (87.3%), Education, Arts & Media (79.8%), and Health Diagnosing & Treating (75.6%).
| Occupation | Male | Female |
| Management | 776 (41.5%) | 1,092 (58.5%) |
| Business & Financial | 438 (31.1%) | 970 (68.9%) |
| Computers, Engineering & Science | 889 (83.2%) | 179 (16.8%) |
| Computers & Mathematics | 593 (86.4%) | 93 (13.6%) |
| Architecture & Engineering | 254 (83.0%) | 52 (17.0%) |
| Life, Physical & Social Science | 42 (55.3%) | 34 (44.7%) |
| Community & Social Service | 695 (25.4%) | 2,038 (74.6%) |
| Education, Arts & Media | 206 (20.2%) | 815 (79.8%) |
| Legal Services & Support | 31 (12.7%) | 213 (87.3%) |
| Education Instruction & Library | 308 (26.0%) | 875 (74.0%) |
| Arts, Media & Entertainment | 150 (52.6%) | 135 (47.4%) |
| Health Diagnosing & Treating | 617 (24.4%) | 1,913 (75.6%) |
| Health Technologists | 445 (33.4%) | 887 (66.6%) |
| Total (Category) | 3,415 (35.5%) | 6,192 (64.4%) |
| Total (Overall) | 15,818 (46.7%) | 18,043 (53.3%) |
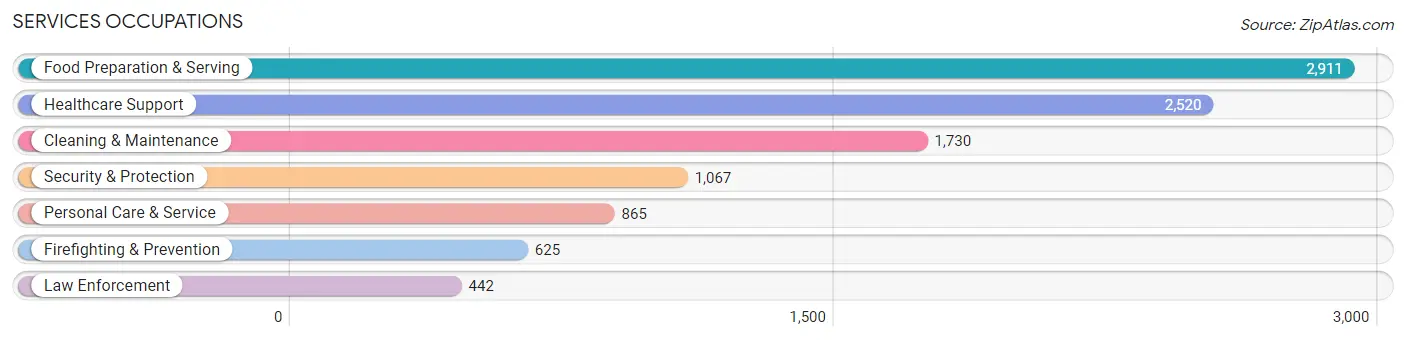
Services Occupations
The most common Services occupations in Lauderhill are Food Preparation & Serving (2,911 | 8.6%), Healthcare Support (2,520 | 7.4%), Cleaning & Maintenance (1,730 | 5.1%), Security & Protection (1,067 | 3.2%), and Personal Care & Service (865 | 2.5%).
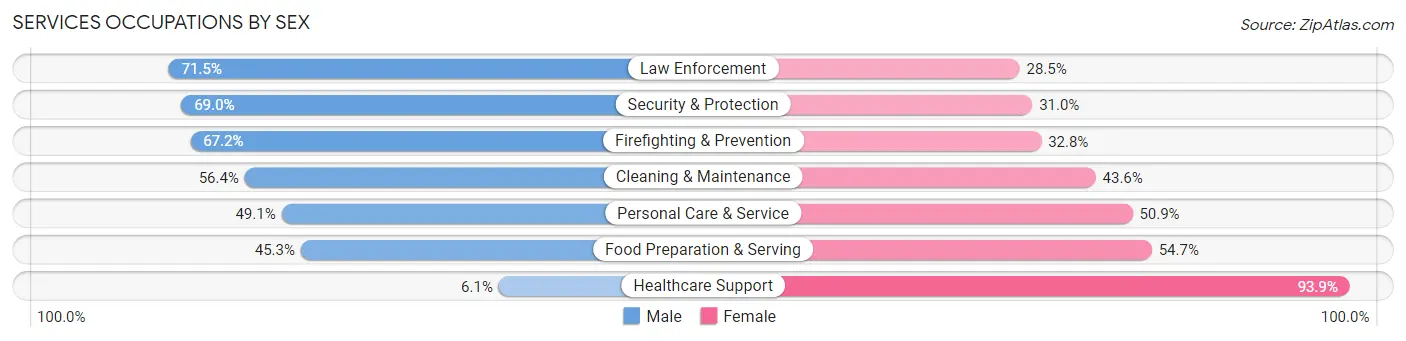
Services Occupations by Sex
Within the Services occupations in Lauderhill, the most male-oriented occupations are Law Enforcement (71.5%), Security & Protection (69.0%), and Firefighting & Prevention (67.2%), while the most female-oriented occupations are Healthcare Support (93.9%), Food Preparation & Serving (54.7%), and Personal Care & Service (50.9%).
| Occupation | Male | Female |
| Healthcare Support | 154 (6.1%) | 2,366 (93.9%) |
| Security & Protection | 736 (69.0%) | 331 (31.0%) |
| Firefighting & Prevention | 420 (67.2%) | 205 (32.8%) |
| Law Enforcement | 316 (71.5%) | 126 (28.5%) |
| Food Preparation & Serving | 1,319 (45.3%) | 1,592 (54.7%) |
| Cleaning & Maintenance | 976 (56.4%) | 754 (43.6%) |
| Personal Care & Service | 425 (49.1%) | 440 (50.9%) |
| Total (Category) | 3,610 (39.7%) | 5,483 (60.3%) |
| Total (Overall) | 15,818 (46.7%) | 18,043 (53.3%) |
Sales and Office Occupations
The most common Sales and Office occupations in Lauderhill are Office & Administration (4,718 | 13.9%), and Sales & Related (3,552 | 10.5%).

Sales and Office Occupations by Sex

| Occupation | Male | Female |
| Sales & Related | 1,661 (46.8%) | 1,891 (53.2%) |
| Office & Administration | 1,070 (22.7%) | 3,648 (77.3%) |
| Total (Category) | 2,731 (33.0%) | 5,539 (67.0%) |
| Total (Overall) | 15,818 (46.7%) | 18,043 (53.3%) |
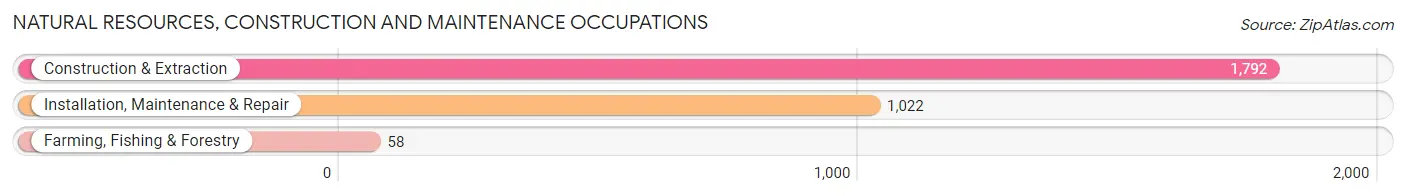
Natural Resources, Construction and Maintenance Occupations
The most common Natural Resources, Construction and Maintenance occupations in Lauderhill are Construction & Extraction (1,792 | 5.3%), Installation, Maintenance & Repair (1,022 | 3.0%), and Farming, Fishing & Forestry (58 | 0.2%).
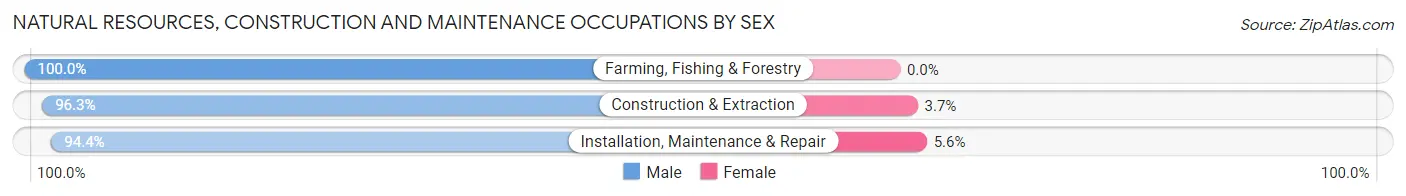
Natural Resources, Construction and Maintenance Occupations by Sex
| Occupation | Male | Female |
| Farming, Fishing & Forestry | 58 (100.0%) | 0 (0.0%) |
| Construction & Extraction | 1,726 (96.3%) | 66 (3.7%) |
| Installation, Maintenance & Repair | 965 (94.4%) | 57 (5.6%) |
| Total (Category) | 2,749 (95.7%) | 123 (4.3%) |
| Total (Overall) | 15,818 (46.7%) | 18,043 (53.3%) |
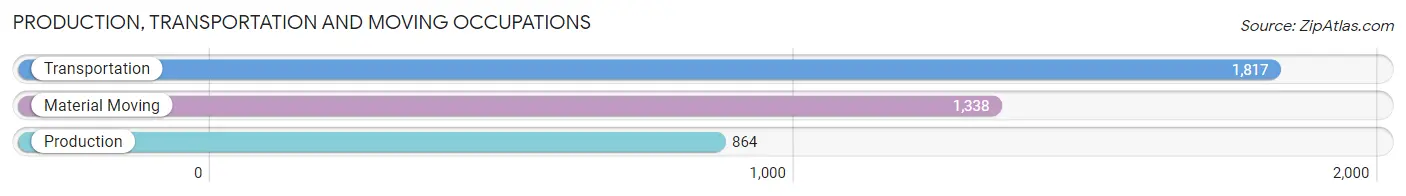
Production, Transportation and Moving Occupations
The most common Production, Transportation and Moving occupations in Lauderhill are Transportation (1,817 | 5.4%), Material Moving (1,338 | 4.0%), and Production (864 | 2.5%).
Production, Transportation and Moving Occupations by Sex
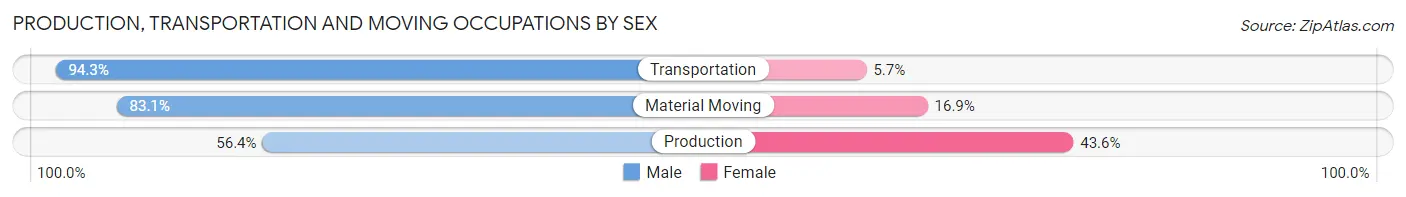
| Occupation | Male | Female |
| Production | 487 (56.4%) | 377 (43.6%) |
| Transportation | 1,714 (94.3%) | 103 (5.7%) |
| Material Moving | 1,112 (83.1%) | 226 (16.9%) |
| Total (Category) | 3,313 (82.4%) | 706 (17.6%) |
| Total (Overall) | 15,818 (46.7%) | 18,043 (53.3%) |
Employment Industries by Sex in Lauderhill
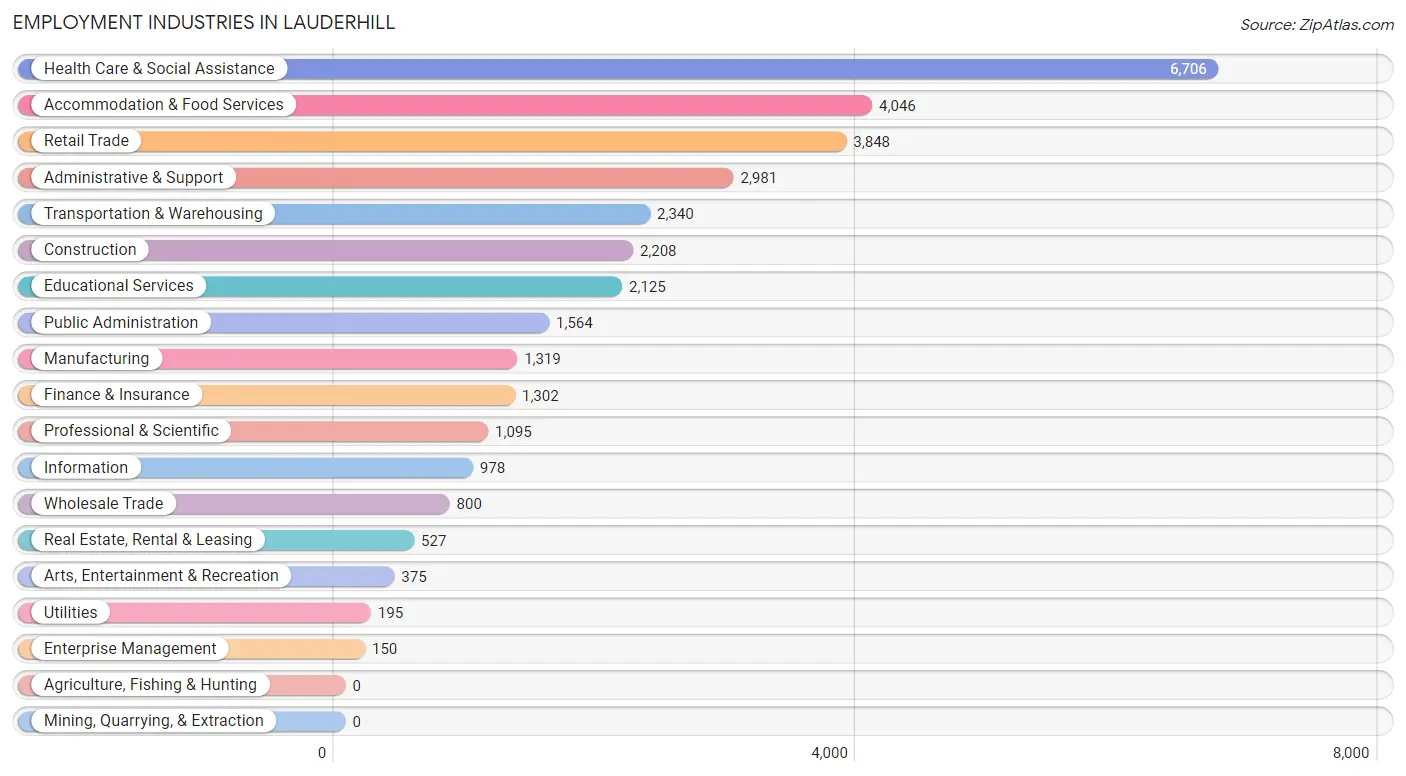
Employment Industries in Lauderhill
The major employment industries in Lauderhill include Health Care & Social Assistance (6,706 | 19.8%), Accommodation & Food Services (4,046 | 11.9%), Retail Trade (3,848 | 11.4%), Administrative & Support (2,981 | 8.8%), and Transportation & Warehousing (2,340 | 6.9%).
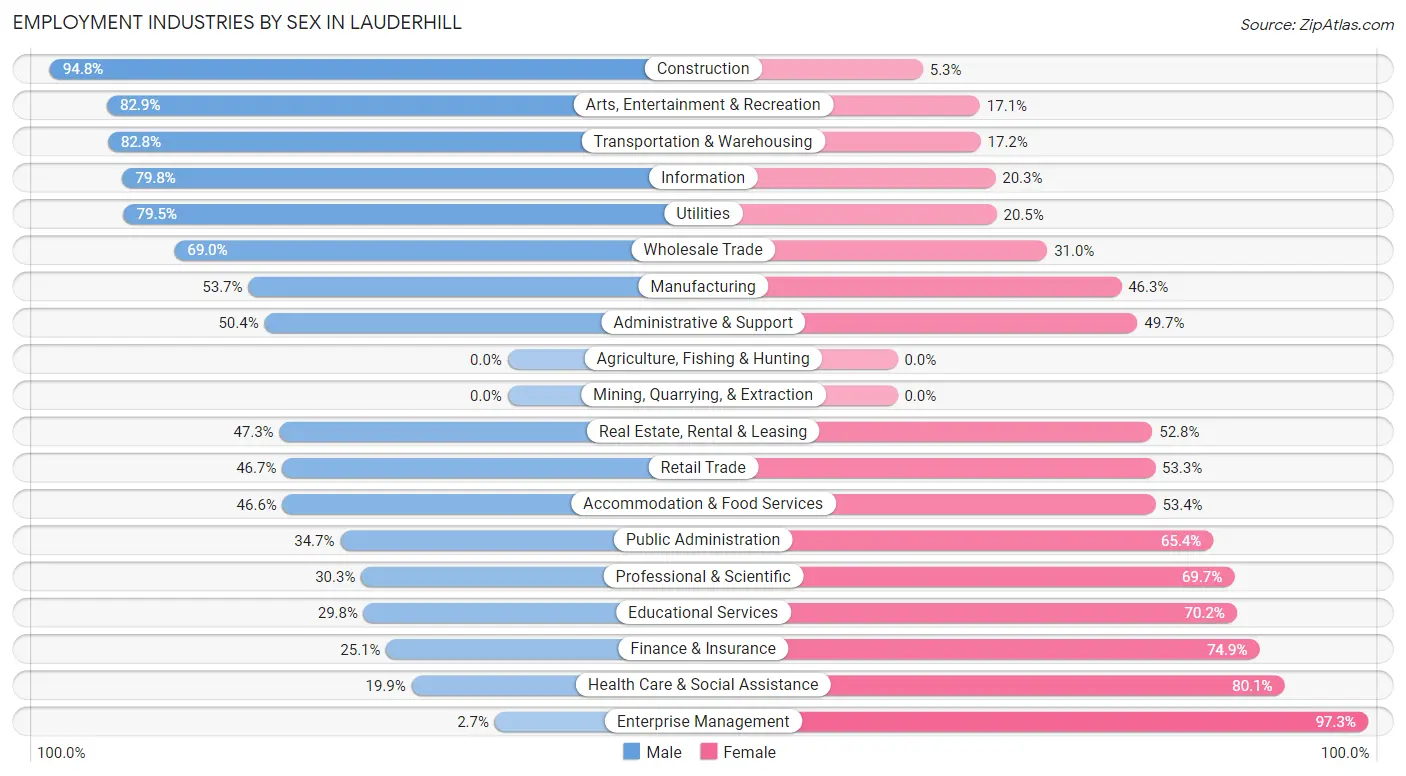
Employment Industries by Sex in Lauderhill
The Lauderhill industries that see more men than women are Construction (94.8%), Arts, Entertainment & Recreation (82.9%), and Transportation & Warehousing (82.8%), whereas the industries that tend to have a higher number of women are Enterprise Management (97.3%), Health Care & Social Assistance (80.1%), and Finance & Insurance (74.9%).
| Industry | Male | Female |
| Agriculture, Fishing & Hunting | 0 (0.0%) | 0 (0.0%) |
| Mining, Quarrying, & Extraction | 0 (0.0%) | 0 (0.0%) |
| Construction | 2,092 (94.8%) | 116 (5.2%) |
| Manufacturing | 708 (53.7%) | 611 (46.3%) |
| Wholesale Trade | 552 (69.0%) | 248 (31.0%) |
| Retail Trade | 1,796 (46.7%) | 2,052 (53.3%) |
| Transportation & Warehousing | 1,937 (82.8%) | 403 (17.2%) |
| Utilities | 155 (79.5%) | 40 (20.5%) |
| Information | 780 (79.7%) | 198 (20.3%) |
| Finance & Insurance | 327 (25.1%) | 975 (74.9%) |
| Real Estate, Rental & Leasing | 249 (47.2%) | 278 (52.7%) |
| Professional & Scientific | 332 (30.3%) | 763 (69.7%) |
| Enterprise Management | 4 (2.7%) | 146 (97.3%) |
| Administrative & Support | 1,501 (50.3%) | 1,480 (49.6%) |
| Educational Services | 633 (29.8%) | 1,492 (70.2%) |
| Health Care & Social Assistance | 1,335 (19.9%) | 5,371 (80.1%) |
| Arts, Entertainment & Recreation | 311 (82.9%) | 64 (17.1%) |
| Accommodation & Food Services | 1,885 (46.6%) | 2,161 (53.4%) |
| Public Administration | 542 (34.6%) | 1,022 (65.3%) |
| Total | 15,818 (46.7%) | 18,043 (53.3%) |
Education in Lauderhill
School Enrollment in Lauderhill
The most common levels of schooling among the 19,944 students in Lauderhill are middle school (5,023 | 25.2%), elementary school (4,262 | 21.4%), and college / undergraduate (3,598 | 18.0%).
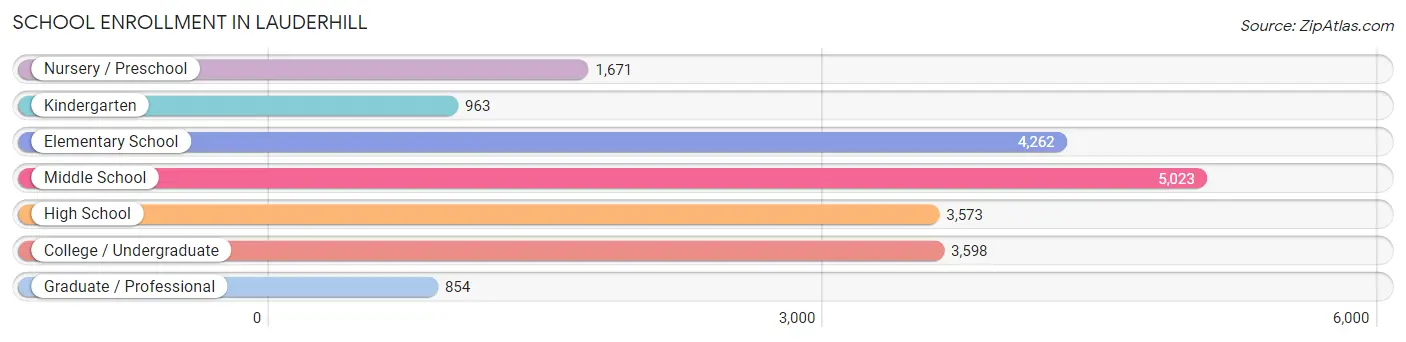
| School Level | # Students | % Students |
| Nursery / Preschool | 1,671 | 8.4% |
| Kindergarten | 963 | 4.8% |
| Elementary School | 4,262 | 21.4% |
| Middle School | 5,023 | 25.2% |
| High School | 3,573 | 17.9% |
| College / Undergraduate | 3,598 | 18.0% |
| Graduate / Professional | 854 | 4.3% |
| Total | 19,944 | 100.0% |
School Enrollment by Age by Funding Source in Lauderhill
Out of a total of 19,944 students who are enrolled in schools in Lauderhill, 3,730 (18.7%) attend a private institution, while the remaining 16,214 (81.3%) are enrolled in public schools. The age group of 3 to 4 year olds has the highest likelihood of being enrolled in private schools, with 489 (37.0% in the age bracket) enrolled. Conversely, the age group of 18 to 19 year olds has the lowest likelihood of being enrolled in a private school, with 865 (94.7% in the age bracket) attending a public institution.
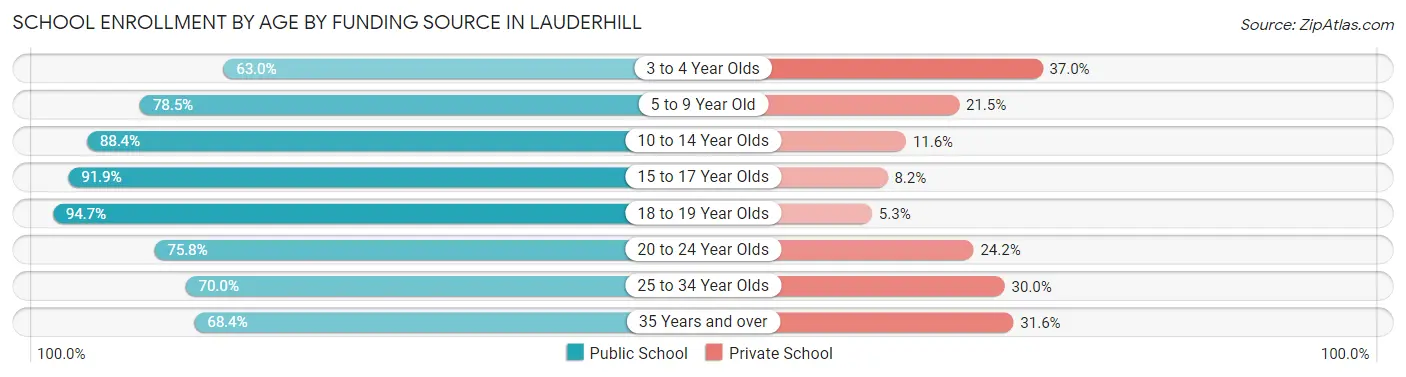
| Age Bracket | Public School | Private School |
| 3 to 4 Year Olds | 832 (63.0%) | 489 (37.0%) |
| 5 to 9 Year Old | 3,888 (78.5%) | 1,064 (21.5%) |
| 10 to 14 Year Olds | 5,573 (88.4%) | 731 (11.6%) |
| 15 to 17 Year Olds | 1,939 (91.8%) | 172 (8.2%) |
| 18 to 19 Year Olds | 865 (94.7%) | 48 (5.3%) |
| 20 to 24 Year Olds | 1,317 (75.8%) | 420 (24.2%) |
| 25 to 34 Year Olds | 939 (70.0%) | 402 (30.0%) |
| 35 Years and over | 865 (68.4%) | 400 (31.6%) |
| Total | 16,214 (81.3%) | 3,730 (18.7%) |
Educational Attainment by Field of Study in Lauderhill
Business (2,310 | 22.6%), education (1,828 | 17.9%), science & technology (1,321 | 13.0%), arts & humanities (681 | 6.7%), and engineering (642 | 6.3%) are the most common fields of study among 10,201 individuals in Lauderhill who have obtained a bachelor's degree or higher.
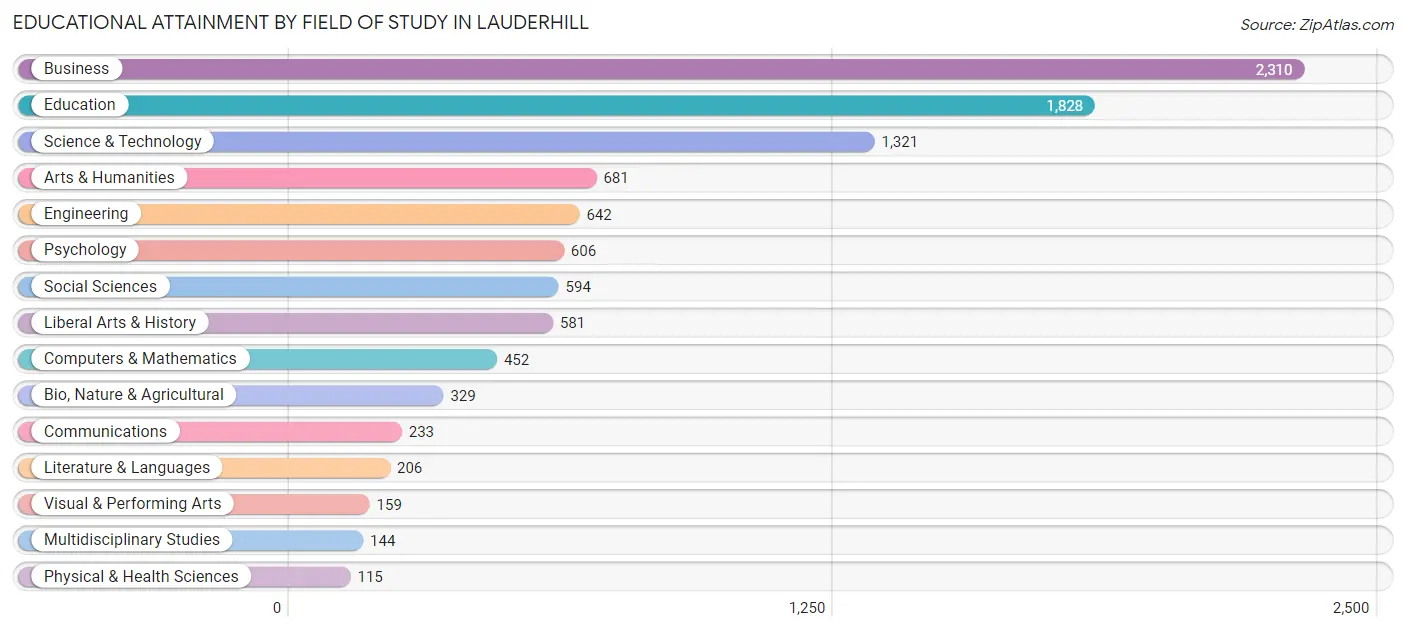
| Field of Study | # Graduates | % Graduates |
| Computers & Mathematics | 452 | 4.4% |
| Bio, Nature & Agricultural | 329 | 3.2% |
| Physical & Health Sciences | 115 | 1.1% |
| Psychology | 606 | 5.9% |
| Social Sciences | 594 | 5.8% |
| Engineering | 642 | 6.3% |
| Multidisciplinary Studies | 144 | 1.4% |
| Science & Technology | 1,321 | 13.0% |
| Business | 2,310 | 22.6% |
| Education | 1,828 | 17.9% |
| Literature & Languages | 206 | 2.0% |
| Liberal Arts & History | 581 | 5.7% |
| Visual & Performing Arts | 159 | 1.6% |
| Communications | 233 | 2.3% |
| Arts & Humanities | 681 | 6.7% |
| Total | 10,201 | 100.0% |
Transportation & Commute in Lauderhill
Vehicle Availability by Sex in Lauderhill
The most prevalent vehicle ownership categories in Lauderhill are males with 2 vehicles (6,197, accounting for 40.1%) and females with 2 vehicles (5,634, making up 35.1%).
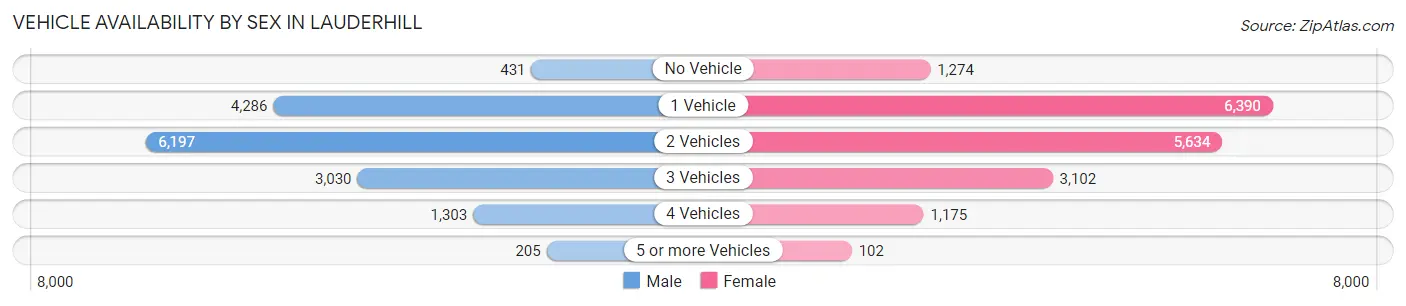
| Vehicles Available | Male | Female |
| No Vehicle | 431 (2.8%) | 1,274 (7.2%) |
| 1 Vehicle | 4,286 (27.7%) | 6,390 (36.1%) |
| 2 Vehicles | 6,197 (40.1%) | 5,634 (31.9%) |
| 3 Vehicles | 3,030 (19.6%) | 3,102 (17.5%) |
| 4 Vehicles | 1,303 (8.4%) | 1,175 (6.7%) |
| 5 or more Vehicles | 205 (1.3%) | 102 (0.6%) |
| Total | 15,452 (100.0%) | 17,677 (100.0%) |
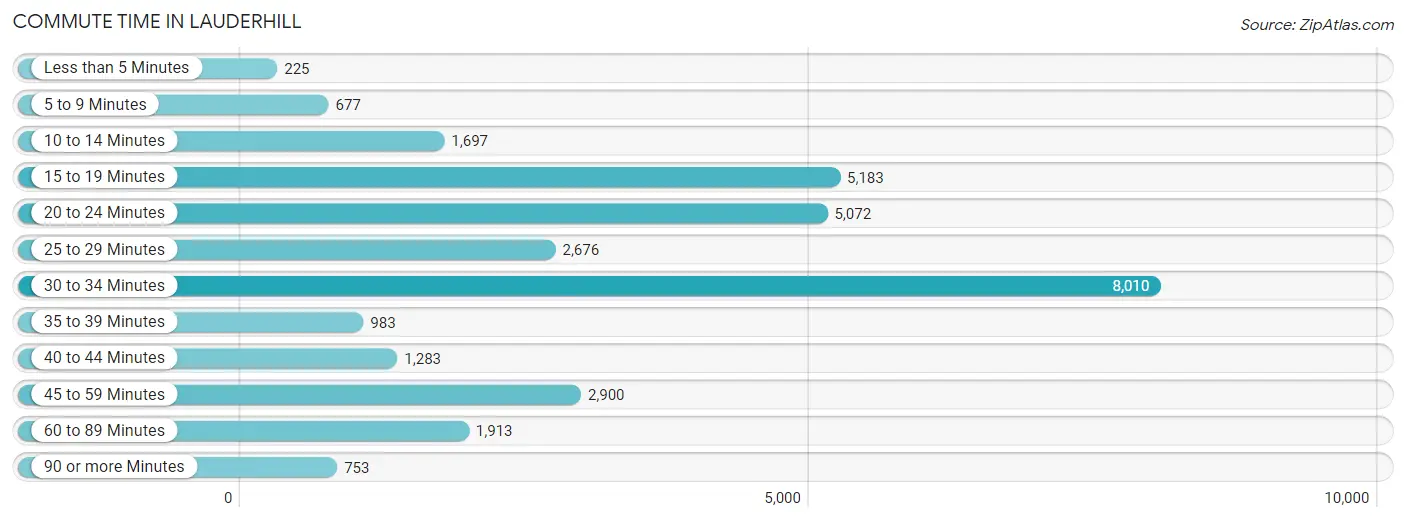
Commute Time in Lauderhill
The most frequently occuring commute durations in Lauderhill are 30 to 34 minutes (8,010 commuters, 25.5%), 15 to 19 minutes (5,183 commuters, 16.5%), and 20 to 24 minutes (5,072 commuters, 16.2%).
| Commute Time | # Commuters | % Commuters |
| Less than 5 Minutes | 225 | 0.7% |
| 5 to 9 Minutes | 677 | 2.2% |
| 10 to 14 Minutes | 1,697 | 5.4% |
| 15 to 19 Minutes | 5,183 | 16.5% |
| 20 to 24 Minutes | 5,072 | 16.2% |
| 25 to 29 Minutes | 2,676 | 8.5% |
| 30 to 34 Minutes | 8,010 | 25.5% |
| 35 to 39 Minutes | 983 | 3.1% |
| 40 to 44 Minutes | 1,283 | 4.1% |
| 45 to 59 Minutes | 2,900 | 9.2% |
| 60 to 89 Minutes | 1,913 | 6.1% |
| 90 or more Minutes | 753 | 2.4% |
Commute Time by Sex in Lauderhill
The most common commute times in Lauderhill are 30 to 34 minutes (3,759 commuters, 25.9%) for males and 30 to 34 minutes (4,251 commuters, 25.2%) for females.
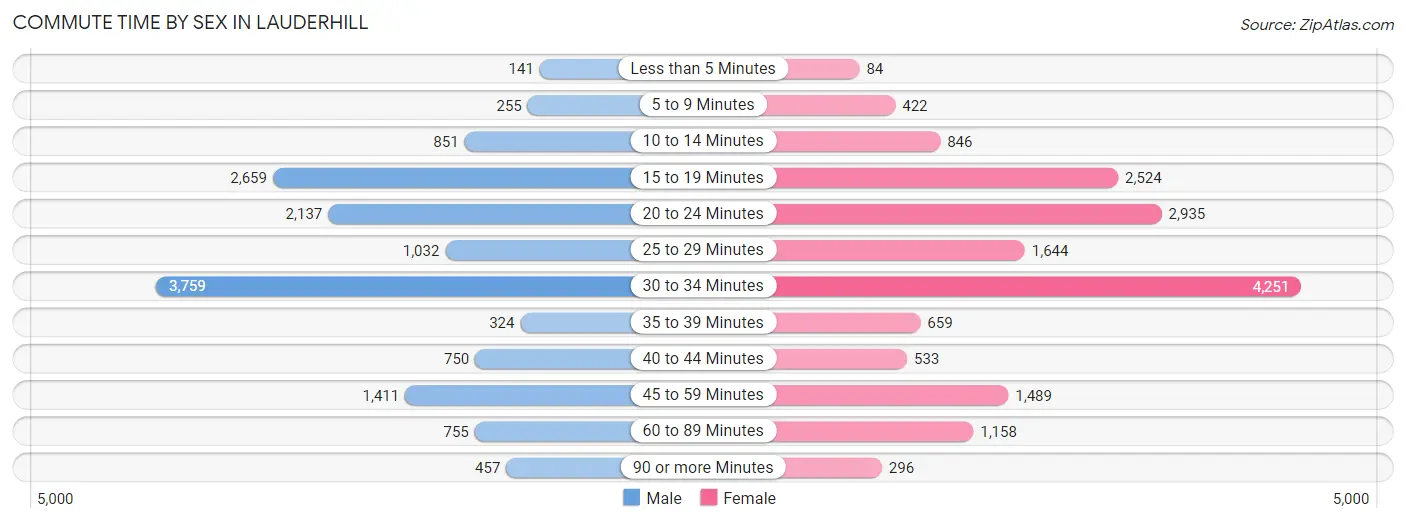
| Commute Time | Male | Female |
| Less than 5 Minutes | 141 (1.0%) | 84 (0.5%) |
| 5 to 9 Minutes | 255 (1.8%) | 422 (2.5%) |
| 10 to 14 Minutes | 851 (5.9%) | 846 (5.0%) |
| 15 to 19 Minutes | 2,659 (18.3%) | 2,524 (15.0%) |
| 20 to 24 Minutes | 2,137 (14.7%) | 2,935 (17.4%) |
| 25 to 29 Minutes | 1,032 (7.1%) | 1,644 (9.8%) |
| 30 to 34 Minutes | 3,759 (25.9%) | 4,251 (25.2%) |
| 35 to 39 Minutes | 324 (2.2%) | 659 (3.9%) |
| 40 to 44 Minutes | 750 (5.2%) | 533 (3.2%) |
| 45 to 59 Minutes | 1,411 (9.7%) | 1,489 (8.8%) |
| 60 to 89 Minutes | 755 (5.2%) | 1,158 (6.9%) |
| 90 or more Minutes | 457 (3.2%) | 296 (1.8%) |
Time of Departure to Work by Sex in Lauderhill
The most frequent times of departure to work in Lauderhill are 8:00 AM to 8:29 AM (2,019, 13.9%) for males and 8:00 AM to 8:29 AM (3,037, 18.0%) for females.
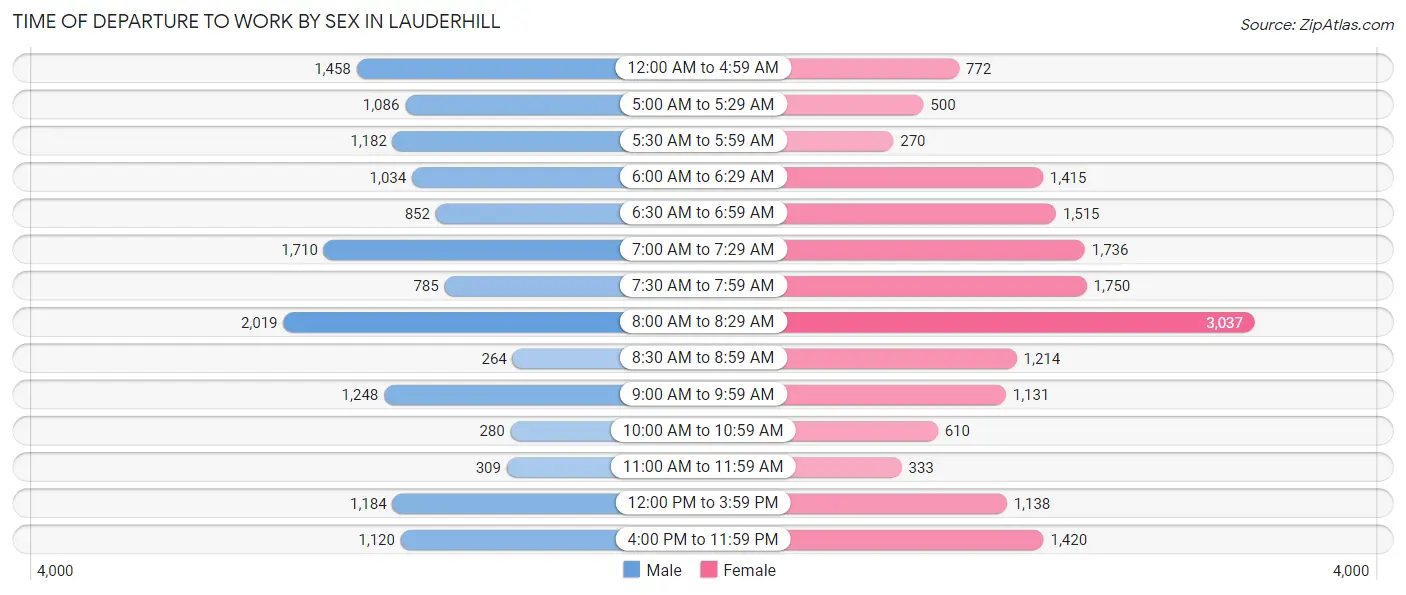
| Time of Departure | Male | Female |
| 12:00 AM to 4:59 AM | 1,458 (10.0%) | 772 (4.6%) |
| 5:00 AM to 5:29 AM | 1,086 (7.5%) | 500 (3.0%) |
| 5:30 AM to 5:59 AM | 1,182 (8.1%) | 270 (1.6%) |
| 6:00 AM to 6:29 AM | 1,034 (7.1%) | 1,415 (8.4%) |
| 6:30 AM to 6:59 AM | 852 (5.9%) | 1,515 (9.0%) |
| 7:00 AM to 7:29 AM | 1,710 (11.8%) | 1,736 (10.3%) |
| 7:30 AM to 7:59 AM | 785 (5.4%) | 1,750 (10.4%) |
| 8:00 AM to 8:29 AM | 2,019 (13.9%) | 3,037 (18.0%) |
| 8:30 AM to 8:59 AM | 264 (1.8%) | 1,214 (7.2%) |
| 9:00 AM to 9:59 AM | 1,248 (8.6%) | 1,131 (6.7%) |
| 10:00 AM to 10:59 AM | 280 (1.9%) | 610 (3.6%) |
| 11:00 AM to 11:59 AM | 309 (2.1%) | 333 (2.0%) |
| 12:00 PM to 3:59 PM | 1,184 (8.2%) | 1,138 (6.8%) |
| 4:00 PM to 11:59 PM | 1,120 (7.7%) | 1,420 (8.4%) |
| Total | 14,531 (100.0%) | 16,841 (100.0%) |
Housing Occupancy in Lauderhill
Occupancy by Ownership in Lauderhill
Of the total 26,464 dwellings in Lauderhill, owner-occupied units account for 13,681 (51.7%), while renter-occupied units make up 12,783 (48.3%).
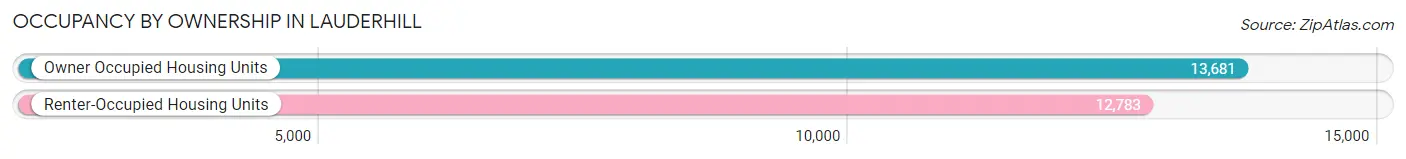
| Occupancy | # Housing Units | % Housing Units |
| Owner Occupied Housing Units | 13,681 | 51.7% |
| Renter-Occupied Housing Units | 12,783 | 48.3% |
| Total Occupied Housing Units | 26,464 | 100.0% |
Occupancy by Household Size in Lauderhill
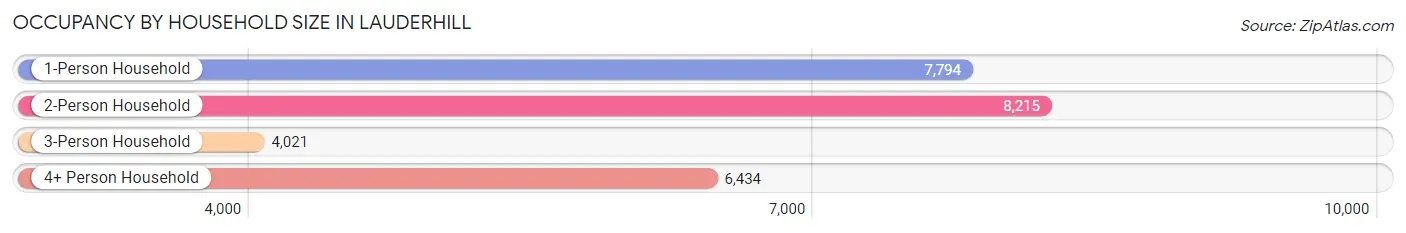
| Household Size | # Housing Units | % Housing Units |
| 1-Person Household | 7,794 | 29.4% |
| 2-Person Household | 8,215 | 31.0% |
| 3-Person Household | 4,021 | 15.2% |
| 4+ Person Household | 6,434 | 24.3% |
| Total Housing Units | 26,464 | 100.0% |
Occupancy by Ownership by Household Size in Lauderhill
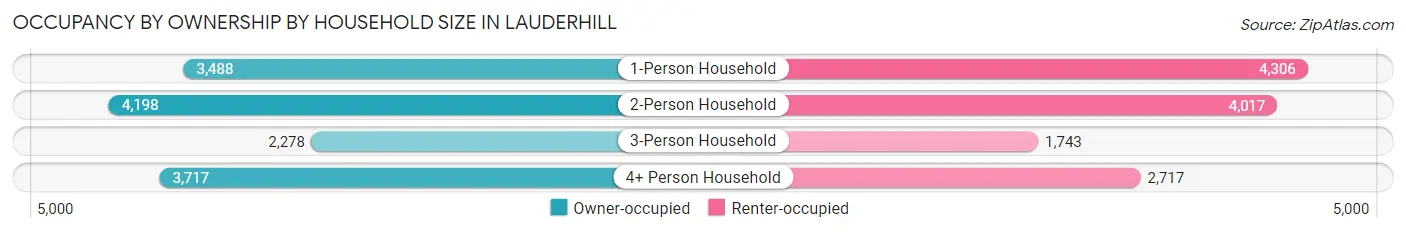
| Household Size | Owner-occupied | Renter-occupied |
| 1-Person Household | 3,488 (44.8%) | 4,306 (55.2%) |
| 2-Person Household | 4,198 (51.1%) | 4,017 (48.9%) |
| 3-Person Household | 2,278 (56.7%) | 1,743 (43.3%) |
| 4+ Person Household | 3,717 (57.8%) | 2,717 (42.2%) |
| Total Housing Units | 13,681 (51.7%) | 12,783 (48.3%) |
Occupancy by Educational Attainment in Lauderhill
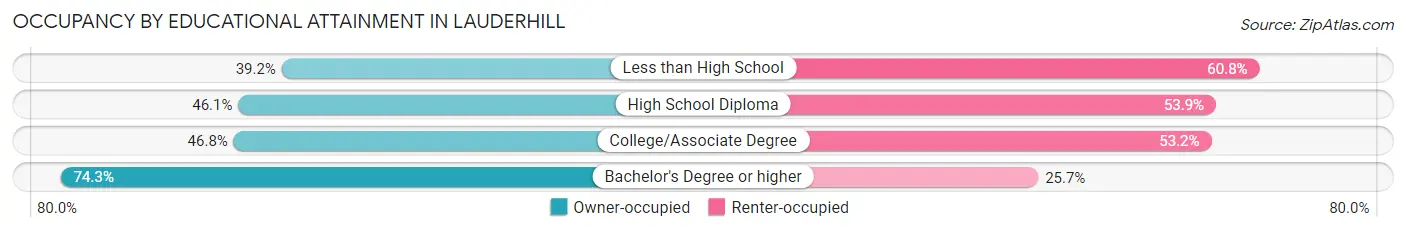
| Household Size | Owner-occupied | Renter-occupied |
| Less than High School | 1,362 (39.2%) | 2,111 (60.8%) |
| High School Diploma | 4,288 (46.1%) | 5,011 (53.9%) |
| College/Associate Degree | 3,654 (46.8%) | 4,147 (53.2%) |
| Bachelor's Degree or higher | 4,377 (74.3%) | 1,514 (25.7%) |
Occupancy by Age of Householder in Lauderhill
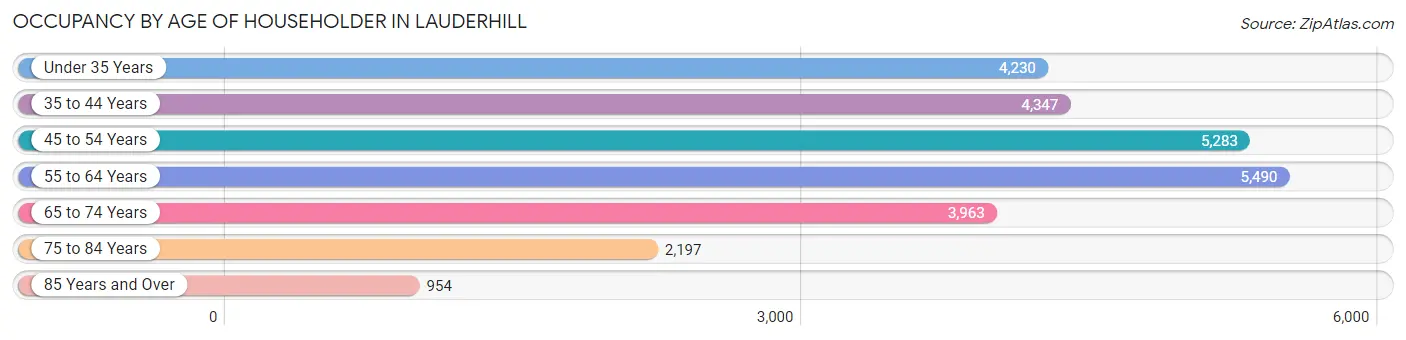
| Age Bracket | # Households | % Households |
| Under 35 Years | 4,230 | 16.0% |
| 35 to 44 Years | 4,347 | 16.4% |
| 45 to 54 Years | 5,283 | 20.0% |
| 55 to 64 Years | 5,490 | 20.7% |
| 65 to 74 Years | 3,963 | 15.0% |
| 75 to 84 Years | 2,197 | 8.3% |
| 85 Years and Over | 954 | 3.6% |
| Total | 26,464 | 100.0% |
Housing Finances in Lauderhill
Median Income by Occupancy in Lauderhill
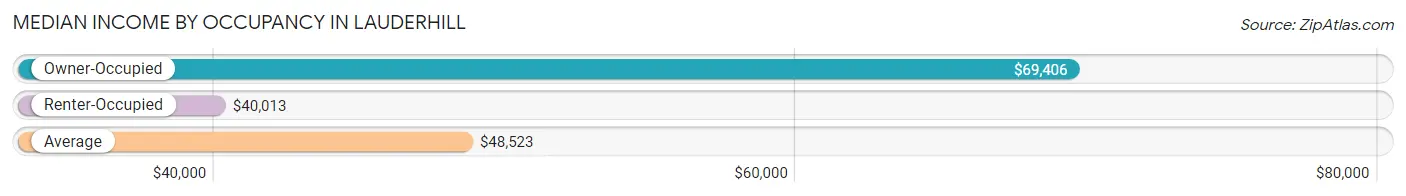
| Occupancy Type | # Households | Median Income |
| Owner-Occupied | 13,681 (51.7%) | $69,406 |
| Renter-Occupied | 12,783 (48.3%) | $40,013 |
| Average | 26,464 (100.0%) | $48,523 |
Occupancy by Householder Income Bracket in Lauderhill
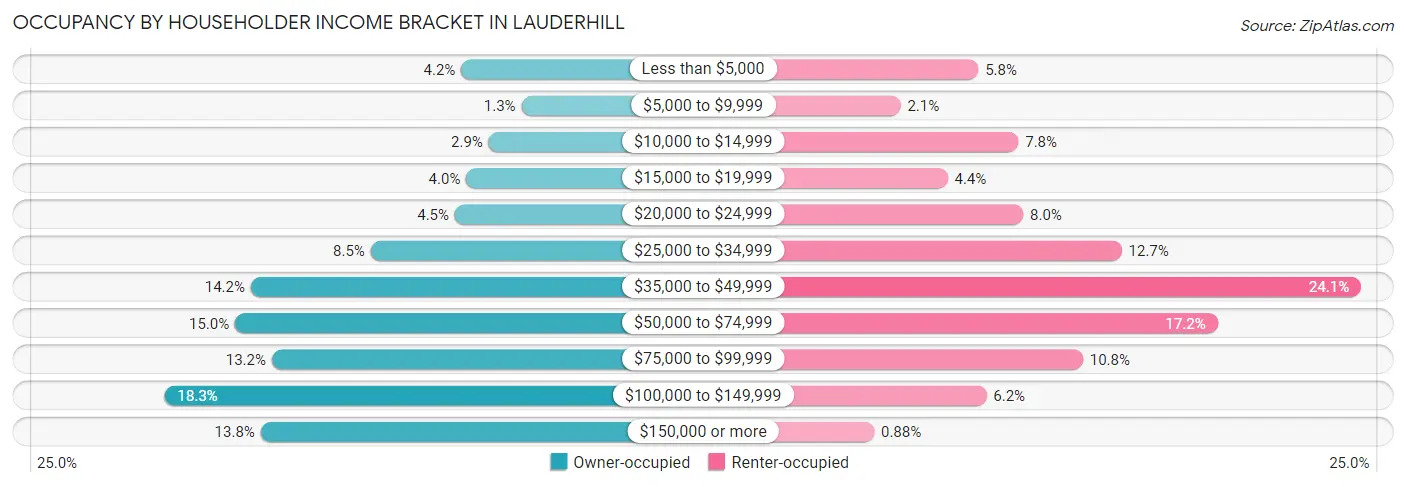
| Income Bracket | Owner-occupied | Renter-occupied |
| Less than $5,000 | 576 (4.2%) | 746 (5.8%) |
| $5,000 to $9,999 | 184 (1.3%) | 273 (2.1%) |
| $10,000 to $14,999 | 397 (2.9%) | 991 (7.7%) |
| $15,000 to $19,999 | 543 (4.0%) | 560 (4.4%) |
| $20,000 to $24,999 | 617 (4.5%) | 1,020 (8.0%) |
| $25,000 to $34,999 | 1,166 (8.5%) | 1,619 (12.7%) |
| $35,000 to $49,999 | 1,947 (14.2%) | 3,077 (24.1%) |
| $50,000 to $74,999 | 2,049 (15.0%) | 2,204 (17.2%) |
| $75,000 to $99,999 | 1,810 (13.2%) | 1,383 (10.8%) |
| $100,000 to $149,999 | 2,509 (18.3%) | 797 (6.2%) |
| $150,000 or more | 1,883 (13.8%) | 113 (0.9%) |
| Total | 13,681 (100.0%) | 12,783 (100.0%) |
Monthly Housing Cost Tiers in Lauderhill
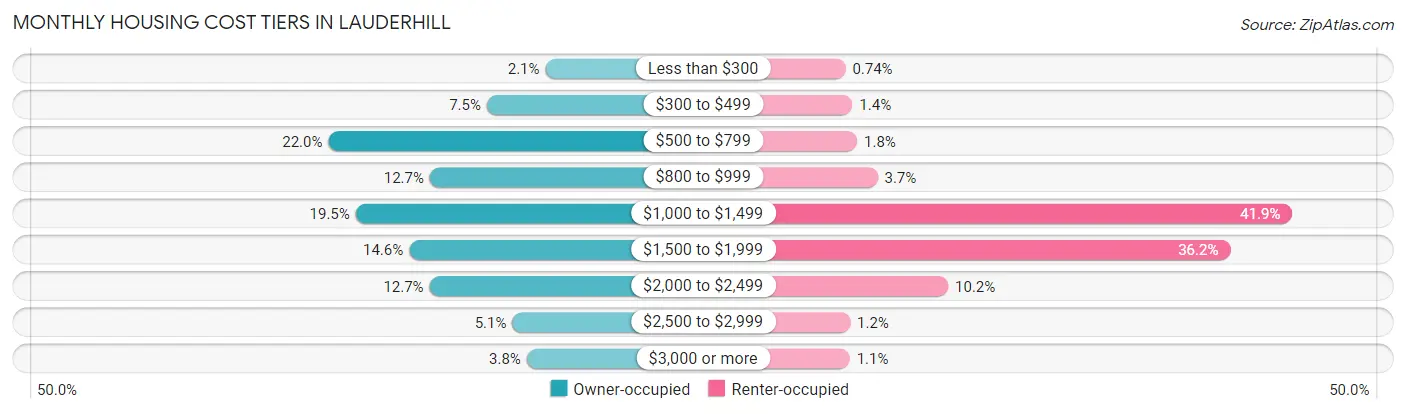
| Monthly Cost | Owner-occupied | Renter-occupied |
| Less than $300 | 282 (2.1%) | 94 (0.7%) |
| $300 to $499 | 1,019 (7.4%) | 177 (1.4%) |
| $500 to $799 | 3,015 (22.0%) | 232 (1.8%) |
| $800 to $999 | 1,737 (12.7%) | 472 (3.7%) |
| $1,000 to $1,499 | 2,672 (19.5%) | 5,353 (41.9%) |
| $1,500 to $1,999 | 1,999 (14.6%) | 4,622 (36.2%) |
| $2,000 to $2,499 | 1,742 (12.7%) | 1,303 (10.2%) |
| $2,500 to $2,999 | 698 (5.1%) | 150 (1.2%) |
| $3,000 or more | 517 (3.8%) | 144 (1.1%) |
| Total | 13,681 (100.0%) | 12,783 (100.0%) |
Physical Housing Characteristics in Lauderhill
Housing Structures in Lauderhill
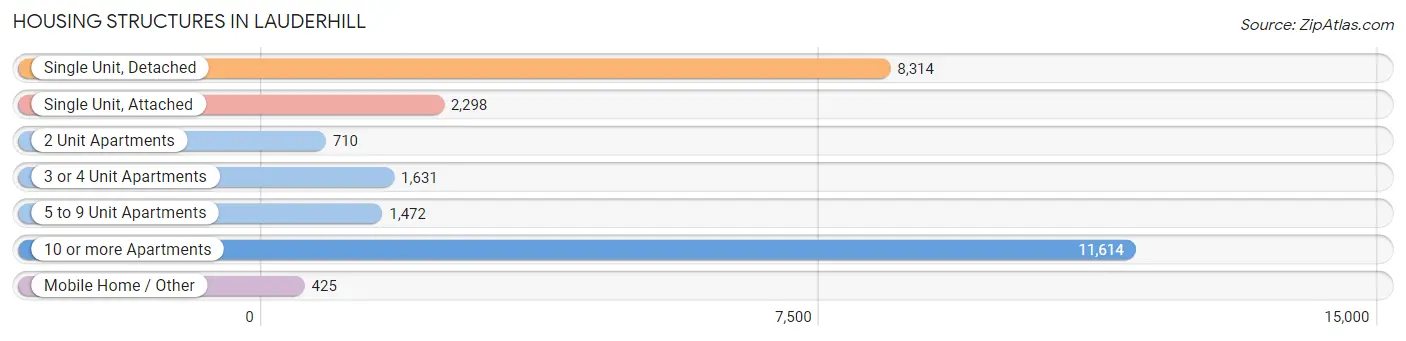
| Structure Type | # Housing Units | % Housing Units |
| Single Unit, Detached | 8,314 | 31.4% |
| Single Unit, Attached | 2,298 | 8.7% |
| 2 Unit Apartments | 710 | 2.7% |
| 3 or 4 Unit Apartments | 1,631 | 6.2% |
| 5 to 9 Unit Apartments | 1,472 | 5.6% |
| 10 or more Apartments | 11,614 | 43.9% |
| Mobile Home / Other | 425 | 1.6% |
| Total | 26,464 | 100.0% |
Housing Structures by Occupancy in Lauderhill
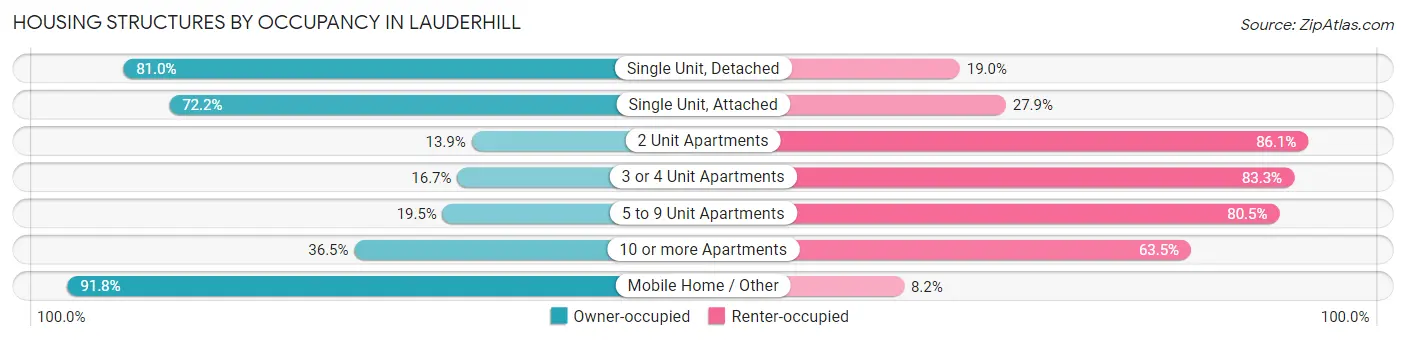
| Structure Type | Owner-occupied | Renter-occupied |
| Single Unit, Detached | 6,735 (81.0%) | 1,579 (19.0%) |
| Single Unit, Attached | 1,658 (72.2%) | 640 (27.9%) |
| 2 Unit Apartments | 99 (13.9%) | 611 (86.1%) |
| 3 or 4 Unit Apartments | 272 (16.7%) | 1,359 (83.3%) |
| 5 to 9 Unit Apartments | 287 (19.5%) | 1,185 (80.5%) |
| 10 or more Apartments | 4,240 (36.5%) | 7,374 (63.5%) |
| Mobile Home / Other | 390 (91.8%) | 35 (8.2%) |
| Total | 13,681 (51.7%) | 12,783 (48.3%) |
Housing Structures by Number of Rooms in Lauderhill
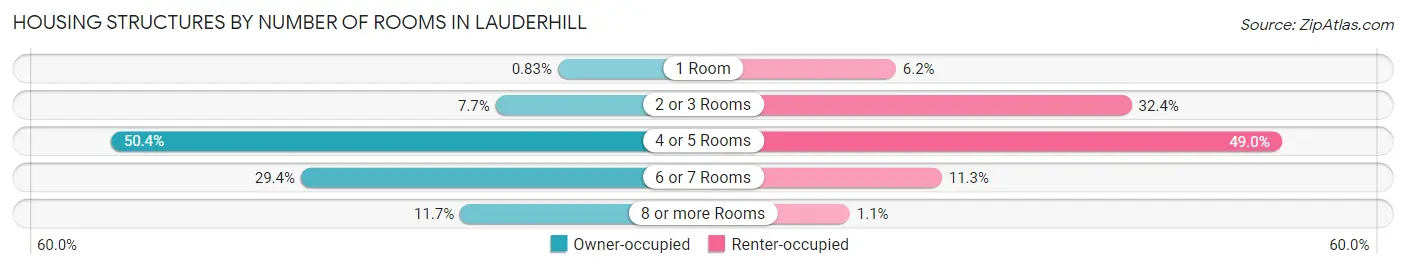
| Number of Rooms | Owner-occupied | Renter-occupied |
| 1 Room | 113 (0.8%) | 794 (6.2%) |
| 2 or 3 Rooms | 1,057 (7.7%) | 4,139 (32.4%) |
| 4 or 5 Rooms | 6,899 (50.4%) | 6,264 (49.0%) |
| 6 or 7 Rooms | 4,016 (29.3%) | 1,446 (11.3%) |
| 8 or more Rooms | 1,596 (11.7%) | 140 (1.1%) |
| Total | 13,681 (100.0%) | 12,783 (100.0%) |
Housing Structure by Heating Type in Lauderhill
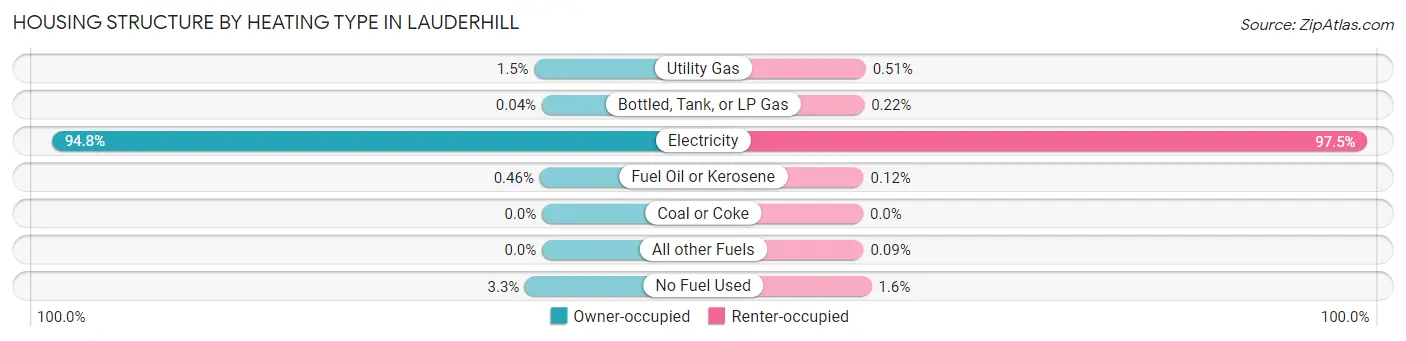
| Heating Type | Owner-occupied | Renter-occupied |
| Utility Gas | 202 (1.5%) | 65 (0.5%) |
| Bottled, Tank, or LP Gas | 6 (0.0%) | 28 (0.2%) |
| Electricity | 12,963 (94.8%) | 12,457 (97.5%) |
| Fuel Oil or Kerosene | 63 (0.5%) | 15 (0.1%) |
| Coal or Coke | 0 (0.0%) | 0 (0.0%) |
| All other Fuels | 0 (0.0%) | 11 (0.1%) |
| No Fuel Used | 447 (3.3%) | 207 (1.6%) |
| Total | 13,681 (100.0%) | 12,783 (100.0%) |
Household Vehicle Usage in Lauderhill
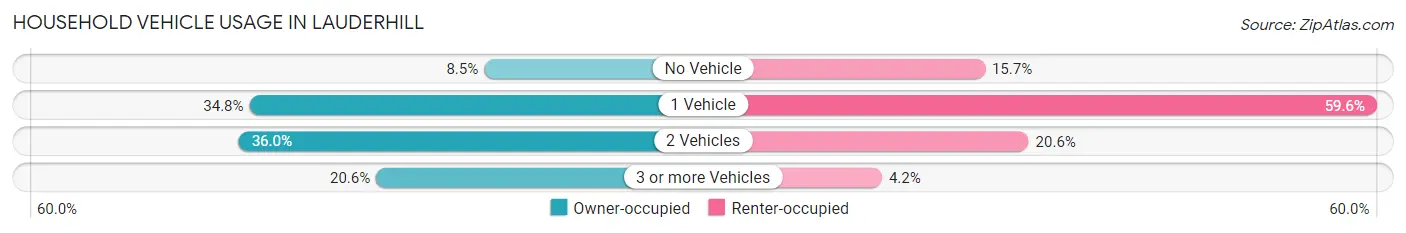
| Vehicles per Household | Owner-occupied | Renter-occupied |
| No Vehicle | 1,167 (8.5%) | 2,006 (15.7%) |
| 1 Vehicle | 4,764 (34.8%) | 7,615 (59.6%) |
| 2 Vehicles | 4,927 (36.0%) | 2,631 (20.6%) |
| 3 or more Vehicles | 2,823 (20.6%) | 531 (4.2%) |
| Total | 13,681 (100.0%) | 12,783 (100.0%) |
Real Estate & Mortgages in Lauderhill
Real Estate and Mortgage Overview in Lauderhill
| Characteristic | Without Mortgage | With Mortgage |
| Housing Units | 5,455 | 8,226 |
| Median Property Value | $159,500 | $262,000 |
| Median Household Income | $45,826 | $1,375 |
| Monthly Housing Costs | $673 | $517 |
| Real Estate Taxes | $1,662 | $336 |
Property Value by Mortgage Status in Lauderhill
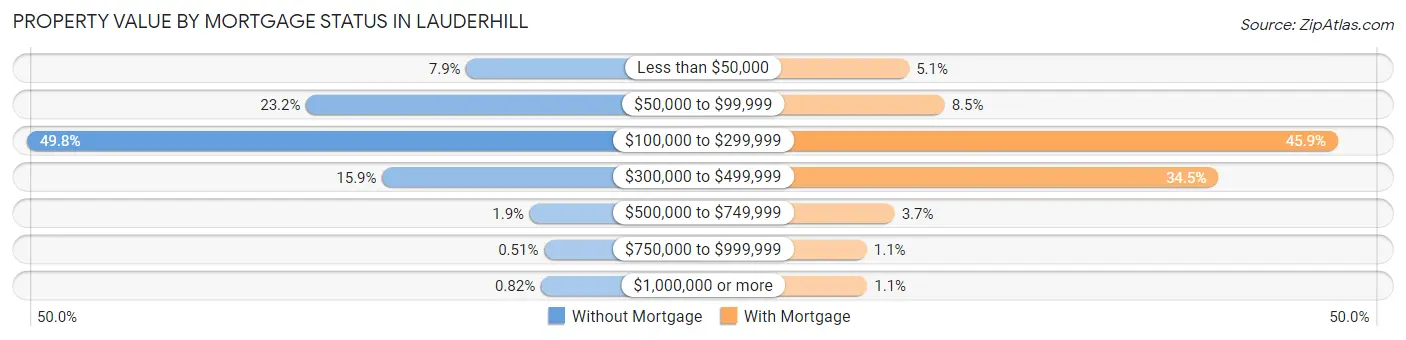
| Property Value | Without Mortgage | With Mortgage |
| Less than $50,000 | 432 (7.9%) | 420 (5.1%) |
| $50,000 to $99,999 | 1,264 (23.2%) | 698 (8.5%) |
| $100,000 to $299,999 | 2,715 (49.8%) | 3,779 (45.9%) |
| $300,000 to $499,999 | 869 (15.9%) | 2,841 (34.5%) |
| $500,000 to $749,999 | 102 (1.9%) | 307 (3.7%) |
| $750,000 to $999,999 | 28 (0.5%) | 89 (1.1%) |
| $1,000,000 or more | 45 (0.8%) | 92 (1.1%) |
| Total | 5,455 (100.0%) | 8,226 (100.0%) |
Household Income by Mortgage Status in Lauderhill
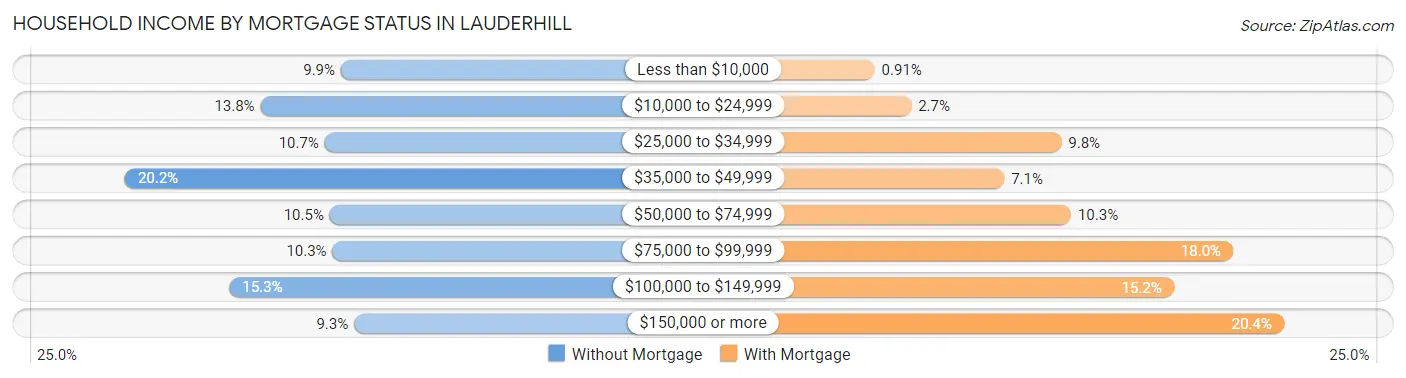
| Household Income | Without Mortgage | With Mortgage |
| Less than $10,000 | 542 (9.9%) | 75 (0.9%) |
| $10,000 to $24,999 | 751 (13.8%) | 218 (2.6%) |
| $25,000 to $34,999 | 584 (10.7%) | 806 (9.8%) |
| $35,000 to $49,999 | 1,103 (20.2%) | 582 (7.1%) |
| $50,000 to $74,999 | 571 (10.5%) | 844 (10.3%) |
| $75,000 to $99,999 | 564 (10.3%) | 1,478 (18.0%) |
| $100,000 to $149,999 | 832 (15.2%) | 1,246 (15.1%) |
| $150,000 or more | 508 (9.3%) | 1,677 (20.4%) |
| Total | 5,455 (100.0%) | 8,226 (100.0%) |
Property Value to Household Income Ratio in Lauderhill
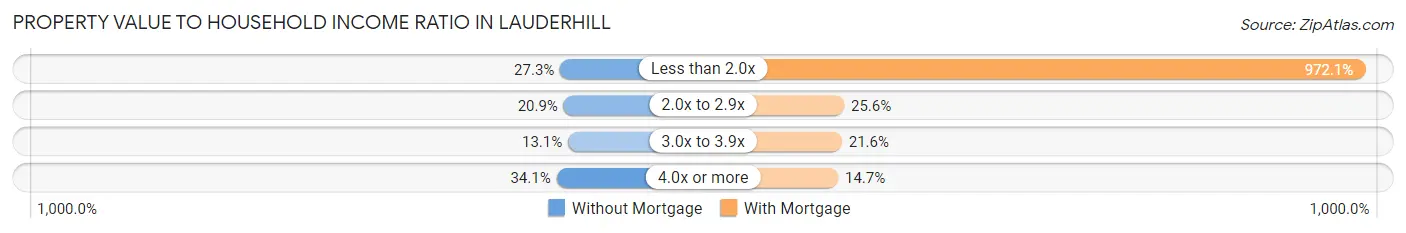
| Value-to-Income Ratio | Without Mortgage | With Mortgage |
| Less than 2.0x | 1,491 (27.3%) | 79,963 (972.1%) |
| 2.0x to 2.9x | 1,140 (20.9%) | 2,104 (25.6%) |
| 3.0x to 3.9x | 713 (13.1%) | 1,777 (21.6%) |
| 4.0x or more | 1,859 (34.1%) | 1,211 (14.7%) |
| Total | 5,455 (100.0%) | 8,226 (100.0%) |
Real Estate Taxes by Mortgage Status in Lauderhill

| Property Taxes | Without Mortgage | With Mortgage |
| Less than $800 | 907 (16.6%) | 28 (0.3%) |
| $800 to $1,499 | 1,475 (27.0%) | 961 (11.7%) |
| $800 to $1,499 | 2,903 (53.2%) | 1,399 (17.0%) |
| Total | 5,455 (100.0%) | 8,226 (100.0%) |
Health & Disability in Lauderhill
Health Insurance Coverage by Age in Lauderhill
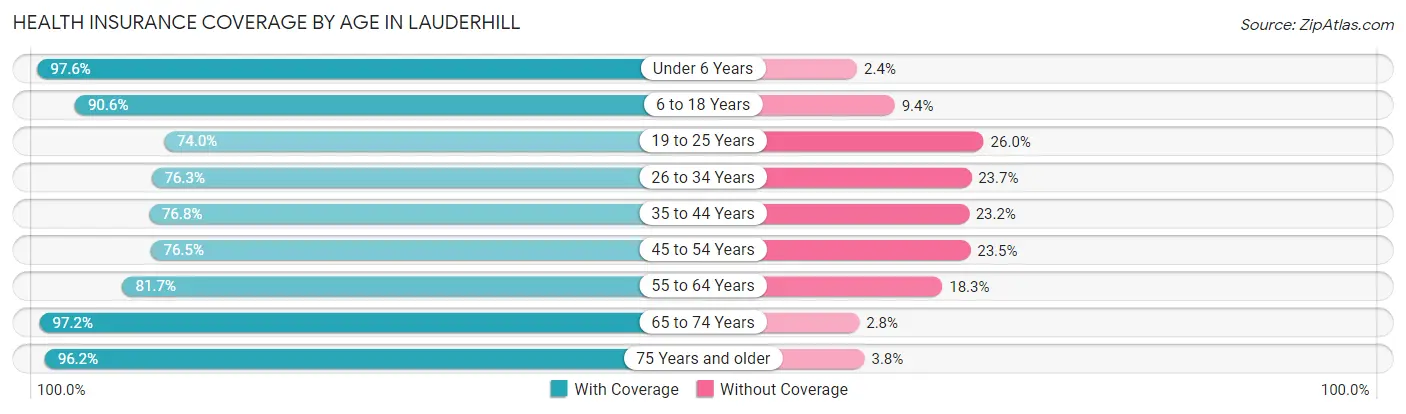
| Age Bracket | With Coverage | Without Coverage |
| Under 6 Years | 6,398 (97.6%) | 157 (2.4%) |
| 6 to 18 Years | 11,937 (90.6%) | 1,238 (9.4%) |
| 19 to 25 Years | 4,494 (74.0%) | 1,578 (26.0%) |
| 26 to 34 Years | 7,051 (76.3%) | 2,187 (23.7%) |
| 35 to 44 Years | 6,878 (76.8%) | 2,078 (23.2%) |
| 45 to 54 Years | 6,933 (76.5%) | 2,128 (23.5%) |
| 55 to 64 Years | 7,724 (81.7%) | 1,727 (18.3%) |
| 65 to 74 Years | 6,265 (97.2%) | 180 (2.8%) |
| 75 Years and older | 4,376 (96.2%) | 172 (3.8%) |
| Total | 62,056 (84.4%) | 11,445 (15.6%) |
Health Insurance Coverage by Citizenship Status in Lauderhill

| Citizenship Status | With Coverage | Without Coverage |
| Native Born | 6,398 (97.6%) | 157 (2.4%) |
| Foreign Born, Citizen | 11,937 (90.6%) | 1,238 (9.4%) |
| Foreign Born, not a Citizen | 4,494 (74.0%) | 1,578 (26.0%) |
Health Insurance Coverage by Household Income in Lauderhill

| Household Income | With Coverage | Without Coverage |
| Under $25,000 | 10,276 (83.2%) | 2,075 (16.8%) |
| $25,000 to $49,999 | 14,249 (77.0%) | 4,246 (23.0%) |
| $50,000 to $74,999 | 11,023 (84.8%) | 1,984 (15.2%) |
| $75,000 to $99,999 | 8,929 (86.8%) | 1,363 (13.2%) |
| $100,000 and over | 17,383 (91.1%) | 1,704 (8.9%) |
Public vs Private Health Insurance Coverage by Age in Lauderhill

| Age Bracket | Public Insurance | Private Insurance |
| Under 6 | 4,350 (66.4%) | 2,374 (36.2%) |
| 6 to 18 Years | 7,598 (57.7%) | 5,144 (39.0%) |
| 19 to 25 Years | 1,357 (22.4%) | 3,419 (56.3%) |
| 25 to 34 Years | 1,792 (19.4%) | 5,433 (58.8%) |
| 35 to 44 Years | 1,283 (14.3%) | 5,996 (66.9%) |
| 45 to 54 Years | 1,296 (14.3%) | 5,905 (65.2%) |
| 55 to 64 Years | 1,564 (16.6%) | 6,400 (67.7%) |
| 65 to 74 Years | 5,591 (86.8%) | 2,517 (39.1%) |
| 75 Years and over | 4,260 (93.7%) | 1,073 (23.6%) |
| Total | 29,091 (39.6%) | 38,261 (52.1%) |
Disability Status by Sex by Age in Lauderhill
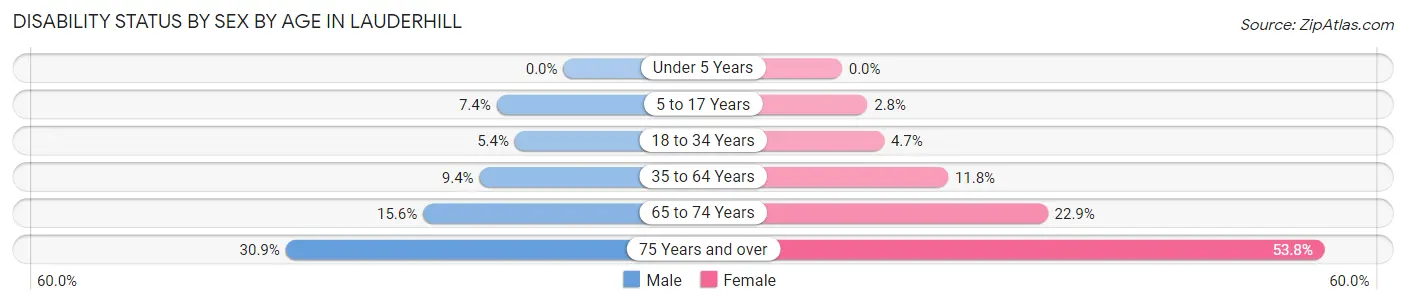
| Age Bracket | Male | Female |
| Under 5 Years | 0 (0.0%) | 0 (0.0%) |
| 5 to 17 Years | 548 (7.4%) | 181 (2.8%) |
| 18 to 34 Years | 421 (5.4%) | 384 (4.7%) |
| 35 to 64 Years | 1,139 (9.3%) | 1,806 (11.8%) |
| 65 to 74 Years | 447 (15.6%) | 822 (22.9%) |
| 75 Years and over | 524 (30.9%) | 1,535 (53.8%) |
Disability Class by Sex by Age in Lauderhill
Disability Class: Hearing Difficulty
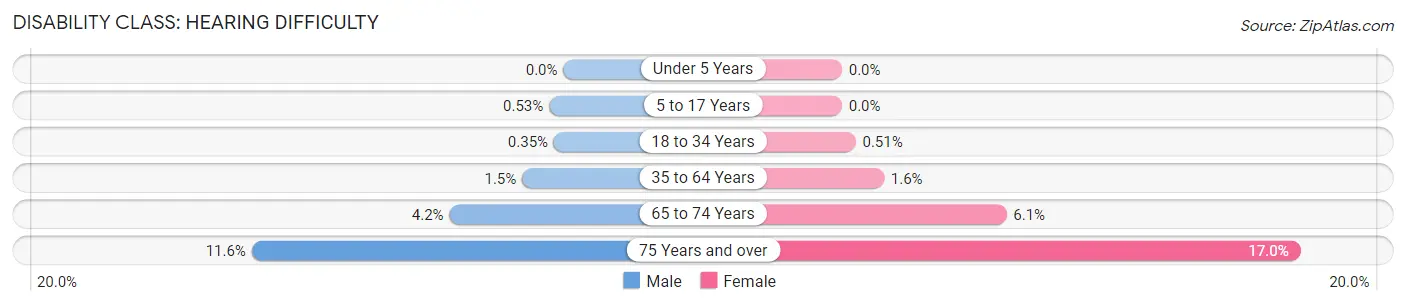
| Age Bracket | Male | Female |
| Under 5 Years | 0 (0.0%) | 0 (0.0%) |
| 5 to 17 Years | 39 (0.5%) | 0 (0.0%) |
| 18 to 34 Years | 27 (0.4%) | 42 (0.5%) |
| 35 to 64 Years | 186 (1.5%) | 238 (1.6%) |
| 65 to 74 Years | 121 (4.2%) | 219 (6.1%) |
| 75 Years and over | 196 (11.6%) | 486 (17.0%) |
Disability Class: Vision Difficulty
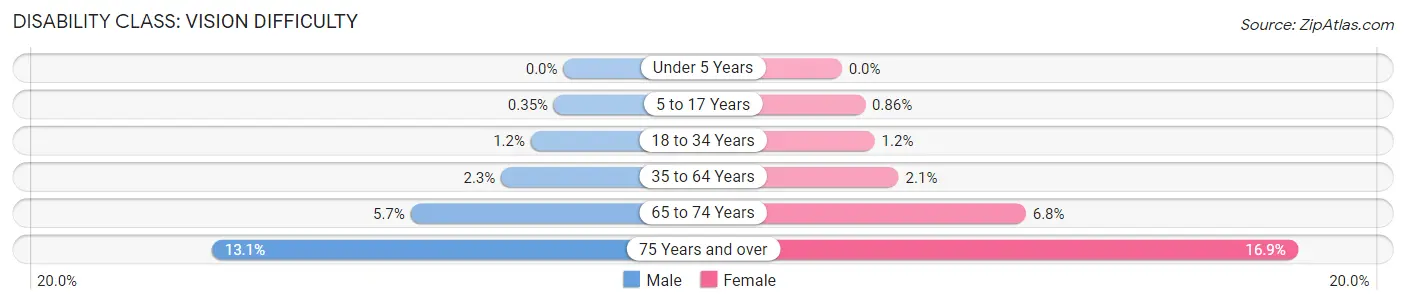
| Age Bracket | Male | Female |
| Under 5 Years | 0 (0.0%) | 0 (0.0%) |
| 5 to 17 Years | 26 (0.4%) | 55 (0.9%) |
| 18 to 34 Years | 94 (1.2%) | 100 (1.2%) |
| 35 to 64 Years | 282 (2.3%) | 323 (2.1%) |
| 65 to 74 Years | 162 (5.7%) | 245 (6.8%) |
| 75 Years and over | 221 (13.1%) | 483 (16.9%) |
Disability Class: Cognitive Difficulty
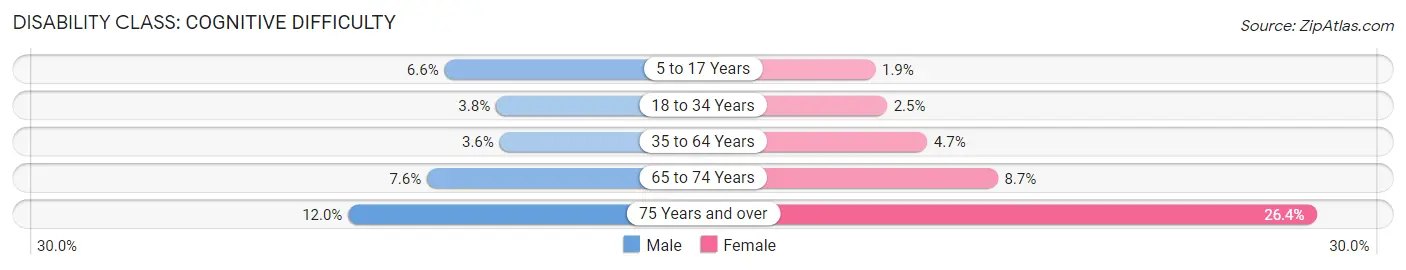
| Age Bracket | Male | Female |
| 5 to 17 Years | 488 (6.6%) | 118 (1.8%) |
| 18 to 34 Years | 292 (3.7%) | 204 (2.5%) |
| 35 to 64 Years | 432 (3.5%) | 725 (4.7%) |
| 65 to 74 Years | 217 (7.6%) | 311 (8.7%) |
| 75 Years and over | 203 (12.0%) | 754 (26.4%) |
Disability Class: Ambulatory Difficulty
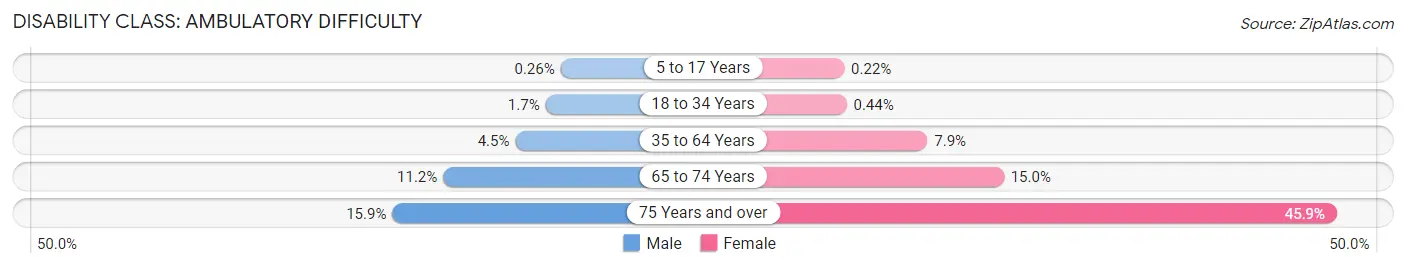
| Age Bracket | Male | Female |
| 5 to 17 Years | 19 (0.3%) | 14 (0.2%) |
| 18 to 34 Years | 129 (1.7%) | 36 (0.4%) |
| 35 to 64 Years | 543 (4.5%) | 1,213 (7.9%) |
| 65 to 74 Years | 319 (11.2%) | 539 (15.0%) |
| 75 Years and over | 269 (15.9%) | 1,311 (45.9%) |
Disability Class: Self-Care Difficulty
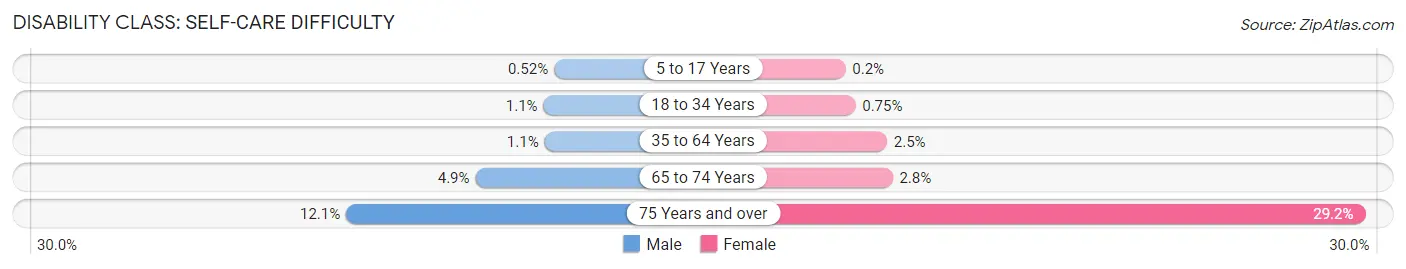
| Age Bracket | Male | Female |
| 5 to 17 Years | 38 (0.5%) | 13 (0.2%) |
| 18 to 34 Years | 86 (1.1%) | 61 (0.7%) |
| 35 to 64 Years | 128 (1.1%) | 383 (2.5%) |
| 65 to 74 Years | 140 (4.9%) | 101 (2.8%) |
| 75 Years and over | 205 (12.1%) | 832 (29.1%) |
Technology Access in Lauderhill
Computing Device Access in Lauderhill
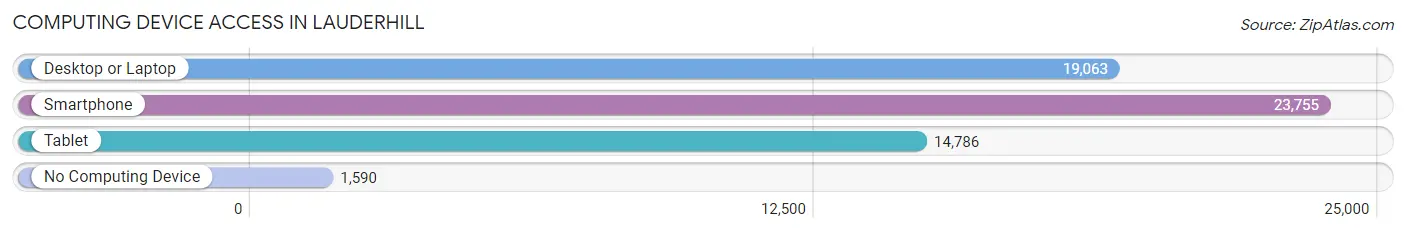
| Device Type | # Households | % Households |
| Desktop or Laptop | 19,063 | 72.0% |
| Smartphone | 23,755 | 89.8% |
| Tablet | 14,786 | 55.9% |
| No Computing Device | 1,590 | 6.0% |
| Total | 26,464 | 100.0% |
Internet Access in Lauderhill
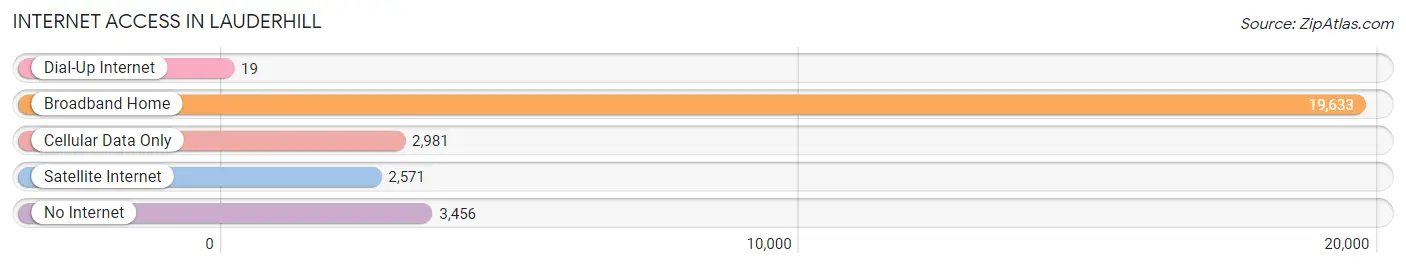
| Internet Type | # Households | % Households |
| Dial-Up Internet | 19 | 0.1% |
| Broadband Home | 19,633 | 74.2% |
| Cellular Data Only | 2,981 | 11.3% |
| Satellite Internet | 2,571 | 9.7% |
| No Internet | 3,456 | 13.1% |
| Total | 26,464 | 100.0% |
Lauderhill Summary
Lauderhill is a city located in Broward County, Florida, United States. It is part of the Miami metropolitan area, which was home to an estimated 6,012,331 people in 2015. The city is located in the central part of the county, just west of Fort Lauderdale. It is bordered by Tamarac to the north, Plantation to the east, Sunrise to the south, and Lauderhill to the west.
History
Lauderhill was founded in 1959 by a group of developers led by Harold E. Kohn and Jack L. Rosenberg. The city was named after the developer's father, Harry Lauderhill, who was a prominent real estate investor in the area. The city was incorporated in 1959 and was the first city in Broward County to be incorporated since the county was created in 1915.
The city has grown steadily since its incorporation, and by the 2000 census, it had a population of 60,742. The city has continued to grow since then, and as of the 2010 census, it had a population of 66,887.
Geography
Lauderhill is located in central Broward County, just west of Fort Lauderdale. It is bordered by Tamarac to the north, Plantation to the east, Sunrise to the south, and Lauderhill to the west. The city covers an area of 8.3 square miles, and has a population density of 8,092 people per square mile.
The city is located in the Miami metropolitan area, which is home to an estimated 6,012,331 people in 2015. The city is located in the humid subtropical climate zone, and has an average annual temperature of 76.7°F.
Economy
Lauderhill is home to a variety of businesses, including retail stores, restaurants, and professional services. The city is also home to a number of corporate headquarters, including the headquarters of the National Beverage Corporation, which is the parent company of the popular soft drink, Faygo.
The city is also home to a number of industrial and manufacturing businesses, including the Lauderhill Industrial Park, which is home to a variety of businesses, including a printing company, a plastics manufacturer, and a food processing plant.
Demographics
As of the 2010 census, the city had a population of 66,887. The racial makeup of the city was 44.3% White, 33.2% African American, 0.4% Native American, 5.2% Asian, 0.1% Pacific Islander, 13.2% from other races, and 3.7% from two or more races. Hispanic or Latino of any race were 33.2% of the population.
The median income for a household in the city was $37,945, and the median income for a family was $41,945. The per capita income for the city was $19,945. About 17.2% of families and 20.3% of the population were below the poverty line, including 28.2% of those under age 18 and 11.2% of those age 65 or over.
Common Questions
What is Per Capita Income in Lauderhill?
Per Capita income in Lauderhill is $24,883.
What is the Median Family Income in Lauderhill?
Median Family Income in Lauderhill is $60,005.
What is the Median Household income in Lauderhill?
Median Household Income in Lauderhill is $48,523.
What is Income or Wage Gap in Lauderhill?
Income or Wage Gap in Lauderhill is 5.6%.
Women in Lauderhill earn 94.4 cents for every dollar earned by a man.
What is Family Income Deficit in Lauderhill?
Family Income Deficit in Lauderhill is $10,829.
Families that are below poverty line in Lauderhill earn $10,829 less on average than the poverty threshold level.
What is Inequality or Gini Index in Lauderhill?
Inequality or Gini Index in Lauderhill is 0.44.
What is the Total Population of Lauderhill?
Total Population of Lauderhill is 73,987.
What is the Total Male Population of Lauderhill?
Total Male Population of Lauderhill is 34,723.
What is the Total Female Population of Lauderhill?
Total Female Population of Lauderhill is 39,264.
What is the Ratio of Males per 100 Females in Lauderhill?
There are 88.43 Males per 100 Females in Lauderhill.
What is the Ratio of Females per 100 Males in Lauderhill?
There are 113.08 Females per 100 Males in Lauderhill.
What is the Median Population Age in Lauderhill?
Median Population Age in Lauderhill is 37.0 Years.
What is the Average Family Size in Lauderhill
Average Family Size in Lauderhill is 3.5 People.
What is the Average Household Size in Lauderhill
Average Household Size in Lauderhill is 2.8 People.
How Large is the Labor Force in Lauderhill?
There are 37,096 People in the Labor Forcein in Lauderhill.
What is the Percentage of People in the Labor Force in Lauderhill?
65.7% of People are in the Labor Force in Lauderhill.
What is the Unemployment Rate in Lauderhill?
Unemployment Rate in Lauderhill is 8.6%.