Oakland Park, FL Map & Demographics
Oakland Park Map
Oakland Park Overview
$35,533
PER CAPITA INCOME
$67,065
AVG FAMILY INCOME
$64,989
AVG HOUSEHOLD INCOME
19.3%
WAGE / INCOME GAP [ % ]
80.7¢/ $1
WAGE / INCOME GAP [ $ ]
$9,903
FAMILY INCOME DEFICIT
0.43
INEQUALITY / GINI INDEX
44,056
TOTAL POPULATION
23,085
MALE POPULATION
20,971
FEMALE POPULATION
110.08
MALES / 100 FEMALES
90.84
FEMALES / 100 MALES
39.1
MEDIAN AGE
3.4
AVG FAMILY SIZE
2.5
AVG HOUSEHOLD SIZE
27,526
LABOR FORCE [ PEOPLE ]
75.7%
PERCENT IN LABOR FORCE
6.4%
UNEMPLOYMENT RATE
Income in Oakland Park
Income Overview in Oakland Park
Per Capita Income in Oakland Park is $35,533, while median incomes of families and households are $67,065 and $64,989 respectively.
| Characteristic | Number | Measure |
| Per Capita Income | 44,056 | $35,533 |
| Median Family Income | 9,232 | $67,065 |
| Mean Family Income | 9,232 | $89,182 |
| Median Household Income | 17,415 | $64,989 |
| Mean Household Income | 17,415 | $85,945 |
| Income Deficit | 9,232 | $9,903 |
| Wage / Income Gap (%) | 44,056 | 19.33% |
| Wage / Income Gap ($) | 44,056 | 80.67¢ per $1 |
| Gini / Inequality Index | 44,056 | 0.43 |
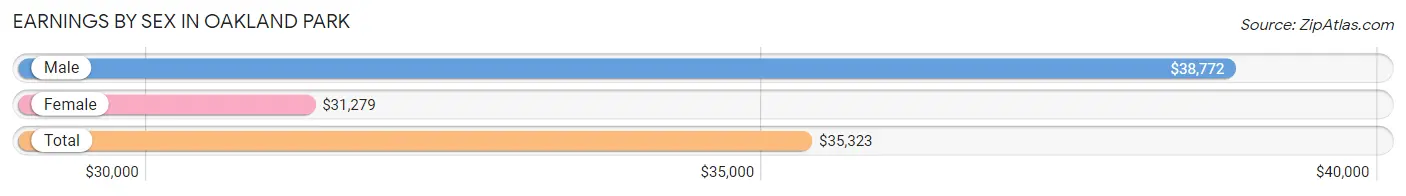
Earnings by Sex in Oakland Park
Average Earnings in Oakland Park are $35,323, $38,772 for men and $31,279 for women, a difference of 19.3%.
| Sex | Number | Average Earnings |
| Male | 15,137 (55.1%) | $38,772 |
| Female | 12,346 (44.9%) | $31,279 |
| Total | 27,483 (100.0%) | $35,323 |
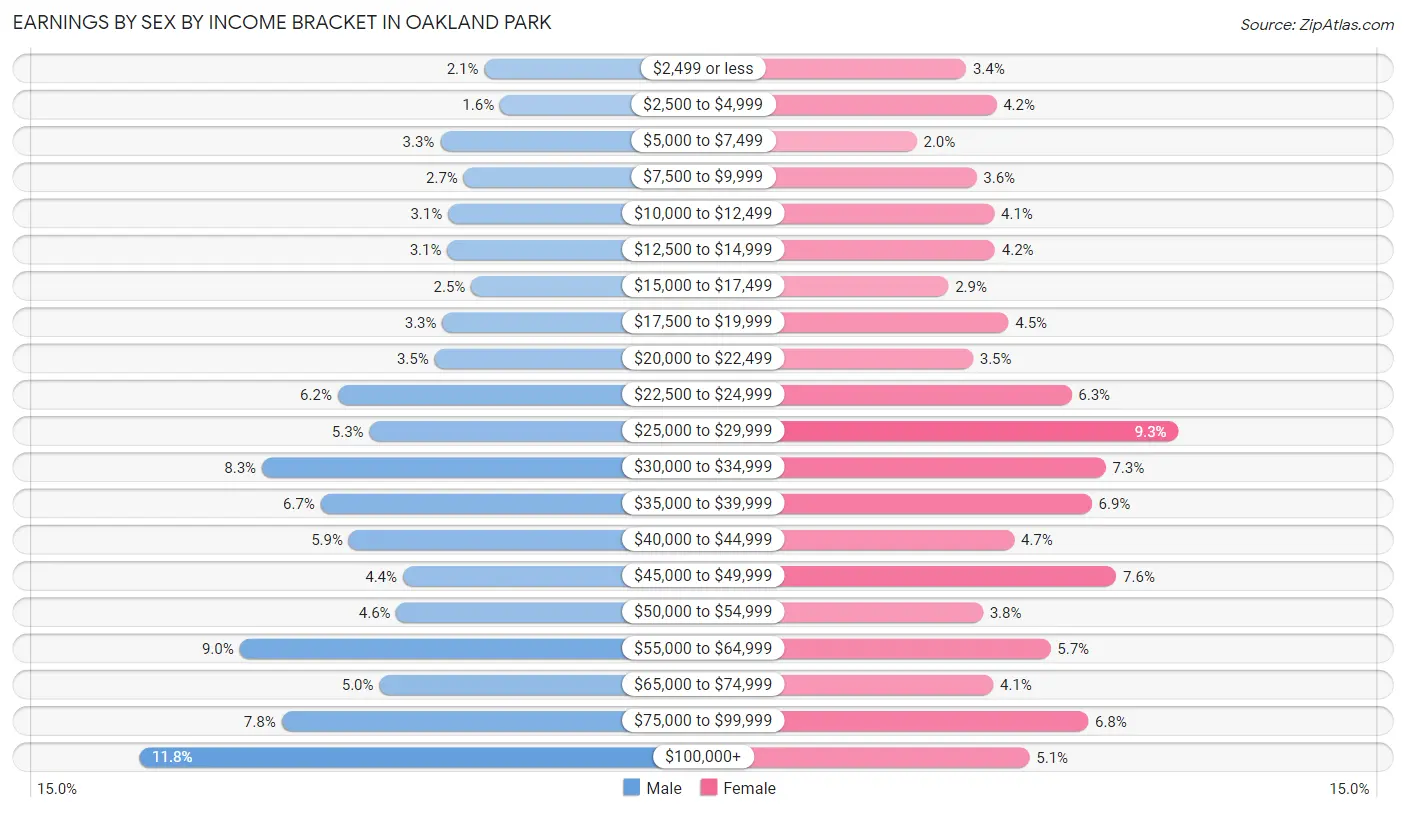
Earnings by Sex by Income Bracket in Oakland Park
The most common earnings brackets in Oakland Park are $100,000+ for men (1,783 | 11.8%) and $25,000 to $29,999 for women (1,151 | 9.3%).
| Income | Male | Female |
| $2,499 or less | 315 (2.1%) | 413 (3.4%) |
| $2,500 to $4,999 | 249 (1.6%) | 519 (4.2%) |
| $5,000 to $7,499 | 502 (3.3%) | 242 (2.0%) |
| $7,500 to $9,999 | 403 (2.7%) | 450 (3.6%) |
| $10,000 to $12,499 | 470 (3.1%) | 511 (4.1%) |
| $12,500 to $14,999 | 473 (3.1%) | 513 (4.2%) |
| $15,000 to $17,499 | 371 (2.5%) | 352 (2.9%) |
| $17,500 to $19,999 | 494 (3.3%) | 561 (4.5%) |
| $20,000 to $22,499 | 527 (3.5%) | 437 (3.5%) |
| $22,500 to $24,999 | 939 (6.2%) | 779 (6.3%) |
| $25,000 to $29,999 | 804 (5.3%) | 1,151 (9.3%) |
| $30,000 to $34,999 | 1,261 (8.3%) | 898 (7.3%) |
| $35,000 to $39,999 | 1,011 (6.7%) | 849 (6.9%) |
| $40,000 to $44,999 | 891 (5.9%) | 580 (4.7%) |
| $45,000 to $49,999 | 661 (4.4%) | 935 (7.6%) |
| $50,000 to $54,999 | 688 (4.5%) | 472 (3.8%) |
| $55,000 to $64,999 | 1,357 (9.0%) | 706 (5.7%) |
| $65,000 to $74,999 | 761 (5.0%) | 508 (4.1%) |
| $75,000 to $99,999 | 1,177 (7.8%) | 837 (6.8%) |
| $100,000+ | 1,783 (11.8%) | 633 (5.1%) |
| Total | 15,137 (100.0%) | 12,346 (100.0%) |
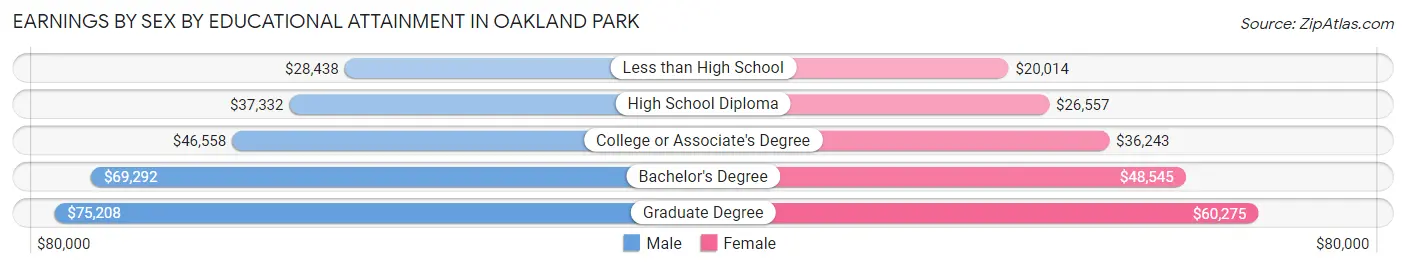
Earnings by Sex by Educational Attainment in Oakland Park
Average earnings in Oakland Park are $42,874 for men and $34,417 for women, a difference of 19.7%. Men with an educational attainment of graduate degree enjoy the highest average annual earnings of $75,208, while those with less than high school education earn the least with $28,438. Women with an educational attainment of graduate degree earn the most with the average annual earnings of $60,275, while those with less than high school education have the smallest earnings of $20,014.
| Educational Attainment | Male Income | Female Income |
| Less than High School | $28,438 | $20,014 |
| High School Diploma | $37,332 | $26,557 |
| College or Associate's Degree | $46,558 | $36,243 |
| Bachelor's Degree | $69,292 | $48,545 |
| Graduate Degree | $75,208 | $60,275 |
| Total | $42,874 | $34,417 |
Family Income in Oakland Park
Family Income Brackets in Oakland Park
According to the Oakland Park family income data, there are 2,225 families falling into the $50,000 to $74,999 income range, which is the most common income bracket and makes up 24.1% of all families. Conversely, the $10,000 to $14,999 income bracket is the least frequent group with only 222 families (2.4%) belonging to this category.
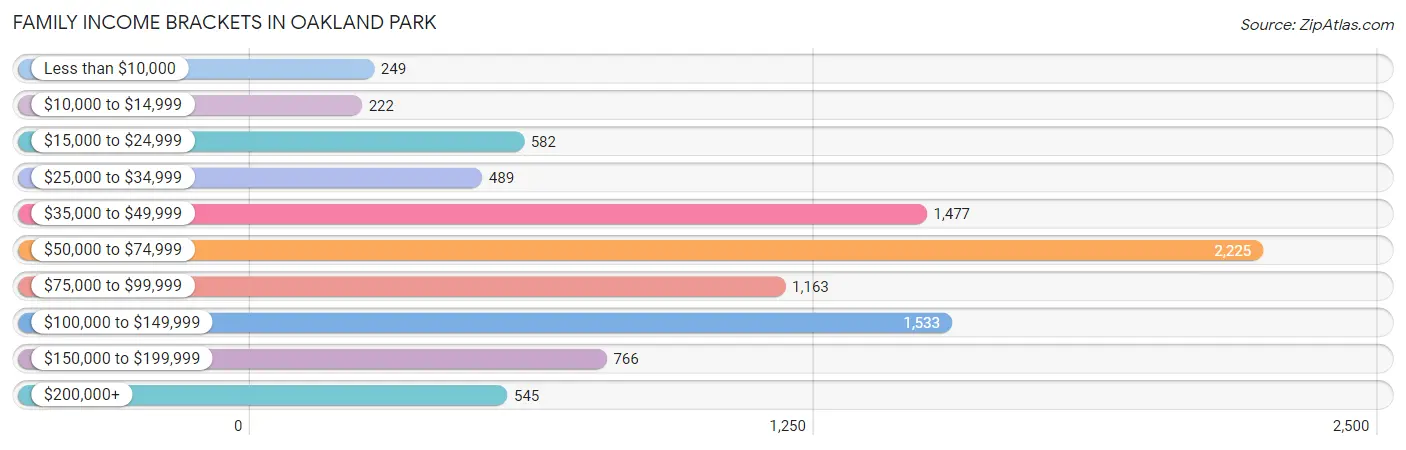
| Income Bracket | # Families | % Families |
| Less than $10,000 | 249 | 2.7% |
| $10,000 to $14,999 | 222 | 2.4% |
| $15,000 to $24,999 | 582 | 6.3% |
| $25,000 to $34,999 | 489 | 5.3% |
| $35,000 to $49,999 | 1,477 | 16.0% |
| $50,000 to $74,999 | 2,225 | 24.1% |
| $75,000 to $99,999 | 1,163 | 12.6% |
| $100,000 to $149,999 | 1,533 | 16.6% |
| $150,000 to $199,999 | 766 | 8.3% |
| $200,000+ | 545 | 5.9% |
Family Income by Famaliy Size in Oakland Park
6-person families (651 | 7.0%) account for the highest median family income in Oakland Park with $79,727 per family, while 2-person families (4,365 | 47.3%) have the highest median income of $31,536 per family member.
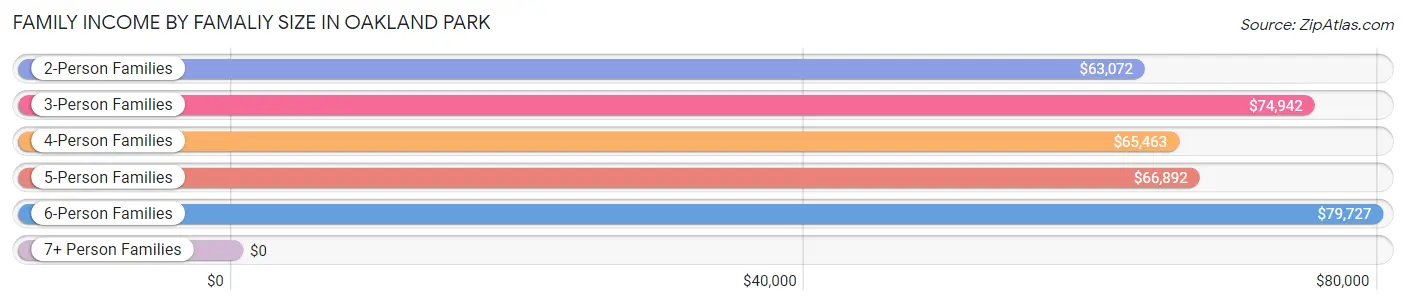
| Income Bracket | # Families | Median Income |
| 2-Person Families | 4,365 (47.3%) | $63,072 |
| 3-Person Families | 2,192 (23.7%) | $74,942 |
| 4-Person Families | 1,192 (12.9%) | $65,463 |
| 5-Person Families | 753 (8.2%) | $66,892 |
| 6-Person Families | 651 (7.0%) | $79,727 |
| 7+ Person Families | 79 (0.9%) | $0 |
| Total | 9,232 (100.0%) | $67,065 |
Family Income by Number of Earners in Oakland Park
The median family income in Oakland Park is $67,065, with families comprising 3+ earners (1,571) having the highest median family income of $104,708, while families with no earners (716) have the lowest median family income of $33,900, accounting for 17.0% and 7.8% of families, respectively.
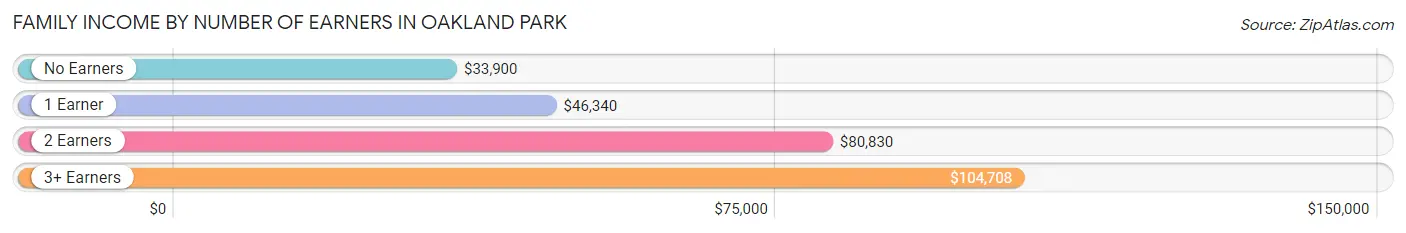
| Number of Earners | # Families | Median Income |
| No Earners | 716 (7.8%) | $33,900 |
| 1 Earner | 2,972 (32.2%) | $46,340 |
| 2 Earners | 3,973 (43.0%) | $80,830 |
| 3+ Earners | 1,571 (17.0%) | $104,708 |
| Total | 9,232 (100.0%) | $67,065 |
Household Income in Oakland Park
Household Income Brackets in Oakland Park
With 4,058 households falling in the category, the $50,000 to $74,999 income range is the most frequent in Oakland Park, accounting for 23.3% of all households. In contrast, only 522 households (3.0%) fall into the $10,000 to $14,999 income bracket, making it the least populous group.
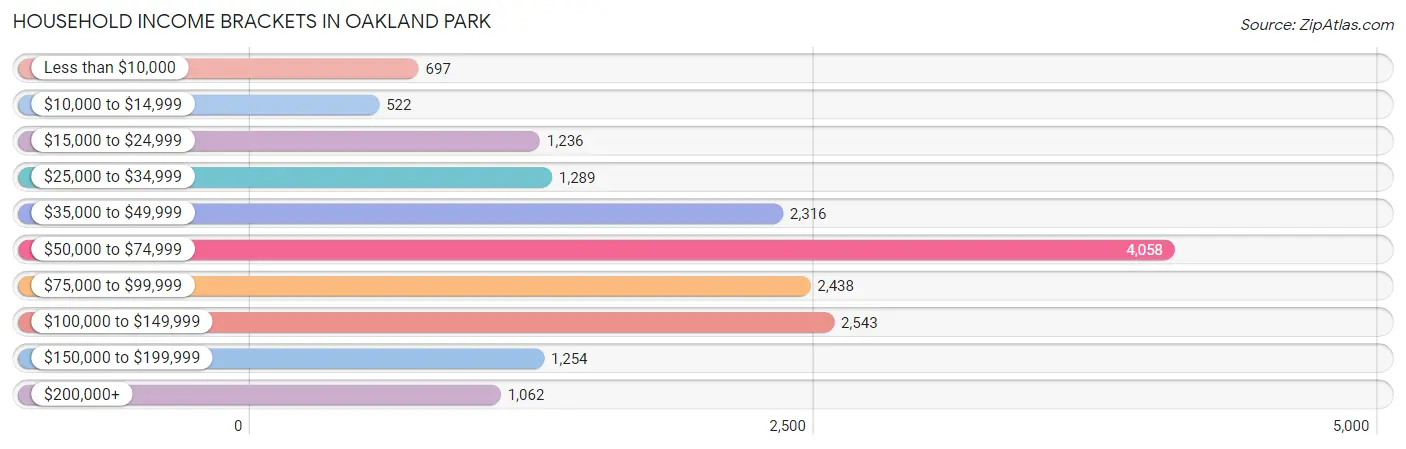
| Income Bracket | # Households | % Households |
| Less than $10,000 | 697 | 4.0% |
| $10,000 to $14,999 | 522 | 3.0% |
| $15,000 to $24,999 | 1,236 | 7.1% |
| $25,000 to $34,999 | 1,289 | 7.4% |
| $35,000 to $49,999 | 2,316 | 13.3% |
| $50,000 to $74,999 | 4,058 | 23.3% |
| $75,000 to $99,999 | 2,438 | 14.0% |
| $100,000 to $149,999 | 2,543 | 14.6% |
| $150,000 to $199,999 | 1,254 | 7.2% |
| $200,000+ | 1,062 | 6.1% |
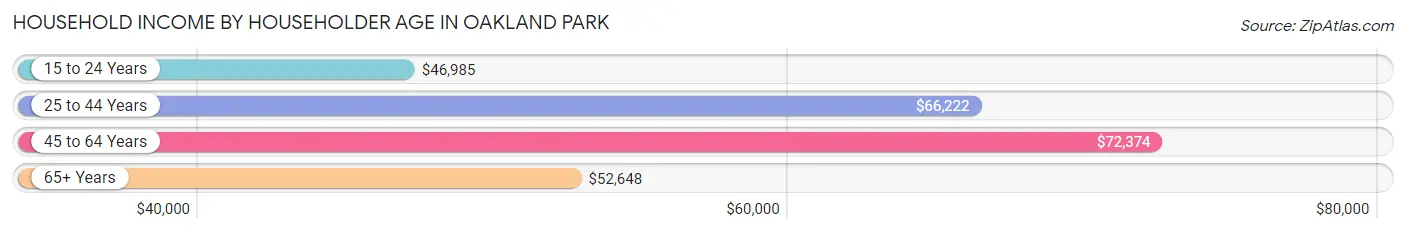
Household Income by Householder Age in Oakland Park
The median household income in Oakland Park is $64,989, with the highest median household income of $72,374 found in the 45 to 64 years age bracket for the primary householder. A total of 7,183 households (41.2%) fall into this category. Meanwhile, the 15 to 24 years age bracket for the primary householder has the lowest median household income of $46,985, with 484 households (2.8%) in this group.
| Income Bracket | # Households | Median Income |
| 15 to 24 Years | 484 (2.8%) | $46,985 |
| 25 to 44 Years | 6,276 (36.0%) | $66,222 |
| 45 to 64 Years | 7,183 (41.2%) | $72,374 |
| 65+ Years | 3,472 (19.9%) | $52,648 |
| Total | 17,415 (100.0%) | $64,989 |
Poverty in Oakland Park
Income Below Poverty by Sex and Age in Oakland Park
With 13.5% poverty level for males and 14.4% for females among the residents of Oakland Park, 5 year old males and 15 year old females are the most vulnerable to poverty, with 33 males (57.9%) and 140 females (36.5%) in their respective age groups living below the poverty level.
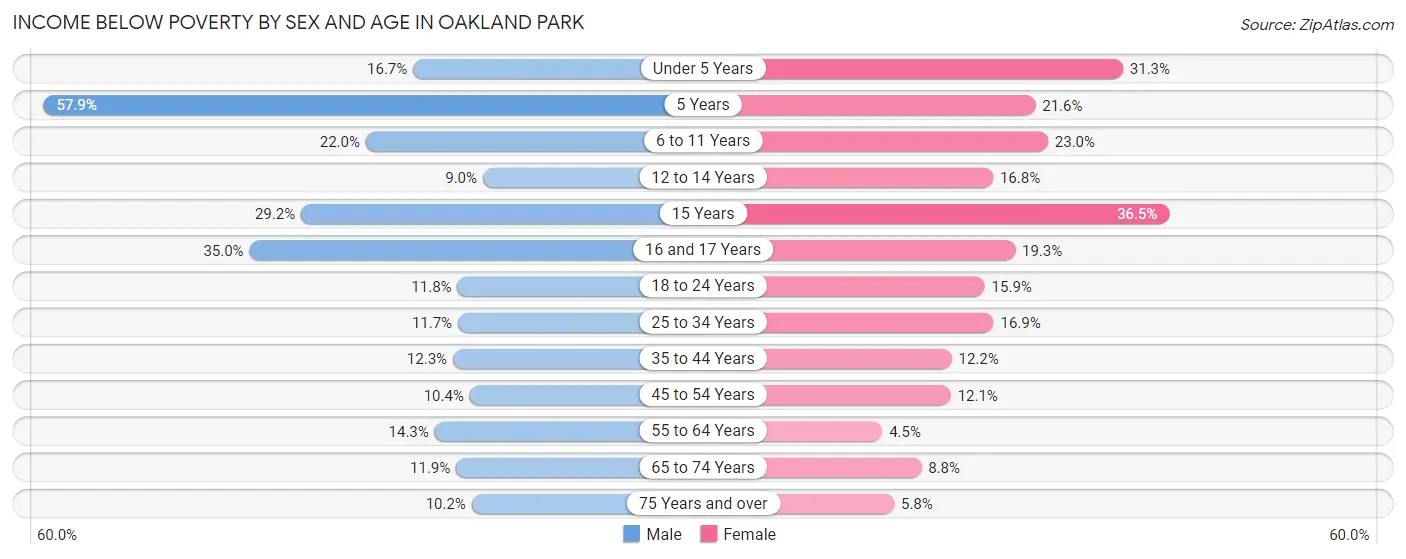
| Age Bracket | Male | Female |
| Under 5 Years | 214 (16.7%) | 437 (31.3%) |
| 5 Years | 33 (57.9%) | 50 (21.5%) |
| 6 to 11 Years | 295 (22.0%) | 300 (23.0%) |
| 12 to 14 Years | 55 (9.0%) | 126 (16.8%) |
| 15 Years | 64 (29.2%) | 140 (36.5%) |
| 16 and 17 Years | 158 (35.0%) | 81 (19.3%) |
| 18 to 24 Years | 260 (11.8%) | 237 (15.9%) |
| 25 to 34 Years | 420 (11.7%) | 572 (16.9%) |
| 35 to 44 Years | 415 (12.3%) | 416 (12.2%) |
| 45 to 54 Years | 361 (10.4%) | 306 (12.1%) |
| 55 to 64 Years | 511 (14.3%) | 126 (4.5%) |
| 65 to 74 Years | 215 (11.9%) | 152 (8.8%) |
| 75 Years and over | 107 (10.2%) | 65 (5.8%) |
| Total | 3,108 (13.5%) | 3,008 (14.4%) |
Income Above Poverty by Sex and Age in Oakland Park
According to the poverty statistics in Oakland Park, males aged 12 to 14 years and females aged 55 to 64 years are the age groups that are most secure financially, with 91.0% of males and 95.5% of females in these age groups living above the poverty line.
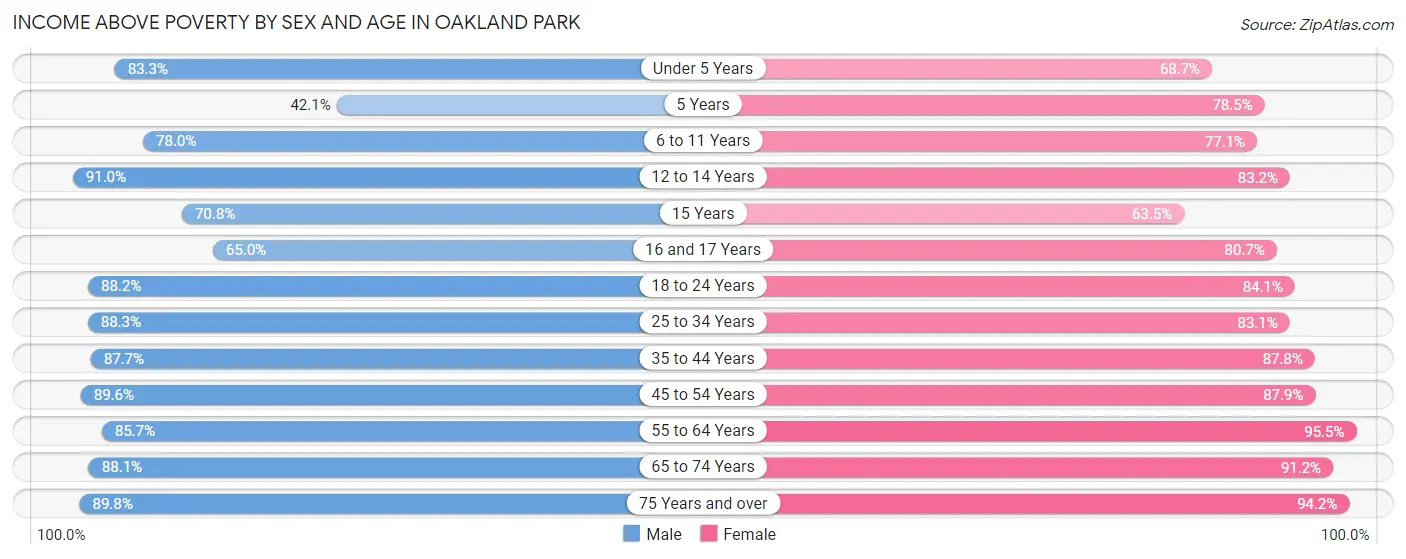
| Age Bracket | Male | Female |
| Under 5 Years | 1,065 (83.3%) | 959 (68.7%) |
| 5 Years | 24 (42.1%) | 182 (78.4%) |
| 6 to 11 Years | 1,046 (78.0%) | 1,007 (77.0%) |
| 12 to 14 Years | 559 (91.0%) | 622 (83.2%) |
| 15 Years | 155 (70.8%) | 244 (63.5%) |
| 16 and 17 Years | 294 (65.0%) | 339 (80.7%) |
| 18 to 24 Years | 1,944 (88.2%) | 1,253 (84.1%) |
| 25 to 34 Years | 3,156 (88.3%) | 2,813 (83.1%) |
| 35 to 44 Years | 2,960 (87.7%) | 2,988 (87.8%) |
| 45 to 54 Years | 3,101 (89.6%) | 2,216 (87.9%) |
| 55 to 64 Years | 3,052 (85.7%) | 2,677 (95.5%) |
| 65 to 74 Years | 1,586 (88.1%) | 1,567 (91.2%) |
| 75 Years and over | 941 (89.8%) | 1,052 (94.2%) |
| Total | 19,883 (86.5%) | 17,919 (85.6%) |
Income Below Poverty Among Married-Couple Families in Oakland Park
The poverty statistics for married-couple families in Oakland Park show that 5.3% or 275 of the total 5,157 families live below the poverty line. Families with 5 or more children have the highest poverty rate of 100.0%, comprising of 36 families. On the other hand, families with no children have the lowest poverty rate of 1.3%, which includes 43 families.
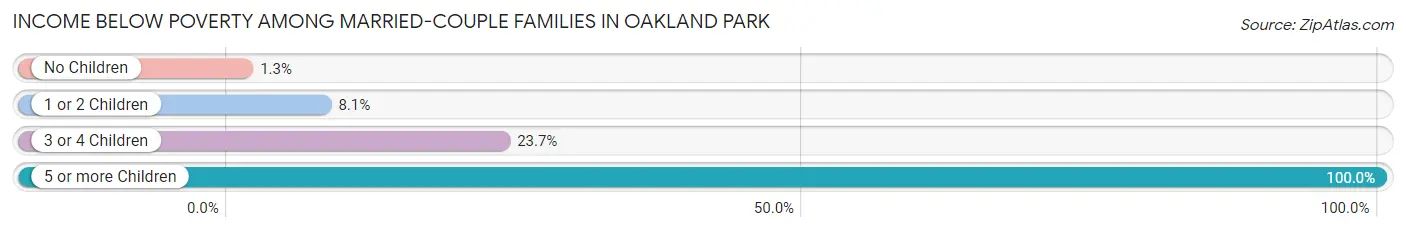
| Children | Above Poverty | Below Poverty |
| No Children | 3,217 (98.7%) | 43 (1.3%) |
| 1 or 2 Children | 1,446 (91.9%) | 128 (8.1%) |
| 3 or 4 Children | 219 (76.3%) | 68 (23.7%) |
| 5 or more Children | 0 (0.0%) | 36 (100.0%) |
| Total | 4,882 (94.7%) | 275 (5.3%) |
Income Below Poverty Among Single-Parent Households in Oakland Park
According to the poverty data in Oakland Park, 24.5% or 242 single-father households and 15.2% or 471 single-mother households are living below the poverty line. Among single-father households, those with 3 or 4 children have the highest poverty rate, with 24 households (100.0%) experiencing poverty. Likewise, among single-mother households, those with 5 or more children have the highest poverty rate, with 69 households (100.0%) falling below the poverty line.
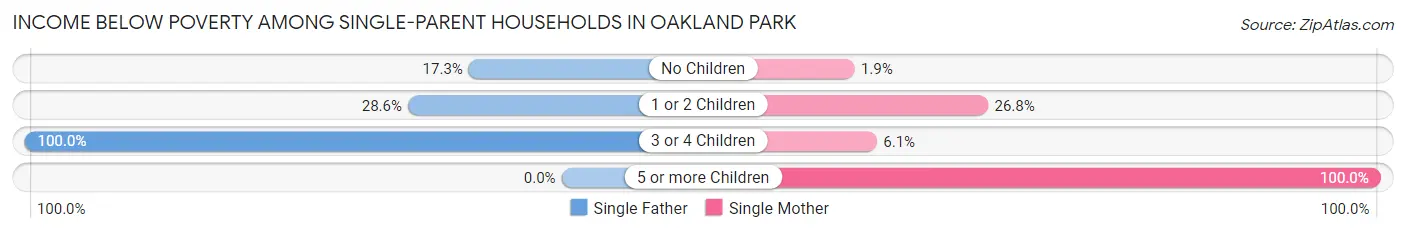
| Children | Single Father | Single Mother |
| No Children | 88 (17.3%) | 26 (1.9%) |
| 1 or 2 Children | 130 (28.6%) | 356 (26.8%) |
| 3 or 4 Children | 24 (100.0%) | 20 (6.1%) |
| 5 or more Children | 0 (0.0%) | 69 (100.0%) |
| Total | 242 (24.5%) | 471 (15.2%) |
Income Below Poverty Among Married-Couple vs Single-Parent Households in Oakland Park
The poverty data for Oakland Park shows that 275 of the married-couple family households (5.3%) and 713 of the single-parent households (17.5%) are living below the poverty level. Within the married-couple family households, those with 5 or more children have the highest poverty rate, with 36 households (100.0%) falling below the poverty line. Among the single-parent households, those with 5 or more children have the highest poverty rate, with 69 household (100.0%) living below poverty.
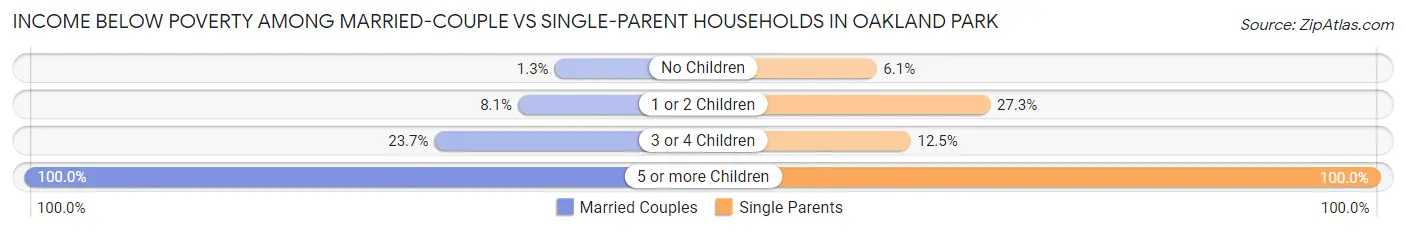
| Children | Married-Couple Families | Single-Parent Households |
| No Children | 43 (1.3%) | 114 (6.1%) |
| 1 or 2 Children | 128 (8.1%) | 486 (27.3%) |
| 3 or 4 Children | 68 (23.7%) | 44 (12.5%) |
| 5 or more Children | 36 (100.0%) | 69 (100.0%) |
| Total | 275 (5.3%) | 713 (17.5%) |
Race in Oakland Park
The most populous races in Oakland Park are White / Caucasian (20,839 | 47.3%), Hispanic or Latino (13,826 | 31.4%), and Black / African American (12,538 | 28.5%).
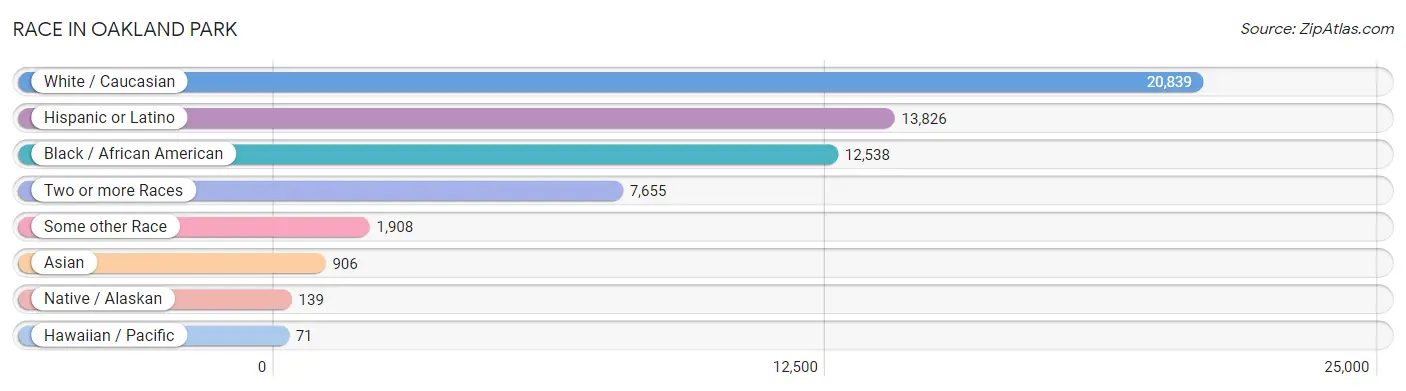
| Race | # Population | % Population |
| Asian | 906 | 2.1% |
| Black / African American | 12,538 | 28.5% |
| Hawaiian / Pacific | 71 | 0.2% |
| Hispanic or Latino | 13,826 | 31.4% |
| Native / Alaskan | 139 | 0.3% |
| White / Caucasian | 20,839 | 47.3% |
| Two or more Races | 7,655 | 17.4% |
| Some other Race | 1,908 | 4.3% |
| Total | 44,056 | 100.0% |
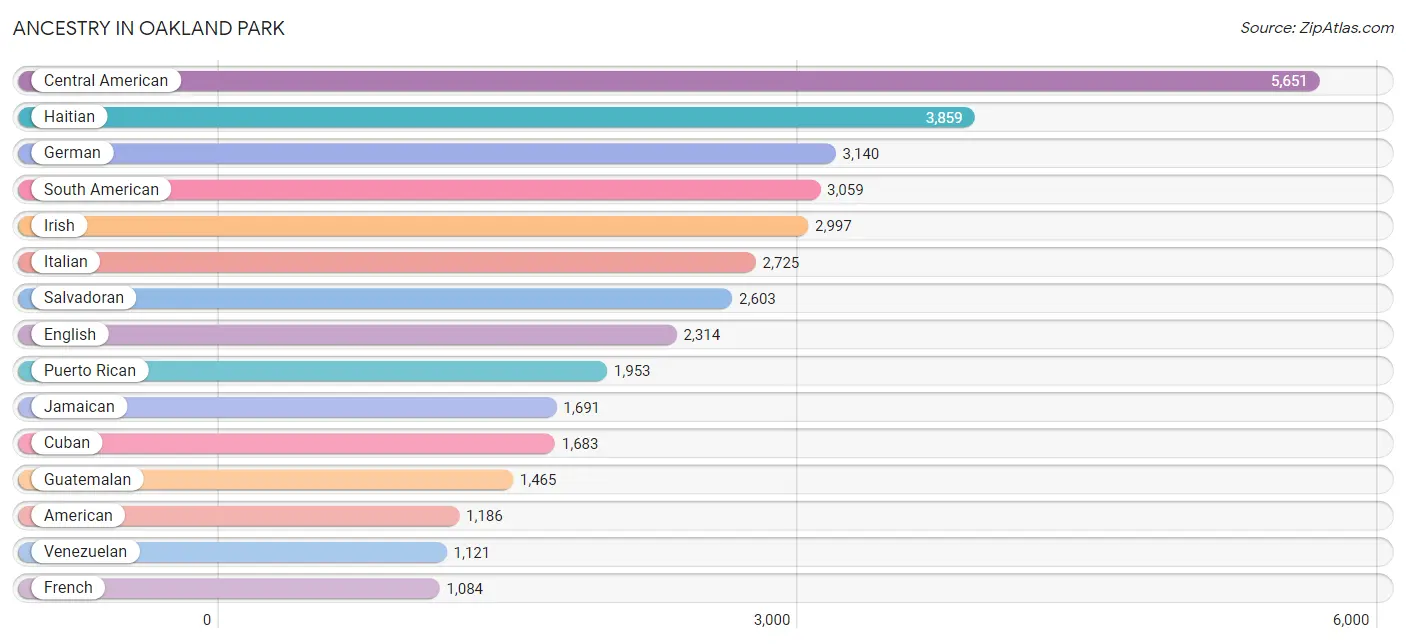
Ancestry in Oakland Park
The most populous ancestries reported in Oakland Park are Central American (5,651 | 12.8%), Haitian (3,859 | 8.8%), German (3,140 | 7.1%), South American (3,059 | 6.9%), and Irish (2,997 | 6.8%), together accounting for 42.5% of all Oakland Park residents.
| Ancestry | # Population | % Population |
| African | 225 | 0.5% |
| Albanian | 789 | 1.8% |
| American | 1,186 | 2.7% |
| Arab | 189 | 0.4% |
| Argentinean | 182 | 0.4% |
| Armenian | 45 | 0.1% |
| Austrian | 79 | 0.2% |
| Bahamian | 299 | 0.7% |
| Barbadian | 24 | 0.1% |
| Bhutanese | 40 | 0.1% |
| Bolivian | 84 | 0.2% |
| Brazilian | 259 | 0.6% |
| British | 352 | 0.8% |
| British West Indian | 218 | 0.5% |
| Bulgarian | 8 | 0.0% |
| Burmese | 29 | 0.1% |
| Canadian | 85 | 0.2% |
| Central American | 5,651 | 12.8% |
| Central American Indian | 378 | 0.9% |
| Cherokee | 257 | 0.6% |
| Chilean | 170 | 0.4% |
| Chippewa | 7 | 0.0% |
| Colombian | 739 | 1.7% |
| Costa Rican | 135 | 0.3% |
| Croatian | 23 | 0.1% |
| Cuban | 1,683 | 3.8% |
| Czech | 291 | 0.7% |
| Czechoslovakian | 15 | 0.0% |
| Danish | 40 | 0.1% |
| Dominican | 129 | 0.3% |
| Dutch | 232 | 0.5% |
| Eastern European | 61 | 0.1% |
| Ecuadorian | 389 | 0.9% |
| English | 2,314 | 5.2% |
| European | 326 | 0.7% |
| Finnish | 17 | 0.0% |
| French | 1,084 | 2.5% |
| French Canadian | 217 | 0.5% |
| German | 3,140 | 7.1% |
| Greek | 195 | 0.4% |
| Guamanian / Chamorro | 21 | 0.1% |
| Guatemalan | 1,465 | 3.3% |
| Haitian | 3,859 | 8.8% |
| Honduran | 960 | 2.2% |
| Hungarian | 222 | 0.5% |
| Icelander | 71 | 0.2% |
| Indian (Asian) | 158 | 0.4% |
| Iranian | 133 | 0.3% |
| Irish | 2,997 | 6.8% |
| Iroquois | 79 | 0.2% |
| Israeli | 38 | 0.1% |
| Italian | 2,725 | 6.2% |
| Jamaican | 1,691 | 3.8% |
| Korean | 98 | 0.2% |
| Lebanese | 138 | 0.3% |
| Lithuanian | 43 | 0.1% |
| Luxembourger | 11 | 0.0% |
| Malaysian | 17 | 0.0% |
| Mexican | 1,045 | 2.4% |
| Native Hawaiian | 8 | 0.0% |
| Nicaraguan | 390 | 0.9% |
| Nigerian | 13 | 0.0% |
| Northern European | 19 | 0.0% |
| Norwegian | 182 | 0.4% |
| Pakistani | 92 | 0.2% |
| Palestinian | 6 | 0.0% |
| Panamanian | 98 | 0.2% |
| Pennsylvania German | 29 | 0.1% |
| Peruvian | 277 | 0.6% |
| Polish | 1,051 | 2.4% |
| Portuguese | 312 | 0.7% |
| Pueblo | 26 | 0.1% |
| Puerto Rican | 1,953 | 4.4% |
| Romanian | 196 | 0.4% |
| Russian | 445 | 1.0% |
| Salvadoran | 2,603 | 5.9% |
| Samoan | 50 | 0.1% |
| Scandinavian | 31 | 0.1% |
| Scotch-Irish | 158 | 0.4% |
| Scottish | 344 | 0.8% |
| Sierra Leonean | 22 | 0.1% |
| Sioux | 12 | 0.0% |
| Slavic | 12 | 0.0% |
| Slovak | 114 | 0.3% |
| Slovene | 15 | 0.0% |
| South American | 3,059 | 6.9% |
| South American Indian | 9 | 0.0% |
| Spaniard | 143 | 0.3% |
| Spanish | 58 | 0.1% |
| Sri Lankan | 217 | 0.5% |
| Subsaharan African | 260 | 0.6% |
| Swedish | 265 | 0.6% |
| Swiss | 83 | 0.2% |
| Thai | 351 | 0.8% |
| Trinidadian and Tobagonian | 197 | 0.4% |
| Turkish | 110 | 0.3% |
| U.S. Virgin Islander | 37 | 0.1% |
| Ukrainian | 122 | 0.3% |
| Uruguayan | 97 | 0.2% |
| Venezuelan | 1,121 | 2.5% |
| Welsh | 187 | 0.4% |
| West Indian | 42 | 0.1% | View All 102 Rows |
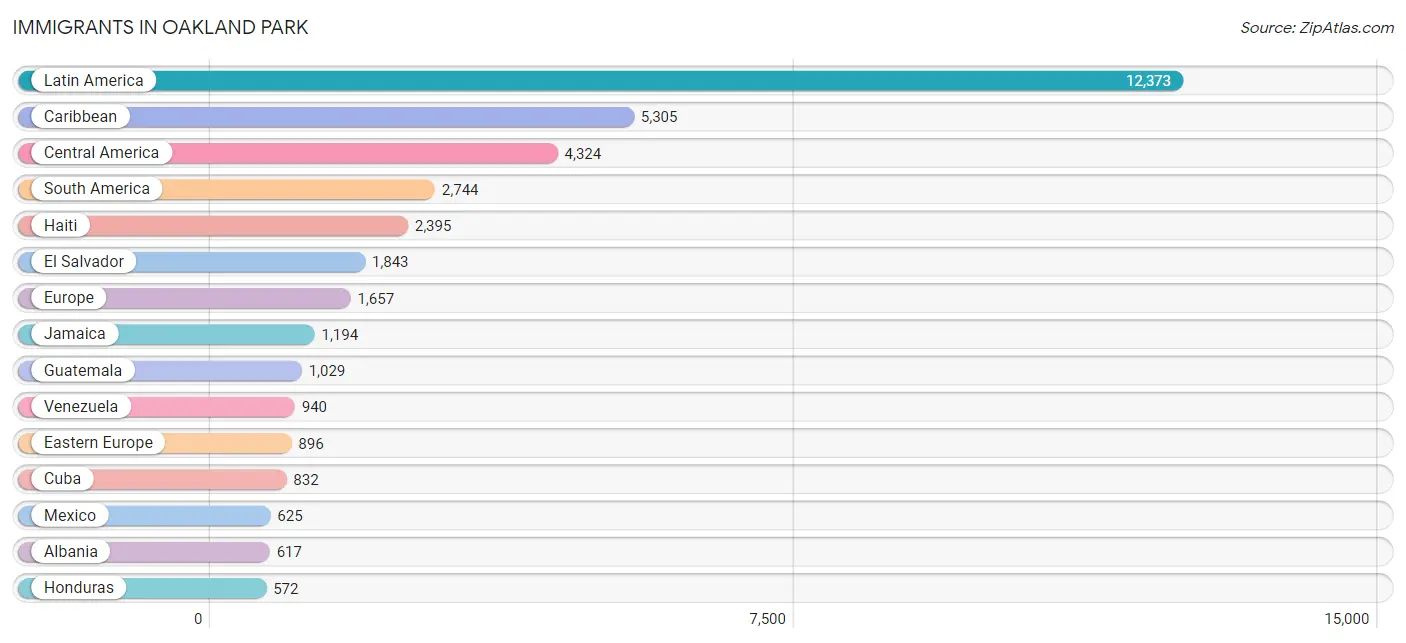
Immigrants in Oakland Park
The most numerous immigrant groups reported in Oakland Park came from Latin America (12,373 | 28.1%), Caribbean (5,305 | 12.0%), Central America (4,324 | 9.8%), South America (2,744 | 6.2%), and Haiti (2,395 | 5.4%), together accounting for 61.6% of all Oakland Park residents.
| Immigration Origin | # Population | % Population |
| Africa | 36 | 0.1% |
| Albania | 617 | 1.4% |
| Argentina | 160 | 0.4% |
| Asia | 408 | 0.9% |
| Australia | 7 | 0.0% |
| Austria | 4 | 0.0% |
| Bahamas | 165 | 0.4% |
| Barbados | 31 | 0.1% |
| Bolivia | 39 | 0.1% |
| Brazil | 481 | 1.1% |
| Bulgaria | 8 | 0.0% |
| Canada | 202 | 0.5% |
| Caribbean | 5,305 | 12.0% |
| Central America | 4,324 | 9.8% |
| Chile | 112 | 0.3% |
| China | 35 | 0.1% |
| Colombia | 466 | 1.1% |
| Costa Rica | 69 | 0.2% |
| Cuba | 832 | 1.9% |
| Czechoslovakia | 7 | 0.0% |
| Dominica | 20 | 0.1% |
| Dominican Republic | 82 | 0.2% |
| Eastern Africa | 4 | 0.0% |
| Eastern Asia | 35 | 0.1% |
| Eastern Europe | 896 | 2.0% |
| Ecuador | 328 | 0.7% |
| Egypt | 11 | 0.0% |
| El Salvador | 1,843 | 4.2% |
| England | 223 | 0.5% |
| Europe | 1,657 | 3.8% |
| France | 160 | 0.4% |
| Germany | 49 | 0.1% |
| Greece | 47 | 0.1% |
| Guatemala | 1,029 | 2.3% |
| Guyana | 12 | 0.0% |
| Haiti | 2,395 | 5.4% |
| Honduras | 572 | 1.3% |
| Hong Kong | 8 | 0.0% |
| Hungary | 30 | 0.1% |
| India | 31 | 0.1% |
| Israel | 24 | 0.1% |
| Italy | 24 | 0.1% |
| Jamaica | 1,194 | 2.7% |
| Laos | 17 | 0.0% |
| Latin America | 12,373 | 28.1% |
| Lebanon | 8 | 0.0% |
| Mexico | 625 | 1.4% |
| Netherlands | 50 | 0.1% |
| Nicaragua | 120 | 0.3% |
| Northern Africa | 20 | 0.1% |
| Northern Europe | 416 | 0.9% |
| Oceania | 7 | 0.0% |
| Pakistan | 25 | 0.1% |
| Panama | 58 | 0.1% |
| Peru | 185 | 0.4% |
| Philippines | 65 | 0.2% |
| Poland | 5 | 0.0% |
| Romania | 99 | 0.2% |
| Russia | 37 | 0.1% |
| Saudi Arabia | 5 | 0.0% |
| Scotland | 26 | 0.1% |
| Singapore | 6 | 0.0% |
| South Africa | 12 | 0.0% |
| South America | 2,744 | 6.2% |
| South Central Asia | 56 | 0.1% |
| South Eastern Asia | 264 | 0.6% |
| Southern Europe | 71 | 0.2% |
| Sweden | 5 | 0.0% |
| Thailand | 62 | 0.1% |
| Trinidad and Tobago | 225 | 0.5% |
| Turkey | 16 | 0.0% |
| Ukraine | 85 | 0.2% |
| Uruguay | 21 | 0.1% |
| Venezuela | 940 | 2.1% |
| Vietnam | 114 | 0.3% |
| West Indies | 5 | 0.0% |
| Western Asia | 53 | 0.1% |
| Western Europe | 274 | 0.6% | View All 78 Rows |
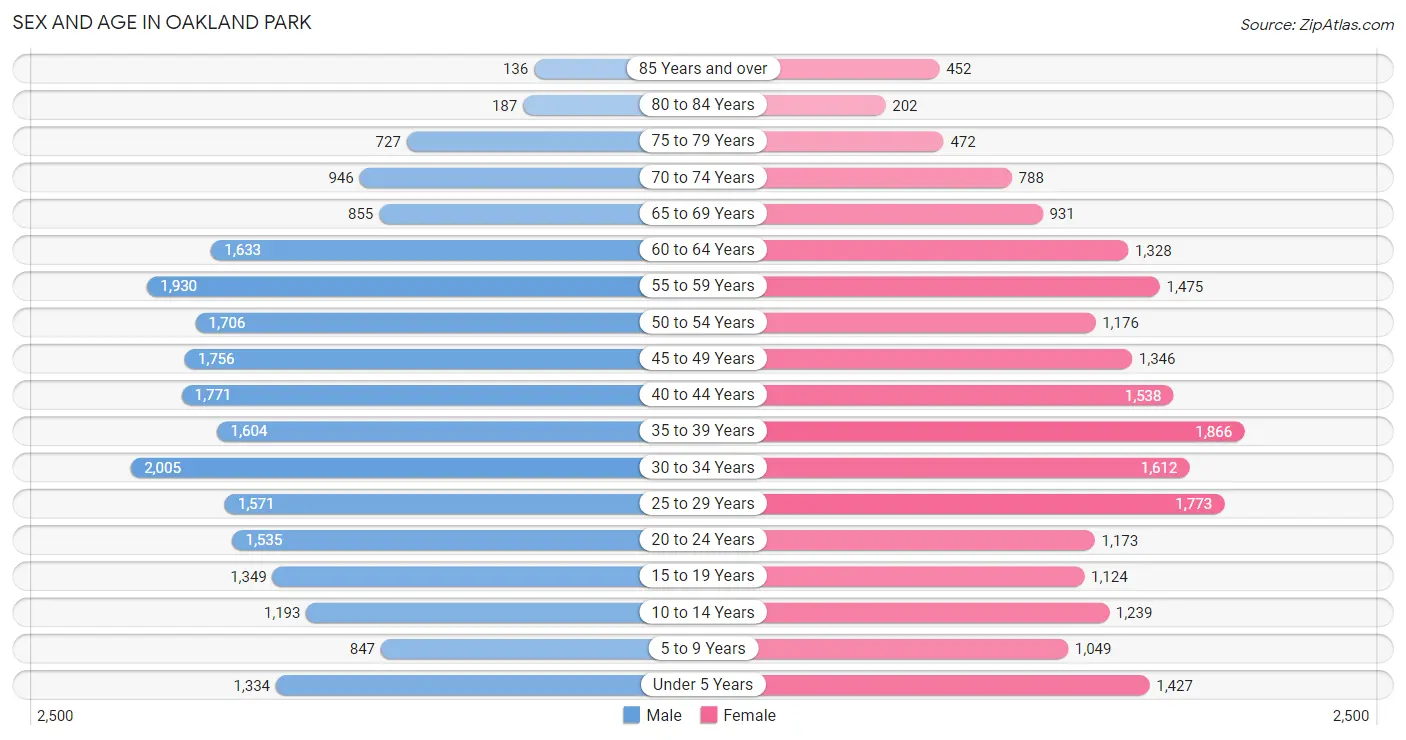
Sex and Age in Oakland Park
Sex and Age in Oakland Park
The most populous age groups in Oakland Park are 30 to 34 Years (2,005 | 8.7%) for men and 35 to 39 Years (1,866 | 8.9%) for women.
| Age Bracket | Male | Female |
| Under 5 Years | 1,334 (5.8%) | 1,427 (6.8%) |
| 5 to 9 Years | 847 (3.7%) | 1,049 (5.0%) |
| 10 to 14 Years | 1,193 (5.2%) | 1,239 (5.9%) |
| 15 to 19 Years | 1,349 (5.8%) | 1,124 (5.4%) |
| 20 to 24 Years | 1,535 (6.7%) | 1,173 (5.6%) |
| 25 to 29 Years | 1,571 (6.8%) | 1,773 (8.5%) |
| 30 to 34 Years | 2,005 (8.7%) | 1,612 (7.7%) |
| 35 to 39 Years | 1,604 (7.0%) | 1,866 (8.9%) |
| 40 to 44 Years | 1,771 (7.7%) | 1,538 (7.3%) |
| 45 to 49 Years | 1,756 (7.6%) | 1,346 (6.4%) |
| 50 to 54 Years | 1,706 (7.4%) | 1,176 (5.6%) |
| 55 to 59 Years | 1,930 (8.4%) | 1,475 (7.0%) |
| 60 to 64 Years | 1,633 (7.1%) | 1,328 (6.3%) |
| 65 to 69 Years | 855 (3.7%) | 931 (4.4%) |
| 70 to 74 Years | 946 (4.1%) | 788 (3.8%) |
| 75 to 79 Years | 727 (3.2%) | 472 (2.2%) |
| 80 to 84 Years | 187 (0.8%) | 202 (1.0%) |
| 85 Years and over | 136 (0.6%) | 452 (2.2%) |
| Total | 23,085 (100.0%) | 20,971 (100.0%) |
Families and Households in Oakland Park
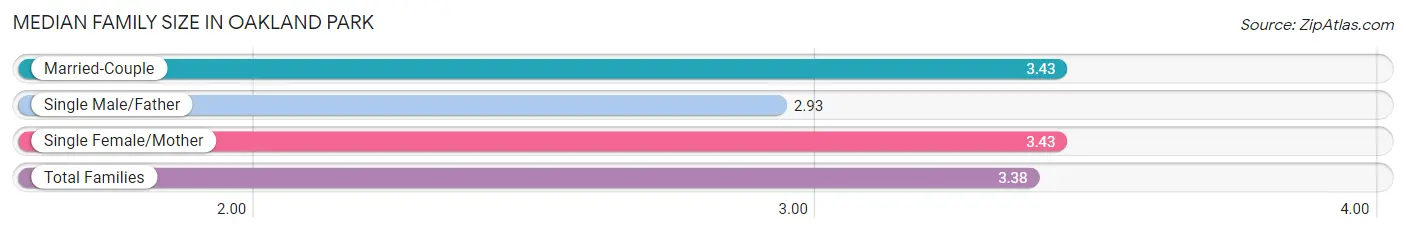
Median Family Size in Oakland Park
The median family size in Oakland Park is 3.38 persons per family, with married-couple families (5,157 | 55.9%) accounting for the largest median family size of 3.43 persons per family. On the other hand, single male/father families (987 | 10.7%) represent the smallest median family size with 2.93 persons per family.
| Family Type | # Families | Family Size |
| Married-Couple | 5,157 (55.9%) | 3.43 |
| Single Male/Father | 987 (10.7%) | 2.93 |
| Single Female/Mother | 3,088 (33.5%) | 3.43 |
| Total Families | 9,232 (100.0%) | 3.38 |
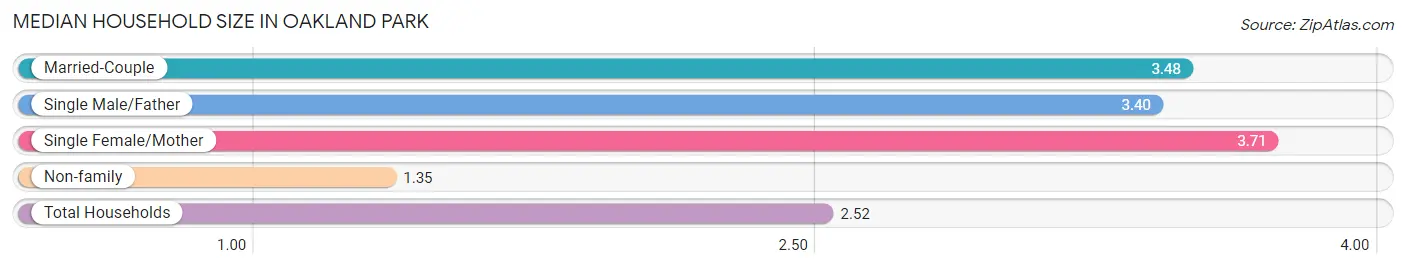
Median Household Size in Oakland Park
The median household size in Oakland Park is 2.52 persons per household, with single female/mother households (3,088 | 17.7%) accounting for the largest median household size of 3.71 persons per household. non-family households (8,183 | 47.0%) represent the smallest median household size with 1.35 persons per household.
| Household Type | # Households | Household Size |
| Married-Couple | 5,157 (29.6%) | 3.48 |
| Single Male/Father | 987 (5.7%) | 3.40 |
| Single Female/Mother | 3,088 (17.7%) | 3.71 |
| Non-family | 8,183 (47.0%) | 1.35 |
| Total Households | 17,415 (100.0%) | 2.52 |
Household Size by Marriage Status in Oakland Park
Out of a total of 17,415 households in Oakland Park, 9,232 (53.0%) are family households, while 8,183 (47.0%) are nonfamily households. The most numerous type of family households are 2-person households, comprising 3,744, and the most common type of nonfamily households are 1-person households, comprising 5,943.
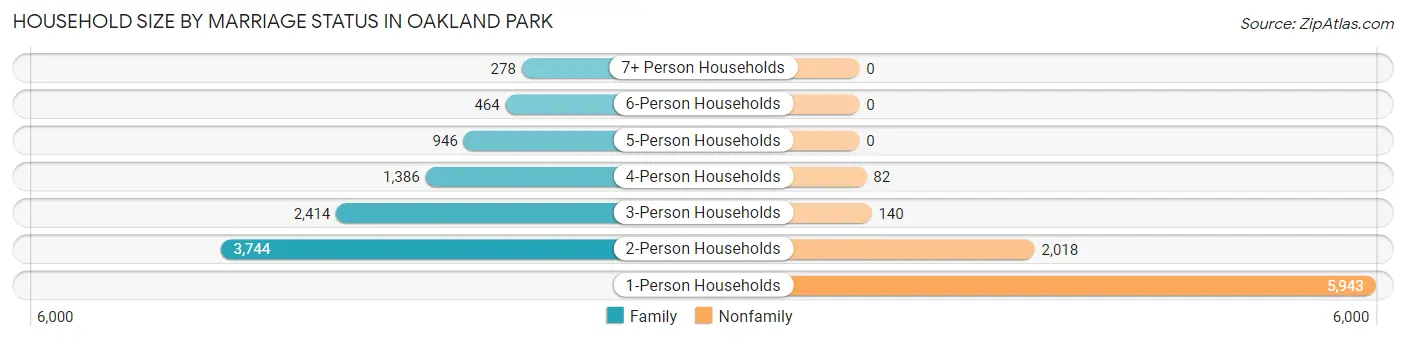
| Household Size | Family Households | Nonfamily Households |
| 1-Person Households | - | 5,943 (34.1%) |
| 2-Person Households | 3,744 (21.5%) | 2,018 (11.6%) |
| 3-Person Households | 2,414 (13.9%) | 140 (0.8%) |
| 4-Person Households | 1,386 (8.0%) | 82 (0.5%) |
| 5-Person Households | 946 (5.4%) | 0 (0.0%) |
| 6-Person Households | 464 (2.7%) | 0 (0.0%) |
| 7+ Person Households | 278 (1.6%) | 0 (0.0%) |
| Total | 9,232 (53.0%) | 8,183 (47.0%) |
Female Fertility in Oakland Park
Fertility by Age in Oakland Park
Average fertility rate in Oakland Park is 57.0 births per 1,000 women. Women in the age bracket of 20 to 34 years have the highest fertility rate with 81.0 births per 1,000 women. Women in the age bracket of 20 to 34 years acount for 60.4% of all women with births.
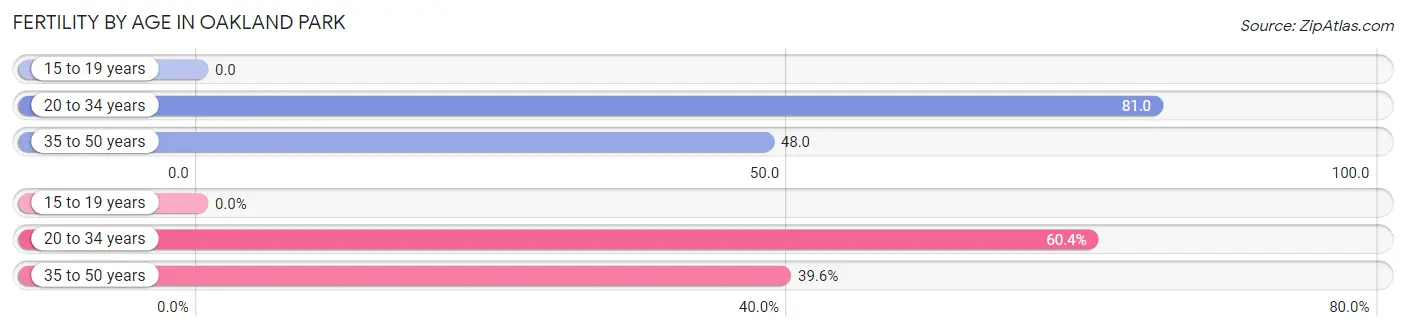
| Age Bracket | Women with Births | Births / 1,000 Women |
| 15 to 19 years | 0 (0.0%) | 0.0 |
| 20 to 34 years | 368 (60.4%) | 81.0 |
| 35 to 50 years | 241 (39.6%) | 48.0 |
| Total | 609 (100.0%) | 57.0 |
Fertility by Age by Marriage Status in Oakland Park
52.1% of women with births (609) in Oakland Park are married. The highest percentage of unmarried women with births falls into 35 to 50 years age bracket with 78.4% of them unmarried at the time of birth, while the lowest percentage of unmarried women with births belong to 20 to 34 years age bracket with 28.0% of them unmarried.
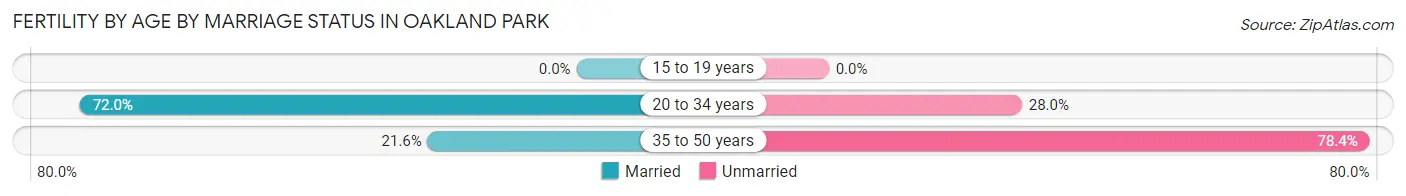
| Age Bracket | Married | Unmarried |
| 15 to 19 years | 0 (0.0%) | 0 (0.0%) |
| 20 to 34 years | 265 (72.0%) | 103 (28.0%) |
| 35 to 50 years | 52 (21.6%) | 189 (78.4%) |
| Total | 317 (52.0%) | 292 (47.9%) |
Fertility by Education in Oakland Park
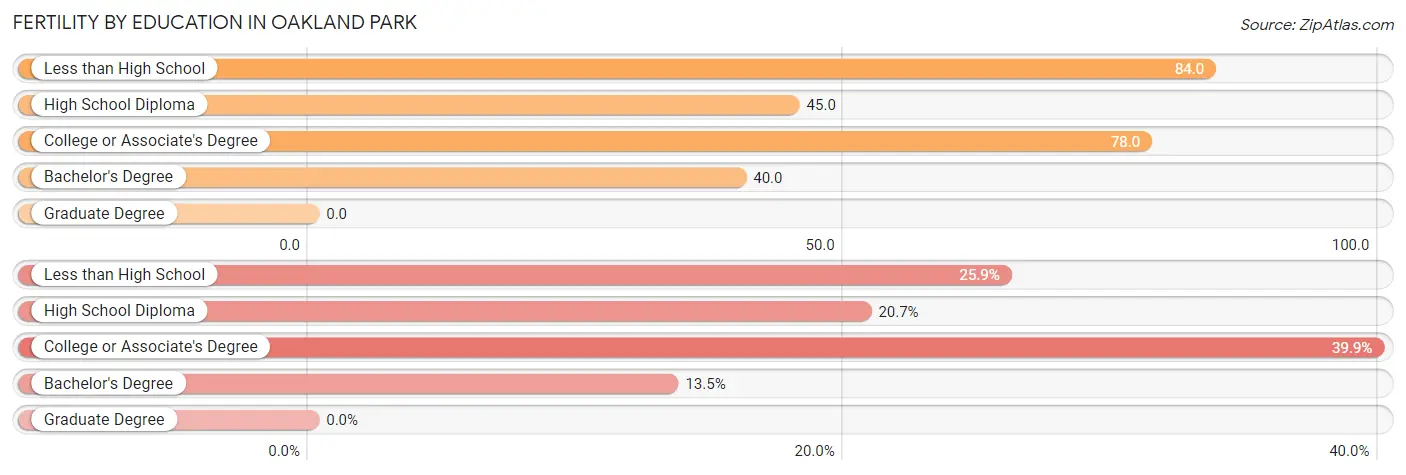
| Educational Attainment | Women with Births | Births / 1,000 Women |
| Less than High School | 158 (25.9%) | 84.0 |
| High School Diploma | 126 (20.7%) | 45.0 |
| College or Associate's Degree | 243 (39.9%) | 78.0 |
| Bachelor's Degree | 82 (13.5%) | 40.0 |
| Graduate Degree | 0 (0.0%) | 0.0 |
| Total | 609 (100.0%) | 57.0 |
Fertility by Education by Marriage Status in Oakland Park
47.9% of women with births in Oakland Park are unmarried. Women with the educational attainment of less than high school are most likely to be married with 100.0% of them married at childbirth, while women with the educational attainment of bachelor's degree are least likely to be married with 100.0% of them unmarried at childbirth.
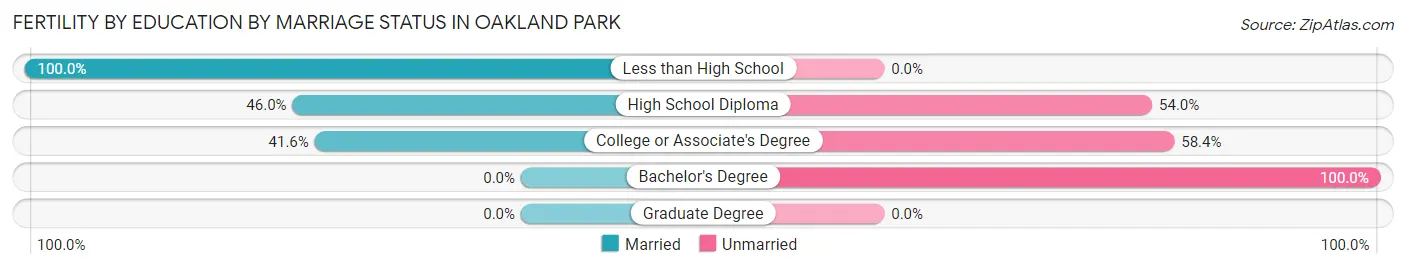
| Educational Attainment | Married | Unmarried |
| Less than High School | 158 (100.0%) | 0 (0.0%) |
| High School Diploma | 58 (46.0%) | 68 (54.0%) |
| College or Associate's Degree | 101 (41.6%) | 142 (58.4%) |
| Bachelor's Degree | 0 (0.0%) | 82 (100.0%) |
| Graduate Degree | 0 (0.0%) | 0 (0.0%) |
| Total | 317 (52.0%) | 292 (47.9%) |
Employment Characteristics in Oakland Park
Employment by Class of Employer in Oakland Park
Among the 25,146 employed individuals in Oakland Park, private company employees (17,274 | 68.7%), self-employed (incorporated) (2,426 | 9.7%), and self-employed (not incorporated) (1,915 | 7.6%) make up the most common classes of employment.
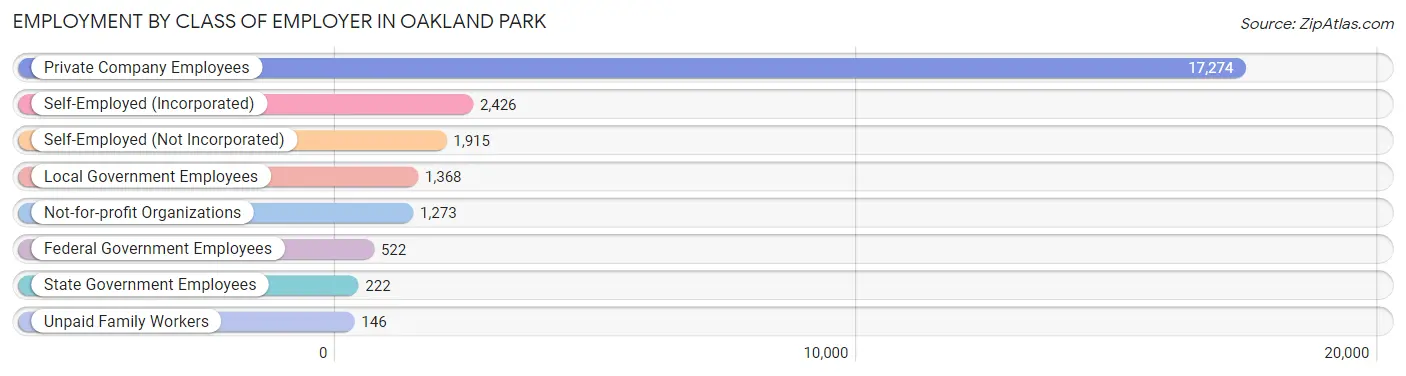
| Employer Class | # Employees | % Employees |
| Private Company Employees | 17,274 | 68.7% |
| Self-Employed (Incorporated) | 2,426 | 9.7% |
| Self-Employed (Not Incorporated) | 1,915 | 7.6% |
| Not-for-profit Organizations | 1,273 | 5.1% |
| Local Government Employees | 1,368 | 5.4% |
| State Government Employees | 222 | 0.9% |
| Federal Government Employees | 522 | 2.1% |
| Unpaid Family Workers | 146 | 0.6% |
| Total | 25,146 | 100.0% |
Employment Status by Age in Oakland Park
According to the labor force statistics for Oakland Park, out of the total population over 16 years of age (36,362), 75.7% or 27,526 individuals are in the labor force, with 6.4% or 1,762 of them unemployed. The age group with the highest labor force participation rate is 25 to 29 years, with 93.5% or 3,127 individuals in the labor force. Within the labor force, the 16 to 19 years age range has the highest percentage of unemployed individuals, with 20.6% or 185 of them being unemployed.
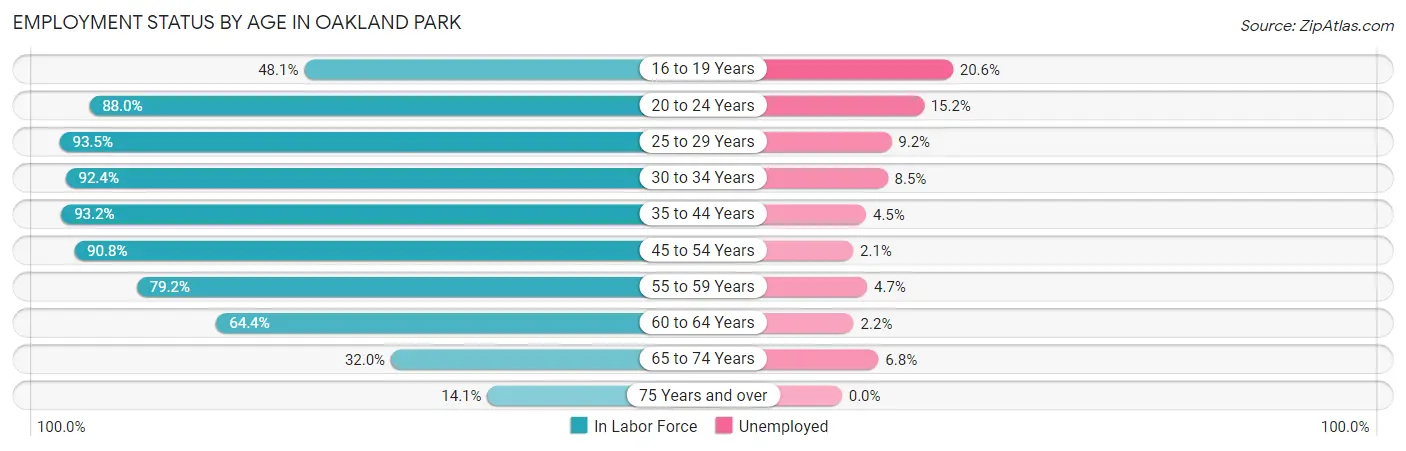
| Age Bracket | In Labor Force | Unemployed |
| 16 to 19 Years | 899 (48.1%) | 185 (20.6%) |
| 20 to 24 Years | 2,383 (88.0%) | 362 (15.2%) |
| 25 to 29 Years | 3,127 (93.5%) | 288 (9.2%) |
| 30 to 34 Years | 3,342 (92.4%) | 284 (8.5%) |
| 35 to 44 Years | 6,318 (93.2%) | 284 (4.5%) |
| 45 to 54 Years | 5,433 (90.8%) | 114 (2.1%) |
| 55 to 59 Years | 2,697 (79.2%) | 127 (4.7%) |
| 60 to 64 Years | 1,907 (64.4%) | 42 (2.2%) |
| 65 to 74 Years | 1,126 (32.0%) | 77 (6.8%) |
| 75 Years and over | 307 (14.1%) | 0 (0.0%) |
| Total | 27,526 (75.7%) | 1,762 (6.4%) |
Employment Status by Educational Attainment in Oakland Park
According to labor force statistics for Oakland Park, 87.5% of individuals (22,829) out of the total population between 25 and 64 years of age (26,090) are in the labor force, with 5.0% or 1,141 of them being unemployed. The group with the highest labor force participation rate are those with the educational attainment of bachelor's degree or higher, with 91.2% or 6,780 individuals in the labor force. Within the labor force, individuals with less than high school education have the highest percentage of unemployment, with 7.8% or 210 of them being unemployed.
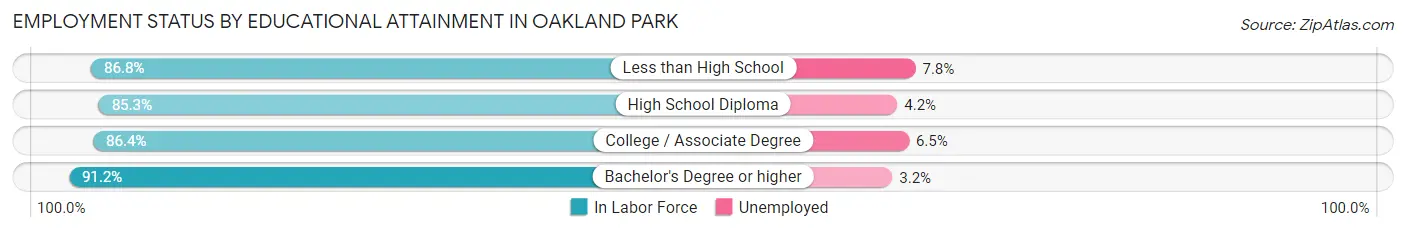
| Educational Attainment | In Labor Force | Unemployed |
| Less than High School | 2,697 (86.8%) | 242 (7.8%) |
| High School Diploma | 6,883 (85.3%) | 339 (4.2%) |
| College / Associate Degree | 6,463 (86.4%) | 486 (6.5%) |
| Bachelor's Degree or higher | 6,780 (91.2%) | 238 (3.2%) |
| Total | 22,829 (87.5%) | 1,304 (5.0%) |
Employment Occupations by Sex in Oakland Park
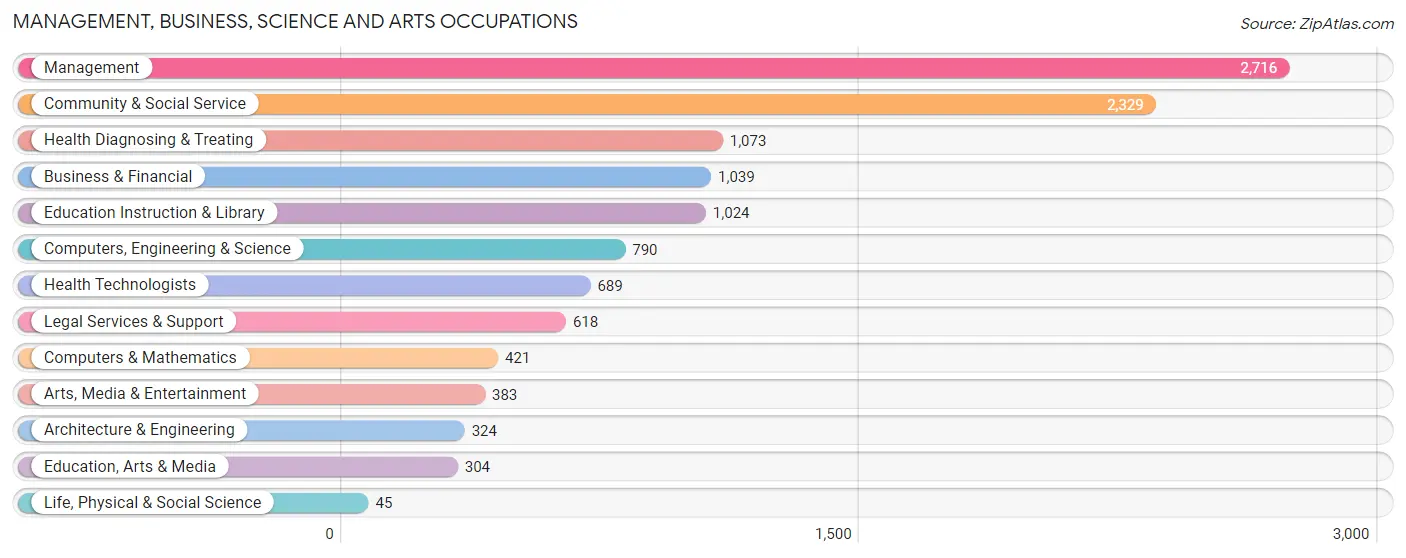
Management, Business, Science and Arts Occupations
The most common Management, Business, Science and Arts occupations in Oakland Park are Management (2,716 | 10.6%), Community & Social Service (2,329 | 9.1%), Health Diagnosing & Treating (1,073 | 4.2%), Business & Financial (1,039 | 4.1%), and Education Instruction & Library (1,024 | 4.0%).
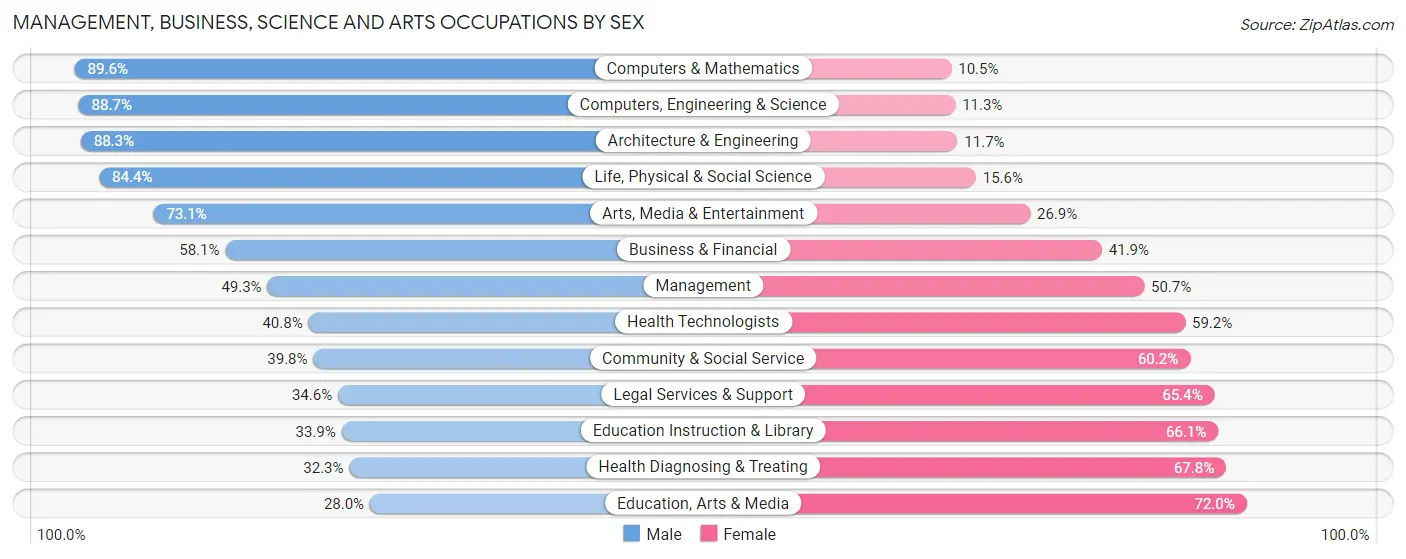
Management, Business, Science and Arts Occupations by Sex
Within the Management, Business, Science and Arts occupations in Oakland Park, the most male-oriented occupations are Computers & Mathematics (89.5%), Computers, Engineering & Science (88.7%), and Architecture & Engineering (88.3%), while the most female-oriented occupations are Education, Arts & Media (72.0%), Health Diagnosing & Treating (67.7%), and Education Instruction & Library (66.1%).
| Occupation | Male | Female |
| Management | 1,340 (49.3%) | 1,376 (50.7%) |
| Business & Financial | 604 (58.1%) | 435 (41.9%) |
| Computers, Engineering & Science | 701 (88.7%) | 89 (11.3%) |
| Computers & Mathematics | 377 (89.5%) | 44 (10.4%) |
| Architecture & Engineering | 286 (88.3%) | 38 (11.7%) |
| Life, Physical & Social Science | 38 (84.4%) | 7 (15.6%) |
| Community & Social Service | 926 (39.8%) | 1,403 (60.2%) |
| Education, Arts & Media | 85 (28.0%) | 219 (72.0%) |
| Legal Services & Support | 214 (34.6%) | 404 (65.4%) |
| Education Instruction & Library | 347 (33.9%) | 677 (66.1%) |
| Arts, Media & Entertainment | 280 (73.1%) | 103 (26.9%) |
| Health Diagnosing & Treating | 346 (32.3%) | 727 (67.7%) |
| Health Technologists | 281 (40.8%) | 408 (59.2%) |
| Total (Category) | 3,917 (49.3%) | 4,030 (50.7%) |
| Total (Overall) | 14,147 (55.1%) | 11,531 (44.9%) |
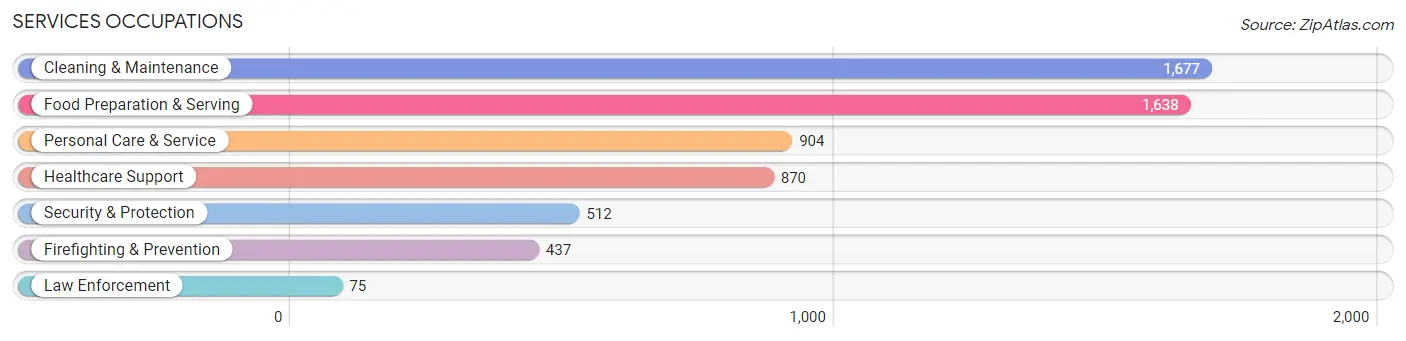
Services Occupations
The most common Services occupations in Oakland Park are Cleaning & Maintenance (1,677 | 6.5%), Food Preparation & Serving (1,638 | 6.4%), Personal Care & Service (904 | 3.5%), Healthcare Support (870 | 3.4%), and Security & Protection (512 | 2.0%).
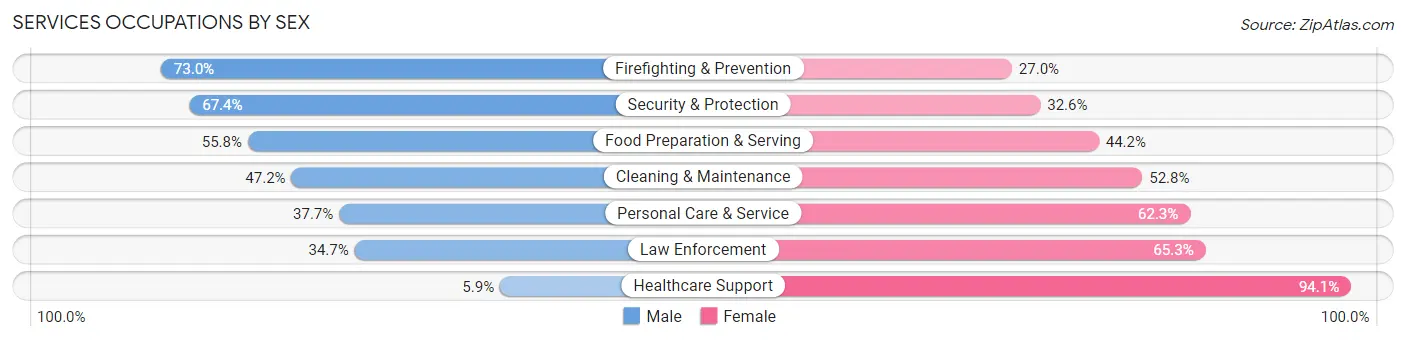
Services Occupations by Sex
Within the Services occupations in Oakland Park, the most male-oriented occupations are Firefighting & Prevention (73.0%), Security & Protection (67.4%), and Food Preparation & Serving (55.8%), while the most female-oriented occupations are Healthcare Support (94.1%), Law Enforcement (65.3%), and Personal Care & Service (62.3%).
| Occupation | Male | Female |
| Healthcare Support | 51 (5.9%) | 819 (94.1%) |
| Security & Protection | 345 (67.4%) | 167 (32.6%) |
| Firefighting & Prevention | 319 (73.0%) | 118 (27.0%) |
| Law Enforcement | 26 (34.7%) | 49 (65.3%) |
| Food Preparation & Serving | 914 (55.8%) | 724 (44.2%) |
| Cleaning & Maintenance | 791 (47.2%) | 886 (52.8%) |
| Personal Care & Service | 341 (37.7%) | 563 (62.3%) |
| Total (Category) | 2,442 (43.6%) | 3,159 (56.4%) |
| Total (Overall) | 14,147 (55.1%) | 11,531 (44.9%) |
Sales and Office Occupations
The most common Sales and Office occupations in Oakland Park are Office & Administration (3,181 | 12.4%), and Sales & Related (2,712 | 10.6%).
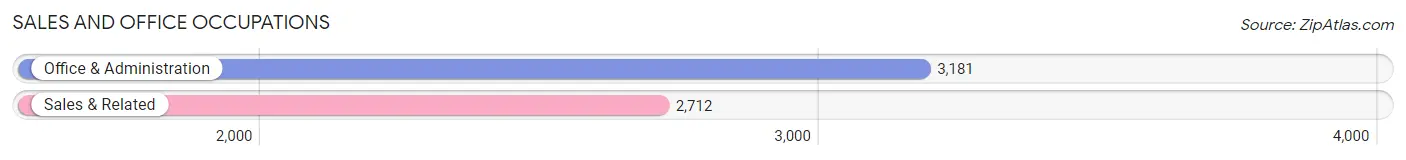
Sales and Office Occupations by Sex
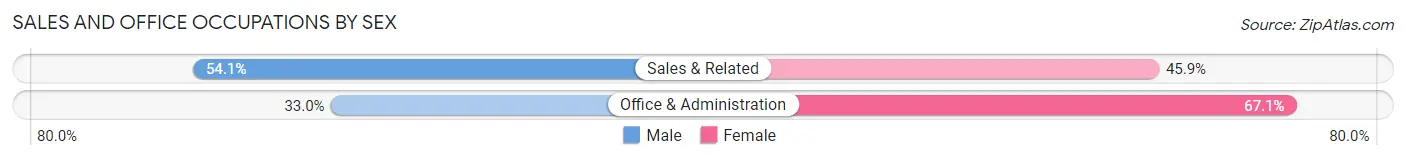
| Occupation | Male | Female |
| Sales & Related | 1,467 (54.1%) | 1,245 (45.9%) |
| Office & Administration | 1,048 (33.0%) | 2,133 (67.0%) |
| Total (Category) | 2,515 (42.7%) | 3,378 (57.3%) |
| Total (Overall) | 14,147 (55.1%) | 11,531 (44.9%) |
Natural Resources, Construction and Maintenance Occupations
The most common Natural Resources, Construction and Maintenance occupations in Oakland Park are Construction & Extraction (2,120 | 8.3%), Installation, Maintenance & Repair (640 | 2.5%), and Farming, Fishing & Forestry (10 | 0.0%).
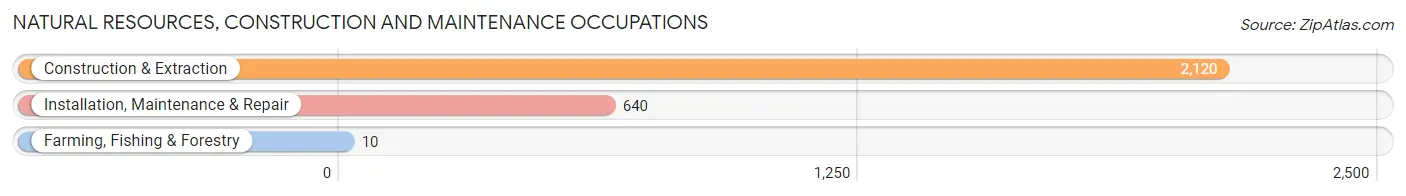
Natural Resources, Construction and Maintenance Occupations by Sex
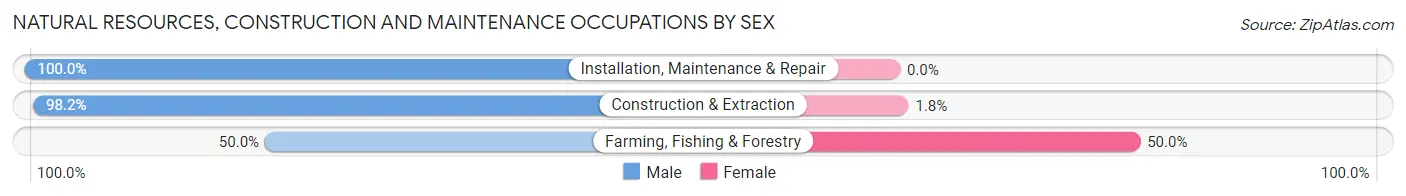
| Occupation | Male | Female |
| Farming, Fishing & Forestry | 5 (50.0%) | 5 (50.0%) |
| Construction & Extraction | 2,082 (98.2%) | 38 (1.8%) |
| Installation, Maintenance & Repair | 640 (100.0%) | 0 (0.0%) |
| Total (Category) | 2,727 (98.5%) | 43 (1.5%) |
| Total (Overall) | 14,147 (55.1%) | 11,531 (44.9%) |
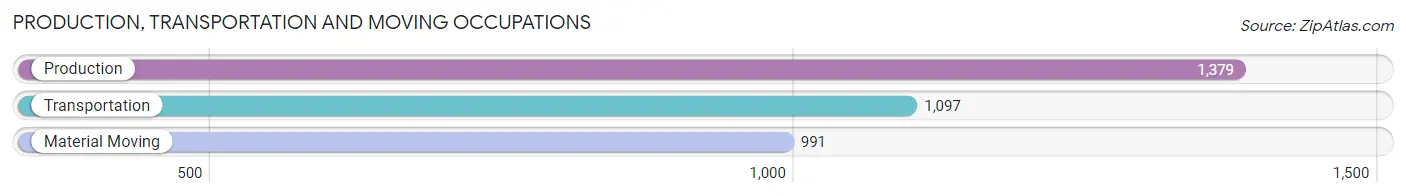
Production, Transportation and Moving Occupations
The most common Production, Transportation and Moving occupations in Oakland Park are Production (1,379 | 5.4%), Transportation (1,097 | 4.3%), and Material Moving (991 | 3.9%).
Production, Transportation and Moving Occupations by Sex
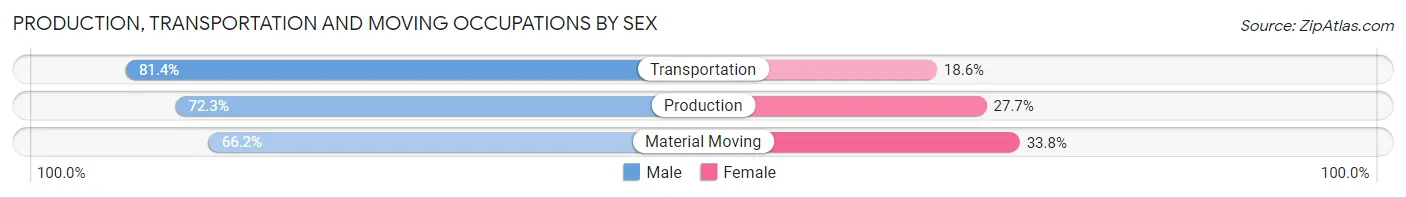
| Occupation | Male | Female |
| Production | 997 (72.3%) | 382 (27.7%) |
| Transportation | 893 (81.4%) | 204 (18.6%) |
| Material Moving | 656 (66.2%) | 335 (33.8%) |
| Total (Category) | 2,546 (73.4%) | 921 (26.6%) |
| Total (Overall) | 14,147 (55.1%) | 11,531 (44.9%) |
Employment Industries by Sex in Oakland Park
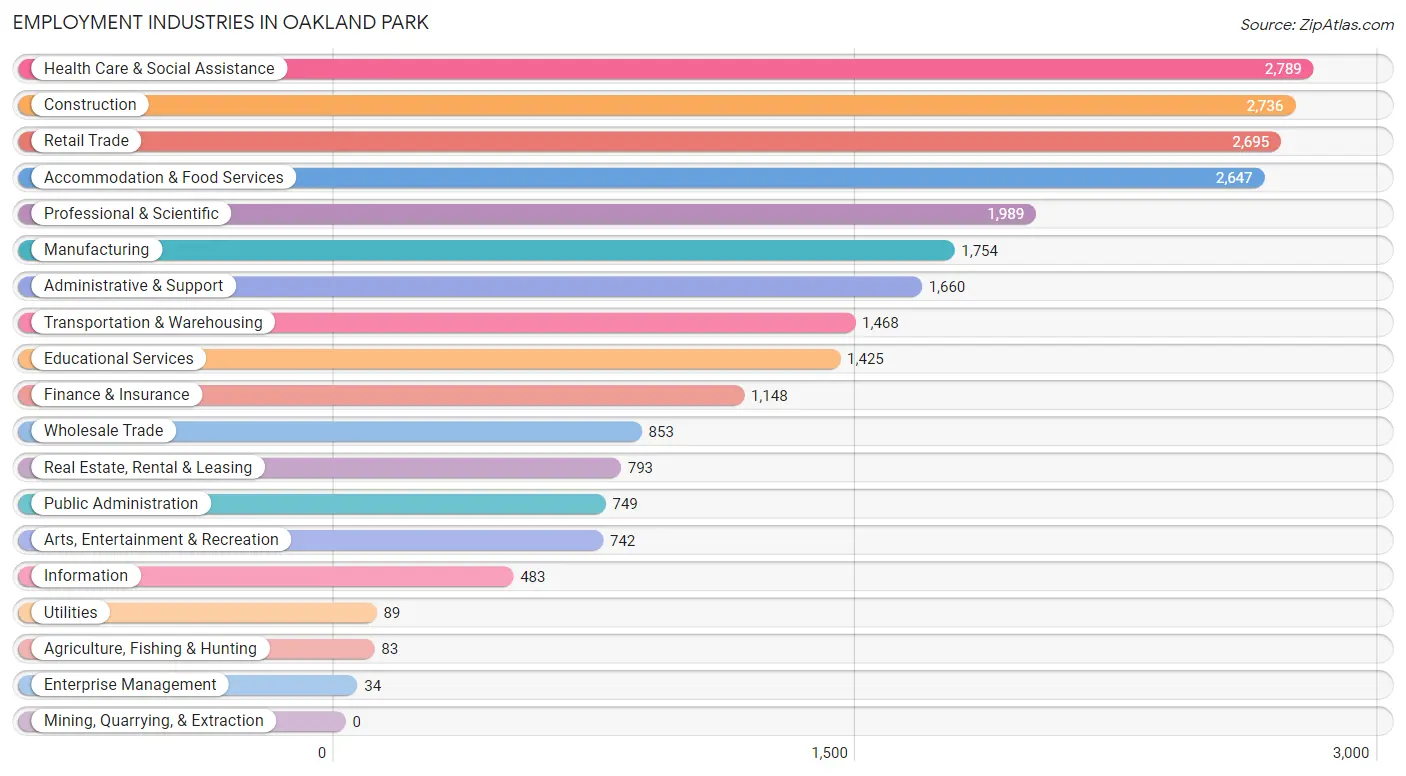
Employment Industries in Oakland Park
The major employment industries in Oakland Park include Health Care & Social Assistance (2,789 | 10.9%), Construction (2,736 | 10.7%), Retail Trade (2,695 | 10.5%), Accommodation & Food Services (2,647 | 10.3%), and Professional & Scientific (1,989 | 7.7%).
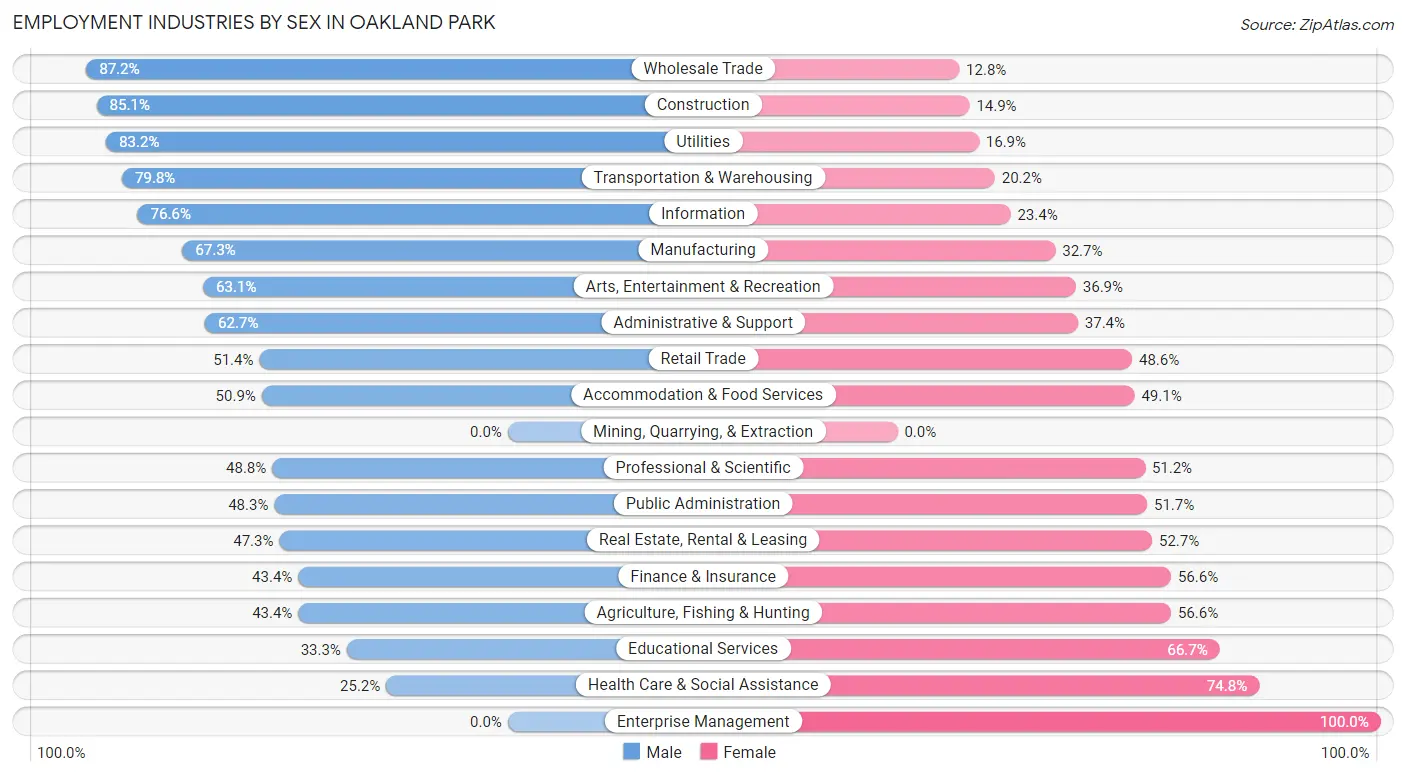
Employment Industries by Sex in Oakland Park
The Oakland Park industries that see more men than women are Wholesale Trade (87.2%), Construction (85.1%), and Utilities (83.2%), whereas the industries that tend to have a higher number of women are Enterprise Management (100.0%), Health Care & Social Assistance (74.8%), and Educational Services (66.7%).
| Industry | Male | Female |
| Agriculture, Fishing & Hunting | 36 (43.4%) | 47 (56.6%) |
| Mining, Quarrying, & Extraction | 0 (0.0%) | 0 (0.0%) |
| Construction | 2,328 (85.1%) | 408 (14.9%) |
| Manufacturing | 1,181 (67.3%) | 573 (32.7%) |
| Wholesale Trade | 744 (87.2%) | 109 (12.8%) |
| Retail Trade | 1,386 (51.4%) | 1,309 (48.6%) |
| Transportation & Warehousing | 1,172 (79.8%) | 296 (20.2%) |
| Utilities | 74 (83.2%) | 15 (16.9%) |
| Information | 370 (76.6%) | 113 (23.4%) |
| Finance & Insurance | 498 (43.4%) | 650 (56.6%) |
| Real Estate, Rental & Leasing | 375 (47.3%) | 418 (52.7%) |
| Professional & Scientific | 970 (48.8%) | 1,019 (51.2%) |
| Enterprise Management | 0 (0.0%) | 34 (100.0%) |
| Administrative & Support | 1,040 (62.6%) | 620 (37.3%) |
| Educational Services | 475 (33.3%) | 950 (66.7%) |
| Health Care & Social Assistance | 702 (25.2%) | 2,087 (74.8%) |
| Arts, Entertainment & Recreation | 468 (63.1%) | 274 (36.9%) |
| Accommodation & Food Services | 1,348 (50.9%) | 1,299 (49.1%) |
| Public Administration | 362 (48.3%) | 387 (51.7%) |
| Total | 14,147 (55.1%) | 11,531 (44.9%) |
Education in Oakland Park
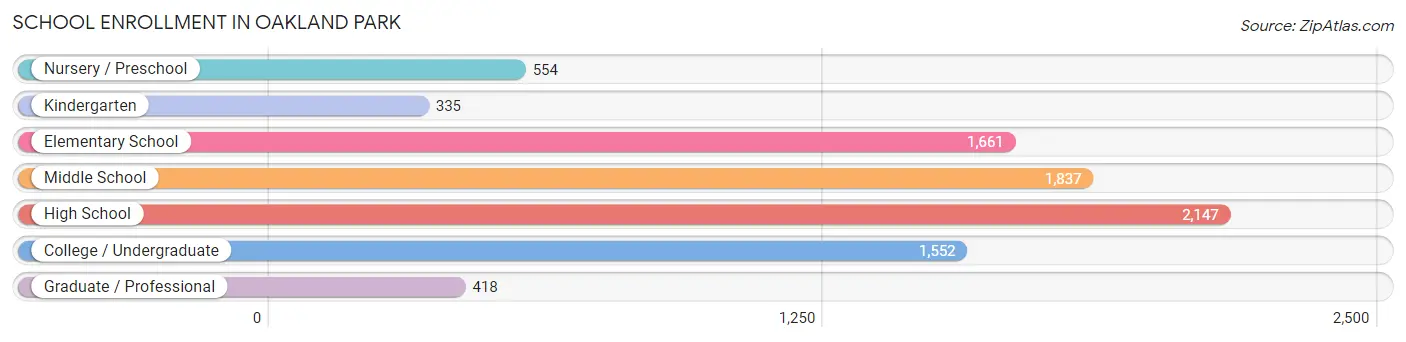
School Enrollment in Oakland Park
The most common levels of schooling among the 8,504 students in Oakland Park are high school (2,147 | 25.3%), middle school (1,837 | 21.6%), and elementary school (1,661 | 19.5%).
| School Level | # Students | % Students |
| Nursery / Preschool | 554 | 6.5% |
| Kindergarten | 335 | 3.9% |
| Elementary School | 1,661 | 19.5% |
| Middle School | 1,837 | 21.6% |
| High School | 2,147 | 25.3% |
| College / Undergraduate | 1,552 | 18.2% |
| Graduate / Professional | 418 | 4.9% |
| Total | 8,504 | 100.0% |
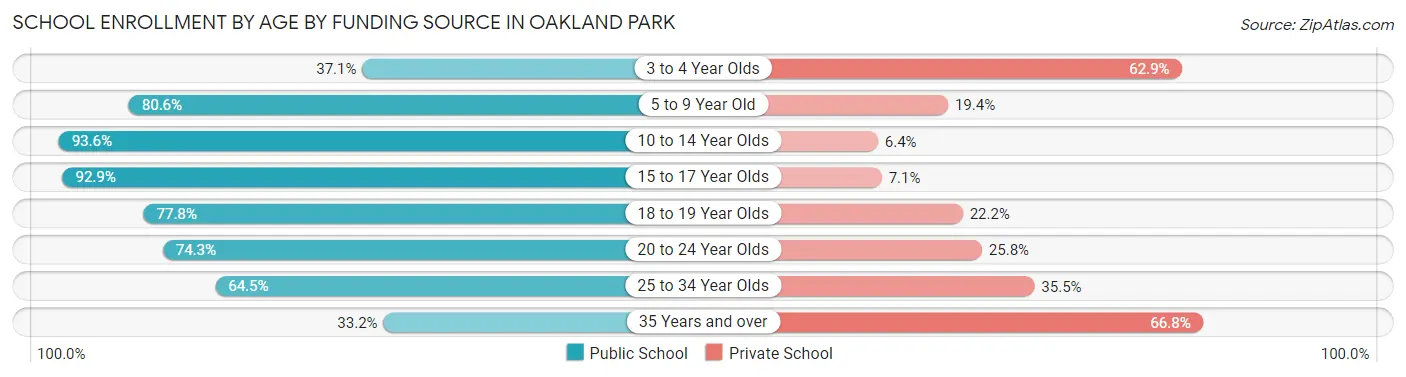
School Enrollment by Age by Funding Source in Oakland Park
Out of a total of 8,504 students who are enrolled in schools in Oakland Park, 1,811 (21.3%) attend a private institution, while the remaining 6,693 (78.7%) are enrolled in public schools. The age group of 35 years and over has the highest likelihood of being enrolled in private schools, with 421 (66.8% in the age bracket) enrolled. Conversely, the age group of 10 to 14 year olds has the lowest likelihood of being enrolled in a private school, with 2,277 (93.6% in the age bracket) attending a public institution.
| Age Bracket | Public School | Private School |
| 3 to 4 Year Olds | 184 (37.1%) | 312 (62.9%) |
| 5 to 9 Year Old | 1,439 (80.6%) | 347 (19.4%) |
| 10 to 14 Year Olds | 2,277 (93.6%) | 155 (6.4%) |
| 15 to 17 Year Olds | 1,378 (92.9%) | 105 (7.1%) |
| 18 to 19 Year Olds | 537 (77.8%) | 153 (22.2%) |
| 20 to 24 Year Olds | 271 (74.3%) | 94 (25.8%) |
| 25 to 34 Year Olds | 401 (64.5%) | 221 (35.5%) |
| 35 Years and over | 209 (33.2%) | 421 (66.8%) |
| Total | 6,693 (78.7%) | 1,811 (21.3%) |
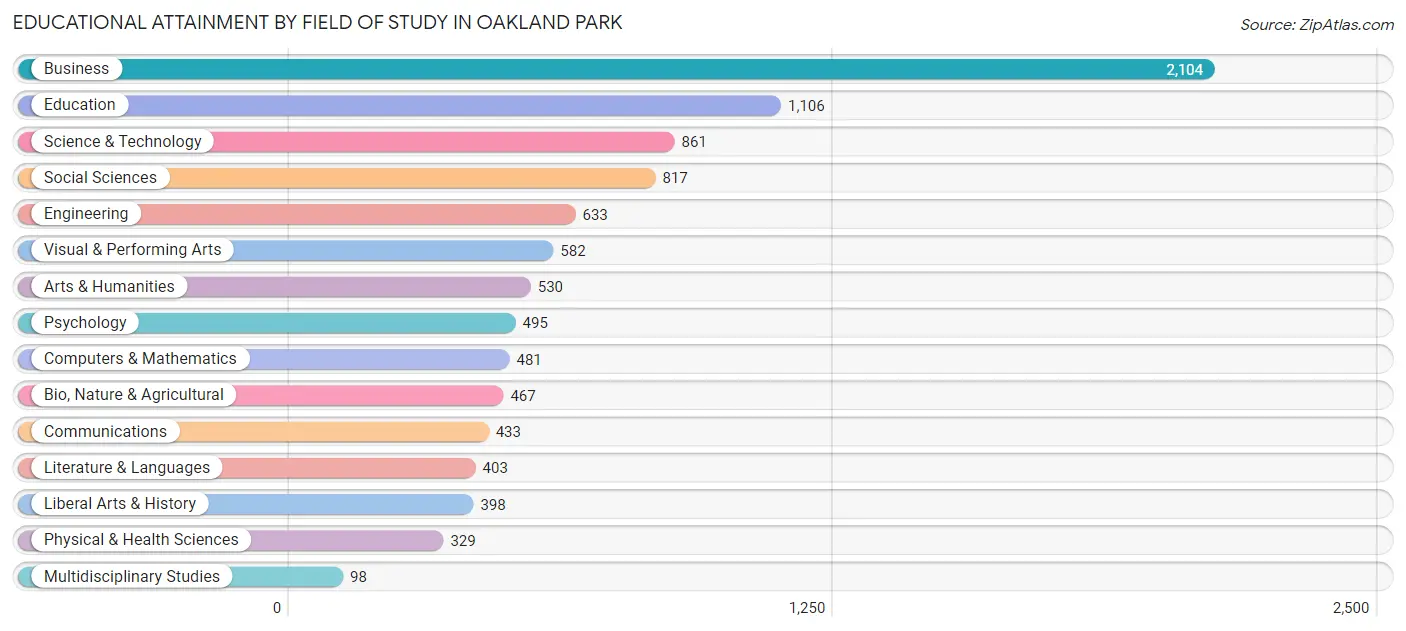
Educational Attainment by Field of Study in Oakland Park
Business (2,104 | 21.6%), education (1,106 | 11.4%), science & technology (861 | 8.8%), social sciences (817 | 8.4%), and engineering (633 | 6.5%) are the most common fields of study among 9,737 individuals in Oakland Park who have obtained a bachelor's degree or higher.
| Field of Study | # Graduates | % Graduates |
| Computers & Mathematics | 481 | 4.9% |
| Bio, Nature & Agricultural | 467 | 4.8% |
| Physical & Health Sciences | 329 | 3.4% |
| Psychology | 495 | 5.1% |
| Social Sciences | 817 | 8.4% |
| Engineering | 633 | 6.5% |
| Multidisciplinary Studies | 98 | 1.0% |
| Science & Technology | 861 | 8.8% |
| Business | 2,104 | 21.6% |
| Education | 1,106 | 11.4% |
| Literature & Languages | 403 | 4.1% |
| Liberal Arts & History | 398 | 4.1% |
| Visual & Performing Arts | 582 | 6.0% |
| Communications | 433 | 4.4% |
| Arts & Humanities | 530 | 5.4% |
| Total | 9,737 | 100.0% |
Transportation & Commute in Oakland Park
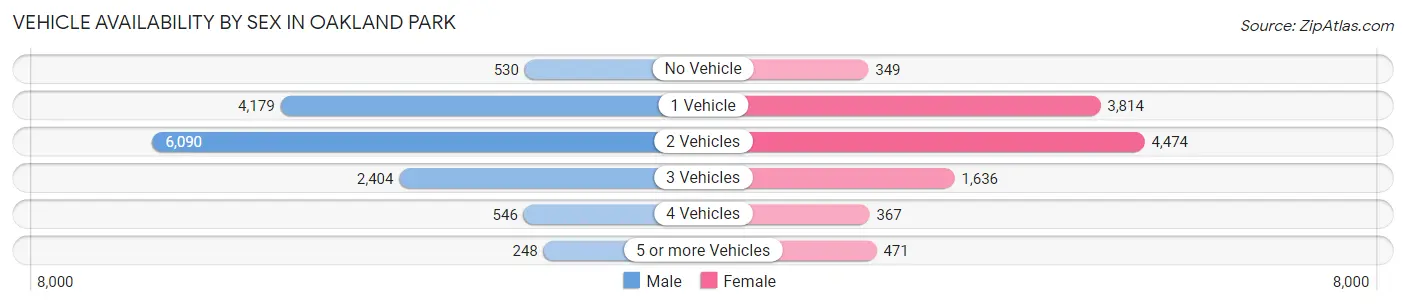
Vehicle Availability by Sex in Oakland Park
The most prevalent vehicle ownership categories in Oakland Park are males with 2 vehicles (6,090, accounting for 43.5%) and females with 2 vehicles (4,474, making up 54.8%).
| Vehicles Available | Male | Female |
| No Vehicle | 530 (3.8%) | 349 (3.1%) |
| 1 Vehicle | 4,179 (29.9%) | 3,814 (34.3%) |
| 2 Vehicles | 6,090 (43.5%) | 4,474 (40.3%) |
| 3 Vehicles | 2,404 (17.2%) | 1,636 (14.7%) |
| 4 Vehicles | 546 (3.9%) | 367 (3.3%) |
| 5 or more Vehicles | 248 (1.8%) | 471 (4.2%) |
| Total | 13,997 (100.0%) | 11,111 (100.0%) |
Commute Time in Oakland Park
The most frequently occuring commute durations in Oakland Park are 15 to 19 minutes (3,826 commuters, 16.9%), 20 to 24 minutes (3,812 commuters, 16.8%), and 30 to 34 minutes (3,264 commuters, 14.4%).
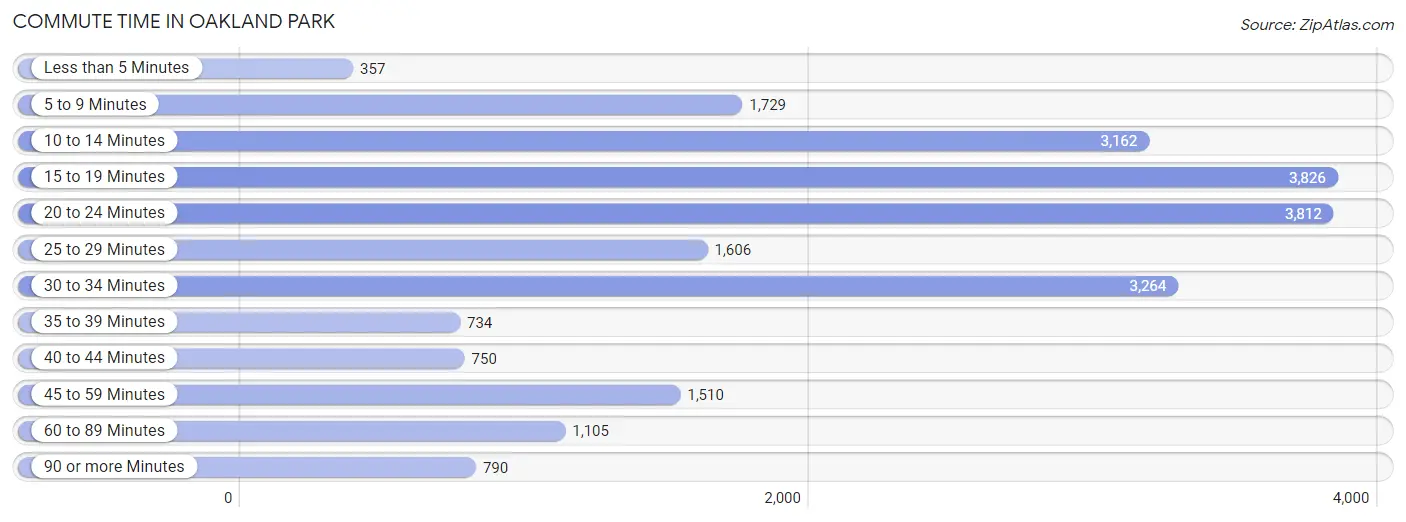
| Commute Time | # Commuters | % Commuters |
| Less than 5 Minutes | 357 | 1.6% |
| 5 to 9 Minutes | 1,729 | 7.6% |
| 10 to 14 Minutes | 3,162 | 14.0% |
| 15 to 19 Minutes | 3,826 | 16.9% |
| 20 to 24 Minutes | 3,812 | 16.8% |
| 25 to 29 Minutes | 1,606 | 7.1% |
| 30 to 34 Minutes | 3,264 | 14.4% |
| 35 to 39 Minutes | 734 | 3.2% |
| 40 to 44 Minutes | 750 | 3.3% |
| 45 to 59 Minutes | 1,510 | 6.7% |
| 60 to 89 Minutes | 1,105 | 4.9% |
| 90 or more Minutes | 790 | 3.5% |
Commute Time by Sex in Oakland Park
The most common commute times in Oakland Park are 20 to 24 minutes (2,101 commuters, 16.4%) for males and 15 to 19 minutes (2,166 commuters, 22.0%) for females.
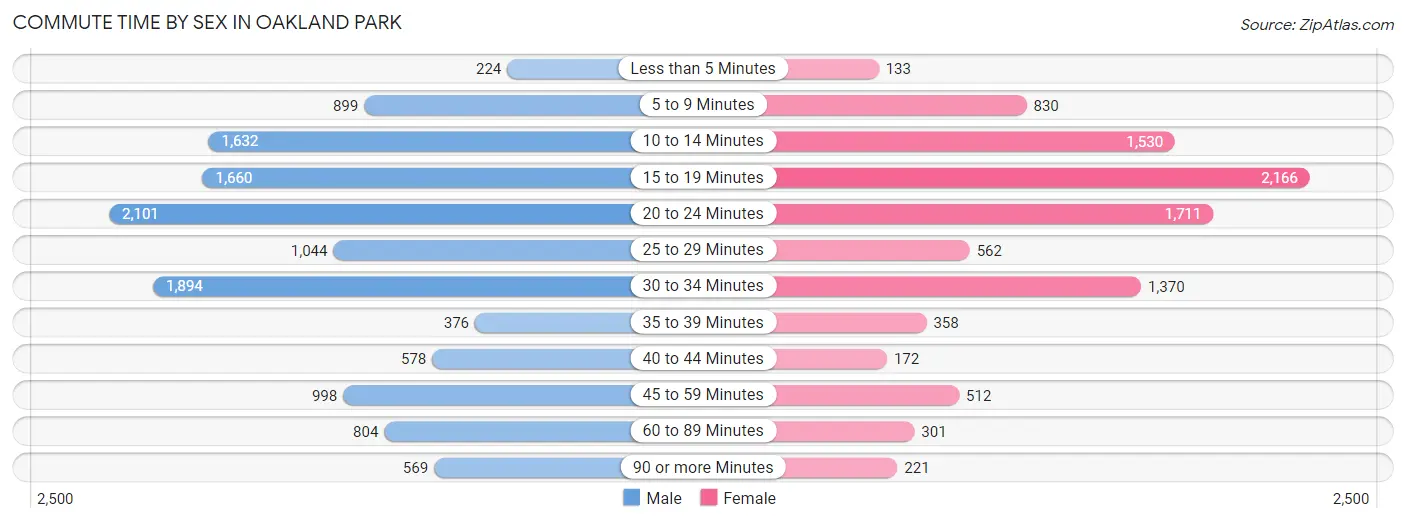
| Commute Time | Male | Female |
| Less than 5 Minutes | 224 (1.8%) | 133 (1.3%) |
| 5 to 9 Minutes | 899 (7.0%) | 830 (8.4%) |
| 10 to 14 Minutes | 1,632 (12.8%) | 1,530 (15.5%) |
| 15 to 19 Minutes | 1,660 (13.0%) | 2,166 (22.0%) |
| 20 to 24 Minutes | 2,101 (16.4%) | 1,711 (17.3%) |
| 25 to 29 Minutes | 1,044 (8.2%) | 562 (5.7%) |
| 30 to 34 Minutes | 1,894 (14.8%) | 1,370 (13.9%) |
| 35 to 39 Minutes | 376 (2.9%) | 358 (3.6%) |
| 40 to 44 Minutes | 578 (4.5%) | 172 (1.7%) |
| 45 to 59 Minutes | 998 (7.8%) | 512 (5.2%) |
| 60 to 89 Minutes | 804 (6.3%) | 301 (3.0%) |
| 90 or more Minutes | 569 (4.4%) | 221 (2.2%) |
Time of Departure to Work by Sex in Oakland Park
The most frequent times of departure to work in Oakland Park are 7:30 AM to 7:59 AM (1,539, 12.0%) for males and 8:00 AM to 8:29 AM (1,658, 16.8%) for females.
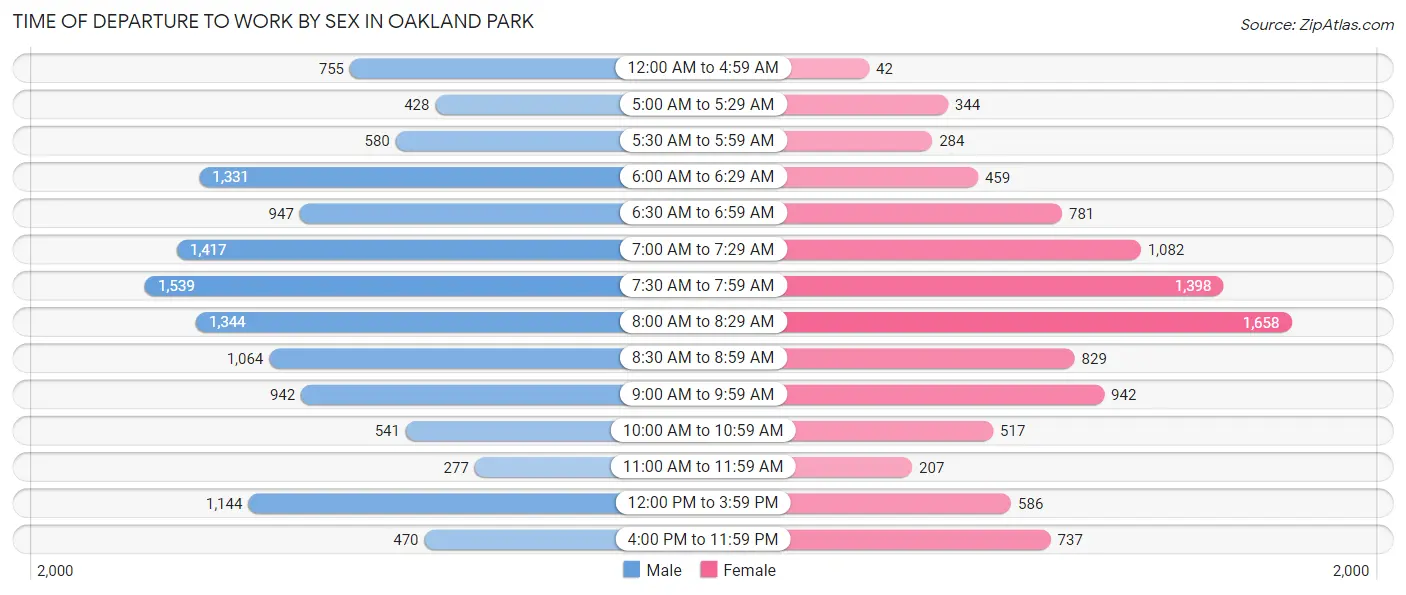
| Time of Departure | Male | Female |
| 12:00 AM to 4:59 AM | 755 (5.9%) | 42 (0.4%) |
| 5:00 AM to 5:29 AM | 428 (3.4%) | 344 (3.5%) |
| 5:30 AM to 5:59 AM | 580 (4.5%) | 284 (2.9%) |
| 6:00 AM to 6:29 AM | 1,331 (10.4%) | 459 (4.6%) |
| 6:30 AM to 6:59 AM | 947 (7.4%) | 781 (7.9%) |
| 7:00 AM to 7:29 AM | 1,417 (11.1%) | 1,082 (11.0%) |
| 7:30 AM to 7:59 AM | 1,539 (12.0%) | 1,398 (14.2%) |
| 8:00 AM to 8:29 AM | 1,344 (10.5%) | 1,658 (16.8%) |
| 8:30 AM to 8:59 AM | 1,064 (8.3%) | 829 (8.4%) |
| 9:00 AM to 9:59 AM | 942 (7.4%) | 942 (9.6%) |
| 10:00 AM to 10:59 AM | 541 (4.2%) | 517 (5.2%) |
| 11:00 AM to 11:59 AM | 277 (2.2%) | 207 (2.1%) |
| 12:00 PM to 3:59 PM | 1,144 (8.9%) | 586 (5.9%) |
| 4:00 PM to 11:59 PM | 470 (3.7%) | 737 (7.5%) |
| Total | 12,779 (100.0%) | 9,866 (100.0%) |
Housing Occupancy in Oakland Park
Occupancy by Ownership in Oakland Park
Of the total 17,415 dwellings in Oakland Park, owner-occupied units account for 9,787 (56.2%), while renter-occupied units make up 7,628 (43.8%).
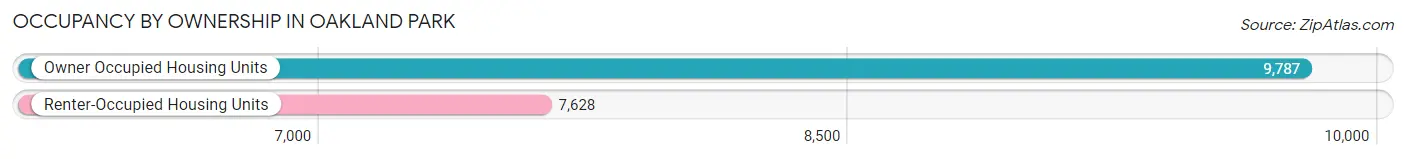
| Occupancy | # Housing Units | % Housing Units |
| Owner Occupied Housing Units | 9,787 | 56.2% |
| Renter-Occupied Housing Units | 7,628 | 43.8% |
| Total Occupied Housing Units | 17,415 | 100.0% |
Occupancy by Household Size in Oakland Park
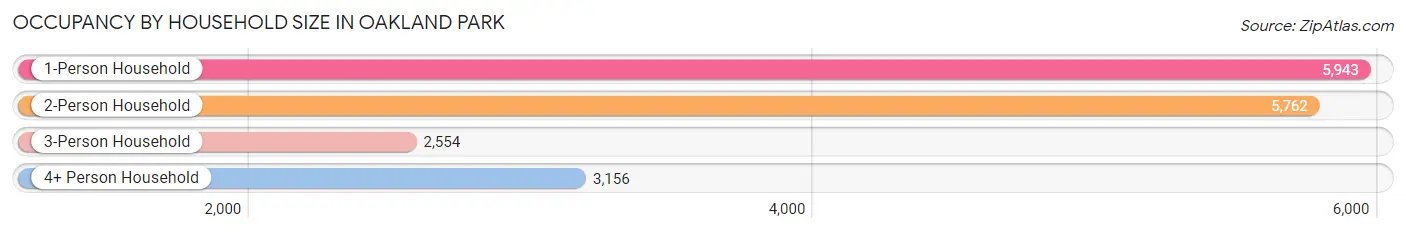
| Household Size | # Housing Units | % Housing Units |
| 1-Person Household | 5,943 | 34.1% |
| 2-Person Household | 5,762 | 33.1% |
| 3-Person Household | 2,554 | 14.7% |
| 4+ Person Household | 3,156 | 18.1% |
| Total Housing Units | 17,415 | 100.0% |
Occupancy by Ownership by Household Size in Oakland Park
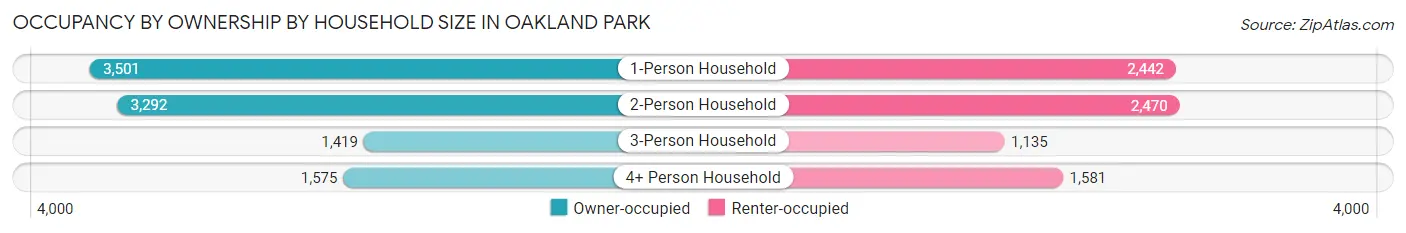
| Household Size | Owner-occupied | Renter-occupied |
| 1-Person Household | 3,501 (58.9%) | 2,442 (41.1%) |
| 2-Person Household | 3,292 (57.1%) | 2,470 (42.9%) |
| 3-Person Household | 1,419 (55.6%) | 1,135 (44.4%) |
| 4+ Person Household | 1,575 (49.9%) | 1,581 (50.1%) |
| Total Housing Units | 9,787 (56.2%) | 7,628 (43.8%) |
Occupancy by Educational Attainment in Oakland Park
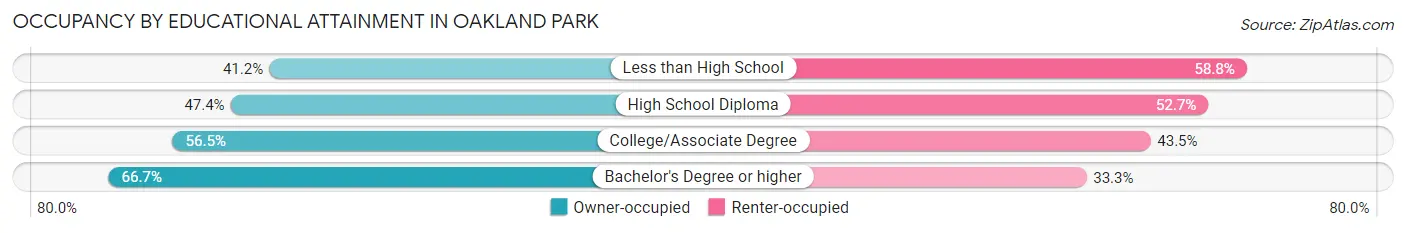
| Household Size | Owner-occupied | Renter-occupied |
| Less than High School | 683 (41.2%) | 973 (58.8%) |
| High School Diploma | 2,075 (47.3%) | 2,307 (52.6%) |
| College/Associate Degree | 3,093 (56.5%) | 2,380 (43.5%) |
| Bachelor's Degree or higher | 3,936 (66.7%) | 1,968 (33.3%) |
Occupancy by Age of Householder in Oakland Park
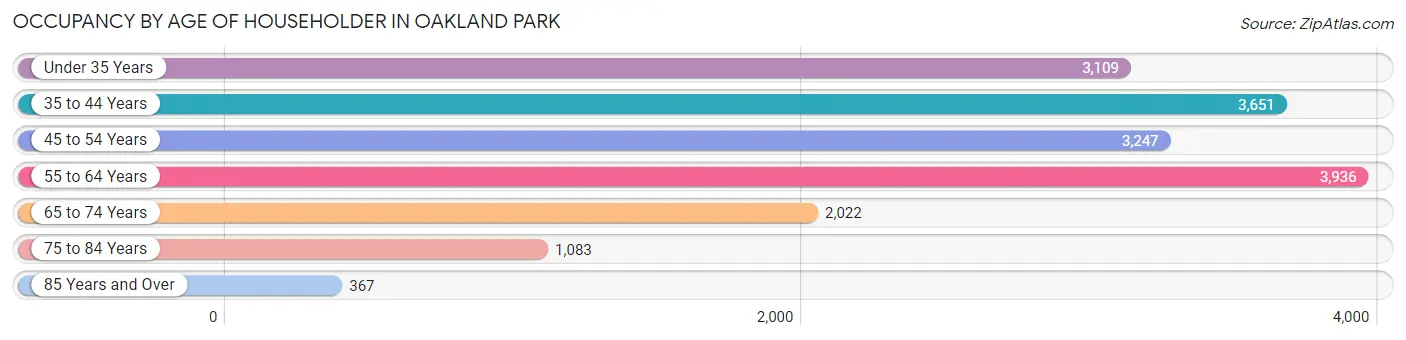
| Age Bracket | # Households | % Households |
| Under 35 Years | 3,109 | 17.8% |
| 35 to 44 Years | 3,651 | 21.0% |
| 45 to 54 Years | 3,247 | 18.6% |
| 55 to 64 Years | 3,936 | 22.6% |
| 65 to 74 Years | 2,022 | 11.6% |
| 75 to 84 Years | 1,083 | 6.2% |
| 85 Years and Over | 367 | 2.1% |
| Total | 17,415 | 100.0% |
Housing Finances in Oakland Park
Median Income by Occupancy in Oakland Park
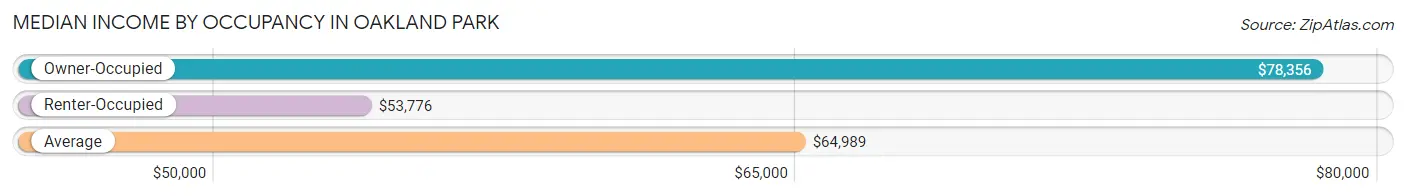
| Occupancy Type | # Households | Median Income |
| Owner-Occupied | 9,787 (56.2%) | $78,356 |
| Renter-Occupied | 7,628 (43.8%) | $53,776 |
| Average | 17,415 (100.0%) | $64,989 |
Occupancy by Householder Income Bracket in Oakland Park
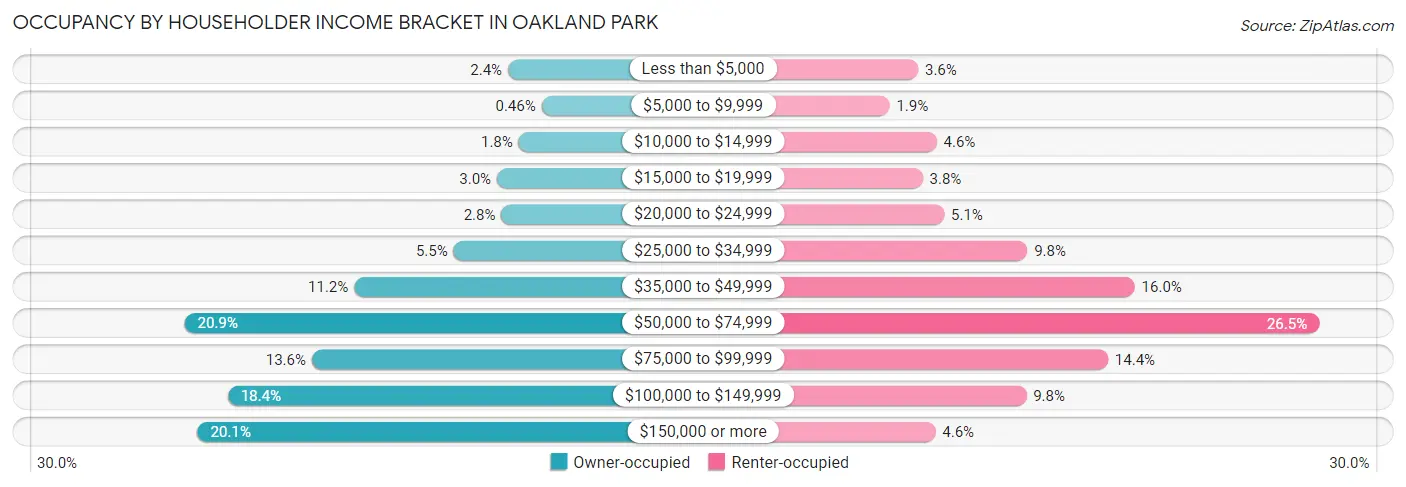
| Income Bracket | Owner-occupied | Renter-occupied |
| Less than $5,000 | 233 (2.4%) | 272 (3.6%) |
| $5,000 to $9,999 | 45 (0.5%) | 148 (1.9%) |
| $10,000 to $14,999 | 173 (1.8%) | 353 (4.6%) |
| $15,000 to $19,999 | 295 (3.0%) | 292 (3.8%) |
| $20,000 to $24,999 | 270 (2.8%) | 386 (5.1%) |
| $25,000 to $34,999 | 537 (5.5%) | 748 (9.8%) |
| $35,000 to $49,999 | 1,093 (11.2%) | 1,217 (16.0%) |
| $50,000 to $74,999 | 2,042 (20.9%) | 2,020 (26.5%) |
| $75,000 to $99,999 | 1,330 (13.6%) | 1,100 (14.4%) |
| $100,000 to $149,999 | 1,800 (18.4%) | 744 (9.8%) |
| $150,000 or more | 1,969 (20.1%) | 348 (4.6%) |
| Total | 9,787 (100.0%) | 7,628 (100.0%) |
Monthly Housing Cost Tiers in Oakland Park
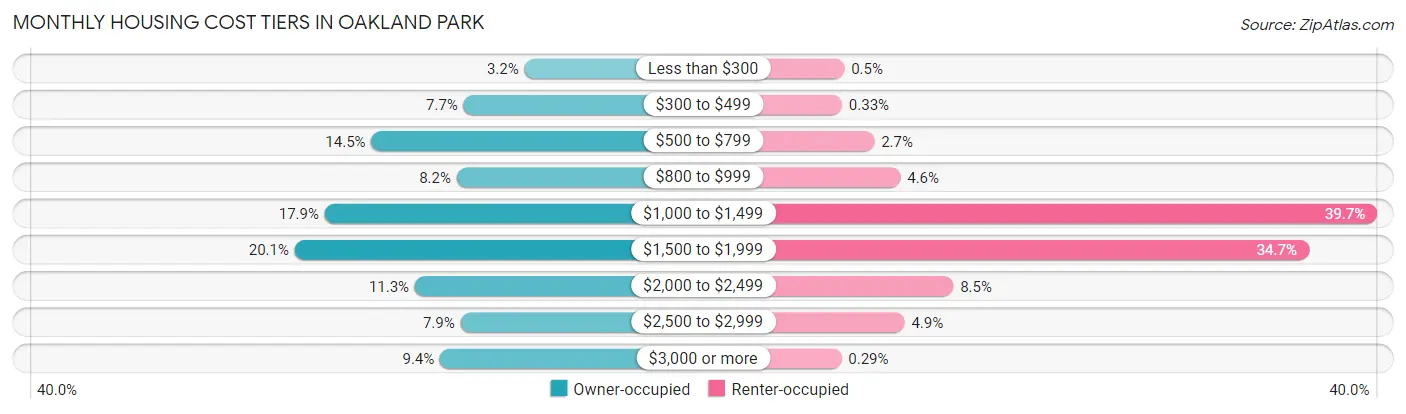
| Monthly Cost | Owner-occupied | Renter-occupied |
| Less than $300 | 311 (3.2%) | 38 (0.5%) |
| $300 to $499 | 750 (7.7%) | 25 (0.3%) |
| $500 to $799 | 1,415 (14.5%) | 207 (2.7%) |
| $800 to $999 | 800 (8.2%) | 353 (4.6%) |
| $1,000 to $1,499 | 1,751 (17.9%) | 3,031 (39.7%) |
| $1,500 to $1,999 | 1,967 (20.1%) | 2,648 (34.7%) |
| $2,000 to $2,499 | 1,101 (11.3%) | 651 (8.5%) |
| $2,500 to $2,999 | 772 (7.9%) | 377 (4.9%) |
| $3,000 or more | 920 (9.4%) | 22 (0.3%) |
| Total | 9,787 (100.0%) | 7,628 (100.0%) |
Physical Housing Characteristics in Oakland Park
Housing Structures in Oakland Park
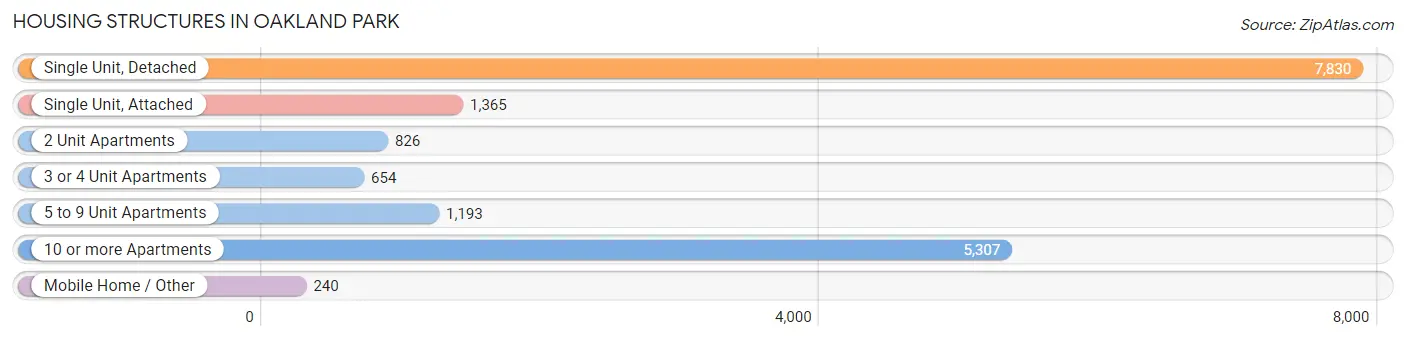
| Structure Type | # Housing Units | % Housing Units |
| Single Unit, Detached | 7,830 | 45.0% |
| Single Unit, Attached | 1,365 | 7.8% |
| 2 Unit Apartments | 826 | 4.7% |
| 3 or 4 Unit Apartments | 654 | 3.8% |
| 5 to 9 Unit Apartments | 1,193 | 6.9% |
| 10 or more Apartments | 5,307 | 30.5% |
| Mobile Home / Other | 240 | 1.4% |
| Total | 17,415 | 100.0% |
Housing Structures by Occupancy in Oakland Park
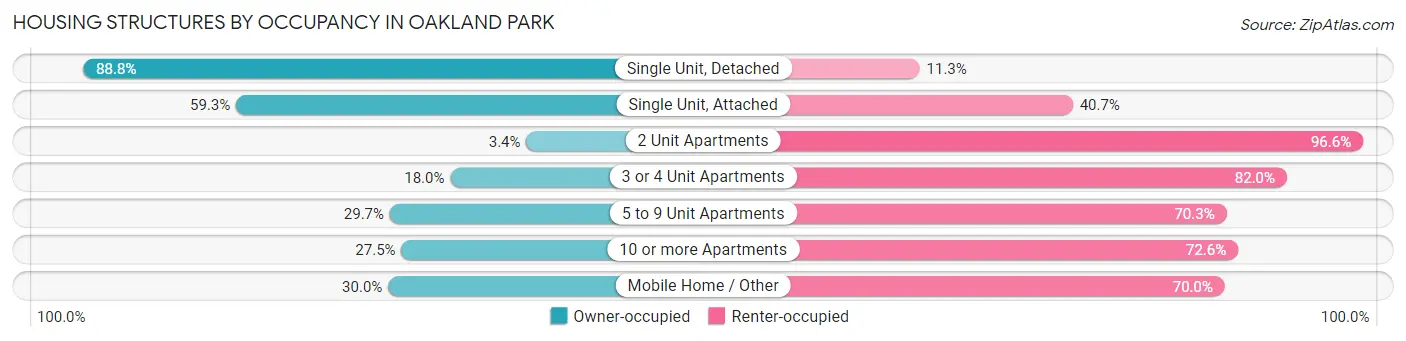
| Structure Type | Owner-occupied | Renter-occupied |
| Single Unit, Detached | 6,949 (88.7%) | 881 (11.3%) |
| Single Unit, Attached | 809 (59.3%) | 556 (40.7%) |
| 2 Unit Apartments | 28 (3.4%) | 798 (96.6%) |
| 3 or 4 Unit Apartments | 118 (18.0%) | 536 (82.0%) |
| 5 to 9 Unit Apartments | 354 (29.7%) | 839 (70.3%) |
| 10 or more Apartments | 1,457 (27.5%) | 3,850 (72.6%) |
| Mobile Home / Other | 72 (30.0%) | 168 (70.0%) |
| Total | 9,787 (56.2%) | 7,628 (43.8%) |
Housing Structures by Number of Rooms in Oakland Park
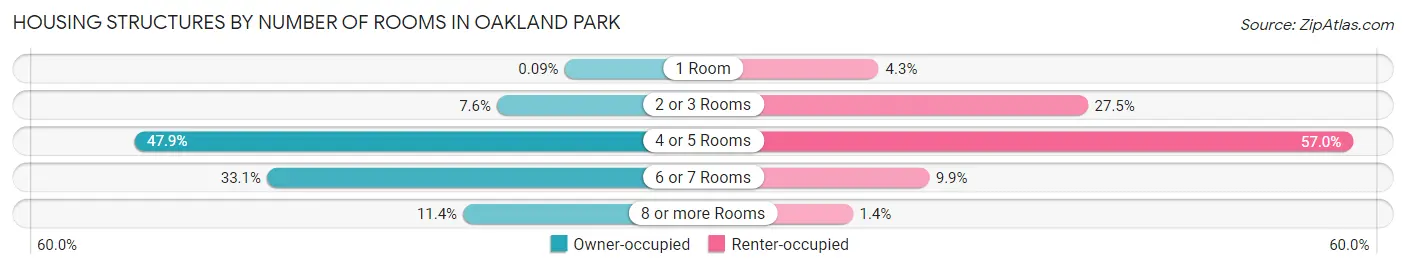
| Number of Rooms | Owner-occupied | Renter-occupied |
| 1 Room | 9 (0.1%) | 328 (4.3%) |
| 2 or 3 Rooms | 743 (7.6%) | 2,097 (27.5%) |
| 4 or 5 Rooms | 4,683 (47.8%) | 4,344 (57.0%) |
| 6 or 7 Rooms | 3,241 (33.1%) | 752 (9.9%) |
| 8 or more Rooms | 1,111 (11.4%) | 107 (1.4%) |
| Total | 9,787 (100.0%) | 7,628 (100.0%) |
Housing Structure by Heating Type in Oakland Park
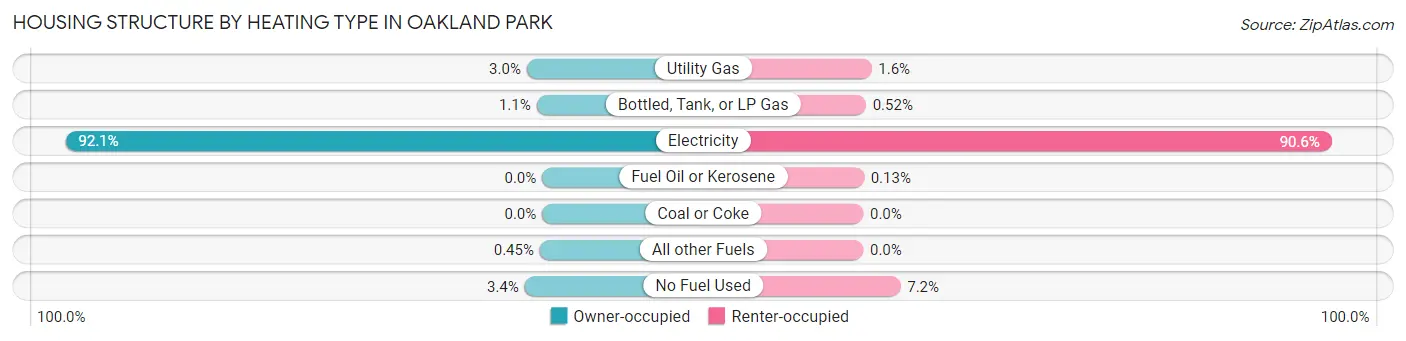
| Heating Type | Owner-occupied | Renter-occupied |
| Utility Gas | 291 (3.0%) | 122 (1.6%) |
| Bottled, Tank, or LP Gas | 105 (1.1%) | 40 (0.5%) |
| Electricity | 9,016 (92.1%) | 6,907 (90.5%) |
| Fuel Oil or Kerosene | 0 (0.0%) | 10 (0.1%) |
| Coal or Coke | 0 (0.0%) | 0 (0.0%) |
| All other Fuels | 44 (0.4%) | 0 (0.0%) |
| No Fuel Used | 331 (3.4%) | 549 (7.2%) |
| Total | 9,787 (100.0%) | 7,628 (100.0%) |
Household Vehicle Usage in Oakland Park
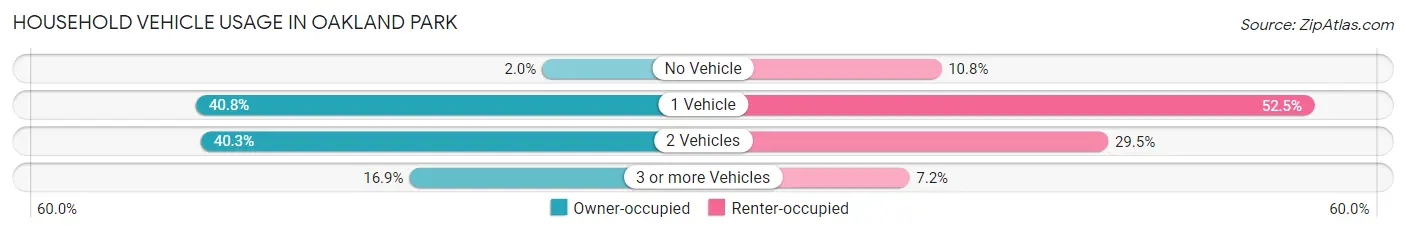
| Vehicles per Household | Owner-occupied | Renter-occupied |
| No Vehicle | 199 (2.0%) | 823 (10.8%) |
| 1 Vehicle | 3,993 (40.8%) | 4,006 (52.5%) |
| 2 Vehicles | 3,940 (40.3%) | 2,248 (29.5%) |
| 3 or more Vehicles | 1,655 (16.9%) | 551 (7.2%) |
| Total | 9,787 (100.0%) | 7,628 (100.0%) |
Real Estate & Mortgages in Oakland Park
Real Estate and Mortgage Overview in Oakland Park
| Characteristic | Without Mortgage | With Mortgage |
| Housing Units | 3,199 | 6,588 |
| Median Property Value | $283,300 | $335,200 |
| Median Household Income | $59,385 | $1,592 |
| Monthly Housing Costs | $587 | $920 |
| Real Estate Taxes | $1,842 | $129 |
Property Value by Mortgage Status in Oakland Park
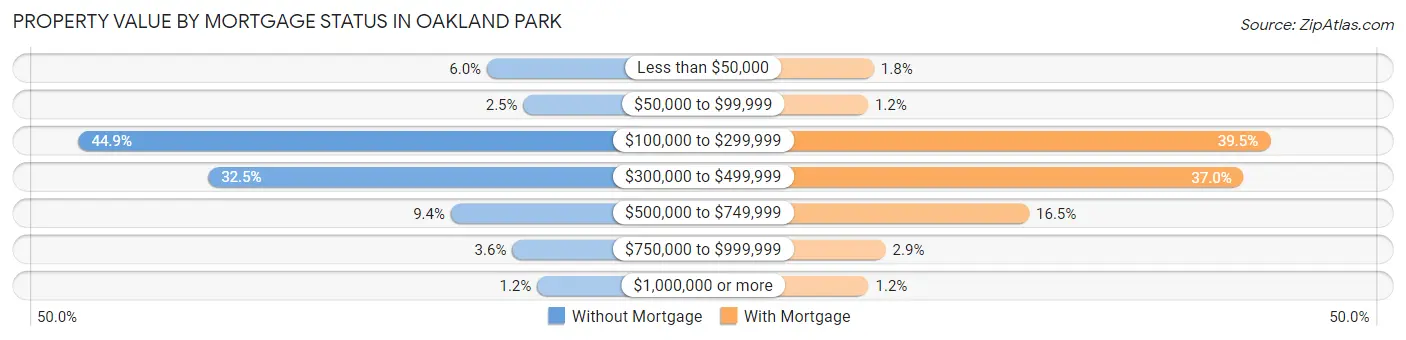
| Property Value | Without Mortgage | With Mortgage |
| Less than $50,000 | 191 (6.0%) | 115 (1.8%) |
| $50,000 to $99,999 | 80 (2.5%) | 78 (1.2%) |
| $100,000 to $299,999 | 1,435 (44.9%) | 2,600 (39.5%) |
| $300,000 to $499,999 | 1,040 (32.5%) | 2,435 (37.0%) |
| $500,000 to $749,999 | 301 (9.4%) | 1,089 (16.5%) |
| $750,000 to $999,999 | 114 (3.6%) | 189 (2.9%) |
| $1,000,000 or more | 38 (1.2%) | 82 (1.2%) |
| Total | 3,199 (100.0%) | 6,588 (100.0%) |
Household Income by Mortgage Status in Oakland Park
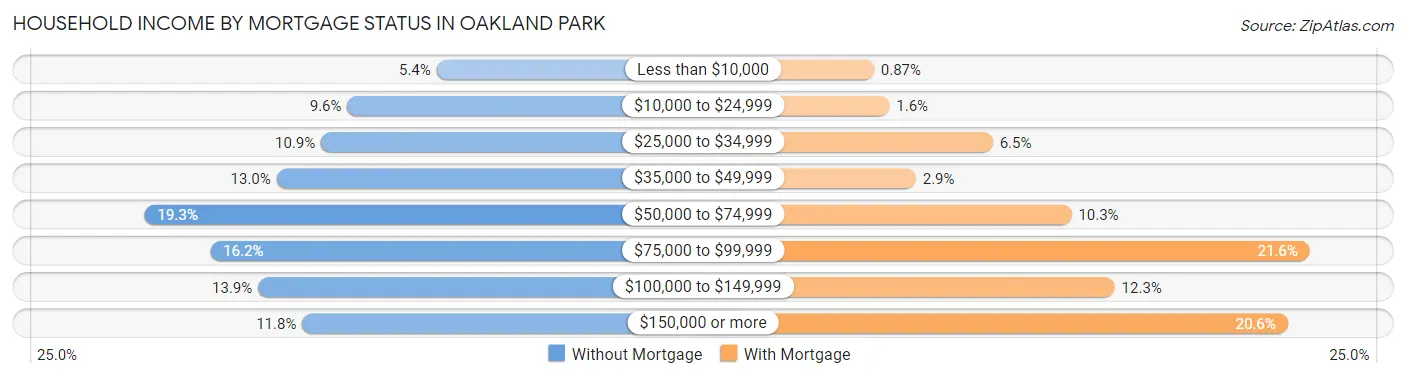
| Household Income | Without Mortgage | With Mortgage |
| Less than $10,000 | 172 (5.4%) | 57 (0.9%) |
| $10,000 to $24,999 | 308 (9.6%) | 106 (1.6%) |
| $25,000 to $34,999 | 348 (10.9%) | 430 (6.5%) |
| $35,000 to $49,999 | 416 (13.0%) | 189 (2.9%) |
| $50,000 to $74,999 | 617 (19.3%) | 677 (10.3%) |
| $75,000 to $99,999 | 517 (16.2%) | 1,425 (21.6%) |
| $100,000 to $149,999 | 444 (13.9%) | 813 (12.3%) |
| $150,000 or more | 377 (11.8%) | 1,356 (20.6%) |
| Total | 3,199 (100.0%) | 6,588 (100.0%) |
Property Value to Household Income Ratio in Oakland Park
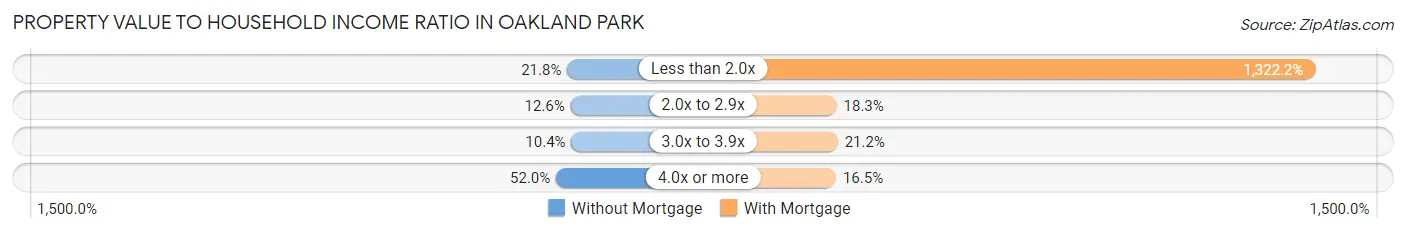
| Value-to-Income Ratio | Without Mortgage | With Mortgage |
| Less than 2.0x | 697 (21.8%) | 87,105 (1,322.2%) |
| 2.0x to 2.9x | 403 (12.6%) | 1,203 (18.3%) |
| 3.0x to 3.9x | 333 (10.4%) | 1,397 (21.2%) |
| 4.0x or more | 1,664 (52.0%) | 1,088 (16.5%) |
| Total | 3,199 (100.0%) | 6,588 (100.0%) |
Real Estate Taxes by Mortgage Status in Oakland Park
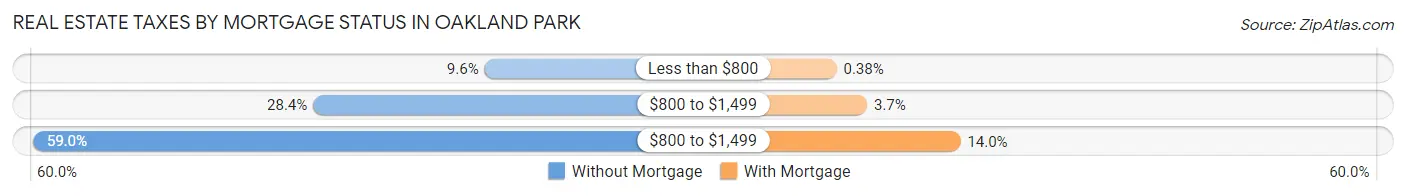
| Property Taxes | Without Mortgage | With Mortgage |
| Less than $800 | 307 (9.6%) | 25 (0.4%) |
| $800 to $1,499 | 908 (28.4%) | 245 (3.7%) |
| $800 to $1,499 | 1,887 (59.0%) | 920 (14.0%) |
| Total | 3,199 (100.0%) | 6,588 (100.0%) |
Health & Disability in Oakland Park
Health Insurance Coverage by Age in Oakland Park
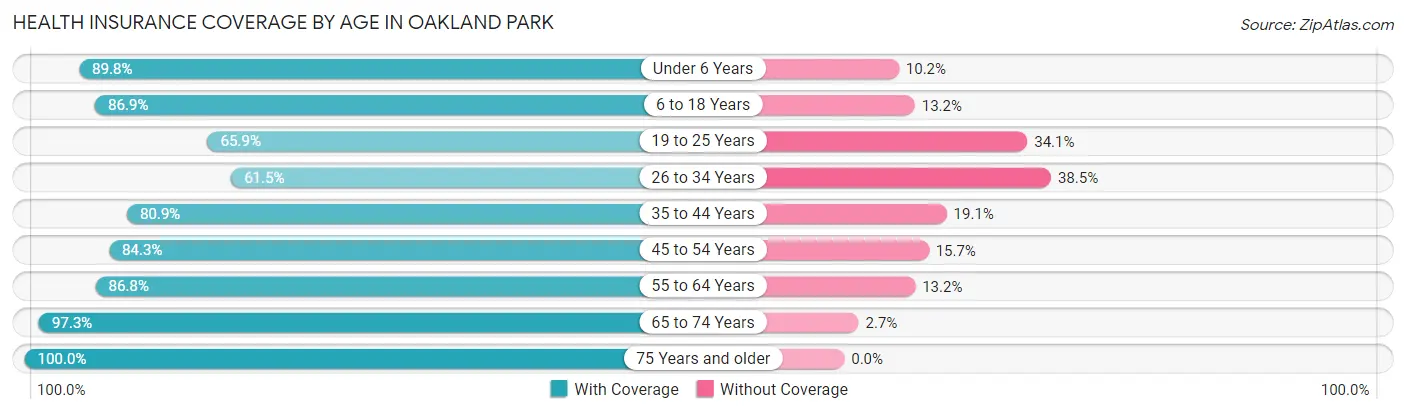
| Age Bracket | With Coverage | Without Coverage |
| Under 6 Years | 2,739 (89.8%) | 310 (10.2%) |
| 6 to 18 Years | 5,398 (86.9%) | 817 (13.2%) |
| 19 to 25 Years | 2,434 (65.9%) | 1,261 (34.1%) |
| 26 to 34 Years | 3,782 (61.5%) | 2,372 (38.5%) |
| 35 to 44 Years | 5,476 (80.9%) | 1,292 (19.1%) |
| 45 to 54 Years | 5,042 (84.3%) | 942 (15.7%) |
| 55 to 64 Years | 5,524 (86.8%) | 842 (13.2%) |
| 65 to 74 Years | 3,426 (97.3%) | 94 (2.7%) |
| 75 Years and older | 2,165 (100.0%) | 0 (0.0%) |
| Total | 35,986 (81.9%) | 7,930 (18.1%) |
Health Insurance Coverage by Citizenship Status in Oakland Park
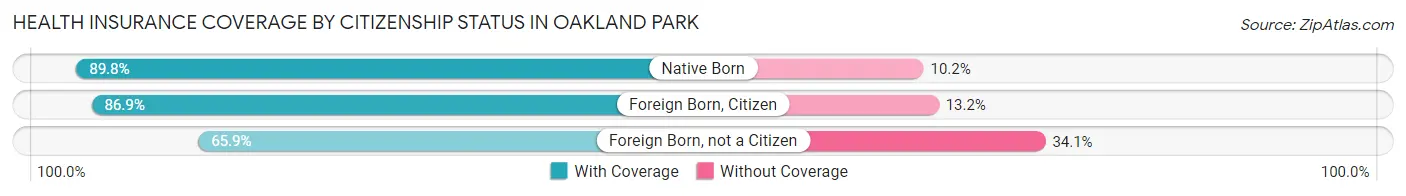
| Citizenship Status | With Coverage | Without Coverage |
| Native Born | 2,739 (89.8%) | 310 (10.2%) |
| Foreign Born, Citizen | 5,398 (86.9%) | 817 (13.2%) |
| Foreign Born, not a Citizen | 2,434 (65.9%) | 1,261 (34.1%) |
Health Insurance Coverage by Household Income in Oakland Park
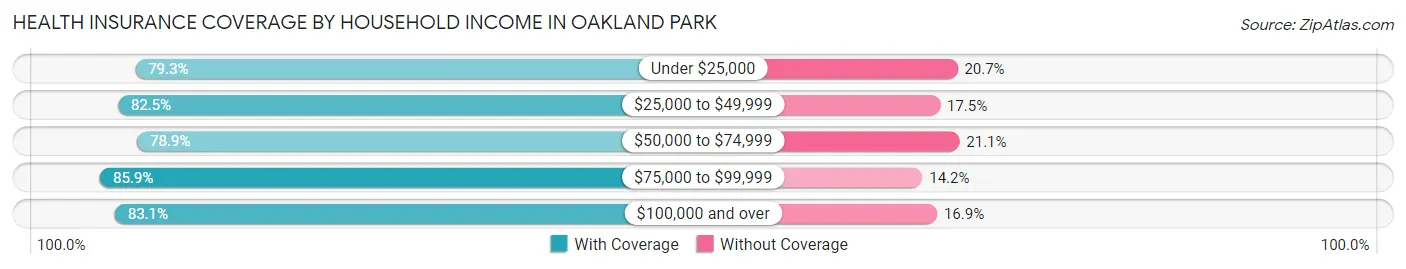
| Household Income | With Coverage | Without Coverage |
| Under $25,000 | 3,362 (79.3%) | 879 (20.7%) |
| $25,000 to $49,999 | 7,171 (82.5%) | 1,518 (17.5%) |
| $50,000 to $74,999 | 8,278 (78.9%) | 2,213 (21.1%) |
| $75,000 to $99,999 | 5,426 (85.9%) | 894 (14.1%) |
| $100,000 and over | 11,634 (83.1%) | 2,366 (16.9%) |
Public vs Private Health Insurance Coverage by Age in Oakland Park
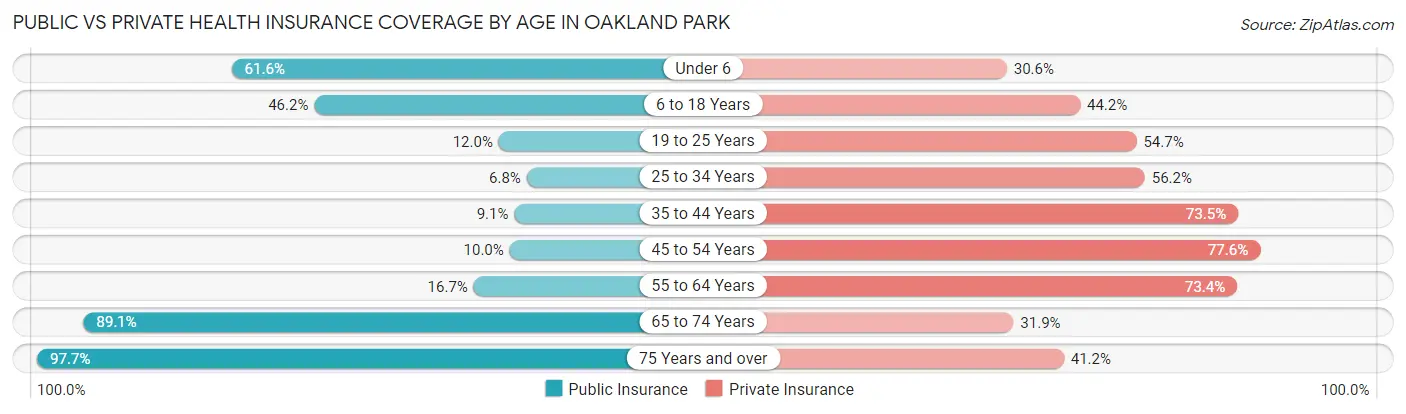
| Age Bracket | Public Insurance | Private Insurance |
| Under 6 | 1,877 (61.6%) | 934 (30.6%) |
| 6 to 18 Years | 2,874 (46.2%) | 2,748 (44.2%) |
| 19 to 25 Years | 443 (12.0%) | 2,021 (54.7%) |
| 25 to 34 Years | 419 (6.8%) | 3,461 (56.2%) |
| 35 to 44 Years | 616 (9.1%) | 4,977 (73.5%) |
| 45 to 54 Years | 597 (10.0%) | 4,645 (77.6%) |
| 55 to 64 Years | 1,060 (16.7%) | 4,670 (73.4%) |
| 65 to 74 Years | 3,136 (89.1%) | 1,121 (31.9%) |
| 75 Years and over | 2,115 (97.7%) | 892 (41.2%) |
| Total | 13,137 (29.9%) | 25,469 (58.0%) |
Disability Status by Sex by Age in Oakland Park
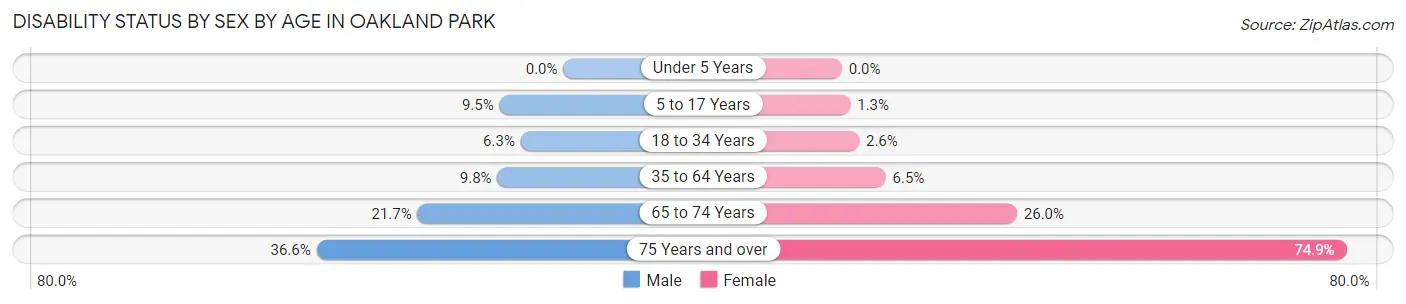
| Age Bracket | Male | Female |
| Under 5 Years | 0 (0.0%) | 0 (0.0%) |
| 5 to 17 Years | 257 (9.5%) | 39 (1.3%) |
| 18 to 34 Years | 361 (6.3%) | 124 (2.6%) |
| 35 to 64 Years | 1,018 (9.8%) | 567 (6.5%) |
| 65 to 74 Years | 390 (21.6%) | 447 (26.0%) |
| 75 Years and over | 384 (36.6%) | 837 (74.9%) |
Disability Class by Sex by Age in Oakland Park
Disability Class: Hearing Difficulty
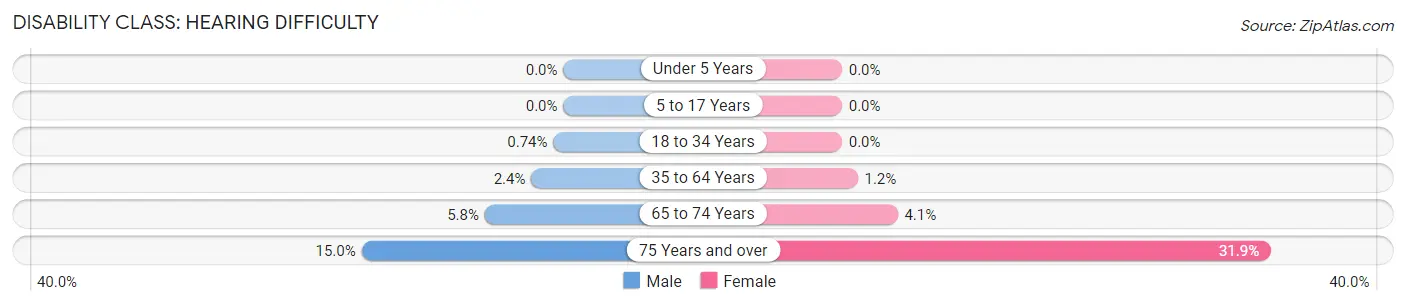
| Age Bracket | Male | Female |
| Under 5 Years | 0 (0.0%) | 0 (0.0%) |
| 5 to 17 Years | 0 (0.0%) | 0 (0.0%) |
| 18 to 34 Years | 42 (0.7%) | 0 (0.0%) |
| 35 to 64 Years | 247 (2.4%) | 102 (1.2%) |
| 65 to 74 Years | 105 (5.8%) | 71 (4.1%) |
| 75 Years and over | 157 (15.0%) | 356 (31.9%) |
Disability Class: Vision Difficulty
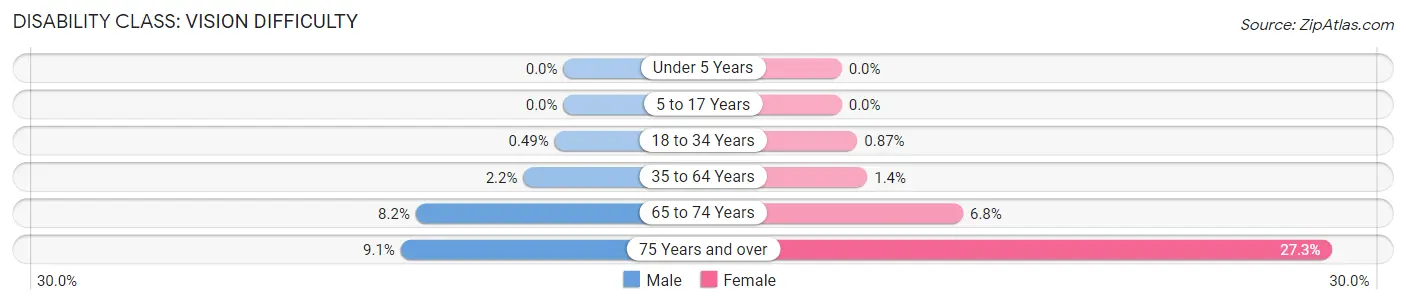
| Age Bracket | Male | Female |
| Under 5 Years | 0 (0.0%) | 0 (0.0%) |
| 5 to 17 Years | 0 (0.0%) | 0 (0.0%) |
| 18 to 34 Years | 28 (0.5%) | 42 (0.9%) |
| 35 to 64 Years | 232 (2.2%) | 124 (1.4%) |
| 65 to 74 Years | 148 (8.2%) | 116 (6.8%) |
| 75 Years and over | 95 (9.1%) | 305 (27.3%) |
Disability Class: Cognitive Difficulty
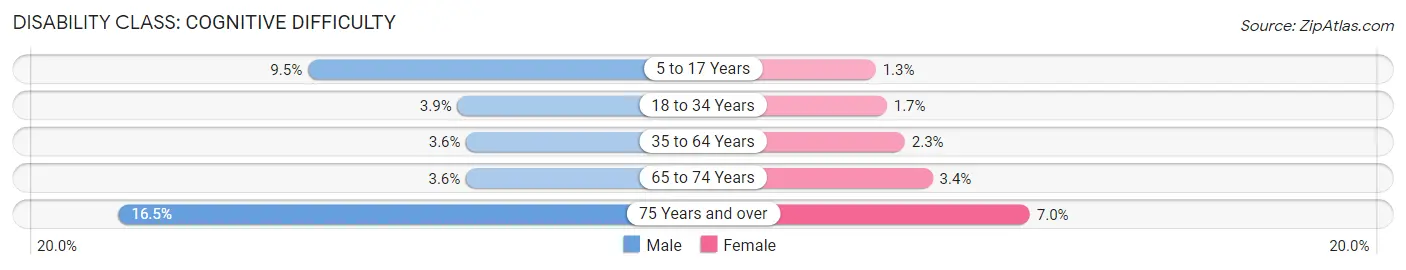
| Age Bracket | Male | Female |
| 5 to 17 Years | 257 (9.5%) | 39 (1.3%) |
| 18 to 34 Years | 224 (3.9%) | 81 (1.7%) |
| 35 to 64 Years | 374 (3.6%) | 204 (2.3%) |
| 65 to 74 Years | 65 (3.6%) | 58 (3.4%) |
| 75 Years and over | 173 (16.5%) | 78 (7.0%) |
Disability Class: Ambulatory Difficulty
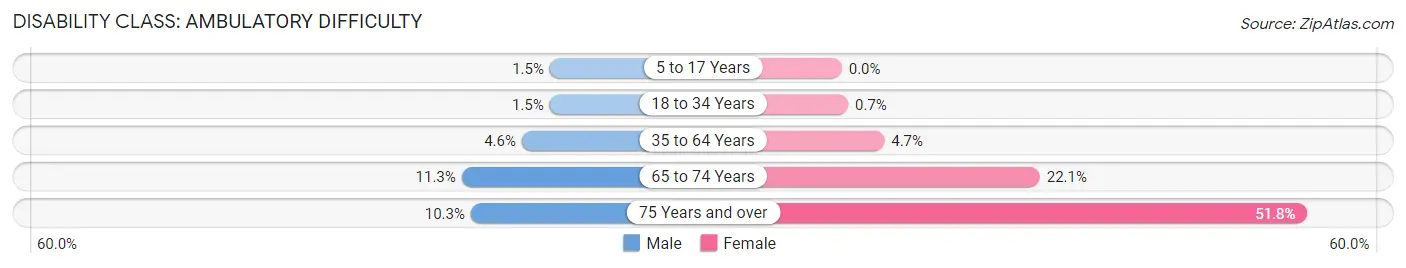
| Age Bracket | Male | Female |
| 5 to 17 Years | 41 (1.5%) | 0 (0.0%) |
| 18 to 34 Years | 88 (1.5%) | 34 (0.7%) |
| 35 to 64 Years | 482 (4.6%) | 412 (4.7%) |
| 65 to 74 Years | 204 (11.3%) | 379 (22.1%) |
| 75 Years and over | 108 (10.3%) | 579 (51.8%) |
Disability Class: Self-Care Difficulty
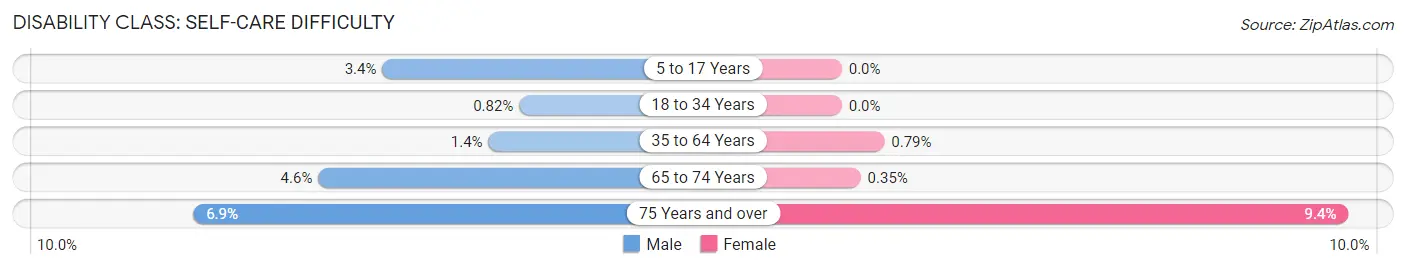
| Age Bracket | Male | Female |
| 5 to 17 Years | 91 (3.4%) | 0 (0.0%) |
| 18 to 34 Years | 47 (0.8%) | 0 (0.0%) |
| 35 to 64 Years | 145 (1.4%) | 69 (0.8%) |
| 65 to 74 Years | 82 (4.5%) | 6 (0.4%) |
| 75 Years and over | 72 (6.9%) | 105 (9.4%) |
Technology Access in Oakland Park
Computing Device Access in Oakland Park
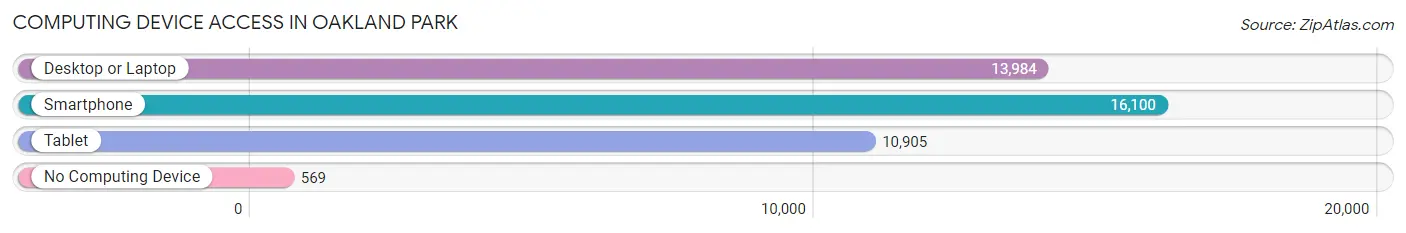
| Device Type | # Households | % Households |
| Desktop or Laptop | 13,984 | 80.3% |
| Smartphone | 16,100 | 92.4% |
| Tablet | 10,905 | 62.6% |
| No Computing Device | 569 | 3.3% |
| Total | 17,415 | 100.0% |
Internet Access in Oakland Park
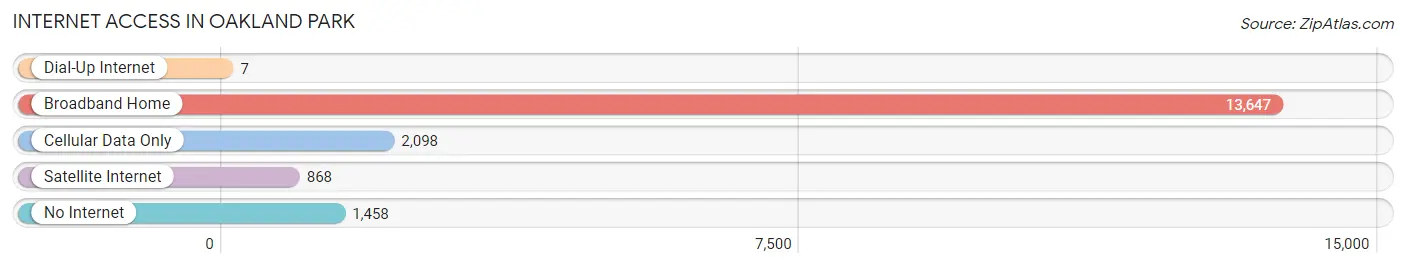
| Internet Type | # Households | % Households |
| Dial-Up Internet | 7 | 0.0% |
| Broadband Home | 13,647 | 78.4% |
| Cellular Data Only | 2,098 | 12.0% |
| Satellite Internet | 868 | 5.0% |
| No Internet | 1,458 | 8.4% |
| Total | 17,415 | 100.0% |
Oakland Park Summary
Oakland Park is a city located in Broward County, Florida, United States. The city is part of the Miami metropolitan area, which was home to an estimated 6,012,331 people in 2015. Oakland Park is located just north of Fort Lauderdale, and is bordered by Wilton Manors to the south, Lauderdale-by-the-Sea to the east, and Pompano Beach to the north.
History
The area that is now Oakland Park was originally inhabited by the Tequesta Indians, who were the first known inhabitants of the area. The Tequesta were a peaceful tribe that lived in the area for thousands of years before the arrival of Europeans.
In the late 1800s, the area was settled by William J. Strachan, who established a pineapple plantation. Strachan named the area “Oakland Park” after his hometown of Oakland, California. The area was incorporated as a town in 1925, and was later annexed by the City of Fort Lauderdale in 1929.
In the 1950s, Oakland Park began to experience rapid growth as the city of Fort Lauderdale began to expand. The city was officially incorporated in 1961, and has since become a popular destination for tourists and residents alike.
Geography
Oakland Park is located in southeastern Florida, in Broward County. The city is situated on the Atlantic Coastal Ridge, which is a series of low hills that run along the eastern coast of Florida. The city is bordered by Wilton Manors to the south, Lauderdale-by-the-Sea to the east, and Pompano Beach to the north.
The city has a total area of 4.2 square miles, of which 4.1 square miles is land and 0.1 square miles is water. The city is located approximately 20 miles north of Miami and 25 miles south of West Palm Beach.
Economy
Oakland Park has a diverse economy that is driven by tourism, manufacturing, and retail. The city is home to several large employers, including the Oakland Park Shopping Center, which is the largest shopping center in the city. Other major employers include the Oakland Park Medical Center, the Oakland Park Fire Department, and the Oakland Park Police Department.
The city also has a thriving arts and culture scene, with several galleries, museums, and theaters. The city is also home to several festivals and events, including the Oakland Park Arts and Music Festival, the Oakland Park Jazz Festival, and the Oakland Park International Film Festival.
Demographics
As of the 2010 census, Oakland Park had a population of 41,363. The racial makeup of the city was 57.2% White, 28.3% African American, 0.4% Native American, 2.2% Asian, 0.1% Pacific Islander, 8.2% from other races, and 3.7% from two or more races. Hispanic or Latino of any race were 24.2% of the population.
The median income for a household in the city was $41,945, and the median income for a family was $50,945. The per capita income for the city was $23,845. About 11.2% of families and 14.2% of the population were below the poverty line, including 20.2% of those under age 18 and 8.2% of those age 65 or over.
Oakland Park is a diverse and vibrant city that has a lot to offer its residents and visitors. The city has a rich history, a thriving economy, and a diverse population that makes it a great place to live and visit.
Common Questions
What is Per Capita Income in Oakland Park?
Per Capita income in Oakland Park is $35,533.
What is the Median Family Income in Oakland Park?
Median Family Income in Oakland Park is $67,065.
What is the Median Household income in Oakland Park?
Median Household Income in Oakland Park is $64,989.
What is Income or Wage Gap in Oakland Park?
Income or Wage Gap in Oakland Park is 19.3%.
Women in Oakland Park earn 80.7 cents for every dollar earned by a man.
What is Family Income Deficit in Oakland Park?
Family Income Deficit in Oakland Park is $9,903.
Families that are below poverty line in Oakland Park earn $9,903 less on average than the poverty threshold level.
What is Inequality or Gini Index in Oakland Park?
Inequality or Gini Index in Oakland Park is 0.43.
What is the Total Population of Oakland Park?
Total Population of Oakland Park is 44,056.
What is the Total Male Population of Oakland Park?
Total Male Population of Oakland Park is 23,085.
What is the Total Female Population of Oakland Park?
Total Female Population of Oakland Park is 20,971.
What is the Ratio of Males per 100 Females in Oakland Park?
There are 110.08 Males per 100 Females in Oakland Park.
What is the Ratio of Females per 100 Males in Oakland Park?
There are 90.84 Females per 100 Males in Oakland Park.
What is the Median Population Age in Oakland Park?
Median Population Age in Oakland Park is 39.1 Years.
What is the Average Family Size in Oakland Park
Average Family Size in Oakland Park is 3.4 People.
What is the Average Household Size in Oakland Park
Average Household Size in Oakland Park is 2.5 People.
How Large is the Labor Force in Oakland Park?
There are 27,526 People in the Labor Forcein in Oakland Park.
What is the Percentage of People in the Labor Force in Oakland Park?
75.7% of People are in the Labor Force in Oakland Park.
What is the Unemployment Rate in Oakland Park?
Unemployment Rate in Oakland Park is 6.4%.