Haines City, FL Map & Demographics
Haines City Map
Haines City Overview
$26,919
PER CAPITA INCOME
$63,147
AVG FAMILY INCOME
$57,718
AVG HOUSEHOLD INCOME
20.2%
WAGE / INCOME GAP [ % ]
79.8¢/ $1
WAGE / INCOME GAP [ $ ]
$12,358
FAMILY INCOME DEFICIT
0.46
INEQUALITY / GINI INDEX
28,922
TOTAL POPULATION
14,209
MALE POPULATION
14,713
FEMALE POPULATION
96.57
MALES / 100 FEMALES
103.55
FEMALES / 100 MALES
36.7
MEDIAN AGE
3.6
AVG FAMILY SIZE
3.1
AVG HOUSEHOLD SIZE
12,993
LABOR FORCE [ PEOPLE ]
58.5%
PERCENT IN LABOR FORCE
4.8%
UNEMPLOYMENT RATE
Haines City Zip Codes
Haines City Area Codes
Income in Haines City
Income Overview in Haines City
Per Capita Income in Haines City is $26,919, while median incomes of families and households are $63,147 and $57,718 respectively.
| Characteristic | Number | Measure |
| Per Capita Income | 28,922 | $26,919 |
| Median Family Income | 6,724 | $63,147 |
| Mean Family Income | 6,724 | $86,189 |
| Median Household Income | 9,319 | $57,718 |
| Mean Household Income | 9,319 | $77,951 |
| Income Deficit | 6,724 | $12,358 |
| Wage / Income Gap (%) | 28,922 | 20.21% |
| Wage / Income Gap ($) | 28,922 | 79.79¢ per $1 |
| Gini / Inequality Index | 28,922 | 0.46 |
Earnings by Sex in Haines City
Average Earnings in Haines City are $33,915, $36,583 for men and $29,191 for women, a difference of 20.2%.
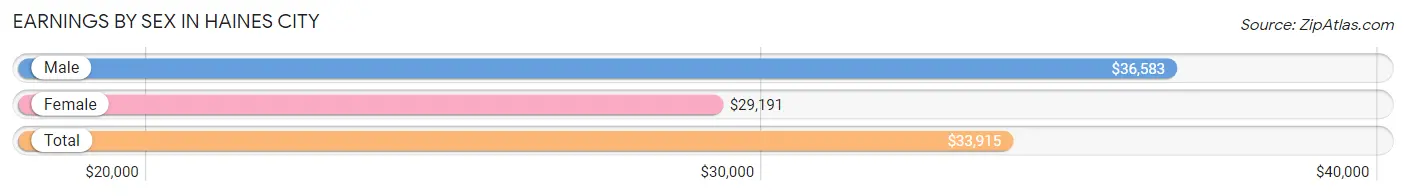
| Sex | Number | Average Earnings |
| Male | 7,292 (56.5%) | $36,583 |
| Female | 5,614 (43.5%) | $29,191 |
| Total | 12,906 (100.0%) | $33,915 |
Earnings by Sex by Income Bracket in Haines City
The most common earnings brackets in Haines City are $30,000 to $34,999 for men (1,030 | 14.1%) and $25,000 to $29,999 for women (1,001 | 17.8%).
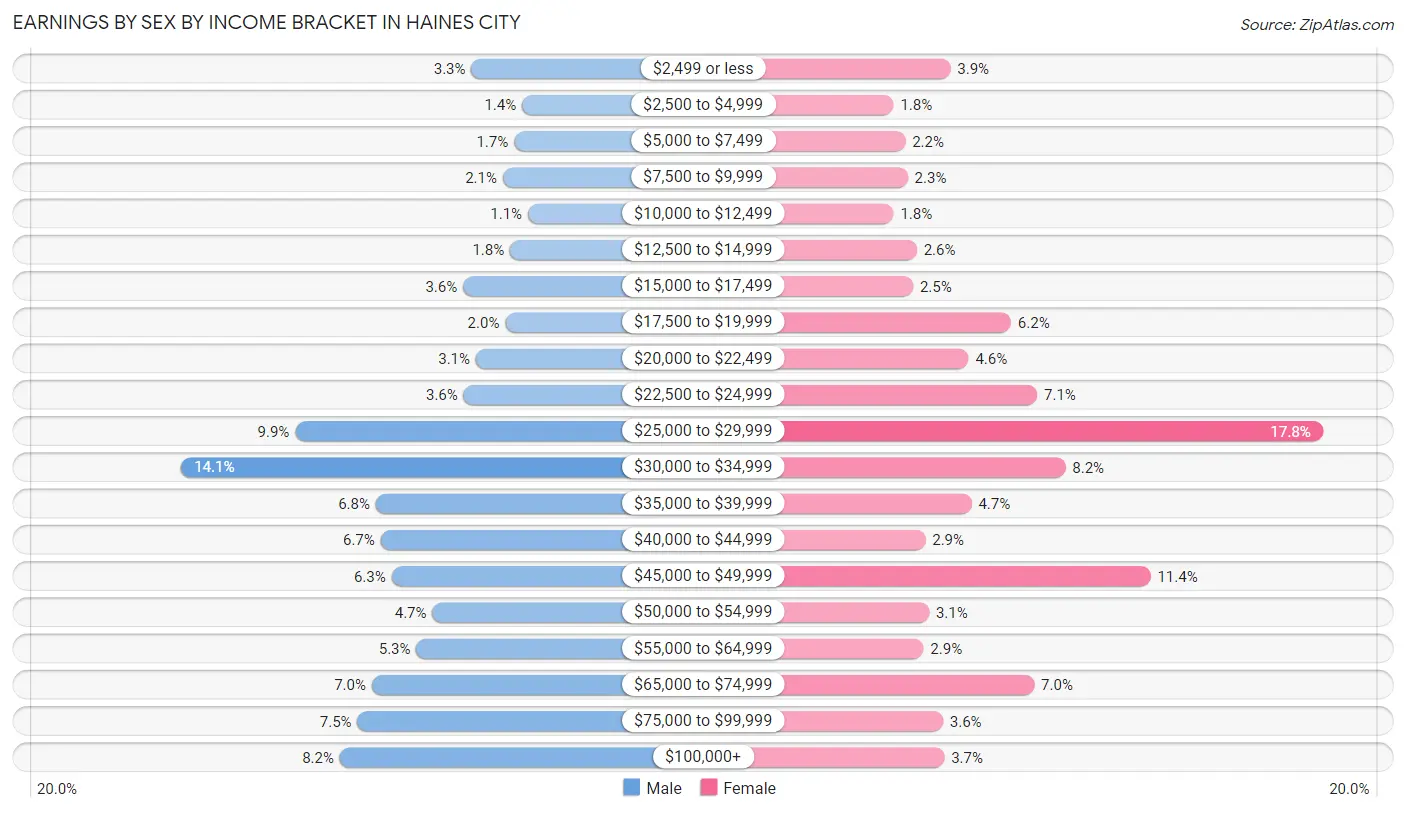
| Income | Male | Female |
| $2,499 or less | 238 (3.3%) | 218 (3.9%) |
| $2,500 to $4,999 | 99 (1.4%) | 98 (1.8%) |
| $5,000 to $7,499 | 121 (1.7%) | 123 (2.2%) |
| $7,500 to $9,999 | 152 (2.1%) | 128 (2.3%) |
| $10,000 to $12,499 | 83 (1.1%) | 98 (1.8%) |
| $12,500 to $14,999 | 132 (1.8%) | 147 (2.6%) |
| $15,000 to $17,499 | 260 (3.6%) | 139 (2.5%) |
| $17,500 to $19,999 | 145 (2.0%) | 345 (6.1%) |
| $20,000 to $22,499 | 225 (3.1%) | 256 (4.6%) |
| $22,500 to $24,999 | 259 (3.5%) | 400 (7.1%) |
| $25,000 to $29,999 | 719 (9.9%) | 1,001 (17.8%) |
| $30,000 to $34,999 | 1,030 (14.1%) | 460 (8.2%) |
| $35,000 to $39,999 | 499 (6.8%) | 262 (4.7%) |
| $40,000 to $44,999 | 486 (6.7%) | 165 (2.9%) |
| $45,000 to $49,999 | 456 (6.2%) | 639 (11.4%) |
| $50,000 to $54,999 | 344 (4.7%) | 173 (3.1%) |
| $55,000 to $64,999 | 388 (5.3%) | 161 (2.9%) |
| $65,000 to $74,999 | 510 (7.0%) | 394 (7.0%) |
| $75,000 to $99,999 | 549 (7.5%) | 202 (3.6%) |
| $100,000+ | 597 (8.2%) | 205 (3.6%) |
| Total | 7,292 (100.0%) | 5,614 (100.0%) |
Earnings by Sex by Educational Attainment in Haines City
Average earnings in Haines City are $40,126 for men and $31,286 for women, a difference of 22.0%. Men with an educational attainment of graduate degree enjoy the highest average annual earnings of $64,737, while those with less than high school education earn the least with $33,360. Women with an educational attainment of graduate degree earn the most with the average annual earnings of $53,452, while those with less than high school education have the smallest earnings of $23,897.
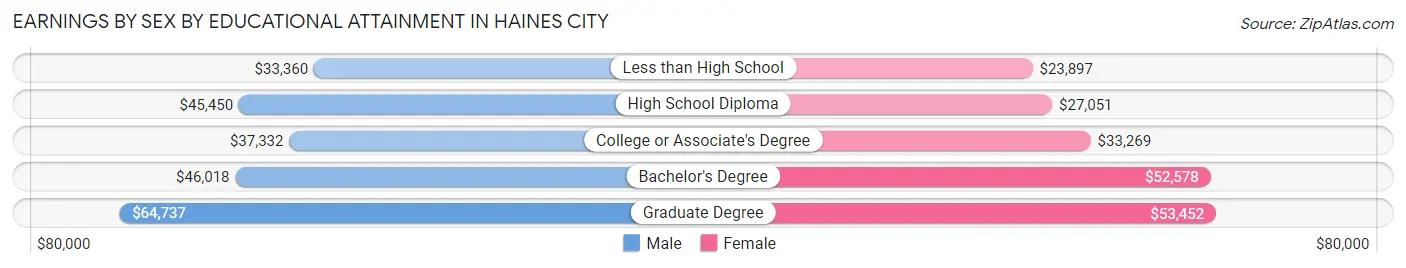
| Educational Attainment | Male Income | Female Income |
| Less than High School | $33,360 | $23,897 |
| High School Diploma | $45,450 | $27,051 |
| College or Associate's Degree | $37,332 | $33,269 |
| Bachelor's Degree | $46,018 | $52,578 |
| Graduate Degree | $64,737 | $53,452 |
| Total | $40,126 | $31,286 |
Family Income in Haines City
Family Income Brackets in Haines City
According to the Haines City family income data, there are 1,681 families falling into the $50,000 to $74,999 income range, which is the most common income bracket and makes up 25.0% of all families. Conversely, the $10,000 to $14,999 income bracket is the least frequent group with only 114 families (1.7%) belonging to this category.
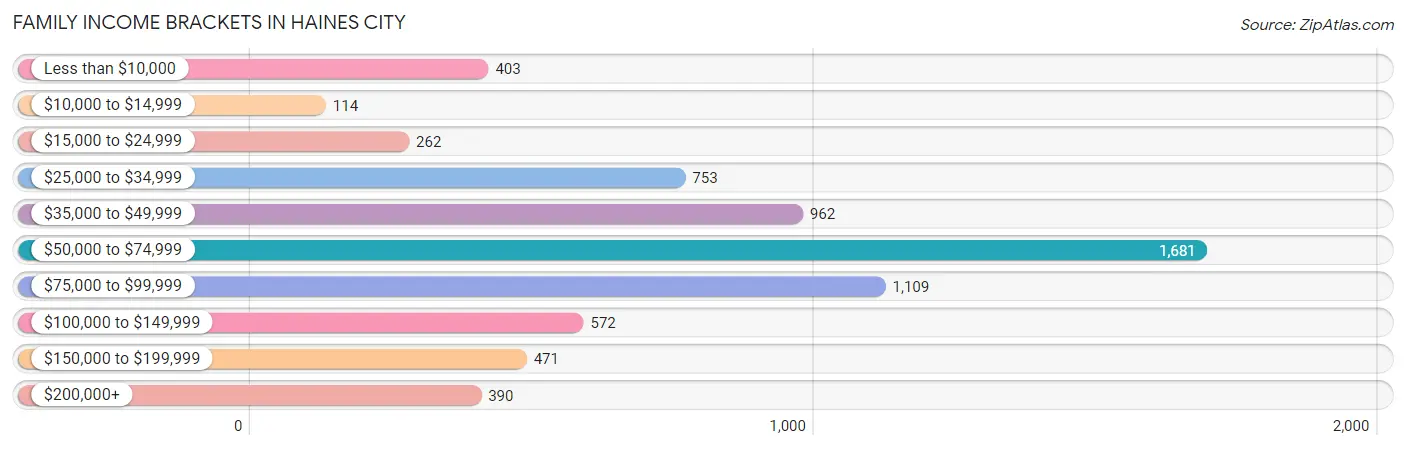
| Income Bracket | # Families | % Families |
| Less than $10,000 | 403 | 6.0% |
| $10,000 to $14,999 | 114 | 1.7% |
| $15,000 to $24,999 | 262 | 3.9% |
| $25,000 to $34,999 | 753 | 11.2% |
| $35,000 to $49,999 | 962 | 14.3% |
| $50,000 to $74,999 | 1,681 | 25.0% |
| $75,000 to $99,999 | 1,109 | 16.5% |
| $100,000 to $149,999 | 572 | 8.5% |
| $150,000 to $199,999 | 471 | 7.0% |
| $200,000+ | 390 | 5.8% |
Family Income by Famaliy Size in Haines City
7+ person families (131 | 1.9%) account for the highest median family income in Haines City with $81,592 per family, while 2-person families (2,947 | 43.8%) have the highest median income of $27,252 per family member.
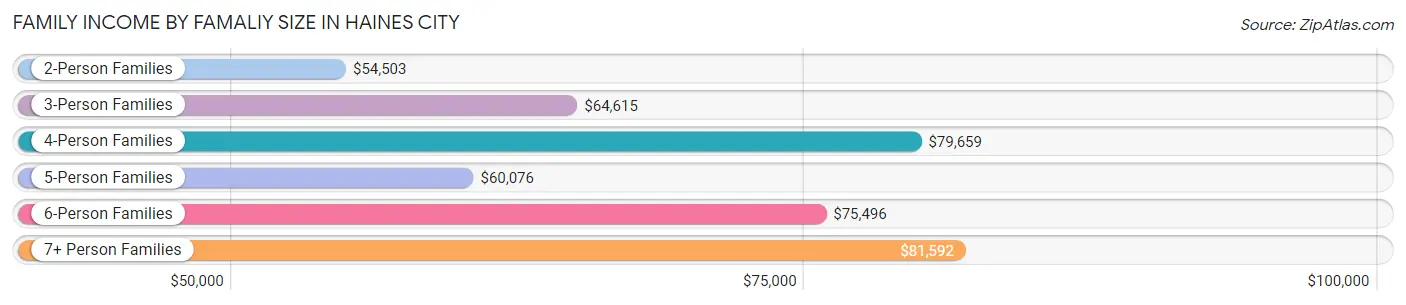
| Income Bracket | # Families | Median Income |
| 2-Person Families | 2,947 (43.8%) | $54,503 |
| 3-Person Families | 1,178 (17.5%) | $64,615 |
| 4-Person Families | 1,243 (18.5%) | $79,659 |
| 5-Person Families | 784 (11.7%) | $60,076 |
| 6-Person Families | 441 (6.6%) | $75,496 |
| 7+ Person Families | 131 (1.9%) | $81,592 |
| Total | 6,724 (100.0%) | $63,147 |
Family Income by Number of Earners in Haines City
The median family income in Haines City is $63,147, with families comprising 3+ earners (680) having the highest median family income of $103,750, while families with no earners (1,466) have the lowest median family income of $30,509, accounting for 10.1% and 21.8% of families, respectively.
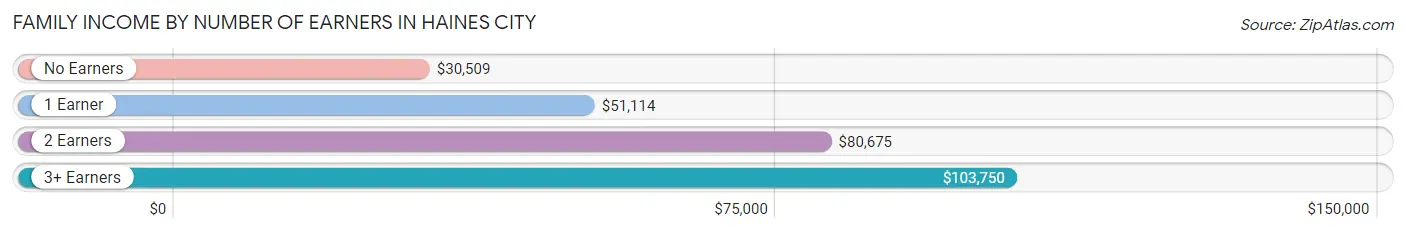
| Number of Earners | # Families | Median Income |
| No Earners | 1,466 (21.8%) | $30,509 |
| 1 Earner | 2,380 (35.4%) | $51,114 |
| 2 Earners | 2,198 (32.7%) | $80,675 |
| 3+ Earners | 680 (10.1%) | $103,750 |
| Total | 6,724 (100.0%) | $63,147 |
Household Income in Haines City
Household Income Brackets in Haines City
With 2,041 households falling in the category, the $50,000 to $74,999 income range is the most frequent in Haines City, accounting for 21.9% of all households. In contrast, only 252 households (2.7%) fall into the $10,000 to $14,999 income bracket, making it the least populous group.
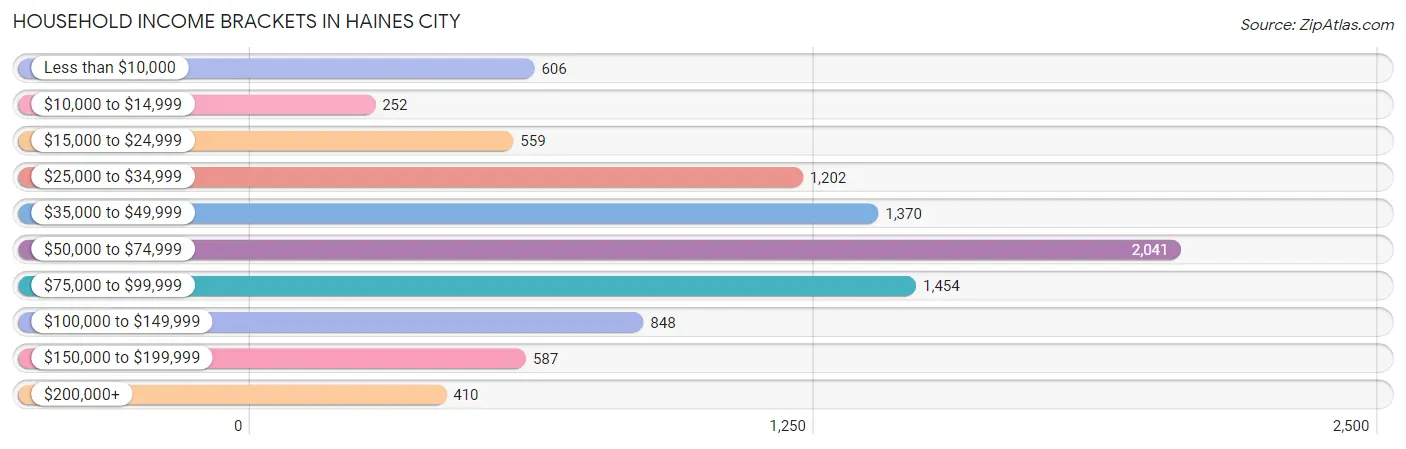
| Income Bracket | # Households | % Households |
| Less than $10,000 | 606 | 6.5% |
| $10,000 to $14,999 | 252 | 2.7% |
| $15,000 to $24,999 | 559 | 6.0% |
| $25,000 to $34,999 | 1,202 | 12.9% |
| $35,000 to $49,999 | 1,370 | 14.7% |
| $50,000 to $74,999 | 2,041 | 21.9% |
| $75,000 to $99,999 | 1,454 | 15.6% |
| $100,000 to $149,999 | 848 | 9.1% |
| $150,000 to $199,999 | 587 | 6.3% |
| $200,000+ | 410 | 4.4% |
Household Income by Householder Age in Haines City
The median household income in Haines City is $57,718, with the highest median household income of $88,203 found in the 15 to 24 years age bracket for the primary householder. A total of 340 households (3.6%) fall into this category. Meanwhile, the 65+ years age bracket for the primary householder has the lowest median household income of $38,670, with 2,383 households (25.6%) in this group.
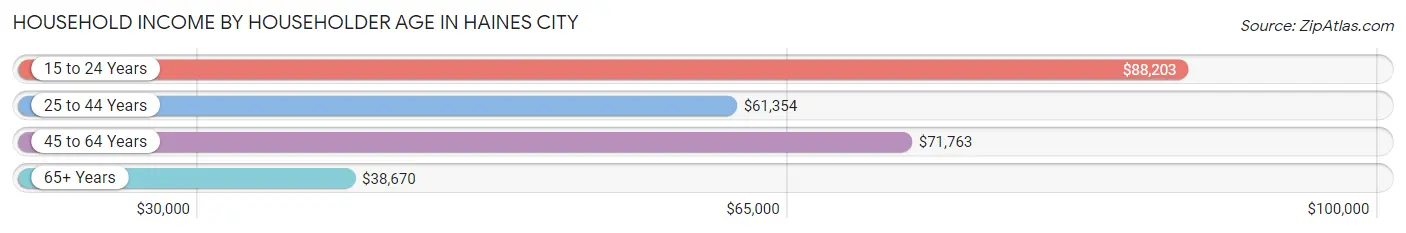
| Income Bracket | # Households | Median Income |
| 15 to 24 Years | 340 (3.6%) | $88,203 |
| 25 to 44 Years | 3,383 (36.3%) | $61,354 |
| 45 to 64 Years | 3,213 (34.5%) | $71,763 |
| 65+ Years | 2,383 (25.6%) | $38,670 |
| Total | 9,319 (100.0%) | $57,718 |
Poverty in Haines City
Income Below Poverty by Sex and Age in Haines City
With 12.0% poverty level for males and 21.7% for females among the residents of Haines City, 12 to 14 year old males and 6 to 11 year old females are the most vulnerable to poverty, with 126 males (24.2%) and 370 females (32.0%) in their respective age groups living below the poverty level.
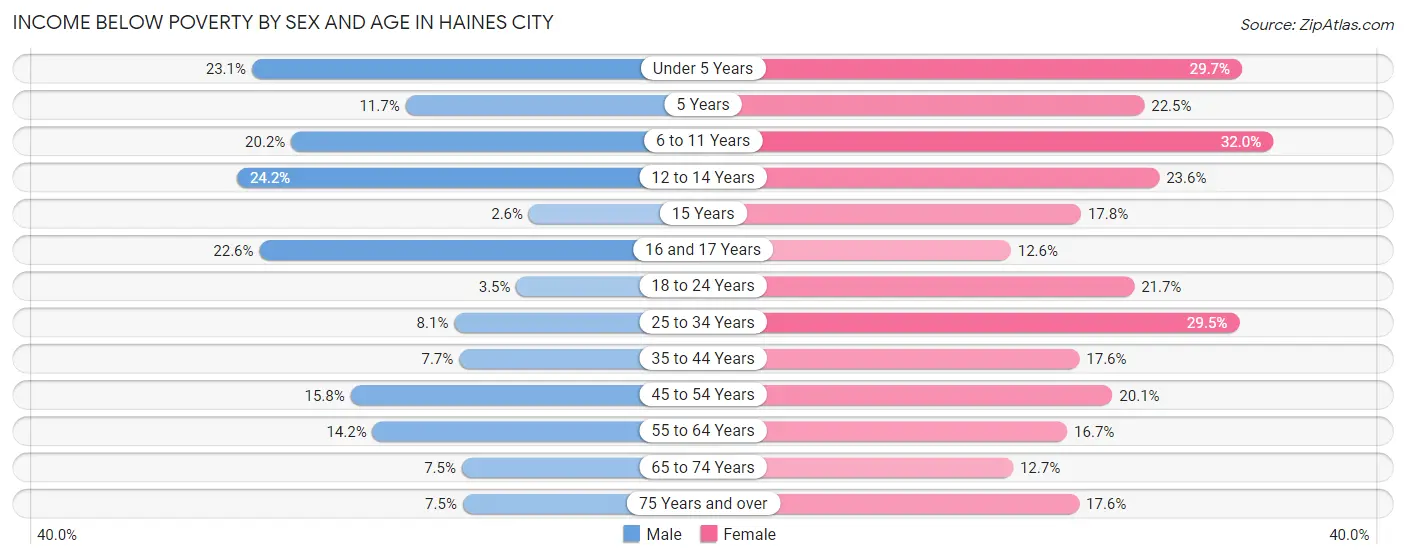
| Age Bracket | Male | Female |
| Under 5 Years | 219 (23.1%) | 259 (29.7%) |
| 5 Years | 15 (11.7%) | 64 (22.5%) |
| 6 to 11 Years | 268 (20.2%) | 370 (32.0%) |
| 12 to 14 Years | 126 (24.2%) | 235 (23.6%) |
| 15 Years | 7 (2.6%) | 19 (17.8%) |
| 16 and 17 Years | 65 (22.6%) | 32 (12.6%) |
| 18 to 24 Years | 39 (3.5%) | 252 (21.7%) |
| 25 to 34 Years | 186 (8.1%) | 556 (29.5%) |
| 35 to 44 Years | 181 (7.7%) | 398 (17.6%) |
| 45 to 54 Years | 213 (15.8%) | 352 (20.1%) |
| 55 to 64 Years | 222 (14.2%) | 285 (16.7%) |
| 65 to 74 Years | 82 (7.5%) | 111 (12.7%) |
| 75 Years and over | 57 (7.5%) | 219 (17.6%) |
| Total | 1,680 (12.0%) | 3,152 (21.7%) |
Income Above Poverty by Sex and Age in Haines City
According to the poverty statistics in Haines City, males aged 15 years and females aged 16 and 17 years are the age groups that are most secure financially, with 97.4% of males and 87.5% of females in these age groups living above the poverty line.
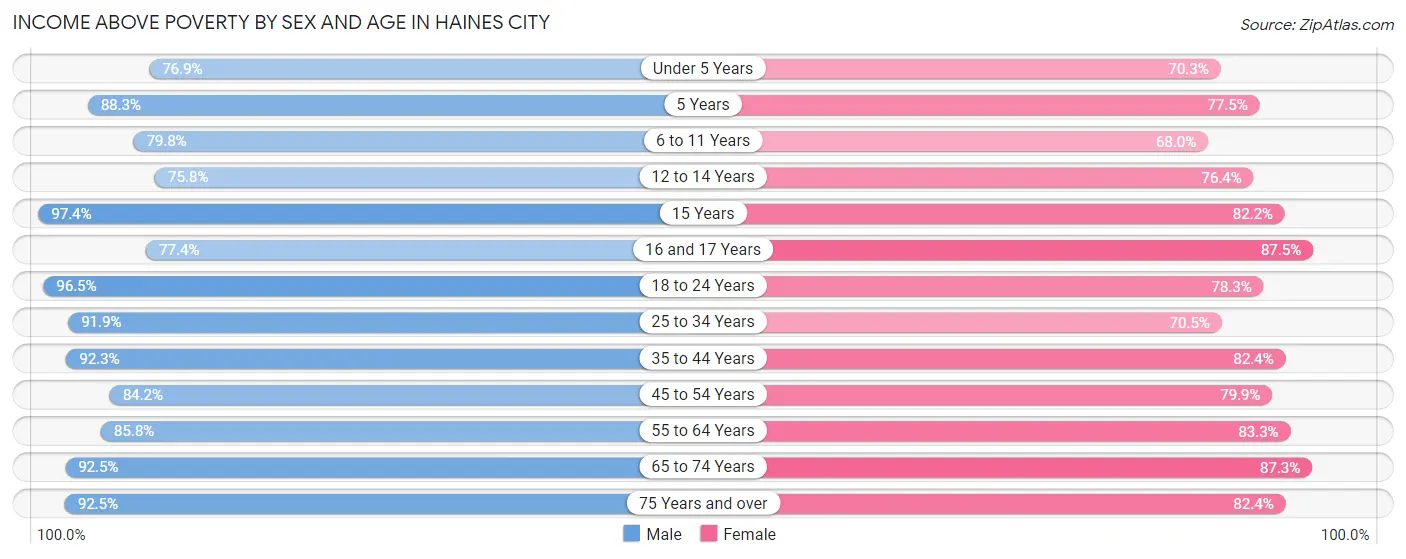
| Age Bracket | Male | Female |
| Under 5 Years | 728 (76.9%) | 613 (70.3%) |
| 5 Years | 113 (88.3%) | 221 (77.5%) |
| 6 to 11 Years | 1,058 (79.8%) | 786 (68.0%) |
| 12 to 14 Years | 394 (75.8%) | 762 (76.4%) |
| 15 Years | 266 (97.4%) | 88 (82.2%) |
| 16 and 17 Years | 223 (77.4%) | 223 (87.5%) |
| 18 to 24 Years | 1,077 (96.5%) | 909 (78.3%) |
| 25 to 34 Years | 2,111 (91.9%) | 1,329 (70.5%) |
| 35 to 44 Years | 2,156 (92.3%) | 1,858 (82.4%) |
| 45 to 54 Years | 1,135 (84.2%) | 1,400 (79.9%) |
| 55 to 64 Years | 1,345 (85.8%) | 1,419 (83.3%) |
| 65 to 74 Years | 1,006 (92.5%) | 762 (87.3%) |
| 75 Years and over | 706 (92.5%) | 1,024 (82.4%) |
| Total | 12,318 (88.0%) | 11,394 (78.3%) |
Income Below Poverty Among Married-Couple Families in Haines City
The poverty statistics for married-couple families in Haines City show that 4.1% or 179 of the total 4,418 families live below the poverty line. Families with 3 or 4 children have the highest poverty rate of 8.5%, comprising of 41 families. On the other hand, families with 5 or more children have the lowest poverty rate of 0.0%, which includes 0 families.
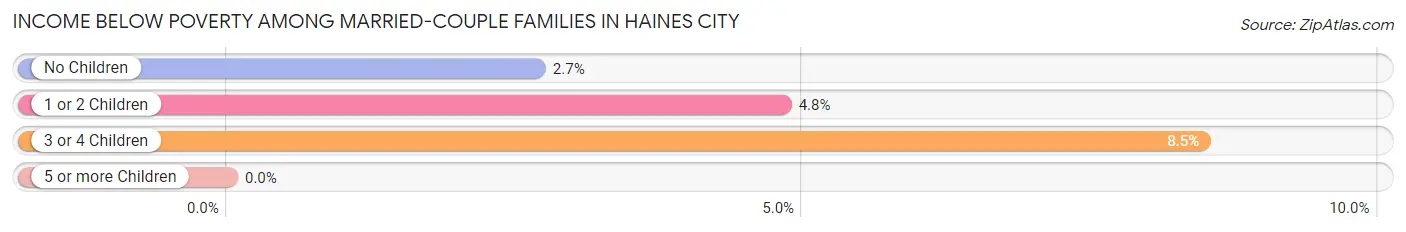
| Children | Above Poverty | Below Poverty |
| No Children | 2,290 (97.3%) | 63 (2.7%) |
| 1 or 2 Children | 1,480 (95.2%) | 75 (4.8%) |
| 3 or 4 Children | 443 (91.5%) | 41 (8.5%) |
| 5 or more Children | 26 (100.0%) | 0 (0.0%) |
| Total | 4,239 (96.0%) | 179 (4.1%) |
Income Below Poverty Among Single-Parent Households in Haines City
According to the poverty data in Haines City, 21.5% or 176 single-father households and 38.3% or 569 single-mother households are living below the poverty line. Among single-father households, those with 5 or more children have the highest poverty rate, with 23 households (100.0%) experiencing poverty. Likewise, among single-mother households, those with 5 or more children have the highest poverty rate, with 27 households (100.0%) falling below the poverty line.
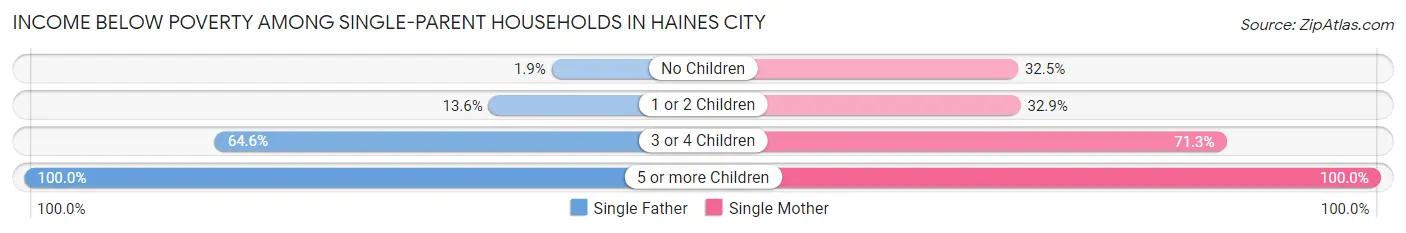
| Children | Single Father | Single Mother |
| No Children | 7 (1.8%) | 200 (32.5%) |
| 1 or 2 Children | 33 (13.6%) | 223 (32.9%) |
| 3 or 4 Children | 113 (64.6%) | 119 (71.3%) |
| 5 or more Children | 23 (100.0%) | 27 (100.0%) |
| Total | 176 (21.5%) | 569 (38.3%) |
Income Below Poverty Among Married-Couple vs Single-Parent Households in Haines City
The poverty data for Haines City shows that 179 of the married-couple family households (4.1%) and 745 of the single-parent households (32.3%) are living below the poverty level. Within the married-couple family households, those with 3 or 4 children have the highest poverty rate, with 41 households (8.5%) falling below the poverty line. Among the single-parent households, those with 5 or more children have the highest poverty rate, with 50 household (100.0%) living below poverty.
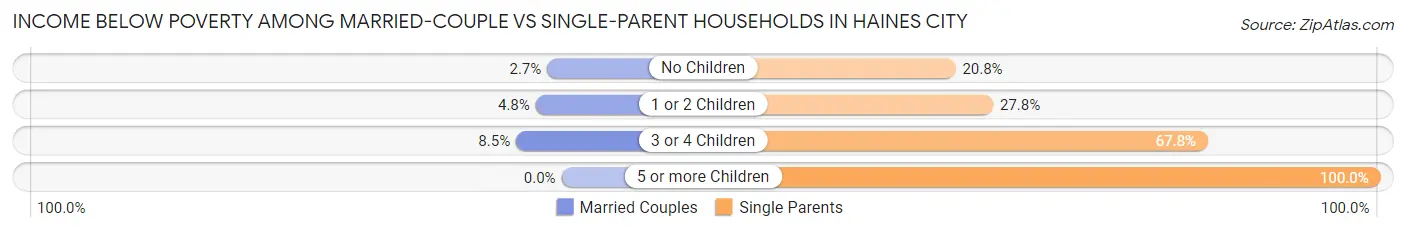
| Children | Married-Couple Families | Single-Parent Households |
| No Children | 63 (2.7%) | 207 (20.8%) |
| 1 or 2 Children | 75 (4.8%) | 256 (27.8%) |
| 3 or 4 Children | 41 (8.5%) | 232 (67.8%) |
| 5 or more Children | 0 (0.0%) | 50 (100.0%) |
| Total | 179 (4.1%) | 745 (32.3%) |
Race in Haines City
The most populous races in Haines City are Hispanic or Latino (13,438 | 46.5%), White / Caucasian (12,109 | 41.9%), and Black / African American (7,710 | 26.7%).
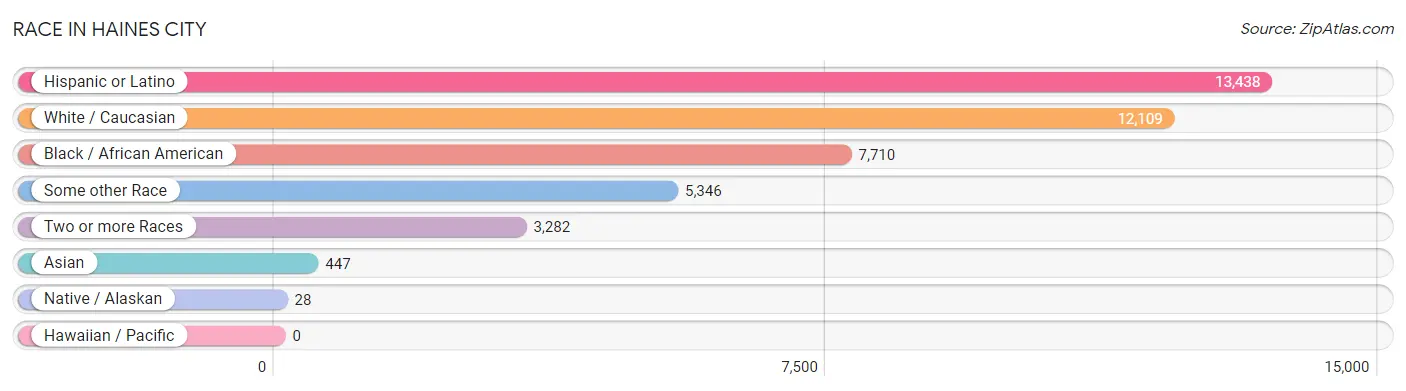
| Race | # Population | % Population |
| Asian | 447 | 1.5% |
| Black / African American | 7,710 | 26.7% |
| Hawaiian / Pacific | 0 | 0.0% |
| Hispanic or Latino | 13,438 | 46.5% |
| Native / Alaskan | 28 | 0.1% |
| White / Caucasian | 12,109 | 41.9% |
| Two or more Races | 3,282 | 11.4% |
| Some other Race | 5,346 | 18.5% |
| Total | 28,922 | 100.0% |
Ancestry in Haines City
The most populous ancestries reported in Haines City are Puerto Rican (5,629 | 19.5%), Mexican (4,840 | 16.7%), American (3,503 | 12.1%), Haitian (1,739 | 6.0%), and English (1,222 | 4.2%), together accounting for 58.5% of all Haines City residents.
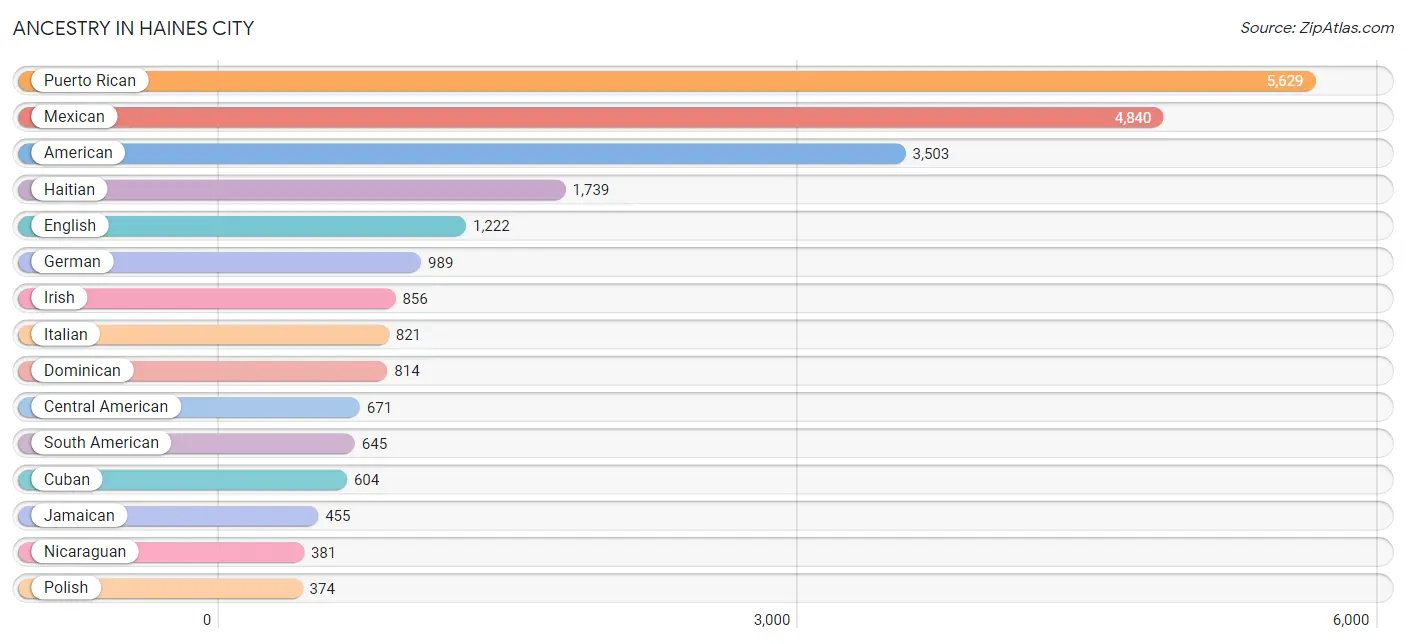
| Ancestry | # Population | % Population |
| African | 267 | 0.9% |
| American | 3,503 | 12.1% |
| Arab | 4 | 0.0% |
| Argentinean | 98 | 0.3% |
| Austrian | 19 | 0.1% |
| Belgian | 21 | 0.1% |
| Bhutanese | 33 | 0.1% |
| British | 21 | 0.1% |
| Burmese | 54 | 0.2% |
| Canadian | 45 | 0.2% |
| Cape Verdean | 39 | 0.1% |
| Central American | 671 | 2.3% |
| Central American Indian | 19 | 0.1% |
| Cherokee | 34 | 0.1% |
| Colombian | 248 | 0.9% |
| Costa Rican | 39 | 0.1% |
| Cuban | 604 | 2.1% |
| Czech | 12 | 0.0% |
| Czechoslovakian | 28 | 0.1% |
| Danish | 13 | 0.0% |
| Dominican | 814 | 2.8% |
| Dutch | 42 | 0.2% |
| Ecuadorian | 102 | 0.4% |
| English | 1,222 | 4.2% |
| European | 32 | 0.1% |
| Finnish | 18 | 0.1% |
| French | 290 | 1.0% |
| French Canadian | 27 | 0.1% |
| German | 989 | 3.4% |
| Greek | 40 | 0.1% |
| Guatemalan | 60 | 0.2% |
| Guyanese | 21 | 0.1% |
| Haitian | 1,739 | 6.0% |
| Honduran | 159 | 0.5% |
| Hungarian | 57 | 0.2% |
| Indian (Asian) | 105 | 0.4% |
| Irish | 856 | 3.0% |
| Italian | 821 | 2.8% |
| Jamaican | 455 | 1.6% |
| Korean | 173 | 0.6% |
| Lithuanian | 51 | 0.2% |
| Mexican | 4,840 | 16.7% |
| Moroccan | 4 | 0.0% |
| Nicaraguan | 381 | 1.3% |
| Norwegian | 15 | 0.1% |
| Peruvian | 86 | 0.3% |
| Polish | 374 | 1.3% |
| Puerto Rican | 5,629 | 19.5% |
| Romanian | 27 | 0.1% |
| Russian | 28 | 0.1% |
| Salvadoran | 32 | 0.1% |
| Scotch-Irish | 60 | 0.2% |
| Scottish | 260 | 0.9% |
| Sioux | 7 | 0.0% |
| Slovak | 26 | 0.1% |
| South American | 645 | 2.2% |
| South American Indian | 11 | 0.0% |
| Subsaharan African | 306 | 1.1% |
| Swedish | 50 | 0.2% |
| Swiss | 13 | 0.0% |
| Thai | 158 | 0.5% |
| U.S. Virgin Islander | 123 | 0.4% |
| Ukrainian | 73 | 0.3% |
| Venezuelan | 111 | 0.4% |
| Welsh | 42 | 0.2% |
| West Indian | 60 | 0.2% | View All 66 Rows |
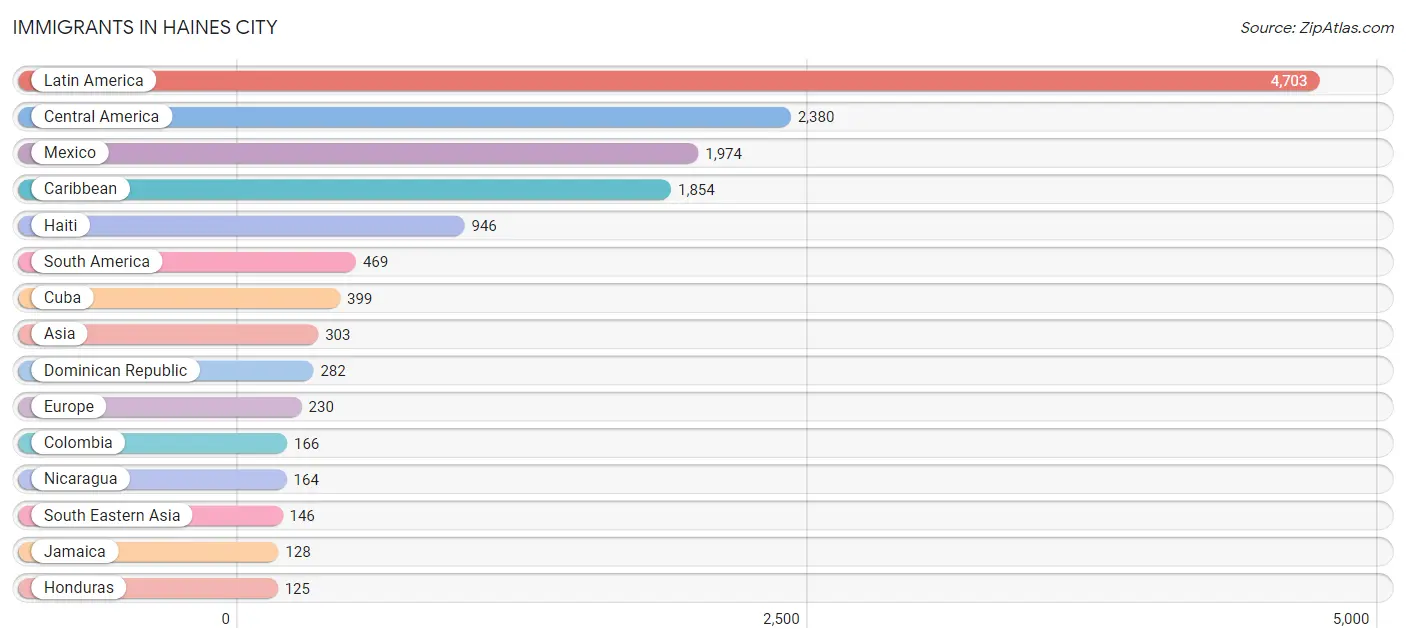
Immigrants in Haines City
The most numerous immigrant groups reported in Haines City came from Latin America (4,703 | 16.3%), Central America (2,380 | 8.2%), Mexico (1,974 | 6.8%), Caribbean (1,854 | 6.4%), and Haiti (946 | 3.3%), together accounting for 41.0% of all Haines City residents.
| Immigration Origin | # Population | % Population |
| Africa | 11 | 0.0% |
| Argentina | 116 | 0.4% |
| Asia | 303 | 1.1% |
| Barbados | 23 | 0.1% |
| Cabo Verde | 7 | 0.0% |
| Canada | 68 | 0.2% |
| Caribbean | 1,854 | 6.4% |
| Central America | 2,380 | 8.2% |
| China | 63 | 0.2% |
| Colombia | 166 | 0.6% |
| Costa Rica | 39 | 0.1% |
| Cuba | 399 | 1.4% |
| Dominica | 19 | 0.1% |
| Dominican Republic | 282 | 1.0% |
| Eastern Asia | 63 | 0.2% |
| Eastern Europe | 70 | 0.2% |
| Ecuador | 41 | 0.1% |
| El Salvador | 18 | 0.1% |
| England | 53 | 0.2% |
| Europe | 230 | 0.8% |
| France | 16 | 0.1% |
| Germany | 7 | 0.0% |
| Greece | 22 | 0.1% |
| Guatemala | 60 | 0.2% |
| Guyana | 29 | 0.1% |
| Haiti | 946 | 3.3% |
| Honduras | 125 | 0.4% |
| India | 57 | 0.2% |
| Indonesia | 24 | 0.1% |
| Italy | 26 | 0.1% |
| Jamaica | 128 | 0.4% |
| Kazakhstan | 17 | 0.1% |
| Latin America | 4,703 | 16.3% |
| Mexico | 1,974 | 6.8% |
| Morocco | 4 | 0.0% |
| Nicaragua | 164 | 0.6% |
| Northern Africa | 4 | 0.0% |
| Northern Europe | 89 | 0.3% |
| Peru | 15 | 0.1% |
| Philippines | 106 | 0.4% |
| Poland | 52 | 0.2% |
| Romania | 18 | 0.1% |
| Scotland | 13 | 0.0% |
| South America | 469 | 1.6% |
| South Central Asia | 74 | 0.3% |
| South Eastern Asia | 146 | 0.5% |
| Southern Europe | 48 | 0.2% |
| Venezuela | 102 | 0.4% |
| Western Africa | 7 | 0.0% |
| Western Asia | 20 | 0.1% |
| Western Europe | 23 | 0.1% | View All 51 Rows |
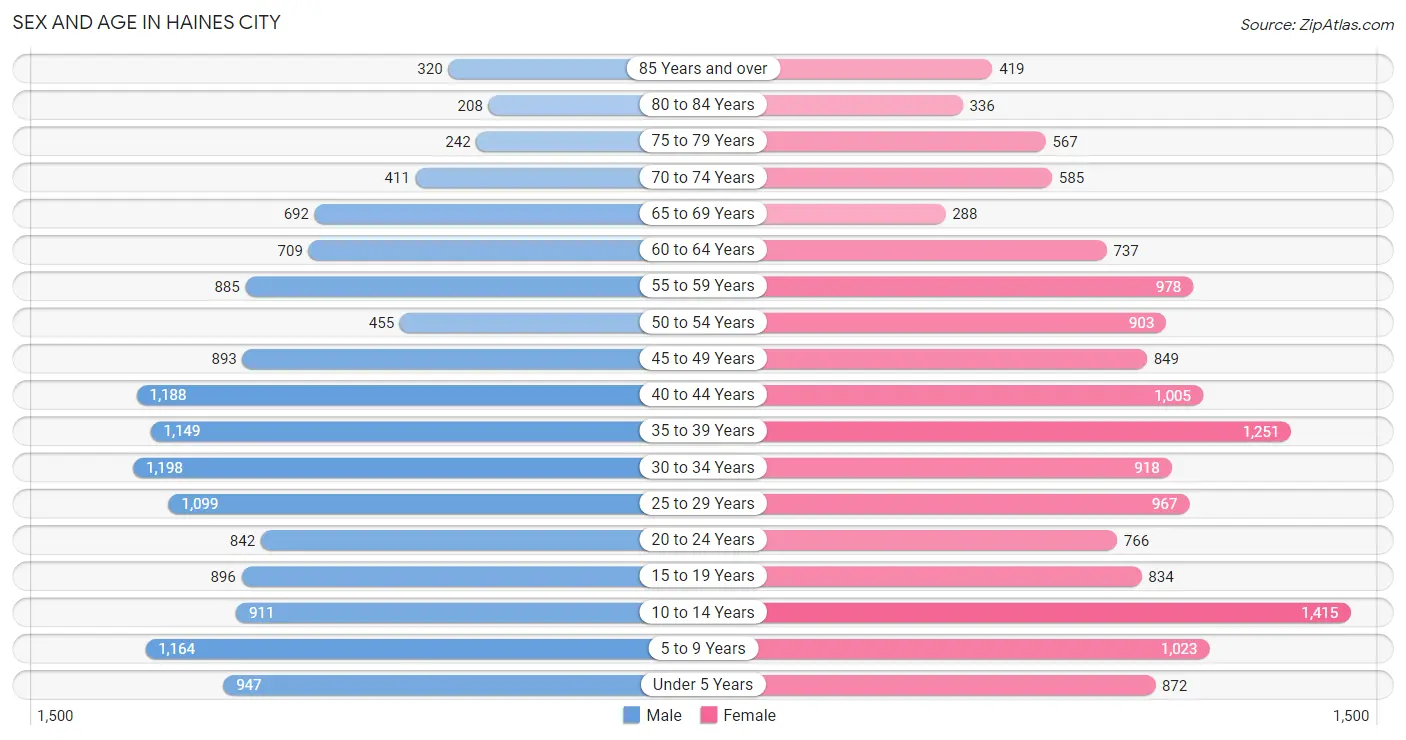
Sex and Age in Haines City
Sex and Age in Haines City
The most populous age groups in Haines City are 30 to 34 Years (1,198 | 8.4%) for men and 10 to 14 Years (1,415 | 9.6%) for women.
| Age Bracket | Male | Female |
| Under 5 Years | 947 (6.7%) | 872 (5.9%) |
| 5 to 9 Years | 1,164 (8.2%) | 1,023 (7.0%) |
| 10 to 14 Years | 911 (6.4%) | 1,415 (9.6%) |
| 15 to 19 Years | 896 (6.3%) | 834 (5.7%) |
| 20 to 24 Years | 842 (5.9%) | 766 (5.2%) |
| 25 to 29 Years | 1,099 (7.7%) | 967 (6.6%) |
| 30 to 34 Years | 1,198 (8.4%) | 918 (6.2%) |
| 35 to 39 Years | 1,149 (8.1%) | 1,251 (8.5%) |
| 40 to 44 Years | 1,188 (8.4%) | 1,005 (6.8%) |
| 45 to 49 Years | 893 (6.3%) | 849 (5.8%) |
| 50 to 54 Years | 455 (3.2%) | 903 (6.1%) |
| 55 to 59 Years | 885 (6.2%) | 978 (6.7%) |
| 60 to 64 Years | 709 (5.0%) | 737 (5.0%) |
| 65 to 69 Years | 692 (4.9%) | 288 (2.0%) |
| 70 to 74 Years | 411 (2.9%) | 585 (4.0%) |
| 75 to 79 Years | 242 (1.7%) | 567 (3.8%) |
| 80 to 84 Years | 208 (1.5%) | 336 (2.3%) |
| 85 Years and over | 320 (2.2%) | 419 (2.9%) |
| Total | 14,209 (100.0%) | 14,713 (100.0%) |
Families and Households in Haines City
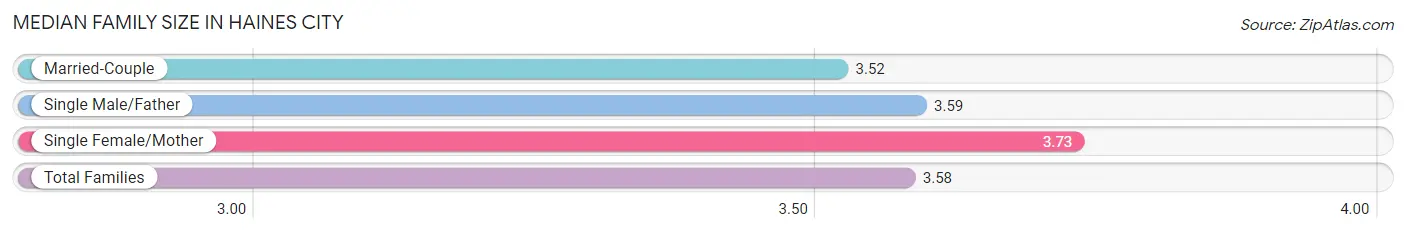
Median Family Size in Haines City
The median family size in Haines City is 3.58 persons per family, with single female/mother families (1,487 | 22.1%) accounting for the largest median family size of 3.73 persons per family. On the other hand, married-couple families (4,418 | 65.7%) represent the smallest median family size with 3.52 persons per family.
| Family Type | # Families | Family Size |
| Married-Couple | 4,418 (65.7%) | 3.52 |
| Single Male/Father | 819 (12.2%) | 3.59 |
| Single Female/Mother | 1,487 (22.1%) | 3.73 |
| Total Families | 6,724 (100.0%) | 3.58 |
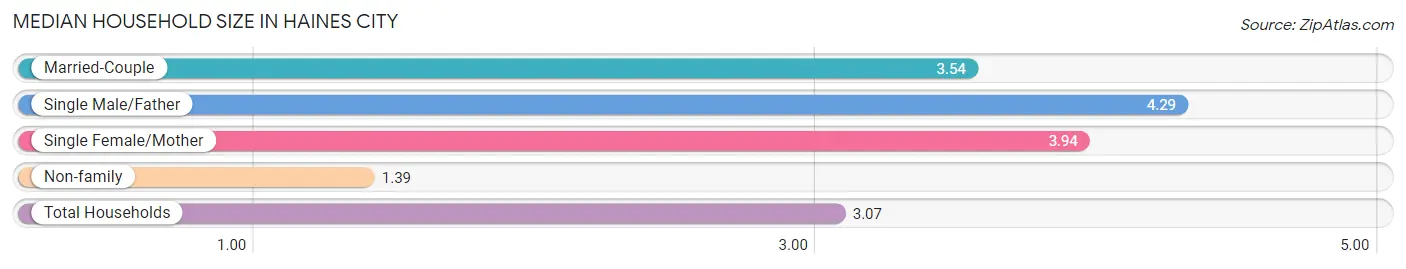
Median Household Size in Haines City
The median household size in Haines City is 3.07 persons per household, with single male/father households (819 | 8.8%) accounting for the largest median household size of 4.29 persons per household. non-family households (2,595 | 27.9%) represent the smallest median household size with 1.39 persons per household.
| Household Type | # Households | Household Size |
| Married-Couple | 4,418 (47.4%) | 3.54 |
| Single Male/Father | 819 (8.8%) | 4.29 |
| Single Female/Mother | 1,487 (16.0%) | 3.94 |
| Non-family | 2,595 (27.9%) | 1.39 |
| Total Households | 9,319 (100.0%) | 3.07 |
Household Size by Marriage Status in Haines City
Out of a total of 9,319 households in Haines City, 6,724 (72.2%) are family households, while 2,595 (27.9%) are nonfamily households. The most numerous type of family households are 2-person households, comprising 2,667, and the most common type of nonfamily households are 1-person households, comprising 2,109.
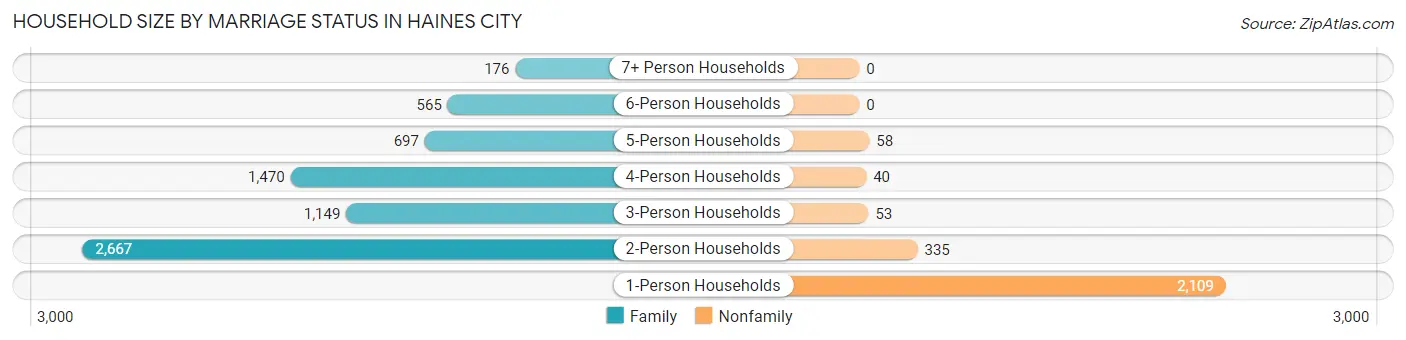
| Household Size | Family Households | Nonfamily Households |
| 1-Person Households | - | 2,109 (22.6%) |
| 2-Person Households | 2,667 (28.6%) | 335 (3.6%) |
| 3-Person Households | 1,149 (12.3%) | 53 (0.6%) |
| 4-Person Households | 1,470 (15.8%) | 40 (0.4%) |
| 5-Person Households | 697 (7.5%) | 58 (0.6%) |
| 6-Person Households | 565 (6.1%) | 0 (0.0%) |
| 7+ Person Households | 176 (1.9%) | 0 (0.0%) |
| Total | 6,724 (72.2%) | 2,595 (27.9%) |
Female Fertility in Haines City
Fertility by Age in Haines City
Average fertility rate in Haines City is 45.0 births per 1,000 women. Women in the age bracket of 20 to 34 years have the highest fertility rate with 54.0 births per 1,000 women. Women in the age bracket of 35 to 50 years acount for 49.5% of all women with births.
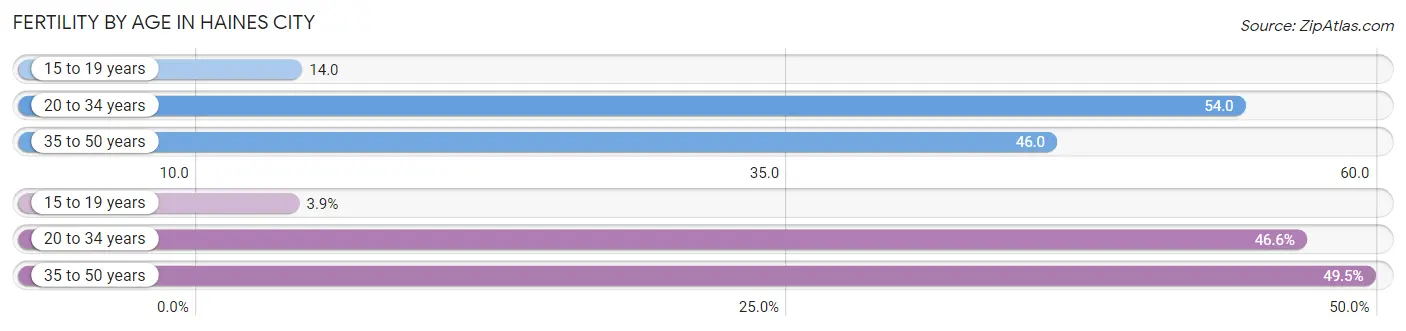
| Age Bracket | Women with Births | Births / 1,000 Women |
| 15 to 19 years | 12 (3.9%) | 14.0 |
| 20 to 34 years | 144 (46.6%) | 54.0 |
| 35 to 50 years | 153 (49.5%) | 46.0 |
| Total | 309 (100.0%) | 45.0 |
Fertility by Age by Marriage Status in Haines City
86.7% of women with births (309) in Haines City are married. The highest percentage of unmarried women with births falls into 15 to 19 years age bracket with 100.0% of them unmarried at the time of birth, while the lowest percentage of unmarried women with births belong to 20 to 34 years age bracket with 0.0% of them unmarried.
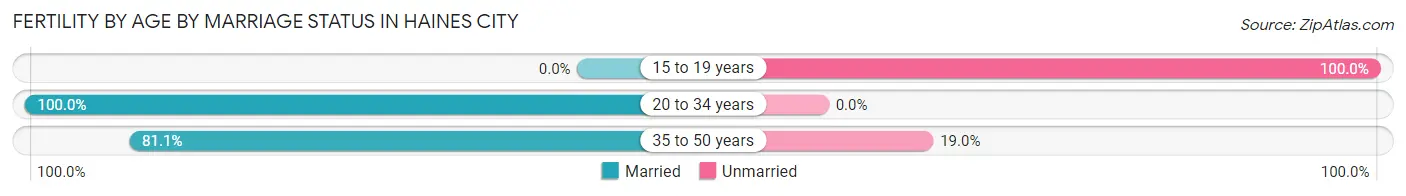
| Age Bracket | Married | Unmarried |
| 15 to 19 years | 0 (0.0%) | 12 (100.0%) |
| 20 to 34 years | 144 (100.0%) | 0 (0.0%) |
| 35 to 50 years | 124 (81.0%) | 29 (19.0%) |
| Total | 268 (86.7%) | 41 (13.3%) |
Fertility by Education in Haines City
Average fertility rate in Haines City is 45.0 births per 1,000 women. Women with the education attainment of bachelor's degree have the highest fertility rate of 91.0 births per 1,000 women, while women with the education attainment of less than high school have the lowest fertility at 9.0 births per 1,000 women. Women with the education attainment of high school diploma represent 41.7% of all women with births.
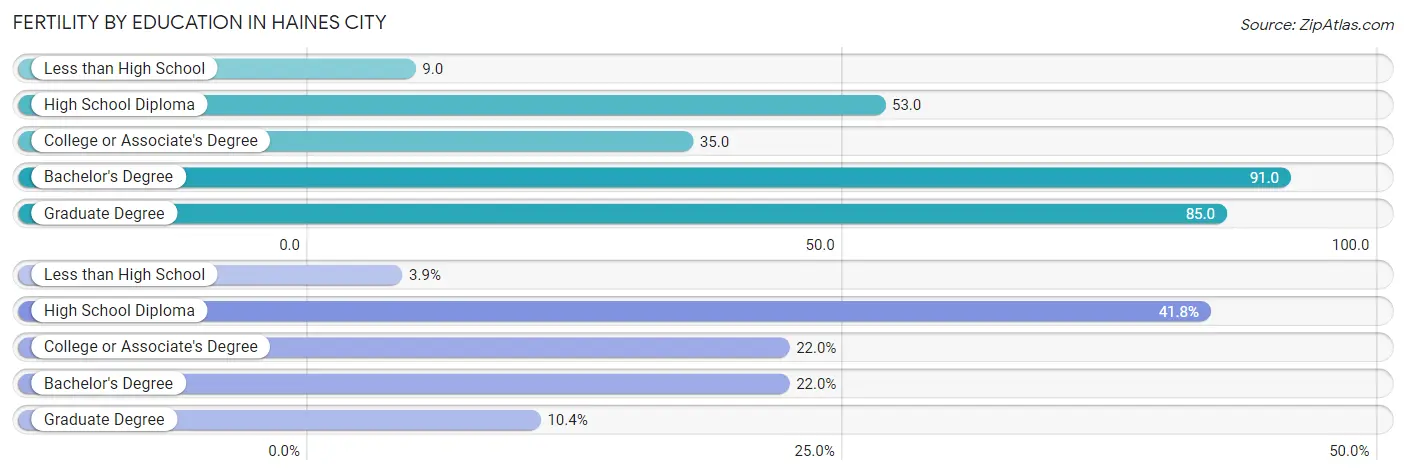
| Educational Attainment | Women with Births | Births / 1,000 Women |
| Less than High School | 12 (3.9%) | 9.0 |
| High School Diploma | 129 (41.7%) | 53.0 |
| College or Associate's Degree | 68 (22.0%) | 35.0 |
| Bachelor's Degree | 68 (22.0%) | 91.0 |
| Graduate Degree | 32 (10.4%) | 85.0 |
| Total | 309 (100.0%) | 45.0 |
Fertility by Education by Marriage Status in Haines City
13.3% of women with births in Haines City are unmarried. Women with the educational attainment of high school diploma are most likely to be married with 100.0% of them married at childbirth, while women with the educational attainment of less than high school are least likely to be married with 100.0% of them unmarried at childbirth.
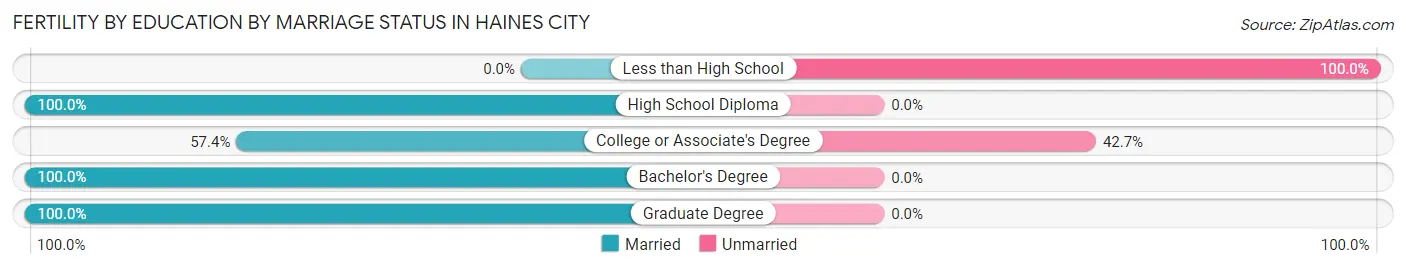
| Educational Attainment | Married | Unmarried |
| Less than High School | 0 (0.0%) | 12 (100.0%) |
| High School Diploma | 129 (100.0%) | 0 (0.0%) |
| College or Associate's Degree | 39 (57.4%) | 29 (42.6%) |
| Bachelor's Degree | 68 (100.0%) | 0 (0.0%) |
| Graduate Degree | 32 (100.0%) | 0 (0.0%) |
| Total | 268 (86.7%) | 41 (13.3%) |
Employment Characteristics in Haines City
Employment by Class of Employer in Haines City
Among the 12,254 employed individuals in Haines City, private company employees (10,049 | 82.0%), self-employed (incorporated) (602 | 4.9%), and not-for-profit organizations (439 | 3.6%) make up the most common classes of employment.
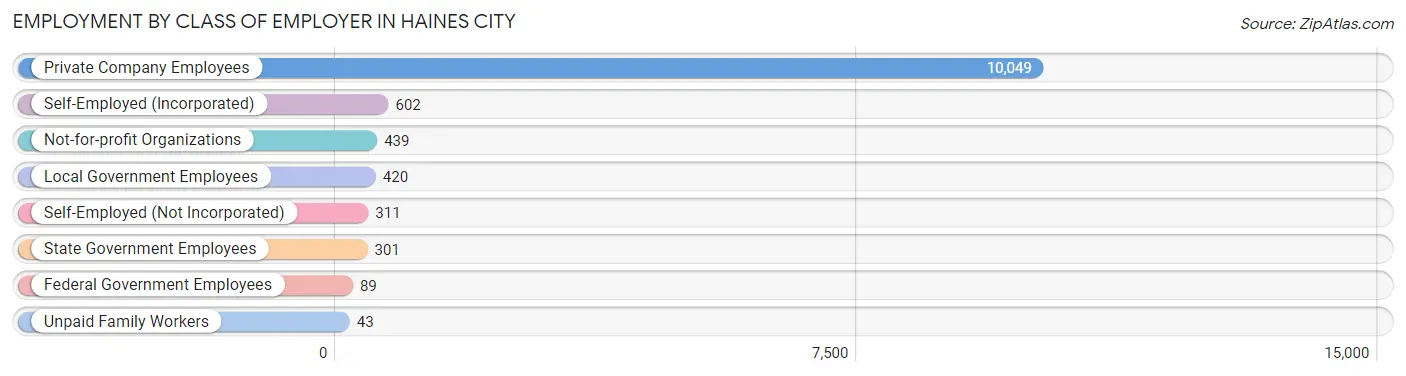
| Employer Class | # Employees | % Employees |
| Private Company Employees | 10,049 | 82.0% |
| Self-Employed (Incorporated) | 602 | 4.9% |
| Self-Employed (Not Incorporated) | 311 | 2.5% |
| Not-for-profit Organizations | 439 | 3.6% |
| Local Government Employees | 420 | 3.4% |
| State Government Employees | 301 | 2.5% |
| Federal Government Employees | 89 | 0.7% |
| Unpaid Family Workers | 43 | 0.4% |
| Total | 12,254 | 100.0% |
Employment Status by Age in Haines City
According to the labor force statistics for Haines City, out of the total population over 16 years of age (22,210), 58.5% or 12,993 individuals are in the labor force, with 4.8% or 624 of them unemployed. The age group with the highest labor force participation rate is 30 to 34 years, with 82.8% or 1,752 individuals in the labor force. Within the labor force, the 20 to 24 years age range has the highest percentage of unemployed individuals, with 18.3% or 195 of them being unemployed.
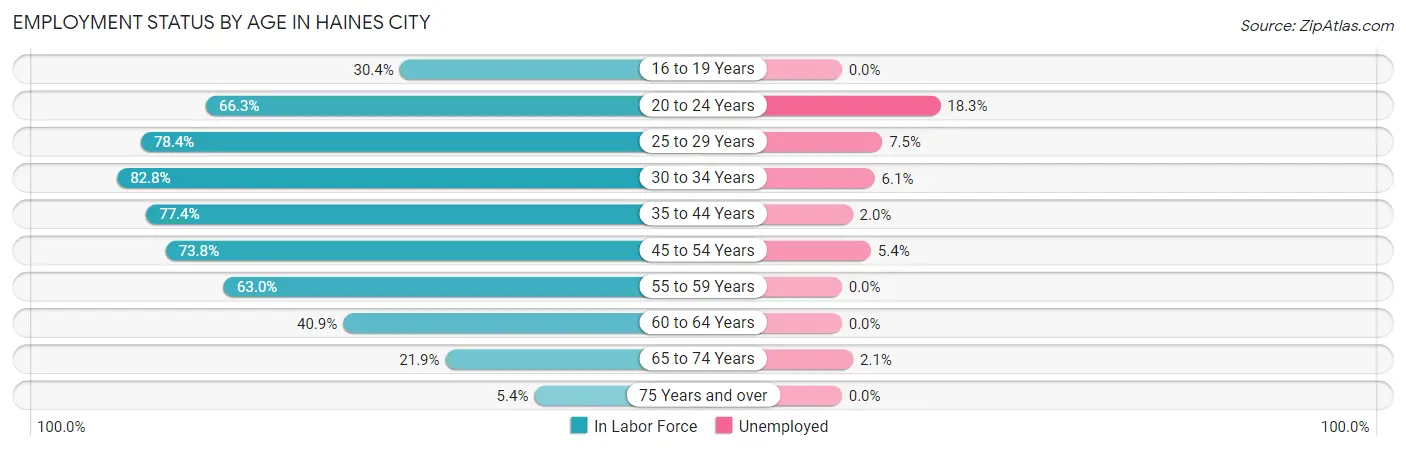
| Age Bracket | In Labor Force | Unemployed |
| 16 to 19 Years | 410 (30.4%) | 0 (0.0%) |
| 20 to 24 Years | 1,066 (66.3%) | 195 (18.3%) |
| 25 to 29 Years | 1,620 (78.4%) | 122 (7.5%) |
| 30 to 34 Years | 1,752 (82.8%) | 107 (6.1%) |
| 35 to 44 Years | 3,555 (77.4%) | 71 (2.0%) |
| 45 to 54 Years | 2,288 (73.8%) | 124 (5.4%) |
| 55 to 59 Years | 1,174 (63.0%) | 0 (0.0%) |
| 60 to 64 Years | 591 (40.9%) | 0 (0.0%) |
| 65 to 74 Years | 433 (21.9%) | 9 (2.1%) |
| 75 Years and over | 113 (5.4%) | 0 (0.0%) |
| Total | 12,993 (58.5%) | 624 (4.8%) |
Employment Status by Educational Attainment in Haines City
According to labor force statistics for Haines City, 72.3% of individuals (10,978) out of the total population between 25 and 64 years of age (15,184) are in the labor force, with 3.9% or 428 of them being unemployed. The group with the highest labor force participation rate are those with the educational attainment of college / associate degree, with 82.8% or 3,700 individuals in the labor force. Within the labor force, individuals with less than high school education have the highest percentage of unemployment, with 8.1% or 130 of them being unemployed.
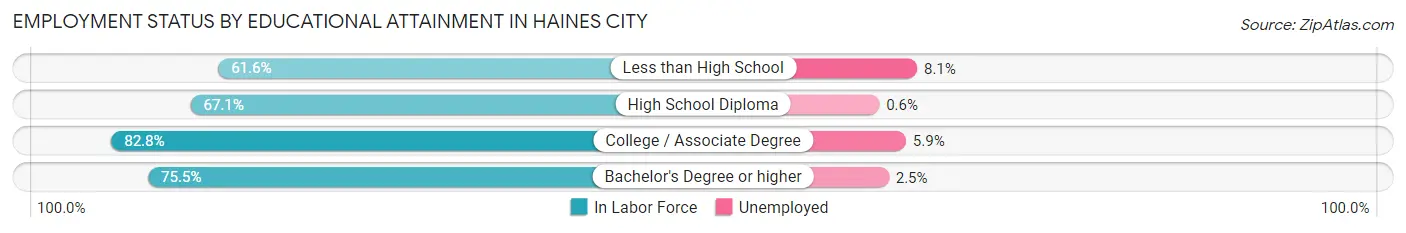
| Educational Attainment | In Labor Force | Unemployed |
| Less than High School | 1,599 (61.6%) | 210 (8.1%) |
| High School Diploma | 3,566 (67.1%) | 32 (0.6%) |
| College / Associate Degree | 3,700 (82.8%) | 264 (5.9%) |
| Bachelor's Degree or higher | 2,118 (75.5%) | 70 (2.5%) |
| Total | 10,978 (72.3%) | 592 (3.9%) |
Employment Occupations by Sex in Haines City
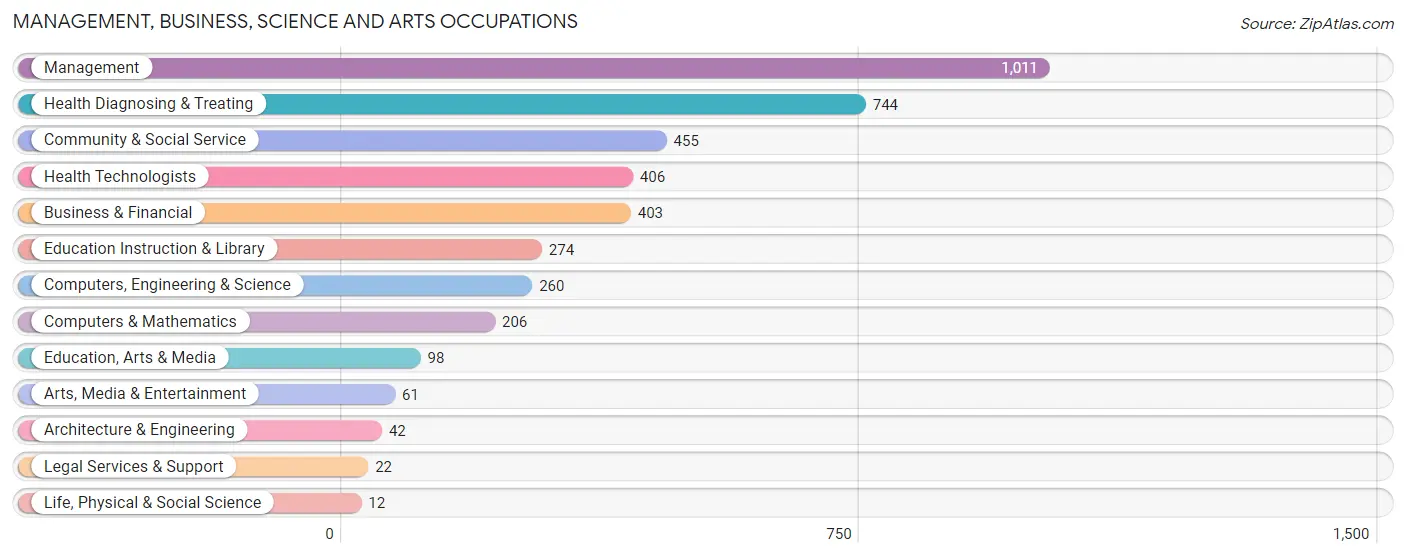
Management, Business, Science and Arts Occupations
The most common Management, Business, Science and Arts occupations in Haines City are Management (1,011 | 8.2%), Health Diagnosing & Treating (744 | 6.0%), Community & Social Service (455 | 3.7%), Health Technologists (406 | 3.3%), and Business & Financial (403 | 3.3%).
Management, Business, Science and Arts Occupations by Sex
Within the Management, Business, Science and Arts occupations in Haines City, the most male-oriented occupations are Computers, Engineering & Science (100.0%), Computers & Mathematics (100.0%), and Architecture & Engineering (100.0%), while the most female-oriented occupations are Legal Services & Support (100.0%), Education Instruction & Library (92.0%), and Community & Social Service (83.7%).
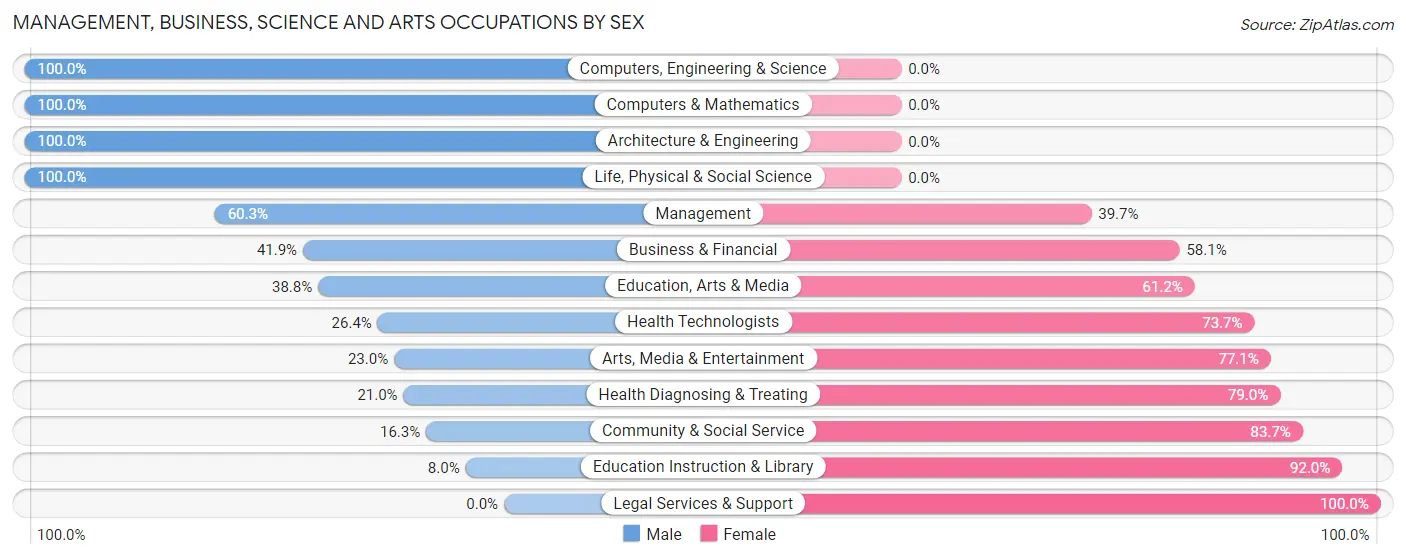
| Occupation | Male | Female |
| Management | 610 (60.3%) | 401 (39.7%) |
| Business & Financial | 169 (41.9%) | 234 (58.1%) |
| Computers, Engineering & Science | 260 (100.0%) | 0 (0.0%) |
| Computers & Mathematics | 206 (100.0%) | 0 (0.0%) |
| Architecture & Engineering | 42 (100.0%) | 0 (0.0%) |
| Life, Physical & Social Science | 12 (100.0%) | 0 (0.0%) |
| Community & Social Service | 74 (16.3%) | 381 (83.7%) |
| Education, Arts & Media | 38 (38.8%) | 60 (61.2%) |
| Legal Services & Support | 0 (0.0%) | 22 (100.0%) |
| Education Instruction & Library | 22 (8.0%) | 252 (92.0%) |
| Arts, Media & Entertainment | 14 (23.0%) | 47 (77.0%) |
| Health Diagnosing & Treating | 156 (21.0%) | 588 (79.0%) |
| Health Technologists | 107 (26.4%) | 299 (73.7%) |
| Total (Category) | 1,269 (44.2%) | 1,604 (55.8%) |
| Total (Overall) | 7,063 (57.1%) | 5,313 (42.9%) |
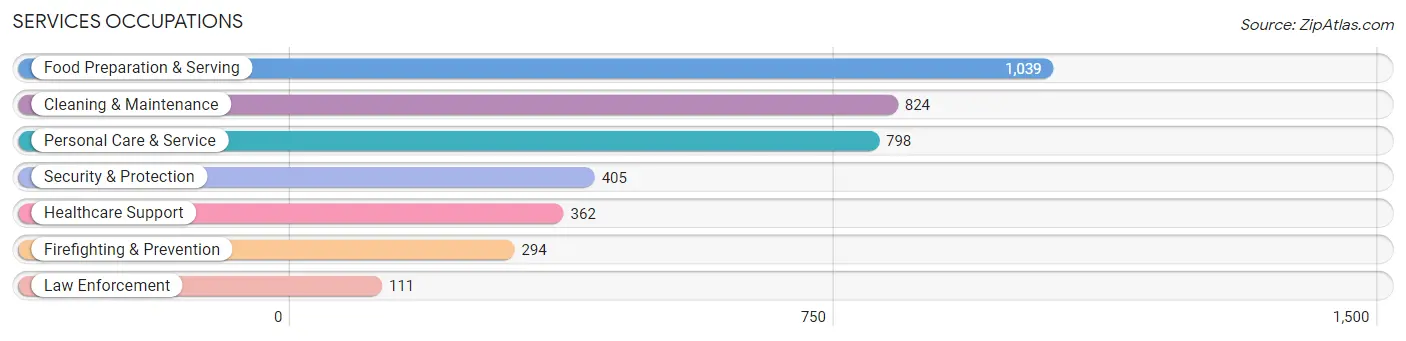
Services Occupations
The most common Services occupations in Haines City are Food Preparation & Serving (1,039 | 8.4%), Cleaning & Maintenance (824 | 6.7%), Personal Care & Service (798 | 6.5%), Security & Protection (405 | 3.3%), and Healthcare Support (362 | 2.9%).
Services Occupations by Sex
Within the Services occupations in Haines City, the most male-oriented occupations are Law Enforcement (100.0%), Security & Protection (97.3%), and Firefighting & Prevention (96.3%), while the most female-oriented occupations are Healthcare Support (90.6%), Food Preparation & Serving (62.9%), and Personal Care & Service (62.2%).
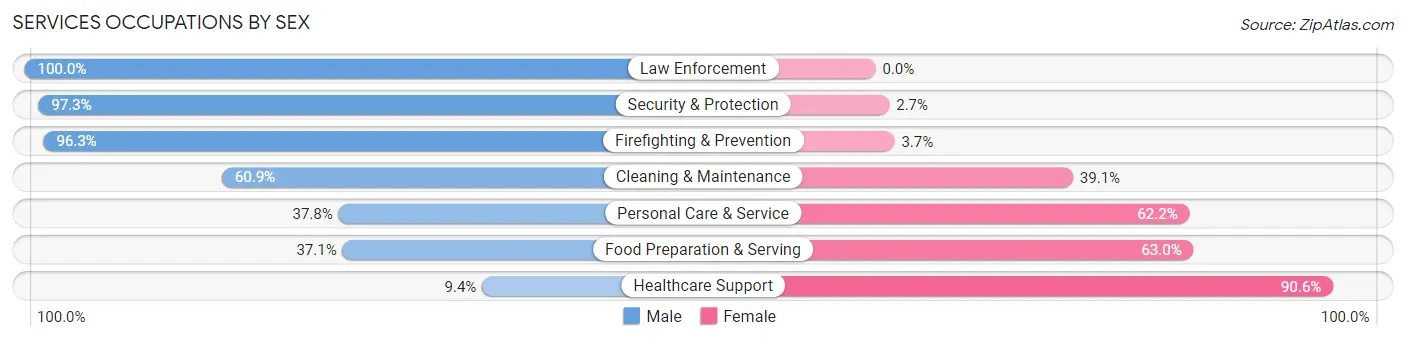
| Occupation | Male | Female |
| Healthcare Support | 34 (9.4%) | 328 (90.6%) |
| Security & Protection | 394 (97.3%) | 11 (2.7%) |
| Firefighting & Prevention | 283 (96.3%) | 11 (3.7%) |
| Law Enforcement | 111 (100.0%) | 0 (0.0%) |
| Food Preparation & Serving | 385 (37.0%) | 654 (62.9%) |
| Cleaning & Maintenance | 502 (60.9%) | 322 (39.1%) |
| Personal Care & Service | 302 (37.8%) | 496 (62.2%) |
| Total (Category) | 1,617 (47.2%) | 1,811 (52.8%) |
| Total (Overall) | 7,063 (57.1%) | 5,313 (42.9%) |
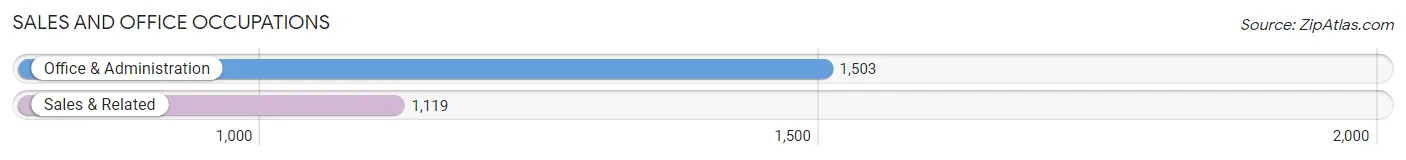
Sales and Office Occupations
The most common Sales and Office occupations in Haines City are Office & Administration (1,503 | 12.1%), and Sales & Related (1,119 | 9.0%).
Sales and Office Occupations by Sex
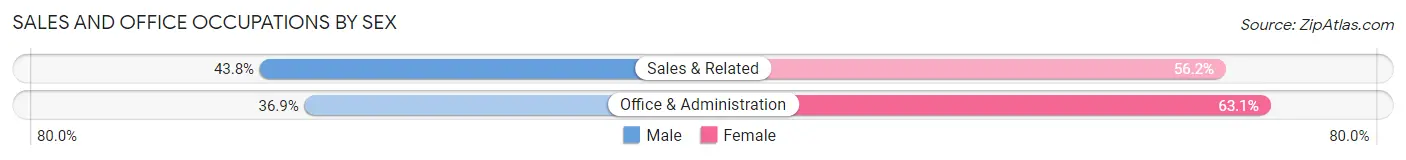
| Occupation | Male | Female |
| Sales & Related | 490 (43.8%) | 629 (56.2%) |
| Office & Administration | 555 (36.9%) | 948 (63.1%) |
| Total (Category) | 1,045 (39.9%) | 1,577 (60.1%) |
| Total (Overall) | 7,063 (57.1%) | 5,313 (42.9%) |
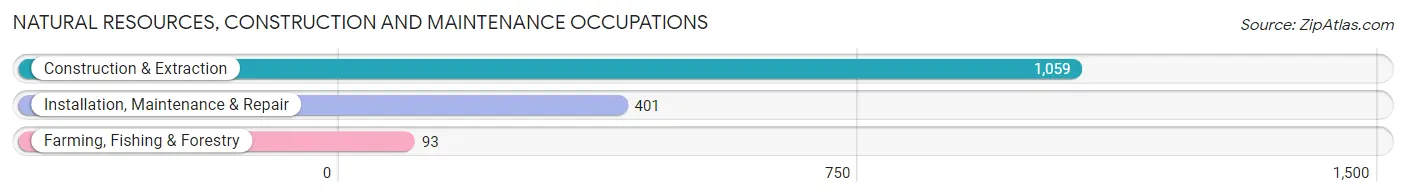
Natural Resources, Construction and Maintenance Occupations
The most common Natural Resources, Construction and Maintenance occupations in Haines City are Construction & Extraction (1,059 | 8.6%), Installation, Maintenance & Repair (401 | 3.2%), and Farming, Fishing & Forestry (93 | 0.7%).
Natural Resources, Construction and Maintenance Occupations by Sex
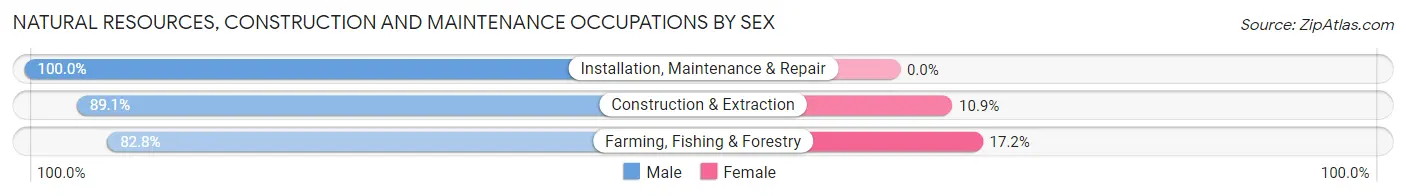
| Occupation | Male | Female |
| Farming, Fishing & Forestry | 77 (82.8%) | 16 (17.2%) |
| Construction & Extraction | 944 (89.1%) | 115 (10.9%) |
| Installation, Maintenance & Repair | 401 (100.0%) | 0 (0.0%) |
| Total (Category) | 1,422 (91.6%) | 131 (8.4%) |
| Total (Overall) | 7,063 (57.1%) | 5,313 (42.9%) |
Production, Transportation and Moving Occupations
The most common Production, Transportation and Moving occupations in Haines City are Material Moving (721 | 5.8%), Production (686 | 5.5%), and Transportation (493 | 4.0%).
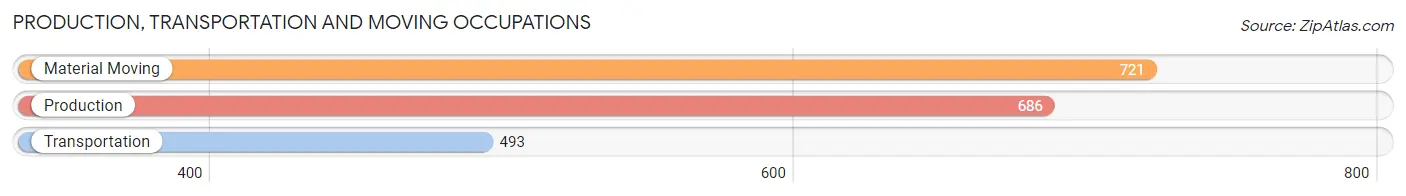
Production, Transportation and Moving Occupations by Sex
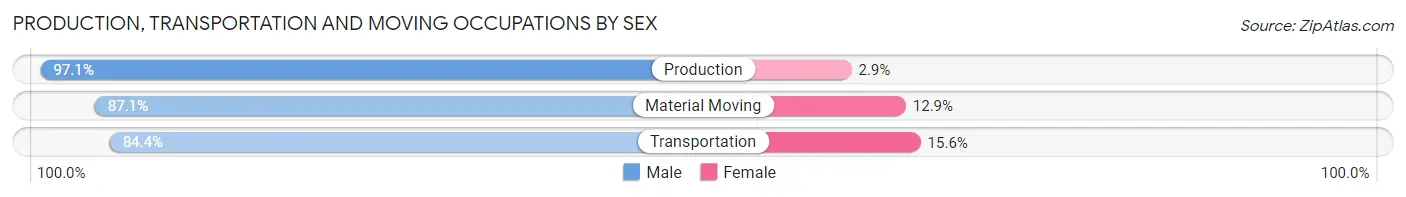
| Occupation | Male | Female |
| Production | 666 (97.1%) | 20 (2.9%) |
| Transportation | 416 (84.4%) | 77 (15.6%) |
| Material Moving | 628 (87.1%) | 93 (12.9%) |
| Total (Category) | 1,710 (90.0%) | 190 (10.0%) |
| Total (Overall) | 7,063 (57.1%) | 5,313 (42.9%) |
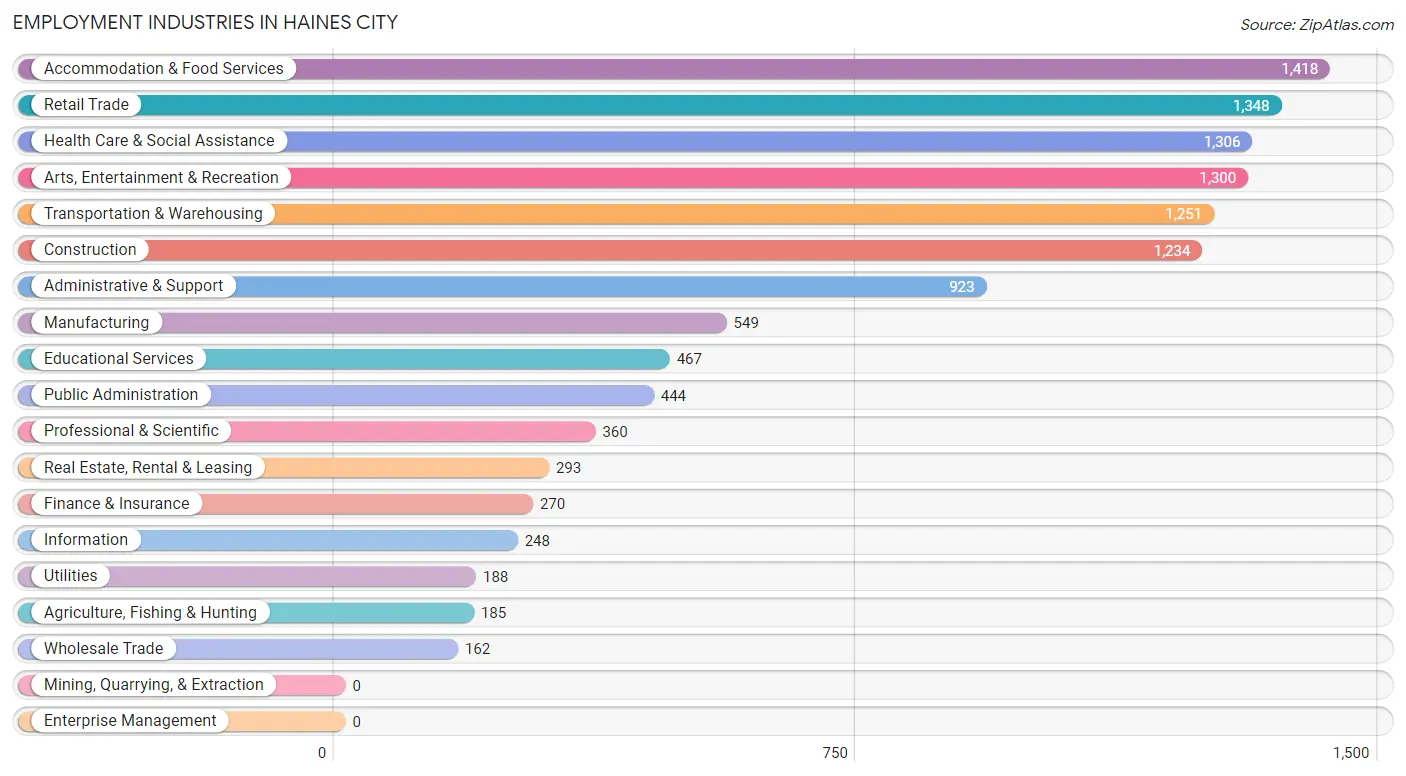
Employment Industries by Sex in Haines City
Employment Industries in Haines City
The major employment industries in Haines City include Accommodation & Food Services (1,418 | 11.5%), Retail Trade (1,348 | 10.9%), Health Care & Social Assistance (1,306 | 10.5%), Arts, Entertainment & Recreation (1,300 | 10.5%), and Transportation & Warehousing (1,251 | 10.1%).
Employment Industries by Sex in Haines City
The Haines City industries that see more men than women are Utilities (100.0%), Construction (88.5%), and Agriculture, Fishing & Hunting (87.0%), whereas the industries that tend to have a higher number of women are Health Care & Social Assistance (86.6%), Educational Services (77.9%), and Accommodation & Food Services (61.9%).
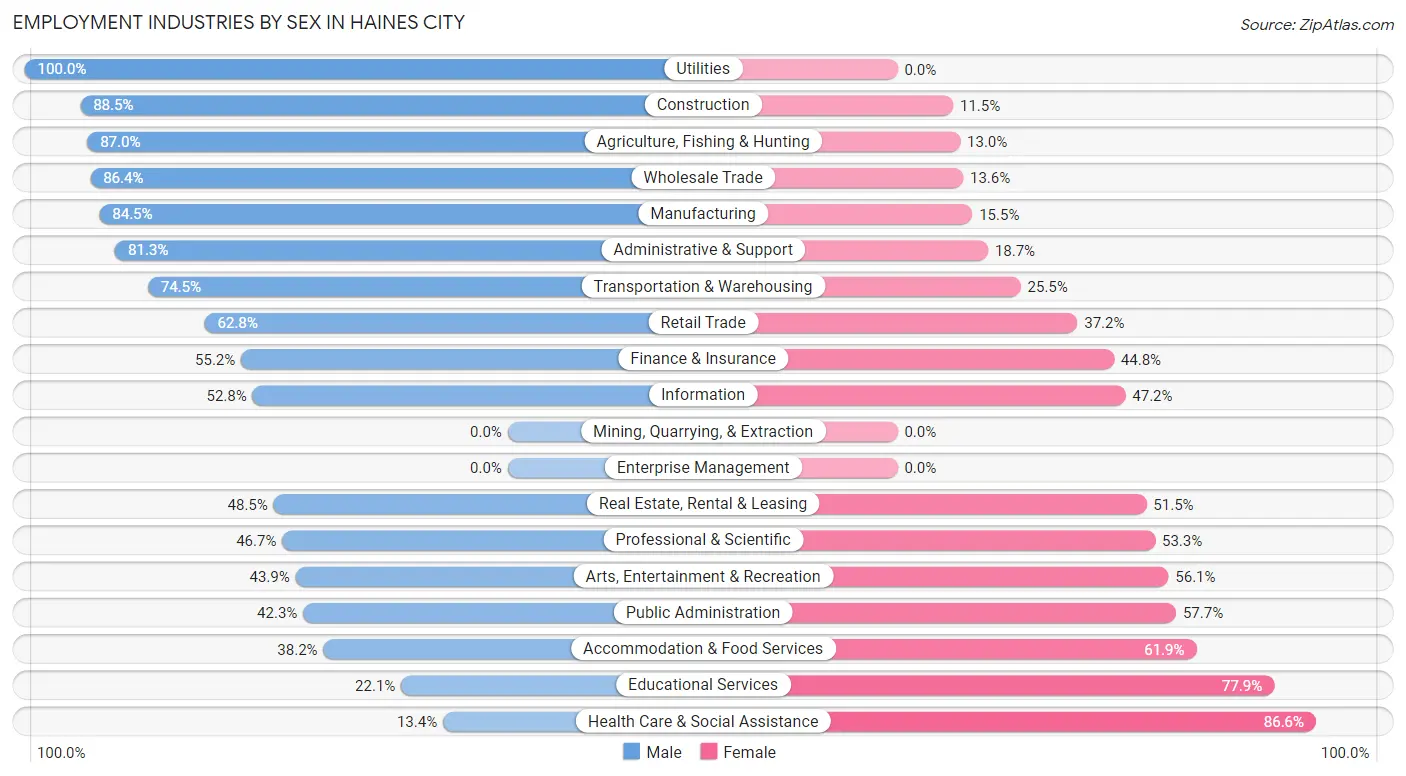
| Industry | Male | Female |
| Agriculture, Fishing & Hunting | 161 (87.0%) | 24 (13.0%) |
| Mining, Quarrying, & Extraction | 0 (0.0%) | 0 (0.0%) |
| Construction | 1,092 (88.5%) | 142 (11.5%) |
| Manufacturing | 464 (84.5%) | 85 (15.5%) |
| Wholesale Trade | 140 (86.4%) | 22 (13.6%) |
| Retail Trade | 846 (62.8%) | 502 (37.2%) |
| Transportation & Warehousing | 932 (74.5%) | 319 (25.5%) |
| Utilities | 188 (100.0%) | 0 (0.0%) |
| Information | 131 (52.8%) | 117 (47.2%) |
| Finance & Insurance | 149 (55.2%) | 121 (44.8%) |
| Real Estate, Rental & Leasing | 142 (48.5%) | 151 (51.5%) |
| Professional & Scientific | 168 (46.7%) | 192 (53.3%) |
| Enterprise Management | 0 (0.0%) | 0 (0.0%) |
| Administrative & Support | 750 (81.3%) | 173 (18.7%) |
| Educational Services | 103 (22.1%) | 364 (77.9%) |
| Health Care & Social Assistance | 175 (13.4%) | 1,131 (86.6%) |
| Arts, Entertainment & Recreation | 571 (43.9%) | 729 (56.1%) |
| Accommodation & Food Services | 541 (38.2%) | 877 (61.9%) |
| Public Administration | 188 (42.3%) | 256 (57.7%) |
| Total | 7,063 (57.1%) | 5,313 (42.9%) |
Education in Haines City
School Enrollment in Haines City
The most common levels of schooling among the 7,663 students in Haines City are middle school (1,853 | 24.2%), elementary school (1,793 | 23.4%), and high school (1,488 | 19.4%).
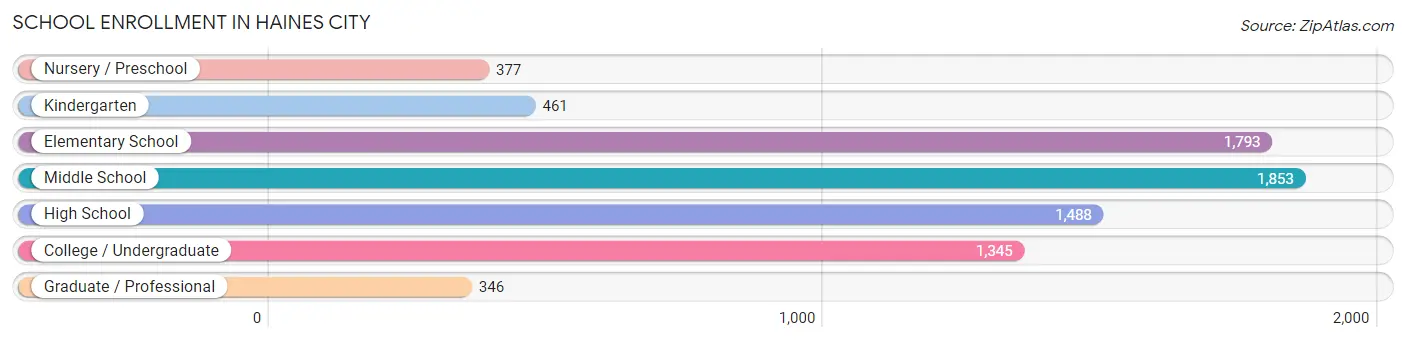
| School Level | # Students | % Students |
| Nursery / Preschool | 377 | 4.9% |
| Kindergarten | 461 | 6.0% |
| Elementary School | 1,793 | 23.4% |
| Middle School | 1,853 | 24.2% |
| High School | 1,488 | 19.4% |
| College / Undergraduate | 1,345 | 17.5% |
| Graduate / Professional | 346 | 4.5% |
| Total | 7,663 | 100.0% |
School Enrollment by Age by Funding Source in Haines City
Out of a total of 7,663 students who are enrolled in schools in Haines City, 828 (10.8%) attend a private institution, while the remaining 6,835 (89.2%) are enrolled in public schools. The age group of 25 to 34 year olds has the highest likelihood of being enrolled in private schools, with 93 (27.5% in the age bracket) enrolled. Conversely, the age group of 5 to 9 year old has the lowest likelihood of being enrolled in a private school, with 2,064 (97.0% in the age bracket) attending a public institution.
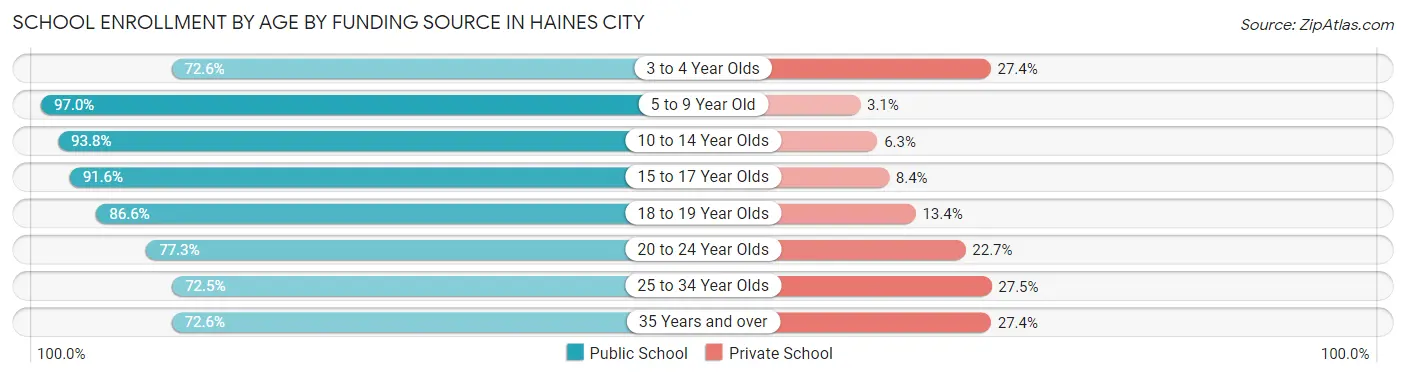
| Age Bracket | Public School | Private School |
| 3 to 4 Year Olds | 239 (72.6%) | 90 (27.4%) |
| 5 to 9 Year Old | 2,064 (97.0%) | 65 (3.0%) |
| 10 to 14 Year Olds | 2,161 (93.8%) | 144 (6.2%) |
| 15 to 17 Year Olds | 806 (91.6%) | 74 (8.4%) |
| 18 to 19 Year Olds | 479 (86.6%) | 74 (13.4%) |
| 20 to 24 Year Olds | 382 (77.3%) | 112 (22.7%) |
| 25 to 34 Year Olds | 245 (72.5%) | 93 (27.5%) |
| 35 Years and over | 461 (72.6%) | 174 (27.4%) |
| Total | 6,835 (89.2%) | 828 (10.8%) |
Educational Attainment by Field of Study in Haines City
Business (977 | 27.5%), education (562 | 15.8%), science & technology (528 | 14.9%), arts & humanities (396 | 11.2%), and computers & mathematics (193 | 5.4%) are the most common fields of study among 3,552 individuals in Haines City who have obtained a bachelor's degree or higher.
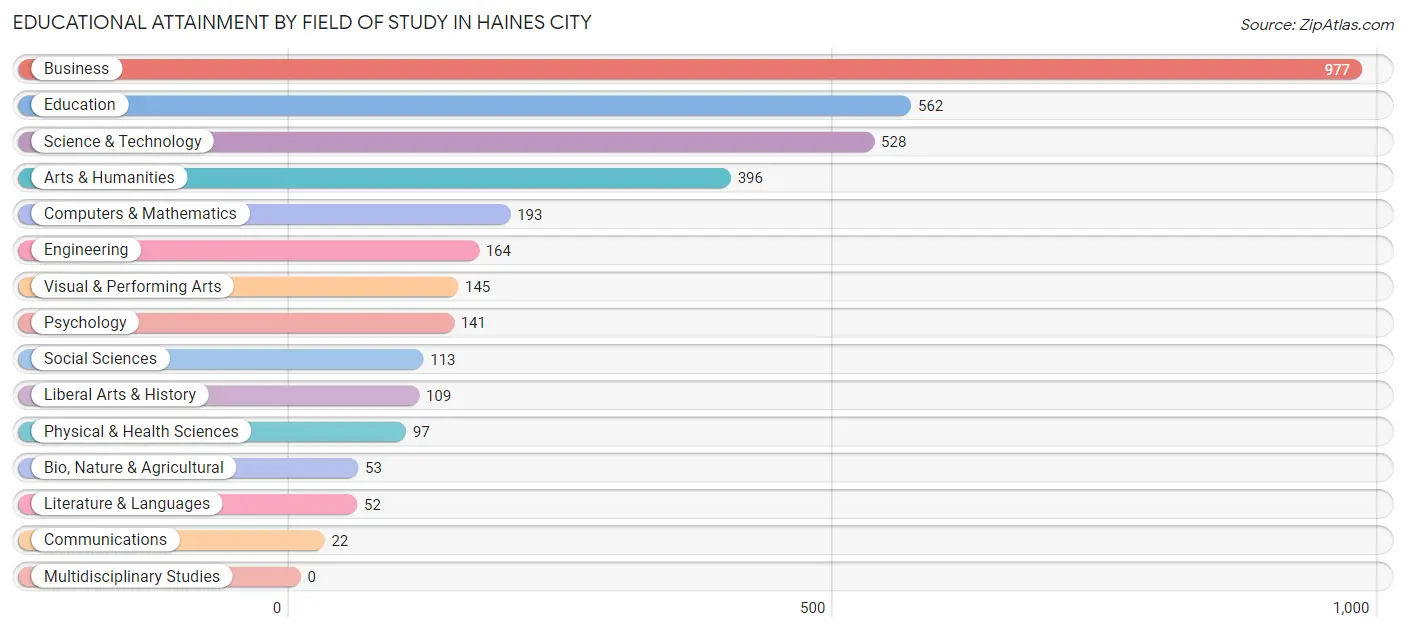
| Field of Study | # Graduates | % Graduates |
| Computers & Mathematics | 193 | 5.4% |
| Bio, Nature & Agricultural | 53 | 1.5% |
| Physical & Health Sciences | 97 | 2.7% |
| Psychology | 141 | 4.0% |
| Social Sciences | 113 | 3.2% |
| Engineering | 164 | 4.6% |
| Multidisciplinary Studies | 0 | 0.0% |
| Science & Technology | 528 | 14.9% |
| Business | 977 | 27.5% |
| Education | 562 | 15.8% |
| Literature & Languages | 52 | 1.5% |
| Liberal Arts & History | 109 | 3.1% |
| Visual & Performing Arts | 145 | 4.1% |
| Communications | 22 | 0.6% |
| Arts & Humanities | 396 | 11.2% |
| Total | 3,552 | 100.0% |
Transportation & Commute in Haines City
Vehicle Availability by Sex in Haines City
The most prevalent vehicle ownership categories in Haines City are males with 2 vehicles (3,186, accounting for 45.6%) and females with 2 vehicles (2,170, making up 61.1%).
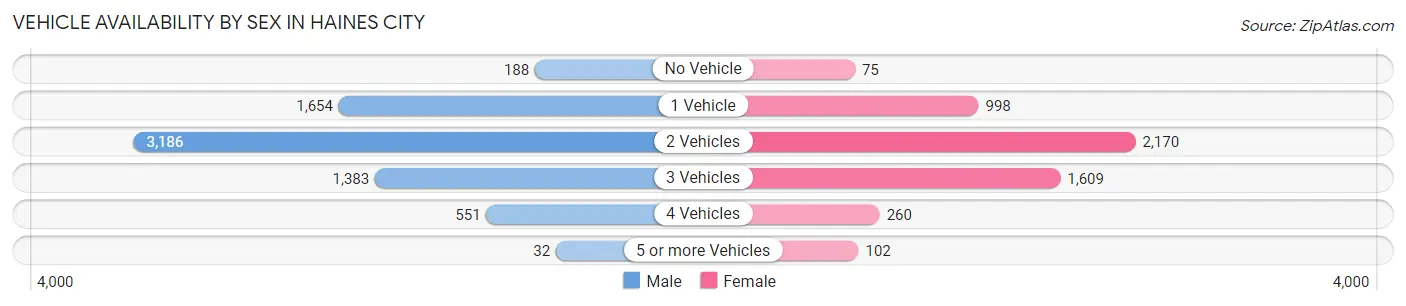
| Vehicles Available | Male | Female |
| No Vehicle | 188 (2.7%) | 75 (1.4%) |
| 1 Vehicle | 1,654 (23.6%) | 998 (19.1%) |
| 2 Vehicles | 3,186 (45.6%) | 2,170 (41.6%) |
| 3 Vehicles | 1,383 (19.8%) | 1,609 (30.9%) |
| 4 Vehicles | 551 (7.9%) | 260 (5.0%) |
| 5 or more Vehicles | 32 (0.5%) | 102 (2.0%) |
| Total | 6,994 (100.0%) | 5,214 (100.0%) |
Commute Time in Haines City
The most frequently occuring commute durations in Haines City are 45 to 59 minutes (3,337 commuters, 29.0%), 20 to 24 minutes (1,373 commuters, 11.9%), and 30 to 34 minutes (1,305 commuters, 11.3%).
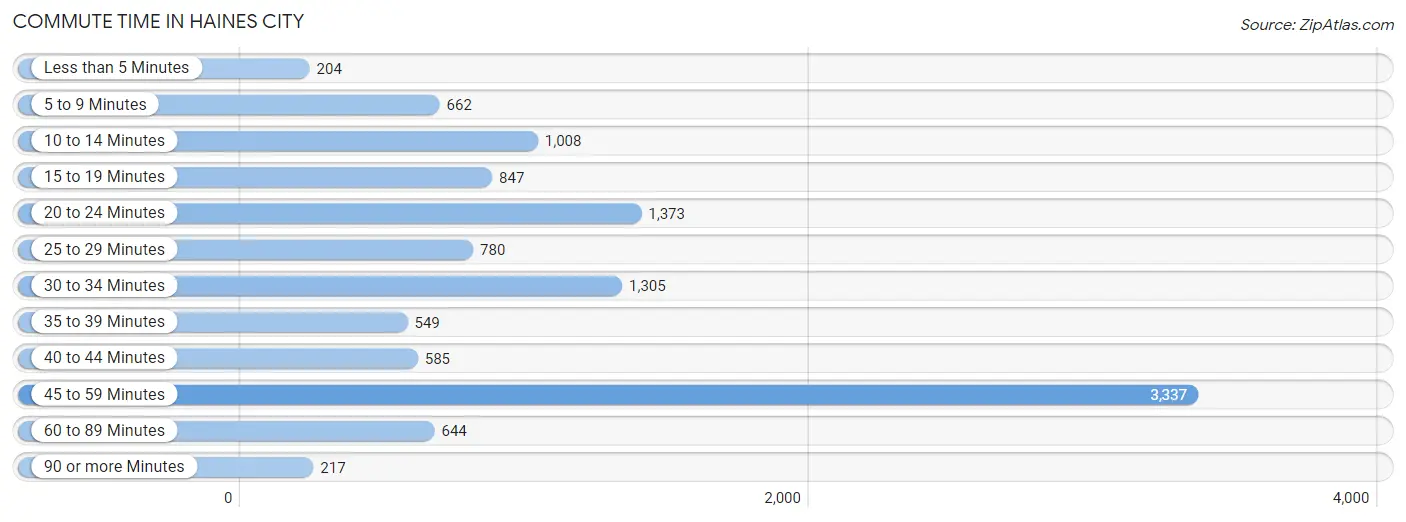
| Commute Time | # Commuters | % Commuters |
| Less than 5 Minutes | 204 | 1.8% |
| 5 to 9 Minutes | 662 | 5.8% |
| 10 to 14 Minutes | 1,008 | 8.8% |
| 15 to 19 Minutes | 847 | 7.4% |
| 20 to 24 Minutes | 1,373 | 11.9% |
| 25 to 29 Minutes | 780 | 6.8% |
| 30 to 34 Minutes | 1,305 | 11.3% |
| 35 to 39 Minutes | 549 | 4.8% |
| 40 to 44 Minutes | 585 | 5.1% |
| 45 to 59 Minutes | 3,337 | 29.0% |
| 60 to 89 Minutes | 644 | 5.6% |
| 90 or more Minutes | 217 | 1.9% |
Commute Time by Sex in Haines City
The most common commute times in Haines City are 45 to 59 minutes (1,720 commuters, 25.7%) for males and 45 to 59 minutes (1,617 commuters, 33.6%) for females.
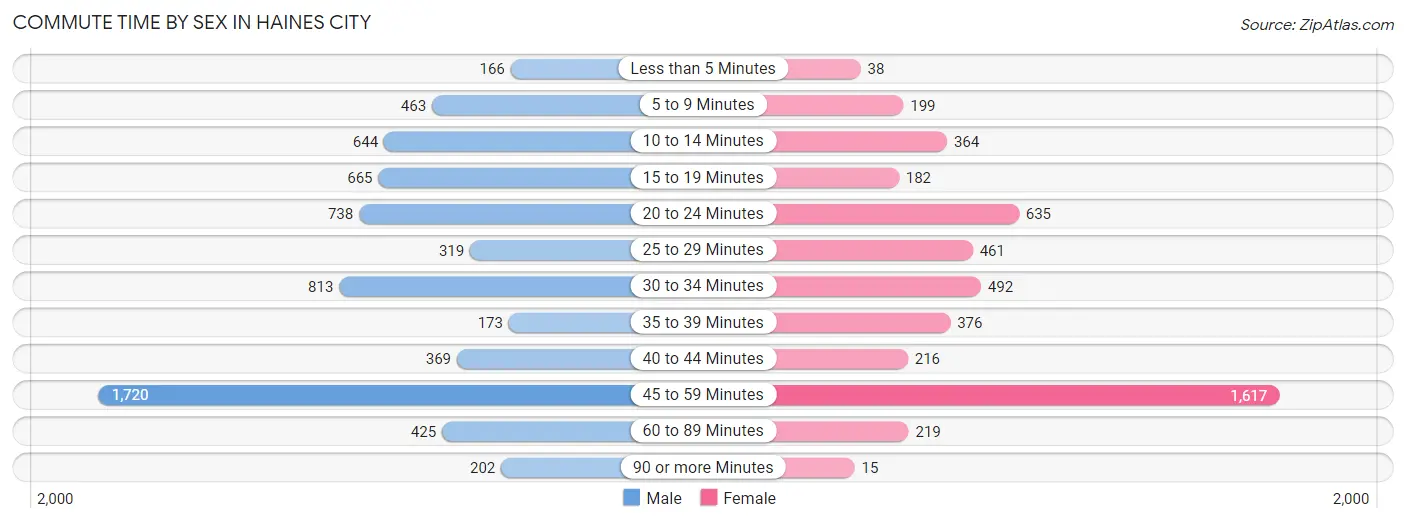
| Commute Time | Male | Female |
| Less than 5 Minutes | 166 (2.5%) | 38 (0.8%) |
| 5 to 9 Minutes | 463 (6.9%) | 199 (4.1%) |
| 10 to 14 Minutes | 644 (9.6%) | 364 (7.6%) |
| 15 to 19 Minutes | 665 (9.9%) | 182 (3.8%) |
| 20 to 24 Minutes | 738 (11.0%) | 635 (13.2%) |
| 25 to 29 Minutes | 319 (4.8%) | 461 (9.6%) |
| 30 to 34 Minutes | 813 (12.1%) | 492 (10.2%) |
| 35 to 39 Minutes | 173 (2.6%) | 376 (7.8%) |
| 40 to 44 Minutes | 369 (5.5%) | 216 (4.5%) |
| 45 to 59 Minutes | 1,720 (25.7%) | 1,617 (33.6%) |
| 60 to 89 Minutes | 425 (6.4%) | 219 (4.5%) |
| 90 or more Minutes | 202 (3.0%) | 15 (0.3%) |
Time of Departure to Work by Sex in Haines City
The most frequent times of departure to work in Haines City are 6:00 AM to 6:29 AM (1,157, 17.3%) for males and 6:00 AM to 6:29 AM (1,157, 24.0%) for females.
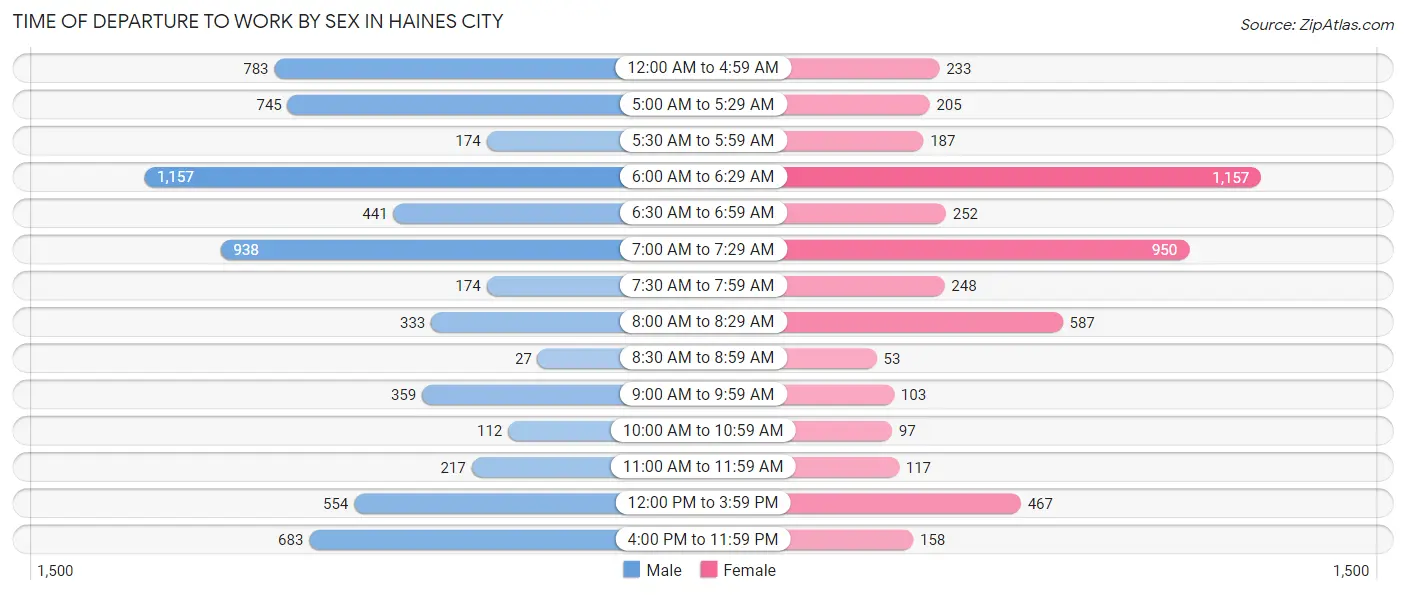
| Time of Departure | Male | Female |
| 12:00 AM to 4:59 AM | 783 (11.7%) | 233 (4.8%) |
| 5:00 AM to 5:29 AM | 745 (11.1%) | 205 (4.3%) |
| 5:30 AM to 5:59 AM | 174 (2.6%) | 187 (3.9%) |
| 6:00 AM to 6:29 AM | 1,157 (17.3%) | 1,157 (24.0%) |
| 6:30 AM to 6:59 AM | 441 (6.6%) | 252 (5.2%) |
| 7:00 AM to 7:29 AM | 938 (14.0%) | 950 (19.7%) |
| 7:30 AM to 7:59 AM | 174 (2.6%) | 248 (5.1%) |
| 8:00 AM to 8:29 AM | 333 (5.0%) | 587 (12.2%) |
| 8:30 AM to 8:59 AM | 27 (0.4%) | 53 (1.1%) |
| 9:00 AM to 9:59 AM | 359 (5.4%) | 103 (2.1%) |
| 10:00 AM to 10:59 AM | 112 (1.7%) | 97 (2.0%) |
| 11:00 AM to 11:59 AM | 217 (3.2%) | 117 (2.4%) |
| 12:00 PM to 3:59 PM | 554 (8.3%) | 467 (9.7%) |
| 4:00 PM to 11:59 PM | 683 (10.2%) | 158 (3.3%) |
| Total | 6,697 (100.0%) | 4,814 (100.0%) |
Housing Occupancy in Haines City
Occupancy by Ownership in Haines City
Of the total 9,319 dwellings in Haines City, owner-occupied units account for 6,367 (68.3%), while renter-occupied units make up 2,952 (31.7%).
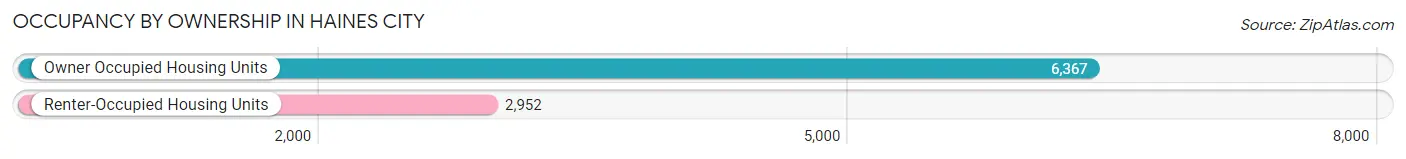
| Occupancy | # Housing Units | % Housing Units |
| Owner Occupied Housing Units | 6,367 | 68.3% |
| Renter-Occupied Housing Units | 2,952 | 31.7% |
| Total Occupied Housing Units | 9,319 | 100.0% |
Occupancy by Household Size in Haines City
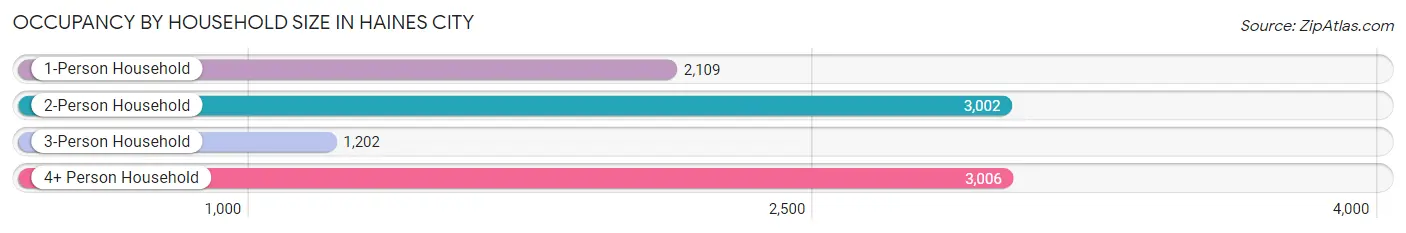
| Household Size | # Housing Units | % Housing Units |
| 1-Person Household | 2,109 | 22.6% |
| 2-Person Household | 3,002 | 32.2% |
| 3-Person Household | 1,202 | 12.9% |
| 4+ Person Household | 3,006 | 32.3% |
| Total Housing Units | 9,319 | 100.0% |
Occupancy by Ownership by Household Size in Haines City
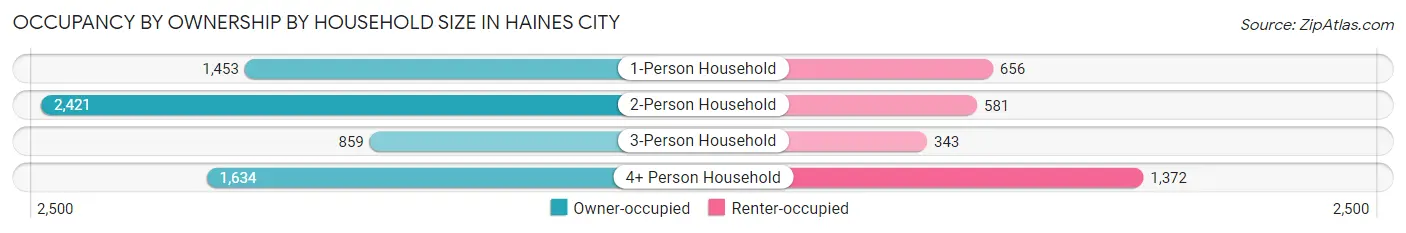
| Household Size | Owner-occupied | Renter-occupied |
| 1-Person Household | 1,453 (68.9%) | 656 (31.1%) |
| 2-Person Household | 2,421 (80.6%) | 581 (19.4%) |
| 3-Person Household | 859 (71.5%) | 343 (28.5%) |
| 4+ Person Household | 1,634 (54.4%) | 1,372 (45.6%) |
| Total Housing Units | 6,367 (68.3%) | 2,952 (31.7%) |
Occupancy by Educational Attainment in Haines City
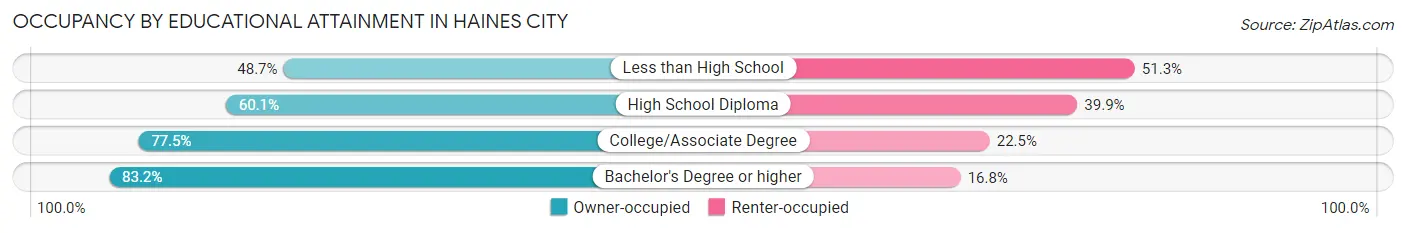
| Household Size | Owner-occupied | Renter-occupied |
| Less than High School | 618 (48.7%) | 651 (51.3%) |
| High School Diploma | 2,088 (60.1%) | 1,386 (39.9%) |
| College/Associate Degree | 1,987 (77.5%) | 578 (22.5%) |
| Bachelor's Degree or higher | 1,674 (83.2%) | 337 (16.8%) |
Occupancy by Age of Householder in Haines City
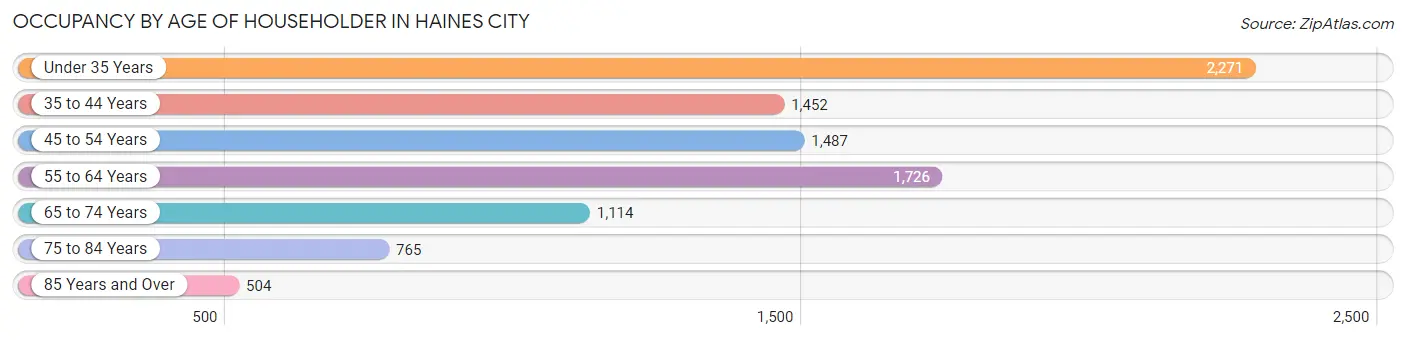
| Age Bracket | # Households | % Households |
| Under 35 Years | 2,271 | 24.4% |
| 35 to 44 Years | 1,452 | 15.6% |
| 45 to 54 Years | 1,487 | 16.0% |
| 55 to 64 Years | 1,726 | 18.5% |
| 65 to 74 Years | 1,114 | 11.9% |
| 75 to 84 Years | 765 | 8.2% |
| 85 Years and Over | 504 | 5.4% |
| Total | 9,319 | 100.0% |
Housing Finances in Haines City
Median Income by Occupancy in Haines City
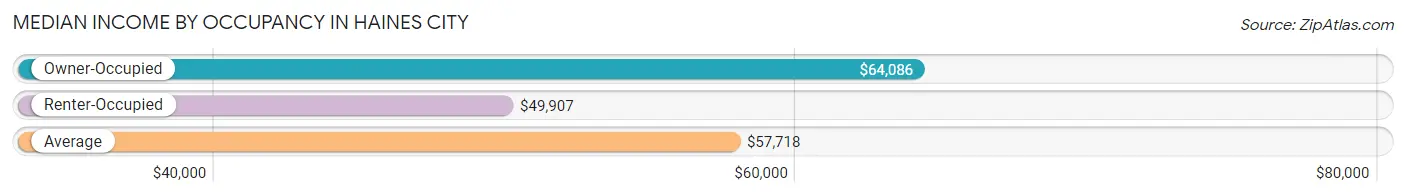
| Occupancy Type | # Households | Median Income |
| Owner-Occupied | 6,367 (68.3%) | $64,086 |
| Renter-Occupied | 2,952 (31.7%) | $49,907 |
| Average | 9,319 (100.0%) | $57,718 |
Occupancy by Householder Income Bracket in Haines City
| Income Bracket | Owner-occupied | Renter-occupied |
| Less than $5,000 | 157 (2.5%) | 292 (9.9%) |
| $5,000 to $9,999 | 145 (2.3%) | 11 (0.4%) |
| $10,000 to $14,999 | 157 (2.5%) | 96 (3.3%) |
| $15,000 to $19,999 | 39 (0.6%) | 164 (5.6%) |
| $20,000 to $24,999 | 190 (3.0%) | 164 (5.6%) |
| $25,000 to $34,999 | 969 (15.2%) | 230 (7.8%) |
| $35,000 to $49,999 | 845 (13.3%) | 521 (17.6%) |
| $50,000 to $74,999 | 1,406 (22.1%) | 634 (21.5%) |
| $75,000 to $99,999 | 816 (12.8%) | 635 (21.5%) |
| $100,000 to $149,999 | 720 (11.3%) | 131 (4.4%) |
| $150,000 or more | 923 (14.5%) | 74 (2.5%) |
| Total | 6,367 (100.0%) | 2,952 (100.0%) |
Monthly Housing Cost Tiers in Haines City
| Monthly Cost | Owner-occupied | Renter-occupied |
| Less than $300 | 257 (4.0%) | 15 (0.5%) |
| $300 to $499 | 488 (7.7%) | 194 (6.6%) |
| $500 to $799 | 1,266 (19.9%) | 452 (15.3%) |
| $800 to $999 | 816 (12.8%) | 212 (7.2%) |
| $1,000 to $1,499 | 1,483 (23.3%) | 1,350 (45.7%) |
| $1,500 to $1,999 | 1,161 (18.2%) | 431 (14.6%) |
| $2,000 to $2,499 | 529 (8.3%) | 247 (8.4%) |
| $2,500 to $2,999 | 211 (3.3%) | 19 (0.6%) |
| $3,000 or more | 156 (2.5%) | 0 (0.0%) |
| Total | 6,367 (100.0%) | 2,952 (100.0%) |
Physical Housing Characteristics in Haines City
Housing Structures in Haines City
| Structure Type | # Housing Units | % Housing Units |
| Single Unit, Detached | 6,766 | 72.6% |
| Single Unit, Attached | 138 | 1.5% |
| 2 Unit Apartments | 488 | 5.2% |
| 3 or 4 Unit Apartments | 278 | 3.0% |
| 5 to 9 Unit Apartments | 196 | 2.1% |
| 10 or more Apartments | 166 | 1.8% |
| Mobile Home / Other | 1,287 | 13.8% |
| Total | 9,319 | 100.0% |
Housing Structures by Occupancy in Haines City
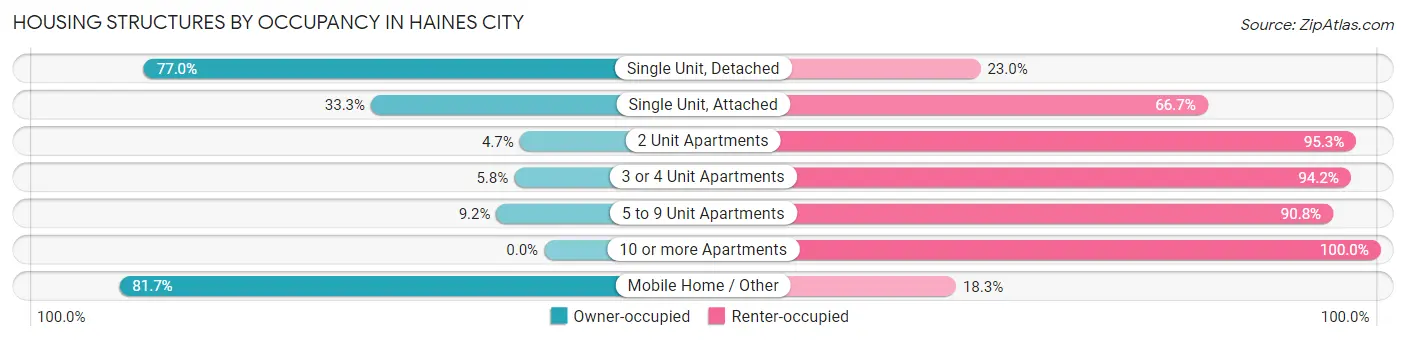
| Structure Type | Owner-occupied | Renter-occupied |
| Single Unit, Detached | 5,212 (77.0%) | 1,554 (23.0%) |
| Single Unit, Attached | 46 (33.3%) | 92 (66.7%) |
| 2 Unit Apartments | 23 (4.7%) | 465 (95.3%) |
| 3 or 4 Unit Apartments | 16 (5.8%) | 262 (94.2%) |
| 5 to 9 Unit Apartments | 18 (9.2%) | 178 (90.8%) |
| 10 or more Apartments | 0 (0.0%) | 166 (100.0%) |
| Mobile Home / Other | 1,052 (81.7%) | 235 (18.3%) |
| Total | 6,367 (68.3%) | 2,952 (31.7%) |
Housing Structures by Number of Rooms in Haines City
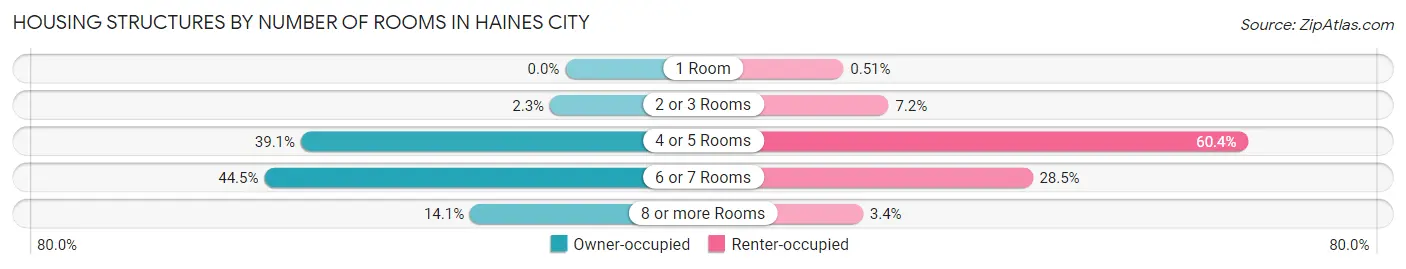
| Number of Rooms | Owner-occupied | Renter-occupied |
| 1 Room | 0 (0.0%) | 15 (0.5%) |
| 2 or 3 Rooms | 144 (2.3%) | 212 (7.2%) |
| 4 or 5 Rooms | 2,491 (39.1%) | 1,784 (60.4%) |
| 6 or 7 Rooms | 2,835 (44.5%) | 841 (28.5%) |
| 8 or more Rooms | 897 (14.1%) | 100 (3.4%) |
| Total | 6,367 (100.0%) | 2,952 (100.0%) |
Housing Structure by Heating Type in Haines City
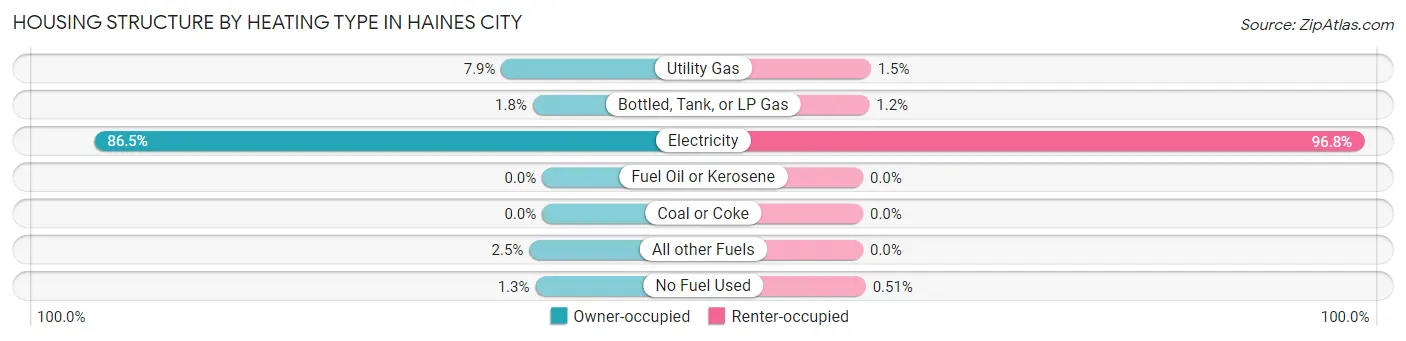
| Heating Type | Owner-occupied | Renter-occupied |
| Utility Gas | 501 (7.9%) | 44 (1.5%) |
| Bottled, Tank, or LP Gas | 115 (1.8%) | 36 (1.2%) |
| Electricity | 5,508 (86.5%) | 2,857 (96.8%) |
| Fuel Oil or Kerosene | 0 (0.0%) | 0 (0.0%) |
| Coal or Coke | 0 (0.0%) | 0 (0.0%) |
| All other Fuels | 159 (2.5%) | 0 (0.0%) |
| No Fuel Used | 84 (1.3%) | 15 (0.5%) |
| Total | 6,367 (100.0%) | 2,952 (100.0%) |
Household Vehicle Usage in Haines City
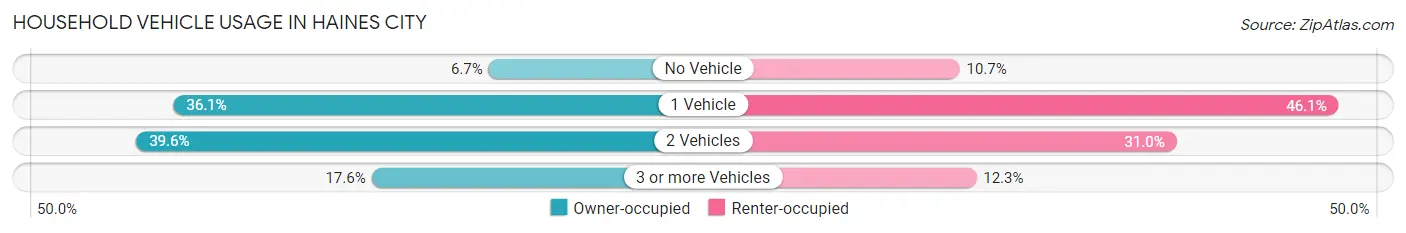
| Vehicles per Household | Owner-occupied | Renter-occupied |
| No Vehicle | 426 (6.7%) | 316 (10.7%) |
| 1 Vehicle | 2,299 (36.1%) | 1,360 (46.1%) |
| 2 Vehicles | 2,520 (39.6%) | 914 (31.0%) |
| 3 or more Vehicles | 1,122 (17.6%) | 362 (12.3%) |
| Total | 6,367 (100.0%) | 2,952 (100.0%) |
Real Estate & Mortgages in Haines City
Real Estate and Mortgage Overview in Haines City
| Characteristic | Without Mortgage | With Mortgage |
| Housing Units | 2,705 | 3,662 |
| Median Property Value | $116,500 | $250,600 |
| Median Household Income | $45,494 | $529 |
| Monthly Housing Costs | $652 | $156 |
| Real Estate Taxes | $1,439 | $136 |
Property Value by Mortgage Status in Haines City
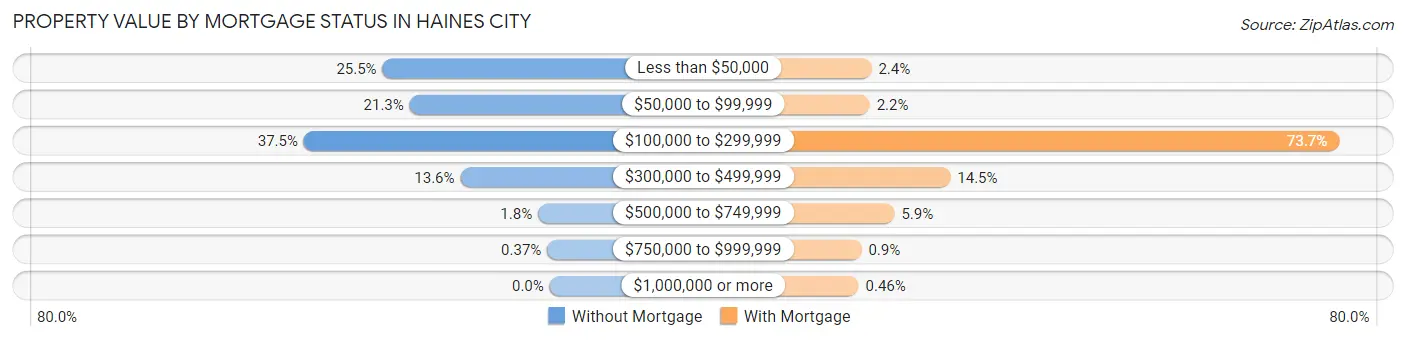
| Property Value | Without Mortgage | With Mortgage |
| Less than $50,000 | 689 (25.5%) | 89 (2.4%) |
| $50,000 to $99,999 | 577 (21.3%) | 79 (2.2%) |
| $100,000 to $299,999 | 1,013 (37.4%) | 2,698 (73.7%) |
| $300,000 to $499,999 | 368 (13.6%) | 529 (14.4%) |
| $500,000 to $749,999 | 48 (1.8%) | 217 (5.9%) |
| $750,000 to $999,999 | 10 (0.4%) | 33 (0.9%) |
| $1,000,000 or more | 0 (0.0%) | 17 (0.5%) |
| Total | 2,705 (100.0%) | 3,662 (100.0%) |
Household Income by Mortgage Status in Haines City
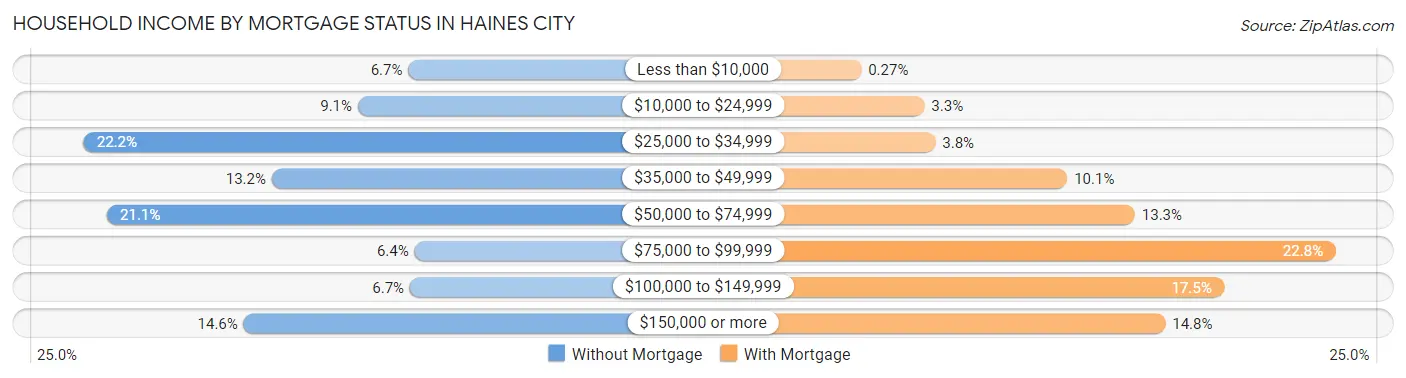
| Household Income | Without Mortgage | With Mortgage |
| Less than $10,000 | 182 (6.7%) | 10 (0.3%) |
| $10,000 to $24,999 | 247 (9.1%) | 120 (3.3%) |
| $25,000 to $34,999 | 600 (22.2%) | 139 (3.8%) |
| $35,000 to $49,999 | 358 (13.2%) | 369 (10.1%) |
| $50,000 to $74,999 | 570 (21.1%) | 487 (13.3%) |
| $75,000 to $99,999 | 174 (6.4%) | 836 (22.8%) |
| $100,000 to $149,999 | 180 (6.7%) | 642 (17.5%) |
| $150,000 or more | 394 (14.6%) | 540 (14.7%) |
| Total | 2,705 (100.0%) | 3,662 (100.0%) |
Property Value to Household Income Ratio in Haines City
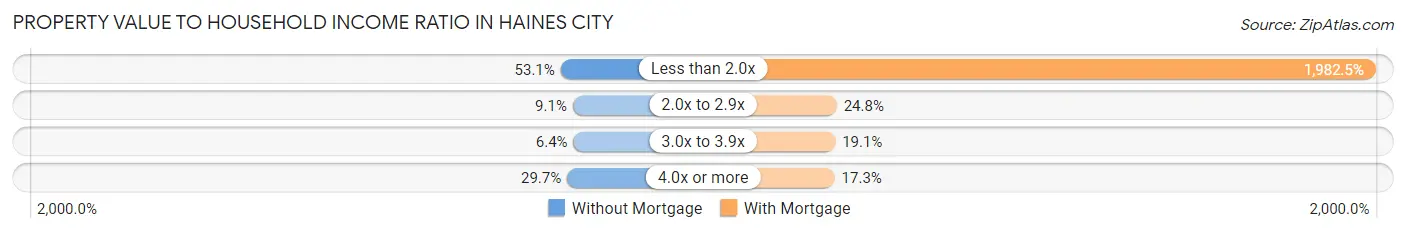
| Value-to-Income Ratio | Without Mortgage | With Mortgage |
| Less than 2.0x | 1,437 (53.1%) | 72,600 (1,982.5%) |
| 2.0x to 2.9x | 245 (9.1%) | 908 (24.8%) |
| 3.0x to 3.9x | 173 (6.4%) | 699 (19.1%) |
| 4.0x or more | 802 (29.6%) | 632 (17.3%) |
| Total | 2,705 (100.0%) | 3,662 (100.0%) |
Real Estate Taxes by Mortgage Status in Haines City
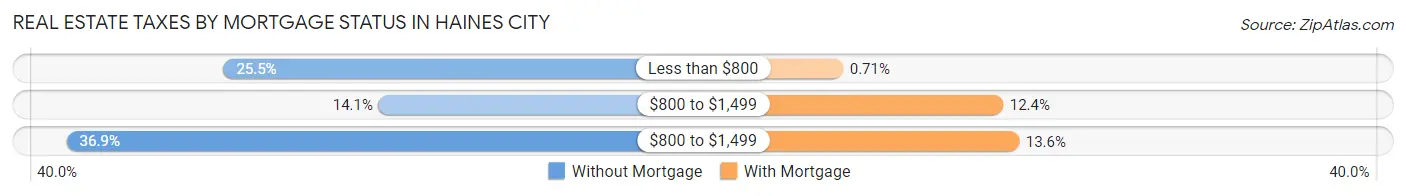
| Property Taxes | Without Mortgage | With Mortgage |
| Less than $800 | 689 (25.5%) | 26 (0.7%) |
| $800 to $1,499 | 382 (14.1%) | 454 (12.4%) |
| $800 to $1,499 | 999 (36.9%) | 497 (13.6%) |
| Total | 2,705 (100.0%) | 3,662 (100.0%) |
Health & Disability in Haines City
Health Insurance Coverage by Age in Haines City
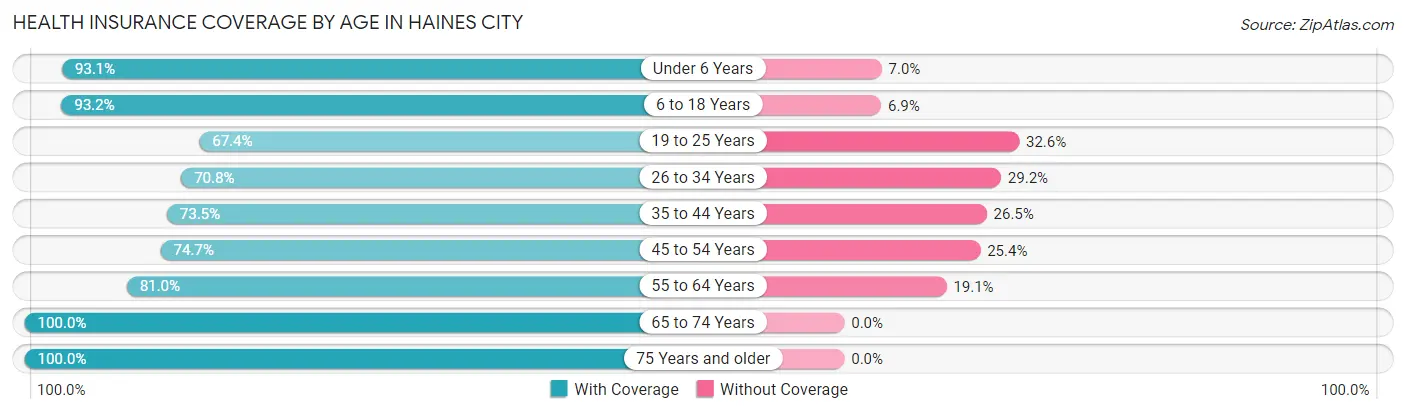
| Age Bracket | With Coverage | Without Coverage |
| Under 6 Years | 2,090 (93.0%) | 156 (7.0%) |
| 6 to 18 Years | 5,087 (93.1%) | 374 (6.9%) |
| 19 to 25 Years | 1,655 (67.4%) | 800 (32.6%) |
| 26 to 34 Years | 2,612 (70.8%) | 1,078 (29.2%) |
| 35 to 44 Years | 3,374 (73.5%) | 1,219 (26.5%) |
| 45 to 54 Years | 2,314 (74.7%) | 786 (25.4%) |
| 55 to 64 Years | 2,648 (80.9%) | 623 (19.1%) |
| 65 to 74 Years | 1,961 (100.0%) | 0 (0.0%) |
| 75 Years and older | 2,006 (100.0%) | 0 (0.0%) |
| Total | 23,747 (82.5%) | 5,036 (17.5%) |
Health Insurance Coverage by Citizenship Status in Haines City
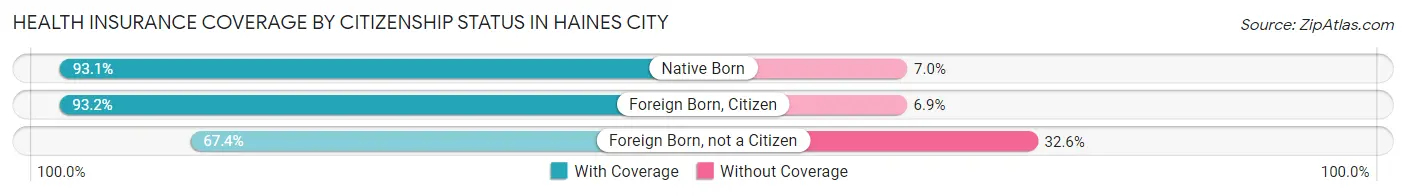
| Citizenship Status | With Coverage | Without Coverage |
| Native Born | 2,090 (93.0%) | 156 (7.0%) |
| Foreign Born, Citizen | 5,087 (93.1%) | 374 (6.9%) |
| Foreign Born, not a Citizen | 1,655 (67.4%) | 800 (32.6%) |
Health Insurance Coverage by Household Income in Haines City
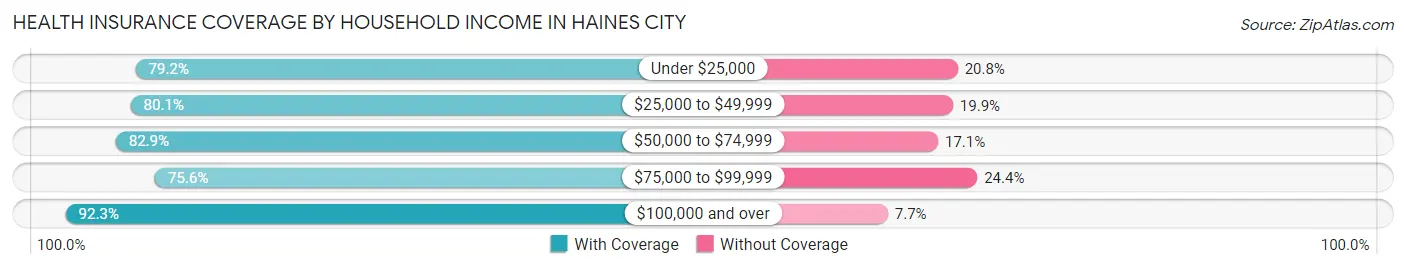
| Household Income | With Coverage | Without Coverage |
| Under $25,000 | 2,329 (79.2%) | 611 (20.8%) |
| $25,000 to $49,999 | 5,517 (80.1%) | 1,369 (19.9%) |
| $50,000 to $74,999 | 4,981 (82.9%) | 1,027 (17.1%) |
| $75,000 to $99,999 | 4,629 (75.6%) | 1,497 (24.4%) |
| $100,000 and over | 6,171 (92.3%) | 514 (7.7%) |
Public vs Private Health Insurance Coverage by Age in Haines City
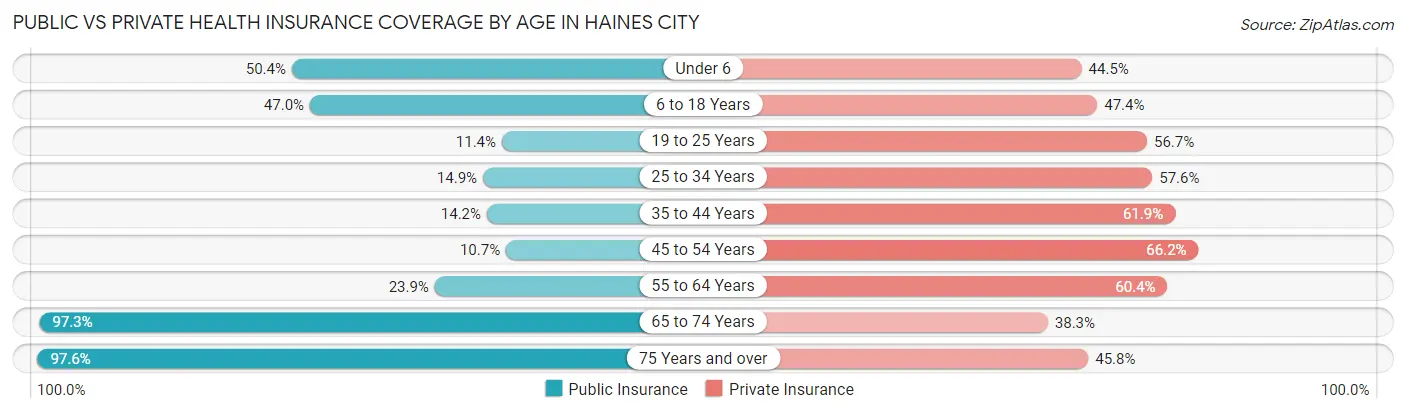
| Age Bracket | Public Insurance | Private Insurance |
| Under 6 | 1,132 (50.4%) | 1,000 (44.5%) |
| 6 to 18 Years | 2,569 (47.0%) | 2,590 (47.4%) |
| 19 to 25 Years | 280 (11.4%) | 1,391 (56.7%) |
| 25 to 34 Years | 551 (14.9%) | 2,127 (57.6%) |
| 35 to 44 Years | 652 (14.2%) | 2,841 (61.9%) |
| 45 to 54 Years | 330 (10.6%) | 2,052 (66.2%) |
| 55 to 64 Years | 781 (23.9%) | 1,977 (60.4%) |
| 65 to 74 Years | 1,907 (97.3%) | 750 (38.3%) |
| 75 Years and over | 1,958 (97.6%) | 918 (45.8%) |
| Total | 10,160 (35.3%) | 15,646 (54.4%) |
Disability Status by Sex by Age in Haines City
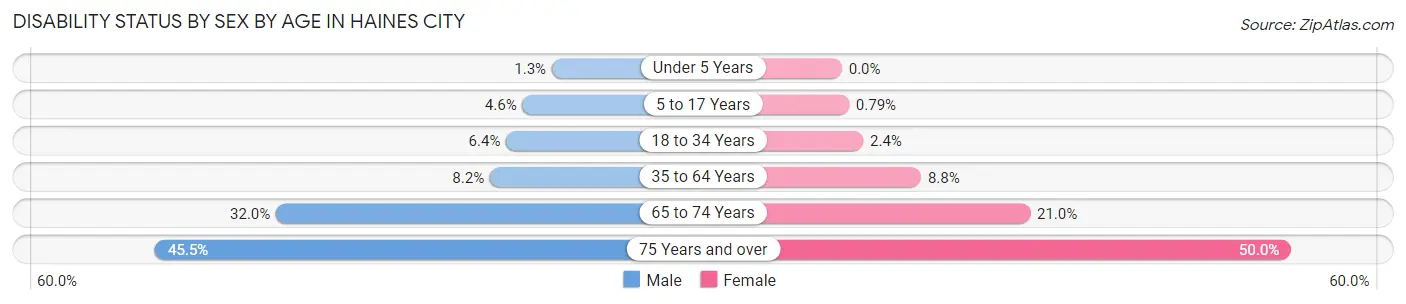
| Age Bracket | Male | Female |
| Under 5 Years | 12 (1.3%) | 0 (0.0%) |
| 5 to 17 Years | 120 (4.5%) | 22 (0.8%) |
| 18 to 34 Years | 221 (6.4%) | 74 (2.4%) |
| 35 to 64 Years | 429 (8.2%) | 504 (8.8%) |
| 65 to 74 Years | 348 (32.0%) | 183 (21.0%) |
| 75 Years and over | 347 (45.5%) | 622 (50.0%) |
Disability Class by Sex by Age in Haines City
Disability Class: Hearing Difficulty
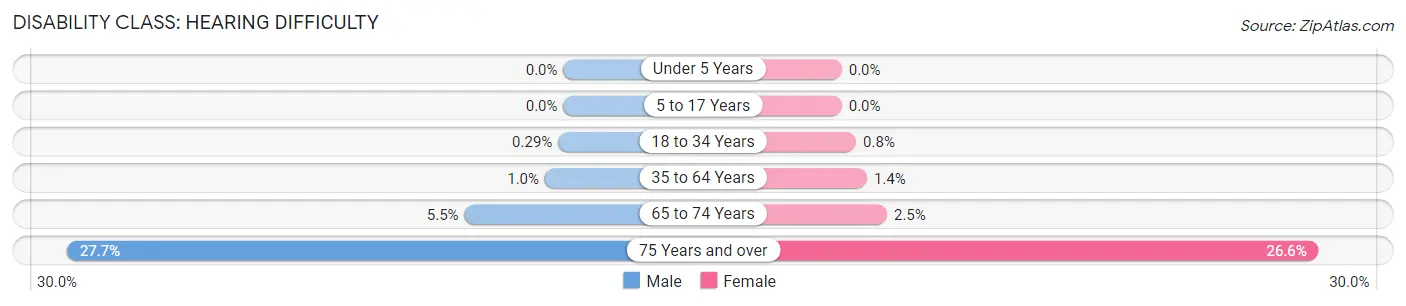
| Age Bracket | Male | Female |
| Under 5 Years | 0 (0.0%) | 0 (0.0%) |
| 5 to 17 Years | 0 (0.0%) | 0 (0.0%) |
| 18 to 34 Years | 10 (0.3%) | 25 (0.8%) |
| 35 to 64 Years | 54 (1.0%) | 80 (1.4%) |
| 65 to 74 Years | 60 (5.5%) | 22 (2.5%) |
| 75 Years and over | 211 (27.7%) | 330 (26.6%) |
Disability Class: Vision Difficulty
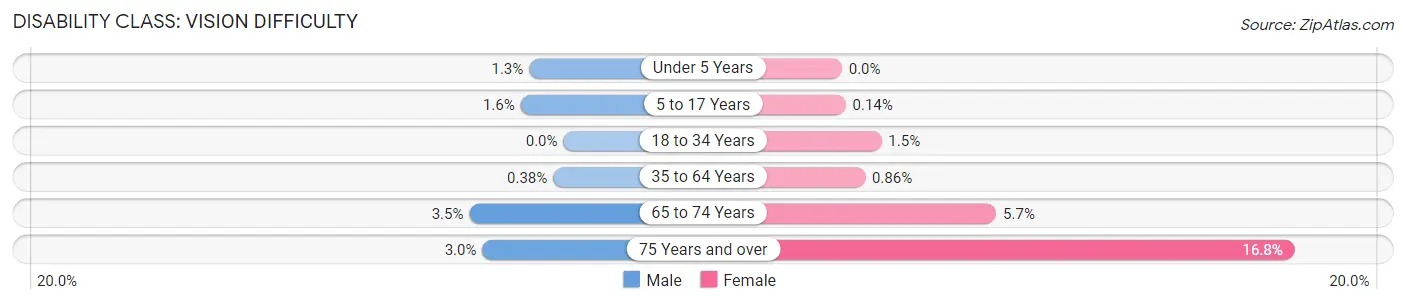
| Age Bracket | Male | Female |
| Under 5 Years | 12 (1.3%) | 0 (0.0%) |
| 5 to 17 Years | 42 (1.6%) | 4 (0.1%) |
| 18 to 34 Years | 0 (0.0%) | 46 (1.5%) |
| 35 to 64 Years | 20 (0.4%) | 49 (0.9%) |
| 65 to 74 Years | 38 (3.5%) | 50 (5.7%) |
| 75 Years and over | 23 (3.0%) | 209 (16.8%) |
Disability Class: Cognitive Difficulty
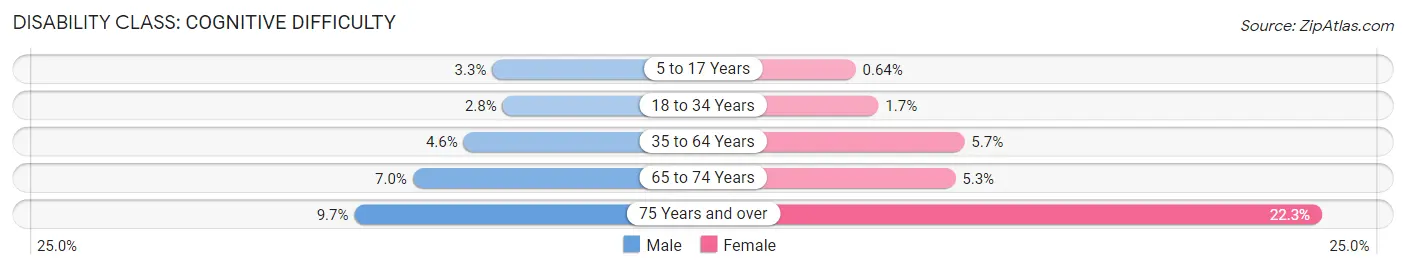
| Age Bracket | Male | Female |
| 5 to 17 Years | 87 (3.3%) | 18 (0.6%) |
| 18 to 34 Years | 98 (2.8%) | 53 (1.7%) |
| 35 to 64 Years | 243 (4.6%) | 325 (5.7%) |
| 65 to 74 Years | 76 (7.0%) | 46 (5.3%) |
| 75 Years and over | 74 (9.7%) | 277 (22.3%) |
Disability Class: Ambulatory Difficulty
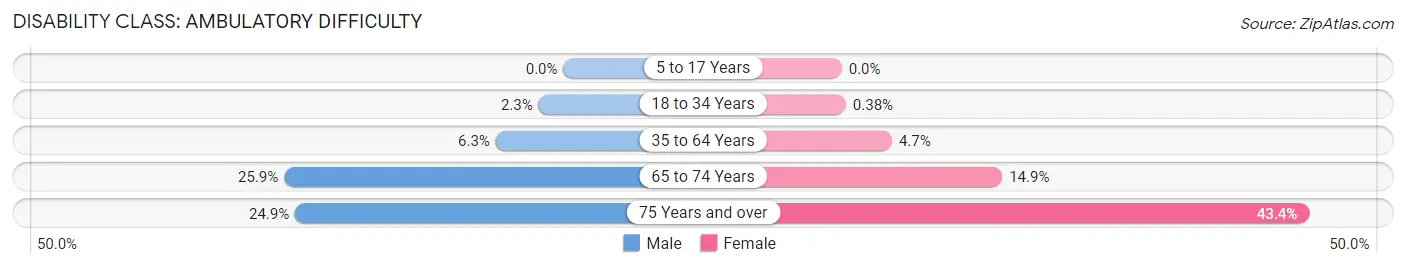
| Age Bracket | Male | Female |
| 5 to 17 Years | 0 (0.0%) | 0 (0.0%) |
| 18 to 34 Years | 80 (2.3%) | 12 (0.4%) |
| 35 to 64 Years | 330 (6.3%) | 266 (4.7%) |
| 65 to 74 Years | 282 (25.9%) | 130 (14.9%) |
| 75 Years and over | 190 (24.9%) | 539 (43.4%) |
Disability Class: Self-Care Difficulty
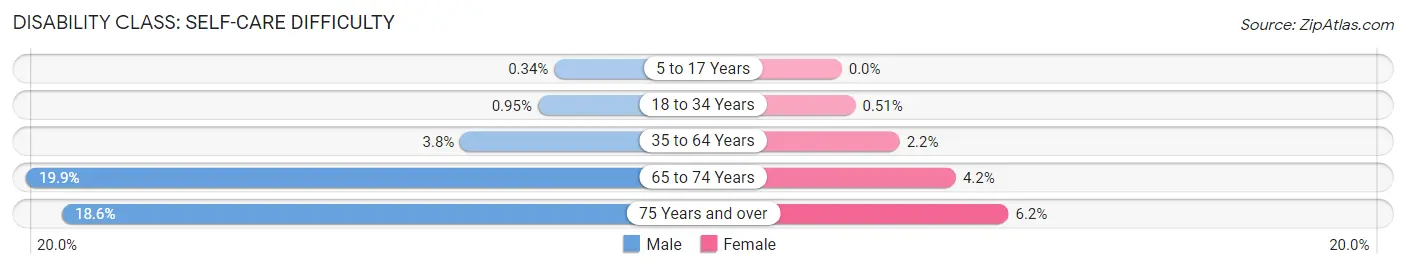
| Age Bracket | Male | Female |
| 5 to 17 Years | 9 (0.3%) | 0 (0.0%) |
| 18 to 34 Years | 33 (0.9%) | 16 (0.5%) |
| 35 to 64 Years | 201 (3.8%) | 123 (2.1%) |
| 65 to 74 Years | 217 (19.9%) | 37 (4.2%) |
| 75 Years and over | 142 (18.6%) | 77 (6.2%) |
Technology Access in Haines City
Computing Device Access in Haines City
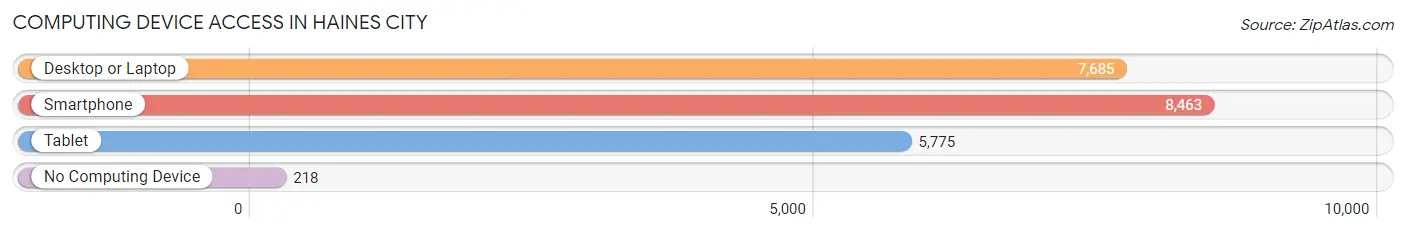
| Device Type | # Households | % Households |
| Desktop or Laptop | 7,685 | 82.5% |
| Smartphone | 8,463 | 90.8% |
| Tablet | 5,775 | 62.0% |
| No Computing Device | 218 | 2.3% |
| Total | 9,319 | 100.0% |
Internet Access in Haines City
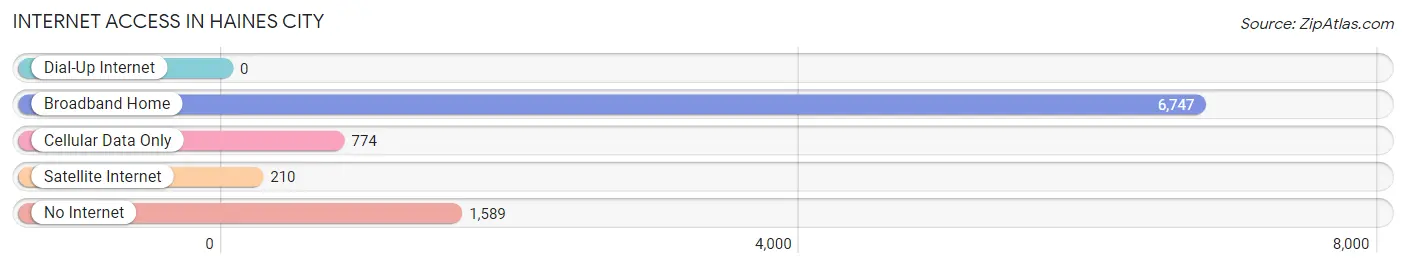
| Internet Type | # Households | % Households |
| Dial-Up Internet | 0 | 0.0% |
| Broadband Home | 6,747 | 72.4% |
| Cellular Data Only | 774 | 8.3% |
| Satellite Internet | 210 | 2.2% |
| No Internet | 1,589 | 17.1% |
| Total | 9,319 | 100.0% |
Haines City Summary
Haines City is a city located in Polk County, Florida, United States. It is part of the Lakeland–Winter Haven Metropolitan Statistical Area. The population was 13,174 at the 2010 census. Haines City was founded in 1885 by Henry Haines, a Civil War veteran.
History
Haines City was founded in 1885 by Henry Haines, a Civil War veteran. Haines had served in the Union Army and was awarded a homestead in the area. He built a home and began to cultivate the land. The town was originally called Clay Cut, but was later renamed Haines City in honor of its founder.
In the early 1900s, Haines City began to grow as a center for citrus production. The city was incorporated in 1920 and the first mayor was elected in 1921. The city continued to grow and by the 1950s, it had become a popular tourist destination.
Geography
Haines City is located in central Florida, approximately 40 miles southwest of Orlando. It is situated in the rolling hills of the Lake Wales Ridge, an area of high elevation in the state. The city is bordered by Lake Pierce to the north, Lake Hatchineha to the east, and Lake Marion to the south.
The city covers an area of 11.3 square miles and has a population density of 1,170 people per square mile. The city is located at an elevation of 98 feet above sea level.
Economy
Haines City’s economy is largely based on agriculture and tourism. The city is home to several large citrus groves and is a major producer of oranges, grapefruit, and tangerines. The city is also home to several tourist attractions, including Legoland Florida, Bok Tower Gardens, and the Haines City Historical Museum.
The city is also home to several manufacturing companies, including a Coca-Cola bottling plant and a paper mill. The city is also home to several retail stores, restaurants, and hotels.
Demographics
As of the 2010 census, Haines City had a population of 13,174. The racial makeup of the city was 68.3% White, 22.2% African American, 0.5% Native American, 1.2% Asian, 0.1% Pacific Islander, 5.2% from other races, and 2.7% from two or more races. Hispanic or Latino of any race were 15.2% of the population.
The median income for a household in the city was $35,945, and the median income for a family was $41,945. The per capita income for the city was $17,845. About 17.2% of families and 20.7% of the population were below the poverty line, including 28.2% of those under age 18 and 11.2% of those age 65 or over.
Common Questions
What is Per Capita Income in Haines City?
Per Capita income in Haines City is $26,919.
What is the Median Family Income in Haines City?
Median Family Income in Haines City is $63,147.
What is the Median Household income in Haines City?
Median Household Income in Haines City is $57,718.
What is Income or Wage Gap in Haines City?
Income or Wage Gap in Haines City is 20.2%.
Women in Haines City earn 79.8 cents for every dollar earned by a man.
What is Family Income Deficit in Haines City?
Family Income Deficit in Haines City is $12,358.
Families that are below poverty line in Haines City earn $12,358 less on average than the poverty threshold level.
What is Inequality or Gini Index in Haines City?
Inequality or Gini Index in Haines City is 0.46.
What is the Total Population of Haines City?
Total Population of Haines City is 28,922.
What is the Total Male Population of Haines City?
Total Male Population of Haines City is 14,209.
What is the Total Female Population of Haines City?
Total Female Population of Haines City is 14,713.
What is the Ratio of Males per 100 Females in Haines City?
There are 96.57 Males per 100 Females in Haines City.
What is the Ratio of Females per 100 Males in Haines City?
There are 103.55 Females per 100 Males in Haines City.
What is the Median Population Age in Haines City?
Median Population Age in Haines City is 36.7 Years.
What is the Average Family Size in Haines City
Average Family Size in Haines City is 3.6 People.
What is the Average Household Size in Haines City
Average Household Size in Haines City is 3.1 People.
How Large is the Labor Force in Haines City?
There are 12,993 People in the Labor Forcein in Haines City.
What is the Percentage of People in the Labor Force in Haines City?
58.5% of People are in the Labor Force in Haines City.
What is the Unemployment Rate in Haines City?
Unemployment Rate in Haines City is 4.8%.