Pembroke Pines, FL Map & Demographics
Pembroke Pines Map
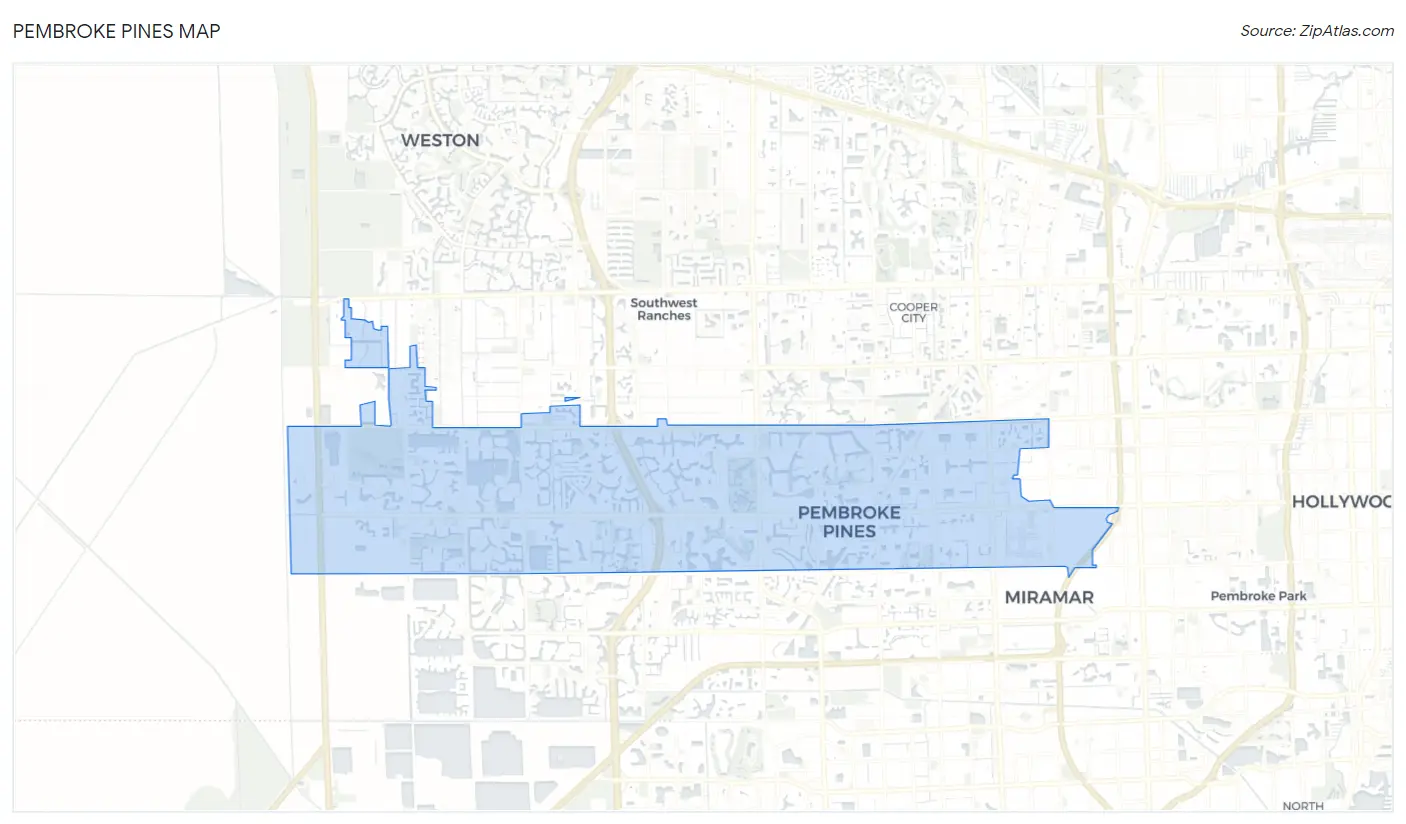
Pembroke Pines Overview
$37,673
PER CAPITA INCOME
$94,525
AVG FAMILY INCOME
$77,657
AVG HOUSEHOLD INCOME
15.2%
WAGE / INCOME GAP [ % ]
84.8¢/ $1
WAGE / INCOME GAP [ $ ]
$10,868
FAMILY INCOME DEFICIT
0.46
INEQUALITY / GINI INDEX
170,472
TOTAL POPULATION
82,020
MALE POPULATION
88,452
FEMALE POPULATION
92.73
MALES / 100 FEMALES
107.84
FEMALES / 100 MALES
42.9
MEDIAN AGE
3.3
AVG FAMILY SIZE
2.7
AVG HOUSEHOLD SIZE
88,304
LABOR FORCE [ PEOPLE ]
63.0%
PERCENT IN LABOR FORCE
4.7%
UNEMPLOYMENT RATE
Pembroke Pines Zip Codes
Income in Pembroke Pines
Income Overview in Pembroke Pines
Per Capita Income in Pembroke Pines is $37,673, while median incomes of families and households are $94,525 and $77,657 respectively.
| Characteristic | Number | Measure |
| Per Capita Income | 170,472 | $37,673 |
| Median Family Income | 43,136 | $94,525 |
| Mean Family Income | 43,136 | $115,837 |
| Median Household Income | 62,807 | $77,657 |
| Mean Household Income | 62,807 | $99,173 |
| Income Deficit | 43,136 | $10,868 |
| Wage / Income Gap (%) | 170,472 | 15.22% |
| Wage / Income Gap ($) | 170,472 | 84.78¢ per $1 |
| Gini / Inequality Index | 170,472 | 0.46 |
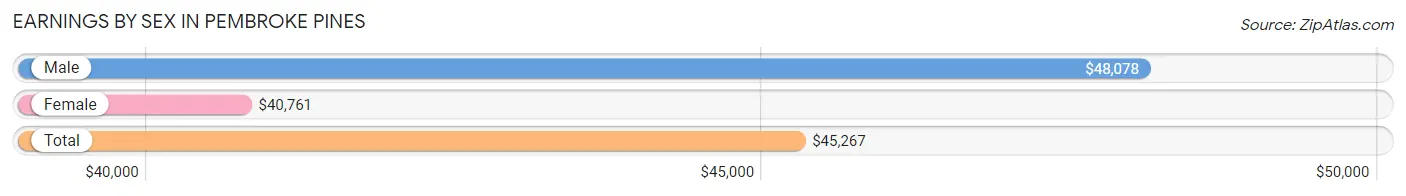
Earnings by Sex in Pembroke Pines
Average Earnings in Pembroke Pines are $45,267, $48,078 for men and $40,761 for women, a difference of 15.2%.
| Sex | Number | Average Earnings |
| Male | 46,873 (52.1%) | $48,078 |
| Female | 43,042 (47.9%) | $40,761 |
| Total | 89,915 (100.0%) | $45,267 |
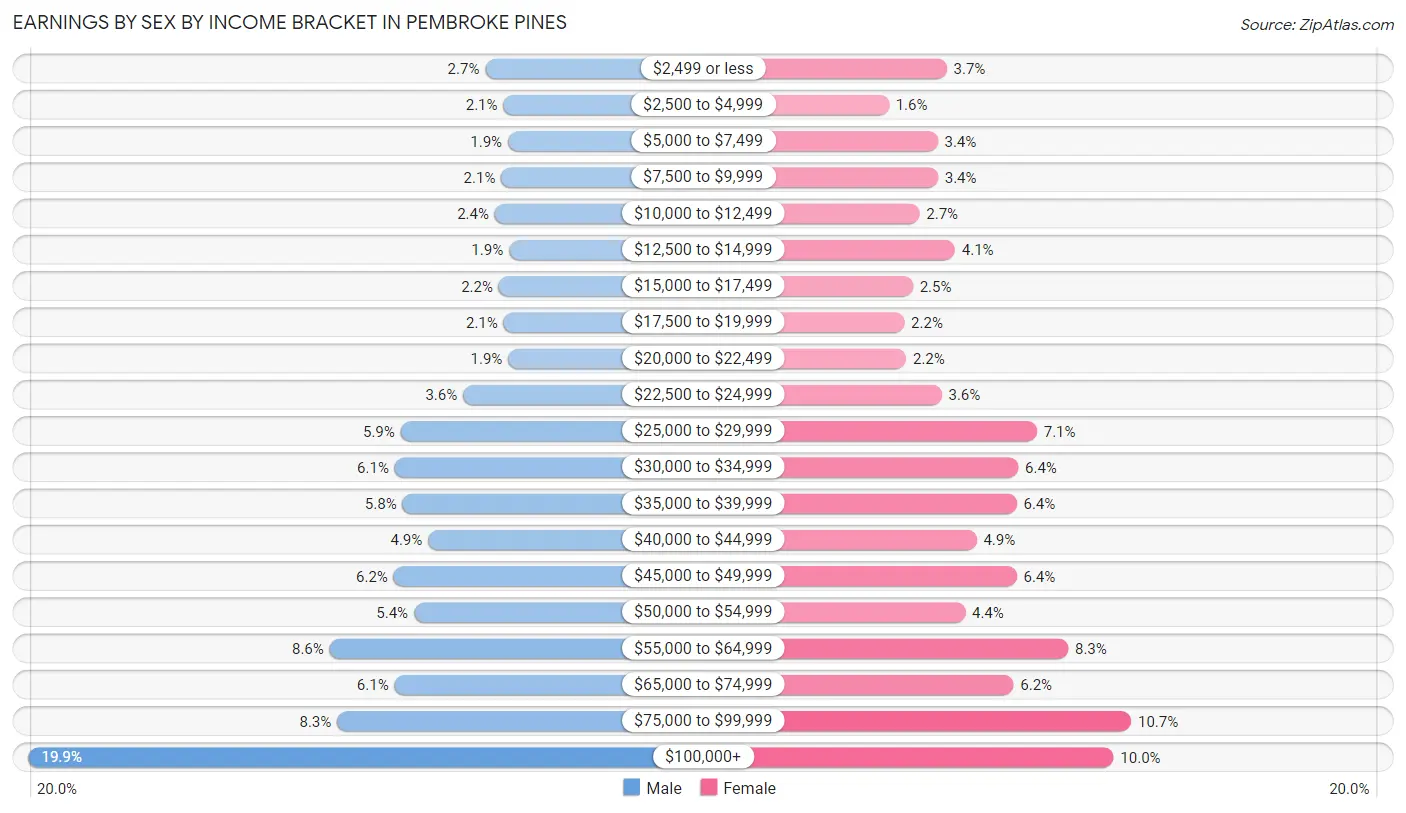
Earnings by Sex by Income Bracket in Pembroke Pines
The most common earnings brackets in Pembroke Pines are $100,000+ for men (9,305 | 19.9%) and $75,000 to $99,999 for women (4,583 | 10.6%).
| Income | Male | Female |
| $2,499 or less | 1,286 (2.7%) | 1,609 (3.7%) |
| $2,500 to $4,999 | 966 (2.1%) | 677 (1.6%) |
| $5,000 to $7,499 | 887 (1.9%) | 1,464 (3.4%) |
| $7,500 to $9,999 | 1,003 (2.1%) | 1,467 (3.4%) |
| $10,000 to $12,499 | 1,117 (2.4%) | 1,172 (2.7%) |
| $12,500 to $14,999 | 869 (1.8%) | 1,743 (4.1%) |
| $15,000 to $17,499 | 1,044 (2.2%) | 1,063 (2.5%) |
| $17,500 to $19,999 | 961 (2.1%) | 925 (2.1%) |
| $20,000 to $22,499 | 881 (1.9%) | 956 (2.2%) |
| $22,500 to $24,999 | 1,673 (3.6%) | 1,527 (3.5%) |
| $25,000 to $29,999 | 2,771 (5.9%) | 3,064 (7.1%) |
| $30,000 to $34,999 | 2,872 (6.1%) | 2,765 (6.4%) |
| $35,000 to $39,999 | 2,738 (5.8%) | 2,736 (6.4%) |
| $40,000 to $44,999 | 2,288 (4.9%) | 2,090 (4.9%) |
| $45,000 to $49,999 | 2,893 (6.2%) | 2,738 (6.4%) |
| $50,000 to $54,999 | 2,537 (5.4%) | 1,908 (4.4%) |
| $55,000 to $64,999 | 4,016 (8.6%) | 3,570 (8.3%) |
| $65,000 to $74,999 | 2,880 (6.1%) | 2,687 (6.2%) |
| $75,000 to $99,999 | 3,886 (8.3%) | 4,583 (10.6%) |
| $100,000+ | 9,305 (19.9%) | 4,298 (10.0%) |
| Total | 46,873 (100.0%) | 43,042 (100.0%) |
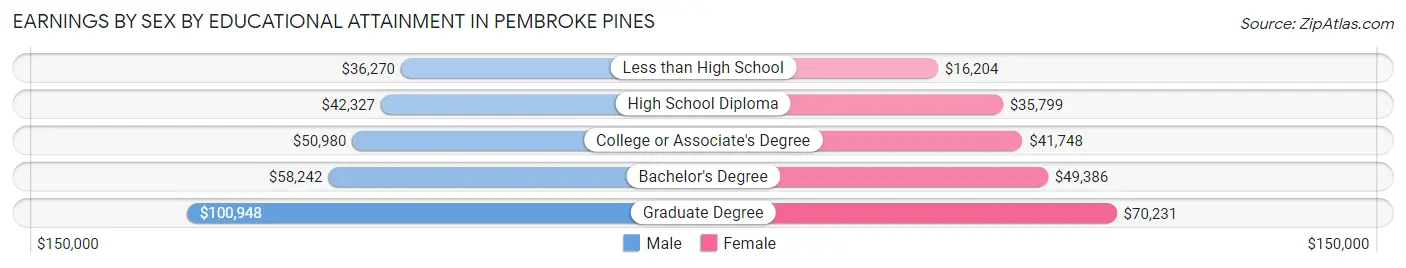
Earnings by Sex by Educational Attainment in Pembroke Pines
Average earnings in Pembroke Pines are $52,155 for men and $45,455 for women, a difference of 12.9%. Men with an educational attainment of graduate degree enjoy the highest average annual earnings of $100,948, while those with less than high school education earn the least with $36,270. Women with an educational attainment of graduate degree earn the most with the average annual earnings of $70,231, while those with less than high school education have the smallest earnings of $16,204.
| Educational Attainment | Male Income | Female Income |
| Less than High School | $36,270 | $16,204 |
| High School Diploma | $42,327 | $35,799 |
| College or Associate's Degree | $50,980 | $41,748 |
| Bachelor's Degree | $58,242 | $49,386 |
| Graduate Degree | $100,948 | $70,231 |
| Total | $52,155 | $45,455 |
Family Income in Pembroke Pines
Family Income Brackets in Pembroke Pines
According to the Pembroke Pines family income data, there are 9,404 families falling into the $100,000 to $149,999 income range, which is the most common income bracket and makes up 21.8% of all families. Conversely, the $10,000 to $14,999 income bracket is the least frequent group with only 604 families (1.4%) belonging to this category.
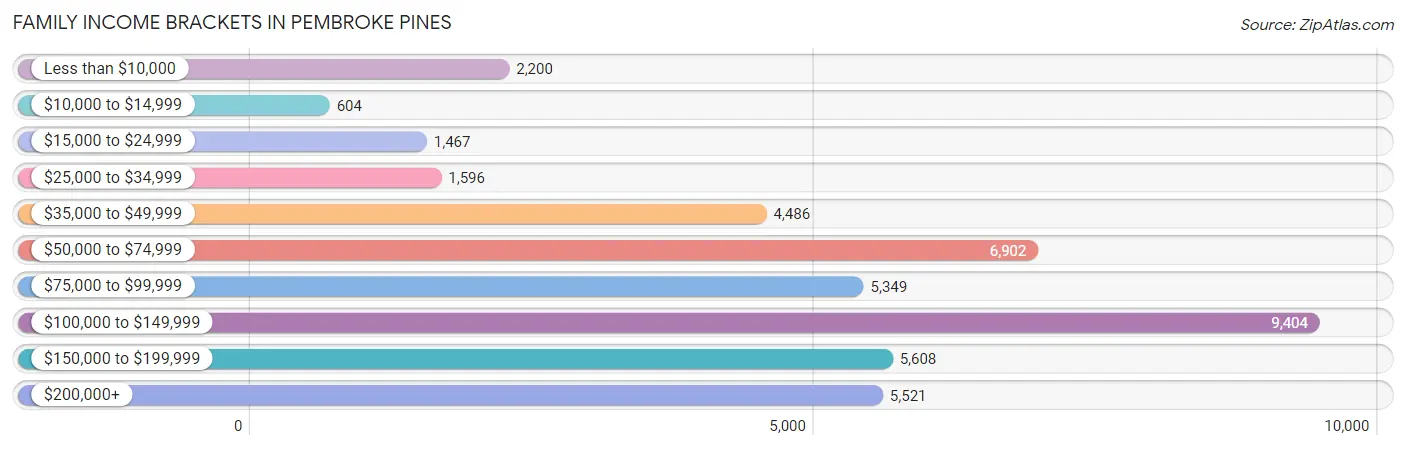
| Income Bracket | # Families | % Families |
| Less than $10,000 | 2,200 | 5.1% |
| $10,000 to $14,999 | 604 | 1.4% |
| $15,000 to $24,999 | 1,467 | 3.4% |
| $25,000 to $34,999 | 1,596 | 3.7% |
| $35,000 to $49,999 | 4,486 | 10.4% |
| $50,000 to $74,999 | 6,902 | 16.0% |
| $75,000 to $99,999 | 5,349 | 12.4% |
| $100,000 to $149,999 | 9,404 | 21.8% |
| $150,000 to $199,999 | 5,608 | 13.0% |
| $200,000+ | 5,521 | 12.8% |
Family Income by Famaliy Size in Pembroke Pines
7+ person families (448 | 1.0%) account for the highest median family income in Pembroke Pines with $156,083 per family, while 2-person families (18,187 | 42.2%) have the highest median income of $35,148 per family member.
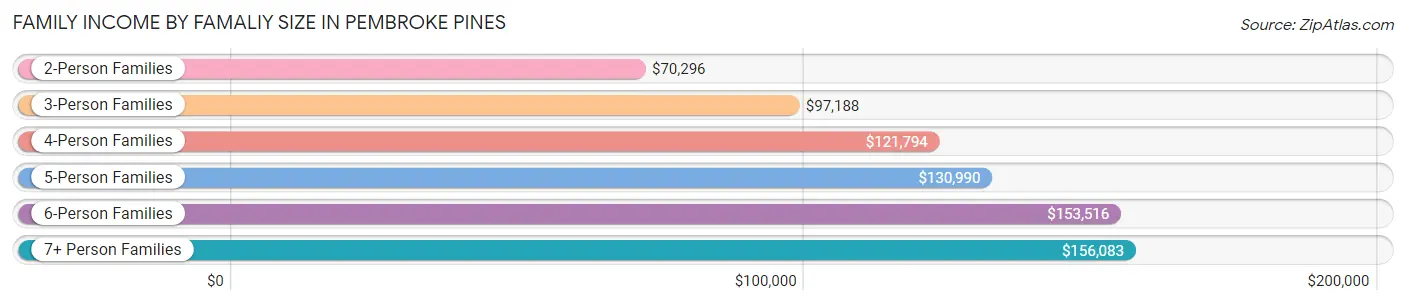
| Income Bracket | # Families | Median Income |
| 2-Person Families | 18,187 (42.2%) | $70,296 |
| 3-Person Families | 10,997 (25.5%) | $97,188 |
| 4-Person Families | 9,394 (21.8%) | $121,794 |
| 5-Person Families | 3,017 (7.0%) | $130,990 |
| 6-Person Families | 1,093 (2.5%) | $153,516 |
| 7+ Person Families | 448 (1.0%) | $156,083 |
| Total | 43,136 (100.0%) | $94,525 |
Family Income by Number of Earners in Pembroke Pines
The median family income in Pembroke Pines is $94,525, with families comprising 3+ earners (6,321) having the highest median family income of $145,244, while families with no earners (6,024) have the lowest median family income of $29,656, accounting for 14.6% and 14.0% of families, respectively.
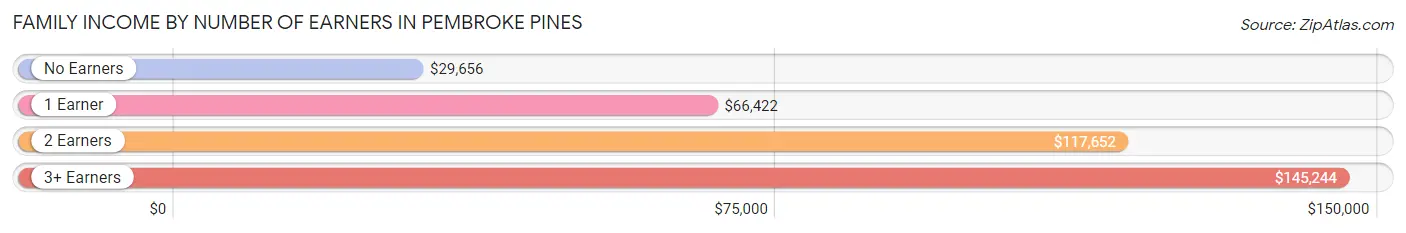
| Number of Earners | # Families | Median Income |
| No Earners | 6,024 (14.0%) | $29,656 |
| 1 Earner | 12,412 (28.8%) | $66,422 |
| 2 Earners | 18,379 (42.6%) | $117,652 |
| 3+ Earners | 6,321 (14.6%) | $145,244 |
| Total | 43,136 (100.0%) | $94,525 |
Household Income in Pembroke Pines
Household Income Brackets in Pembroke Pines
With 11,682 households falling in the category, the $100,000 to $149,999 income range is the most frequent in Pembroke Pines, accounting for 18.6% of all households. In contrast, only 1,696 households (2.7%) fall into the $10,000 to $14,999 income bracket, making it the least populous group.
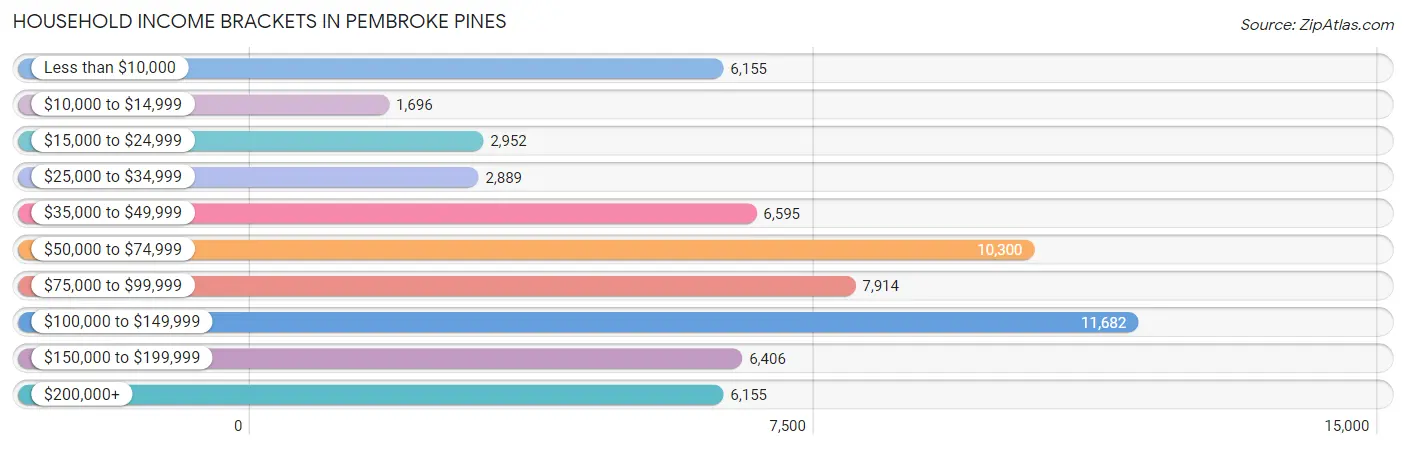
| Income Bracket | # Households | % Households |
| Less than $10,000 | 6,155 | 9.8% |
| $10,000 to $14,999 | 1,696 | 2.7% |
| $15,000 to $24,999 | 2,952 | 4.7% |
| $25,000 to $34,999 | 2,889 | 4.6% |
| $35,000 to $49,999 | 6,595 | 10.5% |
| $50,000 to $74,999 | 10,300 | 16.4% |
| $75,000 to $99,999 | 7,914 | 12.6% |
| $100,000 to $149,999 | 11,682 | 18.6% |
| $150,000 to $199,999 | 6,406 | 10.2% |
| $200,000+ | 6,155 | 9.8% |
Household Income by Householder Age in Pembroke Pines
The median household income in Pembroke Pines is $77,657, with the highest median household income of $98,214 found in the 45 to 64 years age bracket for the primary householder. A total of 25,939 households (41.3%) fall into this category. Meanwhile, the 65+ years age bracket for the primary householder has the lowest median household income of $38,576, with 19,288 households (30.7%) in this group.
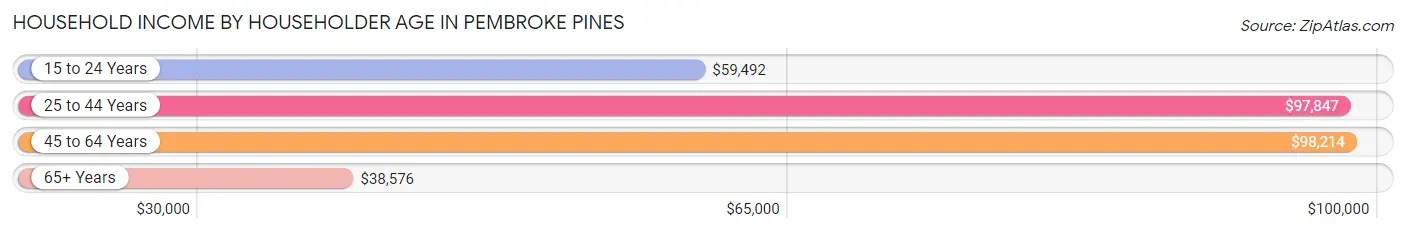
| Income Bracket | # Households | Median Income |
| 15 to 24 Years | 858 (1.4%) | $59,492 |
| 25 to 44 Years | 16,722 (26.6%) | $97,847 |
| 45 to 64 Years | 25,939 (41.3%) | $98,214 |
| 65+ Years | 19,288 (30.7%) | $38,576 |
| Total | 62,807 (100.0%) | $77,657 |
Poverty in Pembroke Pines
Income Below Poverty by Sex and Age in Pembroke Pines
With 11.1% poverty level for males and 11.0% for females among the residents of Pembroke Pines, 15 year old males and 75 year old and over females are the most vulnerable to poverty, with 277 males (25.5%) and 2,630 females (27.8%) in their respective age groups living below the poverty level.
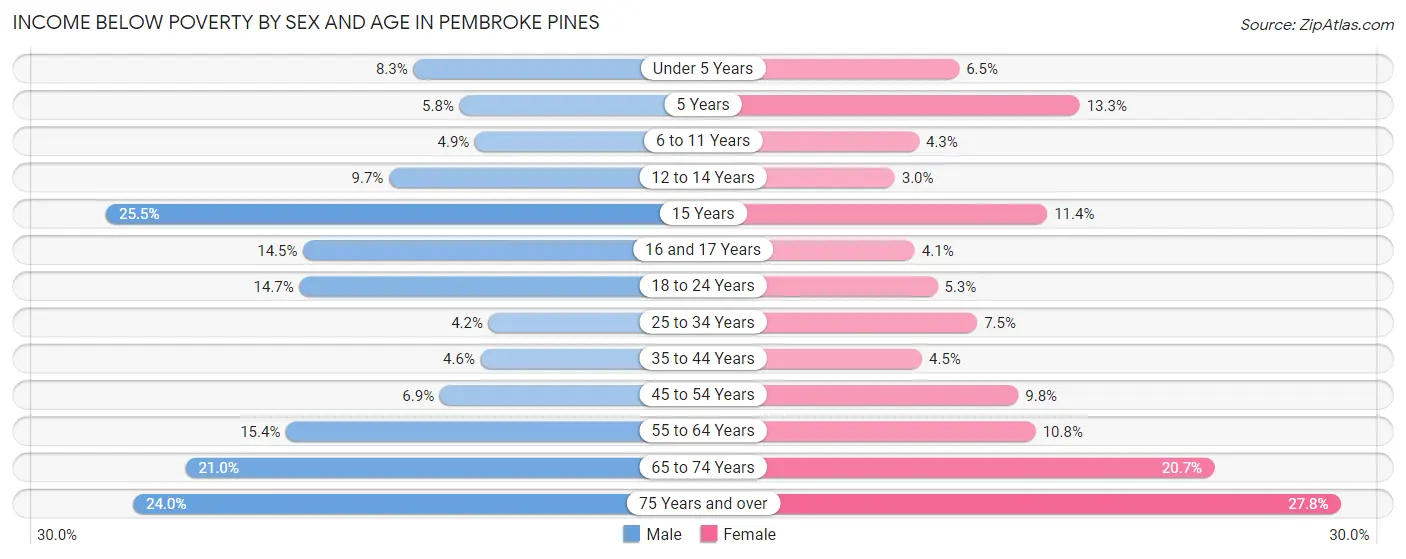
| Age Bracket | Male | Female |
| Under 5 Years | 358 (8.3%) | 239 (6.5%) |
| 5 Years | 38 (5.8%) | 171 (13.3%) |
| 6 to 11 Years | 270 (4.9%) | 264 (4.3%) |
| 12 to 14 Years | 318 (9.7%) | 90 (2.9%) |
| 15 Years | 277 (25.5%) | 121 (11.4%) |
| 16 and 17 Years | 305 (14.5%) | 83 (4.1%) |
| 18 to 24 Years | 1,115 (14.7%) | 347 (5.3%) |
| 25 to 34 Years | 413 (4.2%) | 660 (7.5%) |
| 35 to 44 Years | 510 (4.6%) | 543 (4.5%) |
| 45 to 54 Years | 814 (6.9%) | 1,125 (9.8%) |
| 55 to 64 Years | 1,732 (15.4%) | 1,397 (10.8%) |
| 65 to 74 Years | 1,498 (21.0%) | 2,013 (20.7%) |
| 75 Years and over | 1,386 (24.0%) | 2,630 (27.8%) |
| Total | 9,034 (11.1%) | 9,683 (11.0%) |
Income Above Poverty by Sex and Age in Pembroke Pines
According to the poverty statistics in Pembroke Pines, males aged 25 to 34 years and females aged 12 to 14 years are the age groups that are most secure financially, with 95.9% of males and 97.1% of females in these age groups living above the poverty line.
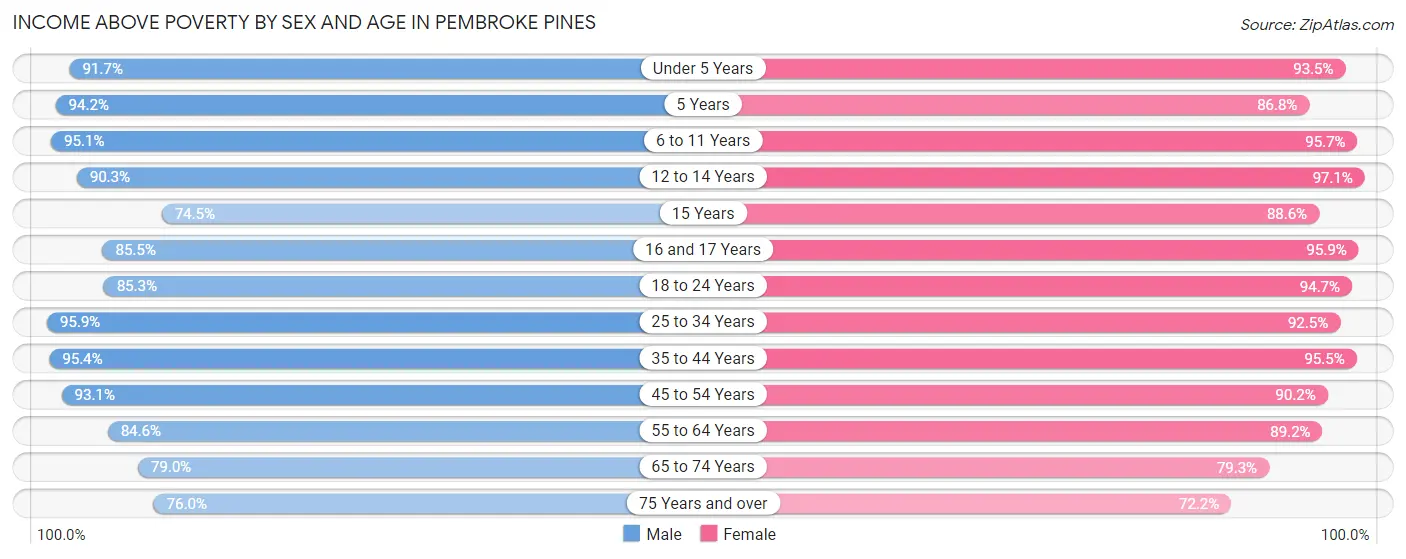
| Age Bracket | Male | Female |
| Under 5 Years | 3,933 (91.7%) | 3,415 (93.5%) |
| 5 Years | 621 (94.2%) | 1,120 (86.8%) |
| 6 to 11 Years | 5,231 (95.1%) | 5,881 (95.7%) |
| 12 to 14 Years | 2,961 (90.3%) | 2,957 (97.1%) |
| 15 Years | 811 (74.5%) | 937 (88.6%) |
| 16 and 17 Years | 1,802 (85.5%) | 1,954 (95.9%) |
| 18 to 24 Years | 6,473 (85.3%) | 6,163 (94.7%) |
| 25 to 34 Years | 9,539 (95.9%) | 8,091 (92.5%) |
| 35 to 44 Years | 10,588 (95.4%) | 11,603 (95.5%) |
| 45 to 54 Years | 11,036 (93.1%) | 10,323 (90.2%) |
| 55 to 64 Years | 9,494 (84.6%) | 11,536 (89.2%) |
| 65 to 74 Years | 5,623 (79.0%) | 7,703 (79.3%) |
| 75 Years and over | 4,399 (76.0%) | 6,844 (72.2%) |
| Total | 72,511 (88.9%) | 78,527 (89.0%) |
Income Below Poverty Among Married-Couple Families in Pembroke Pines
The poverty statistics for married-couple families in Pembroke Pines show that 6.9% or 2,086 of the total 30,328 families live below the poverty line. Families with 5 or more children have the highest poverty rate of 57.1%, comprising of 20 families. On the other hand, families with 1 or 2 children have the lowest poverty rate of 1.7%, which includes 179 families.
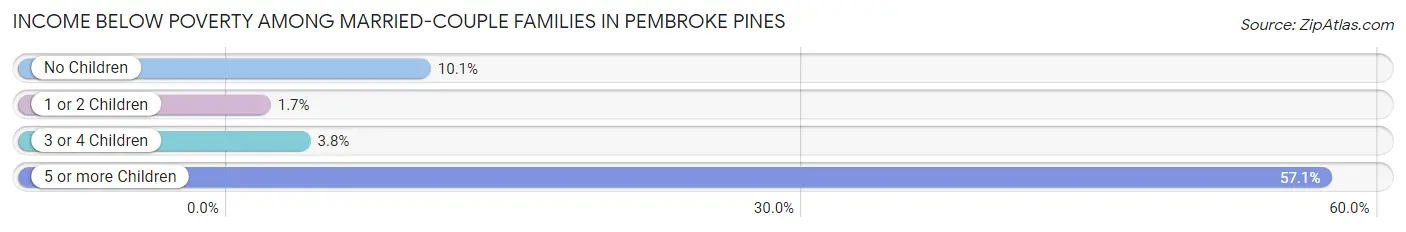
| Children | Above Poverty | Below Poverty |
| No Children | 16,257 (89.9%) | 1,820 (10.1%) |
| 1 or 2 Children | 10,270 (98.3%) | 179 (1.7%) |
| 3 or 4 Children | 1,700 (96.2%) | 67 (3.8%) |
| 5 or more Children | 15 (42.9%) | 20 (57.1%) |
| Total | 28,242 (93.1%) | 2,086 (6.9%) |
Income Below Poverty Among Single-Parent Households in Pembroke Pines
According to the poverty data in Pembroke Pines, 11.7% or 374 single-father households and 12.4% or 1,189 single-mother households are living below the poverty line. Among single-father households, those with no children have the highest poverty rate, with 231 households (13.9%) experiencing poverty. Likewise, among single-mother households, those with 3 or 4 children have the highest poverty rate, with 124 households (36.6%) falling below the poverty line.
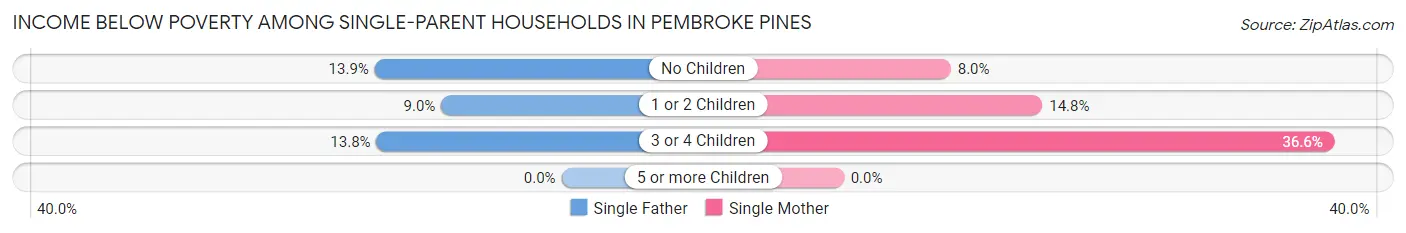
| Children | Single Father | Single Mother |
| No Children | 231 (13.9%) | 360 (8.0%) |
| 1 or 2 Children | 127 (9.0%) | 705 (14.8%) |
| 3 or 4 Children | 16 (13.8%) | 124 (36.6%) |
| 5 or more Children | 0 (0.0%) | 0 (0.0%) |
| Total | 374 (11.7%) | 1,189 (12.4%) |
Income Below Poverty Among Married-Couple vs Single-Parent Households in Pembroke Pines
The poverty data for Pembroke Pines shows that 2,086 of the married-couple family households (6.9%) and 1,563 of the single-parent households (12.2%) are living below the poverty level. Within the married-couple family households, those with 5 or more children have the highest poverty rate, with 20 households (57.1%) falling below the poverty line. Among the single-parent households, those with 3 or 4 children have the highest poverty rate, with 140 household (30.8%) living below poverty.
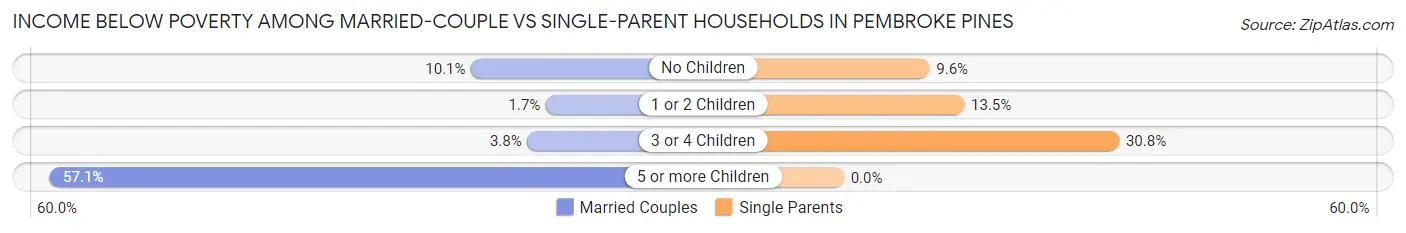
| Children | Married-Couple Families | Single-Parent Households |
| No Children | 1,820 (10.1%) | 591 (9.6%) |
| 1 or 2 Children | 179 (1.7%) | 832 (13.5%) |
| 3 or 4 Children | 67 (3.8%) | 140 (30.8%) |
| 5 or more Children | 20 (57.1%) | 0 (0.0%) |
| Total | 2,086 (6.9%) | 1,563 (12.2%) |
Race in Pembroke Pines
The most populous races in Pembroke Pines are White / Caucasian (86,514 | 50.7%), Hispanic or Latino (80,525 | 47.2%), and Black / African American (36,518 | 21.4%).
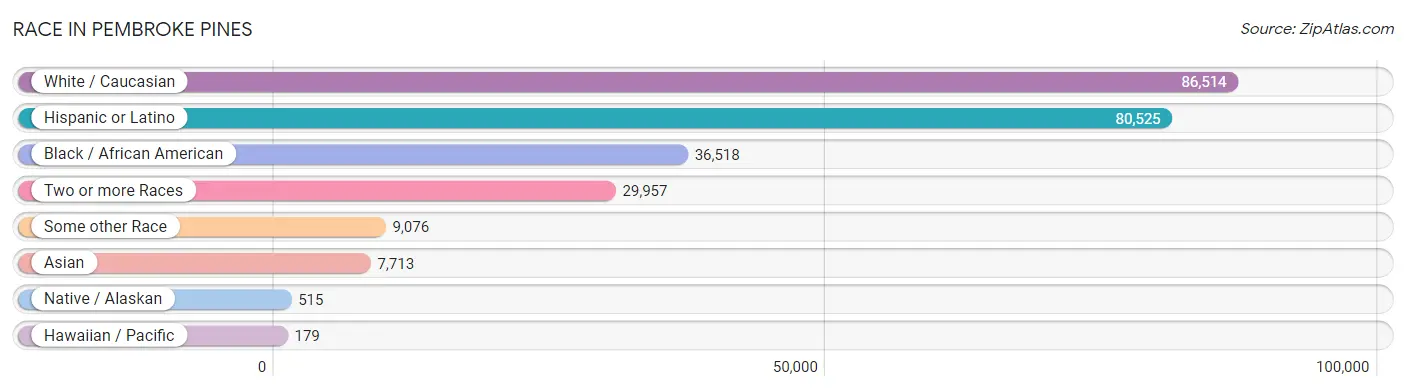
| Race | # Population | % Population |
| Asian | 7,713 | 4.5% |
| Black / African American | 36,518 | 21.4% |
| Hawaiian / Pacific | 179 | 0.1% |
| Hispanic or Latino | 80,525 | 47.2% |
| Native / Alaskan | 515 | 0.3% |
| White / Caucasian | 86,514 | 50.7% |
| Two or more Races | 29,957 | 17.6% |
| Some other Race | 9,076 | 5.3% |
| Total | 170,472 | 100.0% |
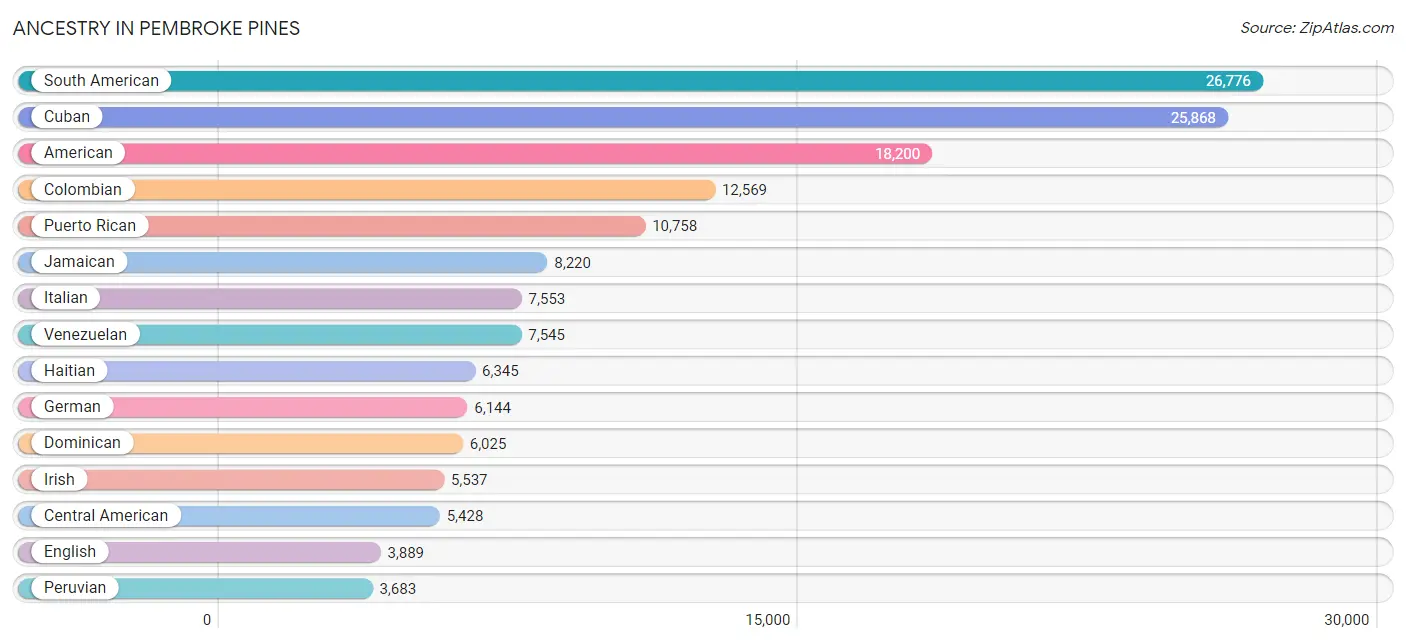
Ancestry in Pembroke Pines
The most populous ancestries reported in Pembroke Pines are South American (26,776 | 15.7%), Cuban (25,868 | 15.2%), American (18,200 | 10.7%), Colombian (12,569 | 7.4%), and Puerto Rican (10,758 | 6.3%), together accounting for 55.2% of all Pembroke Pines residents.
| Ancestry | # Population | % Population |
| African | 1,005 | 0.6% |
| Albanian | 9 | 0.0% |
| American | 18,200 | 10.7% |
| Arab | 977 | 0.6% |
| Argentinean | 648 | 0.4% |
| Armenian | 65 | 0.0% |
| Assyrian / Chaldean / Syriac | 28 | 0.0% |
| Austrian | 317 | 0.2% |
| Bahamian | 1,105 | 0.6% |
| Barbadian | 121 | 0.1% |
| Basque | 37 | 0.0% |
| Belgian | 9 | 0.0% |
| Belizean | 9 | 0.0% |
| Bermudan | 25 | 0.0% |
| Bhutanese | 438 | 0.3% |
| Blackfeet | 187 | 0.1% |
| Bolivian | 66 | 0.0% |
| Brazilian | 829 | 0.5% |
| British | 298 | 0.2% |
| British West Indian | 350 | 0.2% |
| Bulgarian | 24 | 0.0% |
| Burmese | 524 | 0.3% |
| Canadian | 557 | 0.3% |
| Cape Verdean | 51 | 0.0% |
| Central American | 5,428 | 3.2% |
| Central American Indian | 725 | 0.4% |
| Cherokee | 71 | 0.0% |
| Chilean | 498 | 0.3% |
| Chippewa | 13 | 0.0% |
| Colombian | 12,569 | 7.4% |
| Costa Rican | 568 | 0.3% |
| Croatian | 19 | 0.0% |
| Cuban | 25,868 | 15.2% |
| Czech | 165 | 0.1% |
| Czechoslovakian | 48 | 0.0% |
| Danish | 50 | 0.0% |
| Dominican | 6,025 | 3.5% |
| Dutch | 302 | 0.2% |
| Dutch West Indian | 138 | 0.1% |
| Eastern European | 582 | 0.3% |
| Ecuadorian | 1,326 | 0.8% |
| Egyptian | 136 | 0.1% |
| English | 3,889 | 2.3% |
| European | 1,510 | 0.9% |
| Fijian | 118 | 0.1% |
| Filipino | 136 | 0.1% |
| Finnish | 43 | 0.0% |
| French | 1,200 | 0.7% |
| French Canadian | 747 | 0.4% |
| German | 6,144 | 3.6% |
| Ghanaian | 20 | 0.0% |
| Greek | 620 | 0.4% |
| Guatemalan | 843 | 0.5% |
| Guyanese | 390 | 0.2% |
| Haitian | 6,345 | 3.7% |
| Honduran | 925 | 0.5% |
| Hungarian | 628 | 0.4% |
| Indian (Asian) | 3,120 | 1.8% |
| Iranian | 33 | 0.0% |
| Irish | 5,537 | 3.3% |
| Israeli | 55 | 0.0% |
| Italian | 7,553 | 4.4% |
| Jamaican | 8,220 | 4.8% |
| Japanese | 13 | 0.0% |
| Jordanian | 118 | 0.1% |
| Korean | 1,448 | 0.9% |
| Laotian | 29 | 0.0% |
| Latvian | 110 | 0.1% |
| Lebanese | 378 | 0.2% |
| Lithuanian | 171 | 0.1% |
| Malaysian | 133 | 0.1% |
| Mexican | 2,335 | 1.4% |
| Moroccan | 25 | 0.0% |
| Nicaraguan | 1,875 | 1.1% |
| Nigerian | 472 | 0.3% |
| Northern European | 70 | 0.0% |
| Norwegian | 501 | 0.3% |
| Pakistani | 101 | 0.1% |
| Palestinian | 63 | 0.0% |
| Panamanian | 471 | 0.3% |
| Pennsylvania German | 6 | 0.0% |
| Peruvian | 3,683 | 2.2% |
| Polish | 1,885 | 1.1% |
| Portuguese | 709 | 0.4% |
| Puerto Rican | 10,758 | 6.3% |
| Romanian | 354 | 0.2% |
| Russian | 1,380 | 0.8% |
| Salvadoran | 746 | 0.4% |
| Scandinavian | 58 | 0.0% |
| Scotch-Irish | 105 | 0.1% |
| Scottish | 776 | 0.5% |
| Seminole | 117 | 0.1% |
| Serbian | 19 | 0.0% |
| Slavic | 19 | 0.0% |
| Slovak | 161 | 0.1% |
| Slovene | 9 | 0.0% |
| South African | 81 | 0.1% |
| South American | 26,776 | 15.7% |
| South American Indian | 287 | 0.2% |
| Spaniard | 1,201 | 0.7% |
| Spanish | 356 | 0.2% |
| Sri Lankan | 506 | 0.3% |
| Subsaharan African | 1,629 | 1.0% |
| Swedish | 489 | 0.3% |
| Swiss | 302 | 0.2% |
| Syrian | 96 | 0.1% |
| Thai | 2,906 | 1.7% |
| Tongan | 136 | 0.1% |
| Trinidadian and Tobagonian | 918 | 0.5% |
| Turkish | 142 | 0.1% |
| U.S. Virgin Islander | 70 | 0.0% |
| Ukrainian | 208 | 0.1% |
| Uruguayan | 176 | 0.1% |
| Venezuelan | 7,545 | 4.4% |
| Welsh | 76 | 0.0% |
| West Indian | 843 | 0.5% |
| Yugoslavian | 44 | 0.0% | View All 117 Rows |
Immigrants in Pembroke Pines
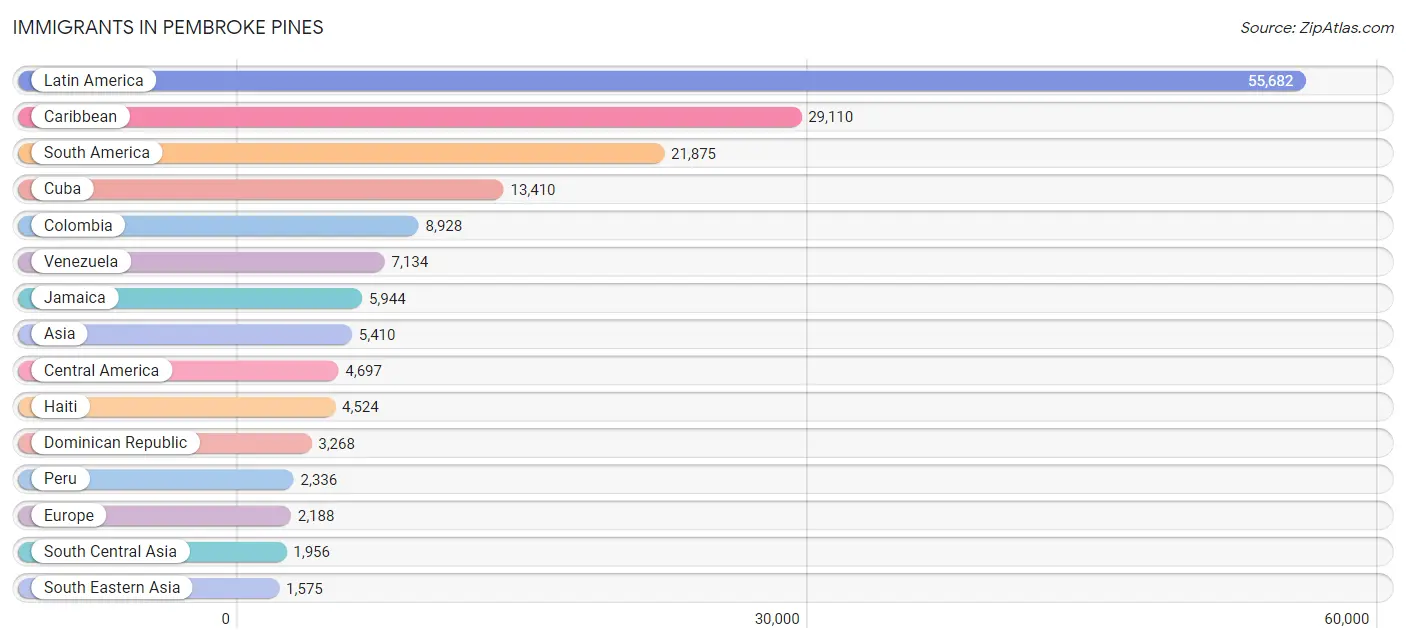
The most numerous immigrant groups reported in Pembroke Pines came from Latin America (55,682 | 32.7%), Caribbean (29,110 | 17.1%), South America (21,875 | 12.8%), Cuba (13,410 | 7.9%), and Colombia (8,928 | 5.2%), together accounting for 75.7% of all Pembroke Pines residents.
| Immigration Origin | # Population | % Population |
| Africa | 585 | 0.3% |
| Argentina | 589 | 0.4% |
| Asia | 5,410 | 3.2% |
| Austria | 15 | 0.0% |
| Bahamas | 21 | 0.0% |
| Bangladesh | 90 | 0.1% |
| Barbados | 296 | 0.2% |
| Belarus | 54 | 0.0% |
| Belize | 16 | 0.0% |
| Bolivia | 66 | 0.0% |
| Brazil | 814 | 0.5% |
| Bulgaria | 24 | 0.0% |
| Cambodia | 13 | 0.0% |
| Canada | 1,009 | 0.6% |
| Caribbean | 29,110 | 17.1% |
| Central America | 4,697 | 2.8% |
| Chile | 207 | 0.1% |
| China | 1,237 | 0.7% |
| Colombia | 8,928 | 5.2% |
| Costa Rica | 465 | 0.3% |
| Cuba | 13,410 | 7.9% |
| Czechoslovakia | 28 | 0.0% |
| Dominica | 327 | 0.2% |
| Dominican Republic | 3,268 | 1.9% |
| Eastern Africa | 54 | 0.0% |
| Eastern Asia | 1,524 | 0.9% |
| Eastern Europe | 727 | 0.4% |
| Ecuador | 941 | 0.5% |
| Egypt | 77 | 0.1% |
| El Salvador | 425 | 0.3% |
| England | 216 | 0.1% |
| Ethiopia | 11 | 0.0% |
| Europe | 2,188 | 1.3% |
| France | 60 | 0.0% |
| Germany | 146 | 0.1% |
| Ghana | 20 | 0.0% |
| Greece | 82 | 0.1% |
| Grenada | 46 | 0.0% |
| Guatemala | 530 | 0.3% |
| Guyana | 526 | 0.3% |
| Haiti | 4,524 | 2.6% |
| Honduras | 689 | 0.4% |
| Hong Kong | 166 | 0.1% |
| Hungary | 146 | 0.1% |
| India | 1,296 | 0.8% |
| Iran | 32 | 0.0% |
| Iraq | 8 | 0.0% |
| Ireland | 33 | 0.0% |
| Israel | 59 | 0.0% |
| Italy | 258 | 0.2% |
| Jamaica | 5,944 | 3.5% |
| Japan | 55 | 0.0% |
| Jordan | 107 | 0.1% |
| Korea | 232 | 0.1% |
| Kuwait | 4 | 0.0% |
| Laos | 88 | 0.1% |
| Latin America | 55,682 | 32.7% |
| Lebanon | 41 | 0.0% |
| Lithuania | 16 | 0.0% |
| Malaysia | 10 | 0.0% |
| Mexico | 863 | 0.5% |
| Moldova | 57 | 0.0% |
| Morocco | 33 | 0.0% |
| Nepal | 13 | 0.0% |
| Netherlands | 54 | 0.0% |
| Nicaragua | 1,395 | 0.8% |
| Nigeria | 308 | 0.2% |
| Northern Africa | 110 | 0.1% |
| Northern Europe | 455 | 0.3% |
| Norway | 11 | 0.0% |
| Oceania | 43 | 0.0% |
| Pakistan | 450 | 0.3% |
| Panama | 314 | 0.2% |
| Peru | 2,336 | 1.4% |
| Philippines | 811 | 0.5% |
| Poland | 141 | 0.1% |
| Portugal | 39 | 0.0% |
| Romania | 144 | 0.1% |
| Russia | 79 | 0.1% |
| Saudi Arabia | 14 | 0.0% |
| Serbia | 19 | 0.0% |
| Singapore | 71 | 0.0% |
| South Africa | 93 | 0.1% |
| South America | 21,875 | 12.8% |
| South Central Asia | 1,956 | 1.1% |
| South Eastern Asia | 1,575 | 0.9% |
| Southern Europe | 651 | 0.4% |
| Spain | 272 | 0.2% |
| Sri Lanka | 15 | 0.0% |
| Sweden | 111 | 0.1% |
| Switzerland | 44 | 0.0% |
| Syria | 54 | 0.0% |
| Taiwan | 87 | 0.1% |
| Thailand | 45 | 0.0% |
| Trinidad and Tobago | 770 | 0.4% |
| Turkey | 43 | 0.0% |
| Ukraine | 9 | 0.0% |
| Uruguay | 217 | 0.1% |
| Uzbekistan | 60 | 0.0% |
| Venezuela | 7,134 | 4.2% |
| Vietnam | 537 | 0.3% |
| West Indies | 36 | 0.0% |
| Western Africa | 328 | 0.2% |
| Western Asia | 345 | 0.2% |
| Western Europe | 319 | 0.2% |
| Zimbabwe | 43 | 0.0% | View All 106 Rows |
Sex and Age in Pembroke Pines
Sex and Age in Pembroke Pines
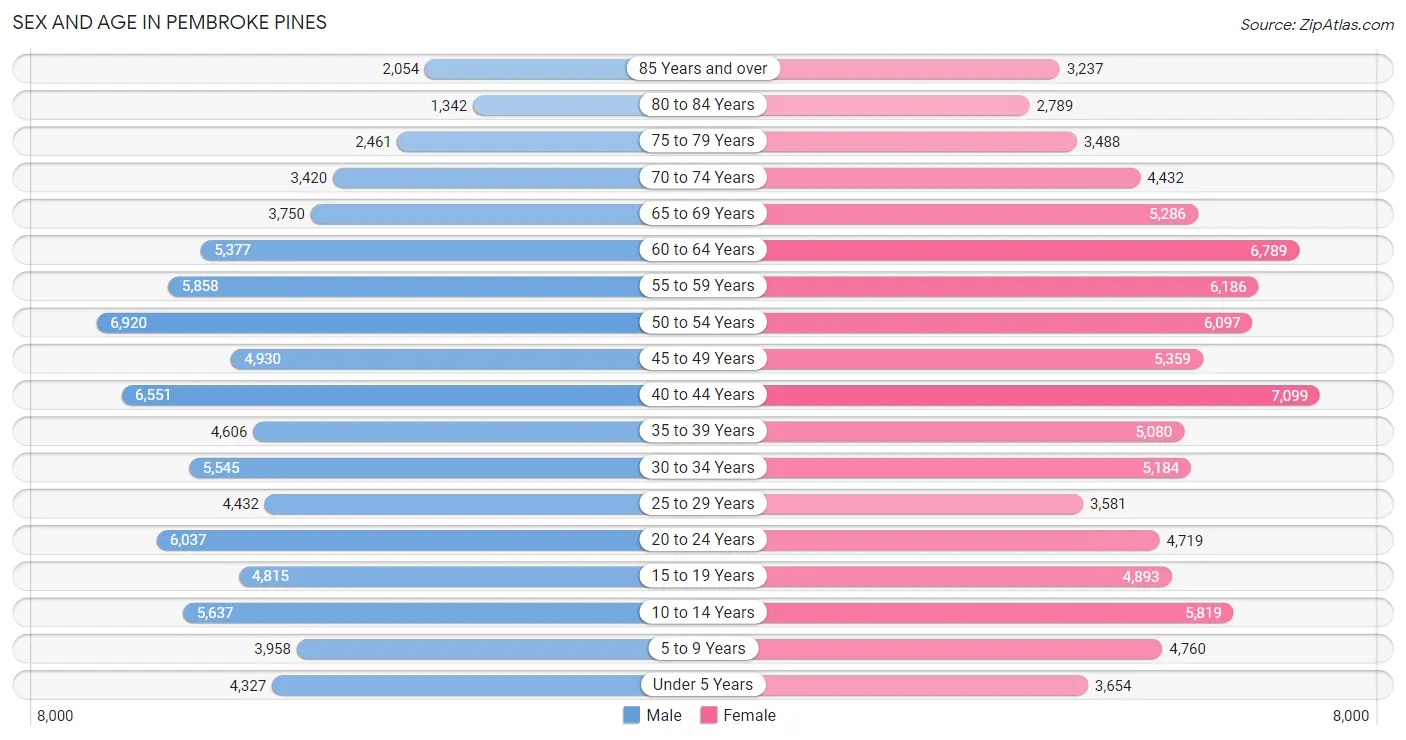
The most populous age groups in Pembroke Pines are 50 to 54 Years (6,920 | 8.4%) for men and 40 to 44 Years (7,099 | 8.0%) for women.
| Age Bracket | Male | Female |
| Under 5 Years | 4,327 (5.3%) | 3,654 (4.1%) |
| 5 to 9 Years | 3,958 (4.8%) | 4,760 (5.4%) |
| 10 to 14 Years | 5,637 (6.9%) | 5,819 (6.6%) |
| 15 to 19 Years | 4,815 (5.9%) | 4,893 (5.5%) |
| 20 to 24 Years | 6,037 (7.4%) | 4,719 (5.3%) |
| 25 to 29 Years | 4,432 (5.4%) | 3,581 (4.1%) |
| 30 to 34 Years | 5,545 (6.8%) | 5,184 (5.9%) |
| 35 to 39 Years | 4,606 (5.6%) | 5,080 (5.7%) |
| 40 to 44 Years | 6,551 (8.0%) | 7,099 (8.0%) |
| 45 to 49 Years | 4,930 (6.0%) | 5,359 (6.1%) |
| 50 to 54 Years | 6,920 (8.4%) | 6,097 (6.9%) |
| 55 to 59 Years | 5,858 (7.1%) | 6,186 (7.0%) |
| 60 to 64 Years | 5,377 (6.6%) | 6,789 (7.7%) |
| 65 to 69 Years | 3,750 (4.6%) | 5,286 (6.0%) |
| 70 to 74 Years | 3,420 (4.2%) | 4,432 (5.0%) |
| 75 to 79 Years | 2,461 (3.0%) | 3,488 (3.9%) |
| 80 to 84 Years | 1,342 (1.6%) | 2,789 (3.2%) |
| 85 Years and over | 2,054 (2.5%) | 3,237 (3.7%) |
| Total | 82,020 (100.0%) | 88,452 (100.0%) |
Families and Households in Pembroke Pines
Median Family Size in Pembroke Pines
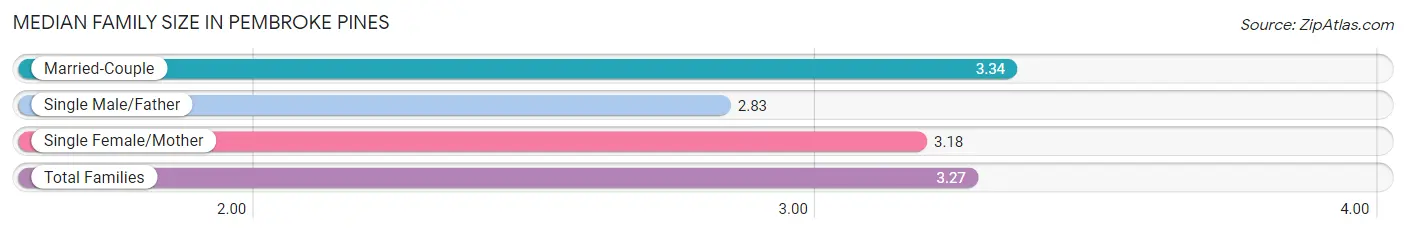
The median family size in Pembroke Pines is 3.27 persons per family, with married-couple families (30,328 | 70.3%) accounting for the largest median family size of 3.34 persons per family. On the other hand, single male/father families (3,194 | 7.4%) represent the smallest median family size with 2.83 persons per family.
| Family Type | # Families | Family Size |
| Married-Couple | 30,328 (70.3%) | 3.34 |
| Single Male/Father | 3,194 (7.4%) | 2.83 |
| Single Female/Mother | 9,614 (22.3%) | 3.18 |
| Total Families | 43,136 (100.0%) | 3.27 |
Median Household Size in Pembroke Pines
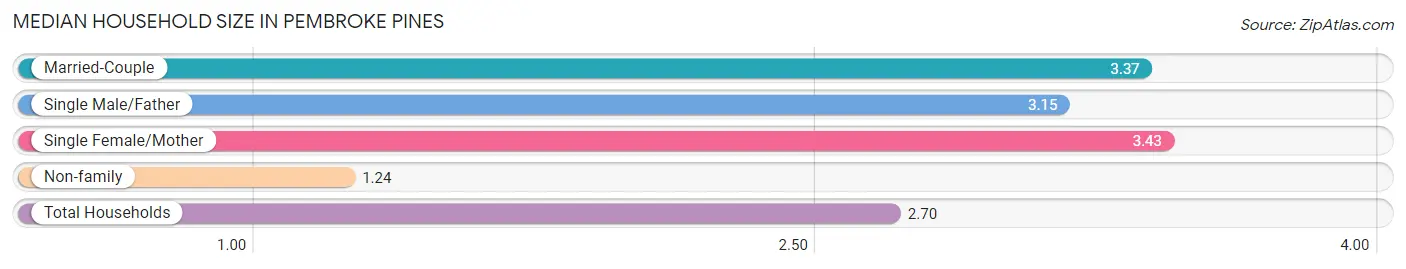
The median household size in Pembroke Pines is 2.70 persons per household, with single female/mother households (9,614 | 15.3%) accounting for the largest median household size of 3.43 persons per household. non-family households (19,671 | 31.3%) represent the smallest median household size with 1.24 persons per household.
| Household Type | # Households | Household Size |
| Married-Couple | 30,328 (48.3%) | 3.37 |
| Single Male/Father | 3,194 (5.1%) | 3.15 |
| Single Female/Mother | 9,614 (15.3%) | 3.43 |
| Non-family | 19,671 (31.3%) | 1.24 |
| Total Households | 62,807 (100.0%) | 2.70 |
Household Size by Marriage Status in Pembroke Pines
Out of a total of 62,807 households in Pembroke Pines, 43,136 (68.7%) are family households, while 19,671 (31.3%) are nonfamily households. The most numerous type of family households are 2-person households, comprising 16,567, and the most common type of nonfamily households are 1-person households, comprising 15,954.
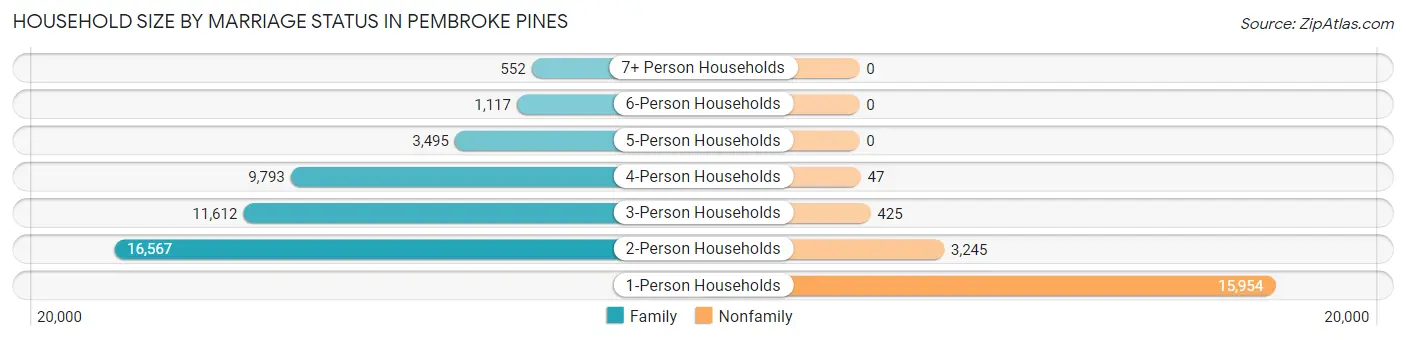
| Household Size | Family Households | Nonfamily Households |
| 1-Person Households | - | 15,954 (25.4%) |
| 2-Person Households | 16,567 (26.4%) | 3,245 (5.2%) |
| 3-Person Households | 11,612 (18.5%) | 425 (0.7%) |
| 4-Person Households | 9,793 (15.6%) | 47 (0.1%) |
| 5-Person Households | 3,495 (5.6%) | 0 (0.0%) |
| 6-Person Households | 1,117 (1.8%) | 0 (0.0%) |
| 7+ Person Households | 552 (0.9%) | 0 (0.0%) |
| Total | 43,136 (68.7%) | 19,671 (31.3%) |
Female Fertility in Pembroke Pines
Fertility by Age in Pembroke Pines
Average fertility rate in Pembroke Pines is 35.0 births per 1,000 women. Women in the age bracket of 20 to 34 years have the highest fertility rate with 63.0 births per 1,000 women. Women in the age bracket of 20 to 34 years acount for 64.2% of all women with births.
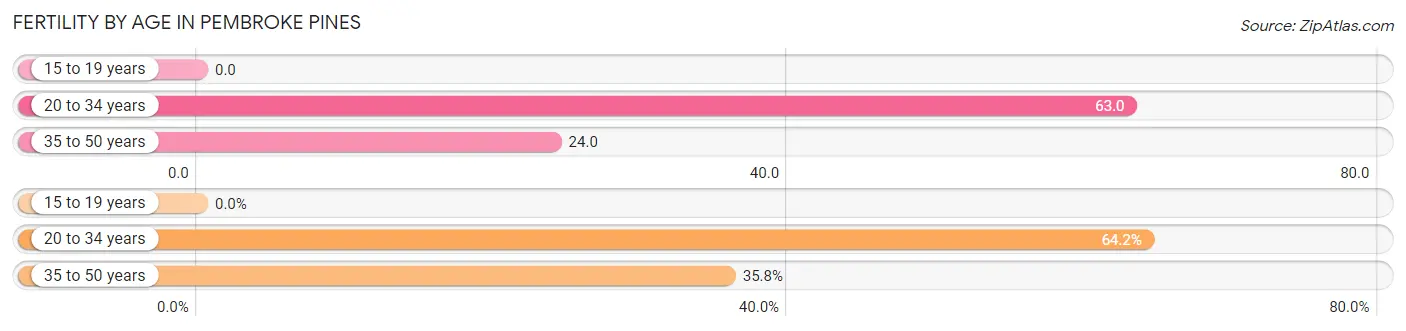
| Age Bracket | Women with Births | Births / 1,000 Women |
| 15 to 19 years | 0 (0.0%) | 0.0 |
| 20 to 34 years | 853 (64.2%) | 63.0 |
| 35 to 50 years | 476 (35.8%) | 24.0 |
| Total | 1,329 (100.0%) | 35.0 |
Fertility by Age by Marriage Status in Pembroke Pines
63.5% of women with births (1,329) in Pembroke Pines are married. The highest percentage of unmarried women with births falls into 20 to 34 years age bracket with 44.8% of them unmarried at the time of birth, while the lowest percentage of unmarried women with births belong to 35 to 50 years age bracket with 21.6% of them unmarried.
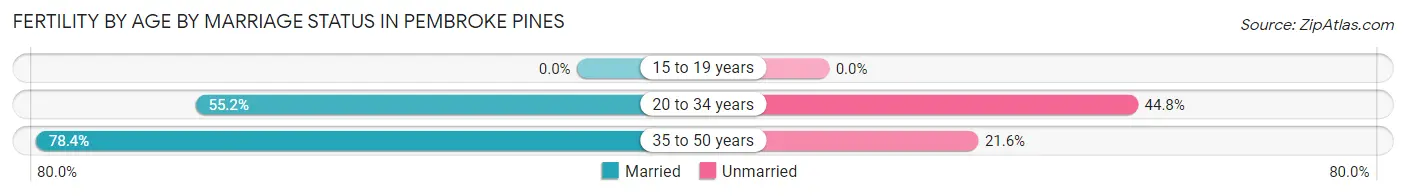
| Age Bracket | Married | Unmarried |
| 15 to 19 years | 0 (0.0%) | 0 (0.0%) |
| 20 to 34 years | 471 (55.2%) | 382 (44.8%) |
| 35 to 50 years | 373 (78.4%) | 103 (21.6%) |
| Total | 844 (63.5%) | 485 (36.5%) |
Fertility by Education in Pembroke Pines
Average fertility rate in Pembroke Pines is 35.0 births per 1,000 women. Women with the education attainment of graduate degree have the highest fertility rate of 49.0 births per 1,000 women, while women with the education attainment of less than high school have the lowest fertility at 3.0 births per 1,000 women. Women with the education attainment of college or associate's degree represent 37.2% of all women with births.
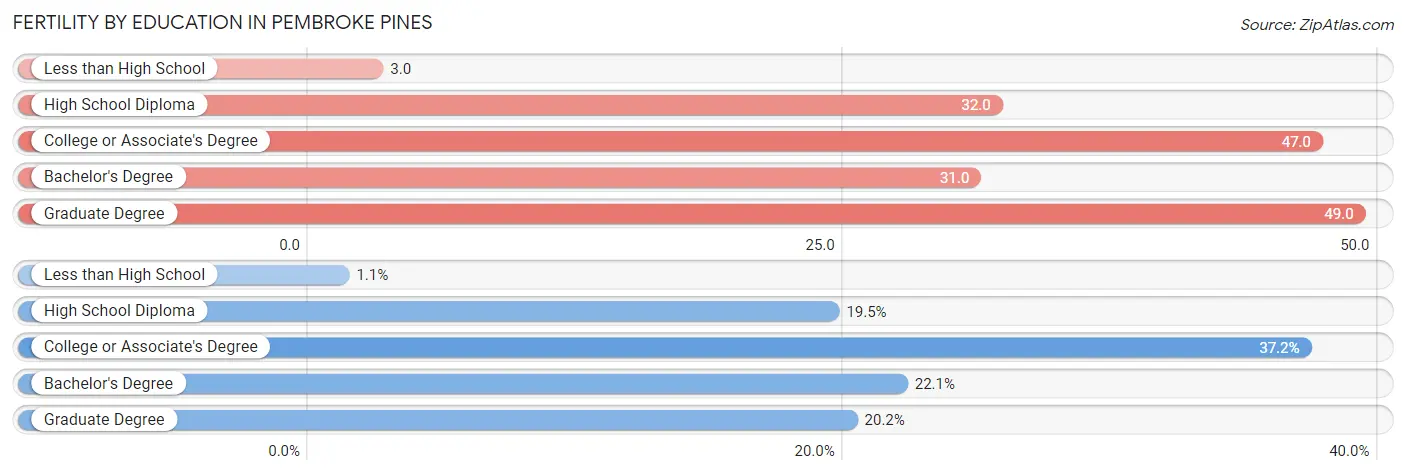
| Educational Attainment | Women with Births | Births / 1,000 Women |
| Less than High School | 15 (1.1%) | 3.0 |
| High School Diploma | 259 (19.5%) | 32.0 |
| College or Associate's Degree | 494 (37.2%) | 47.0 |
| Bachelor's Degree | 293 (22.1%) | 31.0 |
| Graduate Degree | 268 (20.2%) | 49.0 |
| Total | 1,329 (100.0%) | 35.0 |
Fertility by Education by Marriage Status in Pembroke Pines
36.5% of women with births in Pembroke Pines are unmarried. Women with the educational attainment of high school diploma are most likely to be married with 80.7% of them married at childbirth, while women with the educational attainment of less than high school are least likely to be married with 100.0% of them unmarried at childbirth.
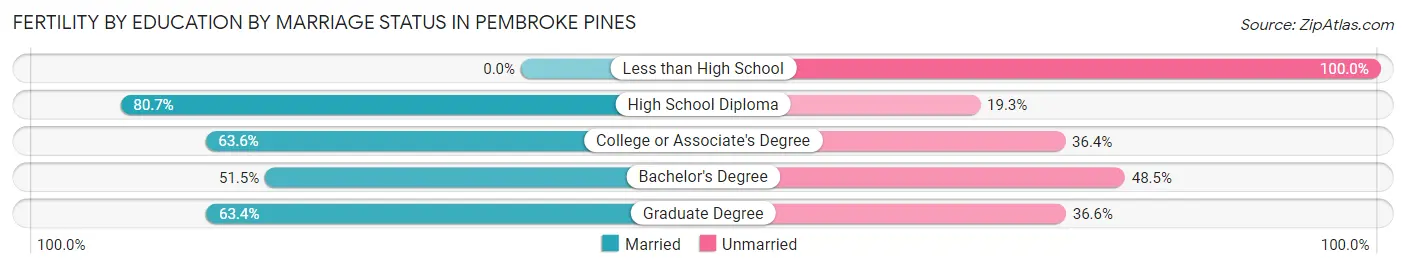
| Educational Attainment | Married | Unmarried |
| Less than High School | 0 (0.0%) | 15 (100.0%) |
| High School Diploma | 209 (80.7%) | 50 (19.3%) |
| College or Associate's Degree | 314 (63.6%) | 180 (36.4%) |
| Bachelor's Degree | 151 (51.5%) | 142 (48.5%) |
| Graduate Degree | 170 (63.4%) | 98 (36.6%) |
| Total | 844 (63.5%) | 485 (36.5%) |
Employment Characteristics in Pembroke Pines
Employment by Class of Employer in Pembroke Pines
Among the 81,803 employed individuals in Pembroke Pines, private company employees (56,261 | 68.8%), local government employees (7,497 | 9.2%), and not-for-profit organizations (5,821 | 7.1%) make up the most common classes of employment.
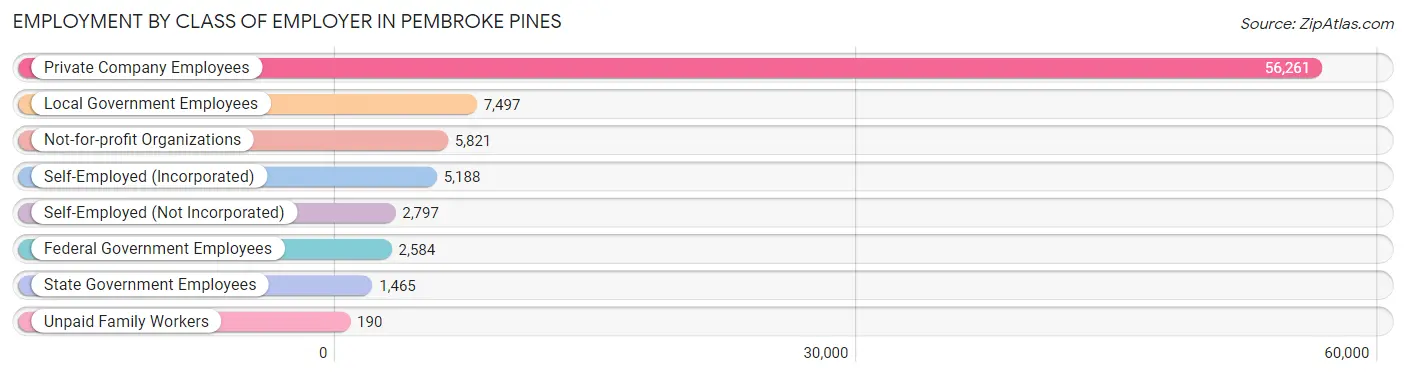
| Employer Class | # Employees | % Employees |
| Private Company Employees | 56,261 | 68.8% |
| Self-Employed (Incorporated) | 5,188 | 6.3% |
| Self-Employed (Not Incorporated) | 2,797 | 3.4% |
| Not-for-profit Organizations | 5,821 | 7.1% |
| Local Government Employees | 7,497 | 9.2% |
| State Government Employees | 1,465 | 1.8% |
| Federal Government Employees | 2,584 | 3.2% |
| Unpaid Family Workers | 190 | 0.2% |
| Total | 81,803 | 100.0% |
Employment Status by Age in Pembroke Pines
According to the labor force statistics for Pembroke Pines, out of the total population over 16 years of age (140,165), 63.0% or 88,304 individuals are in the labor force, with 4.7% or 4,150 of them unemployed. The age group with the highest labor force participation rate is 35 to 44 years, with 88.9% or 20,746 individuals in the labor force. Within the labor force, the 16 to 19 years age range has the highest percentage of unemployed individuals, with 18.5% or 369 of them being unemployed.
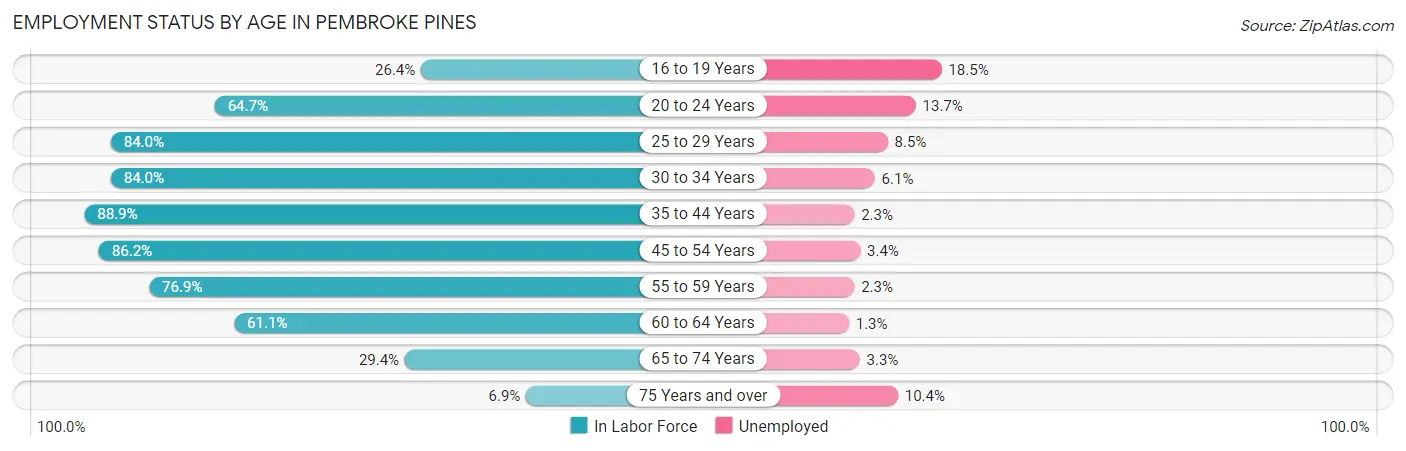
| Age Bracket | In Labor Force | Unemployed |
| 16 to 19 Years | 1,995 (26.4%) | 369 (18.5%) |
| 20 to 24 Years | 6,959 (64.7%) | 953 (13.7%) |
| 25 to 29 Years | 6,731 (84.0%) | 572 (8.5%) |
| 30 to 34 Years | 9,012 (84.0%) | 550 (6.1%) |
| 35 to 44 Years | 20,746 (88.9%) | 477 (2.3%) |
| 45 to 54 Years | 20,090 (86.2%) | 683 (3.4%) |
| 55 to 59 Years | 9,262 (76.9%) | 213 (2.3%) |
| 60 to 64 Years | 7,433 (61.1%) | 97 (1.3%) |
| 65 to 74 Years | 4,965 (29.4%) | 164 (3.3%) |
| 75 Years and over | 1,061 (6.9%) | 110 (10.4%) |
| Total | 88,304 (63.0%) | 4,150 (4.7%) |
Employment Status by Educational Attainment in Pembroke Pines
According to labor force statistics for Pembroke Pines, 81.8% of individuals (73,288) out of the total population between 25 and 64 years of age (89,594) are in the labor force, with 3.5% or 2,565 of them being unemployed. The group with the highest labor force participation rate are those with the educational attainment of bachelor's degree or higher, with 88.2% or 31,395 individuals in the labor force. Within the labor force, individuals with high school diploma education have the highest percentage of unemployment, with 5.2% or 930 of them being unemployed.
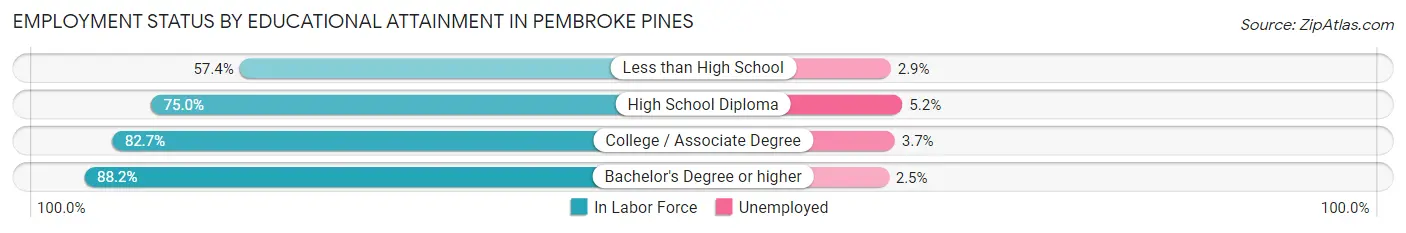
| Educational Attainment | In Labor Force | Unemployed |
| Less than High School | 2,085 (57.4%) | 105 (2.9%) |
| High School Diploma | 17,892 (75.0%) | 1,241 (5.2%) |
| College / Associate Degree | 21,925 (82.7%) | 981 (3.7%) |
| Bachelor's Degree or higher | 31,395 (88.2%) | 890 (2.5%) |
| Total | 73,288 (81.8%) | 3,136 (3.5%) |
Employment Occupations by Sex in Pembroke Pines
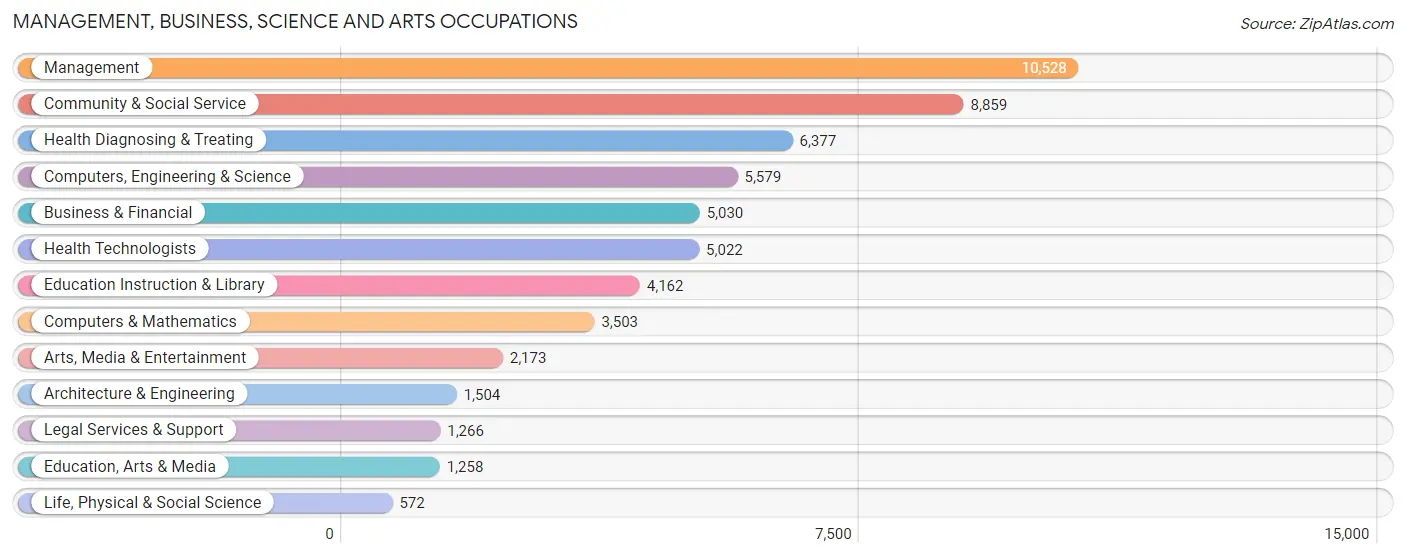
Management, Business, Science and Arts Occupations
The most common Management, Business, Science and Arts occupations in Pembroke Pines are Management (10,528 | 12.6%), Community & Social Service (8,859 | 10.6%), Health Diagnosing & Treating (6,377 | 7.6%), Computers, Engineering & Science (5,579 | 6.7%), and Business & Financial (5,030 | 6.0%).
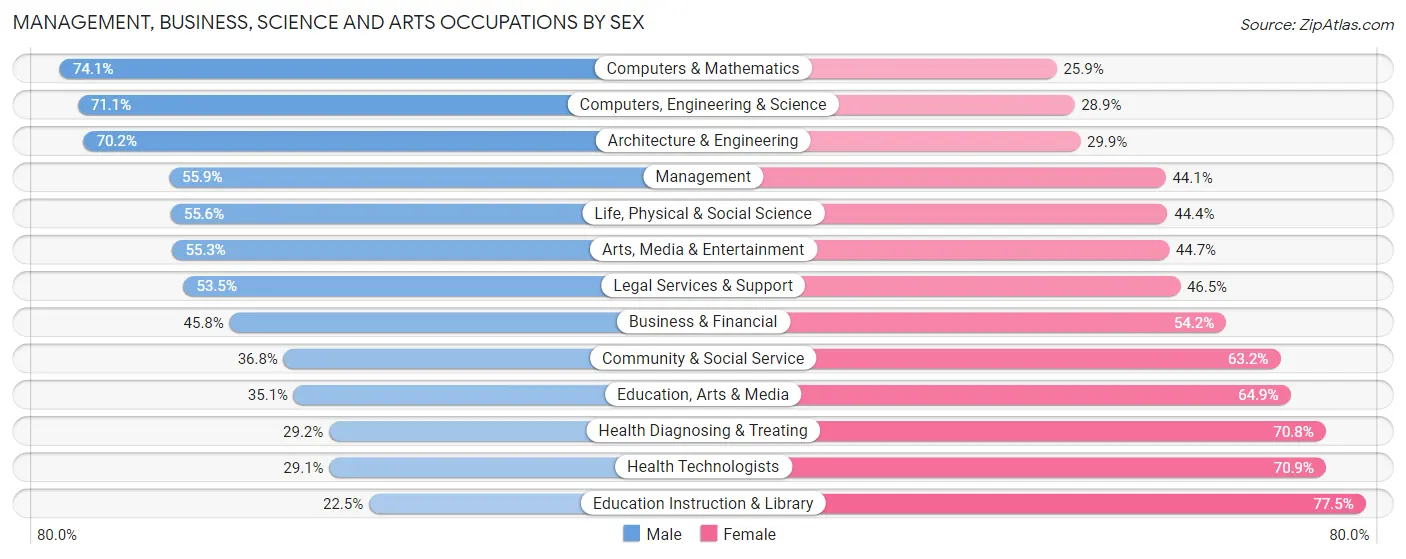
Management, Business, Science and Arts Occupations by Sex
Within the Management, Business, Science and Arts occupations in Pembroke Pines, the most male-oriented occupations are Computers & Mathematics (74.1%), Computers, Engineering & Science (71.1%), and Architecture & Engineering (70.2%), while the most female-oriented occupations are Education Instruction & Library (77.5%), Health Technologists (70.9%), and Health Diagnosing & Treating (70.8%).
| Occupation | Male | Female |
| Management | 5,884 (55.9%) | 4,644 (44.1%) |
| Business & Financial | 2,303 (45.8%) | 2,727 (54.2%) |
| Computers, Engineering & Science | 3,968 (71.1%) | 1,611 (28.9%) |
| Computers & Mathematics | 2,595 (74.1%) | 908 (25.9%) |
| Architecture & Engineering | 1,055 (70.2%) | 449 (29.8%) |
| Life, Physical & Social Science | 318 (55.6%) | 254 (44.4%) |
| Community & Social Service | 3,257 (36.8%) | 5,602 (63.2%) |
| Education, Arts & Media | 441 (35.1%) | 817 (64.9%) |
| Legal Services & Support | 677 (53.5%) | 589 (46.5%) |
| Education Instruction & Library | 937 (22.5%) | 3,225 (77.5%) |
| Arts, Media & Entertainment | 1,202 (55.3%) | 971 (44.7%) |
| Health Diagnosing & Treating | 1,861 (29.2%) | 4,516 (70.8%) |
| Health Technologists | 1,463 (29.1%) | 3,559 (70.9%) |
| Total (Category) | 17,273 (47.5%) | 19,100 (52.5%) |
| Total (Overall) | 43,492 (51.9%) | 40,252 (48.1%) |
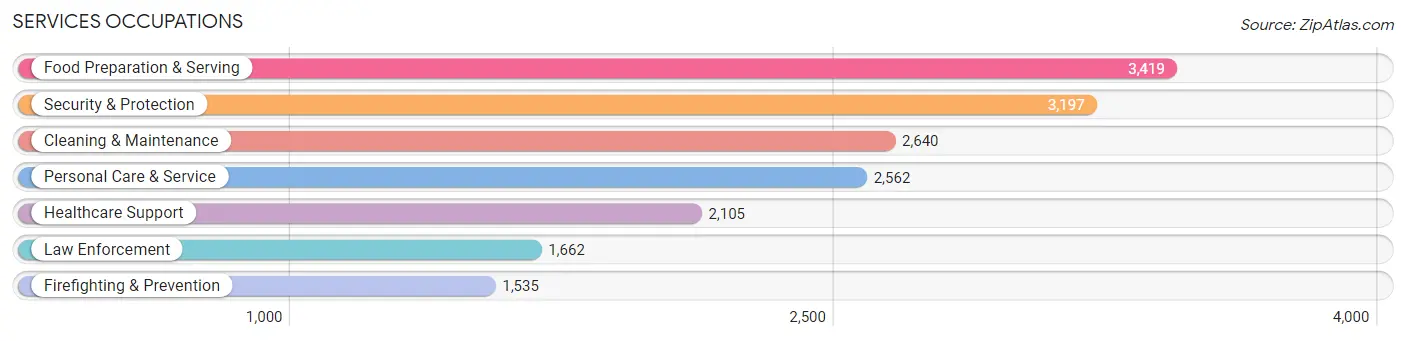
Services Occupations
The most common Services occupations in Pembroke Pines are Food Preparation & Serving (3,419 | 4.1%), Security & Protection (3,197 | 3.8%), Cleaning & Maintenance (2,640 | 3.2%), Personal Care & Service (2,562 | 3.1%), and Healthcare Support (2,105 | 2.5%).
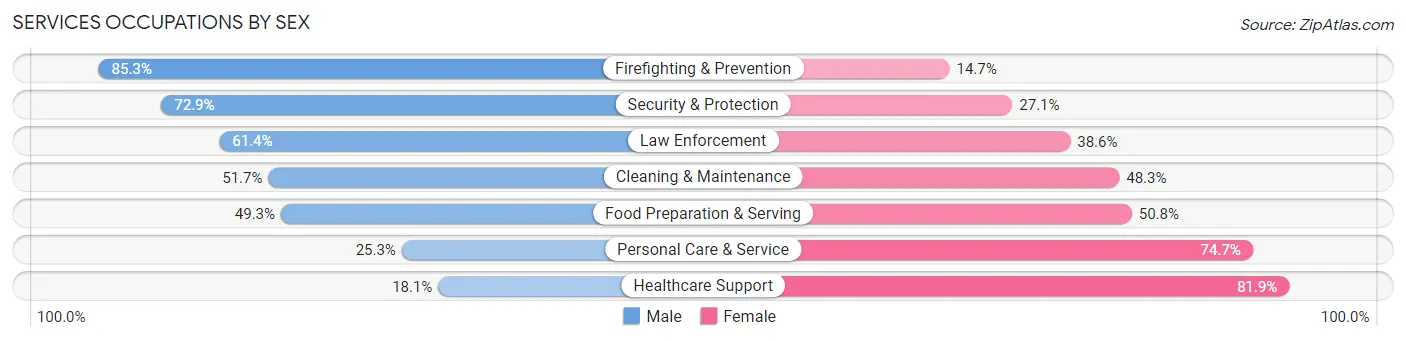
Services Occupations by Sex
Within the Services occupations in Pembroke Pines, the most male-oriented occupations are Firefighting & Prevention (85.3%), Security & Protection (72.9%), and Law Enforcement (61.4%), while the most female-oriented occupations are Healthcare Support (81.9%), Personal Care & Service (74.7%), and Food Preparation & Serving (50.7%).
| Occupation | Male | Female |
| Healthcare Support | 381 (18.1%) | 1,724 (81.9%) |
| Security & Protection | 2,331 (72.9%) | 866 (27.1%) |
| Firefighting & Prevention | 1,310 (85.3%) | 225 (14.7%) |
| Law Enforcement | 1,021 (61.4%) | 641 (38.6%) |
| Food Preparation & Serving | 1,684 (49.2%) | 1,735 (50.7%) |
| Cleaning & Maintenance | 1,366 (51.7%) | 1,274 (48.3%) |
| Personal Care & Service | 649 (25.3%) | 1,913 (74.7%) |
| Total (Category) | 6,411 (46.1%) | 7,512 (53.9%) |
| Total (Overall) | 43,492 (51.9%) | 40,252 (48.1%) |
Sales and Office Occupations
The most common Sales and Office occupations in Pembroke Pines are Office & Administration (11,056 | 13.2%), and Sales & Related (10,191 | 12.2%).

Sales and Office Occupations by Sex
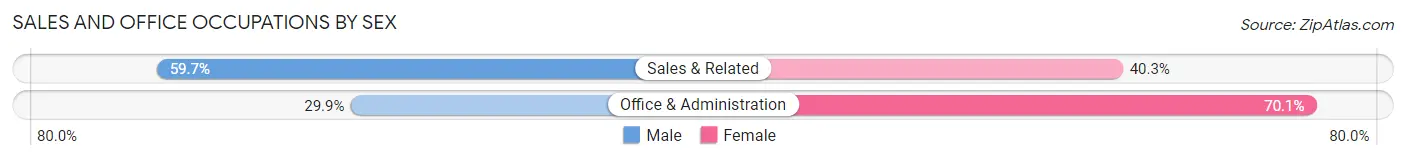
| Occupation | Male | Female |
| Sales & Related | 6,081 (59.7%) | 4,110 (40.3%) |
| Office & Administration | 3,305 (29.9%) | 7,751 (70.1%) |
| Total (Category) | 9,386 (44.2%) | 11,861 (55.8%) |
| Total (Overall) | 43,492 (51.9%) | 40,252 (48.1%) |
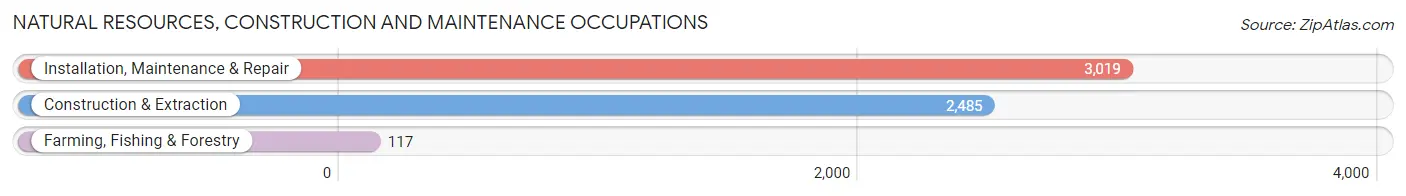
Natural Resources, Construction and Maintenance Occupations
The most common Natural Resources, Construction and Maintenance occupations in Pembroke Pines are Installation, Maintenance & Repair (3,019 | 3.6%), Construction & Extraction (2,485 | 3.0%), and Farming, Fishing & Forestry (117 | 0.1%).
Natural Resources, Construction and Maintenance Occupations by Sex
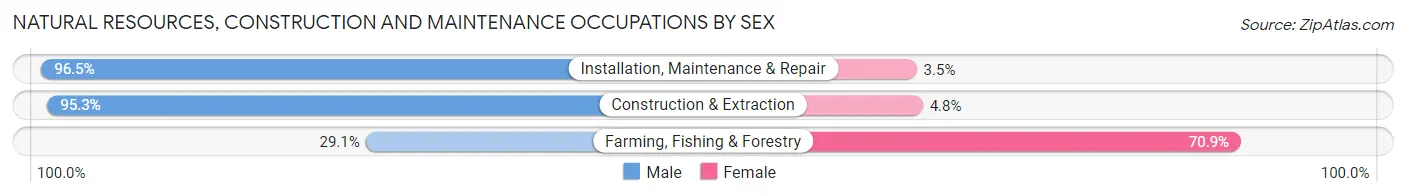
| Occupation | Male | Female |
| Farming, Fishing & Forestry | 34 (29.1%) | 83 (70.9%) |
| Construction & Extraction | 2,367 (95.3%) | 118 (4.8%) |
| Installation, Maintenance & Repair | 2,914 (96.5%) | 105 (3.5%) |
| Total (Category) | 5,315 (94.6%) | 306 (5.4%) |
| Total (Overall) | 43,492 (51.9%) | 40,252 (48.1%) |
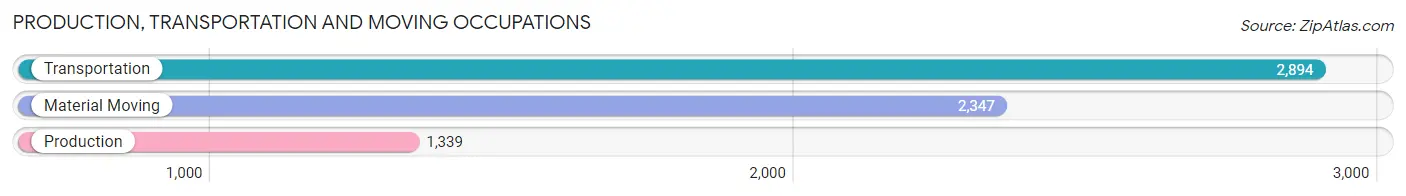
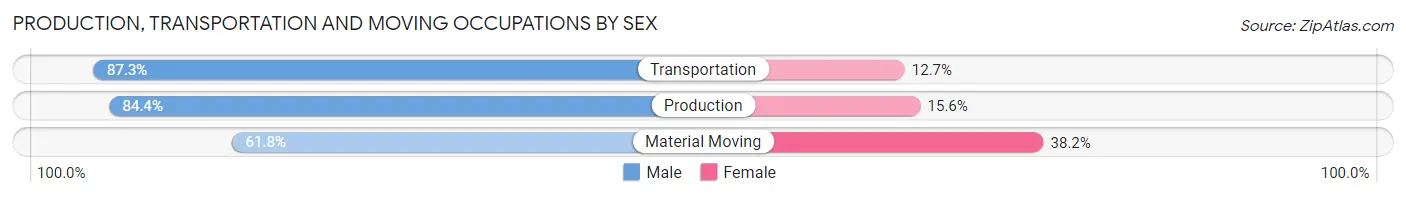
Production, Transportation and Moving Occupations
The most common Production, Transportation and Moving occupations in Pembroke Pines are Transportation (2,894 | 3.5%), Material Moving (2,347 | 2.8%), and Production (1,339 | 1.6%).
Production, Transportation and Moving Occupations by Sex
| Occupation | Male | Female |
| Production | 1,130 (84.4%) | 209 (15.6%) |
| Transportation | 2,526 (87.3%) | 368 (12.7%) |
| Material Moving | 1,451 (61.8%) | 896 (38.2%) |
| Total (Category) | 5,107 (77.6%) | 1,473 (22.4%) |
| Total (Overall) | 43,492 (51.9%) | 40,252 (48.1%) |
Employment Industries by Sex in Pembroke Pines
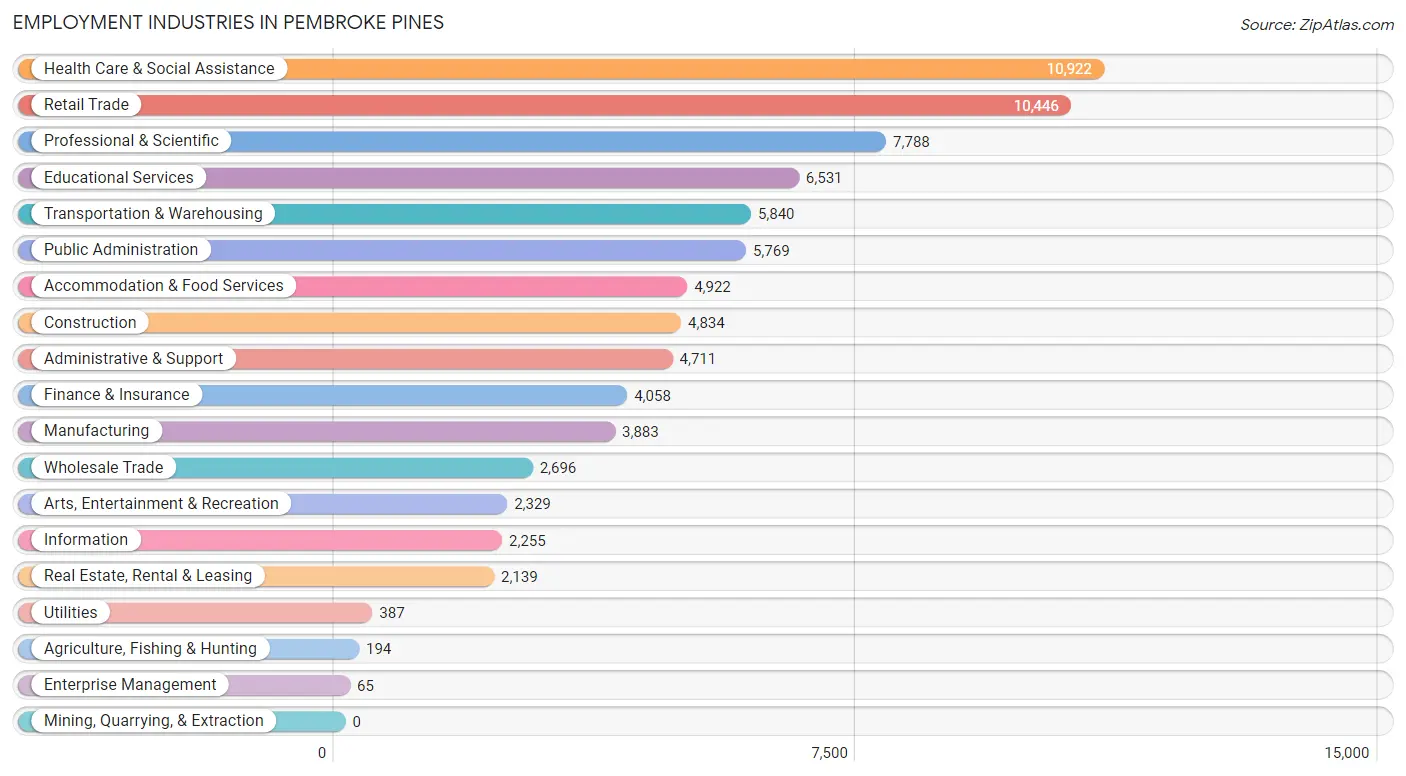
Employment Industries in Pembroke Pines
The major employment industries in Pembroke Pines include Health Care & Social Assistance (10,922 | 13.0%), Retail Trade (10,446 | 12.5%), Professional & Scientific (7,788 | 9.3%), Educational Services (6,531 | 7.8%), and Transportation & Warehousing (5,840 | 7.0%).
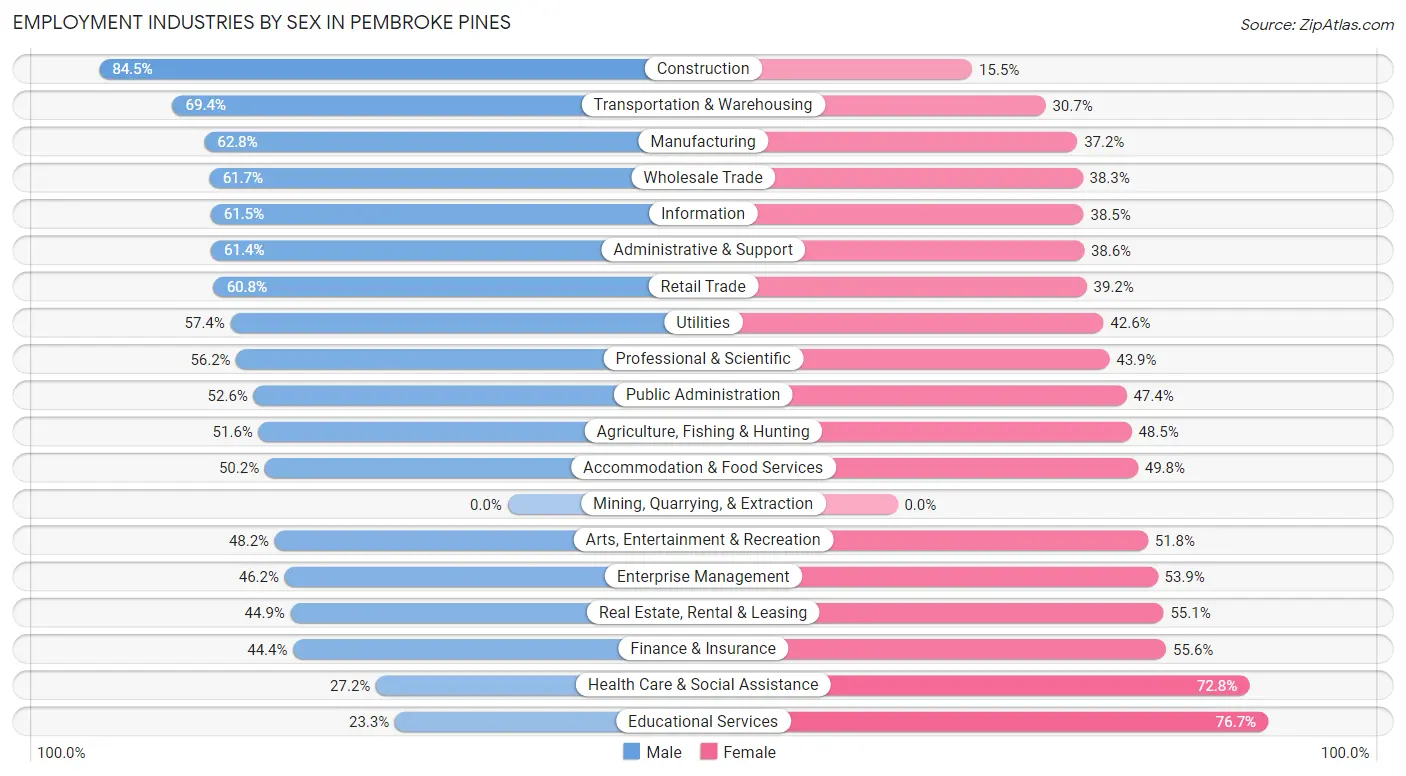
Employment Industries by Sex in Pembroke Pines
The Pembroke Pines industries that see more men than women are Construction (84.5%), Transportation & Warehousing (69.4%), and Manufacturing (62.8%), whereas the industries that tend to have a higher number of women are Educational Services (76.7%), Health Care & Social Assistance (72.8%), and Finance & Insurance (55.6%).
| Industry | Male | Female |
| Agriculture, Fishing & Hunting | 100 (51.5%) | 94 (48.4%) |
| Mining, Quarrying, & Extraction | 0 (0.0%) | 0 (0.0%) |
| Construction | 4,086 (84.5%) | 748 (15.5%) |
| Manufacturing | 2,438 (62.8%) | 1,445 (37.2%) |
| Wholesale Trade | 1,663 (61.7%) | 1,033 (38.3%) |
| Retail Trade | 6,355 (60.8%) | 4,091 (39.2%) |
| Transportation & Warehousing | 4,050 (69.4%) | 1,790 (30.6%) |
| Utilities | 222 (57.4%) | 165 (42.6%) |
| Information | 1,386 (61.5%) | 869 (38.5%) |
| Finance & Insurance | 1,801 (44.4%) | 2,257 (55.6%) |
| Real Estate, Rental & Leasing | 961 (44.9%) | 1,178 (55.1%) |
| Professional & Scientific | 4,373 (56.1%) | 3,415 (43.9%) |
| Enterprise Management | 30 (46.2%) | 35 (53.8%) |
| Administrative & Support | 2,892 (61.4%) | 1,819 (38.6%) |
| Educational Services | 1,523 (23.3%) | 5,008 (76.7%) |
| Health Care & Social Assistance | 2,974 (27.2%) | 7,948 (72.8%) |
| Arts, Entertainment & Recreation | 1,122 (48.2%) | 1,207 (51.8%) |
| Accommodation & Food Services | 2,473 (50.2%) | 2,449 (49.8%) |
| Public Administration | 3,034 (52.6%) | 2,735 (47.4%) |
| Total | 43,492 (51.9%) | 40,252 (48.1%) |
Education in Pembroke Pines
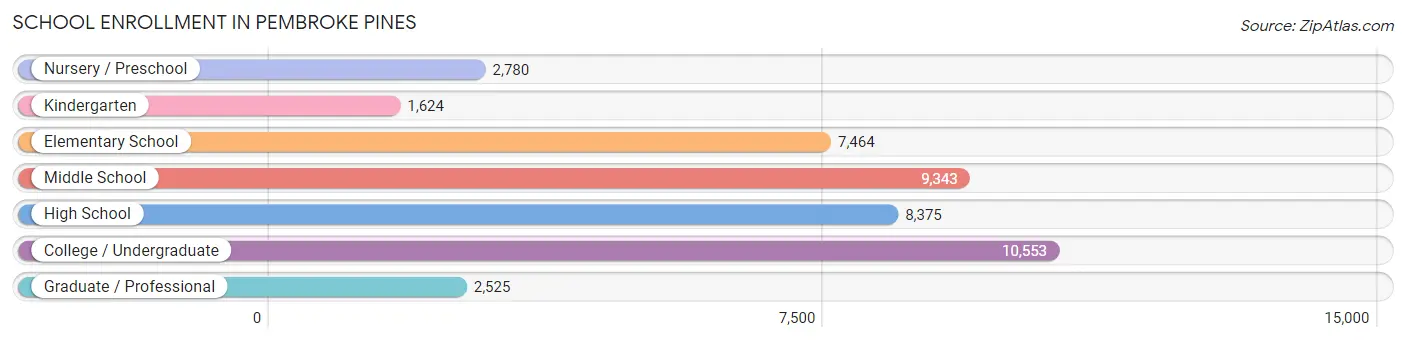
School Enrollment in Pembroke Pines
The most common levels of schooling among the 42,664 students in Pembroke Pines are college / undergraduate (10,553 | 24.7%), middle school (9,343 | 21.9%), and high school (8,375 | 19.6%).
| School Level | # Students | % Students |
| Nursery / Preschool | 2,780 | 6.5% |
| Kindergarten | 1,624 | 3.8% |
| Elementary School | 7,464 | 17.5% |
| Middle School | 9,343 | 21.9% |
| High School | 8,375 | 19.6% |
| College / Undergraduate | 10,553 | 24.7% |
| Graduate / Professional | 2,525 | 5.9% |
| Total | 42,664 | 100.0% |
School Enrollment by Age by Funding Source in Pembroke Pines
Out of a total of 42,664 students who are enrolled in schools in Pembroke Pines, 8,362 (19.6%) attend a private institution, while the remaining 34,302 (80.4%) are enrolled in public schools. The age group of 3 to 4 year olds has the highest likelihood of being enrolled in private schools, with 1,364 (55.3% in the age bracket) enrolled. Conversely, the age group of 15 to 17 year olds has the lowest likelihood of being enrolled in a private school, with 5,619 (90.0% in the age bracket) attending a public institution.
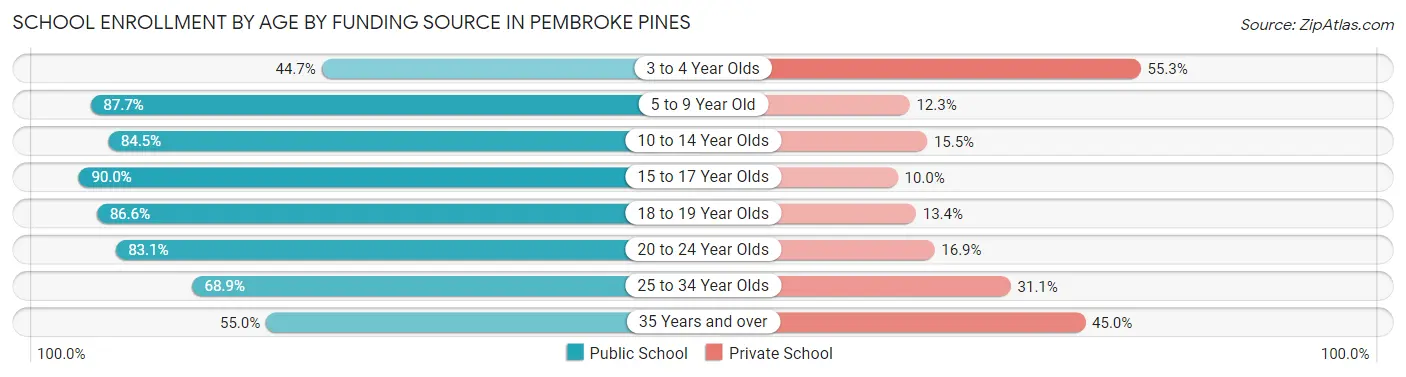
| Age Bracket | Public School | Private School |
| 3 to 4 Year Olds | 1,102 (44.7%) | 1,364 (55.3%) |
| 5 to 9 Year Old | 7,302 (87.7%) | 1,020 (12.3%) |
| 10 to 14 Year Olds | 9,446 (84.5%) | 1,734 (15.5%) |
| 15 to 17 Year Olds | 5,619 (90.0%) | 627 (10.0%) |
| 18 to 19 Year Olds | 2,537 (86.6%) | 394 (13.4%) |
| 20 to 24 Year Olds | 4,610 (83.1%) | 937 (16.9%) |
| 25 to 34 Year Olds | 2,065 (68.9%) | 932 (31.1%) |
| 35 Years and over | 1,637 (55.0%) | 1,338 (45.0%) |
| Total | 34,302 (80.4%) | 8,362 (19.6%) |
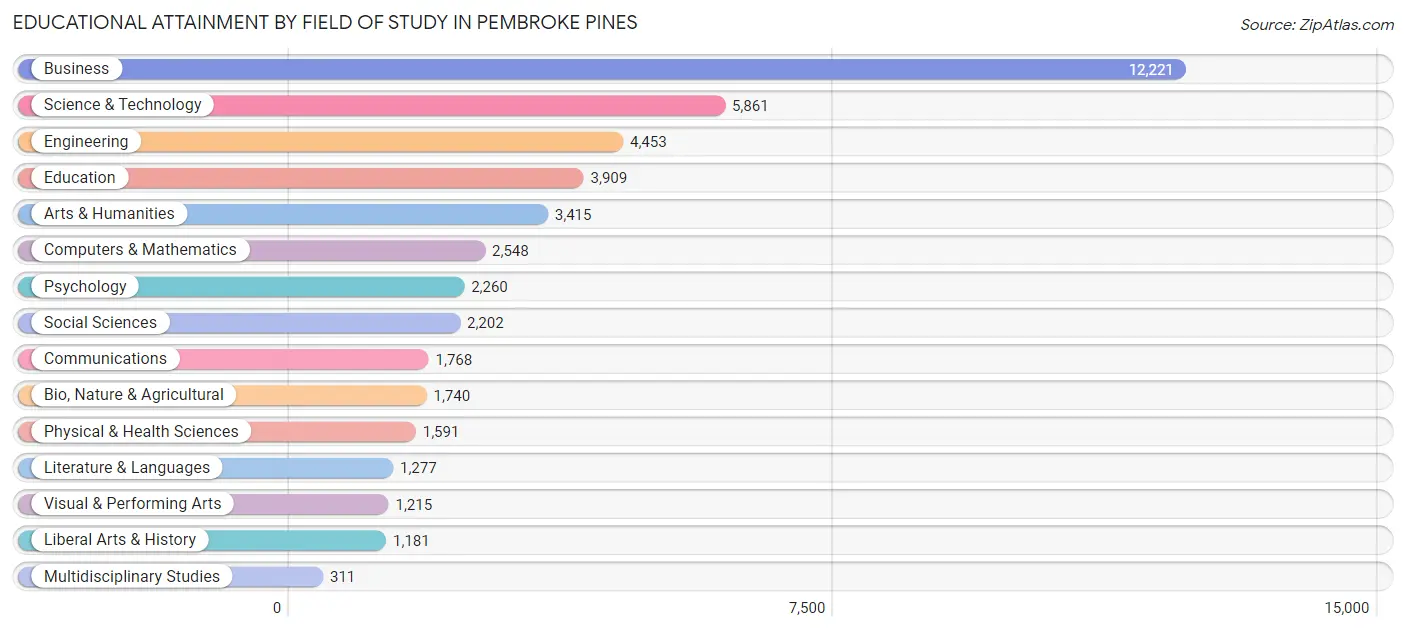
Educational Attainment by Field of Study in Pembroke Pines
Business (12,221 | 26.6%), science & technology (5,861 | 12.8%), engineering (4,453 | 9.7%), education (3,909 | 8.5%), and arts & humanities (3,415 | 7.4%) are the most common fields of study among 45,952 individuals in Pembroke Pines who have obtained a bachelor's degree or higher.
| Field of Study | # Graduates | % Graduates |
| Computers & Mathematics | 2,548 | 5.5% |
| Bio, Nature & Agricultural | 1,740 | 3.8% |
| Physical & Health Sciences | 1,591 | 3.5% |
| Psychology | 2,260 | 4.9% |
| Social Sciences | 2,202 | 4.8% |
| Engineering | 4,453 | 9.7% |
| Multidisciplinary Studies | 311 | 0.7% |
| Science & Technology | 5,861 | 12.8% |
| Business | 12,221 | 26.6% |
| Education | 3,909 | 8.5% |
| Literature & Languages | 1,277 | 2.8% |
| Liberal Arts & History | 1,181 | 2.6% |
| Visual & Performing Arts | 1,215 | 2.6% |
| Communications | 1,768 | 3.8% |
| Arts & Humanities | 3,415 | 7.4% |
| Total | 45,952 | 100.0% |
Transportation & Commute in Pembroke Pines
Vehicle Availability by Sex in Pembroke Pines
The most prevalent vehicle ownership categories in Pembroke Pines are males with 2 vehicles (20,456, accounting for 48.2%) and females with 2 vehicles (17,648, making up 52.0%).
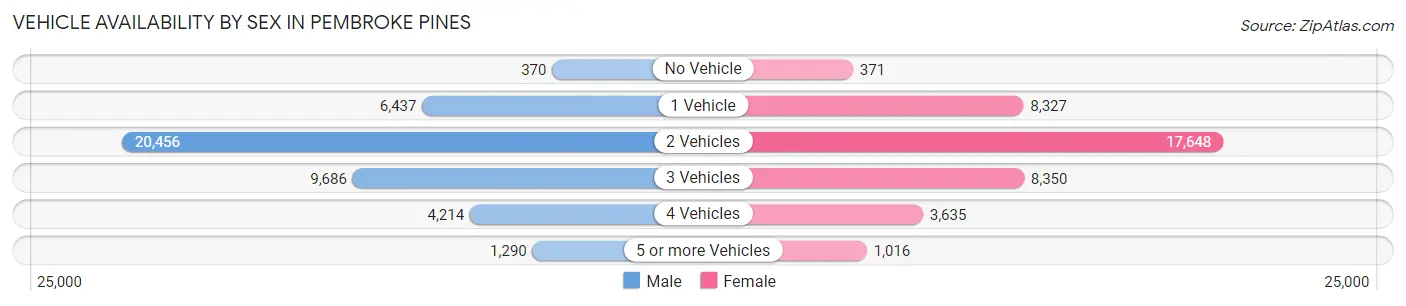
| Vehicles Available | Male | Female |
| No Vehicle | 370 (0.9%) | 371 (0.9%) |
| 1 Vehicle | 6,437 (15.2%) | 8,327 (21.2%) |
| 2 Vehicles | 20,456 (48.2%) | 17,648 (44.9%) |
| 3 Vehicles | 9,686 (22.8%) | 8,350 (21.2%) |
| 4 Vehicles | 4,214 (9.9%) | 3,635 (9.2%) |
| 5 or more Vehicles | 1,290 (3.0%) | 1,016 (2.6%) |
| Total | 42,453 (100.0%) | 39,347 (100.0%) |
Commute Time in Pembroke Pines
The most frequently occuring commute durations in Pembroke Pines are 20 to 24 minutes (14,517 commuters, 19.9%), 30 to 34 minutes (13,777 commuters, 18.9%), and 45 to 59 minutes (8,344 commuters, 11.4%).
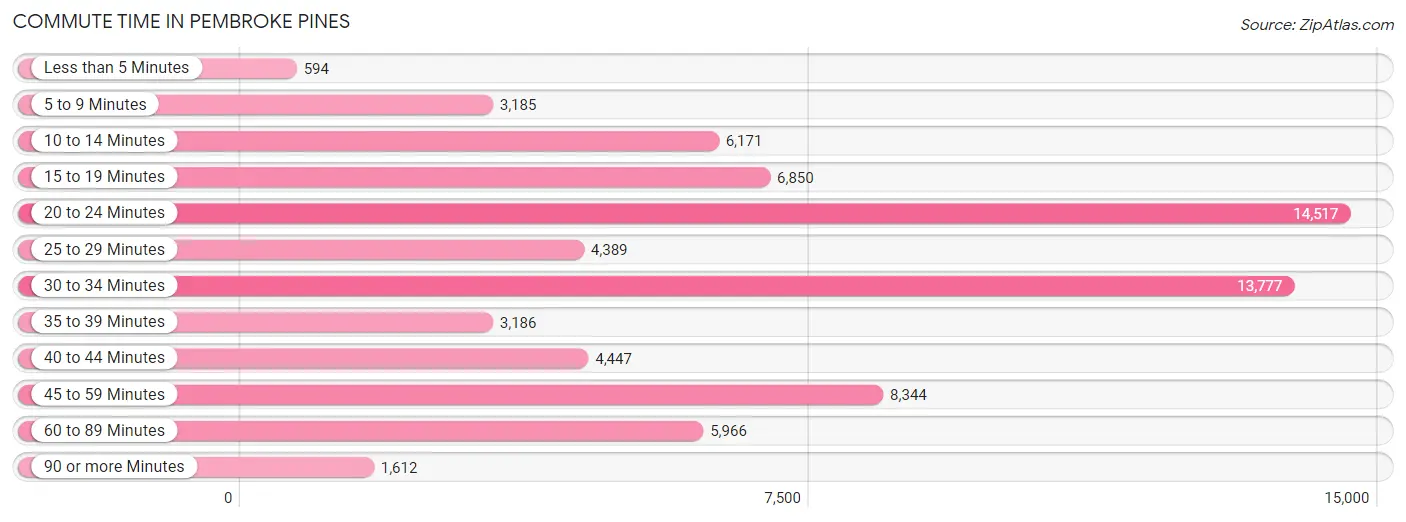
| Commute Time | # Commuters | % Commuters |
| Less than 5 Minutes | 594 | 0.8% |
| 5 to 9 Minutes | 3,185 | 4.4% |
| 10 to 14 Minutes | 6,171 | 8.5% |
| 15 to 19 Minutes | 6,850 | 9.4% |
| 20 to 24 Minutes | 14,517 | 19.9% |
| 25 to 29 Minutes | 4,389 | 6.0% |
| 30 to 34 Minutes | 13,777 | 18.9% |
| 35 to 39 Minutes | 3,186 | 4.4% |
| 40 to 44 Minutes | 4,447 | 6.1% |
| 45 to 59 Minutes | 8,344 | 11.4% |
| 60 to 89 Minutes | 5,966 | 8.2% |
| 90 or more Minutes | 1,612 | 2.2% |
Commute Time by Sex in Pembroke Pines
The most common commute times in Pembroke Pines are 30 to 34 minutes (7,562 commuters, 20.0%) for males and 20 to 24 minutes (7,088 commuters, 20.1%) for females.
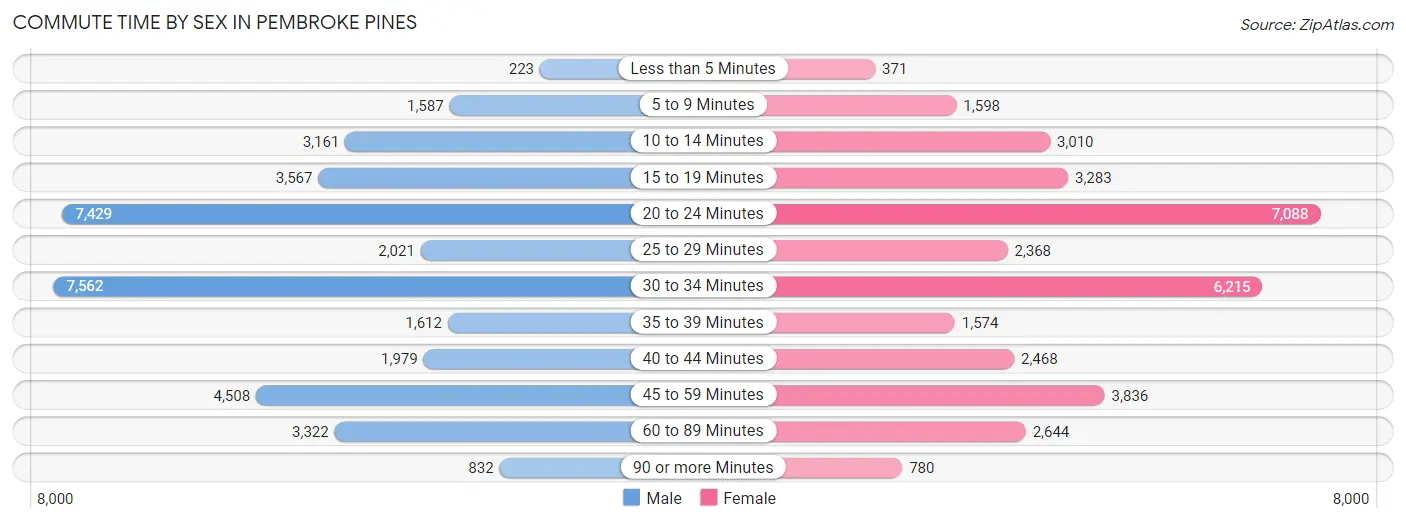
| Commute Time | Male | Female |
| Less than 5 Minutes | 223 (0.6%) | 371 (1.1%) |
| 5 to 9 Minutes | 1,587 (4.2%) | 1,598 (4.5%) |
| 10 to 14 Minutes | 3,161 (8.4%) | 3,010 (8.5%) |
| 15 to 19 Minutes | 3,567 (9.4%) | 3,283 (9.3%) |
| 20 to 24 Minutes | 7,429 (19.7%) | 7,088 (20.1%) |
| 25 to 29 Minutes | 2,021 (5.3%) | 2,368 (6.7%) |
| 30 to 34 Minutes | 7,562 (20.0%) | 6,215 (17.6%) |
| 35 to 39 Minutes | 1,612 (4.3%) | 1,574 (4.5%) |
| 40 to 44 Minutes | 1,979 (5.2%) | 2,468 (7.0%) |
| 45 to 59 Minutes | 4,508 (11.9%) | 3,836 (10.9%) |
| 60 to 89 Minutes | 3,322 (8.8%) | 2,644 (7.5%) |
| 90 or more Minutes | 832 (2.2%) | 780 (2.2%) |
Time of Departure to Work by Sex in Pembroke Pines
The most frequent times of departure to work in Pembroke Pines are 7:00 AM to 7:29 AM (6,595, 17.4%) for males and 7:00 AM to 7:29 AM (5,987, 17.0%) for females.
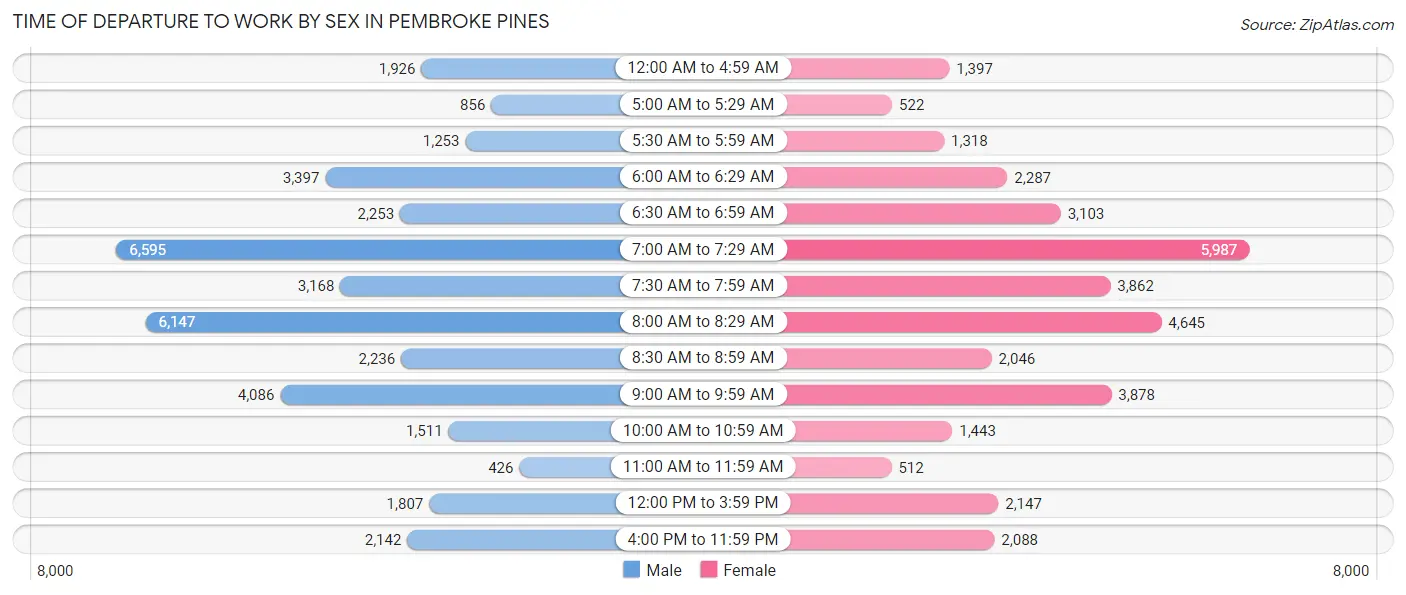
| Time of Departure | Male | Female |
| 12:00 AM to 4:59 AM | 1,926 (5.1%) | 1,397 (4.0%) |
| 5:00 AM to 5:29 AM | 856 (2.3%) | 522 (1.5%) |
| 5:30 AM to 5:59 AM | 1,253 (3.3%) | 1,318 (3.7%) |
| 6:00 AM to 6:29 AM | 3,397 (9.0%) | 2,287 (6.5%) |
| 6:30 AM to 6:59 AM | 2,253 (6.0%) | 3,103 (8.8%) |
| 7:00 AM to 7:29 AM | 6,595 (17.4%) | 5,987 (17.0%) |
| 7:30 AM to 7:59 AM | 3,168 (8.4%) | 3,862 (11.0%) |
| 8:00 AM to 8:29 AM | 6,147 (16.3%) | 4,645 (13.2%) |
| 8:30 AM to 8:59 AM | 2,236 (5.9%) | 2,046 (5.8%) |
| 9:00 AM to 9:59 AM | 4,086 (10.8%) | 3,878 (11.0%) |
| 10:00 AM to 10:59 AM | 1,511 (4.0%) | 1,443 (4.1%) |
| 11:00 AM to 11:59 AM | 426 (1.1%) | 512 (1.5%) |
| 12:00 PM to 3:59 PM | 1,807 (4.8%) | 2,147 (6.1%) |
| 4:00 PM to 11:59 PM | 2,142 (5.7%) | 2,088 (5.9%) |
| Total | 37,803 (100.0%) | 35,235 (100.0%) |
Housing Occupancy in Pembroke Pines
Occupancy by Ownership in Pembroke Pines
Of the total 62,807 dwellings in Pembroke Pines, owner-occupied units account for 44,576 (71.0%), while renter-occupied units make up 18,231 (29.0%).

| Occupancy | # Housing Units | % Housing Units |
| Owner Occupied Housing Units | 44,576 | 71.0% |
| Renter-Occupied Housing Units | 18,231 | 29.0% |
| Total Occupied Housing Units | 62,807 | 100.0% |
Occupancy by Household Size in Pembroke Pines
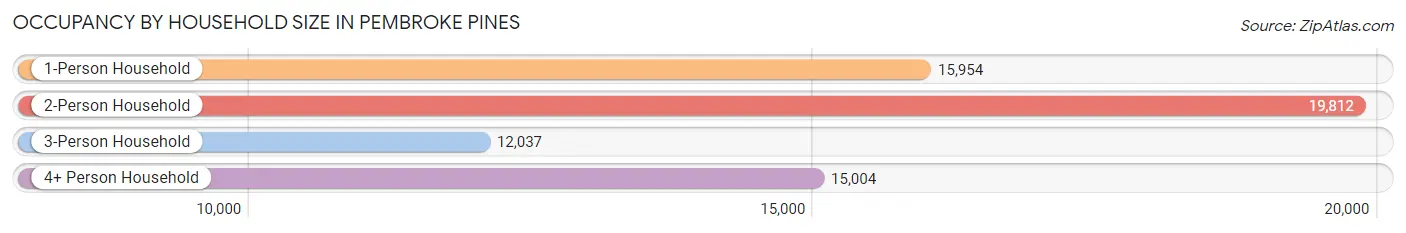
| Household Size | # Housing Units | % Housing Units |
| 1-Person Household | 15,954 | 25.4% |
| 2-Person Household | 19,812 | 31.5% |
| 3-Person Household | 12,037 | 19.2% |
| 4+ Person Household | 15,004 | 23.9% |
| Total Housing Units | 62,807 | 100.0% |
Occupancy by Ownership by Household Size in Pembroke Pines
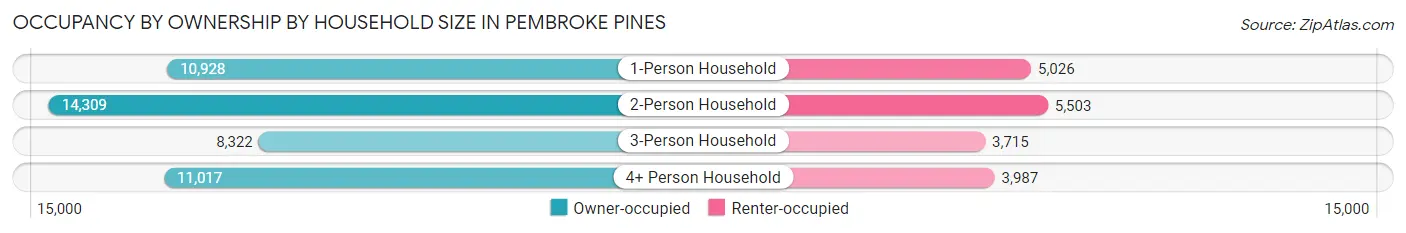
| Household Size | Owner-occupied | Renter-occupied |
| 1-Person Household | 10,928 (68.5%) | 5,026 (31.5%) |
| 2-Person Household | 14,309 (72.2%) | 5,503 (27.8%) |
| 3-Person Household | 8,322 (69.1%) | 3,715 (30.9%) |
| 4+ Person Household | 11,017 (73.4%) | 3,987 (26.6%) |
| Total Housing Units | 44,576 (71.0%) | 18,231 (29.0%) |
Occupancy by Educational Attainment in Pembroke Pines
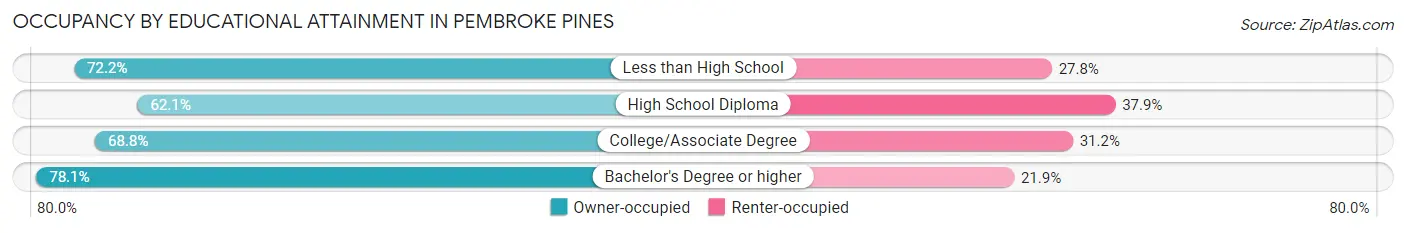
| Household Size | Owner-occupied | Renter-occupied |
| Less than High School | 2,488 (72.2%) | 960 (27.8%) |
| High School Diploma | 9,911 (62.1%) | 6,051 (37.9%) |
| College/Associate Degree | 12,792 (68.8%) | 5,796 (31.2%) |
| Bachelor's Degree or higher | 19,385 (78.1%) | 5,424 (21.9%) |
Occupancy by Age of Householder in Pembroke Pines
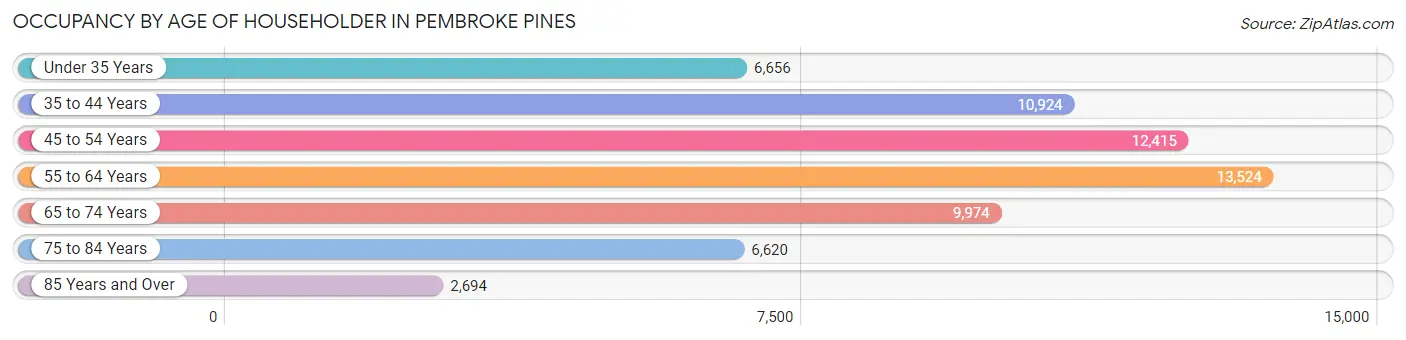
| Age Bracket | # Households | % Households |
| Under 35 Years | 6,656 | 10.6% |
| 35 to 44 Years | 10,924 | 17.4% |
| 45 to 54 Years | 12,415 | 19.8% |
| 55 to 64 Years | 13,524 | 21.5% |
| 65 to 74 Years | 9,974 | 15.9% |
| 75 to 84 Years | 6,620 | 10.5% |
| 85 Years and Over | 2,694 | 4.3% |
| Total | 62,807 | 100.0% |
Housing Finances in Pembroke Pines
Median Income by Occupancy in Pembroke Pines
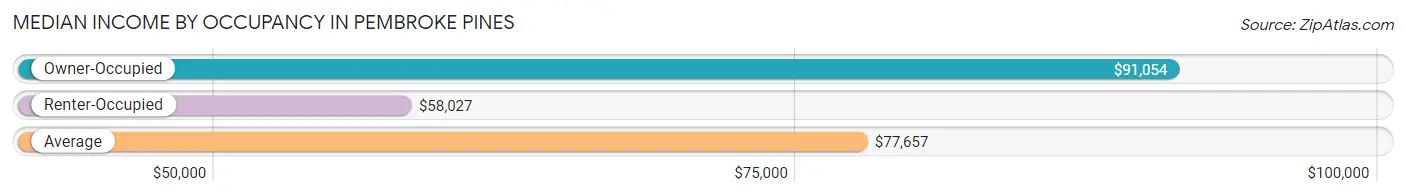
| Occupancy Type | # Households | Median Income |
| Owner-Occupied | 44,576 (71.0%) | $91,054 |
| Renter-Occupied | 18,231 (29.0%) | $58,027 |
| Average | 62,807 (100.0%) | $77,657 |
Occupancy by Householder Income Bracket in Pembroke Pines
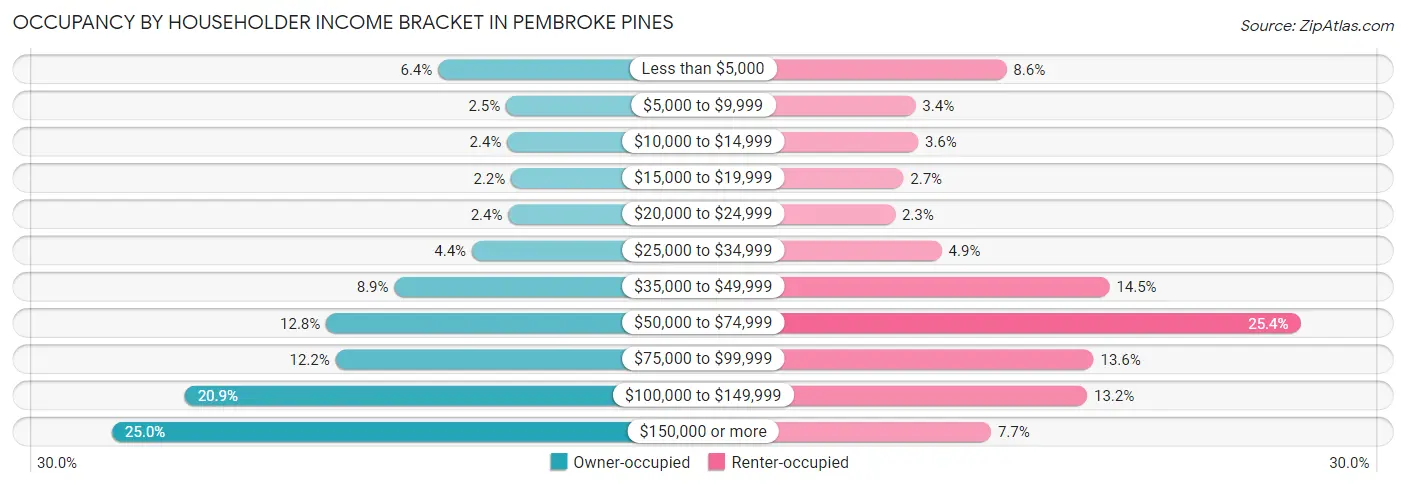
| Income Bracket | Owner-occupied | Renter-occupied |
| Less than $5,000 | 2,839 (6.4%) | 1,571 (8.6%) |
| $5,000 to $9,999 | 1,111 (2.5%) | 623 (3.4%) |
| $10,000 to $14,999 | 1,077 (2.4%) | 650 (3.6%) |
| $15,000 to $19,999 | 979 (2.2%) | 498 (2.7%) |
| $20,000 to $24,999 | 1,051 (2.4%) | 411 (2.2%) |
| $25,000 to $34,999 | 1,978 (4.4%) | 897 (4.9%) |
| $35,000 to $49,999 | 3,955 (8.9%) | 2,645 (14.5%) |
| $50,000 to $74,999 | 5,693 (12.8%) | 4,633 (25.4%) |
| $75,000 to $99,999 | 5,450 (12.2%) | 2,480 (13.6%) |
| $100,000 to $149,999 | 9,295 (20.8%) | 2,412 (13.2%) |
| $150,000 or more | 11,148 (25.0%) | 1,411 (7.7%) |
| Total | 44,576 (100.0%) | 18,231 (100.0%) |
Monthly Housing Cost Tiers in Pembroke Pines
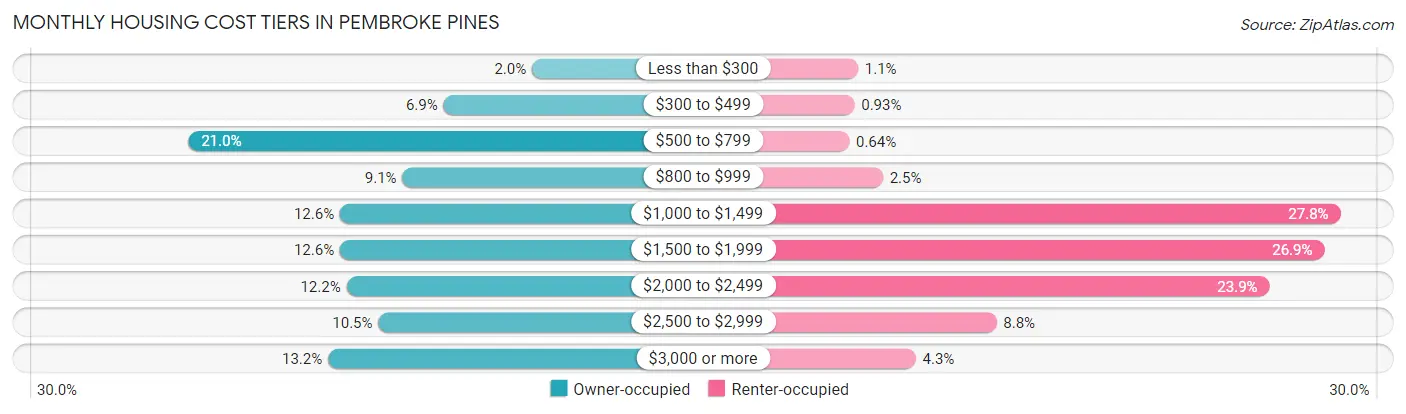
| Monthly Cost | Owner-occupied | Renter-occupied |
| Less than $300 | 877 (2.0%) | 206 (1.1%) |
| $300 to $499 | 3,057 (6.9%) | 170 (0.9%) |
| $500 to $799 | 9,343 (21.0%) | 116 (0.6%) |
| $800 to $999 | 4,072 (9.1%) | 456 (2.5%) |
| $1,000 to $1,499 | 5,607 (12.6%) | 5,065 (27.8%) |
| $1,500 to $1,999 | 5,608 (12.6%) | 4,903 (26.9%) |
| $2,000 to $2,499 | 5,449 (12.2%) | 4,350 (23.9%) |
| $2,500 to $2,999 | 4,661 (10.5%) | 1,600 (8.8%) |
| $3,000 or more | 5,902 (13.2%) | 788 (4.3%) |
| Total | 44,576 (100.0%) | 18,231 (100.0%) |
Physical Housing Characteristics in Pembroke Pines
Housing Structures in Pembroke Pines
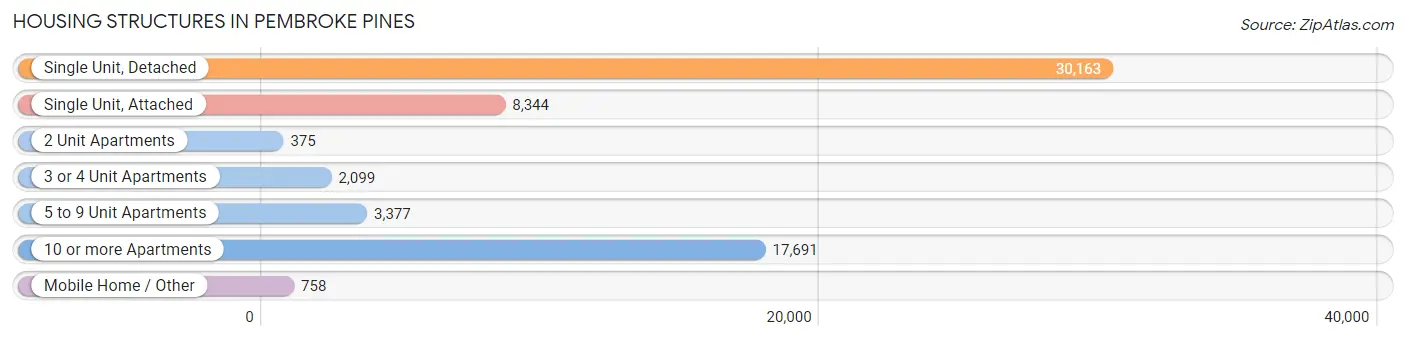
| Structure Type | # Housing Units | % Housing Units |
| Single Unit, Detached | 30,163 | 48.0% |
| Single Unit, Attached | 8,344 | 13.3% |
| 2 Unit Apartments | 375 | 0.6% |
| 3 or 4 Unit Apartments | 2,099 | 3.3% |
| 5 to 9 Unit Apartments | 3,377 | 5.4% |
| 10 or more Apartments | 17,691 | 28.2% |
| Mobile Home / Other | 758 | 1.2% |
| Total | 62,807 | 100.0% |
Housing Structures by Occupancy in Pembroke Pines
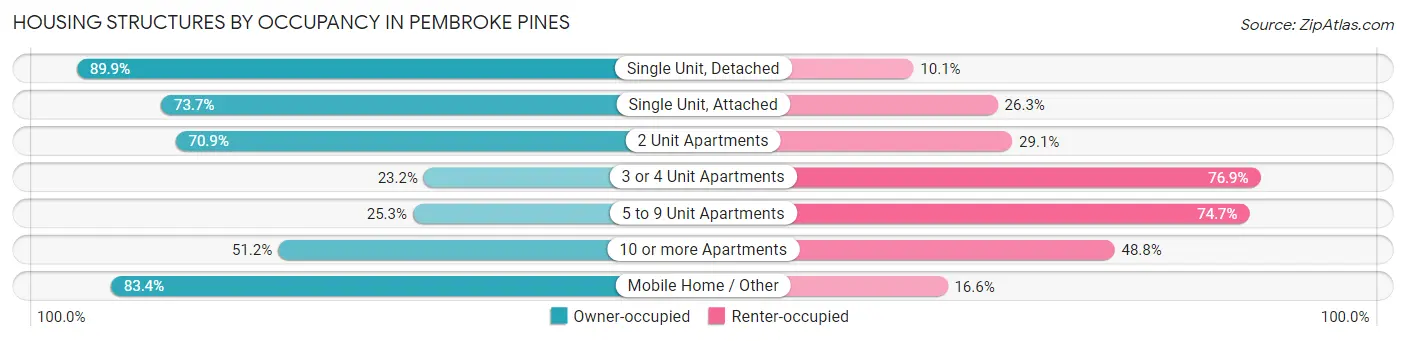
| Structure Type | Owner-occupied | Renter-occupied |
| Single Unit, Detached | 27,128 (89.9%) | 3,035 (10.1%) |
| Single Unit, Attached | 6,151 (73.7%) | 2,193 (26.3%) |
| 2 Unit Apartments | 266 (70.9%) | 109 (29.1%) |
| 3 or 4 Unit Apartments | 486 (23.2%) | 1,613 (76.8%) |
| 5 to 9 Unit Apartments | 853 (25.3%) | 2,524 (74.7%) |
| 10 or more Apartments | 9,060 (51.2%) | 8,631 (48.8%) |
| Mobile Home / Other | 632 (83.4%) | 126 (16.6%) |
| Total | 44,576 (71.0%) | 18,231 (29.0%) |
Housing Structures by Number of Rooms in Pembroke Pines
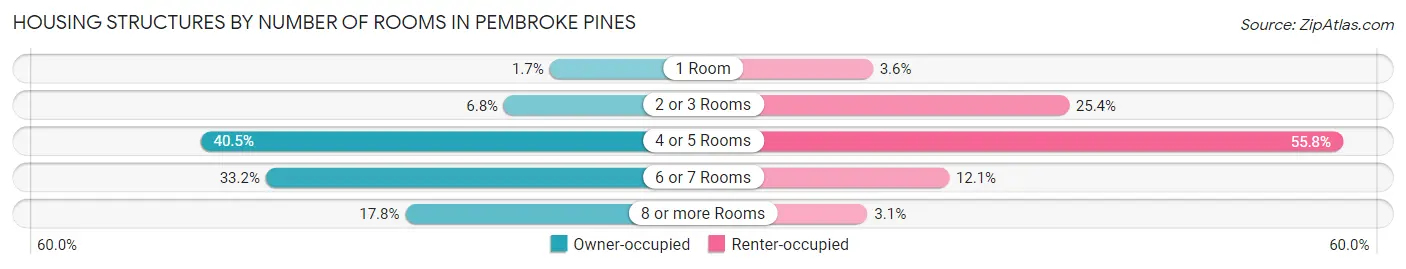
| Number of Rooms | Owner-occupied | Renter-occupied |
| 1 Room | 776 (1.7%) | 663 (3.6%) |
| 2 or 3 Rooms | 3,029 (6.8%) | 4,632 (25.4%) |
| 4 or 5 Rooms | 18,040 (40.5%) | 10,174 (55.8%) |
| 6 or 7 Rooms | 14,819 (33.2%) | 2,206 (12.1%) |
| 8 or more Rooms | 7,912 (17.7%) | 556 (3.0%) |
| Total | 44,576 (100.0%) | 18,231 (100.0%) |
Housing Structure by Heating Type in Pembroke Pines
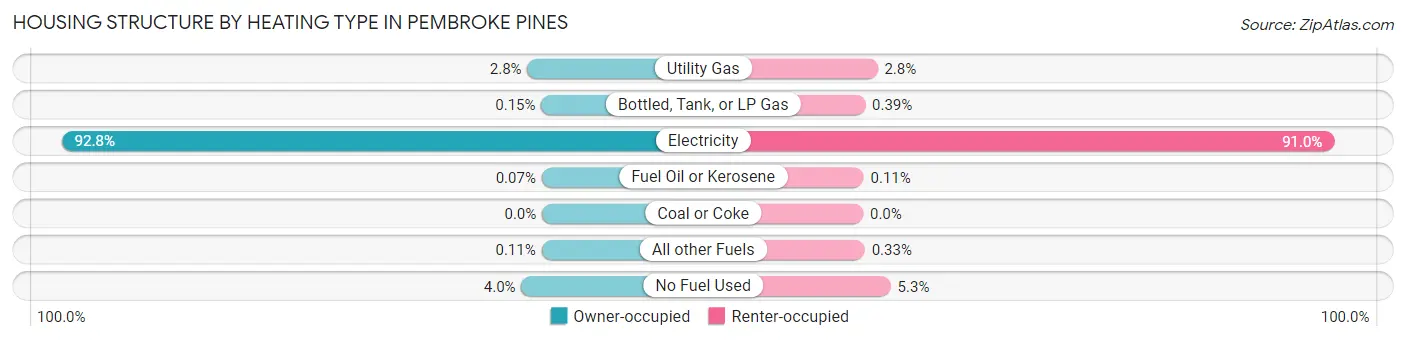
| Heating Type | Owner-occupied | Renter-occupied |
| Utility Gas | 1,262 (2.8%) | 508 (2.8%) |
| Bottled, Tank, or LP Gas | 68 (0.2%) | 72 (0.4%) |
| Electricity | 41,383 (92.8%) | 16,597 (91.0%) |
| Fuel Oil or Kerosene | 31 (0.1%) | 20 (0.1%) |
| Coal or Coke | 0 (0.0%) | 0 (0.0%) |
| All other Fuels | 51 (0.1%) | 61 (0.3%) |
| No Fuel Used | 1,781 (4.0%) | 973 (5.3%) |
| Total | 44,576 (100.0%) | 18,231 (100.0%) |
Household Vehicle Usage in Pembroke Pines
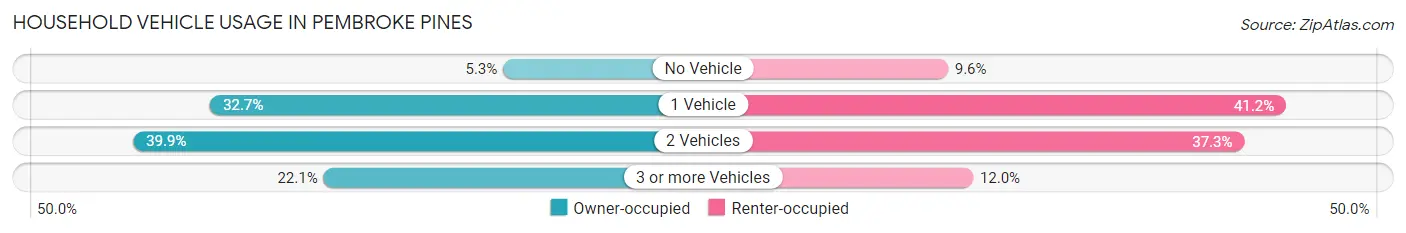
| Vehicles per Household | Owner-occupied | Renter-occupied |
| No Vehicle | 2,378 (5.3%) | 1,750 (9.6%) |
| 1 Vehicle | 14,574 (32.7%) | 7,507 (41.2%) |
| 2 Vehicles | 17,774 (39.9%) | 6,796 (37.3%) |
| 3 or more Vehicles | 9,850 (22.1%) | 2,178 (11.9%) |
| Total | 44,576 (100.0%) | 18,231 (100.0%) |
Real Estate & Mortgages in Pembroke Pines
Real Estate and Mortgage Overview in Pembroke Pines
| Characteristic | Without Mortgage | With Mortgage |
| Housing Units | 19,173 | 25,403 |
| Median Property Value | $255,500 | $426,800 |
| Median Household Income | $53,135 | $8,698 |
| Monthly Housing Costs | $697 | $5,886 |
| Real Estate Taxes | $2,550 | $439 |
Property Value by Mortgage Status in Pembroke Pines
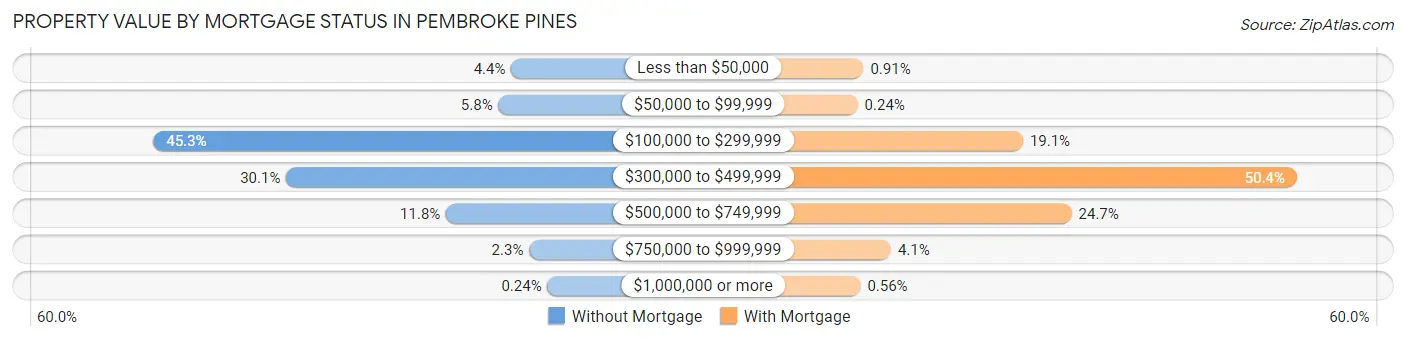
| Property Value | Without Mortgage | With Mortgage |
| Less than $50,000 | 840 (4.4%) | 230 (0.9%) |
| $50,000 to $99,999 | 1,119 (5.8%) | 60 (0.2%) |
| $100,000 to $299,999 | 8,684 (45.3%) | 4,860 (19.1%) |
| $300,000 to $499,999 | 5,771 (30.1%) | 12,810 (50.4%) |
| $500,000 to $749,999 | 2,267 (11.8%) | 6,271 (24.7%) |
| $750,000 to $999,999 | 446 (2.3%) | 1,030 (4.1%) |
| $1,000,000 or more | 46 (0.2%) | 142 (0.6%) |
| Total | 19,173 (100.0%) | 25,403 (100.0%) |
Household Income by Mortgage Status in Pembroke Pines
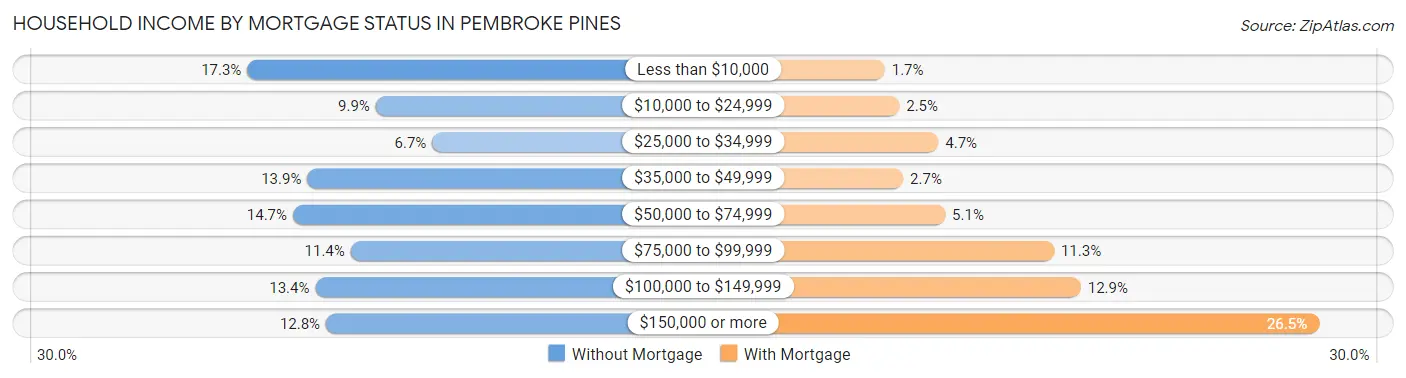
| Household Income | Without Mortgage | With Mortgage |
| Less than $10,000 | 3,314 (17.3%) | 425 (1.7%) |
| $10,000 to $24,999 | 1,906 (9.9%) | 636 (2.5%) |
| $25,000 to $34,999 | 1,287 (6.7%) | 1,201 (4.7%) |
| $35,000 to $49,999 | 2,655 (13.9%) | 691 (2.7%) |
| $50,000 to $74,999 | 2,813 (14.7%) | 1,300 (5.1%) |
| $75,000 to $99,999 | 2,180 (11.4%) | 2,880 (11.3%) |
| $100,000 to $149,999 | 2,568 (13.4%) | 3,270 (12.9%) |
| $150,000 or more | 2,450 (12.8%) | 6,727 (26.5%) |
| Total | 19,173 (100.0%) | 25,403 (100.0%) |
Property Value to Household Income Ratio in Pembroke Pines
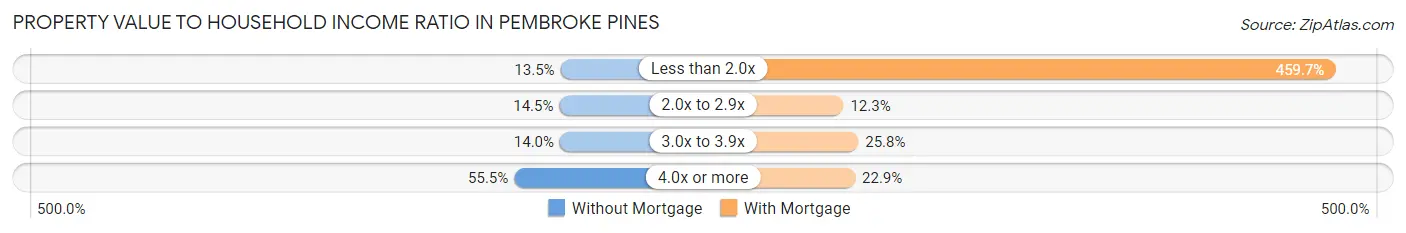
| Value-to-Income Ratio | Without Mortgage | With Mortgage |
| Less than 2.0x | 2,580 (13.5%) | 116,778 (459.7%) |
| 2.0x to 2.9x | 2,777 (14.5%) | 3,129 (12.3%) |
| 3.0x to 3.9x | 2,676 (14.0%) | 6,549 (25.8%) |
| 4.0x or more | 10,639 (55.5%) | 5,805 (22.9%) |
| Total | 19,173 (100.0%) | 25,403 (100.0%) |
Real Estate Taxes by Mortgage Status in Pembroke Pines
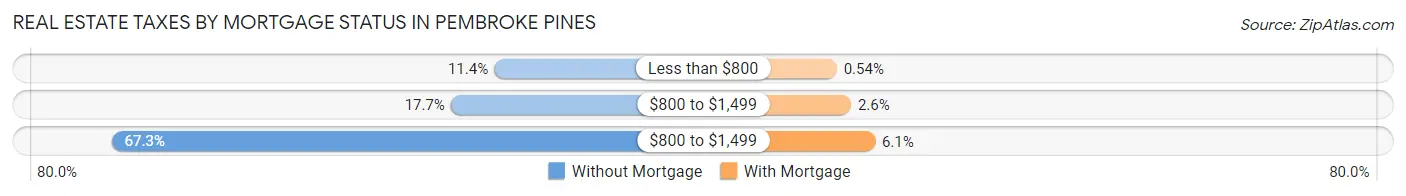
| Property Taxes | Without Mortgage | With Mortgage |
| Less than $800 | 2,188 (11.4%) | 138 (0.5%) |
| $800 to $1,499 | 3,401 (17.7%) | 666 (2.6%) |
| $800 to $1,499 | 12,900 (67.3%) | 1,557 (6.1%) |
| Total | 19,173 (100.0%) | 25,403 (100.0%) |
Health & Disability in Pembroke Pines
Health Insurance Coverage by Age in Pembroke Pines
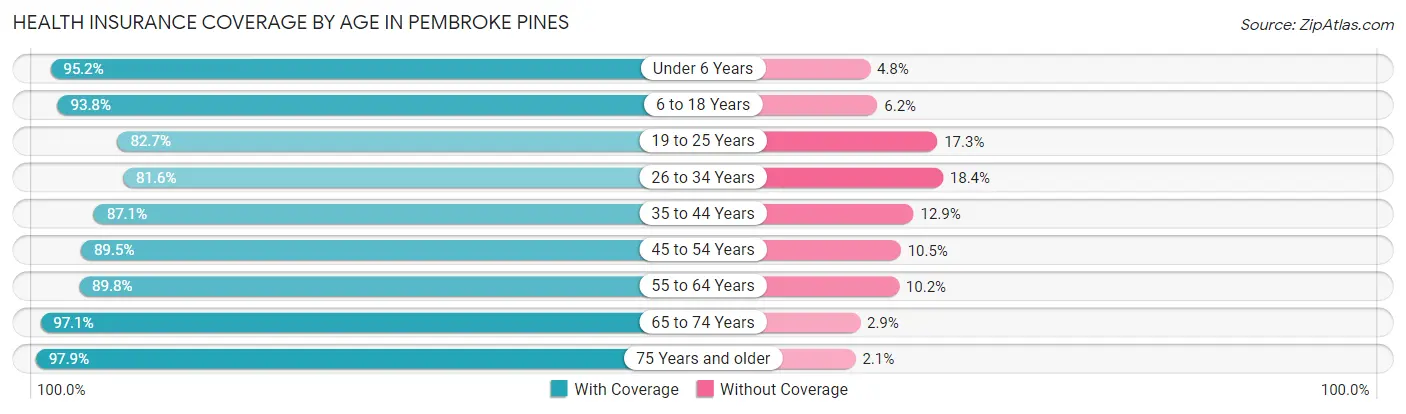
| Age Bracket | With Coverage | Without Coverage |
| Under 6 Years | 9,494 (95.2%) | 479 (4.8%) |
| 6 to 18 Years | 24,612 (93.8%) | 1,615 (6.2%) |
| 19 to 25 Years | 11,615 (82.7%) | 2,434 (17.3%) |
| 26 to 34 Years | 13,622 (81.6%) | 3,068 (18.4%) |
| 35 to 44 Years | 20,213 (87.1%) | 2,996 (12.9%) |
| 45 to 54 Years | 20,799 (89.5%) | 2,445 (10.5%) |
| 55 to 64 Years | 21,699 (89.8%) | 2,460 (10.2%) |
| 65 to 74 Years | 16,343 (97.1%) | 494 (2.9%) |
| 75 Years and older | 14,941 (97.9%) | 318 (2.1%) |
| Total | 153,338 (90.4%) | 16,309 (9.6%) |
Health Insurance Coverage by Citizenship Status in Pembroke Pines
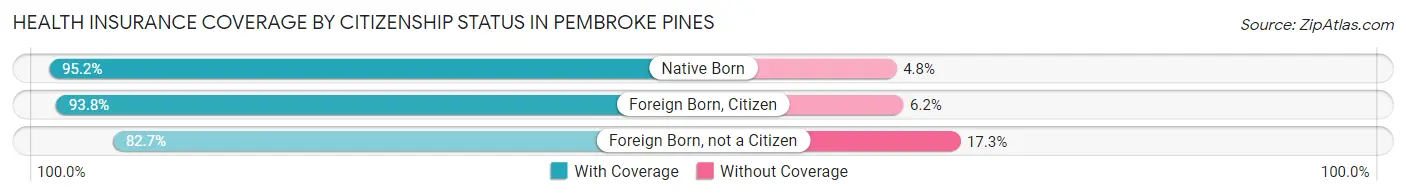
| Citizenship Status | With Coverage | Without Coverage |
| Native Born | 9,494 (95.2%) | 479 (4.8%) |
| Foreign Born, Citizen | 24,612 (93.8%) | 1,615 (6.2%) |
| Foreign Born, not a Citizen | 11,615 (82.7%) | 2,434 (17.3%) |
Health Insurance Coverage by Household Income in Pembroke Pines
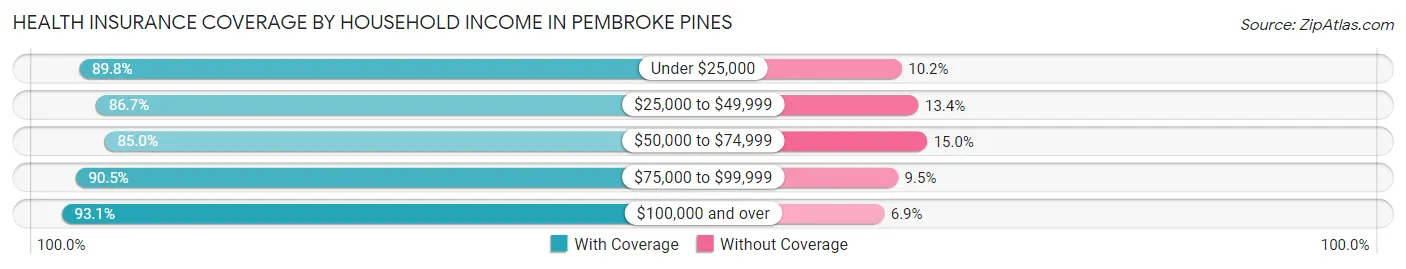
| Household Income | With Coverage | Without Coverage |
| Under $25,000 | 15,964 (89.8%) | 1,817 (10.2%) |
| $25,000 to $49,999 | 17,347 (86.7%) | 2,672 (13.4%) |
| $50,000 to $74,999 | 22,278 (85.0%) | 3,923 (15.0%) |
| $75,000 to $99,999 | 20,030 (90.5%) | 2,109 (9.5%) |
| $100,000 and over | 77,519 (93.1%) | 5,774 (6.9%) |
Public vs Private Health Insurance Coverage by Age in Pembroke Pines
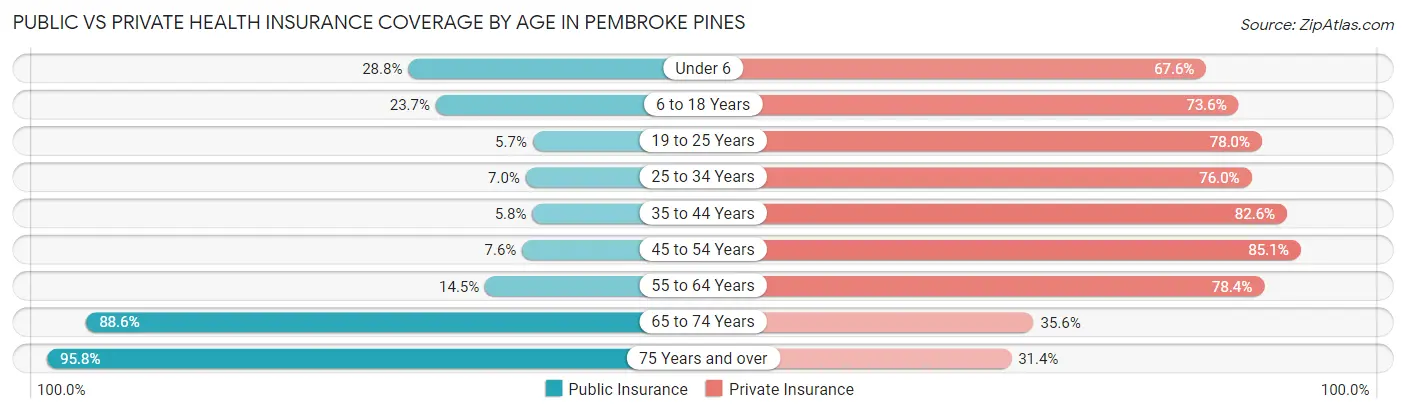
| Age Bracket | Public Insurance | Private Insurance |
| Under 6 | 2,871 (28.8%) | 6,745 (67.6%) |
| 6 to 18 Years | 6,210 (23.7%) | 19,310 (73.6%) |
| 19 to 25 Years | 798 (5.7%) | 10,952 (78.0%) |
| 25 to 34 Years | 1,169 (7.0%) | 12,688 (76.0%) |
| 35 to 44 Years | 1,336 (5.8%) | 19,172 (82.6%) |
| 45 to 54 Years | 1,776 (7.6%) | 19,788 (85.1%) |
| 55 to 64 Years | 3,508 (14.5%) | 18,934 (78.4%) |
| 65 to 74 Years | 14,909 (88.5%) | 5,992 (35.6%) |
| 75 Years and over | 14,622 (95.8%) | 4,797 (31.4%) |
| Total | 47,199 (27.8%) | 118,378 (69.8%) |
Disability Status by Sex by Age in Pembroke Pines
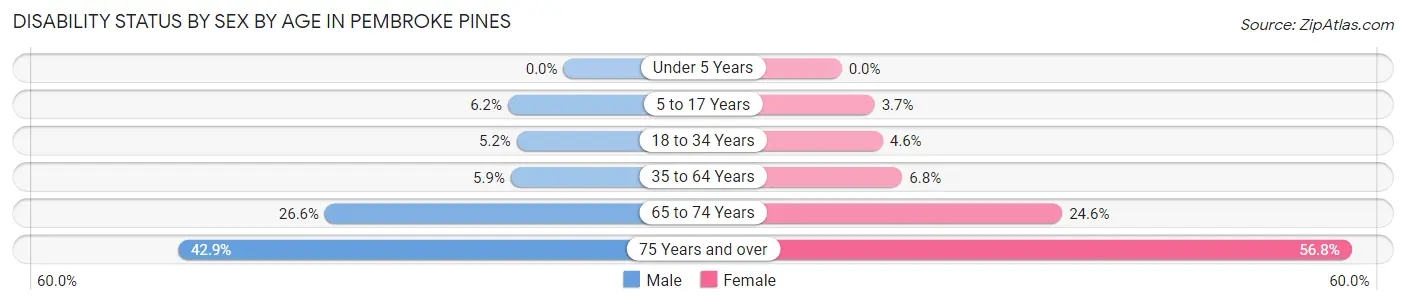
| Age Bracket | Male | Female |
| Under 5 Years | 0 (0.0%) | 0 (0.0%) |
| 5 to 17 Years | 791 (6.2%) | 501 (3.7%) |
| 18 to 34 Years | 902 (5.2%) | 693 (4.6%) |
| 35 to 64 Years | 1,997 (5.9%) | 2,466 (6.8%) |
| 65 to 74 Years | 1,891 (26.6%) | 2,385 (24.5%) |
| 75 Years and over | 2,483 (42.9%) | 5,377 (56.8%) |
Disability Class by Sex by Age in Pembroke Pines
Disability Class: Hearing Difficulty
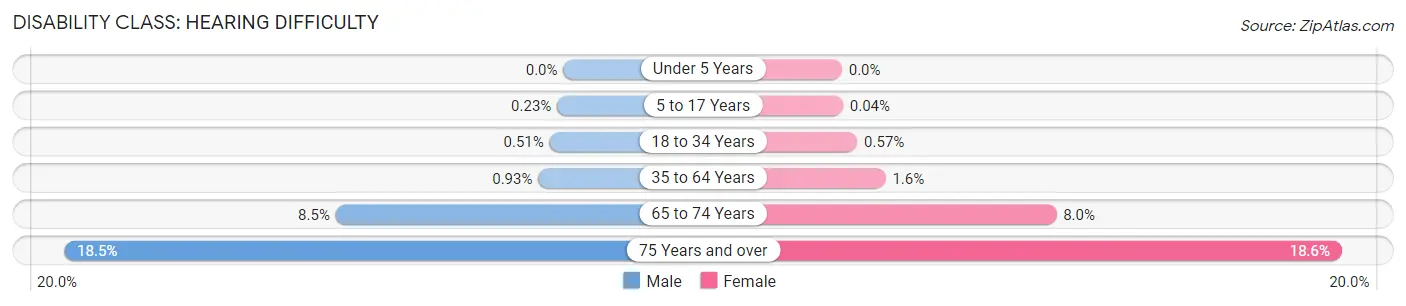
| Age Bracket | Male | Female |
| Under 5 Years | 0 (0.0%) | 0 (0.0%) |
| 5 to 17 Years | 30 (0.2%) | 5 (0.0%) |
| 18 to 34 Years | 88 (0.5%) | 86 (0.6%) |
| 35 to 64 Years | 318 (0.9%) | 590 (1.6%) |
| 65 to 74 Years | 602 (8.5%) | 773 (8.0%) |
| 75 Years and over | 1,072 (18.5%) | 1,758 (18.6%) |
Disability Class: Vision Difficulty
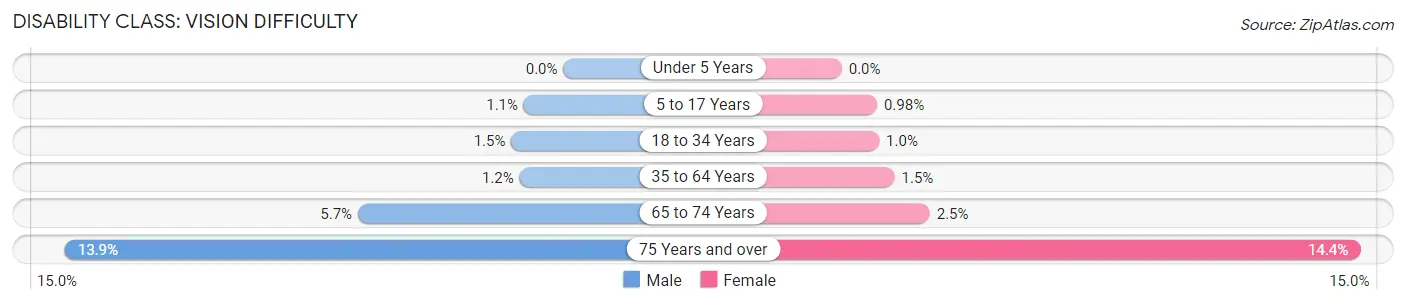
| Age Bracket | Male | Female |
| Under 5 Years | 0 (0.0%) | 0 (0.0%) |
| 5 to 17 Years | 140 (1.1%) | 134 (1.0%) |
| 18 to 34 Years | 251 (1.5%) | 158 (1.0%) |
| 35 to 64 Years | 416 (1.2%) | 537 (1.5%) |
| 65 to 74 Years | 407 (5.7%) | 238 (2.5%) |
| 75 Years and over | 803 (13.9%) | 1,367 (14.4%) |
Disability Class: Cognitive Difficulty
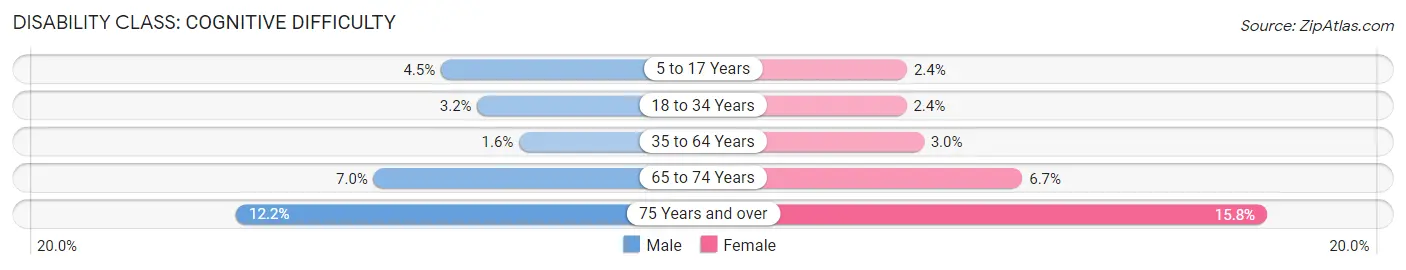
| Age Bracket | Male | Female |
| 5 to 17 Years | 580 (4.5%) | 330 (2.4%) |
| 18 to 34 Years | 554 (3.2%) | 364 (2.4%) |
| 35 to 64 Years | 558 (1.6%) | 1,112 (3.0%) |
| 65 to 74 Years | 501 (7.0%) | 651 (6.7%) |
| 75 Years and over | 703 (12.1%) | 1,495 (15.8%) |
Disability Class: Ambulatory Difficulty
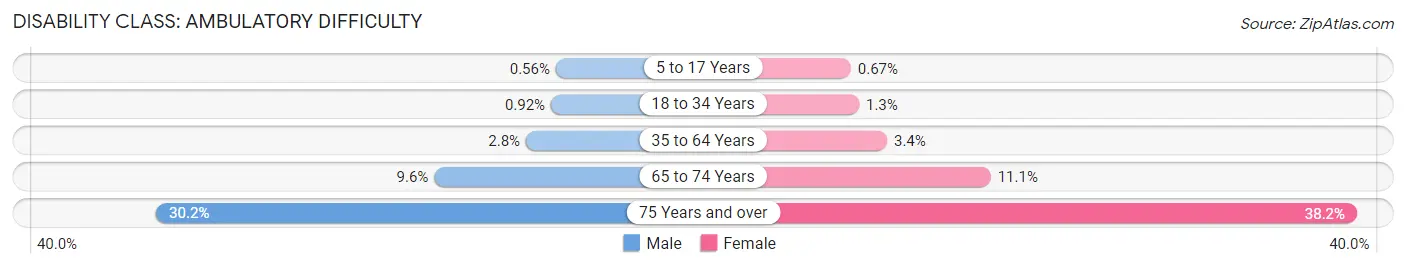
| Age Bracket | Male | Female |
| 5 to 17 Years | 71 (0.6%) | 91 (0.7%) |
| 18 to 34 Years | 160 (0.9%) | 194 (1.3%) |
| 35 to 64 Years | 948 (2.8%) | 1,229 (3.4%) |
| 65 to 74 Years | 683 (9.6%) | 1,075 (11.1%) |
| 75 Years and over | 1,749 (30.2%) | 3,623 (38.2%) |
Disability Class: Self-Care Difficulty
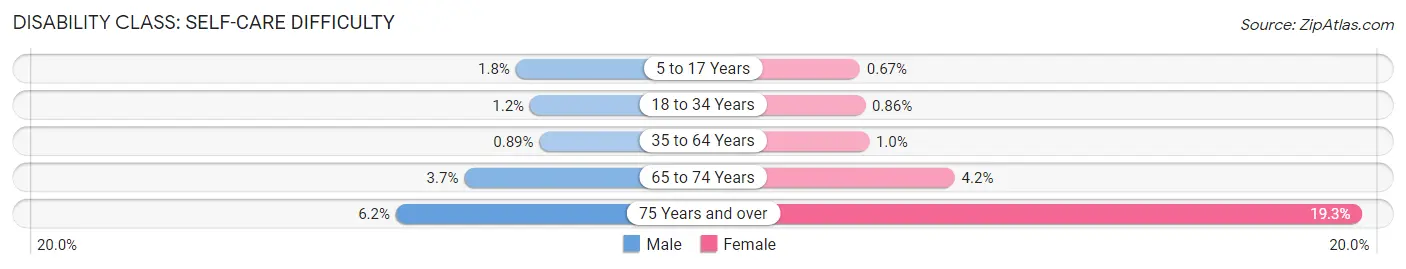
| Age Bracket | Male | Female |
| 5 to 17 Years | 226 (1.8%) | 91 (0.7%) |
| 18 to 34 Years | 216 (1.2%) | 131 (0.9%) |
| 35 to 64 Years | 305 (0.9%) | 370 (1.0%) |
| 65 to 74 Years | 262 (3.7%) | 407 (4.2%) |
| 75 Years and over | 360 (6.2%) | 1,830 (19.3%) |
Technology Access in Pembroke Pines
Computing Device Access in Pembroke Pines
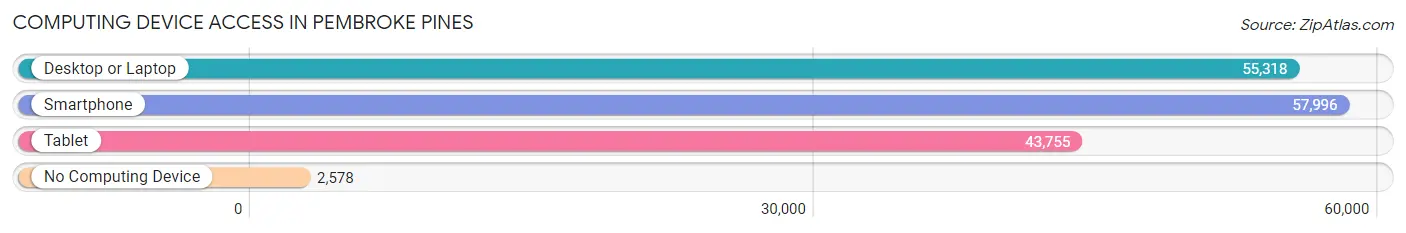
| Device Type | # Households | % Households |
| Desktop or Laptop | 55,318 | 88.1% |
| Smartphone | 57,996 | 92.3% |
| Tablet | 43,755 | 69.7% |
| No Computing Device | 2,578 | 4.1% |
| Total | 62,807 | 100.0% |
Internet Access in Pembroke Pines
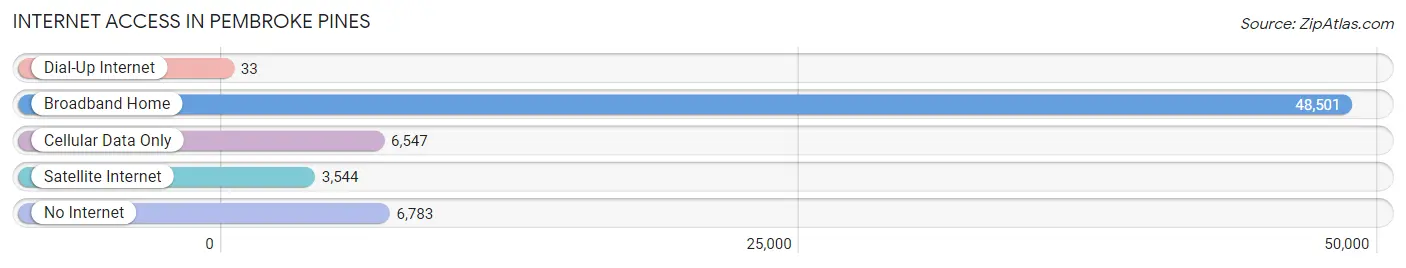
| Internet Type | # Households | % Households |
| Dial-Up Internet | 33 | 0.1% |
| Broadband Home | 48,501 | 77.2% |
| Cellular Data Only | 6,547 | 10.4% |
| Satellite Internet | 3,544 | 5.6% |
| No Internet | 6,783 | 10.8% |
| Total | 62,807 | 100.0% |
Pembroke Pines Summary
Pembroke Pines is a city located in Broward County, Florida, United States. It is located in the South Florida metropolitan area, which is home to 5.5 million people. The city is bordered by Miramar to the east, Hollywood to the south, and Pembroke Park to the west. As of the 2010 census, the city had a population of 154,750, making it the second most populous city in Broward County after Fort Lauderdale.
Geography
Pembroke Pines is located in southeastern Broward County, approximately 20 miles (32 km) north of Miami. It is bordered by Miramar to the east, Hollywood to the south, and Pembroke Park to the west. The city is situated on the Miami Rock Ridge, which is a ridge of limestone that runs from the Everglades to Lake Okeechobee. The city is located in the Miami metropolitan area, which is home to 5.5 million people.
The city has a total area of 31.3 square miles (81 km2), of which 30.9 square miles (80 km2) is land and 0.4 square miles (1.0 km2) (1.3%) is water.
History
Pembroke Pines was founded in the 1950s by developer Fred Peters. The city was named after the nearby Pembroke Pines Country Club, which was named after the pines that grew in the area. The city was incorporated in 1960 and has grown rapidly since then.
Economy
Pembroke Pines is home to a variety of businesses, including retail stores, restaurants, and professional services. The city is also home to several large employers, including Memorial Healthcare System, Broward County Public Schools, and the City of Pembroke Pines.
Demographics
As of the 2010 census, there were 154,750 people, 56,945 households, and 39,945 families residing in the city. The population density was 4,955.3 people per square mile (1,914.2/km2). There were 59,819 housing units at an average density of 1,922.3 per square mile (741.2/km2). The racial makeup of the city was 68.2% White (non-Hispanic), 16.2% African American, 0.2% Native American, 4.3% Asian, 0.1% Pacific Islander, 8.5% from other races, and 2.5% from two or more races. Hispanic or Latino of any race were 33.9% of the population.
The median income for a household in the city was $50,819, and the median income for a family was $55,849. Males had a median income of $36,819 versus $30,849 for females. The per capita income for the city was $22,097. About 8.9% of families and 11.6% of the population were below the poverty line, including 15.2% of those under age 18 and 9.8% of those age 65 or over.
Common Questions
What is Per Capita Income in Pembroke Pines?
Per Capita income in Pembroke Pines is $37,673.
What is the Median Family Income in Pembroke Pines?
Median Family Income in Pembroke Pines is $94,525.
What is the Median Household income in Pembroke Pines?
Median Household Income in Pembroke Pines is $77,657.
What is Income or Wage Gap in Pembroke Pines?
Income or Wage Gap in Pembroke Pines is 15.2%.
Women in Pembroke Pines earn 84.8 cents for every dollar earned by a man.
What is Family Income Deficit in Pembroke Pines?
Family Income Deficit in Pembroke Pines is $10,868.
Families that are below poverty line in Pembroke Pines earn $10,868 less on average than the poverty threshold level.
What is Inequality or Gini Index in Pembroke Pines?
Inequality or Gini Index in Pembroke Pines is 0.46.
What is the Total Population of Pembroke Pines?
Total Population of Pembroke Pines is 170,472.
What is the Total Male Population of Pembroke Pines?
Total Male Population of Pembroke Pines is 82,020.
What is the Total Female Population of Pembroke Pines?
Total Female Population of Pembroke Pines is 88,452.
What is the Ratio of Males per 100 Females in Pembroke Pines?
There are 92.73 Males per 100 Females in Pembroke Pines.
What is the Ratio of Females per 100 Males in Pembroke Pines?
There are 107.84 Females per 100 Males in Pembroke Pines.
What is the Median Population Age in Pembroke Pines?
Median Population Age in Pembroke Pines is 42.9 Years.
What is the Average Family Size in Pembroke Pines
Average Family Size in Pembroke Pines is 3.3 People.
What is the Average Household Size in Pembroke Pines
Average Household Size in Pembroke Pines is 2.7 People.
How Large is the Labor Force in Pembroke Pines?
There are 88,304 People in the Labor Forcein in Pembroke Pines.
What is the Percentage of People in the Labor Force in Pembroke Pines?
63.0% of People are in the Labor Force in Pembroke Pines.
What is the Unemployment Rate in Pembroke Pines?
Unemployment Rate in Pembroke Pines is 4.7%.