Wellington, FL Map & Demographics
Wellington Map
Wellington Overview
$51,226
PER CAPITA INCOME
$122,370
AVG FAMILY INCOME
$105,848
AVG HOUSEHOLD INCOME
38.5%
WAGE / INCOME GAP [ % ]
61.5¢/ $1
WAGE / INCOME GAP [ $ ]
$11,973
FAMILY INCOME DEFICIT
0.44
INEQUALITY / GINI INDEX
61,373
TOTAL POPULATION
29,131
MALE POPULATION
32,242
FEMALE POPULATION
90.35
MALES / 100 FEMALES
110.68
FEMALES / 100 MALES
41.5
MEDIAN AGE
3.3
AVG FAMILY SIZE
2.9
AVG HOUSEHOLD SIZE
30,244
LABOR FORCE [ PEOPLE ]
63.3%
PERCENT IN LABOR FORCE
4.6%
UNEMPLOYMENT RATE
Wellington Zip Codes
Wellington Area Codes
Income in Wellington
Income Overview in Wellington
Per Capita Income in Wellington is $51,226, while median incomes of families and households are $122,370 and $105,848 respectively.
| Characteristic | Number | Measure |
| Per Capita Income | 61,373 | $51,226 |
| Median Family Income | 16,391 | $122,370 |
| Mean Family Income | 16,391 | $159,759 |
| Median Household Income | 21,163 | $105,848 |
| Mean Household Income | 21,163 | $144,189 |
| Income Deficit | 16,391 | $11,973 |
| Wage / Income Gap (%) | 61,373 | 38.48% |
| Wage / Income Gap ($) | 61,373 | 61.52¢ per $1 |
| Gini / Inequality Index | 61,373 | 0.44 |
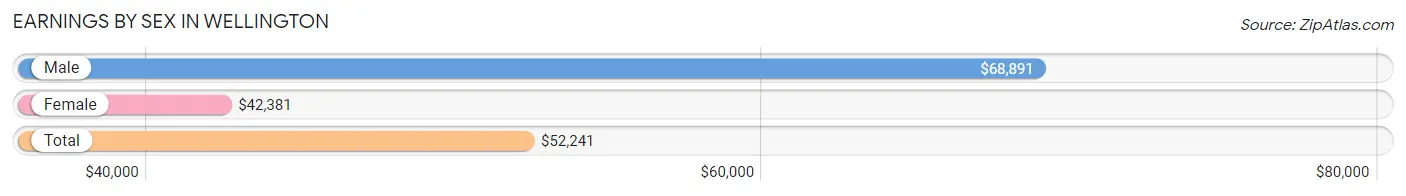
Earnings by Sex in Wellington
Average Earnings in Wellington are $52,241, $68,891 for men and $42,381 for women, a difference of 38.5%.
| Sex | Number | Average Earnings |
| Male | 16,299 (51.8%) | $68,891 |
| Female | 15,168 (48.2%) | $42,381 |
| Total | 31,467 (100.0%) | $52,241 |
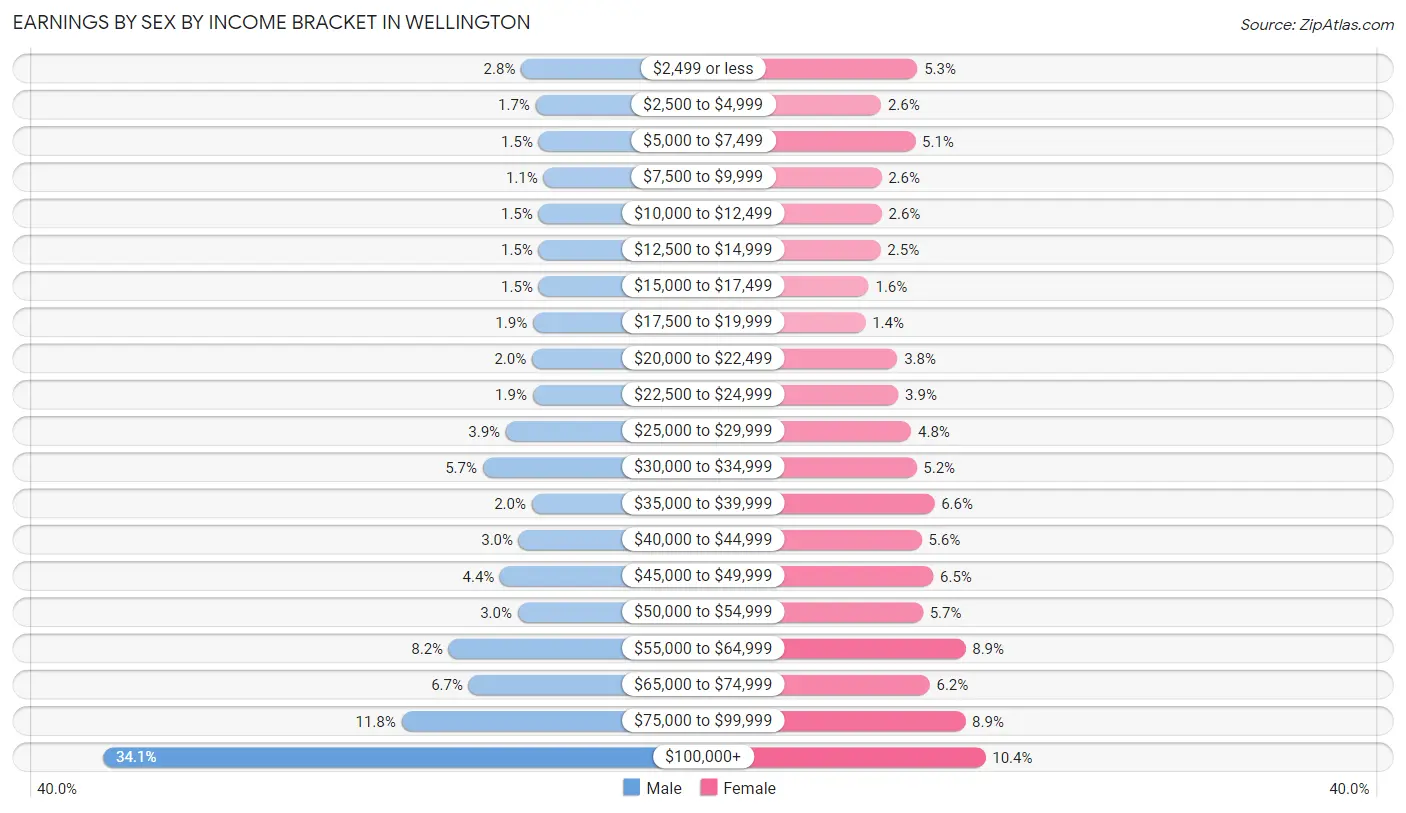
Earnings by Sex by Income Bracket in Wellington
The most common earnings brackets in Wellington are $100,000+ for men (5,561 | 34.1%) and $100,000+ for women (1,574 | 10.4%).
| Income | Male | Female |
| $2,499 or less | 453 (2.8%) | 801 (5.3%) |
| $2,500 to $4,999 | 277 (1.7%) | 389 (2.6%) |
| $5,000 to $7,499 | 239 (1.5%) | 776 (5.1%) |
| $7,500 to $9,999 | 181 (1.1%) | 392 (2.6%) |
| $10,000 to $12,499 | 242 (1.5%) | 396 (2.6%) |
| $12,500 to $14,999 | 242 (1.5%) | 382 (2.5%) |
| $15,000 to $17,499 | 240 (1.5%) | 247 (1.6%) |
| $17,500 to $19,999 | 309 (1.9%) | 210 (1.4%) |
| $20,000 to $22,499 | 321 (2.0%) | 573 (3.8%) |
| $22,500 to $24,999 | 313 (1.9%) | 584 (3.8%) |
| $25,000 to $29,999 | 641 (3.9%) | 731 (4.8%) |
| $30,000 to $34,999 | 923 (5.7%) | 791 (5.2%) |
| $35,000 to $39,999 | 324 (2.0%) | 993 (6.6%) |
| $40,000 to $44,999 | 482 (3.0%) | 850 (5.6%) |
| $45,000 to $49,999 | 711 (4.4%) | 982 (6.5%) |
| $50,000 to $54,999 | 496 (3.0%) | 863 (5.7%) |
| $55,000 to $64,999 | 1,336 (8.2%) | 1,347 (8.9%) |
| $65,000 to $74,999 | 1,093 (6.7%) | 941 (6.2%) |
| $75,000 to $99,999 | 1,915 (11.7%) | 1,346 (8.9%) |
| $100,000+ | 5,561 (34.1%) | 1,574 (10.4%) |
| Total | 16,299 (100.0%) | 15,168 (100.0%) |
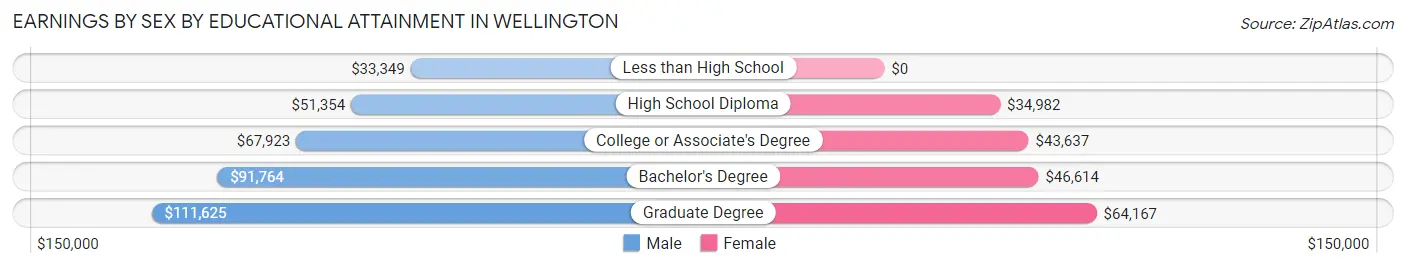
Earnings by Sex by Educational Attainment in Wellington
Average earnings in Wellington are $76,092 for men and $45,991 for women, a difference of 39.6%. Men with an educational attainment of graduate degree enjoy the highest average annual earnings of $111,625, while those with less than high school education earn the least with $33,349. Women with an educational attainment of graduate degree earn the most with the average annual earnings of $64,167, while those with high school diploma education have the smallest earnings of $34,982.
| Educational Attainment | Male Income | Female Income |
| Less than High School | $33,349 | $0 |
| High School Diploma | $51,354 | $34,982 |
| College or Associate's Degree | $67,923 | $43,637 |
| Bachelor's Degree | $91,764 | $46,614 |
| Graduate Degree | $111,625 | $64,167 |
| Total | $76,092 | $45,991 |
Family Income in Wellington
Family Income Brackets in Wellington
According to the Wellington family income data, there are 4,114 families falling into the $200,000+ income range, which is the most common income bracket and makes up 25.1% of all families. Conversely, the $10,000 to $14,999 income bracket is the least frequent group with only 180 families (1.1%) belonging to this category.
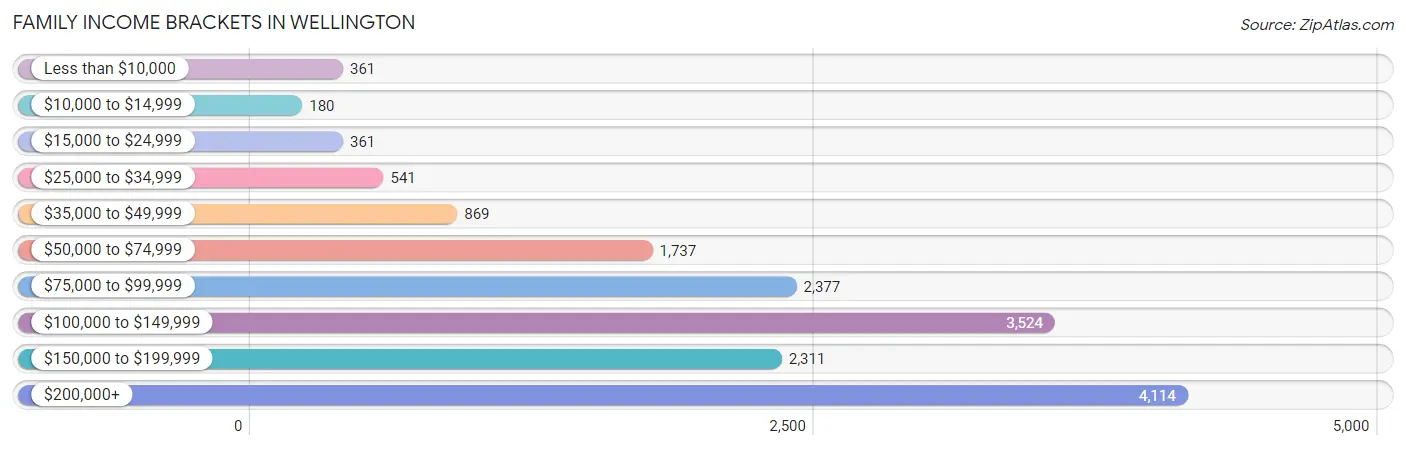
| Income Bracket | # Families | % Families |
| Less than $10,000 | 361 | 2.2% |
| $10,000 to $14,999 | 180 | 1.1% |
| $15,000 to $24,999 | 361 | 2.2% |
| $25,000 to $34,999 | 541 | 3.3% |
| $35,000 to $49,999 | 869 | 5.3% |
| $50,000 to $74,999 | 1,737 | 10.6% |
| $75,000 to $99,999 | 2,377 | 14.5% |
| $100,000 to $149,999 | 3,524 | 21.5% |
| $150,000 to $199,999 | 2,311 | 14.1% |
| $200,000+ | 4,114 | 25.1% |
Family Income by Famaliy Size in Wellington
7+ person families (283 | 1.7%) account for the highest median family income in Wellington with $250,001 per family, while 2-person families (6,546 | 39.9%) have the highest median income of $55,213 per family member.
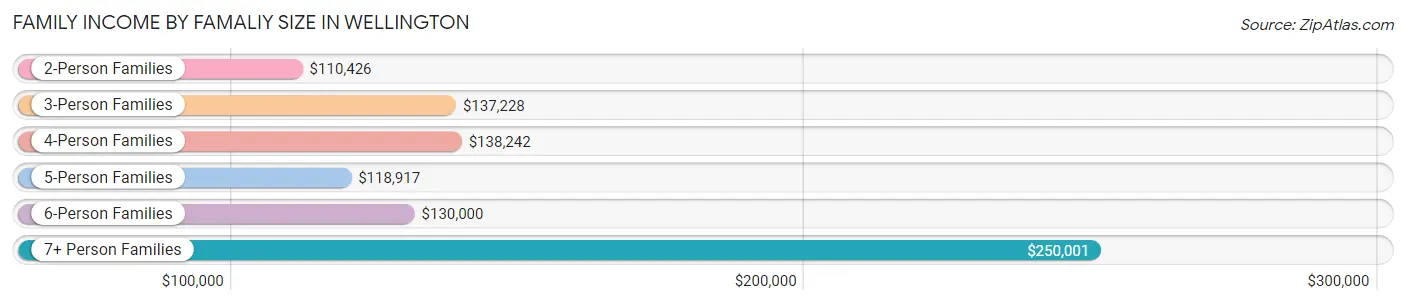
| Income Bracket | # Families | Median Income |
| 2-Person Families | 6,546 (39.9%) | $110,426 |
| 3-Person Families | 4,013 (24.5%) | $137,228 |
| 4-Person Families | 3,193 (19.5%) | $138,242 |
| 5-Person Families | 2,110 (12.9%) | $118,917 |
| 6-Person Families | 246 (1.5%) | $130,000 |
| 7+ Person Families | 283 (1.7%) | $250,001 |
| Total | 16,391 (100.0%) | $122,370 |
Family Income by Number of Earners in Wellington
The median family income in Wellington is $122,370, with families comprising 3+ earners (1,922) having the highest median family income of $168,491, while families with no earners (2,091) have the lowest median family income of $55,953, accounting for 11.7% and 12.8% of families, respectively.
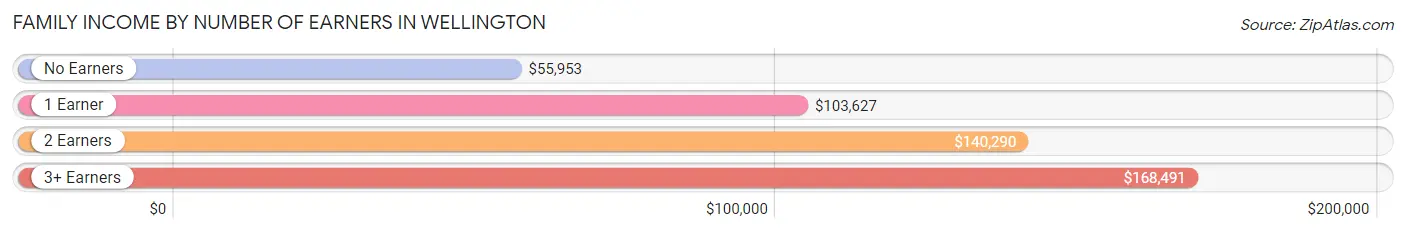
| Number of Earners | # Families | Median Income |
| No Earners | 2,091 (12.8%) | $55,953 |
| 1 Earner | 5,171 (31.6%) | $103,627 |
| 2 Earners | 7,207 (44.0%) | $140,290 |
| 3+ Earners | 1,922 (11.7%) | $168,491 |
| Total | 16,391 (100.0%) | $122,370 |
Household Income in Wellington
Household Income Brackets in Wellington
With 4,635 households falling in the category, the $200,000+ income range is the most frequent in Wellington, accounting for 21.9% of all households. In contrast, only 339 households (1.6%) fall into the $10,000 to $14,999 income bracket, making it the least populous group.
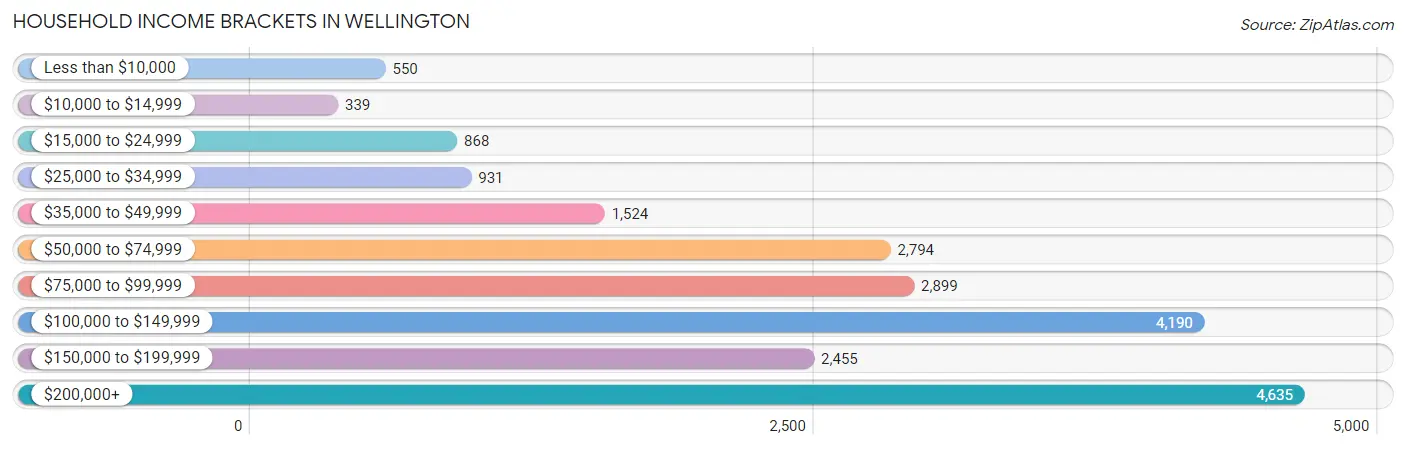
| Income Bracket | # Households | % Households |
| Less than $10,000 | 550 | 2.6% |
| $10,000 to $14,999 | 339 | 1.6% |
| $15,000 to $24,999 | 868 | 4.1% |
| $25,000 to $34,999 | 931 | 4.4% |
| $35,000 to $49,999 | 1,524 | 7.2% |
| $50,000 to $74,999 | 2,794 | 13.2% |
| $75,000 to $99,999 | 2,899 | 13.7% |
| $100,000 to $149,999 | 4,190 | 19.8% |
| $150,000 to $199,999 | 2,455 | 11.6% |
| $200,000+ | 4,635 | 21.9% |
Household Income by Householder Age in Wellington
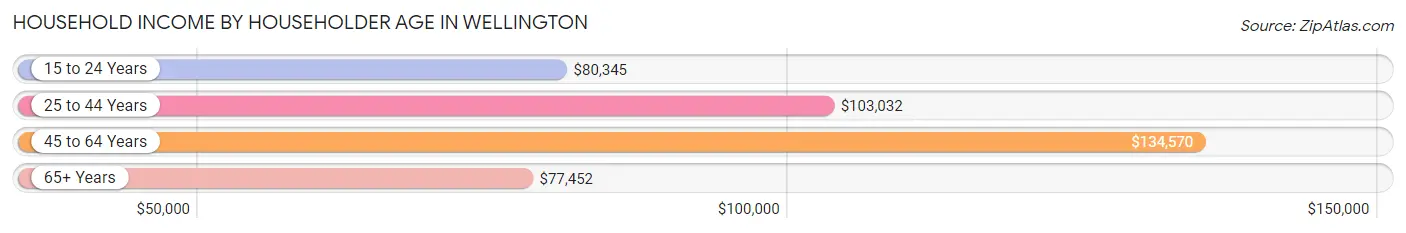
The median household income in Wellington is $105,848, with the highest median household income of $134,570 found in the 45 to 64 years age bracket for the primary householder. A total of 9,370 households (44.3%) fall into this category. Meanwhile, the 65+ years age bracket for the primary householder has the lowest median household income of $77,452, with 6,080 households (28.7%) in this group.
| Income Bracket | # Households | Median Income |
| 15 to 24 Years | 152 (0.7%) | $80,345 |
| 25 to 44 Years | 5,561 (26.3%) | $103,032 |
| 45 to 64 Years | 9,370 (44.3%) | $134,570 |
| 65+ Years | 6,080 (28.7%) | $77,452 |
| Total | 21,163 (100.0%) | $105,848 |
Poverty in Wellington
Income Below Poverty by Sex and Age in Wellington
With 5.0% poverty level for males and 7.5% for females among the residents of Wellington, 12 to 14 year old males and 5 year old females are the most vulnerable to poverty, with 128 males (8.3%) and 126 females (33.0%) in their respective age groups living below the poverty level.
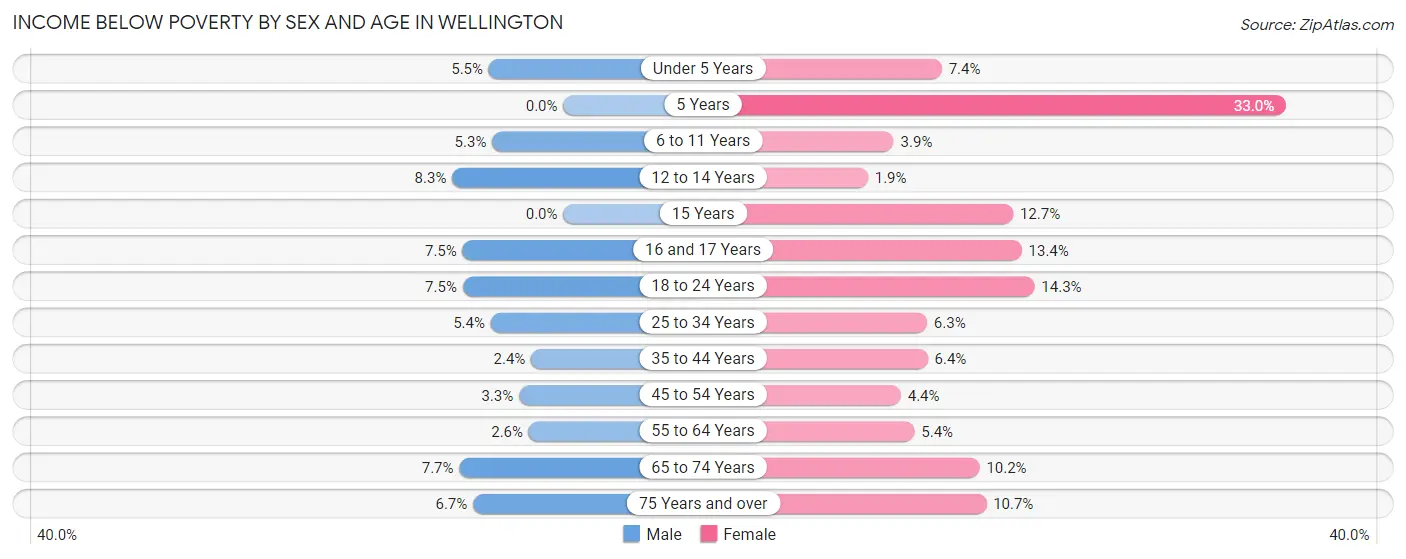
| Age Bracket | Male | Female |
| Under 5 Years | 80 (5.5%) | 99 (7.4%) |
| 5 Years | 0 (0.0%) | 126 (33.0%) |
| 6 to 11 Years | 150 (5.3%) | 99 (3.8%) |
| 12 to 14 Years | 128 (8.3%) | 35 (1.9%) |
| 15 Years | 0 (0.0%) | 112 (12.7%) |
| 16 and 17 Years | 81 (7.5%) | 102 (13.4%) |
| 18 to 24 Years | 188 (7.5%) | 333 (14.3%) |
| 25 to 34 Years | 122 (5.4%) | 213 (6.3%) |
| 35 to 44 Years | 79 (2.4%) | 269 (6.4%) |
| 45 to 54 Years | 155 (3.3%) | 190 (4.4%) |
| 55 to 64 Years | 96 (2.6%) | 227 (5.4%) |
| 65 to 74 Years | 214 (7.7%) | 344 (10.2%) |
| 75 Years and over | 145 (6.7%) | 277 (10.7%) |
| Total | 1,438 (5.0%) | 2,426 (7.5%) |
Income Above Poverty by Sex and Age in Wellington
According to the poverty statistics in Wellington, males aged 5 years and females aged 12 to 14 years are the age groups that are most secure financially, with 100.0% of males and 98.1% of females in these age groups living above the poverty line.
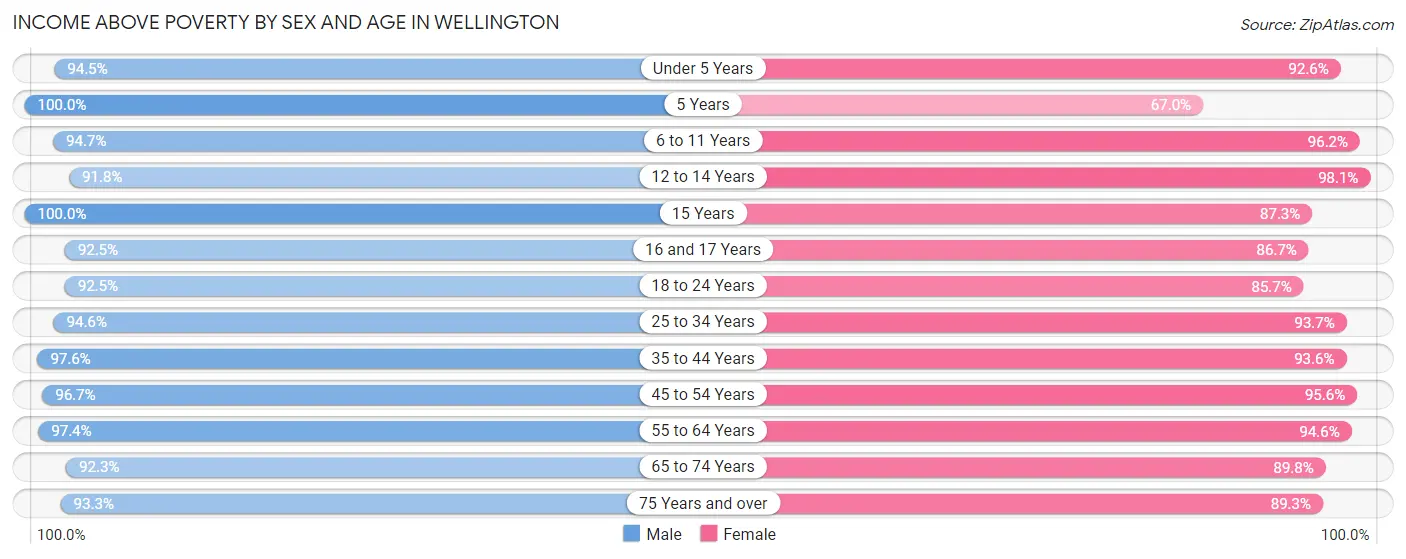
| Age Bracket | Male | Female |
| Under 5 Years | 1,367 (94.5%) | 1,236 (92.6%) |
| 5 Years | 314 (100.0%) | 256 (67.0%) |
| 6 to 11 Years | 2,693 (94.7%) | 2,472 (96.2%) |
| 12 to 14 Years | 1,424 (91.7%) | 1,779 (98.1%) |
| 15 Years | 262 (100.0%) | 769 (87.3%) |
| 16 and 17 Years | 1,002 (92.5%) | 662 (86.7%) |
| 18 to 24 Years | 2,329 (92.5%) | 1,996 (85.7%) |
| 25 to 34 Years | 2,141 (94.6%) | 3,156 (93.7%) |
| 35 to 44 Years | 3,230 (97.6%) | 3,954 (93.6%) |
| 45 to 54 Years | 4,556 (96.7%) | 4,150 (95.6%) |
| 55 to 64 Years | 3,652 (97.4%) | 3,981 (94.6%) |
| 65 to 74 Years | 2,559 (92.3%) | 3,022 (89.8%) |
| 75 Years and over | 2,019 (93.3%) | 2,306 (89.3%) |
| Total | 27,548 (95.0%) | 29,739 (92.5%) |
Income Below Poverty Among Married-Couple Families in Wellington
The poverty statistics for married-couple families in Wellington show that 3.5% or 453 of the total 13,130 families live below the poverty line. Families with no children have the highest poverty rate of 3.7%, comprising of 259 families. On the other hand, families with 5 or more children have the lowest poverty rate of 0.0%, which includes 0 families.
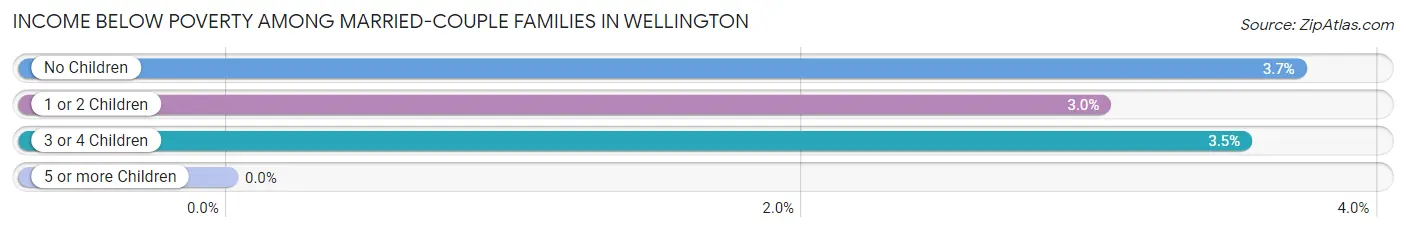
| Children | Above Poverty | Below Poverty |
| No Children | 6,703 (96.3%) | 259 (3.7%) |
| 1 or 2 Children | 4,527 (97.0%) | 142 (3.0%) |
| 3 or 4 Children | 1,420 (96.5%) | 52 (3.5%) |
| 5 or more Children | 27 (100.0%) | 0 (0.0%) |
| Total | 12,677 (96.6%) | 453 (3.5%) |
Income Below Poverty Among Single-Parent Households in Wellington
According to the poverty data in Wellington, 8.6% or 99 single-father households and 12.2% or 258 single-mother households are living below the poverty line. Among single-father households, those with 3 or 4 children have the highest poverty rate, with 25 households (50.0%) experiencing poverty. Likewise, among single-mother households, those with 3 or 4 children have the highest poverty rate, with 88 households (49.4%) falling below the poverty line.
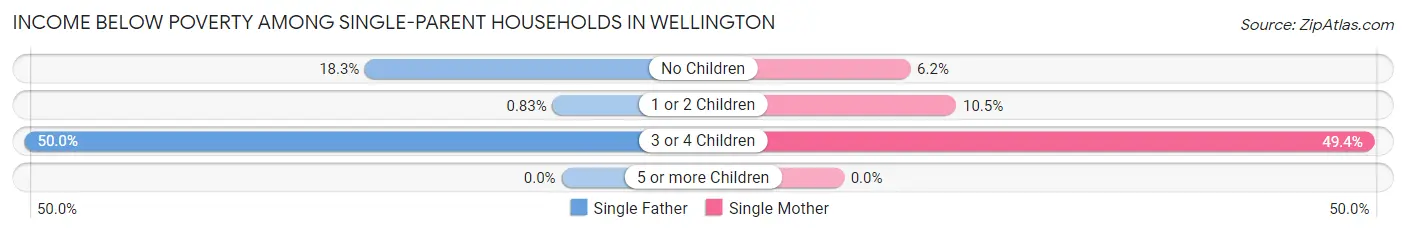
| Children | Single Father | Single Mother |
| No Children | 68 (18.3%) | 47 (6.2%) |
| 1 or 2 Children | 6 (0.8%) | 123 (10.5%) |
| 3 or 4 Children | 25 (50.0%) | 88 (49.4%) |
| 5 or more Children | 0 (0.0%) | 0 (0.0%) |
| Total | 99 (8.6%) | 258 (12.2%) |
Income Below Poverty Among Married-Couple vs Single-Parent Households in Wellington
The poverty data for Wellington shows that 453 of the married-couple family households (3.5%) and 357 of the single-parent households (11.0%) are living below the poverty level. Within the married-couple family households, those with no children have the highest poverty rate, with 259 households (3.7%) falling below the poverty line. Among the single-parent households, those with 3 or 4 children have the highest poverty rate, with 113 household (49.6%) living below poverty.
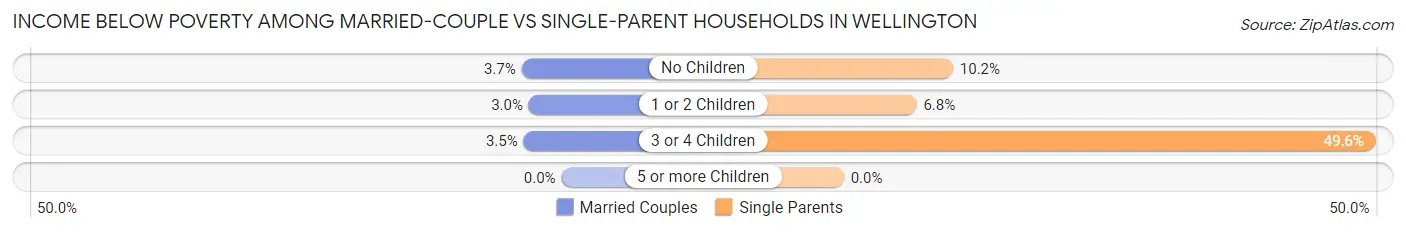
| Children | Married-Couple Families | Single-Parent Households |
| No Children | 259 (3.7%) | 115 (10.2%) |
| 1 or 2 Children | 142 (3.0%) | 129 (6.8%) |
| 3 or 4 Children | 52 (3.5%) | 113 (49.6%) |
| 5 or more Children | 0 (0.0%) | 0 (0.0%) |
| Total | 453 (3.5%) | 357 (11.0%) |
Race in Wellington
The most populous races in Wellington are White / Caucasian (39,767 | 64.8%), Hispanic or Latino (16,747 | 27.3%), and Two or more Races (8,943 | 14.6%).
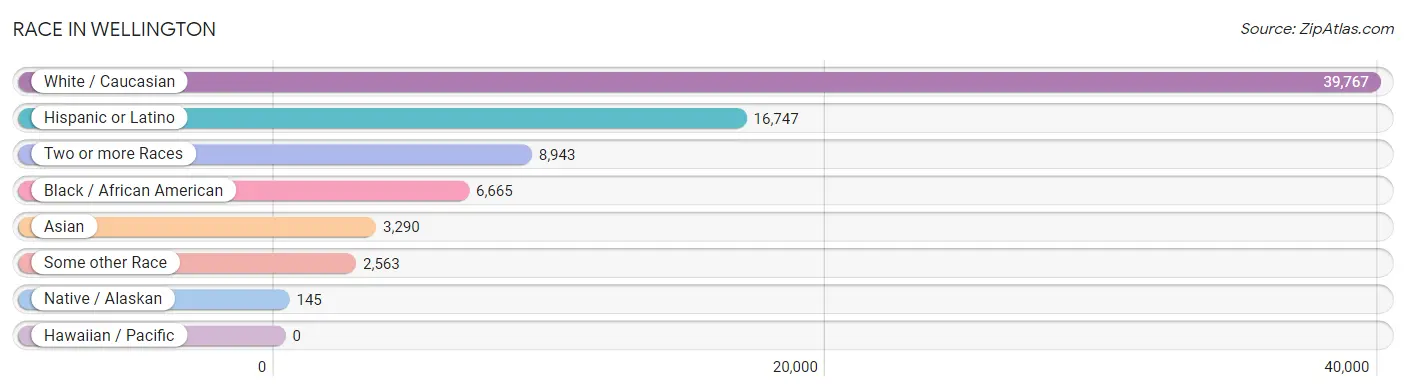
| Race | # Population | % Population |
| Asian | 3,290 | 5.4% |
| Black / African American | 6,665 | 10.9% |
| Hawaiian / Pacific | 0 | 0.0% |
| Hispanic or Latino | 16,747 | 27.3% |
| Native / Alaskan | 145 | 0.2% |
| White / Caucasian | 39,767 | 64.8% |
| Two or more Races | 8,943 | 14.6% |
| Some other Race | 2,563 | 4.2% |
| Total | 61,373 | 100.0% |
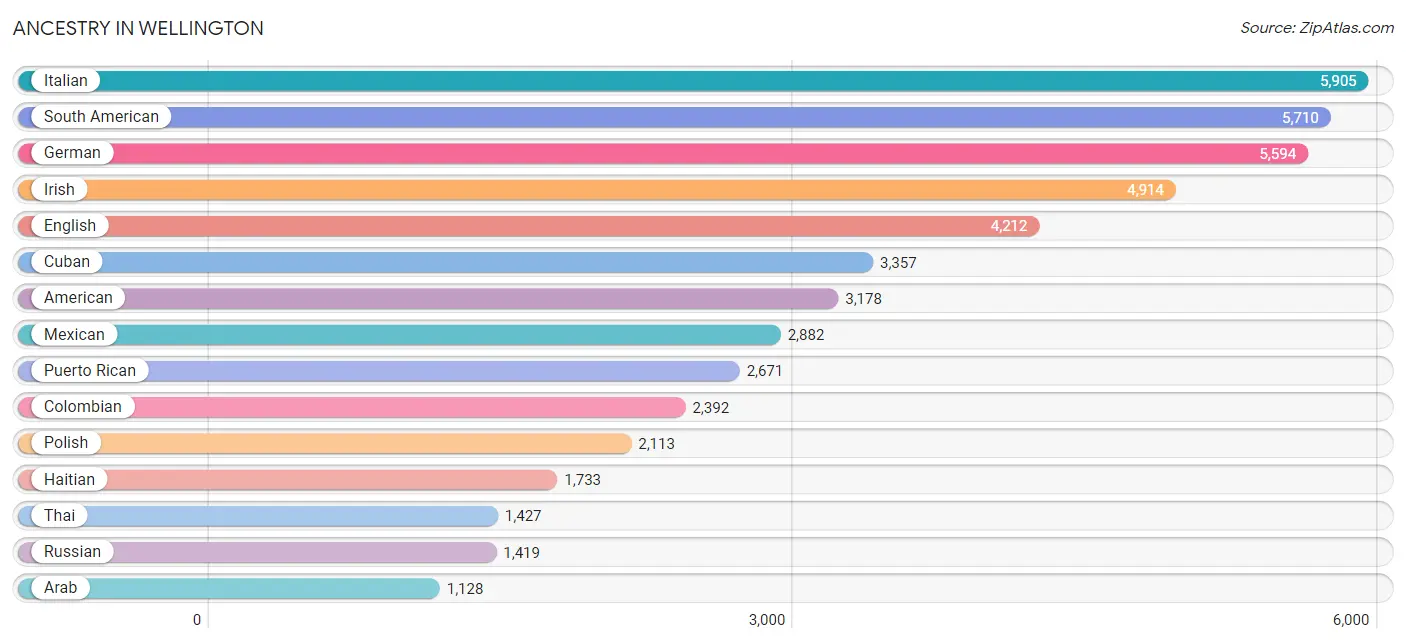
Ancestry in Wellington
The most populous ancestries reported in Wellington are Italian (5,905 | 9.6%), South American (5,710 | 9.3%), German (5,594 | 9.1%), Irish (4,914 | 8.0%), and English (4,212 | 6.9%), together accounting for 42.9% of all Wellington residents.
| Ancestry | # Population | % Population |
| Afghan | 40 | 0.1% |
| African | 687 | 1.1% |
| Albanian | 17 | 0.0% |
| Alsatian | 6 | 0.0% |
| American | 3,178 | 5.2% |
| Arab | 1,128 | 1.8% |
| Argentinean | 744 | 1.2% |
| Armenian | 71 | 0.1% |
| Austrian | 267 | 0.4% |
| Bahamian | 13 | 0.0% |
| Basque | 7 | 0.0% |
| Belgian | 6 | 0.0% |
| Bhutanese | 119 | 0.2% |
| Bolivian | 125 | 0.2% |
| Brazilian | 311 | 0.5% |
| British | 453 | 0.7% |
| British West Indian | 24 | 0.0% |
| Burmese | 32 | 0.1% |
| Cajun | 9 | 0.0% |
| Canadian | 179 | 0.3% |
| Cape Verdean | 28 | 0.1% |
| Celtic | 38 | 0.1% |
| Central American | 509 | 0.8% |
| Central American Indian | 125 | 0.2% |
| Cherokee | 60 | 0.1% |
| Chilean | 48 | 0.1% |
| Colombian | 2,392 | 3.9% |
| Costa Rican | 17 | 0.0% |
| Croatian | 39 | 0.1% |
| Cuban | 3,357 | 5.5% |
| Cypriot | 10 | 0.0% |
| Czech | 103 | 0.2% |
| Czechoslovakian | 65 | 0.1% |
| Danish | 38 | 0.1% |
| Dominican | 636 | 1.0% |
| Dutch | 303 | 0.5% |
| Eastern European | 556 | 0.9% |
| Ecuadorian | 505 | 0.8% |
| Egyptian | 161 | 0.3% |
| English | 4,212 | 6.9% |
| European | 1,024 | 1.7% |
| Filipino | 106 | 0.2% |
| Finnish | 81 | 0.1% |
| French | 1,108 | 1.8% |
| French Canadian | 316 | 0.5% |
| German | 5,594 | 9.1% |
| Greek | 308 | 0.5% |
| Guatemalan | 47 | 0.1% |
| Guyanese | 24 | 0.0% |
| Haitian | 1,733 | 2.8% |
| Honduran | 166 | 0.3% |
| Hungarian | 553 | 0.9% |
| Indian (Asian) | 1,120 | 1.8% |
| Iraqi | 26 | 0.0% |
| Irish | 4,914 | 8.0% |
| Israeli | 79 | 0.1% |
| Italian | 5,905 | 9.6% |
| Jamaican | 939 | 1.5% |
| Japanese | 17 | 0.0% |
| Jordanian | 9 | 0.0% |
| Korean | 365 | 0.6% |
| Latvian | 4 | 0.0% |
| Lebanese | 254 | 0.4% |
| Lithuanian | 258 | 0.4% |
| Luxembourger | 9 | 0.0% |
| Maltese | 10 | 0.0% |
| Mexican | 2,882 | 4.7% |
| Mexican American Indian | 61 | 0.1% |
| Nicaraguan | 151 | 0.3% |
| Nigerian | 32 | 0.1% |
| Northern European | 30 | 0.1% |
| Norwegian | 526 | 0.9% |
| Pakistani | 62 | 0.1% |
| Palestinian | 110 | 0.2% |
| Panamanian | 26 | 0.0% |
| Peruvian | 689 | 1.1% |
| Polish | 2,113 | 3.4% |
| Portuguese | 313 | 0.5% |
| Puerto Rican | 2,671 | 4.3% |
| Romanian | 156 | 0.3% |
| Russian | 1,419 | 2.3% |
| Salvadoran | 102 | 0.2% |
| Scandinavian | 151 | 0.3% |
| Scotch-Irish | 379 | 0.6% |
| Scottish | 689 | 1.1% |
| Slavic | 38 | 0.1% |
| Slovak | 49 | 0.1% |
| Slovene | 54 | 0.1% |
| South African | 7 | 0.0% |
| South American | 5,710 | 9.3% |
| South American Indian | 57 | 0.1% |
| Spaniard | 662 | 1.1% |
| Spanish | 73 | 0.1% |
| Sri Lankan | 550 | 0.9% |
| Subsaharan African | 761 | 1.2% |
| Swedish | 311 | 0.5% |
| Swiss | 187 | 0.3% |
| Thai | 1,427 | 2.3% |
| Trinidadian and Tobagonian | 213 | 0.4% |
| Turkish | 74 | 0.1% |
| Ukrainian | 105 | 0.2% |
| Uruguayan | 87 | 0.1% |
| Venezuelan | 1,120 | 1.8% |
| Vietnamese | 135 | 0.2% |
| Welsh | 206 | 0.3% |
| West Indian | 94 | 0.2% |
| Yugoslavian | 15 | 0.0% |
| Zimbabwean | 7 | 0.0% | View All 108 Rows |
Immigrants in Wellington
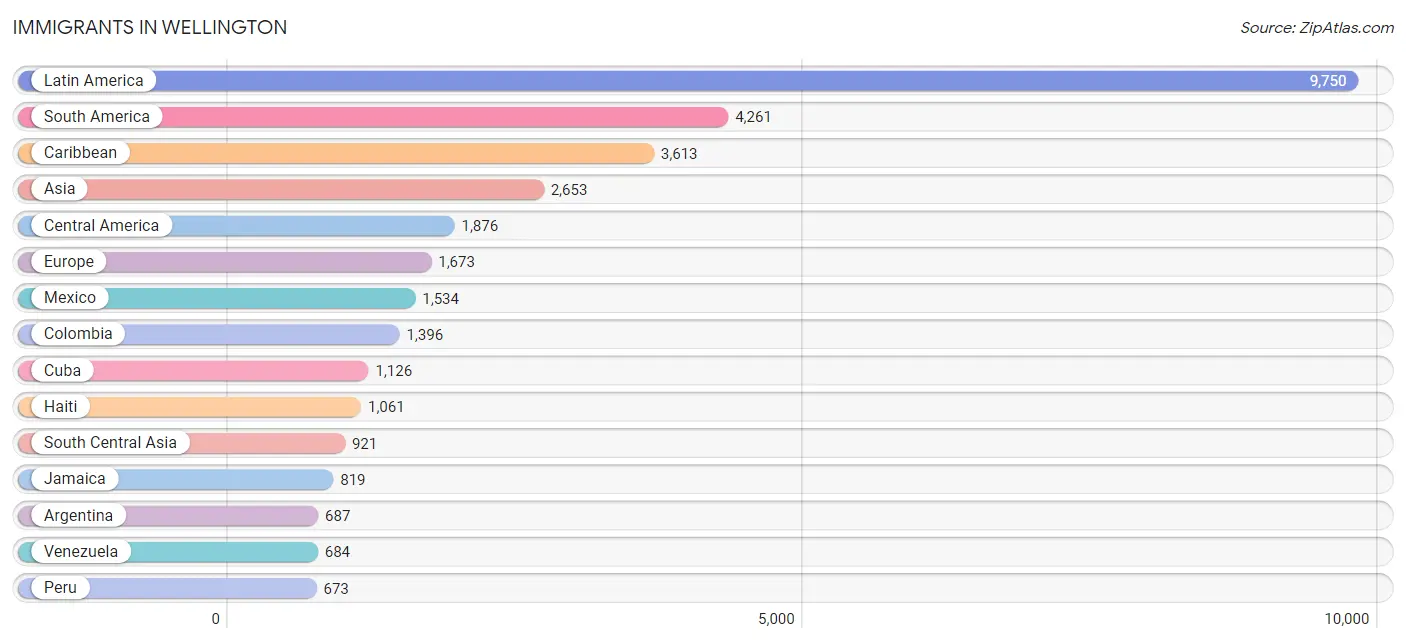
The most numerous immigrant groups reported in Wellington came from Latin America (9,750 | 15.9%), South America (4,261 | 6.9%), Caribbean (3,613 | 5.9%), Asia (2,653 | 4.3%), and Central America (1,876 | 3.1%), together accounting for 36.1% of all Wellington residents.
| Immigration Origin | # Population | % Population |
| Afghanistan | 40 | 0.1% |
| Africa | 627 | 1.0% |
| Argentina | 687 | 1.1% |
| Asia | 2,653 | 4.3% |
| Australia | 6 | 0.0% |
| Austria | 20 | 0.0% |
| Bahamas | 13 | 0.0% |
| Bangladesh | 194 | 0.3% |
| Bolivia | 36 | 0.1% |
| Brazil | 408 | 0.7% |
| Cabo Verde | 46 | 0.1% |
| Cambodia | 9 | 0.0% |
| Canada | 615 | 1.0% |
| Caribbean | 3,613 | 5.9% |
| Central America | 1,876 | 3.1% |
| Chile | 47 | 0.1% |
| China | 567 | 0.9% |
| Colombia | 1,396 | 2.3% |
| Costa Rica | 28 | 0.1% |
| Croatia | 8 | 0.0% |
| Cuba | 1,126 | 1.8% |
| Denmark | 18 | 0.0% |
| Dominican Republic | 321 | 0.5% |
| Eastern Africa | 88 | 0.1% |
| Eastern Asia | 604 | 1.0% |
| Eastern Europe | 406 | 0.7% |
| Ecuador | 249 | 0.4% |
| Egypt | 291 | 0.5% |
| El Salvador | 25 | 0.0% |
| England | 135 | 0.2% |
| Europe | 1,673 | 2.7% |
| France | 182 | 0.3% |
| Germany | 158 | 0.3% |
| Ghana | 13 | 0.0% |
| Greece | 18 | 0.0% |
| Grenada | 24 | 0.0% |
| Guatemala | 57 | 0.1% |
| Haiti | 1,061 | 1.7% |
| Honduras | 121 | 0.2% |
| Hong Kong | 70 | 0.1% |
| India | 534 | 0.9% |
| Iraq | 25 | 0.0% |
| Ireland | 48 | 0.1% |
| Israel | 19 | 0.0% |
| Italy | 88 | 0.1% |
| Jamaica | 819 | 1.3% |
| Japan | 20 | 0.0% |
| Jordan | 21 | 0.0% |
| Kenya | 81 | 0.1% |
| Korea | 17 | 0.0% |
| Latin America | 9,750 | 15.9% |
| Lebanon | 32 | 0.1% |
| Lithuania | 38 | 0.1% |
| Malaysia | 10 | 0.0% |
| Mexico | 1,534 | 2.5% |
| Moldova | 26 | 0.0% |
| Netherlands | 75 | 0.1% |
| Nicaragua | 77 | 0.1% |
| Northern Africa | 304 | 0.5% |
| Northern Europe | 373 | 0.6% |
| Norway | 8 | 0.0% |
| Oceania | 6 | 0.0% |
| Pakistan | 91 | 0.2% |
| Panama | 34 | 0.1% |
| Peru | 673 | 1.1% |
| Philippines | 200 | 0.3% |
| Poland | 148 | 0.2% |
| Portugal | 138 | 0.2% |
| Romania | 177 | 0.3% |
| Russia | 9 | 0.0% |
| South Africa | 57 | 0.1% |
| South America | 4,261 | 6.9% |
| South Central Asia | 921 | 1.5% |
| South Eastern Asia | 639 | 1.0% |
| Southern Europe | 441 | 0.7% |
| Spain | 197 | 0.3% |
| Sri Lanka | 39 | 0.1% |
| Switzerland | 9 | 0.0% |
| Syria | 359 | 0.6% |
| Taiwan | 54 | 0.1% |
| Thailand | 44 | 0.1% |
| Trinidad and Tobago | 249 | 0.4% |
| Uruguay | 53 | 0.1% |
| Uzbekistan | 23 | 0.0% |
| Venezuela | 684 | 1.1% |
| Vietnam | 376 | 0.6% |
| Western Africa | 59 | 0.1% |
| Western Asia | 489 | 0.8% |
| Western Europe | 453 | 0.7% |
| Zimbabwe | 7 | 0.0% | View All 90 Rows |
Sex and Age in Wellington
Sex and Age in Wellington
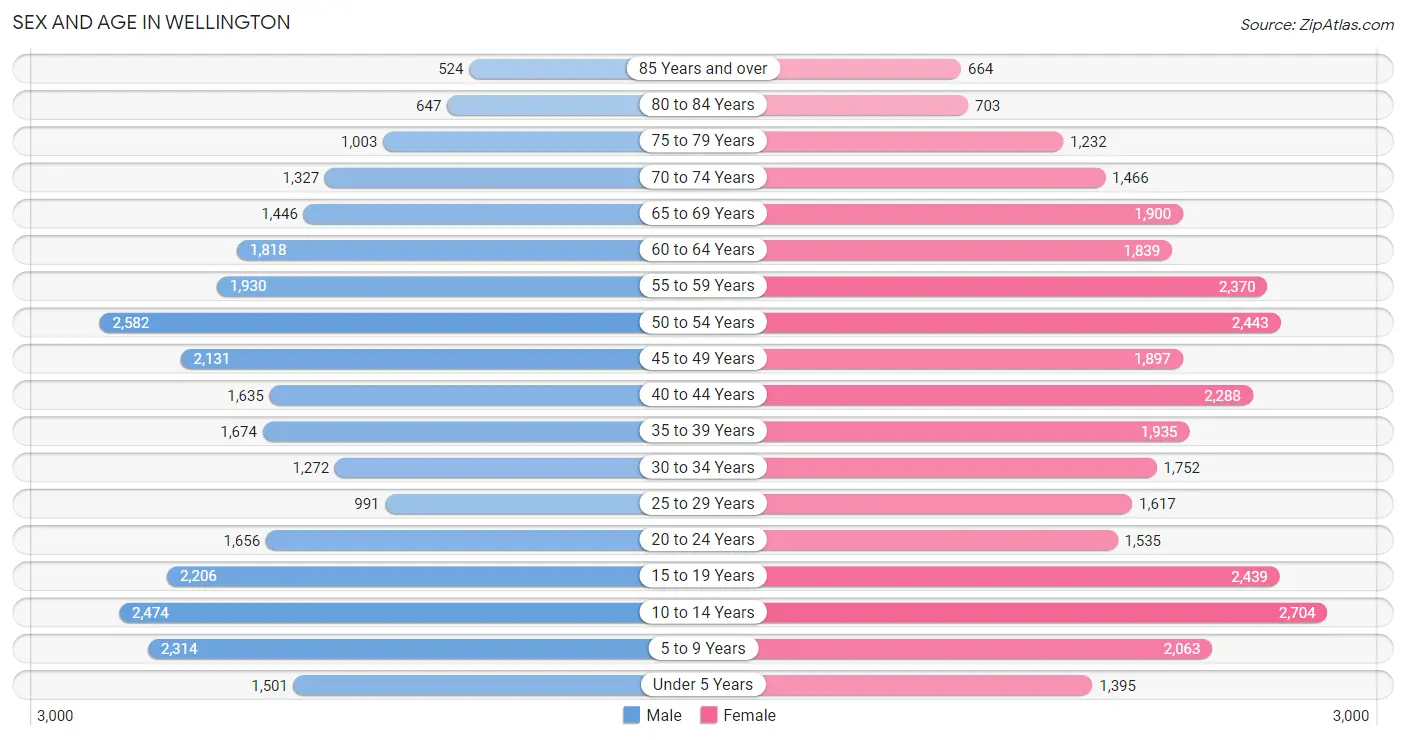
The most populous age groups in Wellington are 50 to 54 Years (2,582 | 8.9%) for men and 10 to 14 Years (2,704 | 8.4%) for women.
| Age Bracket | Male | Female |
| Under 5 Years | 1,501 (5.1%) | 1,395 (4.3%) |
| 5 to 9 Years | 2,314 (7.9%) | 2,063 (6.4%) |
| 10 to 14 Years | 2,474 (8.5%) | 2,704 (8.4%) |
| 15 to 19 Years | 2,206 (7.6%) | 2,439 (7.6%) |
| 20 to 24 Years | 1,656 (5.7%) | 1,535 (4.8%) |
| 25 to 29 Years | 991 (3.4%) | 1,617 (5.0%) |
| 30 to 34 Years | 1,272 (4.4%) | 1,752 (5.4%) |
| 35 to 39 Years | 1,674 (5.8%) | 1,935 (6.0%) |
| 40 to 44 Years | 1,635 (5.6%) | 2,288 (7.1%) |
| 45 to 49 Years | 2,131 (7.3%) | 1,897 (5.9%) |
| 50 to 54 Years | 2,582 (8.9%) | 2,443 (7.6%) |
| 55 to 59 Years | 1,930 (6.6%) | 2,370 (7.3%) |
| 60 to 64 Years | 1,818 (6.2%) | 1,839 (5.7%) |
| 65 to 69 Years | 1,446 (5.0%) | 1,900 (5.9%) |
| 70 to 74 Years | 1,327 (4.6%) | 1,466 (4.5%) |
| 75 to 79 Years | 1,003 (3.4%) | 1,232 (3.8%) |
| 80 to 84 Years | 647 (2.2%) | 703 (2.2%) |
| 85 Years and over | 524 (1.8%) | 664 (2.1%) |
| Total | 29,131 (100.0%) | 32,242 (100.0%) |
Families and Households in Wellington
Median Family Size in Wellington
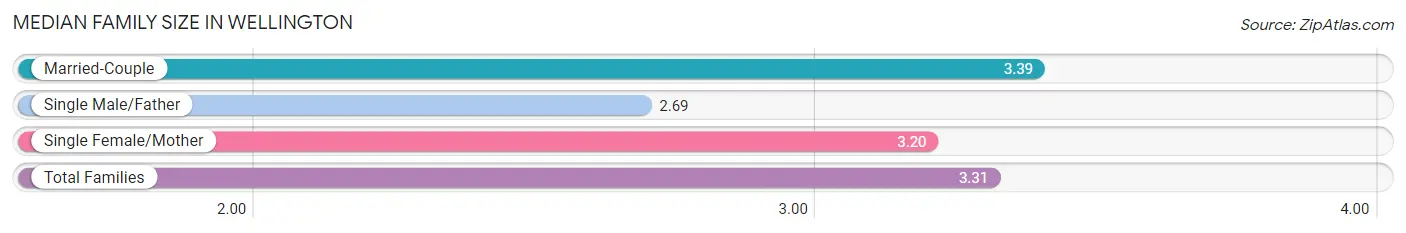
The median family size in Wellington is 3.31 persons per family, with married-couple families (13,130 | 80.1%) accounting for the largest median family size of 3.39 persons per family. On the other hand, single male/father families (1,149 | 7.0%) represent the smallest median family size with 2.69 persons per family.
| Family Type | # Families | Family Size |
| Married-Couple | 13,130 (80.1%) | 3.39 |
| Single Male/Father | 1,149 (7.0%) | 2.69 |
| Single Female/Mother | 2,112 (12.9%) | 3.20 |
| Total Families | 16,391 (100.0%) | 3.31 |
Median Household Size in Wellington
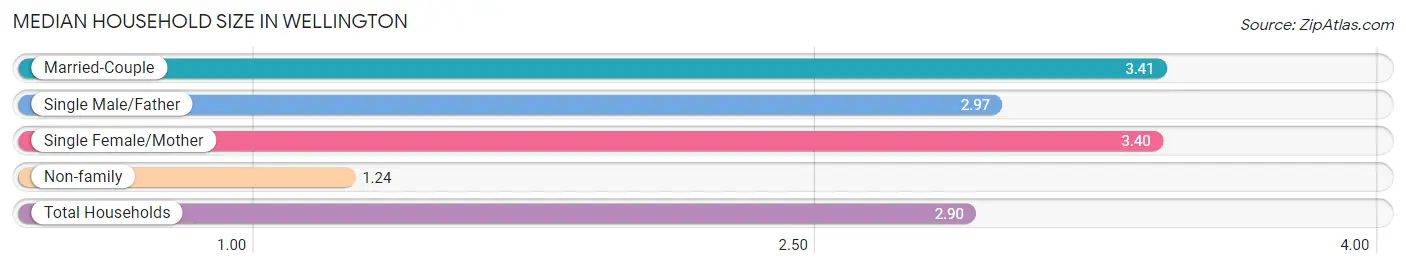
The median household size in Wellington is 2.90 persons per household, with married-couple households (13,130 | 62.0%) accounting for the largest median household size of 3.41 persons per household. non-family households (4,772 | 22.6%) represent the smallest median household size with 1.24 persons per household.
| Household Type | # Households | Household Size |
| Married-Couple | 13,130 (62.0%) | 3.41 |
| Single Male/Father | 1,149 (5.4%) | 2.97 |
| Single Female/Mother | 2,112 (10.0%) | 3.40 |
| Non-family | 4,772 (22.6%) | 1.24 |
| Total Households | 21,163 (100.0%) | 2.90 |
Household Size by Marriage Status in Wellington
Out of a total of 21,163 households in Wellington, 16,391 (77.4%) are family households, while 4,772 (22.6%) are nonfamily households. The most numerous type of family households are 2-person households, comprising 6,308, and the most common type of nonfamily households are 1-person households, comprising 3,808.
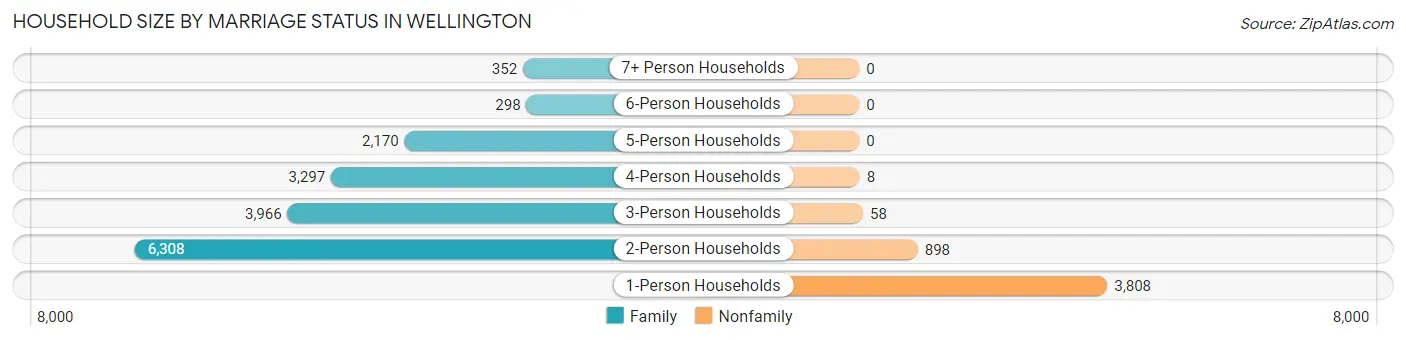
| Household Size | Family Households | Nonfamily Households |
| 1-Person Households | - | 3,808 (18.0%) |
| 2-Person Households | 6,308 (29.8%) | 898 (4.2%) |
| 3-Person Households | 3,966 (18.7%) | 58 (0.3%) |
| 4-Person Households | 3,297 (15.6%) | 8 (0.0%) |
| 5-Person Households | 2,170 (10.2%) | 0 (0.0%) |
| 6-Person Households | 298 (1.4%) | 0 (0.0%) |
| 7+ Person Households | 352 (1.7%) | 0 (0.0%) |
| Total | 16,391 (77.4%) | 4,772 (22.6%) |
Female Fertility in Wellington
Fertility by Age in Wellington
Average fertility rate in Wellington is 25.0 births per 1,000 women. Women in the age bracket of 20 to 34 years have the highest fertility rate with 35.0 births per 1,000 women. Women in the age bracket of 20 to 34 years acount for 49.4% of all women with births.
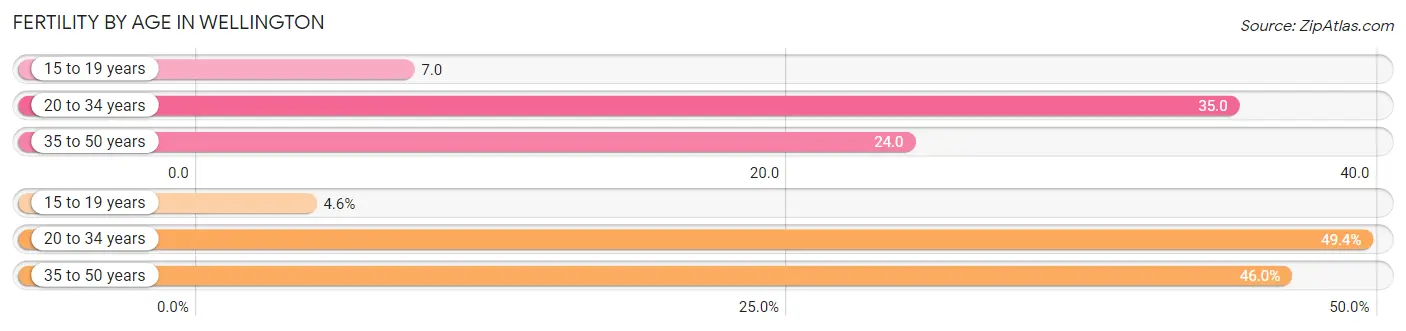
| Age Bracket | Women with Births | Births / 1,000 Women |
| 15 to 19 years | 16 (4.6%) | 7.0 |
| 20 to 34 years | 172 (49.4%) | 35.0 |
| 35 to 50 years | 160 (46.0%) | 24.0 |
| Total | 348 (100.0%) | 25.0 |
Fertility by Age by Marriage Status in Wellington
71.6% of women with births (348) in Wellington are married. The highest percentage of unmarried women with births falls into 20 to 34 years age bracket with 48.8% of them unmarried at the time of birth, while the lowest percentage of unmarried women with births belong to 15 to 19 years age bracket with 0.0% of them unmarried.
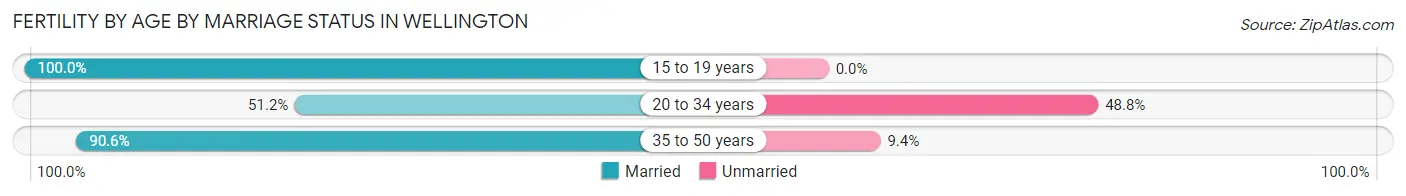
| Age Bracket | Married | Unmarried |
| 15 to 19 years | 16 (100.0%) | 0 (0.0%) |
| 20 to 34 years | 88 (51.2%) | 84 (48.8%) |
| 35 to 50 years | 145 (90.6%) | 15 (9.4%) |
| Total | 249 (71.6%) | 99 (28.4%) |
Fertility by Education in Wellington
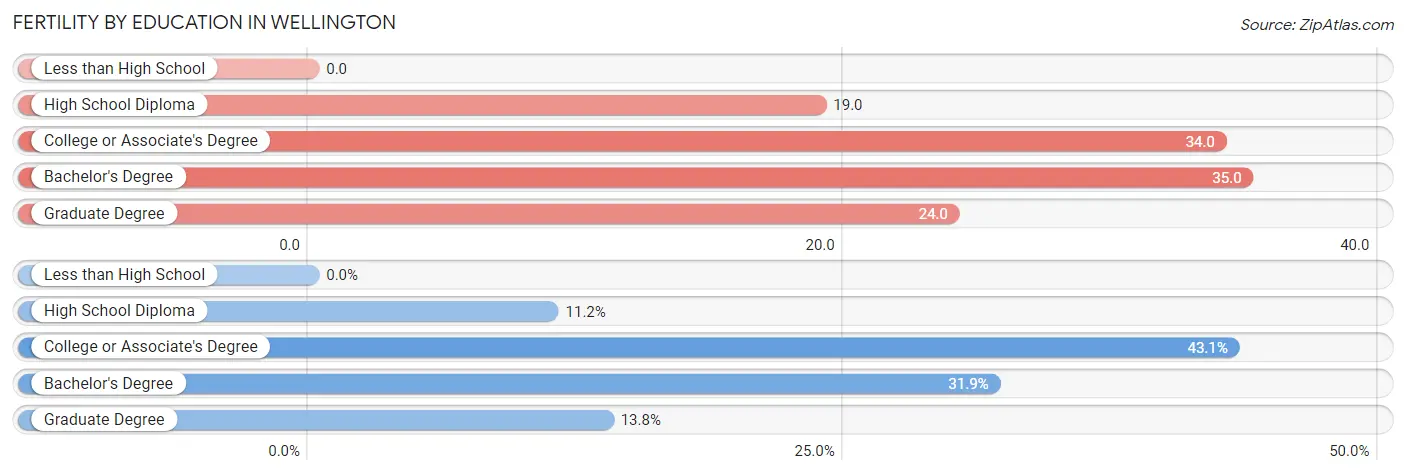
| Educational Attainment | Women with Births | Births / 1,000 Women |
| Less than High School | 0 (0.0%) | 0.0 |
| High School Diploma | 39 (11.2%) | 19.0 |
| College or Associate's Degree | 150 (43.1%) | 34.0 |
| Bachelor's Degree | 111 (31.9%) | 35.0 |
| Graduate Degree | 48 (13.8%) | 24.0 |
| Total | 348 (100.0%) | 25.0 |
Fertility by Education by Marriage Status in Wellington
28.4% of women with births in Wellington are unmarried. Women with the educational attainment of graduate degree are most likely to be married with 100.0% of them married at childbirth, while women with the educational attainment of college or associate's degree are least likely to be married with 58.0% of them unmarried at childbirth.
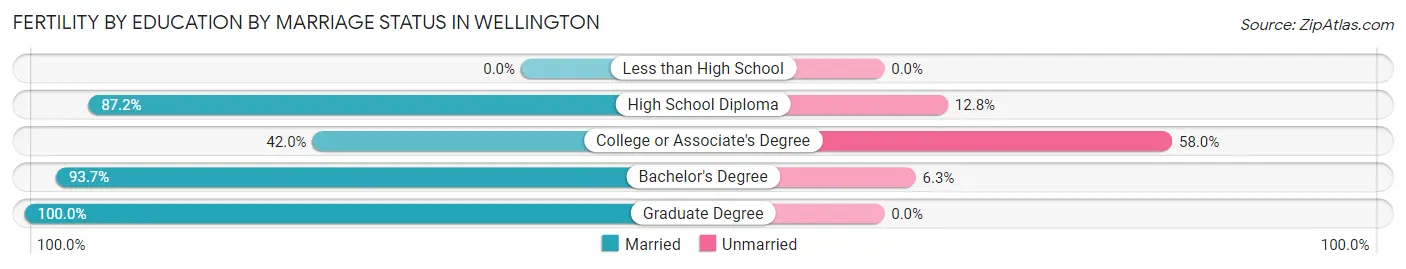
| Educational Attainment | Married | Unmarried |
| Less than High School | 0 (0.0%) | 0 (0.0%) |
| High School Diploma | 34 (87.2%) | 5 (12.8%) |
| College or Associate's Degree | 63 (42.0%) | 87 (58.0%) |
| Bachelor's Degree | 104 (93.7%) | 7 (6.3%) |
| Graduate Degree | 48 (100.0%) | 0 (0.0%) |
| Total | 249 (71.6%) | 99 (28.4%) |
Employment Characteristics in Wellington
Employment by Class of Employer in Wellington
Among the 27,769 employed individuals in Wellington, private company employees (17,721 | 63.8%), self-employed (incorporated) (3,130 | 11.3%), and local government employees (2,470 | 8.9%) make up the most common classes of employment.
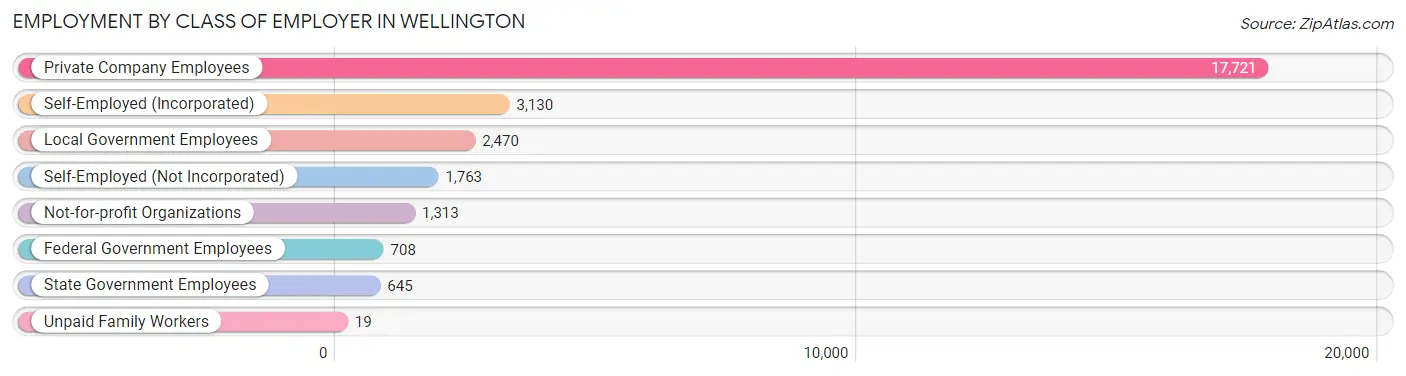
| Employer Class | # Employees | % Employees |
| Private Company Employees | 17,721 | 63.8% |
| Self-Employed (Incorporated) | 3,130 | 11.3% |
| Self-Employed (Not Incorporated) | 1,763 | 6.4% |
| Not-for-profit Organizations | 1,313 | 4.7% |
| Local Government Employees | 2,470 | 8.9% |
| State Government Employees | 645 | 2.3% |
| Federal Government Employees | 708 | 2.5% |
| Unpaid Family Workers | 19 | 0.1% |
| Total | 27,769 | 100.0% |
Employment Status by Age in Wellington
According to the labor force statistics for Wellington, out of the total population over 16 years of age (47,779), 63.3% or 30,244 individuals are in the labor force, with 4.6% or 1,391 of them unemployed. The age group with the highest labor force participation rate is 45 to 54 years, with 85.5% or 7,740 individuals in the labor force. Within the labor force, the 16 to 19 years age range has the highest percentage of unemployed individuals, with 37.9% or 396 of them being unemployed.
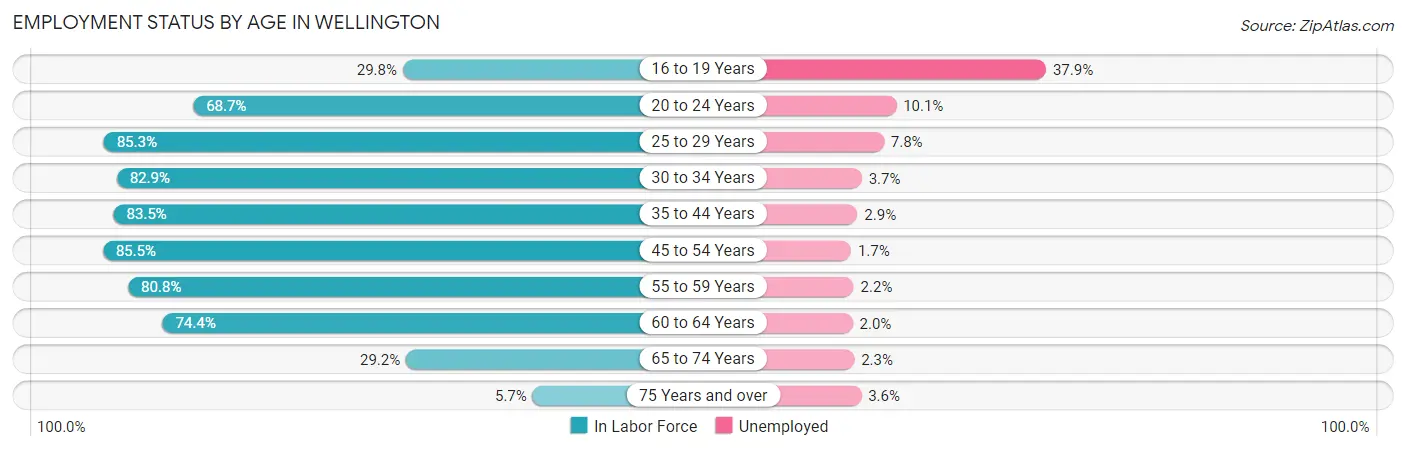
| Age Bracket | In Labor Force | Unemployed |
| 16 to 19 Years | 1,044 (29.8%) | 396 (37.9%) |
| 20 to 24 Years | 2,192 (68.7%) | 221 (10.1%) |
| 25 to 29 Years | 2,225 (85.3%) | 174 (7.8%) |
| 30 to 34 Years | 2,507 (82.9%) | 93 (3.7%) |
| 35 to 44 Years | 6,289 (83.5%) | 182 (2.9%) |
| 45 to 54 Years | 7,740 (85.5%) | 132 (1.7%) |
| 55 to 59 Years | 3,474 (80.8%) | 76 (2.2%) |
| 60 to 64 Years | 2,721 (74.4%) | 54 (2.0%) |
| 65 to 74 Years | 1,793 (29.2%) | 41 (2.3%) |
| 75 Years and over | 272 (5.7%) | 10 (3.6%) |
| Total | 30,244 (63.3%) | 1,391 (4.6%) |
Employment Status by Educational Attainment in Wellington
According to labor force statistics for Wellington, 82.7% of individuals (24,954) out of the total population between 25 and 64 years of age (30,174) are in the labor force, with 2.9% or 724 of them being unemployed. The group with the highest labor force participation rate are those with the educational attainment of bachelor's degree or higher, with 85.2% or 12,729 individuals in the labor force. Within the labor force, individuals with high school diploma education have the highest percentage of unemployment, with 5.3% or 198 of them being unemployed.
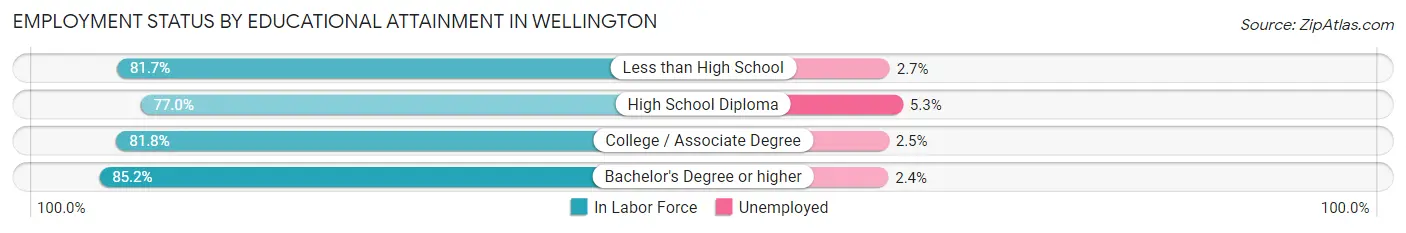
| Educational Attainment | In Labor Force | Unemployed |
| Less than High School | 1,284 (81.7%) | 42 (2.7%) |
| High School Diploma | 3,745 (77.0%) | 258 (5.3%) |
| College / Associate Degree | 7,198 (81.8%) | 220 (2.5%) |
| Bachelor's Degree or higher | 12,729 (85.2%) | 359 (2.4%) |
| Total | 24,954 (82.7%) | 875 (2.9%) |
Employment Occupations by Sex in Wellington
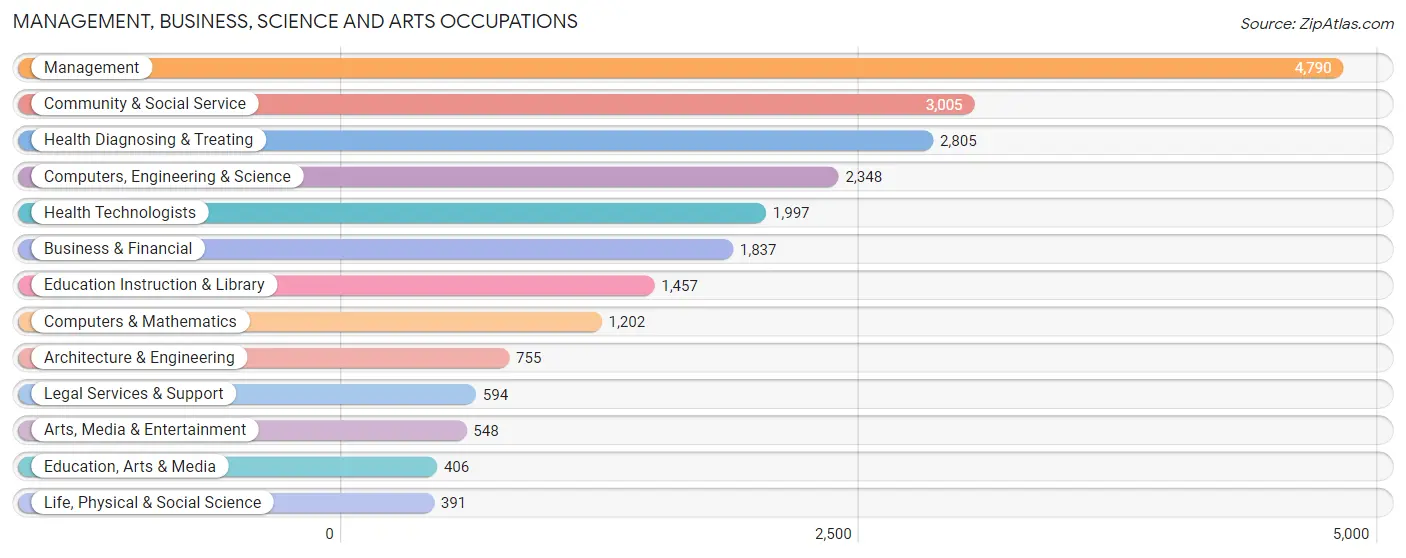
Management, Business, Science and Arts Occupations
The most common Management, Business, Science and Arts occupations in Wellington are Management (4,790 | 16.6%), Community & Social Service (3,005 | 10.4%), Health Diagnosing & Treating (2,805 | 9.7%), Computers, Engineering & Science (2,348 | 8.2%), and Health Technologists (1,997 | 6.9%).
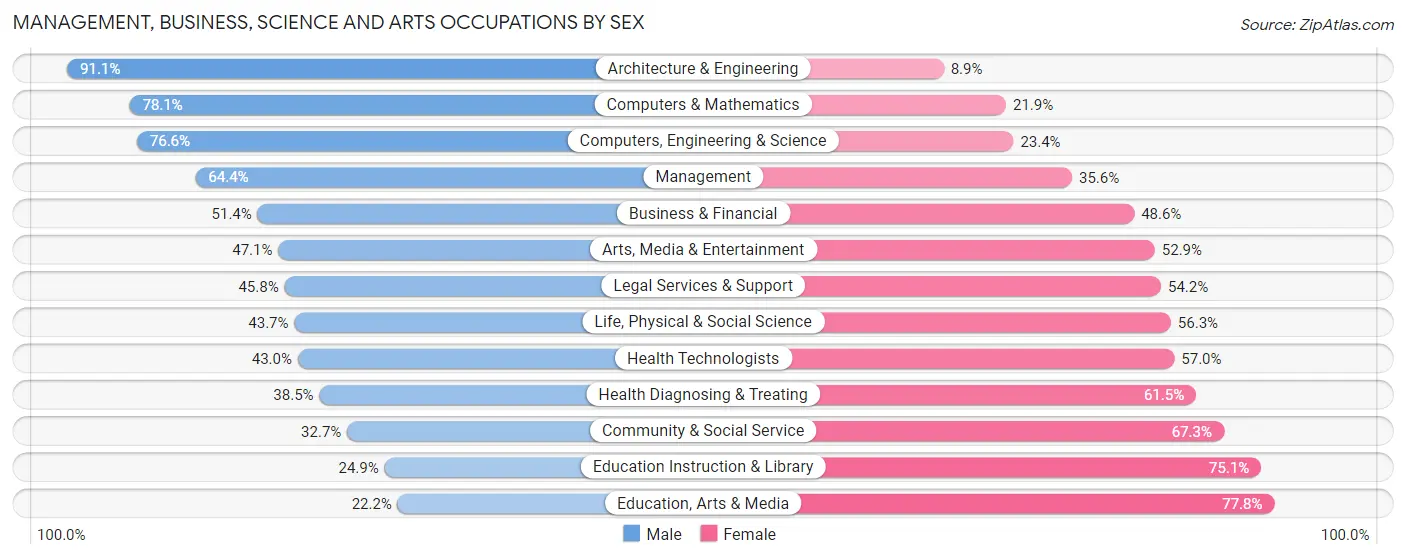
Management, Business, Science and Arts Occupations by Sex
Within the Management, Business, Science and Arts occupations in Wellington, the most male-oriented occupations are Architecture & Engineering (91.1%), Computers & Mathematics (78.1%), and Computers, Engineering & Science (76.6%), while the most female-oriented occupations are Education, Arts & Media (77.8%), Education Instruction & Library (75.1%), and Community & Social Service (67.3%).
| Occupation | Male | Female |
| Management | 3,083 (64.4%) | 1,707 (35.6%) |
| Business & Financial | 944 (51.4%) | 893 (48.6%) |
| Computers, Engineering & Science | 1,798 (76.6%) | 550 (23.4%) |
| Computers & Mathematics | 939 (78.1%) | 263 (21.9%) |
| Architecture & Engineering | 688 (91.1%) | 67 (8.9%) |
| Life, Physical & Social Science | 171 (43.7%) | 220 (56.3%) |
| Community & Social Service | 983 (32.7%) | 2,022 (67.3%) |
| Education, Arts & Media | 90 (22.2%) | 316 (77.8%) |
| Legal Services & Support | 272 (45.8%) | 322 (54.2%) |
| Education Instruction & Library | 363 (24.9%) | 1,094 (75.1%) |
| Arts, Media & Entertainment | 258 (47.1%) | 290 (52.9%) |
| Health Diagnosing & Treating | 1,080 (38.5%) | 1,725 (61.5%) |
| Health Technologists | 859 (43.0%) | 1,138 (57.0%) |
| Total (Category) | 7,888 (53.3%) | 6,897 (46.7%) |
| Total (Overall) | 15,193 (52.7%) | 13,634 (47.3%) |
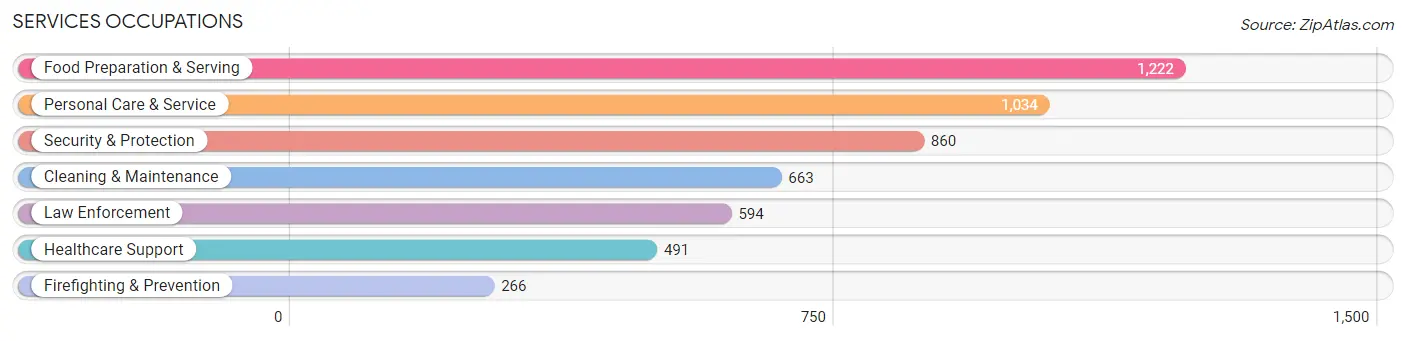
Services Occupations
The most common Services occupations in Wellington are Food Preparation & Serving (1,222 | 4.2%), Personal Care & Service (1,034 | 3.6%), Security & Protection (860 | 3.0%), Cleaning & Maintenance (663 | 2.3%), and Law Enforcement (594 | 2.1%).
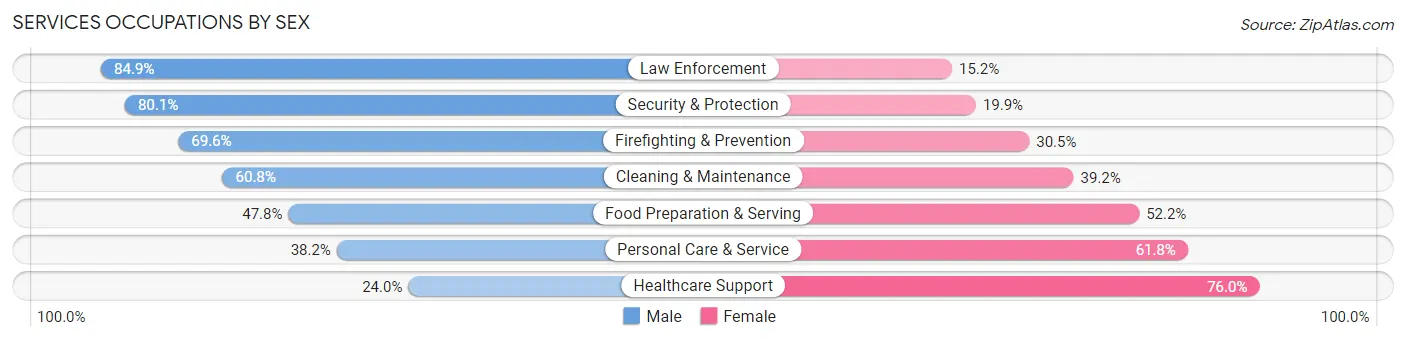
Services Occupations by Sex
Within the Services occupations in Wellington, the most male-oriented occupations are Law Enforcement (84.9%), Security & Protection (80.1%), and Firefighting & Prevention (69.6%), while the most female-oriented occupations are Healthcare Support (76.0%), Personal Care & Service (61.8%), and Food Preparation & Serving (52.2%).
| Occupation | Male | Female |
| Healthcare Support | 118 (24.0%) | 373 (76.0%) |
| Security & Protection | 689 (80.1%) | 171 (19.9%) |
| Firefighting & Prevention | 185 (69.6%) | 81 (30.4%) |
| Law Enforcement | 504 (84.9%) | 90 (15.1%) |
| Food Preparation & Serving | 584 (47.8%) | 638 (52.2%) |
| Cleaning & Maintenance | 403 (60.8%) | 260 (39.2%) |
| Personal Care & Service | 395 (38.2%) | 639 (61.8%) |
| Total (Category) | 2,189 (51.3%) | 2,081 (48.7%) |
| Total (Overall) | 15,193 (52.7%) | 13,634 (47.3%) |
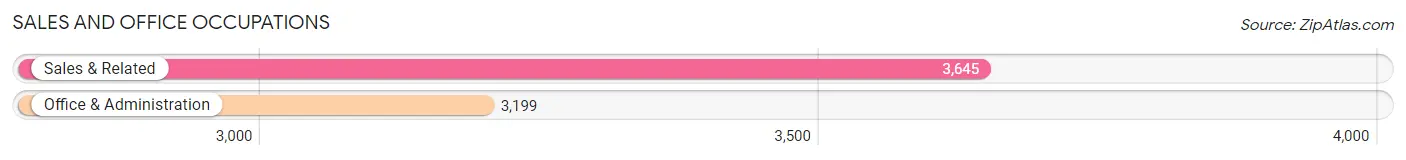
Sales and Office Occupations
The most common Sales and Office occupations in Wellington are Sales & Related (3,645 | 12.6%), and Office & Administration (3,199 | 11.1%).
Sales and Office Occupations by Sex
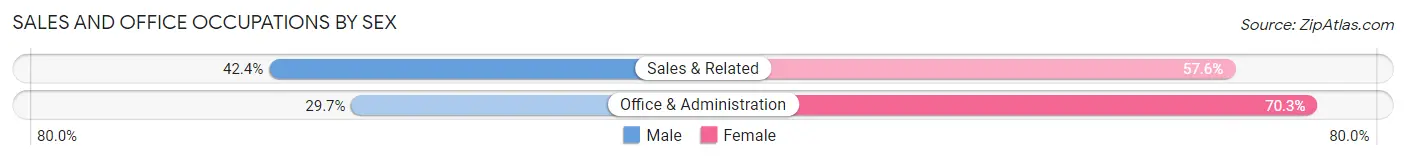
| Occupation | Male | Female |
| Sales & Related | 1,545 (42.4%) | 2,100 (57.6%) |
| Office & Administration | 951 (29.7%) | 2,248 (70.3%) |
| Total (Category) | 2,496 (36.5%) | 4,348 (63.5%) |
| Total (Overall) | 15,193 (52.7%) | 13,634 (47.3%) |
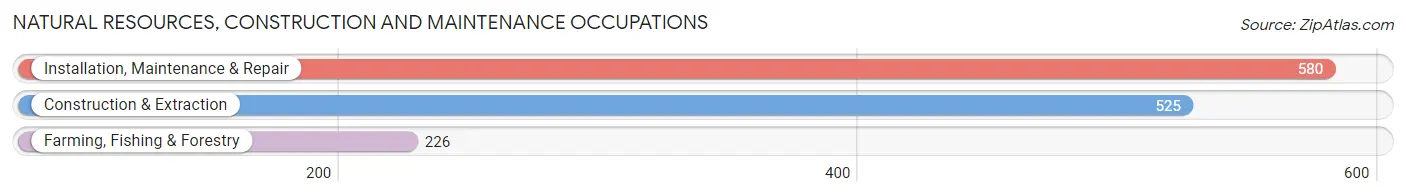
Natural Resources, Construction and Maintenance Occupations
The most common Natural Resources, Construction and Maintenance occupations in Wellington are Installation, Maintenance & Repair (580 | 2.0%), Construction & Extraction (525 | 1.8%), and Farming, Fishing & Forestry (226 | 0.8%).
Natural Resources, Construction and Maintenance Occupations by Sex
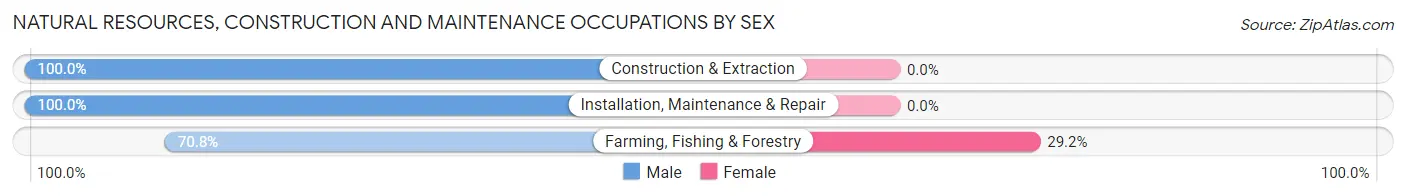
| Occupation | Male | Female |
| Farming, Fishing & Forestry | 160 (70.8%) | 66 (29.2%) |
| Construction & Extraction | 525 (100.0%) | 0 (0.0%) |
| Installation, Maintenance & Repair | 580 (100.0%) | 0 (0.0%) |
| Total (Category) | 1,265 (95.0%) | 66 (5.0%) |
| Total (Overall) | 15,193 (52.7%) | 13,634 (47.3%) |
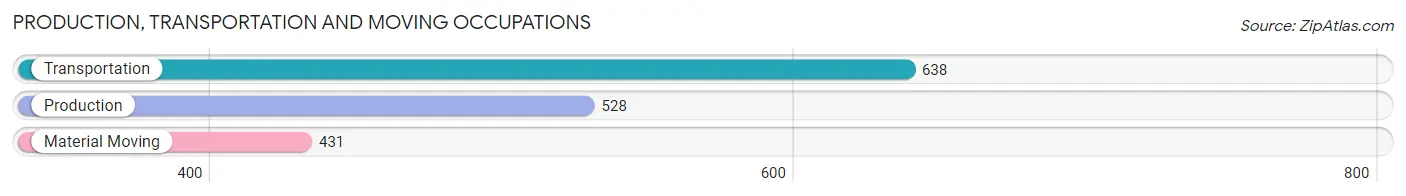
Production, Transportation and Moving Occupations
The most common Production, Transportation and Moving occupations in Wellington are Transportation (638 | 2.2%), Production (528 | 1.8%), and Material Moving (431 | 1.5%).
Production, Transportation and Moving Occupations by Sex
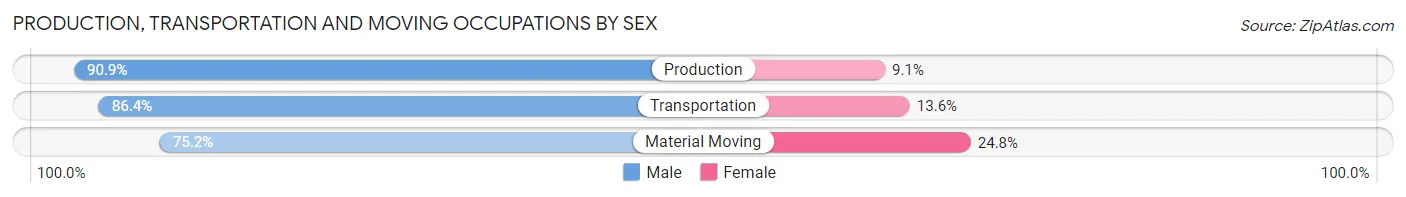
| Occupation | Male | Female |
| Production | 480 (90.9%) | 48 (9.1%) |
| Transportation | 551 (86.4%) | 87 (13.6%) |
| Material Moving | 324 (75.2%) | 107 (24.8%) |
| Total (Category) | 1,355 (84.9%) | 242 (15.1%) |
| Total (Overall) | 15,193 (52.7%) | 13,634 (47.3%) |
Employment Industries by Sex in Wellington
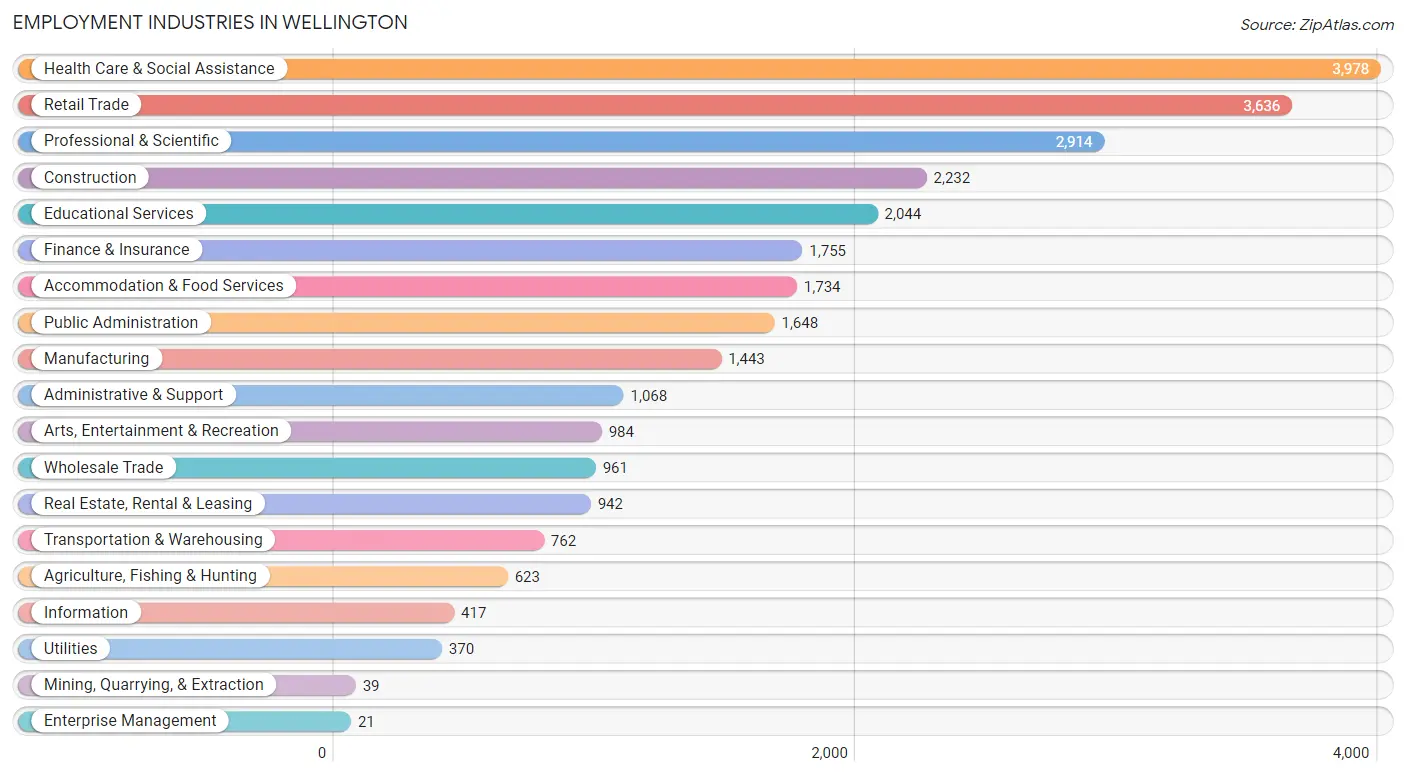
Employment Industries in Wellington
The major employment industries in Wellington include Health Care & Social Assistance (3,978 | 13.8%), Retail Trade (3,636 | 12.6%), Professional & Scientific (2,914 | 10.1%), Construction (2,232 | 7.7%), and Educational Services (2,044 | 7.1%).
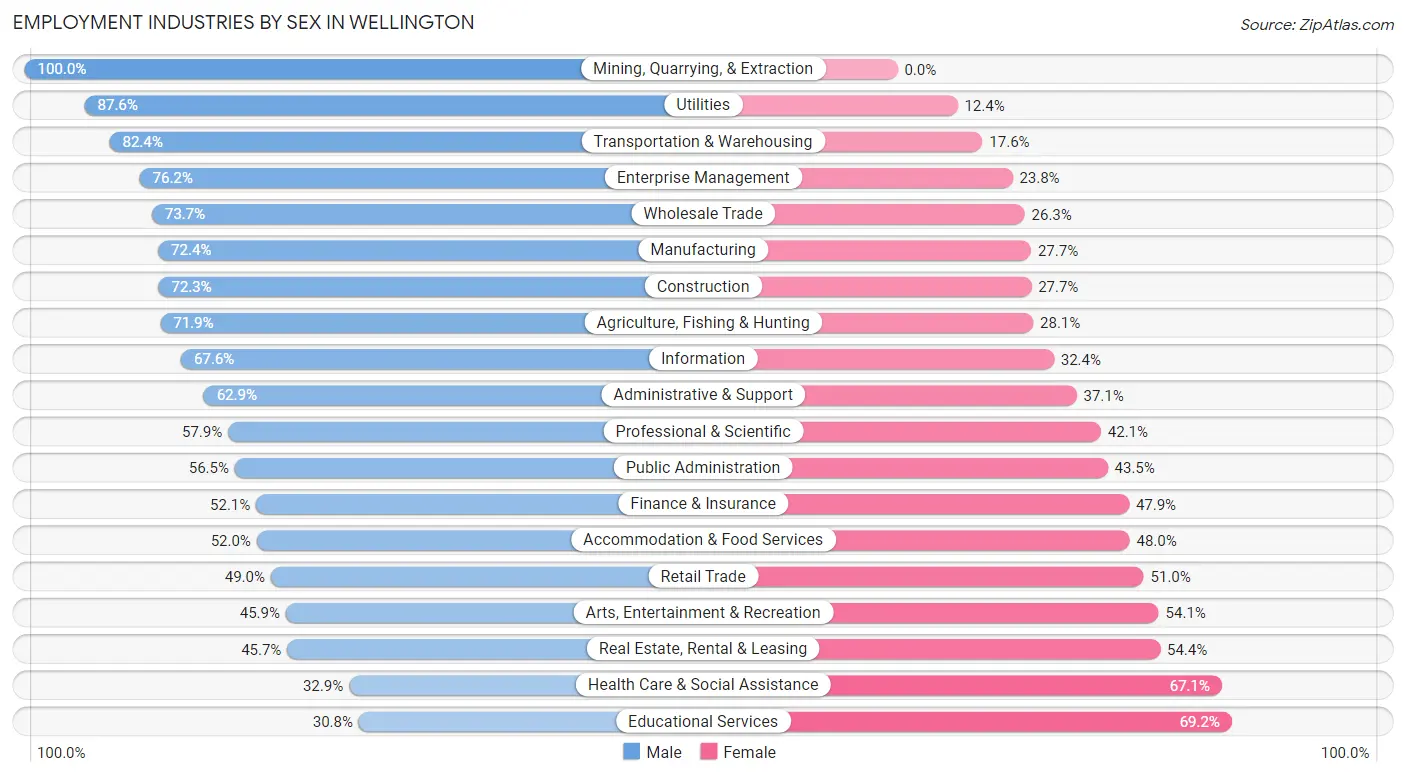
Employment Industries by Sex in Wellington
The Wellington industries that see more men than women are Mining, Quarrying, & Extraction (100.0%), Utilities (87.6%), and Transportation & Warehousing (82.4%), whereas the industries that tend to have a higher number of women are Educational Services (69.2%), Health Care & Social Assistance (67.1%), and Real Estate, Rental & Leasing (54.3%).
| Industry | Male | Female |
| Agriculture, Fishing & Hunting | 448 (71.9%) | 175 (28.1%) |
| Mining, Quarrying, & Extraction | 39 (100.0%) | 0 (0.0%) |
| Construction | 1,614 (72.3%) | 618 (27.7%) |
| Manufacturing | 1,044 (72.4%) | 399 (27.7%) |
| Wholesale Trade | 708 (73.7%) | 253 (26.3%) |
| Retail Trade | 1,783 (49.0%) | 1,853 (51.0%) |
| Transportation & Warehousing | 628 (82.4%) | 134 (17.6%) |
| Utilities | 324 (87.6%) | 46 (12.4%) |
| Information | 282 (67.6%) | 135 (32.4%) |
| Finance & Insurance | 914 (52.1%) | 841 (47.9%) |
| Real Estate, Rental & Leasing | 430 (45.7%) | 512 (54.3%) |
| Professional & Scientific | 1,687 (57.9%) | 1,227 (42.1%) |
| Enterprise Management | 16 (76.2%) | 5 (23.8%) |
| Administrative & Support | 672 (62.9%) | 396 (37.1%) |
| Educational Services | 630 (30.8%) | 1,414 (69.2%) |
| Health Care & Social Assistance | 1,307 (32.9%) | 2,671 (67.1%) |
| Arts, Entertainment & Recreation | 452 (45.9%) | 532 (54.1%) |
| Accommodation & Food Services | 901 (52.0%) | 833 (48.0%) |
| Public Administration | 931 (56.5%) | 717 (43.5%) |
| Total | 15,193 (52.7%) | 13,634 (47.3%) |
Education in Wellington
School Enrollment in Wellington
The most common levels of schooling among the 18,194 students in Wellington are high school (4,254 | 23.4%), middle school (4,151 | 22.8%), and elementary school (3,789 | 20.8%).
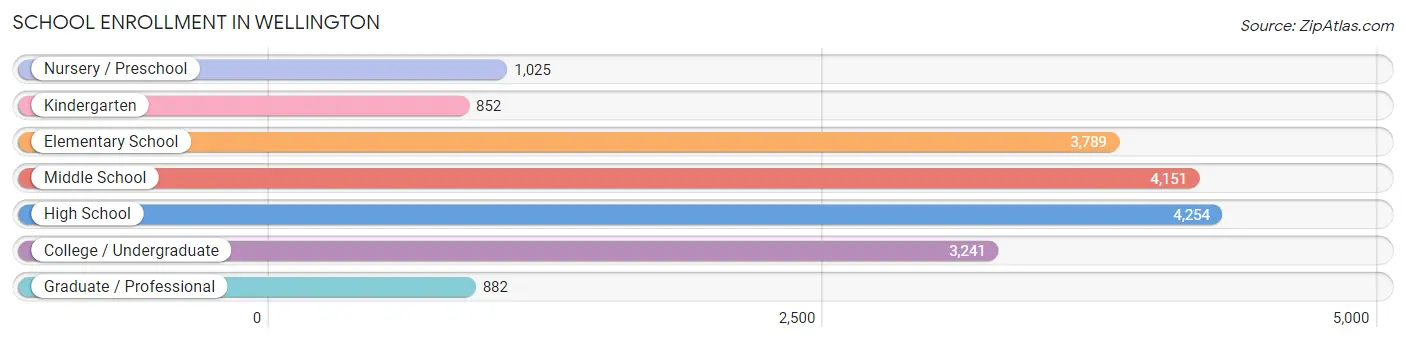
| School Level | # Students | % Students |
| Nursery / Preschool | 1,025 | 5.6% |
| Kindergarten | 852 | 4.7% |
| Elementary School | 3,789 | 20.8% |
| Middle School | 4,151 | 22.8% |
| High School | 4,254 | 23.4% |
| College / Undergraduate | 3,241 | 17.8% |
| Graduate / Professional | 882 | 4.9% |
| Total | 18,194 | 100.0% |
School Enrollment by Age by Funding Source in Wellington
Out of a total of 18,194 students who are enrolled in schools in Wellington, 3,639 (20.0%) attend a private institution, while the remaining 14,555 (80.0%) are enrolled in public schools. The age group of 3 to 4 year olds has the highest likelihood of being enrolled in private schools, with 550 (64.1% in the age bracket) enrolled. Conversely, the age group of 18 to 19 year olds has the lowest likelihood of being enrolled in a private school, with 1,261 (88.1% in the age bracket) attending a public institution.
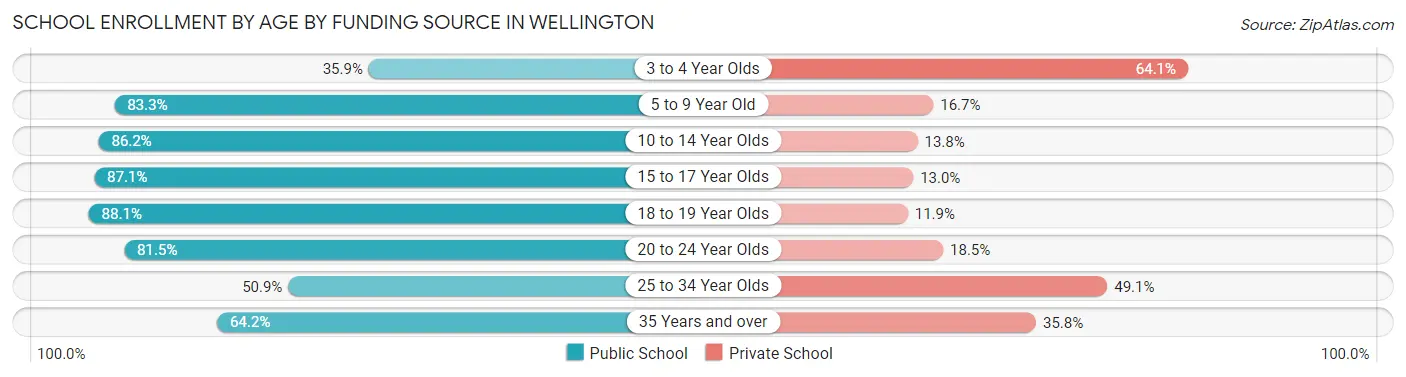
| Age Bracket | Public School | Private School |
| 3 to 4 Year Olds | 308 (35.9%) | 550 (64.1%) |
| 5 to 9 Year Old | 3,621 (83.3%) | 726 (16.7%) |
| 10 to 14 Year Olds | 4,455 (86.2%) | 711 (13.8%) |
| 15 to 17 Year Olds | 2,561 (87.1%) | 381 (13.0%) |
| 18 to 19 Year Olds | 1,261 (88.1%) | 171 (11.9%) |
| 20 to 24 Year Olds | 1,329 (81.5%) | 302 (18.5%) |
| 25 to 34 Year Olds | 539 (50.9%) | 520 (49.1%) |
| 35 Years and over | 487 (64.2%) | 272 (35.8%) |
| Total | 14,555 (80.0%) | 3,639 (20.0%) |
Educational Attainment by Field of Study in Wellington
Business (4,888 | 23.1%), science & technology (2,416 | 11.4%), engineering (2,267 | 10.7%), bio, nature & agricultural (2,065 | 9.8%), and education (2,012 | 9.5%) are the most common fields of study among 21,178 individuals in Wellington who have obtained a bachelor's degree or higher.
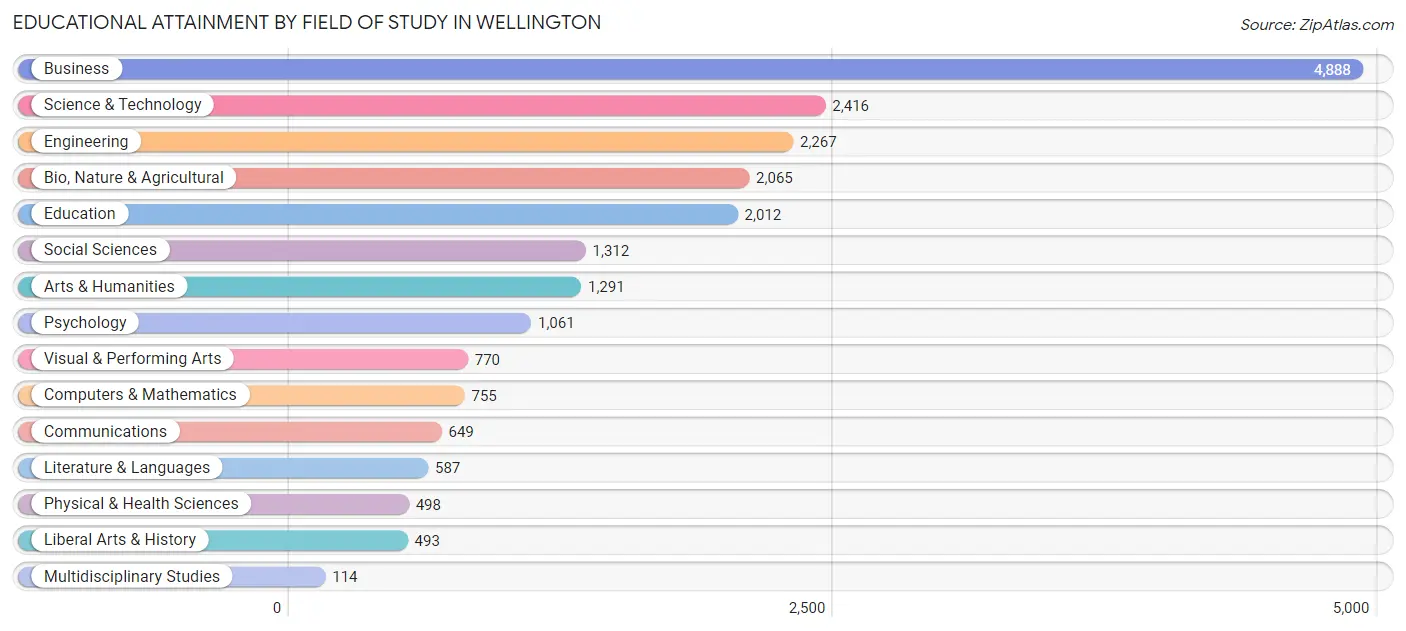
| Field of Study | # Graduates | % Graduates |
| Computers & Mathematics | 755 | 3.6% |
| Bio, Nature & Agricultural | 2,065 | 9.8% |
| Physical & Health Sciences | 498 | 2.4% |
| Psychology | 1,061 | 5.0% |
| Social Sciences | 1,312 | 6.2% |
| Engineering | 2,267 | 10.7% |
| Multidisciplinary Studies | 114 | 0.5% |
| Science & Technology | 2,416 | 11.4% |
| Business | 4,888 | 23.1% |
| Education | 2,012 | 9.5% |
| Literature & Languages | 587 | 2.8% |
| Liberal Arts & History | 493 | 2.3% |
| Visual & Performing Arts | 770 | 3.6% |
| Communications | 649 | 3.1% |
| Arts & Humanities | 1,291 | 6.1% |
| Total | 21,178 | 100.0% |
Transportation & Commute in Wellington
Vehicle Availability by Sex in Wellington
The most prevalent vehicle ownership categories in Wellington are males with 2 vehicles (7,321, accounting for 49.6%) and females with 2 vehicles (5,444, making up 56.3%).
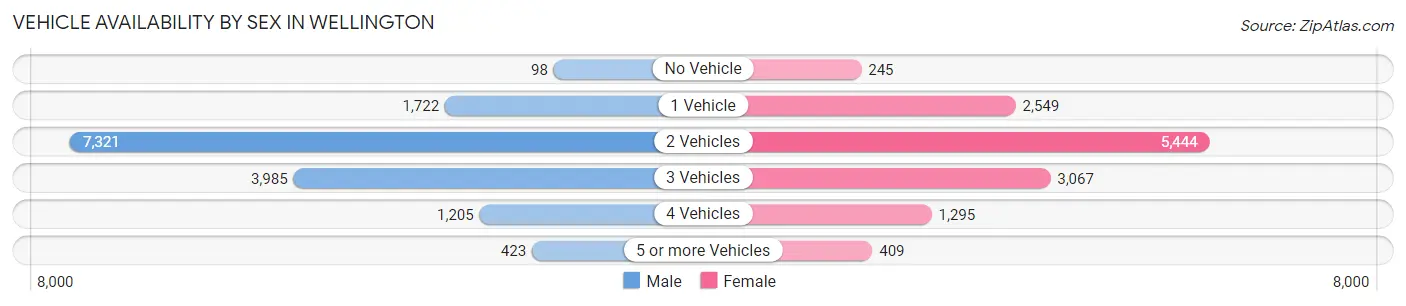
| Vehicles Available | Male | Female |
| No Vehicle | 98 (0.7%) | 245 (1.9%) |
| 1 Vehicle | 1,722 (11.7%) | 2,549 (19.6%) |
| 2 Vehicles | 7,321 (49.6%) | 5,444 (41.8%) |
| 3 Vehicles | 3,985 (27.0%) | 3,067 (23.6%) |
| 4 Vehicles | 1,205 (8.2%) | 1,295 (10.0%) |
| 5 or more Vehicles | 423 (2.9%) | 409 (3.1%) |
| Total | 14,754 (100.0%) | 13,009 (100.0%) |
Commute Time in Wellington
The most frequently occuring commute durations in Wellington are 30 to 34 minutes (3,500 commuters, 14.9%), 45 to 59 minutes (2,765 commuters, 11.8%), and 20 to 24 minutes (2,760 commuters, 11.8%).
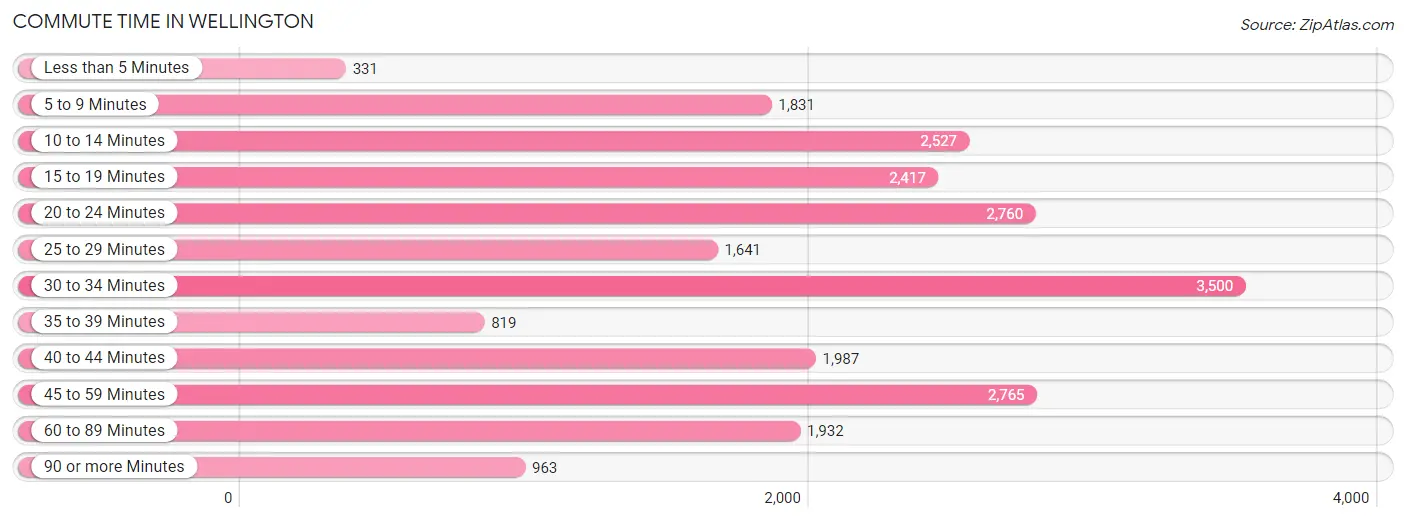
| Commute Time | # Commuters | % Commuters |
| Less than 5 Minutes | 331 | 1.4% |
| 5 to 9 Minutes | 1,831 | 7.8% |
| 10 to 14 Minutes | 2,527 | 10.8% |
| 15 to 19 Minutes | 2,417 | 10.3% |
| 20 to 24 Minutes | 2,760 | 11.8% |
| 25 to 29 Minutes | 1,641 | 7.0% |
| 30 to 34 Minutes | 3,500 | 14.9% |
| 35 to 39 Minutes | 819 | 3.5% |
| 40 to 44 Minutes | 1,987 | 8.5% |
| 45 to 59 Minutes | 2,765 | 11.8% |
| 60 to 89 Minutes | 1,932 | 8.2% |
| 90 or more Minutes | 963 | 4.1% |
Commute Time by Sex in Wellington
The most common commute times in Wellington are 30 to 34 minutes (2,154 commuters, 17.0%) for males and 20 to 24 minutes (1,522 commuters, 14.1%) for females.
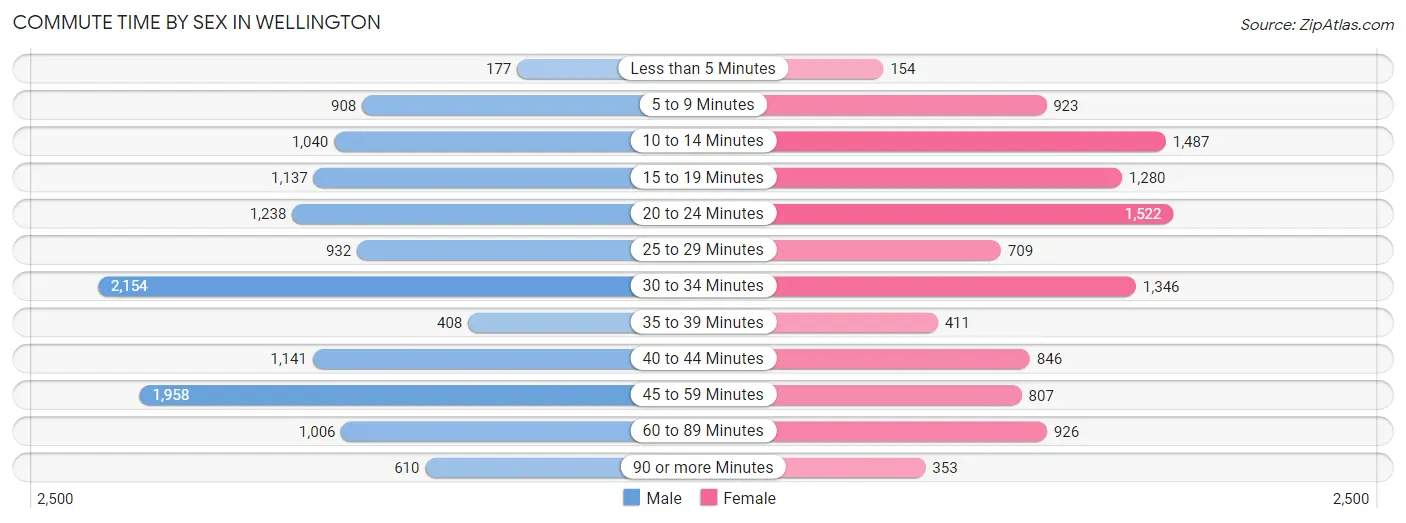
| Commute Time | Male | Female |
| Less than 5 Minutes | 177 (1.4%) | 154 (1.4%) |
| 5 to 9 Minutes | 908 (7.1%) | 923 (8.6%) |
| 10 to 14 Minutes | 1,040 (8.2%) | 1,487 (13.8%) |
| 15 to 19 Minutes | 1,137 (8.9%) | 1,280 (11.9%) |
| 20 to 24 Minutes | 1,238 (9.7%) | 1,522 (14.1%) |
| 25 to 29 Minutes | 932 (7.3%) | 709 (6.6%) |
| 30 to 34 Minutes | 2,154 (17.0%) | 1,346 (12.5%) |
| 35 to 39 Minutes | 408 (3.2%) | 411 (3.8%) |
| 40 to 44 Minutes | 1,141 (9.0%) | 846 (7.9%) |
| 45 to 59 Minutes | 1,958 (15.4%) | 807 (7.5%) |
| 60 to 89 Minutes | 1,006 (7.9%) | 926 (8.6%) |
| 90 or more Minutes | 610 (4.8%) | 353 (3.3%) |
Time of Departure to Work by Sex in Wellington
The most frequent times of departure to work in Wellington are 8:00 AM to 8:29 AM (1,822, 14.3%) for males and 7:00 AM to 7:29 AM (1,844, 17.1%) for females.
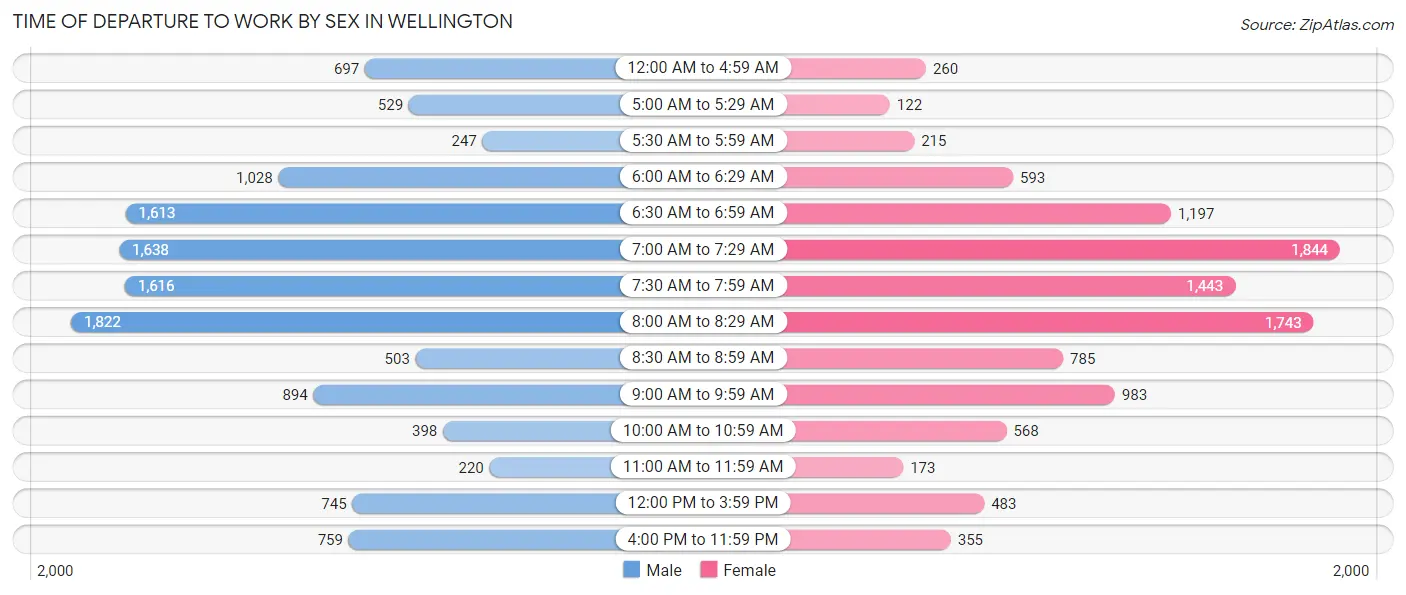
| Time of Departure | Male | Female |
| 12:00 AM to 4:59 AM | 697 (5.5%) | 260 (2.4%) |
| 5:00 AM to 5:29 AM | 529 (4.2%) | 122 (1.1%) |
| 5:30 AM to 5:59 AM | 247 (1.9%) | 215 (2.0%) |
| 6:00 AM to 6:29 AM | 1,028 (8.1%) | 593 (5.5%) |
| 6:30 AM to 6:59 AM | 1,613 (12.7%) | 1,197 (11.1%) |
| 7:00 AM to 7:29 AM | 1,638 (12.9%) | 1,844 (17.1%) |
| 7:30 AM to 7:59 AM | 1,616 (12.7%) | 1,443 (13.4%) |
| 8:00 AM to 8:29 AM | 1,822 (14.3%) | 1,743 (16.2%) |
| 8:30 AM to 8:59 AM | 503 (4.0%) | 785 (7.3%) |
| 9:00 AM to 9:59 AM | 894 (7.0%) | 983 (9.1%) |
| 10:00 AM to 10:59 AM | 398 (3.1%) | 568 (5.3%) |
| 11:00 AM to 11:59 AM | 220 (1.7%) | 173 (1.6%) |
| 12:00 PM to 3:59 PM | 745 (5.9%) | 483 (4.5%) |
| 4:00 PM to 11:59 PM | 759 (6.0%) | 355 (3.3%) |
| Total | 12,709 (100.0%) | 10,764 (100.0%) |
Housing Occupancy in Wellington
Occupancy by Ownership in Wellington
Of the total 21,163 dwellings in Wellington, owner-occupied units account for 16,052 (75.8%), while renter-occupied units make up 5,111 (24.1%).
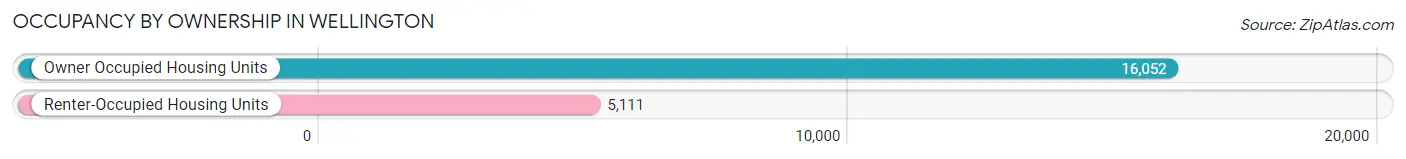
| Occupancy | # Housing Units | % Housing Units |
| Owner Occupied Housing Units | 16,052 | 75.8% |
| Renter-Occupied Housing Units | 5,111 | 24.1% |
| Total Occupied Housing Units | 21,163 | 100.0% |
Occupancy by Household Size in Wellington
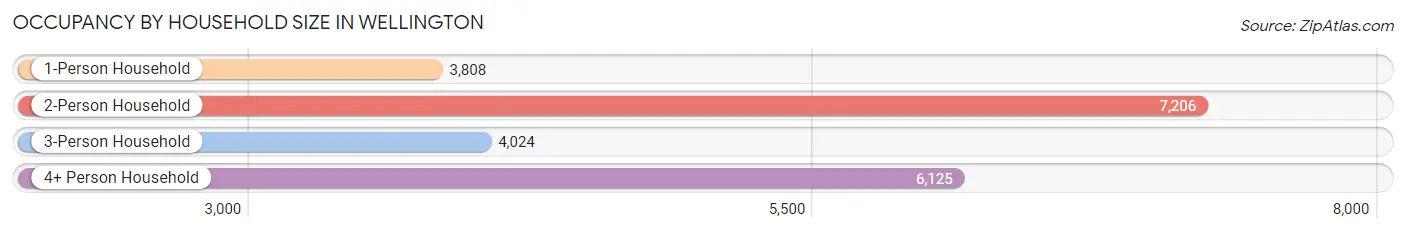
| Household Size | # Housing Units | % Housing Units |
| 1-Person Household | 3,808 | 18.0% |
| 2-Person Household | 7,206 | 34.1% |
| 3-Person Household | 4,024 | 19.0% |
| 4+ Person Household | 6,125 | 28.9% |
| Total Housing Units | 21,163 | 100.0% |
Occupancy by Ownership by Household Size in Wellington
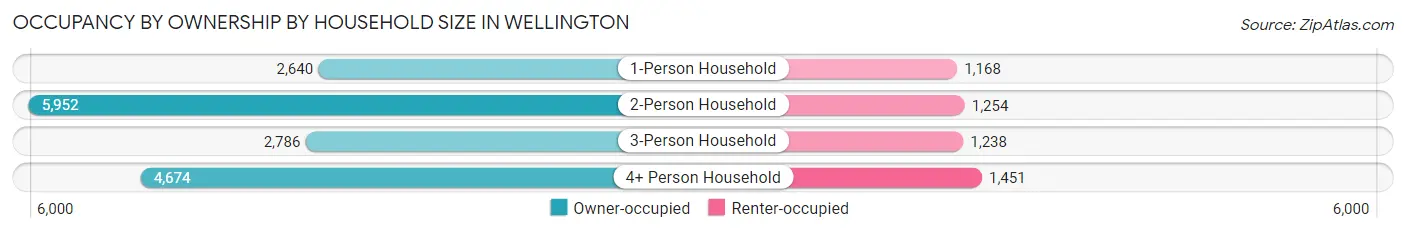
| Household Size | Owner-occupied | Renter-occupied |
| 1-Person Household | 2,640 (69.3%) | 1,168 (30.7%) |
| 2-Person Household | 5,952 (82.6%) | 1,254 (17.4%) |
| 3-Person Household | 2,786 (69.2%) | 1,238 (30.8%) |
| 4+ Person Household | 4,674 (76.3%) | 1,451 (23.7%) |
| Total Housing Units | 16,052 (75.8%) | 5,111 (24.1%) |
Occupancy by Educational Attainment in Wellington
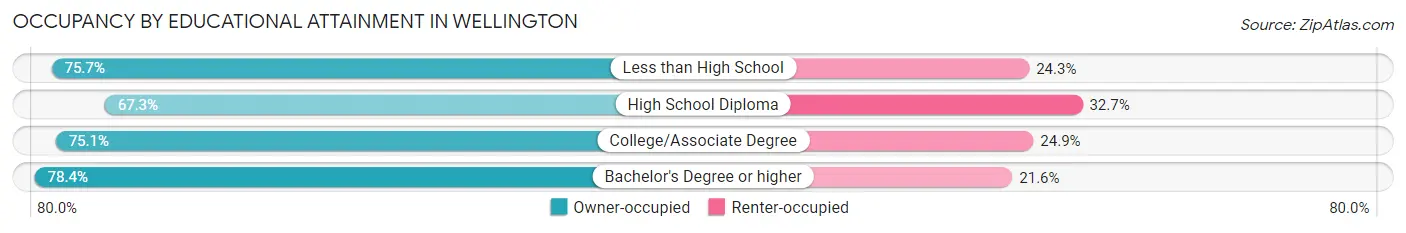
| Household Size | Owner-occupied | Renter-occupied |
| Less than High School | 789 (75.7%) | 253 (24.3%) |
| High School Diploma | 1,840 (67.3%) | 895 (32.7%) |
| College/Associate Degree | 4,684 (75.1%) | 1,556 (24.9%) |
| Bachelor's Degree or higher | 8,739 (78.4%) | 2,407 (21.6%) |
Occupancy by Age of Householder in Wellington
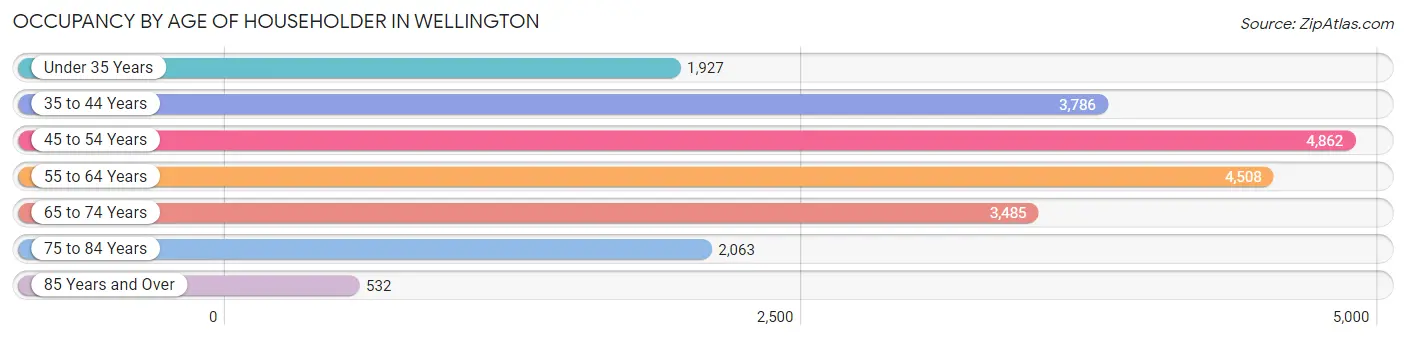
| Age Bracket | # Households | % Households |
| Under 35 Years | 1,927 | 9.1% |
| 35 to 44 Years | 3,786 | 17.9% |
| 45 to 54 Years | 4,862 | 23.0% |
| 55 to 64 Years | 4,508 | 21.3% |
| 65 to 74 Years | 3,485 | 16.5% |
| 75 to 84 Years | 2,063 | 9.8% |
| 85 Years and Over | 532 | 2.5% |
| Total | 21,163 | 100.0% |
Housing Finances in Wellington
Median Income by Occupancy in Wellington
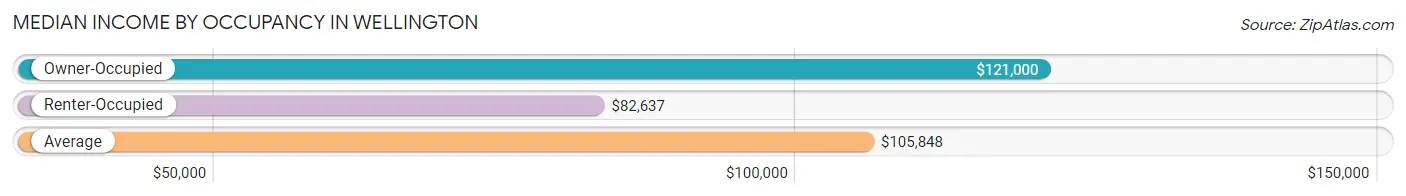
| Occupancy Type | # Households | Median Income |
| Owner-Occupied | 16,052 (75.8%) | $121,000 |
| Renter-Occupied | 5,111 (24.1%) | $82,637 |
| Average | 21,163 (100.0%) | $105,848 |
Occupancy by Householder Income Bracket in Wellington

| Income Bracket | Owner-occupied | Renter-occupied |
| Less than $5,000 | 190 (1.2%) | 144 (2.8%) |
| $5,000 to $9,999 | 165 (1.0%) | 44 (0.9%) |
| $10,000 to $14,999 | 206 (1.3%) | 127 (2.5%) |
| $15,000 to $19,999 | 267 (1.7%) | 188 (3.7%) |
| $20,000 to $24,999 | 305 (1.9%) | 110 (2.1%) |
| $25,000 to $34,999 | 530 (3.3%) | 400 (7.8%) |
| $35,000 to $49,999 | 1,034 (6.4%) | 495 (9.7%) |
| $50,000 to $74,999 | 1,890 (11.8%) | 893 (17.5%) |
| $75,000 to $99,999 | 1,970 (12.3%) | 928 (18.2%) |
| $100,000 to $149,999 | 3,395 (21.1%) | 792 (15.5%) |
| $150,000 or more | 6,100 (38.0%) | 990 (19.4%) |
| Total | 16,052 (100.0%) | 5,111 (100.0%) |
Monthly Housing Cost Tiers in Wellington
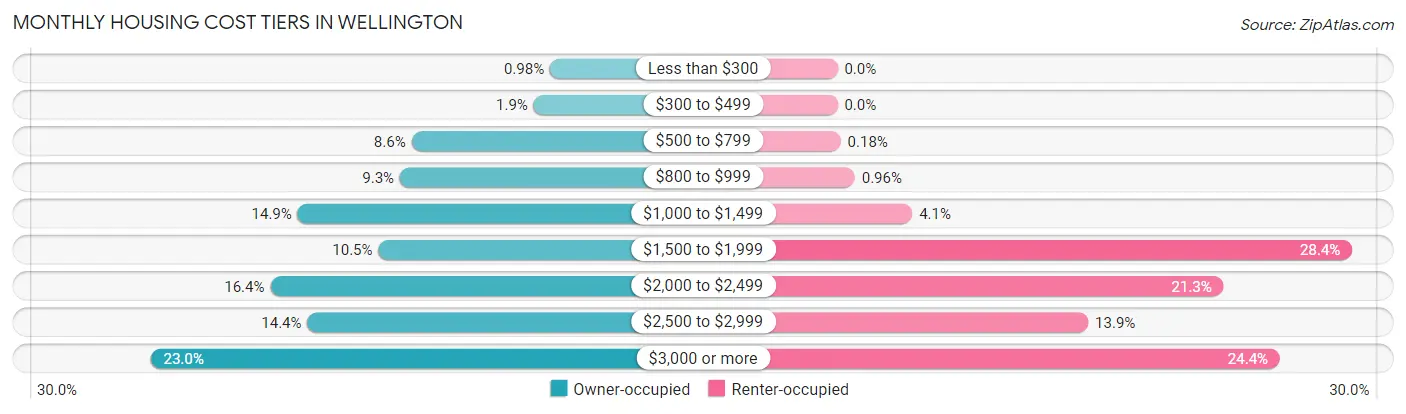
| Monthly Cost | Owner-occupied | Renter-occupied |
| Less than $300 | 157 (1.0%) | 0 (0.0%) |
| $300 to $499 | 302 (1.9%) | 0 (0.0%) |
| $500 to $799 | 1,386 (8.6%) | 9 (0.2%) |
| $800 to $999 | 1,488 (9.3%) | 49 (1.0%) |
| $1,000 to $1,499 | 2,395 (14.9%) | 211 (4.1%) |
| $1,500 to $1,999 | 1,679 (10.5%) | 1,453 (28.4%) |
| $2,000 to $2,499 | 2,638 (16.4%) | 1,090 (21.3%) |
| $2,500 to $2,999 | 2,308 (14.4%) | 708 (13.9%) |
| $3,000 or more | 3,699 (23.0%) | 1,249 (24.4%) |
| Total | 16,052 (100.0%) | 5,111 (100.0%) |
Physical Housing Characteristics in Wellington
Housing Structures in Wellington
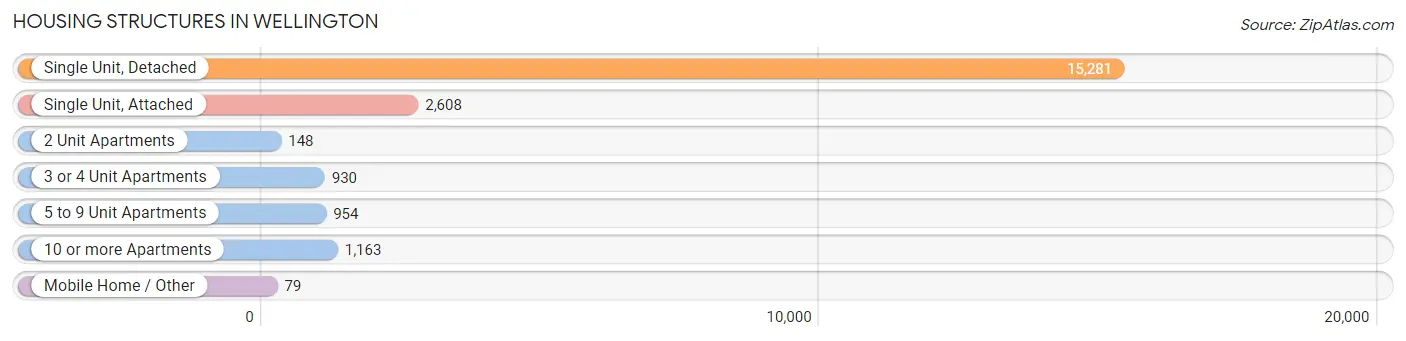
| Structure Type | # Housing Units | % Housing Units |
| Single Unit, Detached | 15,281 | 72.2% |
| Single Unit, Attached | 2,608 | 12.3% |
| 2 Unit Apartments | 148 | 0.7% |
| 3 or 4 Unit Apartments | 930 | 4.4% |
| 5 to 9 Unit Apartments | 954 | 4.5% |
| 10 or more Apartments | 1,163 | 5.5% |
| Mobile Home / Other | 79 | 0.4% |
| Total | 21,163 | 100.0% |
Housing Structures by Occupancy in Wellington
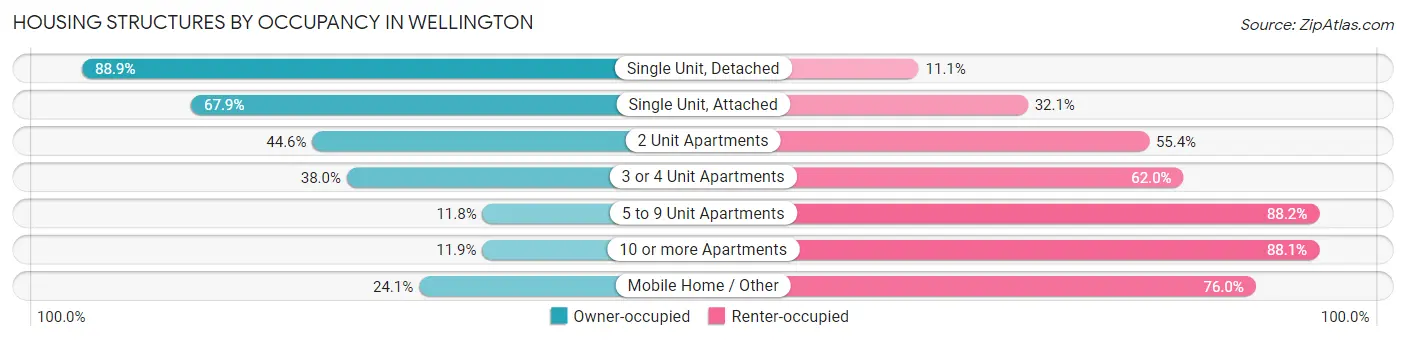
| Structure Type | Owner-occupied | Renter-occupied |
| Single Unit, Detached | 13,591 (88.9%) | 1,690 (11.1%) |
| Single Unit, Attached | 1,772 (67.9%) | 836 (32.1%) |
| 2 Unit Apartments | 66 (44.6%) | 82 (55.4%) |
| 3 or 4 Unit Apartments | 353 (38.0%) | 577 (62.0%) |
| 5 to 9 Unit Apartments | 113 (11.8%) | 841 (88.2%) |
| 10 or more Apartments | 138 (11.9%) | 1,025 (88.1%) |
| Mobile Home / Other | 19 (24.0%) | 60 (75.9%) |
| Total | 16,052 (75.8%) | 5,111 (24.1%) |
Housing Structures by Number of Rooms in Wellington
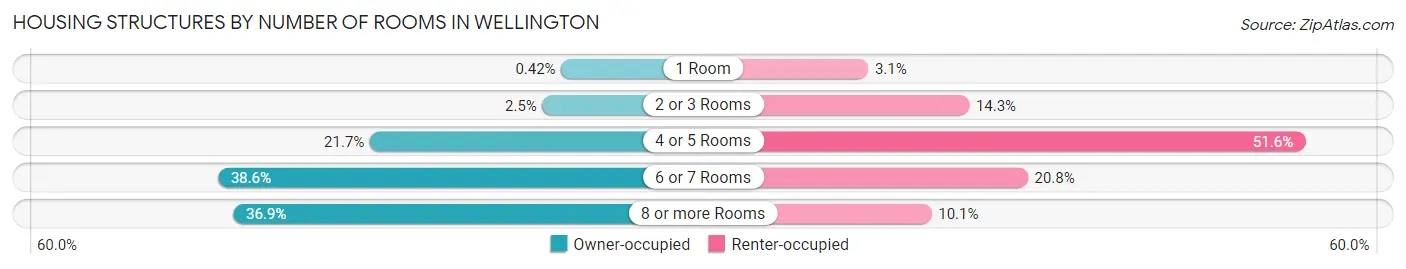
| Number of Rooms | Owner-occupied | Renter-occupied |
| 1 Room | 67 (0.4%) | 159 (3.1%) |
| 2 or 3 Rooms | 402 (2.5%) | 732 (14.3%) |
| 4 or 5 Rooms | 3,476 (21.6%) | 2,638 (51.6%) |
| 6 or 7 Rooms | 6,190 (38.6%) | 1,064 (20.8%) |
| 8 or more Rooms | 5,917 (36.9%) | 518 (10.1%) |
| Total | 16,052 (100.0%) | 5,111 (100.0%) |
Housing Structure by Heating Type in Wellington
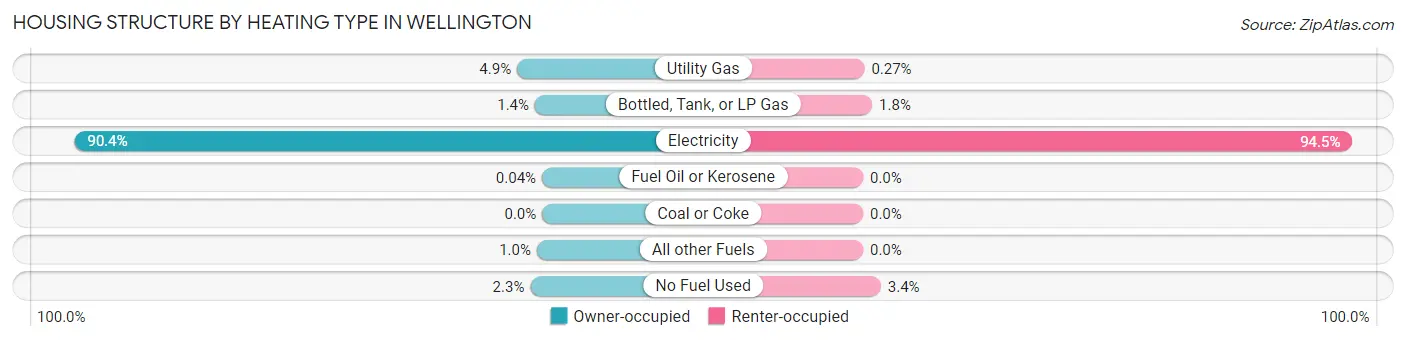
| Heating Type | Owner-occupied | Renter-occupied |
| Utility Gas | 778 (4.9%) | 14 (0.3%) |
| Bottled, Tank, or LP Gas | 224 (1.4%) | 90 (1.8%) |
| Electricity | 14,509 (90.4%) | 4,831 (94.5%) |
| Fuel Oil or Kerosene | 7 (0.0%) | 0 (0.0%) |
| Coal or Coke | 0 (0.0%) | 0 (0.0%) |
| All other Fuels | 166 (1.0%) | 0 (0.0%) |
| No Fuel Used | 368 (2.3%) | 176 (3.4%) |
| Total | 16,052 (100.0%) | 5,111 (100.0%) |
Household Vehicle Usage in Wellington
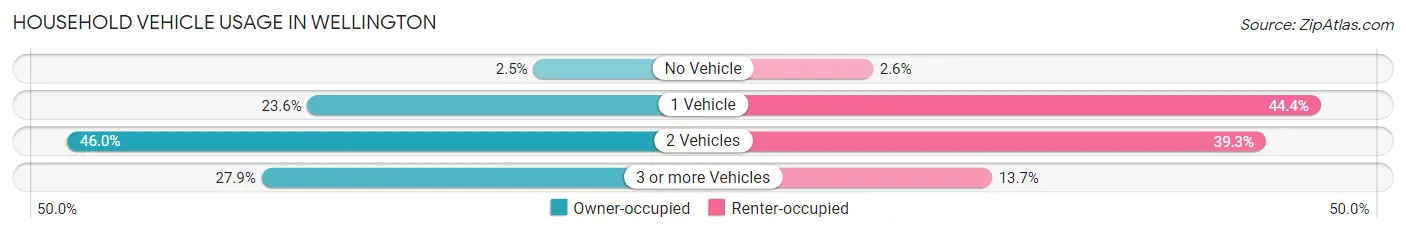
| Vehicles per Household | Owner-occupied | Renter-occupied |
| No Vehicle | 401 (2.5%) | 133 (2.6%) |
| 1 Vehicle | 3,786 (23.6%) | 2,270 (44.4%) |
| 2 Vehicles | 7,389 (46.0%) | 2,008 (39.3%) |
| 3 or more Vehicles | 4,476 (27.9%) | 700 (13.7%) |
| Total | 16,052 (100.0%) | 5,111 (100.0%) |
Real Estate & Mortgages in Wellington
Real Estate and Mortgage Overview in Wellington
| Characteristic | Without Mortgage | With Mortgage |
| Housing Units | 5,748 | 10,304 |
| Median Property Value | $497,300 | $490,600 |
| Median Household Income | $90,650 | $4,390 |
| Monthly Housing Costs | $971 | $3,549 |
| Real Estate Taxes | $5,093 | $61 |
Property Value by Mortgage Status in Wellington
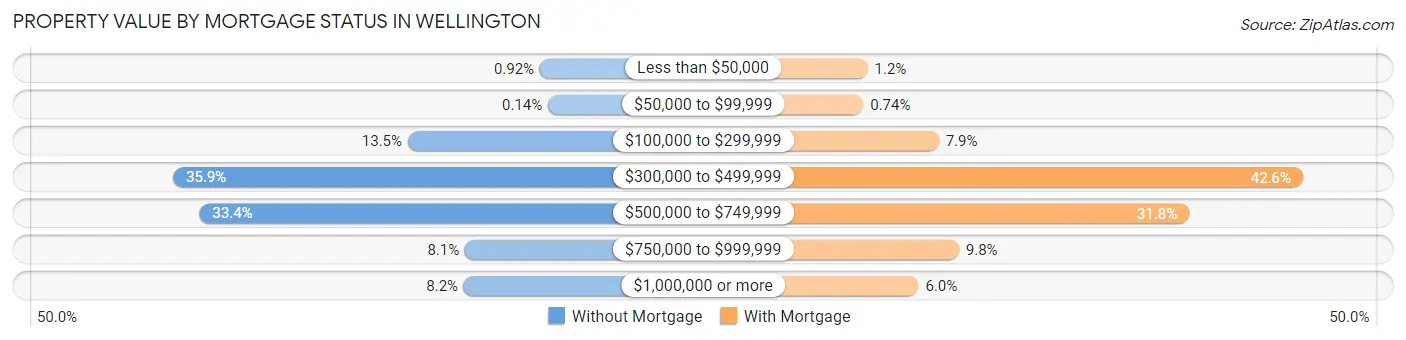
| Property Value | Without Mortgage | With Mortgage |
| Less than $50,000 | 53 (0.9%) | 118 (1.1%) |
| $50,000 to $99,999 | 8 (0.1%) | 76 (0.7%) |
| $100,000 to $299,999 | 776 (13.5%) | 816 (7.9%) |
| $300,000 to $499,999 | 2,062 (35.9%) | 4,389 (42.6%) |
| $500,000 to $749,999 | 1,917 (33.4%) | 3,273 (31.8%) |
| $750,000 to $999,999 | 463 (8.1%) | 1,014 (9.8%) |
| $1,000,000 or more | 469 (8.2%) | 618 (6.0%) |
| Total | 5,748 (100.0%) | 10,304 (100.0%) |
Household Income by Mortgage Status in Wellington
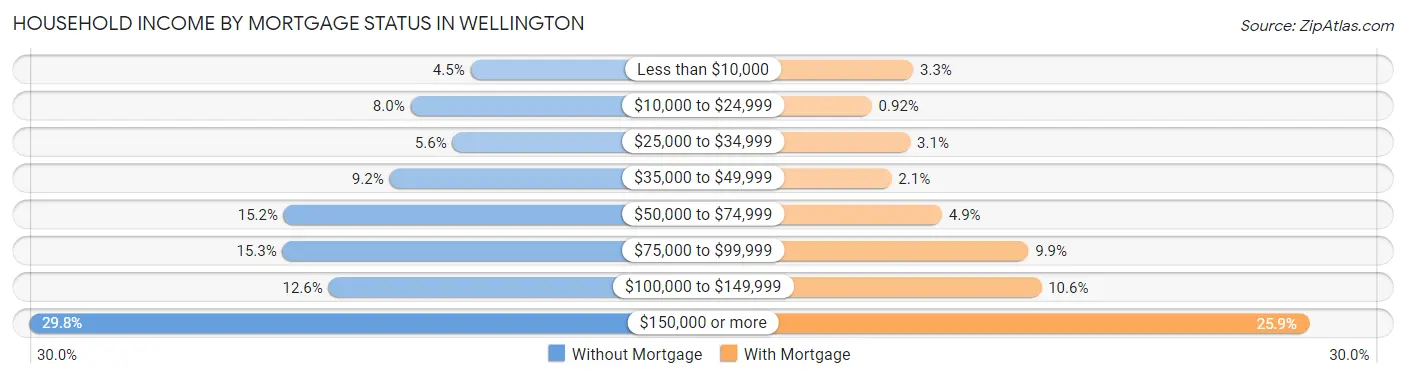
| Household Income | Without Mortgage | With Mortgage |
| Less than $10,000 | 260 (4.5%) | 339 (3.3%) |
| $10,000 to $24,999 | 457 (8.0%) | 95 (0.9%) |
| $25,000 to $34,999 | 319 (5.6%) | 321 (3.1%) |
| $35,000 to $49,999 | 526 (9.1%) | 211 (2.1%) |
| $50,000 to $74,999 | 873 (15.2%) | 508 (4.9%) |
| $75,000 to $99,999 | 877 (15.3%) | 1,017 (9.9%) |
| $100,000 to $149,999 | 726 (12.6%) | 1,093 (10.6%) |
| $150,000 or more | 1,710 (29.7%) | 2,669 (25.9%) |
| Total | 5,748 (100.0%) | 10,304 (100.0%) |
Property Value to Household Income Ratio in Wellington
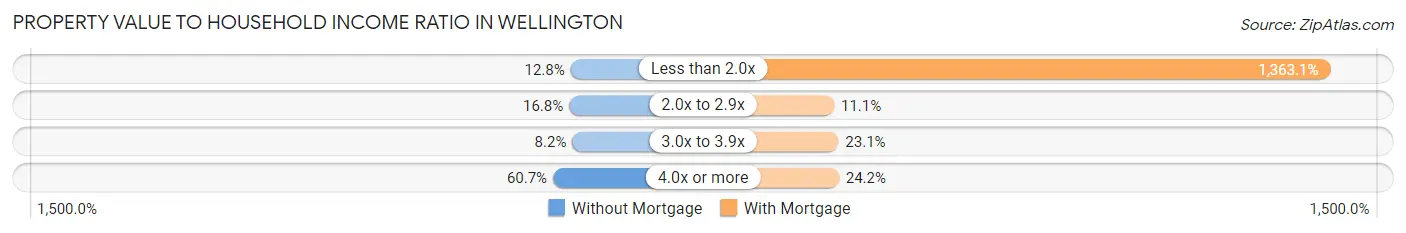
| Value-to-Income Ratio | Without Mortgage | With Mortgage |
| Less than 2.0x | 735 (12.8%) | 140,455 (1,363.1%) |
| 2.0x to 2.9x | 966 (16.8%) | 1,148 (11.1%) |
| 3.0x to 3.9x | 471 (8.2%) | 2,376 (23.1%) |
| 4.0x or more | 3,487 (60.7%) | 2,494 (24.2%) |
| Total | 5,748 (100.0%) | 10,304 (100.0%) |
Real Estate Taxes by Mortgage Status in Wellington
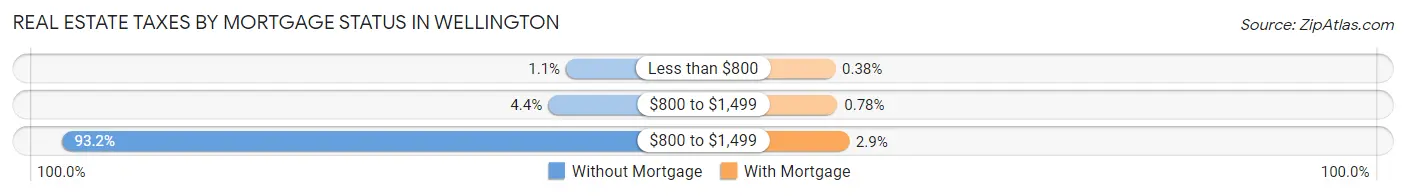
| Property Taxes | Without Mortgage | With Mortgage |
| Less than $800 | 65 (1.1%) | 39 (0.4%) |
| $800 to $1,499 | 253 (4.4%) | 80 (0.8%) |
| $800 to $1,499 | 5,359 (93.2%) | 299 (2.9%) |
| Total | 5,748 (100.0%) | 10,304 (100.0%) |
Health & Disability in Wellington
Health Insurance Coverage by Age in Wellington
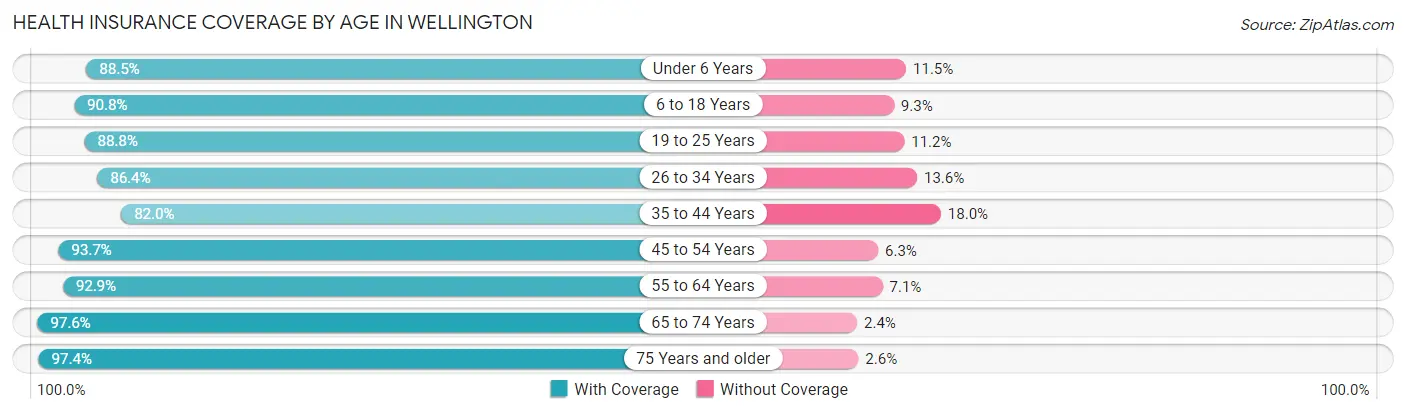
| Age Bracket | With Coverage | Without Coverage |
| Under 6 Years | 3,178 (88.5%) | 414 (11.5%) |
| 6 to 18 Years | 11,810 (90.7%) | 1,204 (9.2%) |
| 19 to 25 Years | 3,754 (88.8%) | 473 (11.2%) |
| 26 to 34 Years | 4,359 (86.4%) | 684 (13.6%) |
| 35 to 44 Years | 6,165 (82.0%) | 1,355 (18.0%) |
| 45 to 54 Years | 8,480 (93.7%) | 571 (6.3%) |
| 55 to 64 Years | 7,388 (92.9%) | 568 (7.1%) |
| 65 to 74 Years | 5,992 (97.6%) | 147 (2.4%) |
| 75 Years and older | 4,622 (97.4%) | 125 (2.6%) |
| Total | 55,748 (91.0%) | 5,541 (9.0%) |
Health Insurance Coverage by Citizenship Status in Wellington
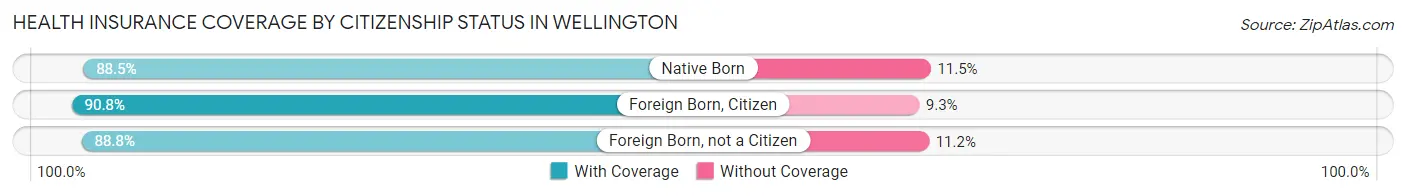
| Citizenship Status | With Coverage | Without Coverage |
| Native Born | 3,178 (88.5%) | 414 (11.5%) |
| Foreign Born, Citizen | 11,810 (90.7%) | 1,204 (9.2%) |
| Foreign Born, not a Citizen | 3,754 (88.8%) | 473 (11.2%) |
Health Insurance Coverage by Household Income in Wellington
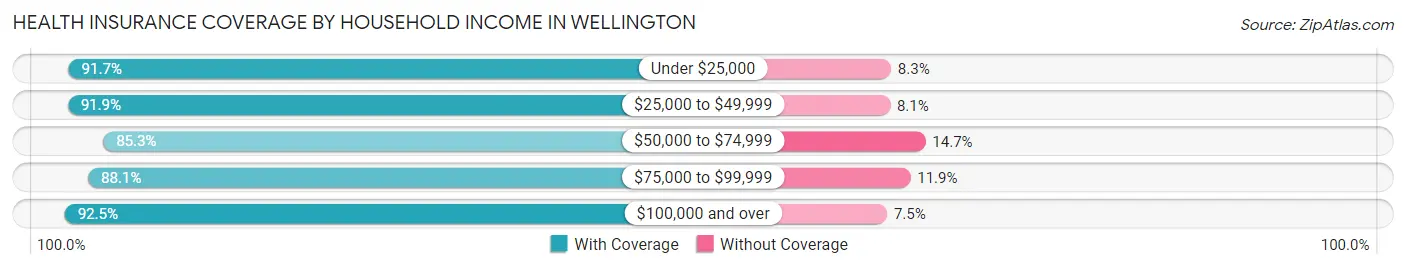
| Household Income | With Coverage | Without Coverage |
| Under $25,000 | 3,265 (91.7%) | 294 (8.3%) |
| $25,000 to $49,999 | 4,523 (91.9%) | 398 (8.1%) |
| $50,000 to $74,999 | 5,835 (85.3%) | 1,008 (14.7%) |
| $75,000 to $99,999 | 7,601 (88.1%) | 1,026 (11.9%) |
| $100,000 and over | 34,503 (92.5%) | 2,810 (7.5%) |
Public vs Private Health Insurance Coverage by Age in Wellington
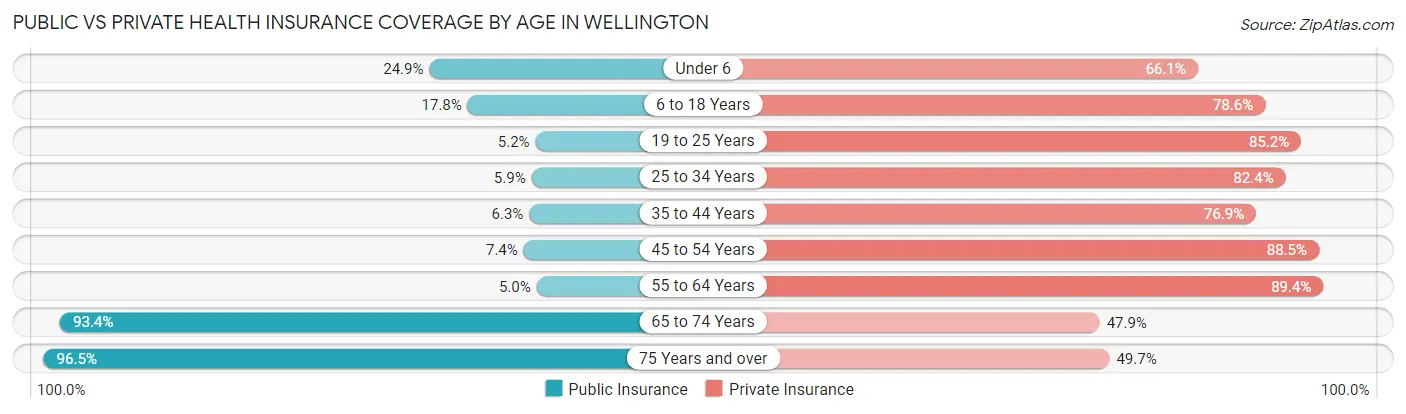
| Age Bracket | Public Insurance | Private Insurance |
| Under 6 | 894 (24.9%) | 2,373 (66.1%) |
| 6 to 18 Years | 2,313 (17.8%) | 10,224 (78.6%) |
| 19 to 25 Years | 219 (5.2%) | 3,603 (85.2%) |
| 25 to 34 Years | 298 (5.9%) | 4,153 (82.4%) |
| 35 to 44 Years | 477 (6.3%) | 5,782 (76.9%) |
| 45 to 54 Years | 668 (7.4%) | 8,013 (88.5%) |
| 55 to 64 Years | 396 (5.0%) | 7,109 (89.3%) |
| 65 to 74 Years | 5,735 (93.4%) | 2,939 (47.9%) |
| 75 Years and over | 4,579 (96.5%) | 2,359 (49.7%) |
| Total | 15,579 (25.4%) | 46,555 (76.0%) |
Disability Status by Sex by Age in Wellington
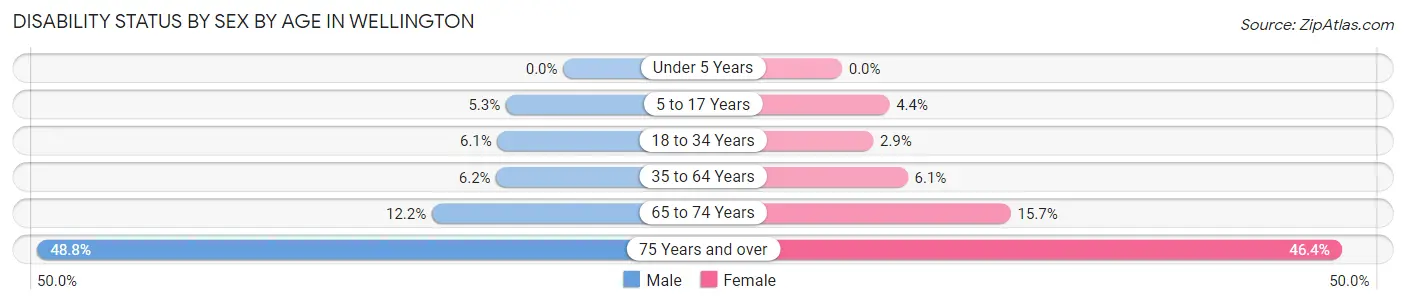
| Age Bracket | Male | Female |
| Under 5 Years | 0 (0.0%) | 0 (0.0%) |
| 5 to 17 Years | 326 (5.3%) | 282 (4.4%) |
| 18 to 34 Years | 289 (6.1%) | 165 (2.9%) |
| 35 to 64 Years | 730 (6.2%) | 780 (6.1%) |
| 65 to 74 Years | 338 (12.2%) | 527 (15.7%) |
| 75 Years and over | 1,056 (48.8%) | 1,198 (46.4%) |
Disability Class by Sex by Age in Wellington
Disability Class: Hearing Difficulty
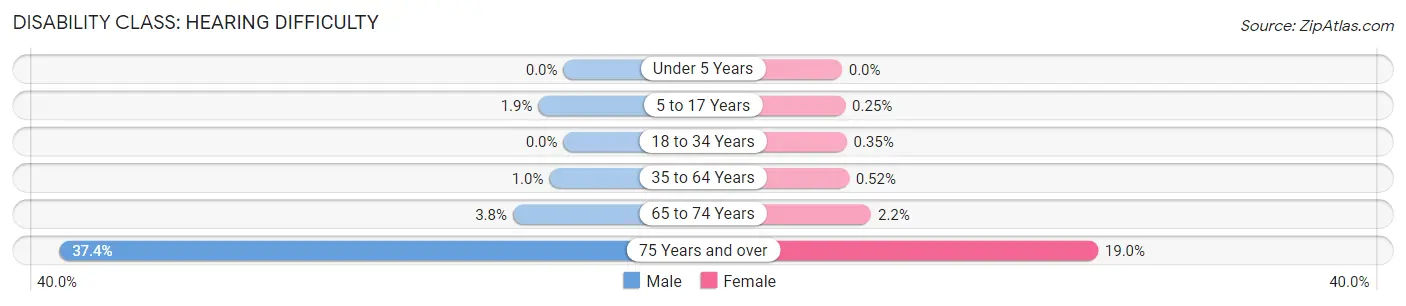
| Age Bracket | Male | Female |
| Under 5 Years | 0 (0.0%) | 0 (0.0%) |
| 5 to 17 Years | 114 (1.9%) | 16 (0.3%) |
| 18 to 34 Years | 0 (0.0%) | 20 (0.4%) |
| 35 to 64 Years | 122 (1.0%) | 67 (0.5%) |
| 65 to 74 Years | 104 (3.7%) | 73 (2.2%) |
| 75 Years and over | 810 (37.4%) | 491 (19.0%) |
Disability Class: Vision Difficulty
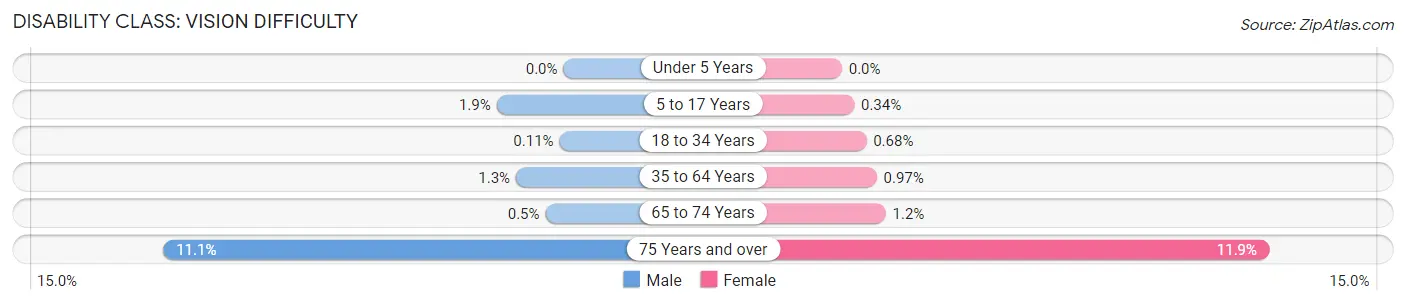
| Age Bracket | Male | Female |
| Under 5 Years | 0 (0.0%) | 0 (0.0%) |
| 5 to 17 Years | 114 (1.9%) | 22 (0.3%) |
| 18 to 34 Years | 5 (0.1%) | 39 (0.7%) |
| 35 to 64 Years | 155 (1.3%) | 124 (1.0%) |
| 65 to 74 Years | 14 (0.5%) | 41 (1.2%) |
| 75 Years and over | 241 (11.1%) | 307 (11.9%) |
Disability Class: Cognitive Difficulty
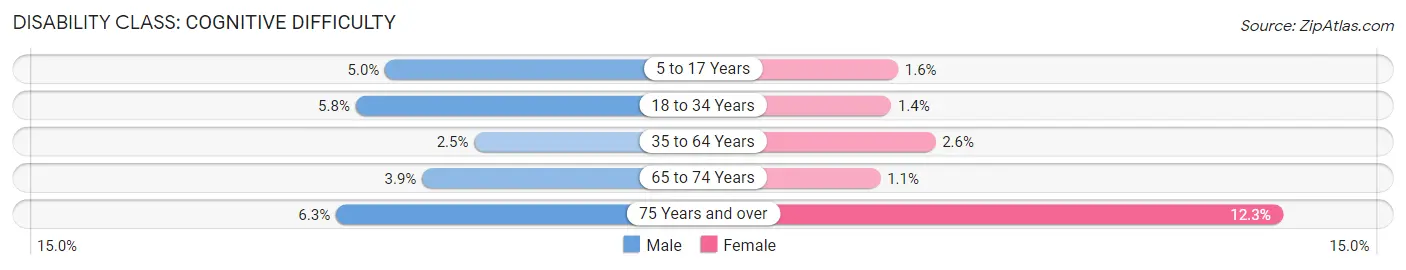
| Age Bracket | Male | Female |
| 5 to 17 Years | 304 (5.0%) | 100 (1.6%) |
| 18 to 34 Years | 274 (5.8%) | 78 (1.4%) |
| 35 to 64 Years | 291 (2.5%) | 332 (2.6%) |
| 65 to 74 Years | 109 (3.9%) | 36 (1.1%) |
| 75 Years and over | 137 (6.3%) | 317 (12.3%) |
Disability Class: Ambulatory Difficulty
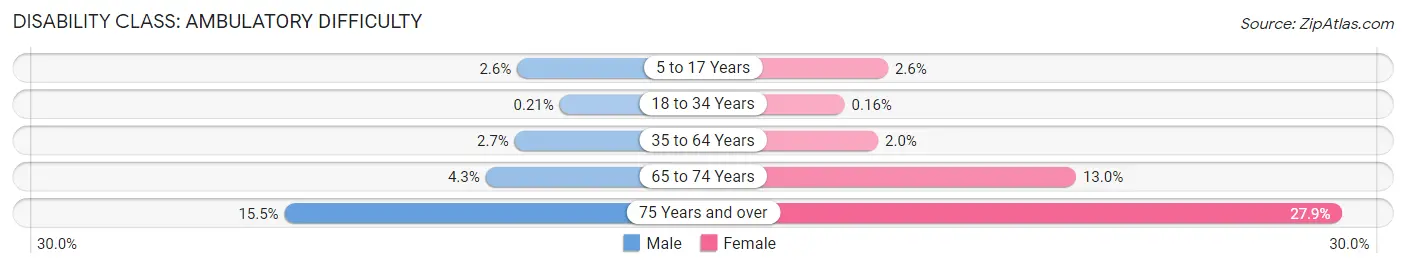
| Age Bracket | Male | Female |
| 5 to 17 Years | 158 (2.6%) | 165 (2.6%) |
| 18 to 34 Years | 10 (0.2%) | 9 (0.2%) |
| 35 to 64 Years | 318 (2.7%) | 258 (2.0%) |
| 65 to 74 Years | 120 (4.3%) | 439 (13.0%) |
| 75 Years and over | 336 (15.5%) | 720 (27.9%) |
Disability Class: Self-Care Difficulty
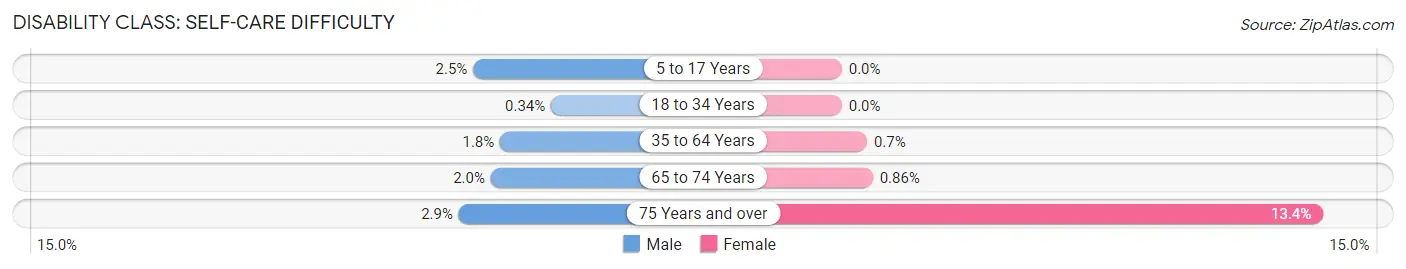
| Age Bracket | Male | Female |
| 5 to 17 Years | 154 (2.5%) | 0 (0.0%) |
| 18 to 34 Years | 16 (0.3%) | 0 (0.0%) |
| 35 to 64 Years | 207 (1.8%) | 90 (0.7%) |
| 65 to 74 Years | 56 (2.0%) | 29 (0.9%) |
| 75 Years and over | 63 (2.9%) | 346 (13.4%) |
Technology Access in Wellington
Computing Device Access in Wellington
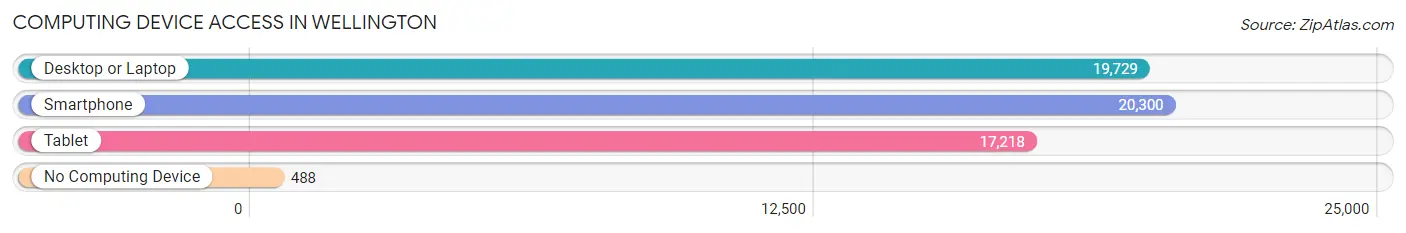
| Device Type | # Households | % Households |
| Desktop or Laptop | 19,729 | 93.2% |
| Smartphone | 20,300 | 95.9% |
| Tablet | 17,218 | 81.4% |
| No Computing Device | 488 | 2.3% |
| Total | 21,163 | 100.0% |
Internet Access in Wellington
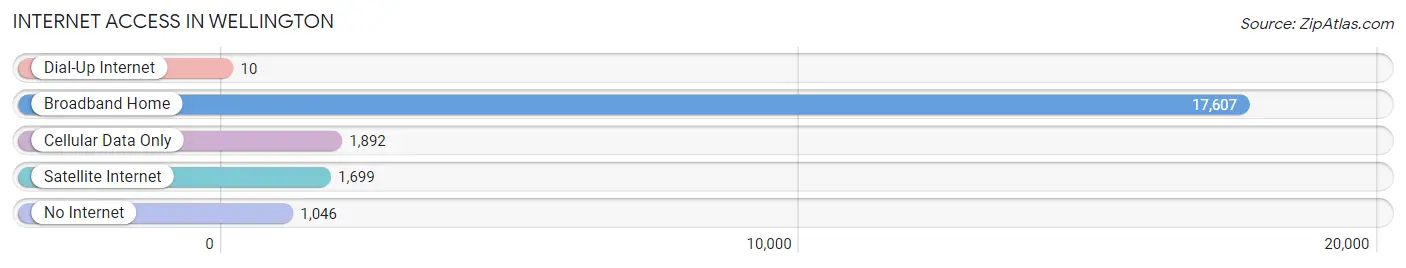
| Internet Type | # Households | % Households |
| Dial-Up Internet | 10 | 0.1% |
| Broadband Home | 17,607 | 83.2% |
| Cellular Data Only | 1,892 | 8.9% |
| Satellite Internet | 1,699 | 8.0% |
| No Internet | 1,046 | 4.9% |
| Total | 21,163 | 100.0% |
Wellington Summary
Wellington, Florida is a village located in Palm Beach County, Florida, United States. It is the most populous village in the county, with a population of 61,485 as of the 2020 census. Wellington is known for its equestrian community, which is home to the International Polo Club Palm Beach, the Palm Beach International Equestrian Center, and the Winter Equestrian Festival. The village is also home to the Mall at Wellington Green, a large shopping mall, and the Wellington Amphitheater, a popular outdoor concert venue.
History
Wellington was founded in the 1950s by Charles Oliver Wellington, a real estate developer from West Palm Beach. He purchased a large tract of land in the area and began developing it into a residential community. The village was incorporated in 1995, and the first mayor was Charles Oliver Wellington's son, Charles Wellington.
Geography
Wellington is located in the western part of Palm Beach County, approximately 20 miles west of West Palm Beach. It is bordered by the cities of Royal Palm Beach to the north, Loxahatchee Groves to the west, and Lake Worth to the south. The village covers an area of approximately 25 square miles.
Climate
Wellington has a humid subtropical climate, with hot, humid summers and mild, dry winters. The average temperature in the summer is around 90°F, and the average temperature in the winter is around 70°F. The area receives an average of 54 inches of rain per year.
Economy
Wellington is home to a variety of businesses, including retail stores, restaurants, and professional services. The village is also home to the Mall at Wellington Green, a large shopping mall, and the Wellington Amphitheater, a popular outdoor concert venue. The village is also home to the International Polo Club Palm Beach, the Palm Beach International Equestrian Center, and the Winter Equestrian Festival.
Demographics
As of the 2020 census, Wellington had a population of 61,485. The racial makeup of the village was 79.2% White, 8.3% African American, 0.3% Native American, 5.2% Asian, 0.1% Pacific Islander, 4.2% from other races, and 2.8% from two or more races. Hispanic or Latino of any race were 16.3% of the population.
The median household income in Wellington was $76,845, and the median family income was $86,945. The per capita income for the village was $37,845. About 4.3% of families and 6.2% of the population were below the poverty line, including 8.2% of those under age 18 and 4.2% of those age 65 or over.
Common Questions
What is Per Capita Income in Wellington?
Per Capita income in Wellington is $51,226.
What is the Median Family Income in Wellington?
Median Family Income in Wellington is $122,370.
What is the Median Household income in Wellington?
Median Household Income in Wellington is $105,848.
What is Income or Wage Gap in Wellington?
Income or Wage Gap in Wellington is 38.5%.
Women in Wellington earn 61.5 cents for every dollar earned by a man.
What is Family Income Deficit in Wellington?
Family Income Deficit in Wellington is $11,973.
Families that are below poverty line in Wellington earn $11,973 less on average than the poverty threshold level.
What is Inequality or Gini Index in Wellington?
Inequality or Gini Index in Wellington is 0.44.
What is the Total Population of Wellington?
Total Population of Wellington is 61,373.
What is the Total Male Population of Wellington?
Total Male Population of Wellington is 29,131.
What is the Total Female Population of Wellington?
Total Female Population of Wellington is 32,242.
What is the Ratio of Males per 100 Females in Wellington?
There are 90.35 Males per 100 Females in Wellington.
What is the Ratio of Females per 100 Males in Wellington?
There are 110.68 Females per 100 Males in Wellington.
What is the Median Population Age in Wellington?
Median Population Age in Wellington is 41.5 Years.
What is the Average Family Size in Wellington
Average Family Size in Wellington is 3.3 People.
What is the Average Household Size in Wellington
Average Household Size in Wellington is 2.9 People.
How Large is the Labor Force in Wellington?
There are 30,244 People in the Labor Forcein in Wellington.
What is the Percentage of People in the Labor Force in Wellington?
63.3% of People are in the Labor Force in Wellington.
What is the Unemployment Rate in Wellington?
Unemployment Rate in Wellington is 4.6%.