Pinewood, FL Map & Demographics
Pinewood Map
Pinewood Overview
$19,107
PER CAPITA INCOME
$43,662
AVG FAMILY INCOME
$41,283
AVG HOUSEHOLD INCOME
13.7%
WAGE / INCOME GAP [ % ]
86.3¢/ $1
WAGE / INCOME GAP [ $ ]
0.44
INEQUALITY / GINI INDEX
17,163
TOTAL POPULATION
8,697
MALE POPULATION
8,466
FEMALE POPULATION
102.73
MALES / 100 FEMALES
97.34
FEMALES / 100 MALES
40.0
MEDIAN AGE
3.7
AVG FAMILY SIZE
3.1
AVG HOUSEHOLD SIZE
7,936
LABOR FORCE [ PEOPLE ]
57.4%
PERCENT IN LABOR FORCE
7.3%
UNEMPLOYMENT RATE
Income in Pinewood
Income Overview in Pinewood
Per Capita Income in Pinewood is $19,107, while median incomes of families and households are $43,662 and $41,283 respectively.
| Characteristic | Number | Measure |
| Per Capita Income | 17,163 | $19,107 |
| Median Family Income | 3,741 | $43,662 |
| Mean Family Income | 3,741 | $60,690 |
| Median Household Income | 5,393 | $41,283 |
| Mean Household Income | 5,393 | $55,550 |
| Income Deficit | 3,741 | $0 |
| Wage / Income Gap (%) | 17,163 | 13.66% |
| Wage / Income Gap ($) | 17,163 | 86.34¢ per $1 |
| Gini / Inequality Index | 17,163 | 0.44 |
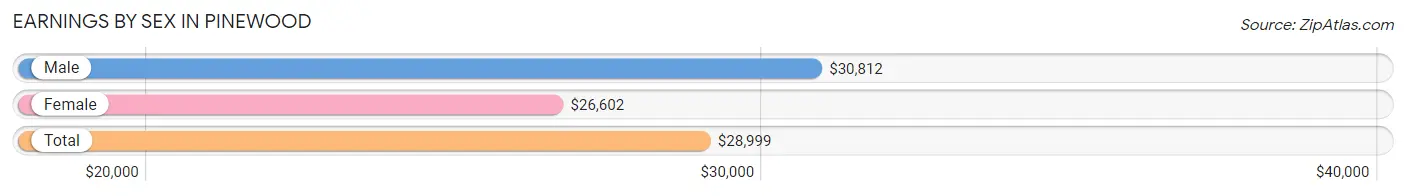
Earnings by Sex in Pinewood
Average Earnings in Pinewood are $28,999, $30,812 for men and $26,602 for women, a difference of 13.7%.
| Sex | Number | Average Earnings |
| Male | 4,108 (51.9%) | $30,812 |
| Female | 3,799 (48.0%) | $26,602 |
| Total | 7,907 (100.0%) | $28,999 |
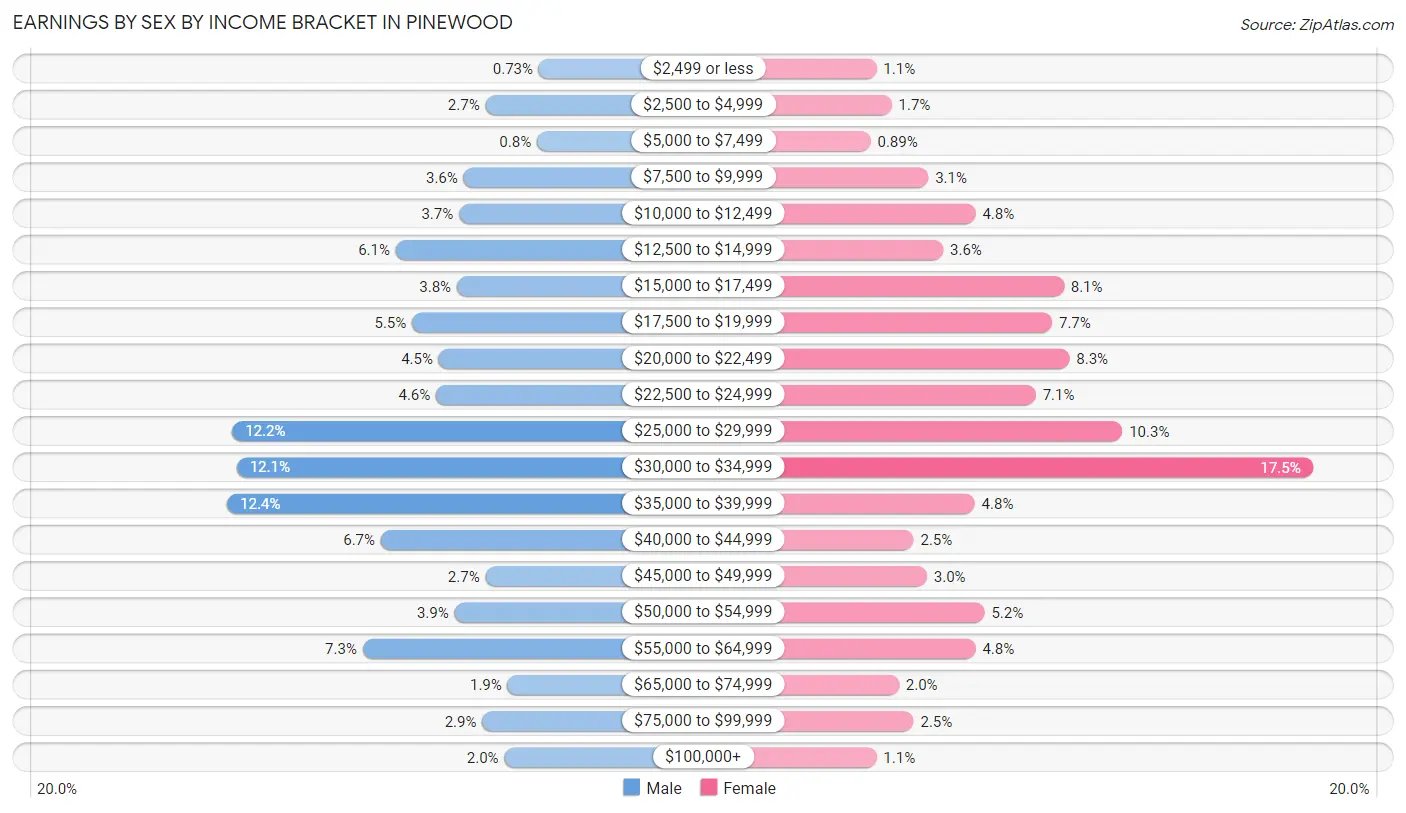
Earnings by Sex by Income Bracket in Pinewood
The most common earnings brackets in Pinewood are $35,000 to $39,999 for men (510 | 12.4%) and $30,000 to $34,999 for women (663 | 17.4%).
| Income | Male | Female |
| $2,499 or less | 30 (0.7%) | 42 (1.1%) |
| $2,500 to $4,999 | 112 (2.7%) | 64 (1.7%) |
| $5,000 to $7,499 | 33 (0.8%) | 34 (0.9%) |
| $7,500 to $9,999 | 146 (3.5%) | 116 (3.0%) |
| $10,000 to $12,499 | 153 (3.7%) | 183 (4.8%) |
| $12,500 to $14,999 | 250 (6.1%) | 137 (3.6%) |
| $15,000 to $17,499 | 156 (3.8%) | 309 (8.1%) |
| $17,500 to $19,999 | 225 (5.5%) | 292 (7.7%) |
| $20,000 to $22,499 | 184 (4.5%) | 317 (8.3%) |
| $22,500 to $24,999 | 188 (4.6%) | 269 (7.1%) |
| $25,000 to $29,999 | 502 (12.2%) | 392 (10.3%) |
| $30,000 to $34,999 | 495 (12.0%) | 663 (17.4%) |
| $35,000 to $39,999 | 510 (12.4%) | 182 (4.8%) |
| $40,000 to $44,999 | 273 (6.7%) | 95 (2.5%) |
| $45,000 to $49,999 | 112 (2.7%) | 114 (3.0%) |
| $50,000 to $54,999 | 160 (3.9%) | 196 (5.2%) |
| $55,000 to $64,999 | 301 (7.3%) | 183 (4.8%) |
| $65,000 to $74,999 | 78 (1.9%) | 74 (1.9%) |
| $75,000 to $99,999 | 117 (2.9%) | 95 (2.5%) |
| $100,000+ | 83 (2.0%) | 42 (1.1%) |
| Total | 4,108 (100.0%) | 3,799 (100.0%) |
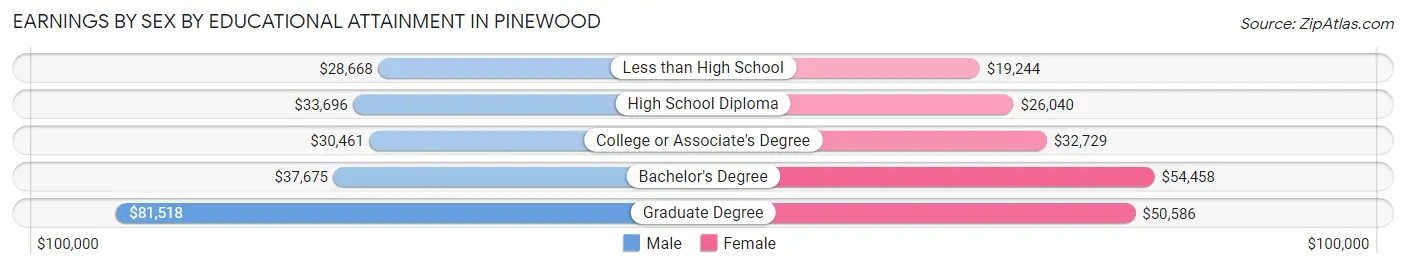
Earnings by Sex by Educational Attainment in Pinewood
Average earnings in Pinewood are $32,708 for men and $28,683 for women, a difference of 12.3%. Men with an educational attainment of graduate degree enjoy the highest average annual earnings of $81,518, while those with less than high school education earn the least with $28,668. Women with an educational attainment of bachelor's degree earn the most with the average annual earnings of $54,458, while those with less than high school education have the smallest earnings of $19,244.
| Educational Attainment | Male Income | Female Income |
| Less than High School | $28,668 | $19,244 |
| High School Diploma | $33,696 | $26,040 |
| College or Associate's Degree | $30,461 | $32,729 |
| Bachelor's Degree | $37,675 | $54,458 |
| Graduate Degree | $81,518 | $50,586 |
| Total | $32,708 | $28,683 |
Family Income in Pinewood
Family Income Brackets in Pinewood
According to the Pinewood family income data, there are 920 families falling into the $50,000 to $74,999 income range, which is the most common income bracket and makes up 24.6% of all families. Conversely, the less than $10,000 income bracket is the least frequent group with only 49 families (1.3%) belonging to this category.
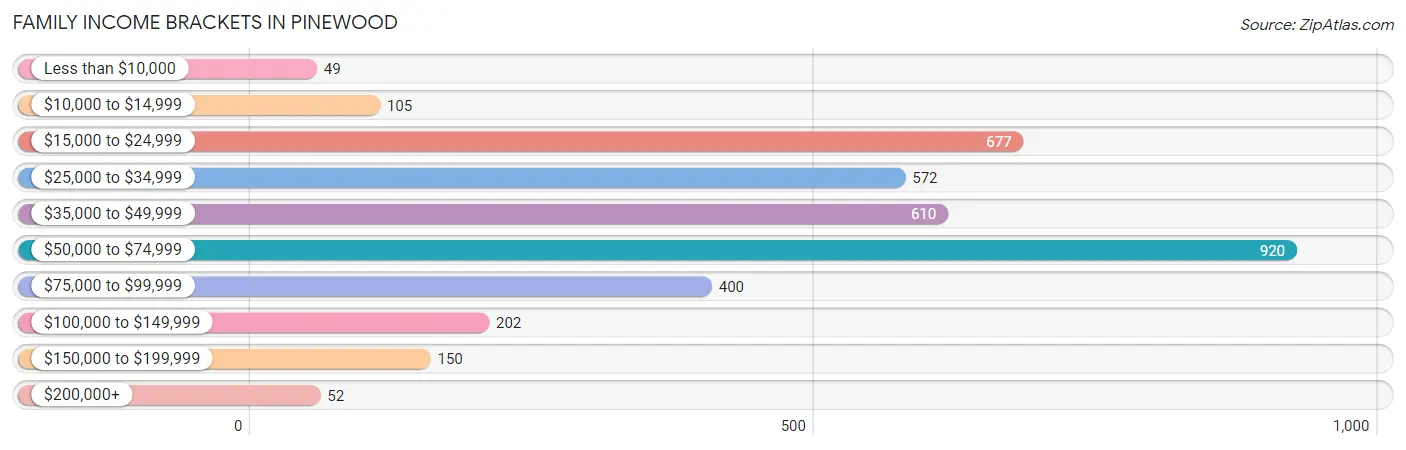
| Income Bracket | # Families | % Families |
| Less than $10,000 | 49 | 1.3% |
| $10,000 to $14,999 | 105 | 2.8% |
| $15,000 to $24,999 | 677 | 18.1% |
| $25,000 to $34,999 | 572 | 15.3% |
| $35,000 to $49,999 | 610 | 16.3% |
| $50,000 to $74,999 | 920 | 24.6% |
| $75,000 to $99,999 | 400 | 10.7% |
| $100,000 to $149,999 | 202 | 5.4% |
| $150,000 to $199,999 | 150 | 4.0% |
| $200,000+ | 52 | 1.4% |
Family Income by Famaliy Size in Pinewood
7+ person families (109 | 2.9%) account for the highest median family income in Pinewood with $88,375 per family, while 4-person families (753 | 20.1%) have the highest median income of $15,872 per family member.
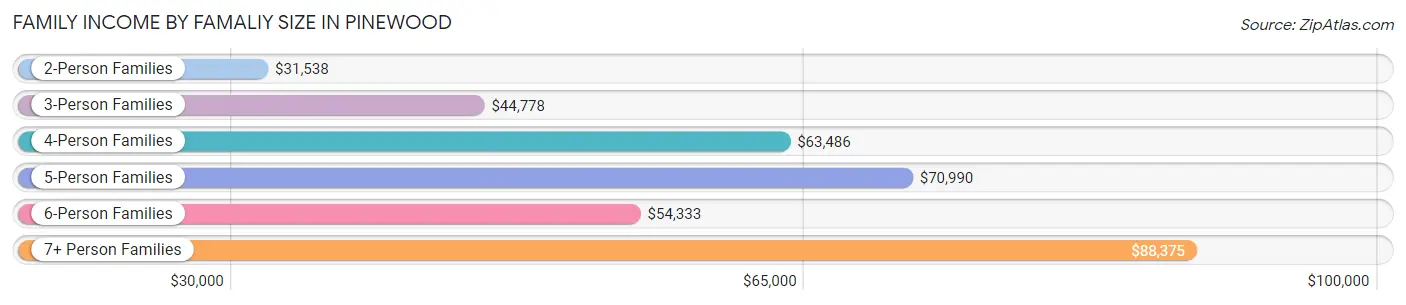
| Income Bracket | # Families | Median Income |
| 2-Person Families | 1,391 (37.2%) | $31,538 |
| 3-Person Families | 990 (26.5%) | $44,778 |
| 4-Person Families | 753 (20.1%) | $63,486 |
| 5-Person Families | 400 (10.7%) | $70,990 |
| 6-Person Families | 98 (2.6%) | $54,333 |
| 7+ Person Families | 109 (2.9%) | $88,375 |
| Total | 3,741 (100.0%) | $43,662 |
Family Income by Number of Earners in Pinewood
The median family income in Pinewood is $43,662, with families comprising 3+ earners (575) having the highest median family income of $84,107, while families with no earners (597) have the lowest median family income of $24,162, accounting for 15.4% and 16.0% of families, respectively.
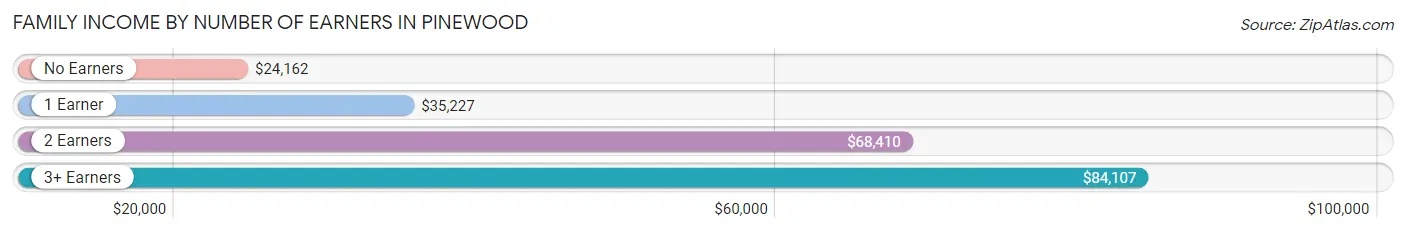
| Number of Earners | # Families | Median Income |
| No Earners | 597 (16.0%) | $24,162 |
| 1 Earner | 1,542 (41.2%) | $35,227 |
| 2 Earners | 1,027 (27.5%) | $68,410 |
| 3+ Earners | 575 (15.4%) | $84,107 |
| Total | 3,741 (100.0%) | $43,662 |
Household Income in Pinewood
Household Income Brackets in Pinewood
With 1,294 households falling in the category, the $50,000 to $74,999 income range is the most frequent in Pinewood, accounting for 24.0% of all households. In contrast, only 65 households (1.2%) fall into the $200,000+ income bracket, making it the least populous group.
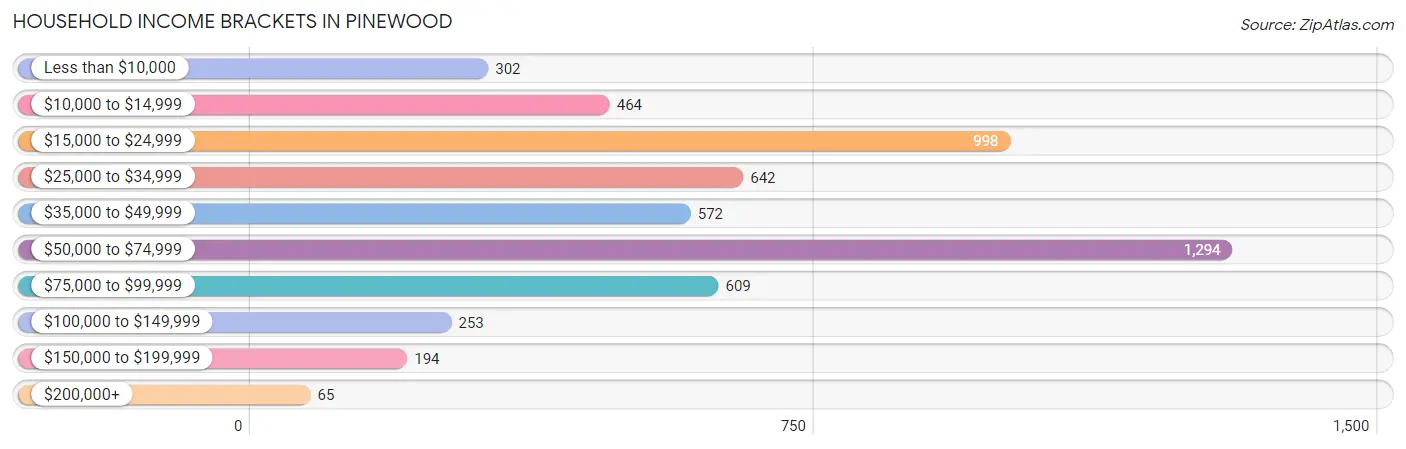
| Income Bracket | # Households | % Households |
| Less than $10,000 | 302 | 5.6% |
| $10,000 to $14,999 | 464 | 8.6% |
| $15,000 to $24,999 | 998 | 18.5% |
| $25,000 to $34,999 | 642 | 11.9% |
| $35,000 to $49,999 | 572 | 10.6% |
| $50,000 to $74,999 | 1,294 | 24.0% |
| $75,000 to $99,999 | 609 | 11.3% |
| $100,000 to $149,999 | 253 | 4.7% |
| $150,000 to $199,999 | 194 | 3.6% |
| $200,000+ | 65 | 1.2% |
Household Income by Householder Age in Pinewood
The median household income in Pinewood is $41,283, with the highest median household income of $57,500 found in the 25 to 44 years age bracket for the primary householder. A total of 1,332 households (24.7%) fall into this category. Meanwhile, the 65+ years age bracket for the primary householder has the lowest median household income of $27,126, with 1,656 households (30.7%) in this group.
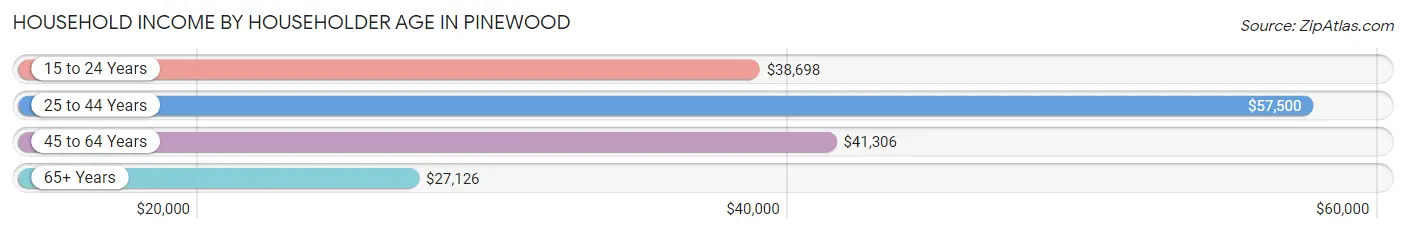
| Income Bracket | # Households | Median Income |
| 15 to 24 Years | 119 (2.2%) | $38,698 |
| 25 to 44 Years | 1,332 (24.7%) | $57,500 |
| 45 to 64 Years | 2,286 (42.4%) | $41,306 |
| 65+ Years | 1,656 (30.7%) | $27,126 |
| Total | 5,393 (100.0%) | $41,283 |
Poverty in Pinewood
Income Below Poverty by Sex and Age in Pinewood
With 20.3% poverty level for males and 22.1% for females among the residents of Pinewood, 12 to 14 year old males and 5 year old females are the most vulnerable to poverty, with 104 males (45.6%) and 38 females (55.1%) in their respective age groups living below the poverty level.
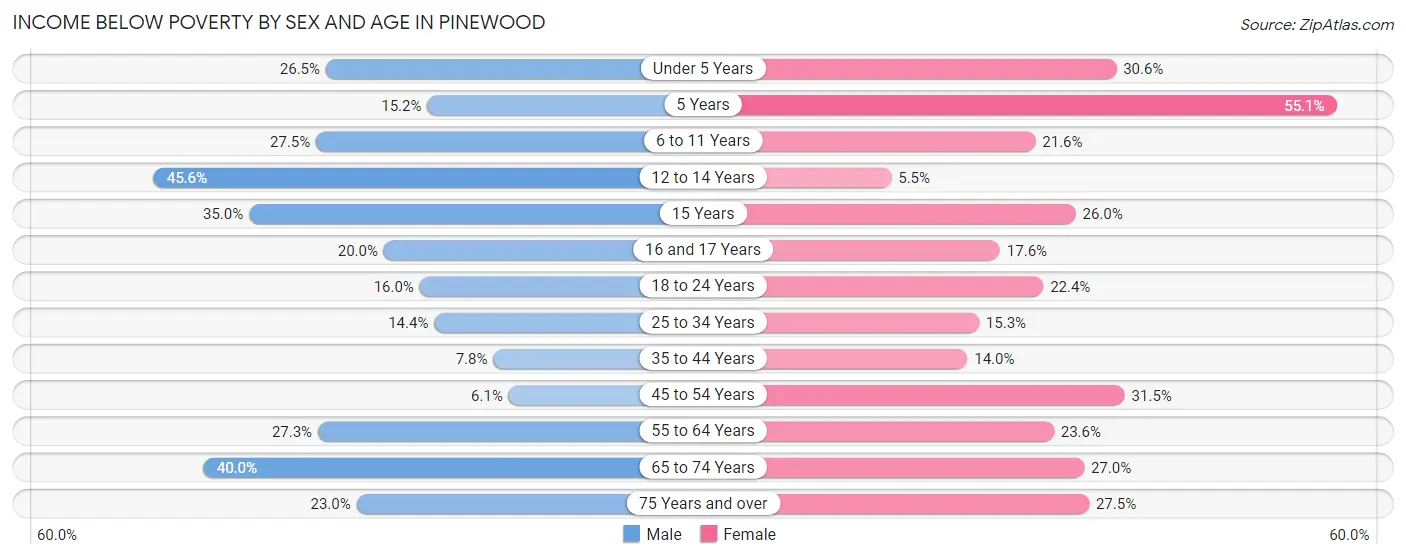
| Age Bracket | Male | Female |
| Under 5 Years | 169 (26.5%) | 147 (30.6%) |
| 5 Years | 20 (15.1%) | 38 (55.1%) |
| 6 to 11 Years | 152 (27.5%) | 144 (21.6%) |
| 12 to 14 Years | 104 (45.6%) | 20 (5.5%) |
| 15 Years | 28 (35.0%) | 19 (26.0%) |
| 16 and 17 Years | 63 (20.0%) | 28 (17.6%) |
| 18 to 24 Years | 143 (16.0%) | 179 (22.4%) |
| 25 to 34 Years | 173 (14.4%) | 128 (15.3%) |
| 35 to 44 Years | 76 (7.8%) | 207 (14.0%) |
| 45 to 54 Years | 83 (6.1%) | 333 (31.5%) |
| 55 to 64 Years | 202 (27.3%) | 230 (23.6%) |
| 65 to 74 Years | 448 (40.0%) | 205 (27.0%) |
| 75 Years and over | 70 (23.0%) | 158 (27.5%) |
| Total | 1,731 (20.3%) | 1,836 (22.1%) |
Income Above Poverty by Sex and Age in Pinewood
According to the poverty statistics in Pinewood, males aged 45 to 54 years and females aged 12 to 14 years are the age groups that are most secure financially, with 93.9% of males and 94.5% of females in these age groups living above the poverty line.
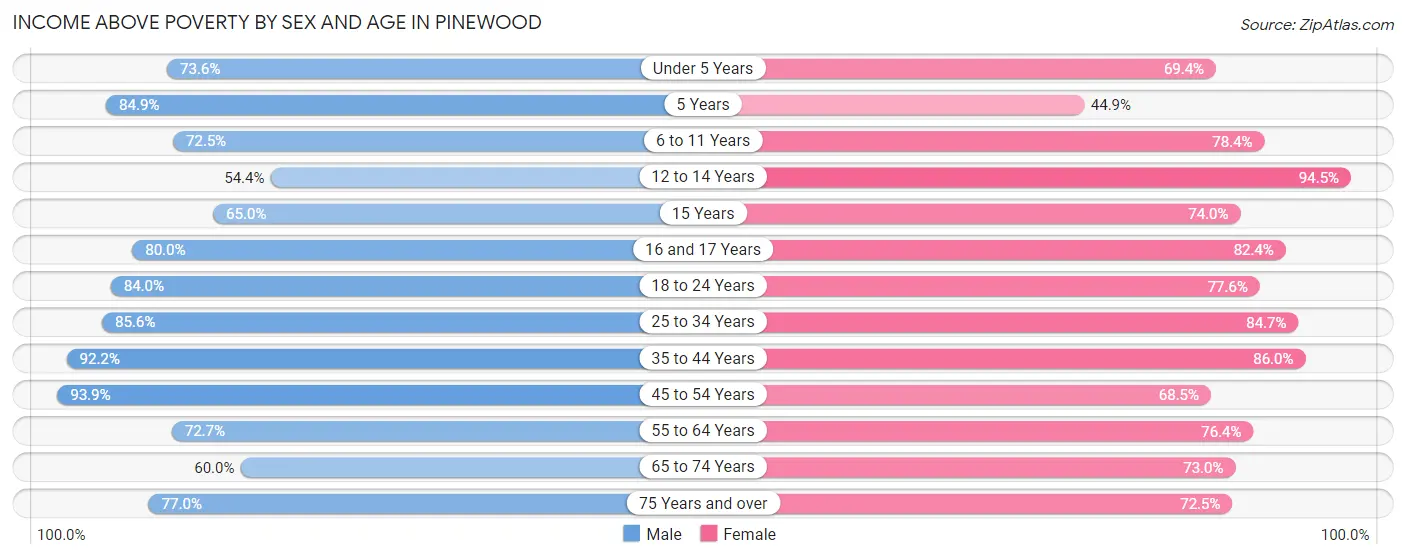
| Age Bracket | Male | Female |
| Under 5 Years | 470 (73.6%) | 334 (69.4%) |
| 5 Years | 112 (84.9%) | 31 (44.9%) |
| 6 to 11 Years | 400 (72.5%) | 524 (78.4%) |
| 12 to 14 Years | 124 (54.4%) | 343 (94.5%) |
| 15 Years | 52 (65.0%) | 54 (74.0%) |
| 16 and 17 Years | 252 (80.0%) | 131 (82.4%) |
| 18 to 24 Years | 751 (84.0%) | 619 (77.6%) |
| 25 to 34 Years | 1,030 (85.6%) | 710 (84.7%) |
| 35 to 44 Years | 898 (92.2%) | 1,274 (86.0%) |
| 45 to 54 Years | 1,282 (93.9%) | 724 (68.5%) |
| 55 to 64 Years | 537 (72.7%) | 744 (76.4%) |
| 65 to 74 Years | 671 (60.0%) | 555 (73.0%) |
| 75 Years and over | 234 (77.0%) | 416 (72.5%) |
| Total | 6,813 (79.7%) | 6,459 (77.9%) |
Income Below Poverty Among Married-Couple Families in Pinewood
The poverty statistics for married-couple families in Pinewood show that 9.2% or 157 of the total 1,707 families live below the poverty line. Families with no children have the highest poverty rate of 10.0%, comprising of 90 families. On the other hand, families with 3 or 4 children have the lowest poverty rate of 0.0%, which includes 0 families.
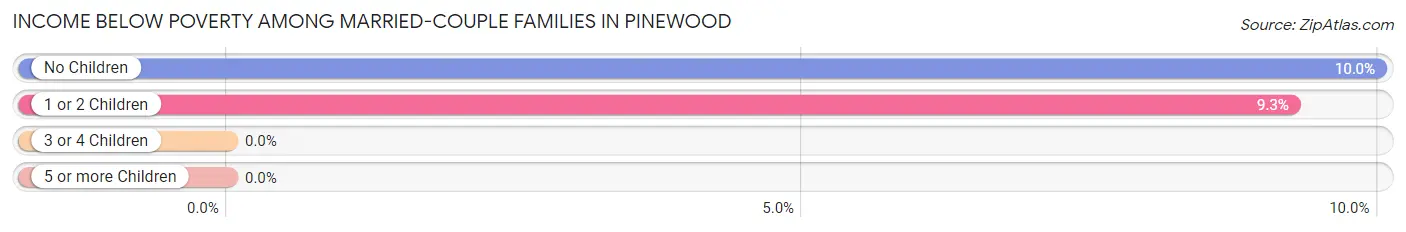
| Children | Above Poverty | Below Poverty |
| No Children | 810 (90.0%) | 90 (10.0%) |
| 1 or 2 Children | 657 (90.7%) | 67 (9.2%) |
| 3 or 4 Children | 83 (100.0%) | 0 (0.0%) |
| 5 or more Children | 0 (0.0%) | 0 (0.0%) |
| Total | 1,550 (90.8%) | 157 (9.2%) |
Income Below Poverty Among Single-Parent Households in Pinewood
According to the poverty data in Pinewood, 5.5% or 44 single-father households and 32.3% or 397 single-mother households are living below the poverty line. Among single-father households, those with 1 or 2 children have the highest poverty rate, with 30 households (8.0%) experiencing poverty. Likewise, among single-mother households, those with 3 or 4 children have the highest poverty rate, with 103 households (73.1%) falling below the poverty line.
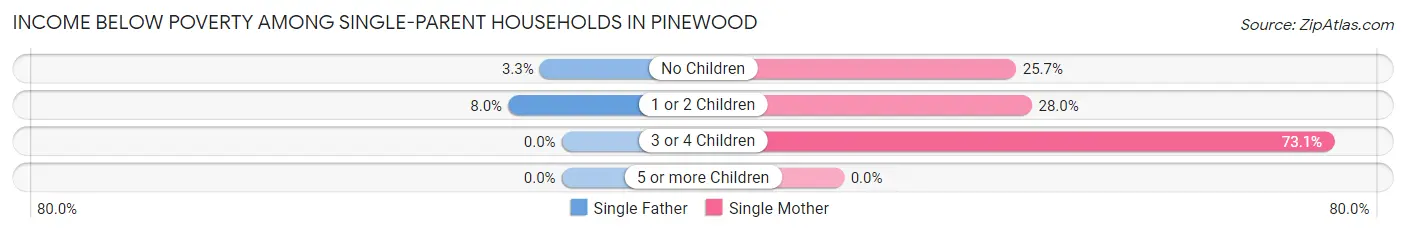
| Children | Single Father | Single Mother |
| No Children | 14 (3.3%) | 119 (25.7%) |
| 1 or 2 Children | 30 (8.0%) | 175 (28.0%) |
| 3 or 4 Children | 0 (0.0%) | 103 (73.1%) |
| 5 or more Children | 0 (0.0%) | 0 (0.0%) |
| Total | 44 (5.5%) | 397 (32.3%) |
Income Below Poverty Among Married-Couple vs Single-Parent Households in Pinewood
The poverty data for Pinewood shows that 157 of the married-couple family households (9.2%) and 441 of the single-parent households (21.7%) are living below the poverty level. Within the married-couple family households, those with no children have the highest poverty rate, with 90 households (10.0%) falling below the poverty line. Among the single-parent households, those with 3 or 4 children have the highest poverty rate, with 103 household (73.1%) living below poverty.
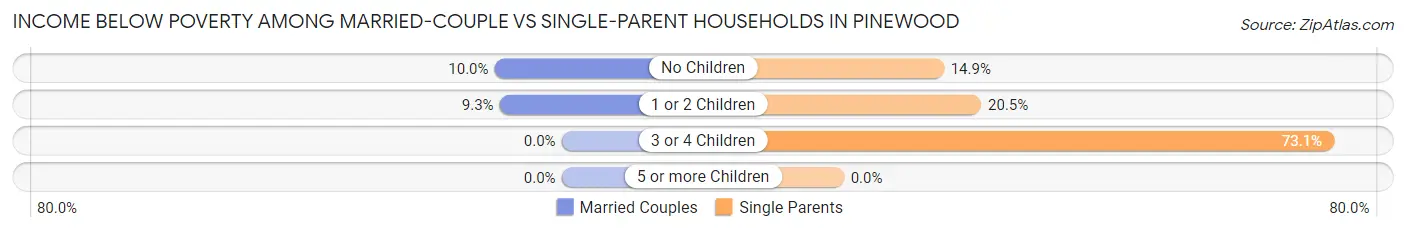
| Children | Married-Couple Families | Single-Parent Households |
| No Children | 90 (10.0%) | 133 (14.9%) |
| 1 or 2 Children | 67 (9.2%) | 205 (20.5%) |
| 3 or 4 Children | 0 (0.0%) | 103 (73.1%) |
| 5 or more Children | 0 (0.0%) | 0 (0.0%) |
| Total | 157 (9.2%) | 441 (21.7%) |
Race in Pinewood
The most populous races in Pinewood are Black / African American (12,330 | 71.8%), Hispanic or Latino (4,643 | 27.1%), and Some other Race (1,677 | 9.8%).
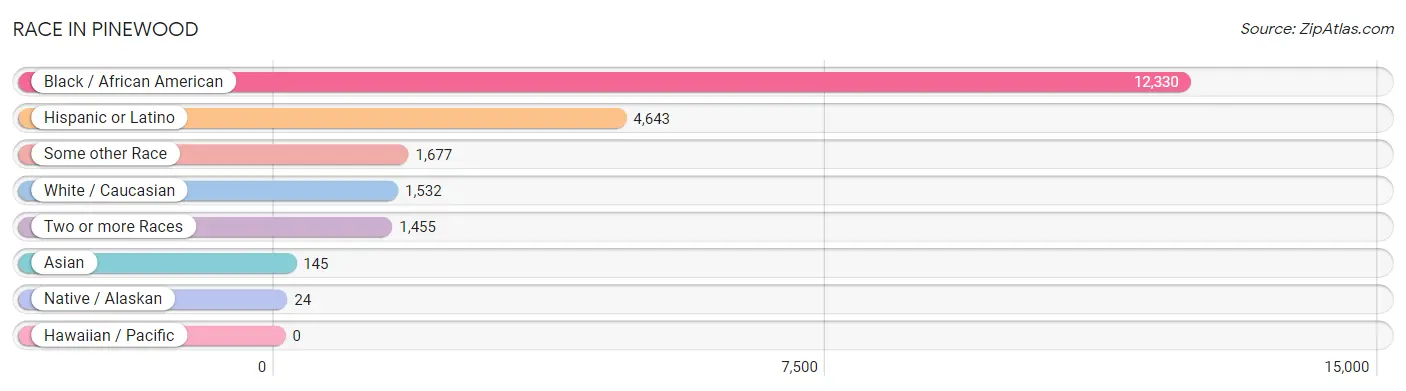
| Race | # Population | % Population |
| Asian | 145 | 0.8% |
| Black / African American | 12,330 | 71.8% |
| Hawaiian / Pacific | 0 | 0.0% |
| Hispanic or Latino | 4,643 | 27.1% |
| Native / Alaskan | 24 | 0.1% |
| White / Caucasian | 1,532 | 8.9% |
| Two or more Races | 1,455 | 8.5% |
| Some other Race | 1,677 | 9.8% |
| Total | 17,163 | 100.0% |
Ancestry in Pinewood
The most populous ancestries reported in Pinewood are Haitian (6,140 | 35.8%), Central American (1,802 | 10.5%), Cuban (1,752 | 10.2%), Nicaraguan (969 | 5.7%), and American (656 | 3.8%), together accounting for 65.9% of all Pinewood residents.
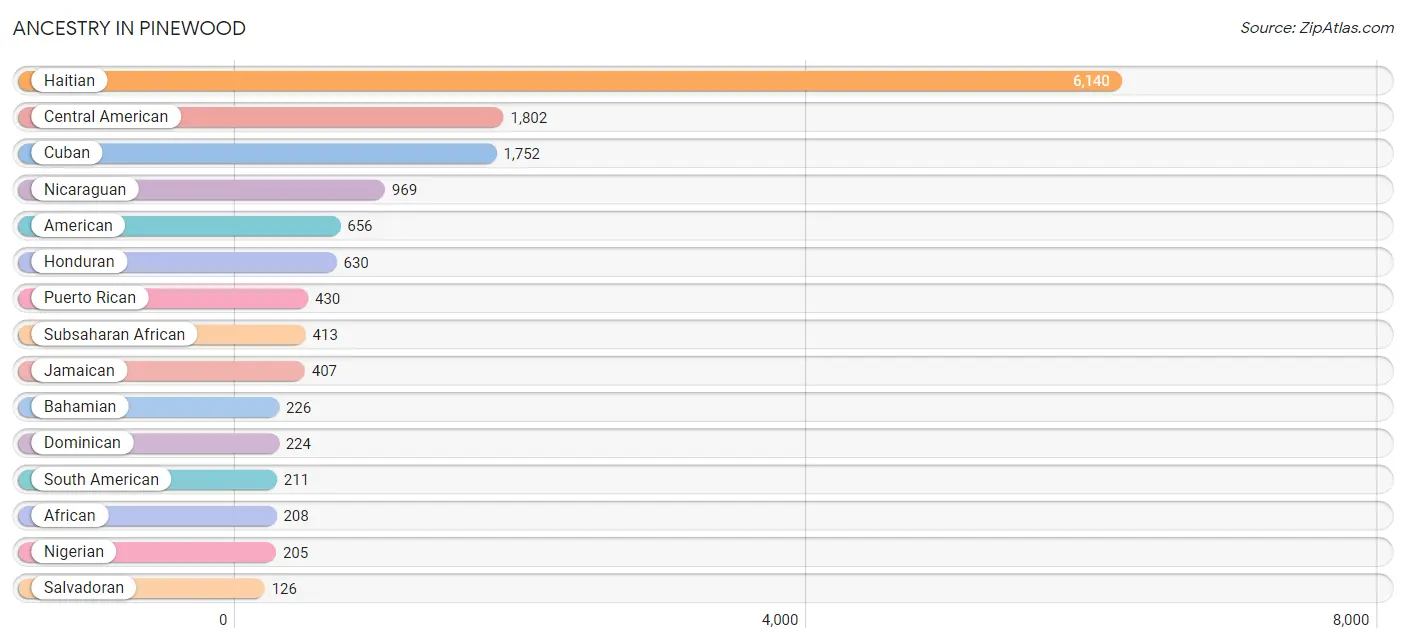
| Ancestry | # Population | % Population |
| African | 208 | 1.2% |
| American | 656 | 3.8% |
| Argentinean | 31 | 0.2% |
| Bahamian | 226 | 1.3% |
| British | 18 | 0.1% |
| Central American | 1,802 | 10.5% |
| Chilean | 27 | 0.2% |
| Colombian | 99 | 0.6% |
| Costa Rican | 3 | 0.0% |
| Cuban | 1,752 | 10.2% |
| Dominican | 224 | 1.3% |
| English | 9 | 0.1% |
| French | 71 | 0.4% |
| French American Indian | 5 | 0.0% |
| German | 57 | 0.3% |
| Guatemalan | 74 | 0.4% |
| Guyanese | 16 | 0.1% |
| Haitian | 6,140 | 35.8% |
| Honduran | 630 | 3.7% |
| Iranian | 2 | 0.0% |
| Italian | 33 | 0.2% |
| Jamaican | 407 | 2.4% |
| Korean | 11 | 0.1% |
| Mexican | 87 | 0.5% |
| Nicaraguan | 969 | 5.7% |
| Nigerian | 205 | 1.2% |
| Peruvian | 27 | 0.2% |
| Puerto Rican | 430 | 2.5% |
| Russian | 52 | 0.3% |
| Salvadoran | 126 | 0.7% |
| Scottish | 5 | 0.0% |
| South American | 211 | 1.2% |
| Sri Lankan | 21 | 0.1% |
| Subsaharan African | 413 | 2.4% |
| Thai | 80 | 0.5% |
| Venezuelan | 27 | 0.2% | View All 36 Rows |
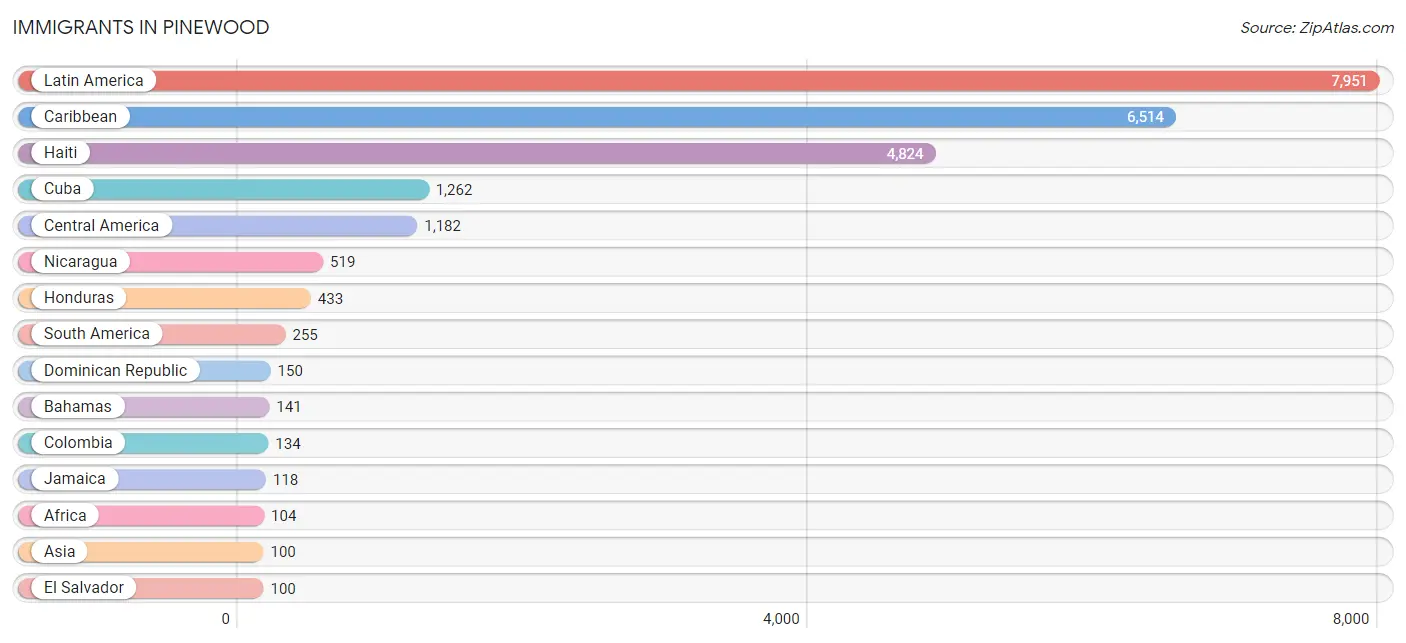
Immigrants in Pinewood
The most numerous immigrant groups reported in Pinewood came from Latin America (7,951 | 46.3%), Caribbean (6,514 | 38.0%), Haiti (4,824 | 28.1%), Cuba (1,262 | 7.3%), and Central America (1,182 | 6.9%), together accounting for 126.6% of all Pinewood residents.
| Immigration Origin | # Population | % Population |
| Africa | 104 | 0.6% |
| Argentina | 16 | 0.1% |
| Asia | 100 | 0.6% |
| Bahamas | 141 | 0.8% |
| Caribbean | 6,514 | 38.0% |
| Central America | 1,182 | 6.9% |
| Chile | 27 | 0.2% |
| Colombia | 134 | 0.8% |
| Costa Rica | 3 | 0.0% |
| Cuba | 1,262 | 7.3% |
| Dominica | 19 | 0.1% |
| Dominican Republic | 150 | 0.9% |
| Eastern Europe | 52 | 0.3% |
| El Salvador | 100 | 0.6% |
| Europe | 100 | 0.6% |
| France | 21 | 0.1% |
| Guatemala | 74 | 0.4% |
| Guyana | 16 | 0.1% |
| Haiti | 4,824 | 28.1% |
| Honduras | 433 | 2.5% |
| India | 65 | 0.4% |
| Italy | 27 | 0.2% |
| Jamaica | 118 | 0.7% |
| Latin America | 7,951 | 46.3% |
| Mexico | 53 | 0.3% |
| Nepal | 24 | 0.1% |
| Nicaragua | 519 | 3.0% |
| Nigeria | 84 | 0.5% |
| Philippines | 11 | 0.1% |
| Russia | 52 | 0.3% |
| South America | 255 | 1.5% |
| South Central Asia | 89 | 0.5% |
| South Eastern Asia | 11 | 0.1% |
| Southern Europe | 27 | 0.2% |
| Venezuela | 27 | 0.2% |
| Western Africa | 84 | 0.5% |
| Western Europe | 21 | 0.1% | View All 37 Rows |
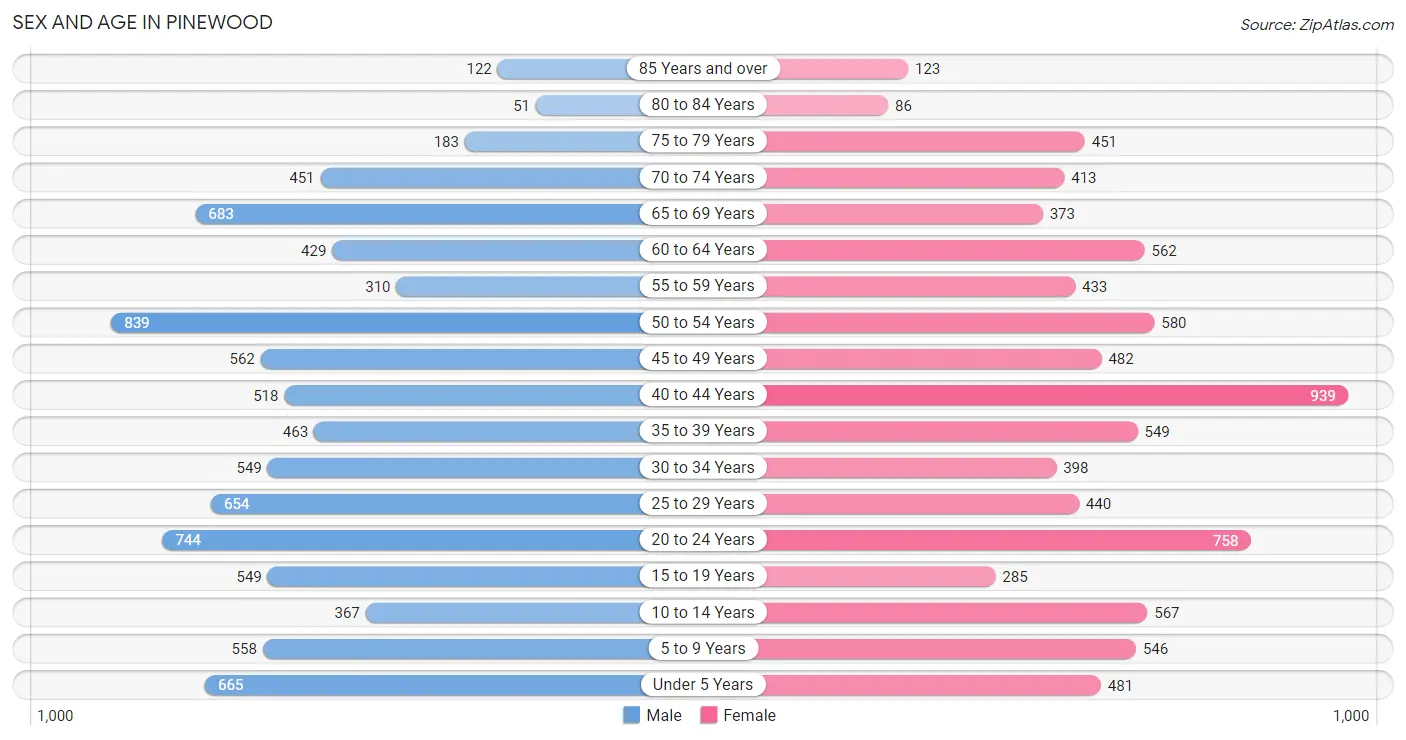
Sex and Age in Pinewood
Sex and Age in Pinewood
The most populous age groups in Pinewood are 50 to 54 Years (839 | 9.7%) for men and 40 to 44 Years (939 | 11.1%) for women.
| Age Bracket | Male | Female |
| Under 5 Years | 665 (7.6%) | 481 (5.7%) |
| 5 to 9 Years | 558 (6.4%) | 546 (6.5%) |
| 10 to 14 Years | 367 (4.2%) | 567 (6.7%) |
| 15 to 19 Years | 549 (6.3%) | 285 (3.4%) |
| 20 to 24 Years | 744 (8.6%) | 758 (8.9%) |
| 25 to 29 Years | 654 (7.5%) | 440 (5.2%) |
| 30 to 34 Years | 549 (6.3%) | 398 (4.7%) |
| 35 to 39 Years | 463 (5.3%) | 549 (6.5%) |
| 40 to 44 Years | 518 (6.0%) | 939 (11.1%) |
| 45 to 49 Years | 562 (6.5%) | 482 (5.7%) |
| 50 to 54 Years | 839 (9.7%) | 580 (6.9%) |
| 55 to 59 Years | 310 (3.6%) | 433 (5.1%) |
| 60 to 64 Years | 429 (4.9%) | 562 (6.6%) |
| 65 to 69 Years | 683 (7.9%) | 373 (4.4%) |
| 70 to 74 Years | 451 (5.2%) | 413 (4.9%) |
| 75 to 79 Years | 183 (2.1%) | 451 (5.3%) |
| 80 to 84 Years | 51 (0.6%) | 86 (1.0%) |
| 85 Years and over | 122 (1.4%) | 123 (1.5%) |
| Total | 8,697 (100.0%) | 8,466 (100.0%) |
Families and Households in Pinewood
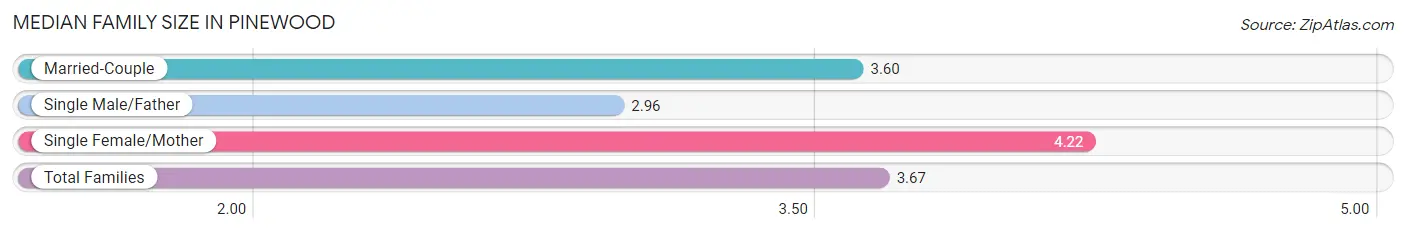
Median Family Size in Pinewood
The median family size in Pinewood is 3.67 persons per family, with single female/mother families (1,230 | 32.9%) accounting for the largest median family size of 4.22 persons per family. On the other hand, single male/father families (804 | 21.5%) represent the smallest median family size with 2.96 persons per family.
| Family Type | # Families | Family Size |
| Married-Couple | 1,707 (45.6%) | 3.60 |
| Single Male/Father | 804 (21.5%) | 2.96 |
| Single Female/Mother | 1,230 (32.9%) | 4.22 |
| Total Families | 3,741 (100.0%) | 3.67 |
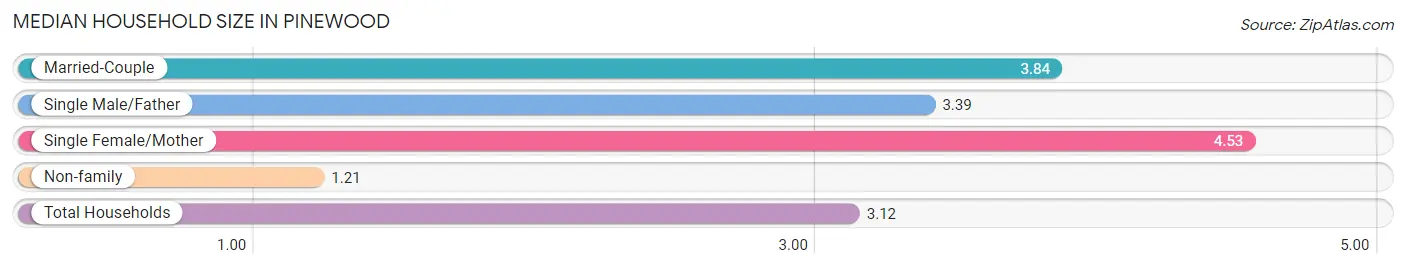
Median Household Size in Pinewood
The median household size in Pinewood is 3.12 persons per household, with single female/mother households (1,230 | 22.8%) accounting for the largest median household size of 4.53 persons per household. non-family households (1,652 | 30.6%) represent the smallest median household size with 1.21 persons per household.
| Household Type | # Households | Household Size |
| Married-Couple | 1,707 (31.7%) | 3.84 |
| Single Male/Father | 804 (14.9%) | 3.39 |
| Single Female/Mother | 1,230 (22.8%) | 4.53 |
| Non-family | 1,652 (30.6%) | 1.21 |
| Total Households | 5,393 (100.0%) | 3.12 |
Household Size by Marriage Status in Pinewood
Out of a total of 5,393 households in Pinewood, 3,741 (69.4%) are family households, while 1,652 (30.6%) are nonfamily households. The most numerous type of family households are 2-person households, comprising 1,040, and the most common type of nonfamily households are 1-person households, comprising 1,399.
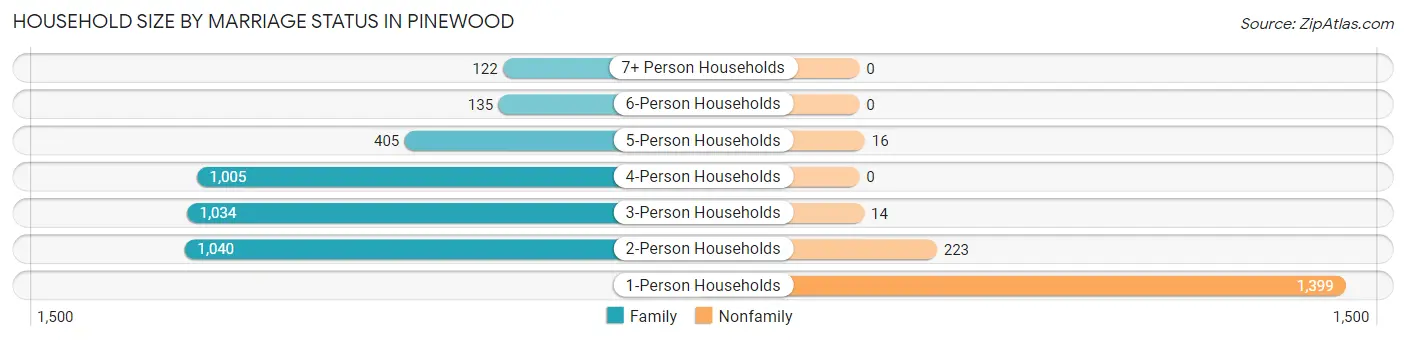
| Household Size | Family Households | Nonfamily Households |
| 1-Person Households | - | 1,399 (25.9%) |
| 2-Person Households | 1,040 (19.3%) | 223 (4.1%) |
| 3-Person Households | 1,034 (19.2%) | 14 (0.3%) |
| 4-Person Households | 1,005 (18.6%) | 0 (0.0%) |
| 5-Person Households | 405 (7.5%) | 16 (0.3%) |
| 6-Person Households | 135 (2.5%) | 0 (0.0%) |
| 7+ Person Households | 122 (2.3%) | 0 (0.0%) |
| Total | 3,741 (69.4%) | 1,652 (30.6%) |
Female Fertility in Pinewood
Fertility by Age in Pinewood
Average fertility rate in Pinewood is 73.0 births per 1,000 women. Women in the age bracket of 20 to 34 years have the highest fertility rate with 108.0 births per 1,000 women. Women in the age bracket of 20 to 34 years acount for 57.9% of all women with births.
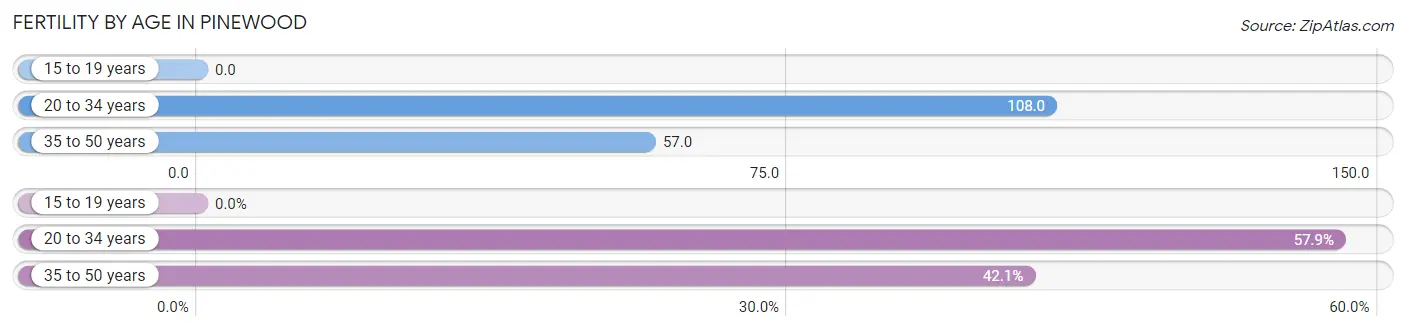
| Age Bracket | Women with Births | Births / 1,000 Women |
| 15 to 19 years | 0 (0.0%) | 0.0 |
| 20 to 34 years | 172 (57.9%) | 108.0 |
| 35 to 50 years | 125 (42.1%) | 57.0 |
| Total | 297 (100.0%) | 73.0 |
Fertility by Age by Marriage Status in Pinewood
62.6% of women with births (297) in Pinewood are married. The highest percentage of unmarried women with births falls into 35 to 50 years age bracket with 57.6% of them unmarried at the time of birth, while the lowest percentage of unmarried women with births belong to 20 to 34 years age bracket with 22.7% of them unmarried.
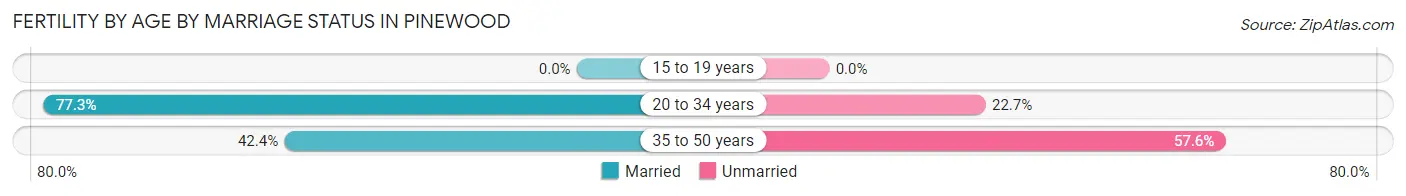
| Age Bracket | Married | Unmarried |
| 15 to 19 years | 0 (0.0%) | 0 (0.0%) |
| 20 to 34 years | 133 (77.3%) | 39 (22.7%) |
| 35 to 50 years | 53 (42.4%) | 72 (57.6%) |
| Total | 186 (62.6%) | 111 (37.4%) |
Fertility by Education in Pinewood
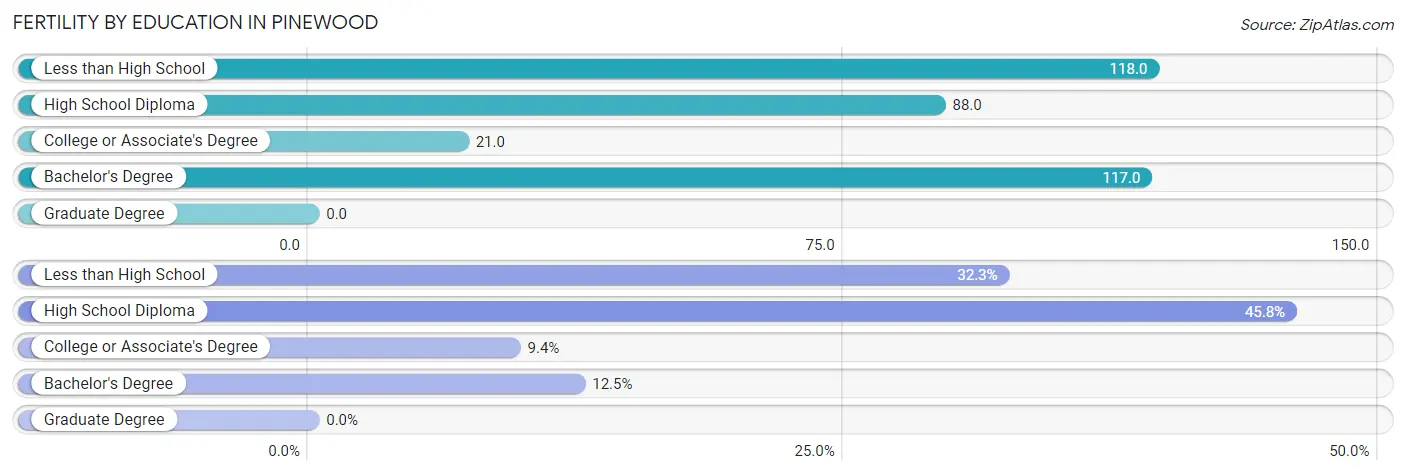
| Educational Attainment | Women with Births | Births / 1,000 Women |
| Less than High School | 96 (32.3%) | 118.0 |
| High School Diploma | 136 (45.8%) | 88.0 |
| College or Associate's Degree | 28 (9.4%) | 21.0 |
| Bachelor's Degree | 37 (12.5%) | 117.0 |
| Graduate Degree | 0 (0.0%) | 0.0 |
| Total | 297 (100.0%) | 73.0 |
Fertility by Education by Marriage Status in Pinewood
37.4% of women with births in Pinewood are unmarried. Women with the educational attainment of high school diploma are most likely to be married with 100.0% of them married at childbirth, while women with the educational attainment of less than high school are least likely to be married with 100.0% of them unmarried at childbirth.
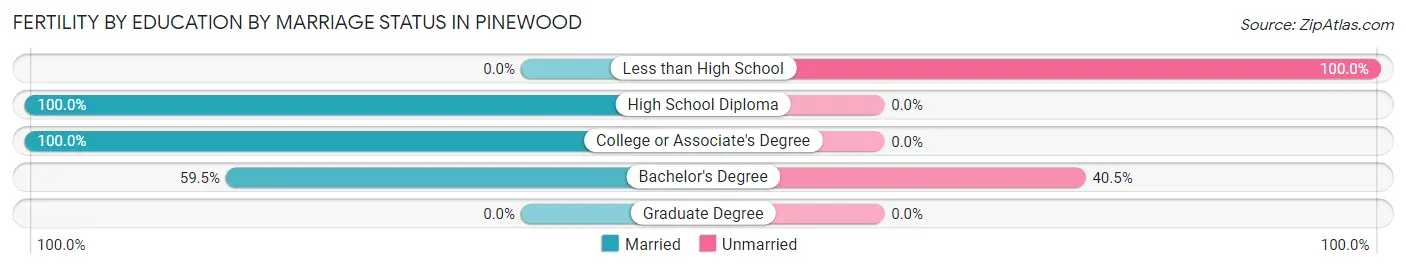
| Educational Attainment | Married | Unmarried |
| Less than High School | 0 (0.0%) | 96 (100.0%) |
| High School Diploma | 136 (100.0%) | 0 (0.0%) |
| College or Associate's Degree | 28 (100.0%) | 0 (0.0%) |
| Bachelor's Degree | 22 (59.5%) | 15 (40.5%) |
| Graduate Degree | 0 (0.0%) | 0 (0.0%) |
| Total | 186 (62.6%) | 111 (37.4%) |
Employment Characteristics in Pinewood
Employment by Class of Employer in Pinewood
Among the 7,245 employed individuals in Pinewood, private company employees (5,425 | 74.9%), local government employees (542 | 7.5%), and self-employed (not incorporated) (456 | 6.3%) make up the most common classes of employment.
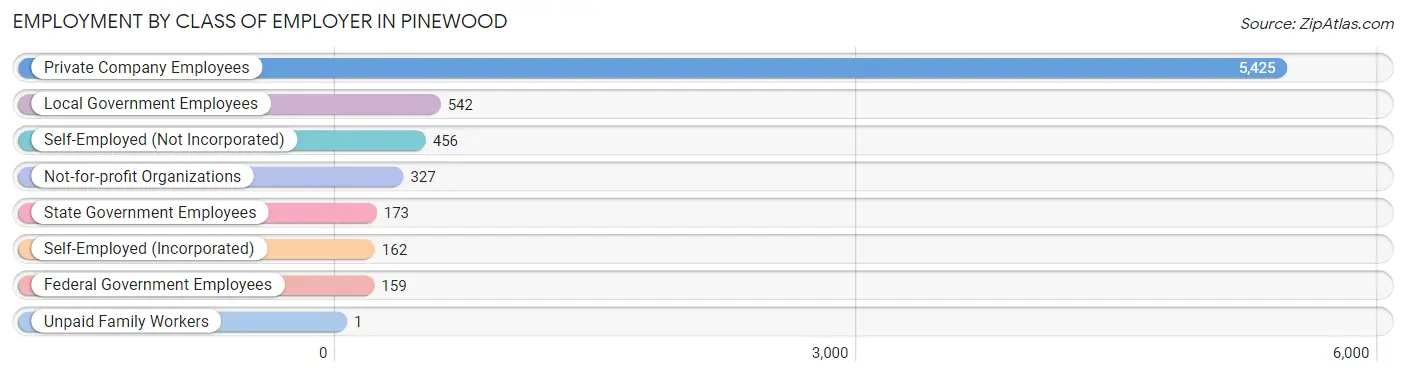
| Employer Class | # Employees | % Employees |
| Private Company Employees | 5,425 | 74.9% |
| Self-Employed (Incorporated) | 162 | 2.2% |
| Self-Employed (Not Incorporated) | 456 | 6.3% |
| Not-for-profit Organizations | 327 | 4.5% |
| Local Government Employees | 542 | 7.5% |
| State Government Employees | 173 | 2.4% |
| Federal Government Employees | 159 | 2.2% |
| Unpaid Family Workers | 1 | 0.0% |
| Total | 7,245 | 100.0% |
Employment Status by Age in Pinewood
According to the labor force statistics for Pinewood, out of the total population over 16 years of age (13,826), 57.4% or 7,936 individuals are in the labor force, with 7.3% or 579 of them unemployed. The age group with the highest labor force participation rate is 35 to 44 years, with 83.9% or 2,071 individuals in the labor force. Within the labor force, the 16 to 19 years age range has the highest percentage of unemployed individuals, with 100.0% or 20 of them being unemployed.
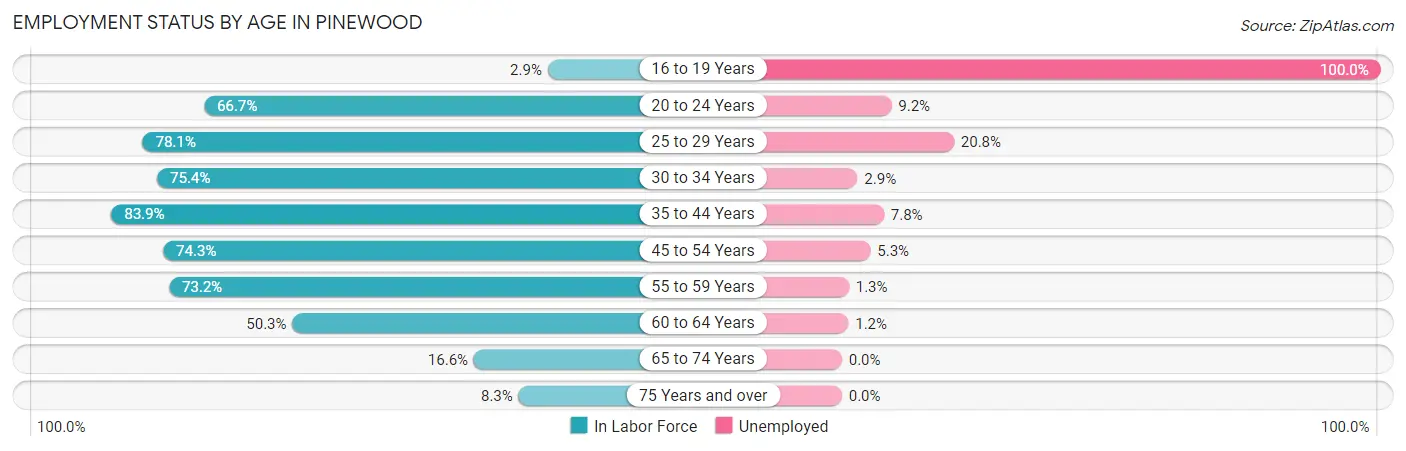
| Age Bracket | In Labor Force | Unemployed |
| 16 to 19 Years | 20 (2.9%) | 20 (100.0%) |
| 20 to 24 Years | 1,002 (66.7%) | 92 (9.2%) |
| 25 to 29 Years | 854 (78.1%) | 178 (20.8%) |
| 30 to 34 Years | 714 (75.4%) | 21 (2.9%) |
| 35 to 44 Years | 2,071 (83.9%) | 162 (7.8%) |
| 45 to 54 Years | 1,830 (74.3%) | 97 (5.3%) |
| 55 to 59 Years | 544 (73.2%) | 7 (1.3%) |
| 60 to 64 Years | 498 (50.3%) | 6 (1.2%) |
| 65 to 74 Years | 319 (16.6%) | 0 (0.0%) |
| 75 Years and over | 84 (8.3%) | 0 (0.0%) |
| Total | 7,936 (57.4%) | 579 (7.3%) |
Employment Status by Educational Attainment in Pinewood
According to labor force statistics for Pinewood, 74.8% of individuals (6,513) out of the total population between 25 and 64 years of age (8,707) are in the labor force, with 7.2% or 469 of them being unemployed. The group with the highest labor force participation rate are those with the educational attainment of bachelor's degree or higher, with 85.0% or 932 individuals in the labor force. Within the labor force, individuals with college / associate degree education have the highest percentage of unemployment, with 10.1% or 192 of them being unemployed.
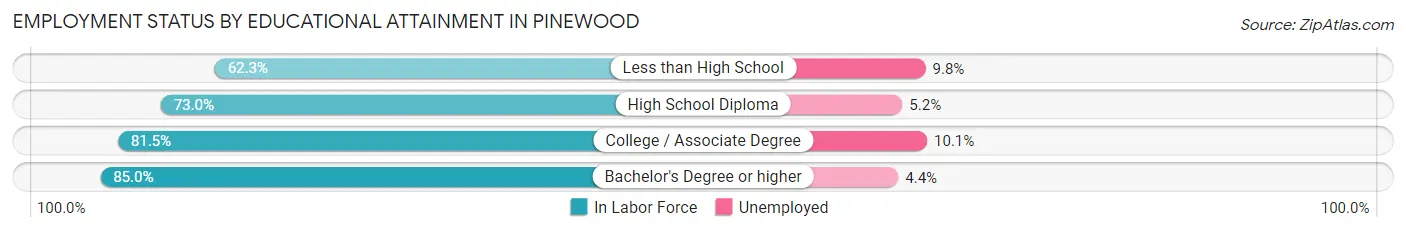
| Educational Attainment | In Labor Force | Unemployed |
| Less than High School | 1,001 (62.3%) | 157 (9.8%) |
| High School Diploma | 2,678 (73.0%) | 191 (5.2%) |
| College / Associate Degree | 1,902 (81.5%) | 236 (10.1%) |
| Bachelor's Degree or higher | 932 (85.0%) | 48 (4.4%) |
| Total | 6,513 (74.8%) | 627 (7.2%) |
Employment Occupations by Sex in Pinewood
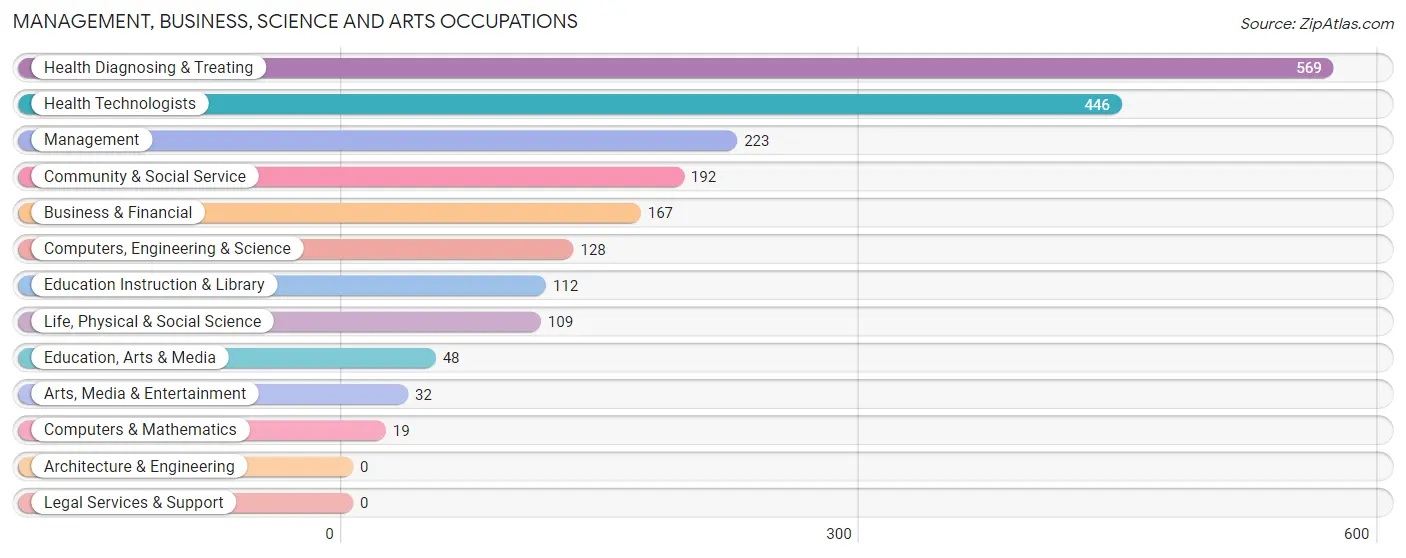
Management, Business, Science and Arts Occupations
The most common Management, Business, Science and Arts occupations in Pinewood are Health Diagnosing & Treating (569 | 7.7%), Health Technologists (446 | 6.1%), Management (223 | 3.0%), Community & Social Service (192 | 2.6%), and Business & Financial (167 | 2.3%).
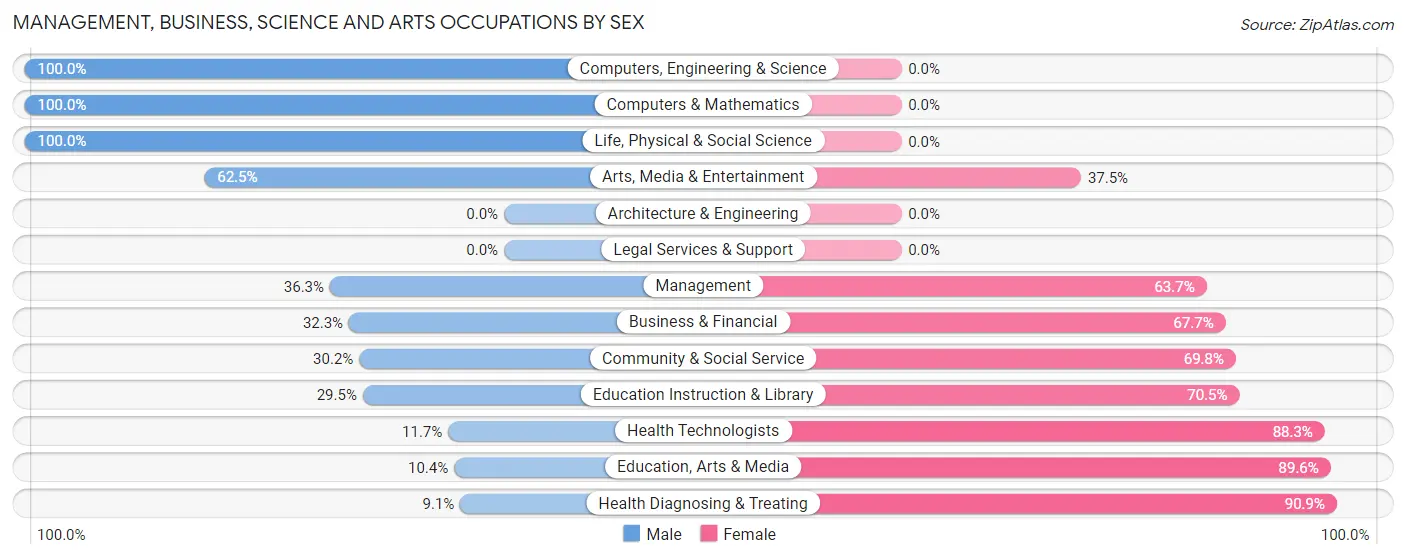
Management, Business, Science and Arts Occupations by Sex
Within the Management, Business, Science and Arts occupations in Pinewood, the most male-oriented occupations are Computers, Engineering & Science (100.0%), Computers & Mathematics (100.0%), and Life, Physical & Social Science (100.0%), while the most female-oriented occupations are Health Diagnosing & Treating (90.9%), Education, Arts & Media (89.6%), and Health Technologists (88.3%).
| Occupation | Male | Female |
| Management | 81 (36.3%) | 142 (63.7%) |
| Business & Financial | 54 (32.3%) | 113 (67.7%) |
| Computers, Engineering & Science | 128 (100.0%) | 0 (0.0%) |
| Computers & Mathematics | 19 (100.0%) | 0 (0.0%) |
| Architecture & Engineering | 0 (0.0%) | 0 (0.0%) |
| Life, Physical & Social Science | 109 (100.0%) | 0 (0.0%) |
| Community & Social Service | 58 (30.2%) | 134 (69.8%) |
| Education, Arts & Media | 5 (10.4%) | 43 (89.6%) |
| Legal Services & Support | 0 (0.0%) | 0 (0.0%) |
| Education Instruction & Library | 33 (29.5%) | 79 (70.5%) |
| Arts, Media & Entertainment | 20 (62.5%) | 12 (37.5%) |
| Health Diagnosing & Treating | 52 (9.1%) | 517 (90.9%) |
| Health Technologists | 52 (11.7%) | 394 (88.3%) |
| Total (Category) | 373 (29.2%) | 906 (70.8%) |
| Total (Overall) | 3,910 (53.2%) | 3,444 (46.8%) |
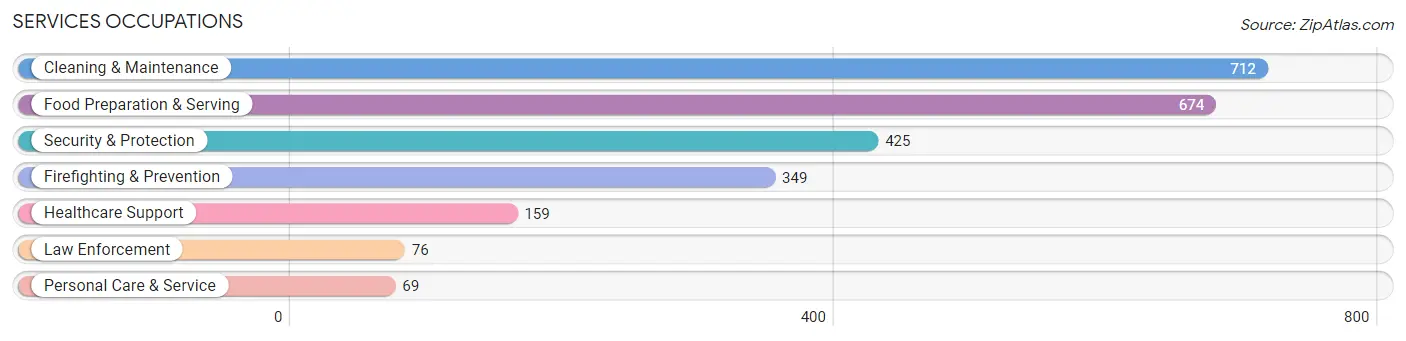
Services Occupations
The most common Services occupations in Pinewood are Cleaning & Maintenance (712 | 9.7%), Food Preparation & Serving (674 | 9.2%), Security & Protection (425 | 5.8%), Firefighting & Prevention (349 | 4.8%), and Healthcare Support (159 | 2.2%).
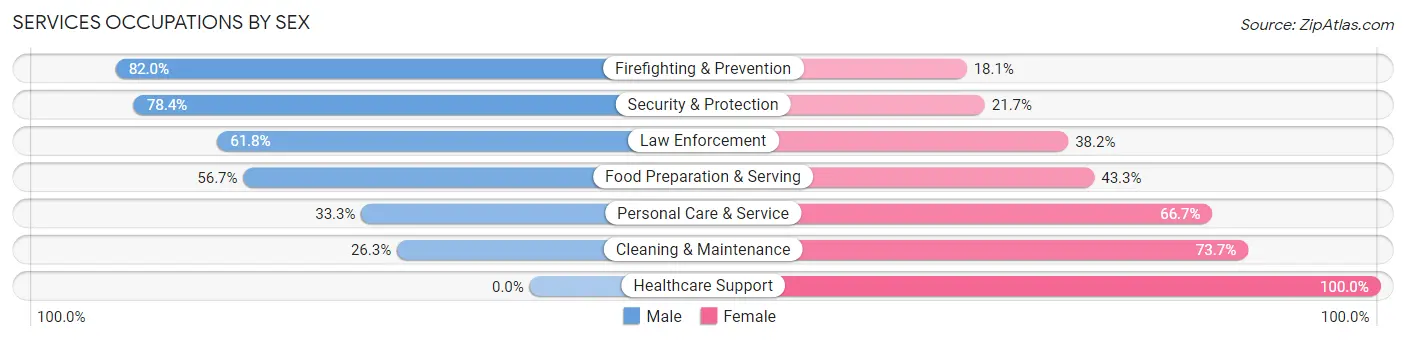
Services Occupations by Sex
Within the Services occupations in Pinewood, the most male-oriented occupations are Firefighting & Prevention (82.0%), Security & Protection (78.3%), and Law Enforcement (61.8%), while the most female-oriented occupations are Healthcare Support (100.0%), Cleaning & Maintenance (73.7%), and Personal Care & Service (66.7%).
| Occupation | Male | Female |
| Healthcare Support | 0 (0.0%) | 159 (100.0%) |
| Security & Protection | 333 (78.3%) | 92 (21.6%) |
| Firefighting & Prevention | 286 (82.0%) | 63 (18.0%) |
| Law Enforcement | 47 (61.8%) | 29 (38.2%) |
| Food Preparation & Serving | 382 (56.7%) | 292 (43.3%) |
| Cleaning & Maintenance | 187 (26.3%) | 525 (73.7%) |
| Personal Care & Service | 23 (33.3%) | 46 (66.7%) |
| Total (Category) | 925 (45.4%) | 1,114 (54.6%) |
| Total (Overall) | 3,910 (53.2%) | 3,444 (46.8%) |
Sales and Office Occupations
The most common Sales and Office occupations in Pinewood are Sales & Related (704 | 9.6%), and Office & Administration (664 | 9.0%).
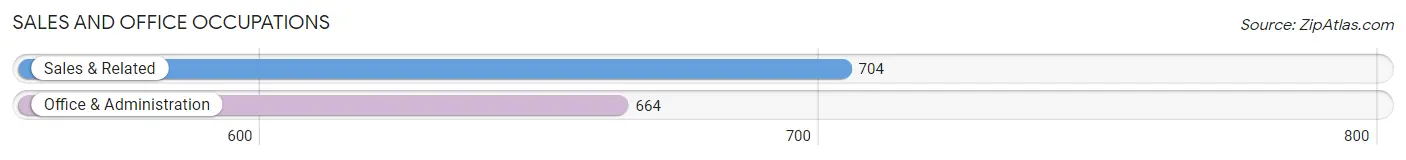
Sales and Office Occupations by Sex
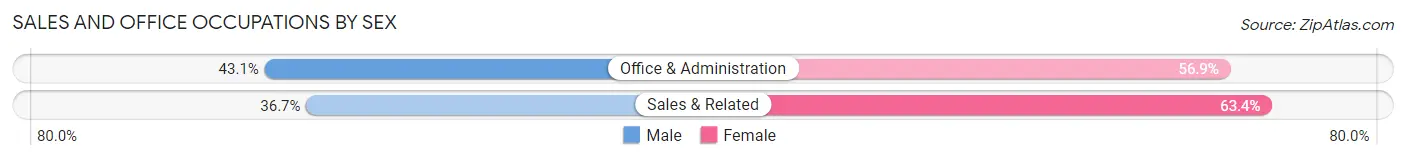
| Occupation | Male | Female |
| Sales & Related | 258 (36.6%) | 446 (63.3%) |
| Office & Administration | 286 (43.1%) | 378 (56.9%) |
| Total (Category) | 544 (39.8%) | 824 (60.2%) |
| Total (Overall) | 3,910 (53.2%) | 3,444 (46.8%) |
Natural Resources, Construction and Maintenance Occupations
The most common Natural Resources, Construction and Maintenance occupations in Pinewood are Installation, Maintenance & Repair (487 | 6.6%), Construction & Extraction (413 | 5.6%), and Farming, Fishing & Forestry (47 | 0.6%).
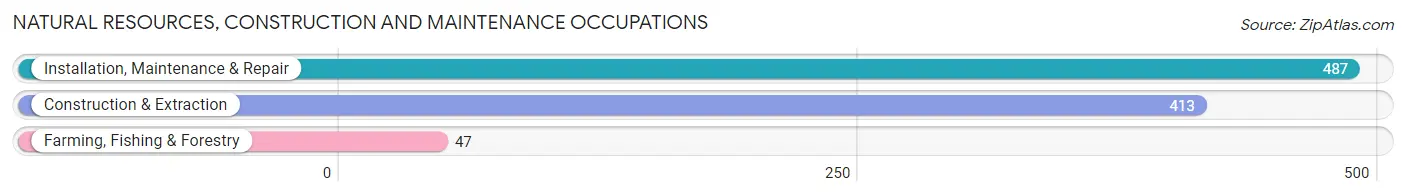
Natural Resources, Construction and Maintenance Occupations by Sex
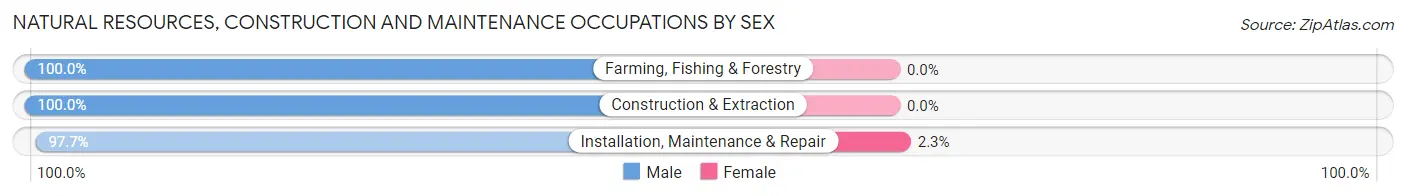
| Occupation | Male | Female |
| Farming, Fishing & Forestry | 47 (100.0%) | 0 (0.0%) |
| Construction & Extraction | 413 (100.0%) | 0 (0.0%) |
| Installation, Maintenance & Repair | 476 (97.7%) | 11 (2.3%) |
| Total (Category) | 936 (98.8%) | 11 (1.2%) |
| Total (Overall) | 3,910 (53.2%) | 3,444 (46.8%) |
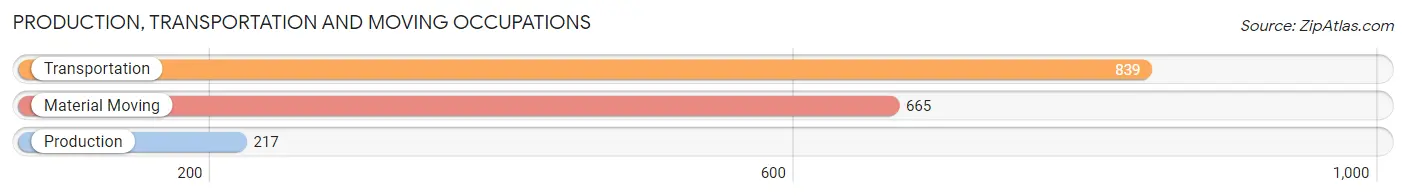
Production, Transportation and Moving Occupations
The most common Production, Transportation and Moving occupations in Pinewood are Transportation (839 | 11.4%), Material Moving (665 | 9.0%), and Production (217 | 2.9%).
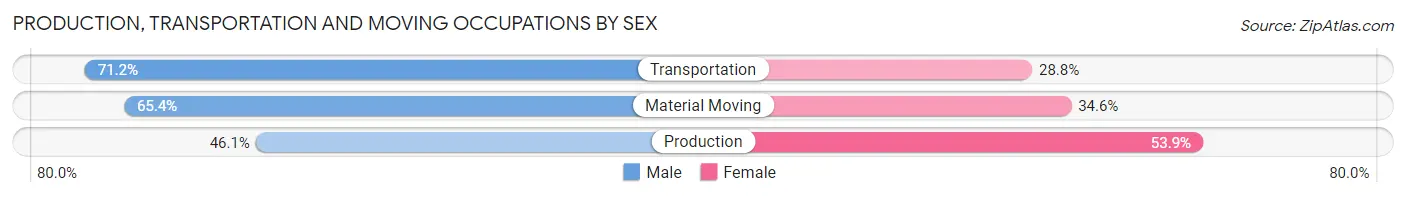
Production, Transportation and Moving Occupations by Sex
| Occupation | Male | Female |
| Production | 100 (46.1%) | 117 (53.9%) |
| Transportation | 597 (71.2%) | 242 (28.8%) |
| Material Moving | 435 (65.4%) | 230 (34.6%) |
| Total (Category) | 1,132 (65.8%) | 589 (34.2%) |
| Total (Overall) | 3,910 (53.2%) | 3,444 (46.8%) |
Employment Industries by Sex in Pinewood
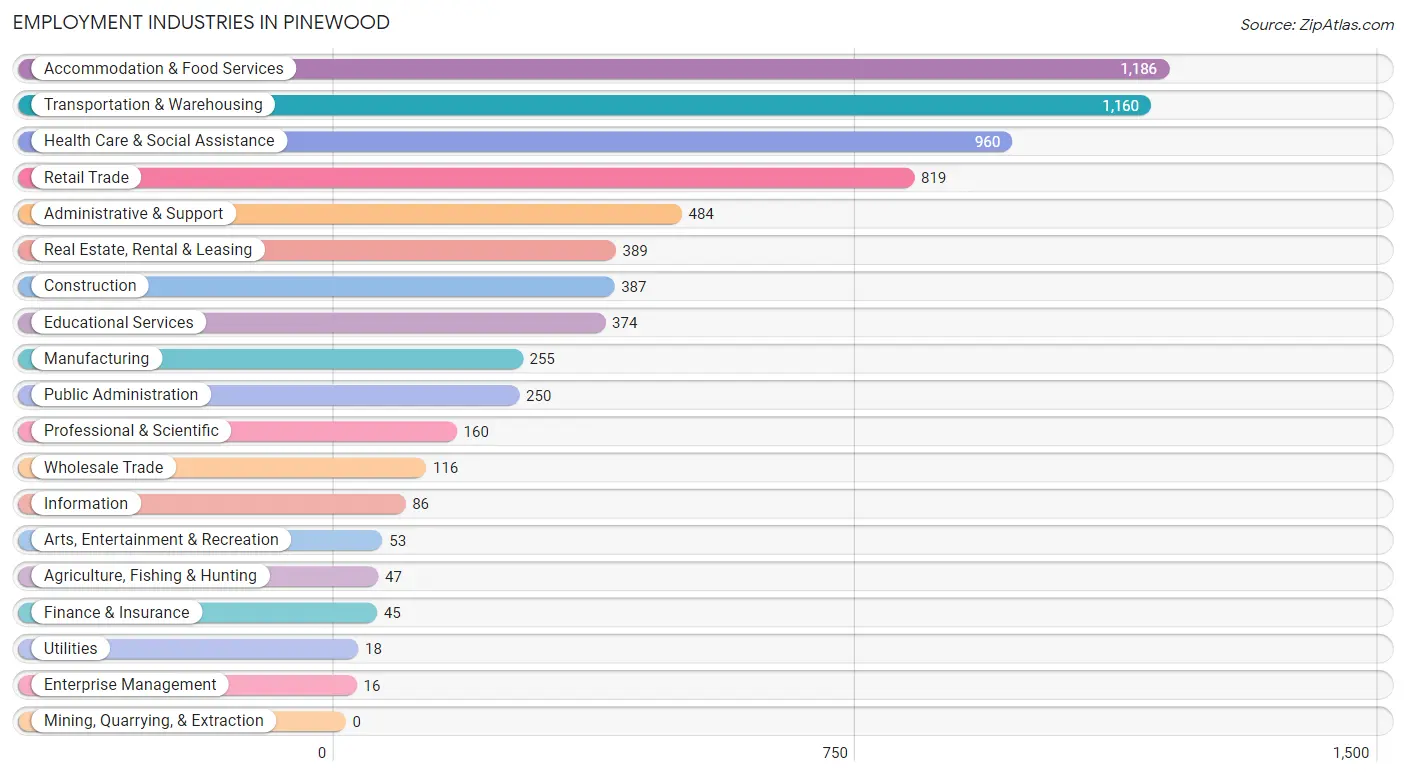
Employment Industries in Pinewood
The major employment industries in Pinewood include Accommodation & Food Services (1,186 | 16.1%), Transportation & Warehousing (1,160 | 15.8%), Health Care & Social Assistance (960 | 13.1%), Retail Trade (819 | 11.1%), and Administrative & Support (484 | 6.6%).
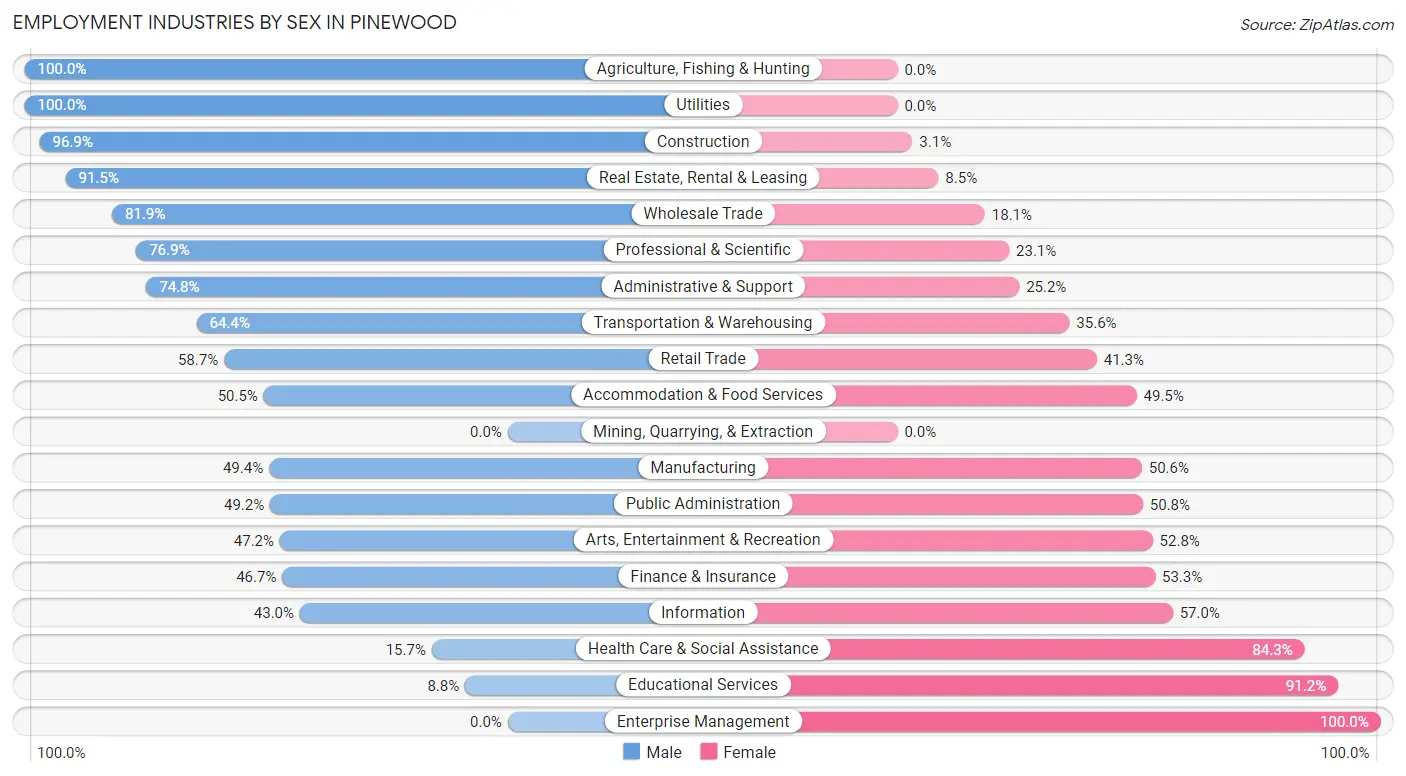
Employment Industries by Sex in Pinewood
The Pinewood industries that see more men than women are Agriculture, Fishing & Hunting (100.0%), Utilities (100.0%), and Construction (96.9%), whereas the industries that tend to have a higher number of women are Enterprise Management (100.0%), Educational Services (91.2%), and Health Care & Social Assistance (84.3%).
| Industry | Male | Female |
| Agriculture, Fishing & Hunting | 47 (100.0%) | 0 (0.0%) |
| Mining, Quarrying, & Extraction | 0 (0.0%) | 0 (0.0%) |
| Construction | 375 (96.9%) | 12 (3.1%) |
| Manufacturing | 126 (49.4%) | 129 (50.6%) |
| Wholesale Trade | 95 (81.9%) | 21 (18.1%) |
| Retail Trade | 481 (58.7%) | 338 (41.3%) |
| Transportation & Warehousing | 747 (64.4%) | 413 (35.6%) |
| Utilities | 18 (100.0%) | 0 (0.0%) |
| Information | 37 (43.0%) | 49 (57.0%) |
| Finance & Insurance | 21 (46.7%) | 24 (53.3%) |
| Real Estate, Rental & Leasing | 356 (91.5%) | 33 (8.5%) |
| Professional & Scientific | 123 (76.9%) | 37 (23.1%) |
| Enterprise Management | 0 (0.0%) | 16 (100.0%) |
| Administrative & Support | 362 (74.8%) | 122 (25.2%) |
| Educational Services | 33 (8.8%) | 341 (91.2%) |
| Health Care & Social Assistance | 151 (15.7%) | 809 (84.3%) |
| Arts, Entertainment & Recreation | 25 (47.2%) | 28 (52.8%) |
| Accommodation & Food Services | 599 (50.5%) | 587 (49.5%) |
| Public Administration | 123 (49.2%) | 127 (50.8%) |
| Total | 3,910 (53.2%) | 3,444 (46.8%) |
Education in Pinewood
School Enrollment in Pinewood
The most common levels of schooling among the 4,299 students in Pinewood are college / undergraduate (1,254 | 29.2%), middle school (847 | 19.7%), and elementary school (789 | 18.3%).
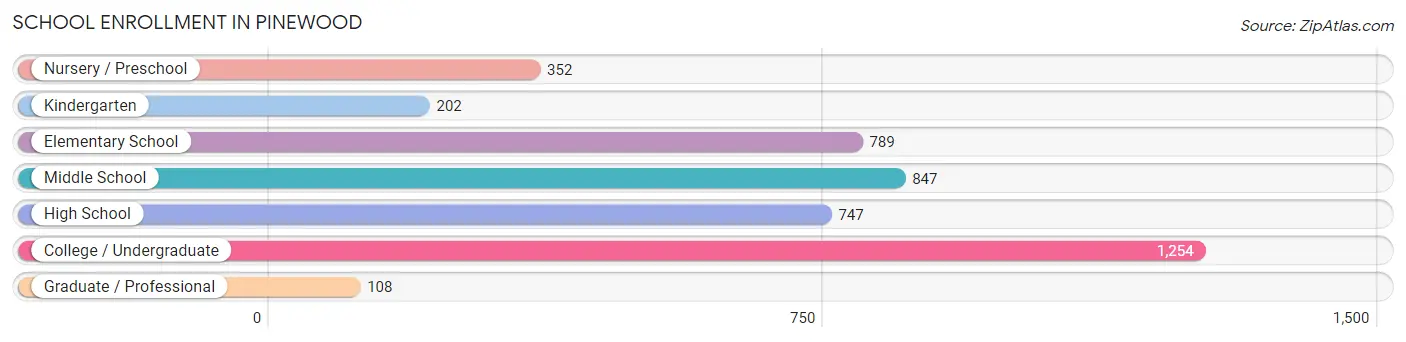
| School Level | # Students | % Students |
| Nursery / Preschool | 352 | 8.2% |
| Kindergarten | 202 | 4.7% |
| Elementary School | 789 | 18.3% |
| Middle School | 847 | 19.7% |
| High School | 747 | 17.4% |
| College / Undergraduate | 1,254 | 29.2% |
| Graduate / Professional | 108 | 2.5% |
| Total | 4,299 | 100.0% |
School Enrollment by Age by Funding Source in Pinewood
Out of a total of 4,299 students who are enrolled in schools in Pinewood, 430 (10.0%) attend a private institution, while the remaining 3,869 (90.0%) are enrolled in public schools. The age group of 35 years and over has the highest likelihood of being enrolled in private schools, with 97 (25.5% in the age bracket) enrolled. Conversely, the age group of 25 to 34 year olds has the lowest likelihood of being enrolled in a private school, with 130 (100.0% in the age bracket) attending a public institution.
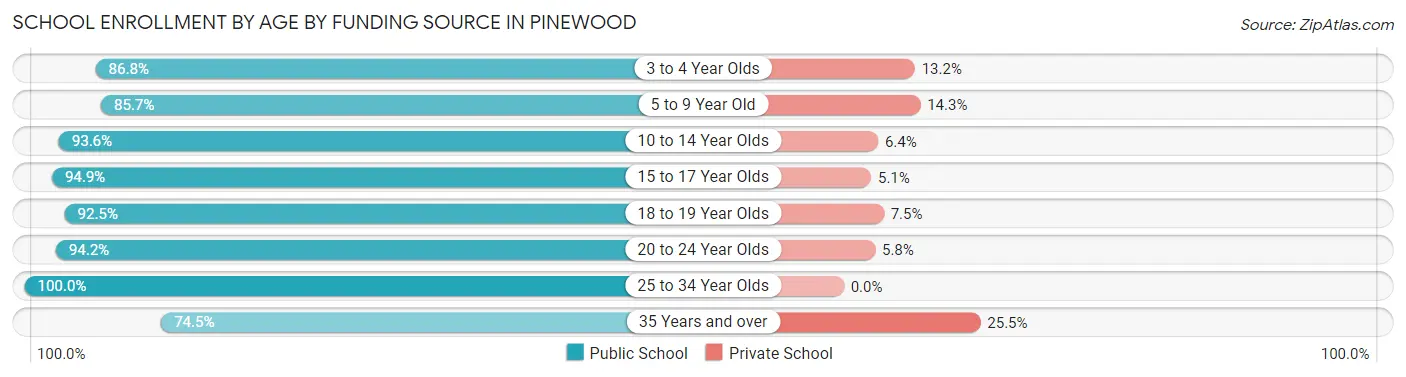
| Age Bracket | Public School | Private School |
| 3 to 4 Year Olds | 295 (86.8%) | 45 (13.2%) |
| 5 to 9 Year Old | 836 (85.7%) | 139 (14.3%) |
| 10 to 14 Year Olds | 849 (93.6%) | 58 (6.4%) |
| 15 to 17 Year Olds | 595 (94.9%) | 32 (5.1%) |
| 18 to 19 Year Olds | 124 (92.5%) | 10 (7.5%) |
| 20 to 24 Year Olds | 758 (94.2%) | 47 (5.8%) |
| 25 to 34 Year Olds | 130 (100.0%) | 0 (0.0%) |
| 35 Years and over | 284 (74.5%) | 97 (25.5%) |
| Total | 3,869 (90.0%) | 430 (10.0%) |
Educational Attainment by Field of Study in Pinewood
Business (414 | 32.2%), science & technology (223 | 17.3%), arts & humanities (123 | 9.6%), engineering (115 | 8.9%), and communications (106 | 8.2%) are the most common fields of study among 1,286 individuals in Pinewood who have obtained a bachelor's degree or higher.
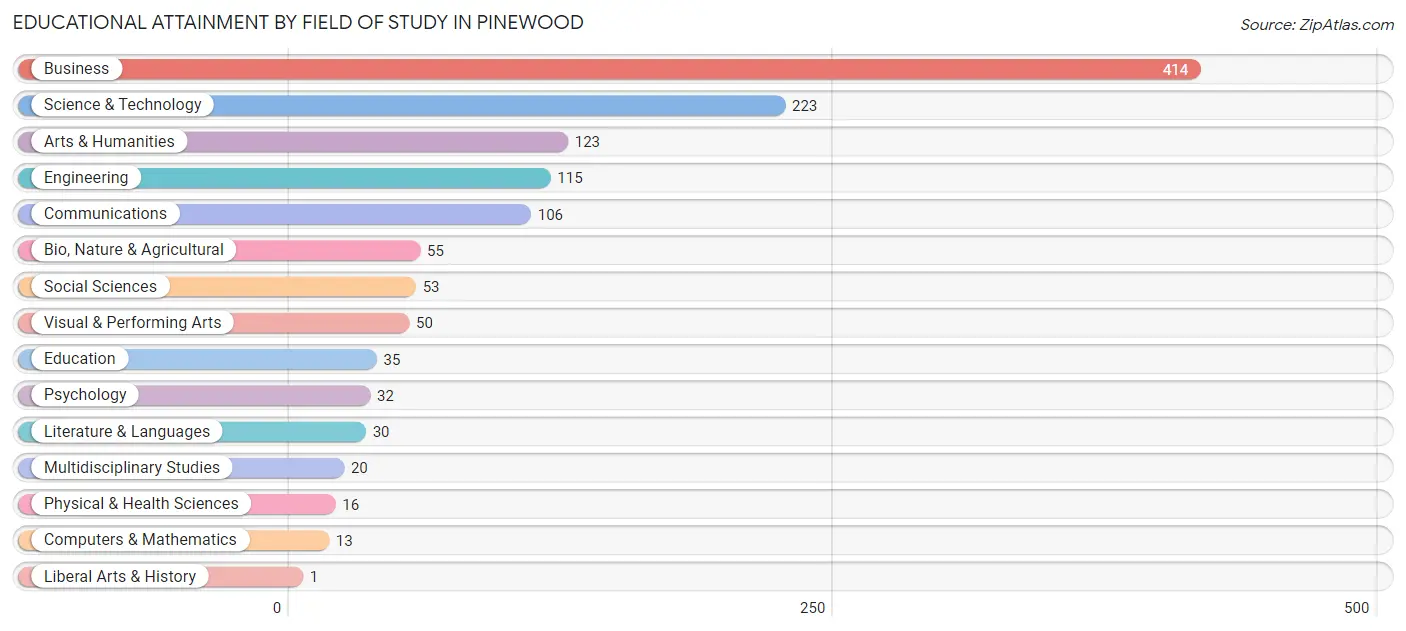
| Field of Study | # Graduates | % Graduates |
| Computers & Mathematics | 13 | 1.0% |
| Bio, Nature & Agricultural | 55 | 4.3% |
| Physical & Health Sciences | 16 | 1.2% |
| Psychology | 32 | 2.5% |
| Social Sciences | 53 | 4.1% |
| Engineering | 115 | 8.9% |
| Multidisciplinary Studies | 20 | 1.6% |
| Science & Technology | 223 | 17.3% |
| Business | 414 | 32.2% |
| Education | 35 | 2.7% |
| Literature & Languages | 30 | 2.3% |
| Liberal Arts & History | 1 | 0.1% |
| Visual & Performing Arts | 50 | 3.9% |
| Communications | 106 | 8.2% |
| Arts & Humanities | 123 | 9.6% |
| Total | 1,286 | 100.0% |
Transportation & Commute in Pinewood
Vehicle Availability by Sex in Pinewood
The most prevalent vehicle ownership categories in Pinewood are males with 1 vehicle (1,557, accounting for 40.9%) and females with 1 vehicle (1,478, making up 45.4%).
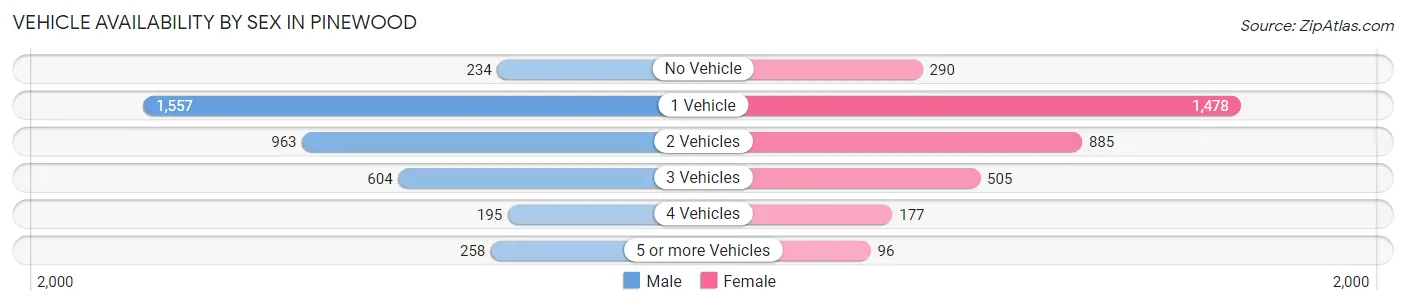
| Vehicles Available | Male | Female |
| No Vehicle | 234 (6.1%) | 290 (8.5%) |
| 1 Vehicle | 1,557 (40.9%) | 1,478 (43.1%) |
| 2 Vehicles | 963 (25.3%) | 885 (25.8%) |
| 3 Vehicles | 604 (15.9%) | 505 (14.7%) |
| 4 Vehicles | 195 (5.1%) | 177 (5.2%) |
| 5 or more Vehicles | 258 (6.8%) | 96 (2.8%) |
| Total | 3,811 (100.0%) | 3,431 (100.0%) |
Commute Time in Pinewood
The most frequently occuring commute durations in Pinewood are 30 to 34 minutes (1,891 commuters, 26.4%), 15 to 19 minutes (1,134 commuters, 15.8%), and 20 to 24 minutes (1,019 commuters, 14.2%).
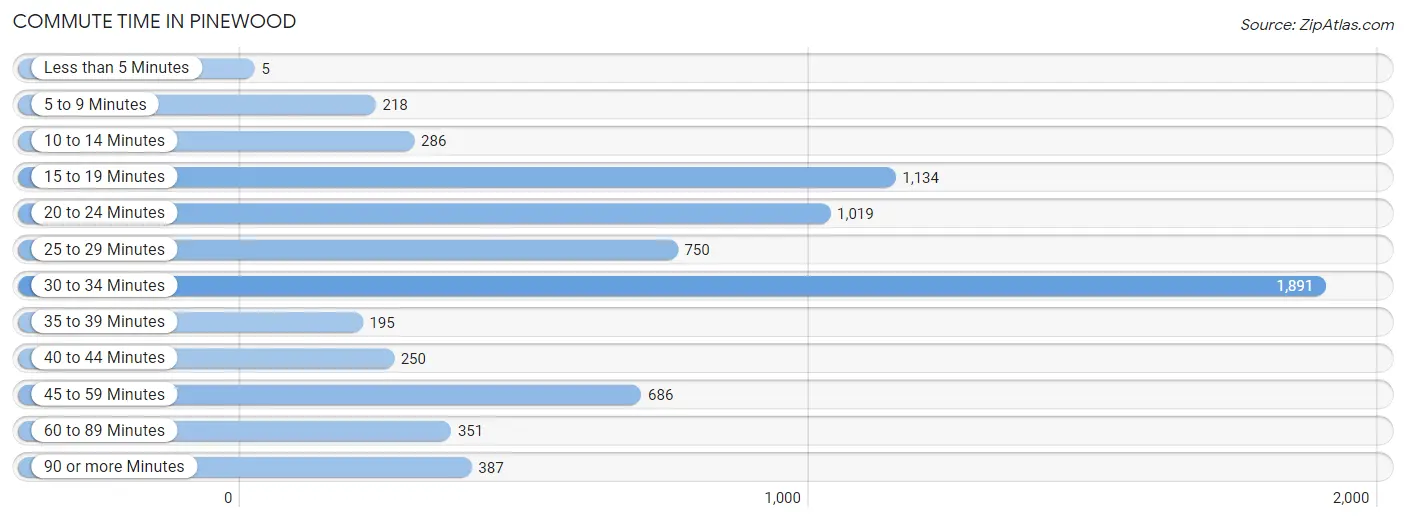
| Commute Time | # Commuters | % Commuters |
| Less than 5 Minutes | 5 | 0.1% |
| 5 to 9 Minutes | 218 | 3.0% |
| 10 to 14 Minutes | 286 | 4.0% |
| 15 to 19 Minutes | 1,134 | 15.8% |
| 20 to 24 Minutes | 1,019 | 14.2% |
| 25 to 29 Minutes | 750 | 10.5% |
| 30 to 34 Minutes | 1,891 | 26.4% |
| 35 to 39 Minutes | 195 | 2.7% |
| 40 to 44 Minutes | 250 | 3.5% |
| 45 to 59 Minutes | 686 | 9.6% |
| 60 to 89 Minutes | 351 | 4.9% |
| 90 or more Minutes | 387 | 5.4% |
Commute Time by Sex in Pinewood
The most common commute times in Pinewood are 30 to 34 minutes (954 commuters, 25.3%) for males and 30 to 34 minutes (937 commuters, 27.6%) for females.
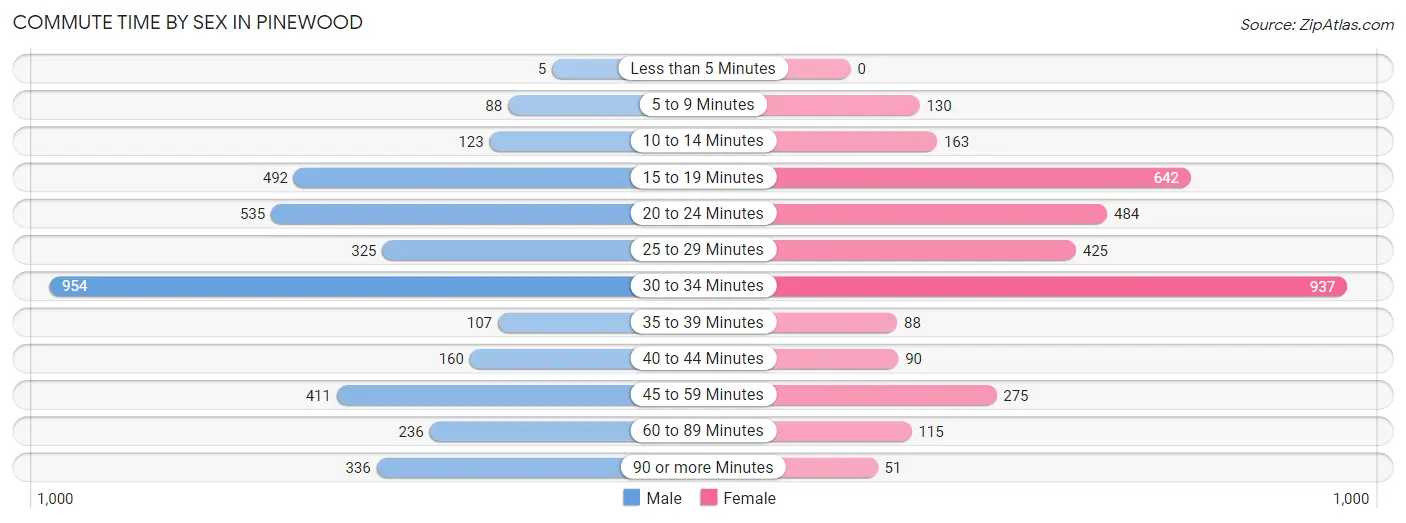
| Commute Time | Male | Female |
| Less than 5 Minutes | 5 (0.1%) | 0 (0.0%) |
| 5 to 9 Minutes | 88 (2.3%) | 130 (3.8%) |
| 10 to 14 Minutes | 123 (3.3%) | 163 (4.8%) |
| 15 to 19 Minutes | 492 (13.0%) | 642 (18.9%) |
| 20 to 24 Minutes | 535 (14.2%) | 484 (14.2%) |
| 25 to 29 Minutes | 325 (8.6%) | 425 (12.5%) |
| 30 to 34 Minutes | 954 (25.3%) | 937 (27.6%) |
| 35 to 39 Minutes | 107 (2.8%) | 88 (2.6%) |
| 40 to 44 Minutes | 160 (4.2%) | 90 (2.6%) |
| 45 to 59 Minutes | 411 (10.9%) | 275 (8.1%) |
| 60 to 89 Minutes | 236 (6.3%) | 115 (3.4%) |
| 90 or more Minutes | 336 (8.9%) | 51 (1.5%) |
Time of Departure to Work by Sex in Pinewood
The most frequent times of departure to work in Pinewood are 8:00 AM to 8:29 AM (679, 18.0%) for males and 8:00 AM to 8:29 AM (978, 28.8%) for females.
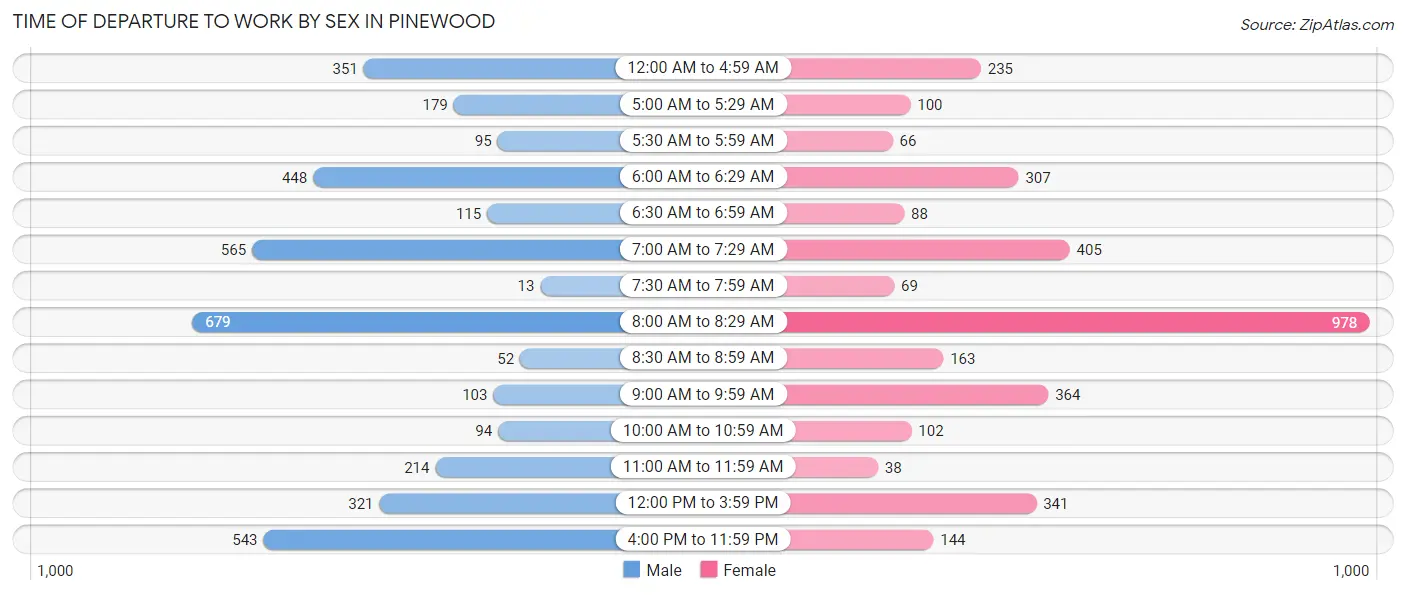
| Time of Departure | Male | Female |
| 12:00 AM to 4:59 AM | 351 (9.3%) | 235 (6.9%) |
| 5:00 AM to 5:29 AM | 179 (4.8%) | 100 (2.9%) |
| 5:30 AM to 5:59 AM | 95 (2.5%) | 66 (1.9%) |
| 6:00 AM to 6:29 AM | 448 (11.9%) | 307 (9.0%) |
| 6:30 AM to 6:59 AM | 115 (3.0%) | 88 (2.6%) |
| 7:00 AM to 7:29 AM | 565 (15.0%) | 405 (11.9%) |
| 7:30 AM to 7:59 AM | 13 (0.3%) | 69 (2.0%) |
| 8:00 AM to 8:29 AM | 679 (18.0%) | 978 (28.8%) |
| 8:30 AM to 8:59 AM | 52 (1.4%) | 163 (4.8%) |
| 9:00 AM to 9:59 AM | 103 (2.7%) | 364 (10.7%) |
| 10:00 AM to 10:59 AM | 94 (2.5%) | 102 (3.0%) |
| 11:00 AM to 11:59 AM | 214 (5.7%) | 38 (1.1%) |
| 12:00 PM to 3:59 PM | 321 (8.5%) | 341 (10.0%) |
| 4:00 PM to 11:59 PM | 543 (14.4%) | 144 (4.2%) |
| Total | 3,772 (100.0%) | 3,400 (100.0%) |
Housing Occupancy in Pinewood
Occupancy by Ownership in Pinewood
Of the total 5,393 dwellings in Pinewood, owner-occupied units account for 1,641 (30.4%), while renter-occupied units make up 3,752 (69.6%).
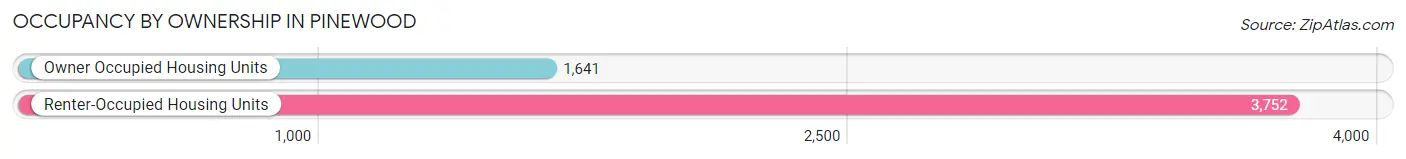
| Occupancy | # Housing Units | % Housing Units |
| Owner Occupied Housing Units | 1,641 | 30.4% |
| Renter-Occupied Housing Units | 3,752 | 69.6% |
| Total Occupied Housing Units | 5,393 | 100.0% |
Occupancy by Household Size in Pinewood
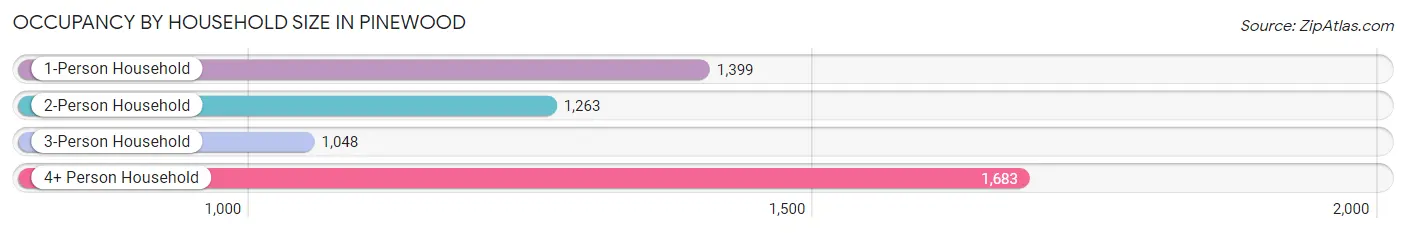
| Household Size | # Housing Units | % Housing Units |
| 1-Person Household | 1,399 | 25.9% |
| 2-Person Household | 1,263 | 23.4% |
| 3-Person Household | 1,048 | 19.4% |
| 4+ Person Household | 1,683 | 31.2% |
| Total Housing Units | 5,393 | 100.0% |
Occupancy by Ownership by Household Size in Pinewood
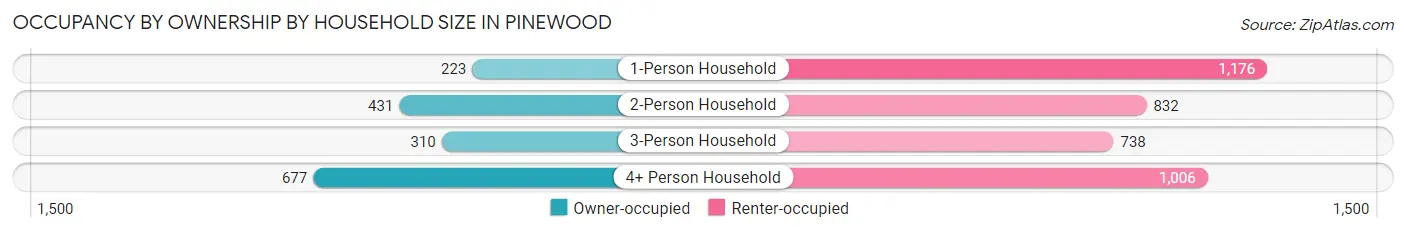
| Household Size | Owner-occupied | Renter-occupied |
| 1-Person Household | 223 (15.9%) | 1,176 (84.1%) |
| 2-Person Household | 431 (34.1%) | 832 (65.9%) |
| 3-Person Household | 310 (29.6%) | 738 (70.4%) |
| 4+ Person Household | 677 (40.2%) | 1,006 (59.8%) |
| Total Housing Units | 1,641 (30.4%) | 3,752 (69.6%) |
Occupancy by Educational Attainment in Pinewood
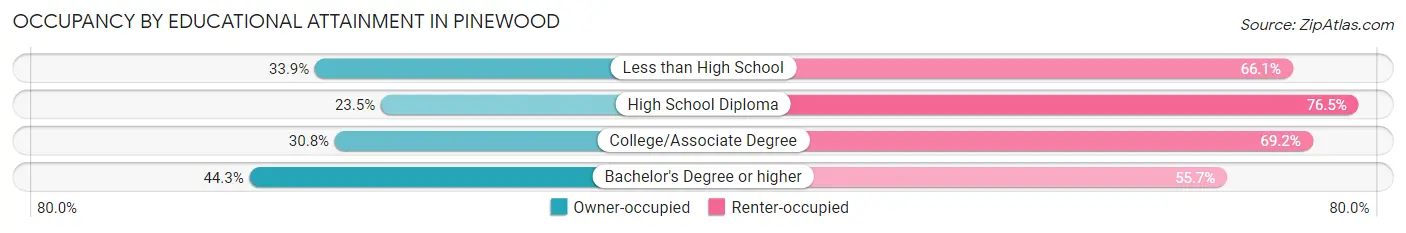
| Household Size | Owner-occupied | Renter-occupied |
| Less than High School | 539 (33.9%) | 1,050 (66.1%) |
| High School Diploma | 486 (23.5%) | 1,585 (76.5%) |
| College/Associate Degree | 346 (30.8%) | 778 (69.2%) |
| Bachelor's Degree or higher | 270 (44.3%) | 339 (55.7%) |
Occupancy by Age of Householder in Pinewood
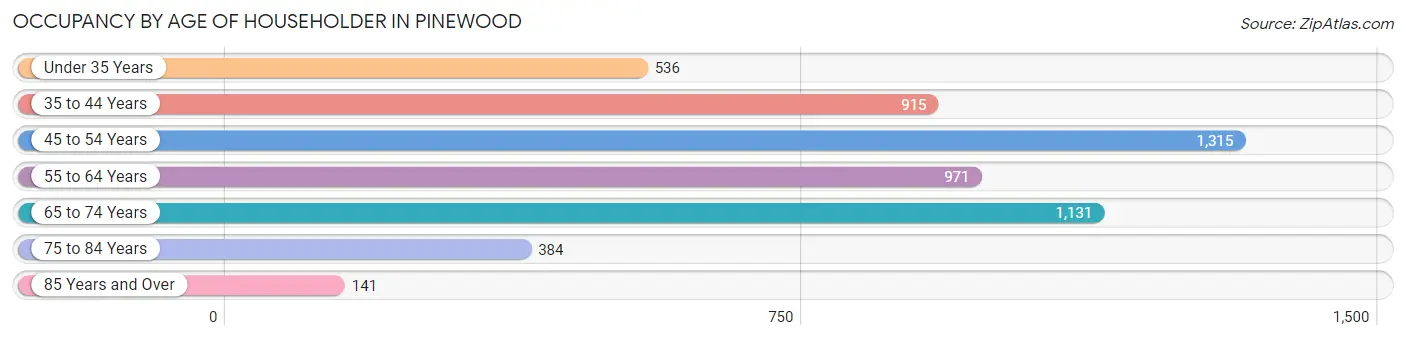
| Age Bracket | # Households | % Households |
| Under 35 Years | 536 | 9.9% |
| 35 to 44 Years | 915 | 17.0% |
| 45 to 54 Years | 1,315 | 24.4% |
| 55 to 64 Years | 971 | 18.0% |
| 65 to 74 Years | 1,131 | 21.0% |
| 75 to 84 Years | 384 | 7.1% |
| 85 Years and Over | 141 | 2.6% |
| Total | 5,393 | 100.0% |
Housing Finances in Pinewood
Median Income by Occupancy in Pinewood
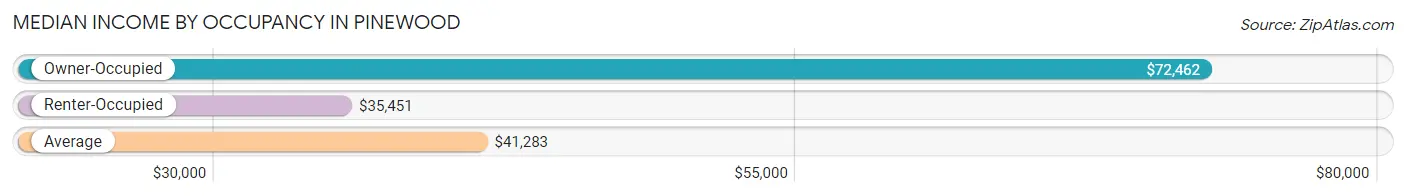
| Occupancy Type | # Households | Median Income |
| Owner-Occupied | 1,641 (30.4%) | $72,462 |
| Renter-Occupied | 3,752 (69.6%) | $35,451 |
| Average | 5,393 (100.0%) | $41,283 |
Occupancy by Householder Income Bracket in Pinewood
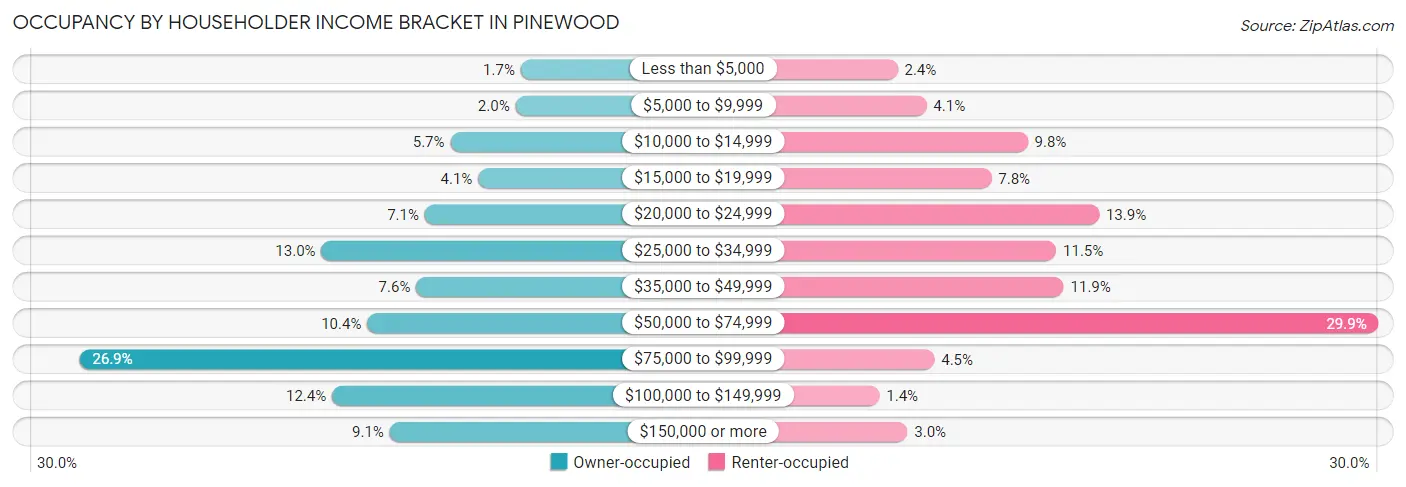
| Income Bracket | Owner-occupied | Renter-occupied |
| Less than $5,000 | 27 (1.7%) | 90 (2.4%) |
| $5,000 to $9,999 | 32 (1.9%) | 152 (4.1%) |
| $10,000 to $14,999 | 93 (5.7%) | 369 (9.8%) |
| $15,000 to $19,999 | 67 (4.1%) | 291 (7.8%) |
| $20,000 to $24,999 | 117 (7.1%) | 522 (13.9%) |
| $25,000 to $34,999 | 214 (13.0%) | 430 (11.5%) |
| $35,000 to $49,999 | 125 (7.6%) | 446 (11.9%) |
| $50,000 to $74,999 | 171 (10.4%) | 1,121 (29.9%) |
| $75,000 to $99,999 | 441 (26.9%) | 169 (4.5%) |
| $100,000 to $149,999 | 204 (12.4%) | 51 (1.4%) |
| $150,000 or more | 150 (9.1%) | 111 (3.0%) |
| Total | 1,641 (100.0%) | 3,752 (100.0%) |
Monthly Housing Cost Tiers in Pinewood
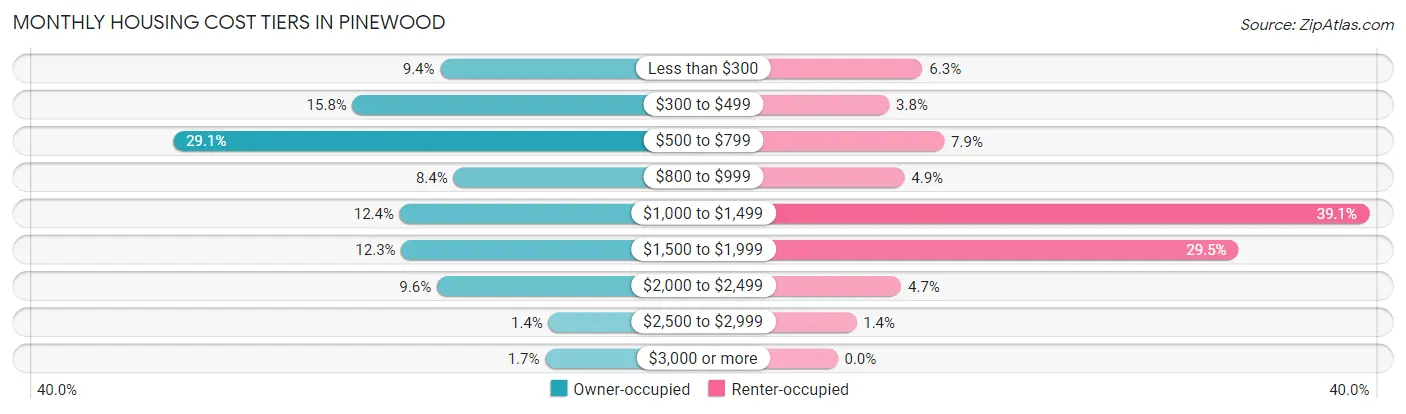
| Monthly Cost | Owner-occupied | Renter-occupied |
| Less than $300 | 154 (9.4%) | 235 (6.3%) |
| $300 to $499 | 260 (15.8%) | 143 (3.8%) |
| $500 to $799 | 477 (29.1%) | 295 (7.9%) |
| $800 to $999 | 138 (8.4%) | 185 (4.9%) |
| $1,000 to $1,499 | 203 (12.4%) | 1,468 (39.1%) |
| $1,500 to $1,999 | 201 (12.2%) | 1,108 (29.5%) |
| $2,000 to $2,499 | 158 (9.6%) | 176 (4.7%) |
| $2,500 to $2,999 | 23 (1.4%) | 52 (1.4%) |
| $3,000 or more | 27 (1.7%) | 0 (0.0%) |
| Total | 1,641 (100.0%) | 3,752 (100.0%) |
Physical Housing Characteristics in Pinewood
Housing Structures in Pinewood
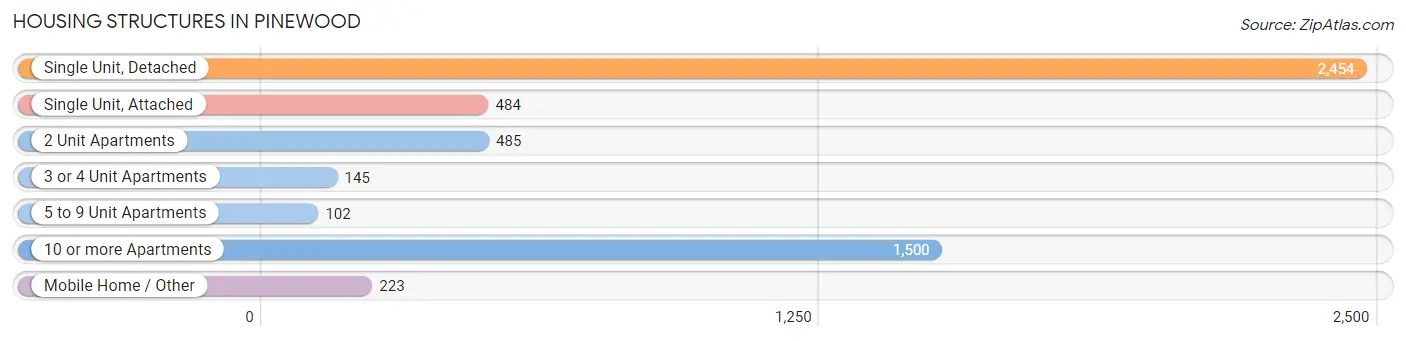
| Structure Type | # Housing Units | % Housing Units |
| Single Unit, Detached | 2,454 | 45.5% |
| Single Unit, Attached | 484 | 9.0% |
| 2 Unit Apartments | 485 | 9.0% |
| 3 or 4 Unit Apartments | 145 | 2.7% |
| 5 to 9 Unit Apartments | 102 | 1.9% |
| 10 or more Apartments | 1,500 | 27.8% |
| Mobile Home / Other | 223 | 4.1% |
| Total | 5,393 | 100.0% |
Housing Structures by Occupancy in Pinewood
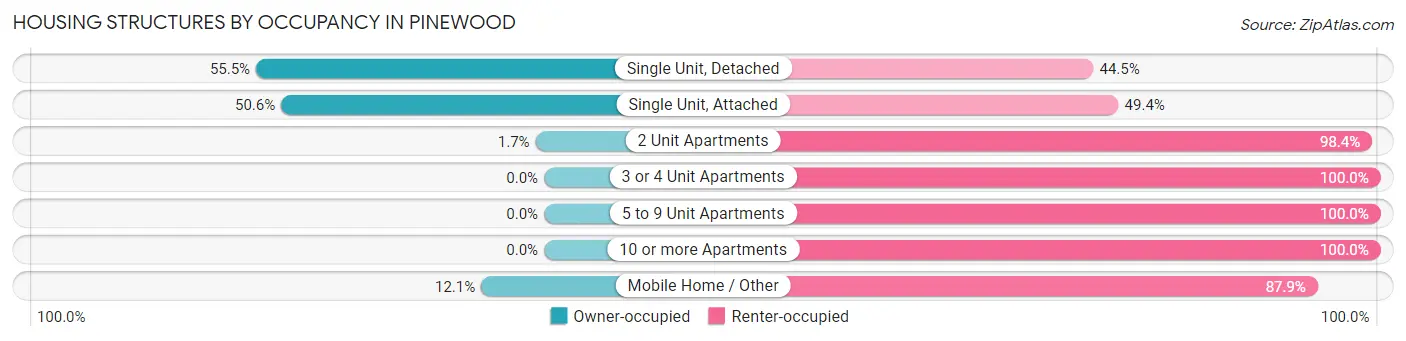
| Structure Type | Owner-occupied | Renter-occupied |
| Single Unit, Detached | 1,361 (55.5%) | 1,093 (44.5%) |
| Single Unit, Attached | 245 (50.6%) | 239 (49.4%) |
| 2 Unit Apartments | 8 (1.7%) | 477 (98.4%) |
| 3 or 4 Unit Apartments | 0 (0.0%) | 145 (100.0%) |
| 5 to 9 Unit Apartments | 0 (0.0%) | 102 (100.0%) |
| 10 or more Apartments | 0 (0.0%) | 1,500 (100.0%) |
| Mobile Home / Other | 27 (12.1%) | 196 (87.9%) |
| Total | 1,641 (30.4%) | 3,752 (69.6%) |
Housing Structures by Number of Rooms in Pinewood
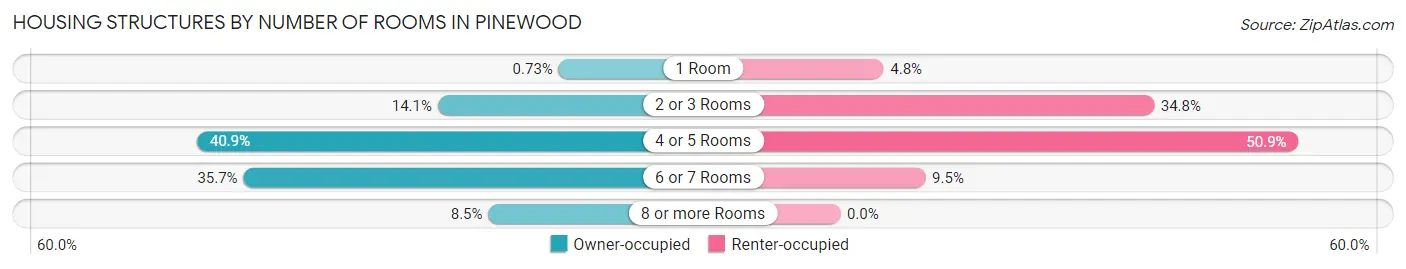
| Number of Rooms | Owner-occupied | Renter-occupied |
| 1 Room | 12 (0.7%) | 181 (4.8%) |
| 2 or 3 Rooms | 232 (14.1%) | 1,307 (34.8%) |
| 4 or 5 Rooms | 671 (40.9%) | 1,909 (50.9%) |
| 6 or 7 Rooms | 586 (35.7%) | 355 (9.5%) |
| 8 or more Rooms | 140 (8.5%) | 0 (0.0%) |
| Total | 1,641 (100.0%) | 3,752 (100.0%) |
Housing Structure by Heating Type in Pinewood
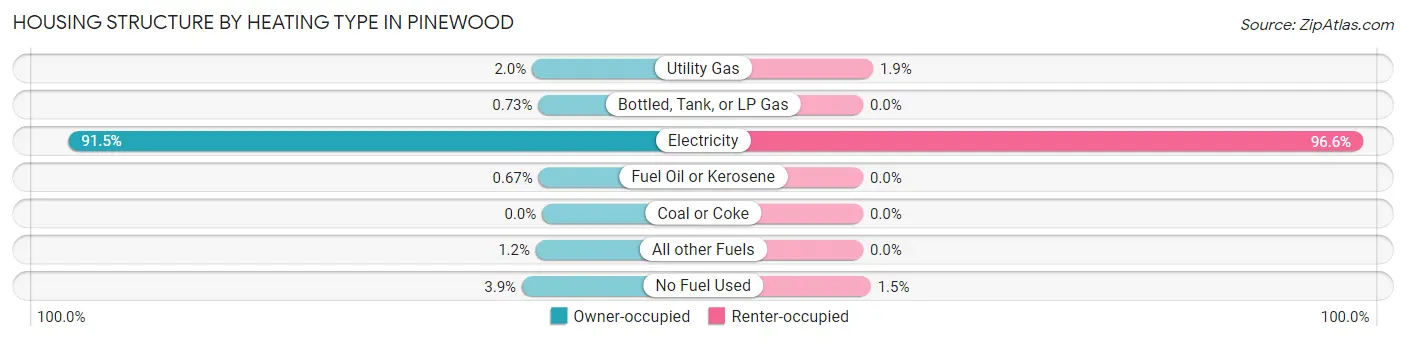
| Heating Type | Owner-occupied | Renter-occupied |
| Utility Gas | 32 (1.9%) | 72 (1.9%) |
| Bottled, Tank, or LP Gas | 12 (0.7%) | 0 (0.0%) |
| Electricity | 1,502 (91.5%) | 3,624 (96.6%) |
| Fuel Oil or Kerosene | 11 (0.7%) | 0 (0.0%) |
| Coal or Coke | 0 (0.0%) | 0 (0.0%) |
| All other Fuels | 20 (1.2%) | 0 (0.0%) |
| No Fuel Used | 64 (3.9%) | 56 (1.5%) |
| Total | 1,641 (100.0%) | 3,752 (100.0%) |
Household Vehicle Usage in Pinewood
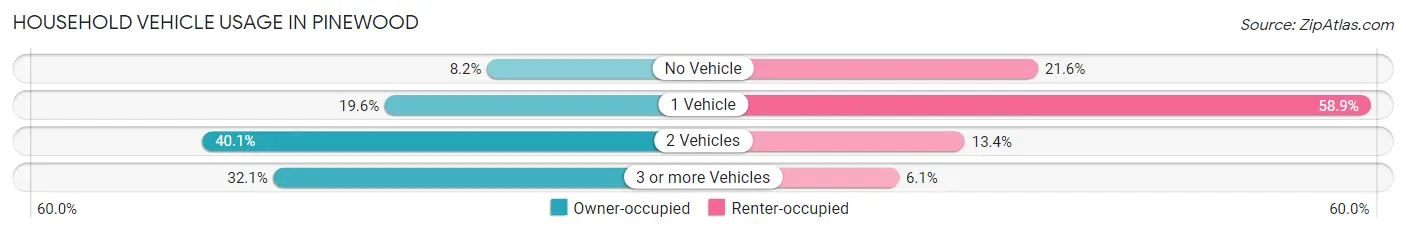
| Vehicles per Household | Owner-occupied | Renter-occupied |
| No Vehicle | 134 (8.2%) | 812 (21.6%) |
| 1 Vehicle | 322 (19.6%) | 2,209 (58.9%) |
| 2 Vehicles | 658 (40.1%) | 504 (13.4%) |
| 3 or more Vehicles | 527 (32.1%) | 227 (6.0%) |
| Total | 1,641 (100.0%) | 3,752 (100.0%) |
Real Estate & Mortgages in Pinewood
Real Estate and Mortgage Overview in Pinewood
| Characteristic | Without Mortgage | With Mortgage |
| Housing Units | 963 | 678 |
| Median Property Value | $266,500 | $293,800 |
| Median Household Income | $70,947 | $47 |
| Monthly Housing Costs | $526 | $27 |
| Real Estate Taxes | $1,963 | $30 |
Property Value by Mortgage Status in Pinewood
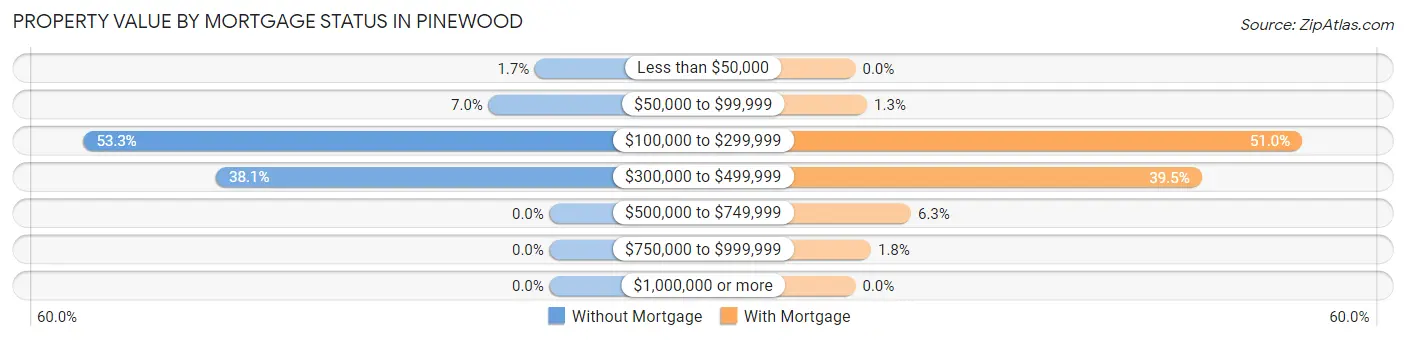
| Property Value | Without Mortgage | With Mortgage |
| Less than $50,000 | 16 (1.7%) | 0 (0.0%) |
| $50,000 to $99,999 | 67 (7.0%) | 9 (1.3%) |
| $100,000 to $299,999 | 513 (53.3%) | 346 (51.0%) |
| $300,000 to $499,999 | 367 (38.1%) | 268 (39.5%) |
| $500,000 to $749,999 | 0 (0.0%) | 43 (6.3%) |
| $750,000 to $999,999 | 0 (0.0%) | 12 (1.8%) |
| $1,000,000 or more | 0 (0.0%) | 0 (0.0%) |
| Total | 963 (100.0%) | 678 (100.0%) |
Household Income by Mortgage Status in Pinewood
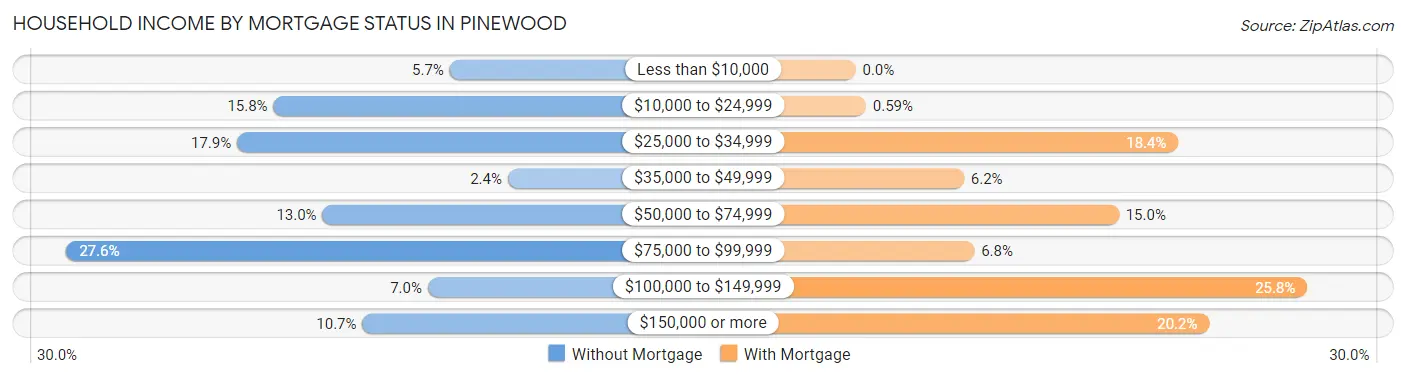
| Household Income | Without Mortgage | With Mortgage |
| Less than $10,000 | 55 (5.7%) | 0 (0.0%) |
| $10,000 to $24,999 | 152 (15.8%) | 4 (0.6%) |
| $25,000 to $34,999 | 172 (17.9%) | 125 (18.4%) |
| $35,000 to $49,999 | 23 (2.4%) | 42 (6.2%) |
| $50,000 to $74,999 | 125 (13.0%) | 102 (15.0%) |
| $75,000 to $99,999 | 266 (27.6%) | 46 (6.8%) |
| $100,000 to $149,999 | 67 (7.0%) | 175 (25.8%) |
| $150,000 or more | 103 (10.7%) | 137 (20.2%) |
| Total | 963 (100.0%) | 678 (100.0%) |
Property Value to Household Income Ratio in Pinewood
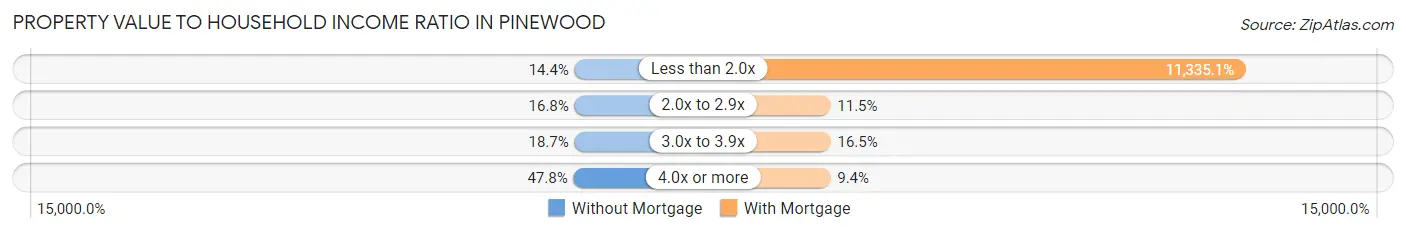
| Value-to-Income Ratio | Without Mortgage | With Mortgage |
| Less than 2.0x | 139 (14.4%) | 76,852 (11,335.1%) |
| 2.0x to 2.9x | 162 (16.8%) | 78 (11.5%) |
| 3.0x to 3.9x | 180 (18.7%) | 112 (16.5%) |
| 4.0x or more | 460 (47.8%) | 64 (9.4%) |
| Total | 963 (100.0%) | 678 (100.0%) |
Real Estate Taxes by Mortgage Status in Pinewood
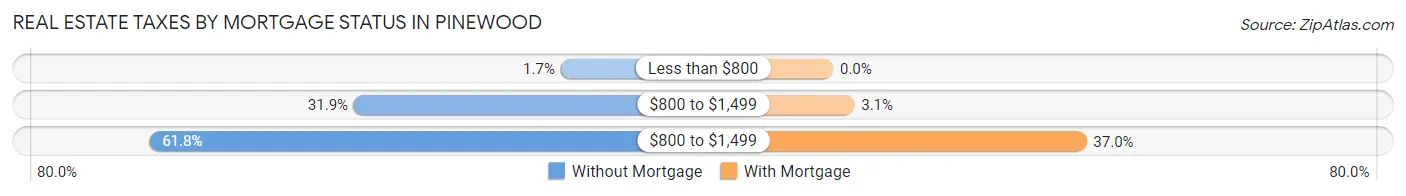
| Property Taxes | Without Mortgage | With Mortgage |
| Less than $800 | 16 (1.7%) | 0 (0.0%) |
| $800 to $1,499 | 307 (31.9%) | 21 (3.1%) |
| $800 to $1,499 | 595 (61.8%) | 251 (37.0%) |
| Total | 963 (100.0%) | 678 (100.0%) |
Health & Disability in Pinewood
Health Insurance Coverage by Age in Pinewood
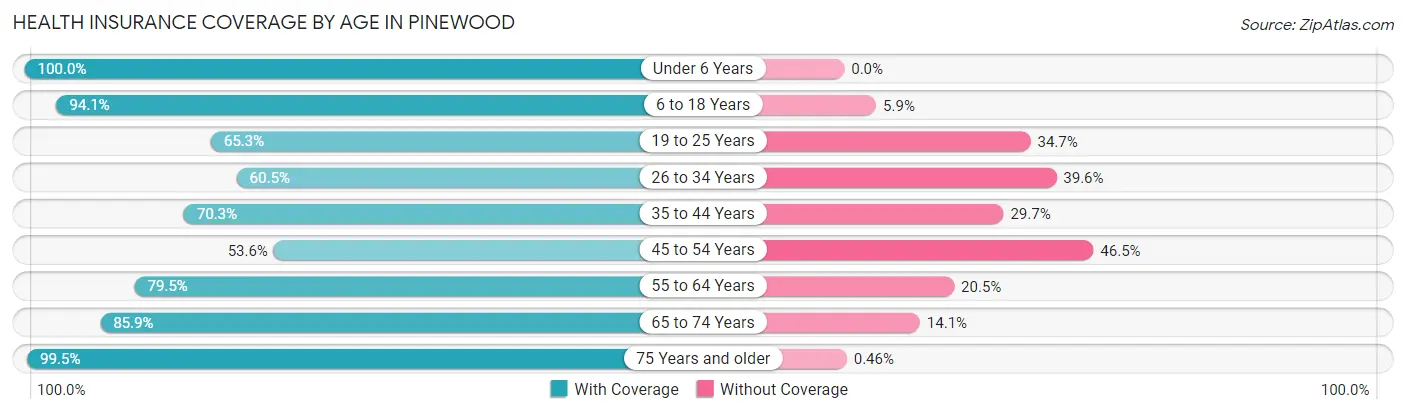
| Age Bracket | With Coverage | Without Coverage |
| Under 6 Years | 1,347 (100.0%) | 0 (0.0%) |
| 6 to 18 Years | 2,408 (94.1%) | 152 (5.9%) |
| 19 to 25 Years | 1,156 (65.3%) | 615 (34.7%) |
| 26 to 34 Years | 1,128 (60.5%) | 738 (39.6%) |
| 35 to 44 Years | 1,726 (70.3%) | 729 (29.7%) |
| 45 to 54 Years | 1,297 (53.5%) | 1,125 (46.5%) |
| 55 to 64 Years | 1,362 (79.5%) | 351 (20.5%) |
| 65 to 74 Years | 1,614 (85.9%) | 265 (14.1%) |
| 75 Years and older | 874 (99.5%) | 4 (0.5%) |
| Total | 12,912 (76.4%) | 3,979 (23.6%) |
Health Insurance Coverage by Citizenship Status in Pinewood
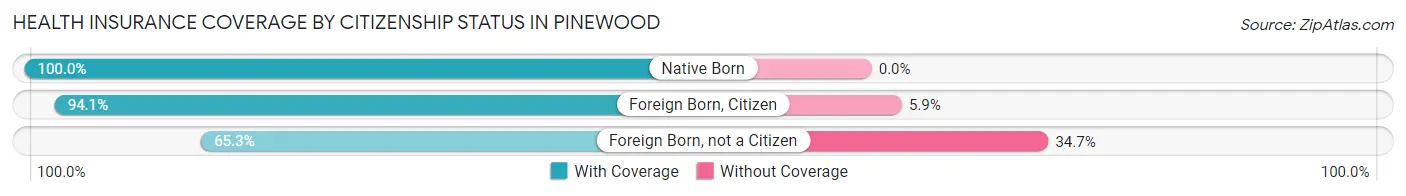
| Citizenship Status | With Coverage | Without Coverage |
| Native Born | 1,347 (100.0%) | 0 (0.0%) |
| Foreign Born, Citizen | 2,408 (94.1%) | 152 (5.9%) |
| Foreign Born, not a Citizen | 1,156 (65.3%) | 615 (34.7%) |
Health Insurance Coverage by Household Income in Pinewood
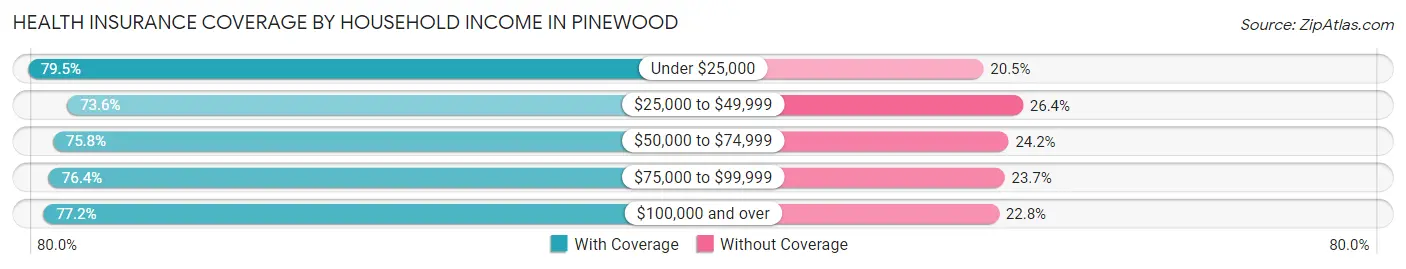
| Household Income | With Coverage | Without Coverage |
| Under $25,000 | 2,837 (79.5%) | 730 (20.5%) |
| $25,000 to $49,999 | 2,761 (73.6%) | 990 (26.4%) |
| $50,000 to $74,999 | 3,349 (75.8%) | 1,071 (24.2%) |
| $75,000 to $99,999 | 2,057 (76.3%) | 637 (23.6%) |
| $100,000 and over | 1,866 (77.2%) | 551 (22.8%) |
Public vs Private Health Insurance Coverage by Age in Pinewood
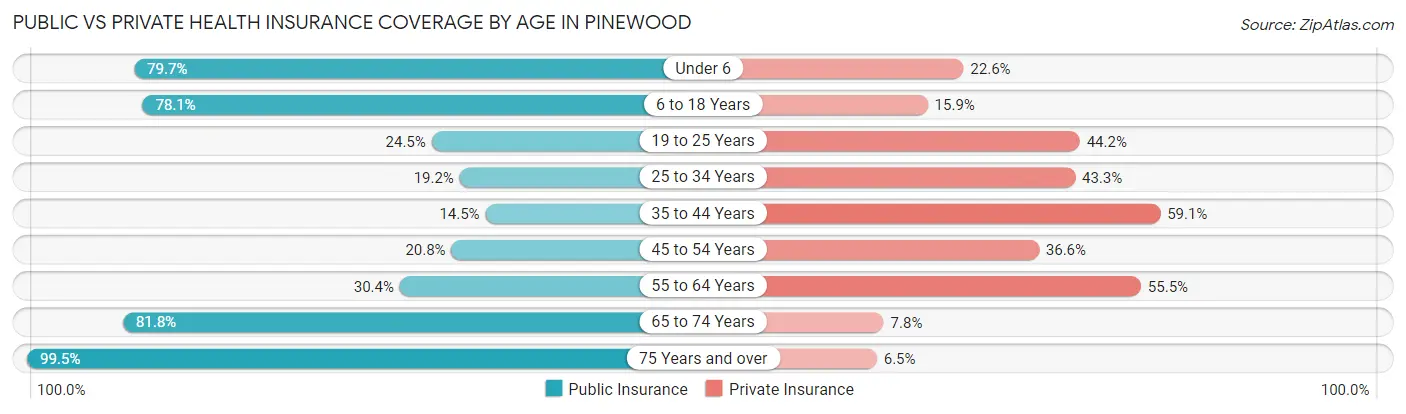
| Age Bracket | Public Insurance | Private Insurance |
| Under 6 | 1,073 (79.7%) | 304 (22.6%) |
| 6 to 18 Years | 2,000 (78.1%) | 408 (15.9%) |
| 19 to 25 Years | 433 (24.4%) | 782 (44.2%) |
| 25 to 34 Years | 359 (19.2%) | 808 (43.3%) |
| 35 to 44 Years | 355 (14.5%) | 1,451 (59.1%) |
| 45 to 54 Years | 503 (20.8%) | 886 (36.6%) |
| 55 to 64 Years | 520 (30.4%) | 951 (55.5%) |
| 65 to 74 Years | 1,536 (81.8%) | 146 (7.8%) |
| 75 Years and over | 874 (99.5%) | 57 (6.5%) |
| Total | 7,653 (45.3%) | 5,793 (34.3%) |
Disability Status by Sex by Age in Pinewood
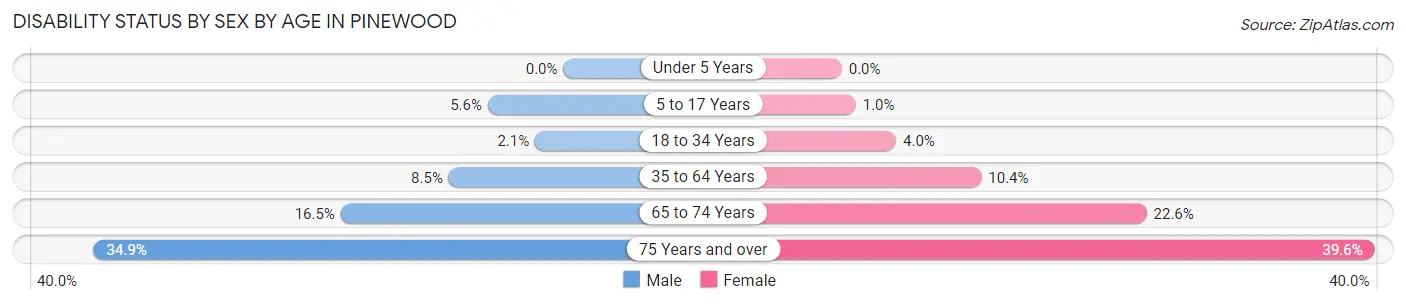
| Age Bracket | Male | Female |
| Under 5 Years | 0 (0.0%) | 0 (0.0%) |
| 5 to 17 Years | 74 (5.6%) | 14 (1.0%) |
| 18 to 34 Years | 44 (2.1%) | 66 (4.0%) |
| 35 to 64 Years | 262 (8.5%) | 364 (10.4%) |
| 65 to 74 Years | 185 (16.5%) | 172 (22.6%) |
| 75 Years and over | 106 (34.9%) | 227 (39.6%) |
Disability Class by Sex by Age in Pinewood
Disability Class: Hearing Difficulty
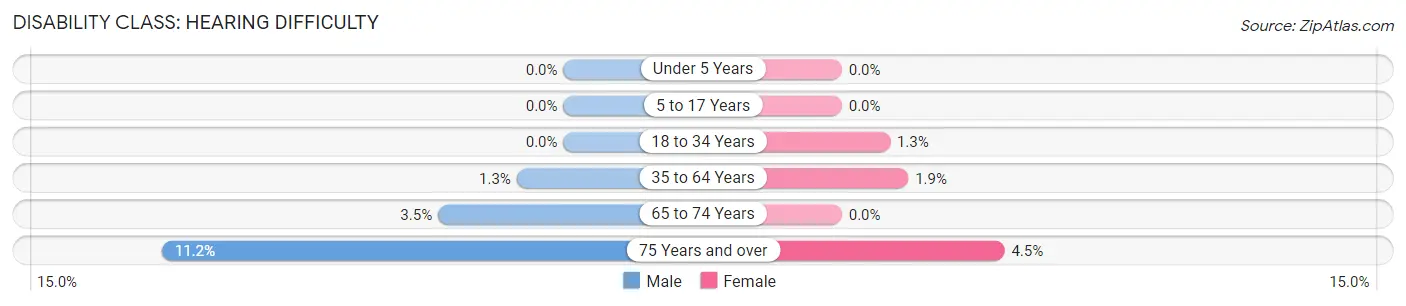
| Age Bracket | Male | Female |
| Under 5 Years | 0 (0.0%) | 0 (0.0%) |
| 5 to 17 Years | 0 (0.0%) | 0 (0.0%) |
| 18 to 34 Years | 0 (0.0%) | 22 (1.3%) |
| 35 to 64 Years | 40 (1.3%) | 65 (1.8%) |
| 65 to 74 Years | 39 (3.5%) | 0 (0.0%) |
| 75 Years and over | 34 (11.2%) | 26 (4.5%) |
Disability Class: Vision Difficulty
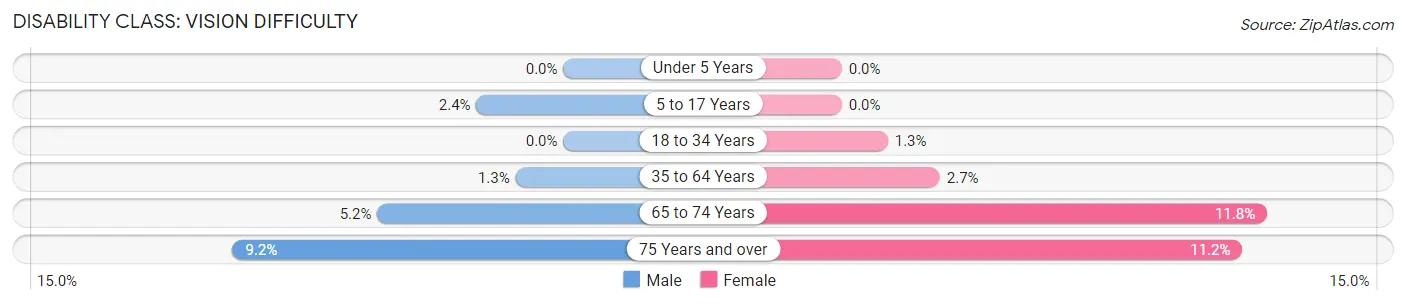
| Age Bracket | Male | Female |
| Under 5 Years | 0 (0.0%) | 0 (0.0%) |
| 5 to 17 Years | 32 (2.4%) | 0 (0.0%) |
| 18 to 34 Years | 0 (0.0%) | 21 (1.3%) |
| 35 to 64 Years | 41 (1.3%) | 96 (2.7%) |
| 65 to 74 Years | 58 (5.2%) | 90 (11.8%) |
| 75 Years and over | 28 (9.2%) | 64 (11.2%) |
Disability Class: Cognitive Difficulty
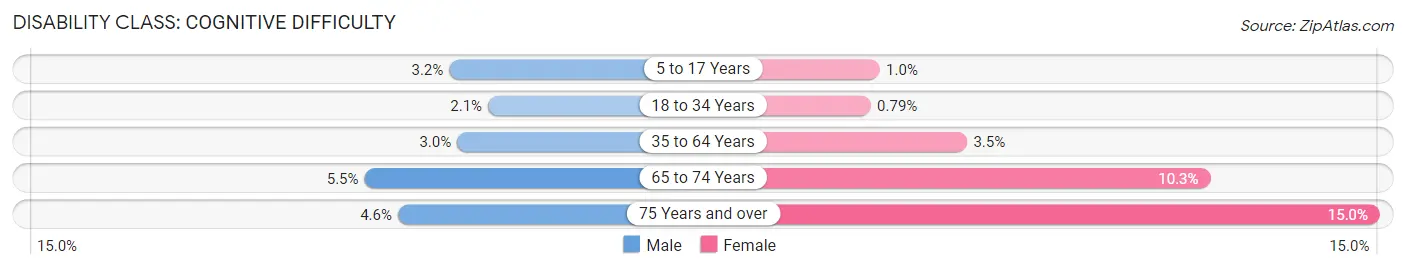
| Age Bracket | Male | Female |
| 5 to 17 Years | 42 (3.2%) | 14 (1.0%) |
| 18 to 34 Years | 44 (2.1%) | 13 (0.8%) |
| 35 to 64 Years | 91 (3.0%) | 122 (3.5%) |
| 65 to 74 Years | 62 (5.5%) | 78 (10.3%) |
| 75 Years and over | 14 (4.6%) | 86 (15.0%) |
Disability Class: Ambulatory Difficulty
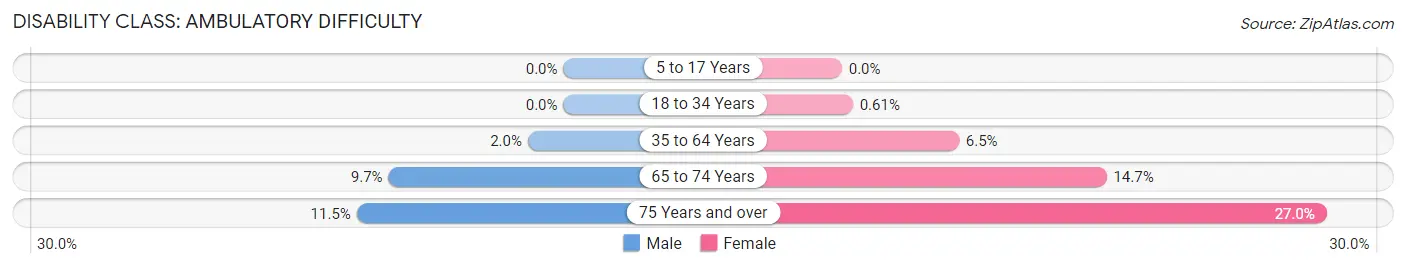
| Age Bracket | Male | Female |
| 5 to 17 Years | 0 (0.0%) | 0 (0.0%) |
| 18 to 34 Years | 0 (0.0%) | 10 (0.6%) |
| 35 to 64 Years | 61 (2.0%) | 229 (6.5%) |
| 65 to 74 Years | 109 (9.7%) | 112 (14.7%) |
| 75 Years and over | 35 (11.5%) | 155 (27.0%) |
Disability Class: Self-Care Difficulty
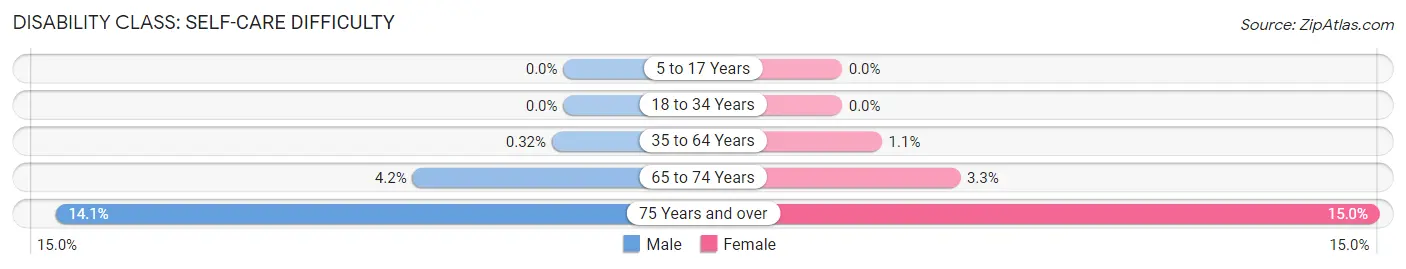
| Age Bracket | Male | Female |
| 5 to 17 Years | 0 (0.0%) | 0 (0.0%) |
| 18 to 34 Years | 0 (0.0%) | 0 (0.0%) |
| 35 to 64 Years | 10 (0.3%) | 39 (1.1%) |
| 65 to 74 Years | 47 (4.2%) | 25 (3.3%) |
| 75 Years and over | 43 (14.1%) | 86 (15.0%) |
Technology Access in Pinewood
Computing Device Access in Pinewood
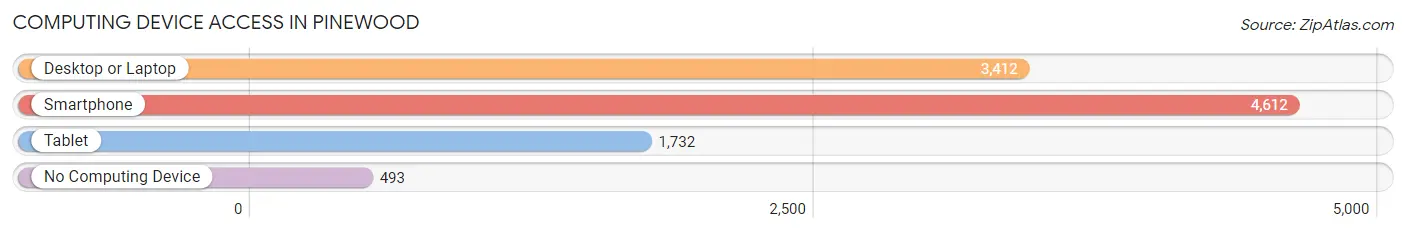
| Device Type | # Households | % Households |
| Desktop or Laptop | 3,412 | 63.3% |
| Smartphone | 4,612 | 85.5% |
| Tablet | 1,732 | 32.1% |
| No Computing Device | 493 | 9.1% |
| Total | 5,393 | 100.0% |
Internet Access in Pinewood
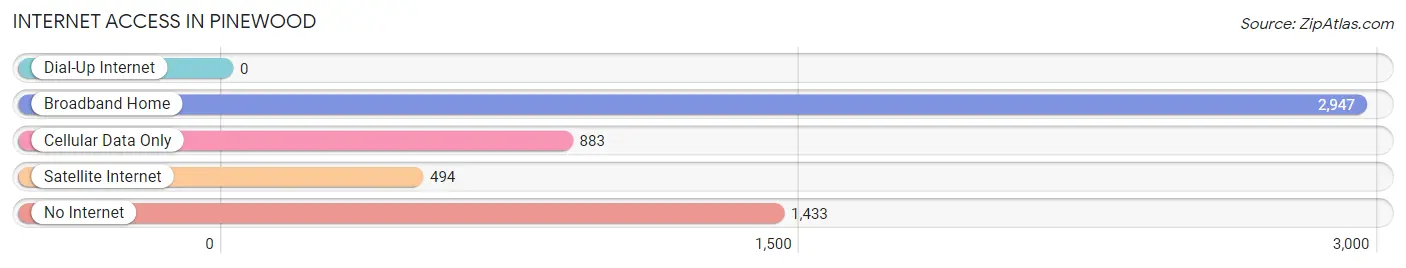
| Internet Type | # Households | % Households |
| Dial-Up Internet | 0 | 0.0% |
| Broadband Home | 2,947 | 54.6% |
| Cellular Data Only | 883 | 16.4% |
| Satellite Internet | 494 | 9.2% |
| No Internet | 1,433 | 26.6% |
| Total | 5,393 | 100.0% |
Pinewood Summary
Pinewood is a small unincorporated community located in Miami-Dade County, Florida. It is situated between the cities of Miami and Hialeah, and is part of the Miami metropolitan area. The community is bordered by the Miami Canal to the east, the Palmetto Expressway to the west, and the Florida Turnpike to the south. Pinewood is a predominantly Hispanic community, with a population of approximately 4,000 people.
History
Pinewood was originally part of the Everglades, and was settled by Native Americans in the late 1800s. The area was later developed by the Florida East Coast Railway in the early 1900s, and was named after the pine trees that grew in the area. The community was originally a farming community, and was home to many citrus groves and vegetable farms.
In the 1950s, the area began to experience rapid growth due to the influx of Cuban immigrants. The population of Pinewood increased from 1,000 in 1950 to 4,000 in 2000. The community was also home to many small businesses, including restaurants, grocery stores, and auto repair shops.
Geography
Pinewood is located in Miami-Dade County, Florida. It is situated between the cities of Miami and Hialeah, and is part of the Miami metropolitan area. The community is bordered by the Miami Canal to the east, the Palmetto Expressway to the west, and the Florida Turnpike to the south.
The area is mostly flat, with an elevation of just 10 feet above sea level. The climate is tropical, with hot and humid summers and mild winters. The average temperature in the summer is around 90 degrees Fahrenheit, and the average temperature in the winter is around 70 degrees Fahrenheit.
Economy
The economy of Pinewood is largely based on small businesses and services. The community is home to many restaurants, grocery stores, auto repair shops, and other small businesses. The area is also home to several industrial parks, which provide employment opportunities for local residents.
The median household income in Pinewood is $30,000, which is lower than the national average. The unemployment rate in the area is also higher than the national average, at 8.5%.
Demographics
Pinewood is a predominantly Hispanic community, with a population of approximately 4,000 people. The majority of the population is of Cuban descent, with smaller numbers of Puerto Ricans, Mexicans, and other Hispanic groups. The median age in the area is 33 years old, and the median household income is $30,000.
The area is also home to a large number of immigrants, with over half of the population being foreign-born. The majority of the foreign-born population is from Cuba, with smaller numbers from Mexico, Puerto Rico, and other countries.
Conclusion
Pinewood is a small unincorporated community located in Miami-Dade County, Florida. It is a predominantly Hispanic community, with a population of approximately 4,000 people. The economy of Pinewood is largely based on small businesses and services, and the median household income is $30,000. The area is also home to a large number of immigrants, with over half of the population being foreign-born. Pinewood is a unique community with a rich history and culture, and is an important part of the Miami metropolitan area.
Common Questions
What is Per Capita Income in Pinewood?
Per Capita income in Pinewood is $19,107.
What is the Median Family Income in Pinewood?
Median Family Income in Pinewood is $43,662.
What is the Median Household income in Pinewood?
Median Household Income in Pinewood is $41,283.
What is Income or Wage Gap in Pinewood?
Income or Wage Gap in Pinewood is 13.7%.
Women in Pinewood earn 86.3 cents for every dollar earned by a man.
What is Inequality or Gini Index in Pinewood?
Inequality or Gini Index in Pinewood is 0.44.
What is the Total Population of Pinewood?
Total Population of Pinewood is 17,163.
What is the Total Male Population of Pinewood?
Total Male Population of Pinewood is 8,697.
What is the Total Female Population of Pinewood?
Total Female Population of Pinewood is 8,466.
What is the Ratio of Males per 100 Females in Pinewood?
There are 102.73 Males per 100 Females in Pinewood.
What is the Ratio of Females per 100 Males in Pinewood?
There are 97.34 Females per 100 Males in Pinewood.
What is the Median Population Age in Pinewood?
Median Population Age in Pinewood is 40.0 Years.
What is the Average Family Size in Pinewood
Average Family Size in Pinewood is 3.7 People.
What is the Average Household Size in Pinewood
Average Household Size in Pinewood is 3.1 People.
How Large is the Labor Force in Pinewood?
There are 7,936 People in the Labor Forcein in Pinewood.
What is the Percentage of People in the Labor Force in Pinewood?
57.4% of People are in the Labor Force in Pinewood.
What is the Unemployment Rate in Pinewood?
Unemployment Rate in Pinewood is 7.3%.