Winter Haven, FL Map & Demographics
Winter Haven Map
Winter Haven Overview
$28,967
PER CAPITA INCOME
$63,816
AVG FAMILY INCOME
$56,425
AVG HOUSEHOLD INCOME
21.8%
WAGE / INCOME GAP [ % ]
78.2¢/ $1
WAGE / INCOME GAP [ $ ]
$11,802
FAMILY INCOME DEFICIT
0.46
INEQUALITY / GINI INDEX
50,778
TOTAL POPULATION
24,273
MALE POPULATION
26,505
FEMALE POPULATION
91.58
MALES / 100 FEMALES
109.20
FEMALES / 100 MALES
40.6
MEDIAN AGE
3.3
AVG FAMILY SIZE
2.7
AVG HOUSEHOLD SIZE
22,294
LABOR FORCE [ PEOPLE ]
54.3%
PERCENT IN LABOR FORCE
4.2%
UNEMPLOYMENT RATE
Income in Winter Haven
Income Overview in Winter Haven
Per Capita Income in Winter Haven is $28,967, while median incomes of families and households are $63,816 and $56,425 respectively.
| Characteristic | Number | Measure |
| Per Capita Income | 50,778 | $28,967 |
| Median Family Income | 12,456 | $63,816 |
| Mean Family Income | 12,456 | $83,196 |
| Median Household Income | 18,741 | $56,425 |
| Mean Household Income | 18,741 | $73,957 |
| Income Deficit | 12,456 | $11,802 |
| Wage / Income Gap (%) | 50,778 | 21.78% |
| Wage / Income Gap ($) | 50,778 | 78.22¢ per $1 |
| Gini / Inequality Index | 50,778 | 0.46 |
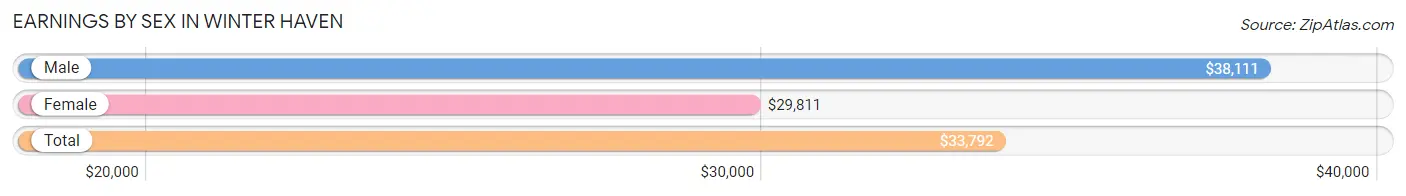
Earnings by Sex in Winter Haven
Average Earnings in Winter Haven are $33,792, $38,111 for men and $29,811 for women, a difference of 21.8%.
| Sex | Number | Average Earnings |
| Male | 12,084 (53.4%) | $38,111 |
| Female | 10,540 (46.6%) | $29,811 |
| Total | 22,624 (100.0%) | $33,792 |
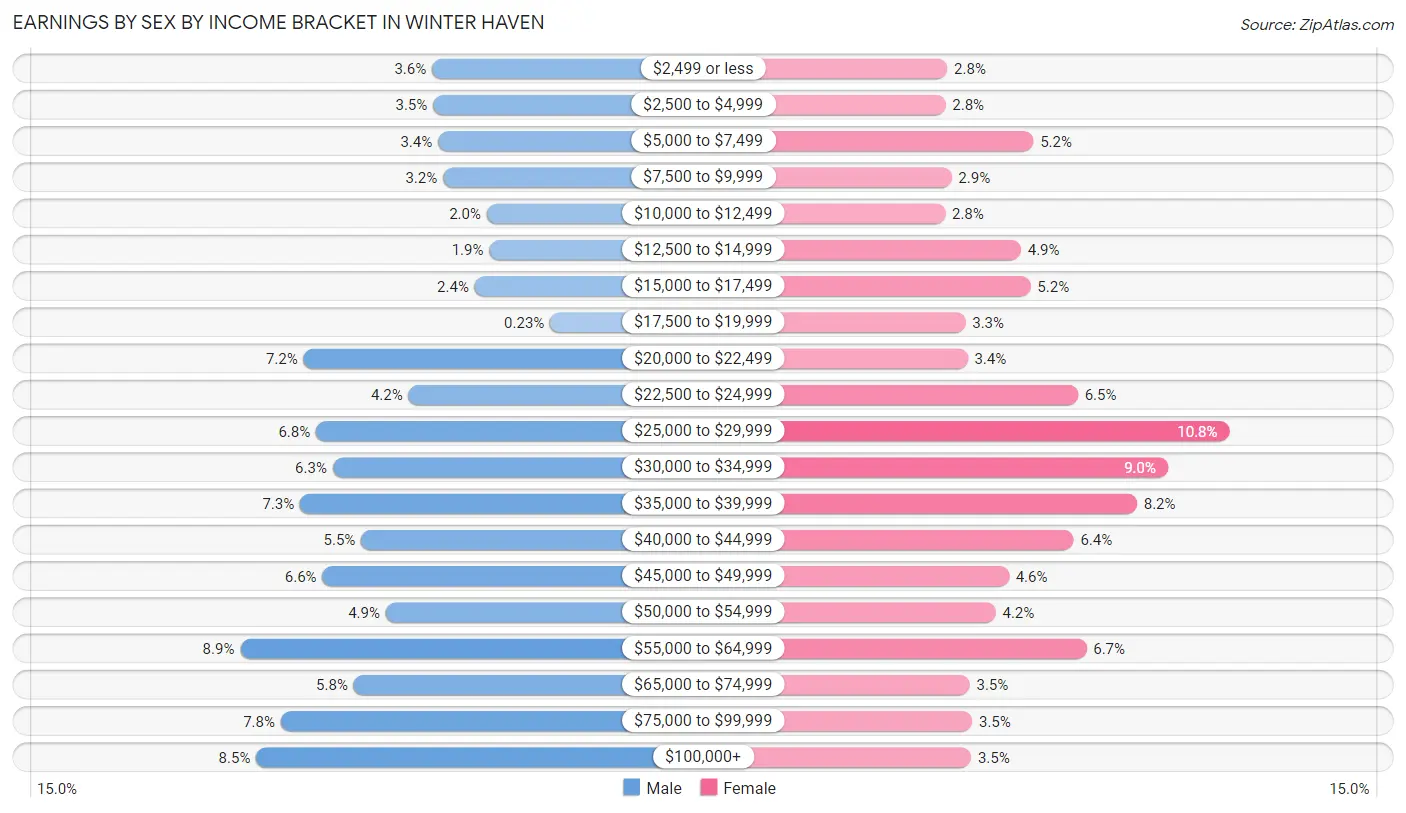
Earnings by Sex by Income Bracket in Winter Haven
The most common earnings brackets in Winter Haven are $55,000 to $64,999 for men (1,080 | 8.9%) and $25,000 to $29,999 for women (1,133 | 10.7%).
| Income | Male | Female |
| $2,499 or less | 429 (3.5%) | 297 (2.8%) |
| $2,500 to $4,999 | 425 (3.5%) | 292 (2.8%) |
| $5,000 to $7,499 | 408 (3.4%) | 552 (5.2%) |
| $7,500 to $9,999 | 391 (3.2%) | 310 (2.9%) |
| $10,000 to $12,499 | 243 (2.0%) | 291 (2.8%) |
| $12,500 to $14,999 | 235 (1.9%) | 515 (4.9%) |
| $15,000 to $17,499 | 284 (2.4%) | 544 (5.2%) |
| $17,500 to $19,999 | 28 (0.2%) | 351 (3.3%) |
| $20,000 to $22,499 | 865 (7.2%) | 357 (3.4%) |
| $22,500 to $24,999 | 509 (4.2%) | 684 (6.5%) |
| $25,000 to $29,999 | 823 (6.8%) | 1,133 (10.7%) |
| $30,000 to $34,999 | 766 (6.3%) | 951 (9.0%) |
| $35,000 to $39,999 | 877 (7.3%) | 859 (8.2%) |
| $40,000 to $44,999 | 670 (5.5%) | 671 (6.4%) |
| $45,000 to $49,999 | 801 (6.6%) | 480 (4.5%) |
| $50,000 to $54,999 | 586 (4.9%) | 441 (4.2%) |
| $55,000 to $64,999 | 1,080 (8.9%) | 709 (6.7%) |
| $65,000 to $74,999 | 695 (5.8%) | 364 (3.5%) |
| $75,000 to $99,999 | 943 (7.8%) | 371 (3.5%) |
| $100,000+ | 1,026 (8.5%) | 368 (3.5%) |
| Total | 12,084 (100.0%) | 10,540 (100.0%) |
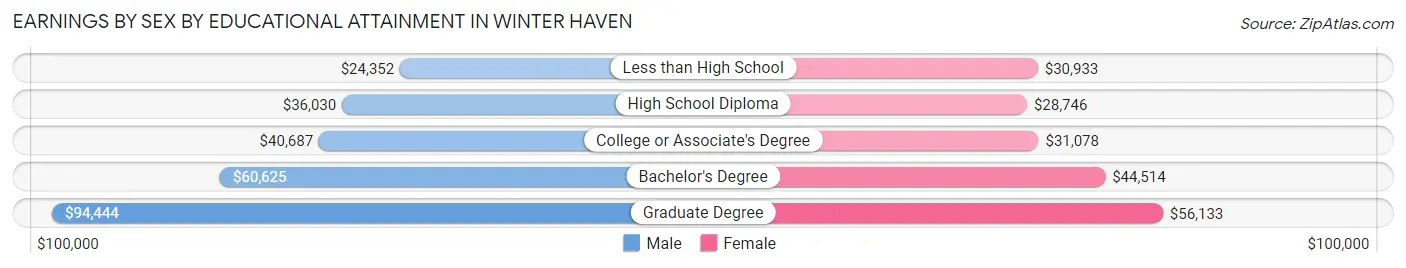
Earnings by Sex by Educational Attainment in Winter Haven
Average earnings in Winter Haven are $41,460 for men and $31,676 for women, a difference of 23.6%. Men with an educational attainment of graduate degree enjoy the highest average annual earnings of $94,444, while those with less than high school education earn the least with $24,352. Women with an educational attainment of graduate degree earn the most with the average annual earnings of $56,133, while those with high school diploma education have the smallest earnings of $28,746.
| Educational Attainment | Male Income | Female Income |
| Less than High School | $24,352 | $30,933 |
| High School Diploma | $36,030 | $28,746 |
| College or Associate's Degree | $40,687 | $31,078 |
| Bachelor's Degree | $60,625 | $44,514 |
| Graduate Degree | $94,444 | $56,133 |
| Total | $41,460 | $31,676 |
Family Income in Winter Haven
Family Income Brackets in Winter Haven
According to the Winter Haven family income data, there are 2,778 families falling into the $50,000 to $74,999 income range, which is the most common income bracket and makes up 22.3% of all families. Conversely, the $10,000 to $14,999 income bracket is the least frequent group with only 436 families (3.5%) belonging to this category.
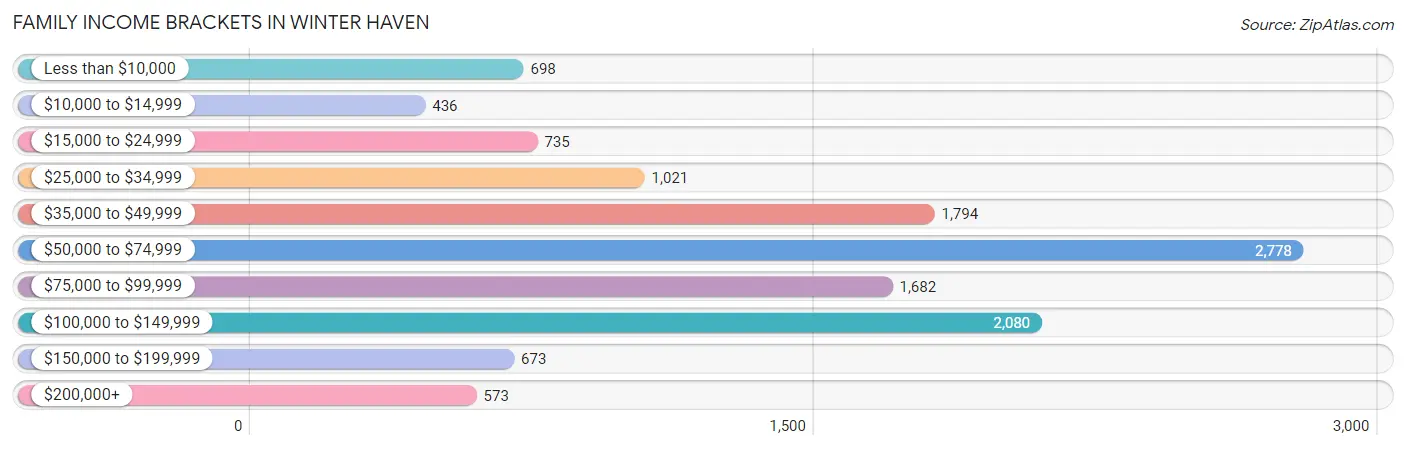
| Income Bracket | # Families | % Families |
| Less than $10,000 | 698 | 5.6% |
| $10,000 to $14,999 | 436 | 3.5% |
| $15,000 to $24,999 | 735 | 5.9% |
| $25,000 to $34,999 | 1,021 | 8.2% |
| $35,000 to $49,999 | 1,794 | 14.4% |
| $50,000 to $74,999 | 2,778 | 22.3% |
| $75,000 to $99,999 | 1,682 | 13.5% |
| $100,000 to $149,999 | 2,080 | 16.7% |
| $150,000 to $199,999 | 673 | 5.4% |
| $200,000+ | 573 | 4.6% |
Family Income by Famaliy Size in Winter Haven
6-person families (456 | 3.7%) account for the highest median family income in Winter Haven with $90,278 per family, while 2-person families (6,403 | 51.4%) have the highest median income of $28,175 per family member.
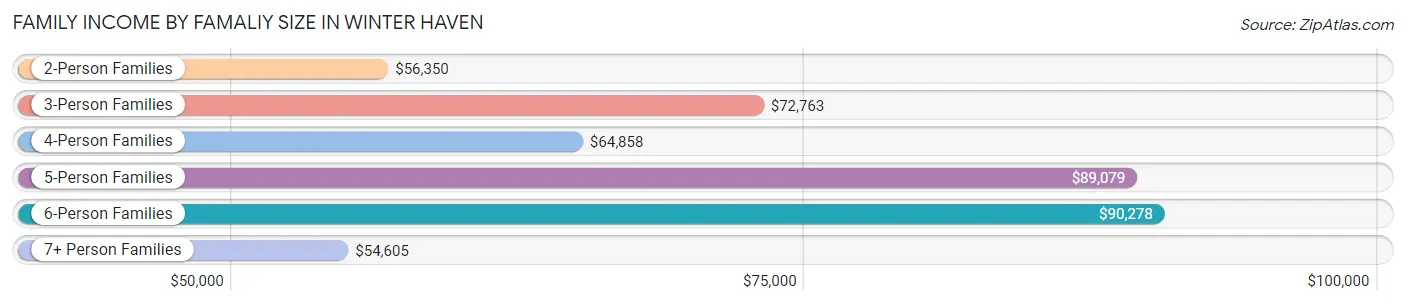
| Income Bracket | # Families | Median Income |
| 2-Person Families | 6,403 (51.4%) | $56,350 |
| 3-Person Families | 2,329 (18.7%) | $72,763 |
| 4-Person Families | 1,996 (16.0%) | $64,858 |
| 5-Person Families | 972 (7.8%) | $89,079 |
| 6-Person Families | 456 (3.7%) | $90,278 |
| 7+ Person Families | 300 (2.4%) | $54,605 |
| Total | 12,456 (100.0%) | $63,816 |
Family Income by Number of Earners in Winter Haven
The median family income in Winter Haven is $63,816, with families comprising 3+ earners (1,366) having the highest median family income of $106,979, while families with 1 earner (4,076) have the lowest median family income of $46,039, accounting for 11.0% and 32.7% of families, respectively.
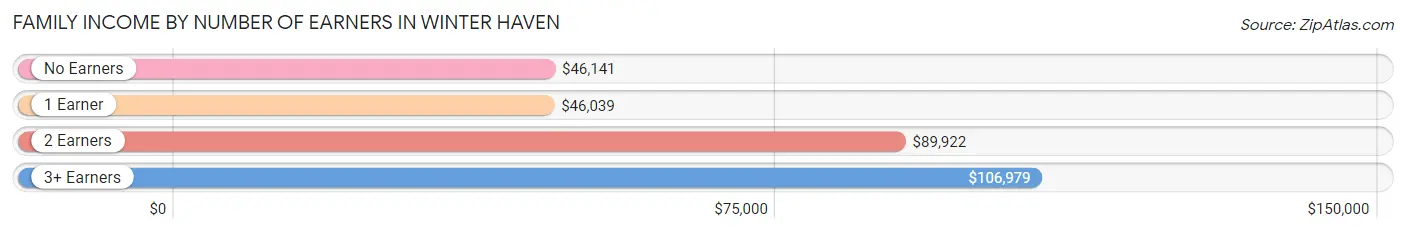
| Number of Earners | # Families | Median Income |
| No Earners | 3,215 (25.8%) | $46,141 |
| 1 Earner | 4,076 (32.7%) | $46,039 |
| 2 Earners | 3,799 (30.5%) | $89,922 |
| 3+ Earners | 1,366 (11.0%) | $106,979 |
| Total | 12,456 (100.0%) | $63,816 |
Household Income in Winter Haven
Household Income Brackets in Winter Haven
With 3,842 households falling in the category, the $50,000 to $74,999 income range is the most frequent in Winter Haven, accounting for 20.5% of all households. In contrast, only 712 households (3.8%) fall into the $200,000+ income bracket, making it the least populous group.
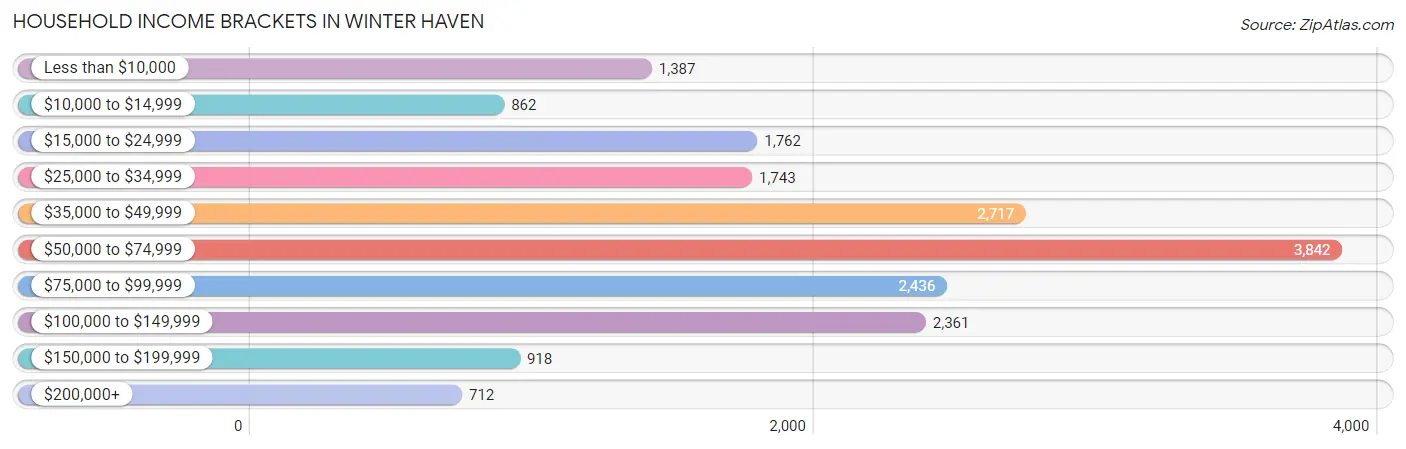
| Income Bracket | # Households | % Households |
| Less than $10,000 | 1,387 | 7.4% |
| $10,000 to $14,999 | 862 | 4.6% |
| $15,000 to $24,999 | 1,762 | 9.4% |
| $25,000 to $34,999 | 1,743 | 9.3% |
| $35,000 to $49,999 | 2,717 | 14.5% |
| $50,000 to $74,999 | 3,842 | 20.5% |
| $75,000 to $99,999 | 2,436 | 13.0% |
| $100,000 to $149,999 | 2,361 | 12.6% |
| $150,000 to $199,999 | 918 | 4.9% |
| $200,000+ | 712 | 3.8% |
Household Income by Householder Age in Winter Haven
The median household income in Winter Haven is $56,425, with the highest median household income of $70,178 found in the 45 to 64 years age bracket for the primary householder. A total of 6,286 households (33.5%) fall into this category. Meanwhile, the 65+ years age bracket for the primary householder has the lowest median household income of $42,644, with 6,819 households (36.4%) in this group.
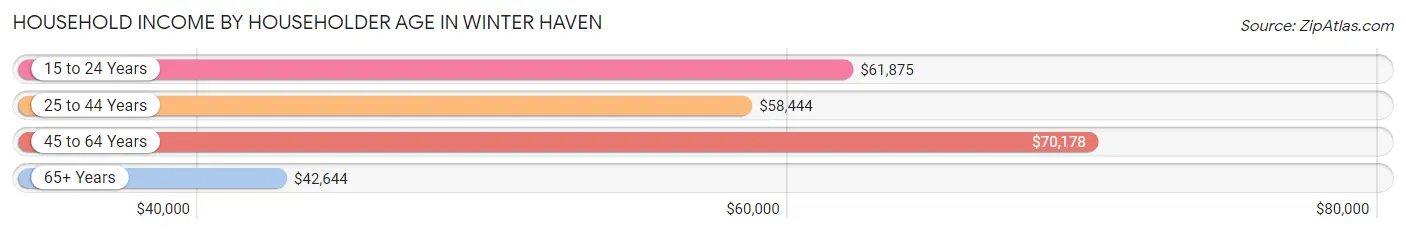
| Income Bracket | # Households | Median Income |
| 15 to 24 Years | 826 (4.4%) | $61,875 |
| 25 to 44 Years | 4,810 (25.7%) | $58,444 |
| 45 to 64 Years | 6,286 (33.5%) | $70,178 |
| 65+ Years | 6,819 (36.4%) | $42,644 |
| Total | 18,741 (100.0%) | $56,425 |
Poverty in Winter Haven
Income Below Poverty by Sex and Age in Winter Haven
With 13.7% poverty level for males and 18.0% for females among the residents of Winter Haven, 16 and 17 year old males and 15 year old females are the most vulnerable to poverty, with 263 males (40.5%) and 121 females (34.7%) in their respective age groups living below the poverty level.
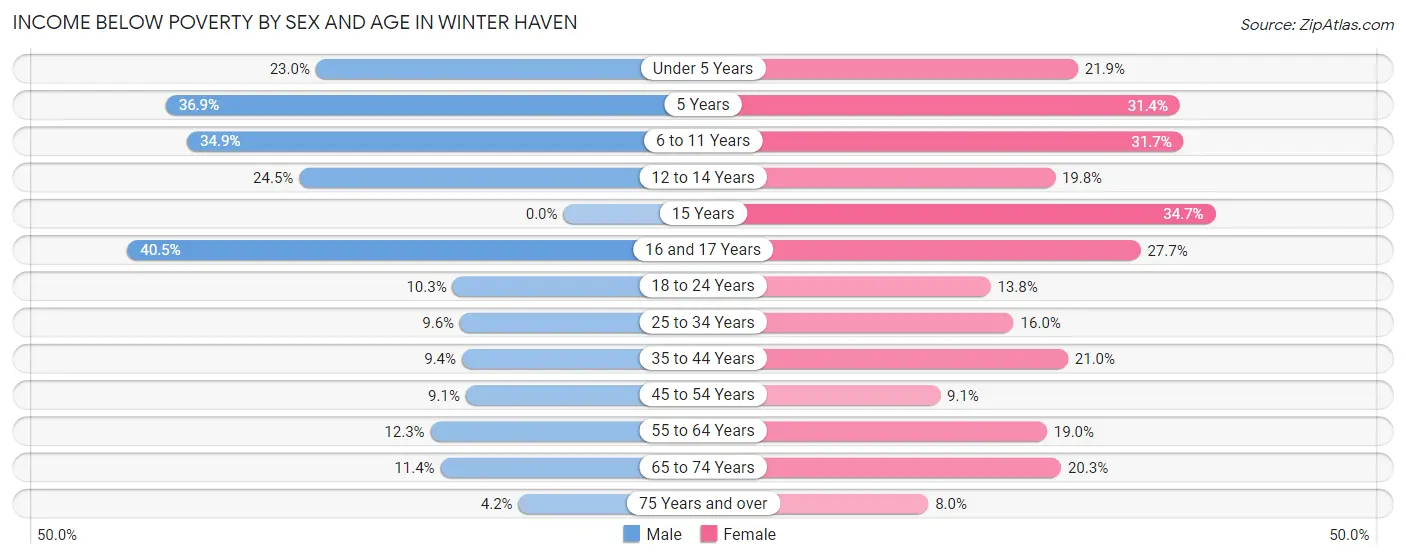
| Age Bracket | Male | Female |
| Under 5 Years | 325 (23.0%) | 374 (21.9%) |
| 5 Years | 152 (36.9%) | 80 (31.4%) |
| 6 to 11 Years | 464 (34.9%) | 618 (31.7%) |
| 12 to 14 Years | 267 (24.5%) | 180 (19.8%) |
| 15 Years | 0 (0.0%) | 121 (34.7%) |
| 16 and 17 Years | 263 (40.5%) | 199 (27.7%) |
| 18 to 24 Years | 238 (10.3%) | 294 (13.8%) |
| 25 to 34 Years | 354 (9.6%) | 501 (16.0%) |
| 35 to 44 Years | 235 (9.4%) | 526 (21.0%) |
| 45 to 54 Years | 257 (9.1%) | 285 (9.1%) |
| 55 to 64 Years | 345 (12.3%) | 586 (19.0%) |
| 65 to 74 Years | 286 (11.4%) | 694 (20.3%) |
| 75 Years and over | 92 (4.2%) | 218 (8.0%) |
| Total | 3,278 (13.7%) | 4,676 (18.0%) |
Income Above Poverty by Sex and Age in Winter Haven
According to the poverty statistics in Winter Haven, males aged 15 years and females aged 75 years and over are the age groups that are most secure financially, with 100.0% of males and 92.0% of females in these age groups living above the poverty line.
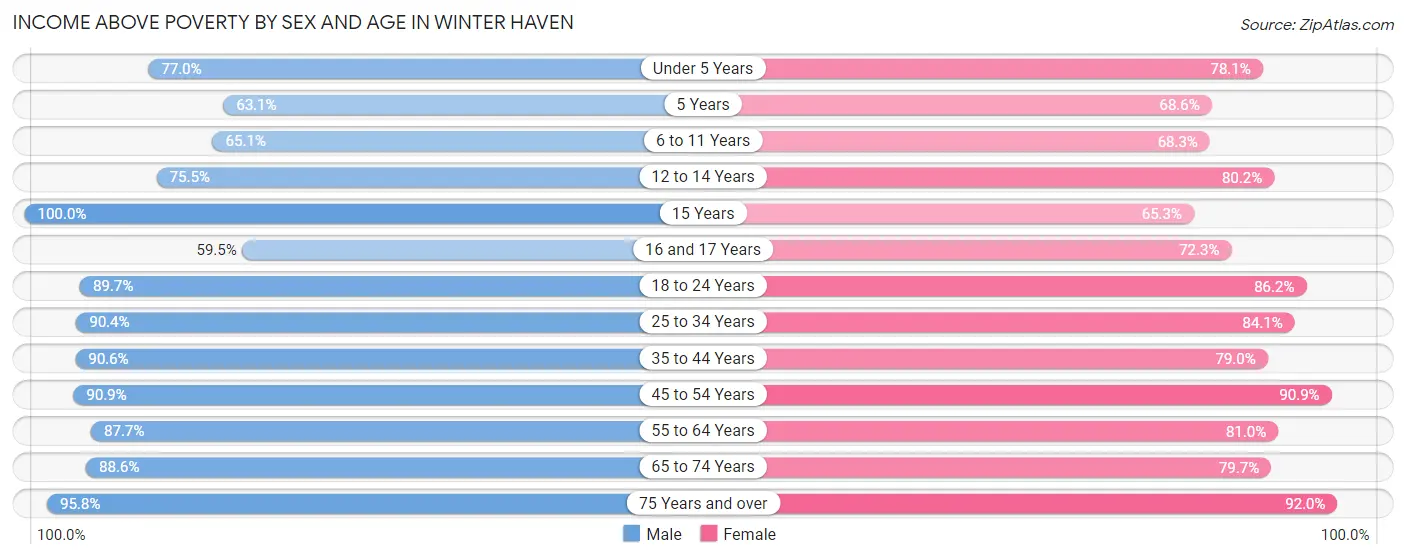
| Age Bracket | Male | Female |
| Under 5 Years | 1,089 (77.0%) | 1,333 (78.1%) |
| 5 Years | 260 (63.1%) | 175 (68.6%) |
| 6 to 11 Years | 865 (65.1%) | 1,330 (68.3%) |
| 12 to 14 Years | 822 (75.5%) | 730 (80.2%) |
| 15 Years | 224 (100.0%) | 228 (65.3%) |
| 16 and 17 Years | 387 (59.5%) | 519 (72.3%) |
| 18 to 24 Years | 2,075 (89.7%) | 1,836 (86.2%) |
| 25 to 34 Years | 3,332 (90.4%) | 2,640 (84.1%) |
| 35 to 44 Years | 2,259 (90.6%) | 1,981 (79.0%) |
| 45 to 54 Years | 2,581 (90.9%) | 2,840 (90.9%) |
| 55 to 64 Years | 2,450 (87.7%) | 2,494 (81.0%) |
| 65 to 74 Years | 2,220 (88.6%) | 2,718 (79.7%) |
| 75 Years and over | 2,112 (95.8%) | 2,500 (92.0%) |
| Total | 20,676 (86.3%) | 21,324 (82.0%) |
Income Below Poverty Among Married-Couple Families in Winter Haven
The poverty statistics for married-couple families in Winter Haven show that 4.8% or 395 of the total 8,268 families live below the poverty line. Families with 5 or more children have the highest poverty rate of 22.7%, comprising of 15 families. On the other hand, families with no children have the lowest poverty rate of 4.3%, which includes 216 families.
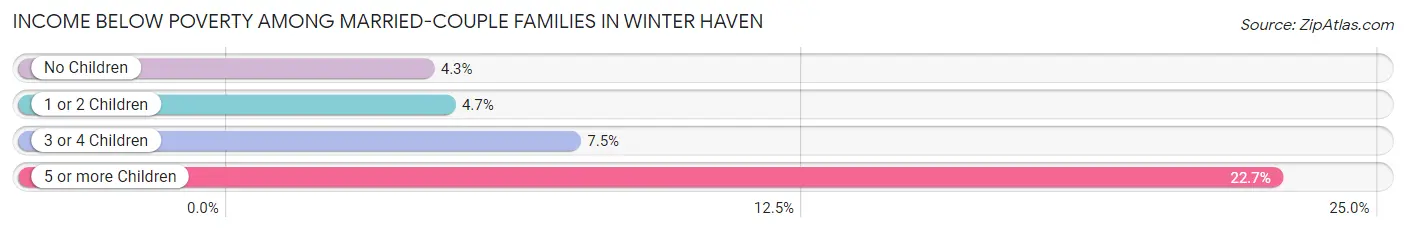
| Children | Above Poverty | Below Poverty |
| No Children | 4,860 (95.7%) | 216 (4.3%) |
| 1 or 2 Children | 2,403 (95.3%) | 119 (4.7%) |
| 3 or 4 Children | 559 (92.5%) | 45 (7.4%) |
| 5 or more Children | 51 (77.3%) | 15 (22.7%) |
| Total | 7,873 (95.2%) | 395 (4.8%) |
Income Below Poverty Among Single-Parent Households in Winter Haven
According to the poverty data in Winter Haven, 20.9% or 253 single-father households and 37.0% or 1,101 single-mother households are living below the poverty line. Among single-father households, those with 5 or more children have the highest poverty rate, with 26 households (100.0%) experiencing poverty. Likewise, among single-mother households, those with 5 or more children have the highest poverty rate, with 53 households (100.0%) falling below the poverty line.
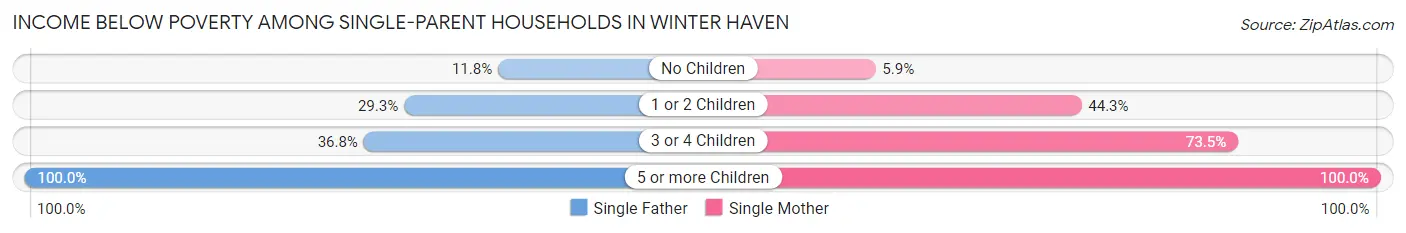
| Children | Single Father | Single Mother |
| No Children | 84 (11.8%) | 54 (5.9%) |
| 1 or 2 Children | 122 (29.3%) | 734 (44.3%) |
| 3 or 4 Children | 21 (36.8%) | 260 (73.5%) |
| 5 or more Children | 26 (100.0%) | 53 (100.0%) |
| Total | 253 (20.9%) | 1,101 (37.0%) |
Income Below Poverty Among Married-Couple vs Single-Parent Households in Winter Haven
The poverty data for Winter Haven shows that 395 of the married-couple family households (4.8%) and 1,354 of the single-parent households (32.3%) are living below the poverty level. Within the married-couple family households, those with 5 or more children have the highest poverty rate, with 15 households (22.7%) falling below the poverty line. Among the single-parent households, those with 5 or more children have the highest poverty rate, with 79 household (100.0%) living below poverty.
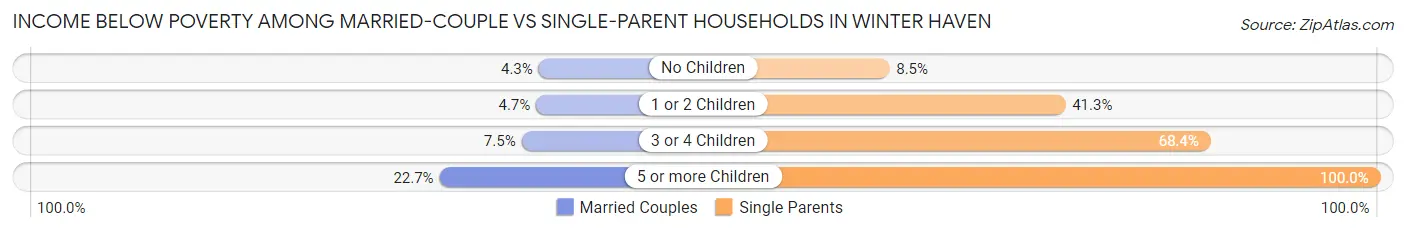
| Children | Married-Couple Families | Single-Parent Households |
| No Children | 216 (4.3%) | 138 (8.5%) |
| 1 or 2 Children | 119 (4.7%) | 856 (41.3%) |
| 3 or 4 Children | 45 (7.4%) | 281 (68.4%) |
| 5 or more Children | 15 (22.7%) | 79 (100.0%) |
| Total | 395 (4.8%) | 1,354 (32.3%) |
Race in Winter Haven
The most populous races in Winter Haven are White / Caucasian (27,017 | 53.2%), Black / African American (13,068 | 25.7%), and Hispanic or Latino (10,813 | 21.3%).
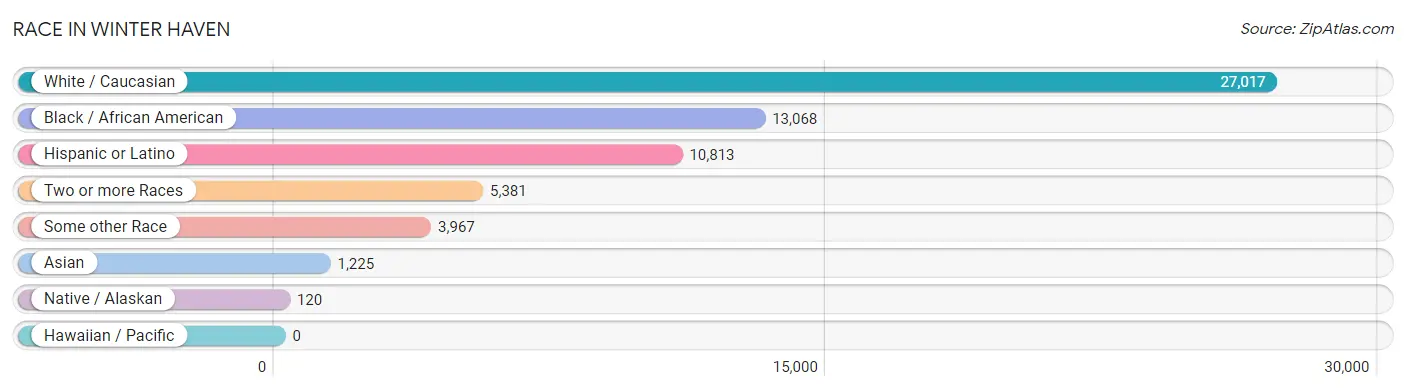
| Race | # Population | % Population |
| Asian | 1,225 | 2.4% |
| Black / African American | 13,068 | 25.7% |
| Hawaiian / Pacific | 0 | 0.0% |
| Hispanic or Latino | 10,813 | 21.3% |
| Native / Alaskan | 120 | 0.2% |
| White / Caucasian | 27,017 | 53.2% |
| Two or more Races | 5,381 | 10.6% |
| Some other Race | 3,967 | 7.8% |
| Total | 50,778 | 100.0% |
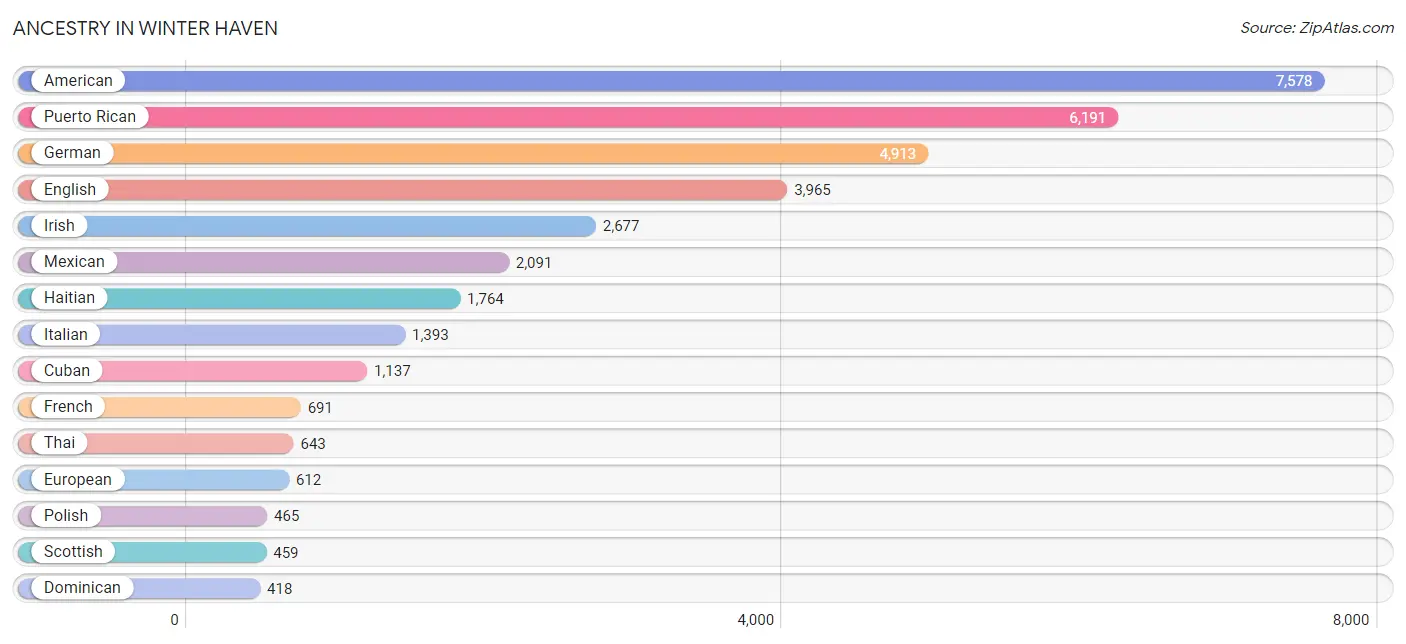
Ancestry in Winter Haven
The most populous ancestries reported in Winter Haven are American (7,578 | 14.9%), Puerto Rican (6,191 | 12.2%), German (4,913 | 9.7%), English (3,965 | 7.8%), and Irish (2,677 | 5.3%), together accounting for 49.9% of all Winter Haven residents.
| Ancestry | # Population | % Population |
| African | 362 | 0.7% |
| American | 7,578 | 14.9% |
| Apache | 155 | 0.3% |
| Arab | 181 | 0.4% |
| Armenian | 24 | 0.1% |
| Assyrian / Chaldean / Syriac | 14 | 0.0% |
| Austrian | 42 | 0.1% |
| Barbadian | 11 | 0.0% |
| Belgian | 22 | 0.0% |
| British | 70 | 0.1% |
| Burmese | 30 | 0.1% |
| Canadian | 140 | 0.3% |
| Cape Verdean | 13 | 0.0% |
| Central American | 355 | 0.7% |
| Central American Indian | 28 | 0.1% |
| Cherokee | 101 | 0.2% |
| Chilean | 14 | 0.0% |
| Colombian | 109 | 0.2% |
| Croatian | 15 | 0.0% |
| Cuban | 1,137 | 2.2% |
| Czech | 85 | 0.2% |
| Czechoslovakian | 40 | 0.1% |
| Danish | 30 | 0.1% |
| Dominican | 418 | 0.8% |
| Dutch | 141 | 0.3% |
| Eastern European | 77 | 0.2% |
| Ecuadorian | 94 | 0.2% |
| English | 3,965 | 7.8% |
| Ethiopian | 5 | 0.0% |
| European | 612 | 1.2% |
| Finnish | 77 | 0.2% |
| French | 691 | 1.4% |
| French Canadian | 231 | 0.4% |
| German | 4,913 | 9.7% |
| Ghanaian | 19 | 0.0% |
| Greek | 19 | 0.0% |
| Guatemalan | 68 | 0.1% |
| Guyanese | 195 | 0.4% |
| Haitian | 1,764 | 3.5% |
| Honduran | 1 | 0.0% |
| Hungarian | 199 | 0.4% |
| Indian (Asian) | 226 | 0.4% |
| Iranian | 65 | 0.1% |
| Iraqi | 10 | 0.0% |
| Irish | 2,677 | 5.3% |
| Italian | 1,393 | 2.7% |
| Jamaican | 412 | 0.8% |
| Korean | 267 | 0.5% |
| Laotian | 3 | 0.0% |
| Lebanese | 36 | 0.1% |
| Lithuanian | 14 | 0.0% |
| Maltese | 30 | 0.1% |
| Mexican | 2,091 | 4.1% |
| Mexican American Indian | 58 | 0.1% |
| Nicaraguan | 215 | 0.4% |
| Northern European | 63 | 0.1% |
| Norwegian | 134 | 0.3% |
| Palestinian | 12 | 0.0% |
| Paraguayan | 16 | 0.0% |
| Pennsylvania German | 24 | 0.1% |
| Peruvian | 27 | 0.1% |
| Polish | 465 | 0.9% |
| Portuguese | 34 | 0.1% |
| Puerto Rican | 6,191 | 12.2% |
| Romanian | 58 | 0.1% |
| Russian | 65 | 0.1% |
| Salvadoran | 71 | 0.1% |
| Scandinavian | 41 | 0.1% |
| Scotch-Irish | 392 | 0.8% |
| Scottish | 459 | 0.9% |
| Slavic | 28 | 0.1% |
| Slovak | 21 | 0.0% |
| South American | 356 | 0.7% |
| Spaniard | 11 | 0.0% |
| Sri Lankan | 185 | 0.4% |
| Subsaharan African | 399 | 0.8% |
| Swedish | 166 | 0.3% |
| Swiss | 24 | 0.1% |
| Syrian | 123 | 0.2% |
| Thai | 643 | 1.3% |
| Trinidadian and Tobagonian | 39 | 0.1% |
| Ukrainian | 50 | 0.1% |
| Venezuelan | 96 | 0.2% |
| Vietnamese | 21 | 0.0% |
| Welsh | 159 | 0.3% |
| West Indian | 41 | 0.1% | View All 86 Rows |
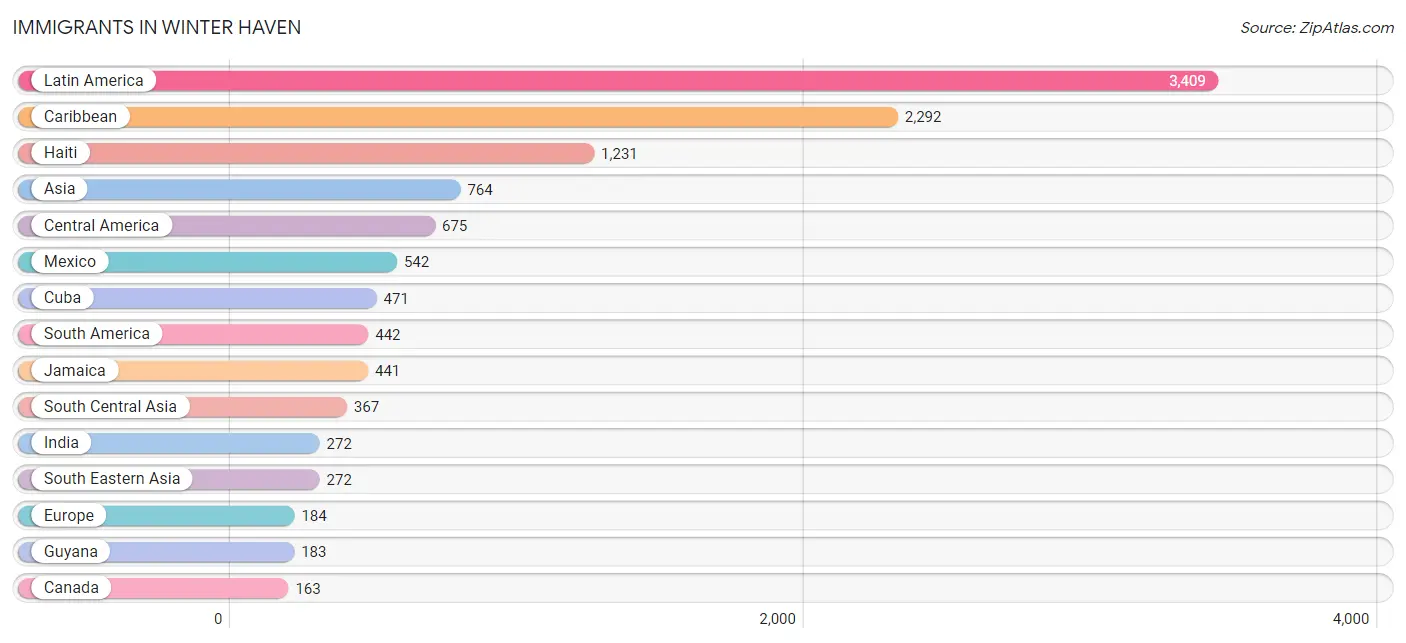
Immigrants in Winter Haven
The most numerous immigrant groups reported in Winter Haven came from Latin America (3,409 | 6.7%), Caribbean (2,292 | 4.5%), Haiti (1,231 | 2.4%), Asia (764 | 1.5%), and Central America (675 | 1.3%), together accounting for 16.5% of all Winter Haven residents.
| Immigration Origin | # Population | % Population |
| Africa | 24 | 0.1% |
| Asia | 764 | 1.5% |
| Bangladesh | 4 | 0.0% |
| Barbados | 11 | 0.0% |
| Canada | 163 | 0.3% |
| Caribbean | 2,292 | 4.5% |
| Central America | 675 | 1.3% |
| China | 58 | 0.1% |
| Colombia | 76 | 0.2% |
| Cuba | 471 | 0.9% |
| Czechoslovakia | 7 | 0.0% |
| Dominican Republic | 45 | 0.1% |
| Eastern Africa | 11 | 0.0% |
| Eastern Asia | 69 | 0.1% |
| Eastern Europe | 60 | 0.1% |
| Ecuador | 72 | 0.1% |
| El Salvador | 71 | 0.1% |
| England | 37 | 0.1% |
| Europe | 184 | 0.4% |
| France | 12 | 0.0% |
| Germany | 5 | 0.0% |
| Ghana | 13 | 0.0% |
| Guatemala | 40 | 0.1% |
| Guyana | 183 | 0.4% |
| Haiti | 1,231 | 2.4% |
| Hong Kong | 9 | 0.0% |
| Hungary | 39 | 0.1% |
| India | 272 | 0.5% |
| Indonesia | 13 | 0.0% |
| Iran | 53 | 0.1% |
| Jamaica | 441 | 0.9% |
| Kenya | 11 | 0.0% |
| Korea | 11 | 0.0% |
| Kuwait | 28 | 0.1% |
| Latin America | 3,409 | 6.7% |
| Mexico | 542 | 1.1% |
| Nepal | 11 | 0.0% |
| Netherlands | 19 | 0.0% |
| Nicaragua | 22 | 0.0% |
| Northern Europe | 37 | 0.1% |
| Pakistan | 27 | 0.1% |
| Peru | 17 | 0.0% |
| Philippines | 149 | 0.3% |
| South America | 442 | 0.9% |
| South Central Asia | 367 | 0.7% |
| South Eastern Asia | 272 | 0.5% |
| Syria | 28 | 0.1% |
| Taiwan | 22 | 0.0% |
| Trinidad and Tobago | 29 | 0.1% |
| Ukraine | 14 | 0.0% |
| Venezuela | 78 | 0.2% |
| Vietnam | 110 | 0.2% |
| West Indies | 39 | 0.1% |
| Western Africa | 13 | 0.0% |
| Western Asia | 56 | 0.1% |
| Western Europe | 56 | 0.1% | View All 56 Rows |
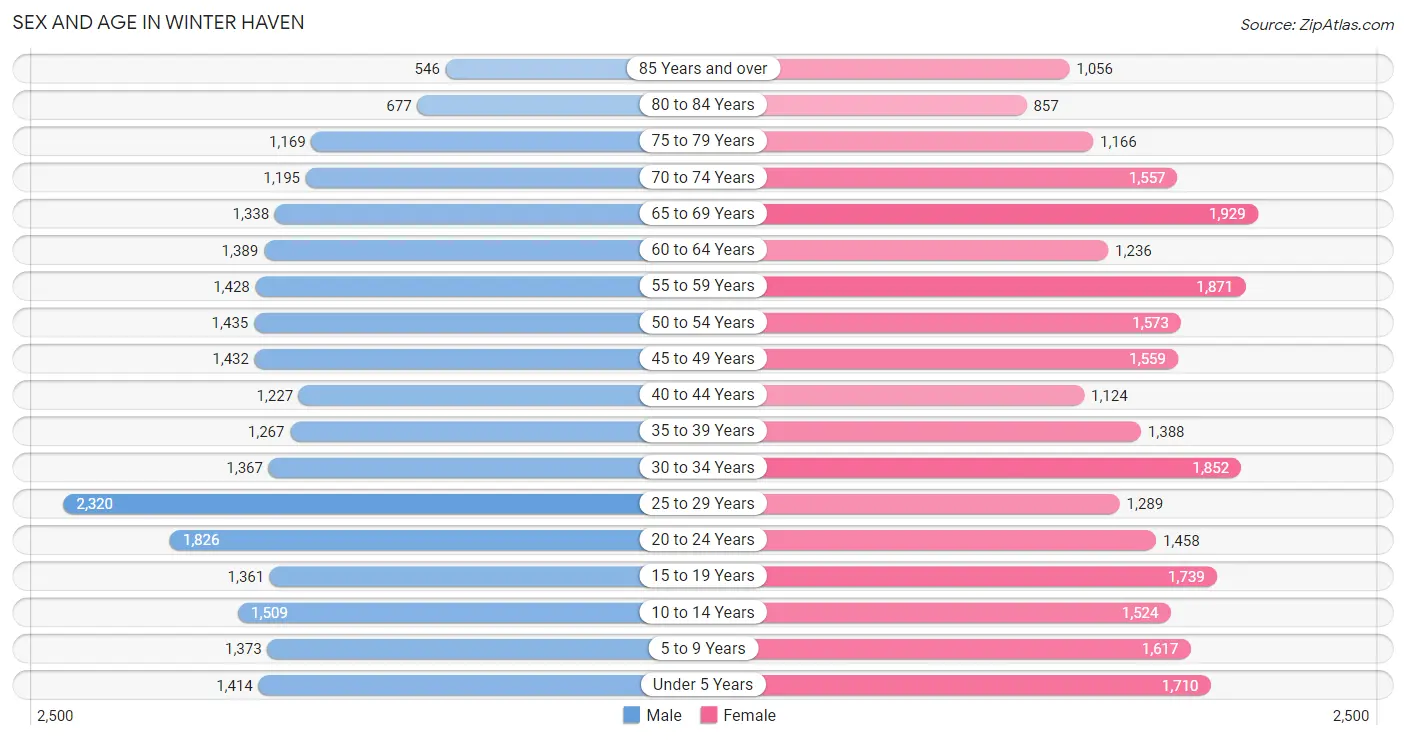
Sex and Age in Winter Haven
Sex and Age in Winter Haven
The most populous age groups in Winter Haven are 25 to 29 Years (2,320 | 9.6%) for men and 65 to 69 Years (1,929 | 7.3%) for women.
| Age Bracket | Male | Female |
| Under 5 Years | 1,414 (5.8%) | 1,710 (6.5%) |
| 5 to 9 Years | 1,373 (5.7%) | 1,617 (6.1%) |
| 10 to 14 Years | 1,509 (6.2%) | 1,524 (5.8%) |
| 15 to 19 Years | 1,361 (5.6%) | 1,739 (6.6%) |
| 20 to 24 Years | 1,826 (7.5%) | 1,458 (5.5%) |
| 25 to 29 Years | 2,320 (9.6%) | 1,289 (4.9%) |
| 30 to 34 Years | 1,367 (5.6%) | 1,852 (7.0%) |
| 35 to 39 Years | 1,267 (5.2%) | 1,388 (5.2%) |
| 40 to 44 Years | 1,227 (5.1%) | 1,124 (4.2%) |
| 45 to 49 Years | 1,432 (5.9%) | 1,559 (5.9%) |
| 50 to 54 Years | 1,435 (5.9%) | 1,573 (5.9%) |
| 55 to 59 Years | 1,428 (5.9%) | 1,871 (7.1%) |
| 60 to 64 Years | 1,389 (5.7%) | 1,236 (4.7%) |
| 65 to 69 Years | 1,338 (5.5%) | 1,929 (7.3%) |
| 70 to 74 Years | 1,195 (4.9%) | 1,557 (5.9%) |
| 75 to 79 Years | 1,169 (4.8%) | 1,166 (4.4%) |
| 80 to 84 Years | 677 (2.8%) | 857 (3.2%) |
| 85 Years and over | 546 (2.2%) | 1,056 (4.0%) |
| Total | 24,273 (100.0%) | 26,505 (100.0%) |
Families and Households in Winter Haven
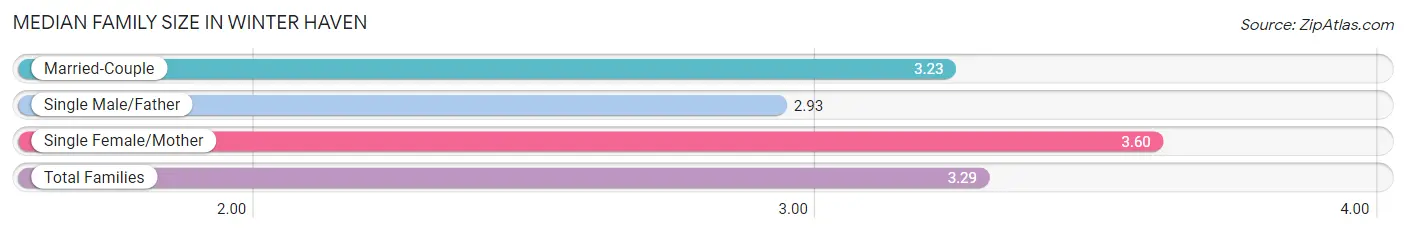
Median Family Size in Winter Haven
The median family size in Winter Haven is 3.29 persons per family, with single female/mother families (2,979 | 23.9%) accounting for the largest median family size of 3.6 persons per family. On the other hand, single male/father families (1,209 | 9.7%) represent the smallest median family size with 2.93 persons per family.
| Family Type | # Families | Family Size |
| Married-Couple | 8,268 (66.4%) | 3.23 |
| Single Male/Father | 1,209 (9.7%) | 2.93 |
| Single Female/Mother | 2,979 (23.9%) | 3.60 |
| Total Families | 12,456 (100.0%) | 3.29 |
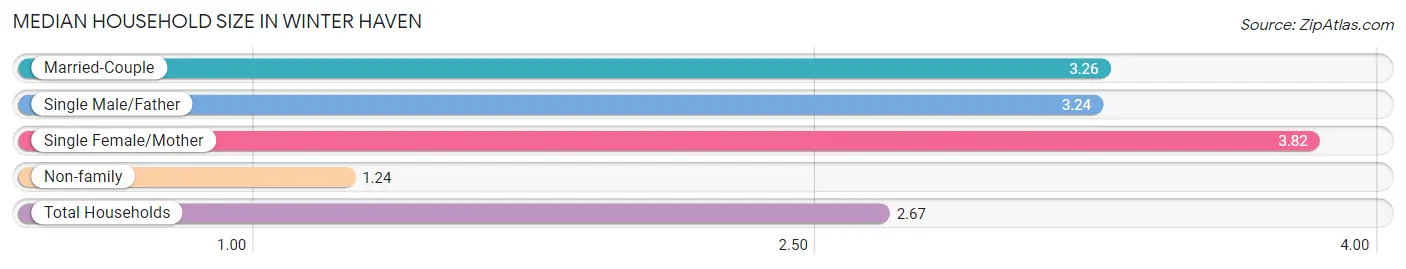
Median Household Size in Winter Haven
The median household size in Winter Haven is 2.67 persons per household, with single female/mother households (2,979 | 15.9%) accounting for the largest median household size of 3.82 persons per household. non-family households (6,285 | 33.5%) represent the smallest median household size with 1.24 persons per household.
| Household Type | # Households | Household Size |
| Married-Couple | 8,268 (44.1%) | 3.26 |
| Single Male/Father | 1,209 (6.5%) | 3.24 |
| Single Female/Mother | 2,979 (15.9%) | 3.82 |
| Non-family | 6,285 (33.5%) | 1.24 |
| Total Households | 18,741 (100.0%) | 2.67 |
Household Size by Marriage Status in Winter Haven
Out of a total of 18,741 households in Winter Haven, 12,456 (66.5%) are family households, while 6,285 (33.5%) are nonfamily households. The most numerous type of family households are 2-person households, comprising 5,935, and the most common type of nonfamily households are 1-person households, comprising 5,134.
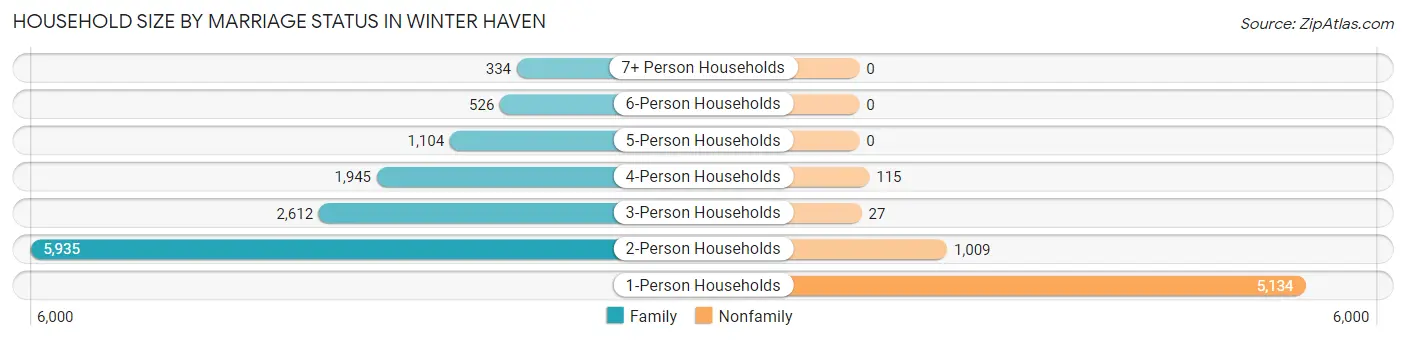
| Household Size | Family Households | Nonfamily Households |
| 1-Person Households | - | 5,134 (27.4%) |
| 2-Person Households | 5,935 (31.7%) | 1,009 (5.4%) |
| 3-Person Households | 2,612 (13.9%) | 27 (0.1%) |
| 4-Person Households | 1,945 (10.4%) | 115 (0.6%) |
| 5-Person Households | 1,104 (5.9%) | 0 (0.0%) |
| 6-Person Households | 526 (2.8%) | 0 (0.0%) |
| 7+ Person Households | 334 (1.8%) | 0 (0.0%) |
| Total | 12,456 (66.5%) | 6,285 (33.5%) |
Female Fertility in Winter Haven
Fertility by Age in Winter Haven
Average fertility rate in Winter Haven is 31.0 births per 1,000 women. Women in the age bracket of 20 to 34 years have the highest fertility rate with 57.0 births per 1,000 women. Women in the age bracket of 20 to 34 years acount for 79.4% of all women with births.
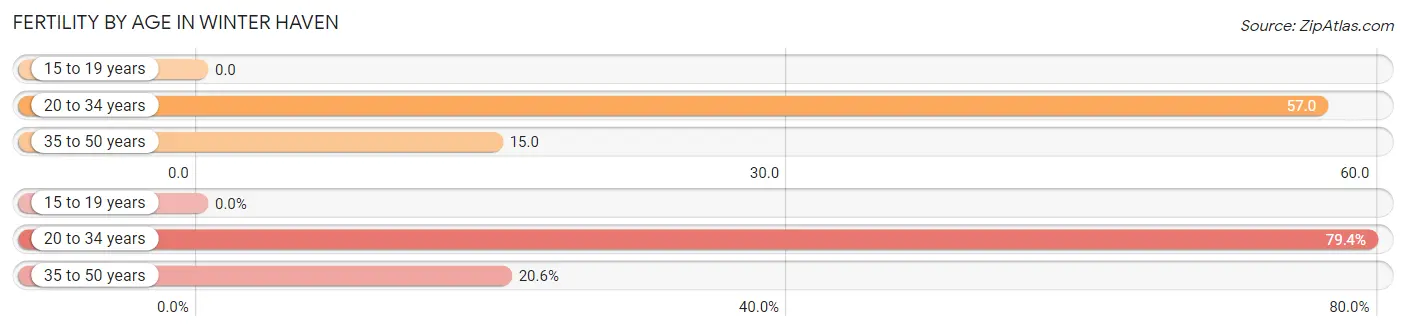
| Age Bracket | Women with Births | Births / 1,000 Women |
| 15 to 19 years | 0 (0.0%) | 0.0 |
| 20 to 34 years | 262 (79.4%) | 57.0 |
| 35 to 50 years | 68 (20.6%) | 15.0 |
| Total | 330 (100.0%) | 31.0 |
Fertility by Age by Marriage Status in Winter Haven
61.5% of women with births (330) in Winter Haven are married. The highest percentage of unmarried women with births falls into 20 to 34 years age bracket with 42.4% of them unmarried at the time of birth, while the lowest percentage of unmarried women with births belong to 35 to 50 years age bracket with 23.5% of them unmarried.
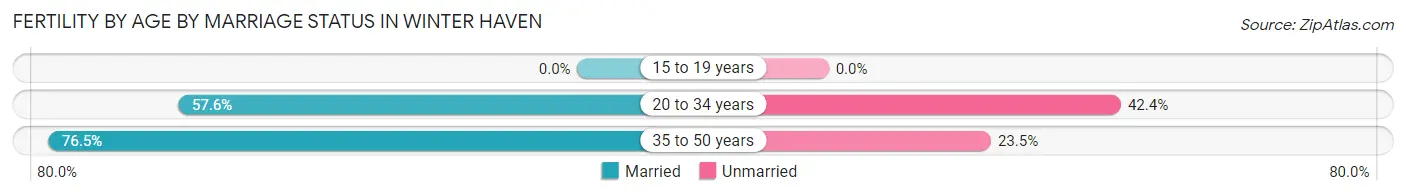
| Age Bracket | Married | Unmarried |
| 15 to 19 years | 0 (0.0%) | 0 (0.0%) |
| 20 to 34 years | 151 (57.6%) | 111 (42.4%) |
| 35 to 50 years | 52 (76.5%) | 16 (23.5%) |
| Total | 203 (61.5%) | 127 (38.5%) |
Fertility by Education in Winter Haven
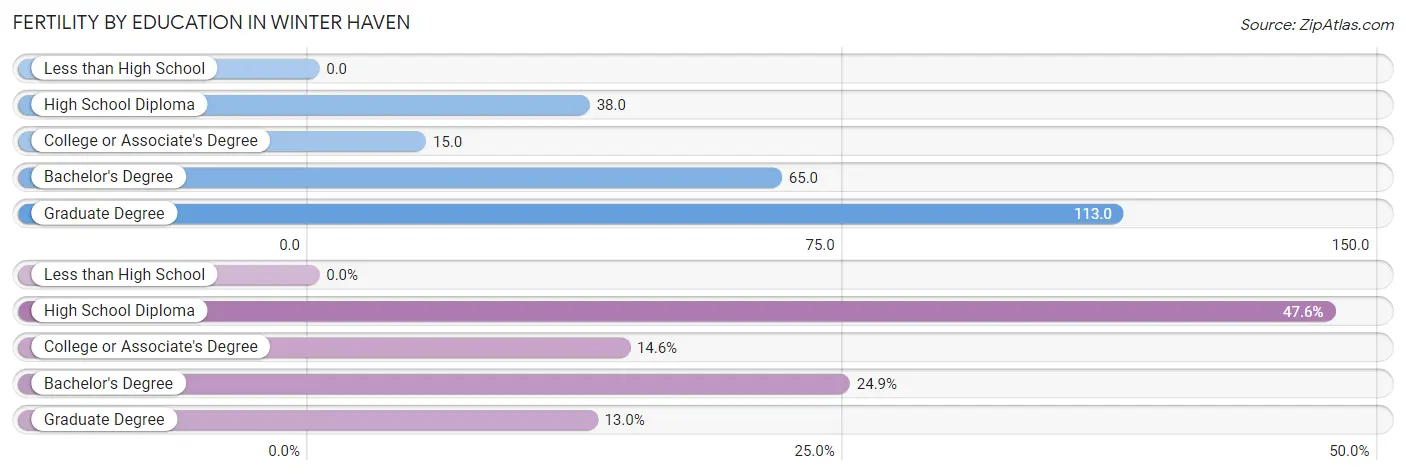
| Educational Attainment | Women with Births | Births / 1,000 Women |
| Less than High School | 0 (0.0%) | 0.0 |
| High School Diploma | 157 (47.6%) | 38.0 |
| College or Associate's Degree | 48 (14.5%) | 15.0 |
| Bachelor's Degree | 82 (24.8%) | 65.0 |
| Graduate Degree | 43 (13.0%) | 113.0 |
| Total | 330 (100.0%) | 31.0 |
Fertility by Education by Marriage Status in Winter Haven
38.5% of women with births in Winter Haven are unmarried. Women with the educational attainment of graduate degree are most likely to be married with 100.0% of them married at childbirth, while women with the educational attainment of college or associate's degree are least likely to be married with 62.5% of them unmarried at childbirth.
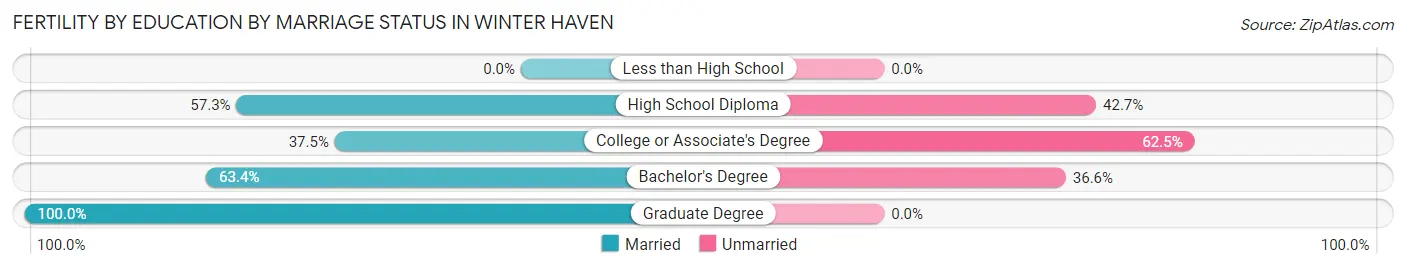
| Educational Attainment | Married | Unmarried |
| Less than High School | 0 (0.0%) | 0 (0.0%) |
| High School Diploma | 90 (57.3%) | 67 (42.7%) |
| College or Associate's Degree | 18 (37.5%) | 30 (62.5%) |
| Bachelor's Degree | 52 (63.4%) | 30 (36.6%) |
| Graduate Degree | 43 (100.0%) | 0 (0.0%) |
| Total | 203 (61.5%) | 127 (38.5%) |
Employment Characteristics in Winter Haven
Employment by Class of Employer in Winter Haven
Among the 21,207 employed individuals in Winter Haven, private company employees (15,947 | 75.2%), local government employees (1,550 | 7.3%), and not-for-profit organizations (1,356 | 6.4%) make up the most common classes of employment.
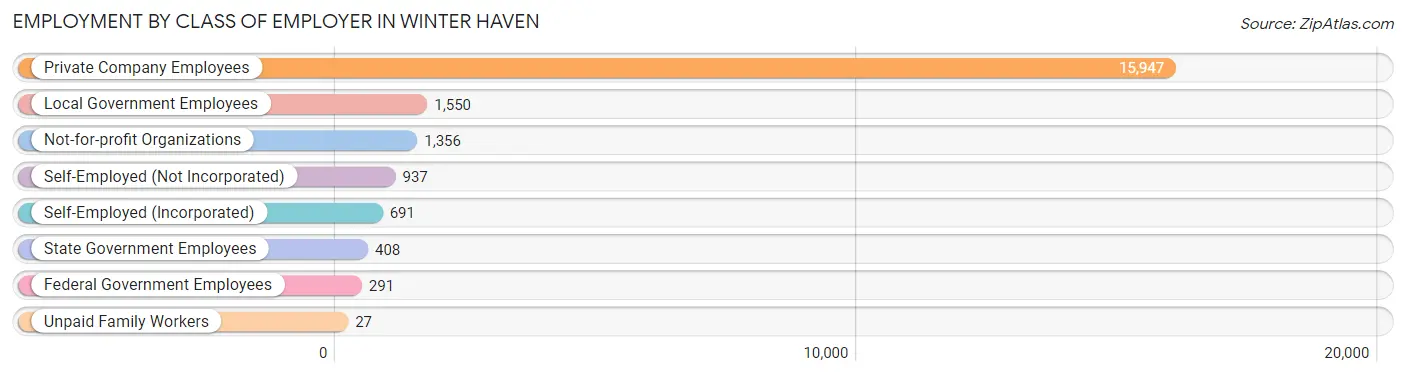
| Employer Class | # Employees | % Employees |
| Private Company Employees | 15,947 | 75.2% |
| Self-Employed (Incorporated) | 691 | 3.3% |
| Self-Employed (Not Incorporated) | 937 | 4.4% |
| Not-for-profit Organizations | 1,356 | 6.4% |
| Local Government Employees | 1,550 | 7.3% |
| State Government Employees | 408 | 1.9% |
| Federal Government Employees | 291 | 1.4% |
| Unpaid Family Workers | 27 | 0.1% |
| Total | 21,207 | 100.0% |
Employment Status by Age in Winter Haven
According to the labor force statistics for Winter Haven, out of the total population over 16 years of age (41,058), 54.3% or 22,294 individuals are in the labor force, with 4.2% or 936 of them unemployed. The age group with the highest labor force participation rate is 35 to 44 years, with 89.6% or 4,485 individuals in the labor force. Within the labor force, the 65 to 74 years age range has the highest percentage of unemployed individuals, with 11.0% or 85 of them being unemployed.
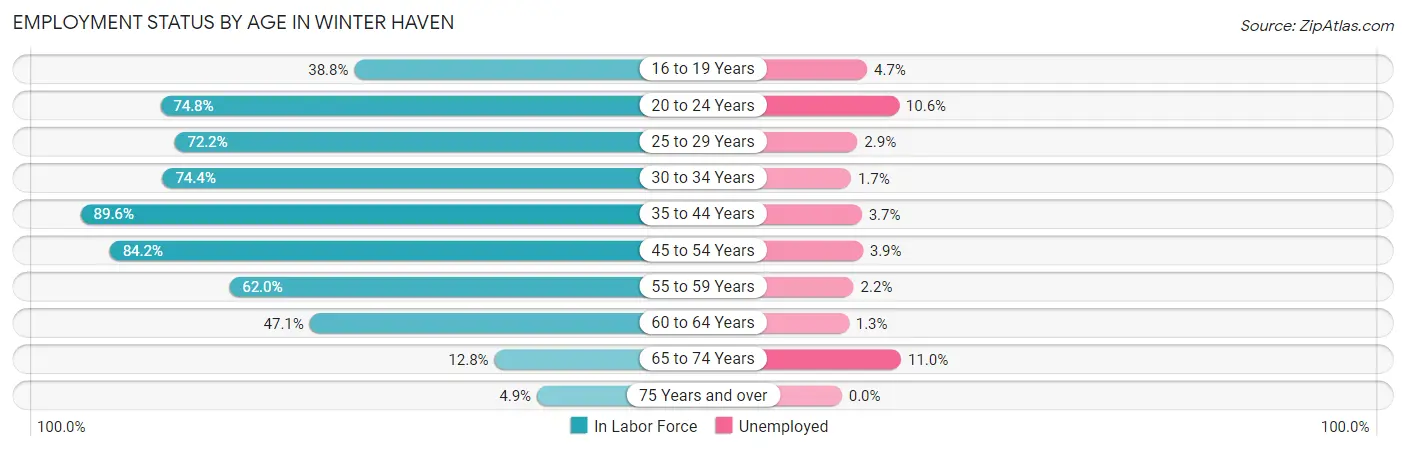
| Age Bracket | In Labor Force | Unemployed |
| 16 to 19 Years | 980 (38.8%) | 46 (4.7%) |
| 20 to 24 Years | 2,456 (74.8%) | 260 (10.6%) |
| 25 to 29 Years | 2,606 (72.2%) | 76 (2.9%) |
| 30 to 34 Years | 2,395 (74.4%) | 41 (1.7%) |
| 35 to 44 Years | 4,485 (89.6%) | 166 (3.7%) |
| 45 to 54 Years | 5,051 (84.2%) | 197 (3.9%) |
| 55 to 59 Years | 2,045 (62.0%) | 45 (2.2%) |
| 60 to 64 Years | 1,236 (47.1%) | 16 (1.3%) |
| 65 to 74 Years | 770 (12.8%) | 85 (11.0%) |
| 75 Years and over | 268 (4.9%) | 0 (0.0%) |
| Total | 22,294 (54.3%) | 936 (4.2%) |
Employment Status by Educational Attainment in Winter Haven
According to labor force statistics for Winter Haven, 75.0% of individuals (17,818) out of the total population between 25 and 64 years of age (23,757) are in the labor force, with 3.0% or 535 of them being unemployed. The group with the highest labor force participation rate are those with the educational attainment of bachelor's degree or higher, with 81.4% or 3,534 individuals in the labor force. Within the labor force, individuals with less than high school education have the highest percentage of unemployment, with 8.0% or 114 of them being unemployed.
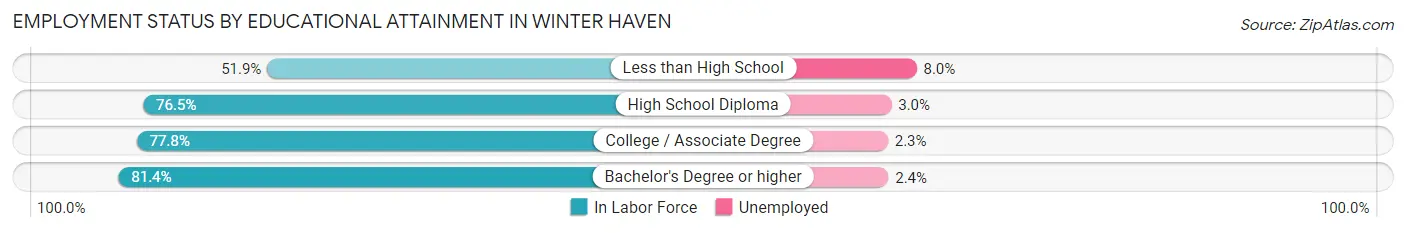
| Educational Attainment | In Labor Force | Unemployed |
| Less than High School | 1,431 (51.9%) | 221 (8.0%) |
| High School Diploma | 6,769 (76.5%) | 265 (3.0%) |
| College / Associate Degree | 6,076 (77.8%) | 180 (2.3%) |
| Bachelor's Degree or higher | 3,534 (81.4%) | 104 (2.4%) |
| Total | 17,818 (75.0%) | 713 (3.0%) |
Employment Occupations by Sex in Winter Haven
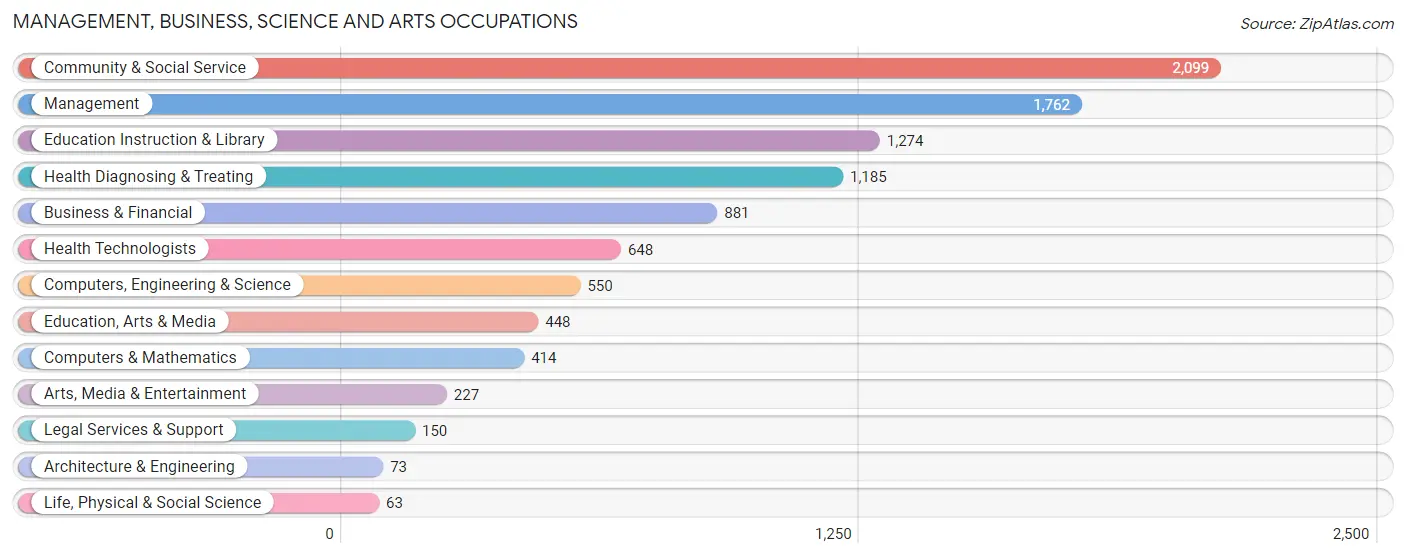
Management, Business, Science and Arts Occupations
The most common Management, Business, Science and Arts occupations in Winter Haven are Community & Social Service (2,099 | 9.8%), Management (1,762 | 8.3%), Education Instruction & Library (1,274 | 6.0%), Health Diagnosing & Treating (1,185 | 5.6%), and Business & Financial (881 | 4.1%).
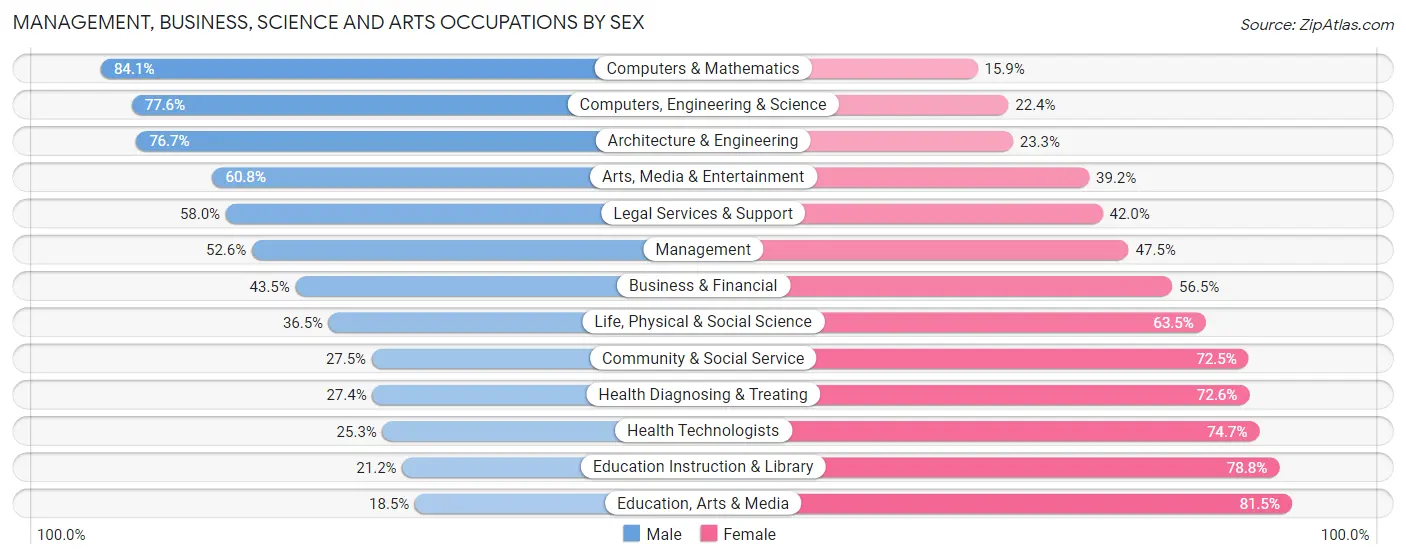
Management, Business, Science and Arts Occupations by Sex
Within the Management, Business, Science and Arts occupations in Winter Haven, the most male-oriented occupations are Computers & Mathematics (84.1%), Computers, Engineering & Science (77.6%), and Architecture & Engineering (76.7%), while the most female-oriented occupations are Education, Arts & Media (81.5%), Education Instruction & Library (78.8%), and Health Technologists (74.7%).
| Occupation | Male | Female |
| Management | 926 (52.5%) | 836 (47.4%) |
| Business & Financial | 383 (43.5%) | 498 (56.5%) |
| Computers, Engineering & Science | 427 (77.6%) | 123 (22.4%) |
| Computers & Mathematics | 348 (84.1%) | 66 (15.9%) |
| Architecture & Engineering | 56 (76.7%) | 17 (23.3%) |
| Life, Physical & Social Science | 23 (36.5%) | 40 (63.5%) |
| Community & Social Service | 578 (27.5%) | 1,521 (72.5%) |
| Education, Arts & Media | 83 (18.5%) | 365 (81.5%) |
| Legal Services & Support | 87 (58.0%) | 63 (42.0%) |
| Education Instruction & Library | 270 (21.2%) | 1,004 (78.8%) |
| Arts, Media & Entertainment | 138 (60.8%) | 89 (39.2%) |
| Health Diagnosing & Treating | 325 (27.4%) | 860 (72.6%) |
| Health Technologists | 164 (25.3%) | 484 (74.7%) |
| Total (Category) | 2,639 (40.7%) | 3,838 (59.3%) |
| Total (Overall) | 11,642 (54.5%) | 9,701 (45.5%) |
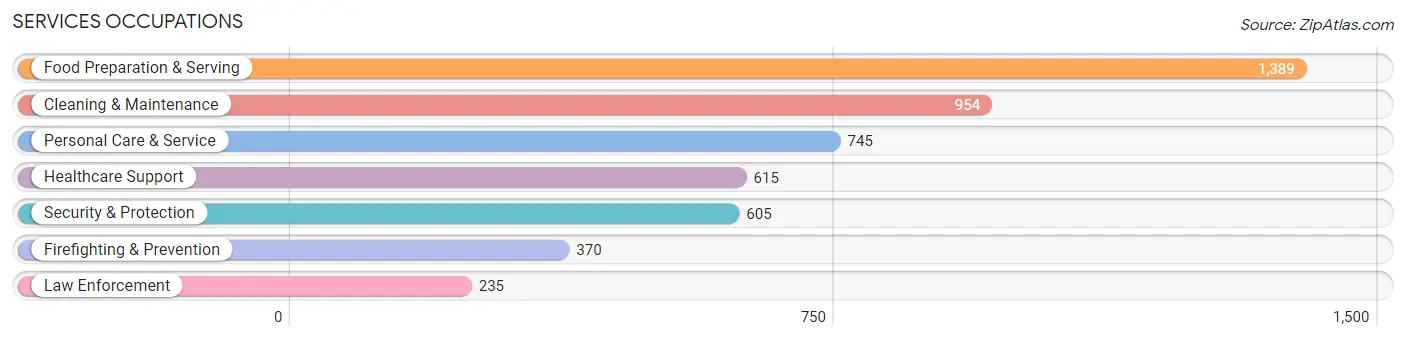
Services Occupations
The most common Services occupations in Winter Haven are Food Preparation & Serving (1,389 | 6.5%), Cleaning & Maintenance (954 | 4.5%), Personal Care & Service (745 | 3.5%), Healthcare Support (615 | 2.9%), and Security & Protection (605 | 2.8%).
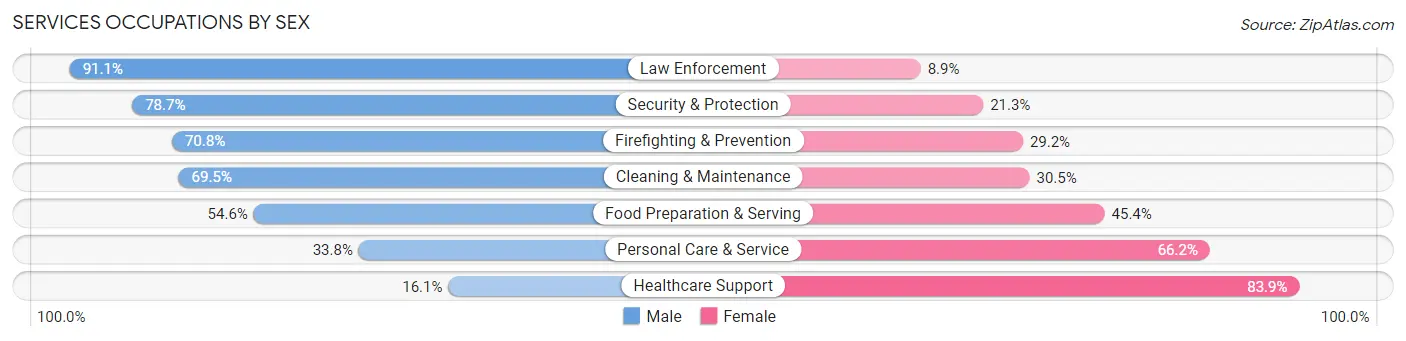
Services Occupations by Sex
Within the Services occupations in Winter Haven, the most male-oriented occupations are Law Enforcement (91.1%), Security & Protection (78.7%), and Firefighting & Prevention (70.8%), while the most female-oriented occupations are Healthcare Support (83.9%), Personal Care & Service (66.2%), and Food Preparation & Serving (45.4%).
| Occupation | Male | Female |
| Healthcare Support | 99 (16.1%) | 516 (83.9%) |
| Security & Protection | 476 (78.7%) | 129 (21.3%) |
| Firefighting & Prevention | 262 (70.8%) | 108 (29.2%) |
| Law Enforcement | 214 (91.1%) | 21 (8.9%) |
| Food Preparation & Serving | 759 (54.6%) | 630 (45.4%) |
| Cleaning & Maintenance | 663 (69.5%) | 291 (30.5%) |
| Personal Care & Service | 252 (33.8%) | 493 (66.2%) |
| Total (Category) | 2,249 (52.2%) | 2,059 (47.8%) |
| Total (Overall) | 11,642 (54.5%) | 9,701 (45.5%) |
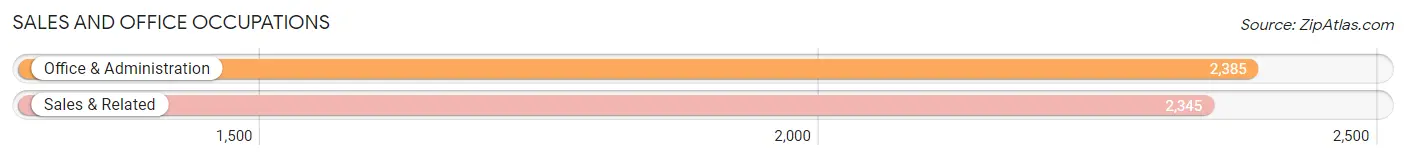
Sales and Office Occupations
The most common Sales and Office occupations in Winter Haven are Office & Administration (2,385 | 11.2%), and Sales & Related (2,345 | 11.0%).
Sales and Office Occupations by Sex
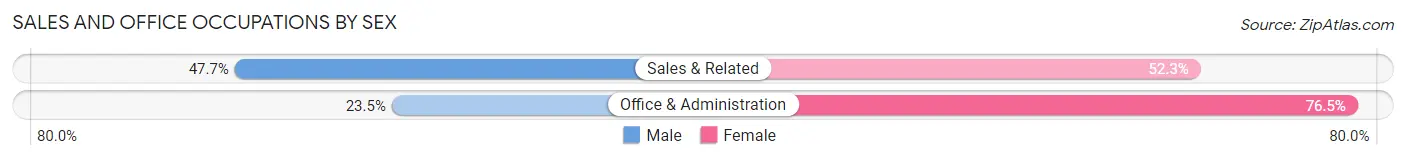
| Occupation | Male | Female |
| Sales & Related | 1,118 (47.7%) | 1,227 (52.3%) |
| Office & Administration | 561 (23.5%) | 1,824 (76.5%) |
| Total (Category) | 1,679 (35.5%) | 3,051 (64.5%) |
| Total (Overall) | 11,642 (54.5%) | 9,701 (45.5%) |
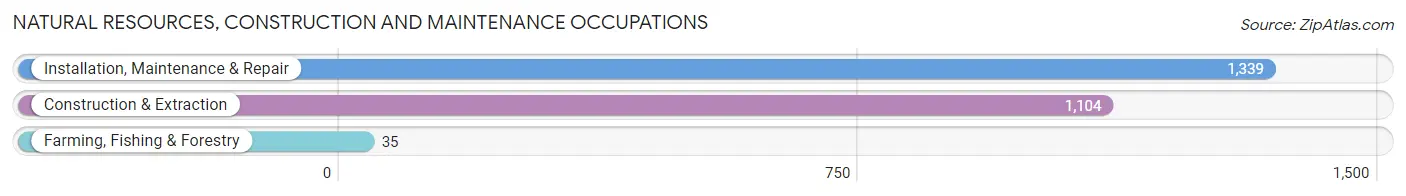
Natural Resources, Construction and Maintenance Occupations
The most common Natural Resources, Construction and Maintenance occupations in Winter Haven are Installation, Maintenance & Repair (1,339 | 6.3%), Construction & Extraction (1,104 | 5.2%), and Farming, Fishing & Forestry (35 | 0.2%).
Natural Resources, Construction and Maintenance Occupations by Sex
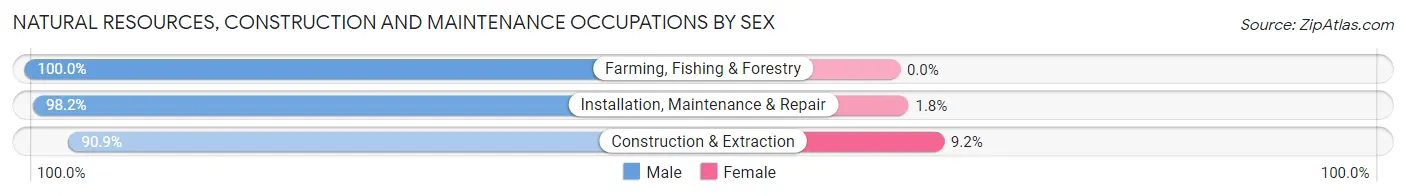
| Occupation | Male | Female |
| Farming, Fishing & Forestry | 35 (100.0%) | 0 (0.0%) |
| Construction & Extraction | 1,003 (90.8%) | 101 (9.1%) |
| Installation, Maintenance & Repair | 1,315 (98.2%) | 24 (1.8%) |
| Total (Category) | 2,353 (95.0%) | 125 (5.0%) |
| Total (Overall) | 11,642 (54.5%) | 9,701 (45.5%) |
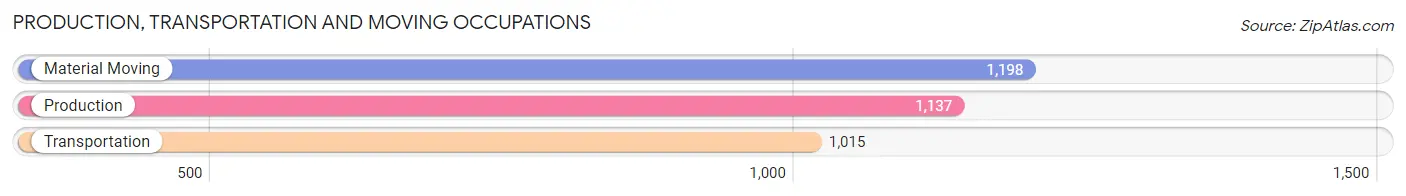
Production, Transportation and Moving Occupations
The most common Production, Transportation and Moving occupations in Winter Haven are Material Moving (1,198 | 5.6%), Production (1,137 | 5.3%), and Transportation (1,015 | 4.8%).
Production, Transportation and Moving Occupations by Sex
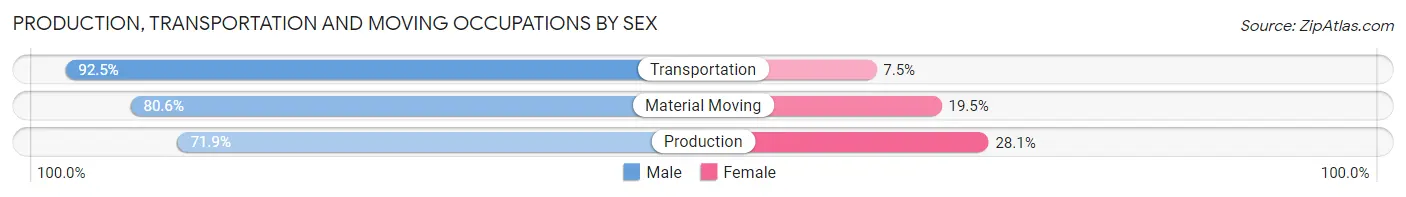
| Occupation | Male | Female |
| Production | 818 (71.9%) | 319 (28.1%) |
| Transportation | 939 (92.5%) | 76 (7.5%) |
| Material Moving | 965 (80.5%) | 233 (19.5%) |
| Total (Category) | 2,722 (81.2%) | 628 (18.8%) |
| Total (Overall) | 11,642 (54.5%) | 9,701 (45.5%) |
Employment Industries by Sex in Winter Haven
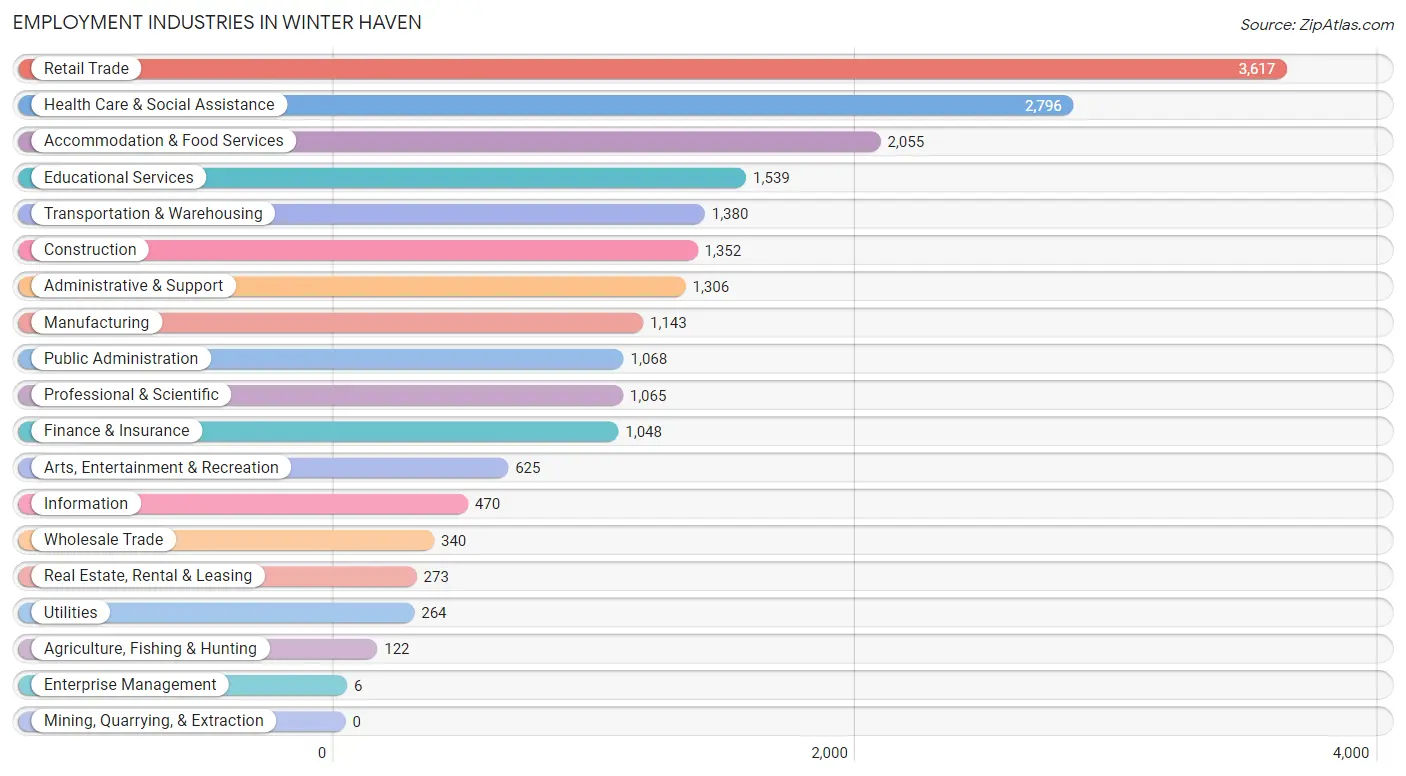
Employment Industries in Winter Haven
The major employment industries in Winter Haven include Retail Trade (3,617 | 17.0%), Health Care & Social Assistance (2,796 | 13.1%), Accommodation & Food Services (2,055 | 9.6%), Educational Services (1,539 | 7.2%), and Transportation & Warehousing (1,380 | 6.5%).
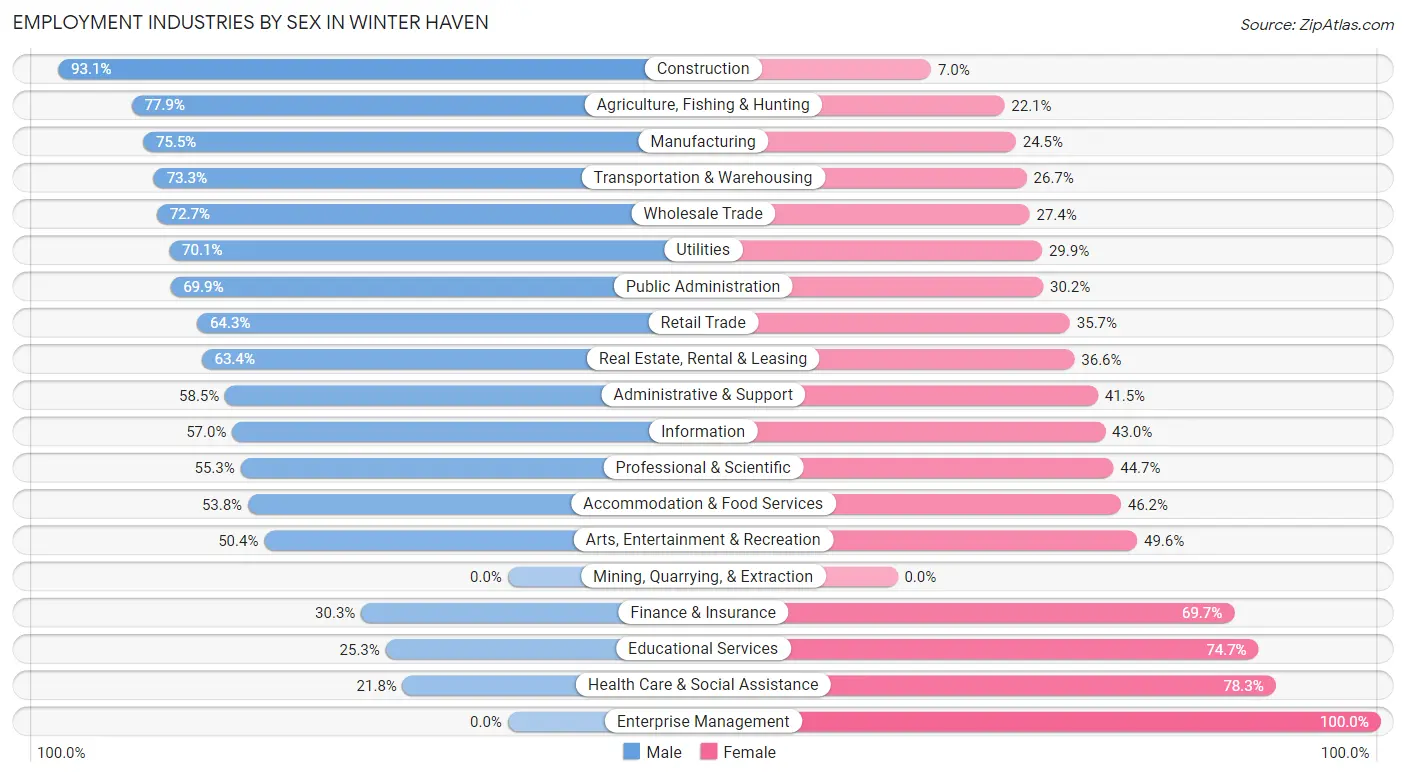
Employment Industries by Sex in Winter Haven
The Winter Haven industries that see more men than women are Construction (93.0%), Agriculture, Fishing & Hunting (77.9%), and Manufacturing (75.5%), whereas the industries that tend to have a higher number of women are Enterprise Management (100.0%), Health Care & Social Assistance (78.2%), and Educational Services (74.7%).
| Industry | Male | Female |
| Agriculture, Fishing & Hunting | 95 (77.9%) | 27 (22.1%) |
| Mining, Quarrying, & Extraction | 0 (0.0%) | 0 (0.0%) |
| Construction | 1,258 (93.0%) | 94 (7.0%) |
| Manufacturing | 863 (75.5%) | 280 (24.5%) |
| Wholesale Trade | 247 (72.7%) | 93 (27.4%) |
| Retail Trade | 2,326 (64.3%) | 1,291 (35.7%) |
| Transportation & Warehousing | 1,011 (73.3%) | 369 (26.7%) |
| Utilities | 185 (70.1%) | 79 (29.9%) |
| Information | 268 (57.0%) | 202 (43.0%) |
| Finance & Insurance | 318 (30.3%) | 730 (69.7%) |
| Real Estate, Rental & Leasing | 173 (63.4%) | 100 (36.6%) |
| Professional & Scientific | 589 (55.3%) | 476 (44.7%) |
| Enterprise Management | 0 (0.0%) | 6 (100.0%) |
| Administrative & Support | 764 (58.5%) | 542 (41.5%) |
| Educational Services | 389 (25.3%) | 1,150 (74.7%) |
| Health Care & Social Assistance | 608 (21.7%) | 2,188 (78.2%) |
| Arts, Entertainment & Recreation | 315 (50.4%) | 310 (49.6%) |
| Accommodation & Food Services | 1,105 (53.8%) | 950 (46.2%) |
| Public Administration | 746 (69.9%) | 322 (30.1%) |
| Total | 11,642 (54.5%) | 9,701 (45.5%) |
Education in Winter Haven
School Enrollment in Winter Haven
The most common levels of schooling among the 10,072 students in Winter Haven are middle school (2,474 | 24.6%), high school (2,250 | 22.3%), and elementary school (2,138 | 21.2%).
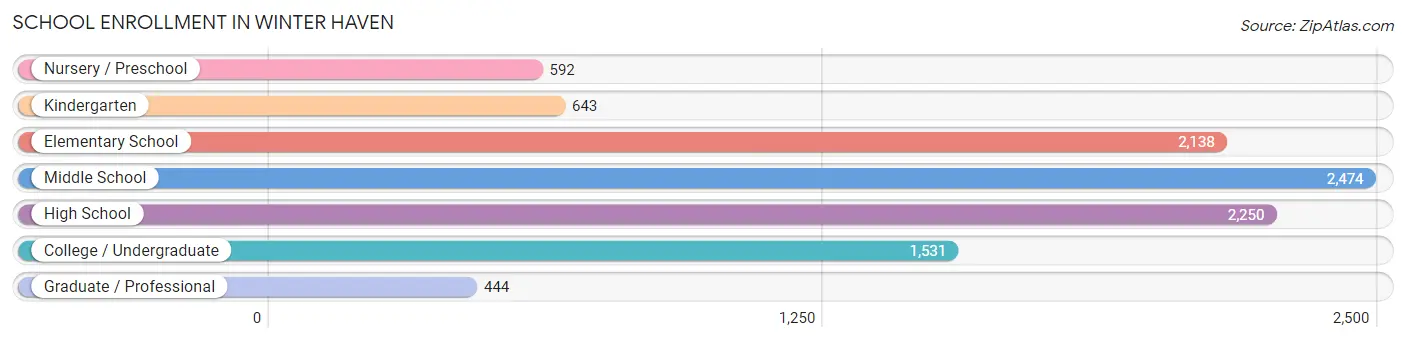
| School Level | # Students | % Students |
| Nursery / Preschool | 592 | 5.9% |
| Kindergarten | 643 | 6.4% |
| Elementary School | 2,138 | 21.2% |
| Middle School | 2,474 | 24.6% |
| High School | 2,250 | 22.3% |
| College / Undergraduate | 1,531 | 15.2% |
| Graduate / Professional | 444 | 4.4% |
| Total | 10,072 | 100.0% |
School Enrollment by Age by Funding Source in Winter Haven
Out of a total of 10,072 students who are enrolled in schools in Winter Haven, 1,561 (15.5%) attend a private institution, while the remaining 8,511 (84.5%) are enrolled in public schools. The age group of 35 years and over has the highest likelihood of being enrolled in private schools, with 216 (44.7% in the age bracket) enrolled. Conversely, the age group of 25 to 34 year olds has the lowest likelihood of being enrolled in a private school, with 637 (90.9% in the age bracket) attending a public institution.
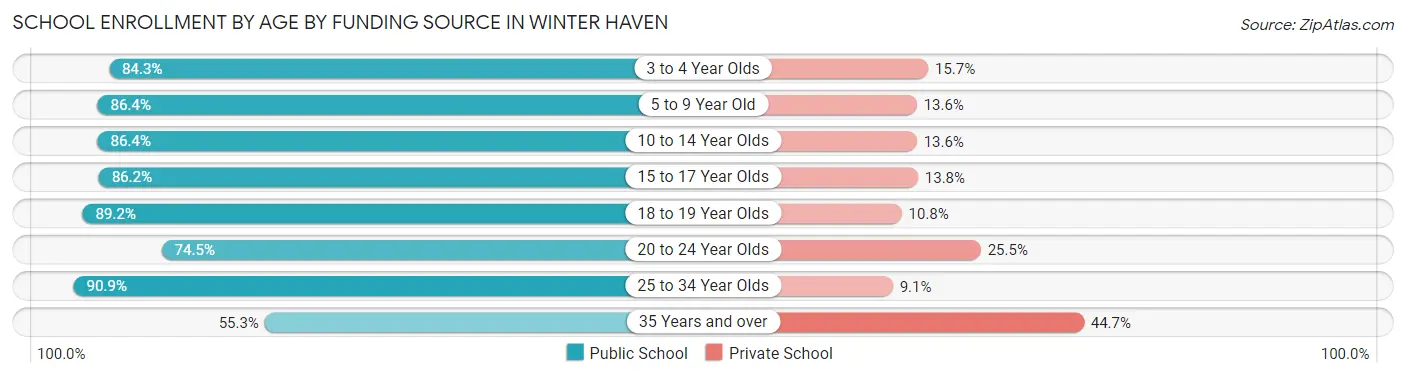
| Age Bracket | Public School | Private School |
| 3 to 4 Year Olds | 445 (84.3%) | 83 (15.7%) |
| 5 to 9 Year Old | 2,318 (86.4%) | 365 (13.6%) |
| 10 to 14 Year Olds | 2,561 (86.4%) | 403 (13.6%) |
| 15 to 17 Year Olds | 1,465 (86.2%) | 235 (13.8%) |
| 18 to 19 Year Olds | 397 (89.2%) | 48 (10.8%) |
| 20 to 24 Year Olds | 423 (74.5%) | 145 (25.5%) |
| 25 to 34 Year Olds | 637 (90.9%) | 64 (9.1%) |
| 35 Years and over | 267 (55.3%) | 216 (44.7%) |
| Total | 8,511 (84.5%) | 1,561 (15.5%) |
Educational Attainment by Field of Study in Winter Haven
Business (1,805 | 24.2%), education (1,174 | 15.8%), science & technology (1,028 | 13.8%), arts & humanities (619 | 8.3%), and bio, nature & agricultural (501 | 6.7%) are the most common fields of study among 7,456 individuals in Winter Haven who have obtained a bachelor's degree or higher.
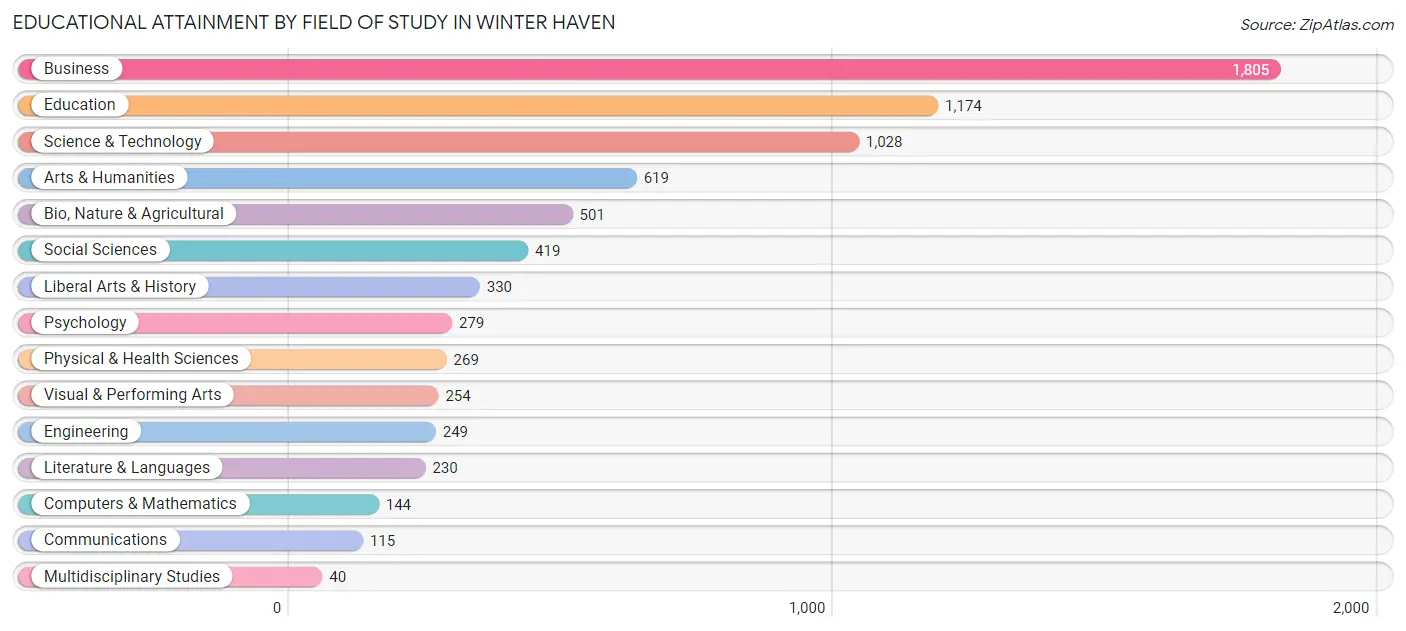
| Field of Study | # Graduates | % Graduates |
| Computers & Mathematics | 144 | 1.9% |
| Bio, Nature & Agricultural | 501 | 6.7% |
| Physical & Health Sciences | 269 | 3.6% |
| Psychology | 279 | 3.7% |
| Social Sciences | 419 | 5.6% |
| Engineering | 249 | 3.3% |
| Multidisciplinary Studies | 40 | 0.5% |
| Science & Technology | 1,028 | 13.8% |
| Business | 1,805 | 24.2% |
| Education | 1,174 | 15.8% |
| Literature & Languages | 230 | 3.1% |
| Liberal Arts & History | 330 | 4.4% |
| Visual & Performing Arts | 254 | 3.4% |
| Communications | 115 | 1.5% |
| Arts & Humanities | 619 | 8.3% |
| Total | 7,456 | 100.0% |
Transportation & Commute in Winter Haven
Vehicle Availability by Sex in Winter Haven
The most prevalent vehicle ownership categories in Winter Haven are males with 2 vehicles (5,443, accounting for 47.1%) and females with 2 vehicles (3,968, making up 56.4%).
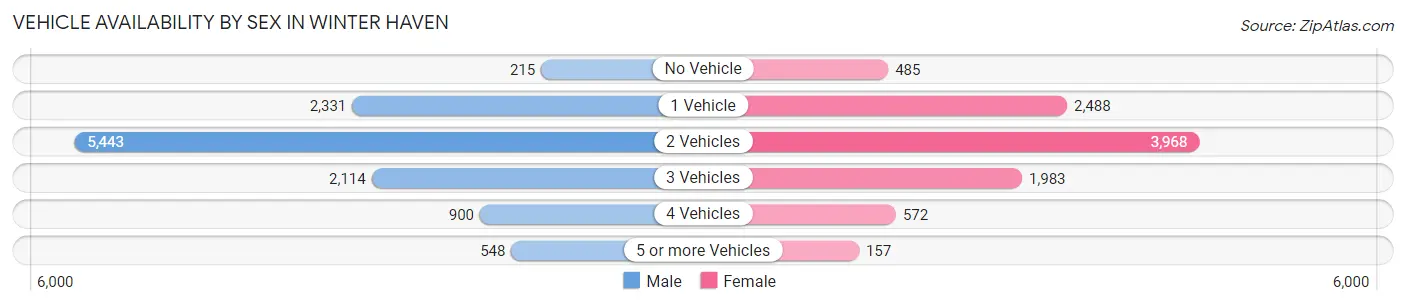
| Vehicles Available | Male | Female |
| No Vehicle | 215 (1.9%) | 485 (5.0%) |
| 1 Vehicle | 2,331 (20.2%) | 2,488 (25.8%) |
| 2 Vehicles | 5,443 (47.1%) | 3,968 (41.1%) |
| 3 Vehicles | 2,114 (18.3%) | 1,983 (20.5%) |
| 4 Vehicles | 900 (7.8%) | 572 (5.9%) |
| 5 or more Vehicles | 548 (4.7%) | 157 (1.6%) |
| Total | 11,551 (100.0%) | 9,653 (100.0%) |
Commute Time in Winter Haven
The most frequently occuring commute durations in Winter Haven are 15 to 19 minutes (3,657 commuters, 18.9%), 20 to 24 minutes (3,121 commuters, 16.1%), and 5 to 9 minutes (2,113 commuters, 10.9%).

| Commute Time | # Commuters | % Commuters |
| Less than 5 Minutes | 491 | 2.5% |
| 5 to 9 Minutes | 2,113 | 10.9% |
| 10 to 14 Minutes | 1,599 | 8.2% |
| 15 to 19 Minutes | 3,657 | 18.9% |
| 20 to 24 Minutes | 3,121 | 16.1% |
| 25 to 29 Minutes | 1,180 | 6.1% |
| 30 to 34 Minutes | 1,987 | 10.2% |
| 35 to 39 Minutes | 677 | 3.5% |
| 40 to 44 Minutes | 917 | 4.7% |
| 45 to 59 Minutes | 1,791 | 9.2% |
| 60 to 89 Minutes | 1,268 | 6.5% |
| 90 or more Minutes | 603 | 3.1% |
Commute Time by Sex in Winter Haven
The most common commute times in Winter Haven are 15 to 19 minutes (1,932 commuters, 17.7%) for males and 15 to 19 minutes (1,725 commuters, 20.3%) for females.
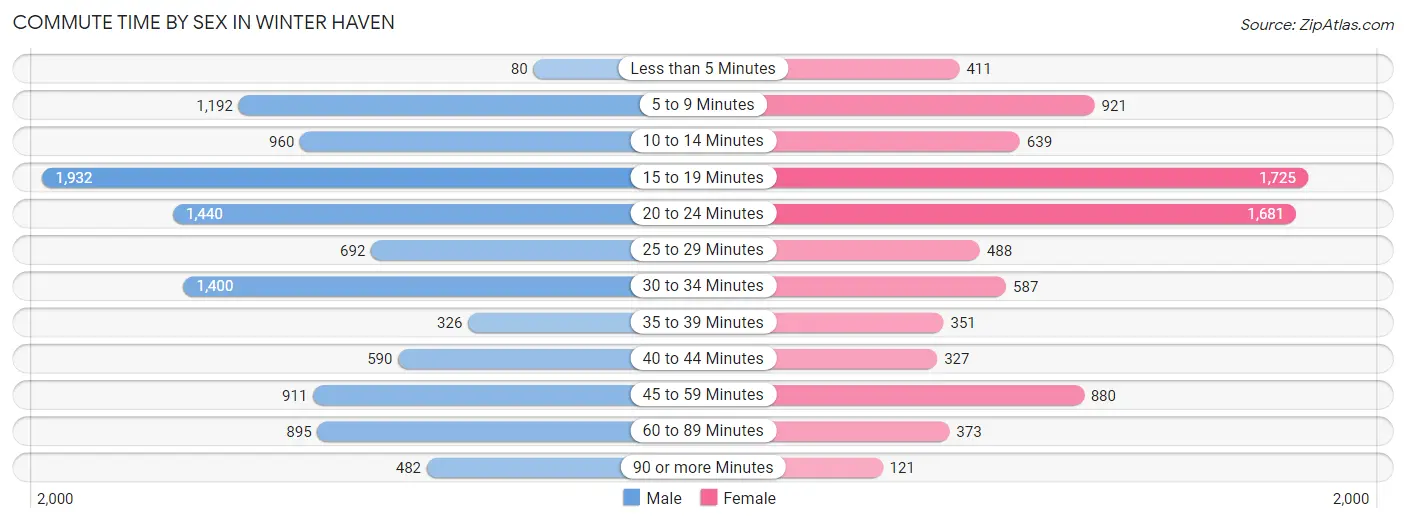
| Commute Time | Male | Female |
| Less than 5 Minutes | 80 (0.7%) | 411 (4.8%) |
| 5 to 9 Minutes | 1,192 (10.9%) | 921 (10.8%) |
| 10 to 14 Minutes | 960 (8.8%) | 639 (7.5%) |
| 15 to 19 Minutes | 1,932 (17.7%) | 1,725 (20.3%) |
| 20 to 24 Minutes | 1,440 (13.2%) | 1,681 (19.8%) |
| 25 to 29 Minutes | 692 (6.4%) | 488 (5.7%) |
| 30 to 34 Minutes | 1,400 (12.8%) | 587 (6.9%) |
| 35 to 39 Minutes | 326 (3.0%) | 351 (4.1%) |
| 40 to 44 Minutes | 590 (5.4%) | 327 (3.8%) |
| 45 to 59 Minutes | 911 (8.4%) | 880 (10.3%) |
| 60 to 89 Minutes | 895 (8.2%) | 373 (4.4%) |
| 90 or more Minutes | 482 (4.4%) | 121 (1.4%) |
Time of Departure to Work by Sex in Winter Haven
The most frequent times of departure to work in Winter Haven are 7:00 AM to 7:29 AM (1,535, 14.1%) for males and 7:00 AM to 7:29 AM (1,531, 18.0%) for females.
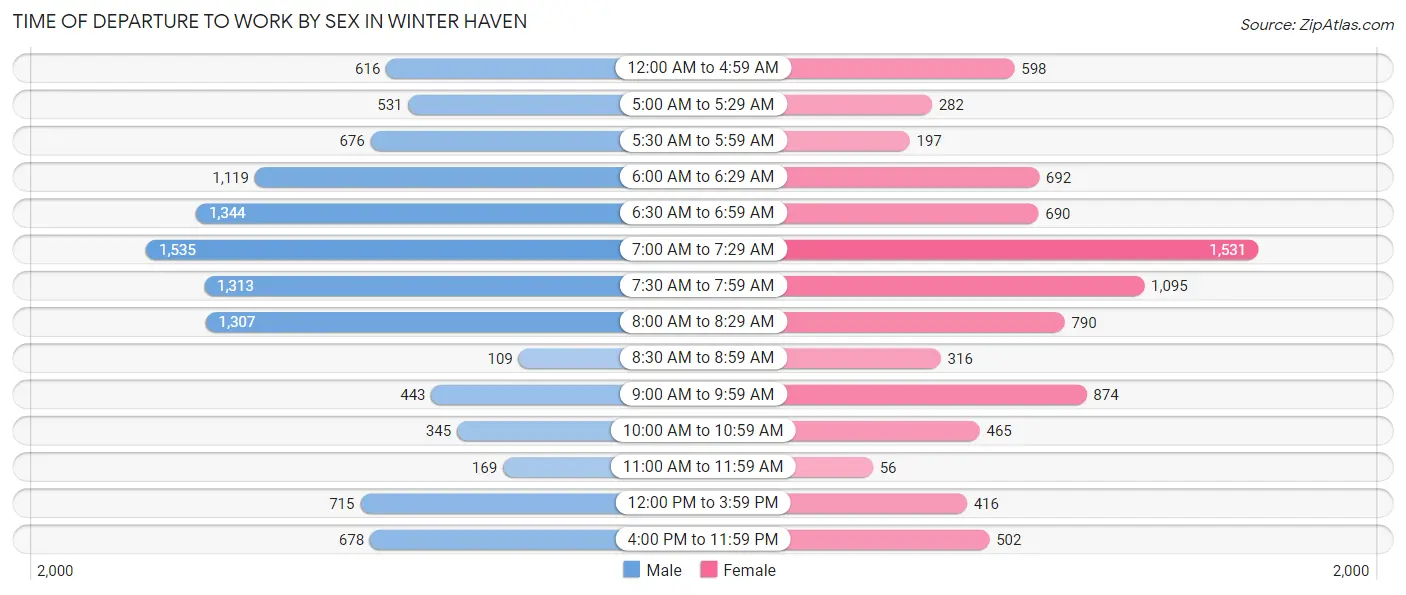
| Time of Departure | Male | Female |
| 12:00 AM to 4:59 AM | 616 (5.7%) | 598 (7.0%) |
| 5:00 AM to 5:29 AM | 531 (4.9%) | 282 (3.3%) |
| 5:30 AM to 5:59 AM | 676 (6.2%) | 197 (2.3%) |
| 6:00 AM to 6:29 AM | 1,119 (10.3%) | 692 (8.1%) |
| 6:30 AM to 6:59 AM | 1,344 (12.3%) | 690 (8.1%) |
| 7:00 AM to 7:29 AM | 1,535 (14.1%) | 1,531 (18.0%) |
| 7:30 AM to 7:59 AM | 1,313 (12.0%) | 1,095 (12.9%) |
| 8:00 AM to 8:29 AM | 1,307 (12.0%) | 790 (9.3%) |
| 8:30 AM to 8:59 AM | 109 (1.0%) | 316 (3.7%) |
| 9:00 AM to 9:59 AM | 443 (4.1%) | 874 (10.3%) |
| 10:00 AM to 10:59 AM | 345 (3.2%) | 465 (5.5%) |
| 11:00 AM to 11:59 AM | 169 (1.5%) | 56 (0.7%) |
| 12:00 PM to 3:59 PM | 715 (6.6%) | 416 (4.9%) |
| 4:00 PM to 11:59 PM | 678 (6.2%) | 502 (5.9%) |
| Total | 10,900 (100.0%) | 8,504 (100.0%) |
Housing Occupancy in Winter Haven
Occupancy by Ownership in Winter Haven
Of the total 18,741 dwellings in Winter Haven, owner-occupied units account for 11,812 (63.0%), while renter-occupied units make up 6,929 (37.0%).
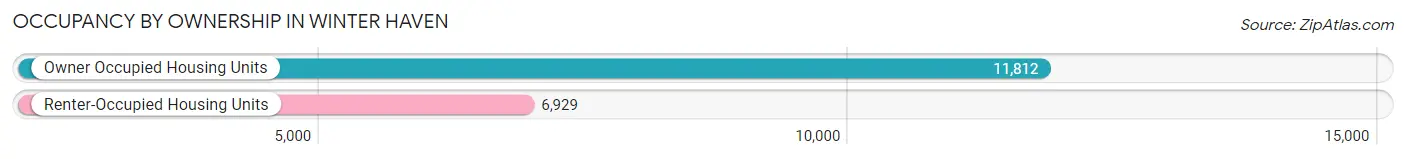
| Occupancy | # Housing Units | % Housing Units |
| Owner Occupied Housing Units | 11,812 | 63.0% |
| Renter-Occupied Housing Units | 6,929 | 37.0% |
| Total Occupied Housing Units | 18,741 | 100.0% |
Occupancy by Household Size in Winter Haven
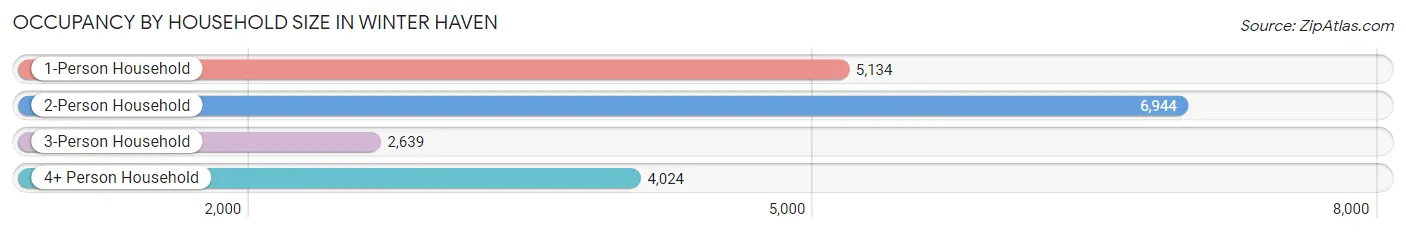
| Household Size | # Housing Units | % Housing Units |
| 1-Person Household | 5,134 | 27.4% |
| 2-Person Household | 6,944 | 37.0% |
| 3-Person Household | 2,639 | 14.1% |
| 4+ Person Household | 4,024 | 21.5% |
| Total Housing Units | 18,741 | 100.0% |
Occupancy by Ownership by Household Size in Winter Haven
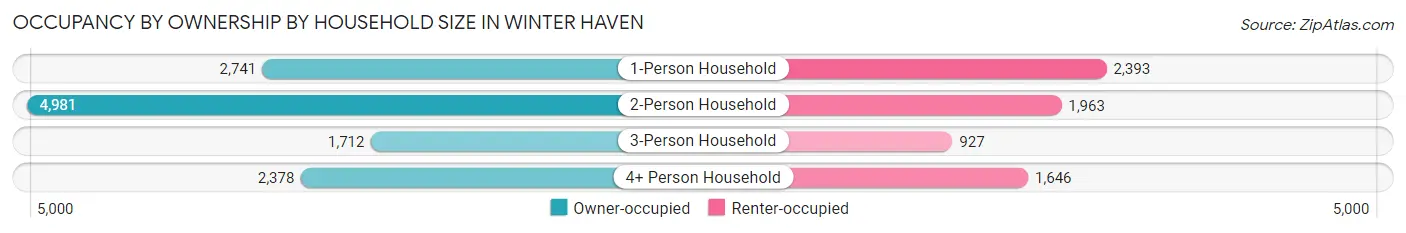
| Household Size | Owner-occupied | Renter-occupied |
| 1-Person Household | 2,741 (53.4%) | 2,393 (46.6%) |
| 2-Person Household | 4,981 (71.7%) | 1,963 (28.3%) |
| 3-Person Household | 1,712 (64.9%) | 927 (35.1%) |
| 4+ Person Household | 2,378 (59.1%) | 1,646 (40.9%) |
| Total Housing Units | 11,812 (63.0%) | 6,929 (37.0%) |
Occupancy by Educational Attainment in Winter Haven
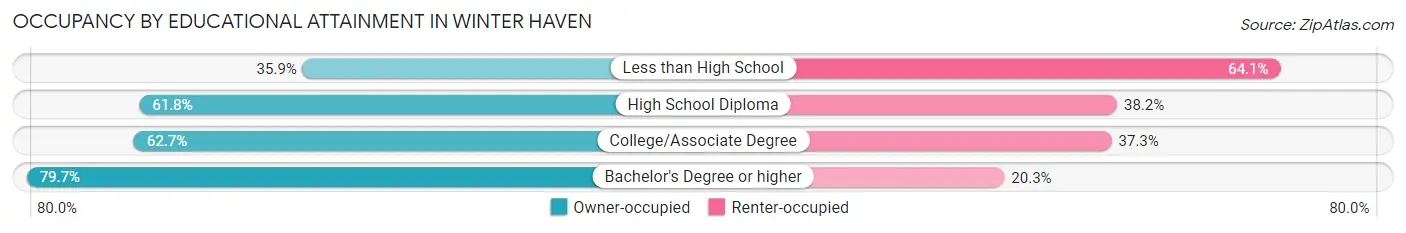
| Household Size | Owner-occupied | Renter-occupied |
| Less than High School | 798 (35.9%) | 1,425 (64.1%) |
| High School Diploma | 3,395 (61.8%) | 2,099 (38.2%) |
| College/Associate Degree | 4,286 (62.7%) | 2,554 (37.3%) |
| Bachelor's Degree or higher | 3,333 (79.7%) | 851 (20.3%) |
Occupancy by Age of Householder in Winter Haven
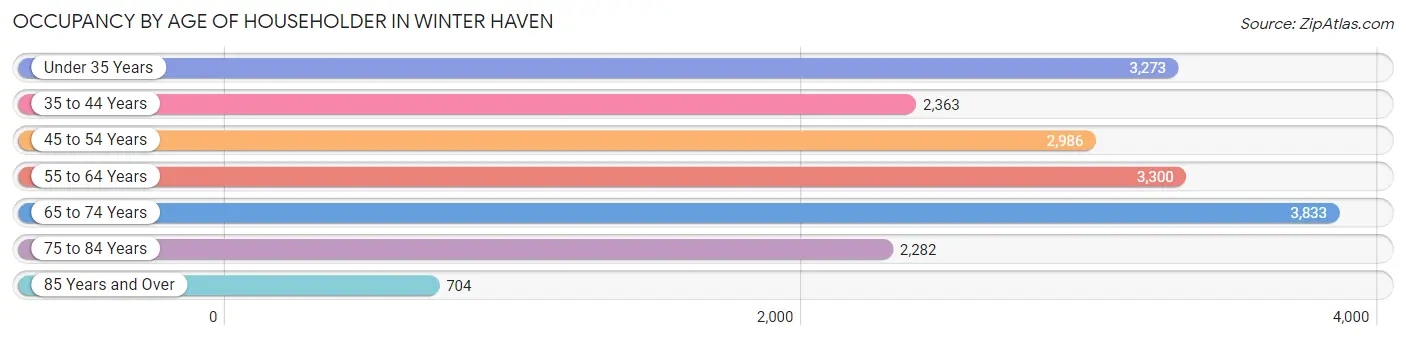
| Age Bracket | # Households | % Households |
| Under 35 Years | 3,273 | 17.5% |
| 35 to 44 Years | 2,363 | 12.6% |
| 45 to 54 Years | 2,986 | 15.9% |
| 55 to 64 Years | 3,300 | 17.6% |
| 65 to 74 Years | 3,833 | 20.4% |
| 75 to 84 Years | 2,282 | 12.2% |
| 85 Years and Over | 704 | 3.8% |
| Total | 18,741 | 100.0% |
Housing Finances in Winter Haven
Median Income by Occupancy in Winter Haven
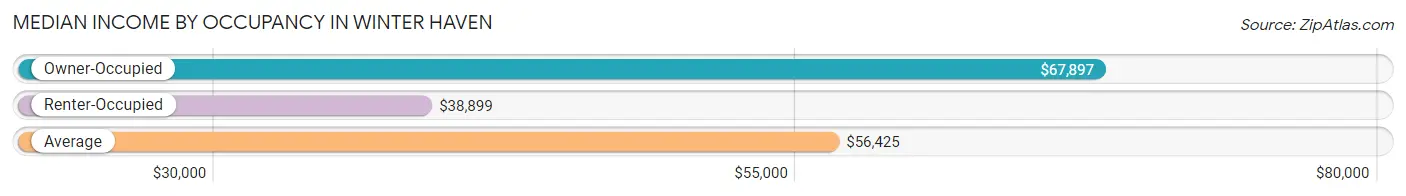
| Occupancy Type | # Households | Median Income |
| Owner-Occupied | 11,812 (63.0%) | $67,897 |
| Renter-Occupied | 6,929 (37.0%) | $38,899 |
| Average | 18,741 (100.0%) | $56,425 |
Occupancy by Householder Income Bracket in Winter Haven
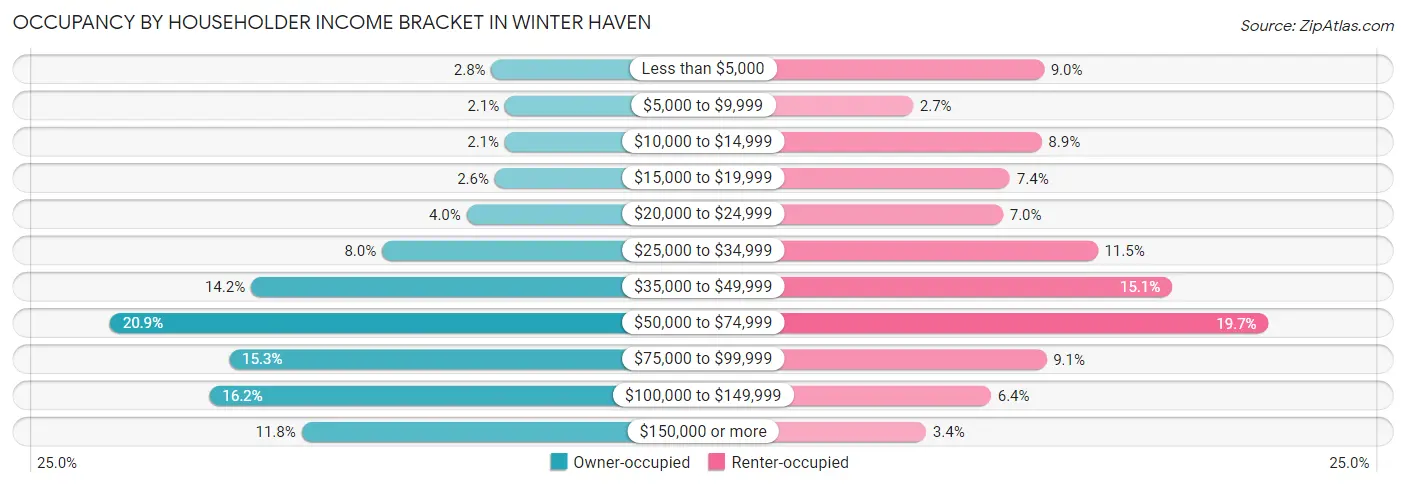
| Income Bracket | Owner-occupied | Renter-occupied |
| Less than $5,000 | 327 (2.8%) | 621 (9.0%) |
| $5,000 to $9,999 | 251 (2.1%) | 189 (2.7%) |
| $10,000 to $14,999 | 252 (2.1%) | 613 (8.8%) |
| $15,000 to $19,999 | 308 (2.6%) | 509 (7.3%) |
| $20,000 to $24,999 | 466 (4.0%) | 486 (7.0%) |
| $25,000 to $34,999 | 943 (8.0%) | 798 (11.5%) |
| $35,000 to $49,999 | 1,680 (14.2%) | 1,044 (15.1%) |
| $50,000 to $74,999 | 2,474 (20.9%) | 1,362 (19.7%) |
| $75,000 to $99,999 | 1,802 (15.3%) | 629 (9.1%) |
| $100,000 to $149,999 | 1,914 (16.2%) | 446 (6.4%) |
| $150,000 or more | 1,395 (11.8%) | 232 (3.4%) |
| Total | 11,812 (100.0%) | 6,929 (100.0%) |
Monthly Housing Cost Tiers in Winter Haven
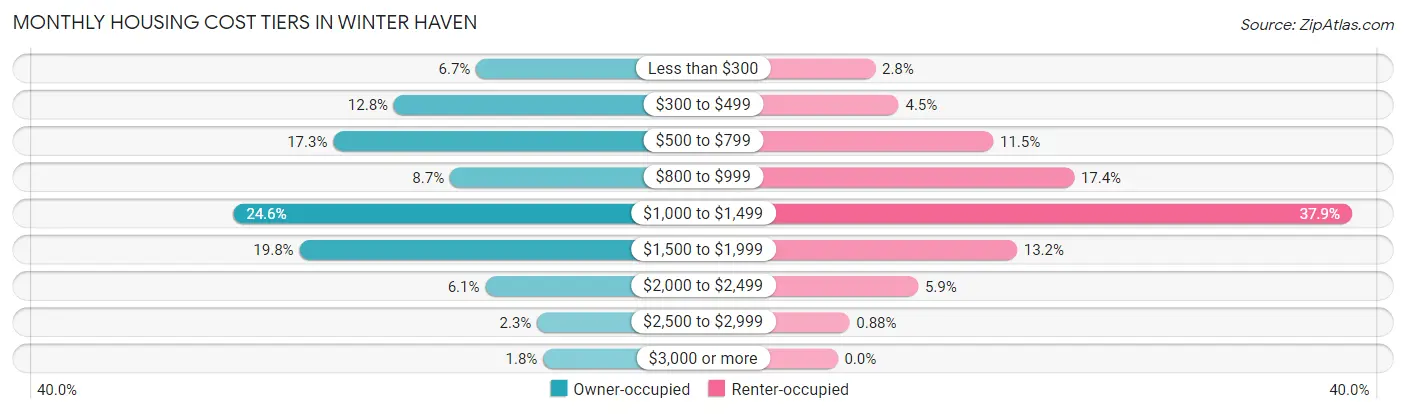
| Monthly Cost | Owner-occupied | Renter-occupied |
| Less than $300 | 796 (6.7%) | 192 (2.8%) |
| $300 to $499 | 1,512 (12.8%) | 312 (4.5%) |
| $500 to $799 | 2,040 (17.3%) | 794 (11.5%) |
| $800 to $999 | 1,024 (8.7%) | 1,207 (17.4%) |
| $1,000 to $1,499 | 2,909 (24.6%) | 2,625 (37.9%) |
| $1,500 to $1,999 | 2,334 (19.8%) | 915 (13.2%) |
| $2,000 to $2,499 | 717 (6.1%) | 411 (5.9%) |
| $2,500 to $2,999 | 266 (2.2%) | 61 (0.9%) |
| $3,000 or more | 214 (1.8%) | 0 (0.0%) |
| Total | 11,812 (100.0%) | 6,929 (100.0%) |
Physical Housing Characteristics in Winter Haven
Housing Structures in Winter Haven
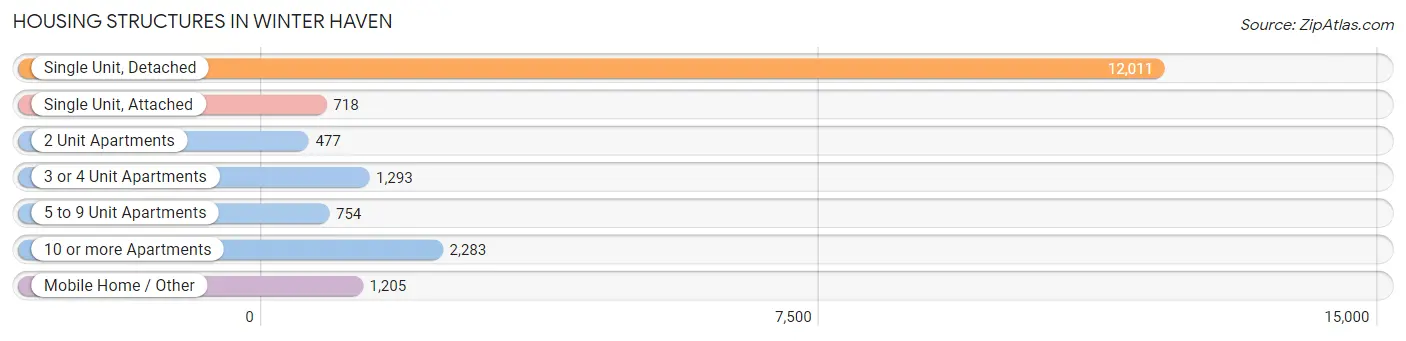
| Structure Type | # Housing Units | % Housing Units |
| Single Unit, Detached | 12,011 | 64.1% |
| Single Unit, Attached | 718 | 3.8% |
| 2 Unit Apartments | 477 | 2.5% |
| 3 or 4 Unit Apartments | 1,293 | 6.9% |
| 5 to 9 Unit Apartments | 754 | 4.0% |
| 10 or more Apartments | 2,283 | 12.2% |
| Mobile Home / Other | 1,205 | 6.4% |
| Total | 18,741 | 100.0% |
Housing Structures by Occupancy in Winter Haven
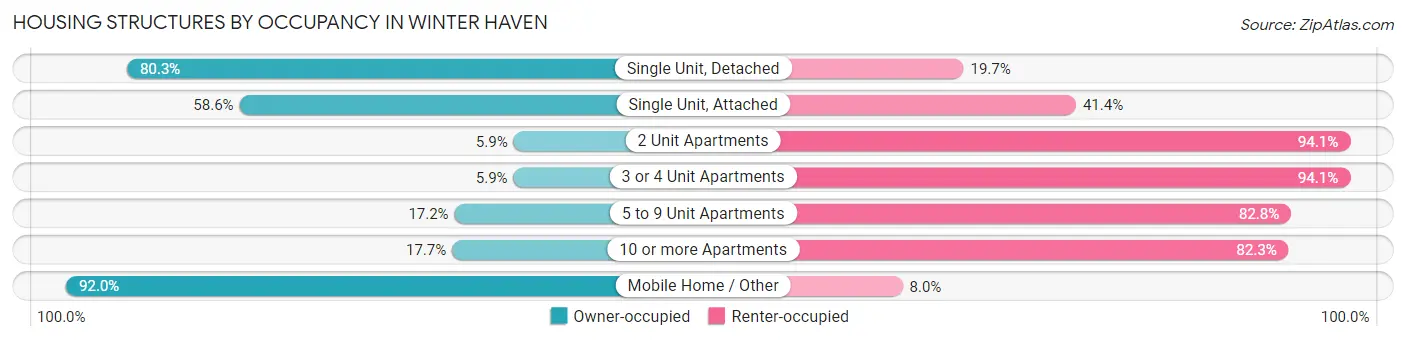
| Structure Type | Owner-occupied | Renter-occupied |
| Single Unit, Detached | 9,644 (80.3%) | 2,367 (19.7%) |
| Single Unit, Attached | 421 (58.6%) | 297 (41.4%) |
| 2 Unit Apartments | 28 (5.9%) | 449 (94.1%) |
| 3 or 4 Unit Apartments | 76 (5.9%) | 1,217 (94.1%) |
| 5 to 9 Unit Apartments | 130 (17.2%) | 624 (82.8%) |
| 10 or more Apartments | 404 (17.7%) | 1,879 (82.3%) |
| Mobile Home / Other | 1,109 (92.0%) | 96 (8.0%) |
| Total | 11,812 (63.0%) | 6,929 (37.0%) |
Housing Structures by Number of Rooms in Winter Haven
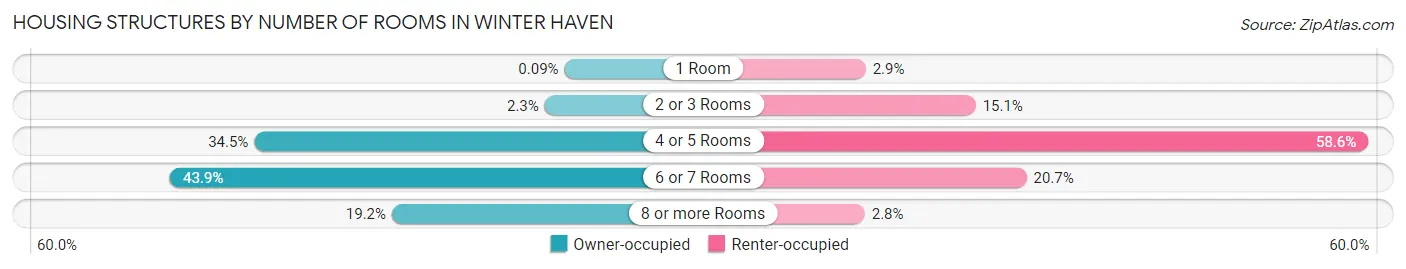
| Number of Rooms | Owner-occupied | Renter-occupied |
| 1 Room | 11 (0.1%) | 198 (2.9%) |
| 2 or 3 Rooms | 270 (2.3%) | 1,044 (15.1%) |
| 4 or 5 Rooms | 4,078 (34.5%) | 4,061 (58.6%) |
| 6 or 7 Rooms | 5,180 (43.9%) | 1,435 (20.7%) |
| 8 or more Rooms | 2,273 (19.2%) | 191 (2.8%) |
| Total | 11,812 (100.0%) | 6,929 (100.0%) |
Housing Structure by Heating Type in Winter Haven
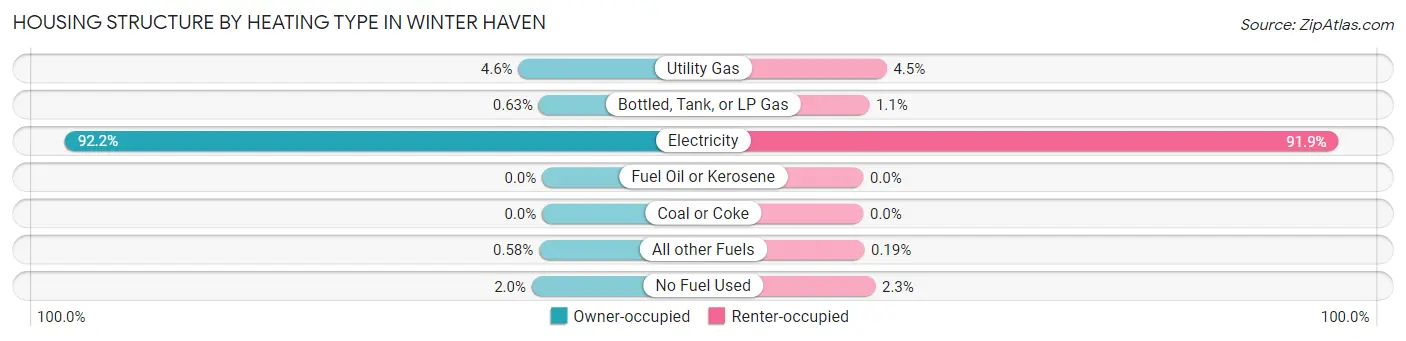
| Heating Type | Owner-occupied | Renter-occupied |
| Utility Gas | 540 (4.6%) | 313 (4.5%) |
| Bottled, Tank, or LP Gas | 75 (0.6%) | 79 (1.1%) |
| Electricity | 10,894 (92.2%) | 6,364 (91.8%) |
| Fuel Oil or Kerosene | 0 (0.0%) | 0 (0.0%) |
| Coal or Coke | 0 (0.0%) | 0 (0.0%) |
| All other Fuels | 68 (0.6%) | 13 (0.2%) |
| No Fuel Used | 235 (2.0%) | 160 (2.3%) |
| Total | 11,812 (100.0%) | 6,929 (100.0%) |
Household Vehicle Usage in Winter Haven
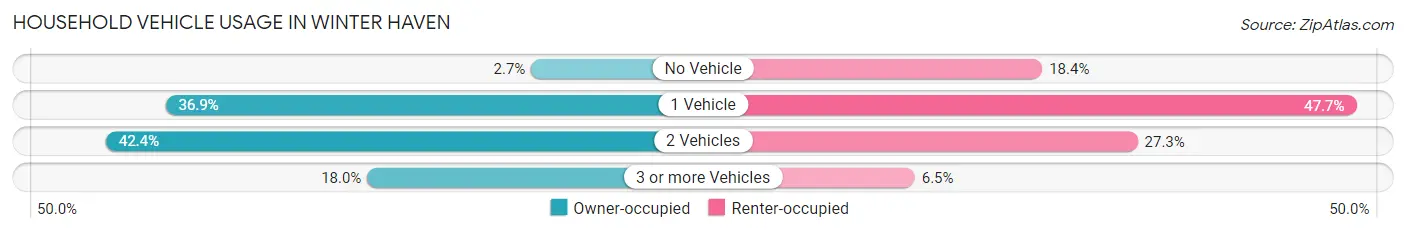
| Vehicles per Household | Owner-occupied | Renter-occupied |
| No Vehicle | 320 (2.7%) | 1,276 (18.4%) |
| 1 Vehicle | 4,353 (36.8%) | 3,308 (47.7%) |
| 2 Vehicles | 5,011 (42.4%) | 1,893 (27.3%) |
| 3 or more Vehicles | 2,128 (18.0%) | 452 (6.5%) |
| Total | 11,812 (100.0%) | 6,929 (100.0%) |
Real Estate & Mortgages in Winter Haven
Real Estate and Mortgage Overview in Winter Haven
| Characteristic | Without Mortgage | With Mortgage |
| Housing Units | 4,751 | 7,061 |
| Median Property Value | $177,100 | $234,600 |
| Median Household Income | $57,450 | $859 |
| Monthly Housing Costs | $523 | $211 |
| Real Estate Taxes | $1,400 | $367 |
Property Value by Mortgage Status in Winter Haven
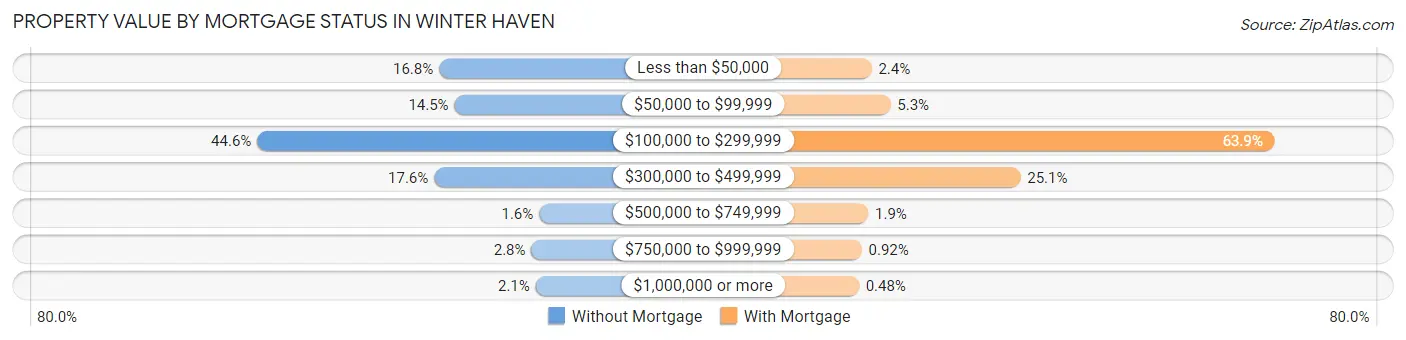
| Property Value | Without Mortgage | With Mortgage |
| Less than $50,000 | 800 (16.8%) | 171 (2.4%) |
| $50,000 to $99,999 | 689 (14.5%) | 374 (5.3%) |
| $100,000 to $299,999 | 2,117 (44.6%) | 4,510 (63.9%) |
| $300,000 to $499,999 | 836 (17.6%) | 1,772 (25.1%) |
| $500,000 to $749,999 | 76 (1.6%) | 135 (1.9%) |
| $750,000 to $999,999 | 132 (2.8%) | 65 (0.9%) |
| $1,000,000 or more | 101 (2.1%) | 34 (0.5%) |
| Total | 4,751 (100.0%) | 7,061 (100.0%) |
Household Income by Mortgage Status in Winter Haven
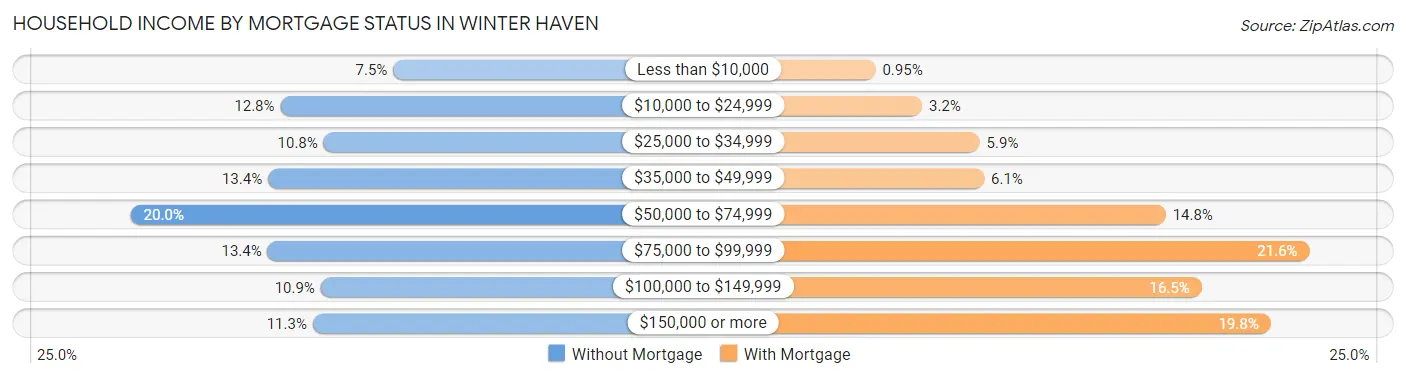
| Household Income | Without Mortgage | With Mortgage |
| Less than $10,000 | 354 (7.4%) | 67 (0.9%) |
| $10,000 to $24,999 | 609 (12.8%) | 224 (3.2%) |
| $25,000 to $34,999 | 511 (10.8%) | 417 (5.9%) |
| $35,000 to $49,999 | 637 (13.4%) | 432 (6.1%) |
| $50,000 to $74,999 | 948 (20.0%) | 1,043 (14.8%) |
| $75,000 to $99,999 | 638 (13.4%) | 1,526 (21.6%) |
| $100,000 to $149,999 | 518 (10.9%) | 1,164 (16.5%) |
| $150,000 or more | 536 (11.3%) | 1,396 (19.8%) |
| Total | 4,751 (100.0%) | 7,061 (100.0%) |
Property Value to Household Income Ratio in Winter Haven
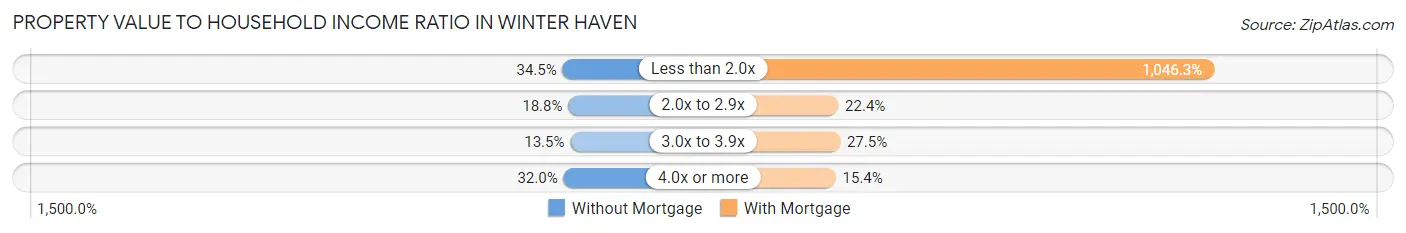
| Value-to-Income Ratio | Without Mortgage | With Mortgage |
| Less than 2.0x | 1,637 (34.5%) | 73,881 (1,046.3%) |
| 2.0x to 2.9x | 895 (18.8%) | 1,583 (22.4%) |
| 3.0x to 3.9x | 641 (13.5%) | 1,938 (27.5%) |
| 4.0x or more | 1,521 (32.0%) | 1,090 (15.4%) |
| Total | 4,751 (100.0%) | 7,061 (100.0%) |
Real Estate Taxes by Mortgage Status in Winter Haven
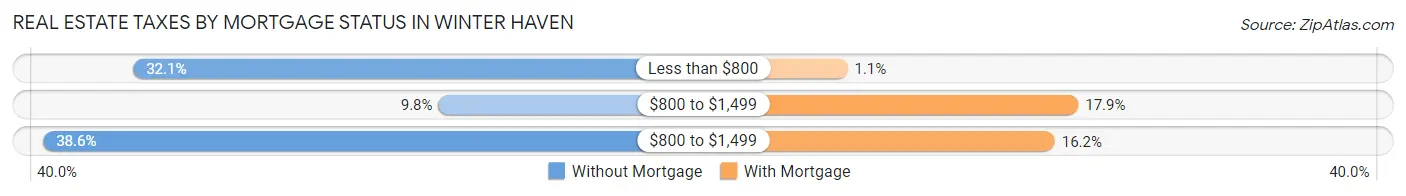
| Property Taxes | Without Mortgage | With Mortgage |
| Less than $800 | 1,523 (32.1%) | 75 (1.1%) |
| $800 to $1,499 | 464 (9.8%) | 1,265 (17.9%) |
| $800 to $1,499 | 1,836 (38.6%) | 1,144 (16.2%) |
| Total | 4,751 (100.0%) | 7,061 (100.0%) |
Health & Disability in Winter Haven
Health Insurance Coverage by Age in Winter Haven
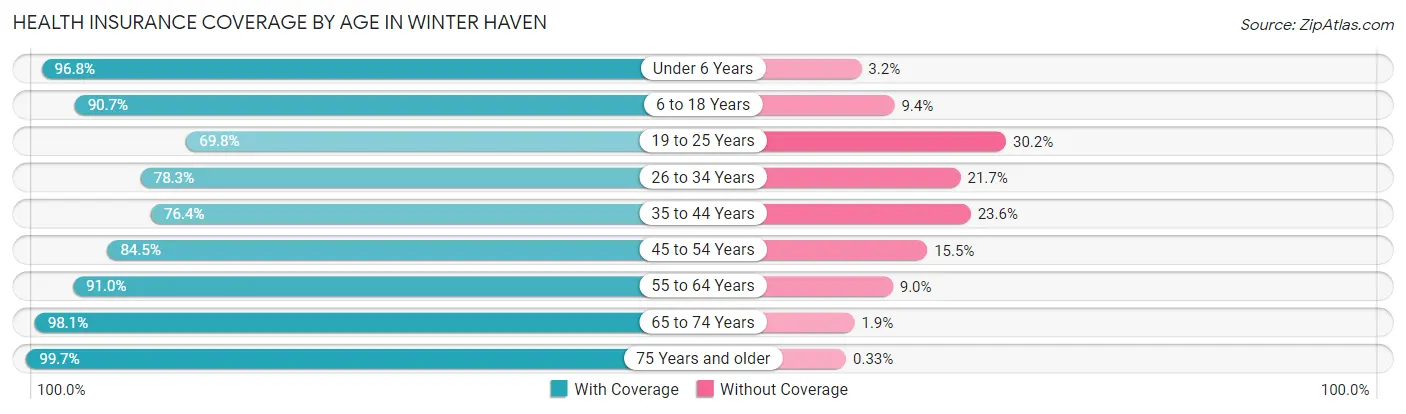
| Age Bracket | With Coverage | Without Coverage |
| Under 6 Years | 3,672 (96.8%) | 121 (3.2%) |
| 6 to 18 Years | 7,271 (90.6%) | 750 (9.3%) |
| 19 to 25 Years | 3,397 (69.8%) | 1,467 (30.2%) |
| 26 to 34 Years | 4,435 (78.3%) | 1,228 (21.7%) |
| 35 to 44 Years | 3,822 (76.4%) | 1,179 (23.6%) |
| 45 to 54 Years | 5,041 (84.5%) | 922 (15.5%) |
| 55 to 64 Years | 5,344 (91.0%) | 531 (9.0%) |
| 65 to 74 Years | 5,805 (98.1%) | 113 (1.9%) |
| 75 Years and older | 4,906 (99.7%) | 16 (0.3%) |
| Total | 43,693 (87.4%) | 6,327 (12.7%) |
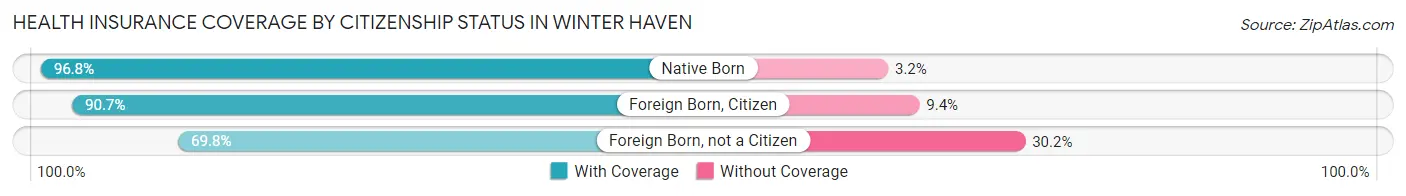
Health Insurance Coverage by Citizenship Status in Winter Haven
| Citizenship Status | With Coverage | Without Coverage |
| Native Born | 3,672 (96.8%) | 121 (3.2%) |
| Foreign Born, Citizen | 7,271 (90.6%) | 750 (9.3%) |
| Foreign Born, not a Citizen | 3,397 (69.8%) | 1,467 (30.2%) |
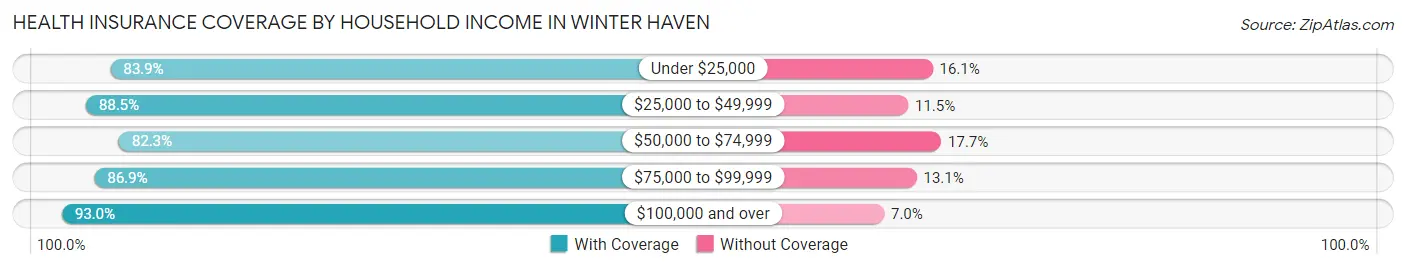
Health Insurance Coverage by Household Income in Winter Haven
| Household Income | With Coverage | Without Coverage |
| Under $25,000 | 6,056 (83.9%) | 1,159 (16.1%) |
| $25,000 to $49,999 | 8,501 (88.5%) | 1,102 (11.5%) |
| $50,000 to $74,999 | 9,982 (82.3%) | 2,143 (17.7%) |
| $75,000 to $99,999 | 6,407 (86.9%) | 963 (13.1%) |
| $100,000 and over | 12,707 (93.0%) | 953 (7.0%) |
Public vs Private Health Insurance Coverage by Age in Winter Haven
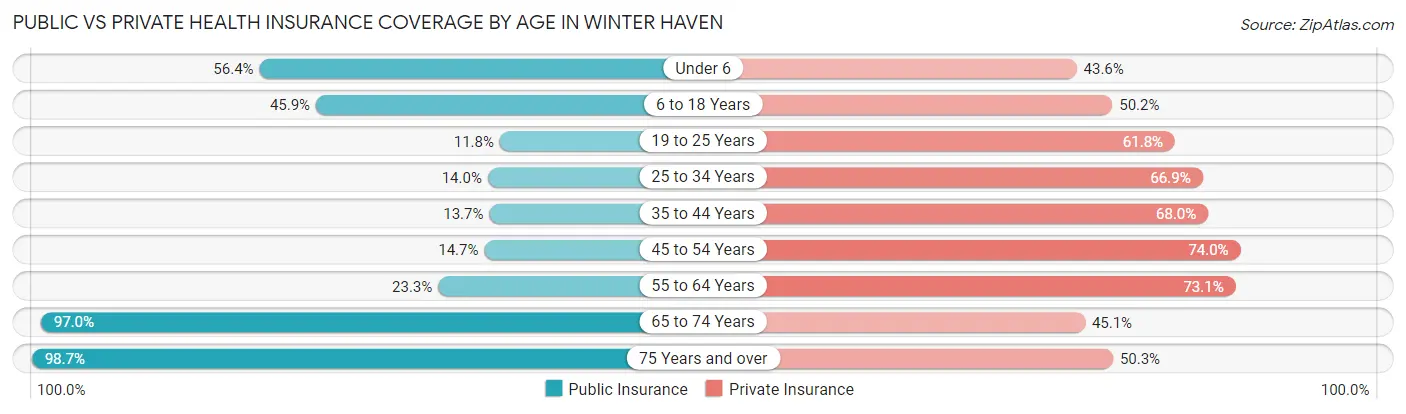
| Age Bracket | Public Insurance | Private Insurance |
| Under 6 | 2,140 (56.4%) | 1,653 (43.6%) |
| 6 to 18 Years | 3,683 (45.9%) | 4,027 (50.2%) |
| 19 to 25 Years | 574 (11.8%) | 3,007 (61.8%) |
| 25 to 34 Years | 795 (14.0%) | 3,791 (66.9%) |
| 35 to 44 Years | 687 (13.7%) | 3,400 (68.0%) |
| 45 to 54 Years | 875 (14.7%) | 4,412 (74.0%) |
| 55 to 64 Years | 1,366 (23.3%) | 4,293 (73.1%) |
| 65 to 74 Years | 5,740 (97.0%) | 2,671 (45.1%) |
| 75 Years and over | 4,857 (98.7%) | 2,477 (50.3%) |
| Total | 20,717 (41.4%) | 29,731 (59.4%) |
Disability Status by Sex by Age in Winter Haven
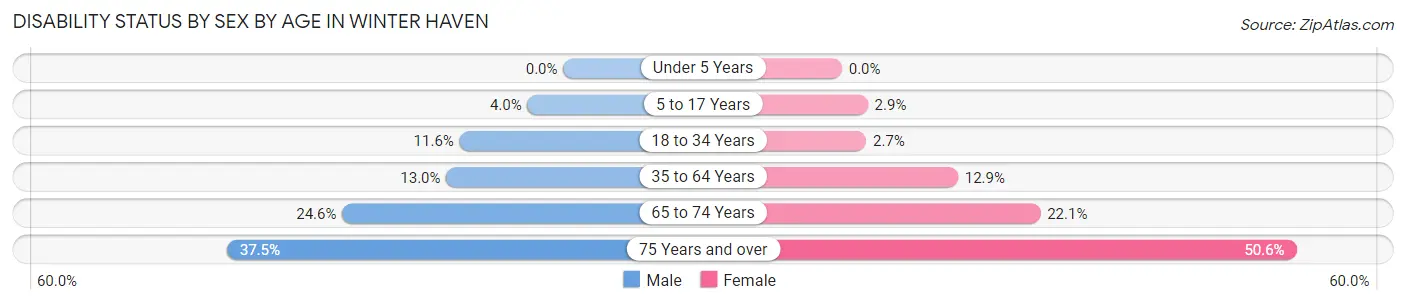
| Age Bracket | Male | Female |
| Under 5 Years | 0 (0.0%) | 0 (0.0%) |
| 5 to 17 Years | 150 (4.0%) | 121 (2.9%) |
| 18 to 34 Years | 691 (11.6%) | 143 (2.7%) |
| 35 to 64 Years | 1,059 (13.0%) | 1,126 (12.9%) |
| 65 to 74 Years | 617 (24.6%) | 754 (22.1%) |
| 75 Years and over | 826 (37.5%) | 1,376 (50.6%) |
Disability Class by Sex by Age in Winter Haven
Disability Class: Hearing Difficulty
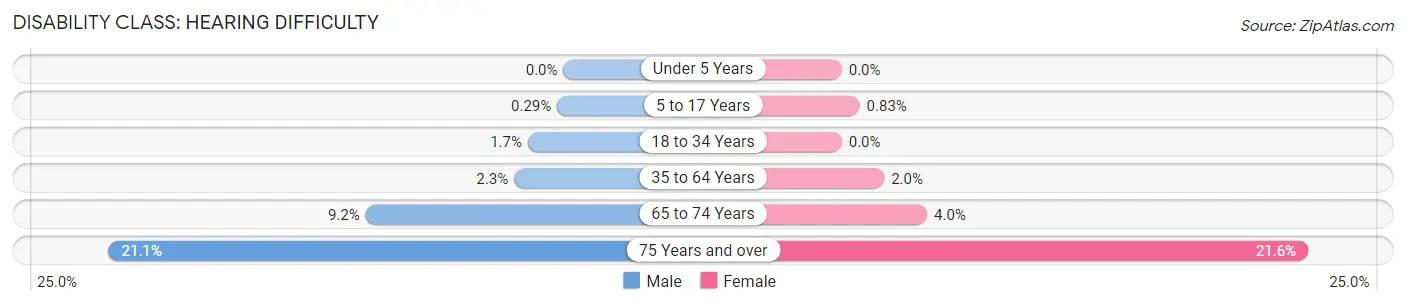
| Age Bracket | Male | Female |
| Under 5 Years | 0 (0.0%) | 0 (0.0%) |
| 5 to 17 Years | 11 (0.3%) | 35 (0.8%) |
| 18 to 34 Years | 99 (1.7%) | 0 (0.0%) |
| 35 to 64 Years | 186 (2.3%) | 172 (2.0%) |
| 65 to 74 Years | 230 (9.2%) | 135 (4.0%) |
| 75 Years and over | 465 (21.1%) | 588 (21.6%) |
Disability Class: Vision Difficulty
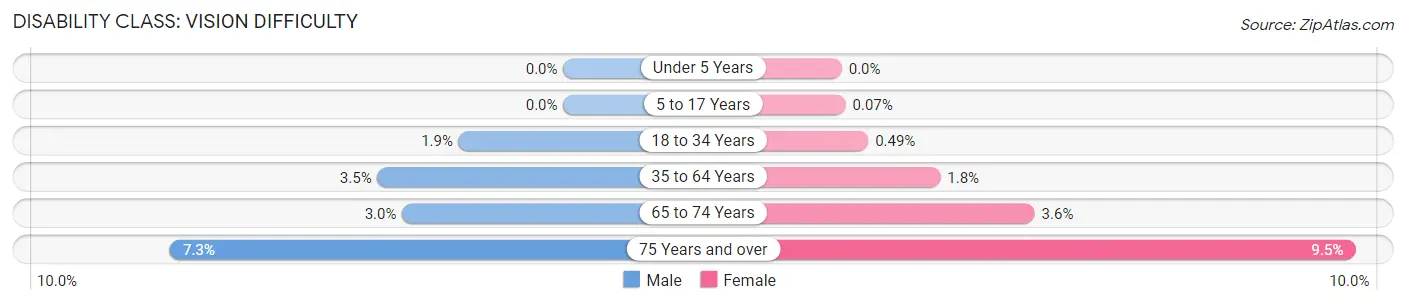
| Age Bracket | Male | Female |
| Under 5 Years | 0 (0.0%) | 0 (0.0%) |
| 5 to 17 Years | 0 (0.0%) | 3 (0.1%) |
| 18 to 34 Years | 116 (1.9%) | 26 (0.5%) |
| 35 to 64 Years | 280 (3.5%) | 159 (1.8%) |
| 65 to 74 Years | 75 (3.0%) | 122 (3.6%) |
| 75 Years and over | 161 (7.3%) | 259 (9.5%) |
Disability Class: Cognitive Difficulty
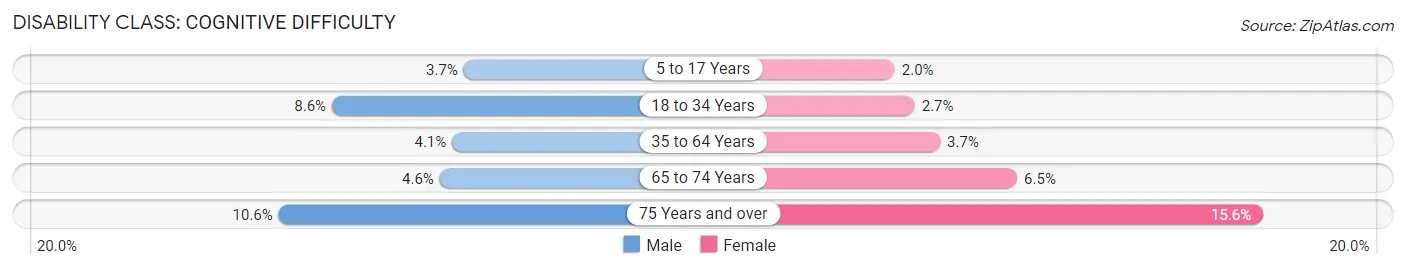
| Age Bracket | Male | Female |
| 5 to 17 Years | 139 (3.7%) | 83 (2.0%) |
| 18 to 34 Years | 514 (8.6%) | 143 (2.7%) |
| 35 to 64 Years | 336 (4.1%) | 318 (3.6%) |
| 65 to 74 Years | 115 (4.6%) | 222 (6.5%) |
| 75 Years and over | 233 (10.6%) | 425 (15.6%) |
Disability Class: Ambulatory Difficulty
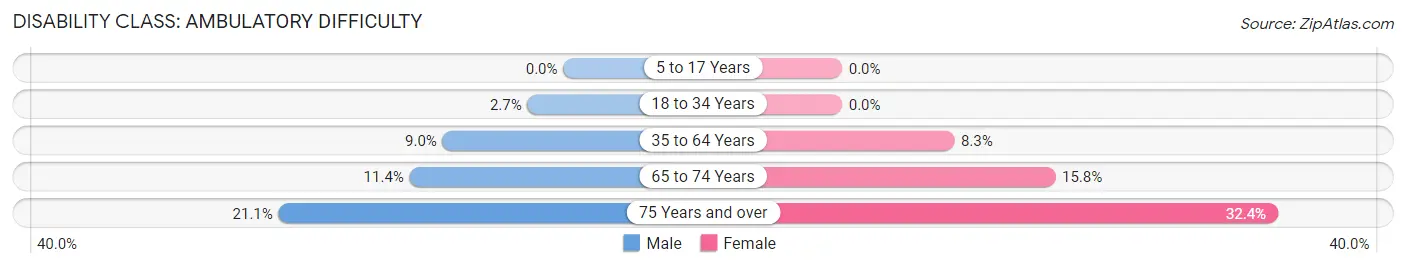
| Age Bracket | Male | Female |
| 5 to 17 Years | 0 (0.0%) | 0 (0.0%) |
| 18 to 34 Years | 159 (2.7%) | 0 (0.0%) |
| 35 to 64 Years | 728 (9.0%) | 726 (8.3%) |
| 65 to 74 Years | 286 (11.4%) | 540 (15.8%) |
| 75 Years and over | 466 (21.1%) | 880 (32.4%) |
Disability Class: Self-Care Difficulty
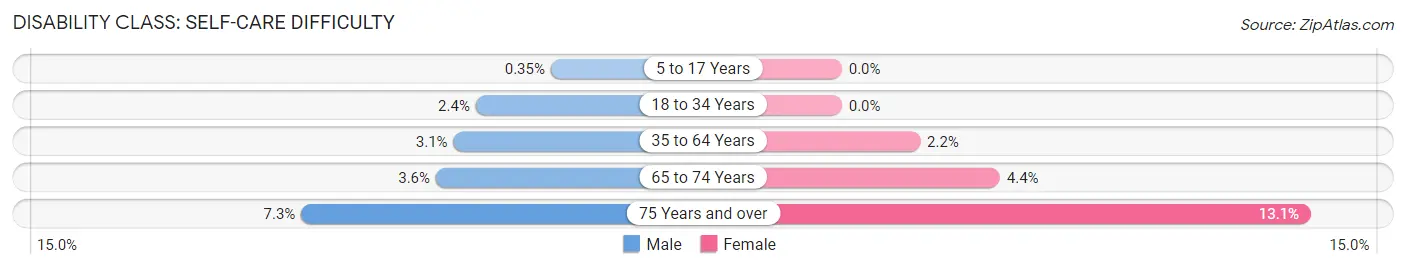
| Age Bracket | Male | Female |
| 5 to 17 Years | 13 (0.4%) | 0 (0.0%) |
| 18 to 34 Years | 146 (2.4%) | 0 (0.0%) |
| 35 to 64 Years | 249 (3.1%) | 190 (2.2%) |
| 65 to 74 Years | 89 (3.5%) | 150 (4.4%) |
| 75 Years and over | 161 (7.3%) | 355 (13.1%) |
Technology Access in Winter Haven
Computing Device Access in Winter Haven
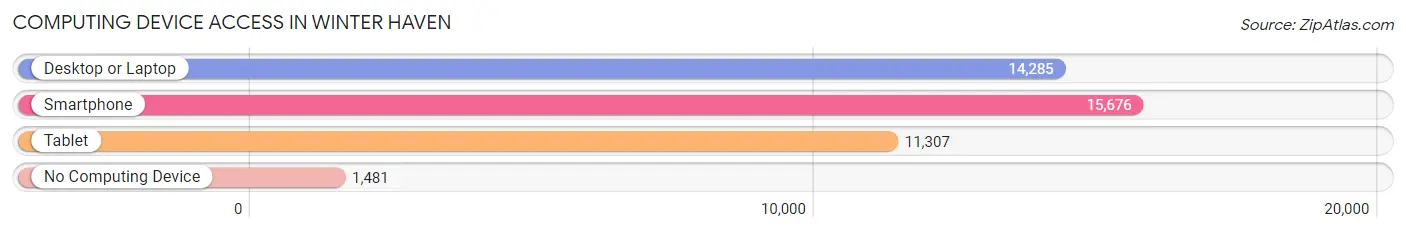
| Device Type | # Households | % Households |
| Desktop or Laptop | 14,285 | 76.2% |
| Smartphone | 15,676 | 83.7% |
| Tablet | 11,307 | 60.3% |
| No Computing Device | 1,481 | 7.9% |
| Total | 18,741 | 100.0% |
Internet Access in Winter Haven
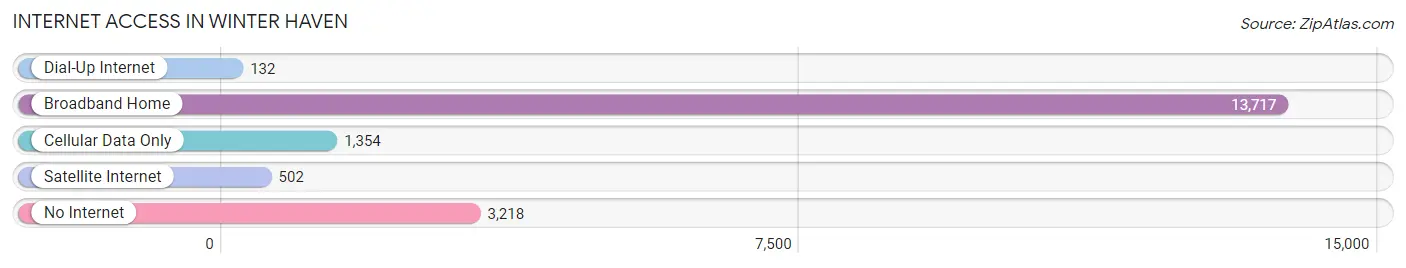
| Internet Type | # Households | % Households |
| Dial-Up Internet | 132 | 0.7% |
| Broadband Home | 13,717 | 73.2% |
| Cellular Data Only | 1,354 | 7.2% |
| Satellite Internet | 502 | 2.7% |
| No Internet | 3,218 | 17.2% |
| Total | 18,741 | 100.0% |
Winter Haven Summary
History
Winter Haven, Florida is a city located in Polk County, Florida. It is situated in the center of the state, approximately 50 miles east of Tampa and 50 miles southwest of Orlando. The city was founded in 1884 by a group of settlers from Philadelphia, Pennsylvania, who were looking for a place to settle and start a new life. The city was originally known as Harris Corners, but was later renamed Winter Haven in 1888.
The city was initially a small agricultural community, with citrus being the main crop. In the early 1900s, the city began to grow and develop, with the construction of a railroad line connecting it to Tampa and Orlando. This allowed for the transportation of goods and people, and helped to spur the growth of the city.
In the 1920s, Winter Haven began to attract tourists, due to its proximity to the beaches of the Gulf of Mexico. The city also became a popular destination for retirees, due to its mild climate and low cost of living.
In the 1950s, the city began to experience a period of rapid growth, as the population increased from around 5,000 to over 20,000. This growth was largely due to the development of the citrus industry, as well as the construction of the Cypress Gardens theme park.
The city continued to grow throughout the 1960s and 1970s, and by the 1980s, the population had reached over 40,000. In the 1990s, the city experienced a period of decline, as the citrus industry began to decline and the theme park closed. However, the city has since rebounded, and the population is now over 50,000.
Geography
Winter Haven is located in central Florida, approximately 50 miles east of Tampa and 50 miles southwest of Orlando. The city is situated on the shores of Lake Eloise, a large lake that is part of the Winter Haven Chain of Lakes. The city is also located near the Kissimmee River, which flows into Lake Okeechobee.
The city has a total area of 24.3 square miles, of which 22.7 square miles is land and 1.6 square miles is water. The city is located at an elevation of approximately 100 feet above sea level.
The climate in Winter Haven is classified as humid subtropical, with hot, humid summers and mild, dry winters. The average temperature in the summer is around 90 degrees Fahrenheit, while the average temperature in the winter is around 60 degrees Fahrenheit.
Economy
The economy of Winter Haven is largely based on tourism, agriculture, and manufacturing. The city is home to several large employers, including Legoland Florida, Publix Super Markets, and the Winter Haven Hospital.
Agriculture is an important part of the local economy, with citrus being the main crop. The city is also home to several large manufacturing companies, including the Winter Haven Manufacturing Company, which produces furniture and other wood products.
The city also has a thriving retail sector, with several large shopping malls and outlets located in the city. The city is also home to several large hotels and resorts, which attract tourists from all over the world.
Demographics
As of the 2010 census, the population of Winter Haven was 50,621. The racial makeup of the city was 75.3% White, 15.2% African American, 0.5% Native American, 1.7% Asian, 0.1% Pacific Islander, 4.7% from other races, and 2.5% from two or more races. Hispanic or Latino of any race were 11.2% of the population.
The median household income in Winter Haven was $37,845, and the median family income was $45,890. The per capita income for the city was $20,845. About 15.2% of the population was below the poverty line.
Common Questions
What is Per Capita Income in Winter Haven?
Per Capita income in Winter Haven is $28,967.
What is the Median Family Income in Winter Haven?
Median Family Income in Winter Haven is $63,816.
What is the Median Household income in Winter Haven?
Median Household Income in Winter Haven is $56,425.
What is Income or Wage Gap in Winter Haven?
Income or Wage Gap in Winter Haven is 21.8%.
Women in Winter Haven earn 78.2 cents for every dollar earned by a man.
What is Family Income Deficit in Winter Haven?
Family Income Deficit in Winter Haven is $11,802.
Families that are below poverty line in Winter Haven earn $11,802 less on average than the poverty threshold level.
What is Inequality or Gini Index in Winter Haven?
Inequality or Gini Index in Winter Haven is 0.46.
What is the Total Population of Winter Haven?
Total Population of Winter Haven is 50,778.
What is the Total Male Population of Winter Haven?
Total Male Population of Winter Haven is 24,273.
What is the Total Female Population of Winter Haven?
Total Female Population of Winter Haven is 26,505.
What is the Ratio of Males per 100 Females in Winter Haven?
There are 91.58 Males per 100 Females in Winter Haven.
What is the Ratio of Females per 100 Males in Winter Haven?
There are 109.20 Females per 100 Males in Winter Haven.
What is the Median Population Age in Winter Haven?
Median Population Age in Winter Haven is 40.6 Years.
What is the Average Family Size in Winter Haven
Average Family Size in Winter Haven is 3.3 People.
What is the Average Household Size in Winter Haven
Average Household Size in Winter Haven is 2.7 People.
How Large is the Labor Force in Winter Haven?
There are 22,294 People in the Labor Forcein in Winter Haven.
What is the Percentage of People in the Labor Force in Winter Haven?
54.3% of People are in the Labor Force in Winter Haven.
What is the Unemployment Rate in Winter Haven?
Unemployment Rate in Winter Haven is 4.2%.