West Little River, FL Map & Demographics
West Little River Map
West Little River Overview
$20,124
PER CAPITA INCOME
$52,432
AVG FAMILY INCOME
$46,518
AVG HOUSEHOLD INCOME
5.8%
WAGE / INCOME GAP [ % ]
94.2¢/ $1
WAGE / INCOME GAP [ $ ]
$11,041
FAMILY INCOME DEFICIT
0.46
INEQUALITY / GINI INDEX
33,465
TOTAL POPULATION
16,568
MALE POPULATION
16,897
FEMALE POPULATION
98.05
MALES / 100 FEMALES
101.99
FEMALES / 100 MALES
41.5
MEDIAN AGE
3.8
AVG FAMILY SIZE
3.2
AVG HOUSEHOLD SIZE
14,850
LABOR FORCE [ PEOPLE ]
55.9%
PERCENT IN LABOR FORCE
6.4%
UNEMPLOYMENT RATE
Income in West Little River
Income Overview in West Little River
Per Capita Income in West Little River is $20,124, while median incomes of families and households are $52,432 and $46,518 respectively.
| Characteristic | Number | Measure |
| Per Capita Income | 33,465 | $20,124 |
| Median Family Income | 7,659 | $52,432 |
| Mean Family Income | 7,659 | $65,800 |
| Median Household Income | 10,347 | $46,518 |
| Mean Household Income | 10,347 | $59,717 |
| Income Deficit | 7,659 | $11,041 |
| Wage / Income Gap (%) | 33,465 | 5.77% |
| Wage / Income Gap ($) | 33,465 | 94.23¢ per $1 |
| Gini / Inequality Index | 33,465 | 0.46 |
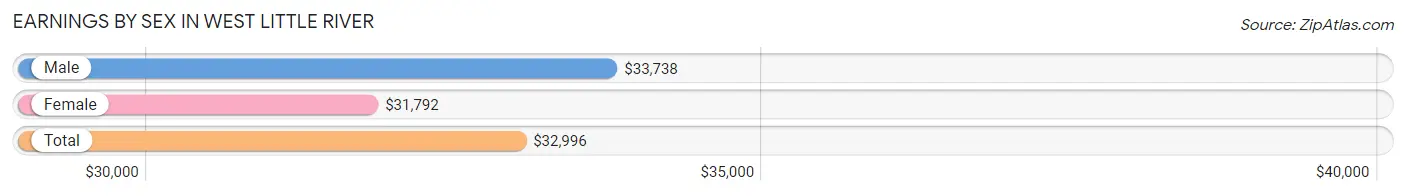
Earnings by Sex in West Little River
Average Earnings in West Little River are $32,996, $33,738 for men and $31,792 for women, a difference of 5.8%.
| Sex | Number | Average Earnings |
| Male | 7,657 (51.8%) | $33,738 |
| Female | 7,110 (48.1%) | $31,792 |
| Total | 14,767 (100.0%) | $32,996 |
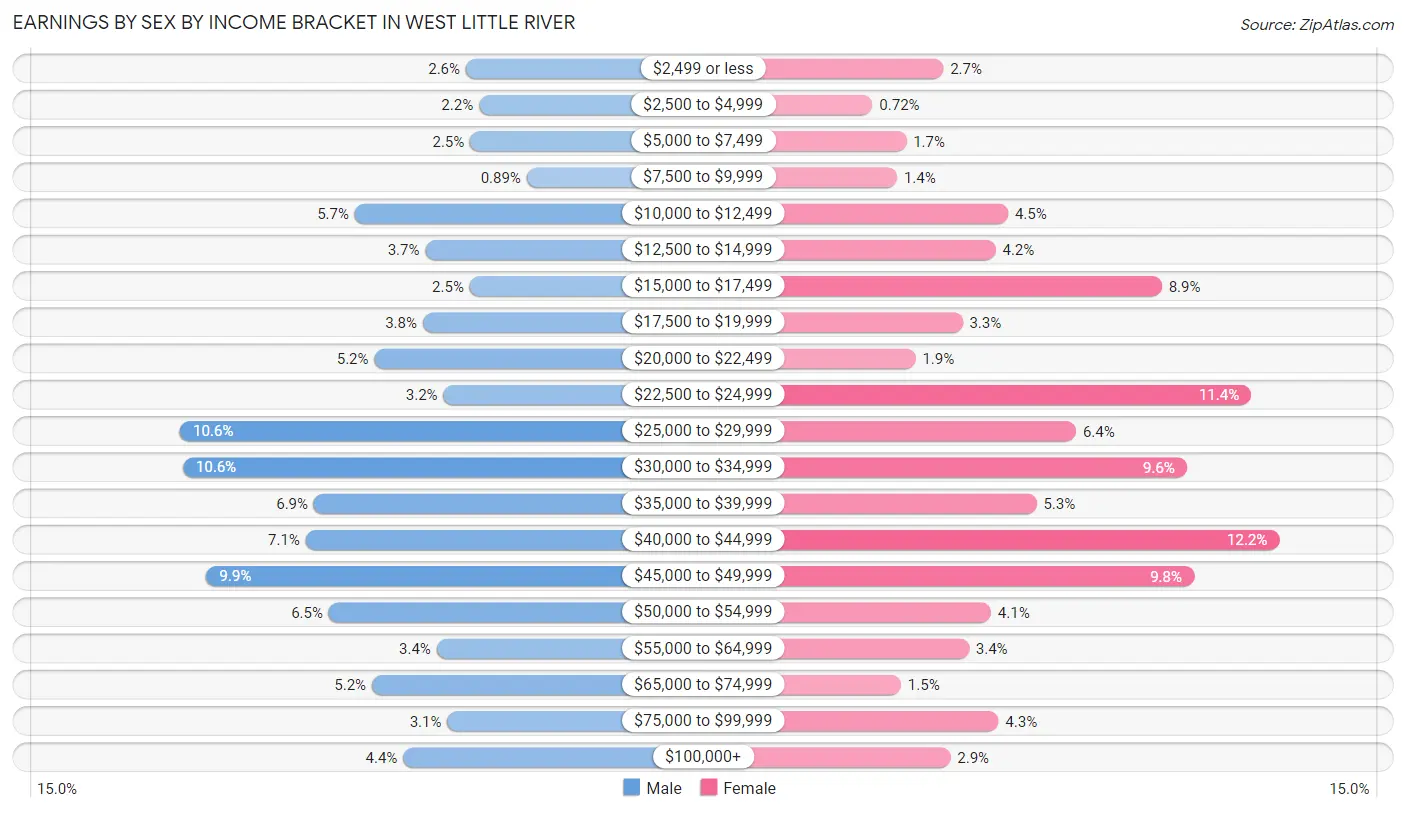
Earnings by Sex by Income Bracket in West Little River
The most common earnings brackets in West Little River are $25,000 to $29,999 for men (814 | 10.6%) and $40,000 to $44,999 for women (864 | 12.1%).
| Income | Male | Female |
| $2,499 or less | 199 (2.6%) | 193 (2.7%) |
| $2,500 to $4,999 | 171 (2.2%) | 51 (0.7%) |
| $5,000 to $7,499 | 190 (2.5%) | 119 (1.7%) |
| $7,500 to $9,999 | 68 (0.9%) | 100 (1.4%) |
| $10,000 to $12,499 | 438 (5.7%) | 322 (4.5%) |
| $12,500 to $14,999 | 286 (3.7%) | 297 (4.2%) |
| $15,000 to $17,499 | 191 (2.5%) | 629 (8.8%) |
| $17,500 to $19,999 | 292 (3.8%) | 231 (3.3%) |
| $20,000 to $22,499 | 396 (5.2%) | 137 (1.9%) |
| $22,500 to $24,999 | 247 (3.2%) | 808 (11.4%) |
| $25,000 to $29,999 | 814 (10.6%) | 458 (6.4%) |
| $30,000 to $34,999 | 808 (10.5%) | 679 (9.6%) |
| $35,000 to $39,999 | 526 (6.9%) | 379 (5.3%) |
| $40,000 to $44,999 | 544 (7.1%) | 864 (12.1%) |
| $45,000 to $49,999 | 757 (9.9%) | 693 (9.8%) |
| $50,000 to $54,999 | 494 (6.5%) | 288 (4.1%) |
| $55,000 to $64,999 | 262 (3.4%) | 244 (3.4%) |
| $65,000 to $74,999 | 401 (5.2%) | 108 (1.5%) |
| $75,000 to $99,999 | 239 (3.1%) | 303 (4.3%) |
| $100,000+ | 334 (4.4%) | 207 (2.9%) |
| Total | 7,657 (100.0%) | 7,110 (100.0%) |
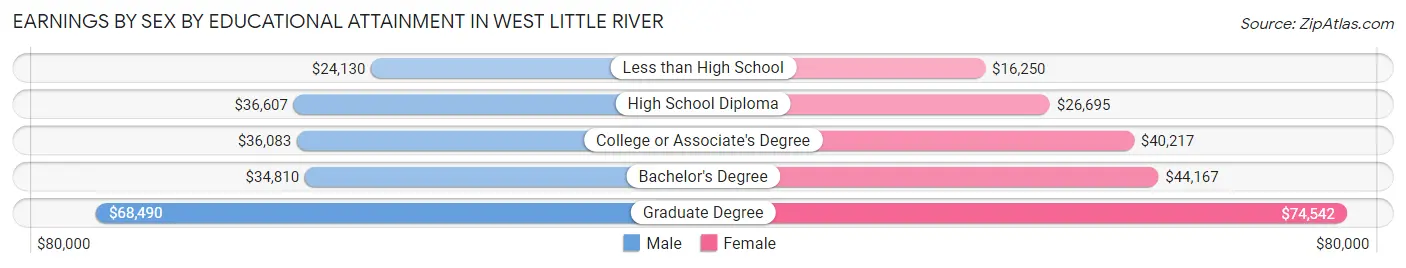
Earnings by Sex by Educational Attainment in West Little River
Average earnings in West Little River are $34,196 for men and $33,101 for women, a difference of 3.2%. Men with an educational attainment of graduate degree enjoy the highest average annual earnings of $68,490, while those with less than high school education earn the least with $24,130. Women with an educational attainment of graduate degree earn the most with the average annual earnings of $74,542, while those with less than high school education have the smallest earnings of $16,250.
| Educational Attainment | Male Income | Female Income |
| Less than High School | $24,130 | $16,250 |
| High School Diploma | $36,607 | $26,695 |
| College or Associate's Degree | $36,083 | $40,217 |
| Bachelor's Degree | $34,810 | $44,167 |
| Graduate Degree | $68,490 | $74,542 |
| Total | $34,196 | $33,101 |
Family Income in West Little River
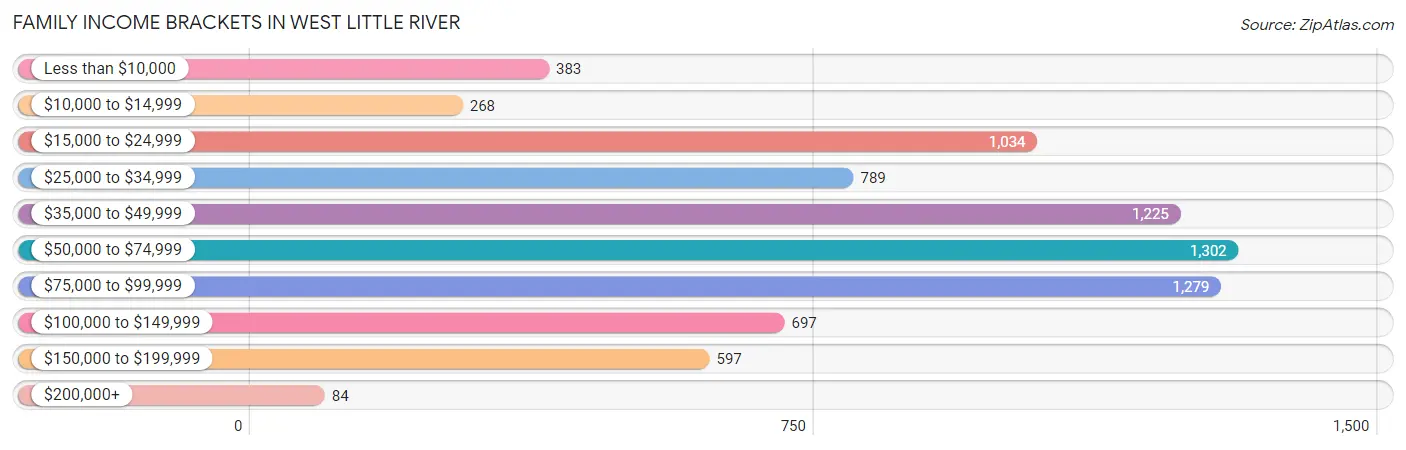
Family Income Brackets in West Little River
According to the West Little River family income data, there are 1,302 families falling into the $50,000 to $74,999 income range, which is the most common income bracket and makes up 17.0% of all families. Conversely, the $200,000+ income bracket is the least frequent group with only 84 families (1.1%) belonging to this category.
| Income Bracket | # Families | % Families |
| Less than $10,000 | 383 | 5.0% |
| $10,000 to $14,999 | 268 | 3.5% |
| $15,000 to $24,999 | 1,034 | 13.5% |
| $25,000 to $34,999 | 789 | 10.3% |
| $35,000 to $49,999 | 1,225 | 16.0% |
| $50,000 to $74,999 | 1,302 | 17.0% |
| $75,000 to $99,999 | 1,279 | 16.7% |
| $100,000 to $149,999 | 697 | 9.1% |
| $150,000 to $199,999 | 597 | 7.8% |
| $200,000+ | 84 | 1.1% |
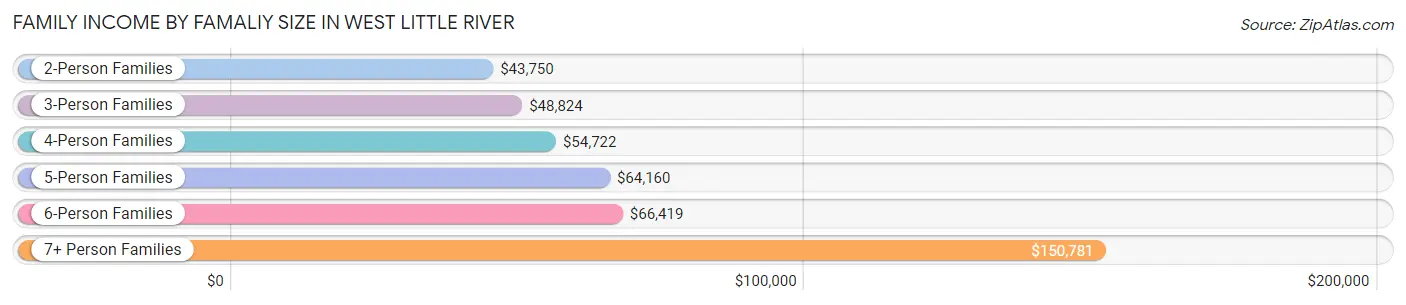
Family Income by Famaliy Size in West Little River
7+ person families (259 | 3.4%) account for the highest median family income in West Little River with $150,781 per family, while 2-person families (2,643 | 34.5%) have the highest median income of $21,875 per family member.
| Income Bracket | # Families | Median Income |
| 2-Person Families | 2,643 (34.5%) | $43,750 |
| 3-Person Families | 2,158 (28.2%) | $48,824 |
| 4-Person Families | 1,384 (18.1%) | $54,722 |
| 5-Person Families | 867 (11.3%) | $64,160 |
| 6-Person Families | 348 (4.5%) | $66,419 |
| 7+ Person Families | 259 (3.4%) | $150,781 |
| Total | 7,659 (100.0%) | $52,432 |
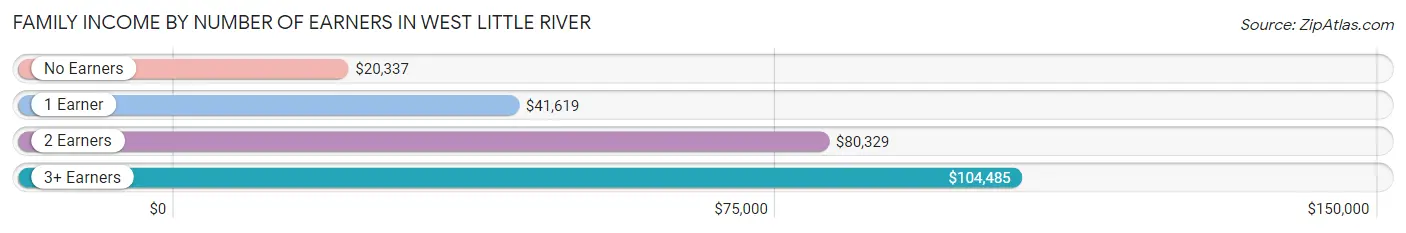
Family Income by Number of Earners in West Little River
The median family income in West Little River is $52,432, with families comprising 3+ earners (967) having the highest median family income of $104,485, while families with no earners (1,170) have the lowest median family income of $20,337, accounting for 12.6% and 15.3% of families, respectively.
| Number of Earners | # Families | Median Income |
| No Earners | 1,170 (15.3%) | $20,337 |
| 1 Earner | 2,898 (37.8%) | $41,619 |
| 2 Earners | 2,624 (34.3%) | $80,329 |
| 3+ Earners | 967 (12.6%) | $104,485 |
| Total | 7,659 (100.0%) | $52,432 |
Household Income in West Little River
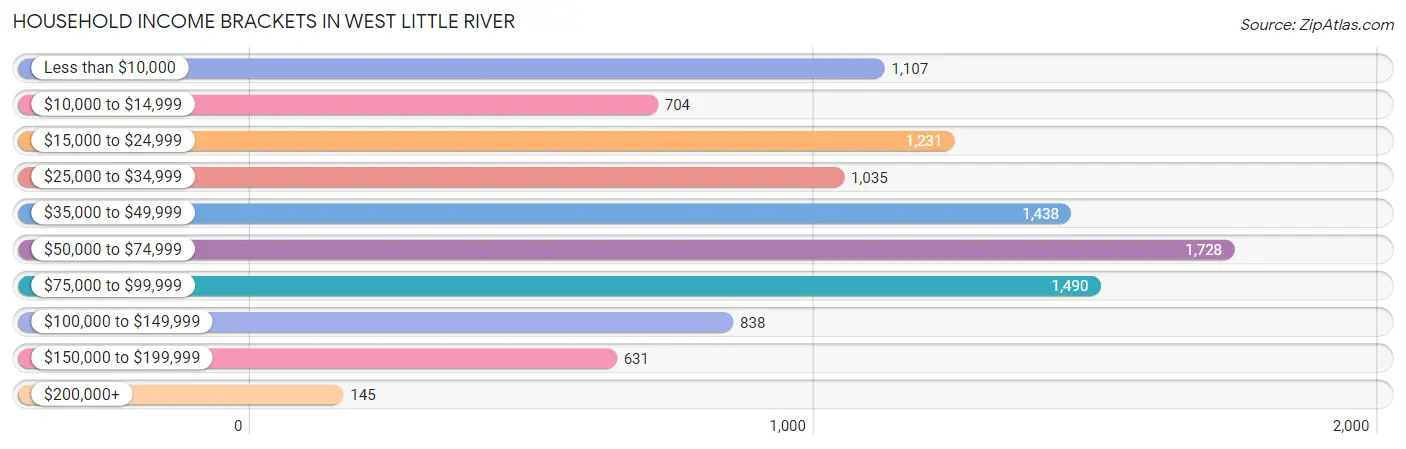
Household Income Brackets in West Little River
With 1,728 households falling in the category, the $50,000 to $74,999 income range is the most frequent in West Little River, accounting for 16.7% of all households. In contrast, only 145 households (1.4%) fall into the $200,000+ income bracket, making it the least populous group.
| Income Bracket | # Households | % Households |
| Less than $10,000 | 1,107 | 10.7% |
| $10,000 to $14,999 | 704 | 6.8% |
| $15,000 to $24,999 | 1,231 | 11.9% |
| $25,000 to $34,999 | 1,035 | 10.0% |
| $35,000 to $49,999 | 1,438 | 13.9% |
| $50,000 to $74,999 | 1,728 | 16.7% |
| $75,000 to $99,999 | 1,490 | 14.4% |
| $100,000 to $149,999 | 838 | 8.1% |
| $150,000 to $199,999 | 631 | 6.1% |
| $200,000+ | 145 | 1.4% |
Household Income by Householder Age in West Little River
The median household income in West Little River is $46,518, with the highest median household income of $57,830 found in the 45 to 64 years age bracket for the primary householder. A total of 4,132 households (39.9%) fall into this category. Meanwhile, the 65+ years age bracket for the primary householder has the lowest median household income of $30,216, with 3,218 households (31.1%) in this group.
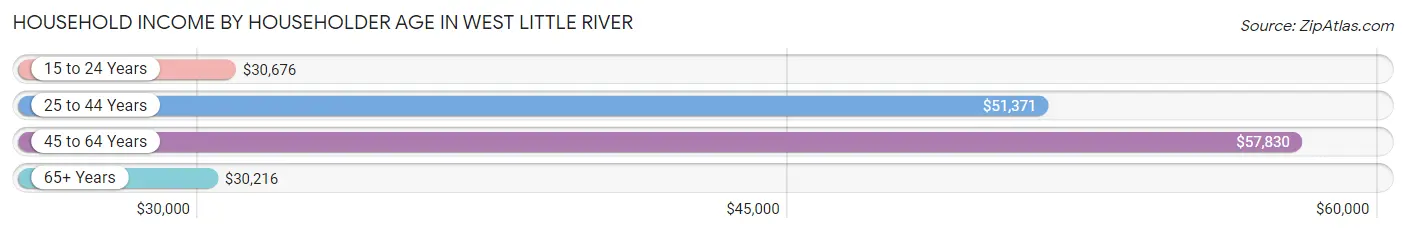
| Income Bracket | # Households | Median Income |
| 15 to 24 Years | 68 (0.7%) | $30,676 |
| 25 to 44 Years | 2,929 (28.3%) | $51,371 |
| 45 to 64 Years | 4,132 (39.9%) | $57,830 |
| 65+ Years | 3,218 (31.1%) | $30,216 |
| Total | 10,347 (100.0%) | $46,518 |
Poverty in West Little River
Income Below Poverty by Sex and Age in West Little River
With 22.2% poverty level for males and 23.7% for females among the residents of West Little River, 12 to 14 year old males and 12 to 14 year old females are the most vulnerable to poverty, with 216 males (46.4%) and 322 females (44.9%) in their respective age groups living below the poverty level.
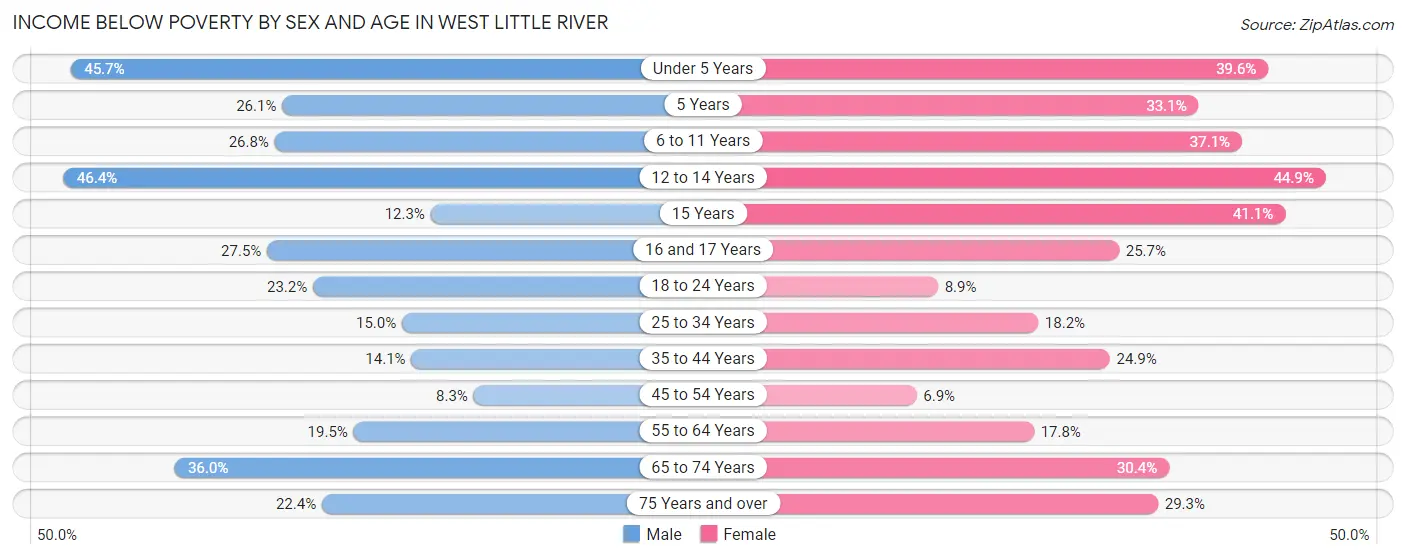
| Age Bracket | Male | Female |
| Under 5 Years | 531 (45.7%) | 442 (39.6%) |
| 5 Years | 24 (26.1%) | 48 (33.1%) |
| 6 to 11 Years | 416 (26.8%) | 456 (37.1%) |
| 12 to 14 Years | 216 (46.4%) | 322 (44.9%) |
| 15 Years | 16 (12.3%) | 65 (41.1%) |
| 16 and 17 Years | 69 (27.5%) | 27 (25.7%) |
| 18 to 24 Years | 275 (23.2%) | 116 (8.9%) |
| 25 to 34 Years | 312 (15.0%) | 359 (18.2%) |
| 35 to 44 Years | 329 (14.1%) | 543 (24.8%) |
| 45 to 54 Years | 169 (8.3%) | 140 (6.9%) |
| 55 to 64 Years | 508 (19.5%) | 430 (17.8%) |
| 65 to 74 Years | 555 (36.0%) | 678 (30.4%) |
| 75 Years and over | 226 (22.4%) | 337 (29.3%) |
| Total | 3,646 (22.2%) | 3,963 (23.7%) |
Income Above Poverty by Sex and Age in West Little River
According to the poverty statistics in West Little River, males aged 45 to 54 years and females aged 45 to 54 years are the age groups that are most secure financially, with 91.7% of males and 93.1% of females in these age groups living above the poverty line.
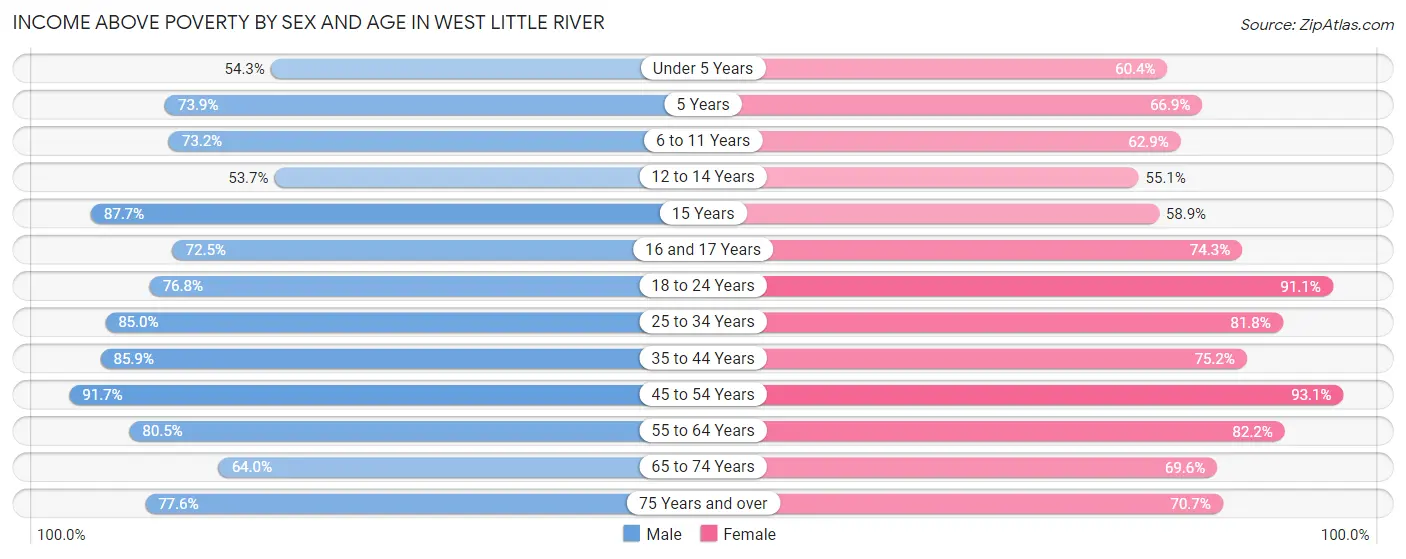
| Age Bracket | Male | Female |
| Under 5 Years | 632 (54.3%) | 675 (60.4%) |
| 5 Years | 68 (73.9%) | 97 (66.9%) |
| 6 to 11 Years | 1,137 (73.2%) | 772 (62.9%) |
| 12 to 14 Years | 250 (53.6%) | 395 (55.1%) |
| 15 Years | 114 (87.7%) | 93 (58.9%) |
| 16 and 17 Years | 182 (72.5%) | 78 (74.3%) |
| 18 to 24 Years | 909 (76.8%) | 1,188 (91.1%) |
| 25 to 34 Years | 1,772 (85.0%) | 1,613 (81.8%) |
| 35 to 44 Years | 2,005 (85.9%) | 1,642 (75.1%) |
| 45 to 54 Years | 1,863 (91.7%) | 1,883 (93.1%) |
| 55 to 64 Years | 2,102 (80.5%) | 1,985 (82.2%) |
| 65 to 74 Years | 985 (64.0%) | 1,555 (69.6%) |
| 75 Years and over | 783 (77.6%) | 812 (70.7%) |
| Total | 12,802 (77.8%) | 12,788 (76.3%) |
Income Below Poverty Among Married-Couple Families in West Little River
The poverty statistics for married-couple families in West Little River show that 11.1% or 378 of the total 3,404 families live below the poverty line. Families with 3 or 4 children have the highest poverty rate of 20.1%, comprising of 28 families. On the other hand, families with 5 or more children have the lowest poverty rate of 0.0%, which includes 0 families.
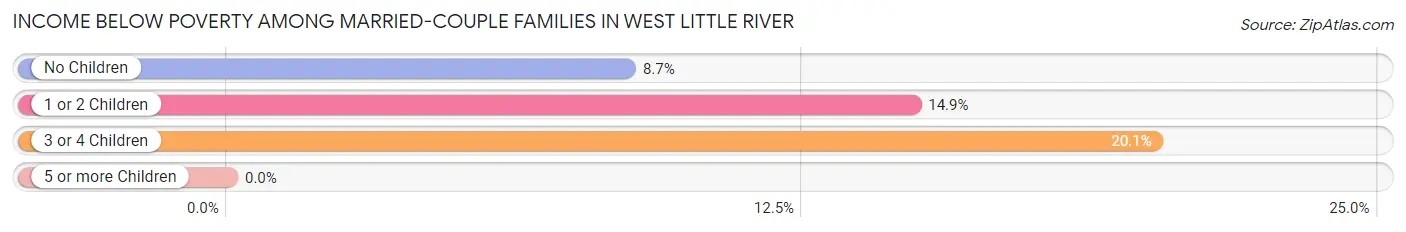
| Children | Above Poverty | Below Poverty |
| No Children | 1,941 (91.3%) | 184 (8.7%) |
| 1 or 2 Children | 950 (85.1%) | 166 (14.9%) |
| 3 or 4 Children | 111 (79.9%) | 28 (20.1%) |
| 5 or more Children | 24 (100.0%) | 0 (0.0%) |
| Total | 3,026 (88.9%) | 378 (11.1%) |
Income Below Poverty Among Single-Parent Households in West Little River
According to the poverty data in West Little River, 24.0% or 282 single-father households and 24.5% or 756 single-mother households are living below the poverty line. Among single-father households, those with 3 or 4 children have the highest poverty rate, with 69 households (53.1%) experiencing poverty. Likewise, among single-mother households, those with 5 or more children have the highest poverty rate, with 71 households (69.6%) falling below the poverty line.
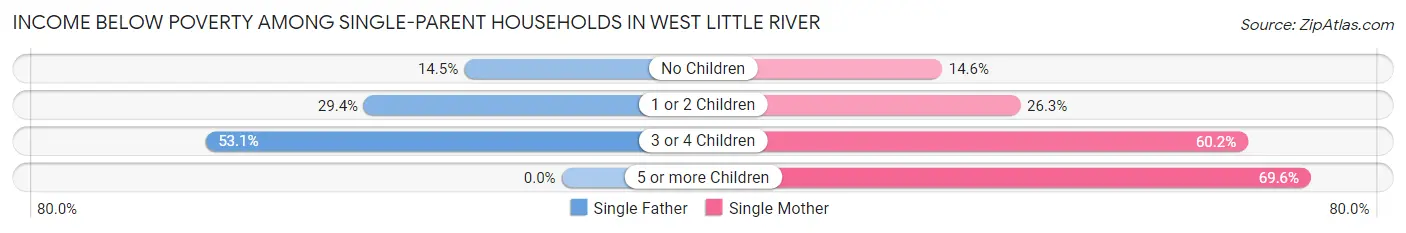
| Children | Single Father | Single Mother |
| No Children | 92 (14.5%) | 231 (14.6%) |
| 1 or 2 Children | 121 (29.4%) | 301 (26.3%) |
| 3 or 4 Children | 69 (53.1%) | 153 (60.2%) |
| 5 or more Children | 0 (0.0%) | 71 (69.6%) |
| Total | 282 (24.0%) | 756 (24.5%) |
Income Below Poverty Among Married-Couple vs Single-Parent Households in West Little River
The poverty data for West Little River shows that 378 of the married-couple family households (11.1%) and 1,038 of the single-parent households (24.4%) are living below the poverty level. Within the married-couple family households, those with 3 or 4 children have the highest poverty rate, with 28 households (20.1%) falling below the poverty line. Among the single-parent households, those with 5 or more children have the highest poverty rate, with 71 household (69.6%) living below poverty.
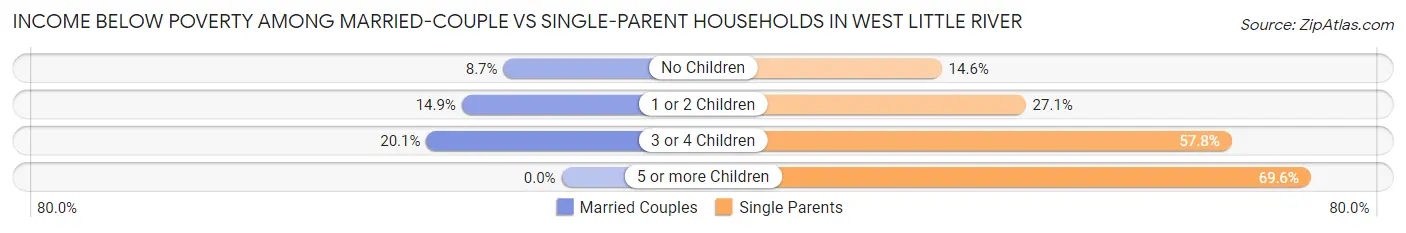
| Children | Married-Couple Families | Single-Parent Households |
| No Children | 184 (8.7%) | 323 (14.6%) |
| 1 or 2 Children | 166 (14.9%) | 422 (27.1%) |
| 3 or 4 Children | 28 (20.1%) | 222 (57.8%) |
| 5 or more Children | 0 (0.0%) | 71 (69.6%) |
| Total | 378 (11.1%) | 1,038 (24.4%) |
Race in West Little River
The most populous races in West Little River are Hispanic or Latino (17,662 | 52.8%), Black / African American (16,018 | 47.9%), and White / Caucasian (6,625 | 19.8%).
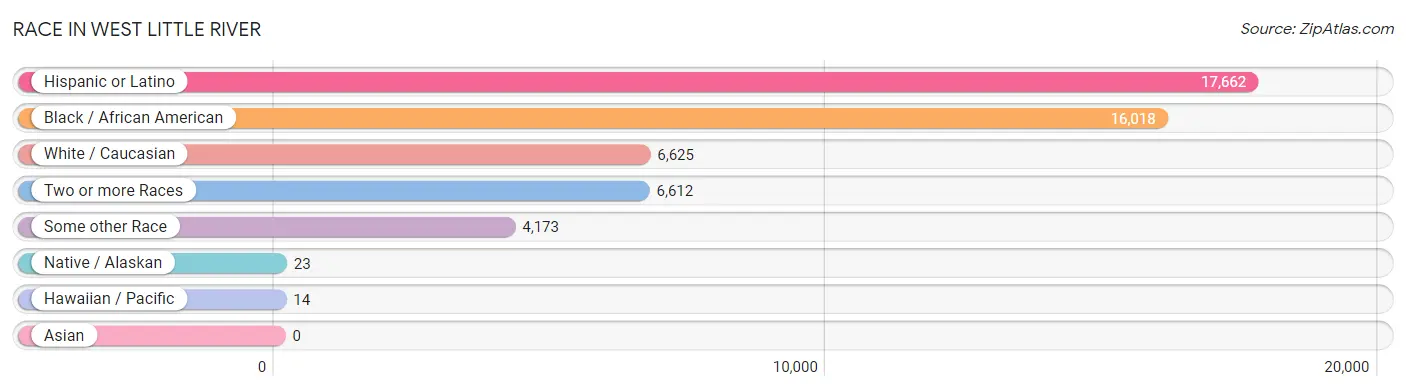
| Race | # Population | % Population |
| Asian | 0 | 0.0% |
| Black / African American | 16,018 | 47.9% |
| Hawaiian / Pacific | 14 | 0.0% |
| Hispanic or Latino | 17,662 | 52.8% |
| Native / Alaskan | 23 | 0.1% |
| White / Caucasian | 6,625 | 19.8% |
| Two or more Races | 6,612 | 19.8% |
| Some other Race | 4,173 | 12.5% |
| Total | 33,465 | 100.0% |
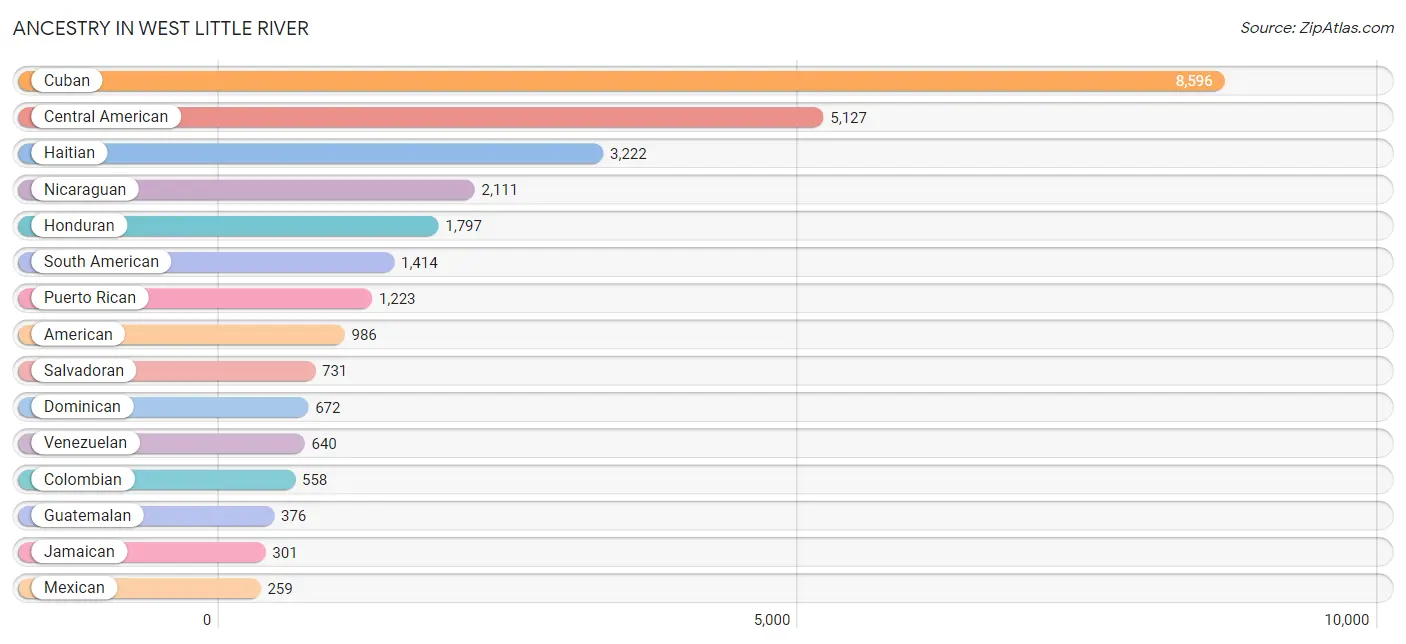
Ancestry in West Little River
The most populous ancestries reported in West Little River are Cuban (8,596 | 25.7%), Central American (5,127 | 15.3%), Haitian (3,222 | 9.6%), Nicaraguan (2,111 | 6.3%), and Honduran (1,797 | 5.4%), together accounting for 62.3% of all West Little River residents.
| Ancestry | # Population | % Population |
| African | 223 | 0.7% |
| American | 986 | 2.9% |
| Arab | 21 | 0.1% |
| Argentinean | 73 | 0.2% |
| Bahamian | 131 | 0.4% |
| Belizean | 12 | 0.0% |
| Brazilian | 51 | 0.2% |
| British West Indian | 39 | 0.1% |
| Central American | 5,127 | 15.3% |
| Central American Indian | 34 | 0.1% |
| Colombian | 558 | 1.7% |
| Costa Rican | 112 | 0.3% |
| Cuban | 8,596 | 25.7% |
| Dominican | 672 | 2.0% |
| Ecuadorian | 70 | 0.2% |
| English | 26 | 0.1% |
| French | 34 | 0.1% |
| German | 38 | 0.1% |
| Guatemalan | 376 | 1.1% |
| Haitian | 3,222 | 9.6% |
| Honduran | 1,797 | 5.4% |
| Iranian | 28 | 0.1% |
| Irish | 126 | 0.4% |
| Italian | 113 | 0.3% |
| Jamaican | 301 | 0.9% |
| Lebanese | 21 | 0.1% |
| Mexican | 259 | 0.8% |
| Nicaraguan | 2,111 | 6.3% |
| Peruvian | 73 | 0.2% |
| Puerto Rican | 1,223 | 3.6% |
| Romanian | 19 | 0.1% |
| Salvadoran | 731 | 2.2% |
| Scottish | 34 | 0.1% |
| South American | 1,414 | 4.2% |
| Subsaharan African | 223 | 0.7% |
| Swedish | 25 | 0.1% |
| Trinidadian and Tobagonian | 27 | 0.1% |
| Ukrainian | 40 | 0.1% |
| Venezuelan | 640 | 1.9% |
| West Indian | 46 | 0.1% | View All 40 Rows |
Immigrants in West Little River
The most numerous immigrant groups reported in West Little River came from Latin America (14,382 | 43.0%), Caribbean (9,351 | 27.9%), Cuba (6,474 | 19.4%), Central America (3,669 | 11.0%), and Haiti (2,048 | 6.1%), together accounting for 107.3% of all West Little River residents.
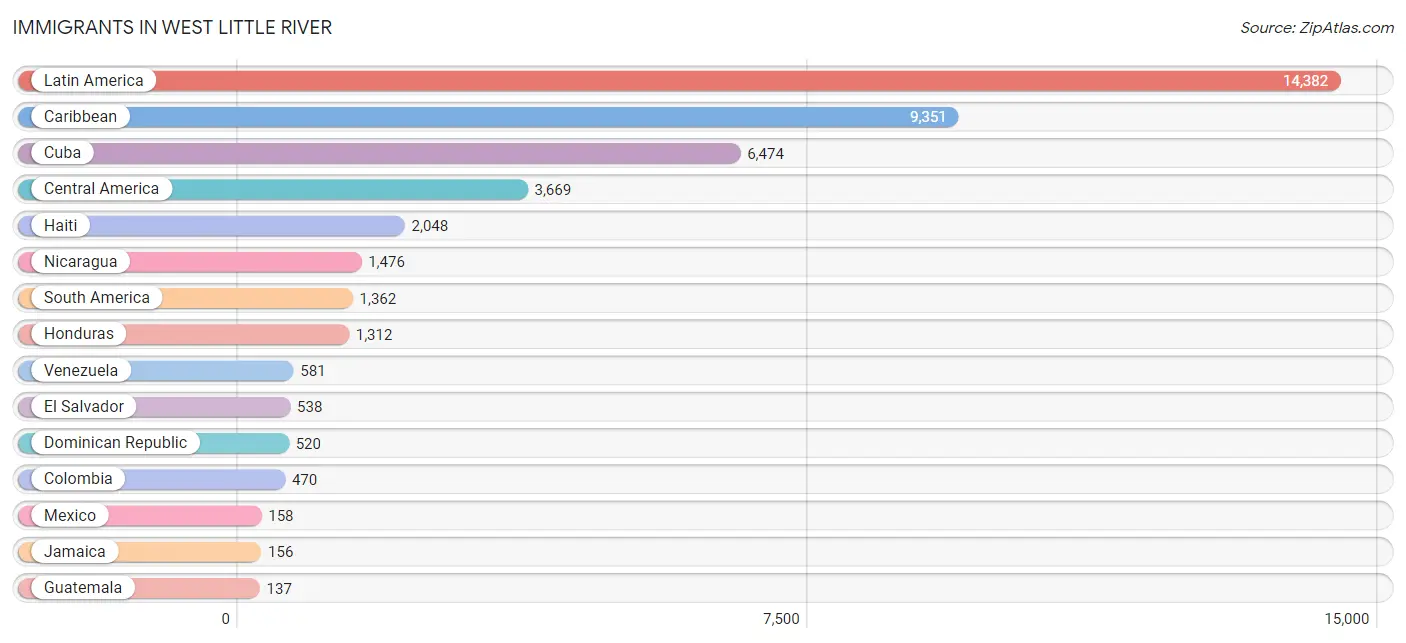
| Immigration Origin | # Population | % Population |
| Argentina | 63 | 0.2% |
| Asia | 8 | 0.0% |
| Bahamas | 26 | 0.1% |
| Barbados | 8 | 0.0% |
| Belize | 19 | 0.1% |
| Bolivia | 54 | 0.2% |
| Brazil | 51 | 0.2% |
| Caribbean | 9,351 | 27.9% |
| Central America | 3,669 | 11.0% |
| Colombia | 470 | 1.4% |
| Costa Rica | 29 | 0.1% |
| Cuba | 6,474 | 19.4% |
| Dominican Republic | 520 | 1.5% |
| Eastern Europe | 40 | 0.1% |
| Ecuador | 70 | 0.2% |
| El Salvador | 538 | 1.6% |
| Europe | 120 | 0.4% |
| Germany | 15 | 0.0% |
| Grenada | 28 | 0.1% |
| Guatemala | 137 | 0.4% |
| Haiti | 2,048 | 6.1% |
| Honduras | 1,312 | 3.9% |
| Iran | 8 | 0.0% |
| Jamaica | 156 | 0.5% |
| Latin America | 14,382 | 43.0% |
| Mexico | 158 | 0.5% |
| Nicaragua | 1,476 | 4.4% |
| Northern Europe | 34 | 0.1% |
| Peru | 73 | 0.2% |
| South America | 1,362 | 4.1% |
| South Central Asia | 8 | 0.0% |
| Southern Europe | 31 | 0.1% |
| Spain | 31 | 0.1% |
| St. Vincent and the Grenadines | 8 | 0.0% |
| Sweden | 25 | 0.1% |
| Trinidad and Tobago | 72 | 0.2% |
| Ukraine | 40 | 0.1% |
| Venezuela | 581 | 1.7% |
| Western Europe | 15 | 0.0% | View All 39 Rows |
Sex and Age in West Little River
Sex and Age in West Little River
The most populous age groups in West Little River are 55 to 59 Years (1,635 | 9.9%) for men and 40 to 44 Years (1,253 | 7.4%) for women.
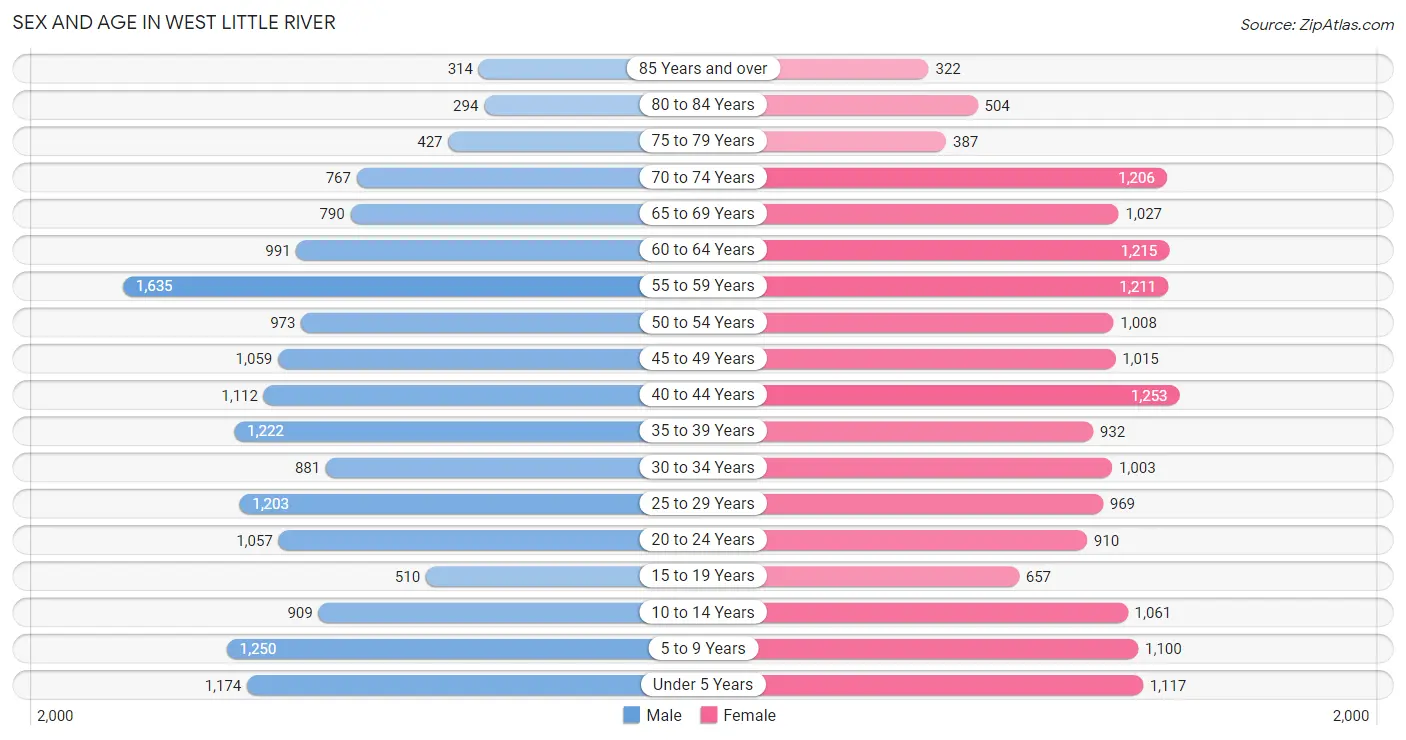
| Age Bracket | Male | Female |
| Under 5 Years | 1,174 (7.1%) | 1,117 (6.6%) |
| 5 to 9 Years | 1,250 (7.5%) | 1,100 (6.5%) |
| 10 to 14 Years | 909 (5.5%) | 1,061 (6.3%) |
| 15 to 19 Years | 510 (3.1%) | 657 (3.9%) |
| 20 to 24 Years | 1,057 (6.4%) | 910 (5.4%) |
| 25 to 29 Years | 1,203 (7.3%) | 969 (5.7%) |
| 30 to 34 Years | 881 (5.3%) | 1,003 (5.9%) |
| 35 to 39 Years | 1,222 (7.4%) | 932 (5.5%) |
| 40 to 44 Years | 1,112 (6.7%) | 1,253 (7.4%) |
| 45 to 49 Years | 1,059 (6.4%) | 1,015 (6.0%) |
| 50 to 54 Years | 973 (5.9%) | 1,008 (6.0%) |
| 55 to 59 Years | 1,635 (9.9%) | 1,211 (7.2%) |
| 60 to 64 Years | 991 (6.0%) | 1,215 (7.2%) |
| 65 to 69 Years | 790 (4.8%) | 1,027 (6.1%) |
| 70 to 74 Years | 767 (4.6%) | 1,206 (7.1%) |
| 75 to 79 Years | 427 (2.6%) | 387 (2.3%) |
| 80 to 84 Years | 294 (1.8%) | 504 (3.0%) |
| 85 Years and over | 314 (1.9%) | 322 (1.9%) |
| Total | 16,568 (100.0%) | 16,897 (100.0%) |
Families and Households in West Little River
Median Family Size in West Little River
The median family size in West Little River is 3.78 persons per family, with married-couple families (3,404 | 44.4%) accounting for the largest median family size of 3.94 persons per family. On the other hand, single male/father families (1,174 | 15.3%) represent the smallest median family size with 3.17 persons per family.
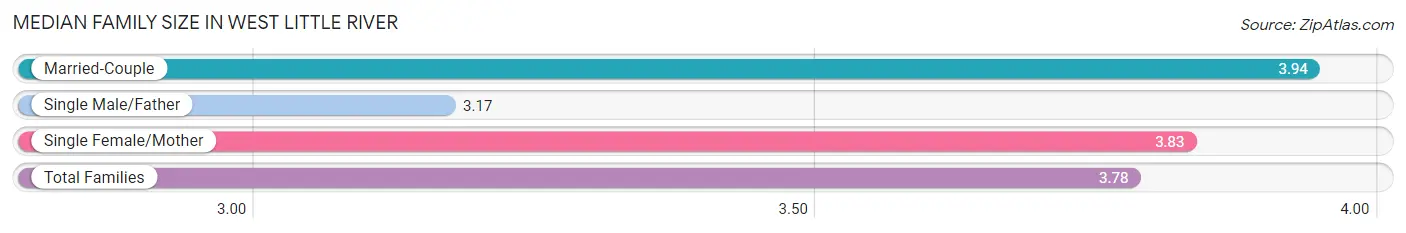
| Family Type | # Families | Family Size |
| Married-Couple | 3,404 (44.4%) | 3.94 |
| Single Male/Father | 1,174 (15.3%) | 3.17 |
| Single Female/Mother | 3,081 (40.2%) | 3.83 |
| Total Families | 7,659 (100.0%) | 3.78 |
Median Household Size in West Little River
The median household size in West Little River is 3.22 persons per household, with single female/mother households (3,081 | 29.8%) accounting for the largest median household size of 4.12 persons per household. non-family households (2,688 | 26.0%) represent the smallest median household size with 1.15 persons per household.
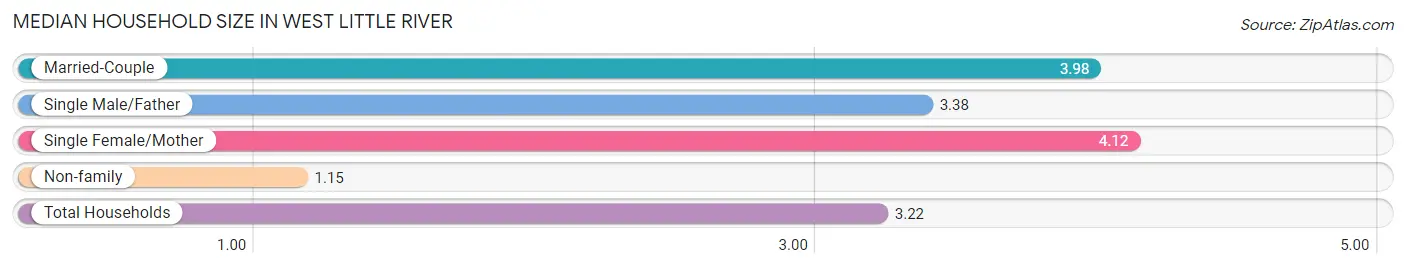
| Household Type | # Households | Household Size |
| Married-Couple | 3,404 (32.9%) | 3.98 |
| Single Male/Father | 1,174 (11.4%) | 3.38 |
| Single Female/Mother | 3,081 (29.8%) | 4.12 |
| Non-family | 2,688 (26.0%) | 1.15 |
| Total Households | 10,347 (100.0%) | 3.22 |
Household Size by Marriage Status in West Little River
Out of a total of 10,347 households in West Little River, 7,659 (74.0%) are family households, while 2,688 (26.0%) are nonfamily households. The most numerous type of family households are 2-person households, comprising 2,447, and the most common type of nonfamily households are 1-person households, comprising 2,372.
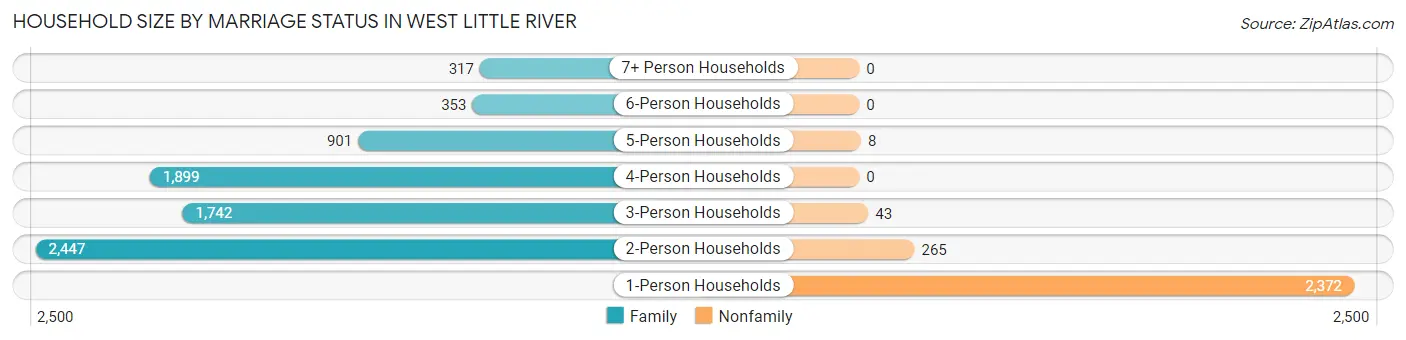
| Household Size | Family Households | Nonfamily Households |
| 1-Person Households | - | 2,372 (22.9%) |
| 2-Person Households | 2,447 (23.6%) | 265 (2.6%) |
| 3-Person Households | 1,742 (16.8%) | 43 (0.4%) |
| 4-Person Households | 1,899 (18.3%) | 0 (0.0%) |
| 5-Person Households | 901 (8.7%) | 8 (0.1%) |
| 6-Person Households | 353 (3.4%) | 0 (0.0%) |
| 7+ Person Households | 317 (3.1%) | 0 (0.0%) |
| Total | 7,659 (74.0%) | 2,688 (26.0%) |
Female Fertility in West Little River
Fertility by Age in West Little River
Average fertility rate in West Little River is 52.0 births per 1,000 women. Women in the age bracket of 20 to 34 years have the highest fertility rate with 77.0 births per 1,000 women. Women in the age bracket of 20 to 34 years acount for 62.1% of all women with births.
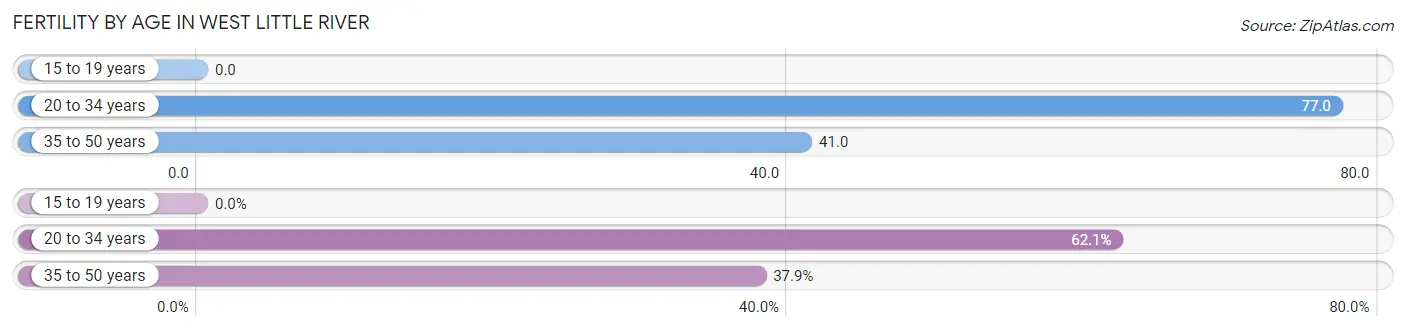
| Age Bracket | Women with Births | Births / 1,000 Women |
| 15 to 19 years | 0 (0.0%) | 0.0 |
| 20 to 34 years | 223 (62.1%) | 77.0 |
| 35 to 50 years | 136 (37.9%) | 41.0 |
| Total | 359 (100.0%) | 52.0 |
Fertility by Age by Marriage Status in West Little River
43.7% of women with births (359) in West Little River are married. The highest percentage of unmarried women with births falls into 20 to 34 years age bracket with 56.5% of them unmarried at the time of birth, while the lowest percentage of unmarried women with births belong to 35 to 50 years age bracket with 55.9% of them unmarried.
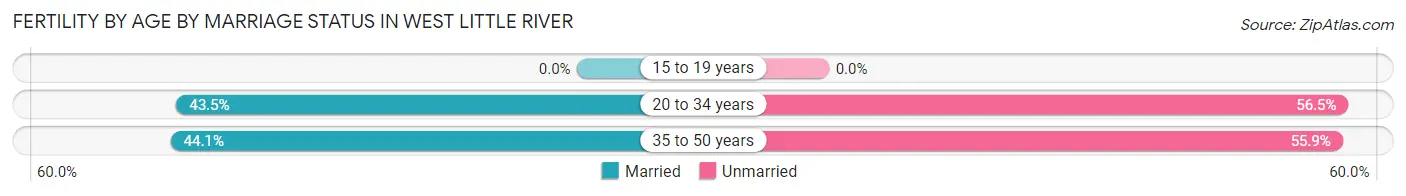
| Age Bracket | Married | Unmarried |
| 15 to 19 years | 0 (0.0%) | 0 (0.0%) |
| 20 to 34 years | 97 (43.5%) | 126 (56.5%) |
| 35 to 50 years | 60 (44.1%) | 76 (55.9%) |
| Total | 157 (43.7%) | 202 (56.3%) |
Fertility by Education in West Little River
Average fertility rate in West Little River is 52.0 births per 1,000 women. Women with the education attainment of high school diploma have the highest fertility rate of 81.0 births per 1,000 women, while women with the education attainment of bachelor's degree have the lowest fertility at 25.0 births per 1,000 women. Women with the education attainment of high school diploma represent 43.4% of all women with births.
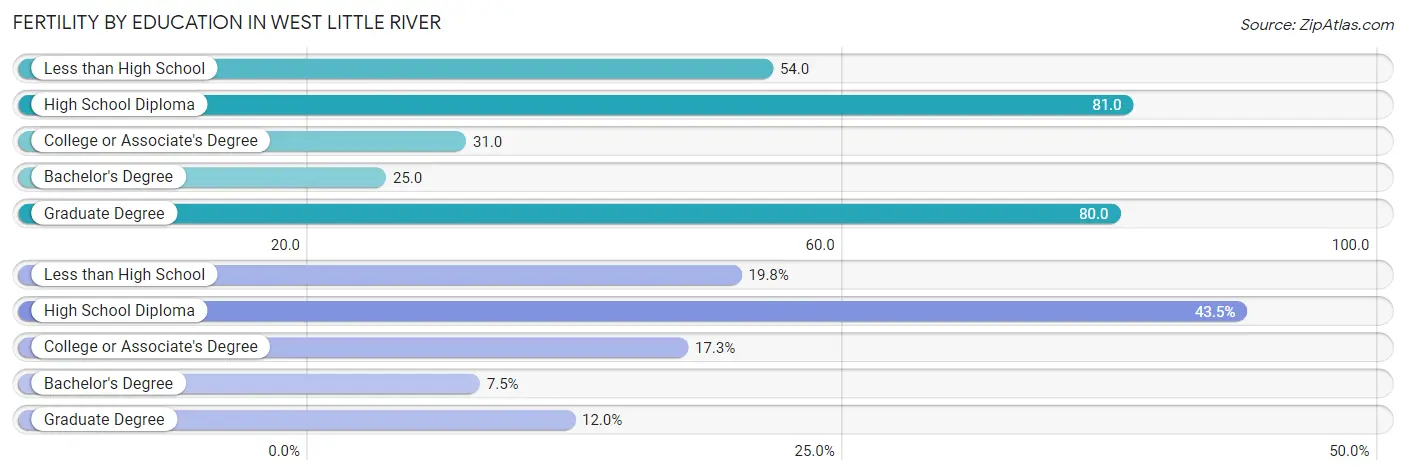
| Educational Attainment | Women with Births | Births / 1,000 Women |
| Less than High School | 71 (19.8%) | 54.0 |
| High School Diploma | 156 (43.4%) | 81.0 |
| College or Associate's Degree | 62 (17.3%) | 31.0 |
| Bachelor's Degree | 27 (7.5%) | 25.0 |
| Graduate Degree | 43 (12.0%) | 80.0 |
| Total | 359 (100.0%) | 52.0 |
Fertility by Education by Marriage Status in West Little River
56.3% of women with births in West Little River are unmarried. Women with the educational attainment of bachelor's degree are most likely to be married with 100.0% of them married at childbirth, while women with the educational attainment of graduate degree are least likely to be married with 100.0% of them unmarried at childbirth.
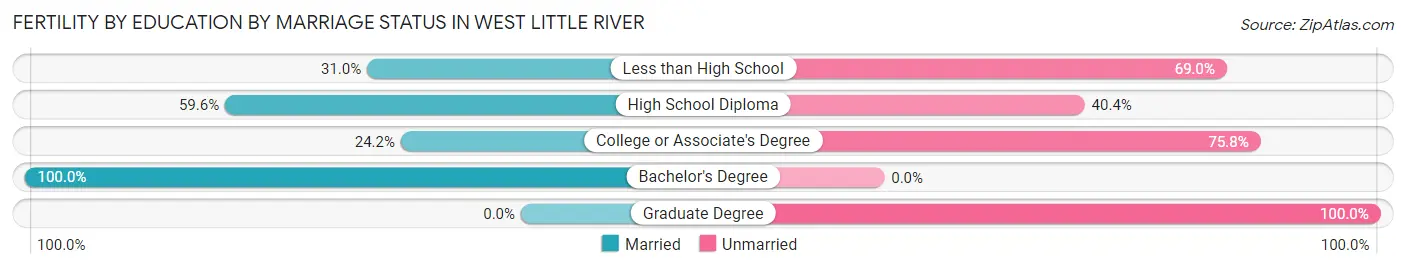
| Educational Attainment | Married | Unmarried |
| Less than High School | 22 (31.0%) | 49 (69.0%) |
| High School Diploma | 93 (59.6%) | 63 (40.4%) |
| College or Associate's Degree | 15 (24.2%) | 47 (75.8%) |
| Bachelor's Degree | 27 (100.0%) | 0 (0.0%) |
| Graduate Degree | 0 (0.0%) | 43 (100.0%) |
| Total | 157 (43.7%) | 202 (56.3%) |
Employment Characteristics in West Little River
Employment by Class of Employer in West Little River
Among the 13,649 employed individuals in West Little River, private company employees (9,751 | 71.4%), self-employed (not incorporated) (968 | 7.1%), and local government employees (870 | 6.4%) make up the most common classes of employment.
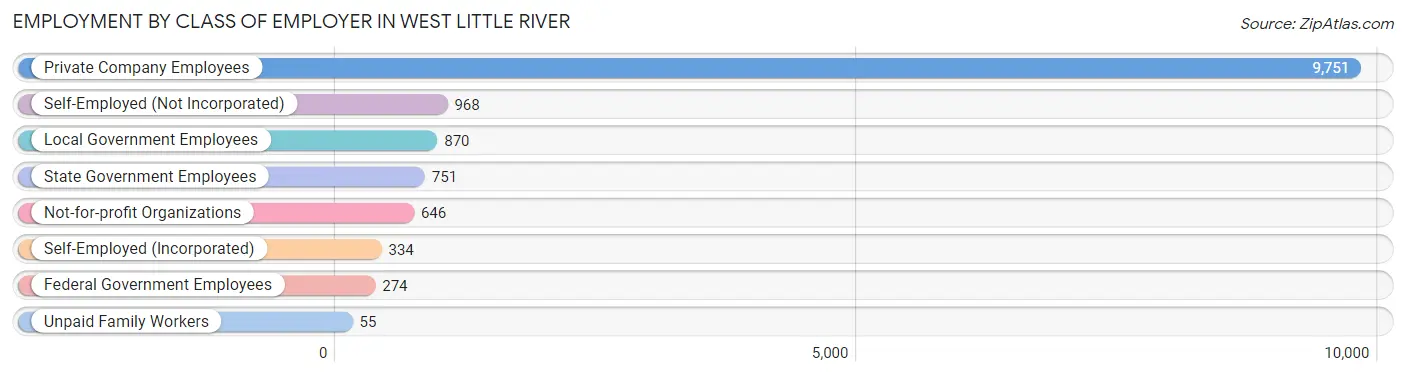
| Employer Class | # Employees | % Employees |
| Private Company Employees | 9,751 | 71.4% |
| Self-Employed (Incorporated) | 334 | 2.5% |
| Self-Employed (Not Incorporated) | 968 | 7.1% |
| Not-for-profit Organizations | 646 | 4.7% |
| Local Government Employees | 870 | 6.4% |
| State Government Employees | 751 | 5.5% |
| Federal Government Employees | 274 | 2.0% |
| Unpaid Family Workers | 55 | 0.4% |
| Total | 13,649 | 100.0% |
Employment Status by Age in West Little River
According to the labor force statistics for West Little River, out of the total population over 16 years of age (26,565), 55.9% or 14,850 individuals are in the labor force, with 6.4% or 950 of them unemployed. The age group with the highest labor force participation rate is 45 to 54 years, with 81.7% or 3,313 individuals in the labor force. Within the labor force, the 20 to 24 years age range has the highest percentage of unemployed individuals, with 26.6% or 361 of them being unemployed.
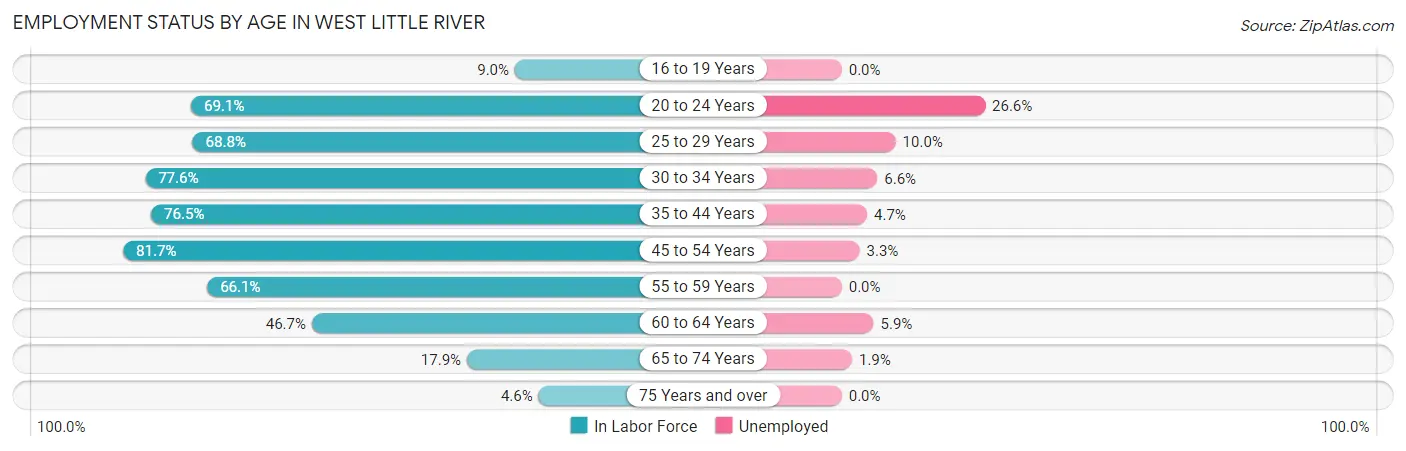
| Age Bracket | In Labor Force | Unemployed |
| 16 to 19 Years | 79 (9.0%) | 0 (0.0%) |
| 20 to 24 Years | 1,359 (69.1%) | 361 (26.6%) |
| 25 to 29 Years | 1,494 (68.8%) | 149 (10.0%) |
| 30 to 34 Years | 1,462 (77.6%) | 96 (6.6%) |
| 35 to 44 Years | 3,457 (76.5%) | 162 (4.7%) |
| 45 to 54 Years | 3,313 (81.7%) | 109 (3.3%) |
| 55 to 59 Years | 1,881 (66.1%) | 0 (0.0%) |
| 60 to 64 Years | 1,030 (46.7%) | 61 (5.9%) |
| 65 to 74 Years | 678 (17.9%) | 13 (1.9%) |
| 75 Years and over | 103 (4.6%) | 0 (0.0%) |
| Total | 14,850 (55.9%) | 950 (6.4%) |
Employment Status by Educational Attainment in West Little River
According to labor force statistics for West Little River, 71.5% of individuals (12,643) out of the total population between 25 and 64 years of age (17,682) are in the labor force, with 4.6% or 582 of them being unemployed. The group with the highest labor force participation rate are those with the educational attainment of bachelor's degree or higher, with 83.3% or 2,606 individuals in the labor force. Within the labor force, individuals with high school diploma education have the highest percentage of unemployment, with 7.0% or 311 of them being unemployed.
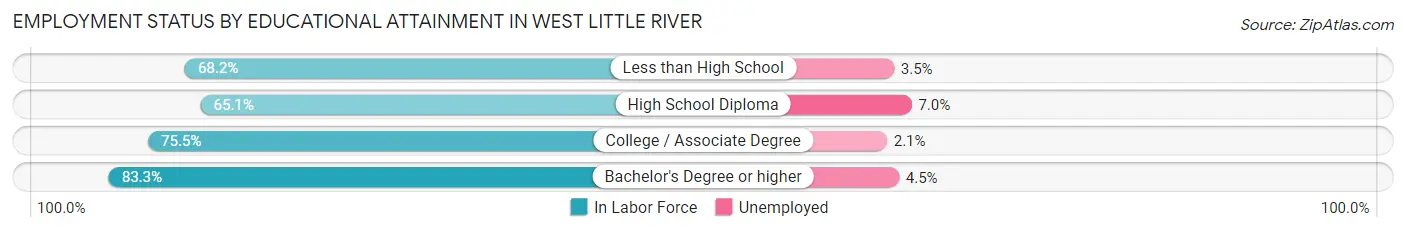
| Educational Attainment | In Labor Force | Unemployed |
| Less than High School | 2,317 (68.2%) | 119 (3.5%) |
| High School Diploma | 4,446 (65.1%) | 478 (7.0%) |
| College / Associate Degree | 3,266 (75.5%) | 91 (2.1%) |
| Bachelor's Degree or higher | 2,606 (83.3%) | 141 (4.5%) |
| Total | 12,643 (71.5%) | 813 (4.6%) |
Employment Occupations by Sex in West Little River
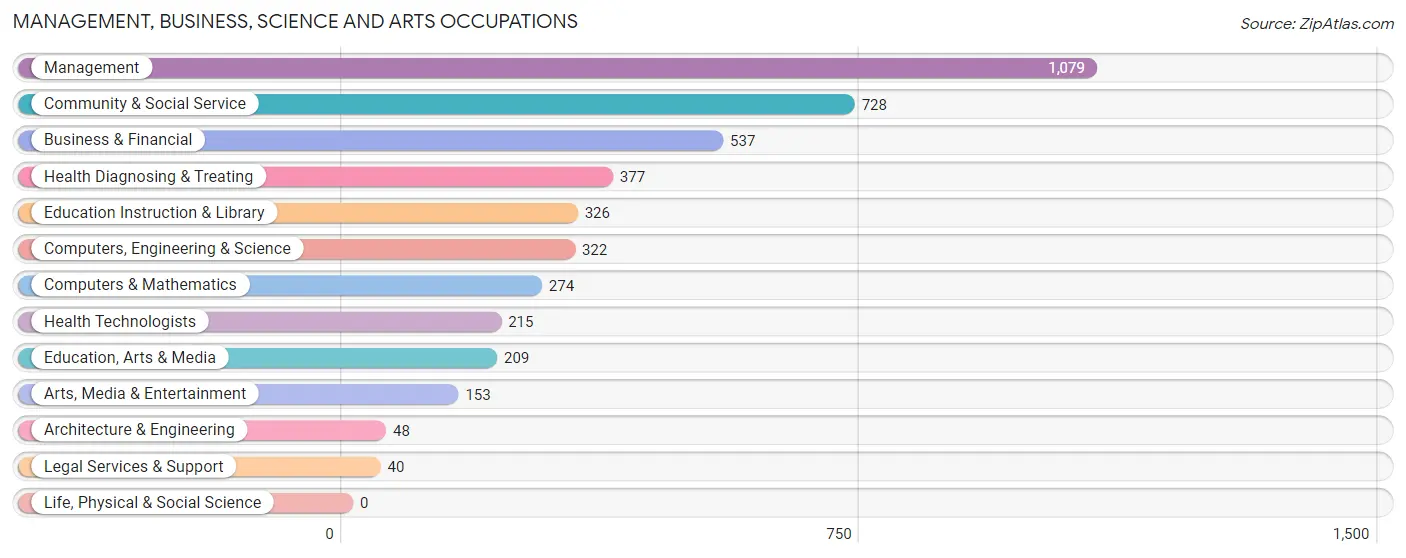
Management, Business, Science and Arts Occupations
The most common Management, Business, Science and Arts occupations in West Little River are Management (1,079 | 7.8%), Community & Social Service (728 | 5.2%), Business & Financial (537 | 3.9%), Health Diagnosing & Treating (377 | 2.7%), and Education Instruction & Library (326 | 2.3%).
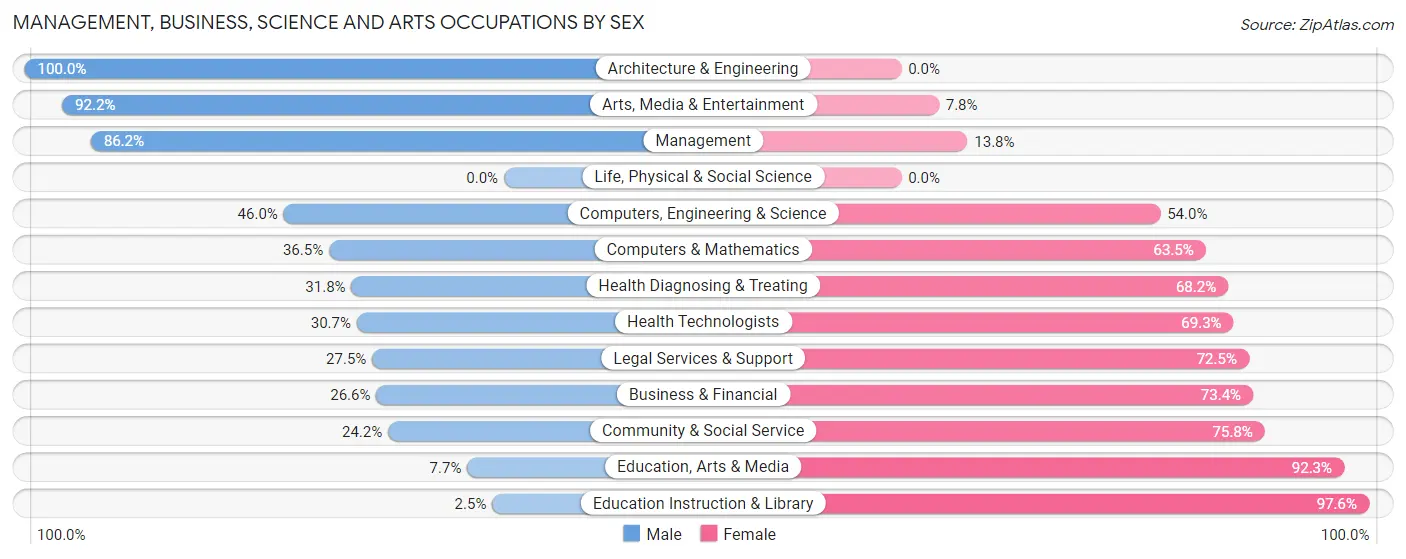
Management, Business, Science and Arts Occupations by Sex
Within the Management, Business, Science and Arts occupations in West Little River, the most male-oriented occupations are Architecture & Engineering (100.0%), Arts, Media & Entertainment (92.2%), and Management (86.2%), while the most female-oriented occupations are Education Instruction & Library (97.6%), Education, Arts & Media (92.3%), and Community & Social Service (75.8%).
| Occupation | Male | Female |
| Management | 930 (86.2%) | 149 (13.8%) |
| Business & Financial | 143 (26.6%) | 394 (73.4%) |
| Computers, Engineering & Science | 148 (46.0%) | 174 (54.0%) |
| Computers & Mathematics | 100 (36.5%) | 174 (63.5%) |
| Architecture & Engineering | 48 (100.0%) | 0 (0.0%) |
| Life, Physical & Social Science | 0 (0.0%) | 0 (0.0%) |
| Community & Social Service | 176 (24.2%) | 552 (75.8%) |
| Education, Arts & Media | 16 (7.7%) | 193 (92.3%) |
| Legal Services & Support | 11 (27.5%) | 29 (72.5%) |
| Education Instruction & Library | 8 (2.5%) | 318 (97.6%) |
| Arts, Media & Entertainment | 141 (92.2%) | 12 (7.8%) |
| Health Diagnosing & Treating | 120 (31.8%) | 257 (68.2%) |
| Health Technologists | 66 (30.7%) | 149 (69.3%) |
| Total (Category) | 1,517 (49.8%) | 1,526 (50.1%) |
| Total (Overall) | 7,116 (51.2%) | 6,786 (48.8%) |
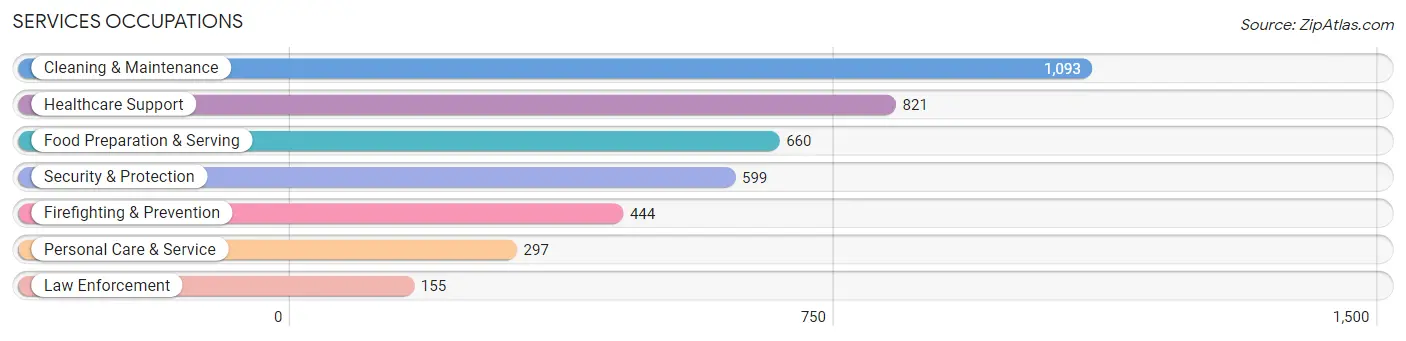
Services Occupations
The most common Services occupations in West Little River are Cleaning & Maintenance (1,093 | 7.9%), Healthcare Support (821 | 5.9%), Food Preparation & Serving (660 | 4.8%), Security & Protection (599 | 4.3%), and Firefighting & Prevention (444 | 3.2%).
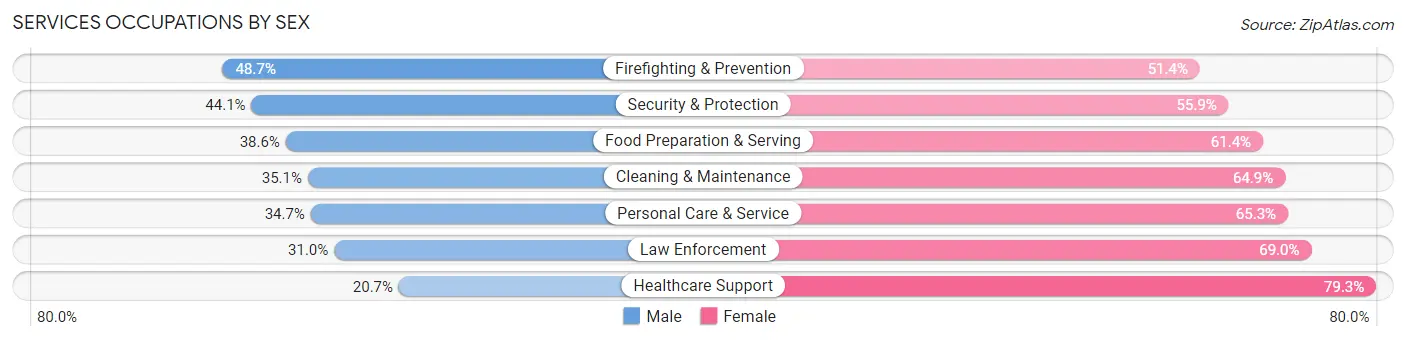
Services Occupations by Sex
Within the Services occupations in West Little River, the most male-oriented occupations are Firefighting & Prevention (48.6%), Security & Protection (44.1%), and Food Preparation & Serving (38.6%), while the most female-oriented occupations are Healthcare Support (79.3%), Law Enforcement (69.0%), and Personal Care & Service (65.3%).
| Occupation | Male | Female |
| Healthcare Support | 170 (20.7%) | 651 (79.3%) |
| Security & Protection | 264 (44.1%) | 335 (55.9%) |
| Firefighting & Prevention | 216 (48.6%) | 228 (51.3%) |
| Law Enforcement | 48 (31.0%) | 107 (69.0%) |
| Food Preparation & Serving | 255 (38.6%) | 405 (61.4%) |
| Cleaning & Maintenance | 384 (35.1%) | 709 (64.9%) |
| Personal Care & Service | 103 (34.7%) | 194 (65.3%) |
| Total (Category) | 1,176 (33.9%) | 2,294 (66.1%) |
| Total (Overall) | 7,116 (51.2%) | 6,786 (48.8%) |
Sales and Office Occupations
The most common Sales and Office occupations in West Little River are Office & Administration (1,531 | 11.0%), and Sales & Related (1,311 | 9.4%).
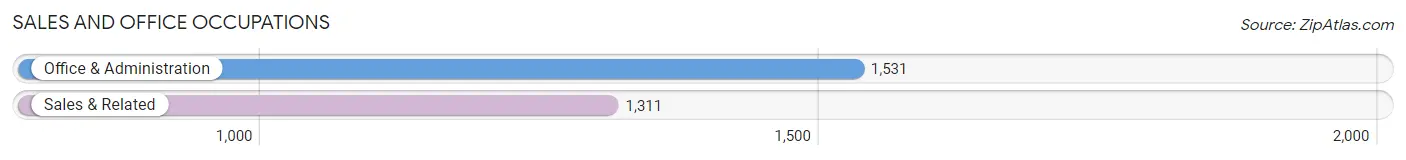
Sales and Office Occupations by Sex
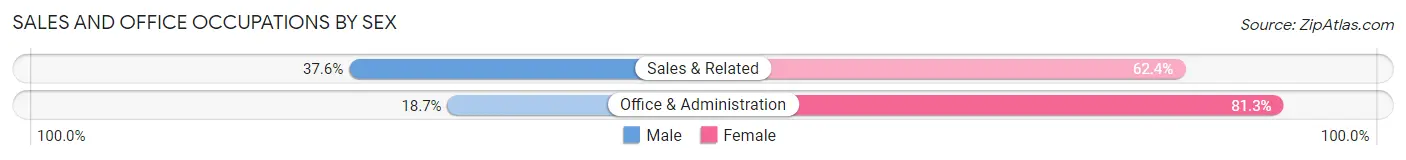
| Occupation | Male | Female |
| Sales & Related | 493 (37.6%) | 818 (62.4%) |
| Office & Administration | 286 (18.7%) | 1,245 (81.3%) |
| Total (Category) | 779 (27.4%) | 2,063 (72.6%) |
| Total (Overall) | 7,116 (51.2%) | 6,786 (48.8%) |
Natural Resources, Construction and Maintenance Occupations
The most common Natural Resources, Construction and Maintenance occupations in West Little River are Construction & Extraction (1,540 | 11.1%), Installation, Maintenance & Repair (634 | 4.6%), and Farming, Fishing & Forestry (52 | 0.4%).
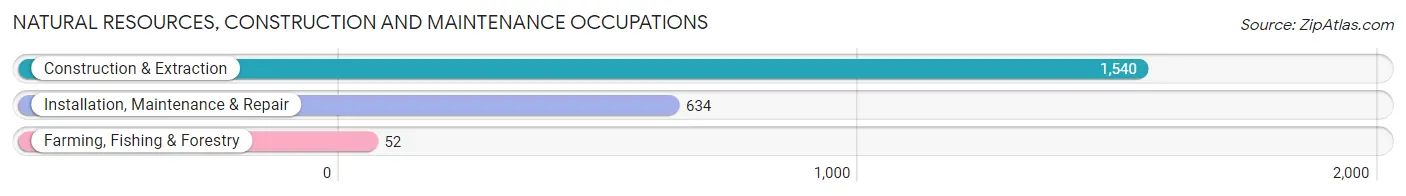
Natural Resources, Construction and Maintenance Occupations by Sex
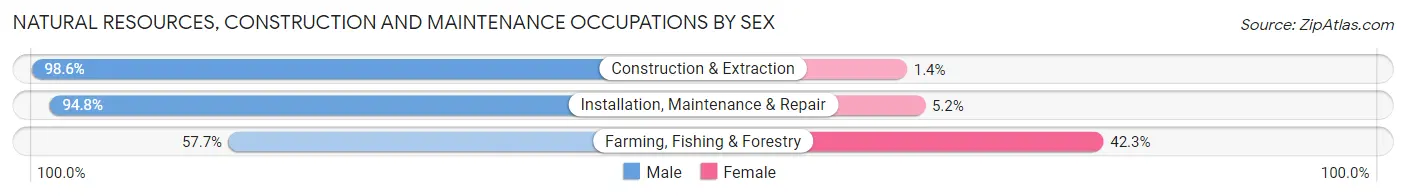
| Occupation | Male | Female |
| Farming, Fishing & Forestry | 30 (57.7%) | 22 (42.3%) |
| Construction & Extraction | 1,518 (98.6%) | 22 (1.4%) |
| Installation, Maintenance & Repair | 601 (94.8%) | 33 (5.2%) |
| Total (Category) | 2,149 (96.5%) | 77 (3.5%) |
| Total (Overall) | 7,116 (51.2%) | 6,786 (48.8%) |
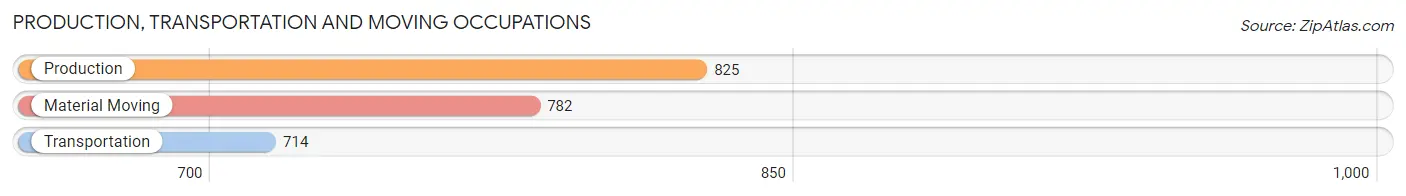
Production, Transportation and Moving Occupations
The most common Production, Transportation and Moving occupations in West Little River are Production (825 | 5.9%), Material Moving (782 | 5.6%), and Transportation (714 | 5.1%).
Production, Transportation and Moving Occupations by Sex
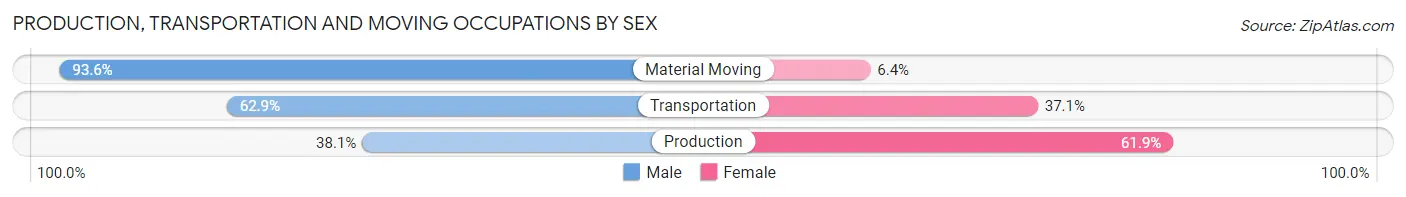
| Occupation | Male | Female |
| Production | 314 (38.1%) | 511 (61.9%) |
| Transportation | 449 (62.9%) | 265 (37.1%) |
| Material Moving | 732 (93.6%) | 50 (6.4%) |
| Total (Category) | 1,495 (64.4%) | 826 (35.6%) |
| Total (Overall) | 7,116 (51.2%) | 6,786 (48.8%) |
Employment Industries by Sex in West Little River
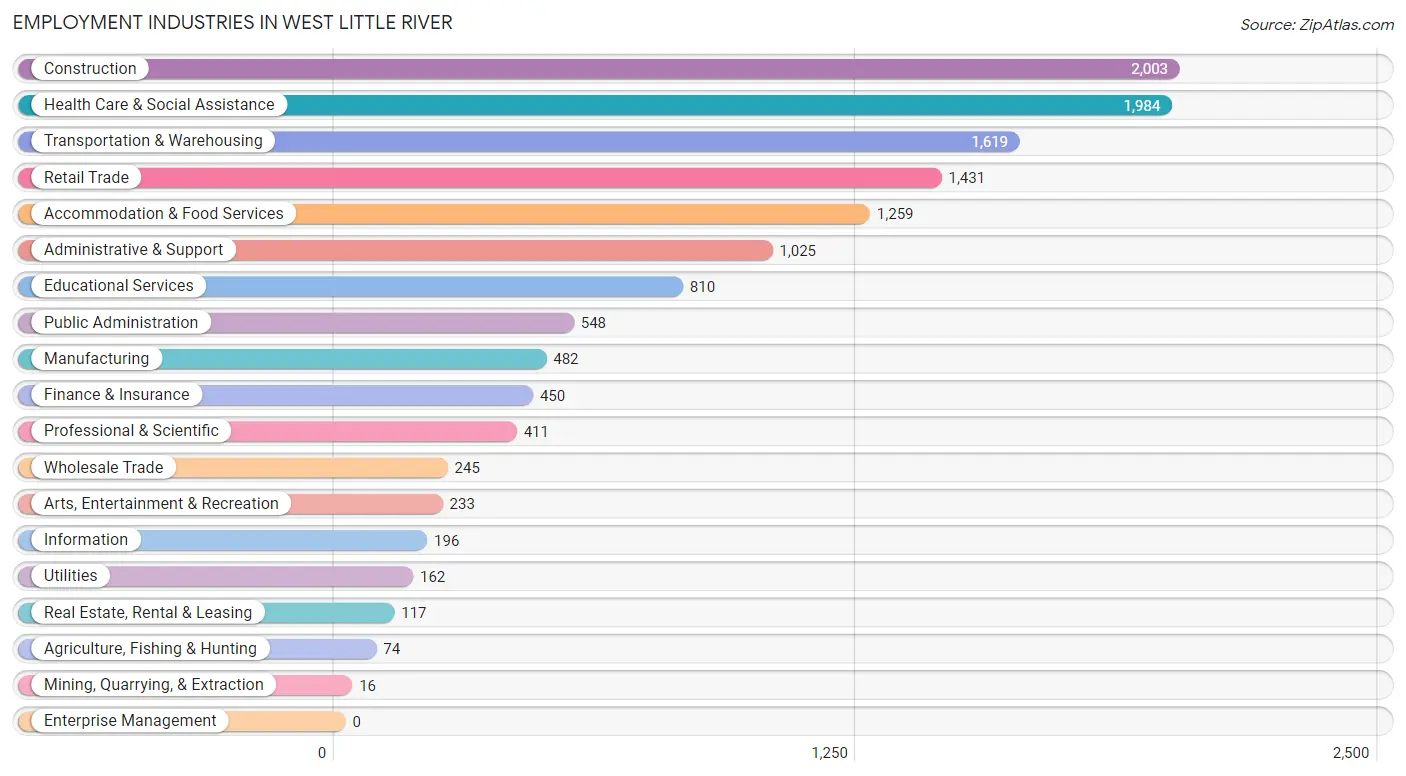
Employment Industries in West Little River
The major employment industries in West Little River include Construction (2,003 | 14.4%), Health Care & Social Assistance (1,984 | 14.3%), Transportation & Warehousing (1,619 | 11.7%), Retail Trade (1,431 | 10.3%), and Accommodation & Food Services (1,259 | 9.1%).
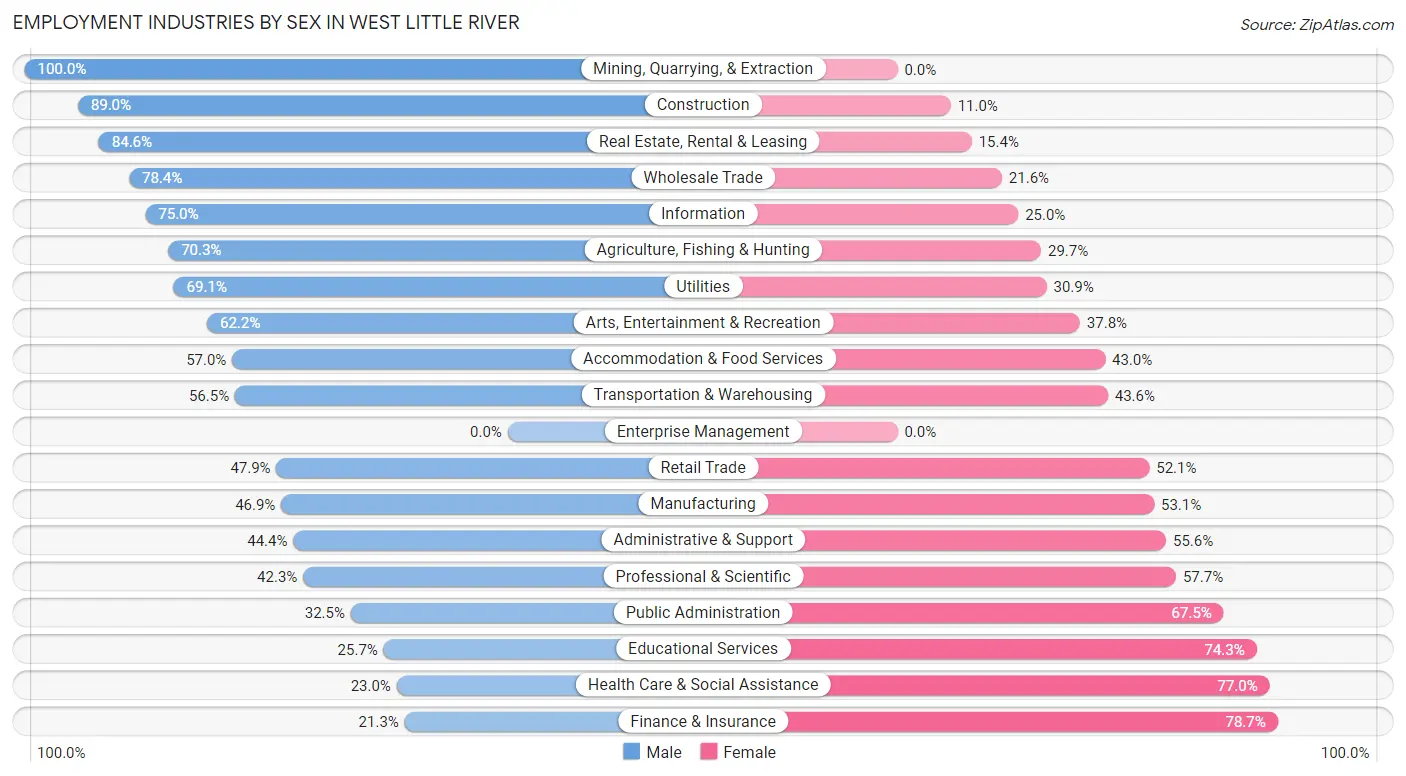
Employment Industries by Sex in West Little River
The West Little River industries that see more men than women are Mining, Quarrying, & Extraction (100.0%), Construction (89.0%), and Real Estate, Rental & Leasing (84.6%), whereas the industries that tend to have a higher number of women are Finance & Insurance (78.7%), Health Care & Social Assistance (77.0%), and Educational Services (74.3%).
| Industry | Male | Female |
| Agriculture, Fishing & Hunting | 52 (70.3%) | 22 (29.7%) |
| Mining, Quarrying, & Extraction | 16 (100.0%) | 0 (0.0%) |
| Construction | 1,782 (89.0%) | 221 (11.0%) |
| Manufacturing | 226 (46.9%) | 256 (53.1%) |
| Wholesale Trade | 192 (78.4%) | 53 (21.6%) |
| Retail Trade | 685 (47.9%) | 746 (52.1%) |
| Transportation & Warehousing | 914 (56.5%) | 705 (43.5%) |
| Utilities | 112 (69.1%) | 50 (30.9%) |
| Information | 147 (75.0%) | 49 (25.0%) |
| Finance & Insurance | 96 (21.3%) | 354 (78.7%) |
| Real Estate, Rental & Leasing | 99 (84.6%) | 18 (15.4%) |
| Professional & Scientific | 174 (42.3%) | 237 (57.7%) |
| Enterprise Management | 0 (0.0%) | 0 (0.0%) |
| Administrative & Support | 455 (44.4%) | 570 (55.6%) |
| Educational Services | 208 (25.7%) | 602 (74.3%) |
| Health Care & Social Assistance | 456 (23.0%) | 1,528 (77.0%) |
| Arts, Entertainment & Recreation | 145 (62.2%) | 88 (37.8%) |
| Accommodation & Food Services | 718 (57.0%) | 541 (43.0%) |
| Public Administration | 178 (32.5%) | 370 (67.5%) |
| Total | 7,116 (51.2%) | 6,786 (48.8%) |
Education in West Little River
School Enrollment in West Little River
The most common levels of schooling among the 7,098 students in West Little River are elementary school (2,037 | 28.7%), middle school (1,722 | 24.3%), and college / undergraduate (1,231 | 17.3%).
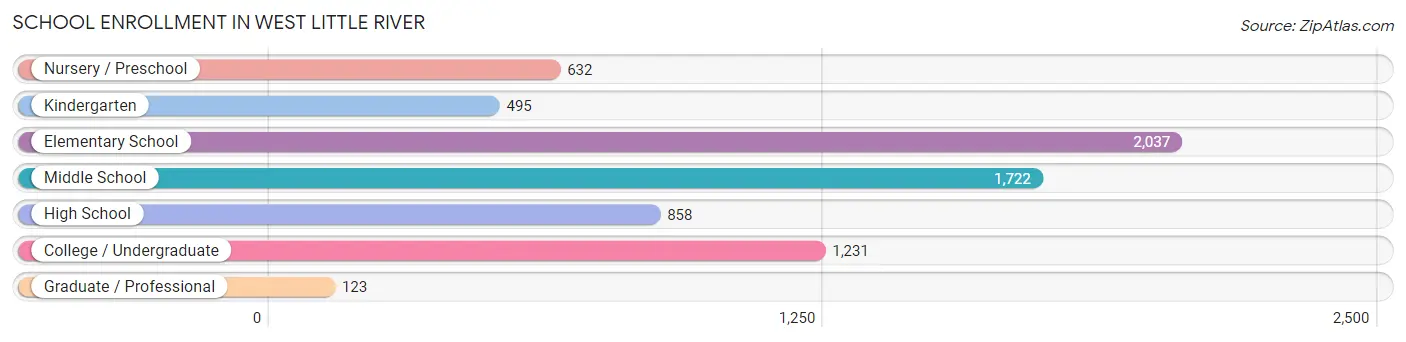
| School Level | # Students | % Students |
| Nursery / Preschool | 632 | 8.9% |
| Kindergarten | 495 | 7.0% |
| Elementary School | 2,037 | 28.7% |
| Middle School | 1,722 | 24.3% |
| High School | 858 | 12.1% |
| College / Undergraduate | 1,231 | 17.3% |
| Graduate / Professional | 123 | 1.7% |
| Total | 7,098 | 100.0% |
School Enrollment by Age by Funding Source in West Little River
Out of a total of 7,098 students who are enrolled in schools in West Little River, 1,228 (17.3%) attend a private institution, while the remaining 5,870 (82.7%) are enrolled in public schools. The age group of 5 to 9 year old has the highest likelihood of being enrolled in private schools, with 529 (23.0% in the age bracket) enrolled. Conversely, the age group of 15 to 17 year olds has the lowest likelihood of being enrolled in a private school, with 553 (92.3% in the age bracket) attending a public institution.
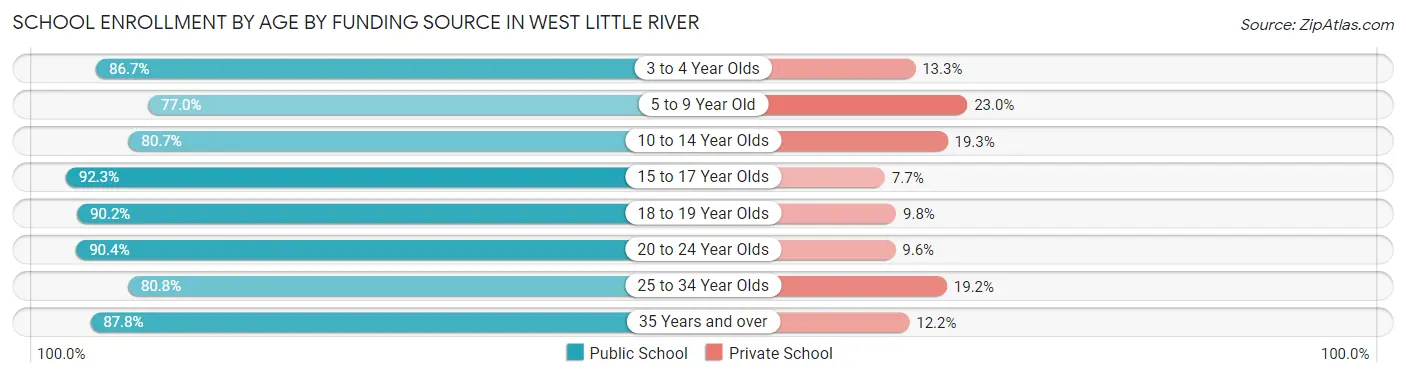
| Age Bracket | Public School | Private School |
| 3 to 4 Year Olds | 676 (86.7%) | 104 (13.3%) |
| 5 to 9 Year Old | 1,770 (77.0%) | 529 (23.0%) |
| 10 to 14 Year Olds | 1,560 (80.7%) | 374 (19.3%) |
| 15 to 17 Year Olds | 553 (92.3%) | 46 (7.7%) |
| 18 to 19 Year Olds | 370 (90.2%) | 40 (9.8%) |
| 20 to 24 Year Olds | 498 (90.4%) | 53 (9.6%) |
| 25 to 34 Year Olds | 206 (80.8%) | 49 (19.2%) |
| 35 Years and over | 237 (87.8%) | 33 (12.2%) |
| Total | 5,870 (82.7%) | 1,228 (17.3%) |
Educational Attainment by Field of Study in West Little River
Business (846 | 20.0%), education (614 | 14.5%), engineering (555 | 13.1%), social sciences (451 | 10.7%), and science & technology (378 | 8.9%) are the most common fields of study among 4,227 individuals in West Little River who have obtained a bachelor's degree or higher.
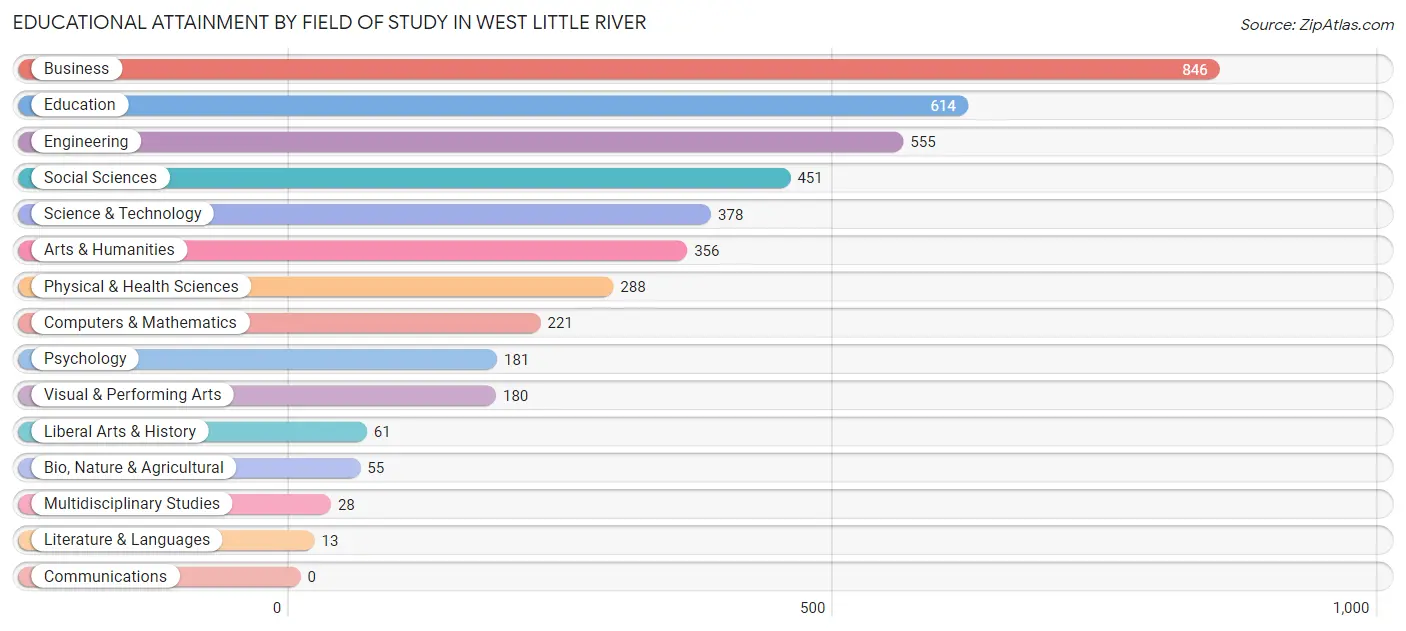
| Field of Study | # Graduates | % Graduates |
| Computers & Mathematics | 221 | 5.2% |
| Bio, Nature & Agricultural | 55 | 1.3% |
| Physical & Health Sciences | 288 | 6.8% |
| Psychology | 181 | 4.3% |
| Social Sciences | 451 | 10.7% |
| Engineering | 555 | 13.1% |
| Multidisciplinary Studies | 28 | 0.7% |
| Science & Technology | 378 | 8.9% |
| Business | 846 | 20.0% |
| Education | 614 | 14.5% |
| Literature & Languages | 13 | 0.3% |
| Liberal Arts & History | 61 | 1.4% |
| Visual & Performing Arts | 180 | 4.3% |
| Communications | 0 | 0.0% |
| Arts & Humanities | 356 | 8.4% |
| Total | 4,227 | 100.0% |
Transportation & Commute in West Little River
Vehicle Availability by Sex in West Little River
The most prevalent vehicle ownership categories in West Little River are males with 2 vehicles (2,647, accounting for 37.4%) and females with 2 vehicles (2,699, making up 40.3%).
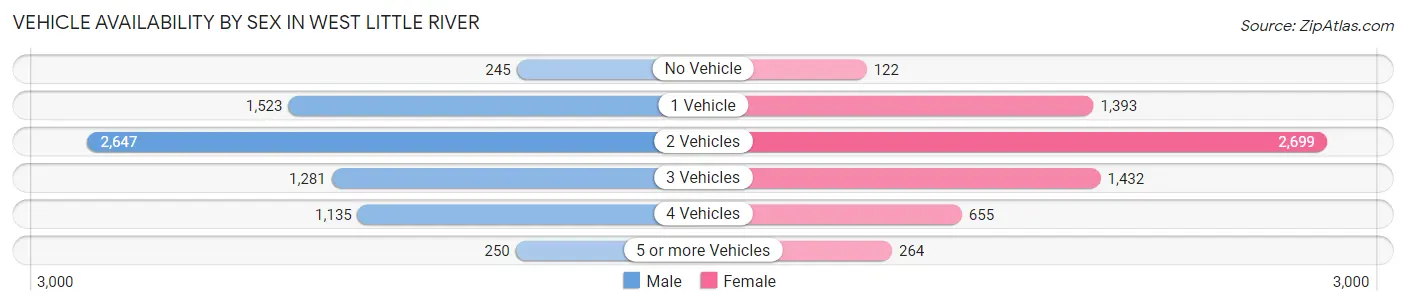
| Vehicles Available | Male | Female |
| No Vehicle | 245 (3.5%) | 122 (1.9%) |
| 1 Vehicle | 1,523 (21.5%) | 1,393 (21.2%) |
| 2 Vehicles | 2,647 (37.4%) | 2,699 (41.1%) |
| 3 Vehicles | 1,281 (18.1%) | 1,432 (21.8%) |
| 4 Vehicles | 1,135 (16.0%) | 655 (10.0%) |
| 5 or more Vehicles | 250 (3.5%) | 264 (4.0%) |
| Total | 7,081 (100.0%) | 6,565 (100.0%) |
Commute Time in West Little River
The most frequently occuring commute durations in West Little River are 30 to 34 minutes (3,229 commuters, 25.2%), 20 to 24 minutes (2,106 commuters, 16.4%), and 60 to 89 minutes (1,391 commuters, 10.8%).
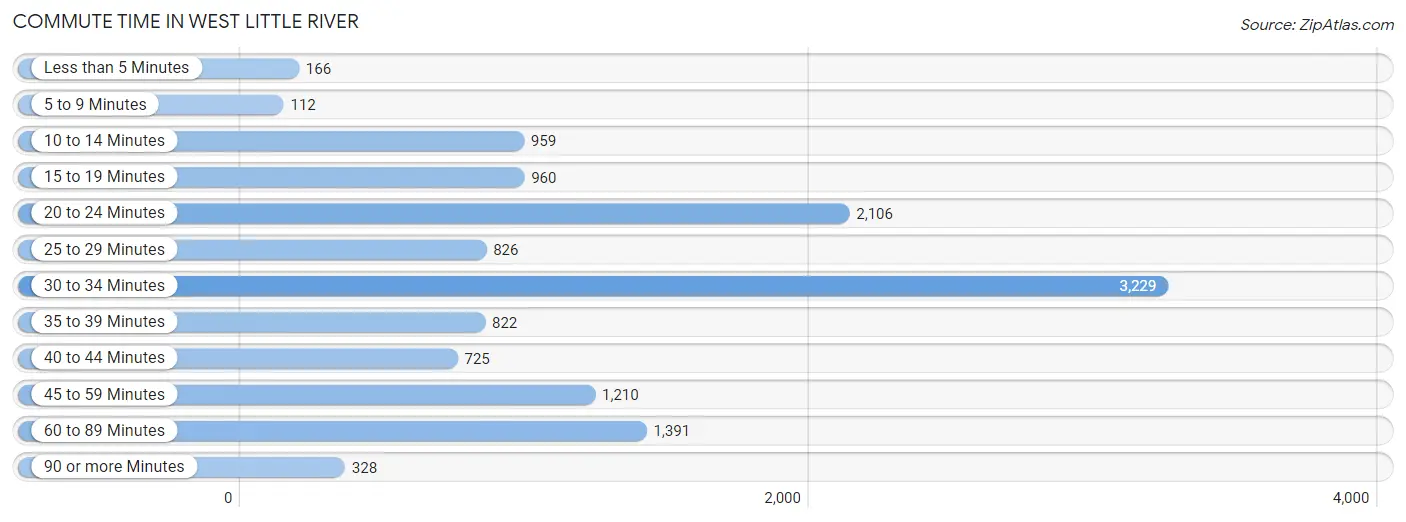
| Commute Time | # Commuters | % Commuters |
| Less than 5 Minutes | 166 | 1.3% |
| 5 to 9 Minutes | 112 | 0.9% |
| 10 to 14 Minutes | 959 | 7.5% |
| 15 to 19 Minutes | 960 | 7.5% |
| 20 to 24 Minutes | 2,106 | 16.4% |
| 25 to 29 Minutes | 826 | 6.4% |
| 30 to 34 Minutes | 3,229 | 25.2% |
| 35 to 39 Minutes | 822 | 6.4% |
| 40 to 44 Minutes | 725 | 5.7% |
| 45 to 59 Minutes | 1,210 | 9.4% |
| 60 to 89 Minutes | 1,391 | 10.8% |
| 90 or more Minutes | 328 | 2.6% |
Commute Time by Sex in West Little River
The most common commute times in West Little River are 30 to 34 minutes (1,822 commuters, 27.1%) for males and 30 to 34 minutes (1,407 commuters, 23.1%) for females.
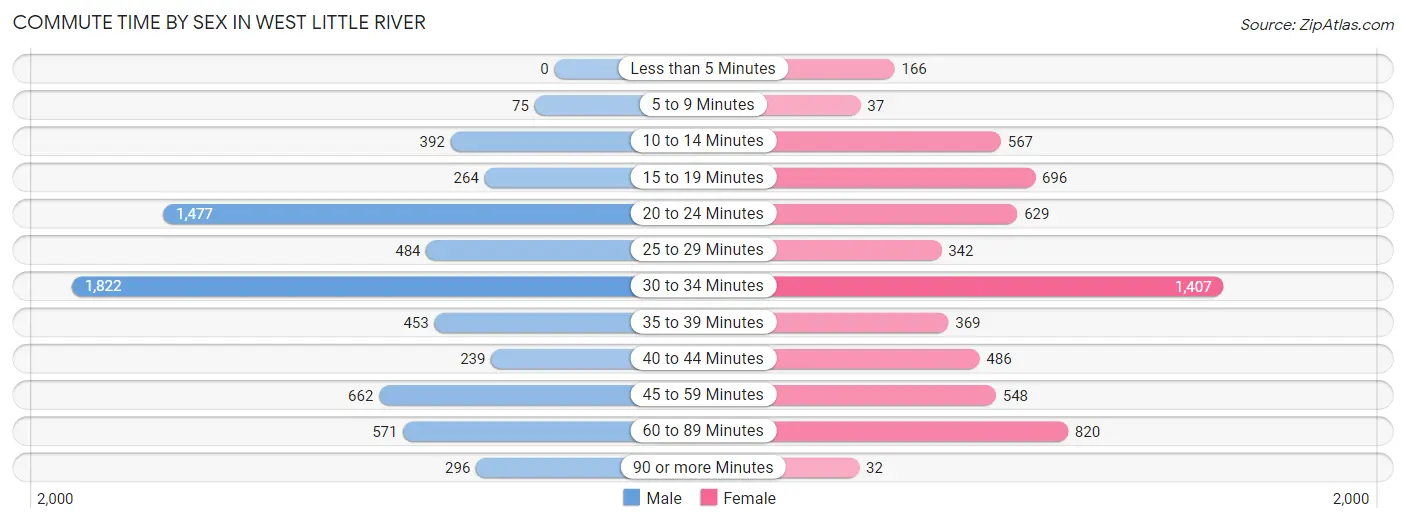
| Commute Time | Male | Female |
| Less than 5 Minutes | 0 (0.0%) | 166 (2.7%) |
| 5 to 9 Minutes | 75 (1.1%) | 37 (0.6%) |
| 10 to 14 Minutes | 392 (5.8%) | 567 (9.3%) |
| 15 to 19 Minutes | 264 (3.9%) | 696 (11.4%) |
| 20 to 24 Minutes | 1,477 (21.9%) | 629 (10.3%) |
| 25 to 29 Minutes | 484 (7.2%) | 342 (5.6%) |
| 30 to 34 Minutes | 1,822 (27.1%) | 1,407 (23.1%) |
| 35 to 39 Minutes | 453 (6.7%) | 369 (6.0%) |
| 40 to 44 Minutes | 239 (3.5%) | 486 (8.0%) |
| 45 to 59 Minutes | 662 (9.8%) | 548 (9.0%) |
| 60 to 89 Minutes | 571 (8.5%) | 820 (13.4%) |
| 90 or more Minutes | 296 (4.4%) | 32 (0.5%) |
Time of Departure to Work by Sex in West Little River
The most frequent times of departure to work in West Little River are 7:00 AM to 7:29 AM (1,777, 26.4%) for males and 7:00 AM to 7:29 AM (2,042, 33.5%) for females.
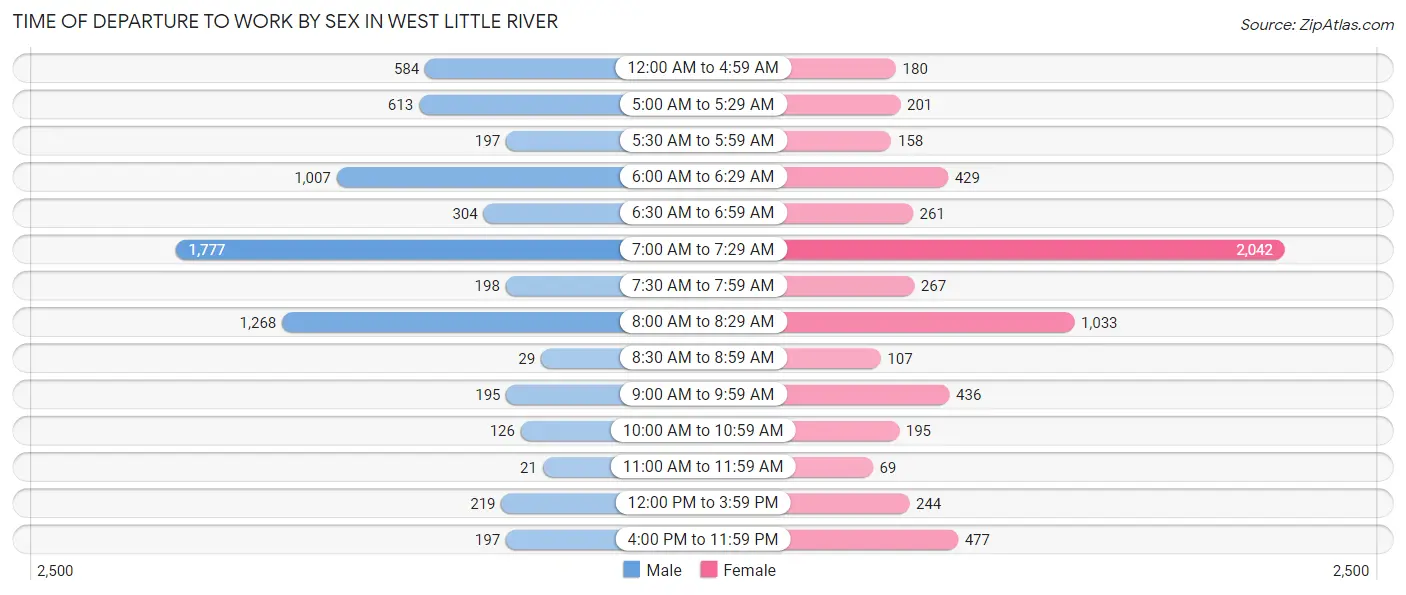
| Time of Departure | Male | Female |
| 12:00 AM to 4:59 AM | 584 (8.7%) | 180 (2.9%) |
| 5:00 AM to 5:29 AM | 613 (9.1%) | 201 (3.3%) |
| 5:30 AM to 5:59 AM | 197 (2.9%) | 158 (2.6%) |
| 6:00 AM to 6:29 AM | 1,007 (14.9%) | 429 (7.0%) |
| 6:30 AM to 6:59 AM | 304 (4.5%) | 261 (4.3%) |
| 7:00 AM to 7:29 AM | 1,777 (26.4%) | 2,042 (33.5%) |
| 7:30 AM to 7:59 AM | 198 (2.9%) | 267 (4.4%) |
| 8:00 AM to 8:29 AM | 1,268 (18.8%) | 1,033 (16.9%) |
| 8:30 AM to 8:59 AM | 29 (0.4%) | 107 (1.8%) |
| 9:00 AM to 9:59 AM | 195 (2.9%) | 436 (7.1%) |
| 10:00 AM to 10:59 AM | 126 (1.9%) | 195 (3.2%) |
| 11:00 AM to 11:59 AM | 21 (0.3%) | 69 (1.1%) |
| 12:00 PM to 3:59 PM | 219 (3.3%) | 244 (4.0%) |
| 4:00 PM to 11:59 PM | 197 (2.9%) | 477 (7.8%) |
| Total | 6,735 (100.0%) | 6,099 (100.0%) |
Housing Occupancy in West Little River
Occupancy by Ownership in West Little River
Of the total 10,347 dwellings in West Little River, owner-occupied units account for 6,034 (58.3%), while renter-occupied units make up 4,313 (41.7%).
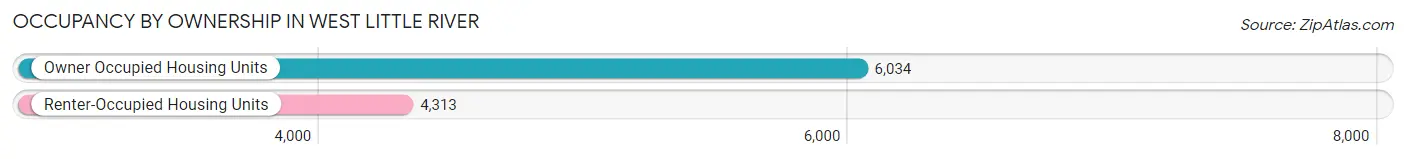
| Occupancy | # Housing Units | % Housing Units |
| Owner Occupied Housing Units | 6,034 | 58.3% |
| Renter-Occupied Housing Units | 4,313 | 41.7% |
| Total Occupied Housing Units | 10,347 | 100.0% |
Occupancy by Household Size in West Little River
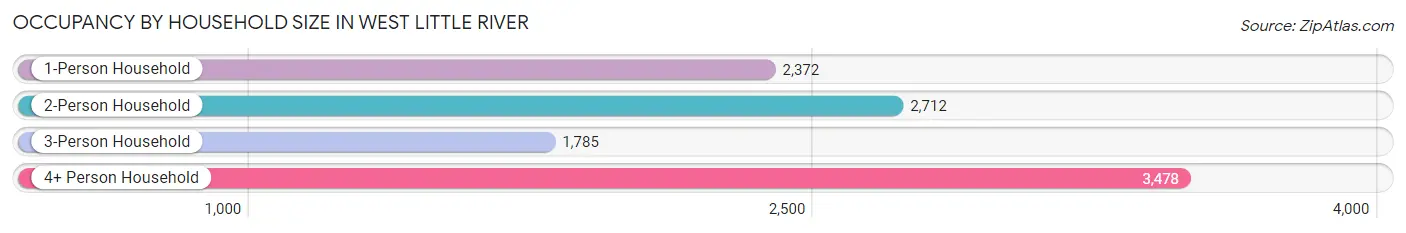
| Household Size | # Housing Units | % Housing Units |
| 1-Person Household | 2,372 | 22.9% |
| 2-Person Household | 2,712 | 26.2% |
| 3-Person Household | 1,785 | 17.2% |
| 4+ Person Household | 3,478 | 33.6% |
| Total Housing Units | 10,347 | 100.0% |
Occupancy by Ownership by Household Size in West Little River
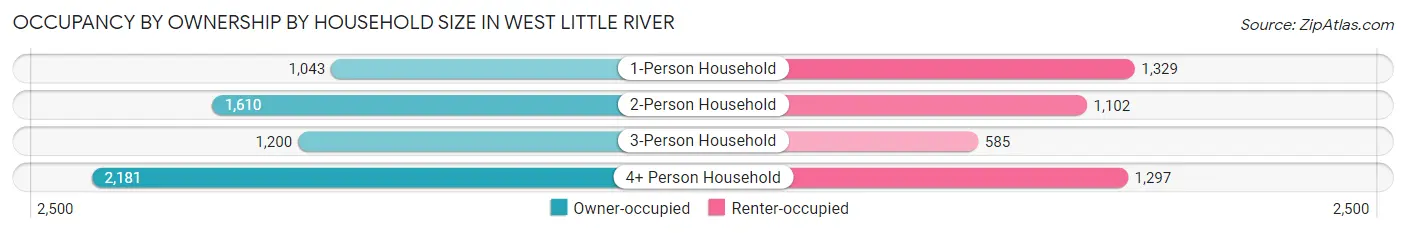
| Household Size | Owner-occupied | Renter-occupied |
| 1-Person Household | 1,043 (44.0%) | 1,329 (56.0%) |
| 2-Person Household | 1,610 (59.4%) | 1,102 (40.6%) |
| 3-Person Household | 1,200 (67.2%) | 585 (32.8%) |
| 4+ Person Household | 2,181 (62.7%) | 1,297 (37.3%) |
| Total Housing Units | 6,034 (58.3%) | 4,313 (41.7%) |
Occupancy by Educational Attainment in West Little River
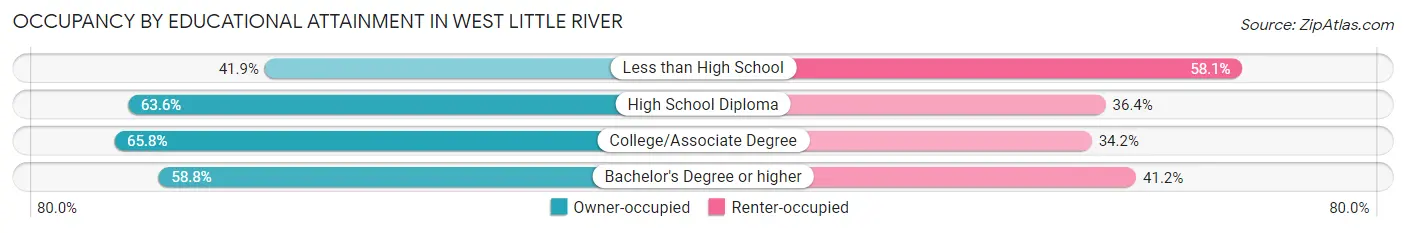
| Household Size | Owner-occupied | Renter-occupied |
| Less than High School | 984 (41.9%) | 1,364 (58.1%) |
| High School Diploma | 2,262 (63.6%) | 1,294 (36.4%) |
| College/Associate Degree | 1,655 (65.8%) | 860 (34.2%) |
| Bachelor's Degree or higher | 1,133 (58.8%) | 795 (41.2%) |
Occupancy by Age of Householder in West Little River
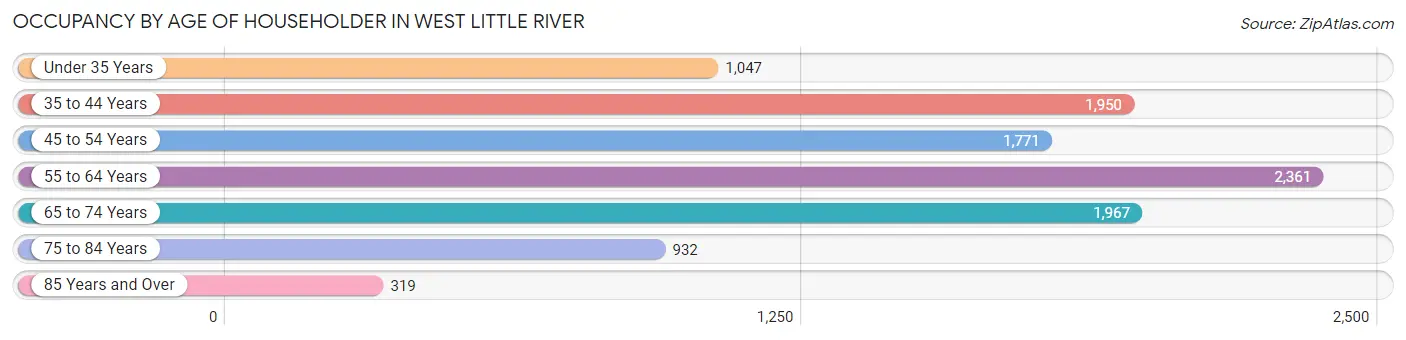
| Age Bracket | # Households | % Households |
| Under 35 Years | 1,047 | 10.1% |
| 35 to 44 Years | 1,950 | 18.9% |
| 45 to 54 Years | 1,771 | 17.1% |
| 55 to 64 Years | 2,361 | 22.8% |
| 65 to 74 Years | 1,967 | 19.0% |
| 75 to 84 Years | 932 | 9.0% |
| 85 Years and Over | 319 | 3.1% |
| Total | 10,347 | 100.0% |
Housing Finances in West Little River
Median Income by Occupancy in West Little River
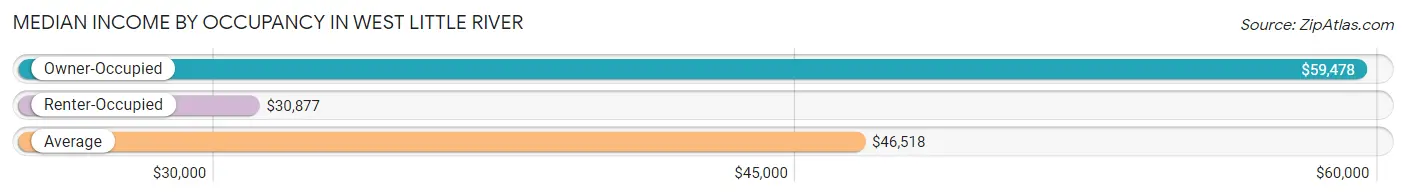
| Occupancy Type | # Households | Median Income |
| Owner-Occupied | 6,034 (58.3%) | $59,478 |
| Renter-Occupied | 4,313 (41.7%) | $30,877 |
| Average | 10,347 (100.0%) | $46,518 |
Occupancy by Householder Income Bracket in West Little River
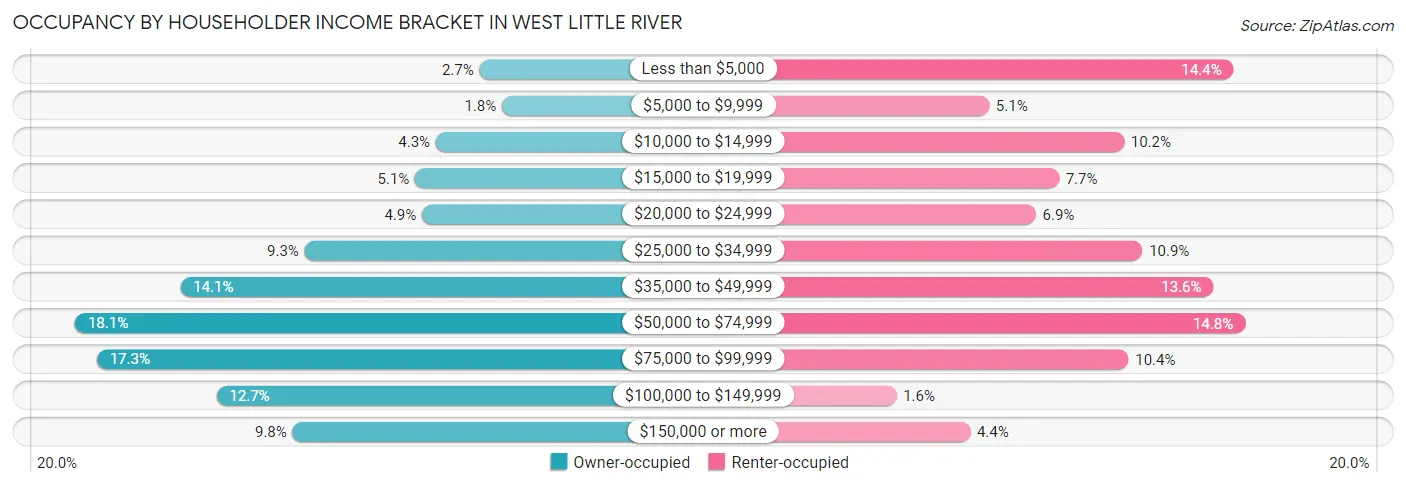
| Income Bracket | Owner-occupied | Renter-occupied |
| Less than $5,000 | 161 (2.7%) | 621 (14.4%) |
| $5,000 to $9,999 | 109 (1.8%) | 219 (5.1%) |
| $10,000 to $14,999 | 261 (4.3%) | 441 (10.2%) |
| $15,000 to $19,999 | 309 (5.1%) | 334 (7.7%) |
| $20,000 to $24,999 | 293 (4.9%) | 296 (6.9%) |
| $25,000 to $34,999 | 563 (9.3%) | 471 (10.9%) |
| $35,000 to $49,999 | 849 (14.1%) | 588 (13.6%) |
| $50,000 to $74,999 | 1,091 (18.1%) | 640 (14.8%) |
| $75,000 to $99,999 | 1,041 (17.2%) | 448 (10.4%) |
| $100,000 to $149,999 | 766 (12.7%) | 67 (1.5%) |
| $150,000 or more | 591 (9.8%) | 188 (4.4%) |
| Total | 6,034 (100.0%) | 4,313 (100.0%) |
Monthly Housing Cost Tiers in West Little River
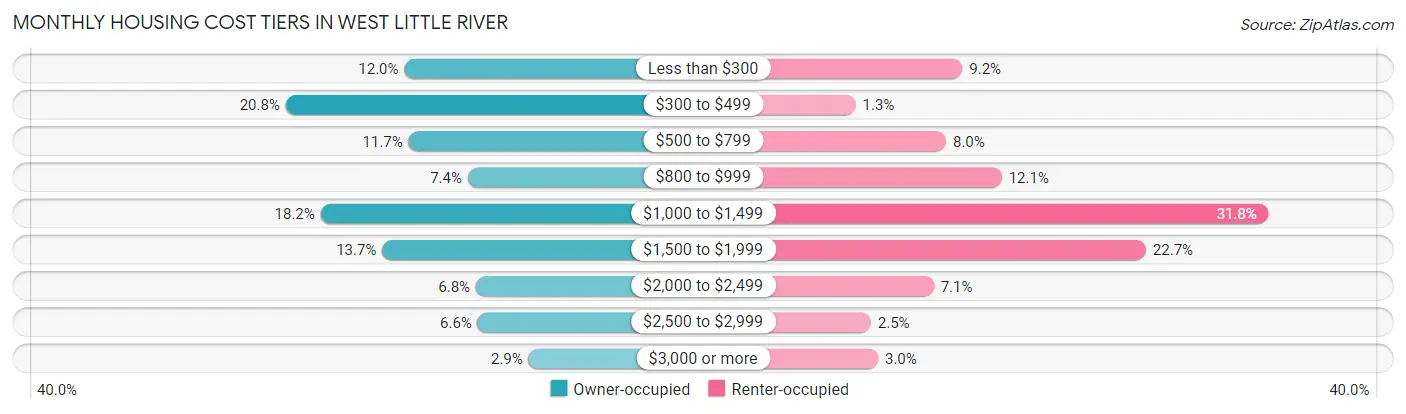
| Monthly Cost | Owner-occupied | Renter-occupied |
| Less than $300 | 726 (12.0%) | 397 (9.2%) |
| $300 to $499 | 1,253 (20.8%) | 58 (1.3%) |
| $500 to $799 | 707 (11.7%) | 345 (8.0%) |
| $800 to $999 | 444 (7.4%) | 522 (12.1%) |
| $1,000 to $1,499 | 1,098 (18.2%) | 1,370 (31.8%) |
| $1,500 to $1,999 | 824 (13.7%) | 980 (22.7%) |
| $2,000 to $2,499 | 408 (6.8%) | 306 (7.1%) |
| $2,500 to $2,999 | 400 (6.6%) | 106 (2.5%) |
| $3,000 or more | 174 (2.9%) | 129 (3.0%) |
| Total | 6,034 (100.0%) | 4,313 (100.0%) |
Physical Housing Characteristics in West Little River
Housing Structures in West Little River
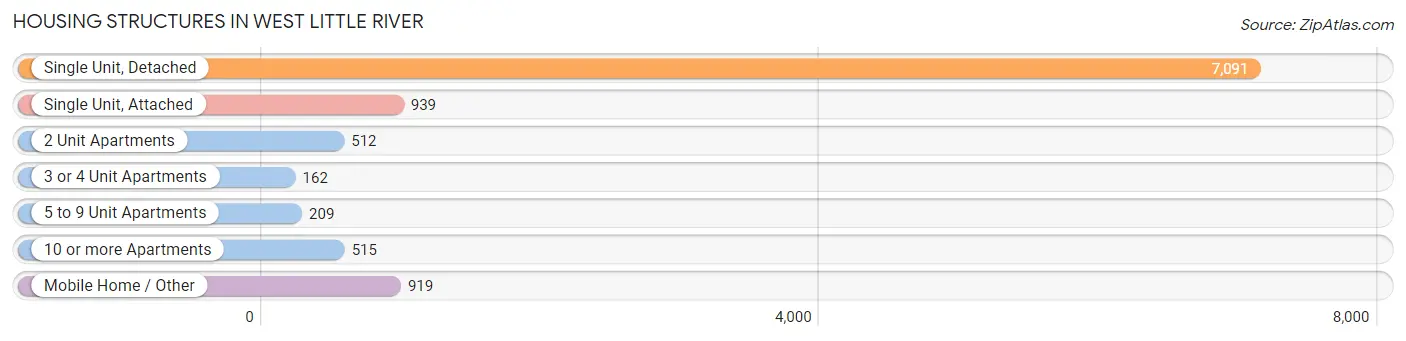
| Structure Type | # Housing Units | % Housing Units |
| Single Unit, Detached | 7,091 | 68.5% |
| Single Unit, Attached | 939 | 9.1% |
| 2 Unit Apartments | 512 | 5.0% |
| 3 or 4 Unit Apartments | 162 | 1.6% |
| 5 to 9 Unit Apartments | 209 | 2.0% |
| 10 or more Apartments | 515 | 5.0% |
| Mobile Home / Other | 919 | 8.9% |
| Total | 10,347 | 100.0% |
Housing Structures by Occupancy in West Little River
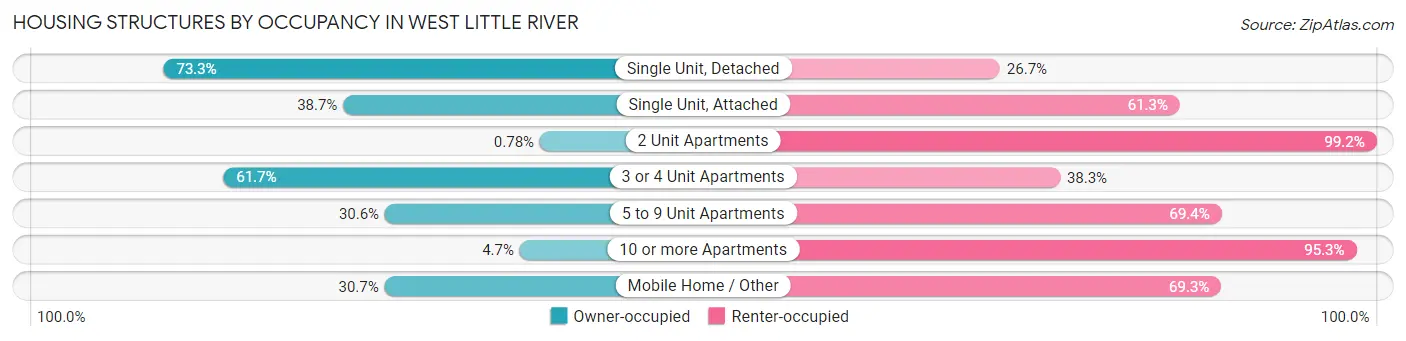
| Structure Type | Owner-occupied | Renter-occupied |
| Single Unit, Detached | 5,197 (73.3%) | 1,894 (26.7%) |
| Single Unit, Attached | 363 (38.7%) | 576 (61.3%) |
| 2 Unit Apartments | 4 (0.8%) | 508 (99.2%) |
| 3 or 4 Unit Apartments | 100 (61.7%) | 62 (38.3%) |
| 5 to 9 Unit Apartments | 64 (30.6%) | 145 (69.4%) |
| 10 or more Apartments | 24 (4.7%) | 491 (95.3%) |
| Mobile Home / Other | 282 (30.7%) | 637 (69.3%) |
| Total | 6,034 (58.3%) | 4,313 (41.7%) |
Housing Structures by Number of Rooms in West Little River
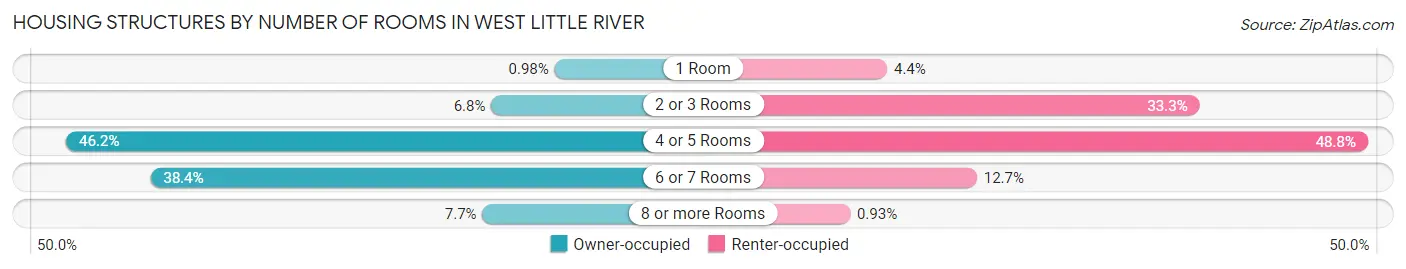
| Number of Rooms | Owner-occupied | Renter-occupied |
| 1 Room | 59 (1.0%) | 188 (4.4%) |
| 2 or 3 Rooms | 413 (6.8%) | 1,434 (33.3%) |
| 4 or 5 Rooms | 2,785 (46.2%) | 2,105 (48.8%) |
| 6 or 7 Rooms | 2,315 (38.4%) | 546 (12.7%) |
| 8 or more Rooms | 462 (7.7%) | 40 (0.9%) |
| Total | 6,034 (100.0%) | 4,313 (100.0%) |
Housing Structure by Heating Type in West Little River
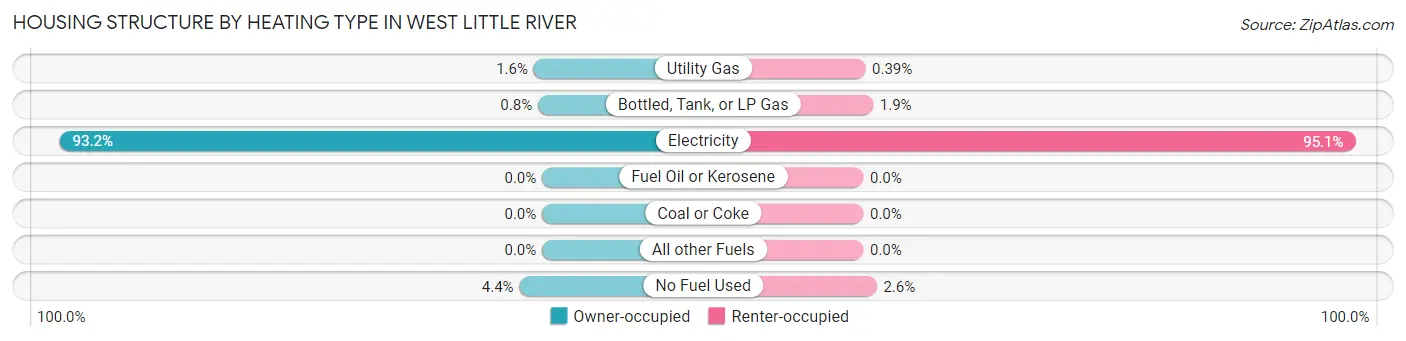
| Heating Type | Owner-occupied | Renter-occupied |
| Utility Gas | 97 (1.6%) | 17 (0.4%) |
| Bottled, Tank, or LP Gas | 48 (0.8%) | 82 (1.9%) |
| Electricity | 5,625 (93.2%) | 4,102 (95.1%) |
| Fuel Oil or Kerosene | 0 (0.0%) | 0 (0.0%) |
| Coal or Coke | 0 (0.0%) | 0 (0.0%) |
| All other Fuels | 0 (0.0%) | 0 (0.0%) |
| No Fuel Used | 264 (4.4%) | 112 (2.6%) |
| Total | 6,034 (100.0%) | 4,313 (100.0%) |
Household Vehicle Usage in West Little River
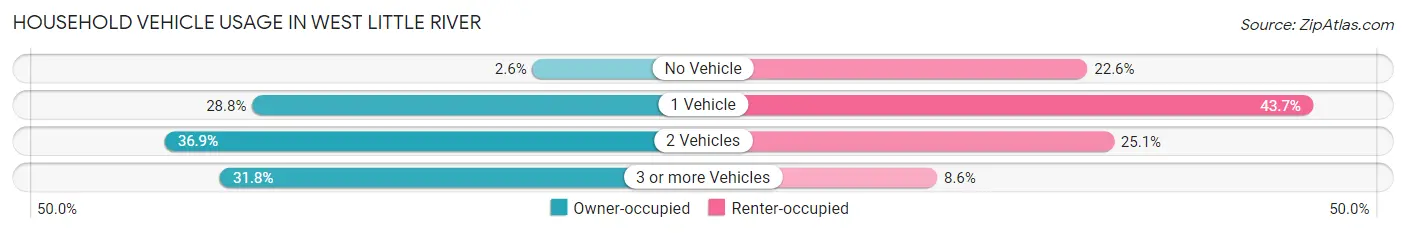
| Vehicles per Household | Owner-occupied | Renter-occupied |
| No Vehicle | 156 (2.6%) | 976 (22.6%) |
| 1 Vehicle | 1,735 (28.7%) | 1,883 (43.7%) |
| 2 Vehicles | 2,227 (36.9%) | 1,083 (25.1%) |
| 3 or more Vehicles | 1,916 (31.8%) | 371 (8.6%) |
| Total | 6,034 (100.0%) | 4,313 (100.0%) |
Real Estate & Mortgages in West Little River
Real Estate and Mortgage Overview in West Little River
| Characteristic | Without Mortgage | With Mortgage |
| Housing Units | 2,964 | 3,070 |
| Median Property Value | $233,000 | $236,800 |
| Median Household Income | $58,464 | $292 |
| Monthly Housing Costs | $422 | $174 |
| Real Estate Taxes | $1,459 | $89 |
Property Value by Mortgage Status in West Little River
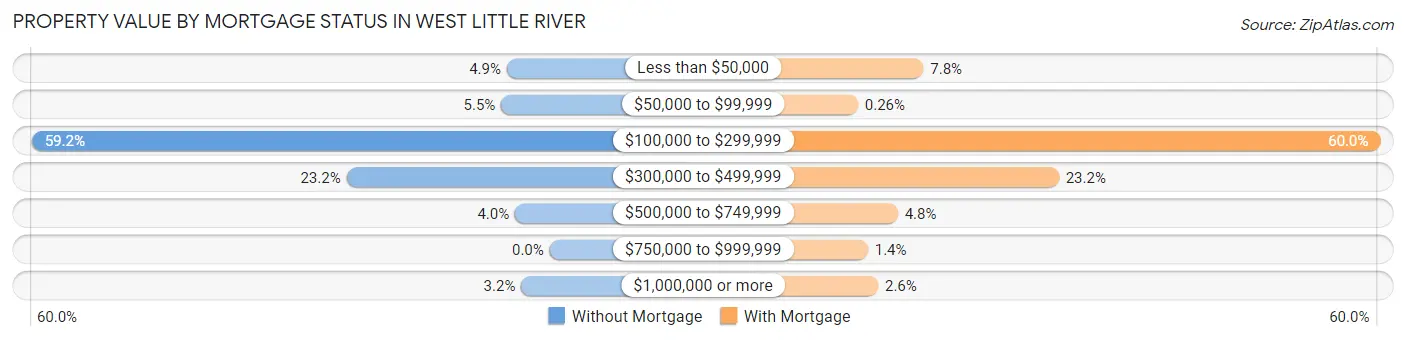
| Property Value | Without Mortgage | With Mortgage |
| Less than $50,000 | 145 (4.9%) | 238 (7.7%) |
| $50,000 to $99,999 | 164 (5.5%) | 8 (0.3%) |
| $100,000 to $299,999 | 1,754 (59.2%) | 1,841 (60.0%) |
| $300,000 to $499,999 | 688 (23.2%) | 713 (23.2%) |
| $500,000 to $749,999 | 117 (4.0%) | 148 (4.8%) |
| $750,000 to $999,999 | 0 (0.0%) | 43 (1.4%) |
| $1,000,000 or more | 96 (3.2%) | 79 (2.6%) |
| Total | 2,964 (100.0%) | 3,070 (100.0%) |
Household Income by Mortgage Status in West Little River
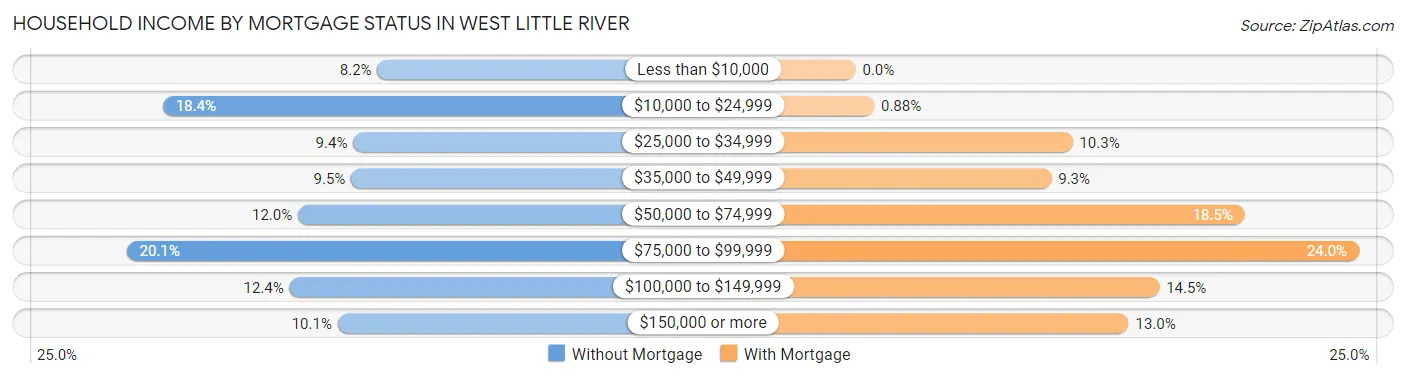
| Household Income | Without Mortgage | With Mortgage |
| Less than $10,000 | 243 (8.2%) | 0 (0.0%) |
| $10,000 to $24,999 | 546 (18.4%) | 27 (0.9%) |
| $25,000 to $34,999 | 277 (9.3%) | 317 (10.3%) |
| $35,000 to $49,999 | 280 (9.5%) | 286 (9.3%) |
| $50,000 to $74,999 | 355 (12.0%) | 569 (18.5%) |
| $75,000 to $99,999 | 597 (20.1%) | 736 (24.0%) |
| $100,000 to $149,999 | 367 (12.4%) | 444 (14.5%) |
| $150,000 or more | 299 (10.1%) | 399 (13.0%) |
| Total | 2,964 (100.0%) | 3,070 (100.0%) |
Property Value to Household Income Ratio in West Little River
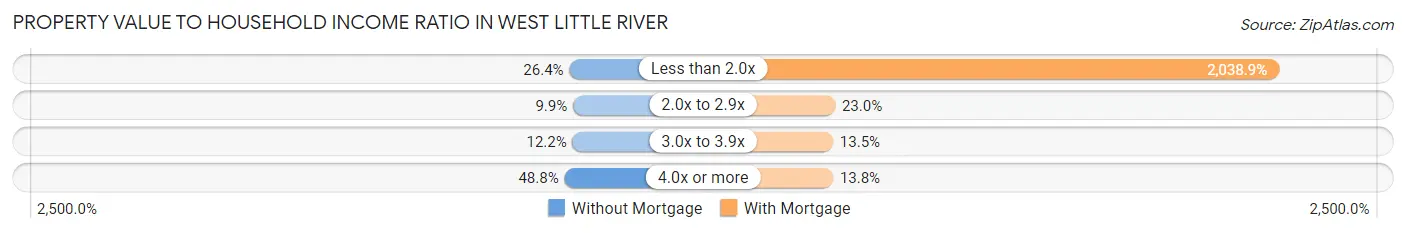
| Value-to-Income Ratio | Without Mortgage | With Mortgage |
| Less than 2.0x | 781 (26.4%) | 62,593 (2,038.9%) |
| 2.0x to 2.9x | 294 (9.9%) | 707 (23.0%) |
| 3.0x to 3.9x | 360 (12.1%) | 414 (13.5%) |
| 4.0x or more | 1,446 (48.8%) | 422 (13.8%) |
| Total | 2,964 (100.0%) | 3,070 (100.0%) |
Real Estate Taxes by Mortgage Status in West Little River
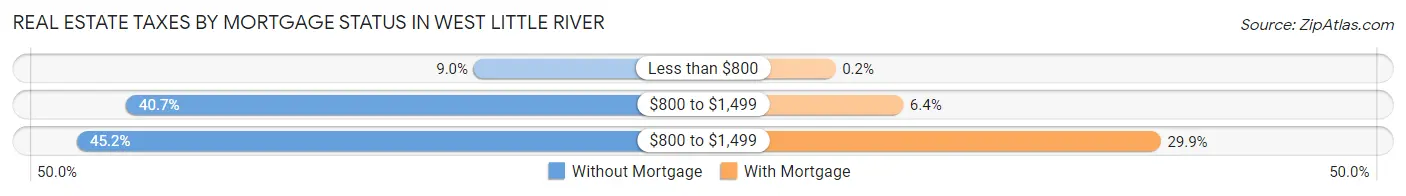
| Property Taxes | Without Mortgage | With Mortgage |
| Less than $800 | 266 (9.0%) | 6 (0.2%) |
| $800 to $1,499 | 1,207 (40.7%) | 196 (6.4%) |
| $800 to $1,499 | 1,340 (45.2%) | 918 (29.9%) |
| Total | 2,964 (100.0%) | 3,070 (100.0%) |
Health & Disability in West Little River
Health Insurance Coverage by Age in West Little River
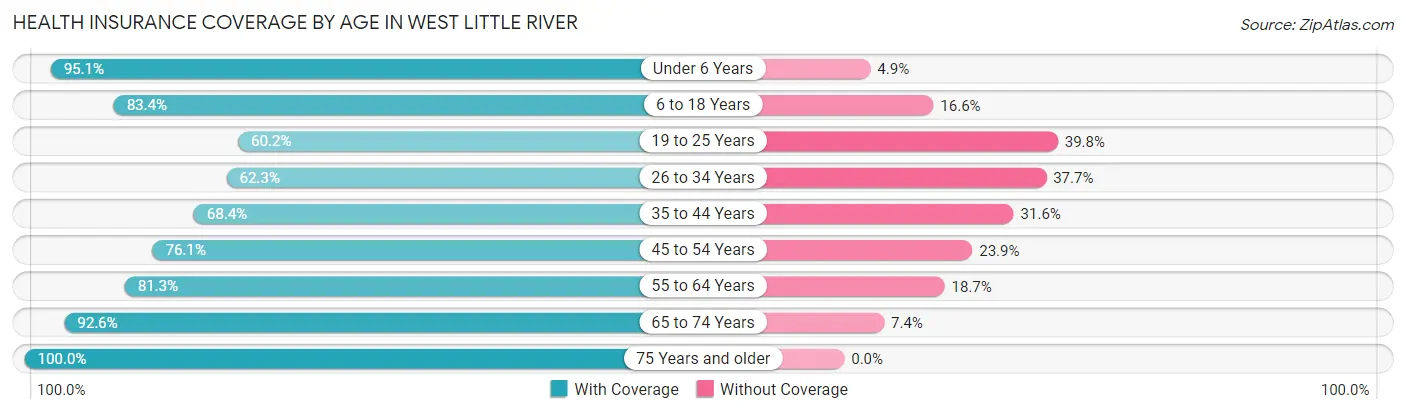
| Age Bracket | With Coverage | Without Coverage |
| Under 6 Years | 2,405 (95.1%) | 123 (4.9%) |
| 6 to 18 Years | 4,234 (83.4%) | 844 (16.6%) |
| 19 to 25 Years | 1,568 (60.2%) | 1,037 (39.8%) |
| 26 to 34 Years | 2,236 (62.3%) | 1,351 (37.7%) |
| 35 to 44 Years | 3,092 (68.4%) | 1,427 (31.6%) |
| 45 to 54 Years | 3,087 (76.1%) | 968 (23.9%) |
| 55 to 64 Years | 4,086 (81.3%) | 939 (18.7%) |
| 65 to 74 Years | 3,493 (92.6%) | 280 (7.4%) |
| 75 Years and older | 2,158 (100.0%) | 0 (0.0%) |
| Total | 26,359 (79.1%) | 6,969 (20.9%) |
Health Insurance Coverage by Citizenship Status in West Little River
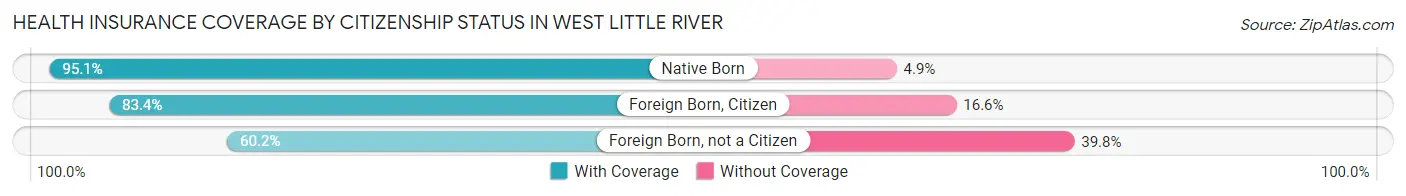
| Citizenship Status | With Coverage | Without Coverage |
| Native Born | 2,405 (95.1%) | 123 (4.9%) |
| Foreign Born, Citizen | 4,234 (83.4%) | 844 (16.6%) |
| Foreign Born, not a Citizen | 1,568 (60.2%) | 1,037 (39.8%) |
Health Insurance Coverage by Household Income in West Little River
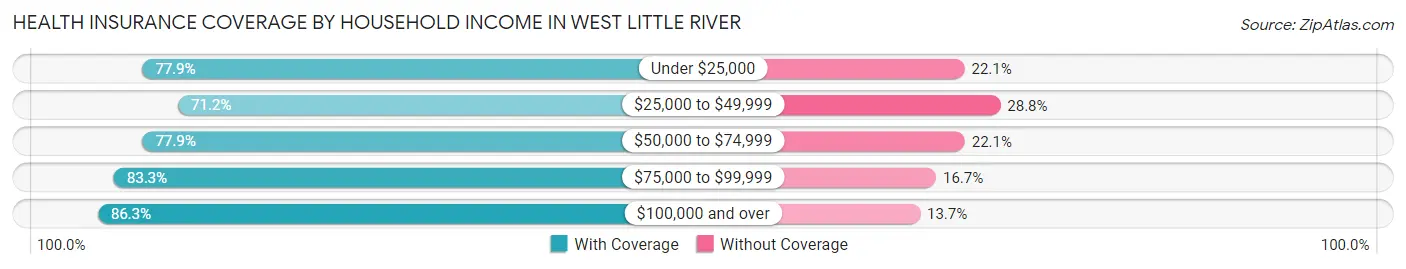
| Household Income | With Coverage | Without Coverage |
| Under $25,000 | 5,332 (77.9%) | 1,509 (22.1%) |
| $25,000 to $49,999 | 5,416 (71.2%) | 2,188 (28.8%) |
| $50,000 to $74,999 | 4,548 (77.9%) | 1,291 (22.1%) |
| $75,000 to $99,999 | 5,247 (83.3%) | 1,054 (16.7%) |
| $100,000 and over | 5,798 (86.3%) | 922 (13.7%) |
Public vs Private Health Insurance Coverage by Age in West Little River
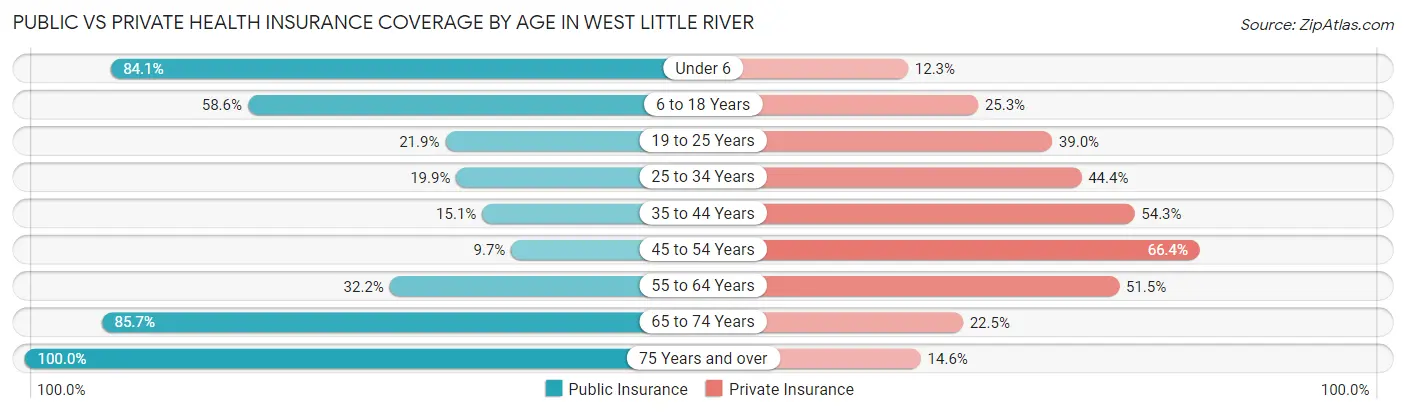
| Age Bracket | Public Insurance | Private Insurance |
| Under 6 | 2,126 (84.1%) | 310 (12.3%) |
| 6 to 18 Years | 2,974 (58.6%) | 1,283 (25.3%) |
| 19 to 25 Years | 571 (21.9%) | 1,016 (39.0%) |
| 25 to 34 Years | 713 (19.9%) | 1,594 (44.4%) |
| 35 to 44 Years | 681 (15.1%) | 2,454 (54.3%) |
| 45 to 54 Years | 393 (9.7%) | 2,694 (66.4%) |
| 55 to 64 Years | 1,620 (32.2%) | 2,586 (51.5%) |
| 65 to 74 Years | 3,234 (85.7%) | 847 (22.5%) |
| 75 Years and over | 2,158 (100.0%) | 316 (14.6%) |
| Total | 14,470 (43.4%) | 13,100 (39.3%) |
Disability Status by Sex by Age in West Little River
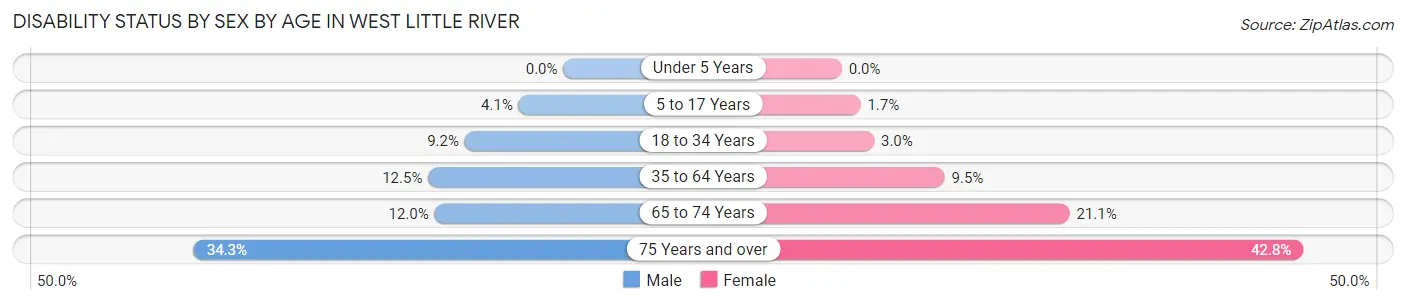
| Age Bracket | Male | Female |
| Under 5 Years | 0 (0.0%) | 0 (0.0%) |
| 5 to 17 Years | 105 (4.1%) | 42 (1.7%) |
| 18 to 34 Years | 299 (9.1%) | 98 (3.0%) |
| 35 to 64 Years | 875 (12.5%) | 632 (9.5%) |
| 65 to 74 Years | 184 (11.9%) | 472 (21.1%) |
| 75 Years and over | 346 (34.3%) | 492 (42.8%) |
Disability Class by Sex by Age in West Little River
Disability Class: Hearing Difficulty
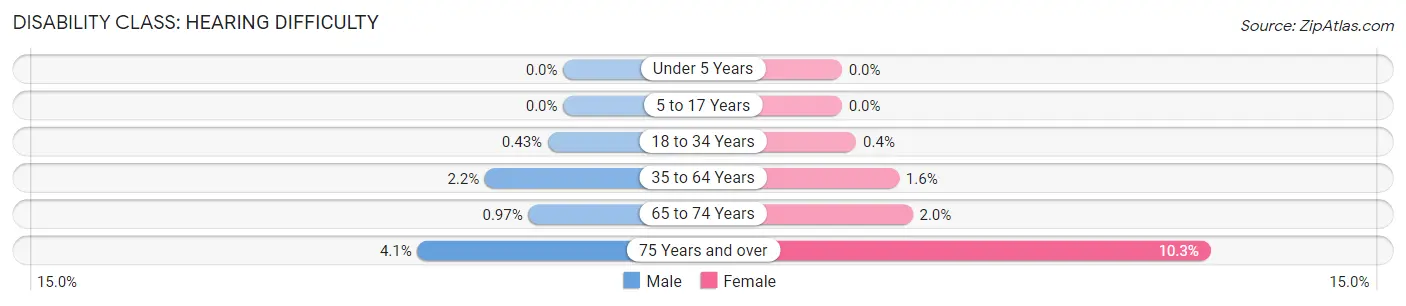
| Age Bracket | Male | Female |
| Under 5 Years | 0 (0.0%) | 0 (0.0%) |
| 5 to 17 Years | 0 (0.0%) | 0 (0.0%) |
| 18 to 34 Years | 14 (0.4%) | 13 (0.4%) |
| 35 to 64 Years | 152 (2.2%) | 105 (1.6%) |
| 65 to 74 Years | 15 (1.0%) | 44 (2.0%) |
| 75 Years and over | 41 (4.1%) | 118 (10.3%) |
Disability Class: Vision Difficulty
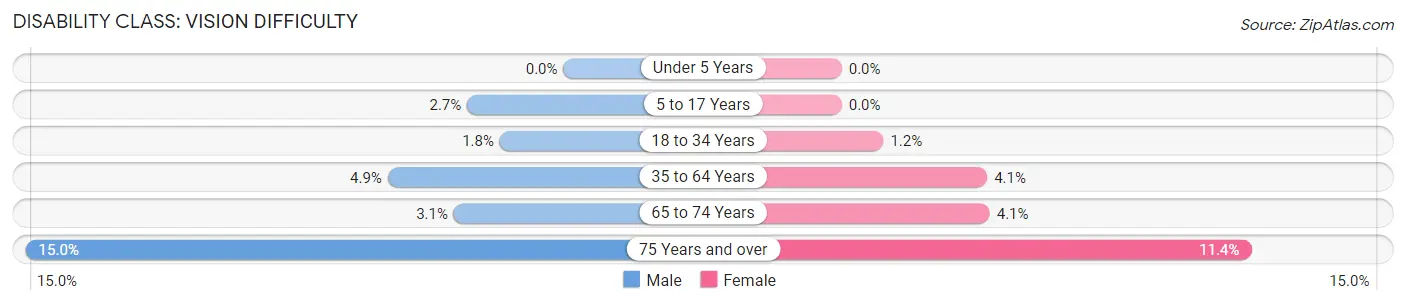
| Age Bracket | Male | Female |
| Under 5 Years | 0 (0.0%) | 0 (0.0%) |
| 5 to 17 Years | 68 (2.7%) | 0 (0.0%) |
| 18 to 34 Years | 58 (1.8%) | 38 (1.2%) |
| 35 to 64 Years | 341 (4.9%) | 268 (4.1%) |
| 65 to 74 Years | 47 (3.0%) | 92 (4.1%) |
| 75 Years and over | 151 (15.0%) | 131 (11.4%) |
Disability Class: Cognitive Difficulty
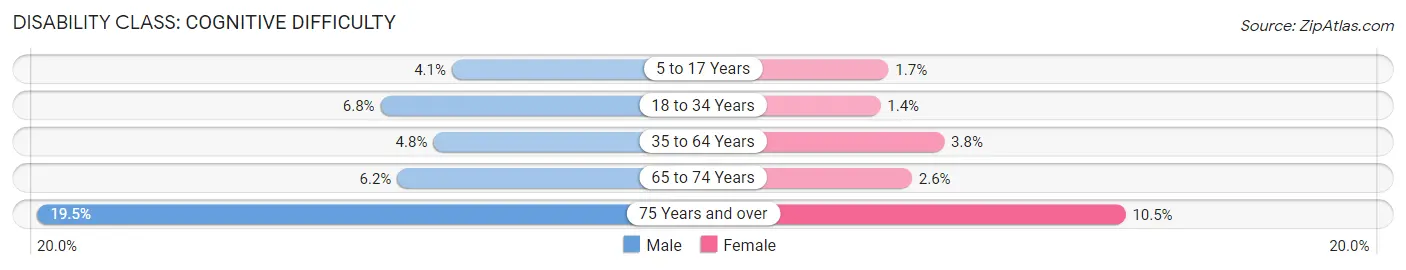
| Age Bracket | Male | Female |
| 5 to 17 Years | 105 (4.1%) | 42 (1.7%) |
| 18 to 34 Years | 222 (6.8%) | 47 (1.4%) |
| 35 to 64 Years | 337 (4.8%) | 252 (3.8%) |
| 65 to 74 Years | 95 (6.2%) | 58 (2.6%) |
| 75 Years and over | 197 (19.5%) | 121 (10.5%) |
Disability Class: Ambulatory Difficulty
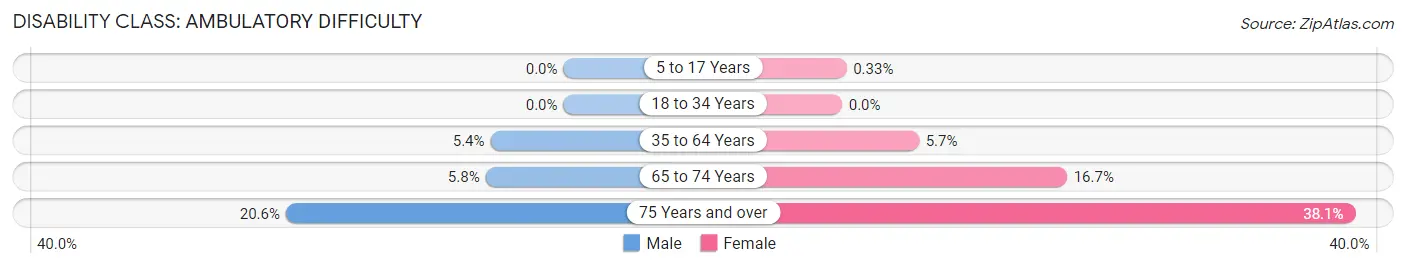
| Age Bracket | Male | Female |
| 5 to 17 Years | 0 (0.0%) | 8 (0.3%) |
| 18 to 34 Years | 0 (0.0%) | 0 (0.0%) |
| 35 to 64 Years | 378 (5.4%) | 378 (5.7%) |
| 65 to 74 Years | 89 (5.8%) | 373 (16.7%) |
| 75 Years and over | 208 (20.6%) | 438 (38.1%) |
Disability Class: Self-Care Difficulty
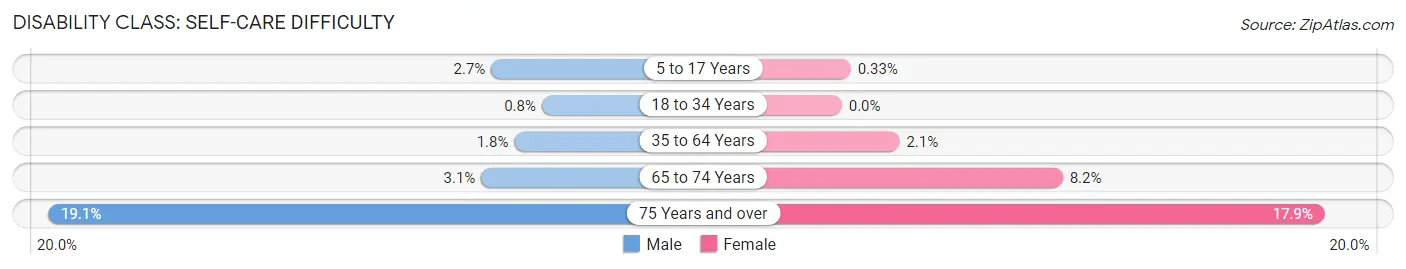
| Age Bracket | Male | Female |
| 5 to 17 Years | 68 (2.7%) | 8 (0.3%) |
| 18 to 34 Years | 26 (0.8%) | 0 (0.0%) |
| 35 to 64 Years | 127 (1.8%) | 142 (2.1%) |
| 65 to 74 Years | 47 (3.0%) | 183 (8.2%) |
| 75 Years and over | 193 (19.1%) | 206 (17.9%) |
Technology Access in West Little River
Computing Device Access in West Little River
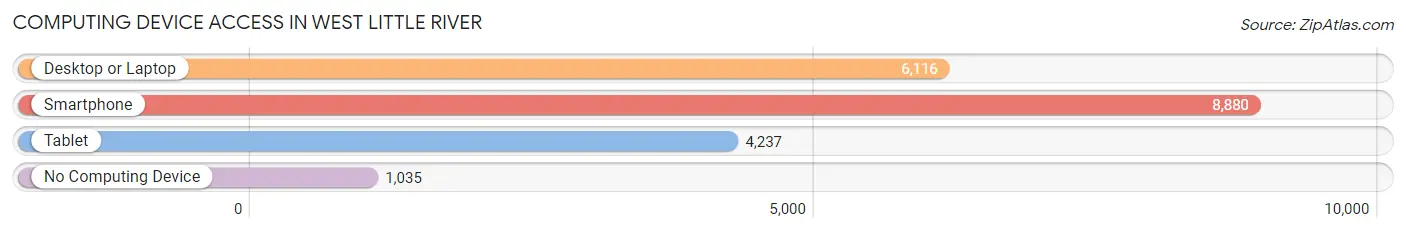
| Device Type | # Households | % Households |
| Desktop or Laptop | 6,116 | 59.1% |
| Smartphone | 8,880 | 85.8% |
| Tablet | 4,237 | 40.9% |
| No Computing Device | 1,035 | 10.0% |
| Total | 10,347 | 100.0% |
Internet Access in West Little River
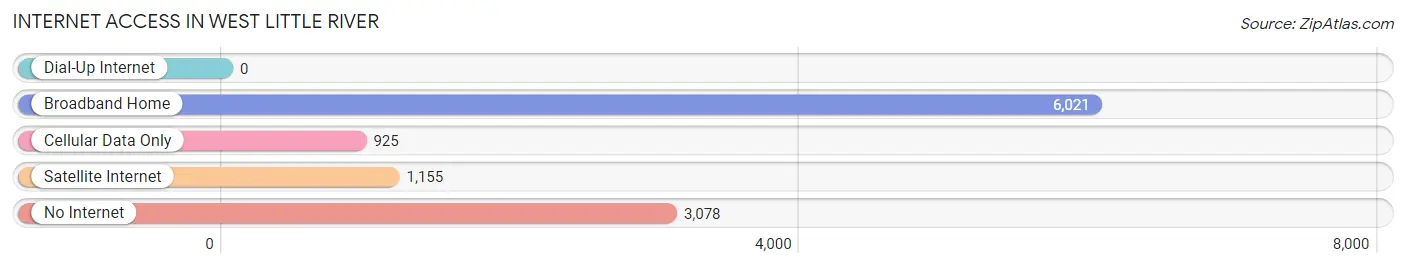
| Internet Type | # Households | % Households |
| Dial-Up Internet | 0 | 0.0% |
| Broadband Home | 6,021 | 58.2% |
| Cellular Data Only | 925 | 8.9% |
| Satellite Internet | 1,155 | 11.2% |
| No Internet | 3,078 | 29.7% |
| Total | 10,347 | 100.0% |
West Little River Summary
Little River is a census-designated place (CDP) in Miami-Dade County, Florida, United States. The population was 24,449 at the 2000 census.
History
Little River was originally a farming community in the early 1900s. The area was settled by Bahamian immigrants who grew tomatoes, beans, and other vegetables. The area was known as Little River because of the Little River Canal, which was dug in the early 1900s to provide irrigation for the farms.
In the 1950s, the area began to experience rapid growth as the population of Miami increased. The area was annexed by the City of Miami in 1954 and became part of the city's West Little River neighborhood.
Geography
Little River is located at 25 51 17 North 80 14 45 West 25 854722 80 245833
According to the United States Census Bureau, the CDP has a total area of 4.2 square miles (10.8 km²), of which, 4.2 square miles (10.8 km²) of it is land and 0.04 square miles (0.1 km²) of it (0.48%) is water.
Economy
Little River is a predominantly residential area, with a few small businesses. The main industries in the area are construction, retail, and health care.
Demographics
As of the census of 2000, there were 24,449 people, 8,845 households, and 6,072 families residing in the CDP. The population density was 5,817.3 people per square mile (2,250.2/km²). There were 9,541 housing units at an average density of 2,286.2/sq mi (886.2/km²). The racial makeup of the CDP was 64.45% White (44.2% were Non-Hispanic White,) 28.17% African American, 0.30% Native American, 0.90% Asian, 0.05% Pacific Islander, 4.45% from other races, and 1.68% from two or more races. Hispanic or Latino of any race were 68.45% of the population.
There were 8,845 households out of which 33.2% had children under the age of 18 living with them, 41.2% were married couples living together, 22.2% had a female householder with no husband present, and 30.2% were non-families. 24.2% of all households were made up of individuals and 9.2% had someone living alone who was 65 years of age or older. The average household size was 2.75 and the average family size was 3.30.
In the CDP, the population was spread out with 26.2% under the age of 18, 10.2% from 18 to 24, 29.2% from 25 to 44, 21.2% from 45 to 64, and 13.2% who were 65 years of age or older. The median age was 34 years. For every 100 females, there were 91.2 males. For every 100 females age 18 and over, there were 86.7 males.
The median income for a household in the CDP was $25,945, and the median income for a family was $27,945. Males had a median income of $25,945 versus $20,945 for females. The per capita income for the CDP was $12,945. About 24.2% of families and 27.2% of the population were below the poverty line, including 37.2% of those under age 18 and 20.2% of those age 65 or over.
Common Questions
What is Per Capita Income in West Little River?
Per Capita income in West Little River is $20,124.
What is the Median Family Income in West Little River?
Median Family Income in West Little River is $52,432.
What is the Median Household income in West Little River?
Median Household Income in West Little River is $46,518.
What is Income or Wage Gap in West Little River?
Income or Wage Gap in West Little River is 5.8%.
Women in West Little River earn 94.2 cents for every dollar earned by a man.
What is Family Income Deficit in West Little River?
Family Income Deficit in West Little River is $11,041.
Families that are below poverty line in West Little River earn $11,041 less on average than the poverty threshold level.
What is Inequality or Gini Index in West Little River?
Inequality or Gini Index in West Little River is 0.46.
What is the Total Population of West Little River?
Total Population of West Little River is 33,465.
What is the Total Male Population of West Little River?
Total Male Population of West Little River is 16,568.
What is the Total Female Population of West Little River?
Total Female Population of West Little River is 16,897.
What is the Ratio of Males per 100 Females in West Little River?
There are 98.05 Males per 100 Females in West Little River.
What is the Ratio of Females per 100 Males in West Little River?
There are 101.99 Females per 100 Males in West Little River.
What is the Median Population Age in West Little River?
Median Population Age in West Little River is 41.5 Years.
What is the Average Family Size in West Little River
Average Family Size in West Little River is 3.8 People.
What is the Average Household Size in West Little River
Average Household Size in West Little River is 3.2 People.
How Large is the Labor Force in West Little River?
There are 14,850 People in the Labor Forcein in West Little River.
What is the Percentage of People in the Labor Force in West Little River?
55.9% of People are in the Labor Force in West Little River.
What is the Unemployment Rate in West Little River?
Unemployment Rate in West Little River is 6.4%.