Hampton, GA Map & Demographics
Hampton Map
Hampton Overview
$23,718
PER CAPITA INCOME
$72,685
AVG FAMILY INCOME
$67,808
AVG HOUSEHOLD INCOME
17.5%
WAGE / INCOME GAP [ % ]
82.5¢/ $1
WAGE / INCOME GAP [ $ ]
0.41
INEQUALITY / GINI INDEX
8,244
TOTAL POPULATION
3,539
MALE POPULATION
4,705
FEMALE POPULATION
75.22
MALES / 100 FEMALES
132.95
FEMALES / 100 MALES
32.9
MEDIAN AGE
4.5
AVG FAMILY SIZE
3.4
AVG HOUSEHOLD SIZE
3,684
LABOR FORCE [ PEOPLE ]
59.1%
PERCENT IN LABOR FORCE
3.6%
UNEMPLOYMENT RATE
Hampton Zip Codes
Hampton Area Codes
Income in Hampton
Income Overview in Hampton
Per Capita Income in Hampton is $23,718, while median incomes of families and households are $72,685 and $67,808 respectively.
| Characteristic | Number | Measure |
| Per Capita Income | 8,244 | $23,718 |
| Median Family Income | 1,612 | $72,685 |
| Mean Family Income | 1,612 | $89,812 |
| Median Household Income | 2,410 | $67,808 |
| Mean Household Income | 2,410 | $77,967 |
| Income Deficit | 1,612 | $0 |
| Wage / Income Gap (%) | 8,244 | 17.54% |
| Wage / Income Gap ($) | 8,244 | 82.46¢ per $1 |
| Gini / Inequality Index | 8,244 | 0.41 |
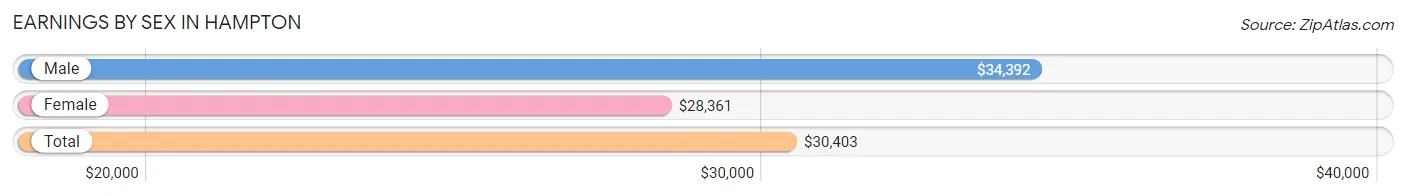
Earnings by Sex in Hampton
Average Earnings in Hampton are $30,403, $34,392 for men and $28,361 for women, a difference of 17.5%.
| Sex | Number | Average Earnings |
| Male | 2,007 (49.0%) | $34,392 |
| Female | 2,092 (51.0%) | $28,361 |
| Total | 4,099 (100.0%) | $30,403 |
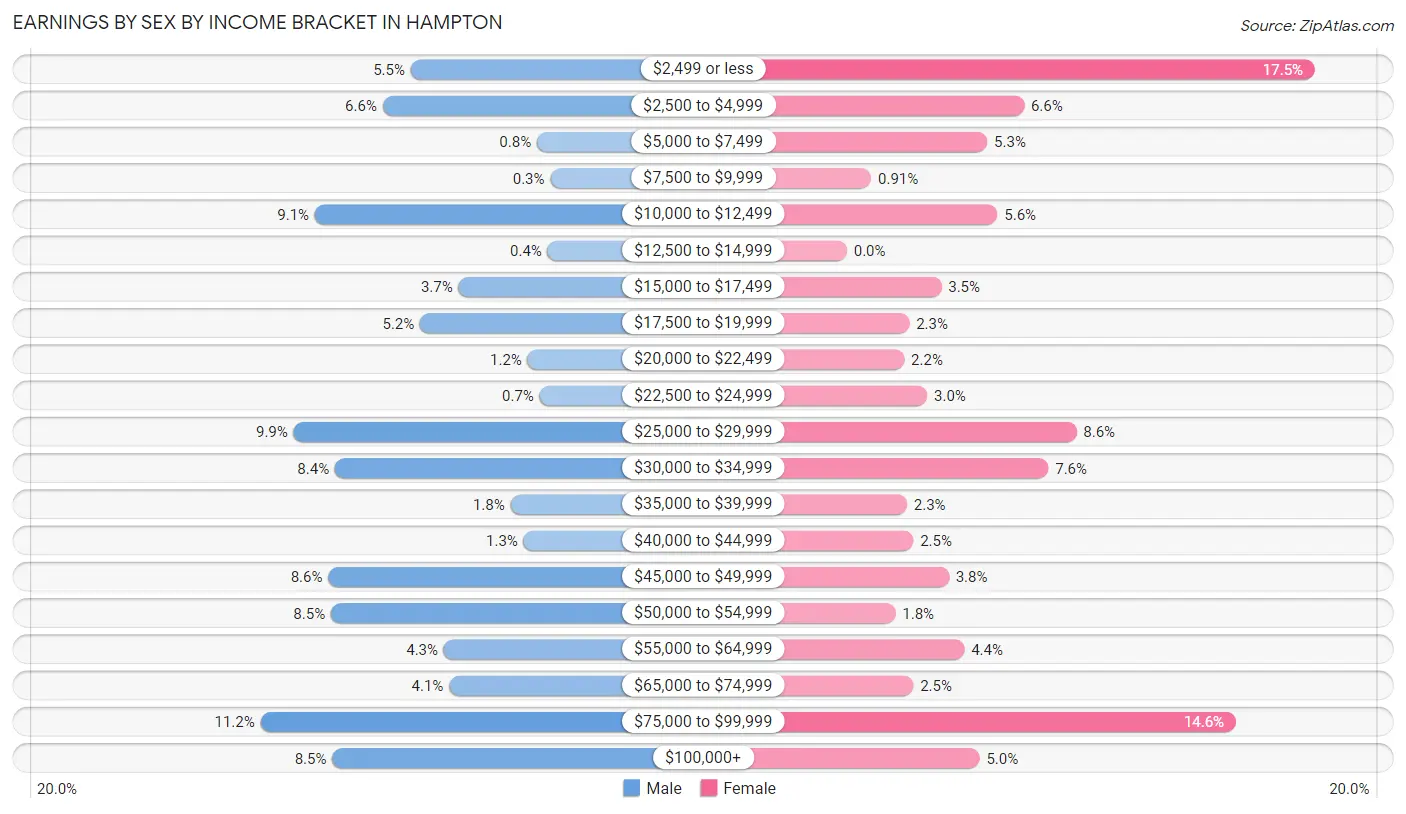
Earnings by Sex by Income Bracket in Hampton
The most common earnings brackets in Hampton are $75,000 to $99,999 for men (224 | 11.2%) and $2,499 or less for women (367 | 17.5%).
| Income | Male | Female |
| $2,499 or less | 111 (5.5%) | 367 (17.5%) |
| $2,500 to $4,999 | 132 (6.6%) | 139 (6.6%) |
| $5,000 to $7,499 | 16 (0.8%) | 110 (5.3%) |
| $7,500 to $9,999 | 6 (0.3%) | 19 (0.9%) |
| $10,000 to $12,499 | 183 (9.1%) | 118 (5.6%) |
| $12,500 to $14,999 | 8 (0.4%) | 0 (0.0%) |
| $15,000 to $17,499 | 75 (3.7%) | 74 (3.5%) |
| $17,500 to $19,999 | 104 (5.2%) | 49 (2.3%) |
| $20,000 to $22,499 | 23 (1.1%) | 45 (2.1%) |
| $22,500 to $24,999 | 14 (0.7%) | 63 (3.0%) |
| $25,000 to $29,999 | 199 (9.9%) | 180 (8.6%) |
| $30,000 to $34,999 | 168 (8.4%) | 158 (7.5%) |
| $35,000 to $39,999 | 36 (1.8%) | 47 (2.2%) |
| $40,000 to $44,999 | 26 (1.3%) | 52 (2.5%) |
| $45,000 to $49,999 | 173 (8.6%) | 80 (3.8%) |
| $50,000 to $54,999 | 171 (8.5%) | 38 (1.8%) |
| $55,000 to $64,999 | 86 (4.3%) | 92 (4.4%) |
| $65,000 to $74,999 | 82 (4.1%) | 52 (2.5%) |
| $75,000 to $99,999 | 224 (11.2%) | 305 (14.6%) |
| $100,000+ | 170 (8.5%) | 104 (5.0%) |
| Total | 2,007 (100.0%) | 2,092 (100.0%) |
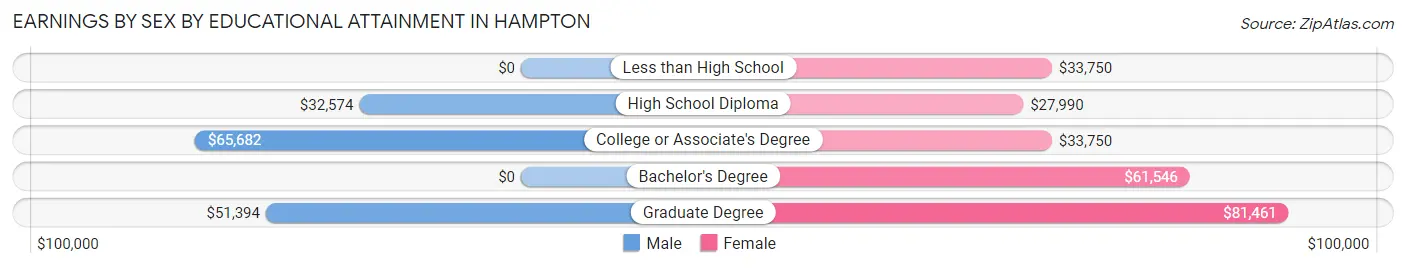
Earnings by Sex by Educational Attainment in Hampton
Average earnings in Hampton are $43,798 for men and $35,479 for women, a difference of 19.0%. Men with an educational attainment of college or associate's degree enjoy the highest average annual earnings of $65,682, while those with high school diploma education earn the least with $32,574. Women with an educational attainment of graduate degree earn the most with the average annual earnings of $81,461, while those with high school diploma education have the smallest earnings of $27,990.
| Educational Attainment | Male Income | Female Income |
| Less than High School | - | - |
| High School Diploma | $32,574 | $27,990 |
| College or Associate's Degree | $65,682 | $33,750 |
| Bachelor's Degree | - | - |
| Graduate Degree | $51,394 | $81,461 |
| Total | $43,798 | $35,479 |
Family Income in Hampton
Family Income Brackets in Hampton
According to the Hampton family income data, there are 272 families falling into the $75,000 to $99,999 income range, which is the most common income bracket and makes up 16.9% of all families.
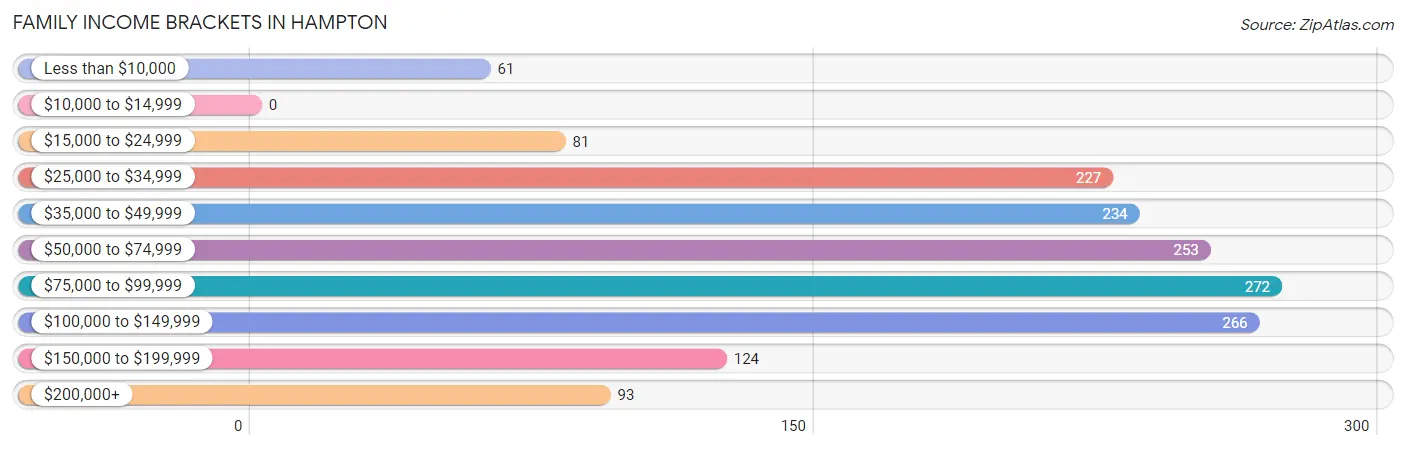
| Income Bracket | # Families | % Families |
| Less than $10,000 | 61 | 3.8% |
| $10,000 to $14,999 | 0 | 0.0% |
| $15,000 to $24,999 | 81 | 5.0% |
| $25,000 to $34,999 | 227 | 14.1% |
| $35,000 to $49,999 | 234 | 14.5% |
| $50,000 to $74,999 | 253 | 15.7% |
| $75,000 to $99,999 | 272 | 16.9% |
| $100,000 to $149,999 | 266 | 16.5% |
| $150,000 to $199,999 | 124 | 7.7% |
| $200,000+ | 93 | 5.8% |
Family Income by Famaliy Size in Hampton
4-person families (295 | 18.3%) account for the highest median family income in Hampton with $92,569 per family, while 2-person families (451 | 28.0%) have the highest median income of $29,479 per family member.
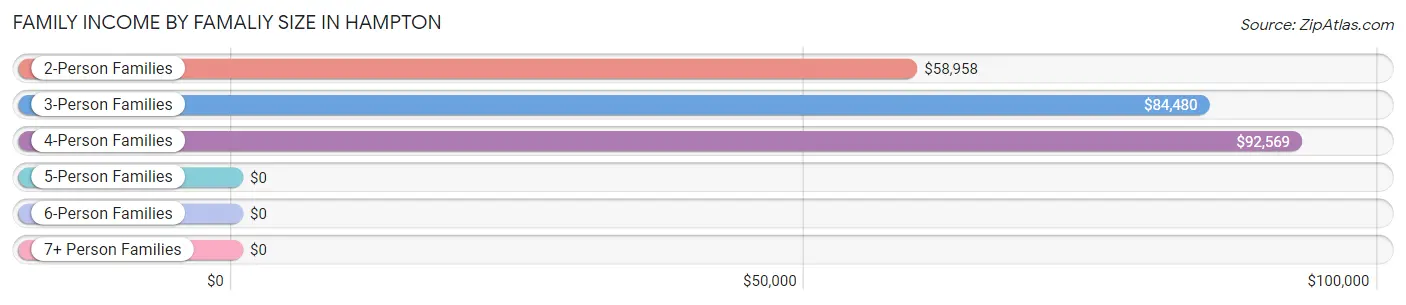
| Income Bracket | # Families | Median Income |
| 2-Person Families | 451 (28.0%) | $58,958 |
| 3-Person Families | 427 (26.5%) | $84,480 |
| 4-Person Families | 295 (18.3%) | $92,569 |
| 5-Person Families | 245 (15.2%) | $0 |
| 6-Person Families | 102 (6.3%) | $0 |
| 7+ Person Families | 92 (5.7%) | $0 |
| Total | 1,612 (100.0%) | $72,685 |
Family Income by Number of Earners in Hampton
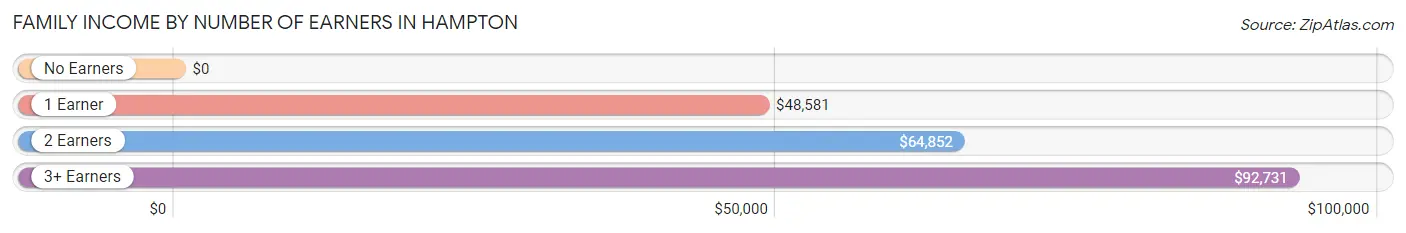
| Number of Earners | # Families | Median Income |
| No Earners | 161 (10.0%) | $0 |
| 1 Earner | 468 (29.0%) | $48,581 |
| 2 Earners | 603 (37.4%) | $64,852 |
| 3+ Earners | 380 (23.6%) | $92,731 |
| Total | 1,612 (100.0%) | $72,685 |
Household Income in Hampton
Household Income Brackets in Hampton
With 537 households falling in the category, the $75,000 to $99,999 income range is the most frequent in Hampton, accounting for 22.3% of all households. In contrast, only 43 households (1.8%) fall into the $10,000 to $14,999 income bracket, making it the least populous group.
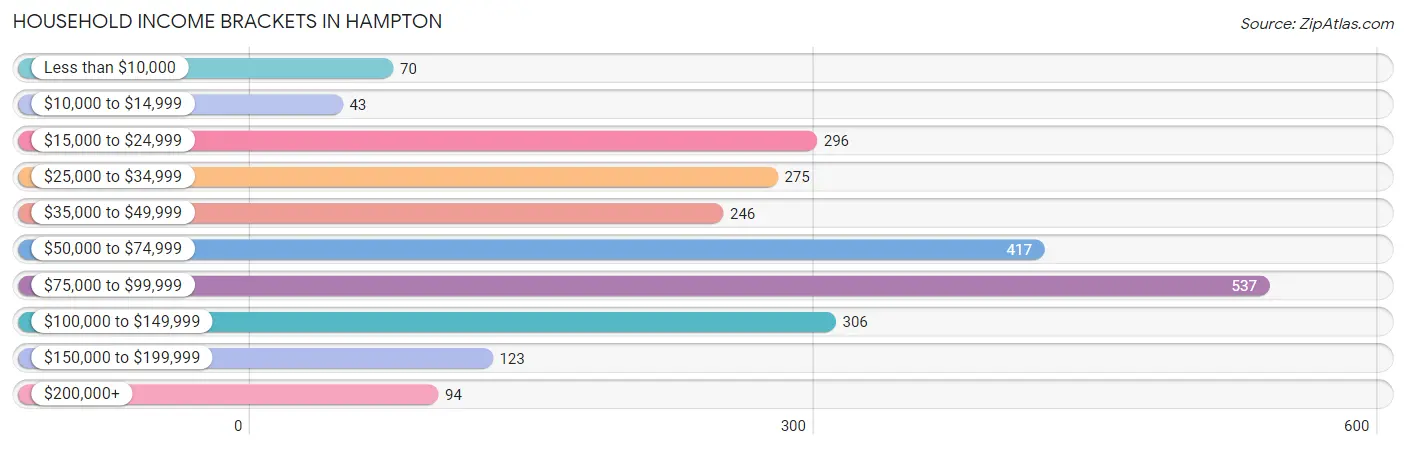
| Income Bracket | # Households | % Households |
| Less than $10,000 | 70 | 2.9% |
| $10,000 to $14,999 | 43 | 1.8% |
| $15,000 to $24,999 | 296 | 12.3% |
| $25,000 to $34,999 | 275 | 11.4% |
| $35,000 to $49,999 | 246 | 10.2% |
| $50,000 to $74,999 | 417 | 17.3% |
| $75,000 to $99,999 | 537 | 22.3% |
| $100,000 to $149,999 | 306 | 12.7% |
| $150,000 to $199,999 | 123 | 5.1% |
| $200,000+ | 94 | 3.9% |
Household Income by Householder Age in Hampton
The median household income in Hampton is $67,808, with the highest median household income of $69,116 found in the 45 to 64 years age bracket for the primary householder. A total of 1,071 households (44.4%) fall into this category.
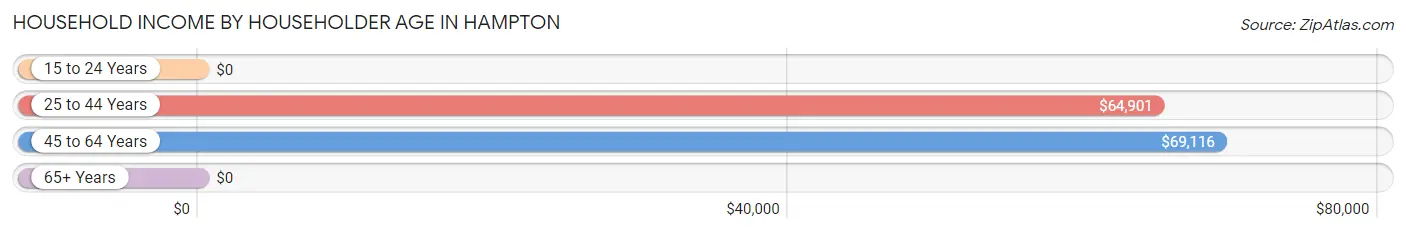
| Income Bracket | # Households | Median Income |
| 15 to 24 Years | 0 (0.0%) | $0 |
| 25 to 44 Years | 1,002 (41.6%) | $64,901 |
| 45 to 64 Years | 1,071 (44.4%) | $69,116 |
| 65+ Years | 337 (14.0%) | $0 |
| Total | 2,410 (100.0%) | $67,808 |
Poverty in Hampton
Income Below Poverty by Sex and Age in Hampton
With 19.6% poverty level for males and 15.5% for females among the residents of Hampton, 6 to 11 year old males and under 5 year old females are the most vulnerable to poverty, with 236 males (47.5%) and 175 females (47.8%) in their respective age groups living below the poverty level.
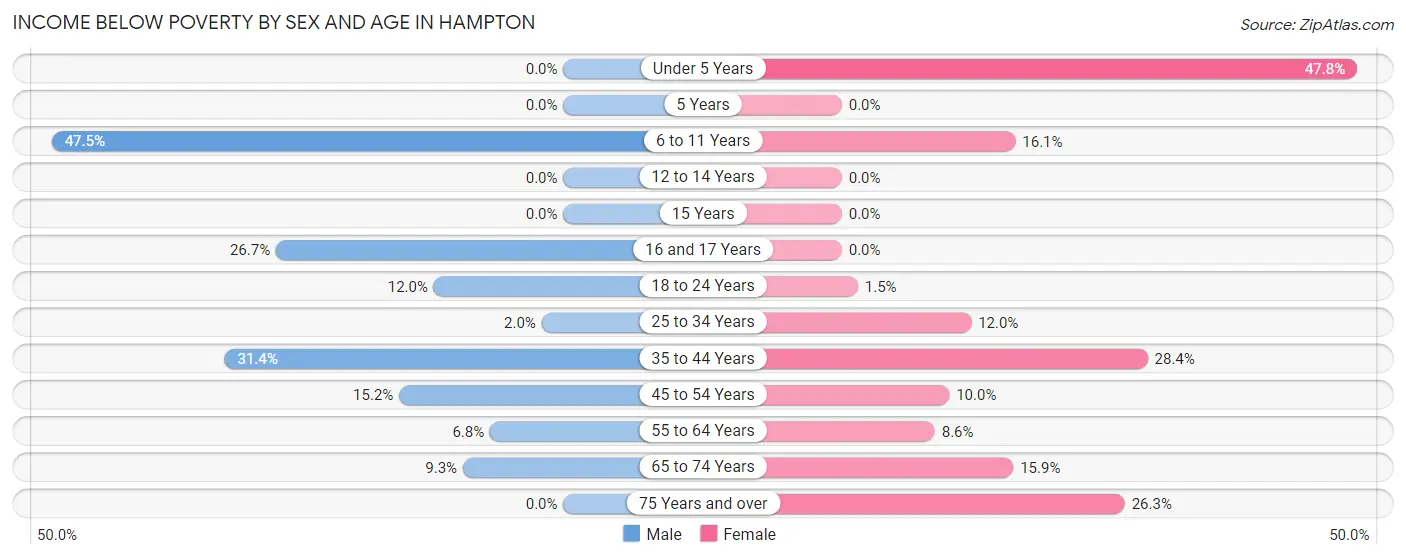
| Age Bracket | Male | Female |
| Under 5 Years | 0 (0.0%) | 175 (47.8%) |
| 5 Years | 0 (0.0%) | 0 (0.0%) |
| 6 to 11 Years | 236 (47.5%) | 121 (16.1%) |
| 12 to 14 Years | 0 (0.0%) | 0 (0.0%) |
| 15 Years | 0 (0.0%) | 0 (0.0%) |
| 16 and 17 Years | 8 (26.7%) | 0 (0.0%) |
| 18 to 24 Years | 44 (12.0%) | 11 (1.5%) |
| 25 to 34 Years | 8 (2.0%) | 37 (12.0%) |
| 35 to 44 Years | 293 (31.4%) | 216 (28.4%) |
| 45 to 54 Years | 66 (15.2%) | 39 (10.0%) |
| 55 to 64 Years | 24 (6.8%) | 51 (8.6%) |
| 65 to 74 Years | 15 (9.3%) | 28 (15.9%) |
| 75 Years and over | 0 (0.0%) | 52 (26.3%) |
| Total | 694 (19.6%) | 730 (15.5%) |
Income Above Poverty by Sex and Age in Hampton
According to the poverty statistics in Hampton, males aged under 5 years and females aged 12 to 14 years are the age groups that are most secure financially, with 100.0% of males and 100.0% of females in these age groups living above the poverty line.
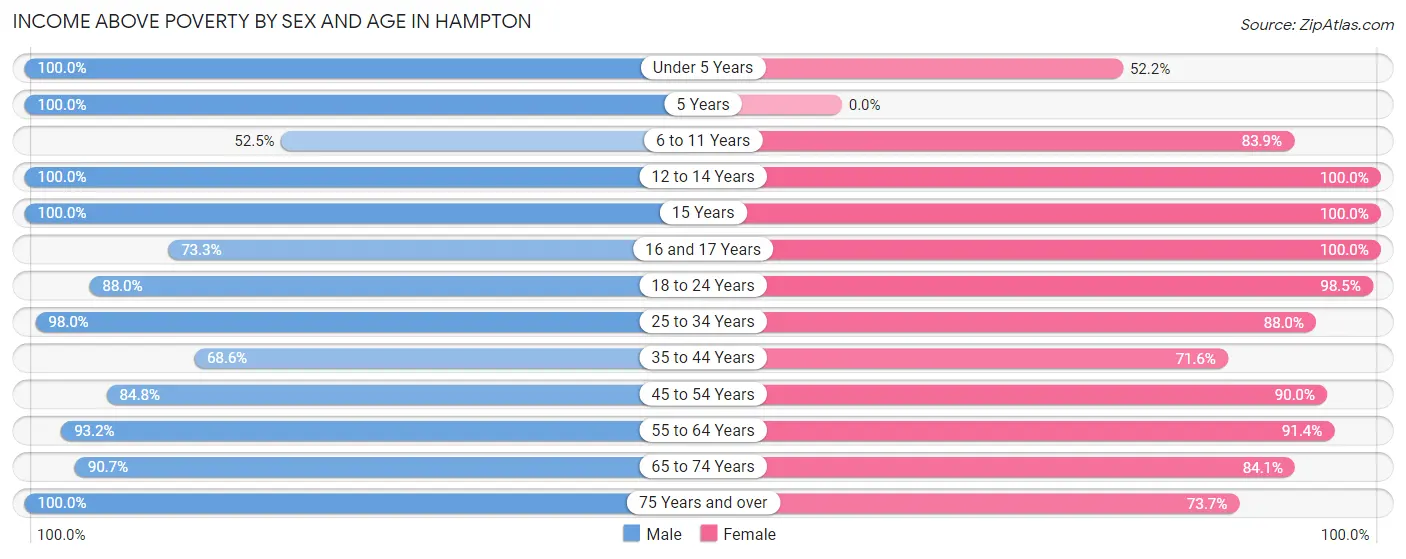
| Age Bracket | Male | Female |
| Under 5 Years | 76 (100.0%) | 191 (52.2%) |
| 5 Years | 139 (100.0%) | 0 (0.0%) |
| 6 to 11 Years | 261 (52.5%) | 630 (83.9%) |
| 12 to 14 Years | 46 (100.0%) | 82 (100.0%) |
| 15 Years | 40 (100.0%) | 13 (100.0%) |
| 16 and 17 Years | 22 (73.3%) | 332 (100.0%) |
| 18 to 24 Years | 322 (88.0%) | 725 (98.5%) |
| 25 to 34 Years | 391 (98.0%) | 271 (88.0%) |
| 35 to 44 Years | 639 (68.6%) | 545 (71.6%) |
| 45 to 54 Years | 367 (84.8%) | 352 (90.0%) |
| 55 to 64 Years | 329 (93.2%) | 540 (91.4%) |
| 65 to 74 Years | 146 (90.7%) | 148 (84.1%) |
| 75 Years and over | 67 (100.0%) | 146 (73.7%) |
| Total | 2,845 (80.4%) | 3,975 (84.5%) |
Income Below Poverty Among Married-Couple Families in Hampton
The poverty statistics for married-couple families in Hampton show that 17.1% or 193 of the total 1,127 families live below the poverty line. Families with 3 or 4 children have the highest poverty rate of 36.3%, comprising of 102 families. On the other hand, families with 1 or 2 children have the lowest poverty rate of 0.0%, which includes 0 families.
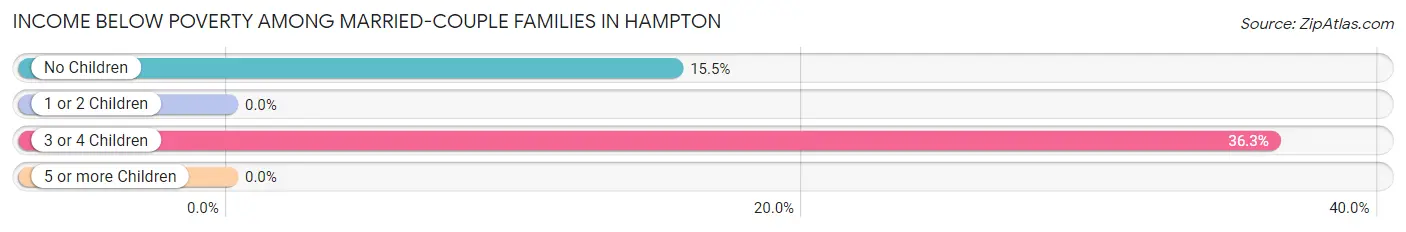
| Children | Above Poverty | Below Poverty |
| No Children | 496 (84.5%) | 91 (15.5%) |
| 1 or 2 Children | 191 (100.0%) | 0 (0.0%) |
| 3 or 4 Children | 179 (63.7%) | 102 (36.3%) |
| 5 or more Children | 68 (100.0%) | 0 (0.0%) |
| Total | 934 (82.9%) | 193 (17.1%) |
Income Below Poverty Among Single-Parent Households in Hampton
According to the poverty data in Hampton, 42.7% or 47 single-father households and 1.1% or 4 single-mother households are living below the poverty line. Among single-father households, those with no children have the highest poverty rate, with 41 households (44.1%) experiencing poverty. Likewise, among single-mother households, those with 1 or 2 children have the highest poverty rate, with 4 households (2.0%) falling below the poverty line.
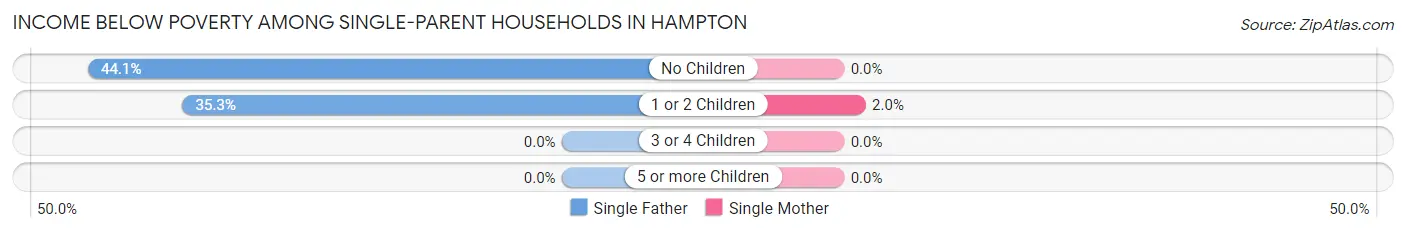
| Children | Single Father | Single Mother |
| No Children | 41 (44.1%) | 0 (0.0%) |
| 1 or 2 Children | 6 (35.3%) | 4 (2.0%) |
| 3 or 4 Children | 0 (0.0%) | 0 (0.0%) |
| 5 or more Children | 0 (0.0%) | 0 (0.0%) |
| Total | 47 (42.7%) | 4 (1.1%) |
Income Below Poverty Among Married-Couple vs Single-Parent Households in Hampton
The poverty data for Hampton shows that 193 of the married-couple family households (17.1%) and 51 of the single-parent households (10.5%) are living below the poverty level. Within the married-couple family households, those with 3 or 4 children have the highest poverty rate, with 102 households (36.3%) falling below the poverty line. Among the single-parent households, those with no children have the highest poverty rate, with 41 household (15.3%) living below poverty.
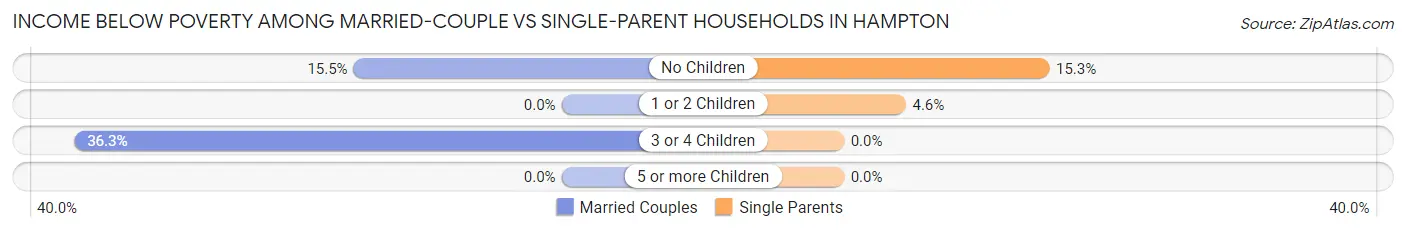
| Children | Married-Couple Families | Single-Parent Households |
| No Children | 91 (15.5%) | 41 (15.3%) |
| 1 or 2 Children | 0 (0.0%) | 10 (4.6%) |
| 3 or 4 Children | 102 (36.3%) | 0 (0.0%) |
| 5 or more Children | 0 (0.0%) | 0 (0.0%) |
| Total | 193 (17.1%) | 51 (10.5%) |
Race in Hampton
The most populous races in Hampton are Black / African American (4,810 | 58.4%), White / Caucasian (3,175 | 38.5%), and Hispanic or Latino (301 | 3.6%).
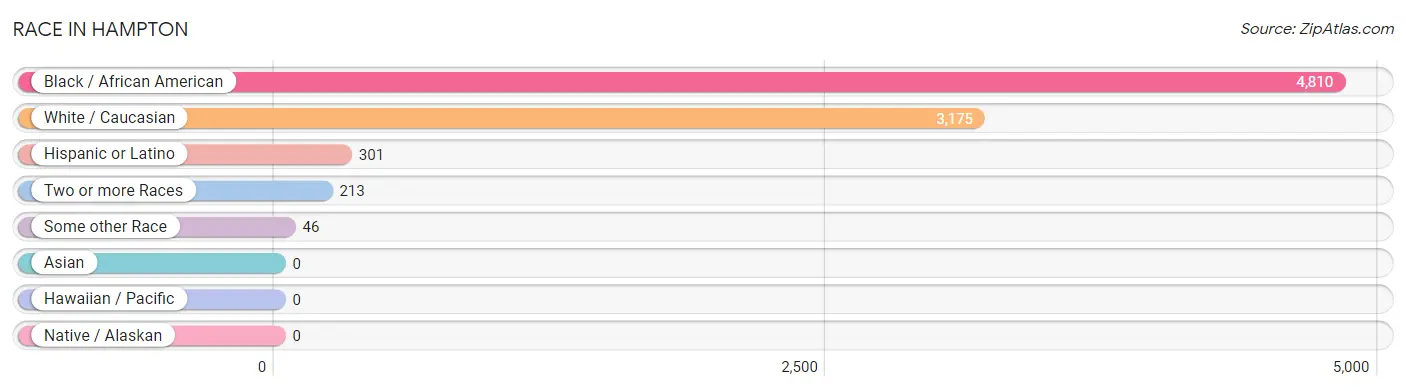
| Race | # Population | % Population |
| Asian | 0 | 0.0% |
| Black / African American | 4,810 | 58.4% |
| Hawaiian / Pacific | 0 | 0.0% |
| Hispanic or Latino | 301 | 3.6% |
| Native / Alaskan | 0 | 0.0% |
| White / Caucasian | 3,175 | 38.5% |
| Two or more Races | 213 | 2.6% |
| Some other Race | 46 | 0.6% |
| Total | 8,244 | 100.0% |
Ancestry in Hampton
The most populous ancestries reported in Hampton are Haitian (1,610 | 19.5%), English (739 | 9.0%), Subsaharan African (609 | 7.4%), Irish (523 | 6.3%), and German (491 | 6.0%), together accounting for 48.2% of all Hampton residents.
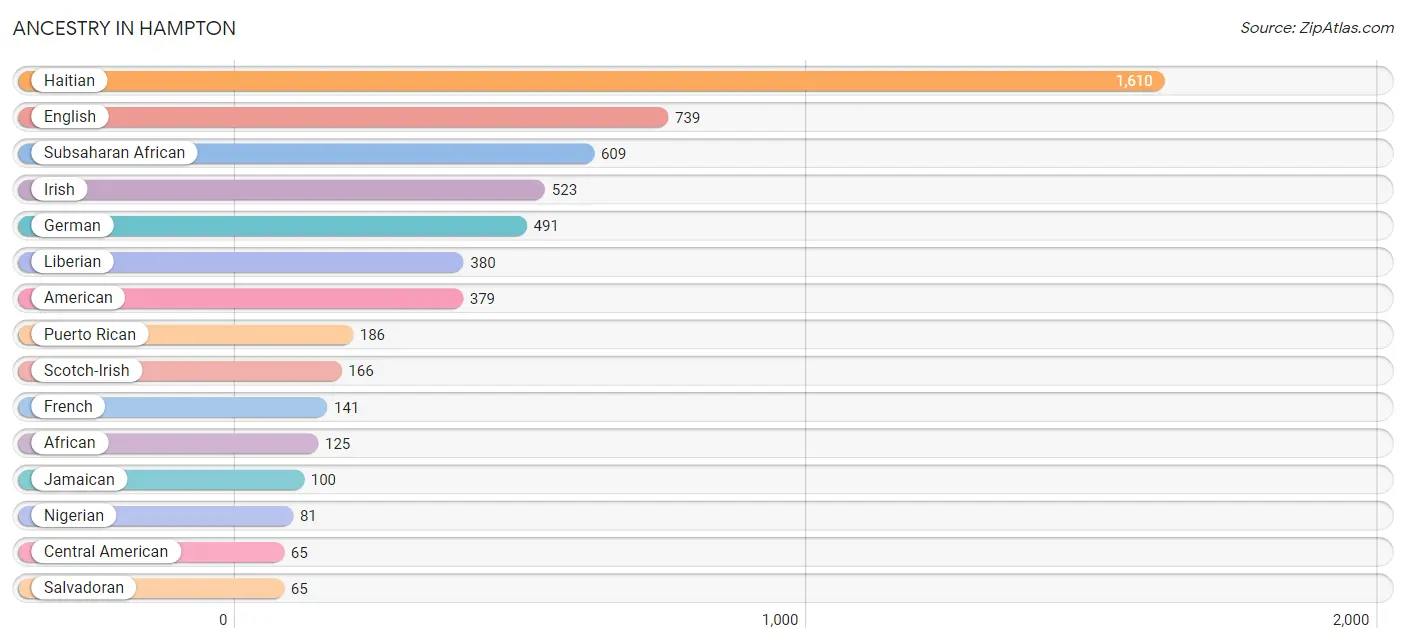
| Ancestry | # Population | % Population |
| African | 125 | 1.5% |
| American | 379 | 4.6% |
| Barbadian | 63 | 0.8% |
| British | 11 | 0.1% |
| Central American | 65 | 0.8% |
| Dominican | 9 | 0.1% |
| Dutch | 4 | 0.1% |
| English | 739 | 9.0% |
| European | 44 | 0.5% |
| French | 141 | 1.7% |
| German | 491 | 6.0% |
| Guyanese | 43 | 0.5% |
| Haitian | 1,610 | 19.5% |
| Hungarian | 36 | 0.4% |
| Irish | 523 | 6.3% |
| Italian | 47 | 0.6% |
| Jamaican | 100 | 1.2% |
| Liberian | 380 | 4.6% |
| Mexican | 41 | 0.5% |
| Nigerian | 81 | 1.0% |
| Norwegian | 22 | 0.3% |
| Polish | 23 | 0.3% |
| Puerto Rican | 186 | 2.3% |
| Salvadoran | 65 | 0.8% |
| Scotch-Irish | 166 | 2.0% |
| Scottish | 8 | 0.1% |
| Subsaharan African | 609 | 7.4% |
| Swedish | 42 | 0.5% | View All 28 Rows |
Immigrants in Hampton
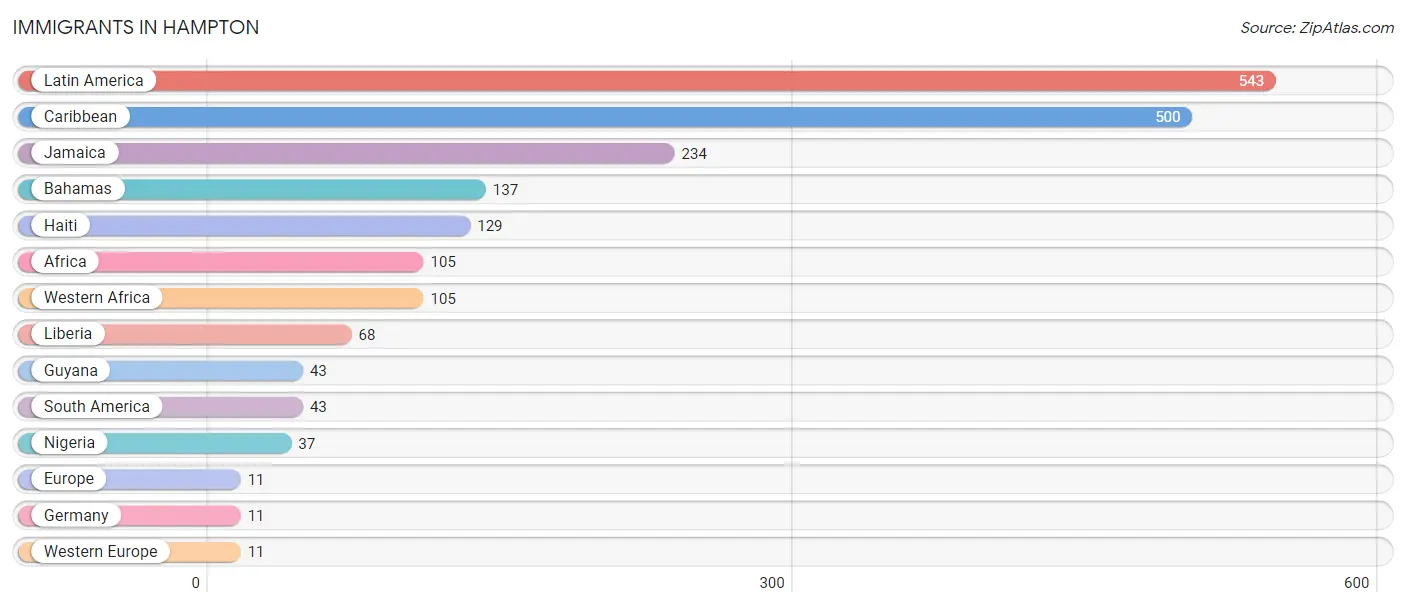
The most numerous immigrant groups reported in Hampton came from Latin America (543 | 6.6%), Caribbean (500 | 6.1%), Jamaica (234 | 2.8%), Bahamas (137 | 1.7%), and Haiti (129 | 1.6%), together accounting for 18.7% of all Hampton residents.
| Immigration Origin | # Population | % Population |
| Africa | 105 | 1.3% |
| Bahamas | 137 | 1.7% |
| Caribbean | 500 | 6.1% |
| Europe | 11 | 0.1% |
| Germany | 11 | 0.1% |
| Guyana | 43 | 0.5% |
| Haiti | 129 | 1.6% |
| Jamaica | 234 | 2.8% |
| Latin America | 543 | 6.6% |
| Liberia | 68 | 0.8% |
| Nigeria | 37 | 0.4% |
| South America | 43 | 0.5% |
| Western Africa | 105 | 1.3% |
| Western Europe | 11 | 0.1% | View All 14 Rows |
Sex and Age in Hampton
Sex and Age in Hampton
The most populous age groups in Hampton are 40 to 44 Years (670 | 18.9%) for men and 15 to 19 Years (690 | 14.7%) for women.
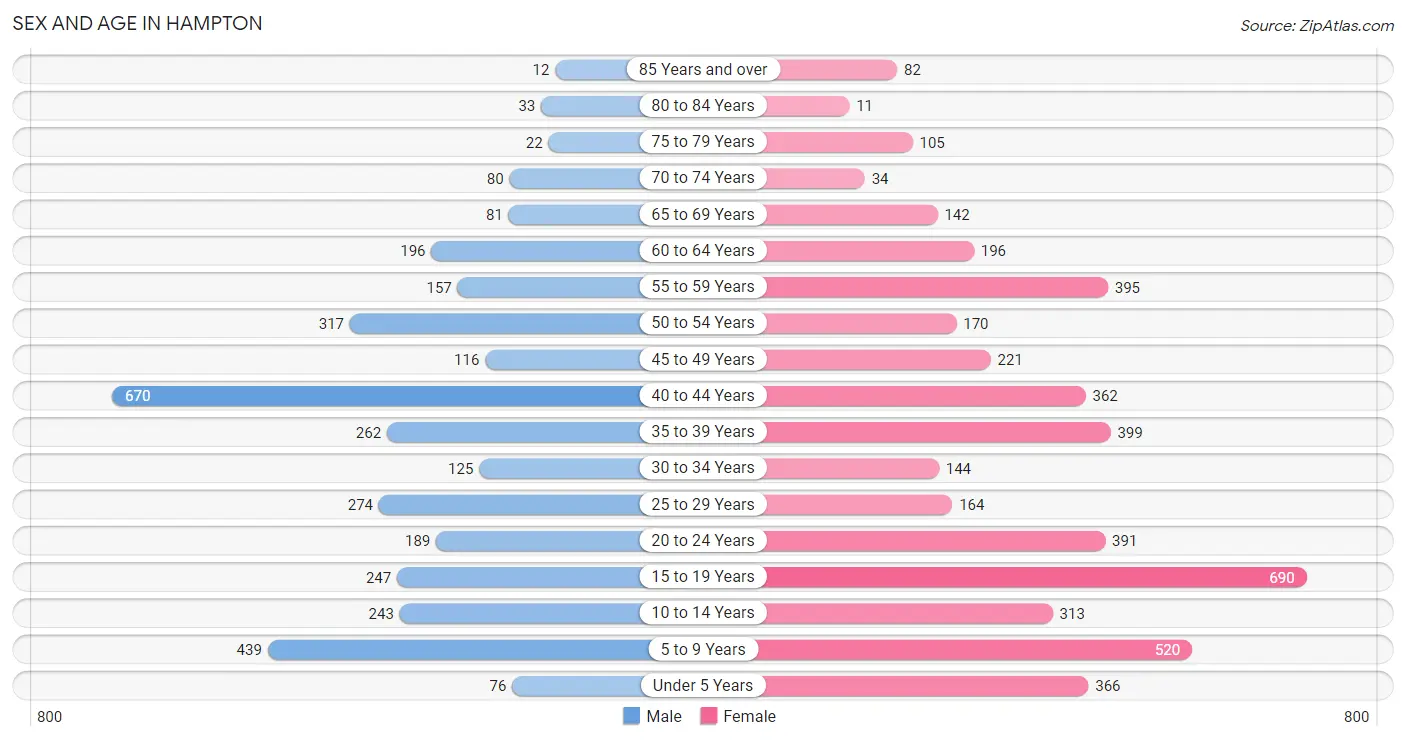
| Age Bracket | Male | Female |
| Under 5 Years | 76 (2.1%) | 366 (7.8%) |
| 5 to 9 Years | 439 (12.4%) | 520 (11.1%) |
| 10 to 14 Years | 243 (6.9%) | 313 (6.7%) |
| 15 to 19 Years | 247 (7.0%) | 690 (14.7%) |
| 20 to 24 Years | 189 (5.3%) | 391 (8.3%) |
| 25 to 29 Years | 274 (7.7%) | 164 (3.5%) |
| 30 to 34 Years | 125 (3.5%) | 144 (3.1%) |
| 35 to 39 Years | 262 (7.4%) | 399 (8.5%) |
| 40 to 44 Years | 670 (18.9%) | 362 (7.7%) |
| 45 to 49 Years | 116 (3.3%) | 221 (4.7%) |
| 50 to 54 Years | 317 (9.0%) | 170 (3.6%) |
| 55 to 59 Years | 157 (4.4%) | 395 (8.4%) |
| 60 to 64 Years | 196 (5.5%) | 196 (4.2%) |
| 65 to 69 Years | 81 (2.3%) | 142 (3.0%) |
| 70 to 74 Years | 80 (2.3%) | 34 (0.7%) |
| 75 to 79 Years | 22 (0.6%) | 105 (2.2%) |
| 80 to 84 Years | 33 (0.9%) | 11 (0.2%) |
| 85 Years and over | 12 (0.3%) | 82 (1.7%) |
| Total | 3,539 (100.0%) | 4,705 (100.0%) |
Families and Households in Hampton
Median Family Size in Hampton
The median family size in Hampton is 4.51 persons per family, with married-couple families (1,127 | 69.9%) accounting for the largest median family size of 4.71 persons per family. On the other hand, single male/father families (110 | 6.8%) represent the smallest median family size with 2.92 persons per family.
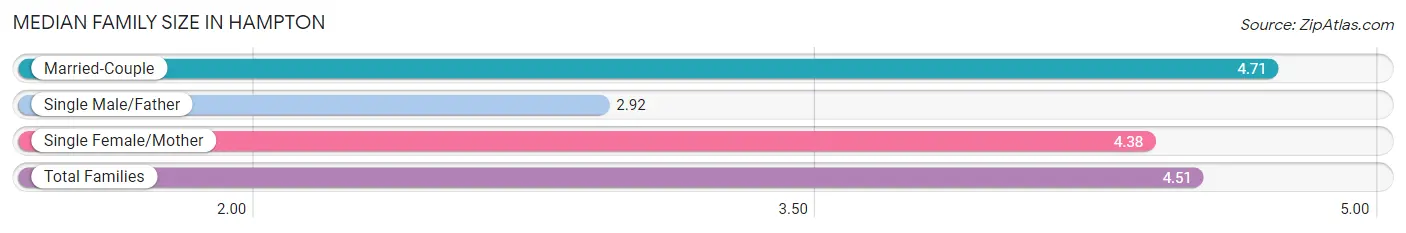
| Family Type | # Families | Family Size |
| Married-Couple | 1,127 (69.9%) | 4.71 |
| Single Male/Father | 110 (6.8%) | 2.92 |
| Single Female/Mother | 375 (23.3%) | 4.38 |
| Total Families | 1,612 (100.0%) | 4.51 |
Median Household Size in Hampton
The median household size in Hampton is 3.41 persons per household, with married-couple households (1,127 | 46.8%) accounting for the largest median household size of 4.71 persons per household. non-family households (798 | 33.1%) represent the smallest median household size with 1.10 persons per household.
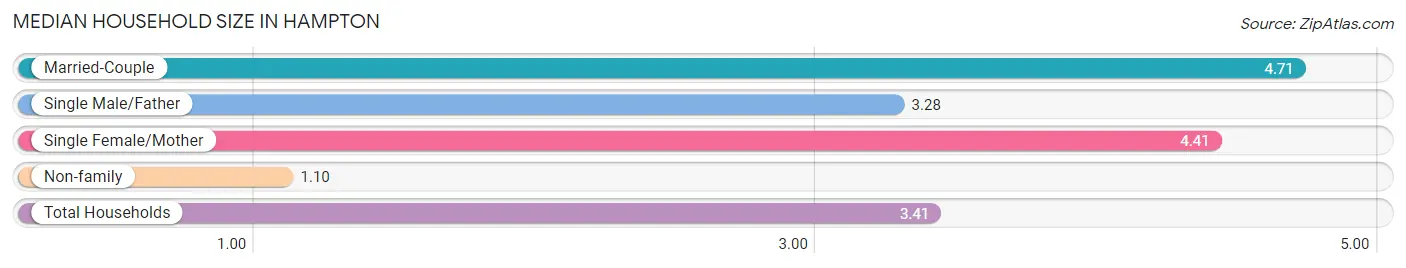
| Household Type | # Households | Household Size |
| Married-Couple | 1,127 (46.8%) | 4.71 |
| Single Male/Father | 110 (4.6%) | 3.28 |
| Single Female/Mother | 375 (15.6%) | 4.41 |
| Non-family | 798 (33.1%) | 1.10 |
| Total Households | 2,410 (100.0%) | 3.41 |
Household Size by Marriage Status in Hampton
Out of a total of 2,410 households in Hampton, 1,612 (66.9%) are family households, while 798 (33.1%) are nonfamily households. The most numerous type of family households are 2-person households, comprising 430, and the most common type of nonfamily households are 1-person households, comprising 714.
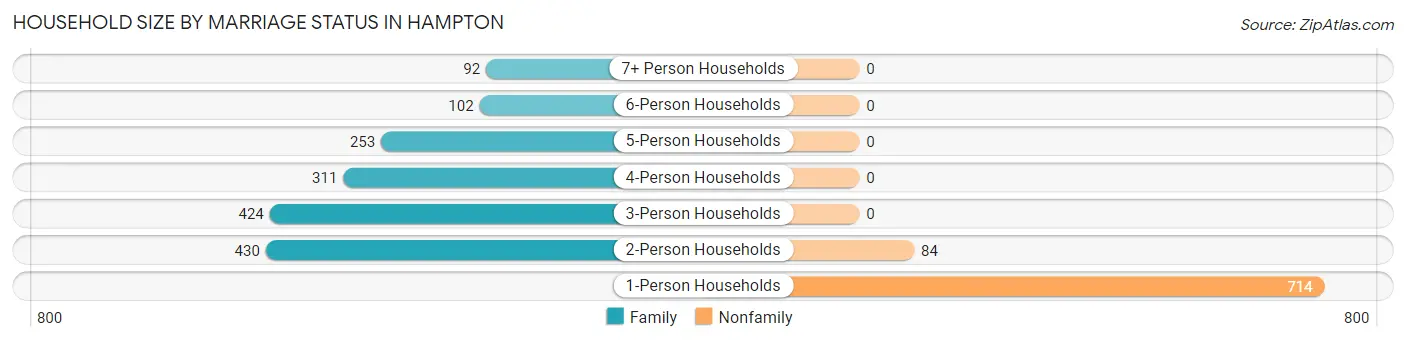
| Household Size | Family Households | Nonfamily Households |
| 1-Person Households | - | 714 (29.6%) |
| 2-Person Households | 430 (17.8%) | 84 (3.5%) |
| 3-Person Households | 424 (17.6%) | 0 (0.0%) |
| 4-Person Households | 311 (12.9%) | 0 (0.0%) |
| 5-Person Households | 253 (10.5%) | 0 (0.0%) |
| 6-Person Households | 102 (4.2%) | 0 (0.0%) |
| 7+ Person Households | 92 (3.8%) | 0 (0.0%) |
| Total | 1,612 (66.9%) | 798 (33.1%) |
Female Fertility in Hampton
Fertility by Age in Hampton
Average fertility rate in Hampton is 5.0 births per 1,000 women. Women in the age bracket of 35 to 50 years have the highest fertility rate with 12.0 births per 1,000 women. Women in the age bracket of 35 to 50 years acount for 100.0% of all women with births.
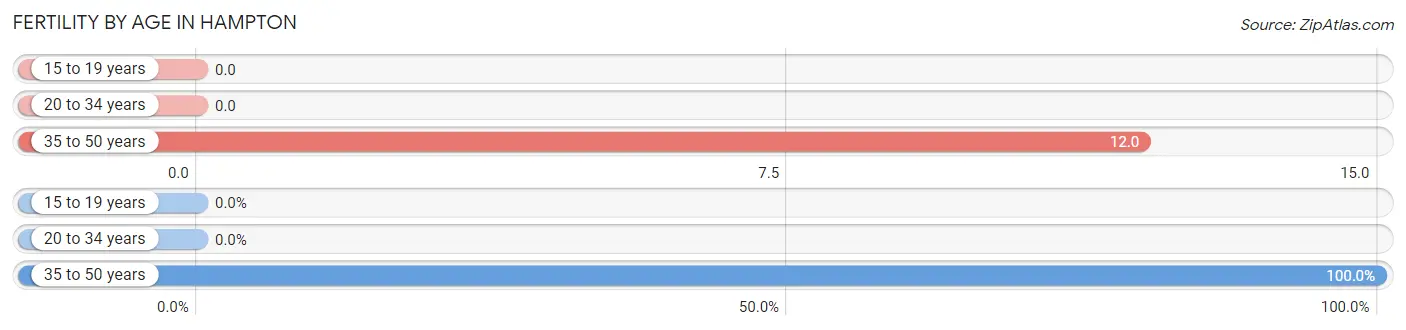
| Age Bracket | Women with Births | Births / 1,000 Women |
| 15 to 19 years | 0 (0.0%) | 0.0 |
| 20 to 34 years | 0 (0.0%) | 0.0 |
| 35 to 50 years | 12 (100.0%) | 12.0 |
| Total | 12 (100.0%) | 5.0 |
Fertility by Age by Marriage Status in Hampton
33.3% of women with births (12) in Hampton are married. The highest percentage of unmarried women with births falls into 35 to 50 years age bracket with 66.7% of them unmarried at the time of birth, while the lowest percentage of unmarried women with births belong to 35 to 50 years age bracket with 66.7% of them unmarried.
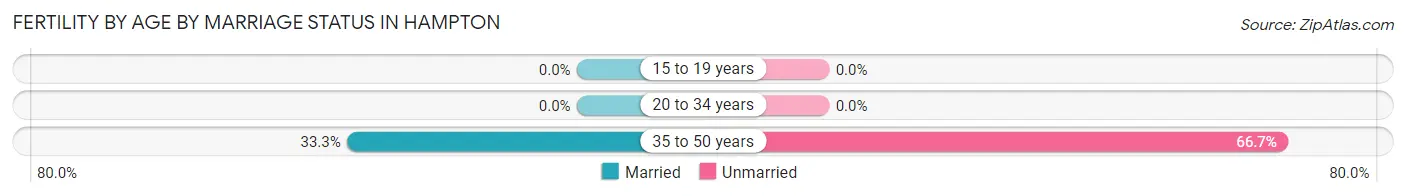
| Age Bracket | Married | Unmarried |
| 15 to 19 years | 0 (0.0%) | 0 (0.0%) |
| 20 to 34 years | 0 (0.0%) | 0 (0.0%) |
| 35 to 50 years | 4 (33.3%) | 8 (66.7%) |
| Total | 4 (33.3%) | 8 (66.7%) |
Fertility by Education in Hampton
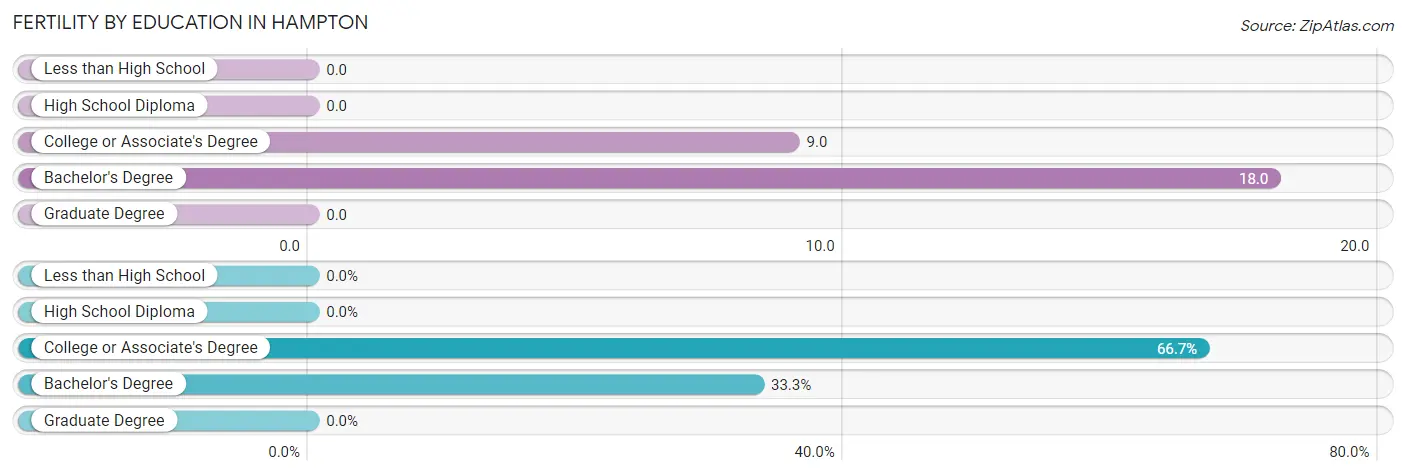
| Educational Attainment | Women with Births | Births / 1,000 Women |
| Less than High School | 0 (0.0%) | 0.0 |
| High School Diploma | 0 (0.0%) | 0.0 |
| College or Associate's Degree | 8 (66.7%) | 9.0 |
| Bachelor's Degree | 4 (33.3%) | 18.0 |
| Graduate Degree | 0 (0.0%) | 0.0 |
| Total | 12 (100.0%) | 5.0 |
Fertility by Education by Marriage Status in Hampton
66.7% of women with births in Hampton are unmarried. Women with the educational attainment of bachelor's degree are most likely to be married with 100.0% of them married at childbirth, while women with the educational attainment of college or associate's degree are least likely to be married with 100.0% of them unmarried at childbirth.
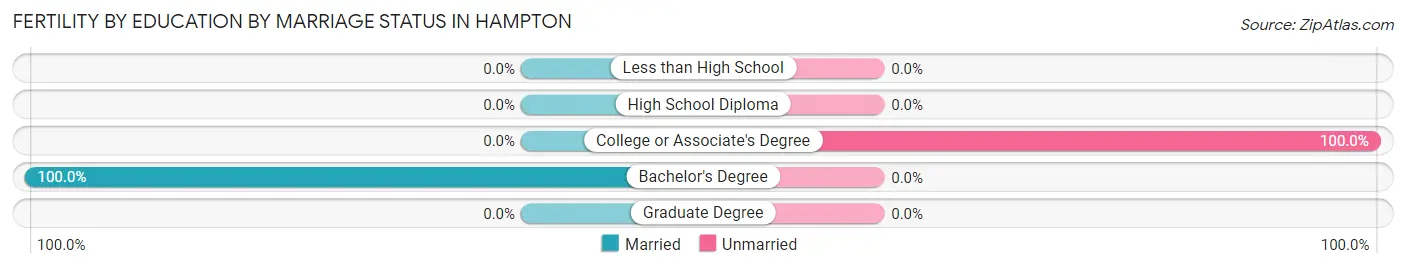
| Educational Attainment | Married | Unmarried |
| Less than High School | 0 (0.0%) | 0 (0.0%) |
| High School Diploma | 0 (0.0%) | 0 (0.0%) |
| College or Associate's Degree | 0 (0.0%) | 8 (100.0%) |
| Bachelor's Degree | 4 (100.0%) | 0 (0.0%) |
| Graduate Degree | 0 (0.0%) | 0 (0.0%) |
| Total | 4 (33.3%) | 8 (66.7%) |
Employment Characteristics in Hampton
Employment by Class of Employer in Hampton
Among the 3,521 employed individuals in Hampton, private company employees (2,219 | 63.0%), local government employees (434 | 12.3%), and self-employed (not incorporated) (363 | 10.3%) make up the most common classes of employment.
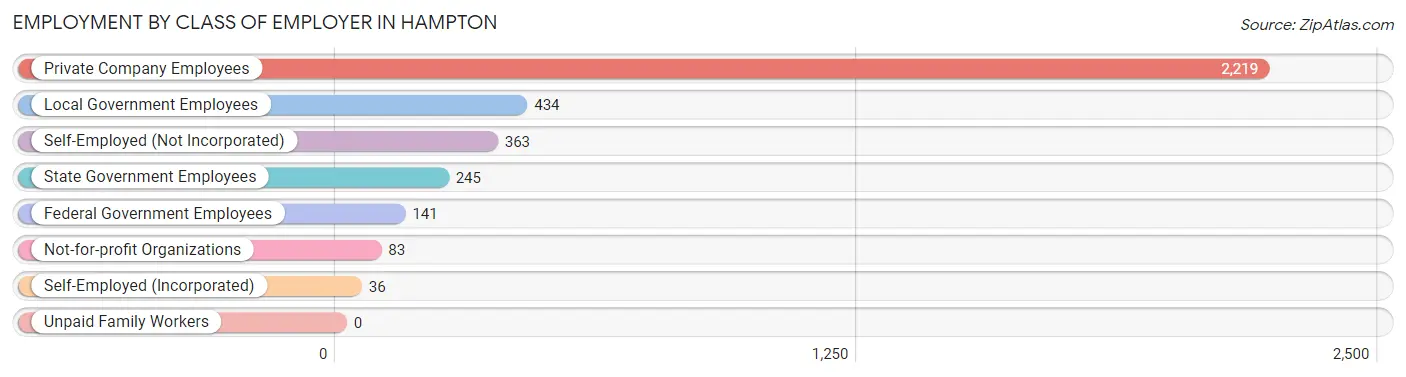
| Employer Class | # Employees | % Employees |
| Private Company Employees | 2,219 | 63.0% |
| Self-Employed (Incorporated) | 36 | 1.0% |
| Self-Employed (Not Incorporated) | 363 | 10.3% |
| Not-for-profit Organizations | 83 | 2.4% |
| Local Government Employees | 434 | 12.3% |
| State Government Employees | 245 | 7.0% |
| Federal Government Employees | 141 | 4.0% |
| Unpaid Family Workers | 0 | 0.0% |
| Total | 3,521 | 100.0% |
Employment Status by Age in Hampton
According to the labor force statistics for Hampton, out of the total population over 16 years of age (6,234), 59.1% or 3,684 individuals are in the labor force, with 3.6% or 133 of them unemployed. The age group with the highest labor force participation rate is 25 to 29 years, with 98.2% or 430 individuals in the labor force. Within the labor force, the 16 to 19 years age range has the highest percentage of unemployed individuals, with 55.9% or 19 of them being unemployed.
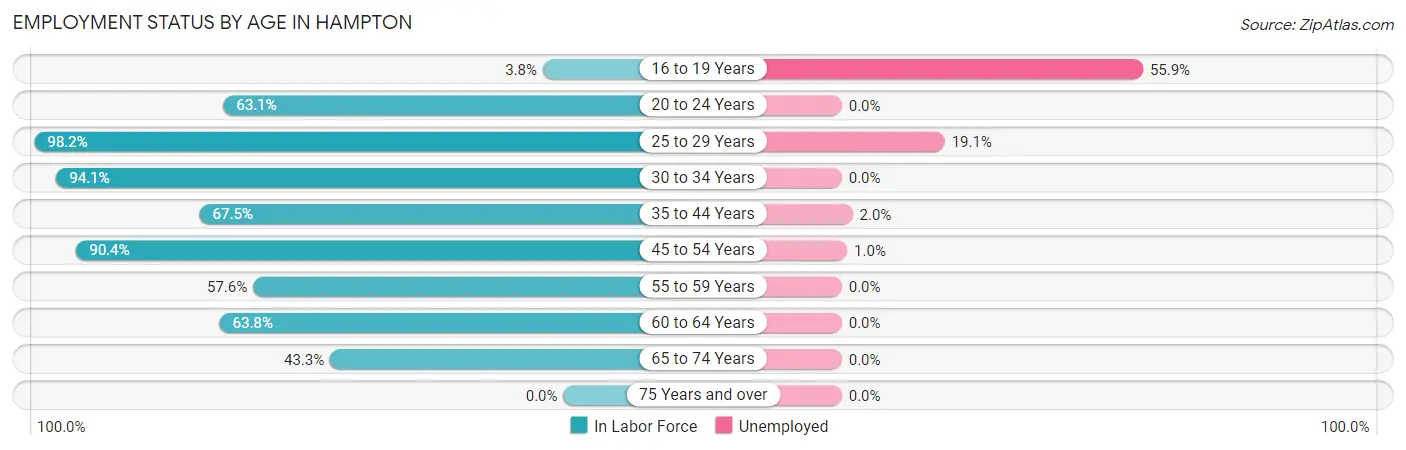
| Age Bracket | In Labor Force | Unemployed |
| 16 to 19 Years | 34 (3.8%) | 19 (55.9%) |
| 20 to 24 Years | 366 (63.1%) | 0 (0.0%) |
| 25 to 29 Years | 430 (98.2%) | 82 (19.1%) |
| 30 to 34 Years | 253 (94.1%) | 0 (0.0%) |
| 35 to 44 Years | 1,143 (67.5%) | 23 (2.0%) |
| 45 to 54 Years | 745 (90.4%) | 7 (1.0%) |
| 55 to 59 Years | 318 (57.6%) | 0 (0.0%) |
| 60 to 64 Years | 250 (63.8%) | 0 (0.0%) |
| 65 to 74 Years | 146 (43.3%) | 0 (0.0%) |
| 75 Years and over | 0 (0.0%) | 0 (0.0%) |
| Total | 3,684 (59.1%) | 133 (3.6%) |
Employment Status by Educational Attainment in Hampton
According to labor force statistics for Hampton, 75.3% of individuals (3,139) out of the total population between 25 and 64 years of age (4,168) are in the labor force, with 3.6% or 113 of them being unemployed. The group with the highest labor force participation rate are those with the educational attainment of bachelor's degree or higher, with 92.9% or 1,008 individuals in the labor force. Within the labor force, individuals with less than high school education have the highest percentage of unemployment, with 9.2% or 7 of them being unemployed.
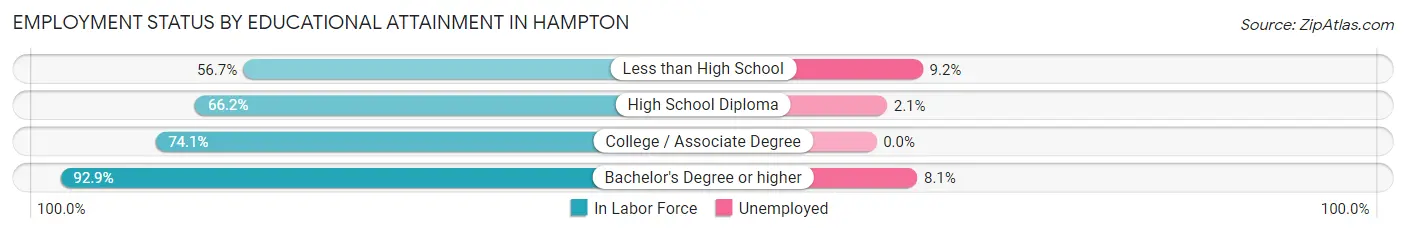
| Educational Attainment | In Labor Force | Unemployed |
| Less than High School | 76 (56.7%) | 12 (9.2%) |
| High School Diploma | 1,102 (66.2%) | 35 (2.1%) |
| College / Associate Degree | 951 (74.1%) | 0 (0.0%) |
| Bachelor's Degree or higher | 1,008 (92.9%) | 88 (8.1%) |
| Total | 3,139 (75.3%) | 150 (3.6%) |
Employment Occupations by Sex in Hampton
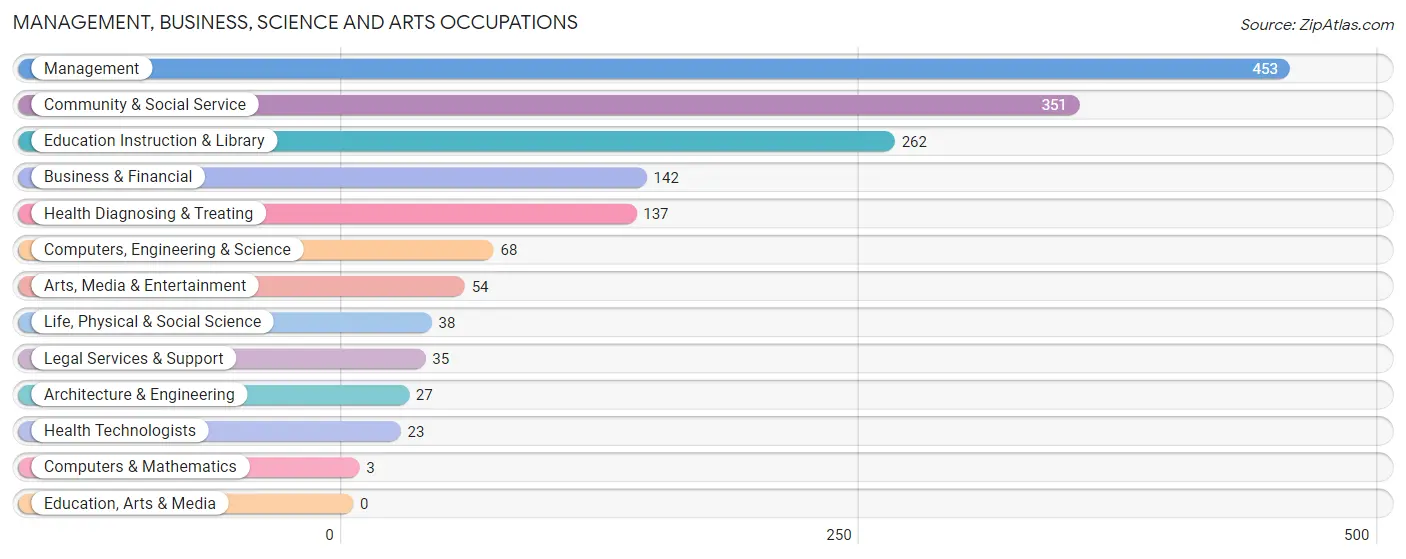
Management, Business, Science and Arts Occupations
The most common Management, Business, Science and Arts occupations in Hampton are Management (453 | 12.9%), Community & Social Service (351 | 10.0%), Education Instruction & Library (262 | 7.4%), Business & Financial (142 | 4.0%), and Health Diagnosing & Treating (137 | 3.9%).
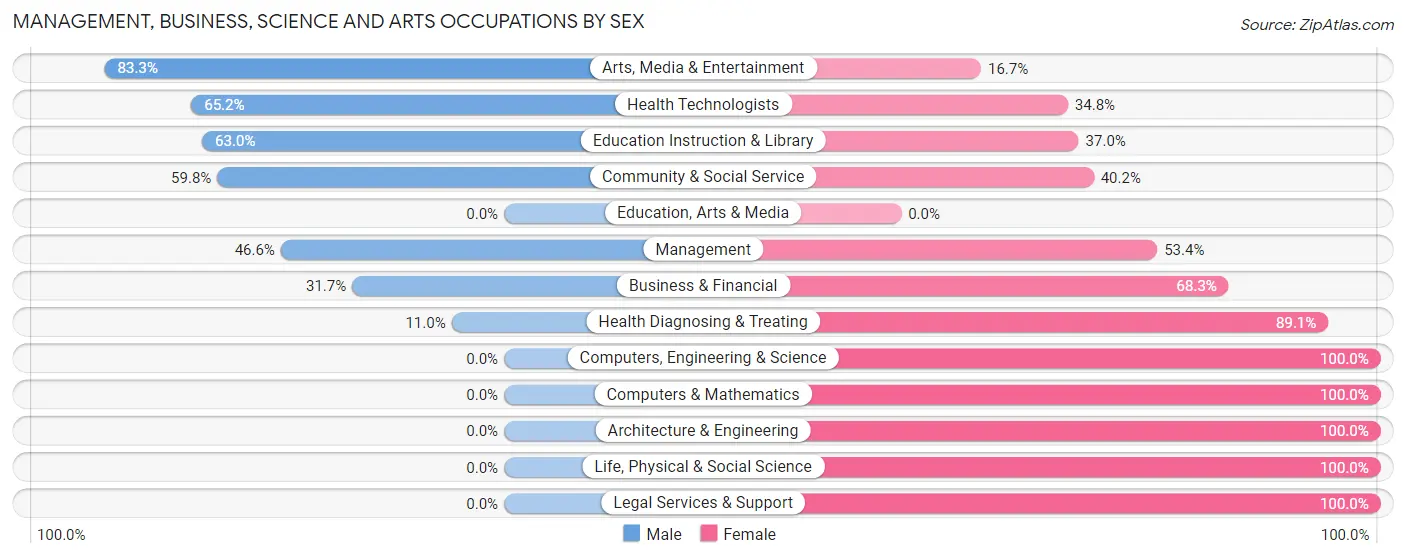
Management, Business, Science and Arts Occupations by Sex
Within the Management, Business, Science and Arts occupations in Hampton, the most male-oriented occupations are Arts, Media & Entertainment (83.3%), Health Technologists (65.2%), and Education Instruction & Library (63.0%), while the most female-oriented occupations are Computers, Engineering & Science (100.0%), Computers & Mathematics (100.0%), and Architecture & Engineering (100.0%).
| Occupation | Male | Female |
| Management | 211 (46.6%) | 242 (53.4%) |
| Business & Financial | 45 (31.7%) | 97 (68.3%) |
| Computers, Engineering & Science | 0 (0.0%) | 68 (100.0%) |
| Computers & Mathematics | 0 (0.0%) | 3 (100.0%) |
| Architecture & Engineering | 0 (0.0%) | 27 (100.0%) |
| Life, Physical & Social Science | 0 (0.0%) | 38 (100.0%) |
| Community & Social Service | 210 (59.8%) | 141 (40.2%) |
| Education, Arts & Media | 0 (0.0%) | 0 (0.0%) |
| Legal Services & Support | 0 (0.0%) | 35 (100.0%) |
| Education Instruction & Library | 165 (63.0%) | 97 (37.0%) |
| Arts, Media & Entertainment | 45 (83.3%) | 9 (16.7%) |
| Health Diagnosing & Treating | 15 (11.0%) | 122 (89.0%) |
| Health Technologists | 15 (65.2%) | 8 (34.8%) |
| Total (Category) | 481 (41.8%) | 670 (58.2%) |
| Total (Overall) | 1,790 (50.8%) | 1,733 (49.2%) |
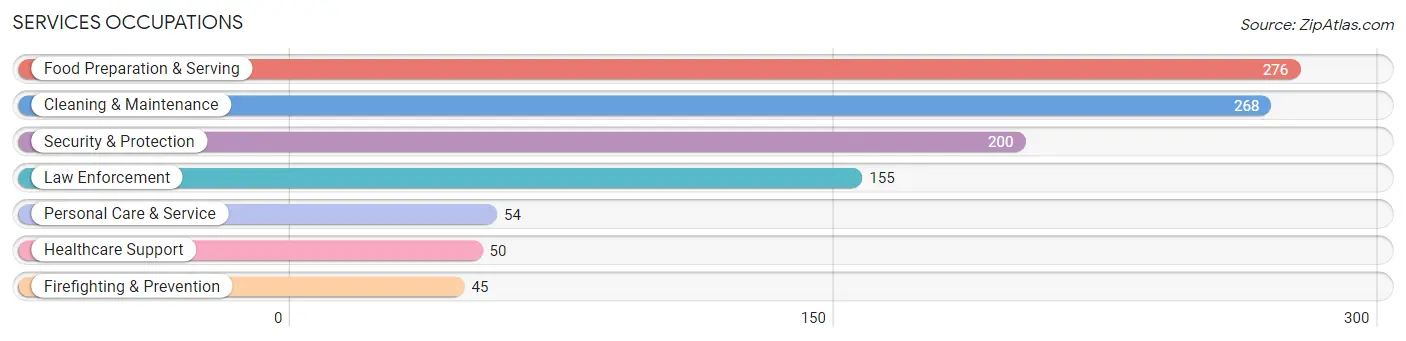
Services Occupations
The most common Services occupations in Hampton are Food Preparation & Serving (276 | 7.8%), Cleaning & Maintenance (268 | 7.6%), Security & Protection (200 | 5.7%), Law Enforcement (155 | 4.4%), and Personal Care & Service (54 | 1.5%).
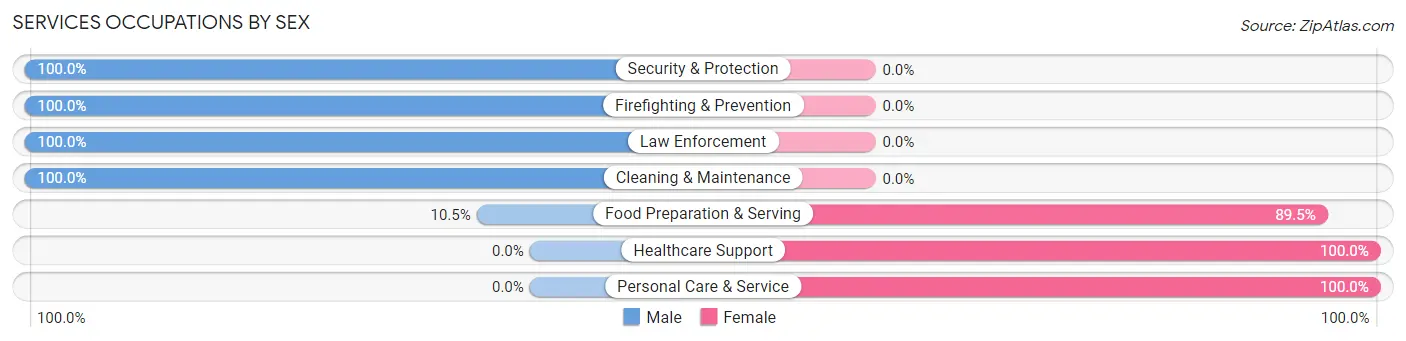
Services Occupations by Sex
Within the Services occupations in Hampton, the most male-oriented occupations are Security & Protection (100.0%), Firefighting & Prevention (100.0%), and Law Enforcement (100.0%), while the most female-oriented occupations are Healthcare Support (100.0%), Personal Care & Service (100.0%), and Food Preparation & Serving (89.5%).
| Occupation | Male | Female |
| Healthcare Support | 0 (0.0%) | 50 (100.0%) |
| Security & Protection | 200 (100.0%) | 0 (0.0%) |
| Firefighting & Prevention | 45 (100.0%) | 0 (0.0%) |
| Law Enforcement | 155 (100.0%) | 0 (0.0%) |
| Food Preparation & Serving | 29 (10.5%) | 247 (89.5%) |
| Cleaning & Maintenance | 268 (100.0%) | 0 (0.0%) |
| Personal Care & Service | 0 (0.0%) | 54 (100.0%) |
| Total (Category) | 497 (58.6%) | 351 (41.4%) |
| Total (Overall) | 1,790 (50.8%) | 1,733 (49.2%) |
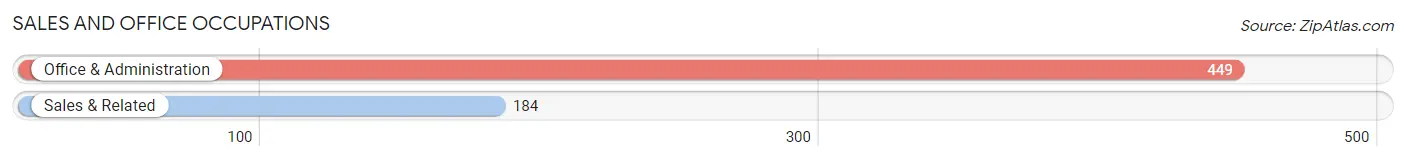
Sales and Office Occupations
The most common Sales and Office occupations in Hampton are Office & Administration (449 | 12.7%), and Sales & Related (184 | 5.2%).
Sales and Office Occupations by Sex
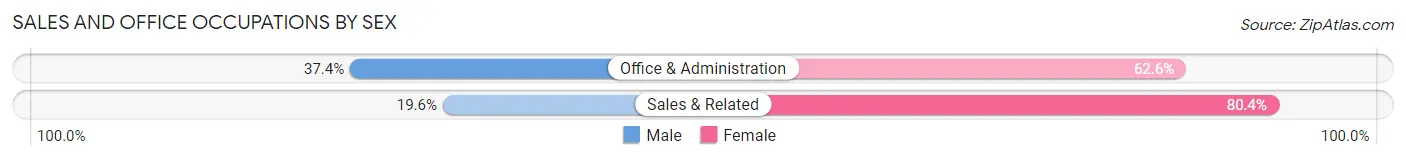
| Occupation | Male | Female |
| Sales & Related | 36 (19.6%) | 148 (80.4%) |
| Office & Administration | 168 (37.4%) | 281 (62.6%) |
| Total (Category) | 204 (32.2%) | 429 (67.8%) |
| Total (Overall) | 1,790 (50.8%) | 1,733 (49.2%) |
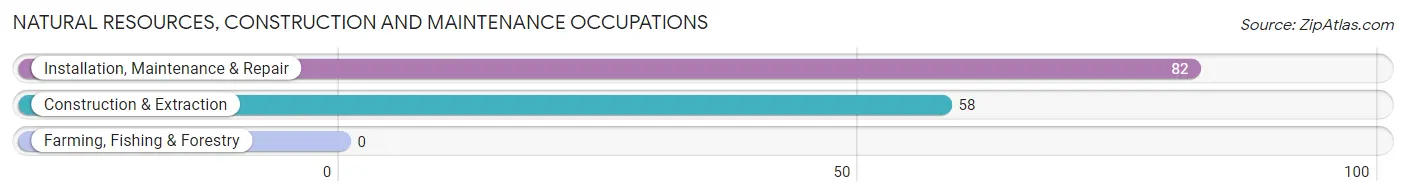
Natural Resources, Construction and Maintenance Occupations
The most common Natural Resources, Construction and Maintenance occupations in Hampton are Installation, Maintenance & Repair (82 | 2.3%), and Construction & Extraction (58 | 1.7%).
Natural Resources, Construction and Maintenance Occupations by Sex
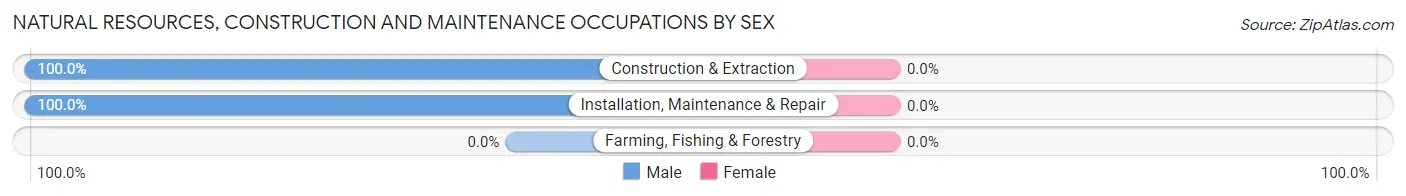
| Occupation | Male | Female |
| Farming, Fishing & Forestry | 0 (0.0%) | 0 (0.0%) |
| Construction & Extraction | 58 (100.0%) | 0 (0.0%) |
| Installation, Maintenance & Repair | 82 (100.0%) | 0 (0.0%) |
| Total (Category) | 140 (100.0%) | 0 (0.0%) |
| Total (Overall) | 1,790 (50.8%) | 1,733 (49.2%) |
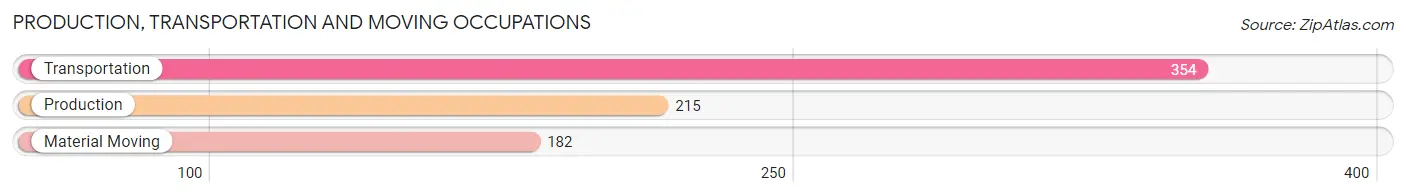
Production, Transportation and Moving Occupations
The most common Production, Transportation and Moving occupations in Hampton are Transportation (354 | 10.1%), Production (215 | 6.1%), and Material Moving (182 | 5.2%).
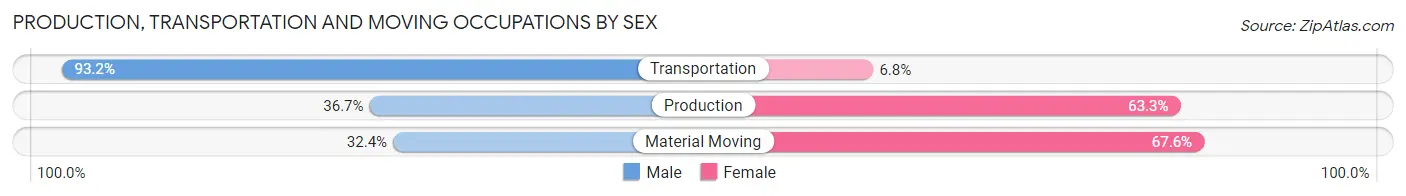
Production, Transportation and Moving Occupations by Sex
| Occupation | Male | Female |
| Production | 79 (36.7%) | 136 (63.3%) |
| Transportation | 330 (93.2%) | 24 (6.8%) |
| Material Moving | 59 (32.4%) | 123 (67.6%) |
| Total (Category) | 468 (62.3%) | 283 (37.7%) |
| Total (Overall) | 1,790 (50.8%) | 1,733 (49.2%) |
Employment Industries by Sex in Hampton
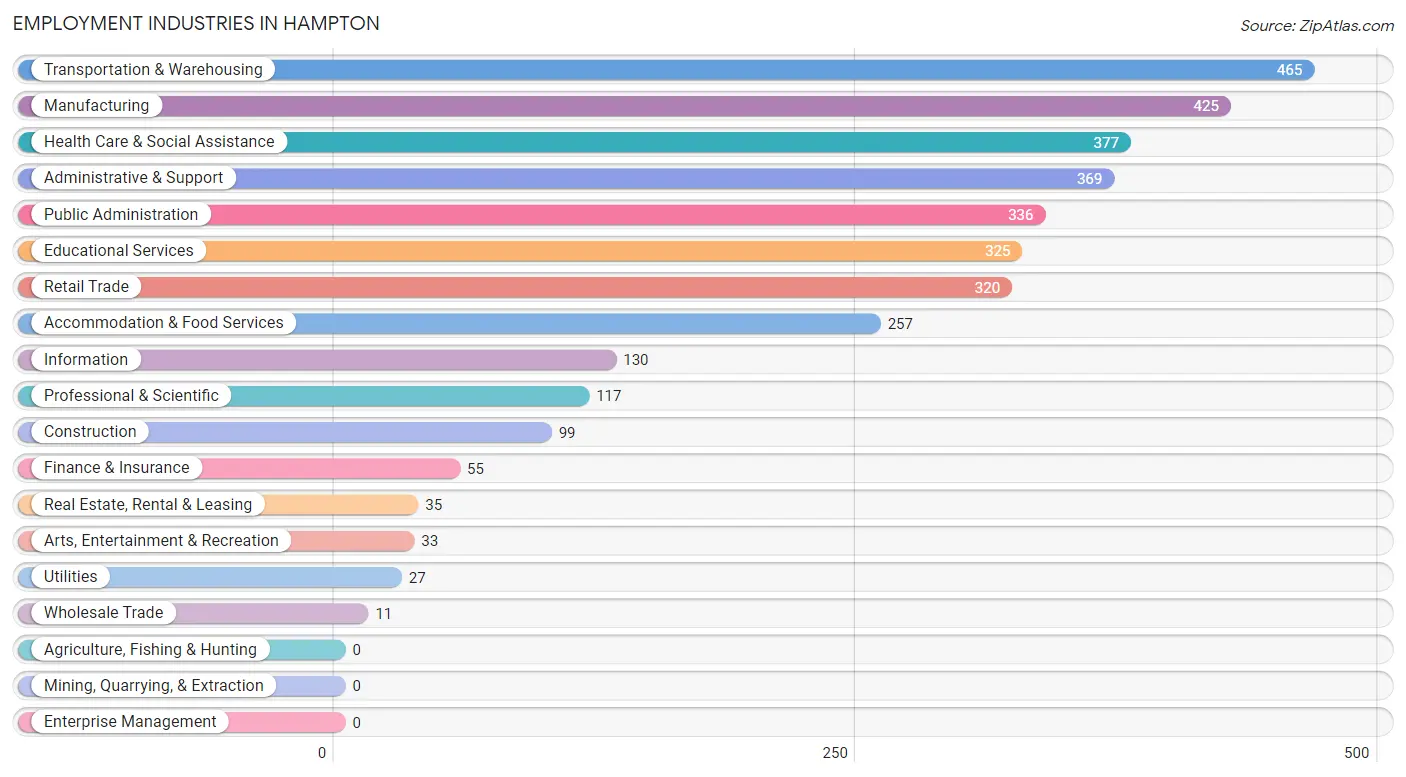
Employment Industries in Hampton
The major employment industries in Hampton include Transportation & Warehousing (465 | 13.2%), Manufacturing (425 | 12.1%), Health Care & Social Assistance (377 | 10.7%), Administrative & Support (369 | 10.5%), and Public Administration (336 | 9.5%).
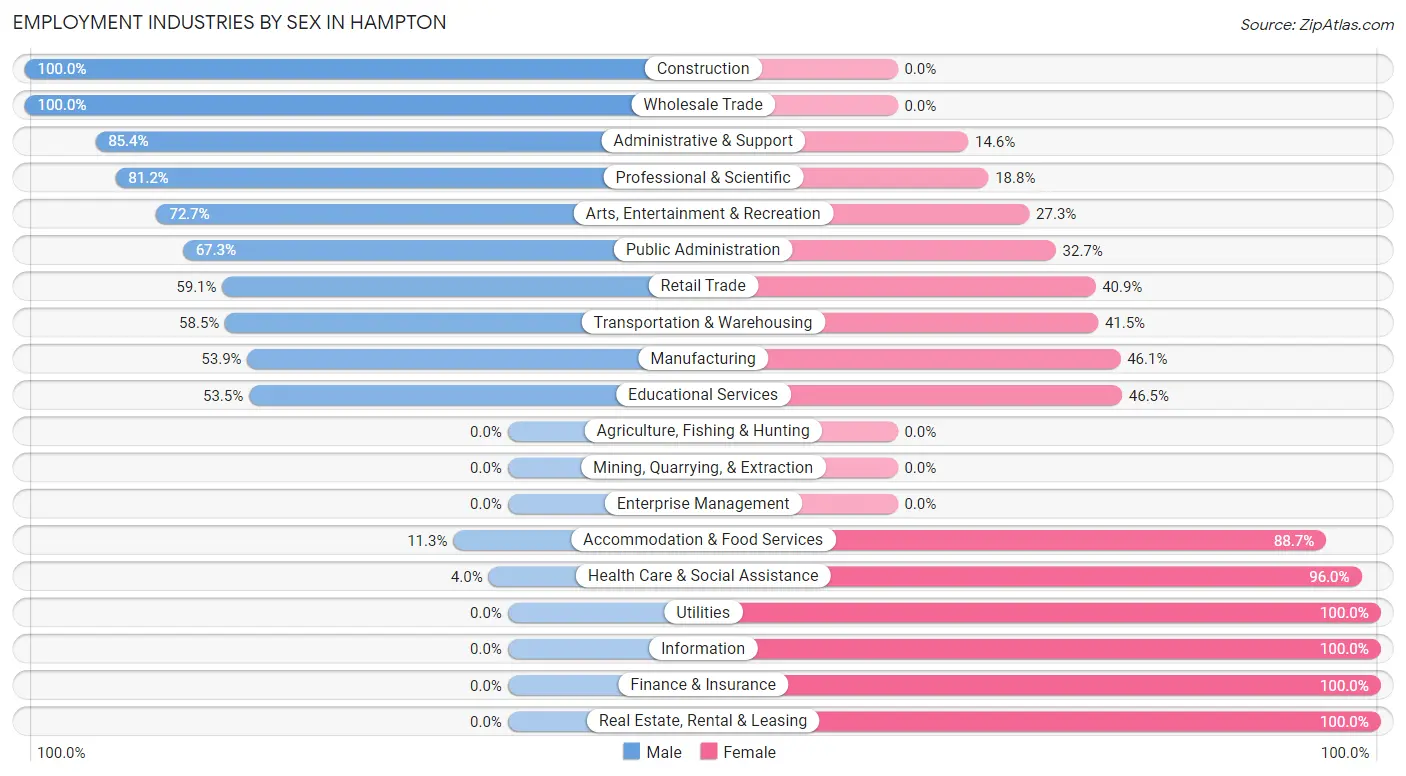
Employment Industries by Sex in Hampton
The Hampton industries that see more men than women are Construction (100.0%), Wholesale Trade (100.0%), and Administrative & Support (85.4%), whereas the industries that tend to have a higher number of women are Utilities (100.0%), Information (100.0%), and Finance & Insurance (100.0%).
| Industry | Male | Female |
| Agriculture, Fishing & Hunting | 0 (0.0%) | 0 (0.0%) |
| Mining, Quarrying, & Extraction | 0 (0.0%) | 0 (0.0%) |
| Construction | 99 (100.0%) | 0 (0.0%) |
| Manufacturing | 229 (53.9%) | 196 (46.1%) |
| Wholesale Trade | 11 (100.0%) | 0 (0.0%) |
| Retail Trade | 189 (59.1%) | 131 (40.9%) |
| Transportation & Warehousing | 272 (58.5%) | 193 (41.5%) |
| Utilities | 0 (0.0%) | 27 (100.0%) |
| Information | 0 (0.0%) | 130 (100.0%) |
| Finance & Insurance | 0 (0.0%) | 55 (100.0%) |
| Real Estate, Rental & Leasing | 0 (0.0%) | 35 (100.0%) |
| Professional & Scientific | 95 (81.2%) | 22 (18.8%) |
| Enterprise Management | 0 (0.0%) | 0 (0.0%) |
| Administrative & Support | 315 (85.4%) | 54 (14.6%) |
| Educational Services | 174 (53.5%) | 151 (46.5%) |
| Health Care & Social Assistance | 15 (4.0%) | 362 (96.0%) |
| Arts, Entertainment & Recreation | 24 (72.7%) | 9 (27.3%) |
| Accommodation & Food Services | 29 (11.3%) | 228 (88.7%) |
| Public Administration | 226 (67.3%) | 110 (32.7%) |
| Total | 1,790 (50.8%) | 1,733 (49.2%) |
Education in Hampton
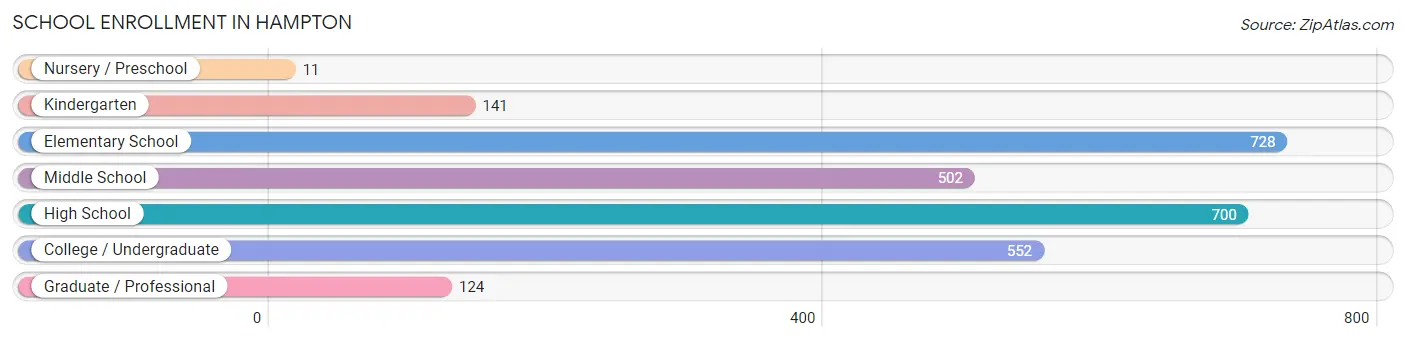
School Enrollment in Hampton
The most common levels of schooling among the 2,758 students in Hampton are elementary school (728 | 26.4%), high school (700 | 25.4%), and college / undergraduate (552 | 20.0%).
| School Level | # Students | % Students |
| Nursery / Preschool | 11 | 0.4% |
| Kindergarten | 141 | 5.1% |
| Elementary School | 728 | 26.4% |
| Middle School | 502 | 18.2% |
| High School | 700 | 25.4% |
| College / Undergraduate | 552 | 20.0% |
| Graduate / Professional | 124 | 4.5% |
| Total | 2,758 | 100.0% |
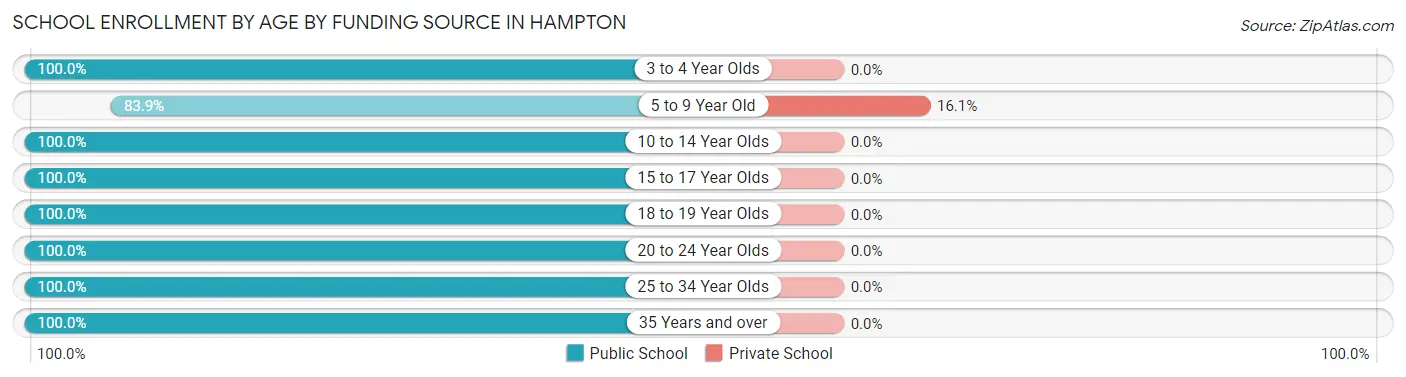
School Enrollment by Age by Funding Source in Hampton
Out of a total of 2,758 students who are enrolled in schools in Hampton, 135 (4.9%) attend a private institution, while the remaining 2,623 (95.1%) are enrolled in public schools. The age group of 5 to 9 year old has the highest likelihood of being enrolled in private schools, with 136 (16.1% in the age bracket) enrolled. Conversely, the age group of 3 to 4 year olds has the lowest likelihood of being enrolled in a private school, with 4 (100.0% in the age bracket) attending a public institution.
| Age Bracket | Public School | Private School |
| 3 to 4 Year Olds | 4 (100.0%) | 0 (0.0%) |
| 5 to 9 Year Old | 709 (83.9%) | 136 (16.1%) |
| 10 to 14 Year Olds | 556 (100.0%) | 0 (0.0%) |
| 15 to 17 Year Olds | 415 (100.0%) | 0 (0.0%) |
| 18 to 19 Year Olds | 512 (100.0%) | 0 (0.0%) |
| 20 to 24 Year Olds | 237 (100.0%) | 0 (0.0%) |
| 25 to 34 Year Olds | 35 (100.0%) | 0 (0.0%) |
| 35 Years and over | 154 (100.0%) | 0 (0.0%) |
| Total | 2,623 (95.1%) | 135 (4.9%) |
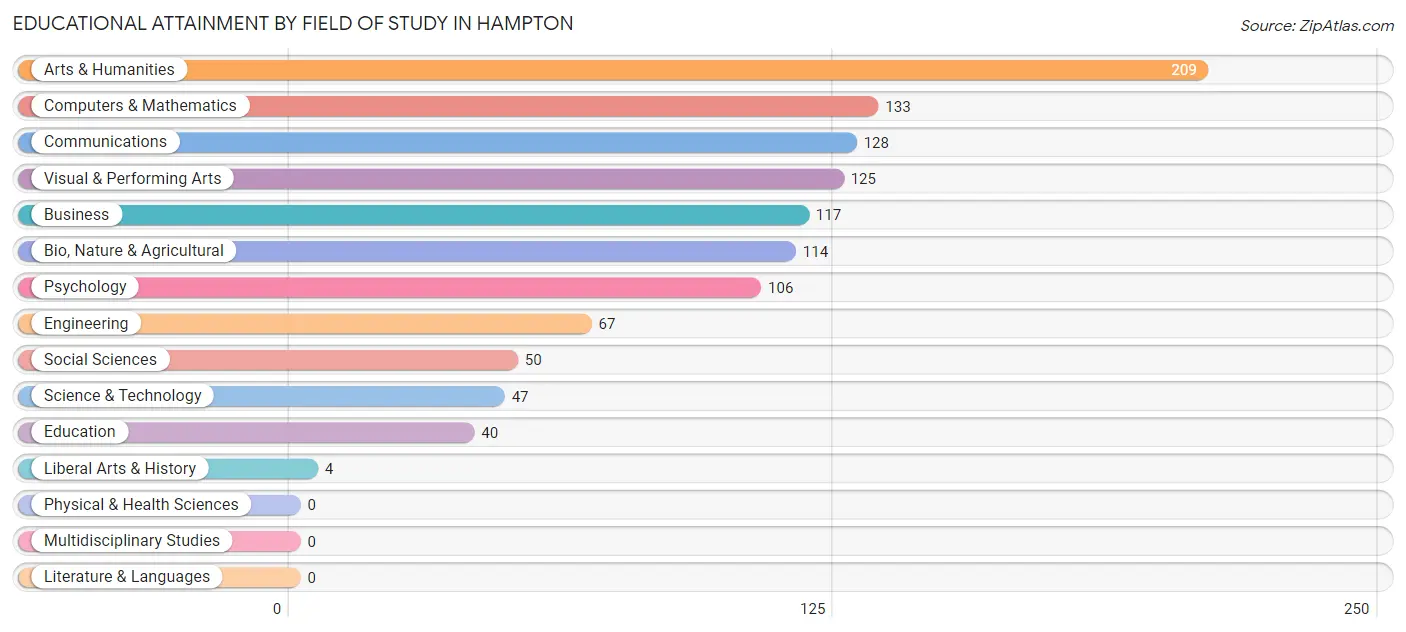
Educational Attainment by Field of Study in Hampton
Arts & humanities (209 | 18.3%), computers & mathematics (133 | 11.7%), communications (128 | 11.2%), visual & performing arts (125 | 11.0%), and business (117 | 10.3%) are the most common fields of study among 1,140 individuals in Hampton who have obtained a bachelor's degree or higher.
| Field of Study | # Graduates | % Graduates |
| Computers & Mathematics | 133 | 11.7% |
| Bio, Nature & Agricultural | 114 | 10.0% |
| Physical & Health Sciences | 0 | 0.0% |
| Psychology | 106 | 9.3% |
| Social Sciences | 50 | 4.4% |
| Engineering | 67 | 5.9% |
| Multidisciplinary Studies | 0 | 0.0% |
| Science & Technology | 47 | 4.1% |
| Business | 117 | 10.3% |
| Education | 40 | 3.5% |
| Literature & Languages | 0 | 0.0% |
| Liberal Arts & History | 4 | 0.4% |
| Visual & Performing Arts | 125 | 11.0% |
| Communications | 128 | 11.2% |
| Arts & Humanities | 209 | 18.3% |
| Total | 1,140 | 100.0% |
Transportation & Commute in Hampton
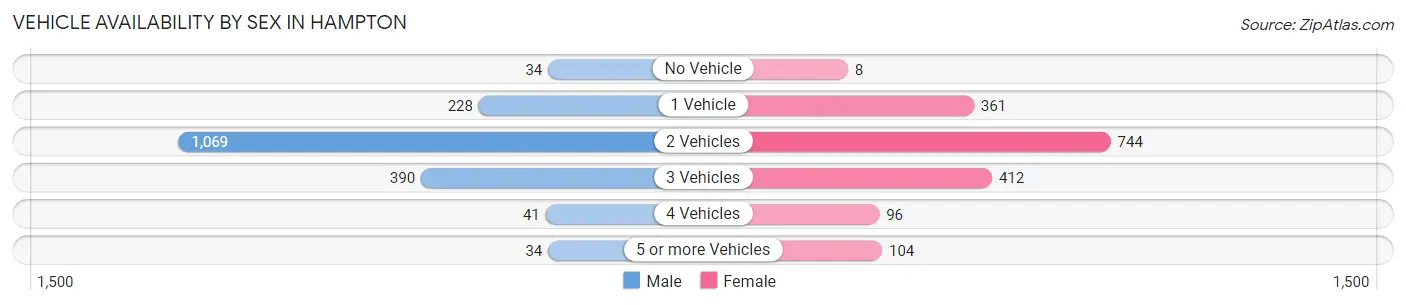
Vehicle Availability by Sex in Hampton
The most prevalent vehicle ownership categories in Hampton are males with 2 vehicles (1,069, accounting for 59.5%) and females with 2 vehicles (744, making up 62.0%).
| Vehicles Available | Male | Female |
| No Vehicle | 34 (1.9%) | 8 (0.5%) |
| 1 Vehicle | 228 (12.7%) | 361 (20.9%) |
| 2 Vehicles | 1,069 (59.5%) | 744 (43.1%) |
| 3 Vehicles | 390 (21.7%) | 412 (23.9%) |
| 4 Vehicles | 41 (2.3%) | 96 (5.6%) |
| 5 or more Vehicles | 34 (1.9%) | 104 (6.0%) |
| Total | 1,796 (100.0%) | 1,725 (100.0%) |
Commute Time in Hampton
The most frequently occuring commute durations in Hampton are 45 to 59 minutes (559 commuters, 20.4%), 60 to 89 minutes (348 commuters, 12.7%), and 20 to 24 minutes (305 commuters, 11.2%).
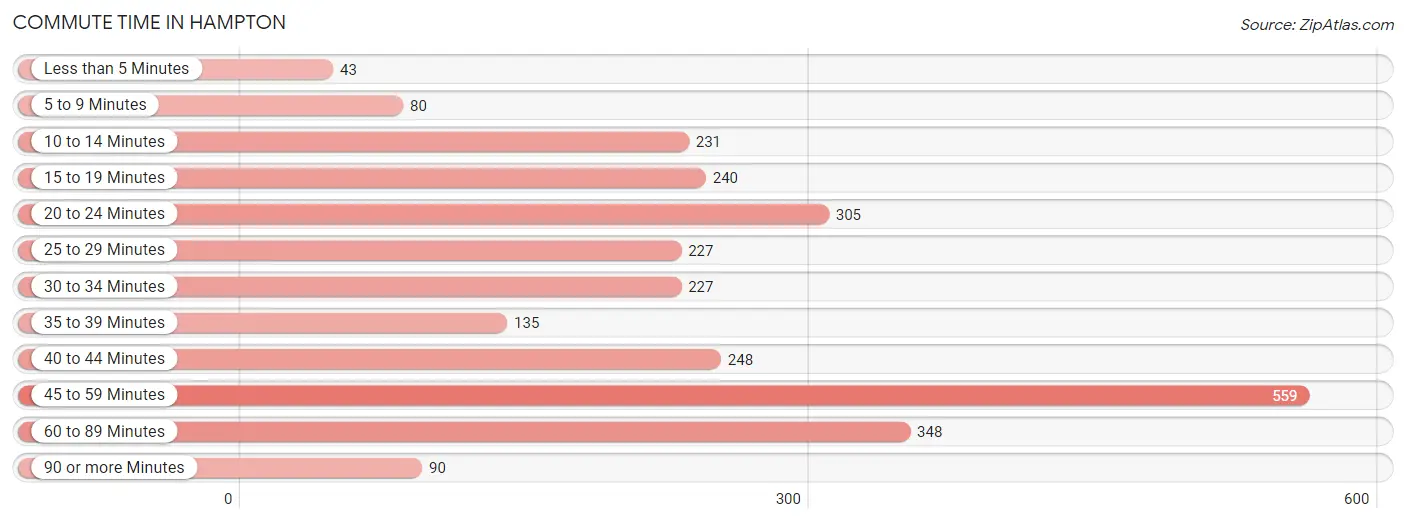
| Commute Time | # Commuters | % Commuters |
| Less than 5 Minutes | 43 | 1.6% |
| 5 to 9 Minutes | 80 | 2.9% |
| 10 to 14 Minutes | 231 | 8.5% |
| 15 to 19 Minutes | 240 | 8.8% |
| 20 to 24 Minutes | 305 | 11.2% |
| 25 to 29 Minutes | 227 | 8.3% |
| 30 to 34 Minutes | 227 | 8.3% |
| 35 to 39 Minutes | 135 | 4.9% |
| 40 to 44 Minutes | 248 | 9.1% |
| 45 to 59 Minutes | 559 | 20.4% |
| 60 to 89 Minutes | 348 | 12.7% |
| 90 or more Minutes | 90 | 3.3% |
Commute Time by Sex in Hampton
The most common commute times in Hampton are 45 to 59 minutes (296 commuters, 23.3%) for males and 20 to 24 minutes (268 commuters, 18.3%) for females.
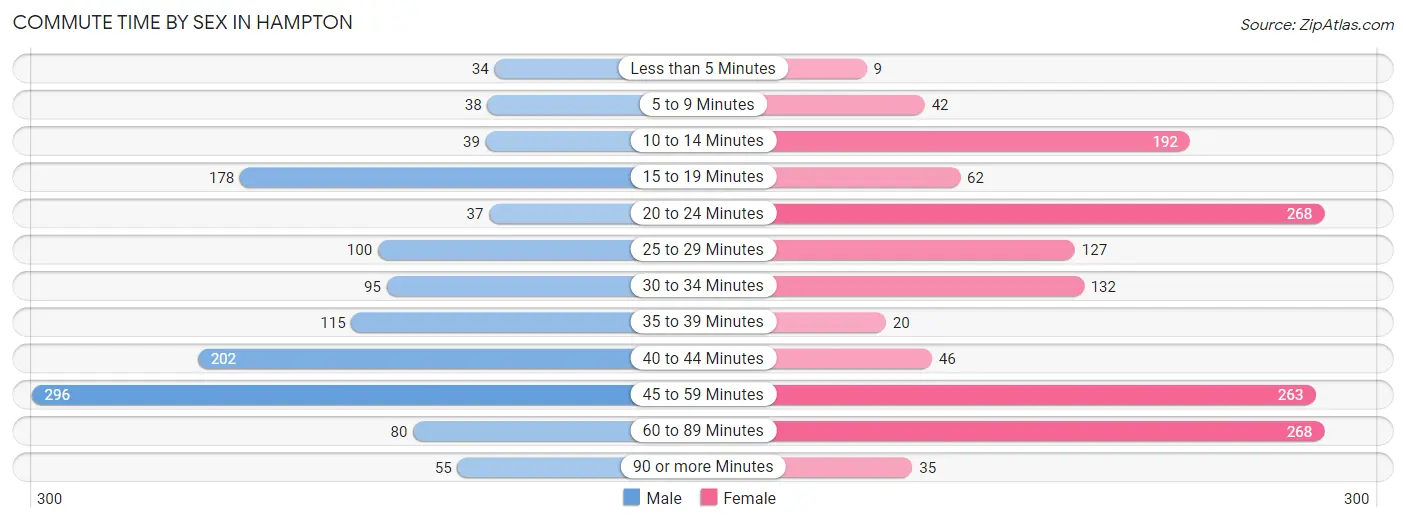
| Commute Time | Male | Female |
| Less than 5 Minutes | 34 (2.7%) | 9 (0.6%) |
| 5 to 9 Minutes | 38 (3.0%) | 42 (2.9%) |
| 10 to 14 Minutes | 39 (3.1%) | 192 (13.1%) |
| 15 to 19 Minutes | 178 (14.0%) | 62 (4.2%) |
| 20 to 24 Minutes | 37 (2.9%) | 268 (18.3%) |
| 25 to 29 Minutes | 100 (7.9%) | 127 (8.7%) |
| 30 to 34 Minutes | 95 (7.5%) | 132 (9.0%) |
| 35 to 39 Minutes | 115 (9.1%) | 20 (1.4%) |
| 40 to 44 Minutes | 202 (15.9%) | 46 (3.1%) |
| 45 to 59 Minutes | 296 (23.3%) | 263 (18.0%) |
| 60 to 89 Minutes | 80 (6.3%) | 268 (18.3%) |
| 90 or more Minutes | 55 (4.3%) | 35 (2.4%) |
Time of Departure to Work by Sex in Hampton
The most frequent times of departure to work in Hampton are 7:00 AM to 7:29 AM (249, 19.6%) for males and 12:00 PM to 3:59 PM (299, 20.4%) for females.
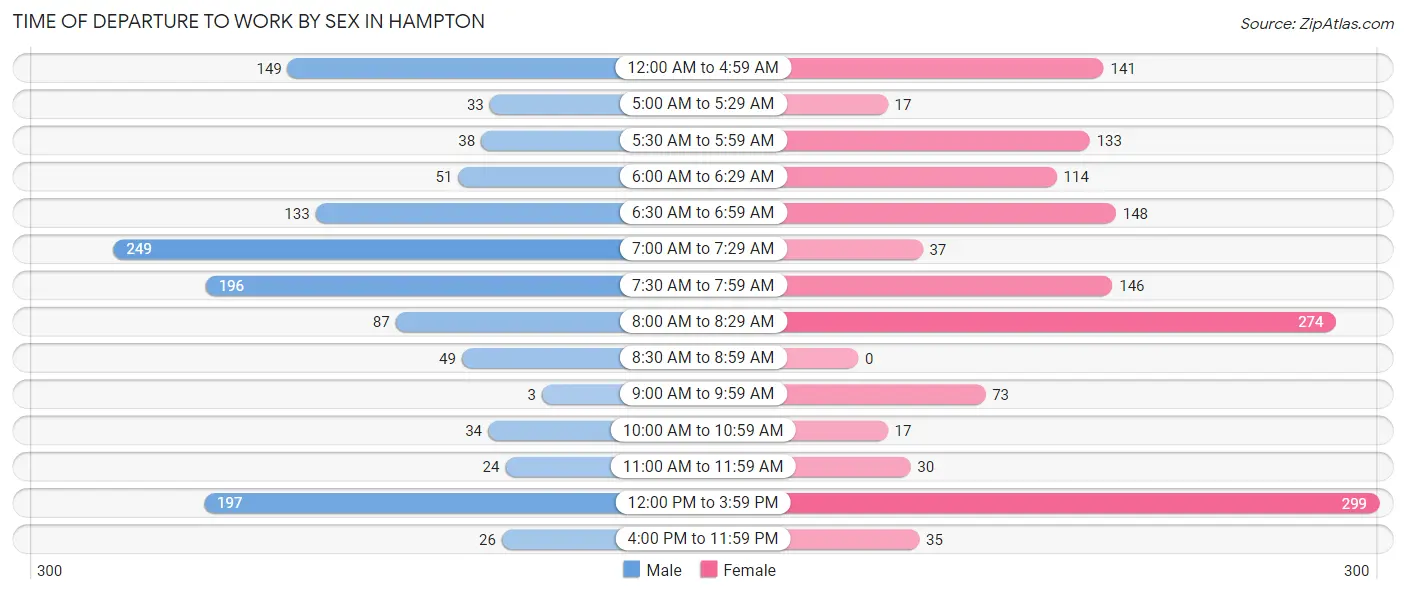
| Time of Departure | Male | Female |
| 12:00 AM to 4:59 AM | 149 (11.7%) | 141 (9.6%) |
| 5:00 AM to 5:29 AM | 33 (2.6%) | 17 (1.2%) |
| 5:30 AM to 5:59 AM | 38 (3.0%) | 133 (9.1%) |
| 6:00 AM to 6:29 AM | 51 (4.0%) | 114 (7.8%) |
| 6:30 AM to 6:59 AM | 133 (10.5%) | 148 (10.1%) |
| 7:00 AM to 7:29 AM | 249 (19.6%) | 37 (2.5%) |
| 7:30 AM to 7:59 AM | 196 (15.4%) | 146 (10.0%) |
| 8:00 AM to 8:29 AM | 87 (6.9%) | 274 (18.7%) |
| 8:30 AM to 8:59 AM | 49 (3.9%) | 0 (0.0%) |
| 9:00 AM to 9:59 AM | 3 (0.2%) | 73 (5.0%) |
| 10:00 AM to 10:59 AM | 34 (2.7%) | 17 (1.2%) |
| 11:00 AM to 11:59 AM | 24 (1.9%) | 30 (2.1%) |
| 12:00 PM to 3:59 PM | 197 (15.5%) | 299 (20.4%) |
| 4:00 PM to 11:59 PM | 26 (2.1%) | 35 (2.4%) |
| Total | 1,269 (100.0%) | 1,464 (100.0%) |
Housing Occupancy in Hampton
Occupancy by Ownership in Hampton
Of the total 2,410 dwellings in Hampton, owner-occupied units account for 1,681 (69.8%), while renter-occupied units make up 729 (30.2%).
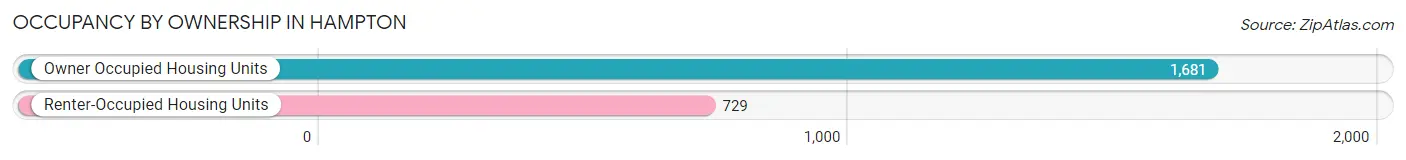
| Occupancy | # Housing Units | % Housing Units |
| Owner Occupied Housing Units | 1,681 | 69.8% |
| Renter-Occupied Housing Units | 729 | 30.2% |
| Total Occupied Housing Units | 2,410 | 100.0% |
Occupancy by Household Size in Hampton
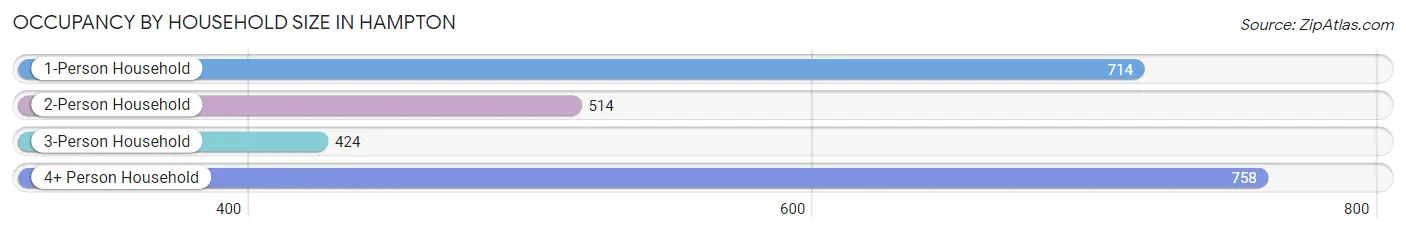
| Household Size | # Housing Units | % Housing Units |
| 1-Person Household | 714 | 29.6% |
| 2-Person Household | 514 | 21.3% |
| 3-Person Household | 424 | 17.6% |
| 4+ Person Household | 758 | 31.5% |
| Total Housing Units | 2,410 | 100.0% |
Occupancy by Ownership by Household Size in Hampton
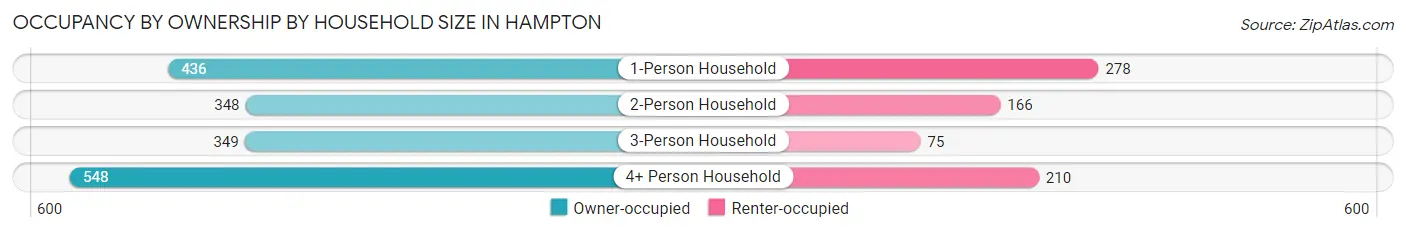
| Household Size | Owner-occupied | Renter-occupied |
| 1-Person Household | 436 (61.1%) | 278 (38.9%) |
| 2-Person Household | 348 (67.7%) | 166 (32.3%) |
| 3-Person Household | 349 (82.3%) | 75 (17.7%) |
| 4+ Person Household | 548 (72.3%) | 210 (27.7%) |
| Total Housing Units | 1,681 (69.8%) | 729 (30.2%) |
Occupancy by Educational Attainment in Hampton
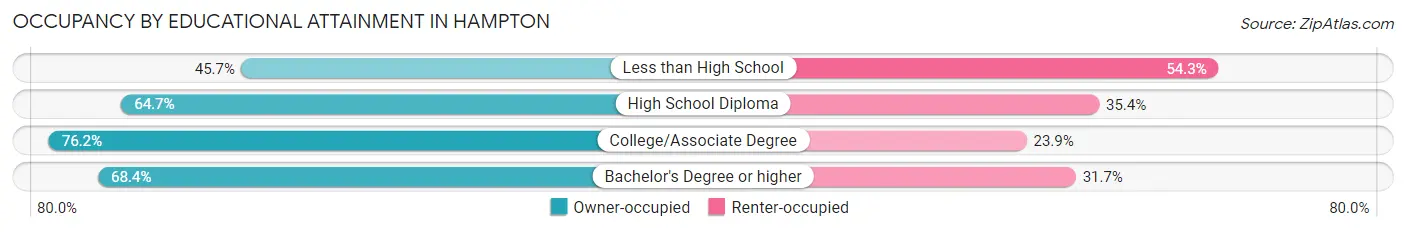
| Household Size | Owner-occupied | Renter-occupied |
| Less than High School | 32 (45.7%) | 38 (54.3%) |
| High School Diploma | 470 (64.6%) | 257 (35.3%) |
| College/Associate Degree | 747 (76.1%) | 234 (23.8%) |
| Bachelor's Degree or higher | 432 (68.3%) | 200 (31.7%) |
Occupancy by Age of Householder in Hampton
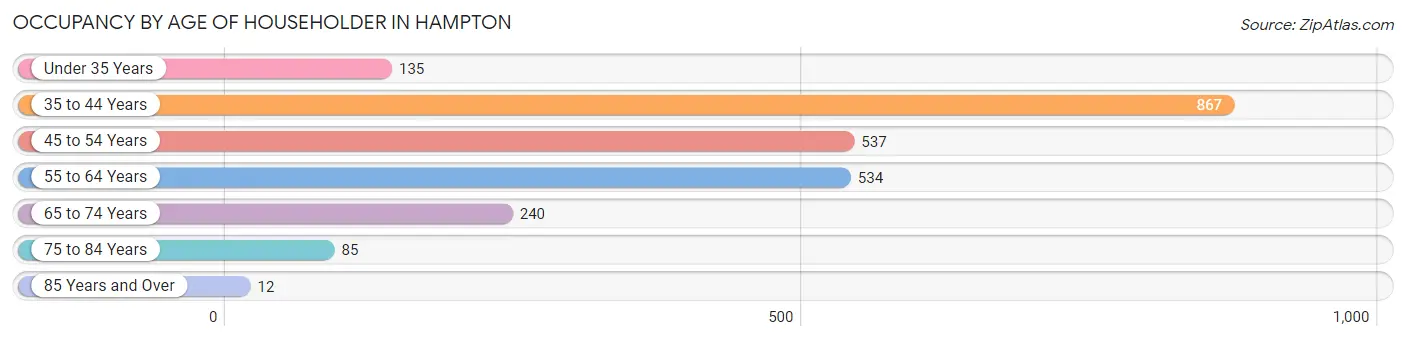
| Age Bracket | # Households | % Households |
| Under 35 Years | 135 | 5.6% |
| 35 to 44 Years | 867 | 36.0% |
| 45 to 54 Years | 537 | 22.3% |
| 55 to 64 Years | 534 | 22.2% |
| 65 to 74 Years | 240 | 10.0% |
| 75 to 84 Years | 85 | 3.5% |
| 85 Years and Over | 12 | 0.5% |
| Total | 2,410 | 100.0% |
Housing Finances in Hampton
Median Income by Occupancy in Hampton
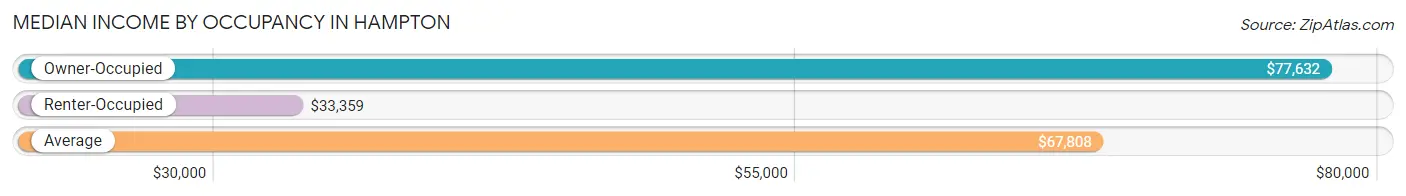
| Occupancy Type | # Households | Median Income |
| Owner-Occupied | 1,681 (69.8%) | $77,632 |
| Renter-Occupied | 729 (30.2%) | $33,359 |
| Average | 2,410 (100.0%) | $67,808 |
Occupancy by Householder Income Bracket in Hampton
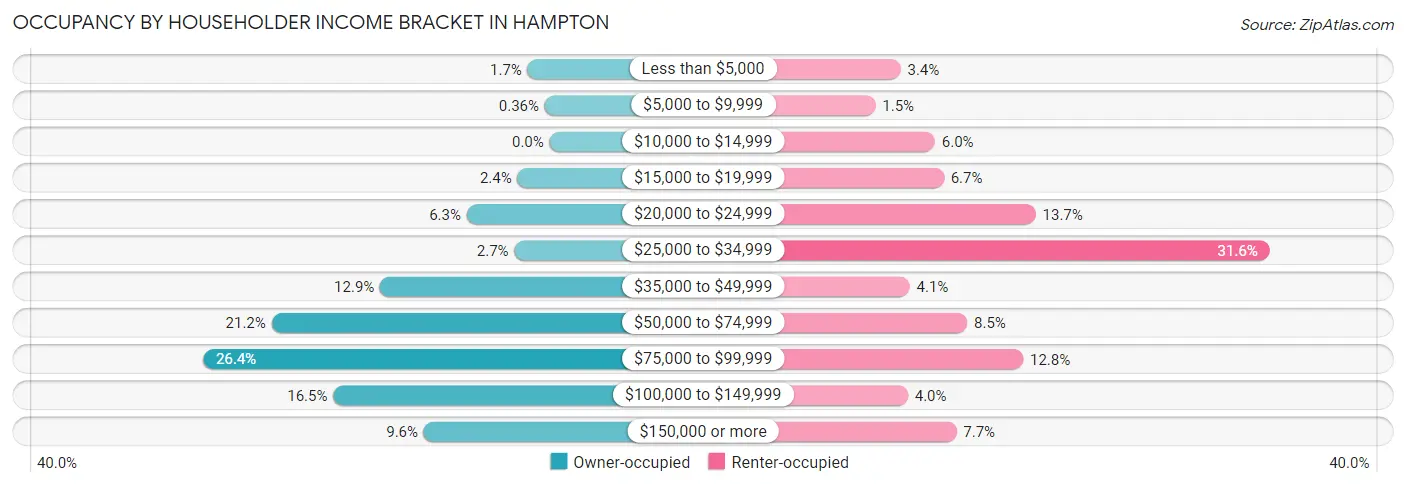
| Income Bracket | Owner-occupied | Renter-occupied |
| Less than $5,000 | 28 (1.7%) | 25 (3.4%) |
| $5,000 to $9,999 | 6 (0.4%) | 11 (1.5%) |
| $10,000 to $14,999 | 0 (0.0%) | 44 (6.0%) |
| $15,000 to $19,999 | 41 (2.4%) | 49 (6.7%) |
| $20,000 to $24,999 | 106 (6.3%) | 100 (13.7%) |
| $25,000 to $34,999 | 45 (2.7%) | 230 (31.6%) |
| $35,000 to $49,999 | 217 (12.9%) | 30 (4.1%) |
| $50,000 to $74,999 | 356 (21.2%) | 62 (8.5%) |
| $75,000 to $99,999 | 444 (26.4%) | 93 (12.8%) |
| $100,000 to $149,999 | 277 (16.5%) | 29 (4.0%) |
| $150,000 or more | 161 (9.6%) | 56 (7.7%) |
| Total | 1,681 (100.0%) | 729 (100.0%) |
Monthly Housing Cost Tiers in Hampton
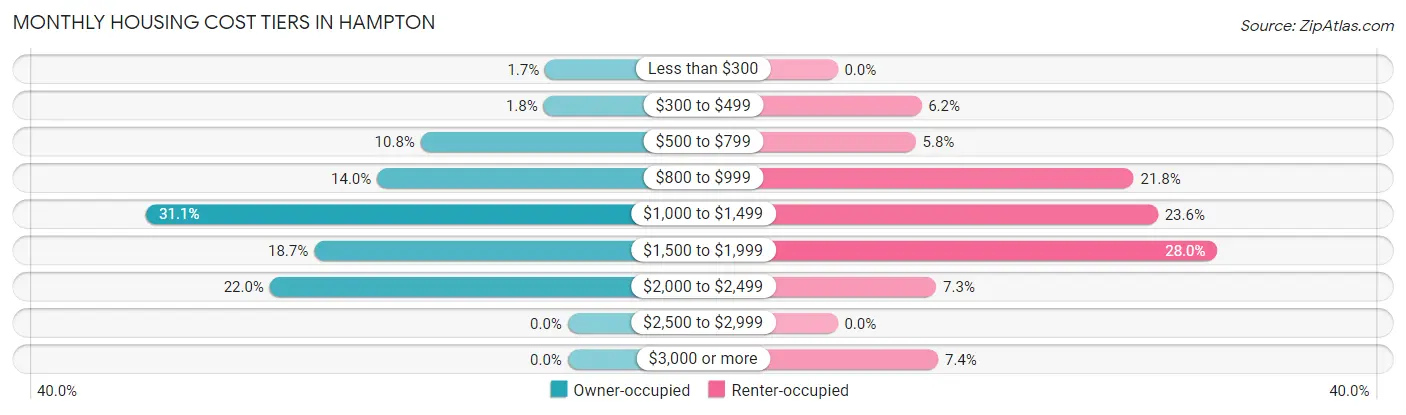
| Monthly Cost | Owner-occupied | Renter-occupied |
| Less than $300 | 28 (1.7%) | 0 (0.0%) |
| $300 to $499 | 30 (1.8%) | 45 (6.2%) |
| $500 to $799 | 182 (10.8%) | 42 (5.8%) |
| $800 to $999 | 236 (14.0%) | 159 (21.8%) |
| $1,000 to $1,499 | 522 (31.0%) | 172 (23.6%) |
| $1,500 to $1,999 | 314 (18.7%) | 204 (28.0%) |
| $2,000 to $2,499 | 369 (22.0%) | 53 (7.3%) |
| $2,500 to $2,999 | 0 (0.0%) | 0 (0.0%) |
| $3,000 or more | 0 (0.0%) | 54 (7.4%) |
| Total | 1,681 (100.0%) | 729 (100.0%) |
Physical Housing Characteristics in Hampton
Housing Structures in Hampton
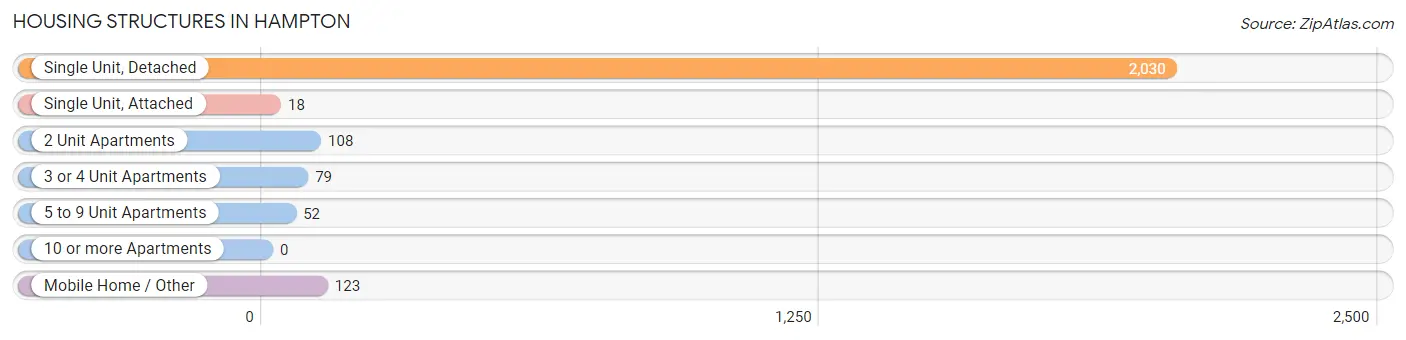
| Structure Type | # Housing Units | % Housing Units |
| Single Unit, Detached | 2,030 | 84.2% |
| Single Unit, Attached | 18 | 0.7% |
| 2 Unit Apartments | 108 | 4.5% |
| 3 or 4 Unit Apartments | 79 | 3.3% |
| 5 to 9 Unit Apartments | 52 | 2.2% |
| 10 or more Apartments | 0 | 0.0% |
| Mobile Home / Other | 123 | 5.1% |
| Total | 2,410 | 100.0% |
Housing Structures by Occupancy in Hampton
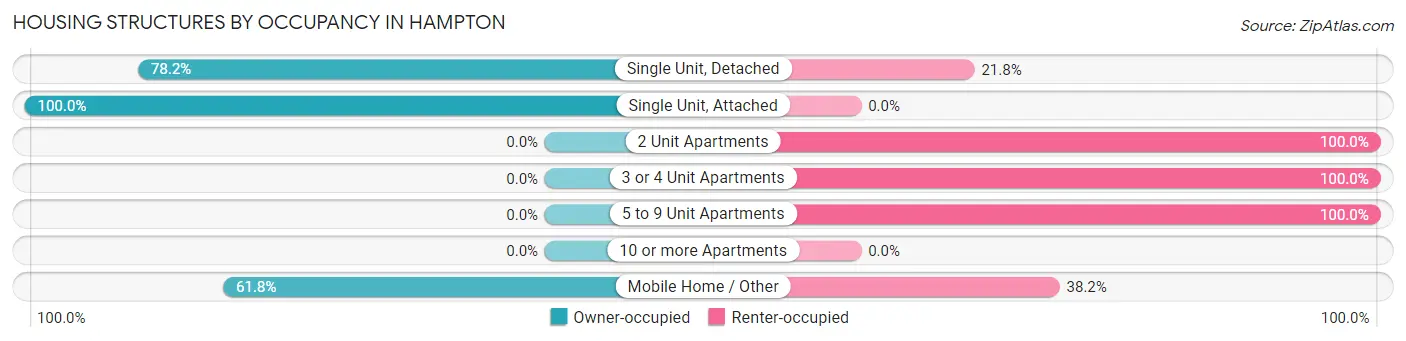
| Structure Type | Owner-occupied | Renter-occupied |
| Single Unit, Detached | 1,587 (78.2%) | 443 (21.8%) |
| Single Unit, Attached | 18 (100.0%) | 0 (0.0%) |
| 2 Unit Apartments | 0 (0.0%) | 108 (100.0%) |
| 3 or 4 Unit Apartments | 0 (0.0%) | 79 (100.0%) |
| 5 to 9 Unit Apartments | 0 (0.0%) | 52 (100.0%) |
| 10 or more Apartments | 0 (0.0%) | 0 (0.0%) |
| Mobile Home / Other | 76 (61.8%) | 47 (38.2%) |
| Total | 1,681 (69.8%) | 729 (30.2%) |
Housing Structures by Number of Rooms in Hampton
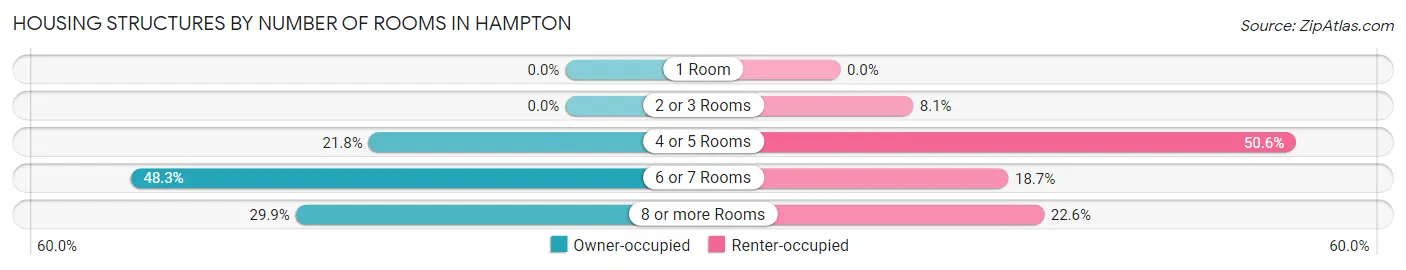
| Number of Rooms | Owner-occupied | Renter-occupied |
| 1 Room | 0 (0.0%) | 0 (0.0%) |
| 2 or 3 Rooms | 0 (0.0%) | 59 (8.1%) |
| 4 or 5 Rooms | 367 (21.8%) | 369 (50.6%) |
| 6 or 7 Rooms | 811 (48.2%) | 136 (18.7%) |
| 8 or more Rooms | 503 (29.9%) | 165 (22.6%) |
| Total | 1,681 (100.0%) | 729 (100.0%) |
Housing Structure by Heating Type in Hampton
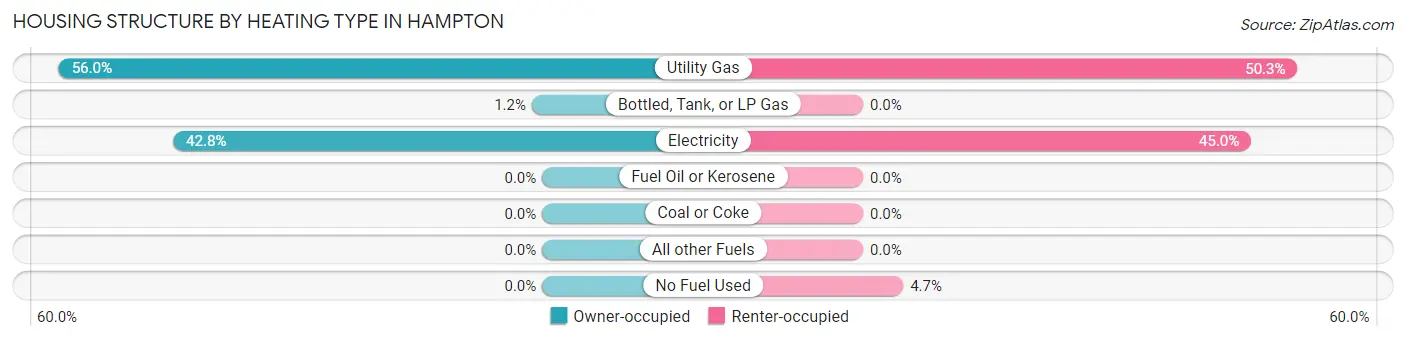
| Heating Type | Owner-occupied | Renter-occupied |
| Utility Gas | 942 (56.0%) | 367 (50.3%) |
| Bottled, Tank, or LP Gas | 20 (1.2%) | 0 (0.0%) |
| Electricity | 719 (42.8%) | 328 (45.0%) |
| Fuel Oil or Kerosene | 0 (0.0%) | 0 (0.0%) |
| Coal or Coke | 0 (0.0%) | 0 (0.0%) |
| All other Fuels | 0 (0.0%) | 0 (0.0%) |
| No Fuel Used | 0 (0.0%) | 34 (4.7%) |
| Total | 1,681 (100.0%) | 729 (100.0%) |
Household Vehicle Usage in Hampton
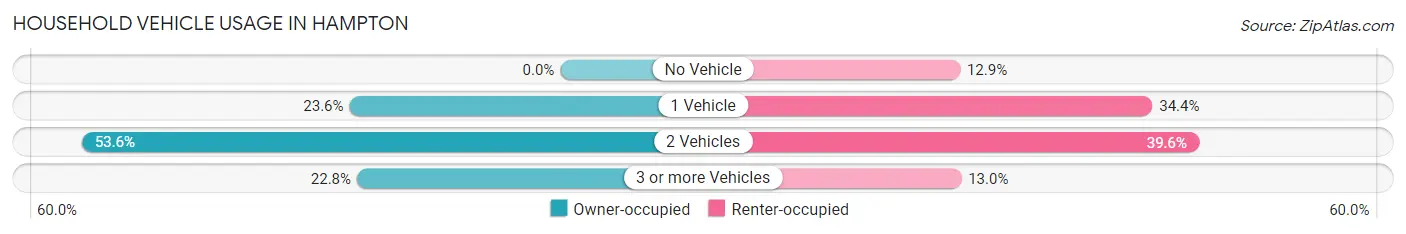
| Vehicles per Household | Owner-occupied | Renter-occupied |
| No Vehicle | 0 (0.0%) | 94 (12.9%) |
| 1 Vehicle | 397 (23.6%) | 251 (34.4%) |
| 2 Vehicles | 901 (53.6%) | 289 (39.6%) |
| 3 or more Vehicles | 383 (22.8%) | 95 (13.0%) |
| Total | 1,681 (100.0%) | 729 (100.0%) |
Real Estate & Mortgages in Hampton
Real Estate and Mortgage Overview in Hampton
| Characteristic | Without Mortgage | With Mortgage |
| Housing Units | 148 | 1,533 |
| Median Property Value | - | - |
| Median Household Income | - | - |
| Monthly Housing Costs | $724 | $0 |
| Real Estate Taxes | - | - |
Property Value by Mortgage Status in Hampton
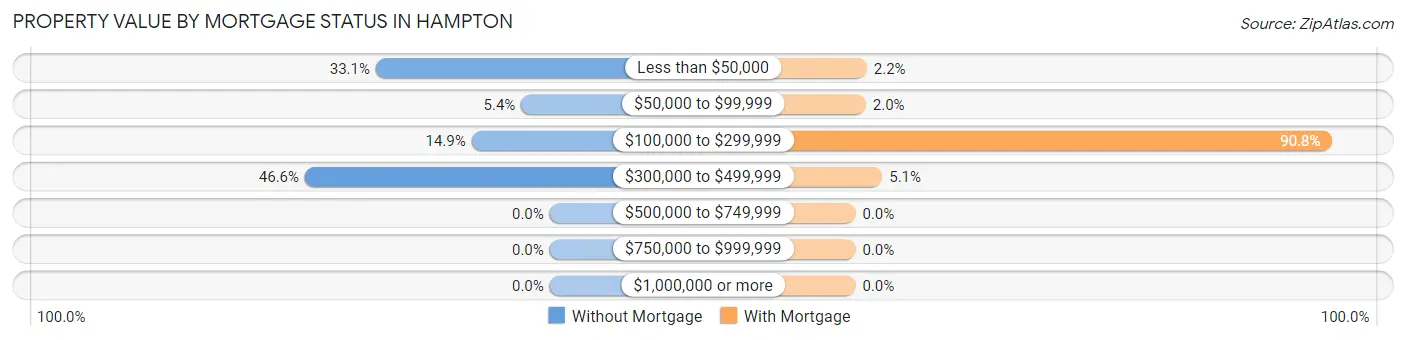
| Property Value | Without Mortgage | With Mortgage |
| Less than $50,000 | 49 (33.1%) | 33 (2.1%) |
| $50,000 to $99,999 | 8 (5.4%) | 30 (2.0%) |
| $100,000 to $299,999 | 22 (14.9%) | 1,392 (90.8%) |
| $300,000 to $499,999 | 69 (46.6%) | 78 (5.1%) |
| $500,000 to $749,999 | 0 (0.0%) | 0 (0.0%) |
| $750,000 to $999,999 | 0 (0.0%) | 0 (0.0%) |
| $1,000,000 or more | 0 (0.0%) | 0 (0.0%) |
| Total | 148 (100.0%) | 1,533 (100.0%) |
Household Income by Mortgage Status in Hampton
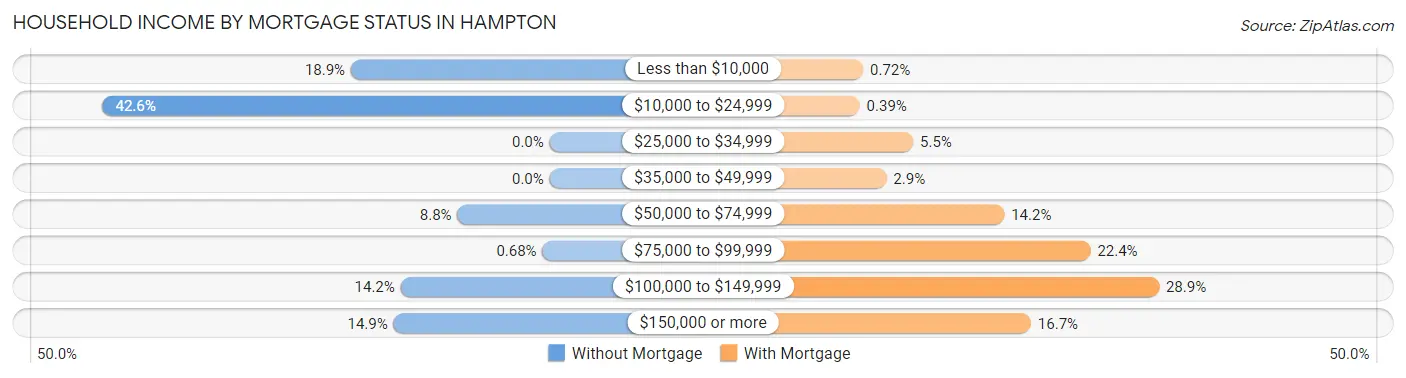
| Household Income | Without Mortgage | With Mortgage |
| Less than $10,000 | 28 (18.9%) | 11 (0.7%) |
| $10,000 to $24,999 | 63 (42.6%) | 6 (0.4%) |
| $25,000 to $34,999 | 0 (0.0%) | 84 (5.5%) |
| $35,000 to $49,999 | 0 (0.0%) | 45 (2.9%) |
| $50,000 to $74,999 | 13 (8.8%) | 217 (14.2%) |
| $75,000 to $99,999 | 1 (0.7%) | 343 (22.4%) |
| $100,000 to $149,999 | 21 (14.2%) | 443 (28.9%) |
| $150,000 or more | 22 (14.9%) | 256 (16.7%) |
| Total | 148 (100.0%) | 1,533 (100.0%) |
Property Value to Household Income Ratio in Hampton
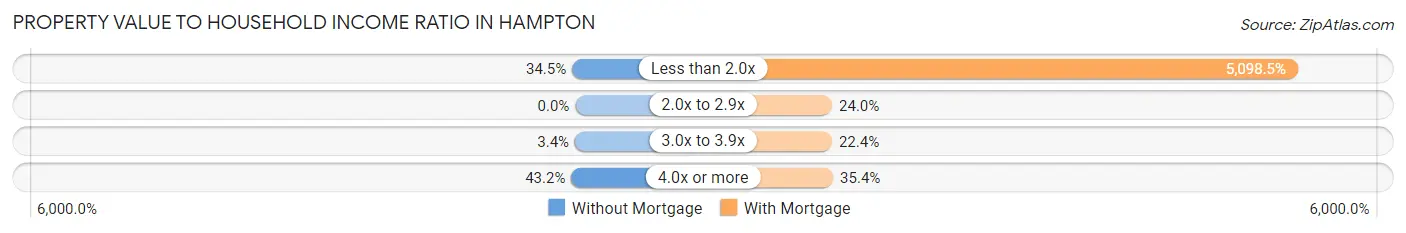
| Value-to-Income Ratio | Without Mortgage | With Mortgage |
| Less than 2.0x | 51 (34.5%) | 78,160 (5,098.5%) |
| 2.0x to 2.9x | 0 (0.0%) | 368 (24.0%) |
| 3.0x to 3.9x | 5 (3.4%) | 344 (22.4%) |
| 4.0x or more | 64 (43.2%) | 543 (35.4%) |
| Total | 148 (100.0%) | 1,533 (100.0%) |
Real Estate Taxes by Mortgage Status in Hampton
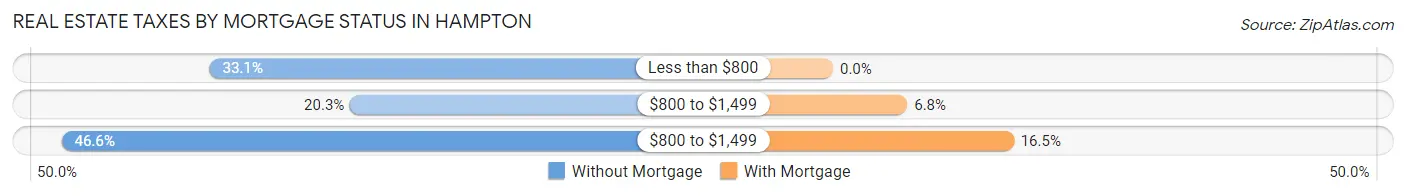
| Property Taxes | Without Mortgage | With Mortgage |
| Less than $800 | 49 (33.1%) | 0 (0.0%) |
| $800 to $1,499 | 30 (20.3%) | 104 (6.8%) |
| $800 to $1,499 | 69 (46.6%) | 253 (16.5%) |
| Total | 148 (100.0%) | 1,533 (100.0%) |
Health & Disability in Hampton
Health Insurance Coverage by Age in Hampton
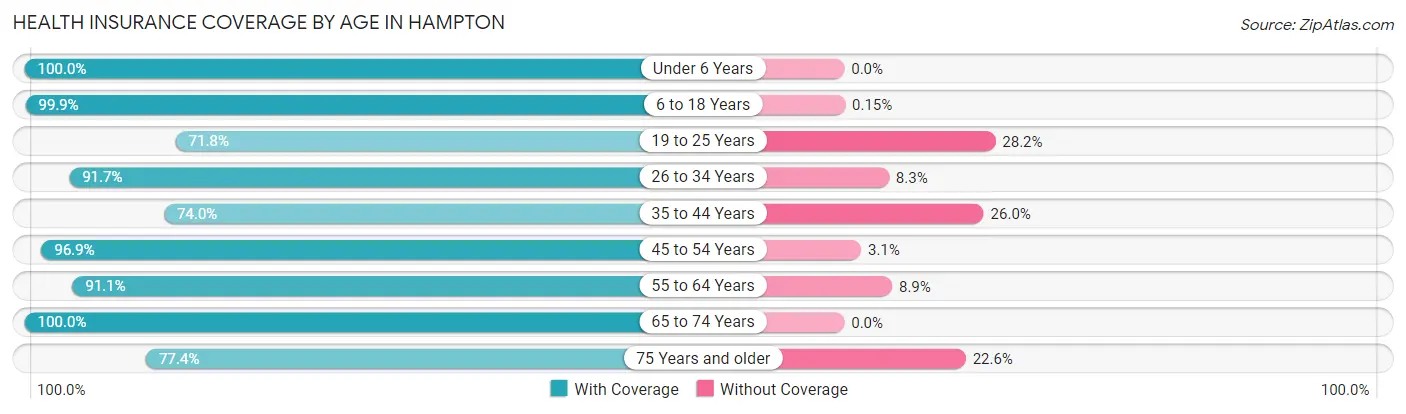
| Age Bracket | With Coverage | Without Coverage |
| Under 6 Years | 581 (100.0%) | 0 (0.0%) |
| 6 to 18 Years | 2,010 (99.9%) | 3 (0.2%) |
| 19 to 25 Years | 691 (71.8%) | 271 (28.2%) |
| 26 to 34 Years | 573 (91.7%) | 52 (8.3%) |
| 35 to 44 Years | 1,247 (74.0%) | 438 (26.0%) |
| 45 to 54 Years | 776 (96.9%) | 25 (3.1%) |
| 55 to 64 Years | 860 (91.1%) | 84 (8.9%) |
| 65 to 74 Years | 337 (100.0%) | 0 (0.0%) |
| 75 Years and older | 205 (77.4%) | 60 (22.6%) |
| Total | 7,280 (88.6%) | 933 (11.4%) |
Health Insurance Coverage by Citizenship Status in Hampton
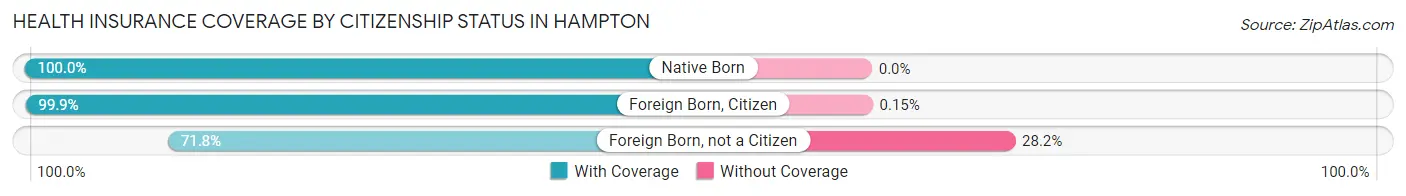
| Citizenship Status | With Coverage | Without Coverage |
| Native Born | 581 (100.0%) | 0 (0.0%) |
| Foreign Born, Citizen | 2,010 (99.9%) | 3 (0.2%) |
| Foreign Born, not a Citizen | 691 (71.8%) | 271 (28.2%) |
Health Insurance Coverage by Household Income in Hampton
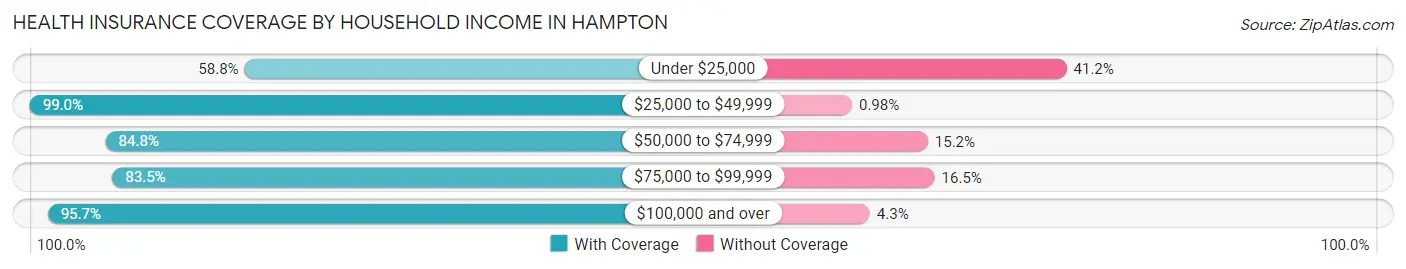
| Household Income | With Coverage | Without Coverage |
| Under $25,000 | 477 (58.8%) | 334 (41.2%) |
| $25,000 to $49,999 | 2,314 (99.0%) | 23 (1.0%) |
| $50,000 to $74,999 | 1,351 (84.8%) | 242 (15.2%) |
| $75,000 to $99,999 | 1,172 (83.5%) | 231 (16.5%) |
| $100,000 and over | 1,945 (95.7%) | 88 (4.3%) |
Public vs Private Health Insurance Coverage by Age in Hampton
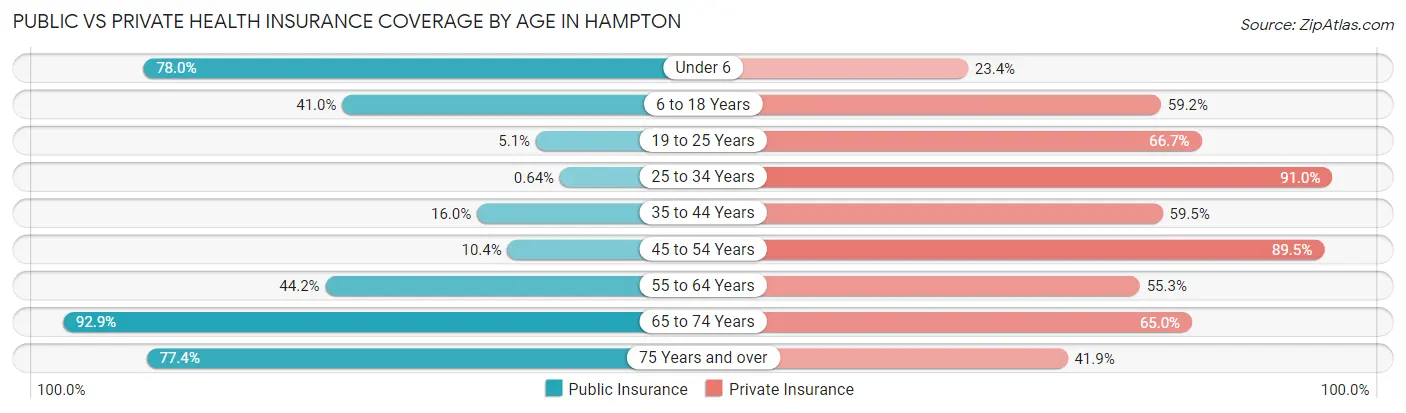
| Age Bracket | Public Insurance | Private Insurance |
| Under 6 | 453 (78.0%) | 136 (23.4%) |
| 6 to 18 Years | 826 (41.0%) | 1,192 (59.2%) |
| 19 to 25 Years | 49 (5.1%) | 642 (66.7%) |
| 25 to 34 Years | 4 (0.6%) | 569 (91.0%) |
| 35 to 44 Years | 270 (16.0%) | 1,003 (59.5%) |
| 45 to 54 Years | 83 (10.4%) | 717 (89.5%) |
| 55 to 64 Years | 417 (44.2%) | 522 (55.3%) |
| 65 to 74 Years | 313 (92.9%) | 219 (65.0%) |
| 75 Years and over | 205 (77.4%) | 111 (41.9%) |
| Total | 2,620 (31.9%) | 5,111 (62.2%) |
Disability Status by Sex by Age in Hampton
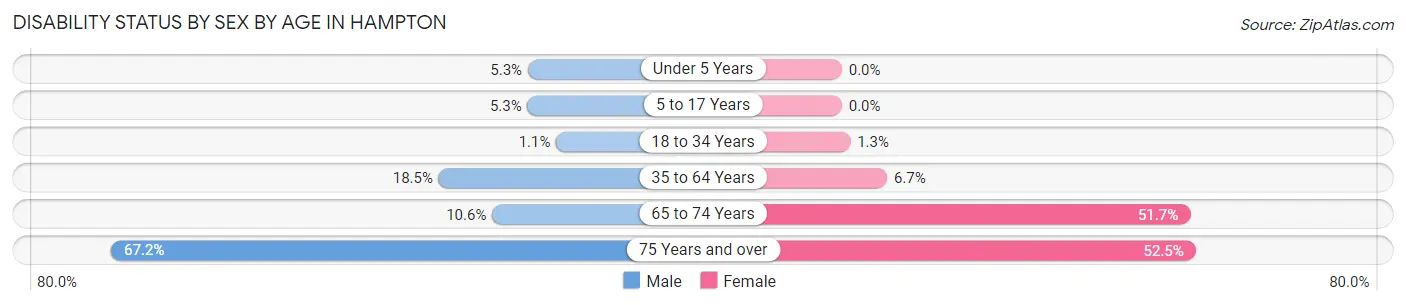
| Age Bracket | Male | Female |
| Under 5 Years | 4 (5.3%) | 0 (0.0%) |
| 5 to 17 Years | 40 (5.3%) | 0 (0.0%) |
| 18 to 34 Years | 8 (1.1%) | 13 (1.3%) |
| 35 to 64 Years | 312 (18.5%) | 117 (6.7%) |
| 65 to 74 Years | 17 (10.6%) | 91 (51.7%) |
| 75 Years and over | 45 (67.2%) | 104 (52.5%) |
Disability Class by Sex by Age in Hampton
Disability Class: Hearing Difficulty
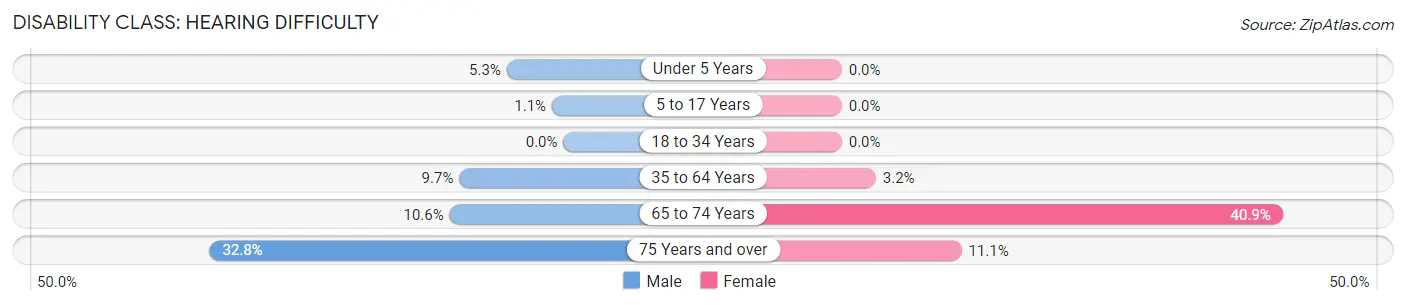
| Age Bracket | Male | Female |
| Under 5 Years | 4 (5.3%) | 0 (0.0%) |
| 5 to 17 Years | 8 (1.1%) | 0 (0.0%) |
| 18 to 34 Years | 0 (0.0%) | 0 (0.0%) |
| 35 to 64 Years | 163 (9.7%) | 55 (3.2%) |
| 65 to 74 Years | 17 (10.6%) | 72 (40.9%) |
| 75 Years and over | 22 (32.8%) | 22 (11.1%) |
Disability Class: Vision Difficulty
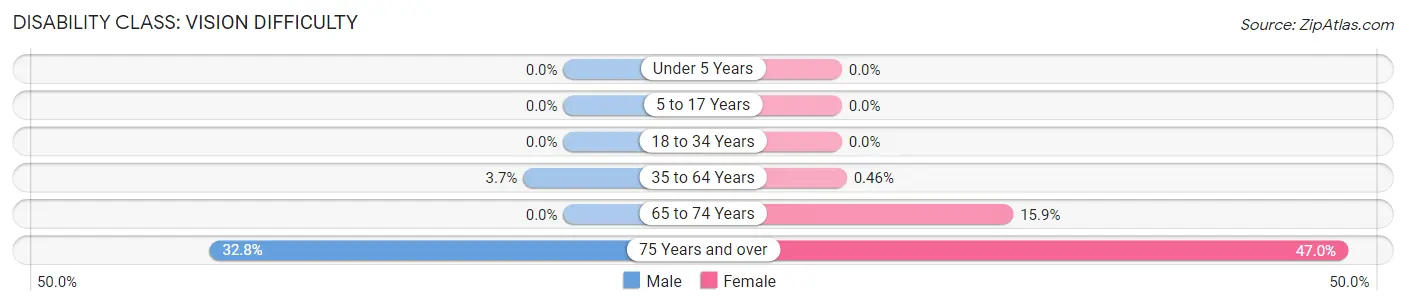
| Age Bracket | Male | Female |
| Under 5 Years | 0 (0.0%) | 0 (0.0%) |
| 5 to 17 Years | 0 (0.0%) | 0 (0.0%) |
| 18 to 34 Years | 0 (0.0%) | 0 (0.0%) |
| 35 to 64 Years | 63 (3.7%) | 8 (0.5%) |
| 65 to 74 Years | 0 (0.0%) | 28 (15.9%) |
| 75 Years and over | 22 (32.8%) | 93 (47.0%) |
Disability Class: Cognitive Difficulty
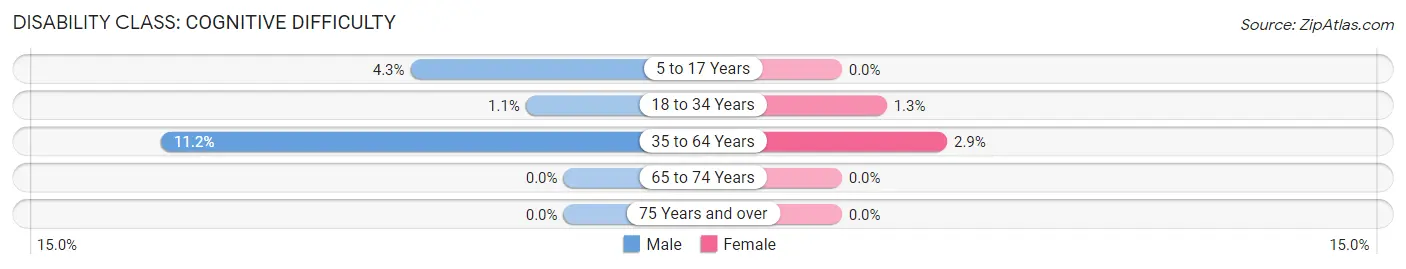
| Age Bracket | Male | Female |
| 5 to 17 Years | 32 (4.3%) | 0 (0.0%) |
| 18 to 34 Years | 8 (1.1%) | 13 (1.3%) |
| 35 to 64 Years | 189 (11.2%) | 51 (2.9%) |
| 65 to 74 Years | 0 (0.0%) | 0 (0.0%) |
| 75 Years and over | 0 (0.0%) | 0 (0.0%) |
Disability Class: Ambulatory Difficulty
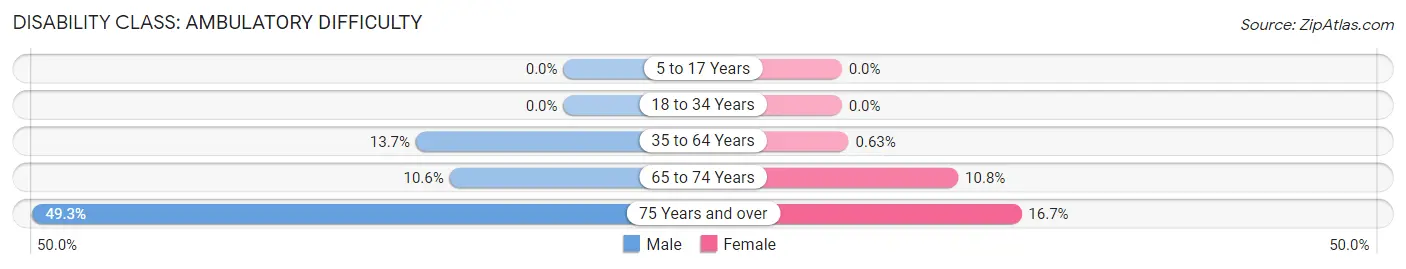
| Age Bracket | Male | Female |
| 5 to 17 Years | 0 (0.0%) | 0 (0.0%) |
| 18 to 34 Years | 0 (0.0%) | 0 (0.0%) |
| 35 to 64 Years | 231 (13.7%) | 11 (0.6%) |
| 65 to 74 Years | 17 (10.6%) | 19 (10.8%) |
| 75 Years and over | 33 (49.2%) | 33 (16.7%) |
Disability Class: Self-Care Difficulty
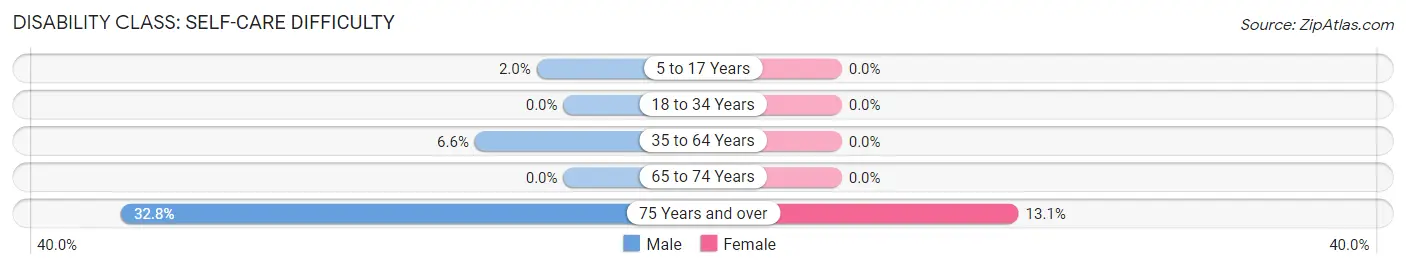
| Age Bracket | Male | Female |
| 5 to 17 Years | 15 (2.0%) | 0 (0.0%) |
| 18 to 34 Years | 0 (0.0%) | 0 (0.0%) |
| 35 to 64 Years | 111 (6.6%) | 0 (0.0%) |
| 65 to 74 Years | 0 (0.0%) | 0 (0.0%) |
| 75 Years and over | 22 (32.8%) | 26 (13.1%) |
Technology Access in Hampton
Computing Device Access in Hampton
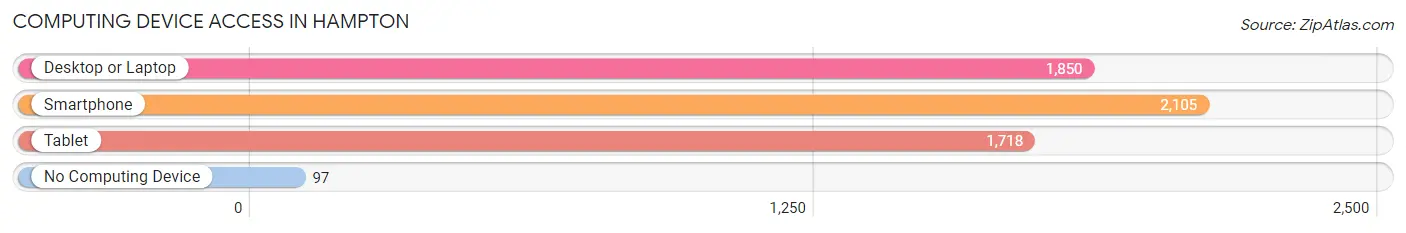
| Device Type | # Households | % Households |
| Desktop or Laptop | 1,850 | 76.8% |
| Smartphone | 2,105 | 87.3% |
| Tablet | 1,718 | 71.3% |
| No Computing Device | 97 | 4.0% |
| Total | 2,410 | 100.0% |
Internet Access in Hampton
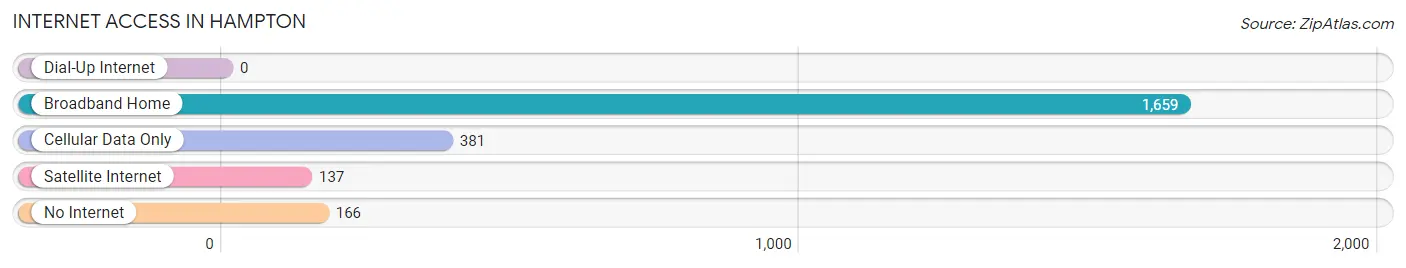
| Internet Type | # Households | % Households |
| Dial-Up Internet | 0 | 0.0% |
| Broadband Home | 1,659 | 68.8% |
| Cellular Data Only | 381 | 15.8% |
| Satellite Internet | 137 | 5.7% |
| No Internet | 166 | 6.9% |
| Total | 2,410 | 100.0% |
Hampton Summary
Hampton, Georgia is a city located in Henry County, Georgia, United States. It is part of the Atlanta metropolitan area. The population was 6,987 at the 2010 census.
History
Hampton was founded in 1873 by the Hampton family, who were among the first settlers in the area. The city was named after the family's patriarch, William Hampton. The city was incorporated in 1891.
In the early 1900s, Hampton was a thriving agricultural community, with cotton, corn, and peanuts being the main crops. The city was also home to several sawmills and gristmills.
In the 1950s, Hampton began to experience a population boom as the city became a popular bedroom community for Atlanta. The city's population grew from 1,000 in 1950 to over 6,000 by the year 2000.
Geography
Hampton is located in Henry County, Georgia, about 30 miles south of Atlanta. The city is situated in the Piedmont region of Georgia, and is surrounded by rolling hills and forests. The city is located at the intersection of U.S. Route 19 and Georgia State Route 20.
The city has a total area of 8.2 square miles, all of which is land. The city is located at an elevation of 845 feet above sea level.
Economy
The economy of Hampton is largely based on the service industry. The city is home to several retail stores, restaurants, and other businesses. The city is also home to several manufacturing companies, including a paper mill and a plastics factory.
The city is also home to several educational institutions, including a technical college and a community college.
Demographics
As of the 2010 census, there were 6,987 people, 2,717 households, and 1,845 families residing in the city. The population density was 851.2 people per square mile. The racial makeup of the city was 68.2% White, 28.2% African American, 0.3% Native American, 0.7% Asian, 0.1% Pacific Islander, 0.7% from other races, and 1.9% from two or more races. Hispanic or Latino of any race were 2.7% of the population.
The median income for a household in the city was $41,945, and the median income for a family was $50,945. The per capita income for the city was $20,945. About 11.2% of families and 14.2% of the population were below the poverty line, including 19.2% of those under age 18 and 8.2% of those age 65 or over.
Common Questions
What is Per Capita Income in Hampton?
Per Capita income in Hampton is $23,718.
What is the Median Family Income in Hampton?
Median Family Income in Hampton is $72,685.
What is the Median Household income in Hampton?
Median Household Income in Hampton is $67,808.
What is Income or Wage Gap in Hampton?
Income or Wage Gap in Hampton is 17.5%.
Women in Hampton earn 82.5 cents for every dollar earned by a man.
What is Inequality or Gini Index in Hampton?
Inequality or Gini Index in Hampton is 0.41.
What is the Total Population of Hampton?
Total Population of Hampton is 8,244.
What is the Total Male Population of Hampton?
Total Male Population of Hampton is 3,539.
What is the Total Female Population of Hampton?
Total Female Population of Hampton is 4,705.
What is the Ratio of Males per 100 Females in Hampton?
There are 75.22 Males per 100 Females in Hampton.
What is the Ratio of Females per 100 Males in Hampton?
There are 132.95 Females per 100 Males in Hampton.
What is the Median Population Age in Hampton?
Median Population Age in Hampton is 32.9 Years.
What is the Average Family Size in Hampton
Average Family Size in Hampton is 4.5 People.
What is the Average Household Size in Hampton
Average Household Size in Hampton is 3.4 People.
How Large is the Labor Force in Hampton?
There are 3,684 People in the Labor Forcein in Hampton.
What is the Percentage of People in the Labor Force in Hampton?
59.1% of People are in the Labor Force in Hampton.
What is the Unemployment Rate in Hampton?
Unemployment Rate in Hampton is 3.6%.