The Acreage, FL Map & Demographics
The Acreage Map
The Acreage Overview
$37,717
PER CAPITA INCOME
$105,716
AVG FAMILY INCOME
$100,417
AVG HOUSEHOLD INCOME
22.4%
WAGE / INCOME GAP [ % ]
77.6¢/ $1
WAGE / INCOME GAP [ $ ]
0.36
INEQUALITY / GINI INDEX
40,160
TOTAL POPULATION
20,783
MALE POPULATION
19,377
FEMALE POPULATION
107.26
MALES / 100 FEMALES
93.23
FEMALES / 100 MALES
41.9
MEDIAN AGE
3.4
AVG FAMILY SIZE
3.2
AVG HOUSEHOLD SIZE
22,443
LABOR FORCE [ PEOPLE ]
68.8%
PERCENT IN LABOR FORCE
3.5%
UNEMPLOYMENT RATE
Income in The Acreage
Income Overview in The Acreage
Per Capita Income in The Acreage is $37,717, while median incomes of families and households are $105,716 and $100,417 respectively.
| Characteristic | Number | Measure |
| Per Capita Income | 40,160 | $37,717 |
| Median Family Income | 10,299 | $105,716 |
| Mean Family Income | 10,299 | $119,433 |
| Median Household Income | 12,631 | $100,417 |
| Mean Household Income | 12,631 | $114,666 |
| Income Deficit | 10,299 | $0 |
| Wage / Income Gap (%) | 40,160 | 22.42% |
| Wage / Income Gap ($) | 40,160 | 77.58¢ per $1 |
| Gini / Inequality Index | 40,160 | 0.36 |
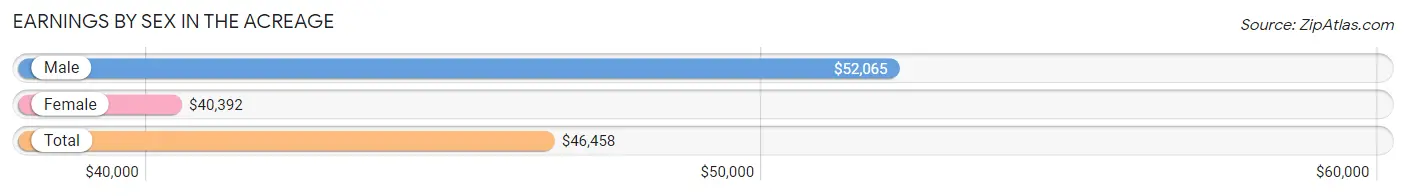
Earnings by Sex in The Acreage
Average Earnings in The Acreage are $46,458, $52,065 for men and $40,392 for women, a difference of 22.4%.
| Sex | Number | Average Earnings |
| Male | 12,444 (54.4%) | $52,065 |
| Female | 10,436 (45.6%) | $40,392 |
| Total | 22,880 (100.0%) | $46,458 |
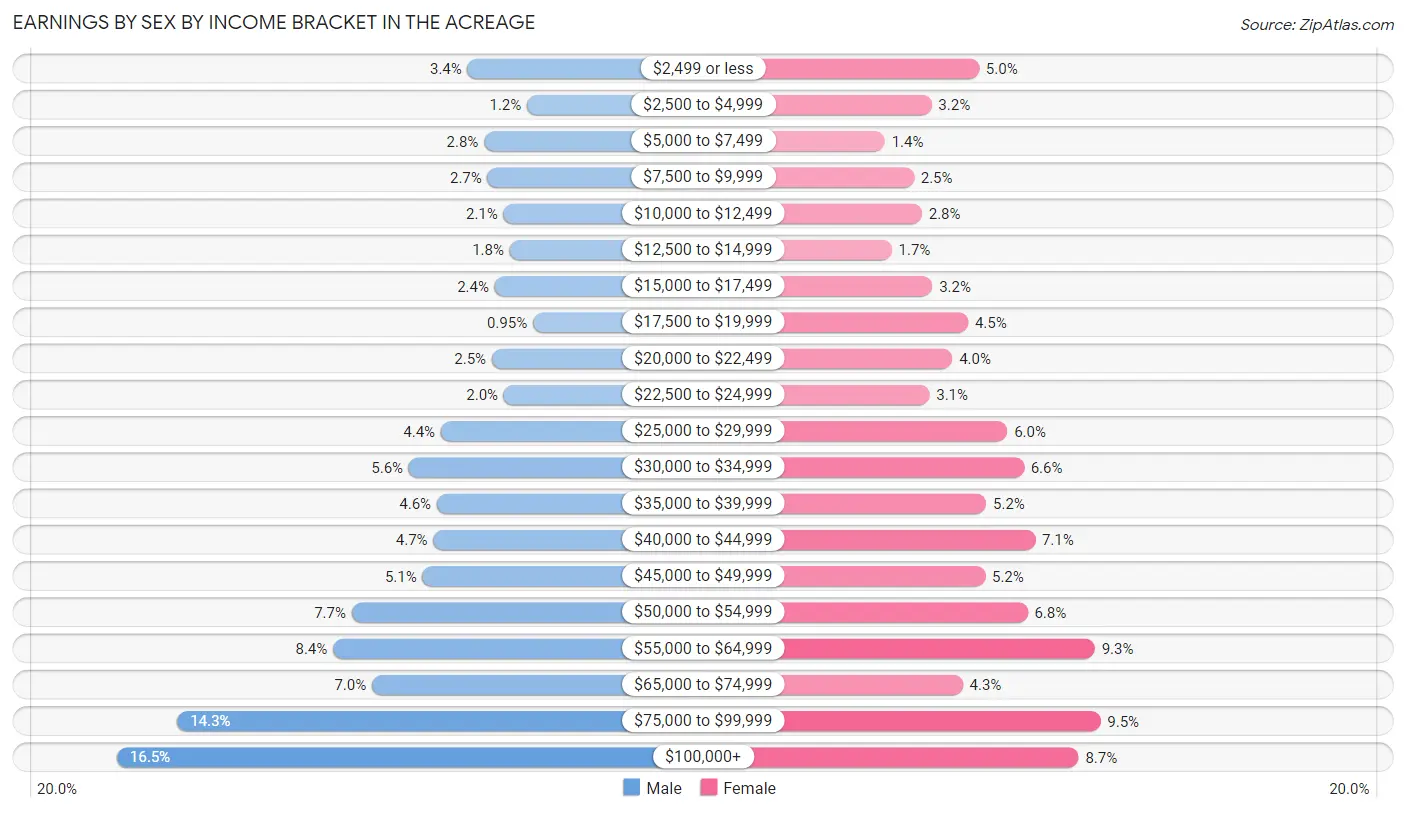
Earnings by Sex by Income Bracket in The Acreage
The most common earnings brackets in The Acreage are $100,000+ for men (2,058 | 16.5%) and $75,000 to $99,999 for women (991 | 9.5%).
| Income | Male | Female |
| $2,499 or less | 423 (3.4%) | 517 (5.0%) |
| $2,500 to $4,999 | 145 (1.2%) | 331 (3.2%) |
| $5,000 to $7,499 | 346 (2.8%) | 148 (1.4%) |
| $7,500 to $9,999 | 330 (2.6%) | 262 (2.5%) |
| $10,000 to $12,499 | 255 (2.1%) | 293 (2.8%) |
| $12,500 to $14,999 | 226 (1.8%) | 175 (1.7%) |
| $15,000 to $17,499 | 296 (2.4%) | 334 (3.2%) |
| $17,500 to $19,999 | 118 (0.9%) | 474 (4.5%) |
| $20,000 to $22,499 | 310 (2.5%) | 412 (4.0%) |
| $22,500 to $24,999 | 254 (2.0%) | 322 (3.1%) |
| $25,000 to $29,999 | 547 (4.4%) | 627 (6.0%) |
| $30,000 to $34,999 | 697 (5.6%) | 692 (6.6%) |
| $35,000 to $39,999 | 566 (4.5%) | 545 (5.2%) |
| $40,000 to $44,999 | 582 (4.7%) | 736 (7.0%) |
| $45,000 to $49,999 | 633 (5.1%) | 541 (5.2%) |
| $50,000 to $54,999 | 963 (7.7%) | 707 (6.8%) |
| $55,000 to $64,999 | 1,050 (8.4%) | 970 (9.3%) |
| $65,000 to $74,999 | 868 (7.0%) | 453 (4.3%) |
| $75,000 to $99,999 | 1,777 (14.3%) | 991 (9.5%) |
| $100,000+ | 2,058 (16.5%) | 906 (8.7%) |
| Total | 12,444 (100.0%) | 10,436 (100.0%) |
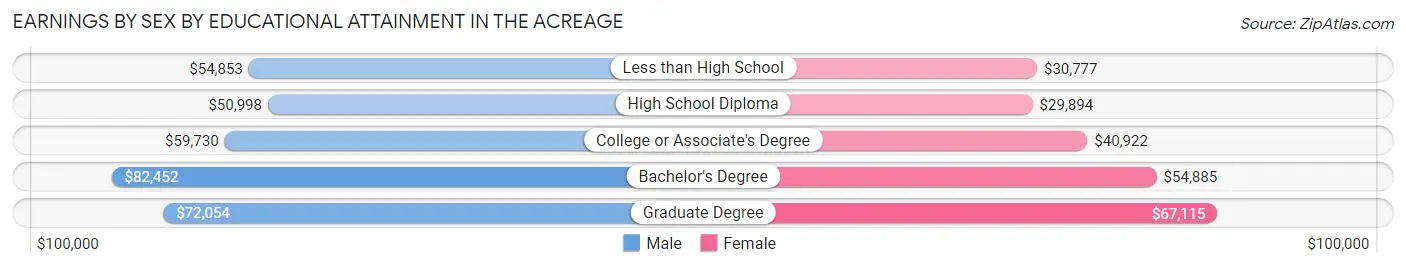
Earnings by Sex by Educational Attainment in The Acreage
Average earnings in The Acreage are $57,640 for men and $42,062 for women, a difference of 27.0%. Men with an educational attainment of bachelor's degree enjoy the highest average annual earnings of $82,452, while those with high school diploma education earn the least with $50,998. Women with an educational attainment of graduate degree earn the most with the average annual earnings of $67,115, while those with high school diploma education have the smallest earnings of $29,894.
| Educational Attainment | Male Income | Female Income |
| Less than High School | $54,853 | $30,777 |
| High School Diploma | $50,998 | $29,894 |
| College or Associate's Degree | $59,730 | $40,922 |
| Bachelor's Degree | $82,452 | $54,885 |
| Graduate Degree | $72,054 | $67,115 |
| Total | $57,640 | $42,062 |
Family Income in The Acreage
Family Income Brackets in The Acreage
According to the The Acreage family income data, there are 2,832 families falling into the $100,000 to $149,999 income range, which is the most common income bracket and makes up 27.5% of all families. Conversely, the $10,000 to $14,999 income bracket is the least frequent group with only 62 families (0.6%) belonging to this category.
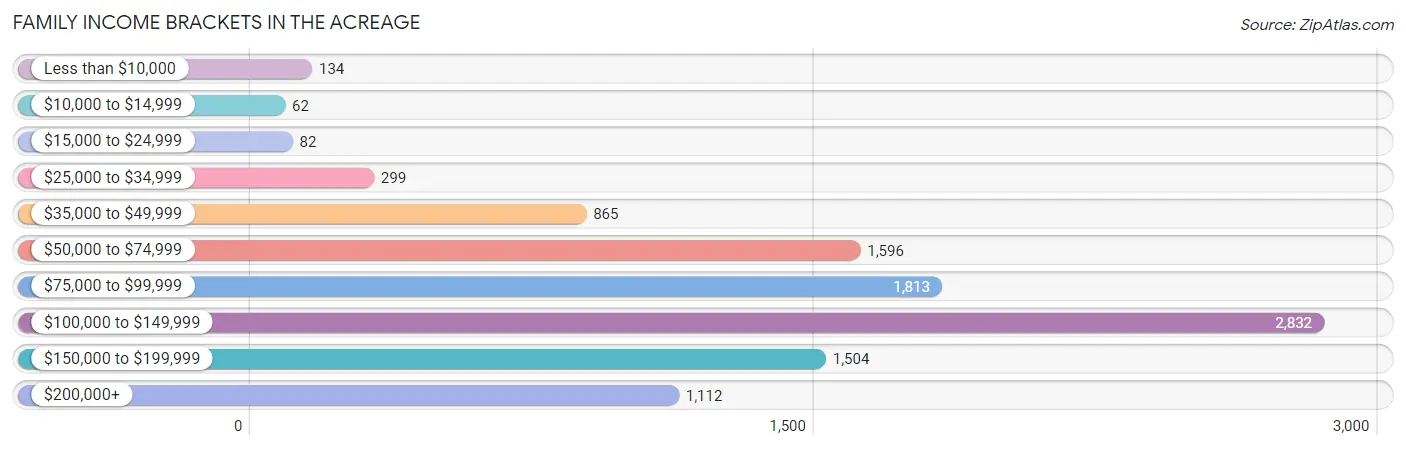
| Income Bracket | # Families | % Families |
| Less than $10,000 | 134 | 1.3% |
| $10,000 to $14,999 | 62 | 0.6% |
| $15,000 to $24,999 | 82 | 0.8% |
| $25,000 to $34,999 | 299 | 2.9% |
| $35,000 to $49,999 | 865 | 8.4% |
| $50,000 to $74,999 | 1,596 | 15.5% |
| $75,000 to $99,999 | 1,813 | 17.6% |
| $100,000 to $149,999 | 2,832 | 27.5% |
| $150,000 to $199,999 | 1,504 | 14.6% |
| $200,000+ | 1,112 | 10.8% |
Family Income by Famaliy Size in The Acreage
7+ person families (132 | 1.3%) account for the highest median family income in The Acreage with $183,750 per family, while 2-person families (4,060 | 39.4%) have the highest median income of $44,049 per family member.
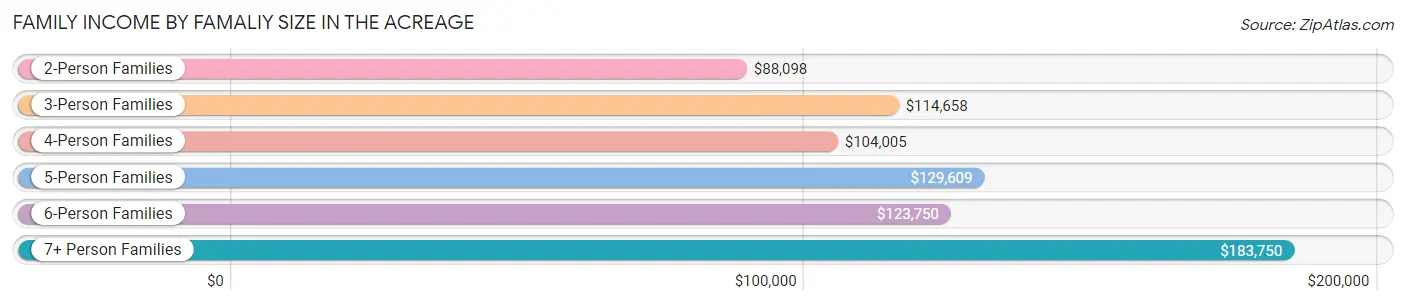
| Income Bracket | # Families | Median Income |
| 2-Person Families | 4,060 (39.4%) | $88,098 |
| 3-Person Families | 2,427 (23.6%) | $114,658 |
| 4-Person Families | 2,280 (22.1%) | $104,005 |
| 5-Person Families | 1,112 (10.8%) | $129,609 |
| 6-Person Families | 288 (2.8%) | $123,750 |
| 7+ Person Families | 132 (1.3%) | $183,750 |
| Total | 10,299 (100.0%) | $105,716 |
Family Income by Number of Earners in The Acreage
The median family income in The Acreage is $105,716, with families comprising 3+ earners (1,653) having the highest median family income of $155,034, while families with no earners (849) have the lowest median family income of $66,544, accounting for 16.1% and 8.2% of families, respectively.
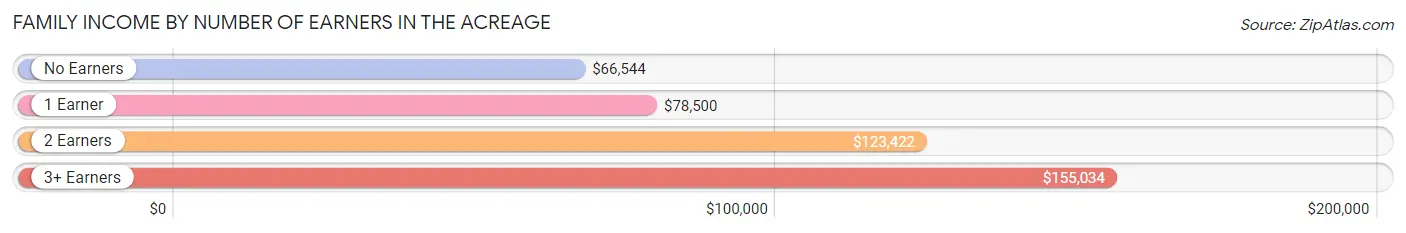
| Number of Earners | # Families | Median Income |
| No Earners | 849 (8.2%) | $66,544 |
| 1 Earner | 2,624 (25.5%) | $78,500 |
| 2 Earners | 5,173 (50.2%) | $123,422 |
| 3+ Earners | 1,653 (16.1%) | $155,034 |
| Total | 10,299 (100.0%) | $105,716 |
Household Income in The Acreage
Household Income Brackets in The Acreage
With 3,271 households falling in the category, the $100,000 to $149,999 income range is the most frequent in The Acreage, accounting for 25.9% of all households. In contrast, only 126 households (1.0%) fall into the $10,000 to $14,999 income bracket, making it the least populous group.
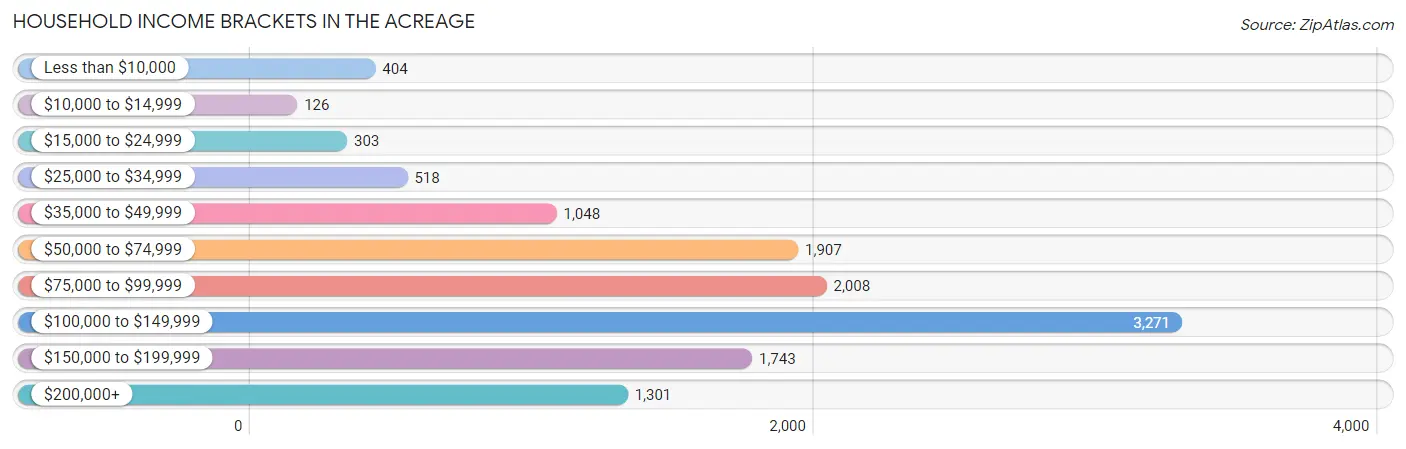
| Income Bracket | # Households | % Households |
| Less than $10,000 | 404 | 3.2% |
| $10,000 to $14,999 | 126 | 1.0% |
| $15,000 to $24,999 | 303 | 2.4% |
| $25,000 to $34,999 | 518 | 4.1% |
| $35,000 to $49,999 | 1,048 | 8.3% |
| $50,000 to $74,999 | 1,907 | 15.1% |
| $75,000 to $99,999 | 2,008 | 15.9% |
| $100,000 to $149,999 | 3,271 | 25.9% |
| $150,000 to $199,999 | 1,743 | 13.8% |
| $200,000+ | 1,301 | 10.3% |
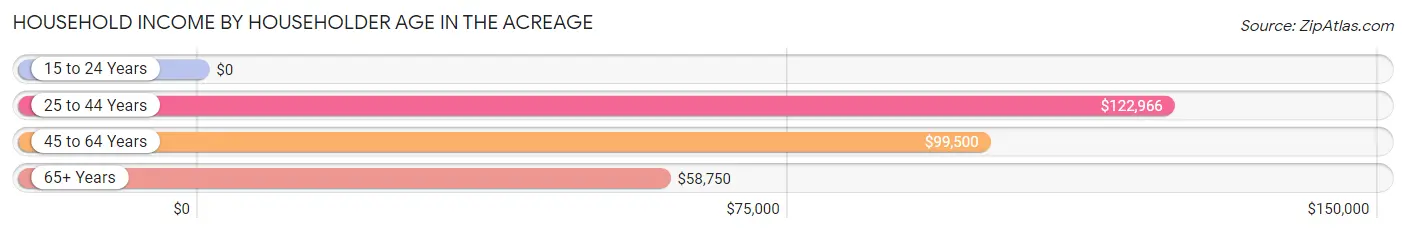
Household Income by Householder Age in The Acreage
The median household income in The Acreage is $100,417, with the highest median household income of $122,966 found in the 25 to 44 years age bracket for the primary householder. A total of 3,297 households (26.1%) fall into this category.
| Income Bracket | # Households | Median Income |
| 15 to 24 Years | 0 (0.0%) | $0 |
| 25 to 44 Years | 3,297 (26.1%) | $122,966 |
| 45 to 64 Years | 6,716 (53.2%) | $99,500 |
| 65+ Years | 2,618 (20.7%) | $58,750 |
| Total | 12,631 (100.0%) | $100,417 |
Poverty in The Acreage
Income Below Poverty by Sex and Age in The Acreage
With 4.3% poverty level for males and 4.4% for females among the residents of The Acreage, 15 year old males and 16 and 17 year old females are the most vulnerable to poverty, with 75 males (19.3%) and 60 females (12.0%) in their respective age groups living below the poverty level.
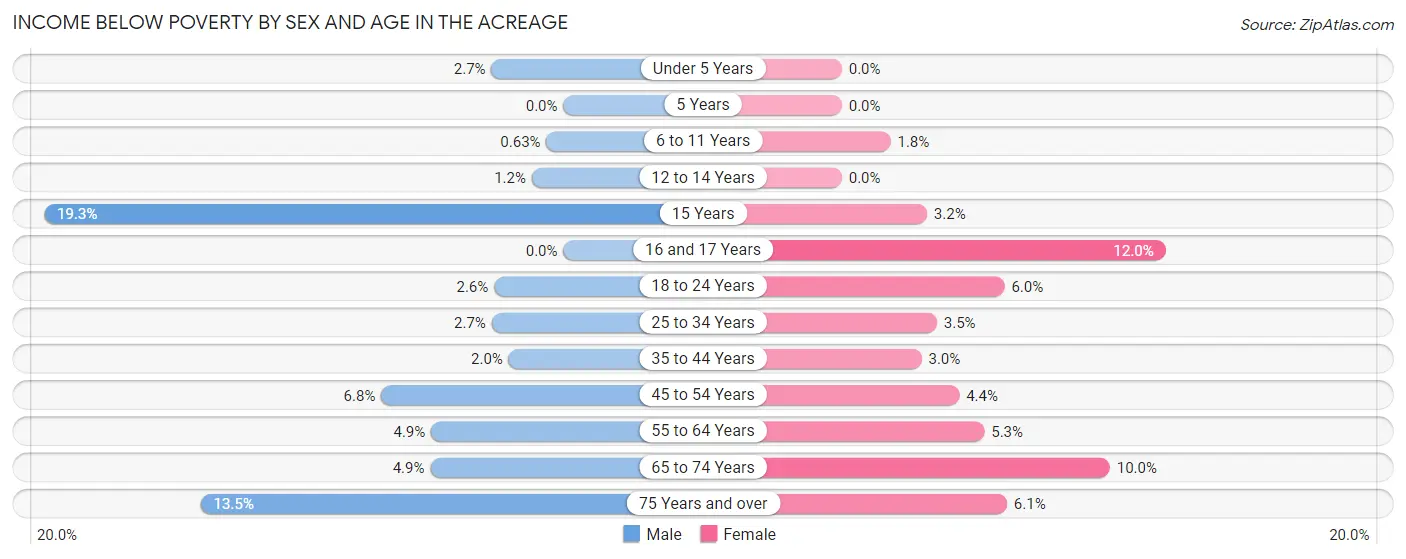
| Age Bracket | Male | Female |
| Under 5 Years | 24 (2.7%) | 0 (0.0%) |
| 5 Years | 0 (0.0%) | 0 (0.0%) |
| 6 to 11 Years | 8 (0.6%) | 22 (1.8%) |
| 12 to 14 Years | 11 (1.2%) | 0 (0.0%) |
| 15 Years | 75 (19.3%) | 13 (3.2%) |
| 16 and 17 Years | 0 (0.0%) | 60 (12.0%) |
| 18 to 24 Years | 46 (2.6%) | 67 (6.0%) |
| 25 to 34 Years | 63 (2.7%) | 91 (3.5%) |
| 35 to 44 Years | 50 (2.0%) | 75 (3.0%) |
| 45 to 54 Years | 246 (6.8%) | 145 (4.4%) |
| 55 to 64 Years | 170 (4.9%) | 152 (5.3%) |
| 65 to 74 Years | 81 (4.9%) | 150 (10.0%) |
| 75 Years and over | 129 (13.5%) | 73 (6.1%) |
| Total | 903 (4.3%) | 848 (4.4%) |
Income Above Poverty by Sex and Age in The Acreage
According to the poverty statistics in The Acreage, males aged 5 years and females aged under 5 years are the age groups that are most secure financially, with 100.0% of males and 100.0% of females in these age groups living above the poverty line.
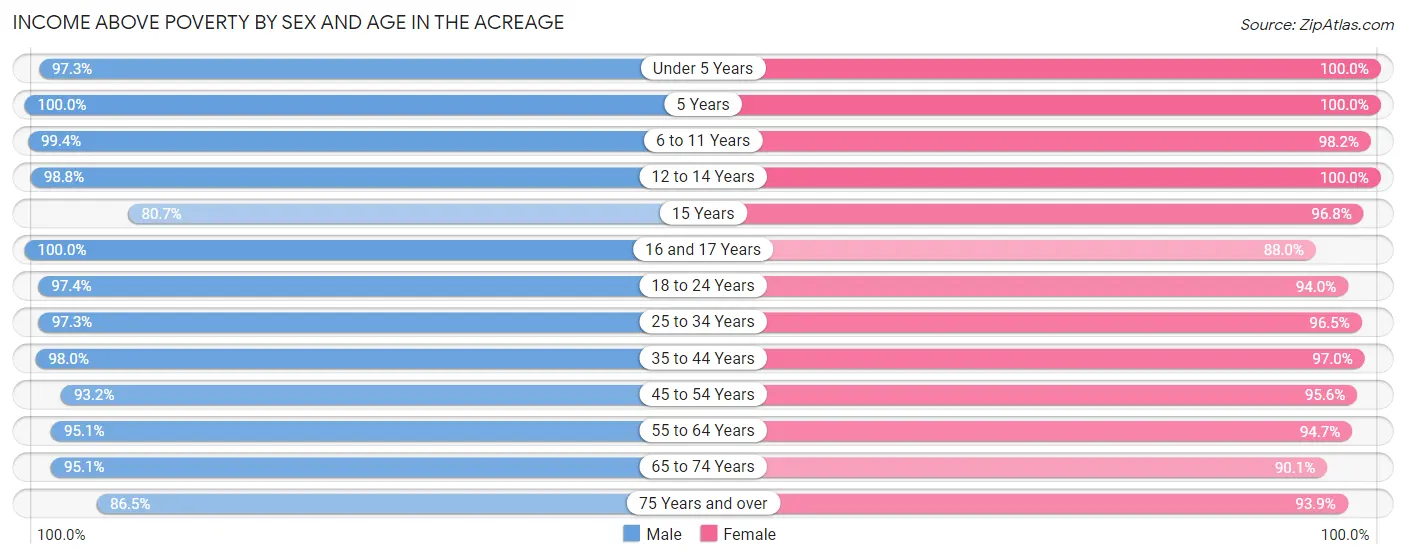
| Age Bracket | Male | Female |
| Under 5 Years | 876 (97.3%) | 707 (100.0%) |
| 5 Years | 255 (100.0%) | 355 (100.0%) |
| 6 to 11 Years | 1,270 (99.4%) | 1,191 (98.2%) |
| 12 to 14 Years | 931 (98.8%) | 1,028 (100.0%) |
| 15 Years | 314 (80.7%) | 399 (96.8%) |
| 16 and 17 Years | 659 (100.0%) | 439 (88.0%) |
| 18 to 24 Years | 1,741 (97.4%) | 1,043 (94.0%) |
| 25 to 34 Years | 2,304 (97.3%) | 2,487 (96.5%) |
| 35 to 44 Years | 2,417 (98.0%) | 2,460 (97.0%) |
| 45 to 54 Years | 3,392 (93.2%) | 3,178 (95.6%) |
| 55 to 64 Years | 3,295 (95.1%) | 2,723 (94.7%) |
| 65 to 74 Years | 1,560 (95.1%) | 1,358 (90.0%) |
| 75 Years and over | 829 (86.5%) | 1,117 (93.9%) |
| Total | 19,843 (95.7%) | 18,485 (95.6%) |
Income Below Poverty Among Married-Couple Families in The Acreage
The poverty statistics for married-couple families in The Acreage show that 2.3% or 195 of the total 8,366 families live below the poverty line. Families with no children have the highest poverty rate of 4.3%, comprising of 195 families. On the other hand, families with 1 or 2 children have the lowest poverty rate of 0.0%, which includes 0 families.
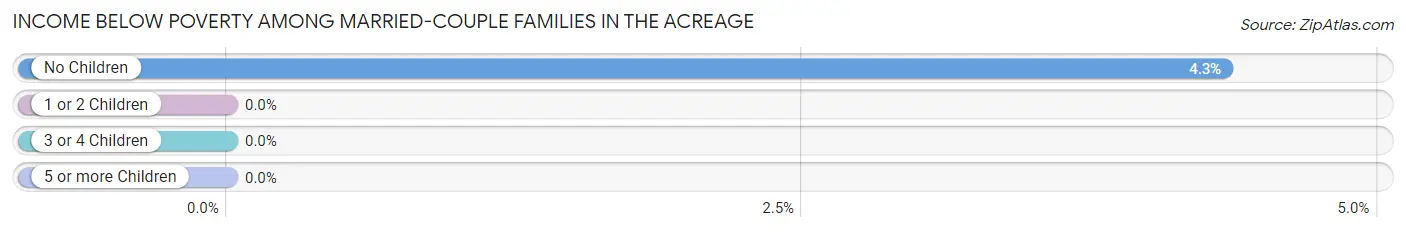
| Children | Above Poverty | Below Poverty |
| No Children | 4,308 (95.7%) | 195 (4.3%) |
| 1 or 2 Children | 3,260 (100.0%) | 0 (0.0%) |
| 3 or 4 Children | 575 (100.0%) | 0 (0.0%) |
| 5 or more Children | 28 (100.0%) | 0 (0.0%) |
| Total | 8,171 (97.7%) | 195 (2.3%) |
Income Below Poverty Among Single-Parent Households in The Acreage
According to the poverty data in The Acreage, 3.2% or 25 single-father households and 5.3% or 61 single-mother households are living below the poverty line. Among single-father households, those with 1 or 2 children have the highest poverty rate, with 25 households (7.3%) experiencing poverty. Likewise, among single-mother households, those with 5 or more children have the highest poverty rate, with 5 households (100.0%) falling below the poverty line.
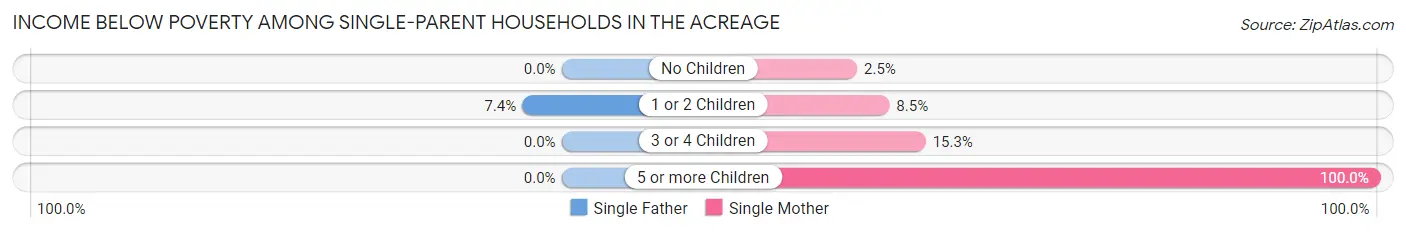
| Children | Single Father | Single Mother |
| No Children | 0 (0.0%) | 19 (2.5%) |
| 1 or 2 Children | 25 (7.3%) | 26 (8.5%) |
| 3 or 4 Children | 0 (0.0%) | 11 (15.3%) |
| 5 or more Children | 0 (0.0%) | 5 (100.0%) |
| Total | 25 (3.2%) | 61 (5.3%) |
Income Below Poverty Among Married-Couple vs Single-Parent Households in The Acreage
The poverty data for The Acreage shows that 195 of the married-couple family households (2.3%) and 86 of the single-parent households (4.4%) are living below the poverty level. Within the married-couple family households, those with no children have the highest poverty rate, with 195 households (4.3%) falling below the poverty line. Among the single-parent households, those with 5 or more children have the highest poverty rate, with 5 household (100.0%) living below poverty.
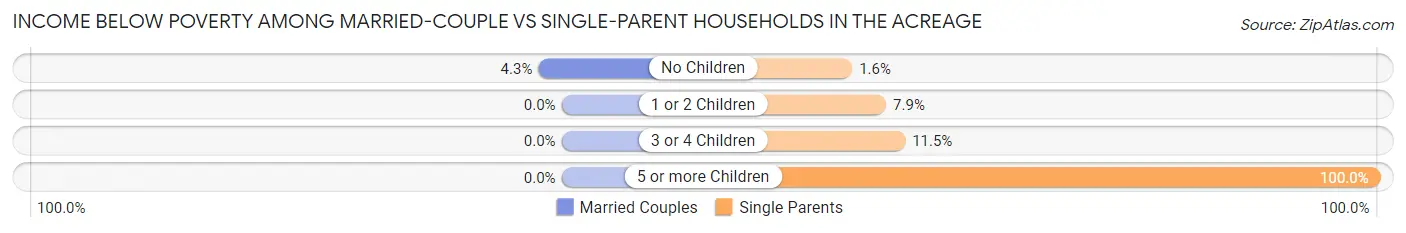
| Children | Married-Couple Families | Single-Parent Households |
| No Children | 195 (4.3%) | 19 (1.6%) |
| 1 or 2 Children | 0 (0.0%) | 51 (7.9%) |
| 3 or 4 Children | 0 (0.0%) | 11 (11.5%) |
| 5 or more Children | 0 (0.0%) | 5 (100.0%) |
| Total | 195 (2.3%) | 86 (4.4%) |
Race in The Acreage
The most populous races in The Acreage are White / Caucasian (28,798 | 71.7%), Hispanic or Latino (8,312 | 20.7%), and Black / African American (5,527 | 13.8%).
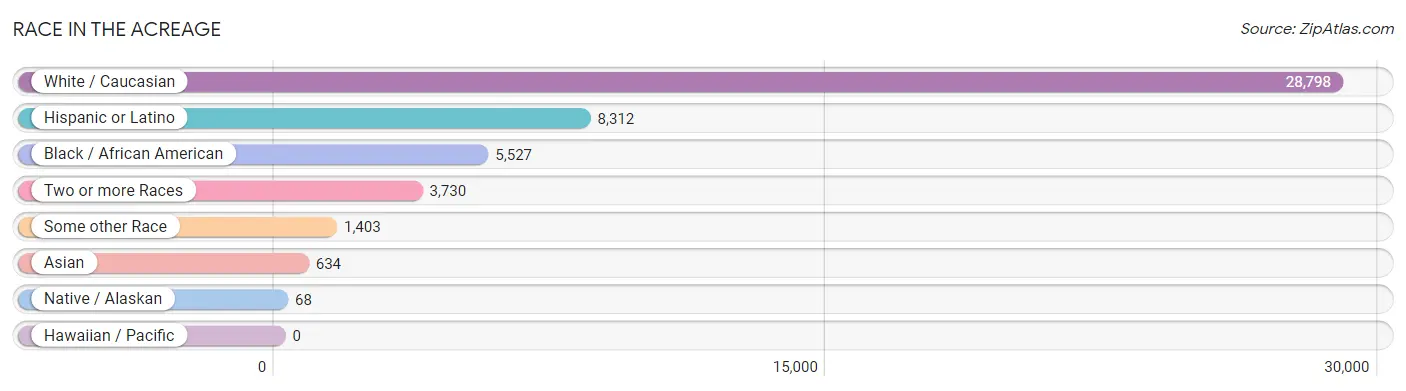
| Race | # Population | % Population |
| Asian | 634 | 1.6% |
| Black / African American | 5,527 | 13.8% |
| Hawaiian / Pacific | 0 | 0.0% |
| Hispanic or Latino | 8,312 | 20.7% |
| Native / Alaskan | 68 | 0.2% |
| White / Caucasian | 28,798 | 71.7% |
| Two or more Races | 3,730 | 9.3% |
| Some other Race | 1,403 | 3.5% |
| Total | 40,160 | 100.0% |
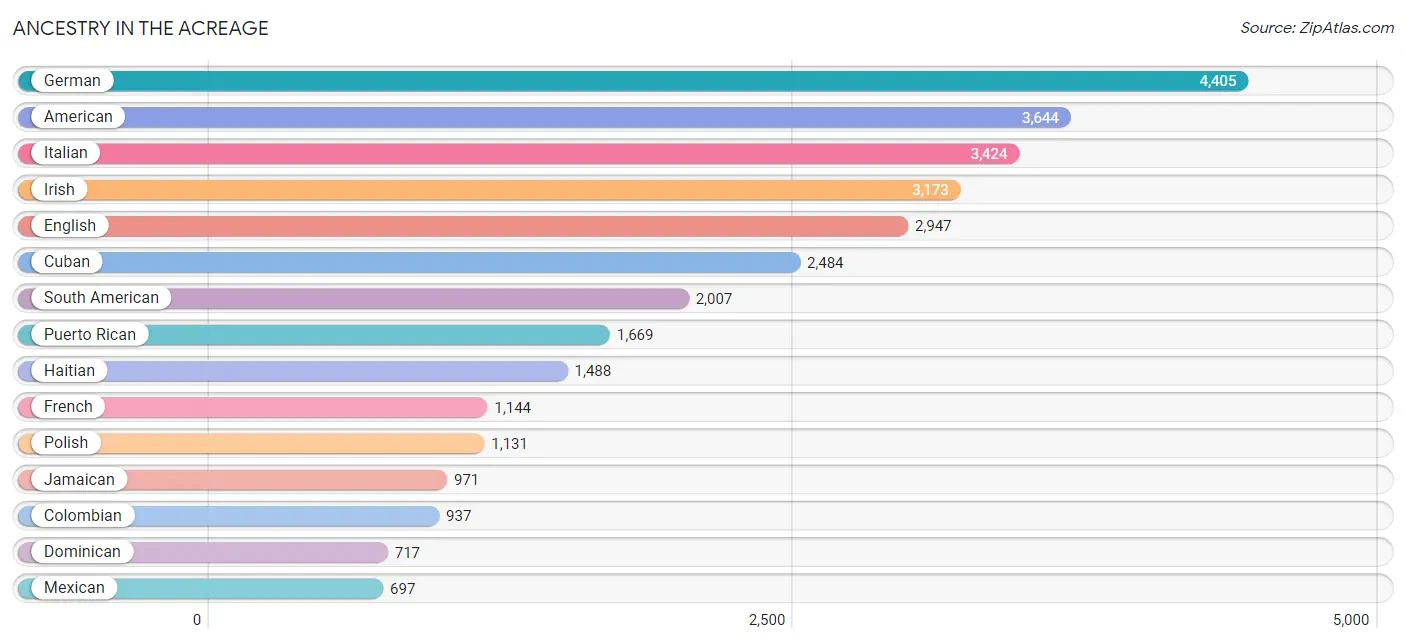
Ancestry in The Acreage
The most populous ancestries reported in The Acreage are German (4,405 | 11.0%), American (3,644 | 9.1%), Italian (3,424 | 8.5%), Irish (3,173 | 7.9%), and English (2,947 | 7.3%), together accounting for 43.8% of all The Acreage residents.
| Ancestry | # Population | % Population |
| African | 239 | 0.6% |
| American | 3,644 | 9.1% |
| Arab | 63 | 0.2% |
| Argentinean | 139 | 0.4% |
| Armenian | 37 | 0.1% |
| Australian | 14 | 0.0% |
| Austrian | 64 | 0.2% |
| Bahamian | 33 | 0.1% |
| Brazilian | 194 | 0.5% |
| British | 93 | 0.2% |
| Burmese | 12 | 0.0% |
| Canadian | 371 | 0.9% |
| Central American | 413 | 1.0% |
| Cherokee | 43 | 0.1% |
| Chilean | 77 | 0.2% |
| Colombian | 937 | 2.3% |
| Costa Rican | 78 | 0.2% |
| Croatian | 22 | 0.1% |
| Cuban | 2,484 | 6.2% |
| Czech | 101 | 0.3% |
| Czechoslovakian | 17 | 0.0% |
| Danish | 34 | 0.1% |
| Dominican | 717 | 1.8% |
| Dutch | 195 | 0.5% |
| Eastern European | 336 | 0.8% |
| Ecuadorian | 121 | 0.3% |
| Egyptian | 16 | 0.0% |
| English | 2,947 | 7.3% |
| European | 602 | 1.5% |
| Finnish | 10 | 0.0% |
| French | 1,144 | 2.9% |
| French Canadian | 294 | 0.7% |
| German | 4,405 | 11.0% |
| Ghanaian | 31 | 0.1% |
| Greek | 46 | 0.1% |
| Guatemalan | 109 | 0.3% |
| Guyanese | 53 | 0.1% |
| Haitian | 1,488 | 3.7% |
| Honduran | 169 | 0.4% |
| Hungarian | 101 | 0.3% |
| Icelander | 16 | 0.0% |
| Indian (Asian) | 239 | 0.6% |
| Irish | 3,173 | 7.9% |
| Iroquois | 29 | 0.1% |
| Israeli | 31 | 0.1% |
| Italian | 3,424 | 8.5% |
| Jamaican | 971 | 2.4% |
| Jordanian | 9 | 0.0% |
| Korean | 25 | 0.1% |
| Lebanese | 28 | 0.1% |
| Lithuanian | 109 | 0.3% |
| Malaysian | 66 | 0.2% |
| Mexican | 697 | 1.7% |
| Mexican American Indian | 48 | 0.1% |
| Native Hawaiian | 7 | 0.0% |
| Nicaraguan | 57 | 0.1% |
| Northern European | 19 | 0.1% |
| Norwegian | 332 | 0.8% |
| Paraguayan | 34 | 0.1% |
| Pennsylvania German | 7 | 0.0% |
| Peruvian | 105 | 0.3% |
| Polish | 1,131 | 2.8% |
| Portuguese | 268 | 0.7% |
| Puerto Rican | 1,669 | 4.2% |
| Romanian | 216 | 0.5% |
| Russian | 308 | 0.8% |
| Scandinavian | 20 | 0.1% |
| Scotch-Irish | 275 | 0.7% |
| Scottish | 669 | 1.7% |
| Seminole | 4 | 0.0% |
| Slavic | 27 | 0.1% |
| Slovak | 187 | 0.5% |
| Slovene | 5 | 0.0% |
| South African | 42 | 0.1% |
| South American | 2,007 | 5.0% |
| Spaniard | 47 | 0.1% |
| Spanish | 4 | 0.0% |
| Sri Lankan | 104 | 0.3% |
| Subsaharan African | 312 | 0.8% |
| Swedish | 170 | 0.4% |
| Swiss | 108 | 0.3% |
| Syrian | 10 | 0.0% |
| Thai | 311 | 0.8% |
| Trinidadian and Tobagonian | 512 | 1.3% |
| Ukrainian | 163 | 0.4% |
| Uruguayan | 63 | 0.2% |
| Venezuelan | 531 | 1.3% |
| Welsh | 216 | 0.5% |
| West Indian | 195 | 0.5% | View All 89 Rows |
Immigrants in The Acreage
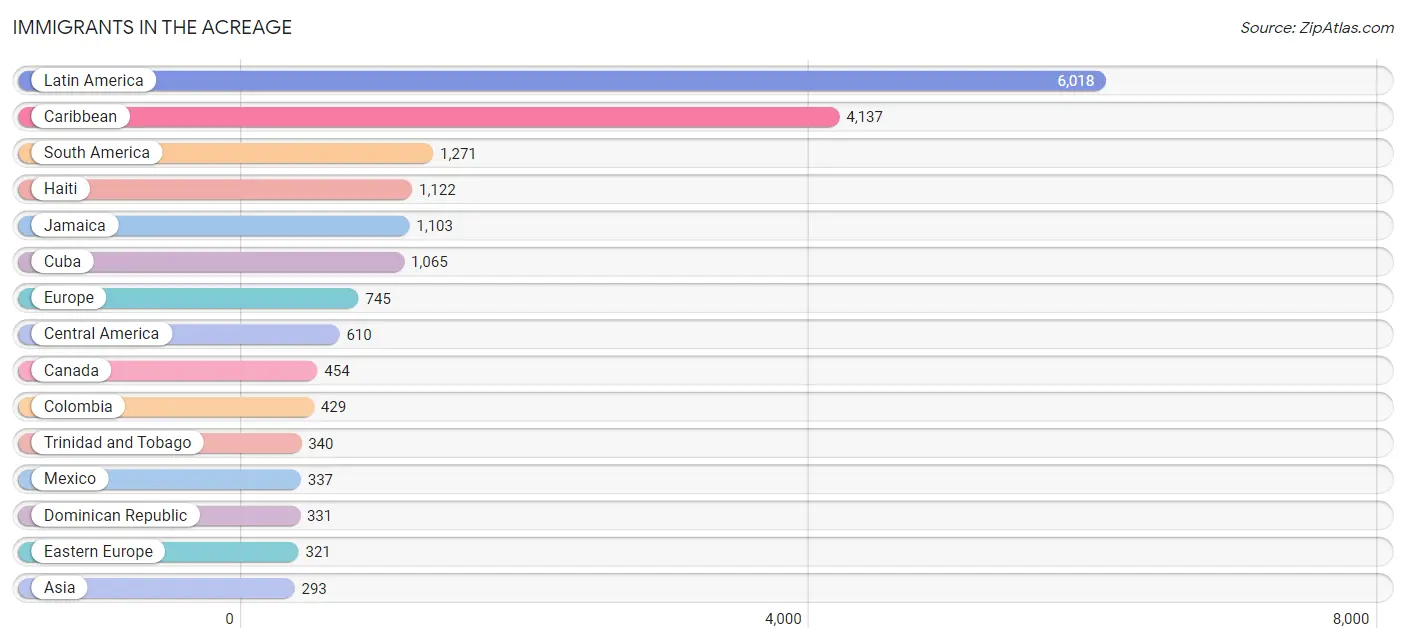
The most numerous immigrant groups reported in The Acreage came from Latin America (6,018 | 15.0%), Caribbean (4,137 | 10.3%), South America (1,271 | 3.2%), Haiti (1,122 | 2.8%), and Jamaica (1,103 | 2.8%), together accounting for 34.0% of all The Acreage residents.
| Immigration Origin | # Population | % Population |
| Africa | 202 | 0.5% |
| Argentina | 70 | 0.2% |
| Asia | 293 | 0.7% |
| Australia | 14 | 0.0% |
| Bahamas | 21 | 0.1% |
| Barbados | 8 | 0.0% |
| Brazil | 203 | 0.5% |
| Canada | 454 | 1.1% |
| Caribbean | 4,137 | 10.3% |
| Central America | 610 | 1.5% |
| Chile | 56 | 0.1% |
| China | 72 | 0.2% |
| Colombia | 429 | 1.1% |
| Costa Rica | 25 | 0.1% |
| Croatia | 10 | 0.0% |
| Cuba | 1,065 | 2.6% |
| Czechoslovakia | 39 | 0.1% |
| Dominican Republic | 331 | 0.8% |
| Eastern Africa | 17 | 0.0% |
| Eastern Asia | 86 | 0.2% |
| Eastern Europe | 321 | 0.8% |
| Ecuador | 54 | 0.1% |
| England | 63 | 0.2% |
| Europe | 745 | 1.9% |
| France | 26 | 0.1% |
| Germany | 47 | 0.1% |
| Ghana | 31 | 0.1% |
| Guatemala | 38 | 0.1% |
| Guyana | 76 | 0.2% |
| Haiti | 1,122 | 2.8% |
| Honduras | 141 | 0.4% |
| India | 21 | 0.1% |
| Iran | 10 | 0.0% |
| Ireland | 5 | 0.0% |
| Italy | 10 | 0.0% |
| Jamaica | 1,103 | 2.8% |
| Japan | 9 | 0.0% |
| Kenya | 17 | 0.0% |
| Korea | 5 | 0.0% |
| Kuwait | 8 | 0.0% |
| Laos | 40 | 0.1% |
| Latin America | 6,018 | 15.0% |
| Lebanon | 14 | 0.0% |
| Mexico | 337 | 0.8% |
| Middle Africa | 112 | 0.3% |
| Nicaragua | 69 | 0.2% |
| Northern Europe | 96 | 0.2% |
| Oceania | 14 | 0.0% |
| Pakistan | 3 | 0.0% |
| Peru | 105 | 0.3% |
| Philippines | 18 | 0.0% |
| Poland | 58 | 0.1% |
| Portugal | 143 | 0.4% |
| Romania | 102 | 0.3% |
| Russia | 87 | 0.2% |
| South Africa | 42 | 0.1% |
| South America | 1,271 | 3.2% |
| South Central Asia | 34 | 0.1% |
| South Eastern Asia | 146 | 0.4% |
| Southern Europe | 255 | 0.6% |
| Spain | 102 | 0.3% |
| St. Vincent and the Grenadines | 134 | 0.3% |
| Taiwan | 9 | 0.0% |
| Trinidad and Tobago | 340 | 0.9% |
| Ukraine | 25 | 0.1% |
| Uruguay | 34 | 0.1% |
| Venezuela | 210 | 0.5% |
| Vietnam | 88 | 0.2% |
| Western Africa | 31 | 0.1% |
| Western Asia | 27 | 0.1% |
| Western Europe | 73 | 0.2% | View All 71 Rows |
Sex and Age in The Acreage
Sex and Age in The Acreage
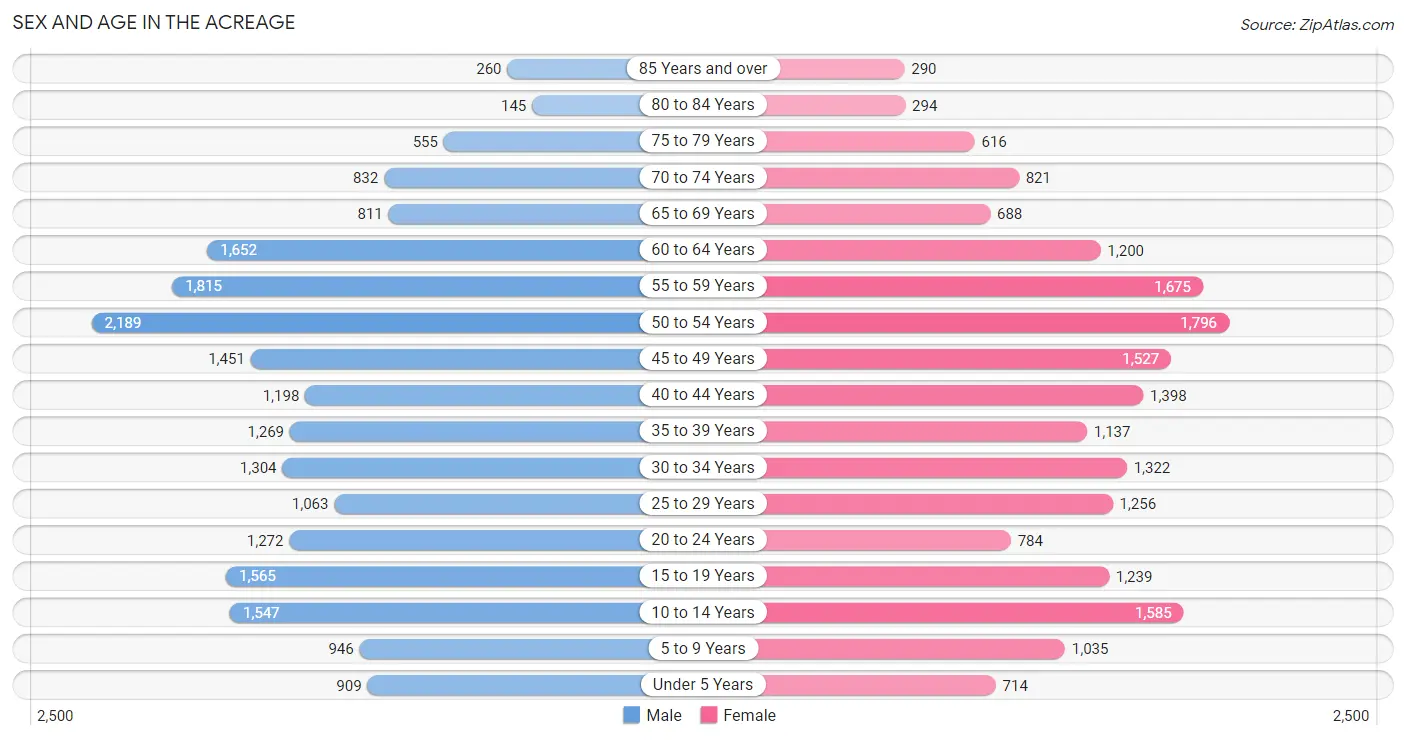
The most populous age groups in The Acreage are 50 to 54 Years (2,189 | 10.5%) for men and 50 to 54 Years (1,796 | 9.3%) for women.
| Age Bracket | Male | Female |
| Under 5 Years | 909 (4.4%) | 714 (3.7%) |
| 5 to 9 Years | 946 (4.5%) | 1,035 (5.3%) |
| 10 to 14 Years | 1,547 (7.4%) | 1,585 (8.2%) |
| 15 to 19 Years | 1,565 (7.5%) | 1,239 (6.4%) |
| 20 to 24 Years | 1,272 (6.1%) | 784 (4.1%) |
| 25 to 29 Years | 1,063 (5.1%) | 1,256 (6.5%) |
| 30 to 34 Years | 1,304 (6.3%) | 1,322 (6.8%) |
| 35 to 39 Years | 1,269 (6.1%) | 1,137 (5.9%) |
| 40 to 44 Years | 1,198 (5.8%) | 1,398 (7.2%) |
| 45 to 49 Years | 1,451 (7.0%) | 1,527 (7.9%) |
| 50 to 54 Years | 2,189 (10.5%) | 1,796 (9.3%) |
| 55 to 59 Years | 1,815 (8.7%) | 1,675 (8.6%) |
| 60 to 64 Years | 1,652 (8.0%) | 1,200 (6.2%) |
| 65 to 69 Years | 811 (3.9%) | 688 (3.5%) |
| 70 to 74 Years | 832 (4.0%) | 821 (4.2%) |
| 75 to 79 Years | 555 (2.7%) | 616 (3.2%) |
| 80 to 84 Years | 145 (0.7%) | 294 (1.5%) |
| 85 Years and over | 260 (1.3%) | 290 (1.5%) |
| Total | 20,783 (100.0%) | 19,377 (100.0%) |
Families and Households in The Acreage
Median Family Size in The Acreage
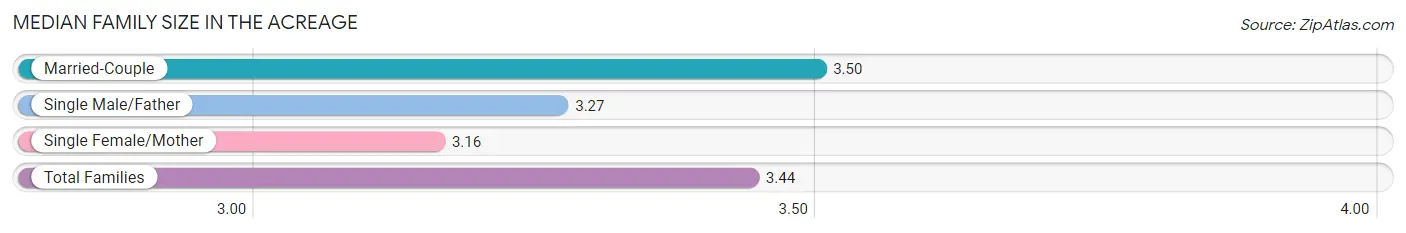
The median family size in The Acreage is 3.44 persons per family, with married-couple families (8,366 | 81.2%) accounting for the largest median family size of 3.5 persons per family. On the other hand, single female/mother families (1,143 | 11.1%) represent the smallest median family size with 3.16 persons per family.
| Family Type | # Families | Family Size |
| Married-Couple | 8,366 (81.2%) | 3.50 |
| Single Male/Father | 790 (7.7%) | 3.27 |
| Single Female/Mother | 1,143 (11.1%) | 3.16 |
| Total Families | 10,299 (100.0%) | 3.44 |
Median Household Size in The Acreage
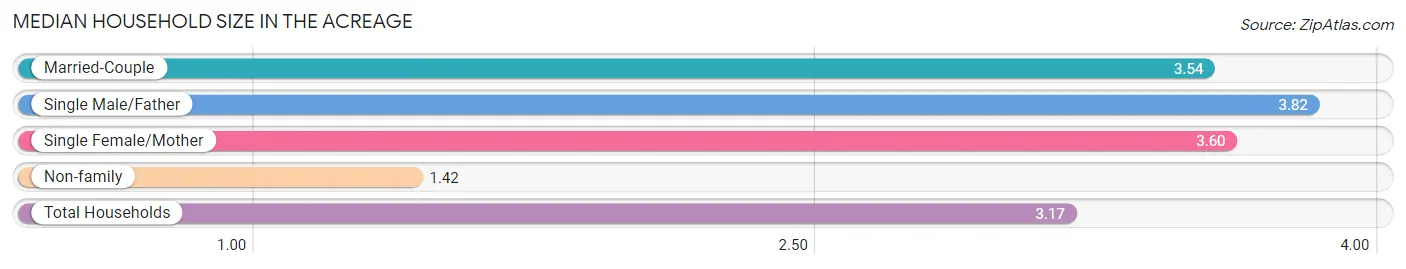
The median household size in The Acreage is 3.17 persons per household, with single male/father households (790 | 6.2%) accounting for the largest median household size of 3.82 persons per household. non-family households (2,332 | 18.5%) represent the smallest median household size with 1.42 persons per household.
| Household Type | # Households | Household Size |
| Married-Couple | 8,366 (66.2%) | 3.54 |
| Single Male/Father | 790 (6.2%) | 3.82 |
| Single Female/Mother | 1,143 (9.0%) | 3.60 |
| Non-family | 2,332 (18.5%) | 1.42 |
| Total Households | 12,631 (100.0%) | 3.17 |
Household Size by Marriage Status in The Acreage
Out of a total of 12,631 households in The Acreage, 10,299 (81.5%) are family households, while 2,332 (18.5%) are nonfamily households. The most numerous type of family households are 2-person households, comprising 3,627, and the most common type of nonfamily households are 1-person households, comprising 1,590.
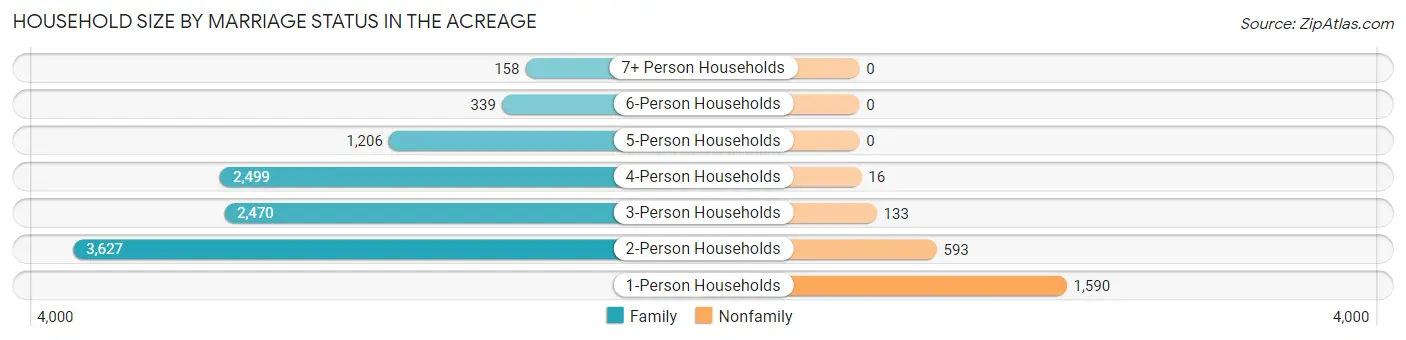
| Household Size | Family Households | Nonfamily Households |
| 1-Person Households | - | 1,590 (12.6%) |
| 2-Person Households | 3,627 (28.7%) | 593 (4.7%) |
| 3-Person Households | 2,470 (19.6%) | 133 (1.1%) |
| 4-Person Households | 2,499 (19.8%) | 16 (0.1%) |
| 5-Person Households | 1,206 (9.6%) | 0 (0.0%) |
| 6-Person Households | 339 (2.7%) | 0 (0.0%) |
| 7+ Person Households | 158 (1.3%) | 0 (0.0%) |
| Total | 10,299 (81.5%) | 2,332 (18.5%) |
Female Fertility in The Acreage
Fertility by Age in The Acreage
Average fertility rate in The Acreage is 57.0 births per 1,000 women. Women in the age bracket of 20 to 34 years have the highest fertility rate with 123.0 births per 1,000 women. Women in the age bracket of 20 to 34 years acount for 80.0% of all women with births.
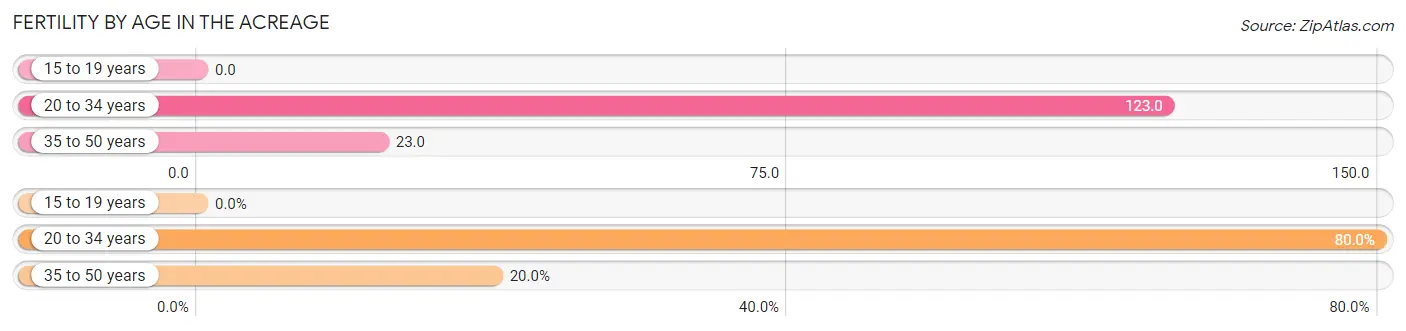
| Age Bracket | Women with Births | Births / 1,000 Women |
| 15 to 19 years | 0 (0.0%) | 0.0 |
| 20 to 34 years | 412 (80.0%) | 123.0 |
| 35 to 50 years | 103 (20.0%) | 23.0 |
| Total | 515 (100.0%) | 57.0 |
Fertility by Age by Marriage Status in The Acreage
95.7% of women with births (515) in The Acreage are married. The highest percentage of unmarried women with births falls into 20 to 34 years age bracket with 5.3% of them unmarried at the time of birth, while the lowest percentage of unmarried women with births belong to 35 to 50 years age bracket with 0.0% of them unmarried.
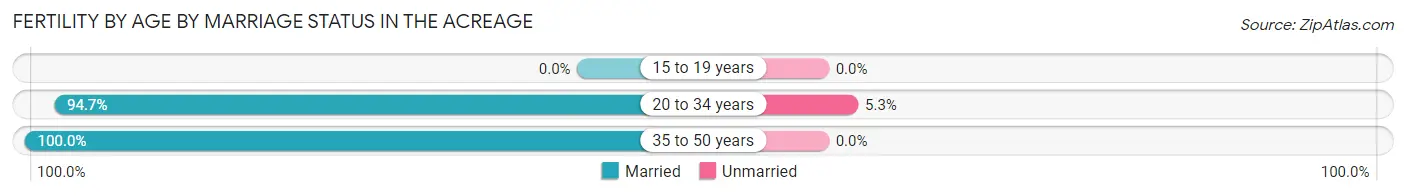
| Age Bracket | Married | Unmarried |
| 15 to 19 years | 0 (0.0%) | 0 (0.0%) |
| 20 to 34 years | 390 (94.7%) | 22 (5.3%) |
| 35 to 50 years | 103 (100.0%) | 0 (0.0%) |
| Total | 493 (95.7%) | 22 (4.3%) |
Fertility by Education in The Acreage
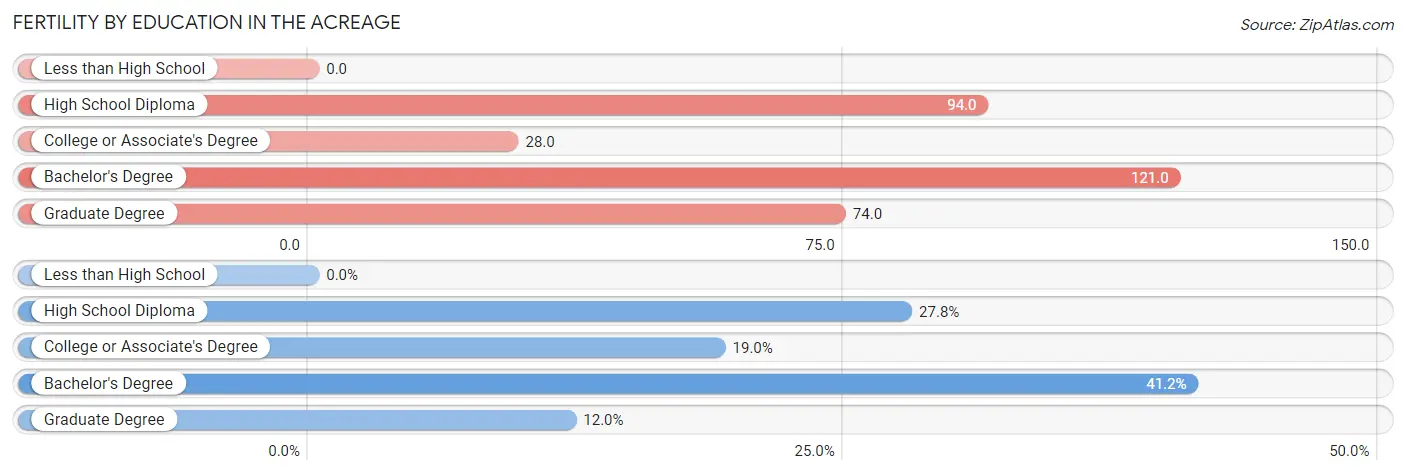
| Educational Attainment | Women with Births | Births / 1,000 Women |
| Less than High School | 0 (0.0%) | 0.0 |
| High School Diploma | 143 (27.8%) | 94.0 |
| College or Associate's Degree | 98 (19.0%) | 28.0 |
| Bachelor's Degree | 212 (41.2%) | 121.0 |
| Graduate Degree | 62 (12.0%) | 74.0 |
| Total | 515 (100.0%) | 57.0 |
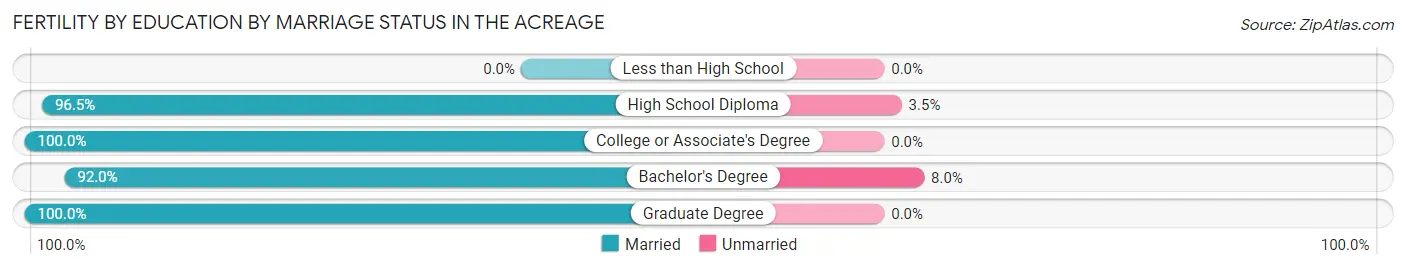
Fertility by Education by Marriage Status in The Acreage
4.3% of women with births in The Acreage are unmarried. Women with the educational attainment of college or associate's degree are most likely to be married with 100.0% of them married at childbirth, while women with the educational attainment of bachelor's degree are least likely to be married with 8.0% of them unmarried at childbirth.
| Educational Attainment | Married | Unmarried |
| Less than High School | 0 (0.0%) | 0 (0.0%) |
| High School Diploma | 138 (96.5%) | 5 (3.5%) |
| College or Associate's Degree | 98 (100.0%) | 0 (0.0%) |
| Bachelor's Degree | 195 (92.0%) | 17 (8.0%) |
| Graduate Degree | 62 (100.0%) | 0 (0.0%) |
| Total | 493 (95.7%) | 22 (4.3%) |
Employment Characteristics in The Acreage
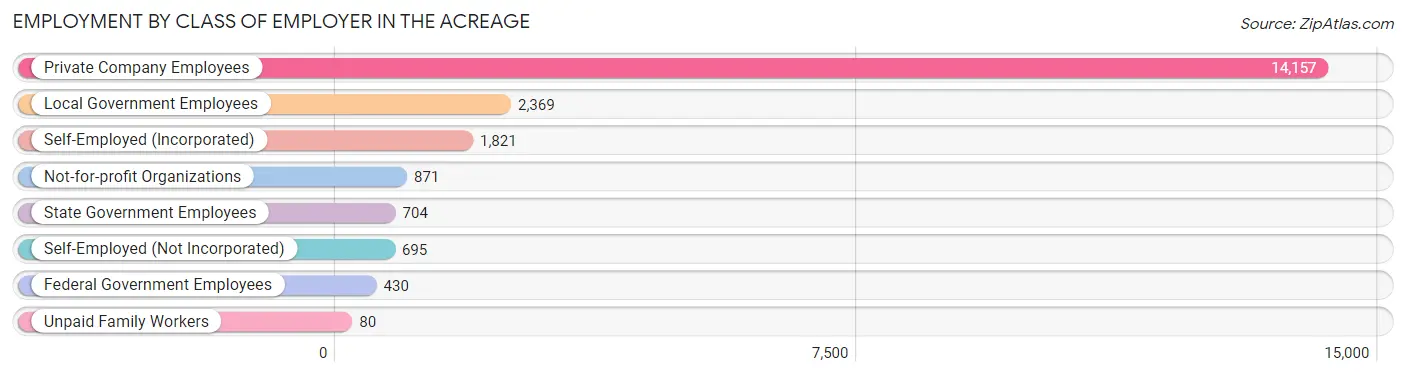
Employment by Class of Employer in The Acreage
Among the 21,127 employed individuals in The Acreage, private company employees (14,157 | 67.0%), local government employees (2,369 | 11.2%), and self-employed (incorporated) (1,821 | 8.6%) make up the most common classes of employment.
| Employer Class | # Employees | % Employees |
| Private Company Employees | 14,157 | 67.0% |
| Self-Employed (Incorporated) | 1,821 | 8.6% |
| Self-Employed (Not Incorporated) | 695 | 3.3% |
| Not-for-profit Organizations | 871 | 4.1% |
| Local Government Employees | 2,369 | 11.2% |
| State Government Employees | 704 | 3.3% |
| Federal Government Employees | 430 | 2.0% |
| Unpaid Family Workers | 80 | 0.4% |
| Total | 21,127 | 100.0% |
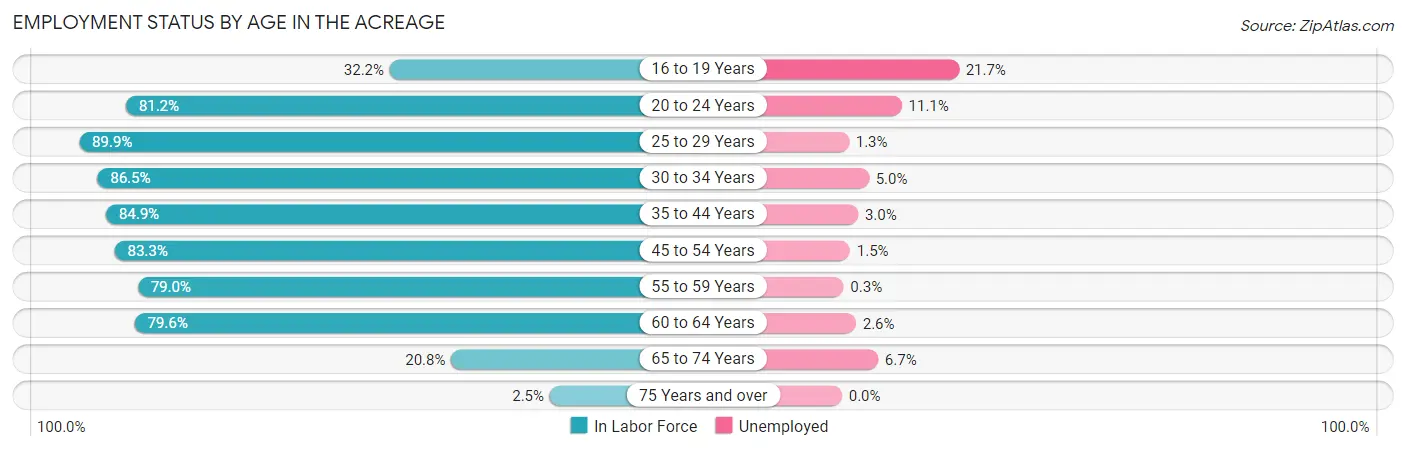
Employment Status by Age in The Acreage
According to the labor force statistics for The Acreage, out of the total population over 16 years of age (32,621), 68.8% or 22,443 individuals are in the labor force, with 3.5% or 786 of them unemployed. The age group with the highest labor force participation rate is 25 to 29 years, with 89.9% or 2,085 individuals in the labor force. Within the labor force, the 16 to 19 years age range has the highest percentage of unemployed individuals, with 21.7% or 140 of them being unemployed.
| Age Bracket | In Labor Force | Unemployed |
| 16 to 19 Years | 644 (32.2%) | 140 (21.7%) |
| 20 to 24 Years | 1,669 (81.2%) | 185 (11.1%) |
| 25 to 29 Years | 2,085 (89.9%) | 27 (1.3%) |
| 30 to 34 Years | 2,271 (86.5%) | 114 (5.0%) |
| 35 to 44 Years | 4,247 (84.9%) | 127 (3.0%) |
| 45 to 54 Years | 5,800 (83.3%) | 87 (1.5%) |
| 55 to 59 Years | 2,757 (79.0%) | 8 (0.3%) |
| 60 to 64 Years | 2,270 (79.6%) | 59 (2.6%) |
| 65 to 74 Years | 656 (20.8%) | 44 (6.7%) |
| 75 Years and over | 54 (2.5%) | 0 (0.0%) |
| Total | 22,443 (68.8%) | 786 (3.5%) |
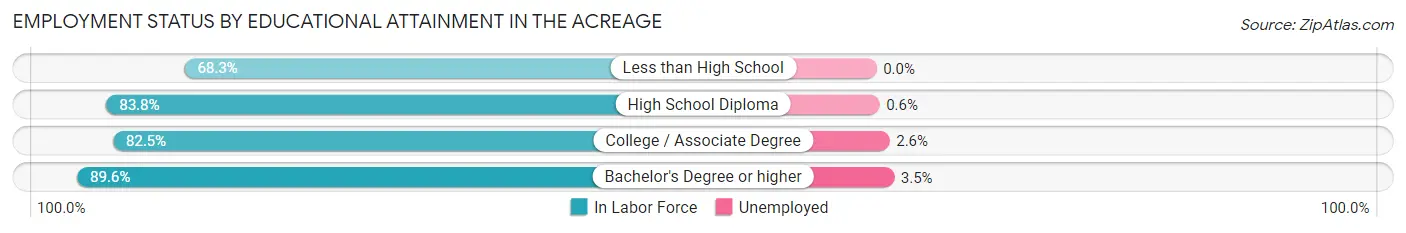
Employment Status by Educational Attainment in The Acreage
According to labor force statistics for The Acreage, 83.6% of individuals (19,439) out of the total population between 25 and 64 years of age (23,252) are in the labor force, with 2.2% or 428 of them being unemployed. The group with the highest labor force participation rate are those with the educational attainment of bachelor's degree or higher, with 89.6% or 5,805 individuals in the labor force. Within the labor force, individuals with bachelor's degree or higher education have the highest percentage of unemployment, with 3.5% or 203 of them being unemployed.
| Educational Attainment | In Labor Force | Unemployed |
| Less than High School | 1,376 (68.3%) | 0 (0.0%) |
| High School Diploma | 5,104 (83.8%) | 37 (0.6%) |
| College / Associate Degree | 7,150 (82.5%) | 225 (2.6%) |
| Bachelor's Degree or higher | 5,805 (89.6%) | 227 (3.5%) |
| Total | 19,439 (83.6%) | 512 (2.2%) |
Employment Occupations by Sex in The Acreage
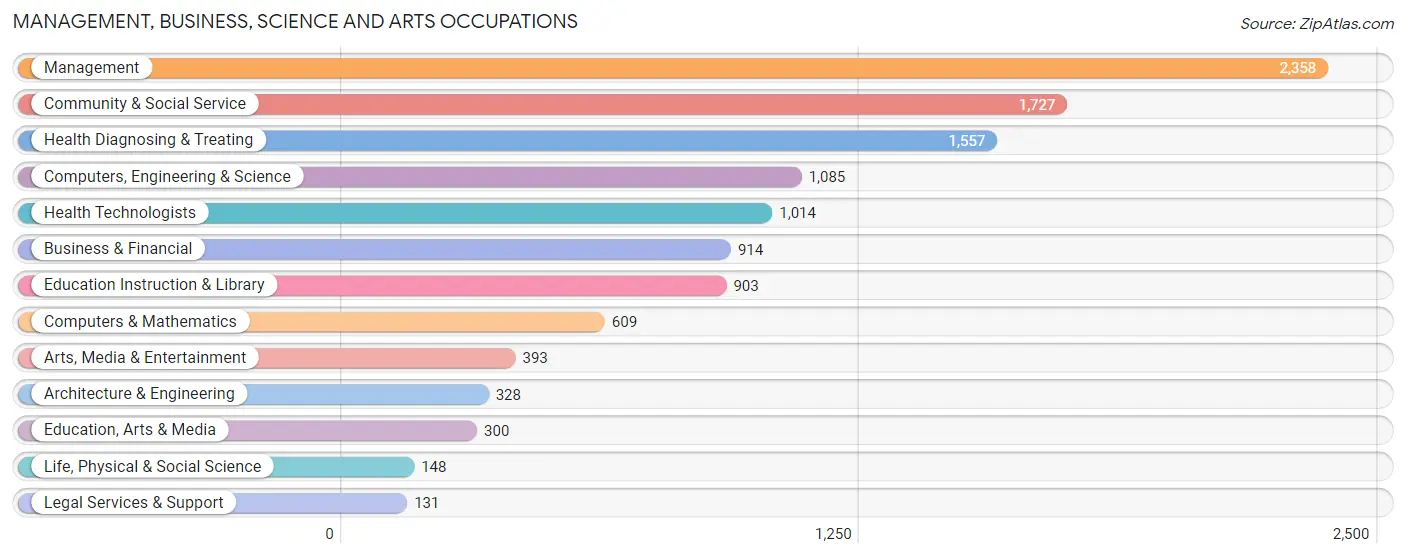
Management, Business, Science and Arts Occupations
The most common Management, Business, Science and Arts occupations in The Acreage are Management (2,358 | 10.9%), Community & Social Service (1,727 | 8.0%), Health Diagnosing & Treating (1,557 | 7.2%), Computers, Engineering & Science (1,085 | 5.0%), and Health Technologists (1,014 | 4.7%).
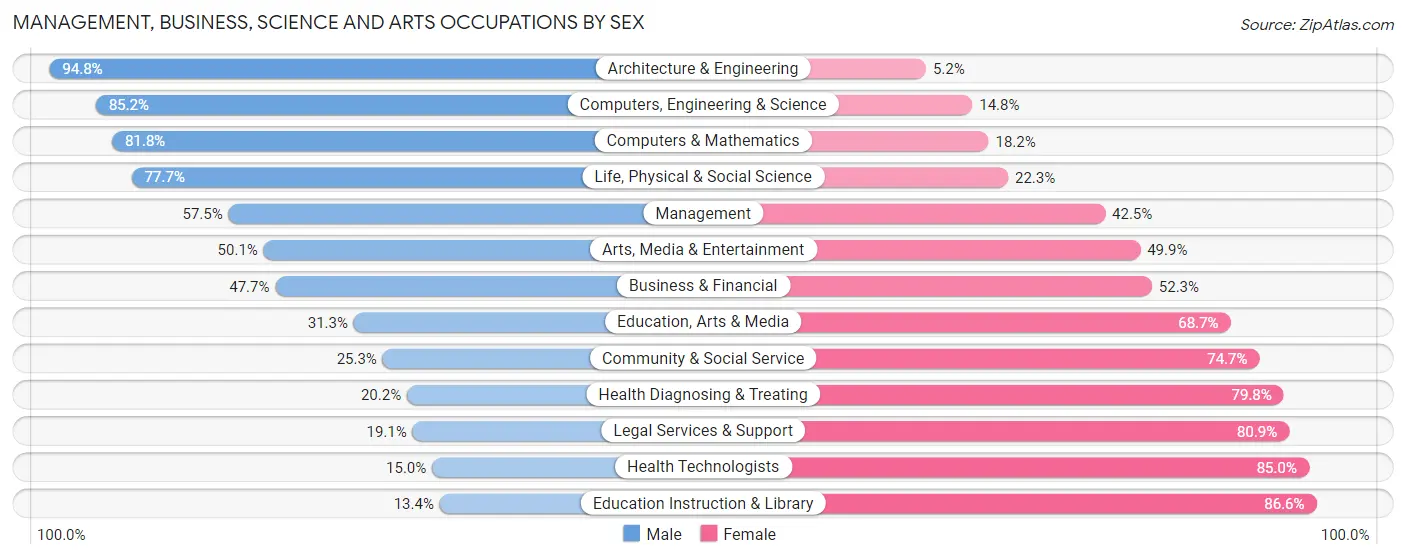
Management, Business, Science and Arts Occupations by Sex
Within the Management, Business, Science and Arts occupations in The Acreage, the most male-oriented occupations are Architecture & Engineering (94.8%), Computers, Engineering & Science (85.2%), and Computers & Mathematics (81.8%), while the most female-oriented occupations are Education Instruction & Library (86.6%), Health Technologists (85.0%), and Legal Services & Support (80.9%).
| Occupation | Male | Female |
| Management | 1,355 (57.5%) | 1,003 (42.5%) |
| Business & Financial | 436 (47.7%) | 478 (52.3%) |
| Computers, Engineering & Science | 924 (85.2%) | 161 (14.8%) |
| Computers & Mathematics | 498 (81.8%) | 111 (18.2%) |
| Architecture & Engineering | 311 (94.8%) | 17 (5.2%) |
| Life, Physical & Social Science | 115 (77.7%) | 33 (22.3%) |
| Community & Social Service | 437 (25.3%) | 1,290 (74.7%) |
| Education, Arts & Media | 94 (31.3%) | 206 (68.7%) |
| Legal Services & Support | 25 (19.1%) | 106 (80.9%) |
| Education Instruction & Library | 121 (13.4%) | 782 (86.6%) |
| Arts, Media & Entertainment | 197 (50.1%) | 196 (49.9%) |
| Health Diagnosing & Treating | 315 (20.2%) | 1,242 (79.8%) |
| Health Technologists | 152 (15.0%) | 862 (85.0%) |
| Total (Category) | 3,467 (45.4%) | 4,174 (54.6%) |
| Total (Overall) | 11,877 (54.8%) | 9,788 (45.2%) |
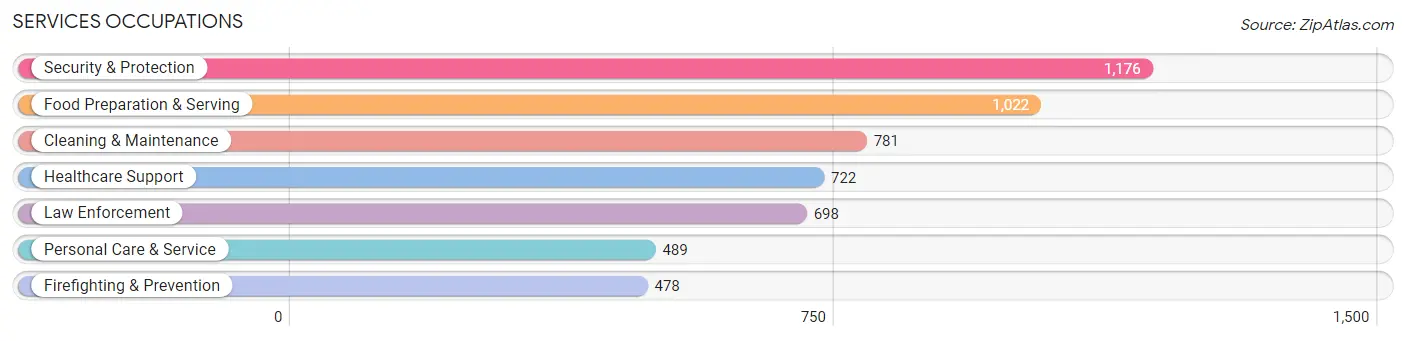
Services Occupations
The most common Services occupations in The Acreage are Security & Protection (1,176 | 5.4%), Food Preparation & Serving (1,022 | 4.7%), Cleaning & Maintenance (781 | 3.6%), Healthcare Support (722 | 3.3%), and Law Enforcement (698 | 3.2%).
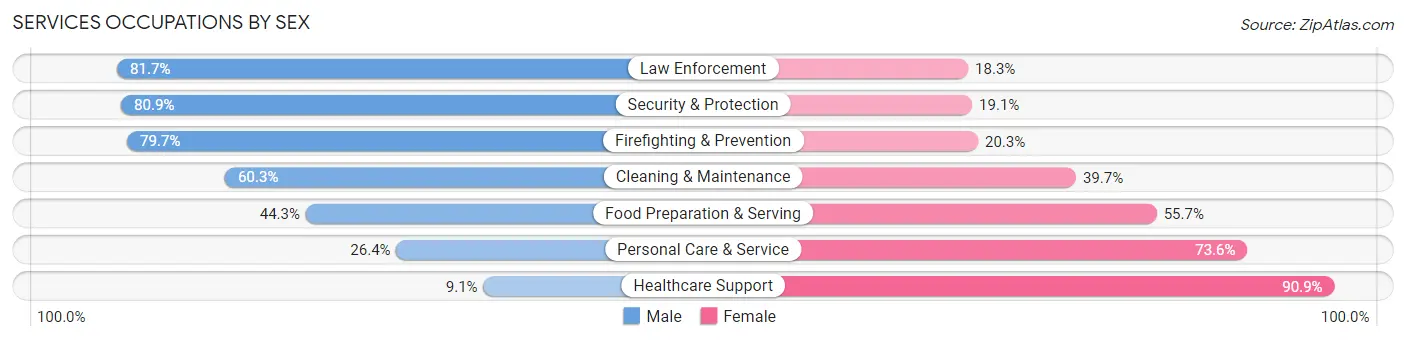
Services Occupations by Sex
Within the Services occupations in The Acreage, the most male-oriented occupations are Law Enforcement (81.7%), Security & Protection (80.9%), and Firefighting & Prevention (79.7%), while the most female-oriented occupations are Healthcare Support (90.9%), Personal Care & Service (73.6%), and Food Preparation & Serving (55.7%).
| Occupation | Male | Female |
| Healthcare Support | 66 (9.1%) | 656 (90.9%) |
| Security & Protection | 951 (80.9%) | 225 (19.1%) |
| Firefighting & Prevention | 381 (79.7%) | 97 (20.3%) |
| Law Enforcement | 570 (81.7%) | 128 (18.3%) |
| Food Preparation & Serving | 453 (44.3%) | 569 (55.7%) |
| Cleaning & Maintenance | 471 (60.3%) | 310 (39.7%) |
| Personal Care & Service | 129 (26.4%) | 360 (73.6%) |
| Total (Category) | 2,070 (49.4%) | 2,120 (50.6%) |
| Total (Overall) | 11,877 (54.8%) | 9,788 (45.2%) |
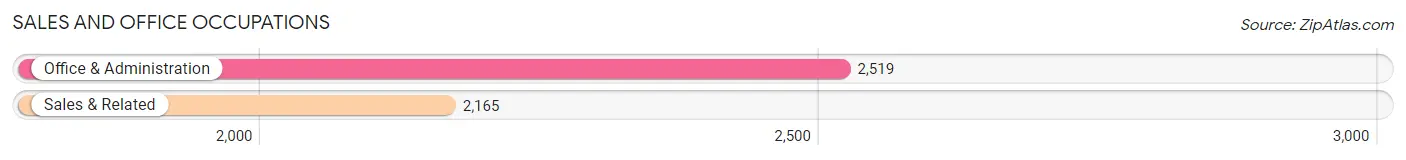
Sales and Office Occupations
The most common Sales and Office occupations in The Acreage are Office & Administration (2,519 | 11.6%), and Sales & Related (2,165 | 10.0%).
Sales and Office Occupations by Sex
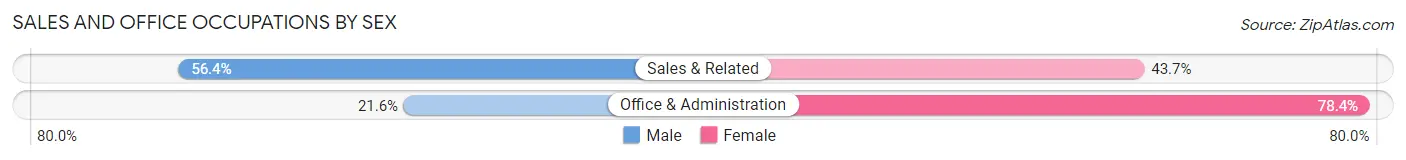
| Occupation | Male | Female |
| Sales & Related | 1,220 (56.4%) | 945 (43.6%) |
| Office & Administration | 545 (21.6%) | 1,974 (78.4%) |
| Total (Category) | 1,765 (37.7%) | 2,919 (62.3%) |
| Total (Overall) | 11,877 (54.8%) | 9,788 (45.2%) |
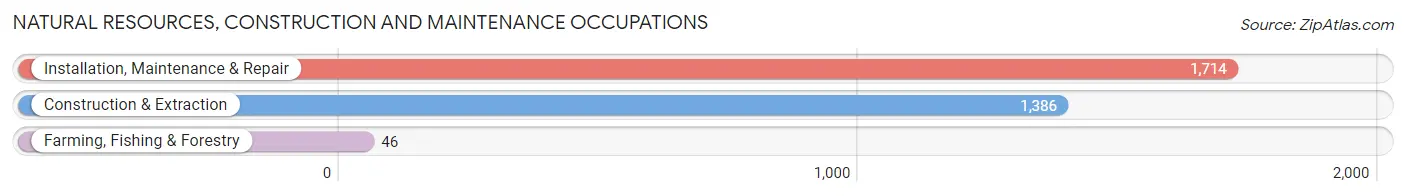
Natural Resources, Construction and Maintenance Occupations
The most common Natural Resources, Construction and Maintenance occupations in The Acreage are Installation, Maintenance & Repair (1,714 | 7.9%), Construction & Extraction (1,386 | 6.4%), and Farming, Fishing & Forestry (46 | 0.2%).
Natural Resources, Construction and Maintenance Occupations by Sex
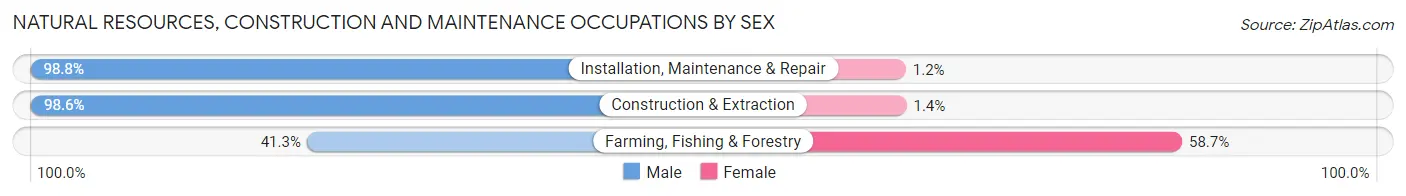
| Occupation | Male | Female |
| Farming, Fishing & Forestry | 19 (41.3%) | 27 (58.7%) |
| Construction & Extraction | 1,367 (98.6%) | 19 (1.4%) |
| Installation, Maintenance & Repair | 1,693 (98.8%) | 21 (1.2%) |
| Total (Category) | 3,079 (97.9%) | 67 (2.1%) |
| Total (Overall) | 11,877 (54.8%) | 9,788 (45.2%) |
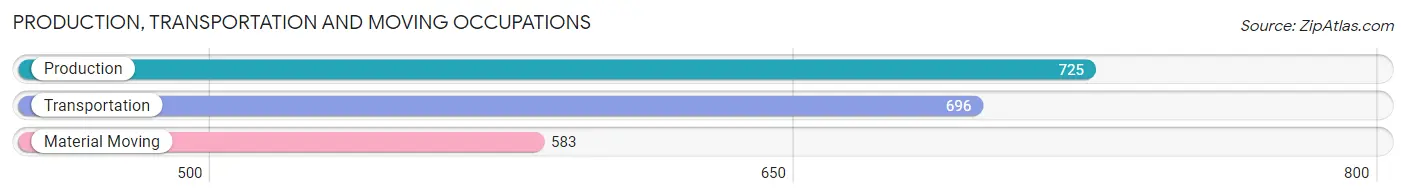
Production, Transportation and Moving Occupations
The most common Production, Transportation and Moving occupations in The Acreage are Production (725 | 3.4%), Transportation (696 | 3.2%), and Material Moving (583 | 2.7%).
Production, Transportation and Moving Occupations by Sex
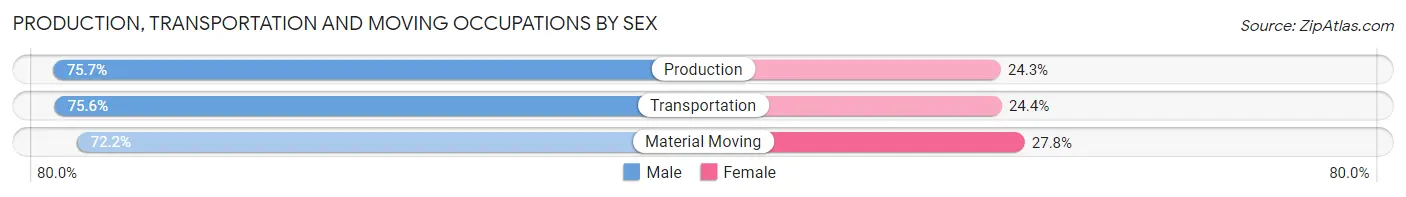
| Occupation | Male | Female |
| Production | 549 (75.7%) | 176 (24.3%) |
| Transportation | 526 (75.6%) | 170 (24.4%) |
| Material Moving | 421 (72.2%) | 162 (27.8%) |
| Total (Category) | 1,496 (74.7%) | 508 (25.4%) |
| Total (Overall) | 11,877 (54.8%) | 9,788 (45.2%) |
Employment Industries by Sex in The Acreage
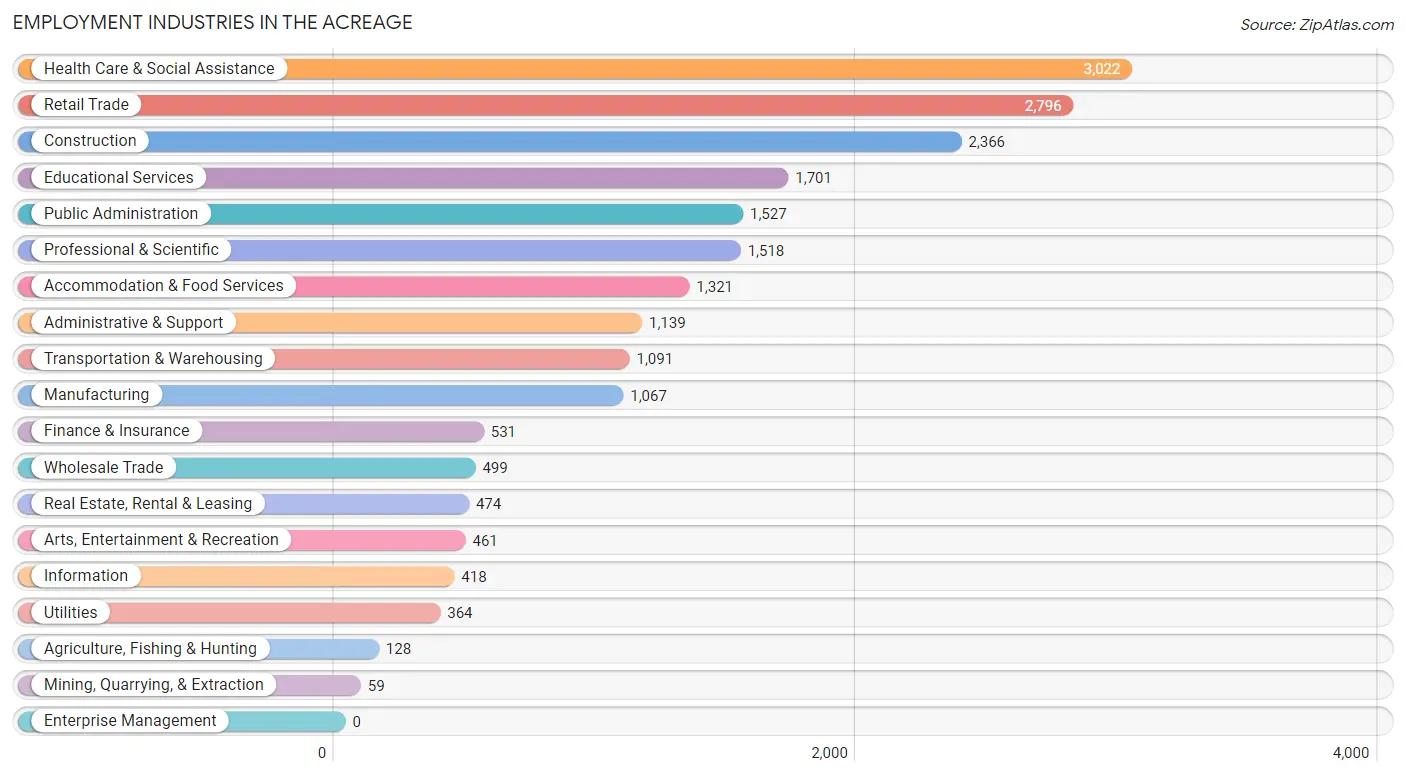
Employment Industries in The Acreage
The major employment industries in The Acreage include Health Care & Social Assistance (3,022 | 14.0%), Retail Trade (2,796 | 12.9%), Construction (2,366 | 10.9%), Educational Services (1,701 | 7.9%), and Public Administration (1,527 | 7.0%).
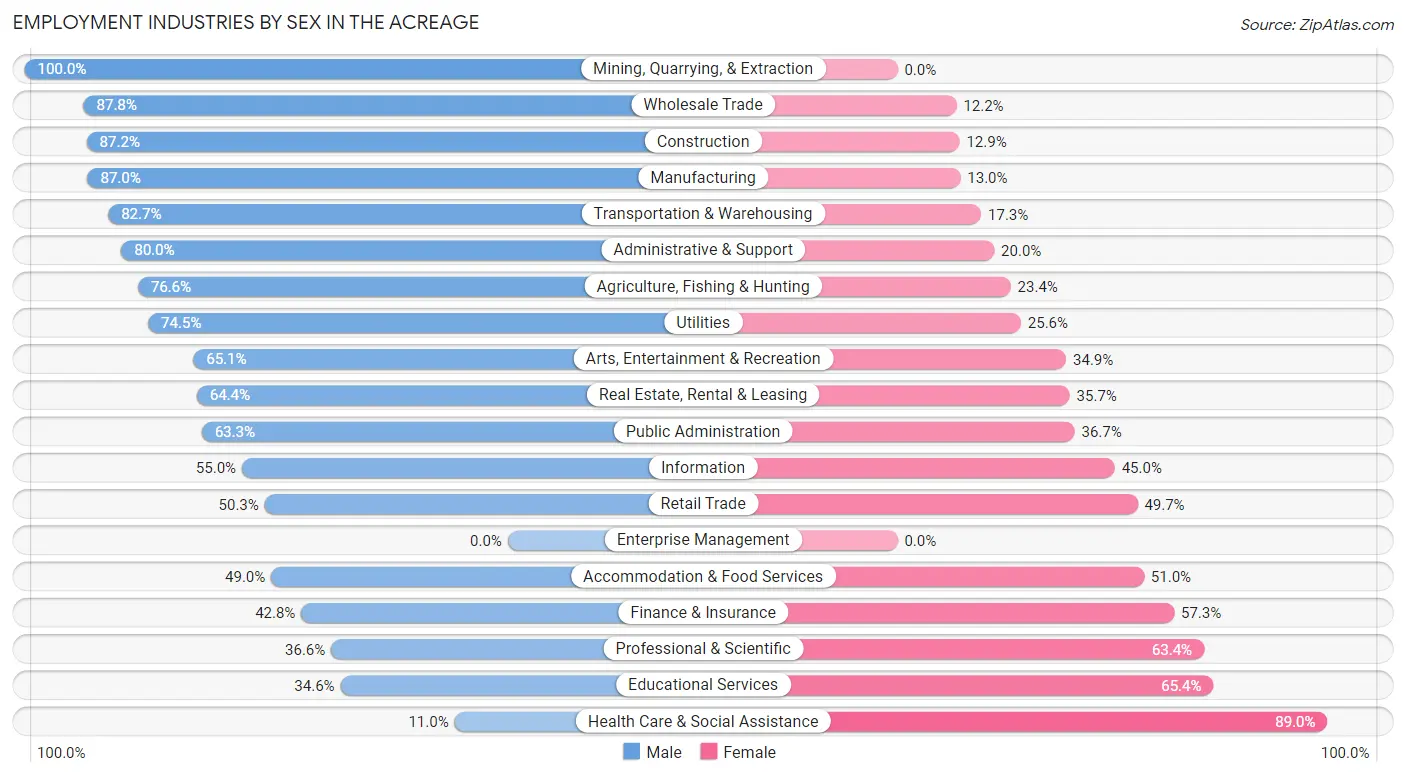
Employment Industries by Sex in The Acreage
The The Acreage industries that see more men than women are Mining, Quarrying, & Extraction (100.0%), Wholesale Trade (87.8%), and Construction (87.2%), whereas the industries that tend to have a higher number of women are Health Care & Social Assistance (89.0%), Educational Services (65.4%), and Professional & Scientific (63.4%).
| Industry | Male | Female |
| Agriculture, Fishing & Hunting | 98 (76.6%) | 30 (23.4%) |
| Mining, Quarrying, & Extraction | 59 (100.0%) | 0 (0.0%) |
| Construction | 2,062 (87.2%) | 304 (12.9%) |
| Manufacturing | 928 (87.0%) | 139 (13.0%) |
| Wholesale Trade | 438 (87.8%) | 61 (12.2%) |
| Retail Trade | 1,407 (50.3%) | 1,389 (49.7%) |
| Transportation & Warehousing | 902 (82.7%) | 189 (17.3%) |
| Utilities | 271 (74.5%) | 93 (25.6%) |
| Information | 230 (55.0%) | 188 (45.0%) |
| Finance & Insurance | 227 (42.7%) | 304 (57.3%) |
| Real Estate, Rental & Leasing | 305 (64.3%) | 169 (35.6%) |
| Professional & Scientific | 555 (36.6%) | 963 (63.4%) |
| Enterprise Management | 0 (0.0%) | 0 (0.0%) |
| Administrative & Support | 911 (80.0%) | 228 (20.0%) |
| Educational Services | 589 (34.6%) | 1,112 (65.4%) |
| Health Care & Social Assistance | 333 (11.0%) | 2,689 (89.0%) |
| Arts, Entertainment & Recreation | 300 (65.1%) | 161 (34.9%) |
| Accommodation & Food Services | 647 (49.0%) | 674 (51.0%) |
| Public Administration | 967 (63.3%) | 560 (36.7%) |
| Total | 11,877 (54.8%) | 9,788 (45.2%) |
Education in The Acreage
School Enrollment in The Acreage
The most common levels of schooling among the 10,194 students in The Acreage are high school (2,835 | 27.8%), middle school (2,384 | 23.4%), and college / undergraduate (2,030 | 19.9%).
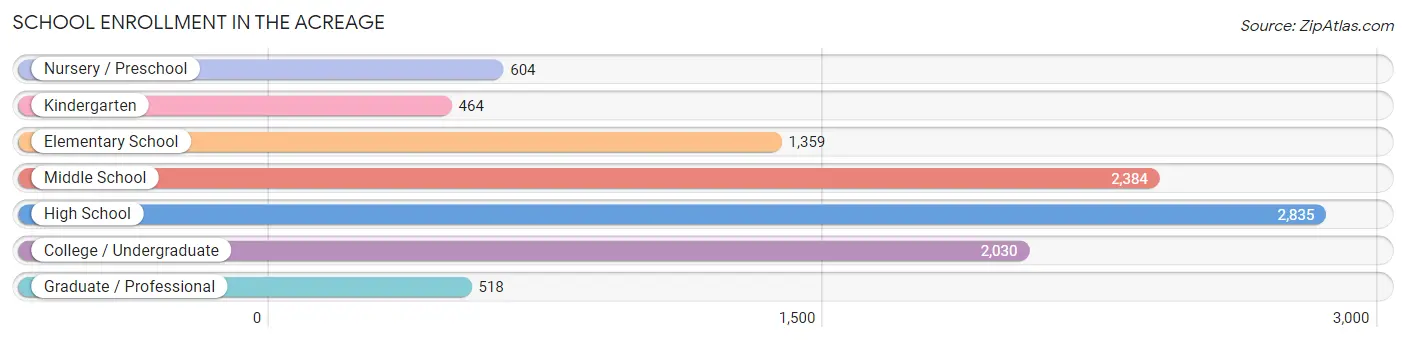
| School Level | # Students | % Students |
| Nursery / Preschool | 604 | 5.9% |
| Kindergarten | 464 | 4.5% |
| Elementary School | 1,359 | 13.3% |
| Middle School | 2,384 | 23.4% |
| High School | 2,835 | 27.8% |
| College / Undergraduate | 2,030 | 19.9% |
| Graduate / Professional | 518 | 5.1% |
| Total | 10,194 | 100.0% |
School Enrollment by Age by Funding Source in The Acreage
Out of a total of 10,194 students who are enrolled in schools in The Acreage, 1,815 (17.8%) attend a private institution, while the remaining 8,379 (82.2%) are enrolled in public schools. The age group of 35 years and over has the highest likelihood of being enrolled in private schools, with 364 (45.2% in the age bracket) enrolled. Conversely, the age group of 15 to 17 year olds has the lowest likelihood of being enrolled in a private school, with 1,854 (94.5% in the age bracket) attending a public institution.
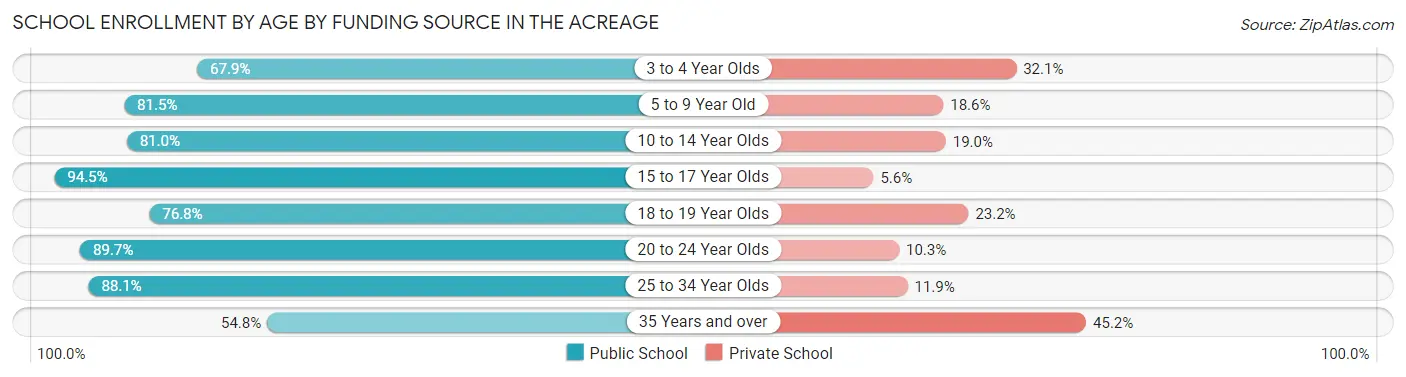
| Age Bracket | Public School | Private School |
| 3 to 4 Year Olds | 190 (67.9%) | 90 (32.1%) |
| 5 to 9 Year Old | 1,506 (81.5%) | 343 (18.5%) |
| 10 to 14 Year Olds | 2,528 (81.0%) | 594 (19.0%) |
| 15 to 17 Year Olds | 1,854 (94.5%) | 109 (5.6%) |
| 18 to 19 Year Olds | 502 (76.8%) | 152 (23.2%) |
| 20 to 24 Year Olds | 843 (89.7%) | 97 (10.3%) |
| 25 to 34 Year Olds | 511 (88.1%) | 69 (11.9%) |
| 35 Years and over | 442 (54.8%) | 364 (45.2%) |
| Total | 8,379 (82.2%) | 1,815 (17.8%) |
Educational Attainment by Field of Study in The Acreage
Business (1,885 | 23.7%), science & technology (1,079 | 13.6%), education (868 | 10.9%), psychology (541 | 6.8%), and engineering (532 | 6.7%) are the most common fields of study among 7,950 individuals in The Acreage who have obtained a bachelor's degree or higher.
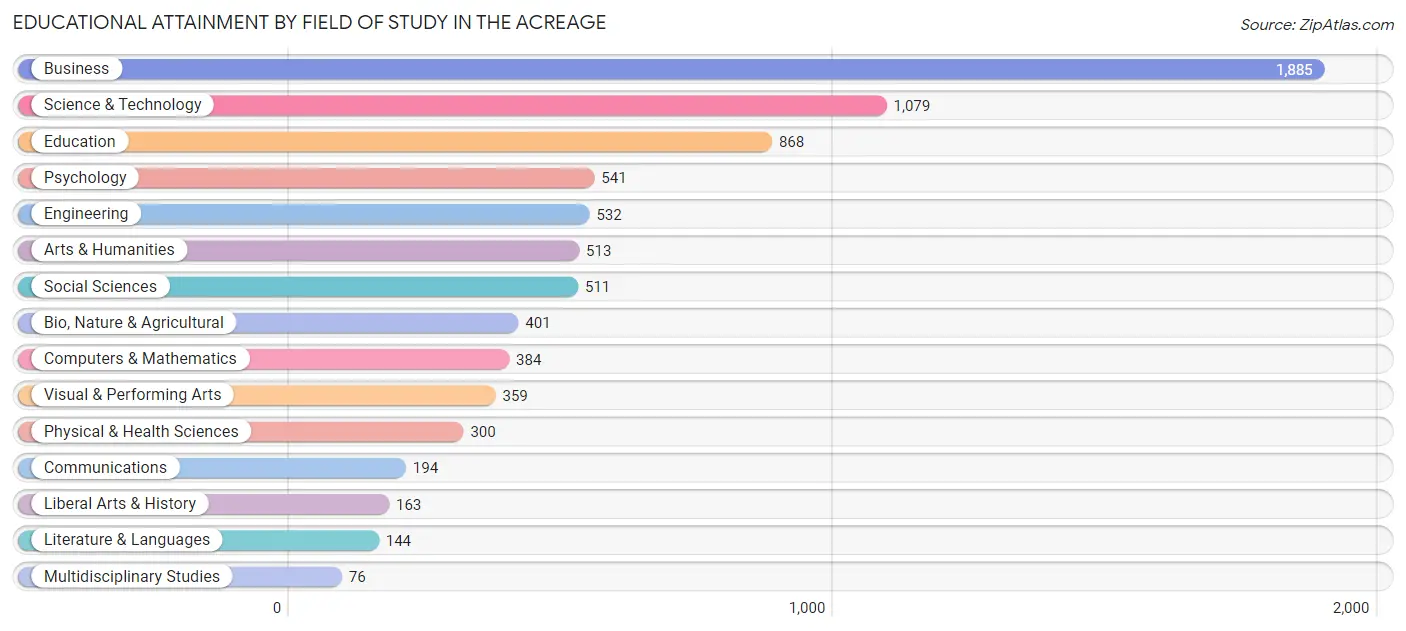
| Field of Study | # Graduates | % Graduates |
| Computers & Mathematics | 384 | 4.8% |
| Bio, Nature & Agricultural | 401 | 5.0% |
| Physical & Health Sciences | 300 | 3.8% |
| Psychology | 541 | 6.8% |
| Social Sciences | 511 | 6.4% |
| Engineering | 532 | 6.7% |
| Multidisciplinary Studies | 76 | 1.0% |
| Science & Technology | 1,079 | 13.6% |
| Business | 1,885 | 23.7% |
| Education | 868 | 10.9% |
| Literature & Languages | 144 | 1.8% |
| Liberal Arts & History | 163 | 2.1% |
| Visual & Performing Arts | 359 | 4.5% |
| Communications | 194 | 2.4% |
| Arts & Humanities | 513 | 6.5% |
| Total | 7,950 | 100.0% |
Transportation & Commute in The Acreage
Vehicle Availability by Sex in The Acreage
The most prevalent vehicle ownership categories in The Acreage are males with 2 vehicles (4,234, accounting for 36.7%) and females with 2 vehicles (3,216, making up 44.2%).
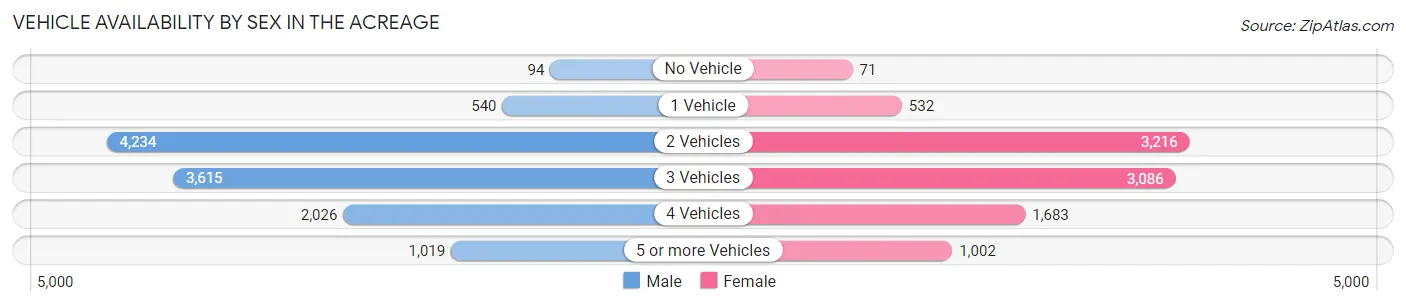
| Vehicles Available | Male | Female |
| No Vehicle | 94 (0.8%) | 71 (0.7%) |
| 1 Vehicle | 540 (4.7%) | 532 (5.6%) |
| 2 Vehicles | 4,234 (36.7%) | 3,216 (33.5%) |
| 3 Vehicles | 3,615 (31.4%) | 3,086 (32.2%) |
| 4 Vehicles | 2,026 (17.6%) | 1,683 (17.5%) |
| 5 or more Vehicles | 1,019 (8.8%) | 1,002 (10.4%) |
| Total | 11,528 (100.0%) | 9,590 (100.0%) |
Commute Time in The Acreage
The most frequently occuring commute durations in The Acreage are 30 to 34 minutes (3,796 commuters, 20.1%), 45 to 59 minutes (3,565 commuters, 18.8%), and 60 to 89 minutes (2,252 commuters, 11.9%).
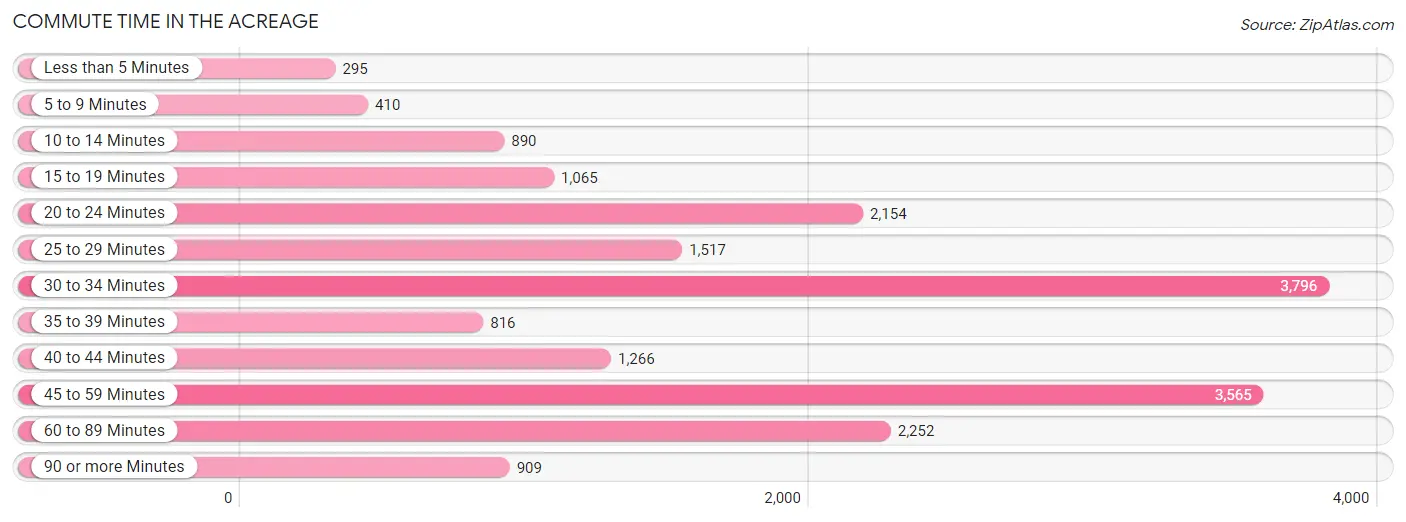
| Commute Time | # Commuters | % Commuters |
| Less than 5 Minutes | 295 | 1.6% |
| 5 to 9 Minutes | 410 | 2.2% |
| 10 to 14 Minutes | 890 | 4.7% |
| 15 to 19 Minutes | 1,065 | 5.6% |
| 20 to 24 Minutes | 2,154 | 11.4% |
| 25 to 29 Minutes | 1,517 | 8.0% |
| 30 to 34 Minutes | 3,796 | 20.1% |
| 35 to 39 Minutes | 816 | 4.3% |
| 40 to 44 Minutes | 1,266 | 6.7% |
| 45 to 59 Minutes | 3,565 | 18.8% |
| 60 to 89 Minutes | 2,252 | 11.9% |
| 90 or more Minutes | 909 | 4.8% |
Commute Time by Sex in The Acreage
The most common commute times in The Acreage are 30 to 34 minutes (2,157 commuters, 20.7%) for males and 45 to 59 minutes (1,958 commuters, 22.9%) for females.
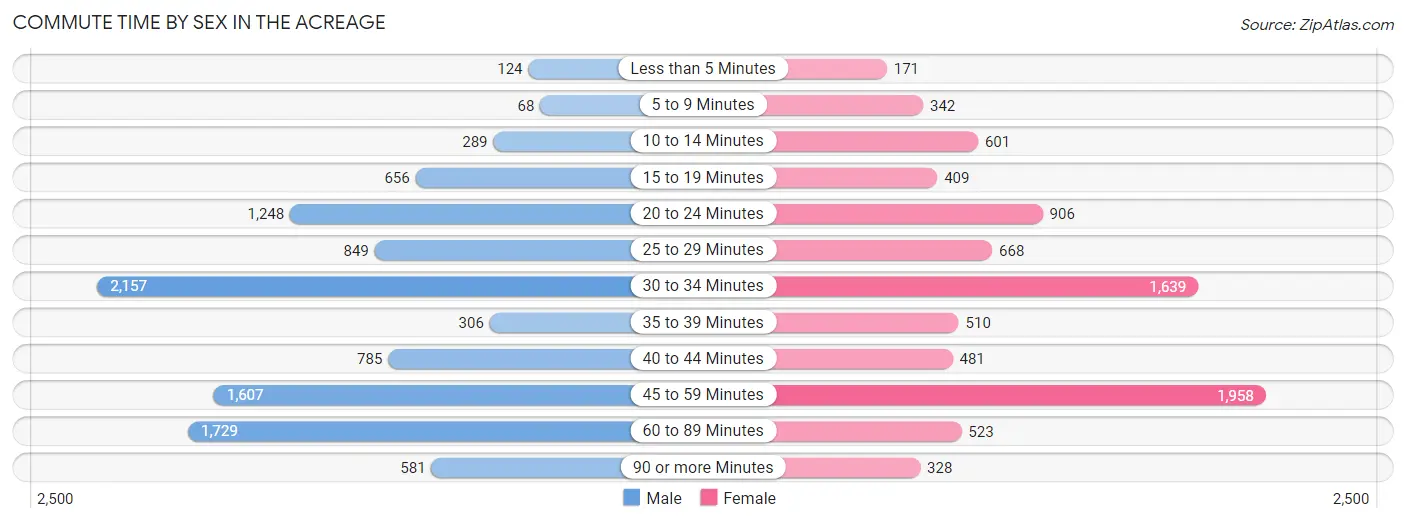
| Commute Time | Male | Female |
| Less than 5 Minutes | 124 (1.2%) | 171 (2.0%) |
| 5 to 9 Minutes | 68 (0.6%) | 342 (4.0%) |
| 10 to 14 Minutes | 289 (2.8%) | 601 (7.0%) |
| 15 to 19 Minutes | 656 (6.3%) | 409 (4.8%) |
| 20 to 24 Minutes | 1,248 (12.0%) | 906 (10.6%) |
| 25 to 29 Minutes | 849 (8.2%) | 668 (7.8%) |
| 30 to 34 Minutes | 2,157 (20.7%) | 1,639 (19.2%) |
| 35 to 39 Minutes | 306 (2.9%) | 510 (6.0%) |
| 40 to 44 Minutes | 785 (7.5%) | 481 (5.6%) |
| 45 to 59 Minutes | 1,607 (15.4%) | 1,958 (22.9%) |
| 60 to 89 Minutes | 1,729 (16.6%) | 523 (6.1%) |
| 90 or more Minutes | 581 (5.6%) | 328 (3.8%) |
Time of Departure to Work by Sex in The Acreage
The most frequent times of departure to work in The Acreage are 7:00 AM to 7:29 AM (1,684, 16.2%) for males and 7:00 AM to 7:29 AM (1,279, 15.0%) for females.
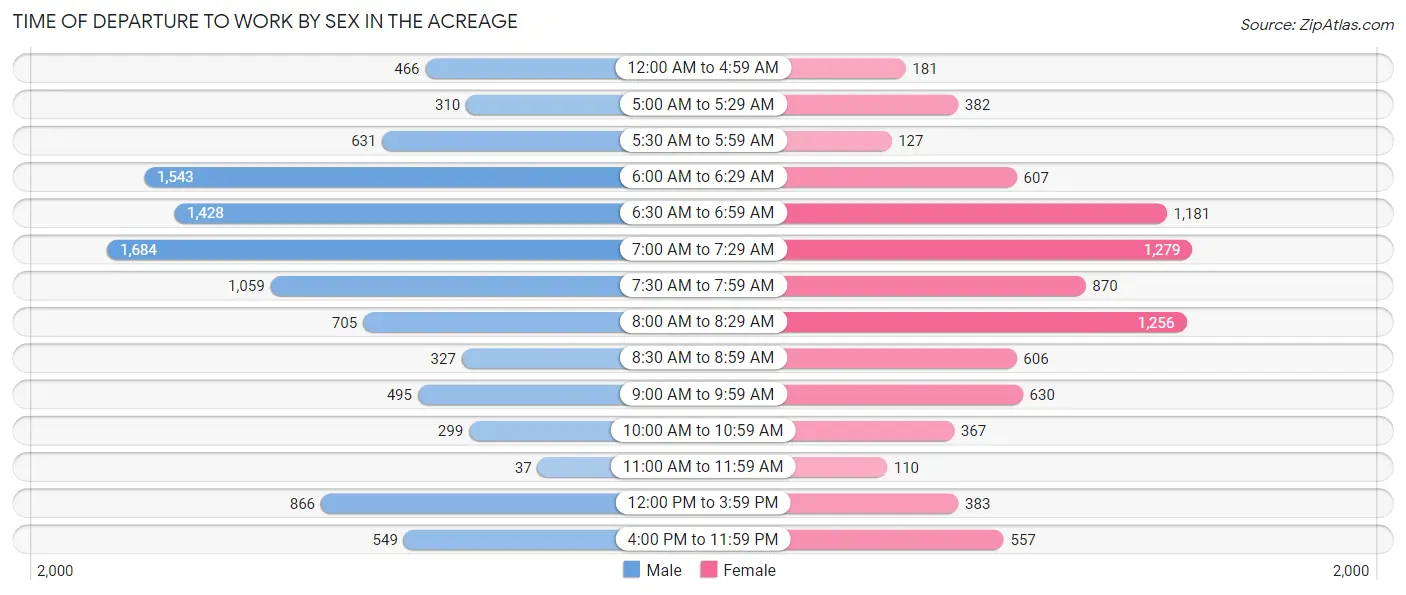
| Time of Departure | Male | Female |
| 12:00 AM to 4:59 AM | 466 (4.5%) | 181 (2.1%) |
| 5:00 AM to 5:29 AM | 310 (3.0%) | 382 (4.5%) |
| 5:30 AM to 5:59 AM | 631 (6.1%) | 127 (1.5%) |
| 6:00 AM to 6:29 AM | 1,543 (14.8%) | 607 (7.1%) |
| 6:30 AM to 6:59 AM | 1,428 (13.7%) | 1,181 (13.8%) |
| 7:00 AM to 7:29 AM | 1,684 (16.2%) | 1,279 (15.0%) |
| 7:30 AM to 7:59 AM | 1,059 (10.2%) | 870 (10.2%) |
| 8:00 AM to 8:29 AM | 705 (6.8%) | 1,256 (14.7%) |
| 8:30 AM to 8:59 AM | 327 (3.1%) | 606 (7.1%) |
| 9:00 AM to 9:59 AM | 495 (4.8%) | 630 (7.4%) |
| 10:00 AM to 10:59 AM | 299 (2.9%) | 367 (4.3%) |
| 11:00 AM to 11:59 AM | 37 (0.4%) | 110 (1.3%) |
| 12:00 PM to 3:59 PM | 866 (8.3%) | 383 (4.5%) |
| 4:00 PM to 11:59 PM | 549 (5.3%) | 557 (6.5%) |
| Total | 10,399 (100.0%) | 8,536 (100.0%) |
Housing Occupancy in The Acreage
Occupancy by Ownership in The Acreage
Of the total 12,631 dwellings in The Acreage, owner-occupied units account for 11,494 (91.0%), while renter-occupied units make up 1,137 (9.0%).
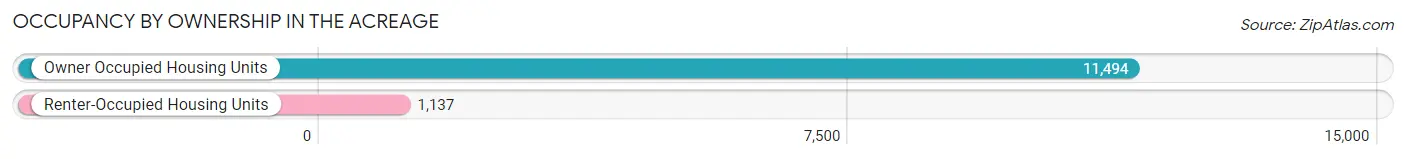
| Occupancy | # Housing Units | % Housing Units |
| Owner Occupied Housing Units | 11,494 | 91.0% |
| Renter-Occupied Housing Units | 1,137 | 9.0% |
| Total Occupied Housing Units | 12,631 | 100.0% |
Occupancy by Household Size in The Acreage
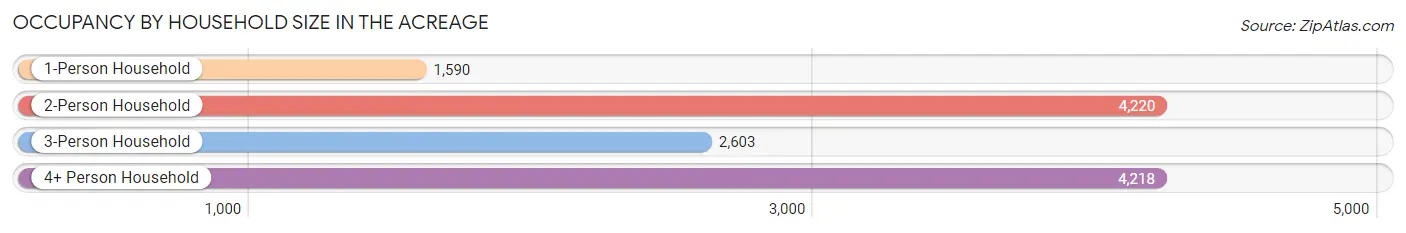
| Household Size | # Housing Units | % Housing Units |
| 1-Person Household | 1,590 | 12.6% |
| 2-Person Household | 4,220 | 33.4% |
| 3-Person Household | 2,603 | 20.6% |
| 4+ Person Household | 4,218 | 33.4% |
| Total Housing Units | 12,631 | 100.0% |
Occupancy by Ownership by Household Size in The Acreage
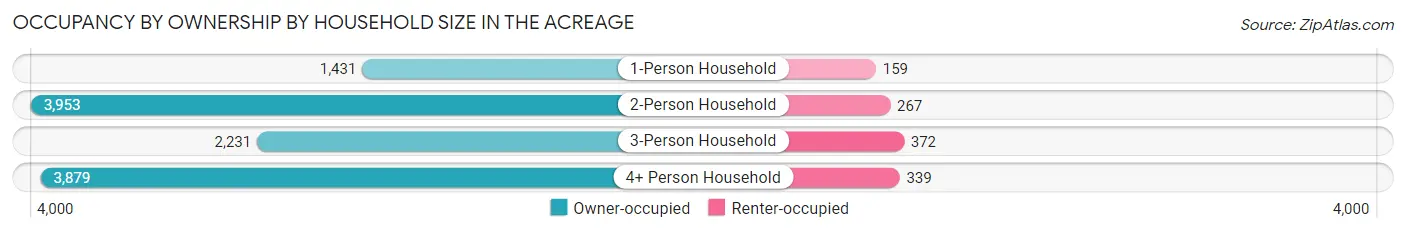
| Household Size | Owner-occupied | Renter-occupied |
| 1-Person Household | 1,431 (90.0%) | 159 (10.0%) |
| 2-Person Household | 3,953 (93.7%) | 267 (6.3%) |
| 3-Person Household | 2,231 (85.7%) | 372 (14.3%) |
| 4+ Person Household | 3,879 (92.0%) | 339 (8.0%) |
| Total Housing Units | 11,494 (91.0%) | 1,137 (9.0%) |
Occupancy by Educational Attainment in The Acreage
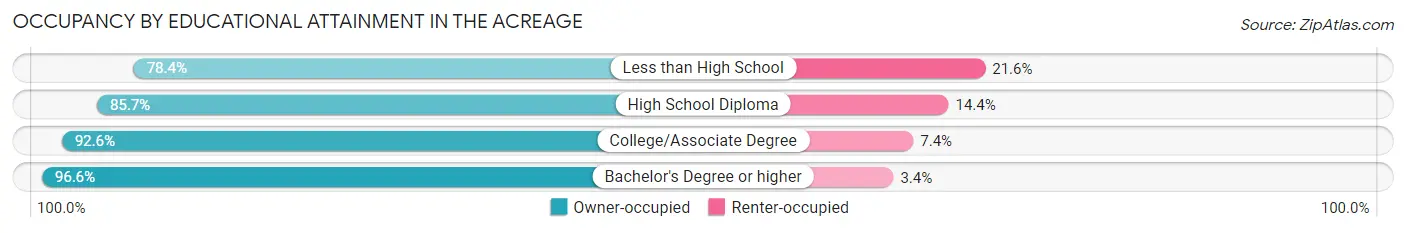
| Household Size | Owner-occupied | Renter-occupied |
| Less than High School | 641 (78.4%) | 177 (21.6%) |
| High School Diploma | 2,884 (85.7%) | 483 (14.3%) |
| College/Associate Degree | 4,396 (92.6%) | 350 (7.4%) |
| Bachelor's Degree or higher | 3,573 (96.6%) | 127 (3.4%) |
Occupancy by Age of Householder in The Acreage
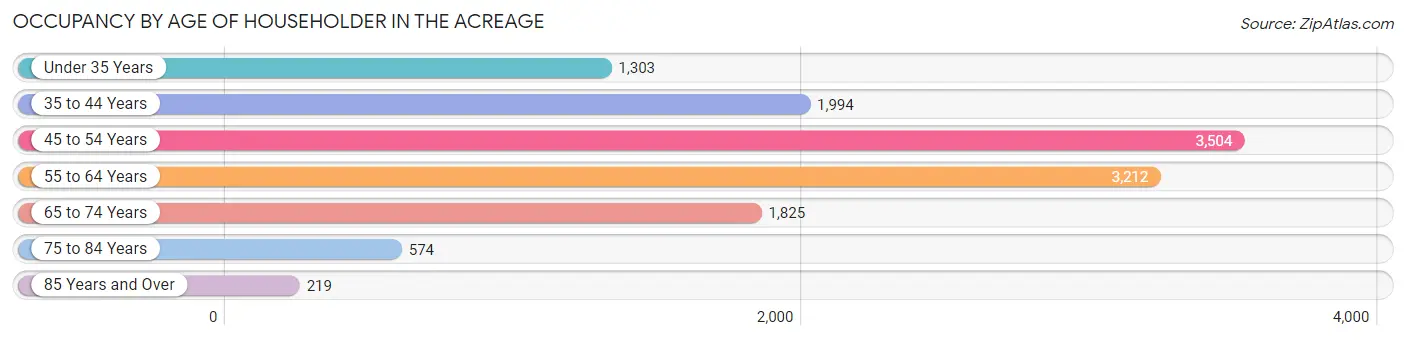
| Age Bracket | # Households | % Households |
| Under 35 Years | 1,303 | 10.3% |
| 35 to 44 Years | 1,994 | 15.8% |
| 45 to 54 Years | 3,504 | 27.7% |
| 55 to 64 Years | 3,212 | 25.4% |
| 65 to 74 Years | 1,825 | 14.4% |
| 75 to 84 Years | 574 | 4.5% |
| 85 Years and Over | 219 | 1.7% |
| Total | 12,631 | 100.0% |
Housing Finances in The Acreage
Median Income by Occupancy in The Acreage
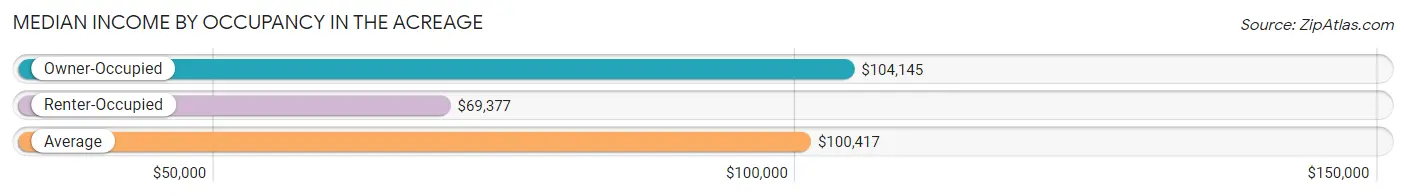
| Occupancy Type | # Households | Median Income |
| Owner-Occupied | 11,494 (91.0%) | $104,145 |
| Renter-Occupied | 1,137 (9.0%) | $69,377 |
| Average | 12,631 (100.0%) | $100,417 |
Occupancy by Householder Income Bracket in The Acreage
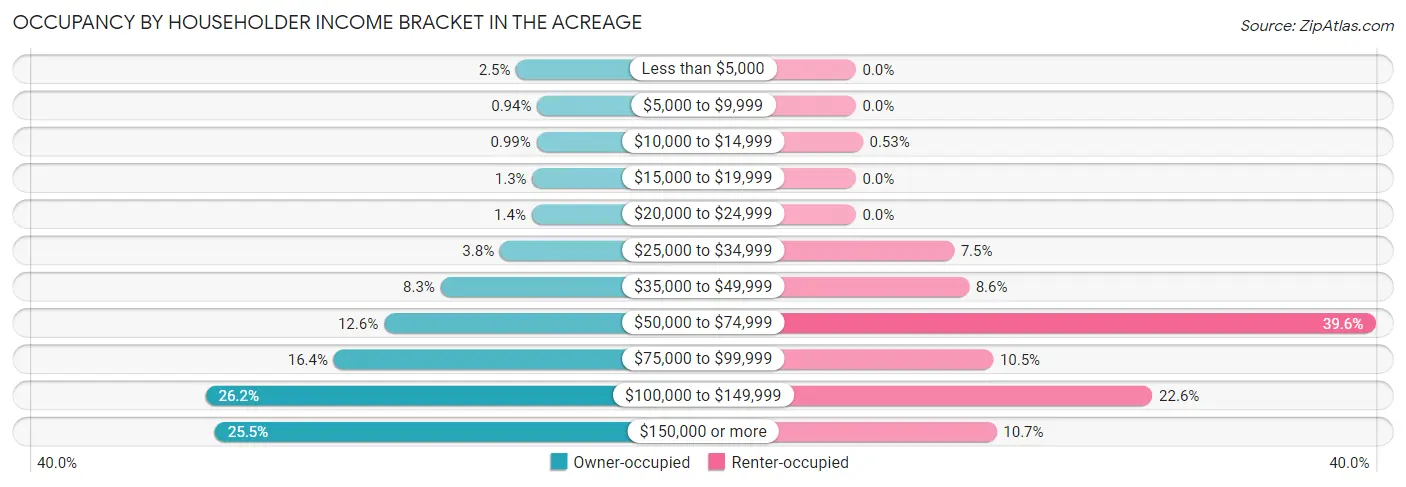
| Income Bracket | Owner-occupied | Renter-occupied |
| Less than $5,000 | 291 (2.5%) | 0 (0.0%) |
| $5,000 to $9,999 | 108 (0.9%) | 0 (0.0%) |
| $10,000 to $14,999 | 114 (1.0%) | 6 (0.5%) |
| $15,000 to $19,999 | 151 (1.3%) | 0 (0.0%) |
| $20,000 to $24,999 | 156 (1.4%) | 0 (0.0%) |
| $25,000 to $34,999 | 435 (3.8%) | 85 (7.5%) |
| $35,000 to $49,999 | 954 (8.3%) | 98 (8.6%) |
| $50,000 to $74,999 | 1,451 (12.6%) | 450 (39.6%) |
| $75,000 to $99,999 | 1,890 (16.4%) | 119 (10.5%) |
| $100,000 to $149,999 | 3,013 (26.2%) | 257 (22.6%) |
| $150,000 or more | 2,931 (25.5%) | 122 (10.7%) |
| Total | 11,494 (100.0%) | 1,137 (100.0%) |
Monthly Housing Cost Tiers in The Acreage
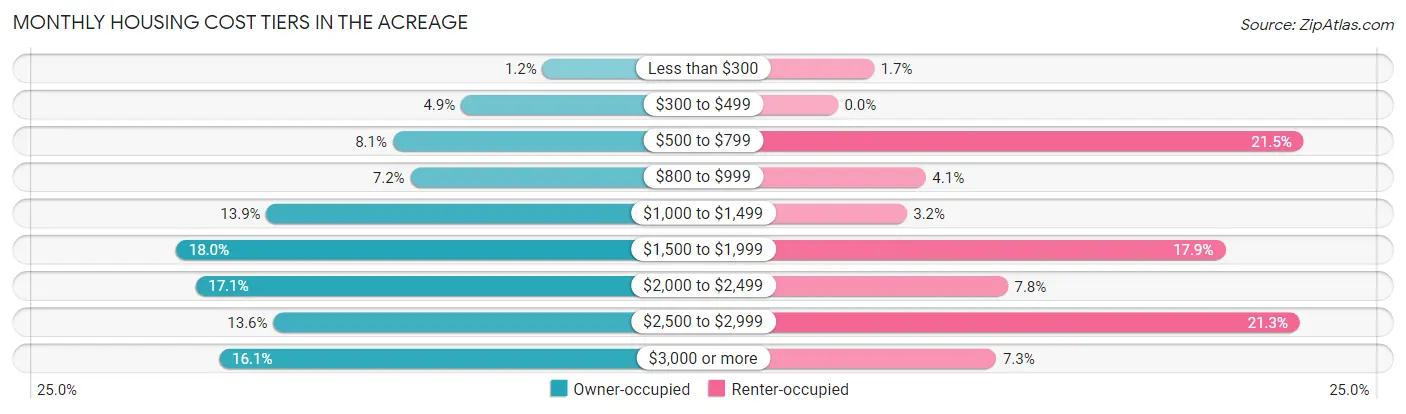
| Monthly Cost | Owner-occupied | Renter-occupied |
| Less than $300 | 133 (1.2%) | 19 (1.7%) |
| $300 to $499 | 564 (4.9%) | 0 (0.0%) |
| $500 to $799 | 925 (8.1%) | 244 (21.5%) |
| $800 to $999 | 832 (7.2%) | 46 (4.1%) |
| $1,000 to $1,499 | 1,594 (13.9%) | 36 (3.2%) |
| $1,500 to $1,999 | 2,074 (18.0%) | 203 (17.8%) |
| $2,000 to $2,499 | 1,970 (17.1%) | 89 (7.8%) |
| $2,500 to $2,999 | 1,557 (13.6%) | 242 (21.3%) |
| $3,000 or more | 1,845 (16.1%) | 83 (7.3%) |
| Total | 11,494 (100.0%) | 1,137 (100.0%) |
Physical Housing Characteristics in The Acreage
Housing Structures in The Acreage
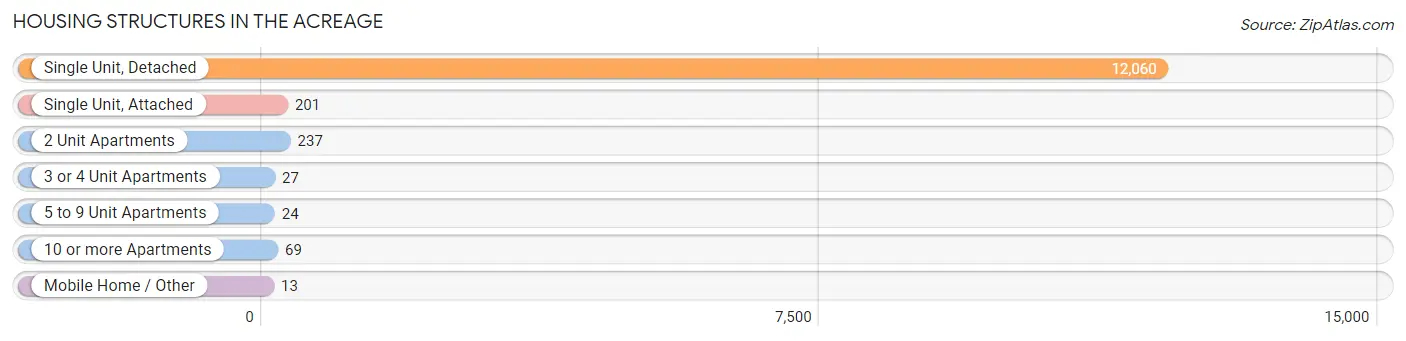
| Structure Type | # Housing Units | % Housing Units |
| Single Unit, Detached | 12,060 | 95.5% |
| Single Unit, Attached | 201 | 1.6% |
| 2 Unit Apartments | 237 | 1.9% |
| 3 or 4 Unit Apartments | 27 | 0.2% |
| 5 to 9 Unit Apartments | 24 | 0.2% |
| 10 or more Apartments | 69 | 0.5% |
| Mobile Home / Other | 13 | 0.1% |
| Total | 12,631 | 100.0% |
Housing Structures by Occupancy in The Acreage
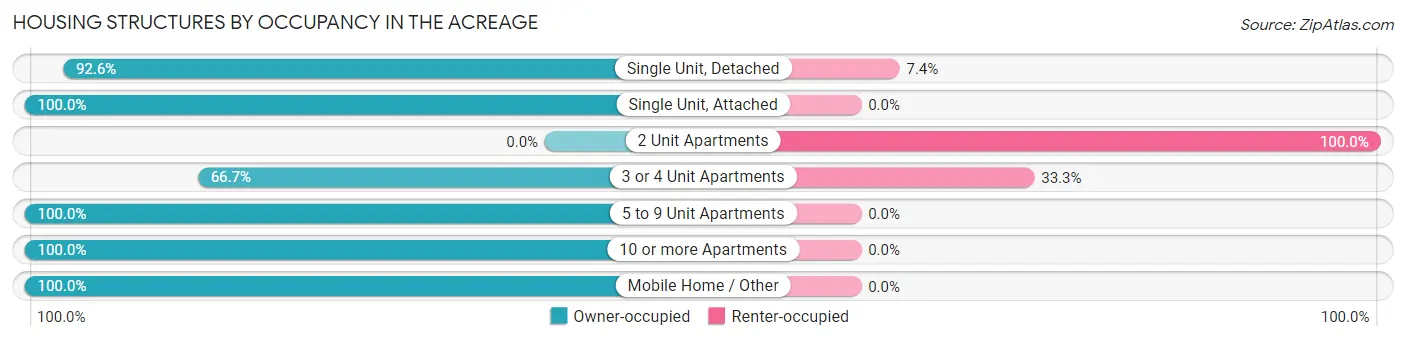
| Structure Type | Owner-occupied | Renter-occupied |
| Single Unit, Detached | 11,169 (92.6%) | 891 (7.4%) |
| Single Unit, Attached | 201 (100.0%) | 0 (0.0%) |
| 2 Unit Apartments | 0 (0.0%) | 237 (100.0%) |
| 3 or 4 Unit Apartments | 18 (66.7%) | 9 (33.3%) |
| 5 to 9 Unit Apartments | 24 (100.0%) | 0 (0.0%) |
| 10 or more Apartments | 69 (100.0%) | 0 (0.0%) |
| Mobile Home / Other | 13 (100.0%) | 0 (0.0%) |
| Total | 11,494 (91.0%) | 1,137 (9.0%) |
Housing Structures by Number of Rooms in The Acreage
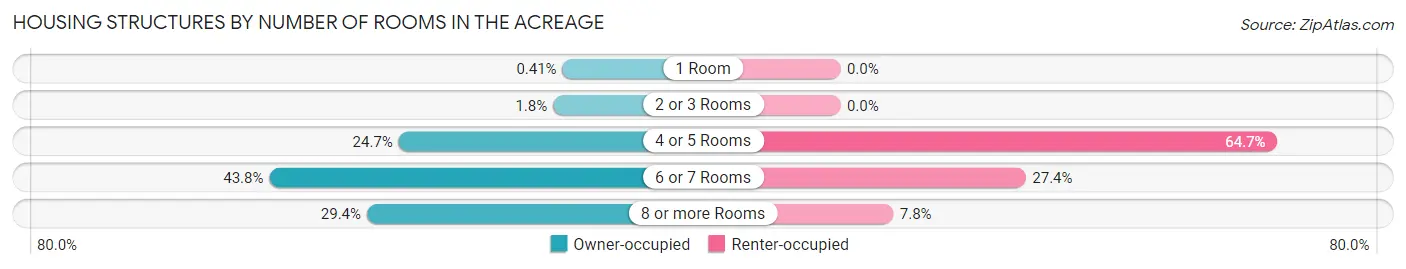
| Number of Rooms | Owner-occupied | Renter-occupied |
| 1 Room | 47 (0.4%) | 0 (0.0%) |
| 2 or 3 Rooms | 207 (1.8%) | 0 (0.0%) |
| 4 or 5 Rooms | 2,833 (24.6%) | 736 (64.7%) |
| 6 or 7 Rooms | 5,033 (43.8%) | 312 (27.4%) |
| 8 or more Rooms | 3,374 (29.3%) | 89 (7.8%) |
| Total | 11,494 (100.0%) | 1,137 (100.0%) |
Housing Structure by Heating Type in The Acreage
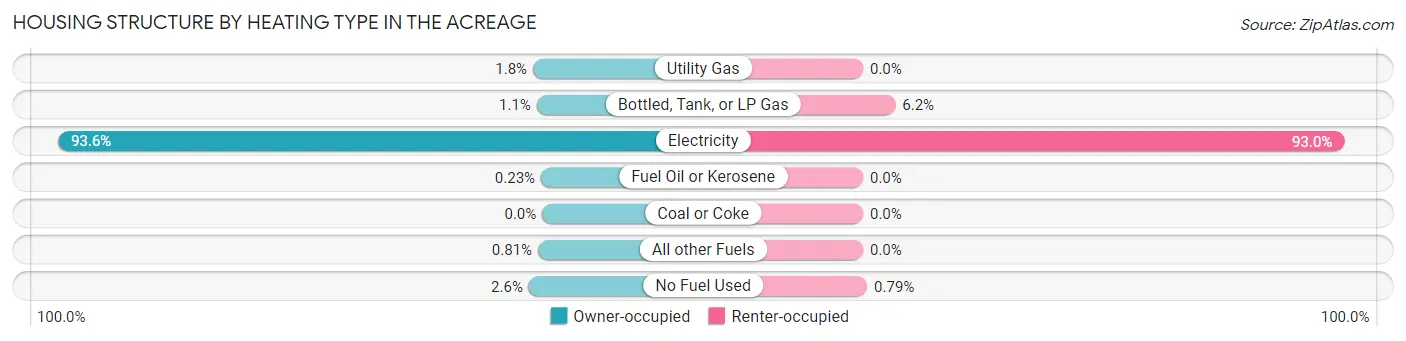
| Heating Type | Owner-occupied | Renter-occupied |
| Utility Gas | 203 (1.8%) | 0 (0.0%) |
| Bottled, Tank, or LP Gas | 121 (1.1%) | 71 (6.2%) |
| Electricity | 10,753 (93.5%) | 1,057 (93.0%) |
| Fuel Oil or Kerosene | 27 (0.2%) | 0 (0.0%) |
| Coal or Coke | 0 (0.0%) | 0 (0.0%) |
| All other Fuels | 93 (0.8%) | 0 (0.0%) |
| No Fuel Used | 297 (2.6%) | 9 (0.8%) |
| Total | 11,494 (100.0%) | 1,137 (100.0%) |
Household Vehicle Usage in The Acreage
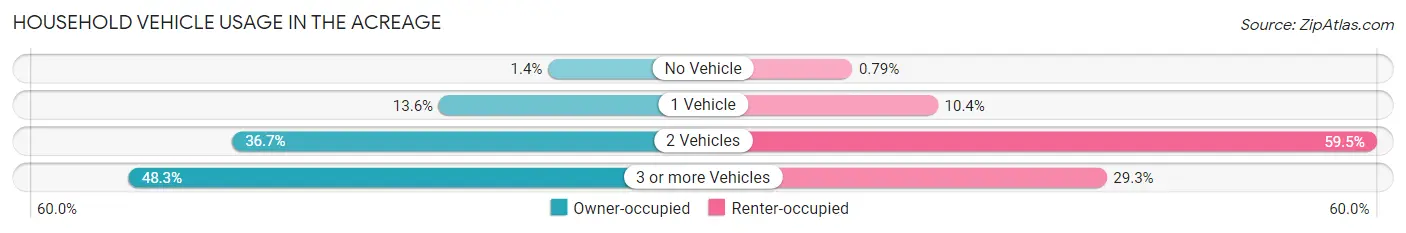
| Vehicles per Household | Owner-occupied | Renter-occupied |
| No Vehicle | 155 (1.3%) | 9 (0.8%) |
| 1 Vehicle | 1,562 (13.6%) | 118 (10.4%) |
| 2 Vehicles | 4,223 (36.7%) | 677 (59.5%) |
| 3 or more Vehicles | 5,554 (48.3%) | 333 (29.3%) |
| Total | 11,494 (100.0%) | 1,137 (100.0%) |
Real Estate & Mortgages in The Acreage
Real Estate and Mortgage Overview in The Acreage
| Characteristic | Without Mortgage | With Mortgage |
| Housing Units | 2,677 | 8,817 |
| Median Property Value | $422,300 | $426,900 |
| Median Household Income | $78,023 | $2,470 |
| Monthly Housing Costs | $738 | $1,835 |
| Real Estate Taxes | $3,723 | $227 |
Property Value by Mortgage Status in The Acreage
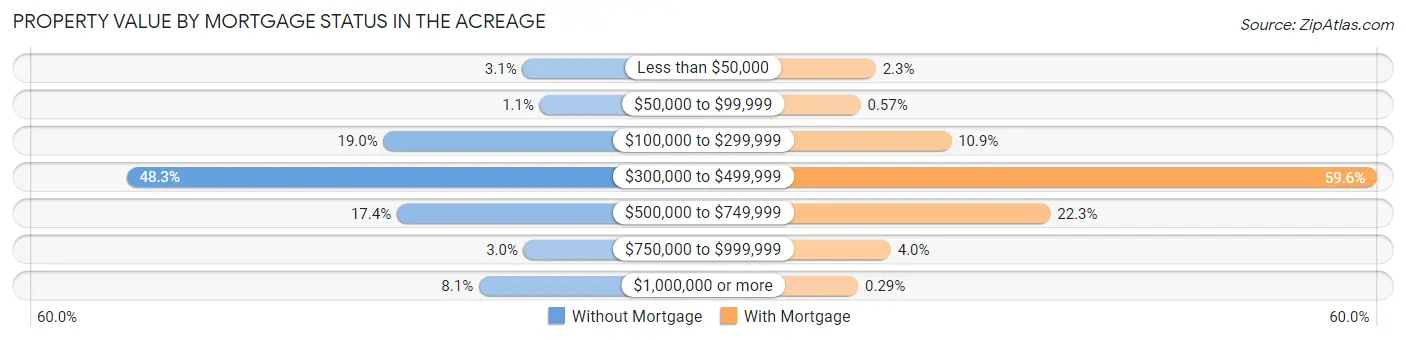
| Property Value | Without Mortgage | With Mortgage |
| Less than $50,000 | 83 (3.1%) | 204 (2.3%) |
| $50,000 to $99,999 | 30 (1.1%) | 50 (0.6%) |
| $100,000 to $299,999 | 508 (19.0%) | 964 (10.9%) |
| $300,000 to $499,999 | 1,294 (48.3%) | 5,255 (59.6%) |
| $500,000 to $749,999 | 467 (17.4%) | 1,963 (22.3%) |
| $750,000 to $999,999 | 79 (2.9%) | 355 (4.0%) |
| $1,000,000 or more | 216 (8.1%) | 26 (0.3%) |
| Total | 2,677 (100.0%) | 8,817 (100.0%) |
Household Income by Mortgage Status in The Acreage
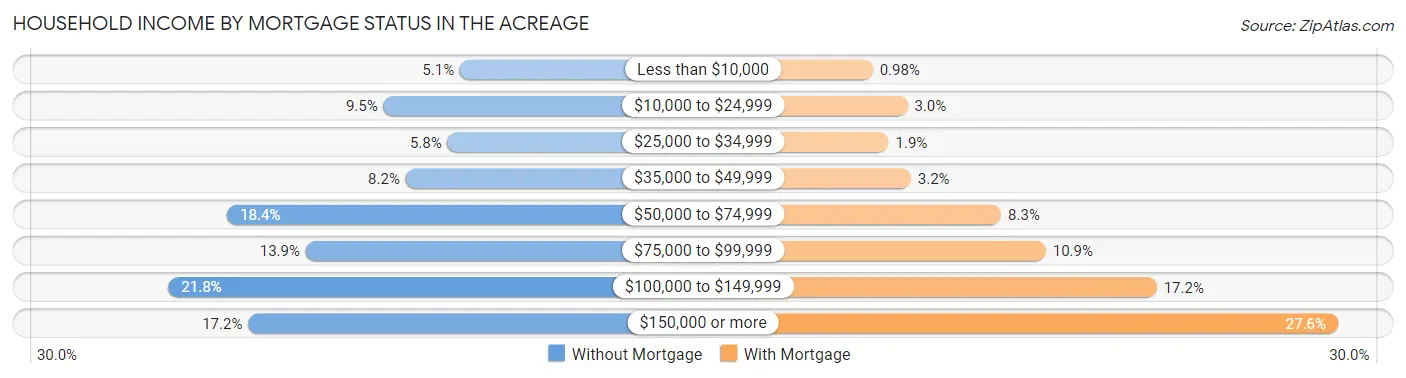
| Household Income | Without Mortgage | With Mortgage |
| Less than $10,000 | 137 (5.1%) | 86 (1.0%) |
| $10,000 to $24,999 | 254 (9.5%) | 262 (3.0%) |
| $25,000 to $34,999 | 156 (5.8%) | 167 (1.9%) |
| $35,000 to $49,999 | 220 (8.2%) | 279 (3.2%) |
| $50,000 to $74,999 | 493 (18.4%) | 734 (8.3%) |
| $75,000 to $99,999 | 373 (13.9%) | 958 (10.9%) |
| $100,000 to $149,999 | 583 (21.8%) | 1,517 (17.2%) |
| $150,000 or more | 461 (17.2%) | 2,430 (27.6%) |
| Total | 2,677 (100.0%) | 8,817 (100.0%) |
Property Value to Household Income Ratio in The Acreage
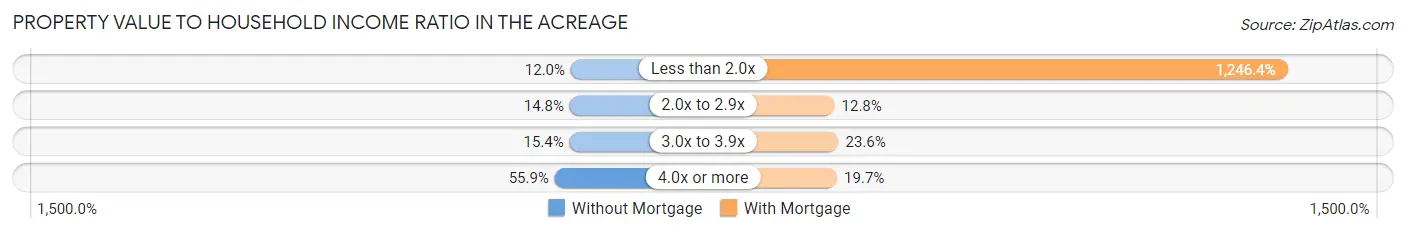
| Value-to-Income Ratio | Without Mortgage | With Mortgage |
| Less than 2.0x | 320 (11.9%) | 109,893 (1,246.4%) |
| 2.0x to 2.9x | 395 (14.8%) | 1,124 (12.8%) |
| 3.0x to 3.9x | 412 (15.4%) | 2,084 (23.6%) |
| 4.0x or more | 1,496 (55.9%) | 1,734 (19.7%) |
| Total | 2,677 (100.0%) | 8,817 (100.0%) |
Real Estate Taxes by Mortgage Status in The Acreage
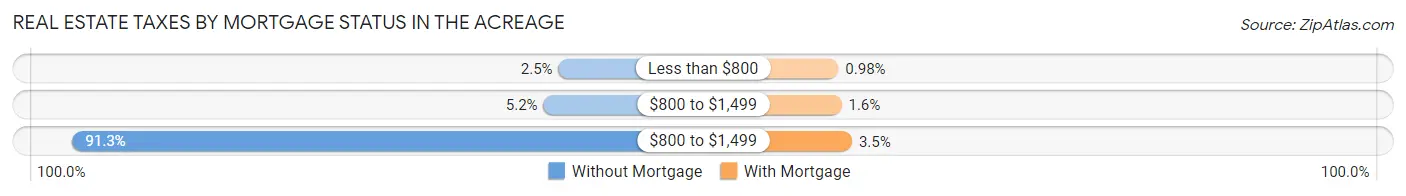
| Property Taxes | Without Mortgage | With Mortgage |
| Less than $800 | 67 (2.5%) | 86 (1.0%) |
| $800 to $1,499 | 140 (5.2%) | 137 (1.5%) |
| $800 to $1,499 | 2,443 (91.3%) | 304 (3.5%) |
| Total | 2,677 (100.0%) | 8,817 (100.0%) |
Health & Disability in The Acreage
Health Insurance Coverage by Age in The Acreage
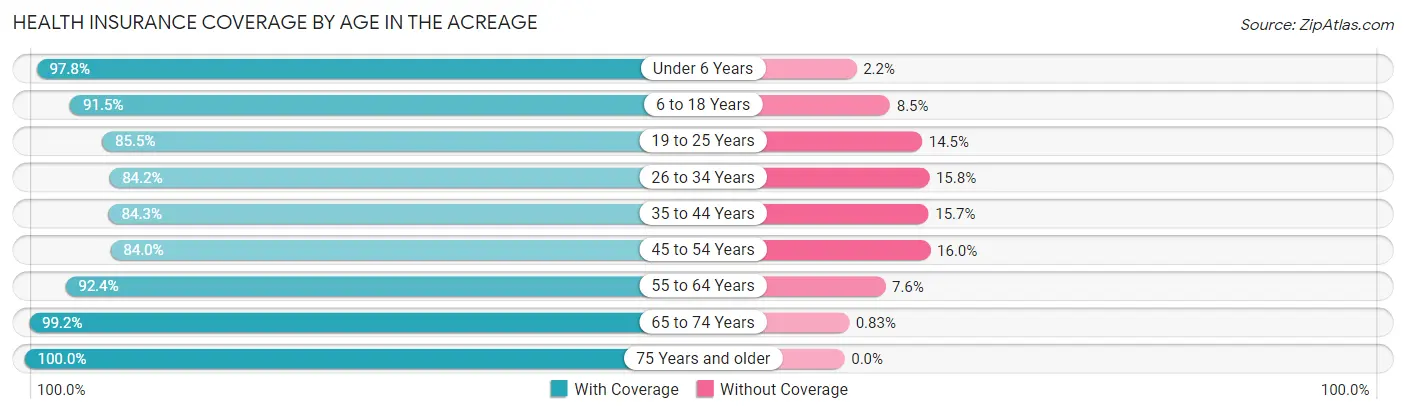
| Age Bracket | With Coverage | Without Coverage |
| Under 6 Years | 2,201 (97.8%) | 50 (2.2%) |
| 6 to 18 Years | 6,396 (91.5%) | 593 (8.5%) |
| 19 to 25 Years | 2,355 (85.5%) | 398 (14.5%) |
| 26 to 34 Years | 3,825 (84.2%) | 717 (15.8%) |
| 35 to 44 Years | 4,218 (84.3%) | 784 (15.7%) |
| 45 to 54 Years | 5,847 (84.0%) | 1,114 (16.0%) |
| 55 to 64 Years | 5,858 (92.4%) | 482 (7.6%) |
| 65 to 74 Years | 3,123 (99.2%) | 26 (0.8%) |
| 75 Years and older | 2,148 (100.0%) | 0 (0.0%) |
| Total | 35,971 (89.6%) | 4,164 (10.4%) |
Health Insurance Coverage by Citizenship Status in The Acreage
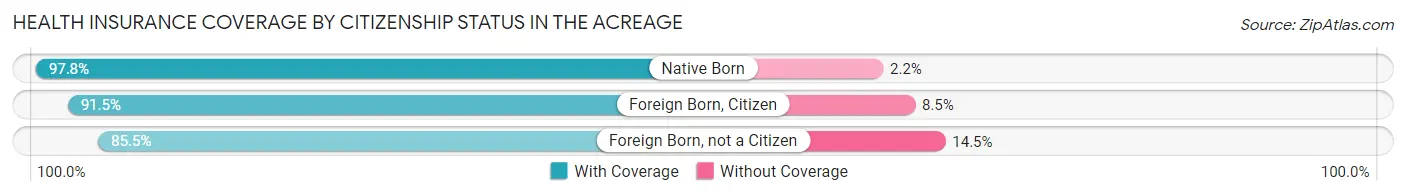
| Citizenship Status | With Coverage | Without Coverage |
| Native Born | 2,201 (97.8%) | 50 (2.2%) |
| Foreign Born, Citizen | 6,396 (91.5%) | 593 (8.5%) |
| Foreign Born, not a Citizen | 2,355 (85.5%) | 398 (14.5%) |
Health Insurance Coverage by Household Income in The Acreage
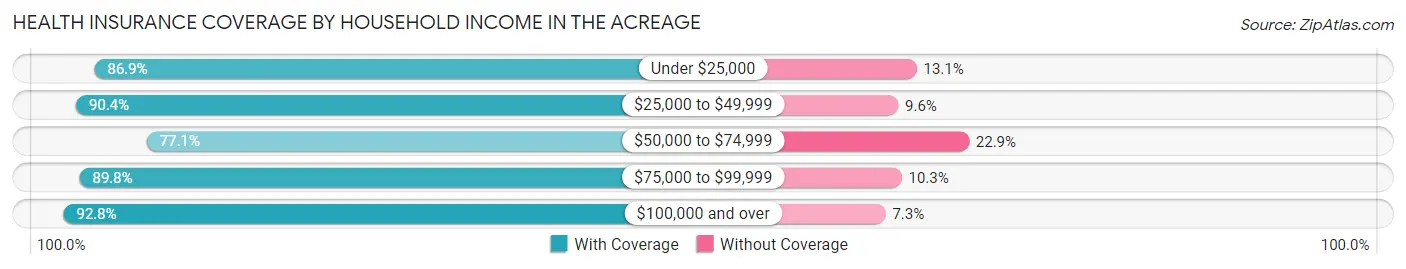
| Household Income | With Coverage | Without Coverage |
| Under $25,000 | 964 (86.9%) | 145 (13.1%) |
| $25,000 to $49,999 | 3,281 (90.4%) | 349 (9.6%) |
| $50,000 to $74,999 | 4,374 (77.1%) | 1,297 (22.9%) |
| $75,000 to $99,999 | 6,506 (89.7%) | 743 (10.2%) |
| $100,000 and over | 20,803 (92.7%) | 1,625 (7.2%) |
Public vs Private Health Insurance Coverage by Age in The Acreage
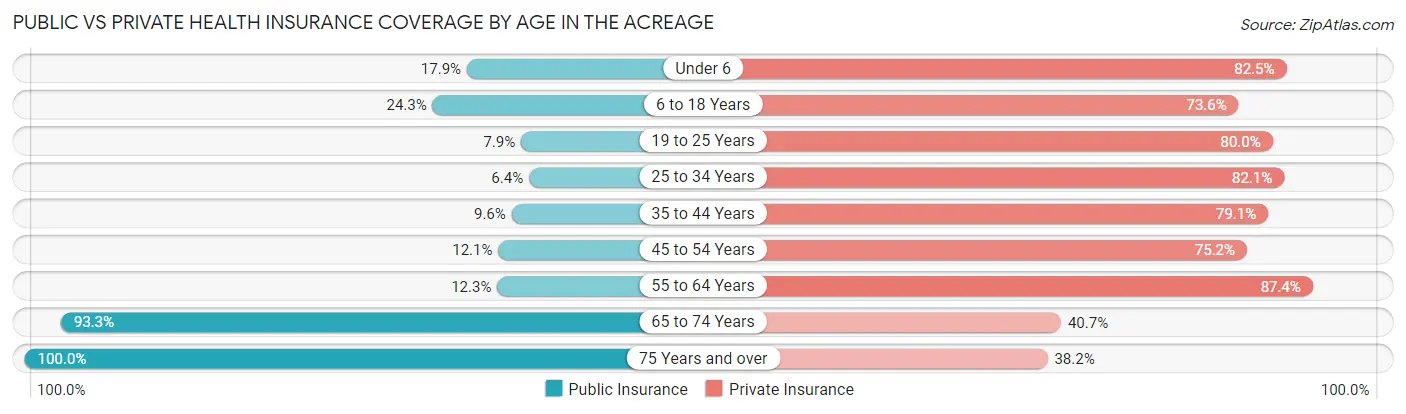
| Age Bracket | Public Insurance | Private Insurance |
| Under 6 | 403 (17.9%) | 1,857 (82.5%) |
| 6 to 18 Years | 1,697 (24.3%) | 5,147 (73.6%) |
| 19 to 25 Years | 216 (7.9%) | 2,201 (79.9%) |
| 25 to 34 Years | 290 (6.4%) | 3,728 (82.1%) |
| 35 to 44 Years | 480 (9.6%) | 3,957 (79.1%) |
| 45 to 54 Years | 840 (12.1%) | 5,233 (75.2%) |
| 55 to 64 Years | 778 (12.3%) | 5,541 (87.4%) |
| 65 to 74 Years | 2,937 (93.3%) | 1,281 (40.7%) |
| 75 Years and over | 2,148 (100.0%) | 820 (38.2%) |
| Total | 9,789 (24.4%) | 29,765 (74.2%) |
Disability Status by Sex by Age in The Acreage
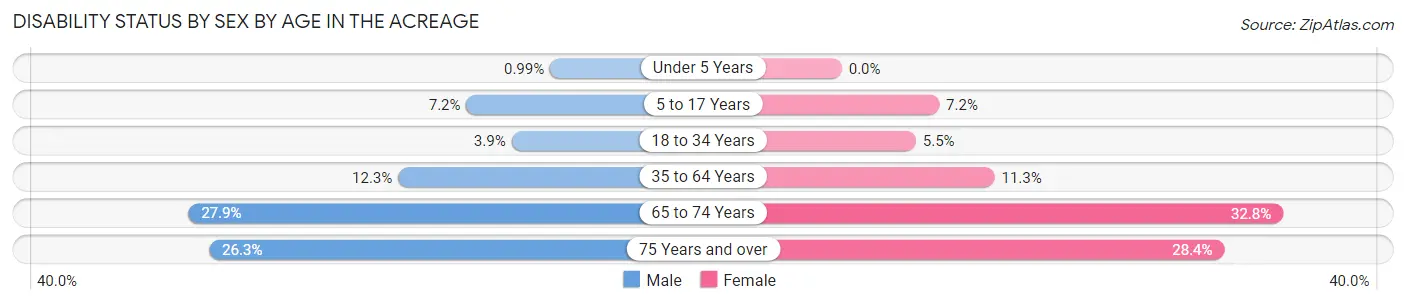
| Age Bracket | Male | Female |
| Under 5 Years | 9 (1.0%) | 0 (0.0%) |
| 5 to 17 Years | 255 (7.2%) | 255 (7.2%) |
| 18 to 34 Years | 160 (3.8%) | 203 (5.5%) |
| 35 to 64 Years | 1,174 (12.3%) | 990 (11.3%) |
| 65 to 74 Years | 457 (27.9%) | 494 (32.8%) |
| 75 Years and over | 252 (26.3%) | 338 (28.4%) |
Disability Class by Sex by Age in The Acreage
Disability Class: Hearing Difficulty
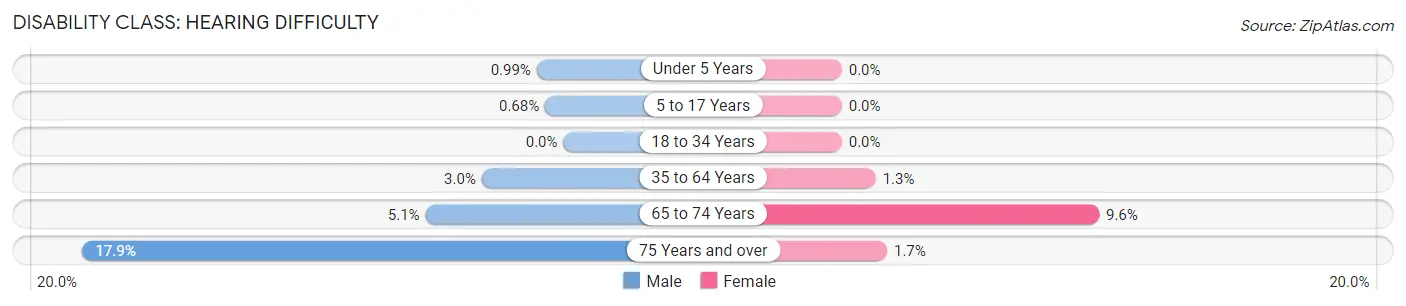
| Age Bracket | Male | Female |
| Under 5 Years | 9 (1.0%) | 0 (0.0%) |
| 5 to 17 Years | 24 (0.7%) | 0 (0.0%) |
| 18 to 34 Years | 0 (0.0%) | 0 (0.0%) |
| 35 to 64 Years | 290 (3.0%) | 110 (1.3%) |
| 65 to 74 Years | 84 (5.1%) | 144 (9.6%) |
| 75 Years and over | 171 (17.8%) | 20 (1.7%) |
Disability Class: Vision Difficulty
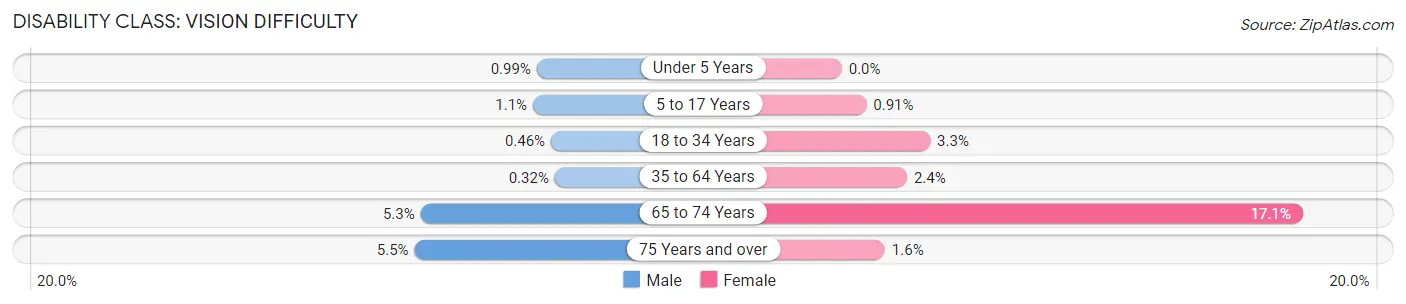
| Age Bracket | Male | Female |
| Under 5 Years | 9 (1.0%) | 0 (0.0%) |
| 5 to 17 Years | 40 (1.1%) | 32 (0.9%) |
| 18 to 34 Years | 19 (0.5%) | 121 (3.3%) |
| 35 to 64 Years | 31 (0.3%) | 211 (2.4%) |
| 65 to 74 Years | 87 (5.3%) | 258 (17.1%) |
| 75 Years and over | 53 (5.5%) | 19 (1.6%) |
Disability Class: Cognitive Difficulty
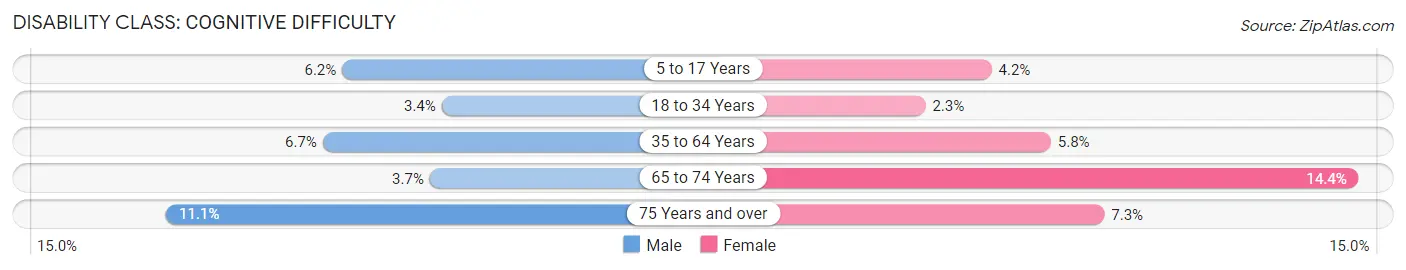
| Age Bracket | Male | Female |
| 5 to 17 Years | 218 (6.2%) | 147 (4.2%) |
| 18 to 34 Years | 141 (3.4%) | 86 (2.3%) |
| 35 to 64 Years | 641 (6.7%) | 508 (5.8%) |
| 65 to 74 Years | 61 (3.7%) | 217 (14.4%) |
| 75 Years and over | 106 (11.1%) | 87 (7.3%) |
Disability Class: Ambulatory Difficulty
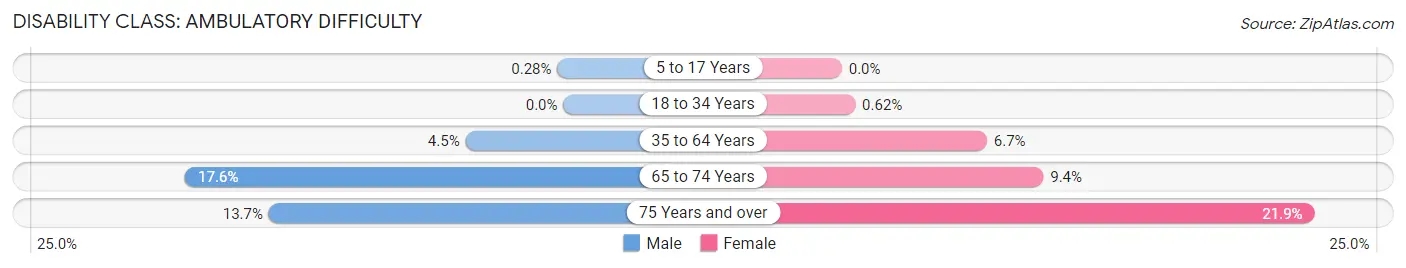
| Age Bracket | Male | Female |
| 5 to 17 Years | 10 (0.3%) | 0 (0.0%) |
| 18 to 34 Years | 0 (0.0%) | 23 (0.6%) |
| 35 to 64 Years | 434 (4.5%) | 588 (6.7%) |
| 65 to 74 Years | 288 (17.5%) | 141 (9.3%) |
| 75 Years and over | 131 (13.7%) | 261 (21.9%) |
Disability Class: Self-Care Difficulty
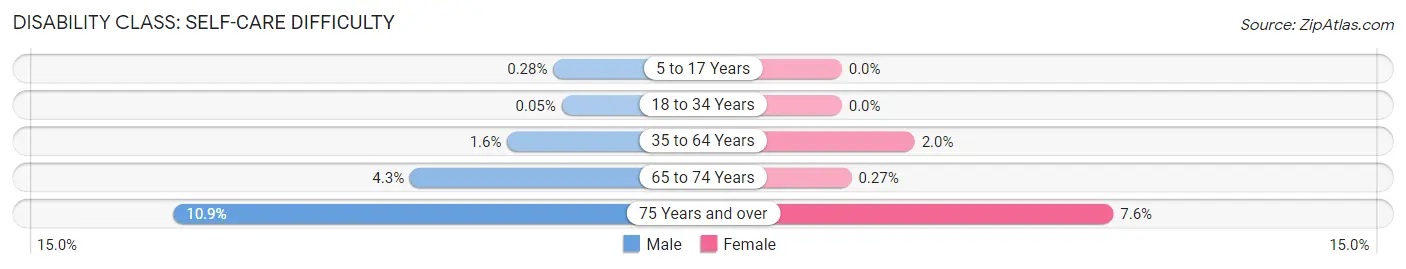
| Age Bracket | Male | Female |
| 5 to 17 Years | 10 (0.3%) | 0 (0.0%) |
| 18 to 34 Years | 2 (0.1%) | 0 (0.0%) |
| 35 to 64 Years | 149 (1.6%) | 177 (2.0%) |
| 65 to 74 Years | 70 (4.3%) | 4 (0.3%) |
| 75 Years and over | 104 (10.9%) | 90 (7.6%) |
Technology Access in The Acreage
Computing Device Access in The Acreage
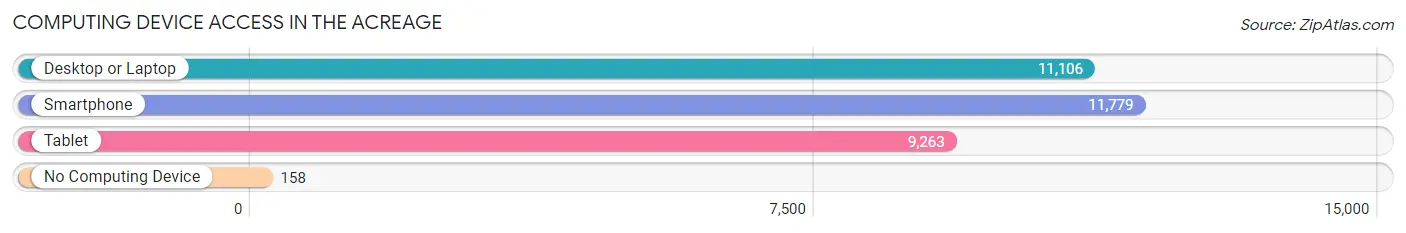
| Device Type | # Households | % Households |
| Desktop or Laptop | 11,106 | 87.9% |
| Smartphone | 11,779 | 93.2% |
| Tablet | 9,263 | 73.3% |
| No Computing Device | 158 | 1.3% |
| Total | 12,631 | 100.0% |
Internet Access in The Acreage
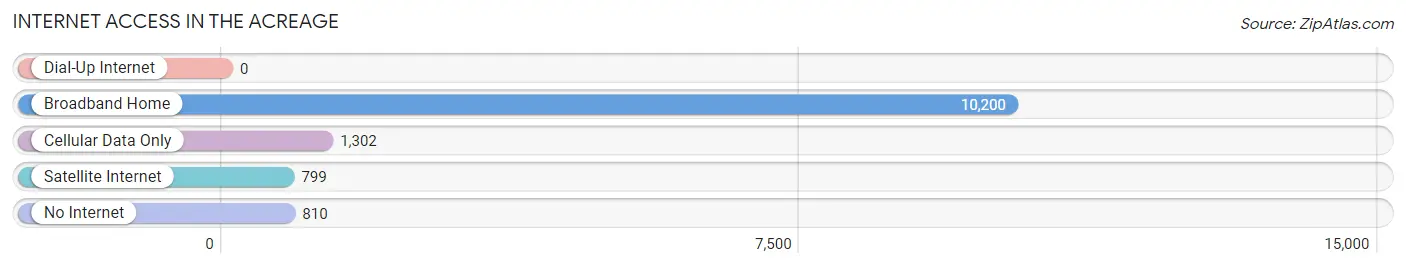
| Internet Type | # Households | % Households |
| Dial-Up Internet | 0 | 0.0% |
| Broadband Home | 10,200 | 80.7% |
| Cellular Data Only | 1,302 | 10.3% |
| Satellite Internet | 799 | 6.3% |
| No Internet | 810 | 6.4% |
| Total | 12,631 | 100.0% |
The Acreage Summary
The Acreage is an unincorporated community located in Palm Beach County, Florida. It is located in the western part of the county, just west of the city of West Palm Beach. The Acreage is a rural community with a population of approximately 30,000 people.
History
The Acreage was originally part of the Everglades, and was settled by Native Americans. The Seminole Indians were the first to inhabit the area, and they used the land for hunting and fishing. The area was also used for cattle ranching, and the first settlers arrived in the late 1800s. The area was known as the “Acreage” because of its large size.
In the early 1900s, the area was developed for agriculture, and the first settlers began to farm the land. The area was also used for cattle ranching, and the first settlers began to raise cattle. The area was also used for timber harvesting, and the first sawmill was built in the area in the early 1900s.
In the 1950s, the area began to be developed for residential use. The first homes were built in the area in the late 1950s, and the population began to grow. The area was incorporated as a town in the late 1960s, and the population continued to grow.
Geography
The Acreage is located in western Palm Beach County, just west of the city of West Palm Beach. The area is bordered by the Loxahatchee National Wildlife Refuge to the north, the Arthur R. Marshall Loxahatchee National Wildlife Refuge to the east, and the Everglades to the south. The area is mostly flat, with some rolling hills. The area is mostly rural, with some residential development.
Economy
The economy of The Acreage is largely based on agriculture and tourism. The area is home to several farms, which produce a variety of crops, including citrus, vegetables, and hay. The area is also home to several nurseries, which produce a variety of plants and flowers. The area is also home to several tourist attractions, including the Lion Country Safari, the Palm Beach Zoo, and the South Florida Science Center.
Demographics
The population of The Acreage is approximately 30,000 people. The population is mostly white, with a small percentage of African Americans, Hispanics, and other ethnicities. The median household income is approximately $60,000, and the median home value is approximately $250,000. The area is served by the Palm Beach County School District, and there are several private schools in the area.
The Acreage is a rural community with a rich history and a diverse economy. The area is home to several farms, nurseries, and tourist attractions, and the population is mostly white. The area is served by the Palm Beach County School District, and there are several private schools in the area. The area is a great place to live, work, and play, and it is a great place to call home.
Common Questions
What is Per Capita Income in The Acreage?
Per Capita income in The Acreage is $37,717.
What is the Median Family Income in The Acreage?
Median Family Income in The Acreage is $105,716.
What is the Median Household income in The Acreage?
Median Household Income in The Acreage is $100,417.
What is Income or Wage Gap in The Acreage?
Income or Wage Gap in The Acreage is 22.4%.
Women in The Acreage earn 77.6 cents for every dollar earned by a man.
What is Inequality or Gini Index in The Acreage?
Inequality or Gini Index in The Acreage is 0.36.
What is the Total Population of The Acreage?
Total Population of The Acreage is 40,160.
What is the Total Male Population of The Acreage?
Total Male Population of The Acreage is 20,783.
What is the Total Female Population of The Acreage?
Total Female Population of The Acreage is 19,377.
What is the Ratio of Males per 100 Females in The Acreage?
There are 107.26 Males per 100 Females in The Acreage.
What is the Ratio of Females per 100 Males in The Acreage?
There are 93.23 Females per 100 Males in The Acreage.
What is the Median Population Age in The Acreage?
Median Population Age in The Acreage is 41.9 Years.
What is the Average Family Size in The Acreage
Average Family Size in The Acreage is 3.4 People.
What is the Average Household Size in The Acreage
Average Household Size in The Acreage is 3.2 People.
How Large is the Labor Force in The Acreage?
There are 22,443 People in the Labor Forcein in The Acreage.
What is the Percentage of People in the Labor Force in The Acreage?
68.8% of People are in the Labor Force in The Acreage.
What is the Unemployment Rate in The Acreage?
Unemployment Rate in The Acreage is 3.5%.