Miami Gardens, FL Map & Demographics
Miami Gardens Map
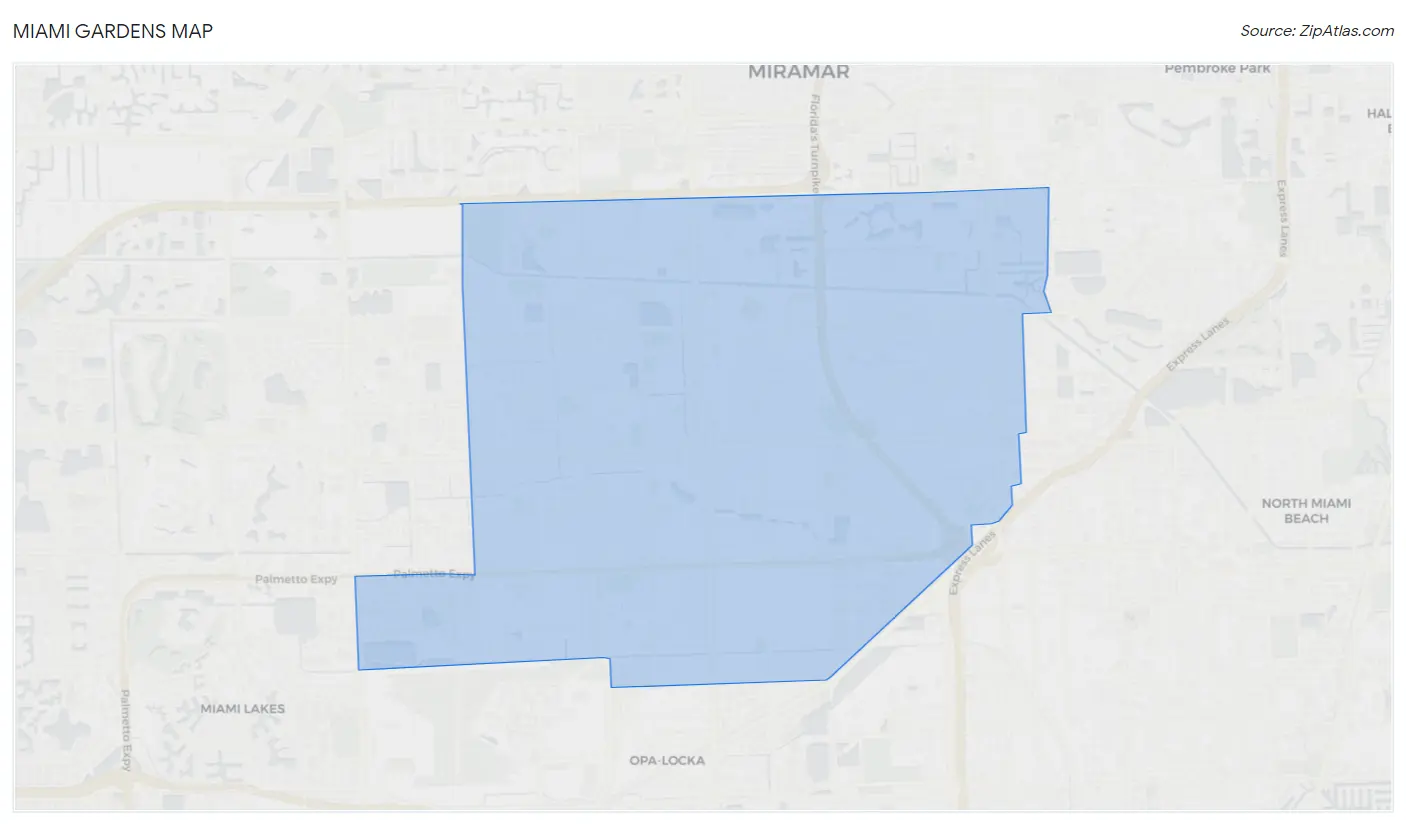
Miami Gardens Overview
$23,556
PER CAPITA INCOME
$63,027
AVG FAMILY INCOME
$56,071
AVG HOUSEHOLD INCOME
13.0%
WAGE / INCOME GAP [ % ]
87.0¢/ $1
WAGE / INCOME GAP [ $ ]
$11,651
FAMILY INCOME DEFICIT
0.42
INEQUALITY / GINI INDEX
111,618
TOTAL POPULATION
53,030
MALE POPULATION
58,588
FEMALE POPULATION
90.51
MALES / 100 FEMALES
110.48
FEMALES / 100 MALES
38.2
MEDIAN AGE
3.7
AVG FAMILY SIZE
3.2
AVG HOUSEHOLD SIZE
54,662
LABOR FORCE [ PEOPLE ]
61.1%
PERCENT IN LABOR FORCE
7.9%
UNEMPLOYMENT RATE
Miami Gardens Zip Codes
Income in Miami Gardens
Income Overview in Miami Gardens
Per Capita Income in Miami Gardens is $23,556, while median incomes of families and households are $63,027 and $56,071 respectively.
| Characteristic | Number | Measure |
| Per Capita Income | 111,618 | $23,556 |
| Median Family Income | 25,659 | $63,027 |
| Mean Family Income | 25,659 | $77,237 |
| Median Household Income | 34,351 | $56,071 |
| Mean Household Income | 34,351 | $70,927 |
| Income Deficit | 25,659 | $11,651 |
| Wage / Income Gap (%) | 111,618 | 13.01% |
| Wage / Income Gap ($) | 111,618 | 86.99¢ per $1 |
| Gini / Inequality Index | 111,618 | 0.42 |
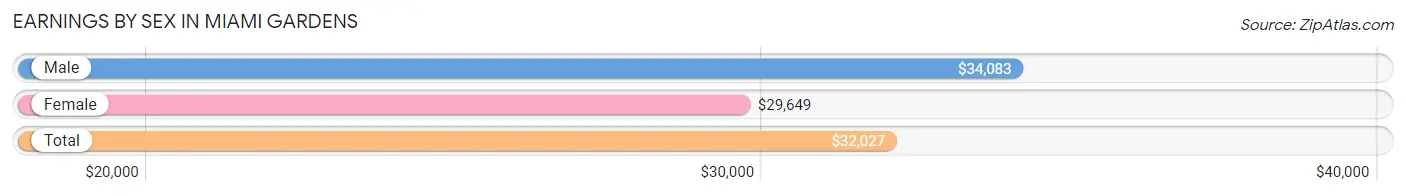
Earnings by Sex in Miami Gardens
Average Earnings in Miami Gardens are $32,027, $34,083 for men and $29,649 for women, a difference of 13.0%.
| Sex | Number | Average Earnings |
| Male | 26,996 (49.5%) | $34,083 |
| Female | 27,510 (50.5%) | $29,649 |
| Total | 54,506 (100.0%) | $32,027 |
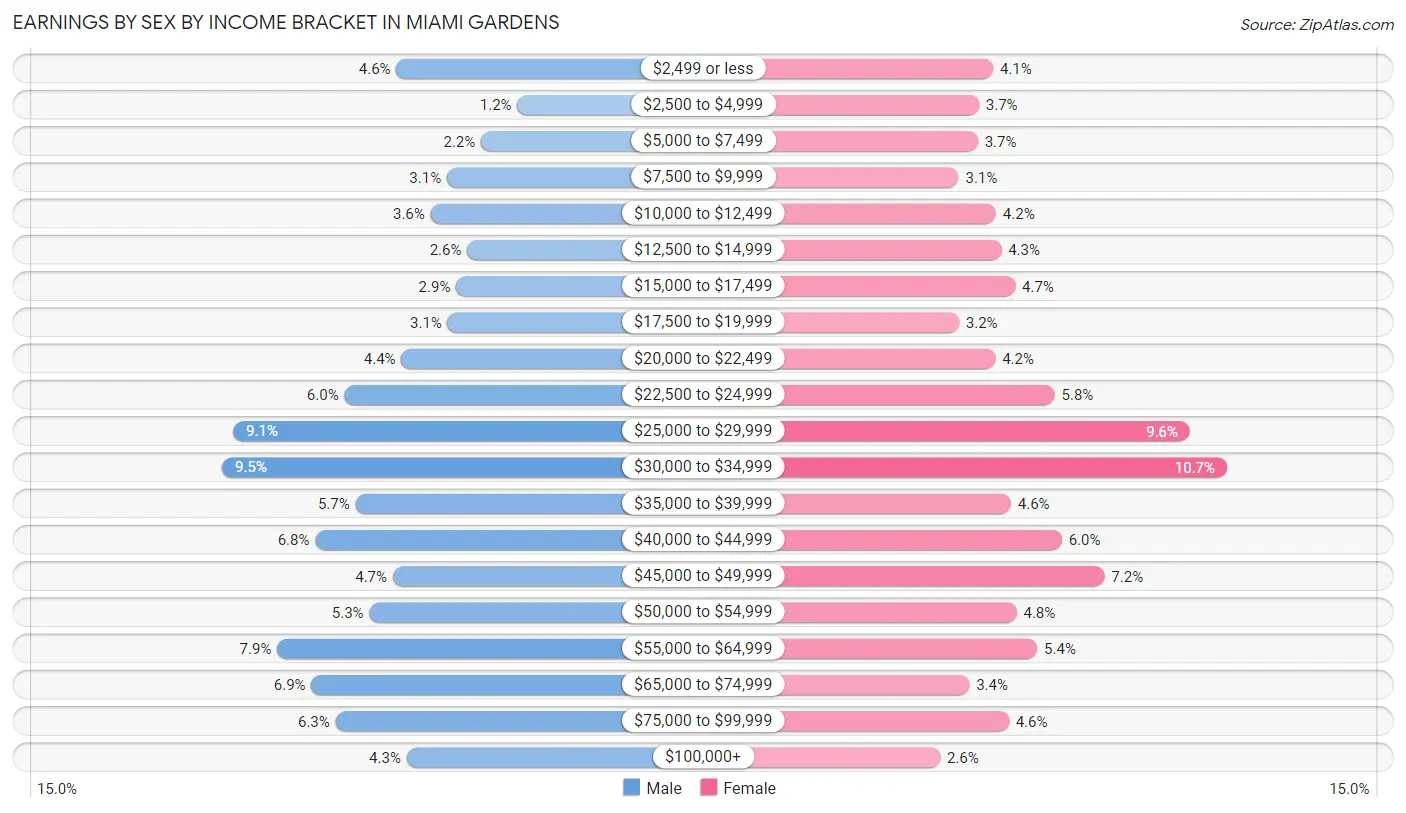
Earnings by Sex by Income Bracket in Miami Gardens
The most common earnings brackets in Miami Gardens are $30,000 to $34,999 for men (2,550 | 9.5%) and $30,000 to $34,999 for women (2,937 | 10.7%).
| Income | Male | Female |
| $2,499 or less | 1,227 (4.5%) | 1,131 (4.1%) |
| $2,500 to $4,999 | 311 (1.1%) | 1,020 (3.7%) |
| $5,000 to $7,499 | 587 (2.2%) | 1,012 (3.7%) |
| $7,500 to $9,999 | 846 (3.1%) | 864 (3.1%) |
| $10,000 to $12,499 | 969 (3.6%) | 1,154 (4.2%) |
| $12,500 to $14,999 | 691 (2.6%) | 1,193 (4.3%) |
| $15,000 to $17,499 | 775 (2.9%) | 1,302 (4.7%) |
| $17,500 to $19,999 | 839 (3.1%) | 867 (3.2%) |
| $20,000 to $22,499 | 1,191 (4.4%) | 1,146 (4.2%) |
| $22,500 to $24,999 | 1,623 (6.0%) | 1,606 (5.8%) |
| $25,000 to $29,999 | 2,468 (9.1%) | 2,652 (9.6%) |
| $30,000 to $34,999 | 2,550 (9.5%) | 2,937 (10.7%) |
| $35,000 to $39,999 | 1,540 (5.7%) | 1,267 (4.6%) |
| $40,000 to $44,999 | 1,844 (6.8%) | 1,662 (6.0%) |
| $45,000 to $49,999 | 1,254 (4.6%) | 1,993 (7.2%) |
| $50,000 to $54,999 | 1,434 (5.3%) | 1,311 (4.8%) |
| $55,000 to $64,999 | 2,132 (7.9%) | 1,472 (5.3%) |
| $65,000 to $74,999 | 1,874 (6.9%) | 947 (3.4%) |
| $75,000 to $99,999 | 1,690 (6.3%) | 1,253 (4.5%) |
| $100,000+ | 1,151 (4.3%) | 721 (2.6%) |
| Total | 26,996 (100.0%) | 27,510 (100.0%) |
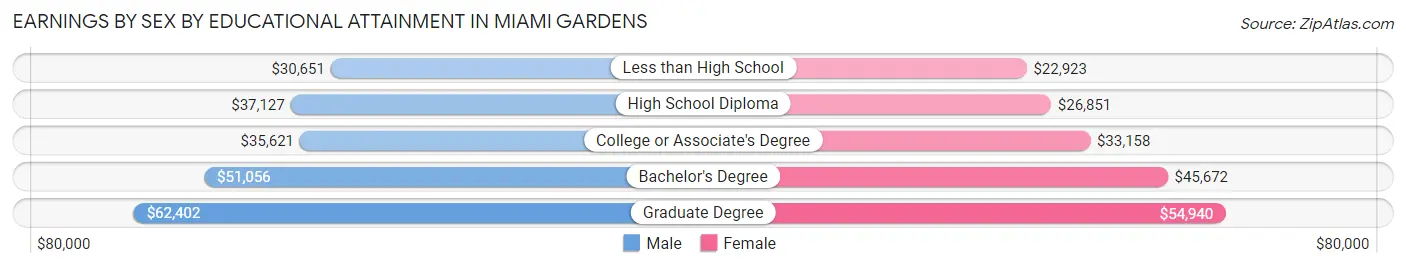
Earnings by Sex by Educational Attainment in Miami Gardens
Average earnings in Miami Gardens are $36,920 for men and $31,661 for women, a difference of 14.2%. Men with an educational attainment of graduate degree enjoy the highest average annual earnings of $62,402, while those with less than high school education earn the least with $30,651. Women with an educational attainment of graduate degree earn the most with the average annual earnings of $54,940, while those with less than high school education have the smallest earnings of $22,923.
| Educational Attainment | Male Income | Female Income |
| Less than High School | $30,651 | $22,923 |
| High School Diploma | $37,127 | $26,851 |
| College or Associate's Degree | $35,621 | $33,158 |
| Bachelor's Degree | $51,056 | $45,672 |
| Graduate Degree | $62,402 | $54,940 |
| Total | $36,920 | $31,661 |
Family Income in Miami Gardens
Family Income Brackets in Miami Gardens
According to the Miami Gardens family income data, there are 5,594 families falling into the $50,000 to $74,999 income range, which is the most common income bracket and makes up 21.8% of all families. Conversely, the $10,000 to $14,999 income bracket is the least frequent group with only 539 families (2.1%) belonging to this category.
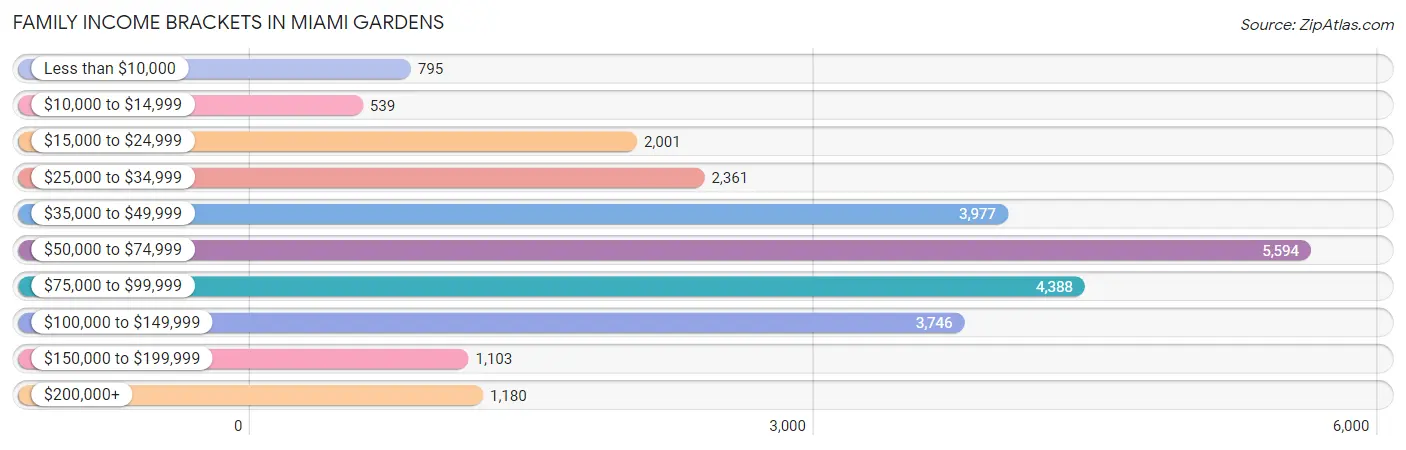
| Income Bracket | # Families | % Families |
| Less than $10,000 | 795 | 3.1% |
| $10,000 to $14,999 | 539 | 2.1% |
| $15,000 to $24,999 | 2,001 | 7.8% |
| $25,000 to $34,999 | 2,361 | 9.2% |
| $35,000 to $49,999 | 3,977 | 15.5% |
| $50,000 to $74,999 | 5,594 | 21.8% |
| $75,000 to $99,999 | 4,388 | 17.1% |
| $100,000 to $149,999 | 3,746 | 14.6% |
| $150,000 to $199,999 | 1,103 | 4.3% |
| $200,000+ | 1,180 | 4.6% |
Family Income by Famaliy Size in Miami Gardens
7+ person families (911 | 3.5%) account for the highest median family income in Miami Gardens with $103,291 per family, while 2-person families (8,817 | 34.4%) have the highest median income of $26,742 per family member.
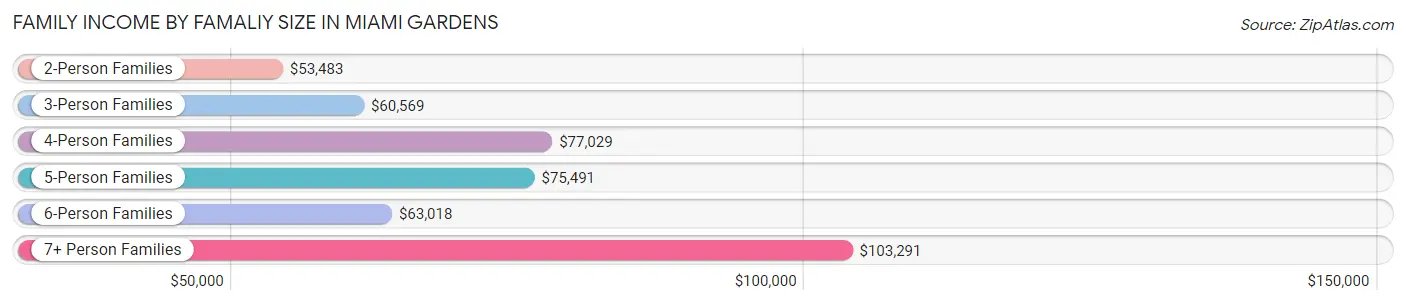
| Income Bracket | # Families | Median Income |
| 2-Person Families | 8,817 (34.4%) | $53,483 |
| 3-Person Families | 6,703 (26.1%) | $60,569 |
| 4-Person Families | 5,028 (19.6%) | $77,029 |
| 5-Person Families | 2,973 (11.6%) | $75,491 |
| 6-Person Families | 1,227 (4.8%) | $63,018 |
| 7+ Person Families | 911 (3.5%) | $103,291 |
| Total | 25,659 (100.0%) | $63,027 |
Family Income by Number of Earners in Miami Gardens
The median family income in Miami Gardens is $63,027, with families comprising 3+ earners (4,114) having the highest median family income of $112,936, while families with no earners (3,544) have the lowest median family income of $30,277, accounting for 16.0% and 13.8% of families, respectively.
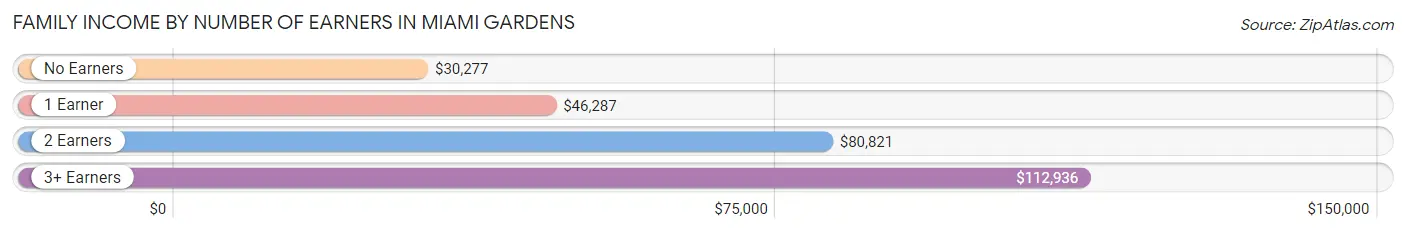
| Number of Earners | # Families | Median Income |
| No Earners | 3,544 (13.8%) | $30,277 |
| 1 Earner | 9,123 (35.5%) | $46,287 |
| 2 Earners | 8,878 (34.6%) | $80,821 |
| 3+ Earners | 4,114 (16.0%) | $112,936 |
| Total | 25,659 (100.0%) | $63,027 |
Household Income in Miami Gardens
Household Income Brackets in Miami Gardens
With 6,527 households falling in the category, the $50,000 to $74,999 income range is the most frequent in Miami Gardens, accounting for 19.0% of all households. In contrast, only 1,340 households (3.9%) fall into the $150,000 to $199,999 income bracket, making it the least populous group.
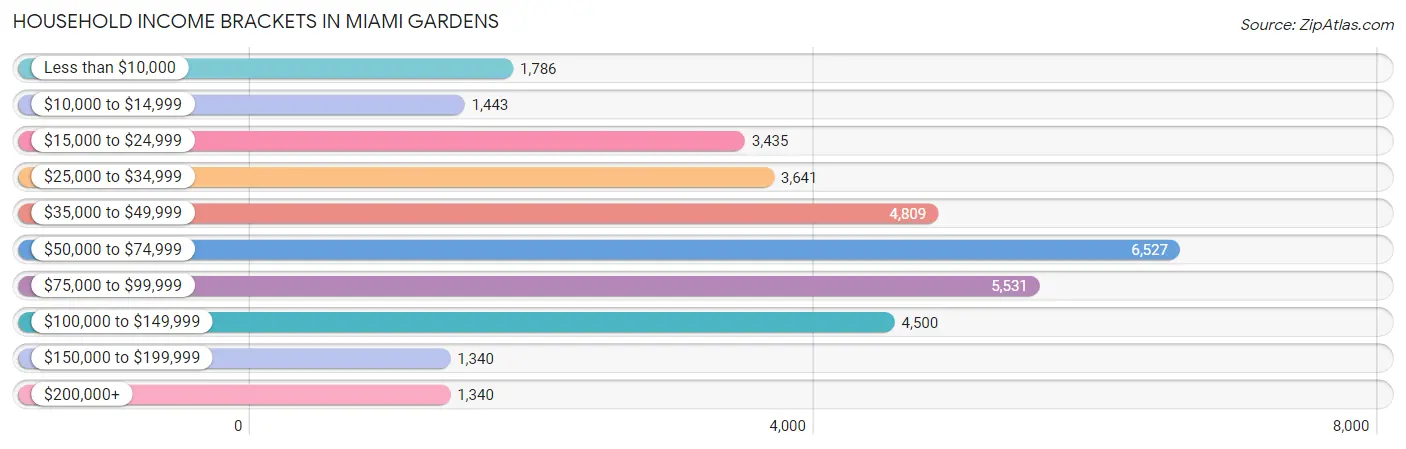
| Income Bracket | # Households | % Households |
| Less than $10,000 | 1,786 | 5.2% |
| $10,000 to $14,999 | 1,443 | 4.2% |
| $15,000 to $24,999 | 3,435 | 10.0% |
| $25,000 to $34,999 | 3,641 | 10.6% |
| $35,000 to $49,999 | 4,809 | 14.0% |
| $50,000 to $74,999 | 6,527 | 19.0% |
| $75,000 to $99,999 | 5,531 | 16.1% |
| $100,000 to $149,999 | 4,500 | 13.1% |
| $150,000 to $199,999 | 1,340 | 3.9% |
| $200,000+ | 1,340 | 3.9% |
Household Income by Householder Age in Miami Gardens
The median household income in Miami Gardens is $56,071, with the highest median household income of $68,754 found in the 45 to 64 years age bracket for the primary householder. A total of 14,256 households (41.5%) fall into this category. Meanwhile, the 15 to 24 years age bracket for the primary householder has the lowest median household income of $32,717, with 492 households (1.4%) in this group.
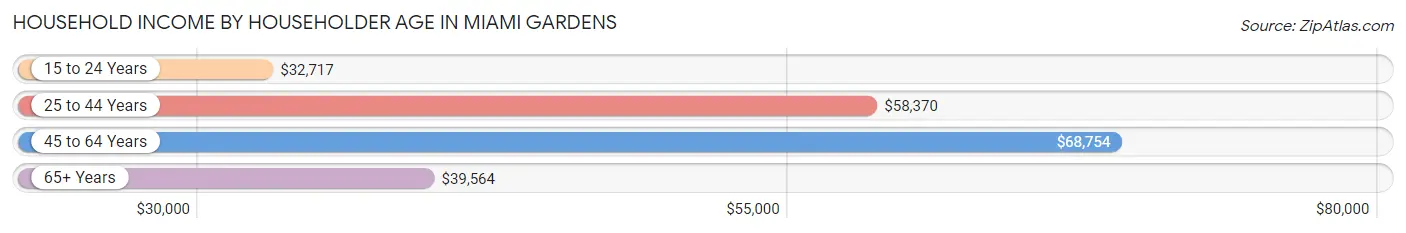
| Income Bracket | # Households | Median Income |
| 15 to 24 Years | 492 (1.4%) | $32,717 |
| 25 to 44 Years | 9,233 (26.9%) | $58,370 |
| 45 to 64 Years | 14,256 (41.5%) | $68,754 |
| 65+ Years | 10,370 (30.2%) | $39,564 |
| Total | 34,351 (100.0%) | $56,071 |
Poverty in Miami Gardens
Income Below Poverty by Sex and Age in Miami Gardens
With 14.3% poverty level for males and 16.5% for females among the residents of Miami Gardens, 5 year old males and 15 year old females are the most vulnerable to poverty, with 174 males (29.0%) and 282 females (49.9%) in their respective age groups living below the poverty level.
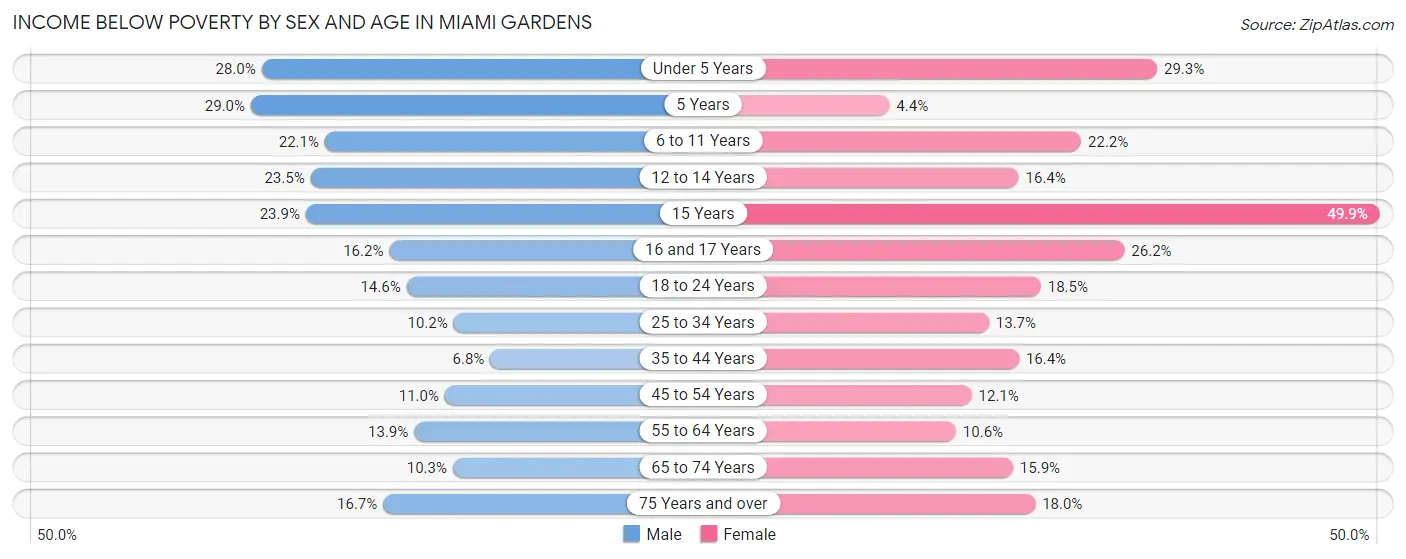
| Age Bracket | Male | Female |
| Under 5 Years | 820 (28.0%) | 878 (29.3%) |
| 5 Years | 174 (29.0%) | 21 (4.4%) |
| 6 to 11 Years | 930 (22.1%) | 894 (22.2%) |
| 12 to 14 Years | 700 (23.5%) | 420 (16.4%) |
| 15 Years | 132 (23.9%) | 282 (49.9%) |
| 16 and 17 Years | 265 (16.2%) | 389 (26.2%) |
| 18 to 24 Years | 644 (14.6%) | 874 (18.5%) |
| 25 to 34 Years | 753 (10.2%) | 1,187 (13.7%) |
| 35 to 44 Years | 485 (6.8%) | 1,056 (16.4%) |
| 45 to 54 Years | 740 (11.0%) | 922 (12.0%) |
| 55 to 64 Years | 876 (13.9%) | 796 (10.6%) |
| 65 to 74 Years | 456 (10.3%) | 923 (15.9%) |
| 75 Years and over | 515 (16.7%) | 916 (17.9%) |
| Total | 7,490 (14.3%) | 9,558 (16.5%) |
Income Above Poverty by Sex and Age in Miami Gardens
According to the poverty statistics in Miami Gardens, males aged 35 to 44 years and females aged 5 years are the age groups that are most secure financially, with 93.2% of males and 95.6% of females in these age groups living above the poverty line.
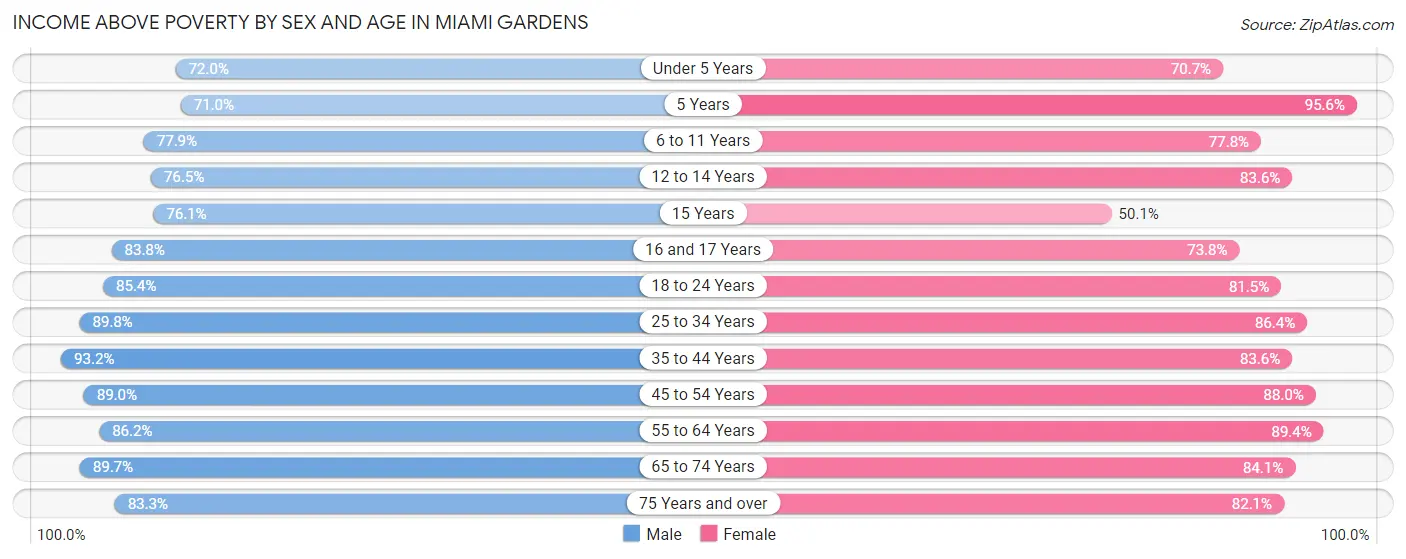
| Age Bracket | Male | Female |
| Under 5 Years | 2,108 (72.0%) | 2,123 (70.7%) |
| 5 Years | 426 (71.0%) | 454 (95.6%) |
| 6 to 11 Years | 3,271 (77.9%) | 3,132 (77.8%) |
| 12 to 14 Years | 2,282 (76.5%) | 2,140 (83.6%) |
| 15 Years | 420 (76.1%) | 283 (50.1%) |
| 16 and 17 Years | 1,375 (83.8%) | 1,094 (73.8%) |
| 18 to 24 Years | 3,779 (85.4%) | 3,859 (81.5%) |
| 25 to 34 Years | 6,634 (89.8%) | 7,511 (86.4%) |
| 35 to 44 Years | 6,662 (93.2%) | 5,368 (83.6%) |
| 45 to 54 Years | 5,990 (89.0%) | 6,730 (87.9%) |
| 55 to 64 Years | 5,450 (86.2%) | 6,724 (89.4%) |
| 65 to 74 Years | 3,990 (89.7%) | 4,891 (84.1%) |
| 75 Years and over | 2,563 (83.3%) | 4,186 (82.1%) |
| Total | 44,950 (85.7%) | 48,495 (83.5%) |
Income Below Poverty Among Married-Couple Families in Miami Gardens
The poverty statistics for married-couple families in Miami Gardens show that 7.9% or 1,029 of the total 13,073 families live below the poverty line. Families with 5 or more children have the highest poverty rate of 58.7%, comprising of 121 families. On the other hand, families with no children have the lowest poverty rate of 5.3%, which includes 379 families.
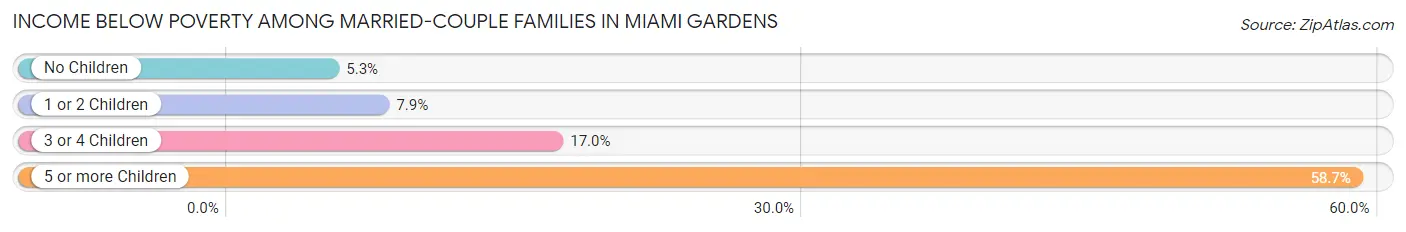
| Children | Above Poverty | Below Poverty |
| No Children | 6,792 (94.7%) | 379 (5.3%) |
| 1 or 2 Children | 4,449 (92.1%) | 382 (7.9%) |
| 3 or 4 Children | 718 (83.0%) | 147 (17.0%) |
| 5 or more Children | 85 (41.3%) | 121 (58.7%) |
| Total | 12,044 (92.1%) | 1,029 (7.9%) |
Income Below Poverty Among Single-Parent Households in Miami Gardens
According to the poverty data in Miami Gardens, 12.4% or 380 single-father households and 16.9% or 1,605 single-mother households are living below the poverty line. Among single-father households, those with 3 or 4 children have the highest poverty rate, with 112 households (36.1%) experiencing poverty. Likewise, among single-mother households, those with 5 or more children have the highest poverty rate, with 65 households (65.7%) falling below the poverty line.
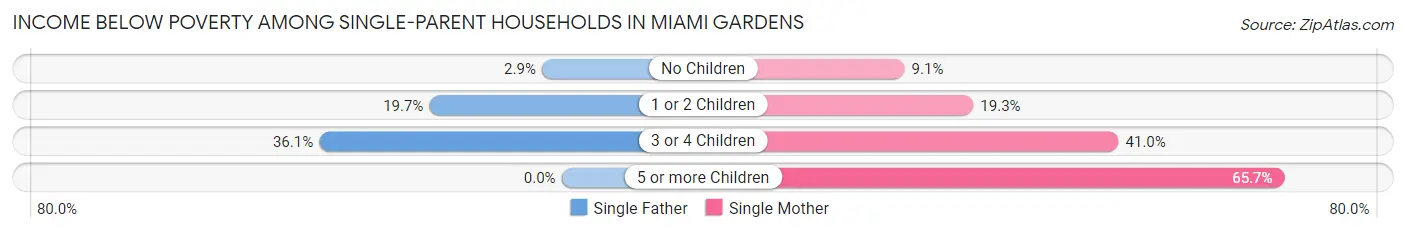
| Children | Single Father | Single Mother |
| No Children | 48 (2.9%) | 389 (9.1%) |
| 1 or 2 Children | 220 (19.7%) | 856 (19.3%) |
| 3 or 4 Children | 112 (36.1%) | 295 (41.0%) |
| 5 or more Children | 0 (0.0%) | 65 (65.7%) |
| Total | 380 (12.4%) | 1,605 (16.9%) |
Income Below Poverty Among Married-Couple vs Single-Parent Households in Miami Gardens
The poverty data for Miami Gardens shows that 1,029 of the married-couple family households (7.9%) and 1,985 of the single-parent households (15.8%) are living below the poverty level. Within the married-couple family households, those with 5 or more children have the highest poverty rate, with 121 households (58.7%) falling below the poverty line. Among the single-parent households, those with 5 or more children have the highest poverty rate, with 65 household (65.7%) living below poverty.
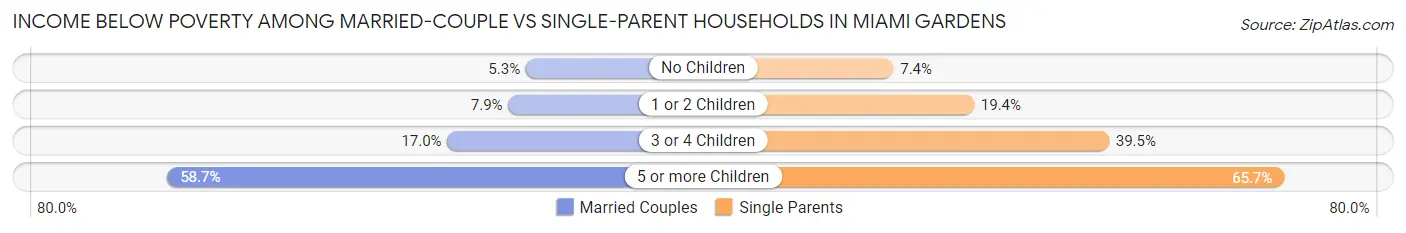
| Children | Married-Couple Families | Single-Parent Households |
| No Children | 379 (5.3%) | 437 (7.4%) |
| 1 or 2 Children | 382 (7.9%) | 1,076 (19.4%) |
| 3 or 4 Children | 147 (17.0%) | 407 (39.5%) |
| 5 or more Children | 121 (58.7%) | 65 (65.7%) |
| Total | 1,029 (7.9%) | 1,985 (15.8%) |
Race in Miami Gardens
The most populous races in Miami Gardens are Black / African American (72,624 | 65.1%), Hispanic or Latino (37,171 | 33.3%), and White / Caucasian (17,049 | 15.3%).
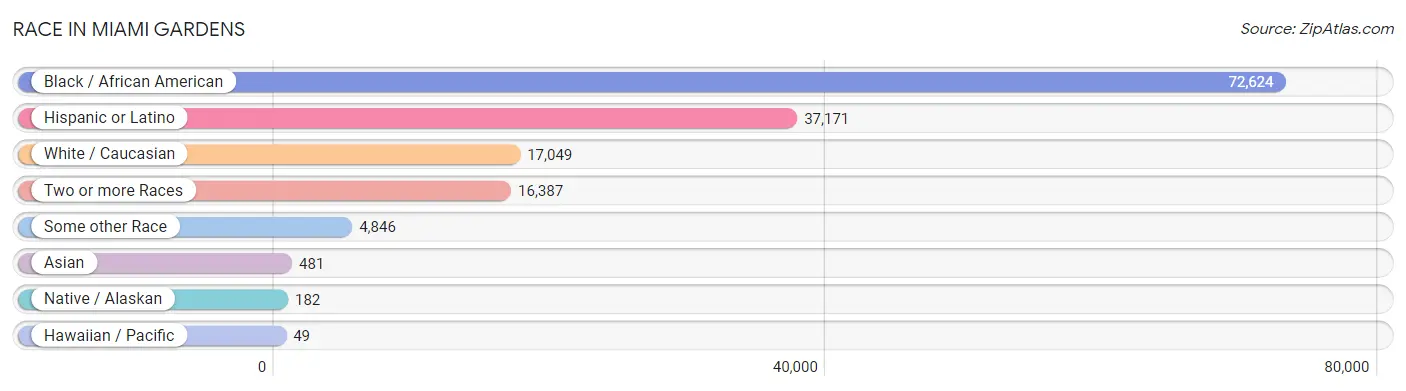
| Race | # Population | % Population |
| Asian | 481 | 0.4% |
| Black / African American | 72,624 | 65.1% |
| Hawaiian / Pacific | 49 | 0.0% |
| Hispanic or Latino | 37,171 | 33.3% |
| Native / Alaskan | 182 | 0.2% |
| White / Caucasian | 17,049 | 15.3% |
| Two or more Races | 16,387 | 14.7% |
| Some other Race | 4,846 | 4.3% |
| Total | 111,618 | 100.0% |
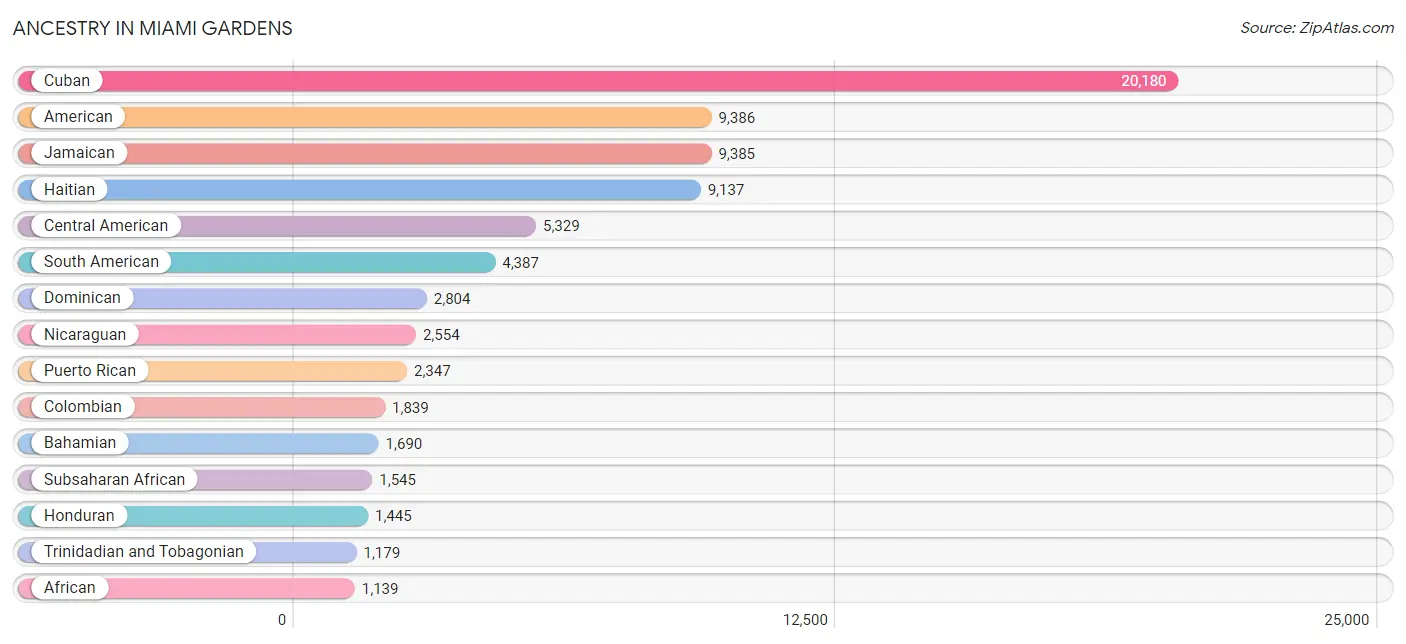
Ancestry in Miami Gardens
The most populous ancestries reported in Miami Gardens are Cuban (20,180 | 18.1%), American (9,386 | 8.4%), Jamaican (9,385 | 8.4%), Haitian (9,137 | 8.2%), and Central American (5,329 | 4.8%), together accounting for 47.9% of all Miami Gardens residents.
| Ancestry | # Population | % Population |
| Afghan | 58 | 0.1% |
| African | 1,139 | 1.0% |
| American | 9,386 | 8.4% |
| Arab | 965 | 0.9% |
| Argentinean | 295 | 0.3% |
| Australian | 98 | 0.1% |
| Bahamian | 1,690 | 1.5% |
| Barbadian | 68 | 0.1% |
| Belizean | 9 | 0.0% |
| Bhutanese | 27 | 0.0% |
| Blackfeet | 9 | 0.0% |
| Bolivian | 35 | 0.0% |
| Brazilian | 17 | 0.0% |
| British | 66 | 0.1% |
| British West Indian | 343 | 0.3% |
| Burmese | 25 | 0.0% |
| Canadian | 72 | 0.1% |
| Central American | 5,329 | 4.8% |
| Central American Indian | 67 | 0.1% |
| Cherokee | 27 | 0.0% |
| Chilean | 11 | 0.0% |
| Chippewa | 12 | 0.0% |
| Colombian | 1,839 | 1.7% |
| Costa Rican | 92 | 0.1% |
| Cuban | 20,180 | 18.1% |
| Czech | 95 | 0.1% |
| Danish | 16 | 0.0% |
| Dominican | 2,804 | 2.5% |
| Dutch | 24 | 0.0% |
| Dutch West Indian | 36 | 0.0% |
| Ecuadorian | 991 | 0.9% |
| Egyptian | 57 | 0.1% |
| English | 243 | 0.2% |
| Ethiopian | 6 | 0.0% |
| European | 11 | 0.0% |
| French | 130 | 0.1% |
| French Canadian | 9 | 0.0% |
| German | 223 | 0.2% |
| Greek | 4 | 0.0% |
| Guatemalan | 397 | 0.4% |
| Guyanese | 71 | 0.1% |
| Haitian | 9,137 | 8.2% |
| Honduran | 1,445 | 1.3% |
| Hungarian | 6 | 0.0% |
| Indian (Asian) | 105 | 0.1% |
| Iraqi | 79 | 0.1% |
| Irish | 239 | 0.2% |
| Israeli | 22 | 0.0% |
| Italian | 388 | 0.4% |
| Jamaican | 9,385 | 8.4% |
| Japanese | 15 | 0.0% |
| Korean | 143 | 0.1% |
| Lebanese | 31 | 0.0% |
| Lithuanian | 8 | 0.0% |
| Mexican | 900 | 0.8% |
| Nicaraguan | 2,554 | 2.3% |
| Nigerian | 400 | 0.4% |
| Norwegian | 69 | 0.1% |
| Panamanian | 557 | 0.5% |
| Peruvian | 501 | 0.4% |
| Polish | 11 | 0.0% |
| Portuguese | 34 | 0.0% |
| Puerto Rican | 2,347 | 2.1% |
| Russian | 55 | 0.1% |
| Salvadoran | 242 | 0.2% |
| Scottish | 94 | 0.1% |
| Seminole | 39 | 0.0% |
| South American | 4,387 | 3.9% |
| Spaniard | 77 | 0.1% |
| Spanish | 9 | 0.0% |
| Sri Lankan | 8 | 0.0% |
| Subsaharan African | 1,545 | 1.4% |
| Swedish | 31 | 0.0% |
| Syrian | 89 | 0.1% |
| Thai | 308 | 0.3% |
| Tongan | 39 | 0.0% |
| Trinidadian and Tobagonian | 1,179 | 1.1% |
| U.S. Virgin Islander | 143 | 0.1% |
| Uruguayan | 26 | 0.0% |
| Venezuelan | 689 | 0.6% |
| West Indian | 244 | 0.2% | View All 81 Rows |
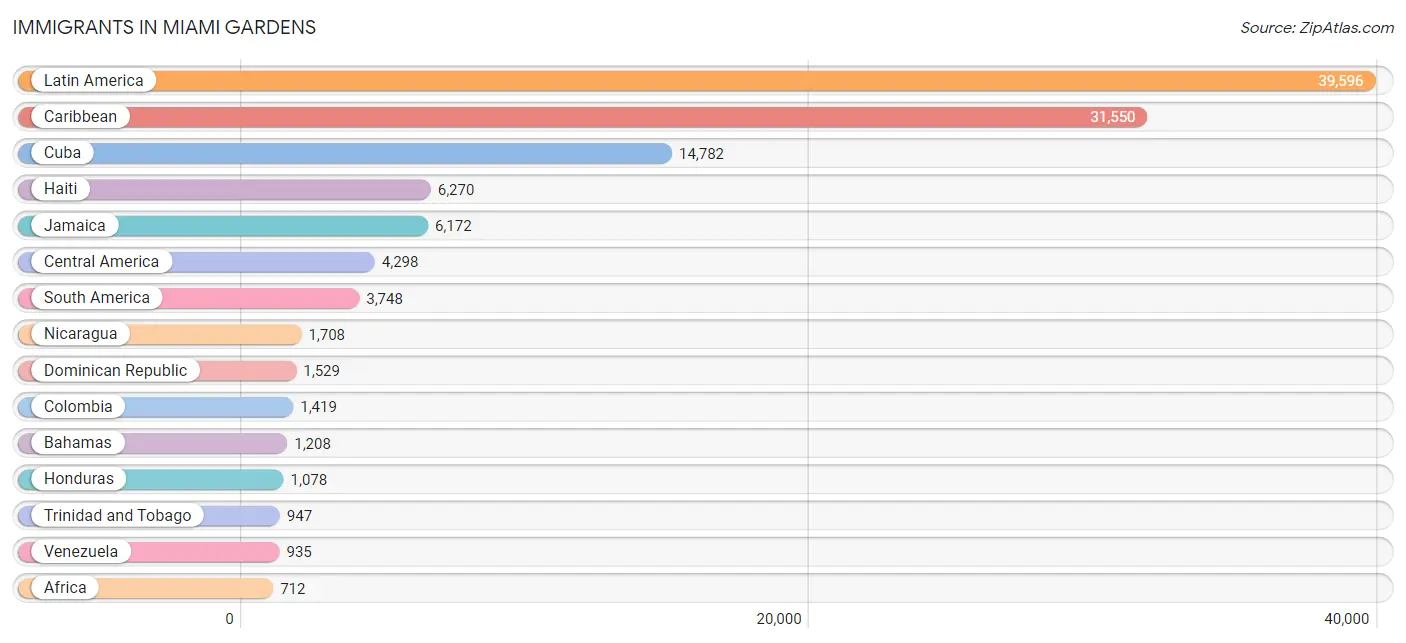
Immigrants in Miami Gardens
The most numerous immigrant groups reported in Miami Gardens came from Latin America (39,596 | 35.5%), Caribbean (31,550 | 28.3%), Cuba (14,782 | 13.2%), Haiti (6,270 | 5.6%), and Jamaica (6,172 | 5.5%), together accounting for 88.1% of all Miami Gardens residents.
| Immigration Origin | # Population | % Population |
| Afghanistan | 58 | 0.1% |
| Africa | 712 | 0.6% |
| Argentina | 202 | 0.2% |
| Asia | 526 | 0.5% |
| Australia | 39 | 0.0% |
| Bahamas | 1,208 | 1.1% |
| Barbados | 77 | 0.1% |
| Belize | 9 | 0.0% |
| Bolivia | 13 | 0.0% |
| Brazil | 36 | 0.0% |
| Cambodia | 15 | 0.0% |
| Canada | 66 | 0.1% |
| Caribbean | 31,550 | 28.3% |
| Central America | 4,298 | 3.8% |
| Chile | 11 | 0.0% |
| China | 40 | 0.0% |
| Colombia | 1,419 | 1.3% |
| Costa Rica | 47 | 0.0% |
| Cuba | 14,782 | 13.2% |
| Dominica | 187 | 0.2% |
| Dominican Republic | 1,529 | 1.4% |
| Eastern Africa | 24 | 0.0% |
| Eastern Asia | 92 | 0.1% |
| Ecuador | 633 | 0.6% |
| Egypt | 51 | 0.1% |
| El Salvador | 166 | 0.2% |
| England | 44 | 0.0% |
| Europe | 197 | 0.2% |
| France | 15 | 0.0% |
| Germany | 12 | 0.0% |
| Grenada | 96 | 0.1% |
| Guatemala | 322 | 0.3% |
| Guyana | 58 | 0.1% |
| Haiti | 6,270 | 5.6% |
| Honduras | 1,078 | 1.0% |
| India | 126 | 0.1% |
| Indonesia | 68 | 0.1% |
| Iraq | 44 | 0.0% |
| Ireland | 11 | 0.0% |
| Italy | 8 | 0.0% |
| Jamaica | 6,172 | 5.5% |
| Kenya | 24 | 0.0% |
| Korea | 52 | 0.1% |
| Latin America | 39,596 | 35.5% |
| Lebanon | 17 | 0.0% |
| Mexico | 464 | 0.4% |
| Morocco | 165 | 0.2% |
| Netherlands | 17 | 0.0% |
| Nicaragua | 1,708 | 1.5% |
| Nigeria | 465 | 0.4% |
| Northern Africa | 216 | 0.2% |
| Northern Europe | 118 | 0.1% |
| Norway | 25 | 0.0% |
| Oceania | 39 | 0.0% |
| Panama | 504 | 0.4% |
| Peru | 415 | 0.4% |
| Philippines | 61 | 0.1% |
| Saudi Arabia | 25 | 0.0% |
| South Africa | 7 | 0.0% |
| South America | 3,748 | 3.4% |
| South Central Asia | 184 | 0.2% |
| South Eastern Asia | 152 | 0.1% |
| Southern Europe | 35 | 0.0% |
| Spain | 27 | 0.0% |
| St. Vincent and the Grenadines | 52 | 0.1% |
| Syria | 12 | 0.0% |
| Trinidad and Tobago | 947 | 0.9% |
| Uruguay | 26 | 0.0% |
| Venezuela | 935 | 0.8% |
| Vietnam | 8 | 0.0% |
| West Indies | 29 | 0.0% |
| Western Africa | 465 | 0.4% |
| Western Asia | 98 | 0.1% |
| Western Europe | 44 | 0.0% | View All 74 Rows |
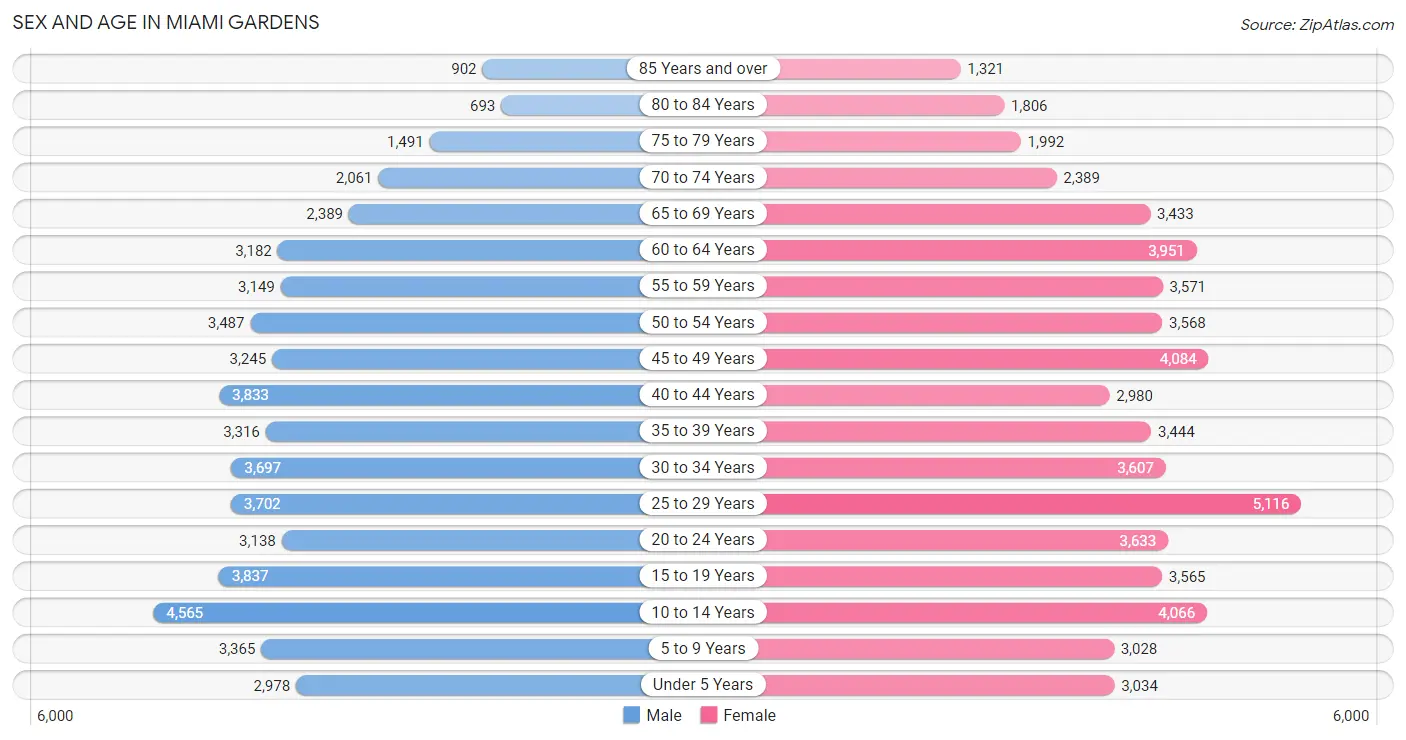
Sex and Age in Miami Gardens
Sex and Age in Miami Gardens
The most populous age groups in Miami Gardens are 10 to 14 Years (4,565 | 8.6%) for men and 25 to 29 Years (5,116 | 8.7%) for women.
| Age Bracket | Male | Female |
| Under 5 Years | 2,978 (5.6%) | 3,034 (5.2%) |
| 5 to 9 Years | 3,365 (6.4%) | 3,028 (5.2%) |
| 10 to 14 Years | 4,565 (8.6%) | 4,066 (6.9%) |
| 15 to 19 Years | 3,837 (7.2%) | 3,565 (6.1%) |
| 20 to 24 Years | 3,138 (5.9%) | 3,633 (6.2%) |
| 25 to 29 Years | 3,702 (7.0%) | 5,116 (8.7%) |
| 30 to 34 Years | 3,697 (7.0%) | 3,607 (6.2%) |
| 35 to 39 Years | 3,316 (6.2%) | 3,444 (5.9%) |
| 40 to 44 Years | 3,833 (7.2%) | 2,980 (5.1%) |
| 45 to 49 Years | 3,245 (6.1%) | 4,084 (7.0%) |
| 50 to 54 Years | 3,487 (6.6%) | 3,568 (6.1%) |
| 55 to 59 Years | 3,149 (5.9%) | 3,571 (6.1%) |
| 60 to 64 Years | 3,182 (6.0%) | 3,951 (6.7%) |
| 65 to 69 Years | 2,389 (4.5%) | 3,433 (5.9%) |
| 70 to 74 Years | 2,061 (3.9%) | 2,389 (4.1%) |
| 75 to 79 Years | 1,491 (2.8%) | 1,992 (3.4%) |
| 80 to 84 Years | 693 (1.3%) | 1,806 (3.1%) |
| 85 Years and over | 902 (1.7%) | 1,321 (2.2%) |
| Total | 53,030 (100.0%) | 58,588 (100.0%) |
Families and Households in Miami Gardens
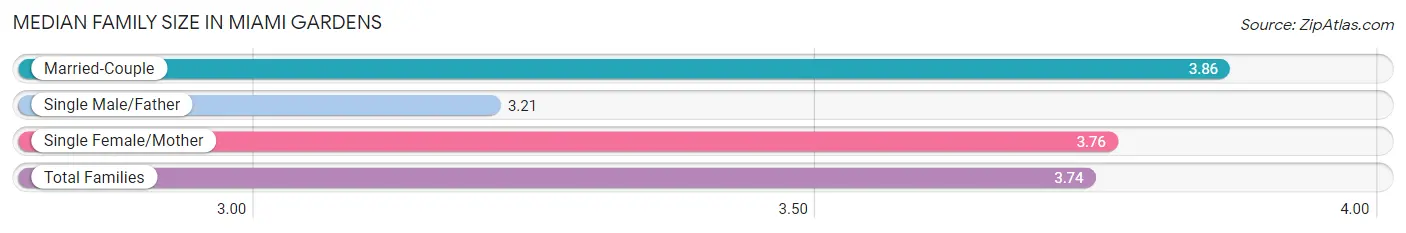
Median Family Size in Miami Gardens
The median family size in Miami Gardens is 3.74 persons per family, with married-couple families (13,073 | 50.9%) accounting for the largest median family size of 3.86 persons per family. On the other hand, single male/father families (3,059 | 11.9%) represent the smallest median family size with 3.21 persons per family.
| Family Type | # Families | Family Size |
| Married-Couple | 13,073 (50.9%) | 3.86 |
| Single Male/Father | 3,059 (11.9%) | 3.21 |
| Single Female/Mother | 9,527 (37.1%) | 3.76 |
| Total Families | 25,659 (100.0%) | 3.74 |
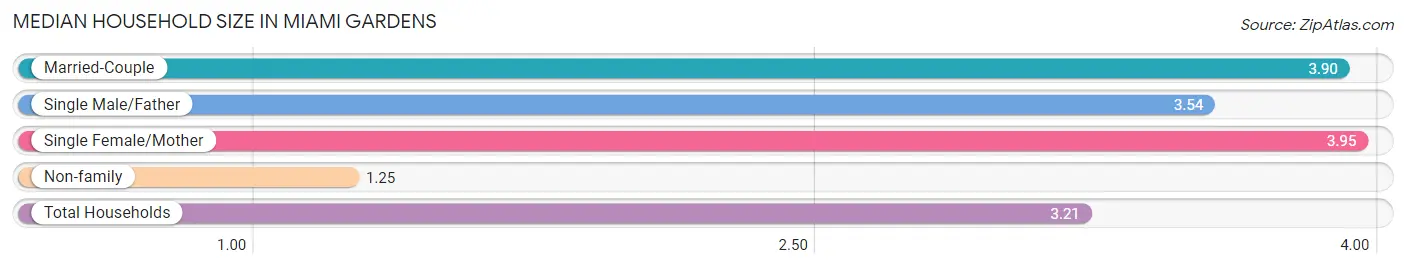
Median Household Size in Miami Gardens
The median household size in Miami Gardens is 3.21 persons per household, with single female/mother households (9,527 | 27.7%) accounting for the largest median household size of 3.95 persons per household. non-family households (8,692 | 25.3%) represent the smallest median household size with 1.25 persons per household.
| Household Type | # Households | Household Size |
| Married-Couple | 13,073 (38.1%) | 3.90 |
| Single Male/Father | 3,059 (8.9%) | 3.54 |
| Single Female/Mother | 9,527 (27.7%) | 3.95 |
| Non-family | 8,692 (25.3%) | 1.25 |
| Total Households | 34,351 (100.0%) | 3.21 |
Household Size by Marriage Status in Miami Gardens
Out of a total of 34,351 households in Miami Gardens, 25,659 (74.7%) are family households, while 8,692 (25.3%) are nonfamily households. The most numerous type of family households are 2-person households, comprising 8,077, and the most common type of nonfamily households are 1-person households, comprising 7,322.
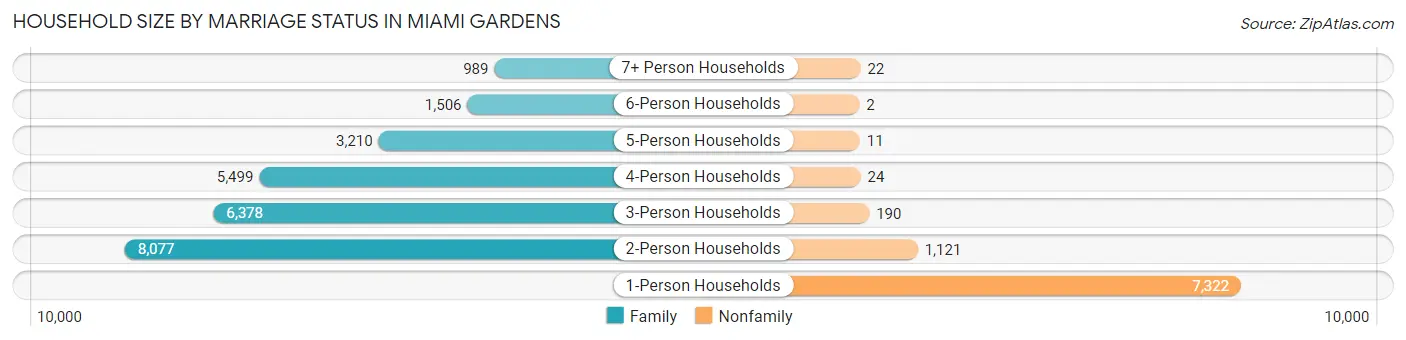
| Household Size | Family Households | Nonfamily Households |
| 1-Person Households | - | 7,322 (21.3%) |
| 2-Person Households | 8,077 (23.5%) | 1,121 (3.3%) |
| 3-Person Households | 6,378 (18.6%) | 190 (0.5%) |
| 4-Person Households | 5,499 (16.0%) | 24 (0.1%) |
| 5-Person Households | 3,210 (9.3%) | 11 (0.0%) |
| 6-Person Households | 1,506 (4.4%) | 2 (0.0%) |
| 7+ Person Households | 989 (2.9%) | 22 (0.1%) |
| Total | 25,659 (74.7%) | 8,692 (25.3%) |
Female Fertility in Miami Gardens
Fertility by Age in Miami Gardens
Average fertility rate in Miami Gardens is 33.0 births per 1,000 women. Women in the age bracket of 20 to 34 years have the highest fertility rate with 64.0 births per 1,000 women. Women in the age bracket of 20 to 34 years acount for 87.9% of all women with births.
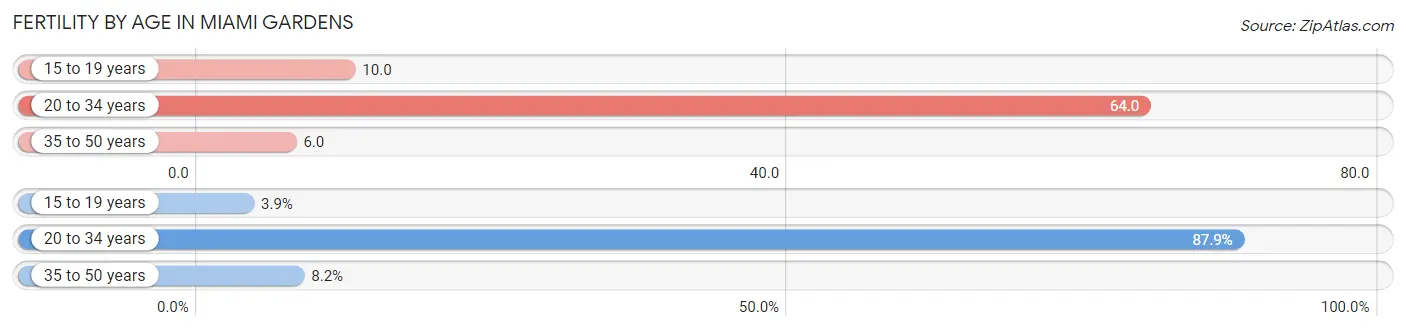
| Age Bracket | Women with Births | Births / 1,000 Women |
| 15 to 19 years | 35 (3.9%) | 10.0 |
| 20 to 34 years | 786 (87.9%) | 64.0 |
| 35 to 50 years | 73 (8.2%) | 6.0 |
| Total | 894 (100.0%) | 33.0 |
Fertility by Age by Marriage Status in Miami Gardens
26.2% of women with births (894) in Miami Gardens are married. The highest percentage of unmarried women with births falls into 15 to 19 years age bracket with 100.0% of them unmarried at the time of birth, while the lowest percentage of unmarried women with births belong to 35 to 50 years age bracket with 68.5% of them unmarried.
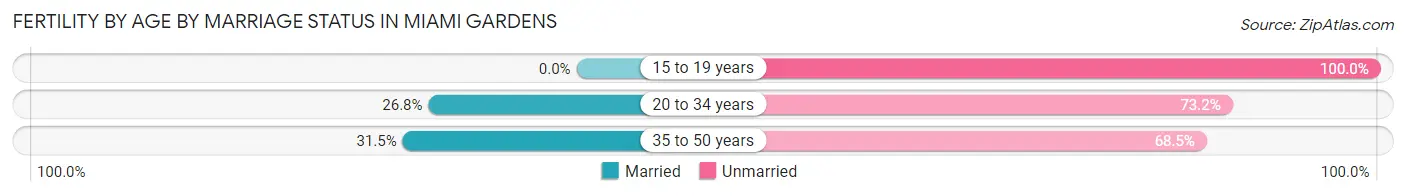
| Age Bracket | Married | Unmarried |
| 15 to 19 years | 0 (0.0%) | 35 (100.0%) |
| 20 to 34 years | 211 (26.8%) | 575 (73.2%) |
| 35 to 50 years | 23 (31.5%) | 50 (68.5%) |
| Total | 234 (26.2%) | 660 (73.8%) |
Fertility by Education in Miami Gardens
Average fertility rate in Miami Gardens is 33.0 births per 1,000 women. Women with the education attainment of college or associate's degree have the highest fertility rate of 39.0 births per 1,000 women, while women with the education attainment of bachelor's degree have the lowest fertility at 20.0 births per 1,000 women. Women with the education attainment of college or associate's degree represent 41.0% of all women with births.
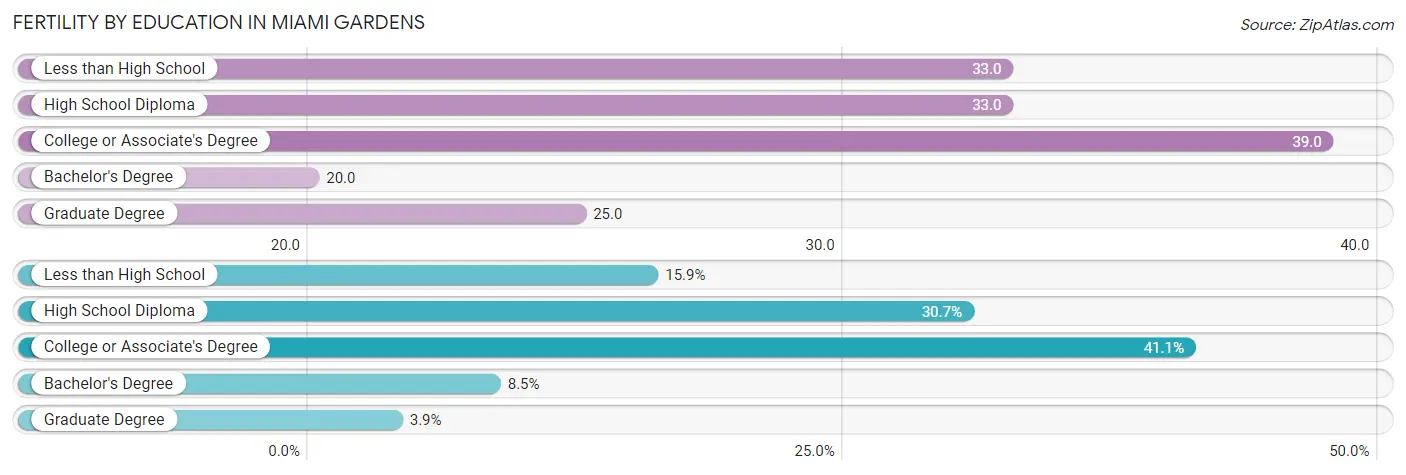
| Educational Attainment | Women with Births | Births / 1,000 Women |
| Less than High School | 142 (15.9%) | 33.0 |
| High School Diploma | 274 (30.6%) | 33.0 |
| College or Associate's Degree | 367 (41.0%) | 39.0 |
| Bachelor's Degree | 76 (8.5%) | 20.0 |
| Graduate Degree | 35 (3.9%) | 25.0 |
| Total | 894 (100.0%) | 33.0 |
Fertility by Education by Marriage Status in Miami Gardens
73.8% of women with births in Miami Gardens are unmarried. Women with the educational attainment of graduate degree are most likely to be married with 100.0% of them married at childbirth, while women with the educational attainment of college or associate's degree are least likely to be married with 84.7% of them unmarried at childbirth.
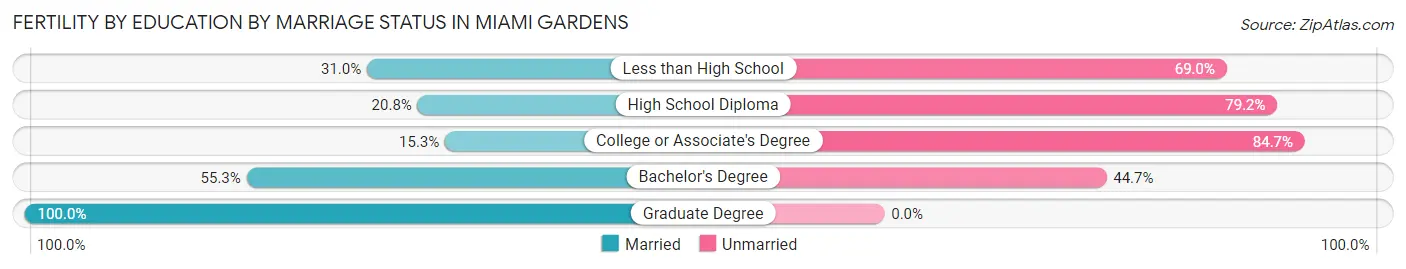
| Educational Attainment | Married | Unmarried |
| Less than High School | 44 (31.0%) | 98 (69.0%) |
| High School Diploma | 57 (20.8%) | 217 (79.2%) |
| College or Associate's Degree | 56 (15.3%) | 311 (84.7%) |
| Bachelor's Degree | 42 (55.3%) | 34 (44.7%) |
| Graduate Degree | 35 (100.0%) | 0 (0.0%) |
| Total | 234 (26.2%) | 660 (73.8%) |
Employment Characteristics in Miami Gardens
Employment by Class of Employer in Miami Gardens
Among the 49,218 employed individuals in Miami Gardens, private company employees (34,320 | 69.7%), local government employees (4,672 | 9.5%), and self-employed (not incorporated) (3,169 | 6.4%) make up the most common classes of employment.
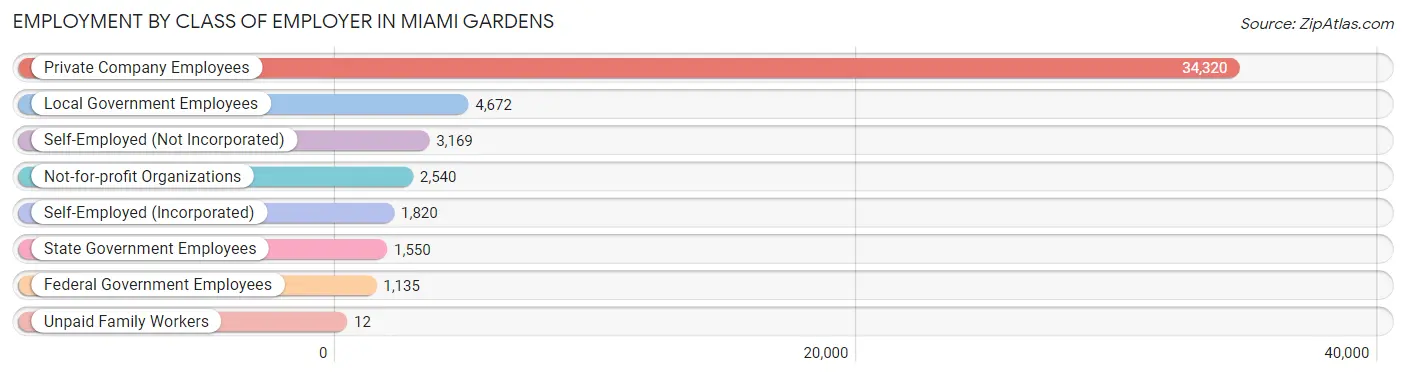
| Employer Class | # Employees | % Employees |
| Private Company Employees | 34,320 | 69.7% |
| Self-Employed (Incorporated) | 1,820 | 3.7% |
| Self-Employed (Not Incorporated) | 3,169 | 6.4% |
| Not-for-profit Organizations | 2,540 | 5.2% |
| Local Government Employees | 4,672 | 9.5% |
| State Government Employees | 1,550 | 3.2% |
| Federal Government Employees | 1,135 | 2.3% |
| Unpaid Family Workers | 12 | 0.0% |
| Total | 49,218 | 100.0% |
Employment Status by Age in Miami Gardens
According to the labor force statistics for Miami Gardens, out of the total population over 16 years of age (89,463), 61.1% or 54,662 individuals are in the labor force, with 7.9% or 4,318 of them unemployed. The age group with the highest labor force participation rate is 35 to 44 years, with 86.0% or 11,673 individuals in the labor force. Within the labor force, the 16 to 19 years age range has the highest percentage of unemployed individuals, with 16.6% or 298 of them being unemployed.
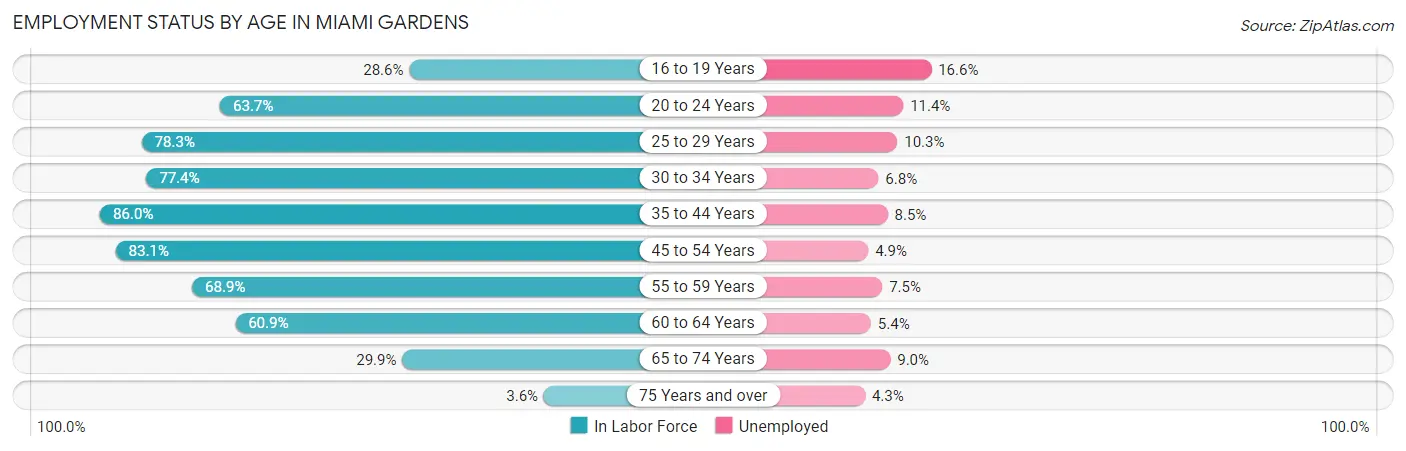
| Age Bracket | In Labor Force | Unemployed |
| 16 to 19 Years | 1,797 (28.6%) | 298 (16.6%) |
| 20 to 24 Years | 4,313 (63.7%) | 492 (11.4%) |
| 25 to 29 Years | 6,904 (78.3%) | 711 (10.3%) |
| 30 to 34 Years | 5,653 (77.4%) | 384 (6.8%) |
| 35 to 44 Years | 11,673 (86.0%) | 992 (8.5%) |
| 45 to 54 Years | 11,953 (83.1%) | 586 (4.9%) |
| 55 to 59 Years | 4,630 (68.9%) | 347 (7.5%) |
| 60 to 64 Years | 4,344 (60.9%) | 235 (5.4%) |
| 65 to 74 Years | 3,071 (29.9%) | 276 (9.0%) |
| 75 Years and over | 295 (3.6%) | 13 (4.3%) |
| Total | 54,662 (61.1%) | 4,318 (7.9%) |
Employment Status by Educational Attainment in Miami Gardens
According to labor force statistics for Miami Gardens, 77.9% of individuals (45,129) out of the total population between 25 and 64 years of age (57,932) are in the labor force, with 7.2% or 3,249 of them being unemployed. The group with the highest labor force participation rate are those with the educational attainment of bachelor's degree or higher, with 87.7% or 9,568 individuals in the labor force. Within the labor force, individuals with high school diploma education have the highest percentage of unemployment, with 8.4% or 1,371 of them being unemployed.
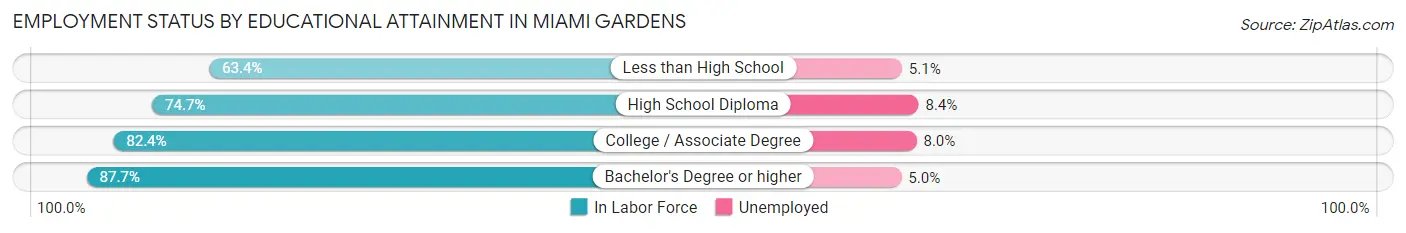
| Educational Attainment | In Labor Force | Unemployed |
| Less than High School | 4,922 (63.4%) | 396 (5.1%) |
| High School Diploma | 16,320 (74.7%) | 1,835 (8.4%) |
| College / Associate Degree | 14,347 (82.4%) | 1,393 (8.0%) |
| Bachelor's Degree or higher | 9,568 (87.7%) | 546 (5.0%) |
| Total | 45,129 (77.9%) | 4,171 (7.2%) |
Employment Occupations by Sex in Miami Gardens
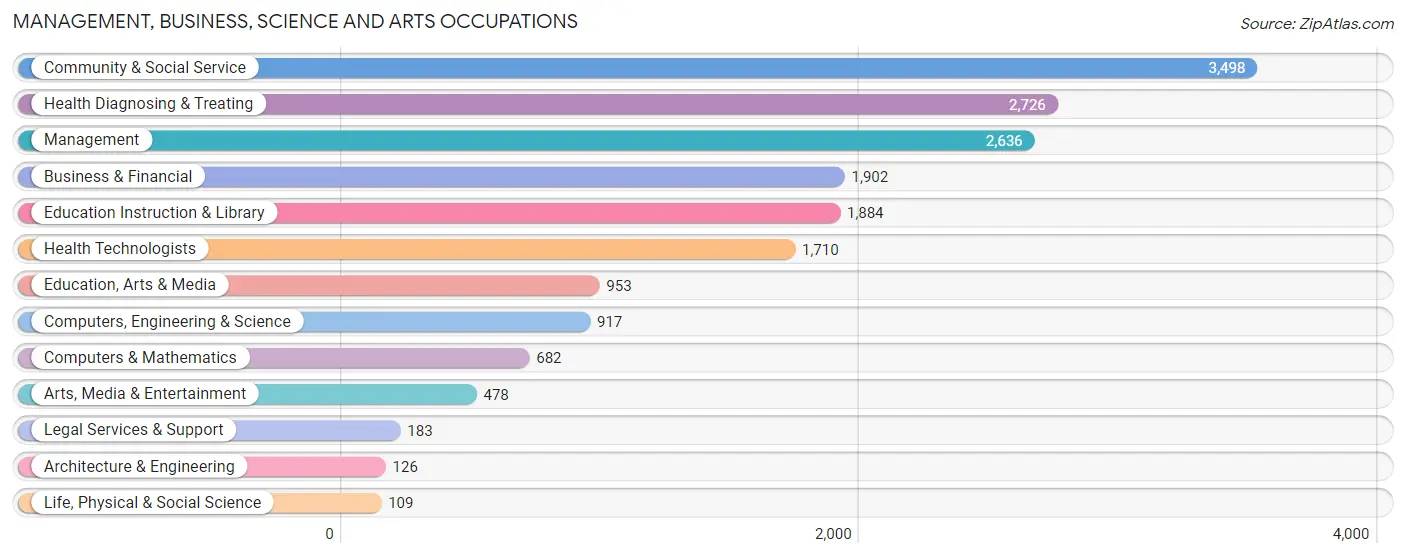
Management, Business, Science and Arts Occupations
The most common Management, Business, Science and Arts occupations in Miami Gardens are Community & Social Service (3,498 | 7.0%), Health Diagnosing & Treating (2,726 | 5.4%), Management (2,636 | 5.2%), Business & Financial (1,902 | 3.8%), and Education Instruction & Library (1,884 | 3.7%).
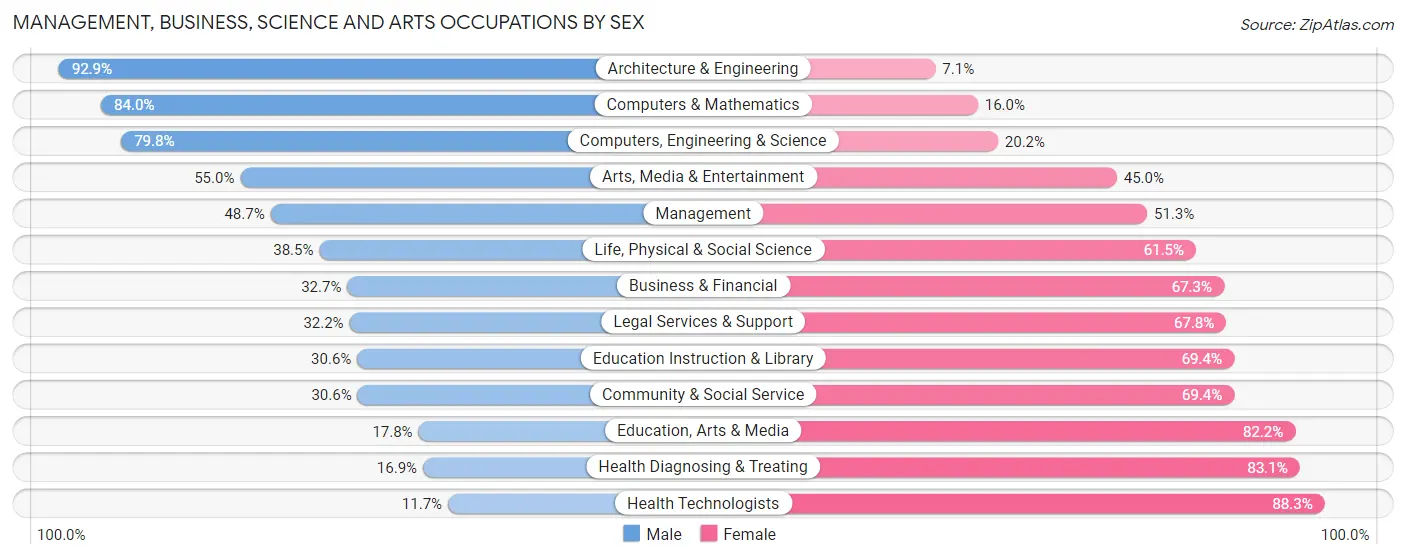
Management, Business, Science and Arts Occupations by Sex
Within the Management, Business, Science and Arts occupations in Miami Gardens, the most male-oriented occupations are Architecture & Engineering (92.9%), Computers & Mathematics (84.0%), and Computers, Engineering & Science (79.8%), while the most female-oriented occupations are Health Technologists (88.3%), Health Diagnosing & Treating (83.1%), and Education, Arts & Media (82.2%).
| Occupation | Male | Female |
| Management | 1,284 (48.7%) | 1,352 (51.3%) |
| Business & Financial | 622 (32.7%) | 1,280 (67.3%) |
| Computers, Engineering & Science | 732 (79.8%) | 185 (20.2%) |
| Computers & Mathematics | 573 (84.0%) | 109 (16.0%) |
| Architecture & Engineering | 117 (92.9%) | 9 (7.1%) |
| Life, Physical & Social Science | 42 (38.5%) | 67 (61.5%) |
| Community & Social Service | 1,069 (30.6%) | 2,429 (69.4%) |
| Education, Arts & Media | 170 (17.8%) | 783 (82.2%) |
| Legal Services & Support | 59 (32.2%) | 124 (67.8%) |
| Education Instruction & Library | 577 (30.6%) | 1,307 (69.4%) |
| Arts, Media & Entertainment | 263 (55.0%) | 215 (45.0%) |
| Health Diagnosing & Treating | 461 (16.9%) | 2,265 (83.1%) |
| Health Technologists | 200 (11.7%) | 1,510 (88.3%) |
| Total (Category) | 4,168 (35.7%) | 7,511 (64.3%) |
| Total (Overall) | 24,822 (49.3%) | 25,481 (50.7%) |
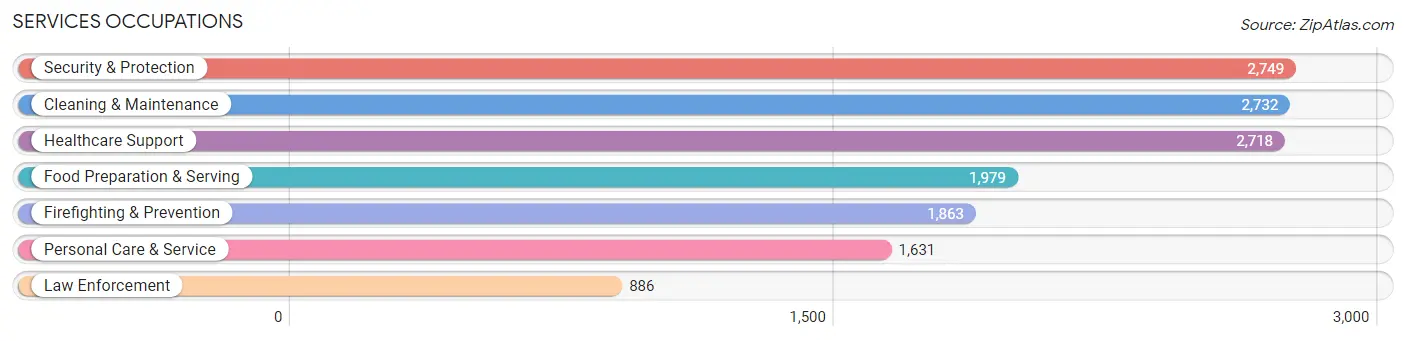
Services Occupations
The most common Services occupations in Miami Gardens are Security & Protection (2,749 | 5.5%), Cleaning & Maintenance (2,732 | 5.4%), Healthcare Support (2,718 | 5.4%), Food Preparation & Serving (1,979 | 3.9%), and Firefighting & Prevention (1,863 | 3.7%).
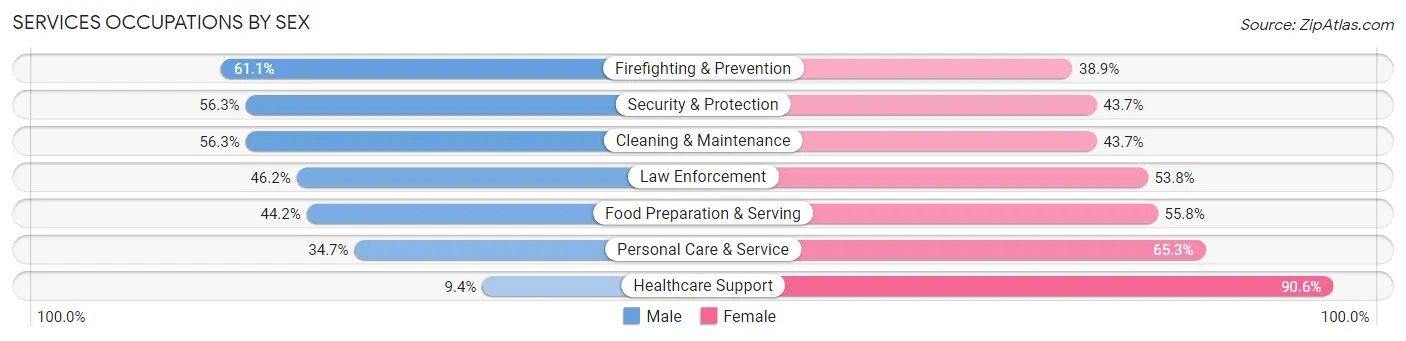
Services Occupations by Sex
Within the Services occupations in Miami Gardens, the most male-oriented occupations are Firefighting & Prevention (61.1%), Security & Protection (56.3%), and Cleaning & Maintenance (56.3%), while the most female-oriented occupations are Healthcare Support (90.6%), Personal Care & Service (65.3%), and Food Preparation & Serving (55.8%).
| Occupation | Male | Female |
| Healthcare Support | 255 (9.4%) | 2,463 (90.6%) |
| Security & Protection | 1,547 (56.3%) | 1,202 (43.7%) |
| Firefighting & Prevention | 1,138 (61.1%) | 725 (38.9%) |
| Law Enforcement | 409 (46.2%) | 477 (53.8%) |
| Food Preparation & Serving | 874 (44.2%) | 1,105 (55.8%) |
| Cleaning & Maintenance | 1,537 (56.3%) | 1,195 (43.7%) |
| Personal Care & Service | 566 (34.7%) | 1,065 (65.3%) |
| Total (Category) | 4,779 (40.5%) | 7,030 (59.5%) |
| Total (Overall) | 24,822 (49.3%) | 25,481 (50.7%) |
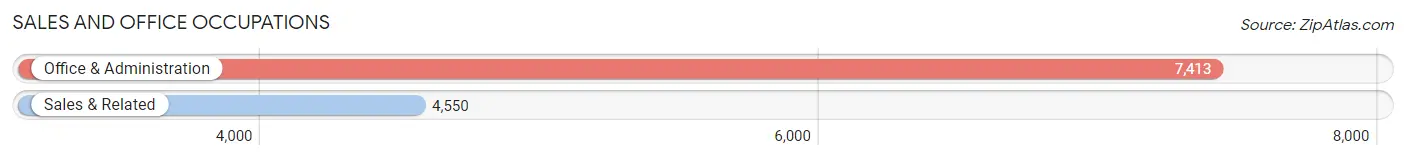
Sales and Office Occupations
The most common Sales and Office occupations in Miami Gardens are Office & Administration (7,413 | 14.7%), and Sales & Related (4,550 | 9.0%).
Sales and Office Occupations by Sex
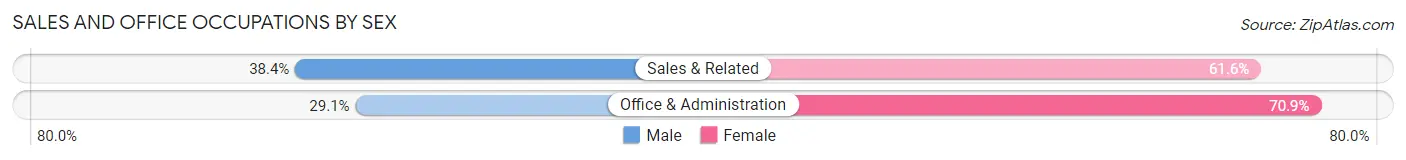
| Occupation | Male | Female |
| Sales & Related | 1,746 (38.4%) | 2,804 (61.6%) |
| Office & Administration | 2,158 (29.1%) | 5,255 (70.9%) |
| Total (Category) | 3,904 (32.6%) | 8,059 (67.4%) |
| Total (Overall) | 24,822 (49.3%) | 25,481 (50.7%) |
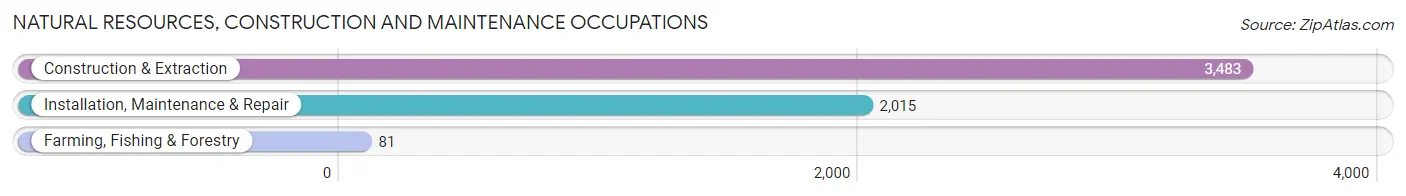
Natural Resources, Construction and Maintenance Occupations
The most common Natural Resources, Construction and Maintenance occupations in Miami Gardens are Construction & Extraction (3,483 | 6.9%), Installation, Maintenance & Repair (2,015 | 4.0%), and Farming, Fishing & Forestry (81 | 0.2%).
Natural Resources, Construction and Maintenance Occupations by Sex
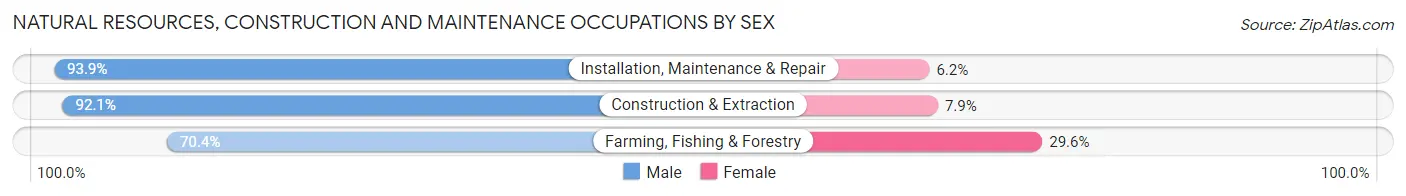
| Occupation | Male | Female |
| Farming, Fishing & Forestry | 57 (70.4%) | 24 (29.6%) |
| Construction & Extraction | 3,207 (92.1%) | 276 (7.9%) |
| Installation, Maintenance & Repair | 1,891 (93.9%) | 124 (6.1%) |
| Total (Category) | 5,155 (92.4%) | 424 (7.6%) |
| Total (Overall) | 24,822 (49.3%) | 25,481 (50.7%) |
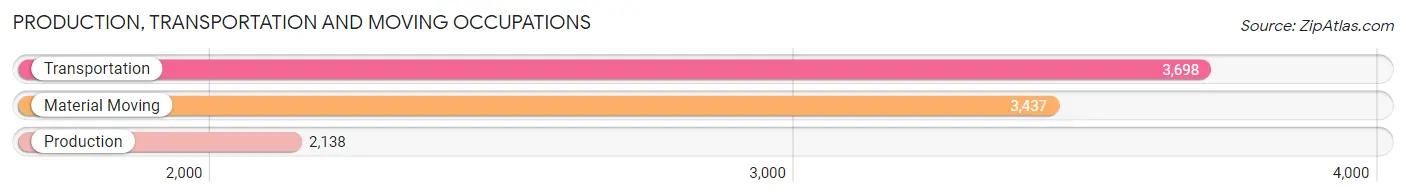
Production, Transportation and Moving Occupations
The most common Production, Transportation and Moving occupations in Miami Gardens are Transportation (3,698 | 7.3%), Material Moving (3,437 | 6.8%), and Production (2,138 | 4.3%).
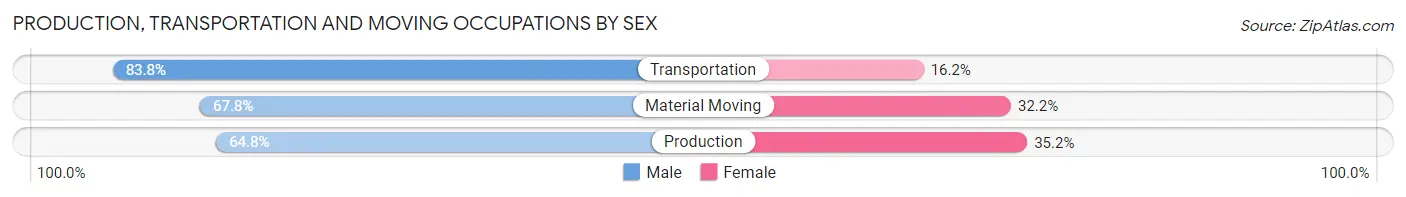
Production, Transportation and Moving Occupations by Sex
| Occupation | Male | Female |
| Production | 1,386 (64.8%) | 752 (35.2%) |
| Transportation | 3,100 (83.8%) | 598 (16.2%) |
| Material Moving | 2,330 (67.8%) | 1,107 (32.2%) |
| Total (Category) | 6,816 (73.5%) | 2,457 (26.5%) |
| Total (Overall) | 24,822 (49.3%) | 25,481 (50.7%) |
Employment Industries by Sex in Miami Gardens
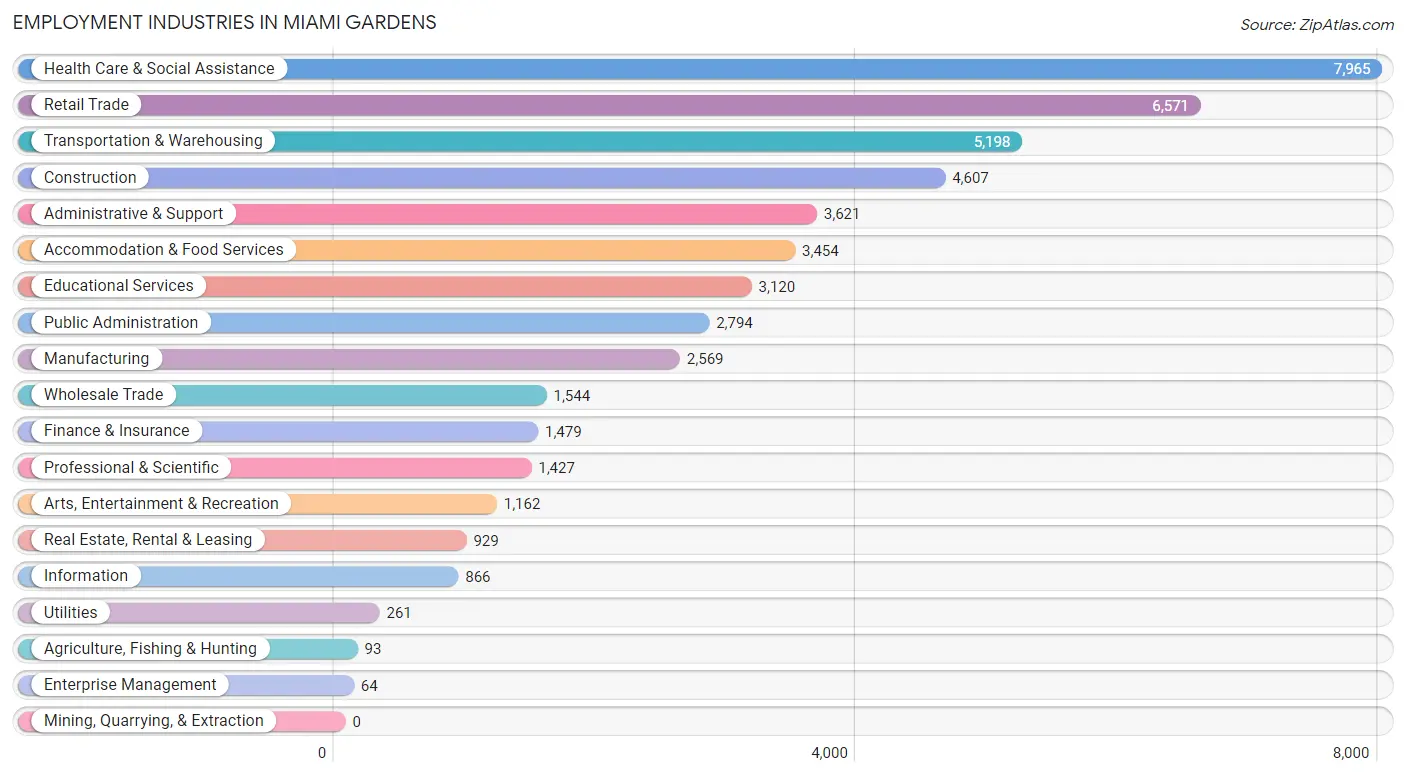
Employment Industries in Miami Gardens
The major employment industries in Miami Gardens include Health Care & Social Assistance (7,965 | 15.8%), Retail Trade (6,571 | 13.1%), Transportation & Warehousing (5,198 | 10.3%), Construction (4,607 | 9.2%), and Administrative & Support (3,621 | 7.2%).
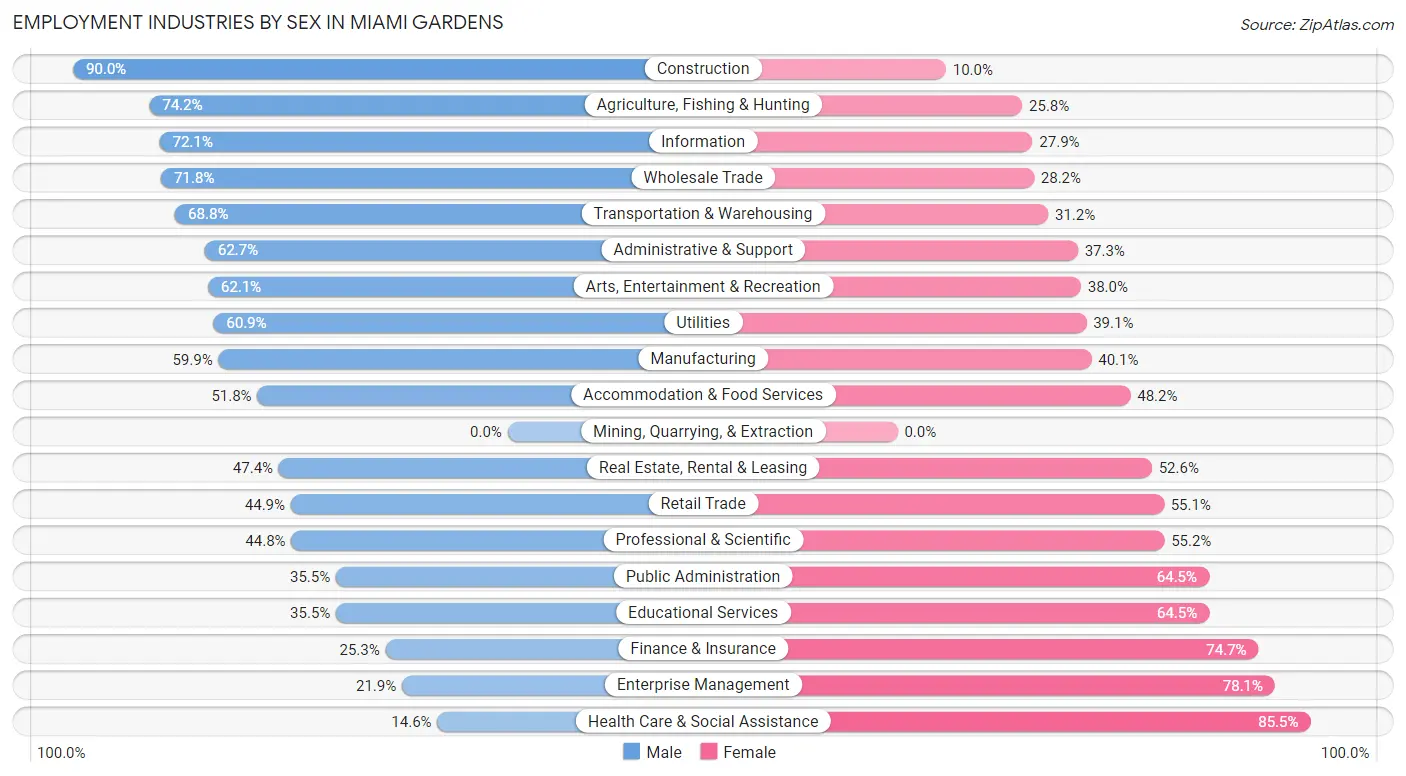
Employment Industries by Sex in Miami Gardens
The Miami Gardens industries that see more men than women are Construction (90.0%), Agriculture, Fishing & Hunting (74.2%), and Information (72.1%), whereas the industries that tend to have a higher number of women are Health Care & Social Assistance (85.5%), Enterprise Management (78.1%), and Finance & Insurance (74.7%).
| Industry | Male | Female |
| Agriculture, Fishing & Hunting | 69 (74.2%) | 24 (25.8%) |
| Mining, Quarrying, & Extraction | 0 (0.0%) | 0 (0.0%) |
| Construction | 4,146 (90.0%) | 461 (10.0%) |
| Manufacturing | 1,538 (59.9%) | 1,031 (40.1%) |
| Wholesale Trade | 1,108 (71.8%) | 436 (28.2%) |
| Retail Trade | 2,950 (44.9%) | 3,621 (55.1%) |
| Transportation & Warehousing | 3,578 (68.8%) | 1,620 (31.2%) |
| Utilities | 159 (60.9%) | 102 (39.1%) |
| Information | 624 (72.1%) | 242 (27.9%) |
| Finance & Insurance | 374 (25.3%) | 1,105 (74.7%) |
| Real Estate, Rental & Leasing | 440 (47.4%) | 489 (52.6%) |
| Professional & Scientific | 639 (44.8%) | 788 (55.2%) |
| Enterprise Management | 14 (21.9%) | 50 (78.1%) |
| Administrative & Support | 2,270 (62.7%) | 1,351 (37.3%) |
| Educational Services | 1,108 (35.5%) | 2,012 (64.5%) |
| Health Care & Social Assistance | 1,159 (14.5%) | 6,806 (85.5%) |
| Arts, Entertainment & Recreation | 721 (62.1%) | 441 (38.0%) |
| Accommodation & Food Services | 1,789 (51.8%) | 1,665 (48.2%) |
| Public Administration | 993 (35.5%) | 1,801 (64.5%) |
| Total | 24,822 (49.3%) | 25,481 (50.7%) |
Education in Miami Gardens
School Enrollment in Miami Gardens
The most common levels of schooling among the 28,918 students in Miami Gardens are college / undergraduate (6,657 | 23.0%), middle school (6,564 | 22.7%), and high school (6,183 | 21.4%).
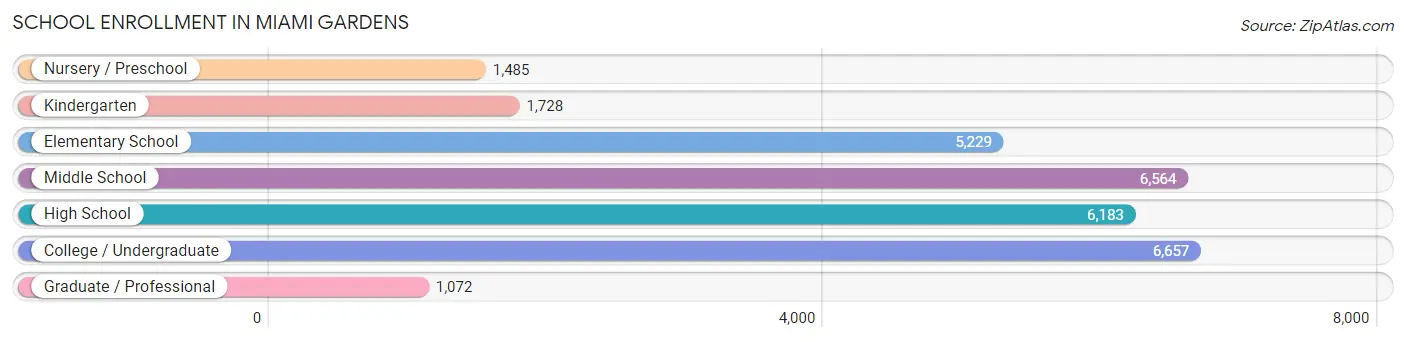
| School Level | # Students | % Students |
| Nursery / Preschool | 1,485 | 5.1% |
| Kindergarten | 1,728 | 6.0% |
| Elementary School | 5,229 | 18.1% |
| Middle School | 6,564 | 22.7% |
| High School | 6,183 | 21.4% |
| College / Undergraduate | 6,657 | 23.0% |
| Graduate / Professional | 1,072 | 3.7% |
| Total | 28,918 | 100.0% |
School Enrollment by Age by Funding Source in Miami Gardens
Out of a total of 28,918 students who are enrolled in schools in Miami Gardens, 4,685 (16.2%) attend a private institution, while the remaining 24,233 (83.8%) are enrolled in public schools. The age group of 25 to 34 year olds has the highest likelihood of being enrolled in private schools, with 789 (37.7% in the age bracket) enrolled. Conversely, the age group of 15 to 17 year olds has the lowest likelihood of being enrolled in a private school, with 3,761 (92.3% in the age bracket) attending a public institution.
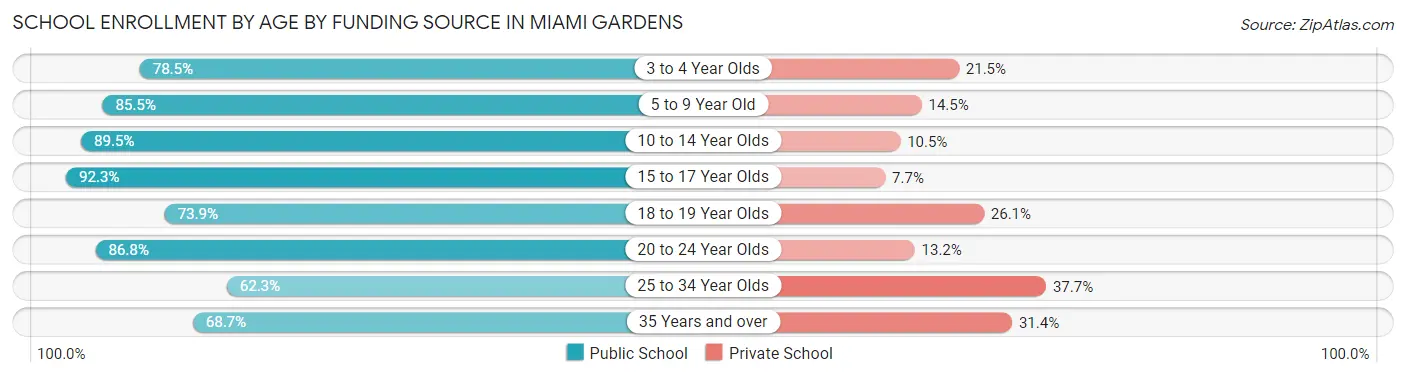
| Age Bracket | Public School | Private School |
| 3 to 4 Year Olds | 1,153 (78.5%) | 315 (21.5%) |
| 5 to 9 Year Old | 5,103 (85.5%) | 866 (14.5%) |
| 10 to 14 Year Olds | 7,582 (89.5%) | 892 (10.5%) |
| 15 to 17 Year Olds | 3,761 (92.3%) | 315 (7.7%) |
| 18 to 19 Year Olds | 1,825 (73.9%) | 645 (26.1%) |
| 20 to 24 Year Olds | 2,445 (86.8%) | 372 (13.2%) |
| 25 to 34 Year Olds | 1,305 (62.3%) | 789 (37.7%) |
| 35 Years and over | 1,064 (68.6%) | 486 (31.4%) |
| Total | 24,233 (83.8%) | 4,685 (16.2%) |
Educational Attainment by Field of Study in Miami Gardens
Business (3,449 | 24.4%), science & technology (2,344 | 16.6%), education (2,192 | 15.5%), arts & humanities (1,297 | 9.2%), and social sciences (935 | 6.6%) are the most common fields of study among 14,154 individuals in Miami Gardens who have obtained a bachelor's degree or higher.
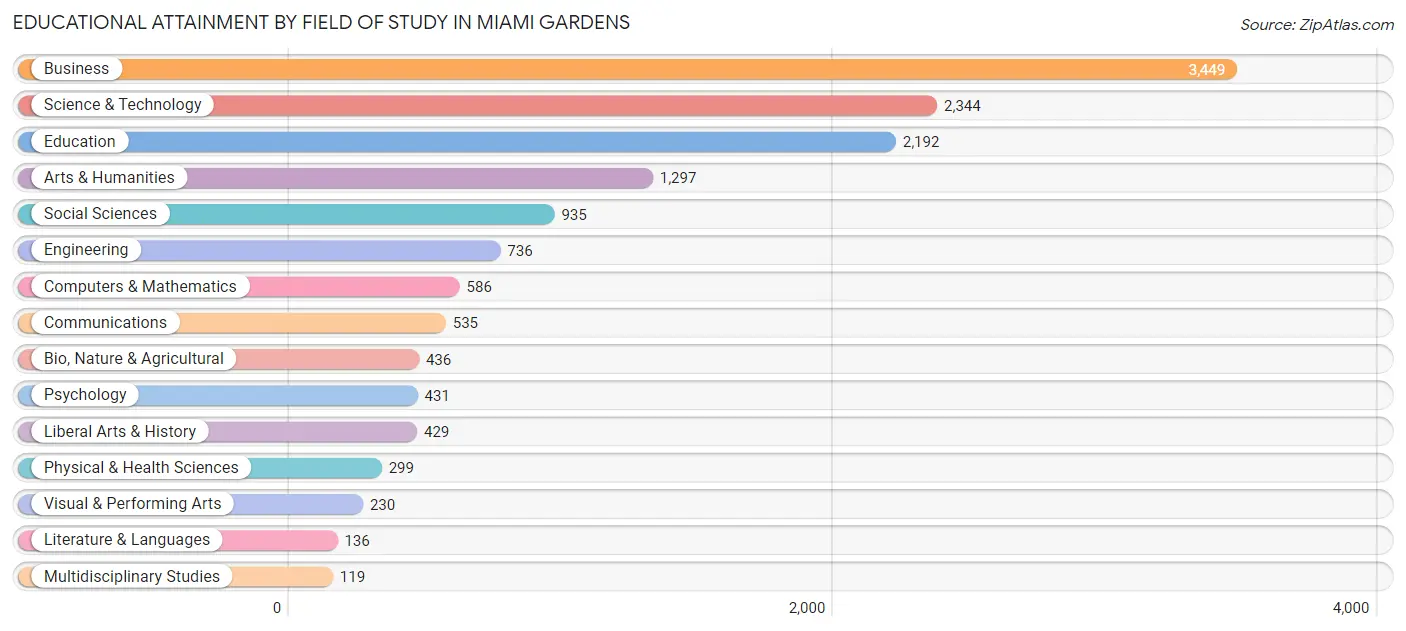
| Field of Study | # Graduates | % Graduates |
| Computers & Mathematics | 586 | 4.1% |
| Bio, Nature & Agricultural | 436 | 3.1% |
| Physical & Health Sciences | 299 | 2.1% |
| Psychology | 431 | 3.0% |
| Social Sciences | 935 | 6.6% |
| Engineering | 736 | 5.2% |
| Multidisciplinary Studies | 119 | 0.8% |
| Science & Technology | 2,344 | 16.6% |
| Business | 3,449 | 24.4% |
| Education | 2,192 | 15.5% |
| Literature & Languages | 136 | 1.0% |
| Liberal Arts & History | 429 | 3.0% |
| Visual & Performing Arts | 230 | 1.6% |
| Communications | 535 | 3.8% |
| Arts & Humanities | 1,297 | 9.2% |
| Total | 14,154 | 100.0% |
Transportation & Commute in Miami Gardens
Vehicle Availability by Sex in Miami Gardens
The most prevalent vehicle ownership categories in Miami Gardens are males with 2 vehicles (10,020, accounting for 41.3%) and females with 2 vehicles (8,859, making up 40.5%).
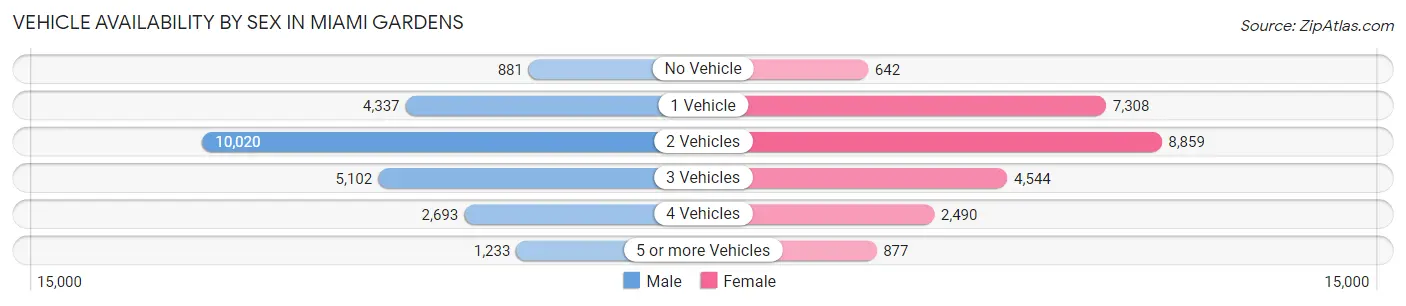
| Vehicles Available | Male | Female |
| No Vehicle | 881 (3.6%) | 642 (2.6%) |
| 1 Vehicle | 4,337 (17.9%) | 7,308 (29.6%) |
| 2 Vehicles | 10,020 (41.3%) | 8,859 (35.8%) |
| 3 Vehicles | 5,102 (21.0%) | 4,544 (18.4%) |
| 4 Vehicles | 2,693 (11.1%) | 2,490 (10.1%) |
| 5 or more Vehicles | 1,233 (5.1%) | 877 (3.5%) |
| Total | 24,266 (100.0%) | 24,720 (100.0%) |
Commute Time in Miami Gardens
The most frequently occuring commute durations in Miami Gardens are 30 to 34 minutes (11,902 commuters, 26.2%), 45 to 59 minutes (5,680 commuters, 12.5%), and 20 to 24 minutes (5,493 commuters, 12.1%).
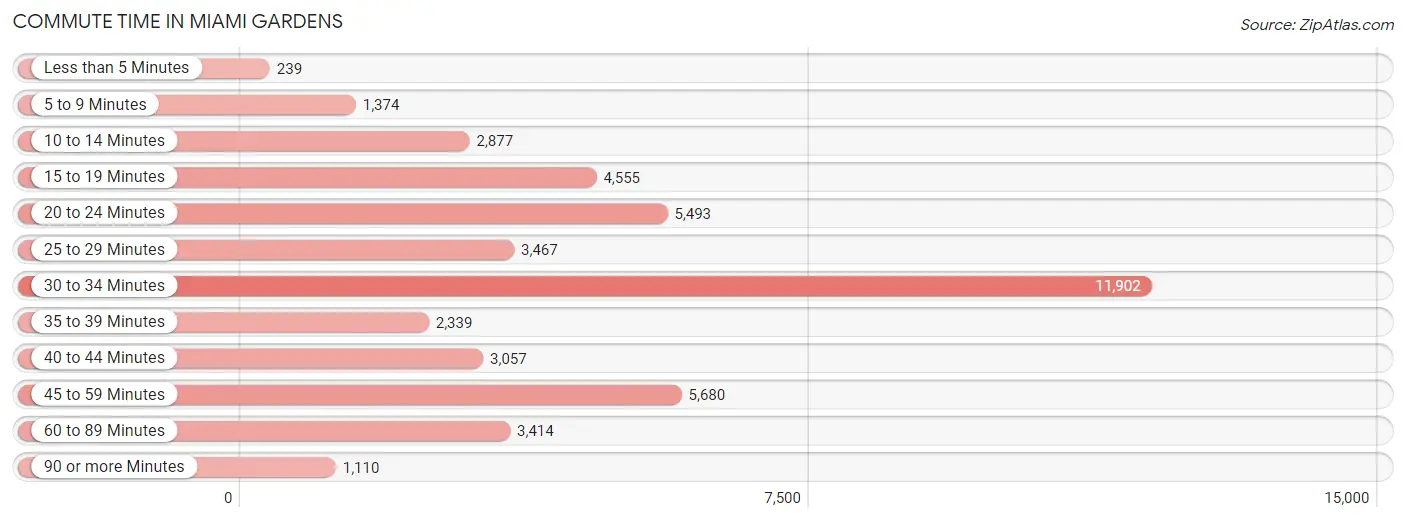
| Commute Time | # Commuters | % Commuters |
| Less than 5 Minutes | 239 | 0.5% |
| 5 to 9 Minutes | 1,374 | 3.0% |
| 10 to 14 Minutes | 2,877 | 6.3% |
| 15 to 19 Minutes | 4,555 | 10.0% |
| 20 to 24 Minutes | 5,493 | 12.1% |
| 25 to 29 Minutes | 3,467 | 7.6% |
| 30 to 34 Minutes | 11,902 | 26.2% |
| 35 to 39 Minutes | 2,339 | 5.1% |
| 40 to 44 Minutes | 3,057 | 6.7% |
| 45 to 59 Minutes | 5,680 | 12.5% |
| 60 to 89 Minutes | 3,414 | 7.5% |
| 90 or more Minutes | 1,110 | 2.4% |
Commute Time by Sex in Miami Gardens
The most common commute times in Miami Gardens are 30 to 34 minutes (6,054 commuters, 26.8%) for males and 30 to 34 minutes (5,848 commuters, 25.5%) for females.
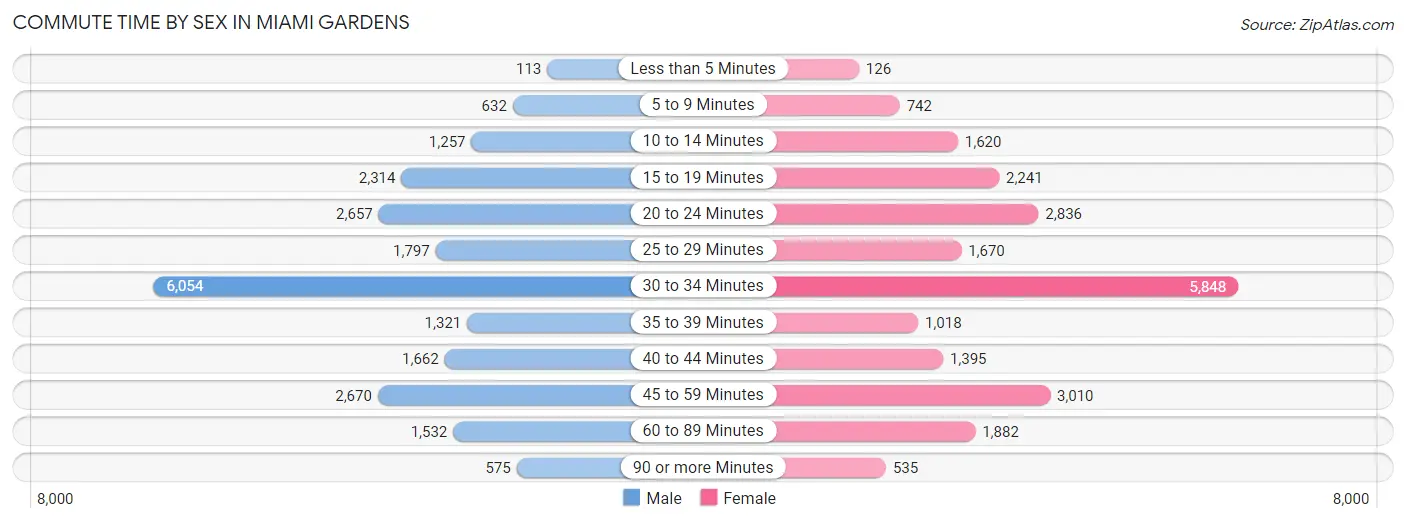
| Commute Time | Male | Female |
| Less than 5 Minutes | 113 (0.5%) | 126 (0.5%) |
| 5 to 9 Minutes | 632 (2.8%) | 742 (3.2%) |
| 10 to 14 Minutes | 1,257 (5.6%) | 1,620 (7.1%) |
| 15 to 19 Minutes | 2,314 (10.2%) | 2,241 (9.8%) |
| 20 to 24 Minutes | 2,657 (11.8%) | 2,836 (12.4%) |
| 25 to 29 Minutes | 1,797 (8.0%) | 1,670 (7.3%) |
| 30 to 34 Minutes | 6,054 (26.8%) | 5,848 (25.5%) |
| 35 to 39 Minutes | 1,321 (5.9%) | 1,018 (4.4%) |
| 40 to 44 Minutes | 1,662 (7.4%) | 1,395 (6.1%) |
| 45 to 59 Minutes | 2,670 (11.8%) | 3,010 (13.1%) |
| 60 to 89 Minutes | 1,532 (6.8%) | 1,882 (8.2%) |
| 90 or more Minutes | 575 (2.5%) | 535 (2.3%) |
Time of Departure to Work by Sex in Miami Gardens
The most frequent times of departure to work in Miami Gardens are 7:00 AM to 7:29 AM (4,992, 22.1%) for males and 7:00 AM to 7:29 AM (6,263, 27.3%) for females.
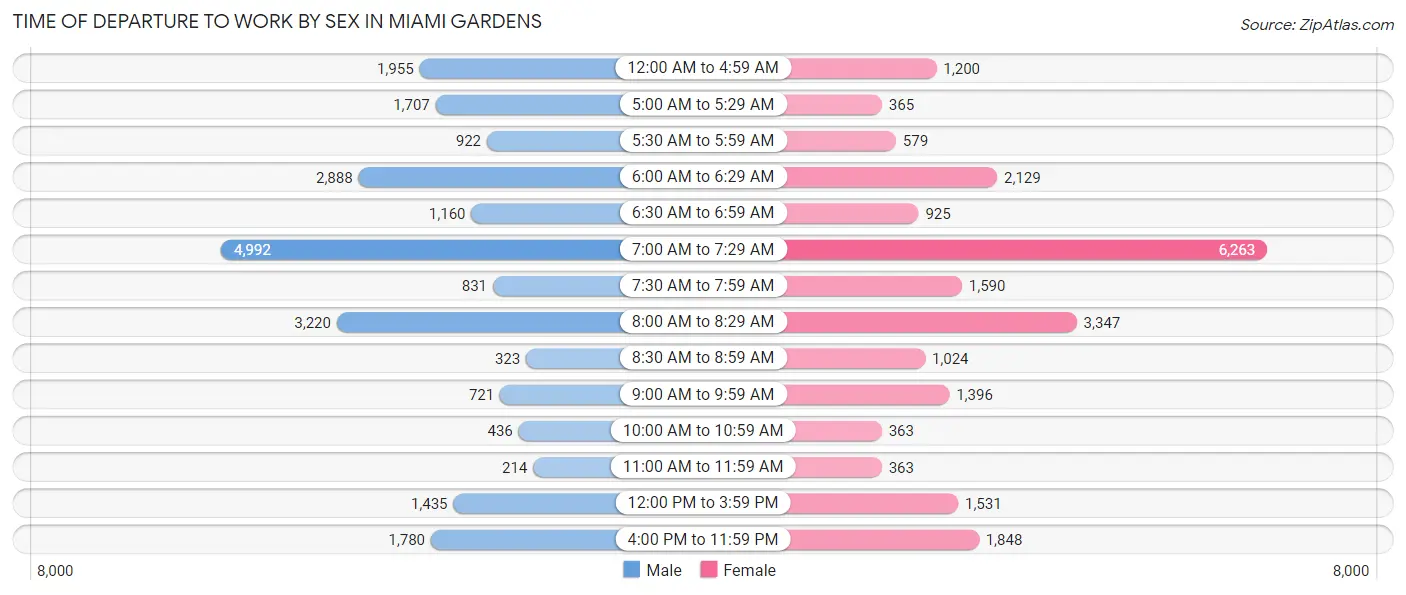
| Time of Departure | Male | Female |
| 12:00 AM to 4:59 AM | 1,955 (8.7%) | 1,200 (5.2%) |
| 5:00 AM to 5:29 AM | 1,707 (7.6%) | 365 (1.6%) |
| 5:30 AM to 5:59 AM | 922 (4.1%) | 579 (2.5%) |
| 6:00 AM to 6:29 AM | 2,888 (12.8%) | 2,129 (9.3%) |
| 6:30 AM to 6:59 AM | 1,160 (5.1%) | 925 (4.0%) |
| 7:00 AM to 7:29 AM | 4,992 (22.1%) | 6,263 (27.3%) |
| 7:30 AM to 7:59 AM | 831 (3.7%) | 1,590 (6.9%) |
| 8:00 AM to 8:29 AM | 3,220 (14.3%) | 3,347 (14.6%) |
| 8:30 AM to 8:59 AM | 323 (1.4%) | 1,024 (4.5%) |
| 9:00 AM to 9:59 AM | 721 (3.2%) | 1,396 (6.1%) |
| 10:00 AM to 10:59 AM | 436 (1.9%) | 363 (1.6%) |
| 11:00 AM to 11:59 AM | 214 (0.9%) | 363 (1.6%) |
| 12:00 PM to 3:59 PM | 1,435 (6.4%) | 1,531 (6.7%) |
| 4:00 PM to 11:59 PM | 1,780 (7.9%) | 1,848 (8.1%) |
| Total | 22,584 (100.0%) | 22,923 (100.0%) |
Housing Occupancy in Miami Gardens
Occupancy by Ownership in Miami Gardens
Of the total 34,351 dwellings in Miami Gardens, owner-occupied units account for 22,229 (64.7%), while renter-occupied units make up 12,122 (35.3%).
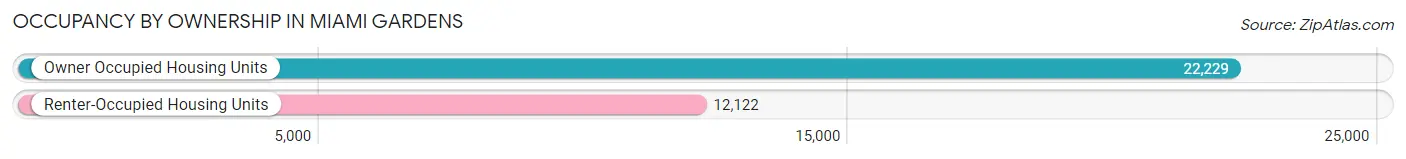
| Occupancy | # Housing Units | % Housing Units |
| Owner Occupied Housing Units | 22,229 | 64.7% |
| Renter-Occupied Housing Units | 12,122 | 35.3% |
| Total Occupied Housing Units | 34,351 | 100.0% |
Occupancy by Household Size in Miami Gardens
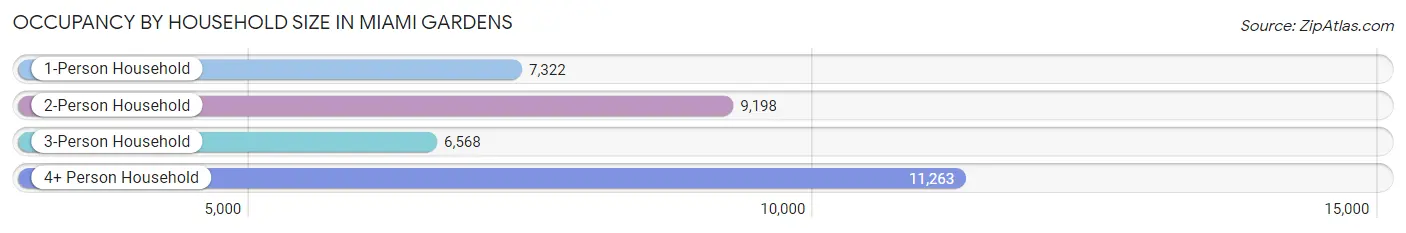
| Household Size | # Housing Units | % Housing Units |
| 1-Person Household | 7,322 | 21.3% |
| 2-Person Household | 9,198 | 26.8% |
| 3-Person Household | 6,568 | 19.1% |
| 4+ Person Household | 11,263 | 32.8% |
| Total Housing Units | 34,351 | 100.0% |
Occupancy by Ownership by Household Size in Miami Gardens
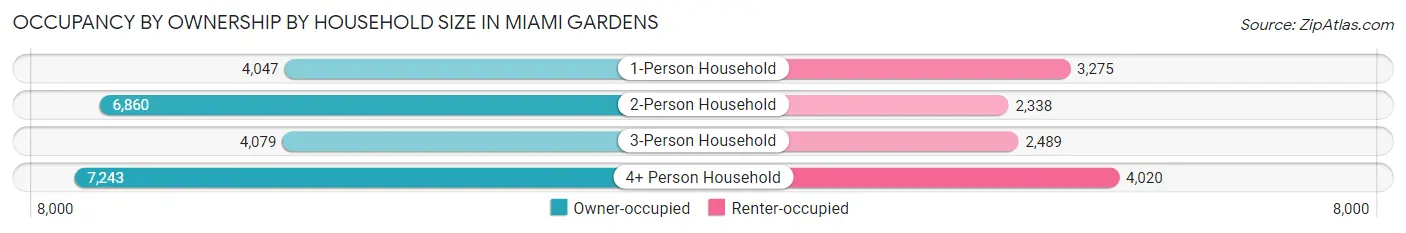
| Household Size | Owner-occupied | Renter-occupied |
| 1-Person Household | 4,047 (55.3%) | 3,275 (44.7%) |
| 2-Person Household | 6,860 (74.6%) | 2,338 (25.4%) |
| 3-Person Household | 4,079 (62.1%) | 2,489 (37.9%) |
| 4+ Person Household | 7,243 (64.3%) | 4,020 (35.7%) |
| Total Housing Units | 22,229 (64.7%) | 12,122 (35.3%) |
Occupancy by Educational Attainment in Miami Gardens
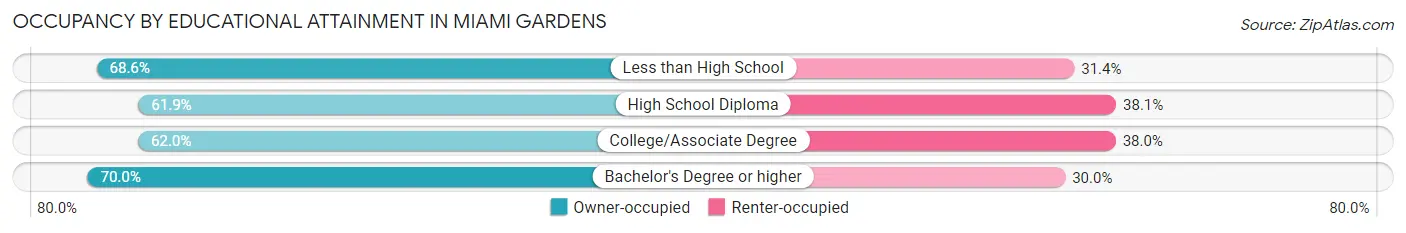
| Household Size | Owner-occupied | Renter-occupied |
| Less than High School | 3,606 (68.6%) | 1,653 (31.4%) |
| High School Diploma | 7,154 (61.9%) | 4,395 (38.1%) |
| College/Associate Degree | 6,303 (62.0%) | 3,861 (38.0%) |
| Bachelor's Degree or higher | 5,166 (70.0%) | 2,213 (30.0%) |
Occupancy by Age of Householder in Miami Gardens
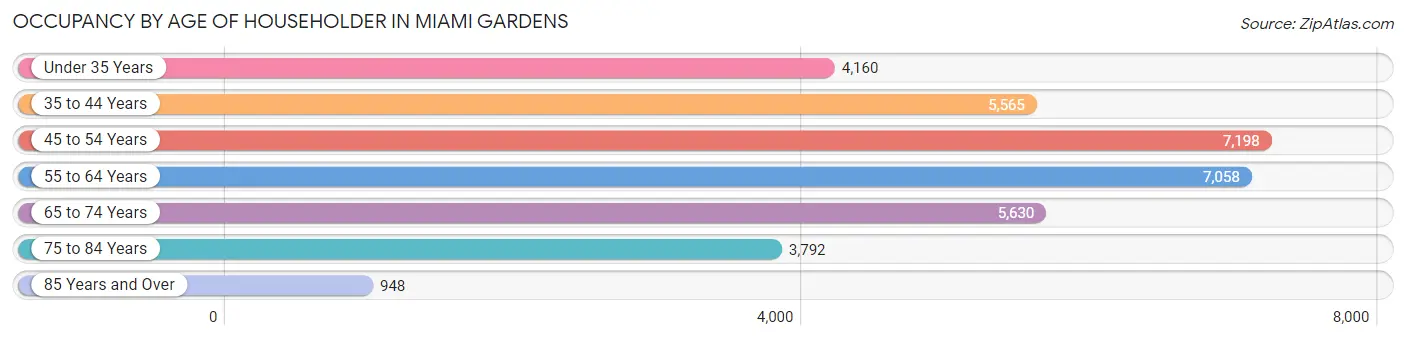
| Age Bracket | # Households | % Households |
| Under 35 Years | 4,160 | 12.1% |
| 35 to 44 Years | 5,565 | 16.2% |
| 45 to 54 Years | 7,198 | 20.9% |
| 55 to 64 Years | 7,058 | 20.5% |
| 65 to 74 Years | 5,630 | 16.4% |
| 75 to 84 Years | 3,792 | 11.0% |
| 85 Years and Over | 948 | 2.8% |
| Total | 34,351 | 100.0% |
Housing Finances in Miami Gardens
Median Income by Occupancy in Miami Gardens
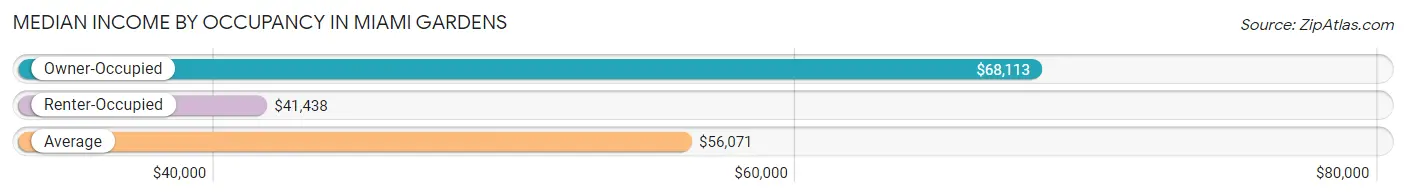
| Occupancy Type | # Households | Median Income |
| Owner-Occupied | 22,229 (64.7%) | $68,113 |
| Renter-Occupied | 12,122 (35.3%) | $41,438 |
| Average | 34,351 (100.0%) | $56,071 |
Occupancy by Householder Income Bracket in Miami Gardens
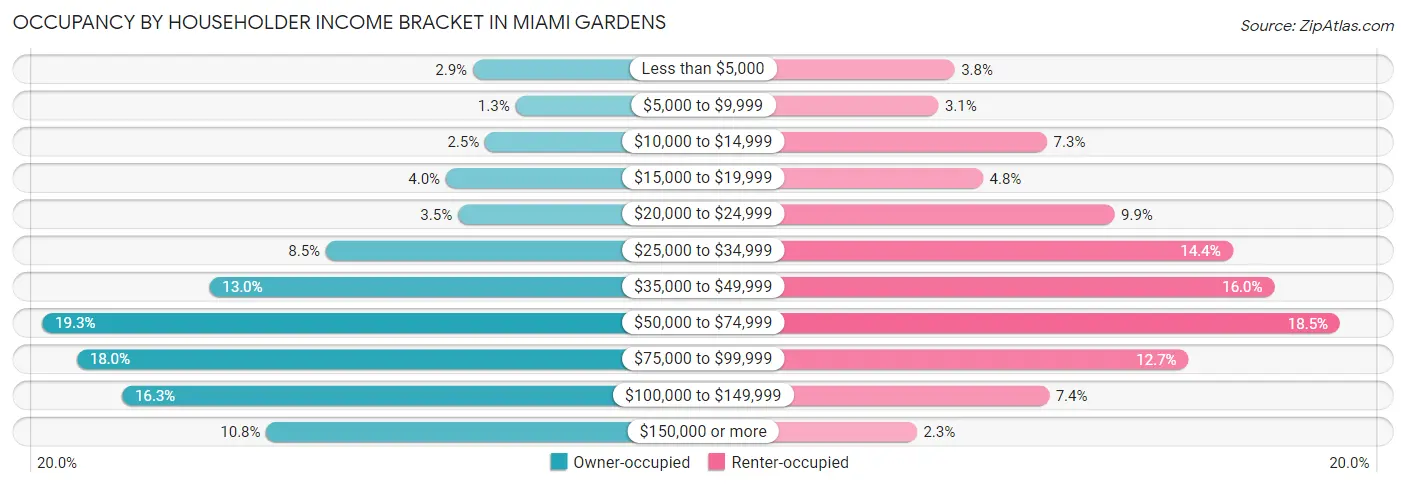
| Income Bracket | Owner-occupied | Renter-occupied |
| Less than $5,000 | 649 (2.9%) | 456 (3.8%) |
| $5,000 to $9,999 | 288 (1.3%) | 381 (3.1%) |
| $10,000 to $14,999 | 546 (2.5%) | 882 (7.3%) |
| $15,000 to $19,999 | 878 (4.0%) | 587 (4.8%) |
| $20,000 to $24,999 | 775 (3.5%) | 1,194 (9.9%) |
| $25,000 to $34,999 | 1,893 (8.5%) | 1,741 (14.4%) |
| $35,000 to $49,999 | 2,880 (13.0%) | 1,934 (16.0%) |
| $50,000 to $74,999 | 4,296 (19.3%) | 2,237 (18.4%) |
| $75,000 to $99,999 | 4,004 (18.0%) | 1,537 (12.7%) |
| $100,000 to $149,999 | 3,621 (16.3%) | 892 (7.4%) |
| $150,000 or more | 2,399 (10.8%) | 281 (2.3%) |
| Total | 22,229 (100.0%) | 12,122 (100.0%) |
Monthly Housing Cost Tiers in Miami Gardens
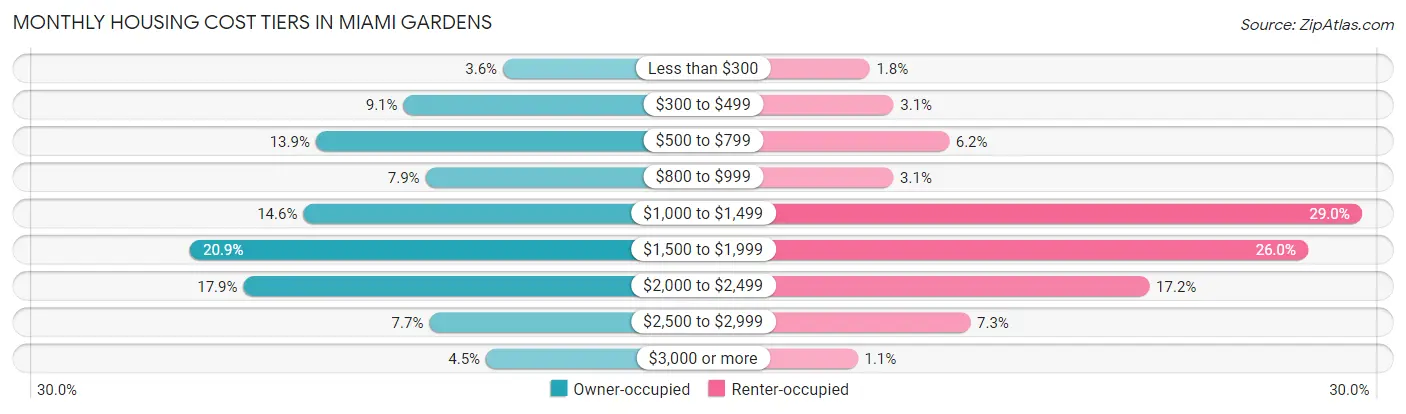
| Monthly Cost | Owner-occupied | Renter-occupied |
| Less than $300 | 795 (3.6%) | 214 (1.8%) |
| $300 to $499 | 2,019 (9.1%) | 375 (3.1%) |
| $500 to $799 | 3,095 (13.9%) | 745 (6.1%) |
| $800 to $999 | 1,748 (7.9%) | 373 (3.1%) |
| $1,000 to $1,499 | 3,247 (14.6%) | 3,509 (28.9%) |
| $1,500 to $1,999 | 4,637 (20.9%) | 3,149 (26.0%) |
| $2,000 to $2,499 | 3,984 (17.9%) | 2,088 (17.2%) |
| $2,500 to $2,999 | 1,700 (7.6%) | 889 (7.3%) |
| $3,000 or more | 1,004 (4.5%) | 135 (1.1%) |
| Total | 22,229 (100.0%) | 12,122 (100.0%) |
Physical Housing Characteristics in Miami Gardens
Housing Structures in Miami Gardens
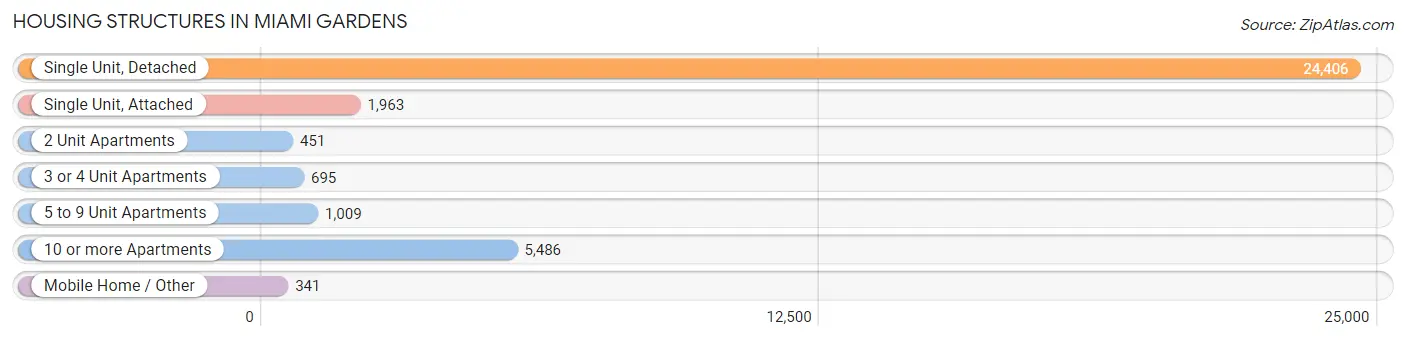
| Structure Type | # Housing Units | % Housing Units |
| Single Unit, Detached | 24,406 | 71.1% |
| Single Unit, Attached | 1,963 | 5.7% |
| 2 Unit Apartments | 451 | 1.3% |
| 3 or 4 Unit Apartments | 695 | 2.0% |
| 5 to 9 Unit Apartments | 1,009 | 2.9% |
| 10 or more Apartments | 5,486 | 16.0% |
| Mobile Home / Other | 341 | 1.0% |
| Total | 34,351 | 100.0% |
Housing Structures by Occupancy in Miami Gardens
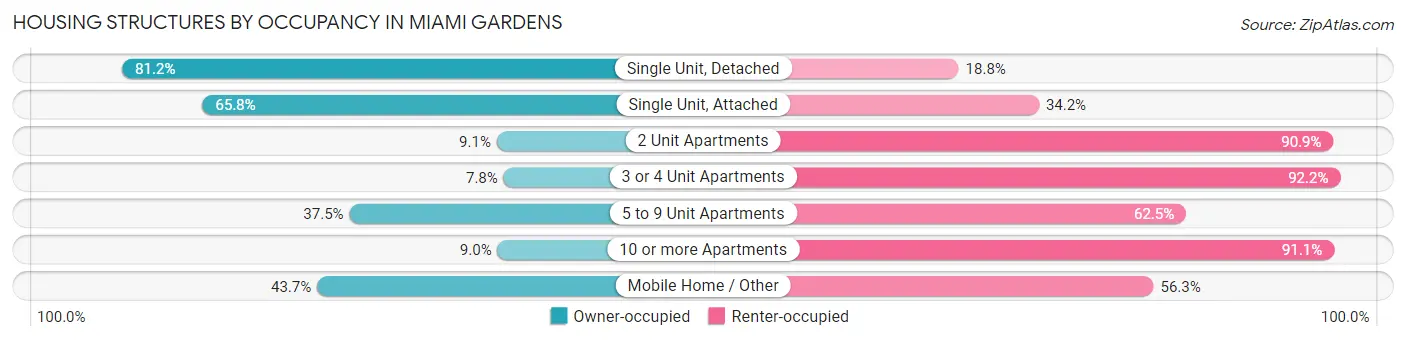
| Structure Type | Owner-occupied | Renter-occupied |
| Single Unit, Detached | 19,825 (81.2%) | 4,581 (18.8%) |
| Single Unit, Attached | 1,291 (65.8%) | 672 (34.2%) |
| 2 Unit Apartments | 41 (9.1%) | 410 (90.9%) |
| 3 or 4 Unit Apartments | 54 (7.8%) | 641 (92.2%) |
| 5 to 9 Unit Apartments | 378 (37.5%) | 631 (62.5%) |
| 10 or more Apartments | 491 (8.9%) | 4,995 (91.0%) |
| Mobile Home / Other | 149 (43.7%) | 192 (56.3%) |
| Total | 22,229 (64.7%) | 12,122 (35.3%) |
Housing Structures by Number of Rooms in Miami Gardens
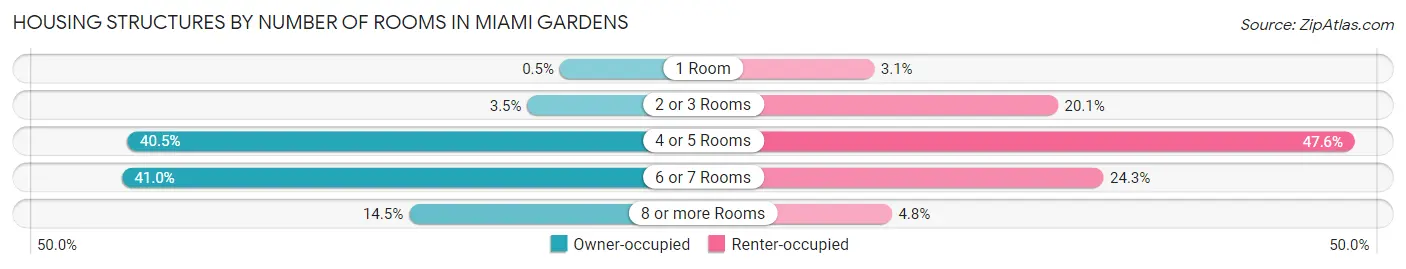
| Number of Rooms | Owner-occupied | Renter-occupied |
| 1 Room | 112 (0.5%) | 381 (3.1%) |
| 2 or 3 Rooms | 779 (3.5%) | 2,440 (20.1%) |
| 4 or 5 Rooms | 9,004 (40.5%) | 5,772 (47.6%) |
| 6 or 7 Rooms | 9,122 (41.0%) | 2,951 (24.3%) |
| 8 or more Rooms | 3,212 (14.4%) | 578 (4.8%) |
| Total | 22,229 (100.0%) | 12,122 (100.0%) |
Housing Structure by Heating Type in Miami Gardens
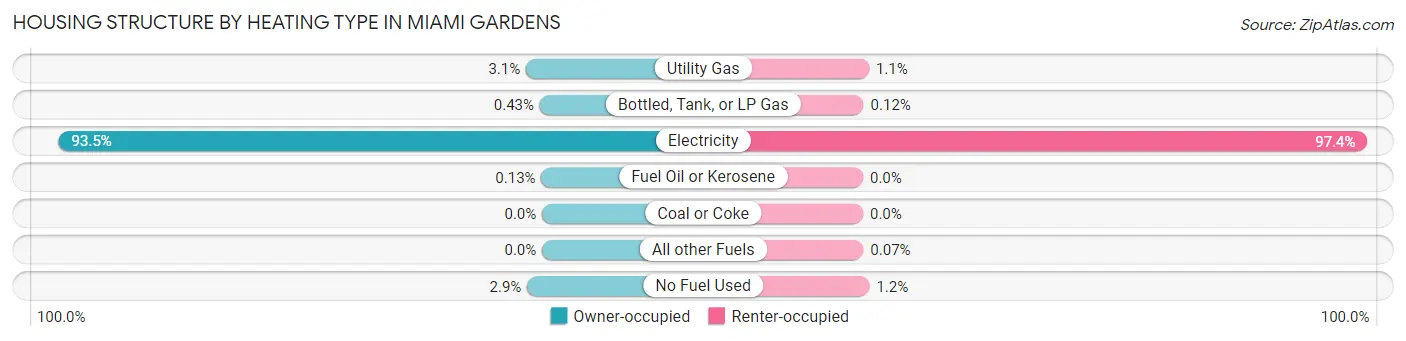
| Heating Type | Owner-occupied | Renter-occupied |
| Utility Gas | 690 (3.1%) | 138 (1.1%) |
| Bottled, Tank, or LP Gas | 95 (0.4%) | 14 (0.1%) |
| Electricity | 20,776 (93.5%) | 11,812 (97.4%) |
| Fuel Oil or Kerosene | 28 (0.1%) | 0 (0.0%) |
| Coal or Coke | 0 (0.0%) | 0 (0.0%) |
| All other Fuels | 0 (0.0%) | 8 (0.1%) |
| No Fuel Used | 640 (2.9%) | 150 (1.2%) |
| Total | 22,229 (100.0%) | 12,122 (100.0%) |
Household Vehicle Usage in Miami Gardens
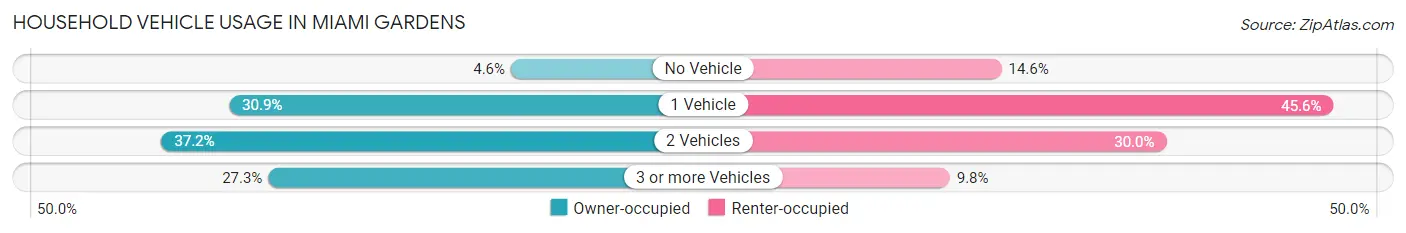
| Vehicles per Household | Owner-occupied | Renter-occupied |
| No Vehicle | 1,025 (4.6%) | 1,772 (14.6%) |
| 1 Vehicle | 6,868 (30.9%) | 5,526 (45.6%) |
| 2 Vehicles | 8,276 (37.2%) | 3,637 (30.0%) |
| 3 or more Vehicles | 6,060 (27.3%) | 1,187 (9.8%) |
| Total | 22,229 (100.0%) | 12,122 (100.0%) |
Real Estate & Mortgages in Miami Gardens
Real Estate and Mortgage Overview in Miami Gardens
| Characteristic | Without Mortgage | With Mortgage |
| Housing Units | 7,257 | 14,972 |
| Median Property Value | $274,600 | $310,000 |
| Median Household Income | $52,311 | $1,666 |
| Monthly Housing Costs | $585 | $1,004 |
| Real Estate Taxes | $2,171 | $406 |
Property Value by Mortgage Status in Miami Gardens
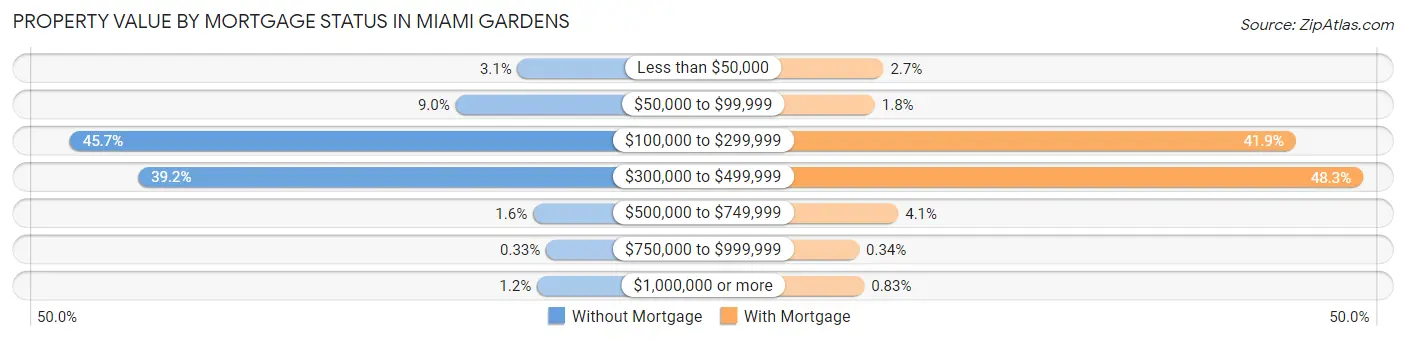
| Property Value | Without Mortgage | With Mortgage |
| Less than $50,000 | 221 (3.0%) | 399 (2.7%) |
| $50,000 to $99,999 | 650 (9.0%) | 275 (1.8%) |
| $100,000 to $299,999 | 3,316 (45.7%) | 6,277 (41.9%) |
| $300,000 to $499,999 | 2,844 (39.2%) | 7,236 (48.3%) |
| $500,000 to $749,999 | 115 (1.6%) | 609 (4.1%) |
| $750,000 to $999,999 | 24 (0.3%) | 51 (0.3%) |
| $1,000,000 or more | 87 (1.2%) | 125 (0.8%) |
| Total | 7,257 (100.0%) | 14,972 (100.0%) |
Household Income by Mortgage Status in Miami Gardens
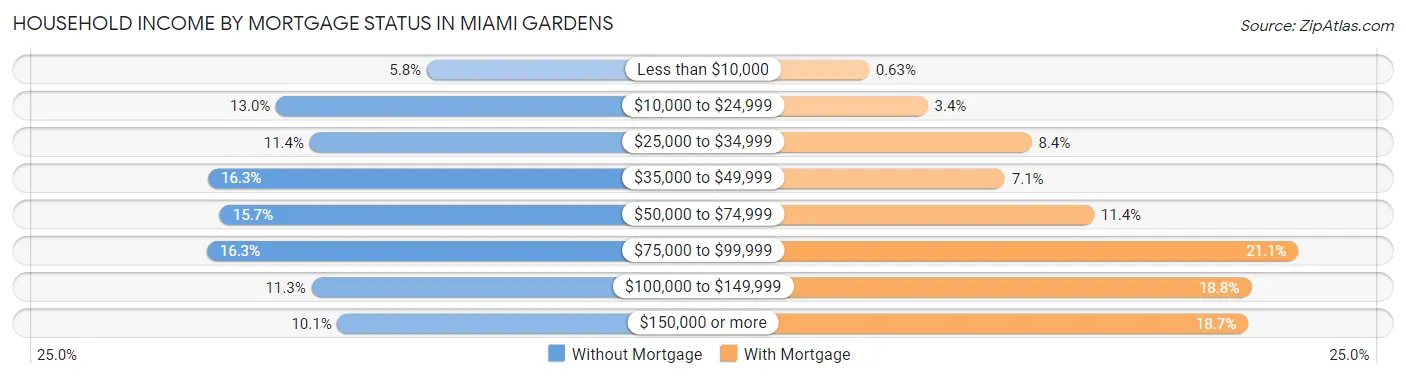
| Household Income | Without Mortgage | With Mortgage |
| Less than $10,000 | 424 (5.8%) | 94 (0.6%) |
| $10,000 to $24,999 | 945 (13.0%) | 513 (3.4%) |
| $25,000 to $34,999 | 829 (11.4%) | 1,254 (8.4%) |
| $35,000 to $49,999 | 1,180 (16.3%) | 1,064 (7.1%) |
| $50,000 to $74,999 | 1,139 (15.7%) | 1,700 (11.4%) |
| $75,000 to $99,999 | 1,184 (16.3%) | 3,157 (21.1%) |
| $100,000 to $149,999 | 823 (11.3%) | 2,820 (18.8%) |
| $150,000 or more | 733 (10.1%) | 2,798 (18.7%) |
| Total | 7,257 (100.0%) | 14,972 (100.0%) |
Property Value to Household Income Ratio in Miami Gardens
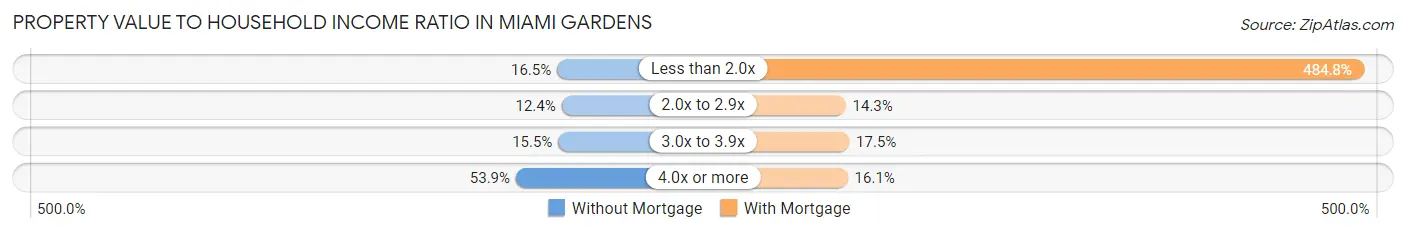
| Value-to-Income Ratio | Without Mortgage | With Mortgage |
| Less than 2.0x | 1,197 (16.5%) | 72,584 (484.8%) |
| 2.0x to 2.9x | 900 (12.4%) | 2,135 (14.3%) |
| 3.0x to 3.9x | 1,122 (15.5%) | 2,616 (17.5%) |
| 4.0x or more | 3,912 (53.9%) | 2,414 (16.1%) |
| Total | 7,257 (100.0%) | 14,972 (100.0%) |
Real Estate Taxes by Mortgage Status in Miami Gardens
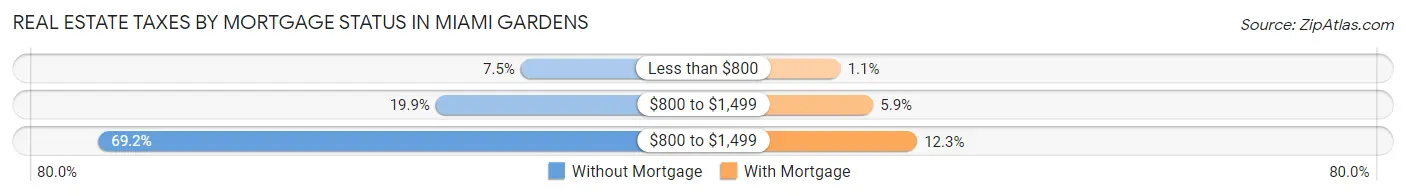
| Property Taxes | Without Mortgage | With Mortgage |
| Less than $800 | 545 (7.5%) | 167 (1.1%) |
| $800 to $1,499 | 1,446 (19.9%) | 882 (5.9%) |
| $800 to $1,499 | 5,024 (69.2%) | 1,841 (12.3%) |
| Total | 7,257 (100.0%) | 14,972 (100.0%) |
Health & Disability in Miami Gardens
Health Insurance Coverage by Age in Miami Gardens
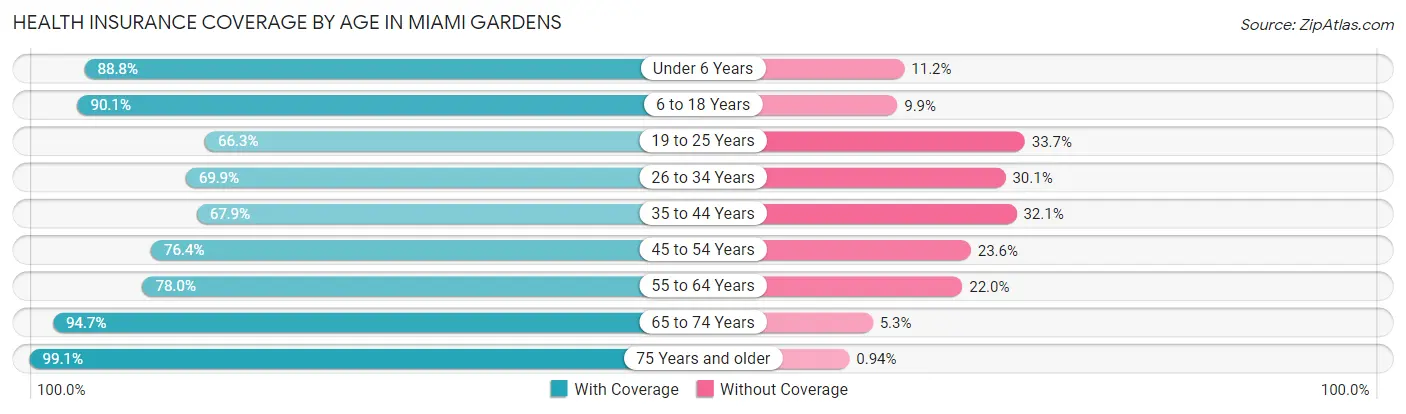
| Age Bracket | With Coverage | Without Coverage |
| Under 6 Years | 6,294 (88.8%) | 794 (11.2%) |
| 6 to 18 Years | 17,689 (90.1%) | 1,940 (9.9%) |
| 19 to 25 Years | 7,065 (66.3%) | 3,585 (33.7%) |
| 26 to 34 Years | 9,758 (69.9%) | 4,193 (30.1%) |
| 35 to 44 Years | 9,213 (67.9%) | 4,358 (32.1%) |
| 45 to 54 Years | 10,989 (76.4%) | 3,393 (23.6%) |
| 55 to 64 Years | 10,800 (78.0%) | 3,046 (22.0%) |
| 65 to 74 Years | 9,716 (94.7%) | 544 (5.3%) |
| 75 Years and older | 8,103 (99.1%) | 77 (0.9%) |
| Total | 89,627 (80.3%) | 21,930 (19.7%) |
Health Insurance Coverage by Citizenship Status in Miami Gardens
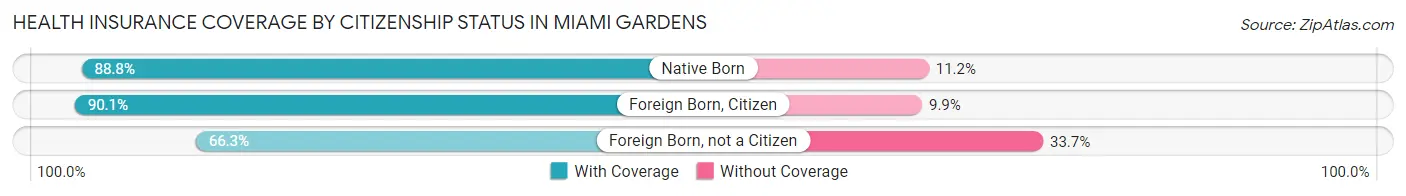
| Citizenship Status | With Coverage | Without Coverage |
| Native Born | 6,294 (88.8%) | 794 (11.2%) |
| Foreign Born, Citizen | 17,689 (90.1%) | 1,940 (9.9%) |
| Foreign Born, not a Citizen | 7,065 (66.3%) | 3,585 (33.7%) |
Health Insurance Coverage by Household Income in Miami Gardens
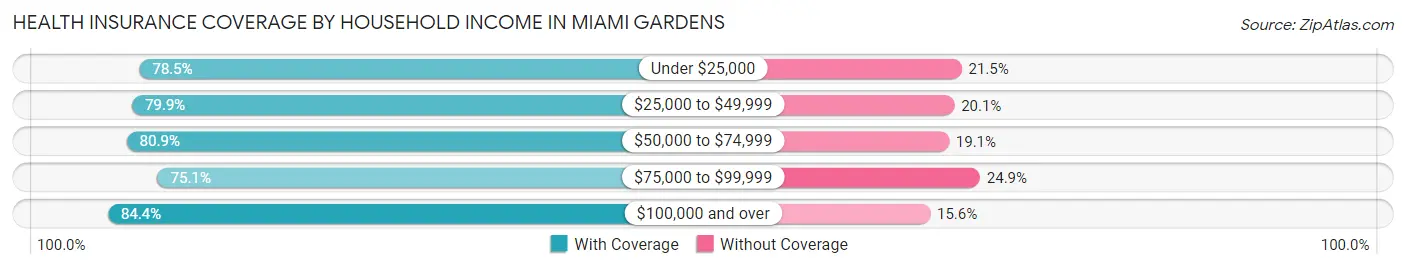
| Household Income | With Coverage | Without Coverage |
| Under $25,000 | 11,660 (78.5%) | 3,193 (21.5%) |
| $25,000 to $49,999 | 18,649 (79.9%) | 4,697 (20.1%) |
| $50,000 to $74,999 | 17,327 (80.9%) | 4,096 (19.1%) |
| $75,000 to $99,999 | 15,064 (75.1%) | 5,002 (24.9%) |
| $100,000 and over | 25,838 (84.4%) | 4,775 (15.6%) |
Public vs Private Health Insurance Coverage by Age in Miami Gardens
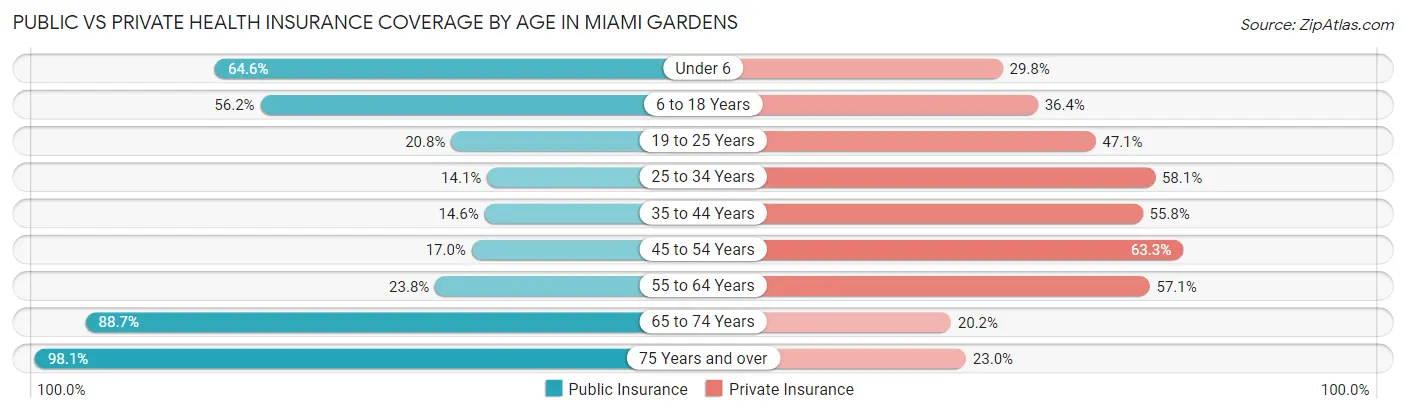
| Age Bracket | Public Insurance | Private Insurance |
| Under 6 | 4,582 (64.6%) | 2,114 (29.8%) |
| 6 to 18 Years | 11,038 (56.2%) | 7,137 (36.4%) |
| 19 to 25 Years | 2,216 (20.8%) | 5,013 (47.1%) |
| 25 to 34 Years | 1,973 (14.1%) | 8,110 (58.1%) |
| 35 to 44 Years | 1,987 (14.6%) | 7,576 (55.8%) |
| 45 to 54 Years | 2,446 (17.0%) | 9,108 (63.3%) |
| 55 to 64 Years | 3,295 (23.8%) | 7,909 (57.1%) |
| 65 to 74 Years | 9,098 (88.7%) | 2,077 (20.2%) |
| 75 Years and over | 8,023 (98.1%) | 1,885 (23.0%) |
| Total | 44,658 (40.0%) | 50,929 (45.7%) |
Disability Status by Sex by Age in Miami Gardens
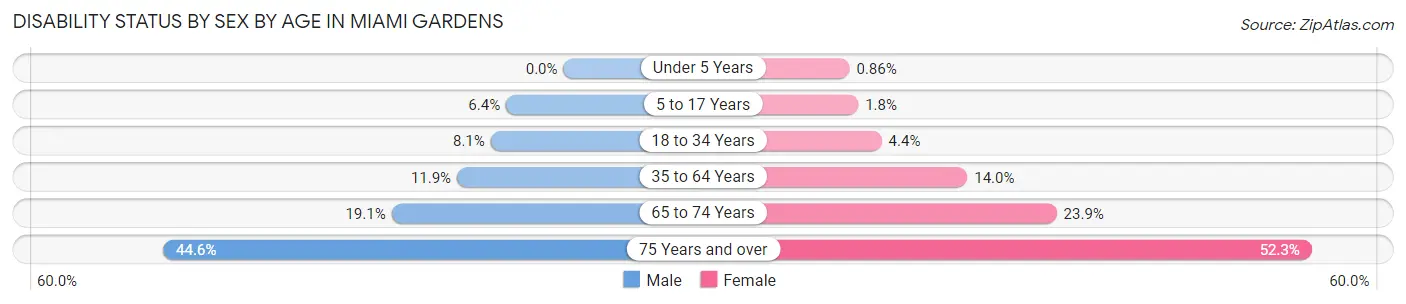
| Age Bracket | Male | Female |
| Under 5 Years | 0 (0.0%) | 26 (0.9%) |
| 5 to 17 Years | 647 (6.4%) | 167 (1.8%) |
| 18 to 34 Years | 986 (8.1%) | 615 (4.4%) |
| 35 to 64 Years | 2,395 (11.8%) | 3,020 (14.0%) |
| 65 to 74 Years | 851 (19.1%) | 1,391 (23.9%) |
| 75 Years and over | 1,372 (44.6%) | 2,670 (52.3%) |
Disability Class by Sex by Age in Miami Gardens
Disability Class: Hearing Difficulty
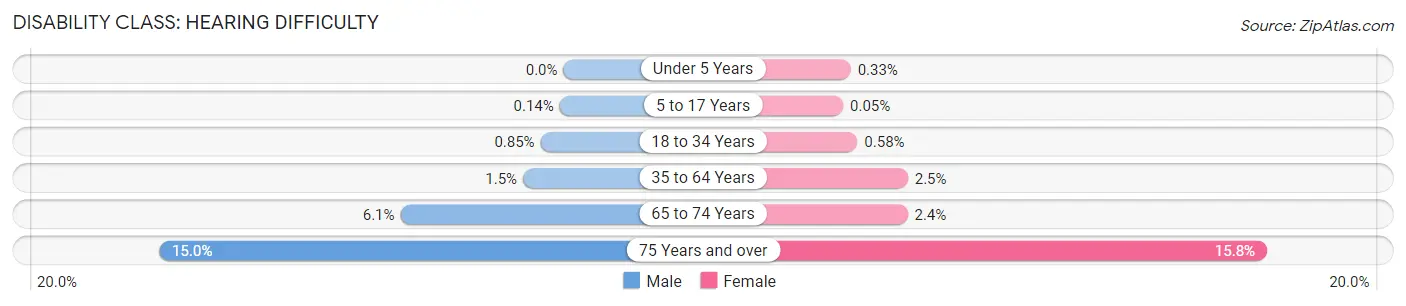
| Age Bracket | Male | Female |
| Under 5 Years | 0 (0.0%) | 10 (0.3%) |
| 5 to 17 Years | 14 (0.1%) | 5 (0.1%) |
| 18 to 34 Years | 104 (0.9%) | 80 (0.6%) |
| 35 to 64 Years | 303 (1.5%) | 529 (2.5%) |
| 65 to 74 Years | 269 (6.0%) | 142 (2.4%) |
| 75 Years and over | 462 (15.0%) | 805 (15.8%) |
Disability Class: Vision Difficulty
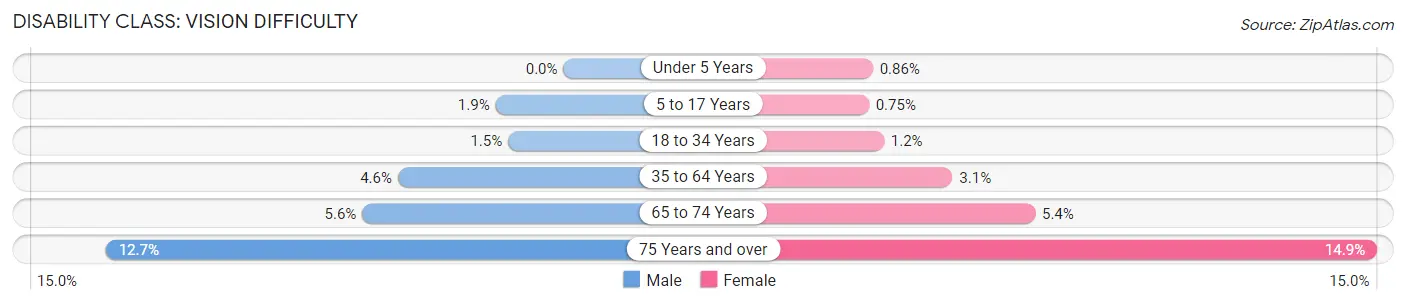
| Age Bracket | Male | Female |
| Under 5 Years | 0 (0.0%) | 26 (0.9%) |
| 5 to 17 Years | 191 (1.9%) | 69 (0.7%) |
| 18 to 34 Years | 188 (1.5%) | 162 (1.2%) |
| 35 to 64 Years | 932 (4.6%) | 665 (3.1%) |
| 65 to 74 Years | 249 (5.6%) | 313 (5.4%) |
| 75 Years and over | 392 (12.7%) | 760 (14.9%) |
Disability Class: Cognitive Difficulty
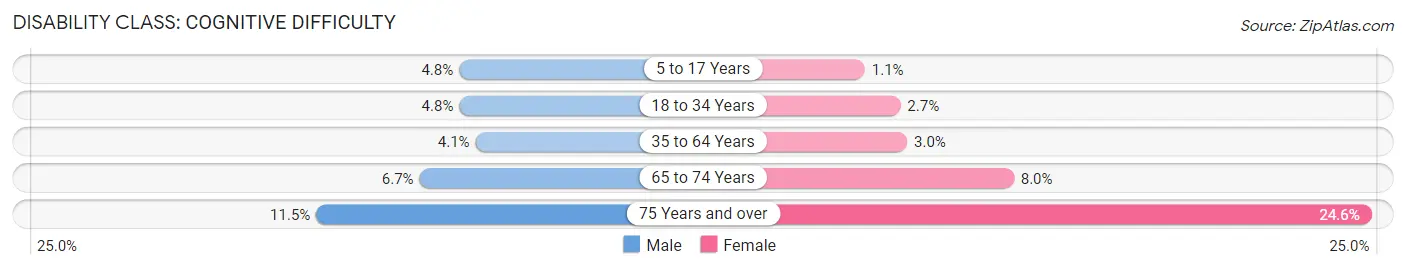
| Age Bracket | Male | Female |
| 5 to 17 Years | 490 (4.8%) | 98 (1.1%) |
| 18 to 34 Years | 588 (4.8%) | 377 (2.7%) |
| 35 to 64 Years | 824 (4.1%) | 654 (3.0%) |
| 65 to 74 Years | 297 (6.7%) | 464 (8.0%) |
| 75 Years and over | 353 (11.5%) | 1,254 (24.6%) |
Disability Class: Ambulatory Difficulty
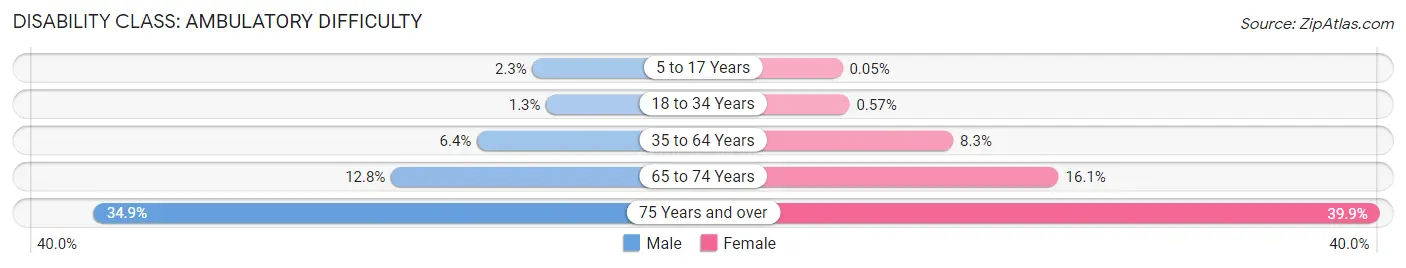
| Age Bracket | Male | Female |
| 5 to 17 Years | 231 (2.3%) | 5 (0.1%) |
| 18 to 34 Years | 153 (1.3%) | 79 (0.6%) |
| 35 to 64 Years | 1,294 (6.4%) | 1,787 (8.3%) |
| 65 to 74 Years | 568 (12.8%) | 936 (16.1%) |
| 75 Years and over | 1,073 (34.9%) | 2,037 (39.9%) |
Disability Class: Self-Care Difficulty
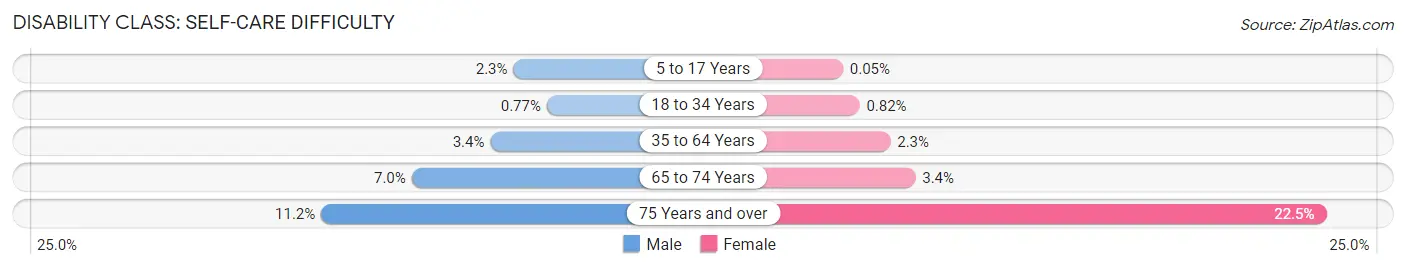
| Age Bracket | Male | Female |
| 5 to 17 Years | 235 (2.3%) | 5 (0.1%) |
| 18 to 34 Years | 94 (0.8%) | 114 (0.8%) |
| 35 to 64 Years | 684 (3.4%) | 486 (2.2%) |
| 65 to 74 Years | 313 (7.0%) | 198 (3.4%) |
| 75 Years and over | 346 (11.2%) | 1,147 (22.5%) |
Technology Access in Miami Gardens
Computing Device Access in Miami Gardens
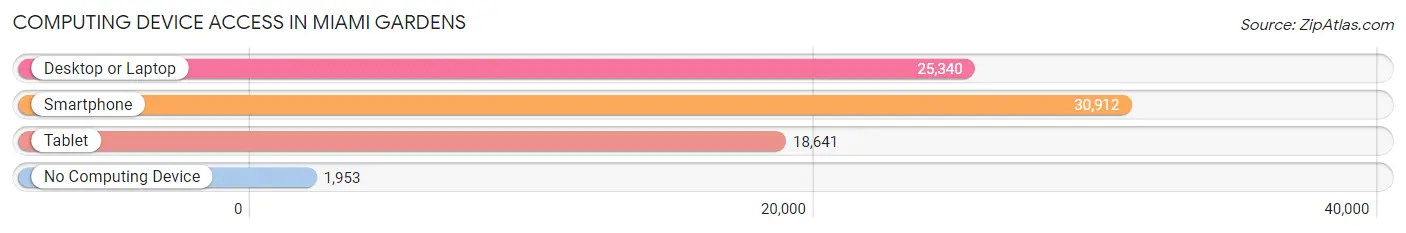
| Device Type | # Households | % Households |
| Desktop or Laptop | 25,340 | 73.8% |
| Smartphone | 30,912 | 90.0% |
| Tablet | 18,641 | 54.3% |
| No Computing Device | 1,953 | 5.7% |
| Total | 34,351 | 100.0% |
Internet Access in Miami Gardens
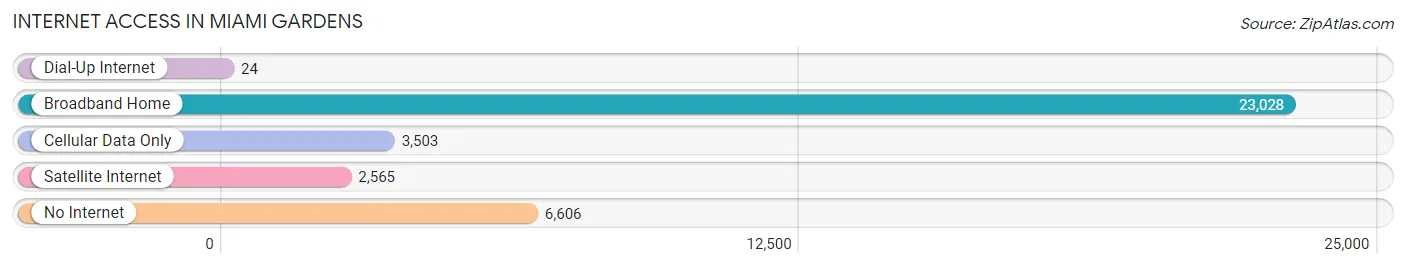
| Internet Type | # Households | % Households |
| Dial-Up Internet | 24 | 0.1% |
| Broadband Home | 23,028 | 67.0% |
| Cellular Data Only | 3,503 | 10.2% |
| Satellite Internet | 2,565 | 7.5% |
| No Internet | 6,606 | 19.2% |
| Total | 34,351 | 100.0% |
Miami Gardens Summary
Miami Gardens is a city located in Miami-Dade County, Florida. It is the third-largest city in Miami-Dade County, with a population of 109,680 as of the 2010 census. The city was incorporated in 2003 and is located in the north-central part of the county, between Miami and Fort Lauderdale.
History
The area that is now Miami Gardens was originally inhabited by the Tequesta Indians, who were the first Native American tribe to inhabit the area. The Tequesta Indians lived in the area for thousands of years before the arrival of Europeans. The first Europeans to settle in the area were the Spanish, who arrived in the late 1500s. The area was part of the Spanish colony of Florida until 1821, when it became part of the United States.
In the early 1900s, the area was mostly farmland and was known as “The Redland”. The area was sparsely populated until the 1950s, when the population began to grow rapidly due to the construction of the Miami International Airport and the development of the city of Miami. In the 1960s, the area was incorporated as the City of Miami Gardens.
Geography
Miami Gardens is located in the north-central part of Miami-Dade County, between Miami and Fort Lauderdale. The city covers an area of 22.4 square miles and is bordered by the cities of Miami, North Miami, Opa-locka, and Miramar. The city is located on the Atlantic Coastal Ridge, which is a low-lying area that is prone to flooding.
The city has a tropical climate, with hot and humid summers and mild winters. The average temperature in the summer is around 90°F, and the average temperature in the winter is around 70°F.
Economy
The economy of Miami Gardens is largely based on tourism and service industries. The city is home to several major tourist attractions, including the Miami Seaquarium, the Miami Zoo, and the Miami Beach Boardwalk. The city is also home to several major sports teams, including the Miami Dolphins, the Miami Heat, and the Florida Panthers.
The city is also home to several major corporations, including Burger King, Carnival Cruise Lines, and Ryder Systems. The city is also home to several major universities, including Florida International University, Miami Dade College, and the University of Miami.
Demographics
As of the 2010 census, the population of Miami Gardens was 109,680. The population is predominantly African American, with a majority of the population being of African descent. The city also has a large Hispanic population, with a majority of the population being of Cuban, Puerto Rican, and Dominican descent.
The median household income in Miami Gardens is $37,845, and the median home value is $179,000. The city has a poverty rate of 22.3%, which is higher than the national average.
Conclusion
Miami Gardens is a city located in Miami-Dade County, Florida. It is the third-largest city in Miami-Dade County, with a population of 109,680 as of the 2010 census. The city was incorporated in 2003 and is located in the north-central part of the county, between Miami and Fort Lauderdale. The economy of Miami Gardens is largely based on tourism and service industries, and the population is predominantly African American, with a majority of the population being of African descent. The city also has a large Hispanic population, with a majority of the population being of Cuban, Puerto Rican, and Dominican descent.
Common Questions
What is Per Capita Income in Miami Gardens?
Per Capita income in Miami Gardens is $23,556.
What is the Median Family Income in Miami Gardens?
Median Family Income in Miami Gardens is $63,027.
What is the Median Household income in Miami Gardens?
Median Household Income in Miami Gardens is $56,071.
What is Income or Wage Gap in Miami Gardens?
Income or Wage Gap in Miami Gardens is 13.0%.
Women in Miami Gardens earn 87.0 cents for every dollar earned by a man.
What is Family Income Deficit in Miami Gardens?
Family Income Deficit in Miami Gardens is $11,651.
Families that are below poverty line in Miami Gardens earn $11,651 less on average than the poverty threshold level.
What is Inequality or Gini Index in Miami Gardens?
Inequality or Gini Index in Miami Gardens is 0.42.
What is the Total Population of Miami Gardens?
Total Population of Miami Gardens is 111,618.
What is the Total Male Population of Miami Gardens?
Total Male Population of Miami Gardens is 53,030.
What is the Total Female Population of Miami Gardens?
Total Female Population of Miami Gardens is 58,588.
What is the Ratio of Males per 100 Females in Miami Gardens?
There are 90.51 Males per 100 Females in Miami Gardens.
What is the Ratio of Females per 100 Males in Miami Gardens?
There are 110.48 Females per 100 Males in Miami Gardens.
What is the Median Population Age in Miami Gardens?
Median Population Age in Miami Gardens is 38.2 Years.
What is the Average Family Size in Miami Gardens
Average Family Size in Miami Gardens is 3.7 People.
What is the Average Household Size in Miami Gardens
Average Household Size in Miami Gardens is 3.2 People.
How Large is the Labor Force in Miami Gardens?
There are 54,662 People in the Labor Forcein in Miami Gardens.
What is the Percentage of People in the Labor Force in Miami Gardens?
61.1% of People are in the Labor Force in Miami Gardens.
What is the Unemployment Rate in Miami Gardens?
Unemployment Rate in Miami Gardens is 7.9%.