Apopka, FL Map & Demographics
Apopka Map
Apopka Overview
$36,244
PER CAPITA INCOME
$98,194
AVG FAMILY INCOME
$87,394
AVG HOUSEHOLD INCOME
9.8%
WAGE / INCOME GAP [ % ]
90.2¢/ $1
WAGE / INCOME GAP [ $ ]
0.40
INEQUALITY / GINI INDEX
55,056
TOTAL POPULATION
26,441
MALE POPULATION
28,615
FEMALE POPULATION
92.40
MALES / 100 FEMALES
108.22
FEMALES / 100 MALES
38.9
MEDIAN AGE
3.5
AVG FAMILY SIZE
3.0
AVG HOUSEHOLD SIZE
29,685
LABOR FORCE [ PEOPLE ]
68.2%
PERCENT IN LABOR FORCE
3.4%
UNEMPLOYMENT RATE
Income in Apopka
Income Overview in Apopka
Per Capita Income in Apopka is $36,244, while median incomes of families and households are $98,194 and $87,394 respectively.
| Characteristic | Number | Measure |
| Per Capita Income | 55,056 | $36,244 |
| Median Family Income | 14,104 | $98,194 |
| Mean Family Income | 14,104 | $113,308 |
| Median Household Income | 18,157 | $87,394 |
| Mean Household Income | 18,157 | $105,032 |
| Income Deficit | 14,104 | $0 |
| Wage / Income Gap (%) | 55,056 | 9.81% |
| Wage / Income Gap ($) | 55,056 | 90.19¢ per $1 |
| Gini / Inequality Index | 55,056 | 0.40 |
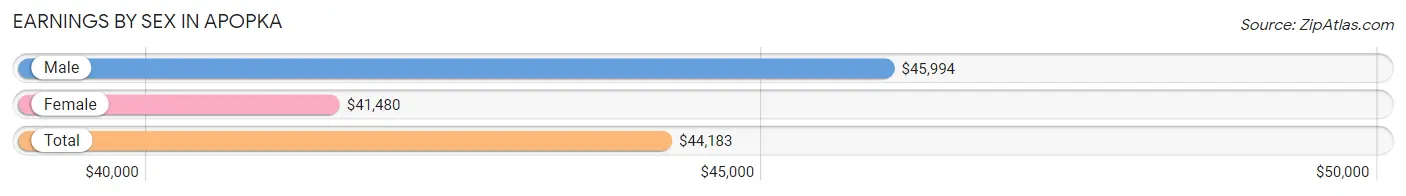
Earnings by Sex in Apopka
Average Earnings in Apopka are $44,183, $45,994 for men and $41,480 for women, a difference of 9.8%.
| Sex | Number | Average Earnings |
| Male | 15,940 (51.8%) | $45,994 |
| Female | 14,848 (48.2%) | $41,480 |
| Total | 30,788 (100.0%) | $44,183 |
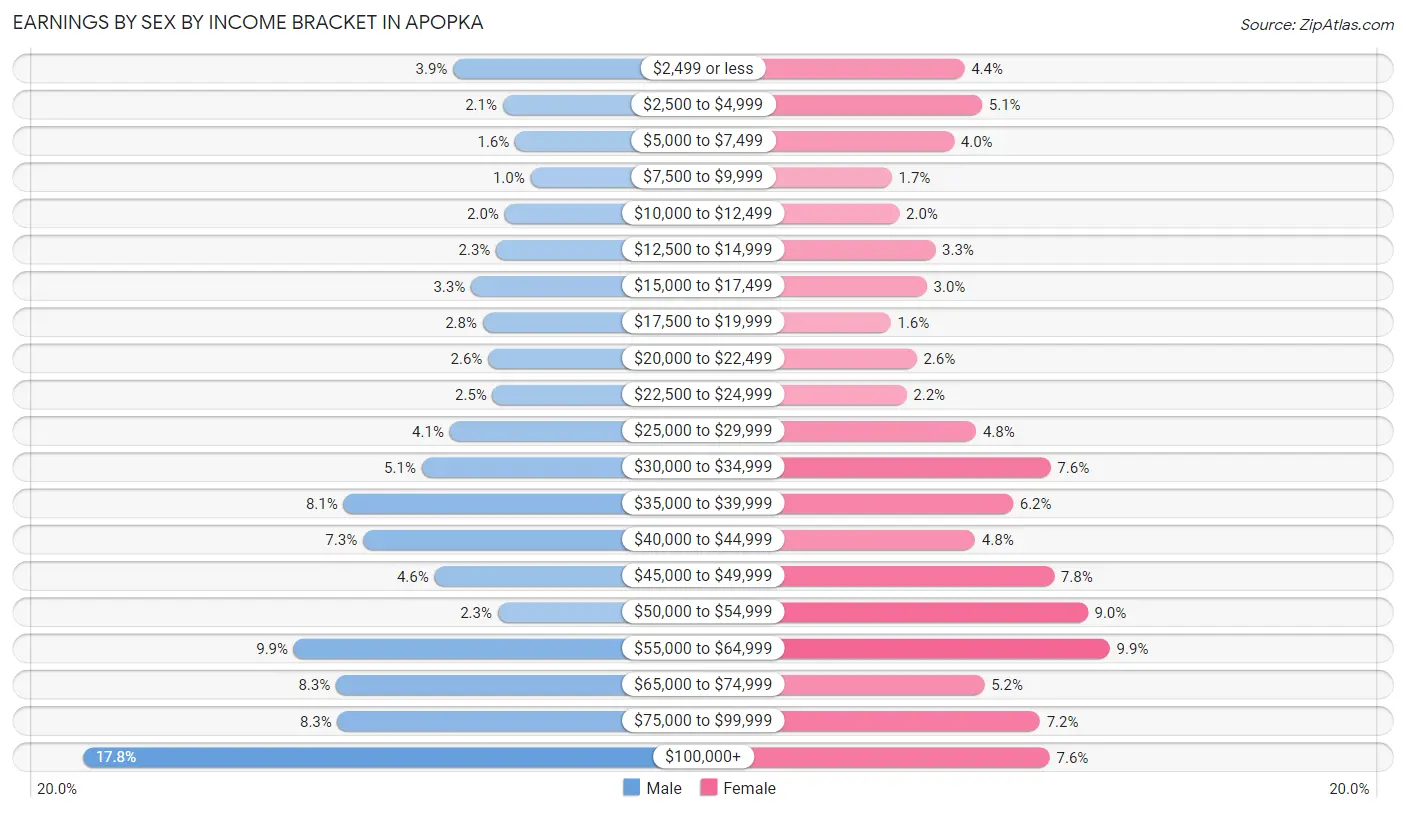
Earnings by Sex by Income Bracket in Apopka
The most common earnings brackets in Apopka are $100,000+ for men (2,840 | 17.8%) and $55,000 to $64,999 for women (1,463 | 9.9%).
| Income | Male | Female |
| $2,499 or less | 628 (3.9%) | 654 (4.4%) |
| $2,500 to $4,999 | 331 (2.1%) | 751 (5.1%) |
| $5,000 to $7,499 | 258 (1.6%) | 596 (4.0%) |
| $7,500 to $9,999 | 166 (1.0%) | 250 (1.7%) |
| $10,000 to $12,499 | 320 (2.0%) | 291 (2.0%) |
| $12,500 to $14,999 | 372 (2.3%) | 492 (3.3%) |
| $15,000 to $17,499 | 521 (3.3%) | 444 (3.0%) |
| $17,500 to $19,999 | 451 (2.8%) | 243 (1.6%) |
| $20,000 to $22,499 | 419 (2.6%) | 388 (2.6%) |
| $22,500 to $24,999 | 392 (2.5%) | 331 (2.2%) |
| $25,000 to $29,999 | 648 (4.1%) | 718 (4.8%) |
| $30,000 to $34,999 | 816 (5.1%) | 1,133 (7.6%) |
| $35,000 to $39,999 | 1,283 (8.1%) | 924 (6.2%) |
| $40,000 to $44,999 | 1,167 (7.3%) | 712 (4.8%) |
| $45,000 to $49,999 | 740 (4.6%) | 1,152 (7.8%) |
| $50,000 to $54,999 | 362 (2.3%) | 1,340 (9.0%) |
| $55,000 to $64,999 | 1,580 (9.9%) | 1,463 (9.9%) |
| $65,000 to $74,999 | 1,328 (8.3%) | 764 (5.1%) |
| $75,000 to $99,999 | 1,318 (8.3%) | 1,074 (7.2%) |
| $100,000+ | 2,840 (17.8%) | 1,128 (7.6%) |
| Total | 15,940 (100.0%) | 14,848 (100.0%) |
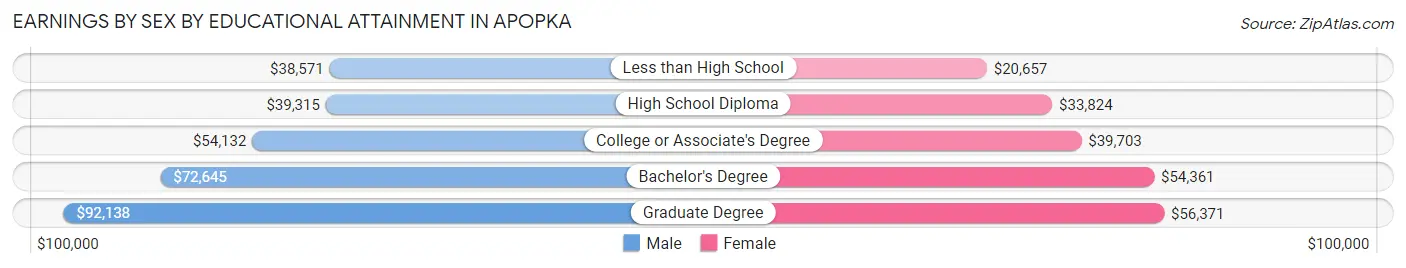
Earnings by Sex by Educational Attainment in Apopka
Average earnings in Apopka are $54,889 for men and $46,352 for women, a difference of 15.5%. Men with an educational attainment of graduate degree enjoy the highest average annual earnings of $92,138, while those with less than high school education earn the least with $38,571. Women with an educational attainment of graduate degree earn the most with the average annual earnings of $56,371, while those with less than high school education have the smallest earnings of $20,657.
| Educational Attainment | Male Income | Female Income |
| Less than High School | $38,571 | $20,657 |
| High School Diploma | $39,315 | $33,824 |
| College or Associate's Degree | $54,132 | $39,703 |
| Bachelor's Degree | $72,645 | $54,361 |
| Graduate Degree | $92,138 | $56,371 |
| Total | $54,889 | $46,352 |
Family Income in Apopka
Family Income Brackets in Apopka
According to the Apopka family income data, there are 2,990 families falling into the $100,000 to $149,999 income range, which is the most common income bracket and makes up 21.2% of all families. Conversely, the $10,000 to $14,999 income bracket is the least frequent group with only 141 families (1.0%) belonging to this category.
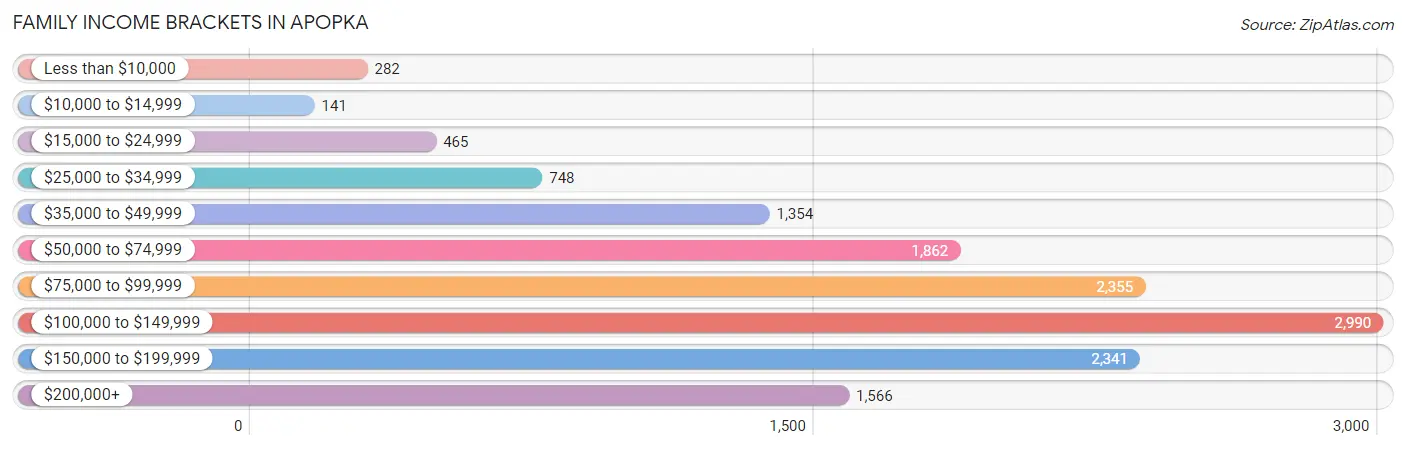
| Income Bracket | # Families | % Families |
| Less than $10,000 | 282 | 2.0% |
| $10,000 to $14,999 | 141 | 1.0% |
| $15,000 to $24,999 | 465 | 3.3% |
| $25,000 to $34,999 | 748 | 5.3% |
| $35,000 to $49,999 | 1,354 | 9.6% |
| $50,000 to $74,999 | 1,862 | 13.2% |
| $75,000 to $99,999 | 2,355 | 16.7% |
| $100,000 to $149,999 | 2,990 | 21.2% |
| $150,000 to $199,999 | 2,341 | 16.6% |
| $200,000+ | 1,566 | 11.1% |
Family Income by Famaliy Size in Apopka
7+ person families (233 | 1.7%) account for the highest median family income in Apopka with $135,865 per family, while 2-person families (5,703 | 40.4%) have the highest median income of $44,392 per family member.
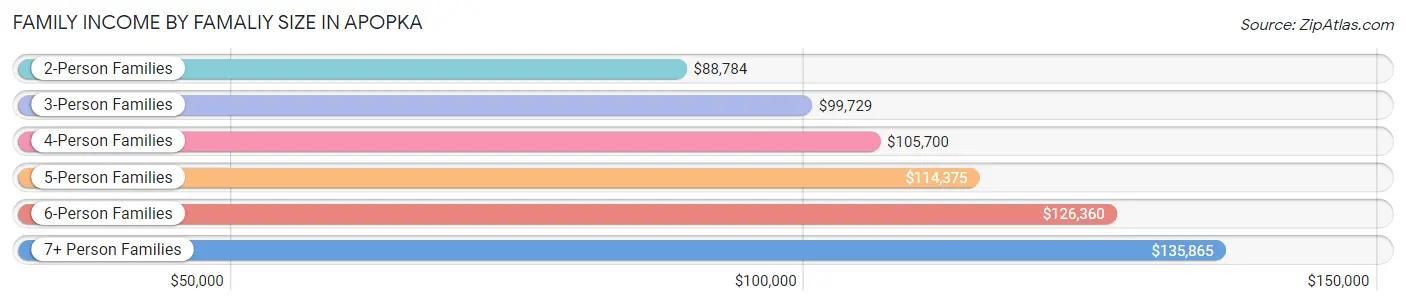
| Income Bracket | # Families | Median Income |
| 2-Person Families | 5,703 (40.4%) | $88,784 |
| 3-Person Families | 3,589 (25.5%) | $99,729 |
| 4-Person Families | 2,554 (18.1%) | $105,700 |
| 5-Person Families | 1,475 (10.5%) | $114,375 |
| 6-Person Families | 550 (3.9%) | $126,360 |
| 7+ Person Families | 233 (1.7%) | $135,865 |
| Total | 14,104 (100.0%) | $98,194 |
Family Income by Number of Earners in Apopka
The median family income in Apopka is $98,194, with families comprising 3+ earners (2,158) having the highest median family income of $139,932, while families with no earners (1,407) have the lowest median family income of $49,940, accounting for 15.3% and 10.0% of families, respectively.
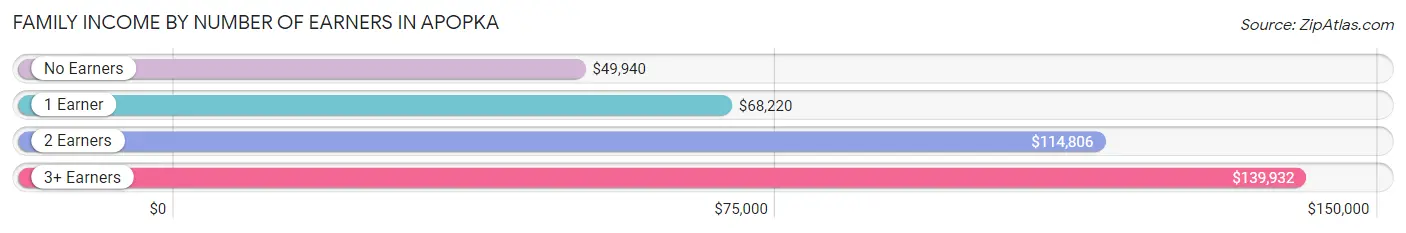
| Number of Earners | # Families | Median Income |
| No Earners | 1,407 (10.0%) | $49,940 |
| 1 Earner | 3,727 (26.4%) | $68,220 |
| 2 Earners | 6,812 (48.3%) | $114,806 |
| 3+ Earners | 2,158 (15.3%) | $139,932 |
| Total | 14,104 (100.0%) | $98,194 |
Household Income in Apopka
Household Income Brackets in Apopka
With 3,468 households falling in the category, the $100,000 to $149,999 income range is the most frequent in Apopka, accounting for 19.1% of all households. In contrast, only 399 households (2.2%) fall into the $10,000 to $14,999 income bracket, making it the least populous group.
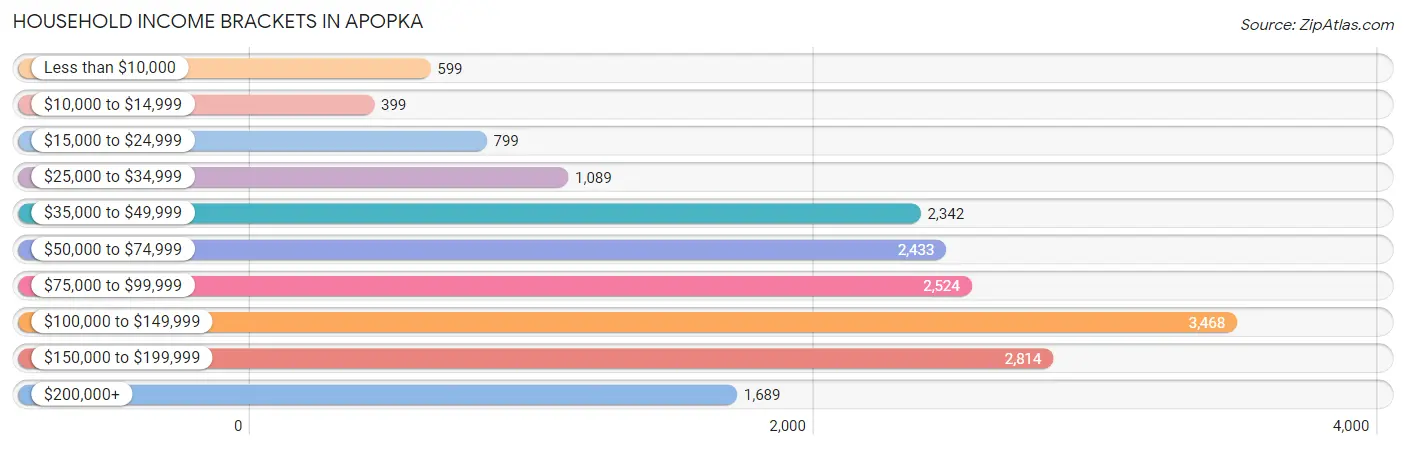
| Income Bracket | # Households | % Households |
| Less than $10,000 | 599 | 3.3% |
| $10,000 to $14,999 | 399 | 2.2% |
| $15,000 to $24,999 | 799 | 4.4% |
| $25,000 to $34,999 | 1,089 | 6.0% |
| $35,000 to $49,999 | 2,342 | 12.9% |
| $50,000 to $74,999 | 2,433 | 13.4% |
| $75,000 to $99,999 | 2,524 | 13.9% |
| $100,000 to $149,999 | 3,468 | 19.1% |
| $150,000 to $199,999 | 2,814 | 15.5% |
| $200,000+ | 1,689 | 9.3% |
Household Income by Householder Age in Apopka
The median household income in Apopka is $87,394, with the highest median household income of $168,571 found in the 15 to 24 years age bracket for the primary householder. A total of 82 households (0.4%) fall into this category. Meanwhile, the 65+ years age bracket for the primary householder has the lowest median household income of $52,361, with 3,625 households (20.0%) in this group.
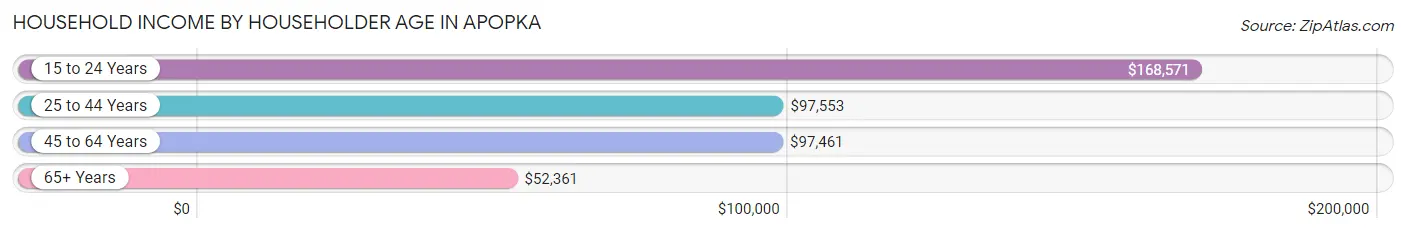
| Income Bracket | # Households | Median Income |
| 15 to 24 Years | 82 (0.4%) | $168,571 |
| 25 to 44 Years | 6,403 (35.3%) | $97,553 |
| 45 to 64 Years | 8,047 (44.3%) | $97,461 |
| 65+ Years | 3,625 (20.0%) | $52,361 |
| Total | 18,157 (100.0%) | $87,394 |
Poverty in Apopka
Income Below Poverty by Sex and Age in Apopka
With 9.2% poverty level for males and 10.7% for females among the residents of Apopka, 5 year old males and 5 year old females are the most vulnerable to poverty, with 107 males (38.1%) and 106 females (16.5%) in their respective age groups living below the poverty level.
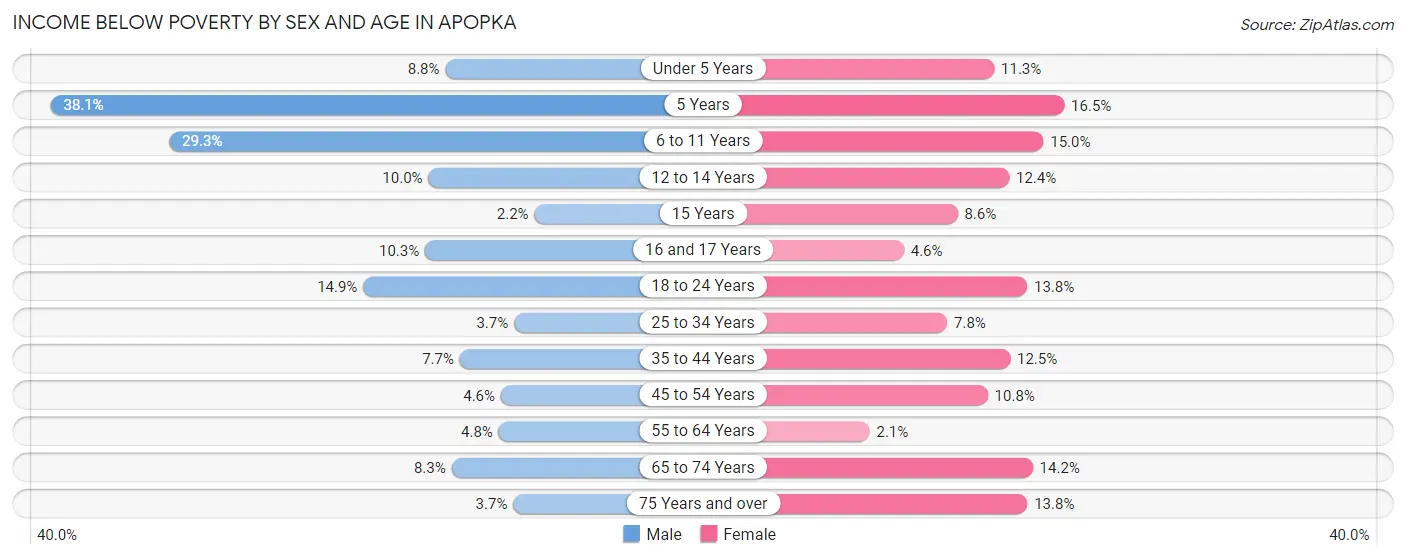
| Age Bracket | Male | Female |
| Under 5 Years | 154 (8.8%) | 154 (11.3%) |
| 5 Years | 107 (38.1%) | 106 (16.5%) |
| 6 to 11 Years | 644 (29.3%) | 275 (15.0%) |
| 12 to 14 Years | 103 (10.0%) | 171 (12.4%) |
| 15 Years | 11 (2.1%) | 39 (8.6%) |
| 16 and 17 Years | 79 (10.3%) | 46 (4.6%) |
| 18 to 24 Years | 374 (14.9%) | 267 (13.8%) |
| 25 to 34 Years | 129 (3.7%) | 291 (7.8%) |
| 35 to 44 Years | 257 (7.7%) | 483 (12.5%) |
| 45 to 54 Years | 203 (4.6%) | 485 (10.8%) |
| 55 to 64 Years | 147 (4.8%) | 64 (2.1%) |
| 65 to 74 Years | 171 (8.3%) | 366 (14.2%) |
| 75 Years and over | 33 (3.7%) | 295 (13.8%) |
| Total | 2,412 (9.2%) | 3,042 (10.7%) |
Income Above Poverty by Sex and Age in Apopka
According to the poverty statistics in Apopka, males aged 15 years and females aged 55 to 64 years are the age groups that are most secure financially, with 97.9% of males and 97.9% of females in these age groups living above the poverty line.
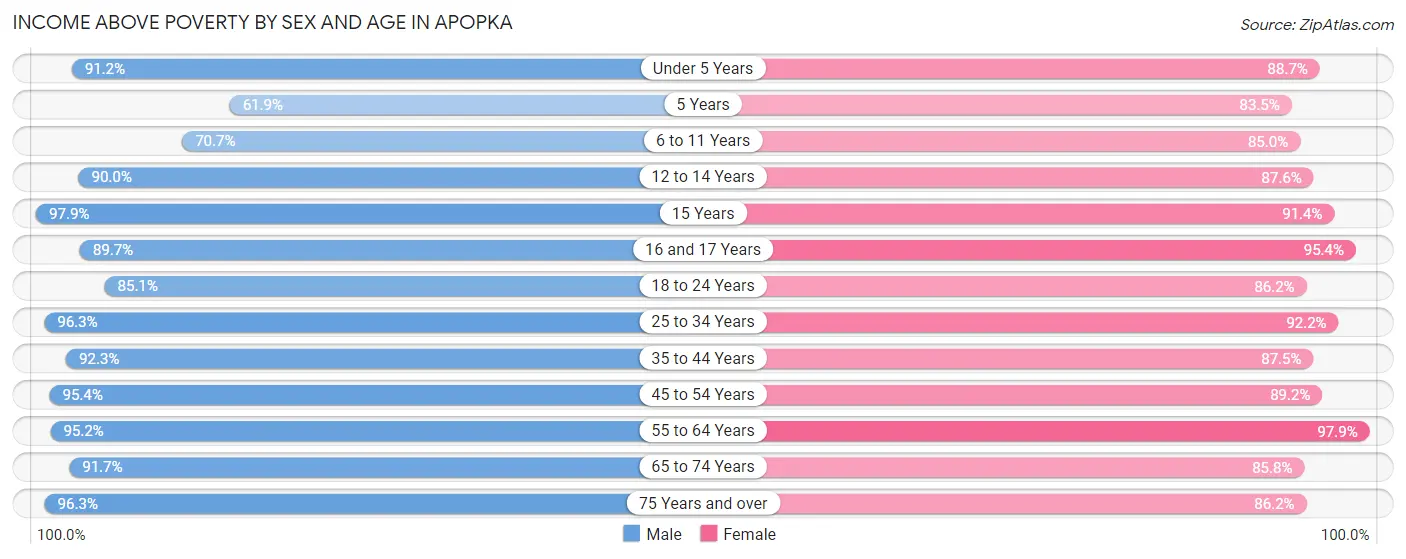
| Age Bracket | Male | Female |
| Under 5 Years | 1,604 (91.2%) | 1,208 (88.7%) |
| 5 Years | 174 (61.9%) | 536 (83.5%) |
| 6 to 11 Years | 1,556 (70.7%) | 1,563 (85.0%) |
| 12 to 14 Years | 925 (90.0%) | 1,206 (87.6%) |
| 15 Years | 500 (97.9%) | 415 (91.4%) |
| 16 and 17 Years | 690 (89.7%) | 954 (95.4%) |
| 18 to 24 Years | 2,143 (85.1%) | 1,674 (86.2%) |
| 25 to 34 Years | 3,400 (96.3%) | 3,428 (92.2%) |
| 35 to 44 Years | 3,085 (92.3%) | 3,385 (87.5%) |
| 45 to 54 Years | 4,172 (95.4%) | 3,993 (89.2%) |
| 55 to 64 Years | 2,913 (95.2%) | 3,045 (97.9%) |
| 65 to 74 Years | 1,890 (91.7%) | 2,217 (85.8%) |
| 75 Years and over | 855 (96.3%) | 1,848 (86.2%) |
| Total | 23,907 (90.8%) | 25,472 (89.3%) |
Income Below Poverty Among Married-Couple Families in Apopka
The poverty statistics for married-couple families in Apopka show that 4.8% or 503 of the total 10,577 families live below the poverty line. Families with 5 or more children have the highest poverty rate of 37.1%, comprising of 36 families. On the other hand, families with 1 or 2 children have the lowest poverty rate of 1.8%, which includes 70 families.
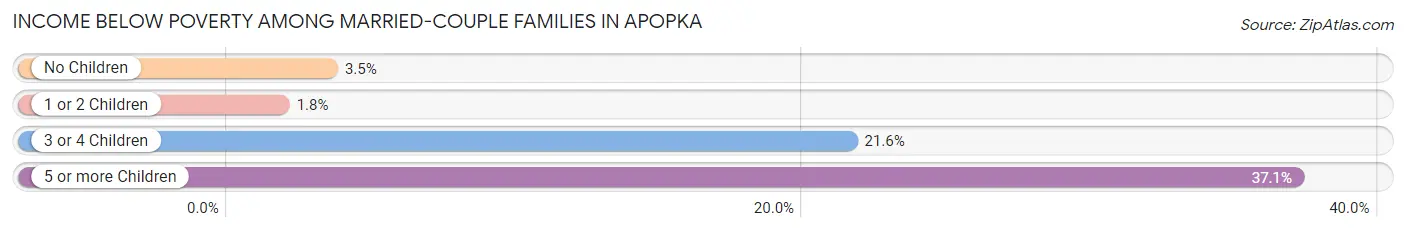
| Children | Above Poverty | Below Poverty |
| No Children | 5,465 (96.5%) | 197 (3.5%) |
| 1 or 2 Children | 3,821 (98.2%) | 70 (1.8%) |
| 3 or 4 Children | 727 (78.4%) | 200 (21.6%) |
| 5 or more Children | 61 (62.9%) | 36 (37.1%) |
| Total | 10,074 (95.2%) | 503 (4.8%) |
Income Below Poverty Among Single-Parent Households in Apopka
According to the poverty data in Apopka, 1.1% or 10 single-father households and 19.2% or 495 single-mother households are living below the poverty line. Among single-father households, those with 3 or 4 children have the highest poverty rate, with 10 households (25.6%) experiencing poverty. Likewise, among single-mother households, those with 3 or 4 children have the highest poverty rate, with 103 households (35.5%) falling below the poverty line.
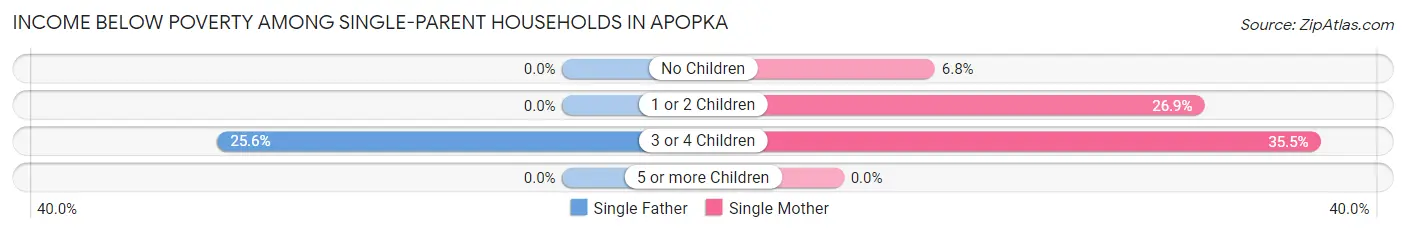
| Children | Single Father | Single Mother |
| No Children | 0 (0.0%) | 76 (6.8%) |
| 1 or 2 Children | 0 (0.0%) | 316 (26.9%) |
| 3 or 4 Children | 10 (25.6%) | 103 (35.5%) |
| 5 or more Children | 0 (0.0%) | 0 (0.0%) |
| Total | 10 (1.1%) | 495 (19.2%) |
Income Below Poverty Among Married-Couple vs Single-Parent Households in Apopka
The poverty data for Apopka shows that 503 of the married-couple family households (4.8%) and 505 of the single-parent households (14.3%) are living below the poverty level. Within the married-couple family households, those with 5 or more children have the highest poverty rate, with 36 households (37.1%) falling below the poverty line. Among the single-parent households, those with 3 or 4 children have the highest poverty rate, with 113 household (34.4%) living below poverty.
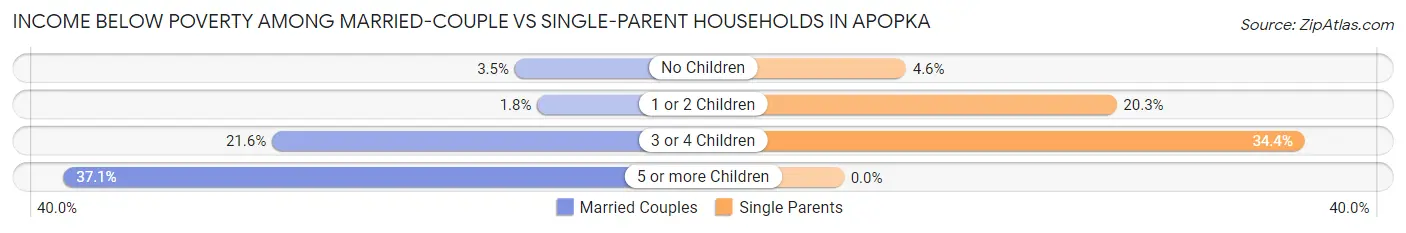
| Children | Married-Couple Families | Single-Parent Households |
| No Children | 197 (3.5%) | 76 (4.6%) |
| 1 or 2 Children | 70 (1.8%) | 316 (20.3%) |
| 3 or 4 Children | 200 (21.6%) | 113 (34.4%) |
| 5 or more Children | 36 (37.1%) | 0 (0.0%) |
| Total | 503 (4.8%) | 505 (14.3%) |
Race in Apopka
The most populous races in Apopka are White / Caucasian (27,138 | 49.3%), Hispanic or Latino (15,619 | 28.4%), and Black / African American (13,916 | 25.3%).
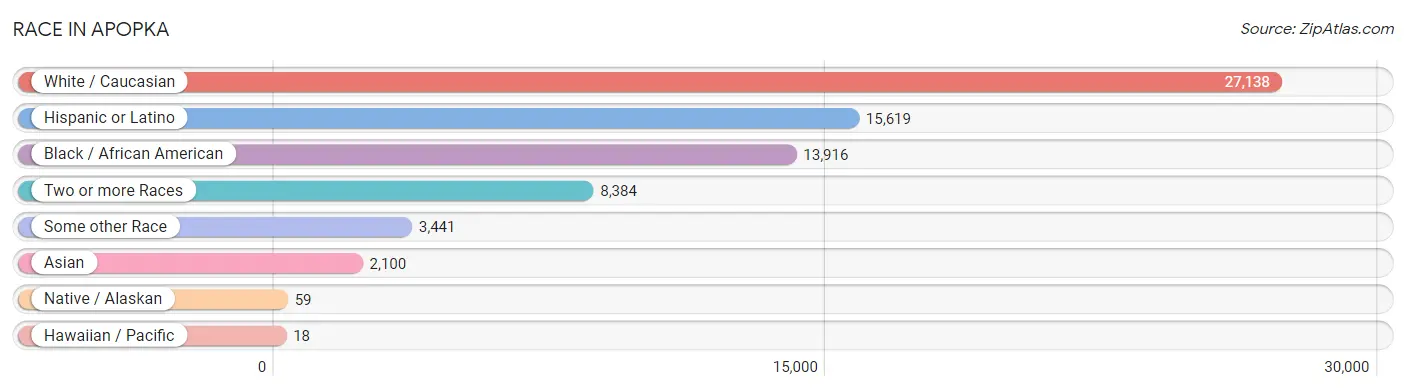
| Race | # Population | % Population |
| Asian | 2,100 | 3.8% |
| Black / African American | 13,916 | 25.3% |
| Hawaiian / Pacific | 18 | 0.0% |
| Hispanic or Latino | 15,619 | 28.4% |
| Native / Alaskan | 59 | 0.1% |
| White / Caucasian | 27,138 | 49.3% |
| Two or more Races | 8,384 | 15.2% |
| Some other Race | 3,441 | 6.2% |
| Total | 55,056 | 100.0% |
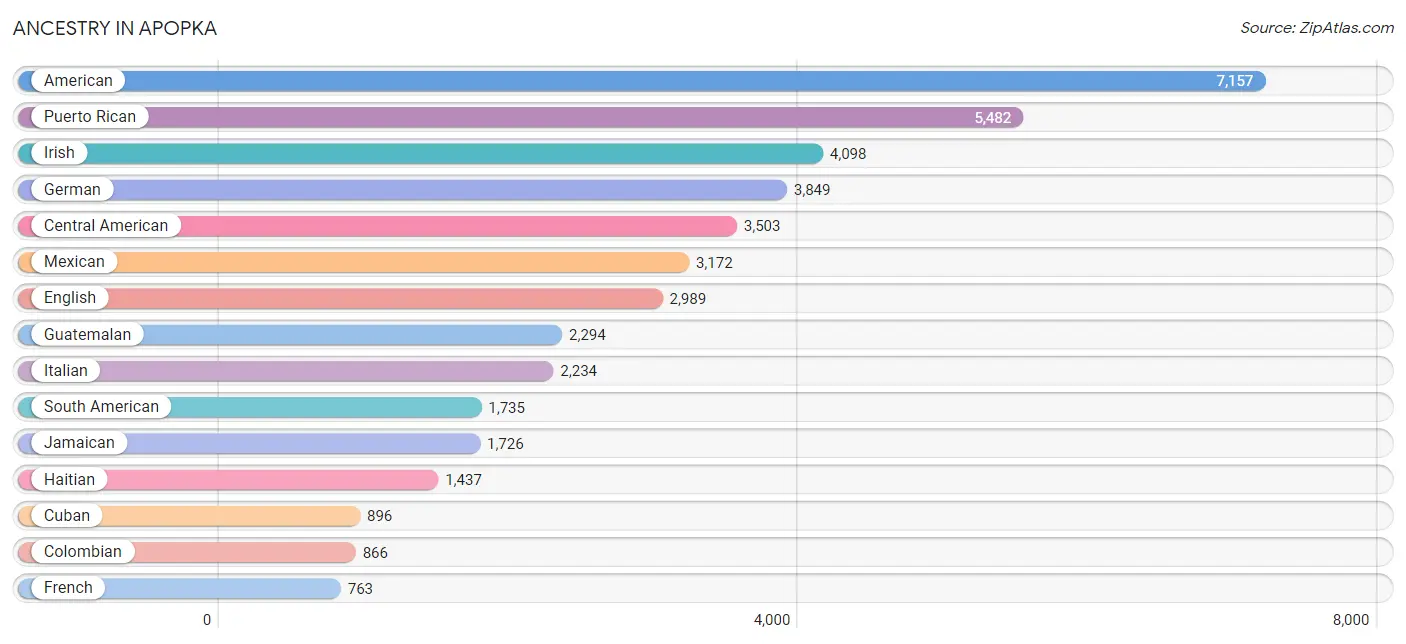
Ancestry in Apopka
The most populous ancestries reported in Apopka are American (7,157 | 13.0%), Puerto Rican (5,482 | 10.0%), Irish (4,098 | 7.4%), German (3,849 | 7.0%), and Central American (3,503 | 6.4%), together accounting for 43.8% of all Apopka residents.
| Ancestry | # Population | % Population |
| African | 421 | 0.8% |
| Albanian | 16 | 0.0% |
| American | 7,157 | 13.0% |
| Arab | 26 | 0.1% |
| Argentinean | 42 | 0.1% |
| Armenian | 13 | 0.0% |
| Austrian | 32 | 0.1% |
| Bahamian | 57 | 0.1% |
| Barbadian | 36 | 0.1% |
| Basque | 4 | 0.0% |
| Belgian | 13 | 0.0% |
| Bhutanese | 21 | 0.0% |
| Bolivian | 9 | 0.0% |
| Brazilian | 98 | 0.2% |
| British | 204 | 0.4% |
| British West Indian | 88 | 0.2% |
| Bulgarian | 22 | 0.0% |
| Burmese | 304 | 0.5% |
| Canadian | 56 | 0.1% |
| Central American | 3,503 | 6.4% |
| Central American Indian | 72 | 0.1% |
| Cherokee | 50 | 0.1% |
| Chilean | 17 | 0.0% |
| Colombian | 866 | 1.6% |
| Costa Rican | 42 | 0.1% |
| Cuban | 896 | 1.6% |
| Czech | 143 | 0.3% |
| Czechoslovakian | 33 | 0.1% |
| Danish | 4 | 0.0% |
| Dominican | 543 | 1.0% |
| Dutch | 302 | 0.5% |
| Dutch West Indian | 22 | 0.0% |
| Ecuadorian | 208 | 0.4% |
| English | 2,989 | 5.4% |
| Ethiopian | 38 | 0.1% |
| European | 511 | 0.9% |
| Finnish | 26 | 0.1% |
| French | 763 | 1.4% |
| French American Indian | 65 | 0.1% |
| French Canadian | 84 | 0.2% |
| German | 3,849 | 7.0% |
| Greek | 184 | 0.3% |
| Guatemalan | 2,294 | 4.2% |
| Guyanese | 85 | 0.2% |
| Haitian | 1,437 | 2.6% |
| Honduran | 583 | 1.1% |
| Hungarian | 99 | 0.2% |
| Indian (Asian) | 448 | 0.8% |
| Indonesian | 206 | 0.4% |
| Irish | 4,098 | 7.4% |
| Italian | 2,234 | 4.1% |
| Jamaican | 1,726 | 3.1% |
| Korean | 465 | 0.8% |
| Latvian | 26 | 0.1% |
| Lebanese | 20 | 0.0% |
| Lithuanian | 7 | 0.0% |
| Macedonian | 39 | 0.1% |
| Maltese | 80 | 0.2% |
| Mexican | 3,172 | 5.8% |
| Native Hawaiian | 11 | 0.0% |
| Nicaraguan | 87 | 0.2% |
| Nigerian | 21 | 0.0% |
| Northern European | 29 | 0.1% |
| Norwegian | 427 | 0.8% |
| Pakistani | 17 | 0.0% |
| Panamanian | 17 | 0.0% |
| Peruvian | 475 | 0.9% |
| Polish | 544 | 1.0% |
| Portuguese | 67 | 0.1% |
| Puerto Rican | 5,482 | 10.0% |
| Romanian | 99 | 0.2% |
| Russian | 133 | 0.2% |
| Salvadoran | 397 | 0.7% |
| Samoan | 101 | 0.2% |
| Scandinavian | 48 | 0.1% |
| Scotch-Irish | 139 | 0.3% |
| Scottish | 436 | 0.8% |
| Seminole | 28 | 0.1% |
| Sioux | 41 | 0.1% |
| Slovene | 22 | 0.0% |
| South American | 1,735 | 3.2% |
| Spaniard | 190 | 0.4% |
| Spanish | 13 | 0.0% |
| Spanish American Indian | 10 | 0.0% |
| Sri Lankan | 471 | 0.9% |
| Subsaharan African | 480 | 0.9% |
| Swedish | 134 | 0.2% |
| Syrian | 6 | 0.0% |
| Thai | 425 | 0.8% |
| Trinidadian and Tobagonian | 122 | 0.2% |
| Turkish | 32 | 0.1% |
| U.S. Virgin Islander | 95 | 0.2% |
| Ukrainian | 26 | 0.1% |
| Venezuelan | 111 | 0.2% |
| Vietnamese | 10 | 0.0% |
| Welsh | 138 | 0.3% |
| West Indian | 175 | 0.3% |
| Yugoslavian | 34 | 0.1% | View All 98 Rows |
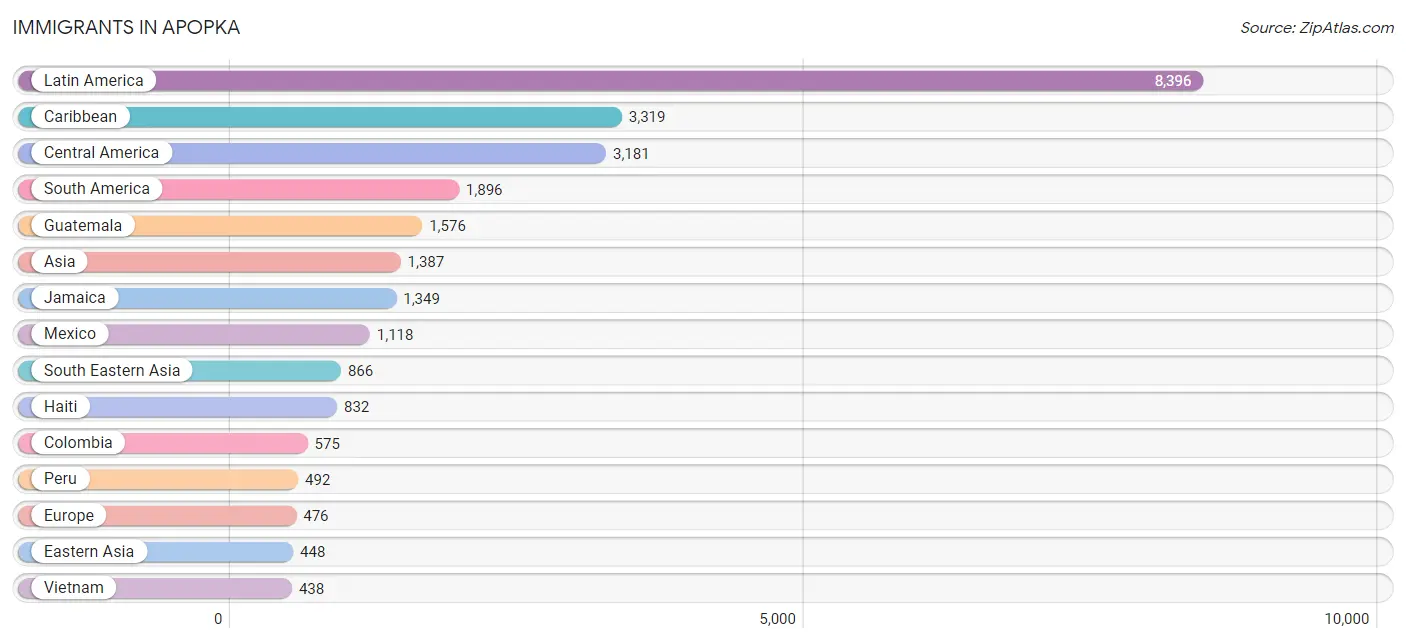
Immigrants in Apopka
The most numerous immigrant groups reported in Apopka came from Latin America (8,396 | 15.2%), Caribbean (3,319 | 6.0%), Central America (3,181 | 5.8%), South America (1,896 | 3.4%), and Guatemala (1,576 | 2.9%), together accounting for 33.4% of all Apopka residents.
| Immigration Origin | # Population | % Population |
| Africa | 231 | 0.4% |
| Argentina | 50 | 0.1% |
| Asia | 1,387 | 2.5% |
| Austria | 9 | 0.0% |
| Bahamas | 90 | 0.2% |
| Bangladesh | 10 | 0.0% |
| Barbados | 64 | 0.1% |
| Bolivia | 9 | 0.0% |
| Brazil | 121 | 0.2% |
| Bulgaria | 22 | 0.0% |
| Canada | 192 | 0.4% |
| Caribbean | 3,319 | 6.0% |
| Central America | 3,181 | 5.8% |
| Chile | 9 | 0.0% |
| China | 256 | 0.5% |
| Colombia | 575 | 1.0% |
| Costa Rica | 24 | 0.0% |
| Cuba | 275 | 0.5% |
| Czechoslovakia | 22 | 0.0% |
| Dominica | 19 | 0.0% |
| Dominican Republic | 208 | 0.4% |
| Eastern Africa | 218 | 0.4% |
| Eastern Asia | 448 | 0.8% |
| Eastern Europe | 149 | 0.3% |
| Ecuador | 132 | 0.2% |
| El Salvador | 81 | 0.2% |
| England | 31 | 0.1% |
| Ethiopia | 38 | 0.1% |
| Europe | 476 | 0.9% |
| France | 9 | 0.0% |
| Germany | 231 | 0.4% |
| Grenada | 42 | 0.1% |
| Guatemala | 1,576 | 2.9% |
| Guyana | 289 | 0.5% |
| Haiti | 832 | 1.5% |
| Honduras | 239 | 0.4% |
| Hungary | 27 | 0.1% |
| India | 43 | 0.1% |
| Italy | 8 | 0.0% |
| Jamaica | 1,349 | 2.5% |
| Kazakhstan | 20 | 0.0% |
| Kenya | 12 | 0.0% |
| Korea | 192 | 0.4% |
| Latin America | 8,396 | 15.2% |
| Mexico | 1,118 | 2.0% |
| Moldova | 8 | 0.0% |
| Morocco | 13 | 0.0% |
| Nicaragua | 143 | 0.3% |
| Northern Africa | 13 | 0.0% |
| Northern Europe | 70 | 0.1% |
| Peru | 492 | 0.9% |
| Philippines | 222 | 0.4% |
| Poland | 40 | 0.1% |
| Romania | 30 | 0.1% |
| South America | 1,896 | 3.4% |
| South Central Asia | 73 | 0.1% |
| South Eastern Asia | 866 | 1.6% |
| Southern Europe | 8 | 0.0% |
| Taiwan | 88 | 0.2% |
| Trinidad and Tobago | 158 | 0.3% |
| Venezuela | 219 | 0.4% |
| Vietnam | 438 | 0.8% |
| Western Europe | 249 | 0.4% |
| Zimbabwe | 168 | 0.3% | View All 64 Rows |
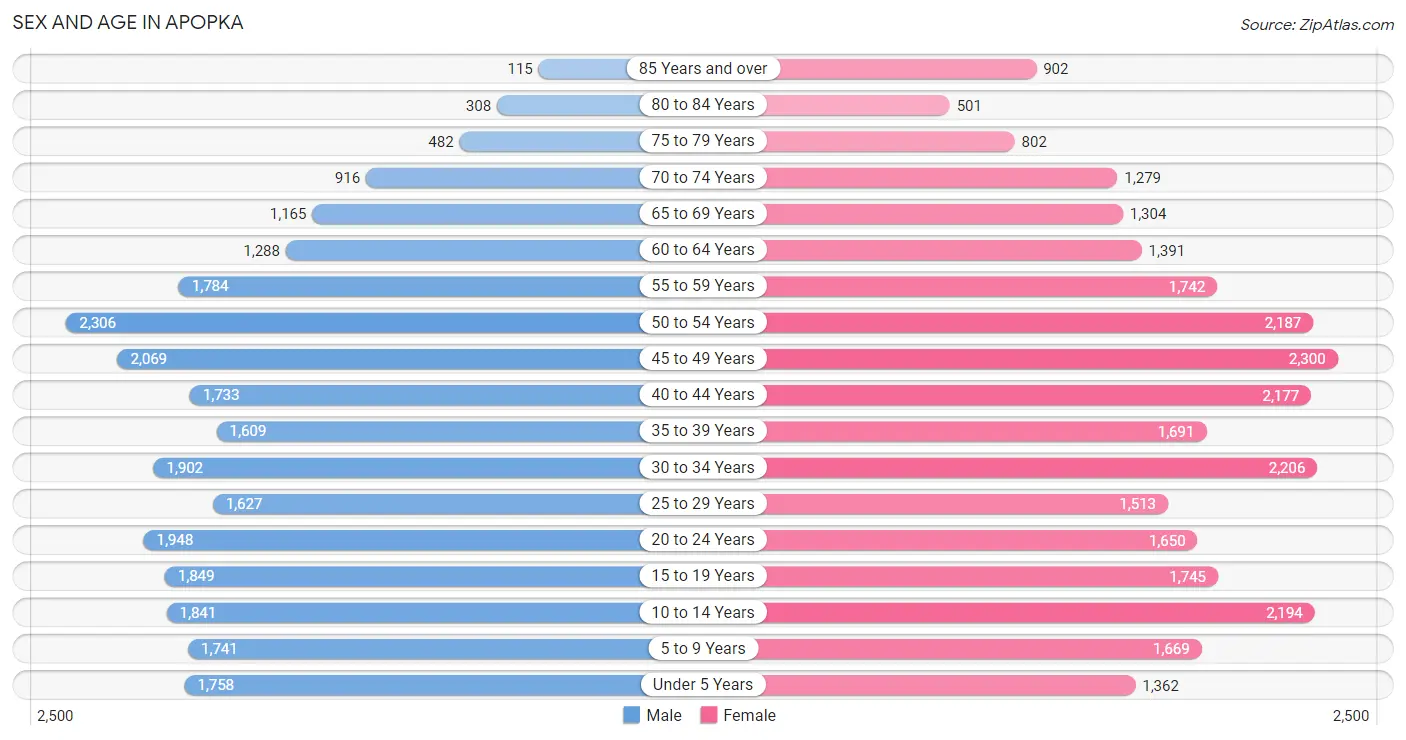
Sex and Age in Apopka
Sex and Age in Apopka
The most populous age groups in Apopka are 50 to 54 Years (2,306 | 8.7%) for men and 45 to 49 Years (2,300 | 8.0%) for women.
| Age Bracket | Male | Female |
| Under 5 Years | 1,758 (6.7%) | 1,362 (4.8%) |
| 5 to 9 Years | 1,741 (6.6%) | 1,669 (5.8%) |
| 10 to 14 Years | 1,841 (7.0%) | 2,194 (7.7%) |
| 15 to 19 Years | 1,849 (7.0%) | 1,745 (6.1%) |
| 20 to 24 Years | 1,948 (7.4%) | 1,650 (5.8%) |
| 25 to 29 Years | 1,627 (6.1%) | 1,513 (5.3%) |
| 30 to 34 Years | 1,902 (7.2%) | 2,206 (7.7%) |
| 35 to 39 Years | 1,609 (6.1%) | 1,691 (5.9%) |
| 40 to 44 Years | 1,733 (6.6%) | 2,177 (7.6%) |
| 45 to 49 Years | 2,069 (7.8%) | 2,300 (8.0%) |
| 50 to 54 Years | 2,306 (8.7%) | 2,187 (7.6%) |
| 55 to 59 Years | 1,784 (6.8%) | 1,742 (6.1%) |
| 60 to 64 Years | 1,288 (4.9%) | 1,391 (4.9%) |
| 65 to 69 Years | 1,165 (4.4%) | 1,304 (4.6%) |
| 70 to 74 Years | 916 (3.5%) | 1,279 (4.5%) |
| 75 to 79 Years | 482 (1.8%) | 802 (2.8%) |
| 80 to 84 Years | 308 (1.2%) | 501 (1.8%) |
| 85 Years and over | 115 (0.4%) | 902 (3.2%) |
| Total | 26,441 (100.0%) | 28,615 (100.0%) |
Families and Households in Apopka
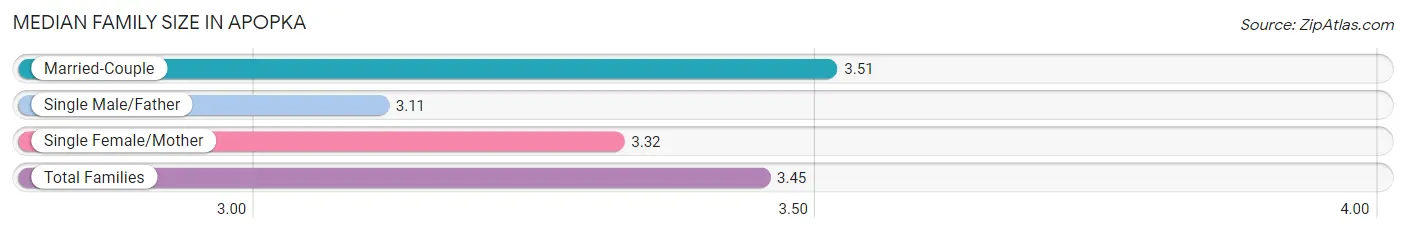
Median Family Size in Apopka
The median family size in Apopka is 3.45 persons per family, with married-couple families (10,577 | 75.0%) accounting for the largest median family size of 3.51 persons per family. On the other hand, single male/father families (942 | 6.7%) represent the smallest median family size with 3.11 persons per family.
| Family Type | # Families | Family Size |
| Married-Couple | 10,577 (75.0%) | 3.51 |
| Single Male/Father | 942 (6.7%) | 3.11 |
| Single Female/Mother | 2,585 (18.3%) | 3.32 |
| Total Families | 14,104 (100.0%) | 3.45 |
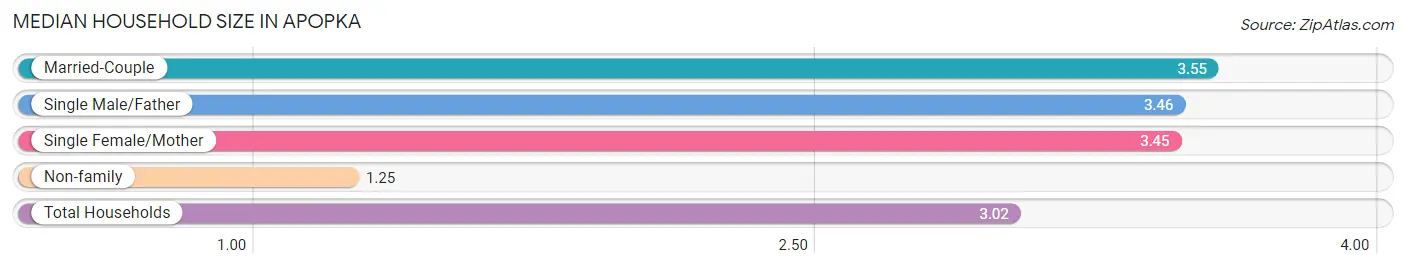
Median Household Size in Apopka
The median household size in Apopka is 3.02 persons per household, with married-couple households (10,577 | 58.3%) accounting for the largest median household size of 3.55 persons per household. non-family households (4,053 | 22.3%) represent the smallest median household size with 1.25 persons per household.
| Household Type | # Households | Household Size |
| Married-Couple | 10,577 (58.3%) | 3.55 |
| Single Male/Father | 942 (5.2%) | 3.46 |
| Single Female/Mother | 2,585 (14.2%) | 3.45 |
| Non-family | 4,053 (22.3%) | 1.25 |
| Total Households | 18,157 (100.0%) | 3.02 |
Household Size by Marriage Status in Apopka
Out of a total of 18,157 households in Apopka, 14,104 (77.7%) are family households, while 4,053 (22.3%) are nonfamily households. The most numerous type of family households are 2-person households, comprising 5,483, and the most common type of nonfamily households are 1-person households, comprising 3,227.
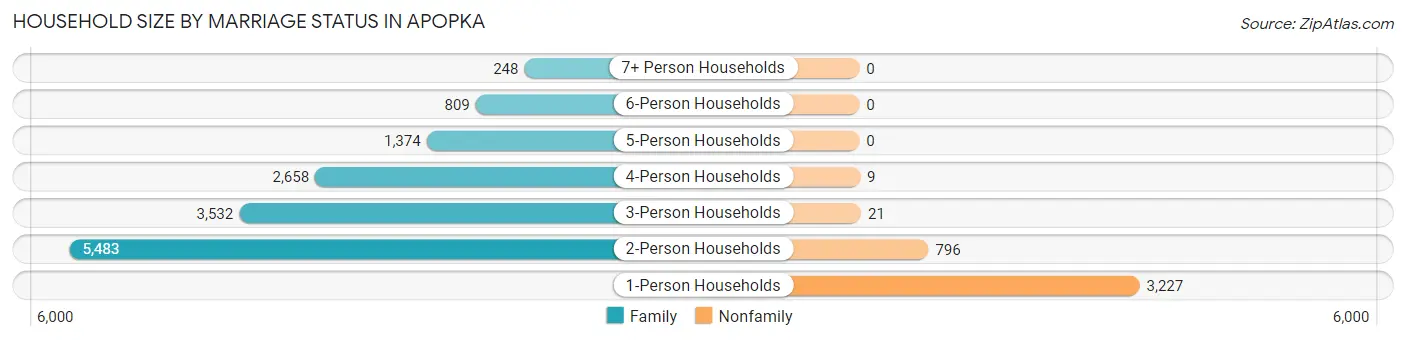
| Household Size | Family Households | Nonfamily Households |
| 1-Person Households | - | 3,227 (17.8%) |
| 2-Person Households | 5,483 (30.2%) | 796 (4.4%) |
| 3-Person Households | 3,532 (19.5%) | 21 (0.1%) |
| 4-Person Households | 2,658 (14.6%) | 9 (0.1%) |
| 5-Person Households | 1,374 (7.6%) | 0 (0.0%) |
| 6-Person Households | 809 (4.5%) | 0 (0.0%) |
| 7+ Person Households | 248 (1.4%) | 0 (0.0%) |
| Total | 14,104 (77.7%) | 4,053 (22.3%) |
Female Fertility in Apopka
Fertility by Age in Apopka
Average fertility rate in Apopka is 46.0 births per 1,000 women. Women in the age bracket of 20 to 34 years have the highest fertility rate with 93.0 births per 1,000 women. Women in the age bracket of 20 to 34 years acount for 79.4% of all women with births.
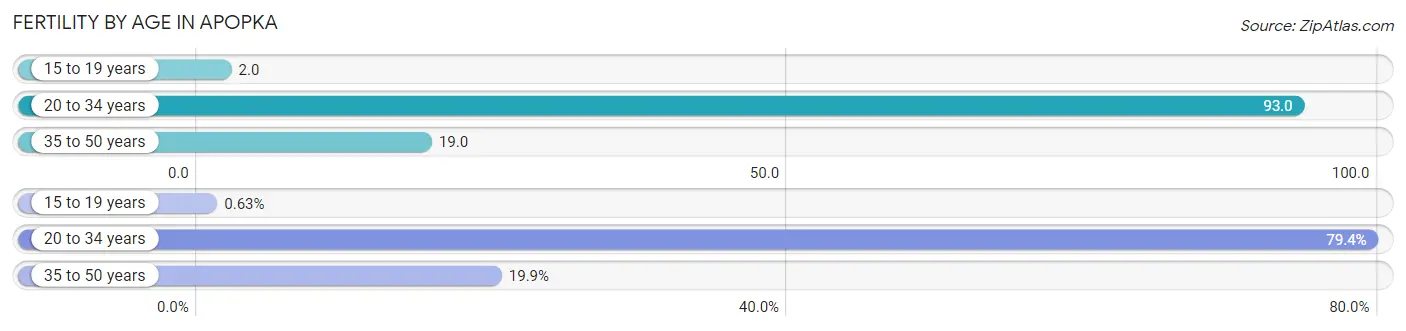
| Age Bracket | Women with Births | Births / 1,000 Women |
| 15 to 19 years | 4 (0.6%) | 2.0 |
| 20 to 34 years | 502 (79.4%) | 93.0 |
| 35 to 50 years | 126 (19.9%) | 19.0 |
| Total | 632 (100.0%) | 46.0 |
Fertility by Age by Marriage Status in Apopka
85.8% of women with births (632) in Apopka are married. The highest percentage of unmarried women with births falls into 15 to 19 years age bracket with 100.0% of them unmarried at the time of birth, while the lowest percentage of unmarried women with births belong to 20 to 34 years age bracket with 11.6% of them unmarried.
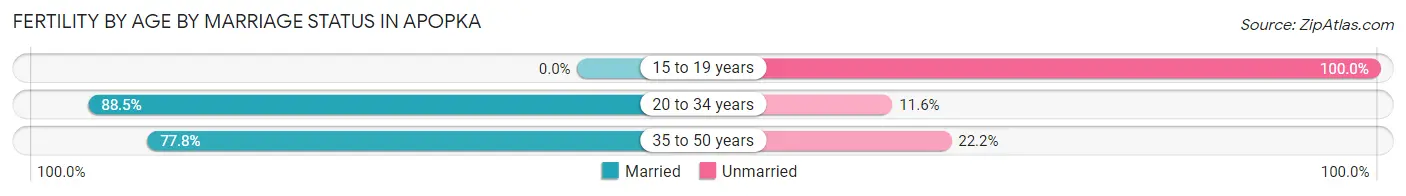
| Age Bracket | Married | Unmarried |
| 15 to 19 years | 0 (0.0%) | 4 (100.0%) |
| 20 to 34 years | 444 (88.4%) | 58 (11.6%) |
| 35 to 50 years | 98 (77.8%) | 28 (22.2%) |
| Total | 542 (85.8%) | 90 (14.2%) |
Fertility by Education in Apopka
Average fertility rate in Apopka is 46.0 births per 1,000 women. Women with the education attainment of college or associate's degree have the highest fertility rate of 84.0 births per 1,000 women, while women with the education attainment of less than high school have the lowest fertility at 24.0 births per 1,000 women. Women with the education attainment of college or associate's degree represent 46.5% of all women with births.
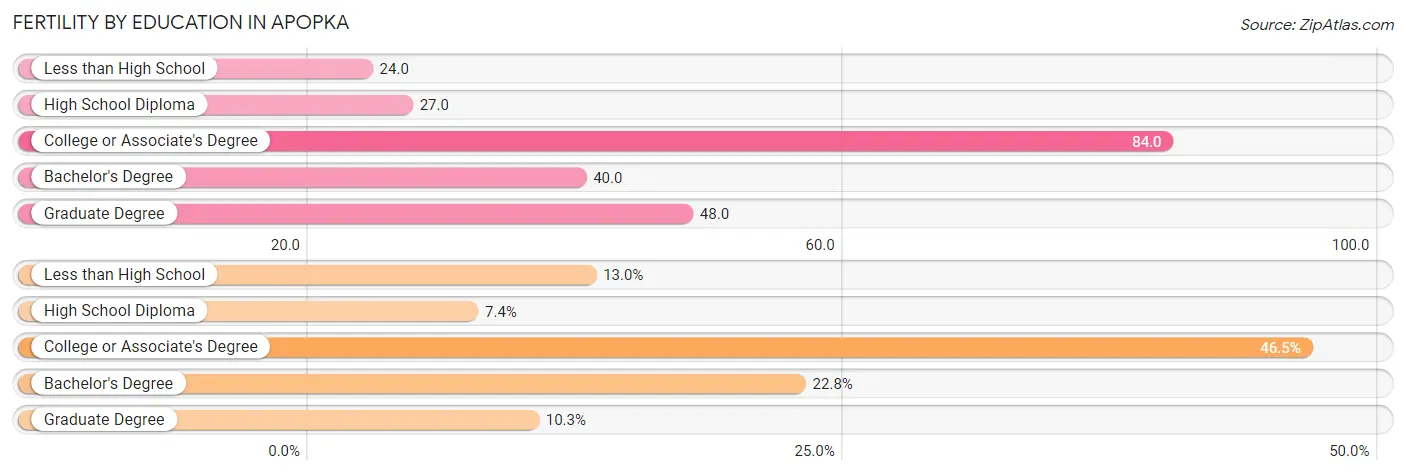
| Educational Attainment | Women with Births | Births / 1,000 Women |
| Less than High School | 82 (13.0%) | 24.0 |
| High School Diploma | 47 (7.4%) | 27.0 |
| College or Associate's Degree | 294 (46.5%) | 84.0 |
| Bachelor's Degree | 144 (22.8%) | 40.0 |
| Graduate Degree | 65 (10.3%) | 48.0 |
| Total | 632 (100.0%) | 46.0 |
Fertility by Education by Marriage Status in Apopka
14.2% of women with births in Apopka are unmarried. Women with the educational attainment of bachelor's degree are most likely to be married with 100.0% of them married at childbirth, while women with the educational attainment of high school diploma are least likely to be married with 59.6% of them unmarried at childbirth.
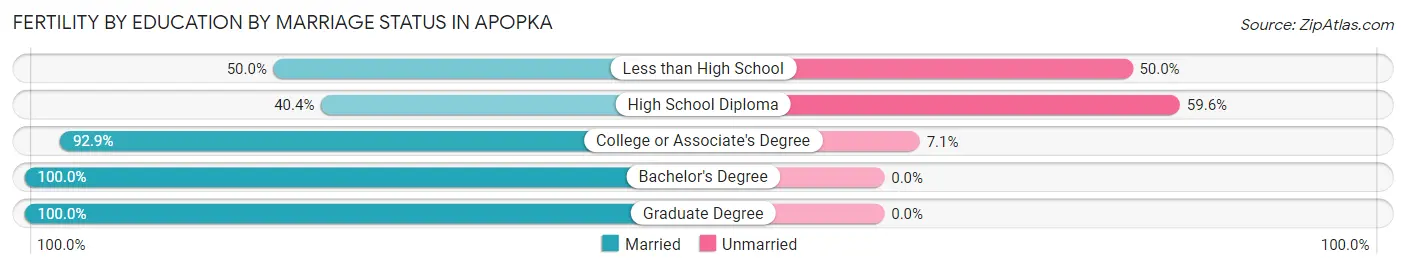
| Educational Attainment | Married | Unmarried |
| Less than High School | 41 (50.0%) | 41 (50.0%) |
| High School Diploma | 19 (40.4%) | 28 (59.6%) |
| College or Associate's Degree | 273 (92.9%) | 21 (7.1%) |
| Bachelor's Degree | 144 (100.0%) | 0 (0.0%) |
| Graduate Degree | 65 (100.0%) | 0 (0.0%) |
| Total | 542 (85.8%) | 90 (14.2%) |
Employment Characteristics in Apopka
Employment by Class of Employer in Apopka
Among the 28,359 employed individuals in Apopka, private company employees (20,574 | 72.6%), not-for-profit organizations (2,910 | 10.3%), and local government employees (2,310 | 8.2%) make up the most common classes of employment.
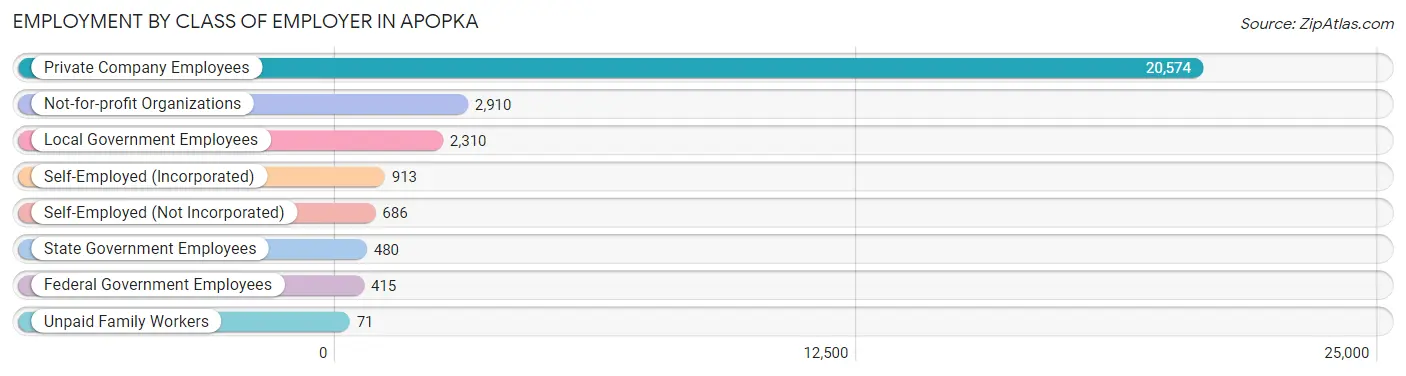
| Employer Class | # Employees | % Employees |
| Private Company Employees | 20,574 | 72.6% |
| Self-Employed (Incorporated) | 913 | 3.2% |
| Self-Employed (Not Incorporated) | 686 | 2.4% |
| Not-for-profit Organizations | 2,910 | 10.3% |
| Local Government Employees | 2,310 | 8.2% |
| State Government Employees | 480 | 1.7% |
| Federal Government Employees | 415 | 1.5% |
| Unpaid Family Workers | 71 | 0.3% |
| Total | 28,359 | 100.0% |
Employment Status by Age in Apopka
According to the labor force statistics for Apopka, out of the total population over 16 years of age (43,526), 68.2% or 29,685 individuals are in the labor force, with 3.4% or 1,009 of them unemployed. The age group with the highest labor force participation rate is 25 to 29 years, with 89.2% or 2,801 individuals in the labor force. Within the labor force, the 20 to 24 years age range has the highest percentage of unemployed individuals, with 7.1% or 198 of them being unemployed.
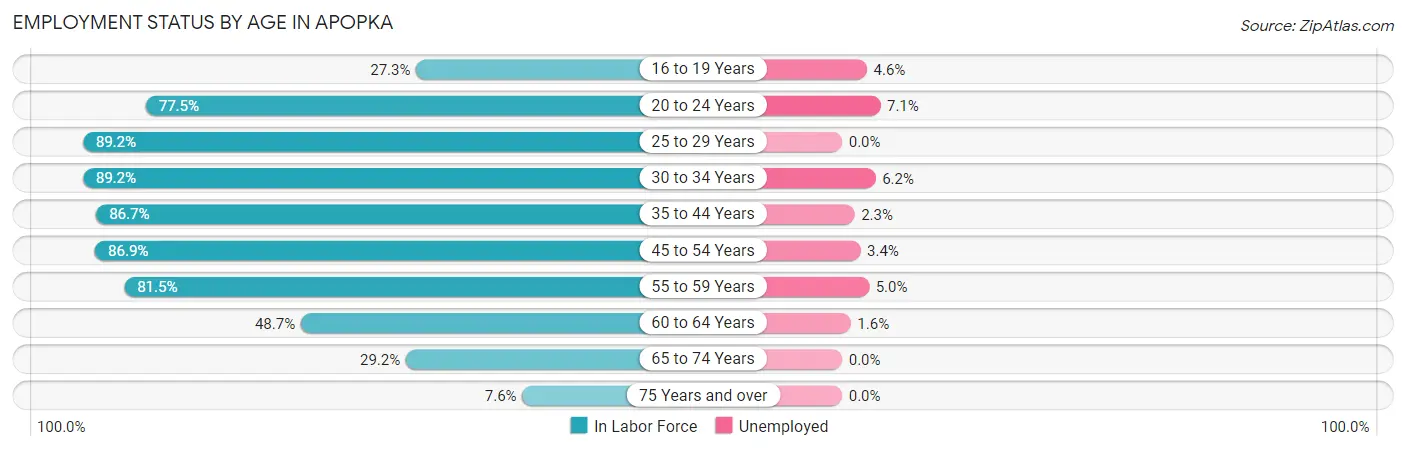
| Age Bracket | In Labor Force | Unemployed |
| 16 to 19 Years | 718 (27.3%) | 33 (4.6%) |
| 20 to 24 Years | 2,788 (77.5%) | 198 (7.1%) |
| 25 to 29 Years | 2,801 (89.2%) | 0 (0.0%) |
| 30 to 34 Years | 3,664 (89.2%) | 227 (6.2%) |
| 35 to 44 Years | 6,251 (86.7%) | 144 (2.3%) |
| 45 to 54 Years | 7,701 (86.9%) | 262 (3.4%) |
| 55 to 59 Years | 2,874 (81.5%) | 144 (5.0%) |
| 60 to 64 Years | 1,305 (48.7%) | 21 (1.6%) |
| 65 to 74 Years | 1,362 (29.2%) | 0 (0.0%) |
| 75 Years and over | 236 (7.6%) | 0 (0.0%) |
| Total | 29,685 (68.2%) | 1,009 (3.4%) |
Employment Status by Educational Attainment in Apopka
According to labor force statistics for Apopka, 83.3% of individuals (24,594) out of the total population between 25 and 64 years of age (29,525) are in the labor force, with 3.2% or 787 of them being unemployed. The group with the highest labor force participation rate are those with the educational attainment of bachelor's degree or higher, with 88.8% or 9,457 individuals in the labor force. Within the labor force, individuals with bachelor's degree or higher education have the highest percentage of unemployment, with 3.6% or 340 of them being unemployed.
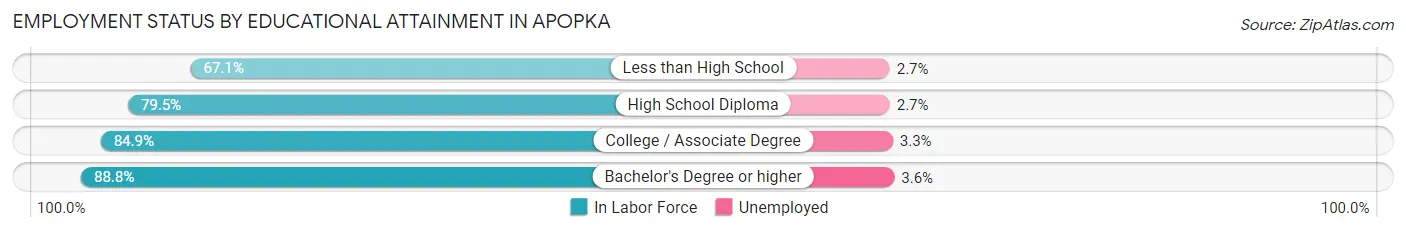
| Educational Attainment | In Labor Force | Unemployed |
| Less than High School | 2,079 (67.1%) | 84 (2.7%) |
| High School Diploma | 4,910 (79.5%) | 167 (2.7%) |
| College / Associate Degree | 8,151 (84.9%) | 317 (3.3%) |
| Bachelor's Degree or higher | 9,457 (88.8%) | 383 (3.6%) |
| Total | 24,594 (83.3%) | 945 (3.2%) |
Employment Occupations by Sex in Apopka
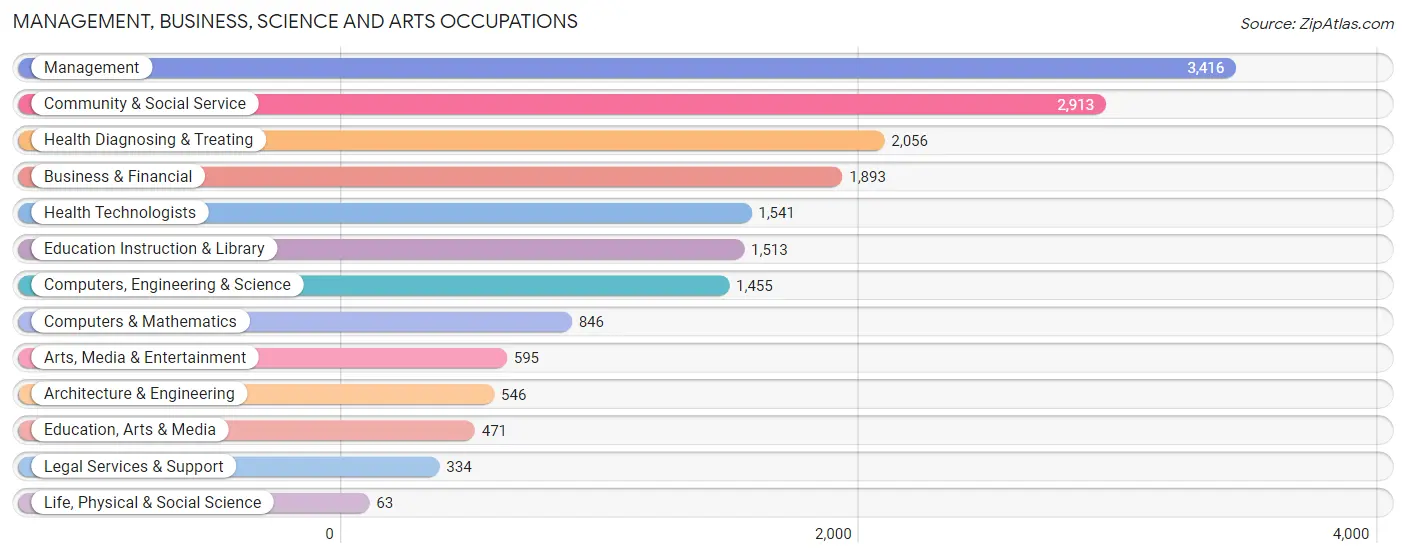
Management, Business, Science and Arts Occupations
The most common Management, Business, Science and Arts occupations in Apopka are Management (3,416 | 11.9%), Community & Social Service (2,913 | 10.2%), Health Diagnosing & Treating (2,056 | 7.2%), Business & Financial (1,893 | 6.6%), and Health Technologists (1,541 | 5.4%).
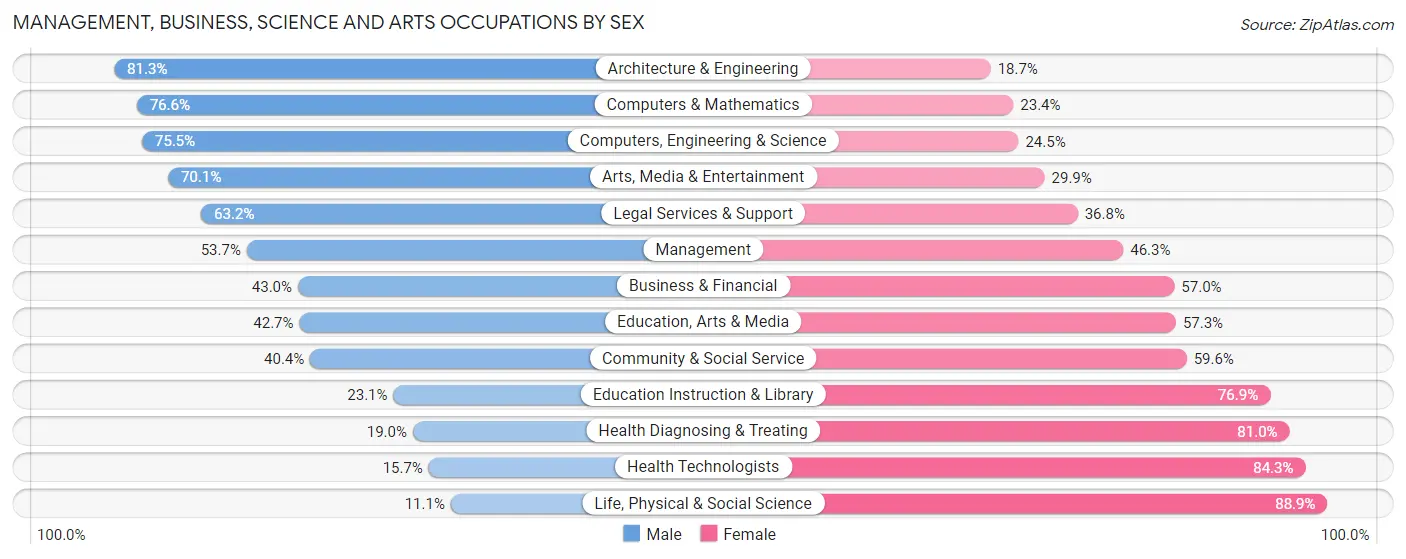
Management, Business, Science and Arts Occupations by Sex
Within the Management, Business, Science and Arts occupations in Apopka, the most male-oriented occupations are Architecture & Engineering (81.3%), Computers & Mathematics (76.6%), and Computers, Engineering & Science (75.5%), while the most female-oriented occupations are Life, Physical & Social Science (88.9%), Health Technologists (84.3%), and Health Diagnosing & Treating (81.0%).
| Occupation | Male | Female |
| Management | 1,833 (53.7%) | 1,583 (46.3%) |
| Business & Financial | 814 (43.0%) | 1,079 (57.0%) |
| Computers, Engineering & Science | 1,099 (75.5%) | 356 (24.5%) |
| Computers & Mathematics | 648 (76.6%) | 198 (23.4%) |
| Architecture & Engineering | 444 (81.3%) | 102 (18.7%) |
| Life, Physical & Social Science | 7 (11.1%) | 56 (88.9%) |
| Community & Social Service | 1,178 (40.4%) | 1,735 (59.6%) |
| Education, Arts & Media | 201 (42.7%) | 270 (57.3%) |
| Legal Services & Support | 211 (63.2%) | 123 (36.8%) |
| Education Instruction & Library | 349 (23.1%) | 1,164 (76.9%) |
| Arts, Media & Entertainment | 417 (70.1%) | 178 (29.9%) |
| Health Diagnosing & Treating | 391 (19.0%) | 1,665 (81.0%) |
| Health Technologists | 242 (15.7%) | 1,299 (84.3%) |
| Total (Category) | 5,315 (45.3%) | 6,418 (54.7%) |
| Total (Overall) | 14,850 (51.8%) | 13,830 (48.2%) |
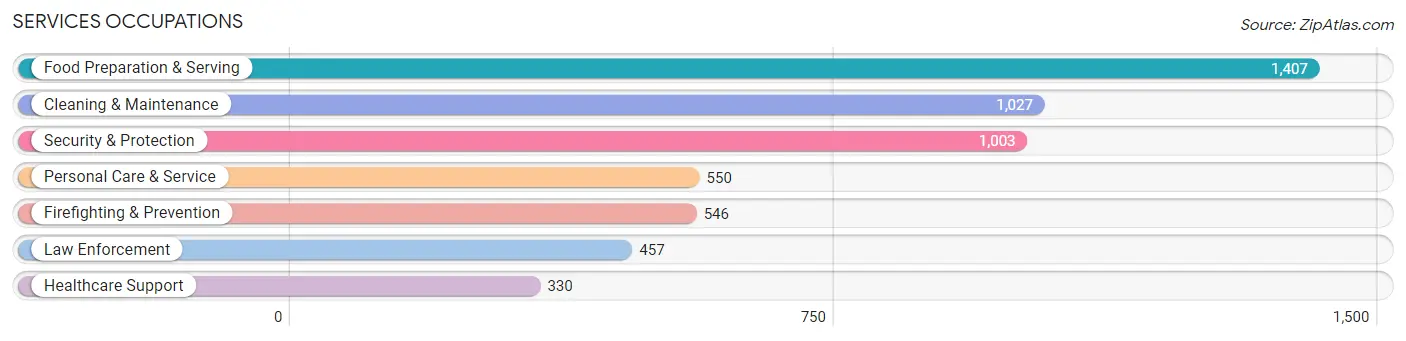
Services Occupations
The most common Services occupations in Apopka are Food Preparation & Serving (1,407 | 4.9%), Cleaning & Maintenance (1,027 | 3.6%), Security & Protection (1,003 | 3.5%), Personal Care & Service (550 | 1.9%), and Firefighting & Prevention (546 | 1.9%).
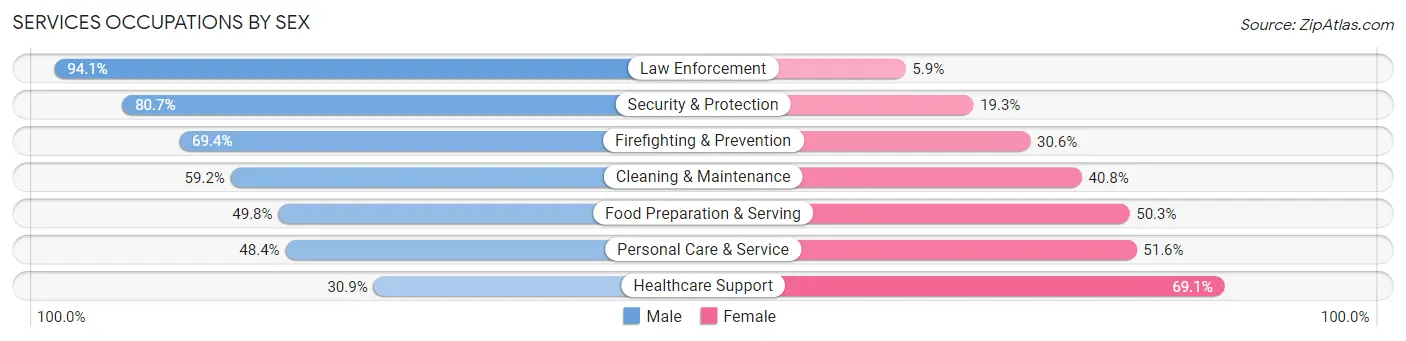
Services Occupations by Sex
Within the Services occupations in Apopka, the most male-oriented occupations are Law Enforcement (94.1%), Security & Protection (80.7%), and Firefighting & Prevention (69.4%), while the most female-oriented occupations are Healthcare Support (69.1%), Personal Care & Service (51.6%), and Food Preparation & Serving (50.2%).
| Occupation | Male | Female |
| Healthcare Support | 102 (30.9%) | 228 (69.1%) |
| Security & Protection | 809 (80.7%) | 194 (19.3%) |
| Firefighting & Prevention | 379 (69.4%) | 167 (30.6%) |
| Law Enforcement | 430 (94.1%) | 27 (5.9%) |
| Food Preparation & Serving | 700 (49.7%) | 707 (50.2%) |
| Cleaning & Maintenance | 608 (59.2%) | 419 (40.8%) |
| Personal Care & Service | 266 (48.4%) | 284 (51.6%) |
| Total (Category) | 2,485 (57.6%) | 1,832 (42.4%) |
| Total (Overall) | 14,850 (51.8%) | 13,830 (48.2%) |
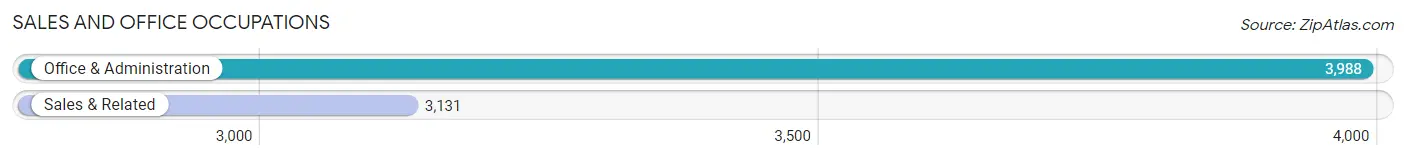
Sales and Office Occupations
The most common Sales and Office occupations in Apopka are Office & Administration (3,988 | 13.9%), and Sales & Related (3,131 | 10.9%).
Sales and Office Occupations by Sex
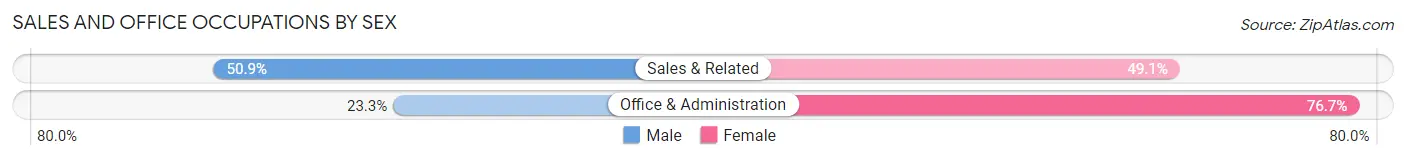
| Occupation | Male | Female |
| Sales & Related | 1,594 (50.9%) | 1,537 (49.1%) |
| Office & Administration | 930 (23.3%) | 3,058 (76.7%) |
| Total (Category) | 2,524 (35.4%) | 4,595 (64.5%) |
| Total (Overall) | 14,850 (51.8%) | 13,830 (48.2%) |
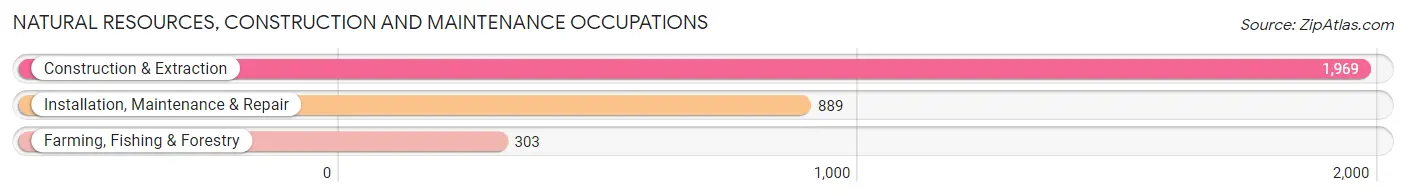
Natural Resources, Construction and Maintenance Occupations
The most common Natural Resources, Construction and Maintenance occupations in Apopka are Construction & Extraction (1,969 | 6.9%), Installation, Maintenance & Repair (889 | 3.1%), and Farming, Fishing & Forestry (303 | 1.1%).
Natural Resources, Construction and Maintenance Occupations by Sex
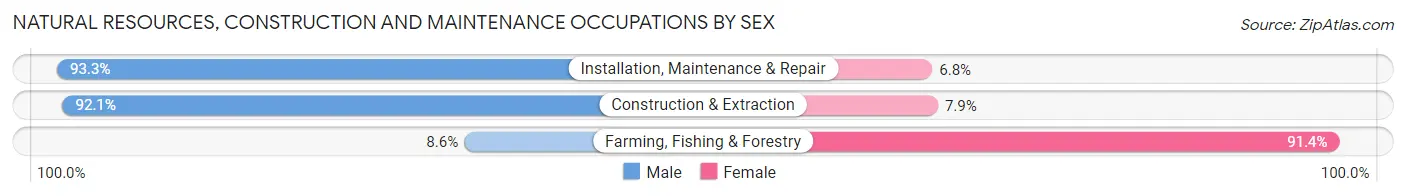
| Occupation | Male | Female |
| Farming, Fishing & Forestry | 26 (8.6%) | 277 (91.4%) |
| Construction & Extraction | 1,813 (92.1%) | 156 (7.9%) |
| Installation, Maintenance & Repair | 829 (93.2%) | 60 (6.8%) |
| Total (Category) | 2,668 (84.4%) | 493 (15.6%) |
| Total (Overall) | 14,850 (51.8%) | 13,830 (48.2%) |
Production, Transportation and Moving Occupations
The most common Production, Transportation and Moving occupations in Apopka are Transportation (876 | 3.0%), Production (875 | 3.0%), and Material Moving (599 | 2.1%).
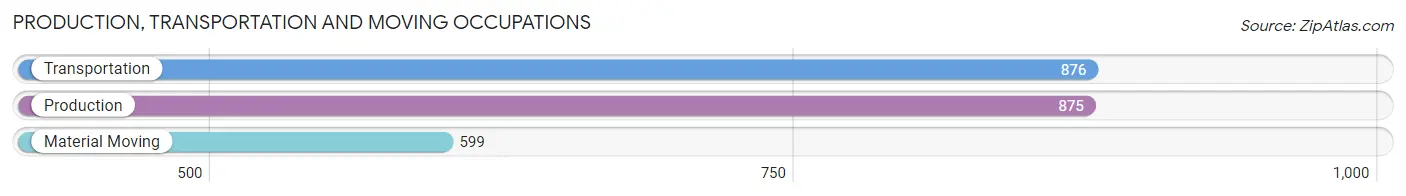
Production, Transportation and Moving Occupations by Sex
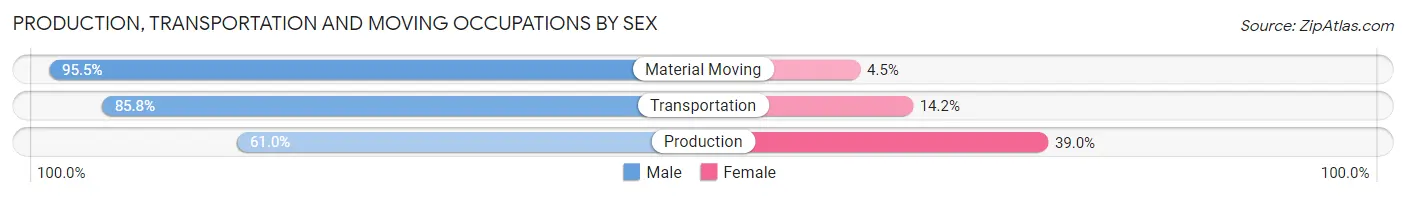
| Occupation | Male | Female |
| Production | 534 (61.0%) | 341 (39.0%) |
| Transportation | 752 (85.8%) | 124 (14.2%) |
| Material Moving | 572 (95.5%) | 27 (4.5%) |
| Total (Category) | 1,858 (79.1%) | 492 (20.9%) |
| Total (Overall) | 14,850 (51.8%) | 13,830 (48.2%) |
Employment Industries by Sex in Apopka
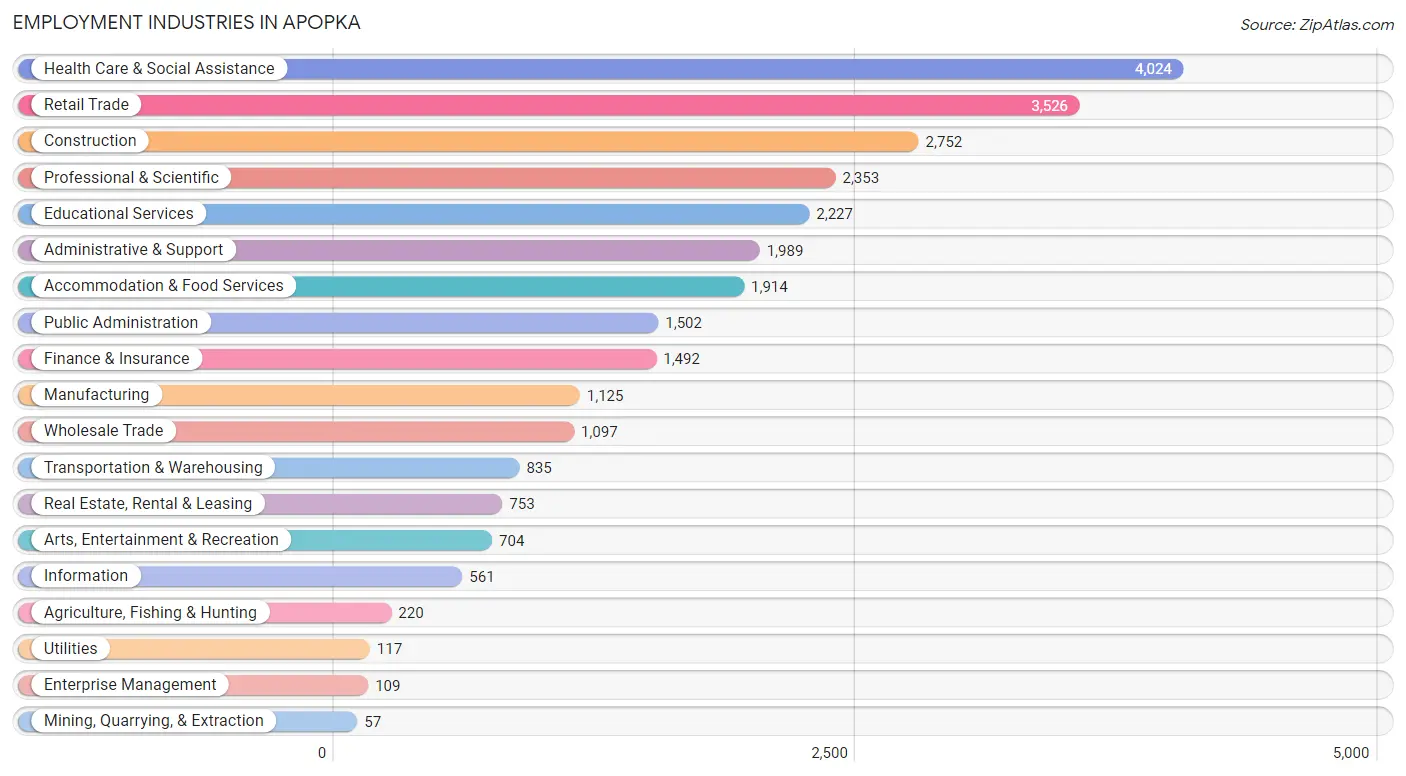
Employment Industries in Apopka
The major employment industries in Apopka include Health Care & Social Assistance (4,024 | 14.0%), Retail Trade (3,526 | 12.3%), Construction (2,752 | 9.6%), Professional & Scientific (2,353 | 8.2%), and Educational Services (2,227 | 7.8%).
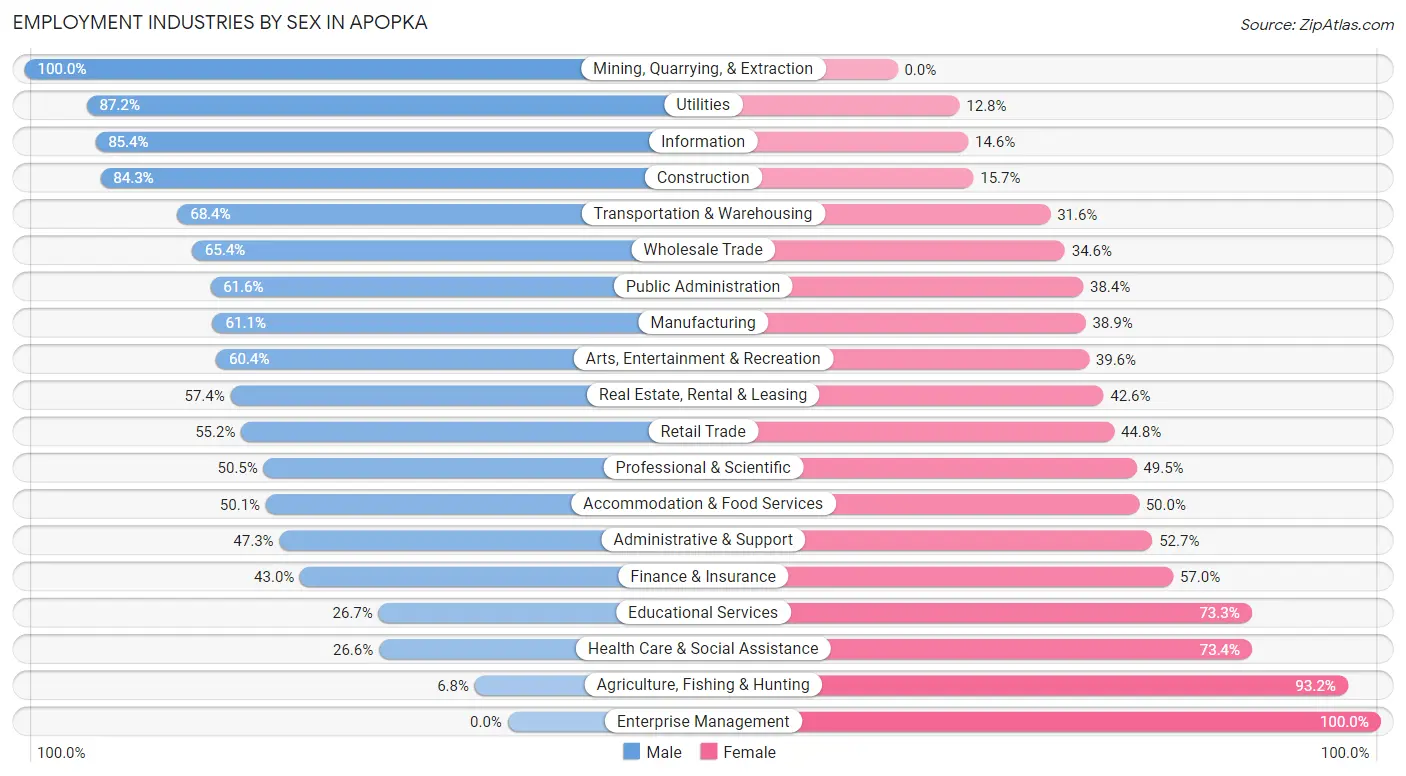
Employment Industries by Sex in Apopka
The Apopka industries that see more men than women are Mining, Quarrying, & Extraction (100.0%), Utilities (87.2%), and Information (85.4%), whereas the industries that tend to have a higher number of women are Enterprise Management (100.0%), Agriculture, Fishing & Hunting (93.2%), and Health Care & Social Assistance (73.4%).
| Industry | Male | Female |
| Agriculture, Fishing & Hunting | 15 (6.8%) | 205 (93.2%) |
| Mining, Quarrying, & Extraction | 57 (100.0%) | 0 (0.0%) |
| Construction | 2,320 (84.3%) | 432 (15.7%) |
| Manufacturing | 687 (61.1%) | 438 (38.9%) |
| Wholesale Trade | 717 (65.4%) | 380 (34.6%) |
| Retail Trade | 1,945 (55.2%) | 1,581 (44.8%) |
| Transportation & Warehousing | 571 (68.4%) | 264 (31.6%) |
| Utilities | 102 (87.2%) | 15 (12.8%) |
| Information | 479 (85.4%) | 82 (14.6%) |
| Finance & Insurance | 641 (43.0%) | 851 (57.0%) |
| Real Estate, Rental & Leasing | 432 (57.4%) | 321 (42.6%) |
| Professional & Scientific | 1,189 (50.5%) | 1,164 (49.5%) |
| Enterprise Management | 0 (0.0%) | 109 (100.0%) |
| Administrative & Support | 940 (47.3%) | 1,049 (52.7%) |
| Educational Services | 595 (26.7%) | 1,632 (73.3%) |
| Health Care & Social Assistance | 1,072 (26.6%) | 2,952 (73.4%) |
| Arts, Entertainment & Recreation | 425 (60.4%) | 279 (39.6%) |
| Accommodation & Food Services | 958 (50.0%) | 956 (49.9%) |
| Public Administration | 925 (61.6%) | 577 (38.4%) |
| Total | 14,850 (51.8%) | 13,830 (48.2%) |
Education in Apopka
School Enrollment in Apopka
The most common levels of schooling among the 13,709 students in Apopka are high school (3,687 | 26.9%), middle school (3,478 | 25.4%), and college / undergraduate (2,325 | 17.0%).
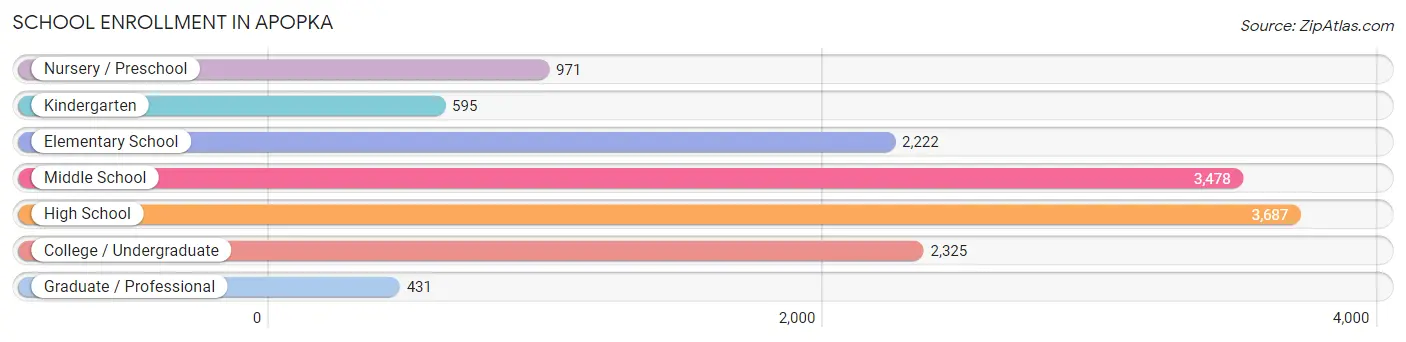
| School Level | # Students | % Students |
| Nursery / Preschool | 971 | 7.1% |
| Kindergarten | 595 | 4.3% |
| Elementary School | 2,222 | 16.2% |
| Middle School | 3,478 | 25.4% |
| High School | 3,687 | 26.9% |
| College / Undergraduate | 2,325 | 17.0% |
| Graduate / Professional | 431 | 3.1% |
| Total | 13,709 | 100.0% |
School Enrollment by Age by Funding Source in Apopka
Out of a total of 13,709 students who are enrolled in schools in Apopka, 3,578 (26.1%) attend a private institution, while the remaining 10,131 (73.9%) are enrolled in public schools. The age group of 3 to 4 year olds has the highest likelihood of being enrolled in private schools, with 400 (69.1% in the age bracket) enrolled. Conversely, the age group of 18 to 19 year olds has the lowest likelihood of being enrolled in a private school, with 503 (91.3% in the age bracket) attending a public institution.
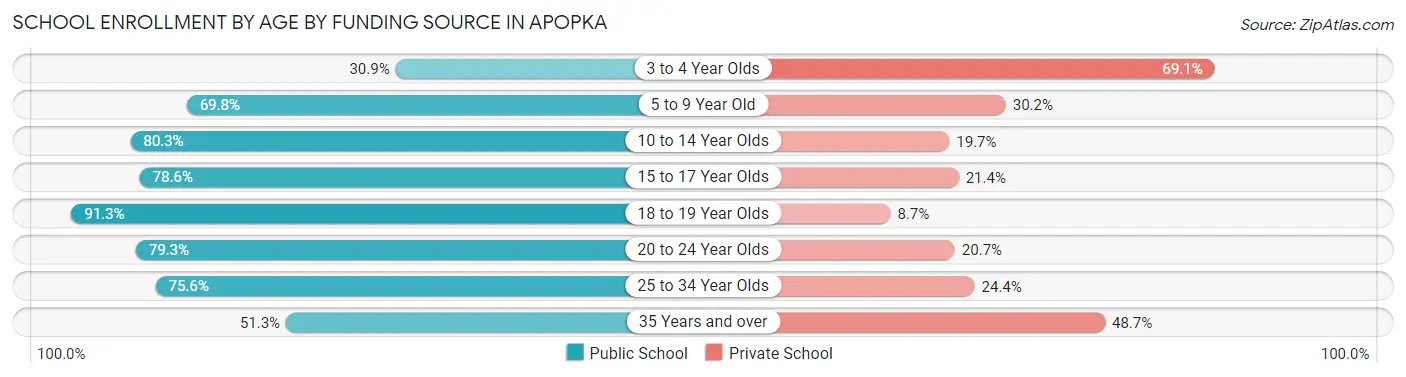
| Age Bracket | Public School | Private School |
| 3 to 4 Year Olds | 179 (30.9%) | 400 (69.1%) |
| 5 to 9 Year Old | 2,200 (69.8%) | 952 (30.2%) |
| 10 to 14 Year Olds | 3,141 (80.3%) | 770 (19.7%) |
| 15 to 17 Year Olds | 2,148 (78.6%) | 586 (21.4%) |
| 18 to 19 Year Olds | 503 (91.3%) | 48 (8.7%) |
| 20 to 24 Year Olds | 987 (79.3%) | 258 (20.7%) |
| 25 to 34 Year Olds | 589 (75.6%) | 190 (24.4%) |
| 35 Years and over | 389 (51.3%) | 369 (48.7%) |
| Total | 10,131 (73.9%) | 3,578 (26.1%) |
Educational Attainment by Field of Study in Apopka
Business (3,504 | 24.9%), science & technology (2,043 | 14.5%), education (1,412 | 10.0%), arts & humanities (1,223 | 8.7%), and engineering (839 | 5.9%) are the most common fields of study among 14,090 individuals in Apopka who have obtained a bachelor's degree or higher.
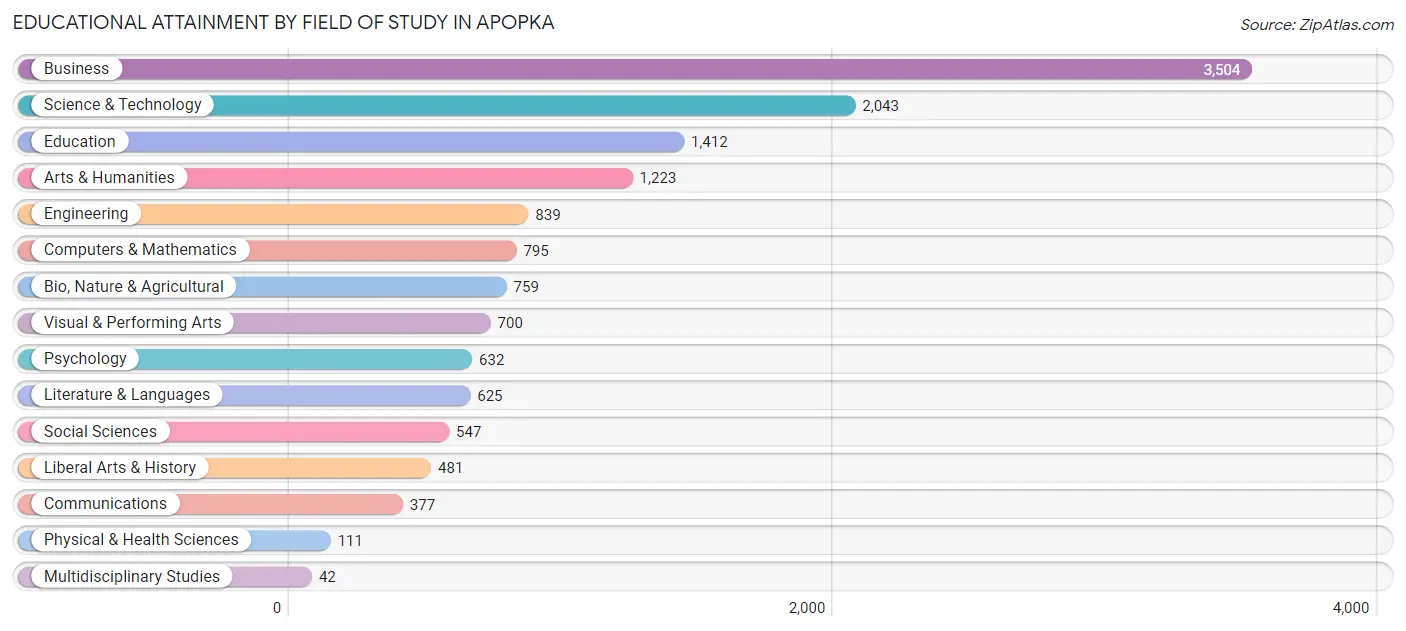
| Field of Study | # Graduates | % Graduates |
| Computers & Mathematics | 795 | 5.6% |
| Bio, Nature & Agricultural | 759 | 5.4% |
| Physical & Health Sciences | 111 | 0.8% |
| Psychology | 632 | 4.5% |
| Social Sciences | 547 | 3.9% |
| Engineering | 839 | 5.9% |
| Multidisciplinary Studies | 42 | 0.3% |
| Science & Technology | 2,043 | 14.5% |
| Business | 3,504 | 24.9% |
| Education | 1,412 | 10.0% |
| Literature & Languages | 625 | 4.4% |
| Liberal Arts & History | 481 | 3.4% |
| Visual & Performing Arts | 700 | 5.0% |
| Communications | 377 | 2.7% |
| Arts & Humanities | 1,223 | 8.7% |
| Total | 14,090 | 100.0% |
Transportation & Commute in Apopka
Vehicle Availability by Sex in Apopka
The most prevalent vehicle ownership categories in Apopka are males with 2 vehicles (6,835, accounting for 46.5%) and females with 2 vehicles (6,280, making up 50.1%).
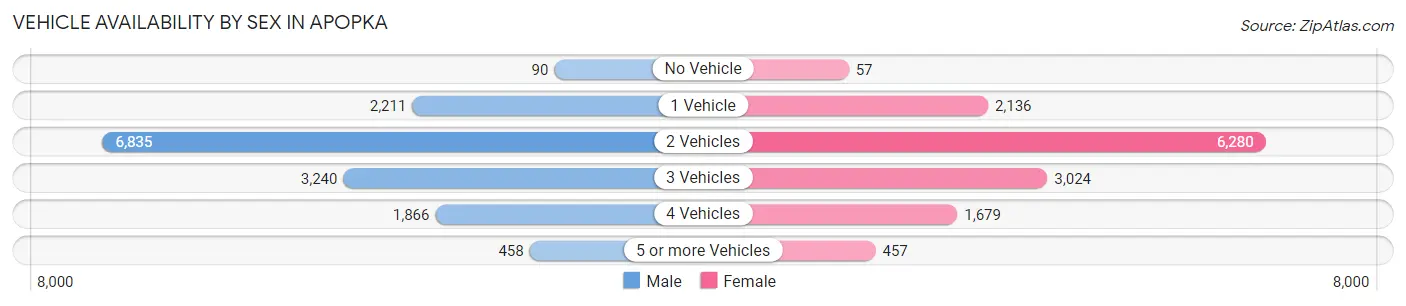
| Vehicles Available | Male | Female |
| No Vehicle | 90 (0.6%) | 57 (0.4%) |
| 1 Vehicle | 2,211 (15.0%) | 2,136 (15.7%) |
| 2 Vehicles | 6,835 (46.5%) | 6,280 (46.1%) |
| 3 Vehicles | 3,240 (22.0%) | 3,024 (22.2%) |
| 4 Vehicles | 1,866 (12.7%) | 1,679 (12.3%) |
| 5 or more Vehicles | 458 (3.1%) | 457 (3.4%) |
| Total | 14,700 (100.0%) | 13,633 (100.0%) |
Commute Time in Apopka
The most frequently occuring commute durations in Apopka are 30 to 34 minutes (4,823 commuters, 19.7%), 45 to 59 minutes (3,120 commuters, 12.7%), and 20 to 24 minutes (3,094 commuters, 12.6%).
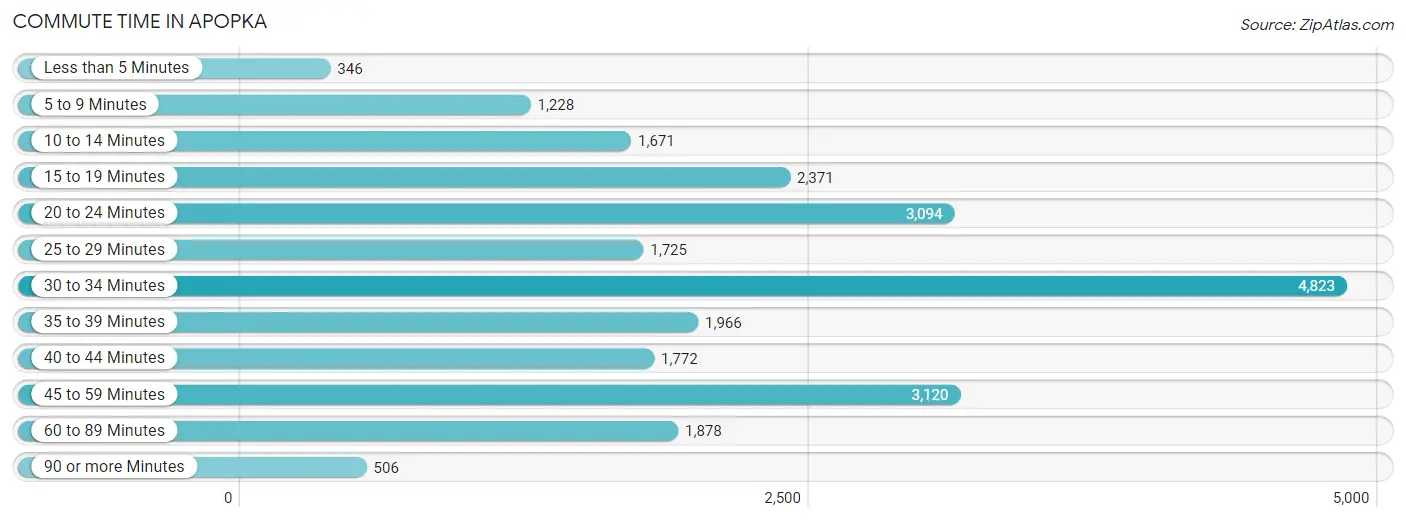
| Commute Time | # Commuters | % Commuters |
| Less than 5 Minutes | 346 | 1.4% |
| 5 to 9 Minutes | 1,228 | 5.0% |
| 10 to 14 Minutes | 1,671 | 6.8% |
| 15 to 19 Minutes | 2,371 | 9.7% |
| 20 to 24 Minutes | 3,094 | 12.6% |
| 25 to 29 Minutes | 1,725 | 7.0% |
| 30 to 34 Minutes | 4,823 | 19.7% |
| 35 to 39 Minutes | 1,966 | 8.0% |
| 40 to 44 Minutes | 1,772 | 7.2% |
| 45 to 59 Minutes | 3,120 | 12.7% |
| 60 to 89 Minutes | 1,878 | 7.7% |
| 90 or more Minutes | 506 | 2.1% |
Commute Time by Sex in Apopka
The most common commute times in Apopka are 30 to 34 minutes (2,614 commuters, 20.3%) for males and 30 to 34 minutes (2,209 commuters, 19.1%) for females.
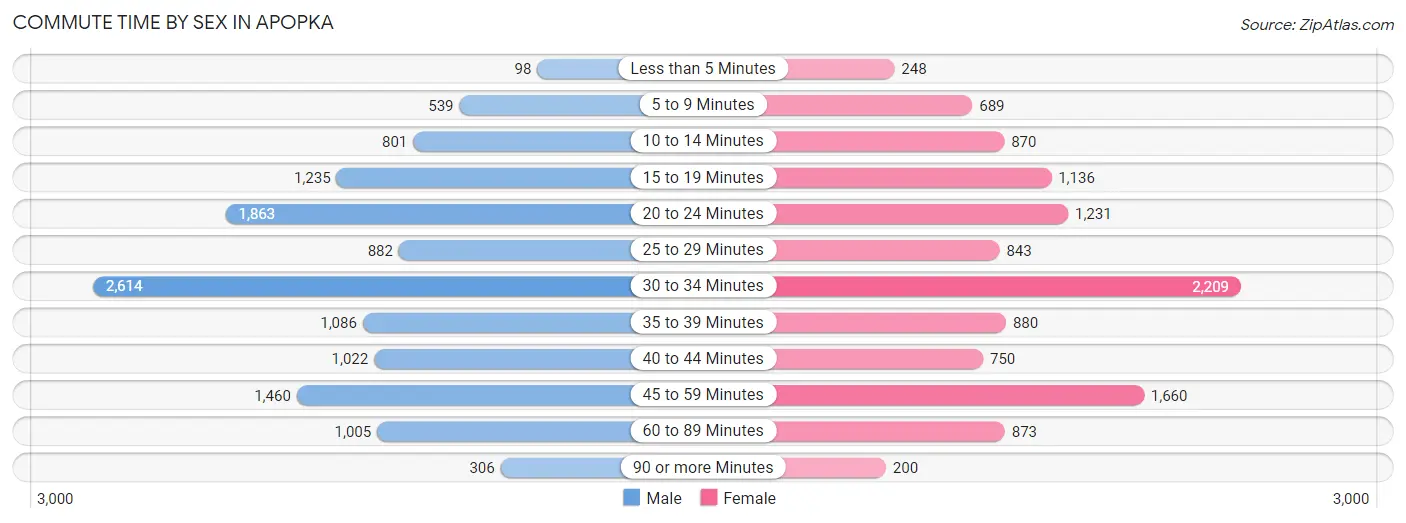
| Commute Time | Male | Female |
| Less than 5 Minutes | 98 (0.8%) | 248 (2.1%) |
| 5 to 9 Minutes | 539 (4.2%) | 689 (5.9%) |
| 10 to 14 Minutes | 801 (6.2%) | 870 (7.5%) |
| 15 to 19 Minutes | 1,235 (9.6%) | 1,136 (9.8%) |
| 20 to 24 Minutes | 1,863 (14.4%) | 1,231 (10.6%) |
| 25 to 29 Minutes | 882 (6.8%) | 843 (7.3%) |
| 30 to 34 Minutes | 2,614 (20.3%) | 2,209 (19.1%) |
| 35 to 39 Minutes | 1,086 (8.4%) | 880 (7.6%) |
| 40 to 44 Minutes | 1,022 (7.9%) | 750 (6.5%) |
| 45 to 59 Minutes | 1,460 (11.3%) | 1,660 (14.3%) |
| 60 to 89 Minutes | 1,005 (7.8%) | 873 (7.5%) |
| 90 or more Minutes | 306 (2.4%) | 200 (1.7%) |
Time of Departure to Work by Sex in Apopka
The most frequent times of departure to work in Apopka are 7:00 AM to 7:29 AM (2,502, 19.4%) for males and 7:00 AM to 7:29 AM (2,566, 22.1%) for females.
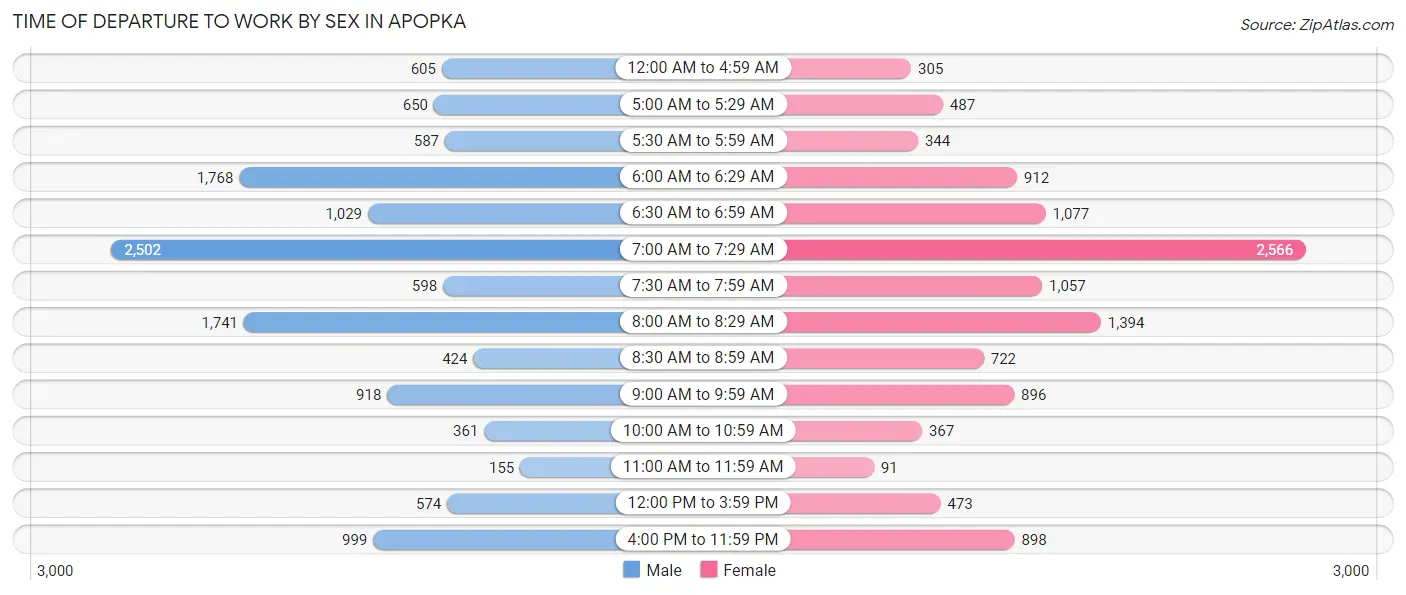
| Time of Departure | Male | Female |
| 12:00 AM to 4:59 AM | 605 (4.7%) | 305 (2.6%) |
| 5:00 AM to 5:29 AM | 650 (5.0%) | 487 (4.2%) |
| 5:30 AM to 5:59 AM | 587 (4.5%) | 344 (3.0%) |
| 6:00 AM to 6:29 AM | 1,768 (13.7%) | 912 (7.9%) |
| 6:30 AM to 6:59 AM | 1,029 (8.0%) | 1,077 (9.3%) |
| 7:00 AM to 7:29 AM | 2,502 (19.4%) | 2,566 (22.1%) |
| 7:30 AM to 7:59 AM | 598 (4.6%) | 1,057 (9.1%) |
| 8:00 AM to 8:29 AM | 1,741 (13.5%) | 1,394 (12.0%) |
| 8:30 AM to 8:59 AM | 424 (3.3%) | 722 (6.2%) |
| 9:00 AM to 9:59 AM | 918 (7.1%) | 896 (7.7%) |
| 10:00 AM to 10:59 AM | 361 (2.8%) | 367 (3.2%) |
| 11:00 AM to 11:59 AM | 155 (1.2%) | 91 (0.8%) |
| 12:00 PM to 3:59 PM | 574 (4.4%) | 473 (4.1%) |
| 4:00 PM to 11:59 PM | 999 (7.7%) | 898 (7.7%) |
| Total | 12,911 (100.0%) | 11,589 (100.0%) |
Housing Occupancy in Apopka
Occupancy by Ownership in Apopka
Of the total 18,157 dwellings in Apopka, owner-occupied units account for 14,142 (77.9%), while renter-occupied units make up 4,015 (22.1%).
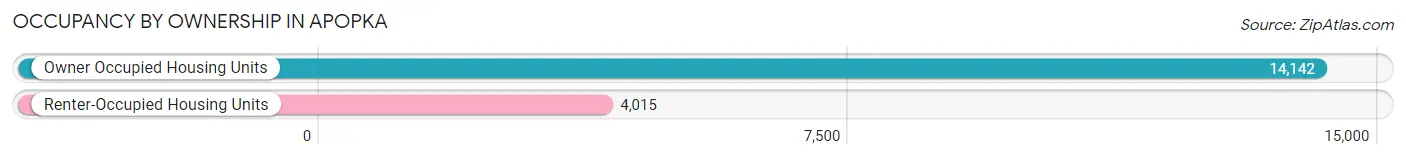
| Occupancy | # Housing Units | % Housing Units |
| Owner Occupied Housing Units | 14,142 | 77.9% |
| Renter-Occupied Housing Units | 4,015 | 22.1% |
| Total Occupied Housing Units | 18,157 | 100.0% |
Occupancy by Household Size in Apopka
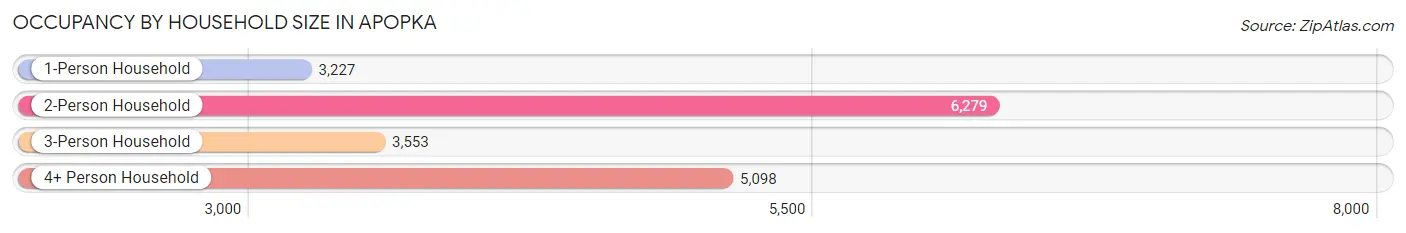
| Household Size | # Housing Units | % Housing Units |
| 1-Person Household | 3,227 | 17.8% |
| 2-Person Household | 6,279 | 34.6% |
| 3-Person Household | 3,553 | 19.6% |
| 4+ Person Household | 5,098 | 28.1% |
| Total Housing Units | 18,157 | 100.0% |
Occupancy by Ownership by Household Size in Apopka
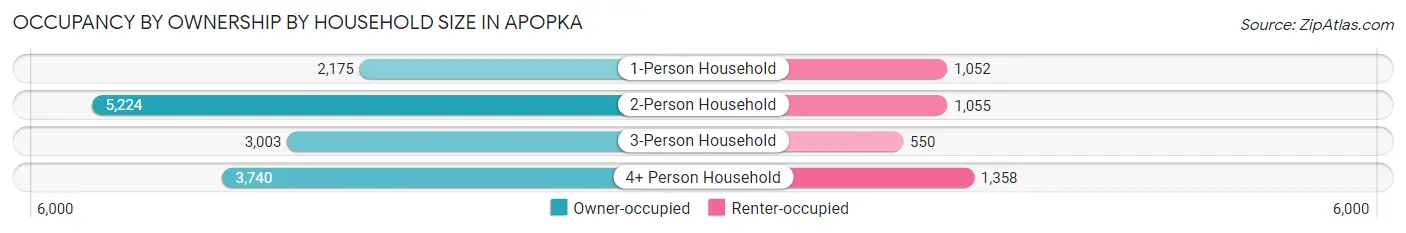
| Household Size | Owner-occupied | Renter-occupied |
| 1-Person Household | 2,175 (67.4%) | 1,052 (32.6%) |
| 2-Person Household | 5,224 (83.2%) | 1,055 (16.8%) |
| 3-Person Household | 3,003 (84.5%) | 550 (15.5%) |
| 4+ Person Household | 3,740 (73.4%) | 1,358 (26.6%) |
| Total Housing Units | 14,142 (77.9%) | 4,015 (22.1%) |
Occupancy by Educational Attainment in Apopka
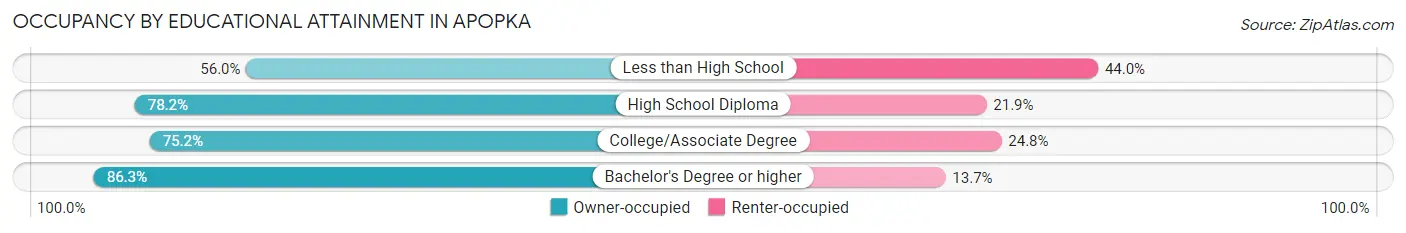
| Household Size | Owner-occupied | Renter-occupied |
| Less than High School | 1,212 (56.0%) | 951 (44.0%) |
| High School Diploma | 2,675 (78.1%) | 748 (21.8%) |
| College/Associate Degree | 4,001 (75.2%) | 1,321 (24.8%) |
| Bachelor's Degree or higher | 6,254 (86.3%) | 995 (13.7%) |
Occupancy by Age of Householder in Apopka
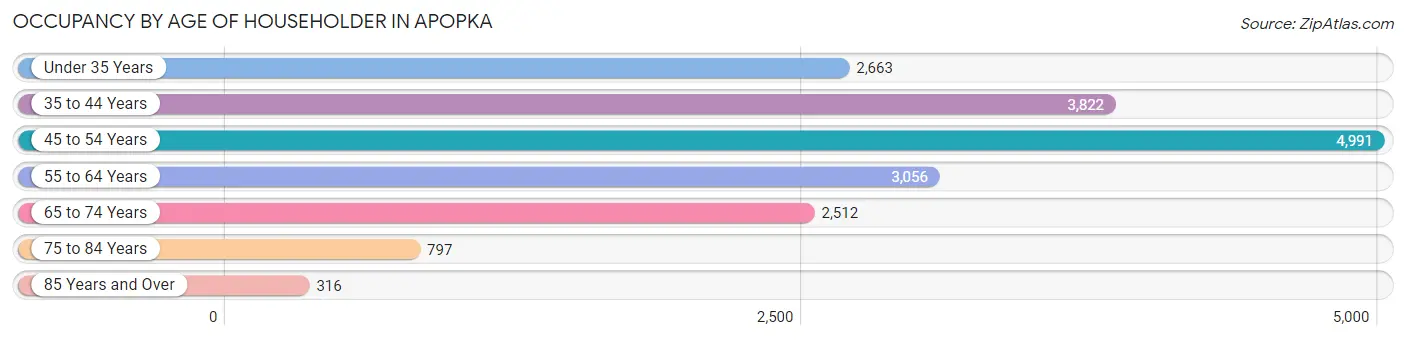
| Age Bracket | # Households | % Households |
| Under 35 Years | 2,663 | 14.7% |
| 35 to 44 Years | 3,822 | 21.0% |
| 45 to 54 Years | 4,991 | 27.5% |
| 55 to 64 Years | 3,056 | 16.8% |
| 65 to 74 Years | 2,512 | 13.8% |
| 75 to 84 Years | 797 | 4.4% |
| 85 Years and Over | 316 | 1.7% |
| Total | 18,157 | 100.0% |
Housing Finances in Apopka
Median Income by Occupancy in Apopka
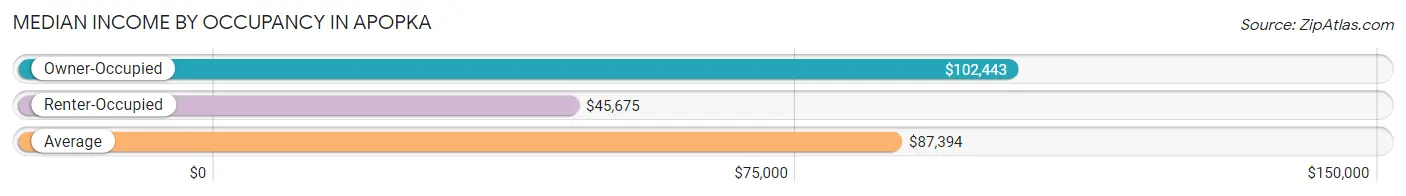
| Occupancy Type | # Households | Median Income |
| Owner-Occupied | 14,142 (77.9%) | $102,443 |
| Renter-Occupied | 4,015 (22.1%) | $45,675 |
| Average | 18,157 (100.0%) | $87,394 |
Occupancy by Householder Income Bracket in Apopka
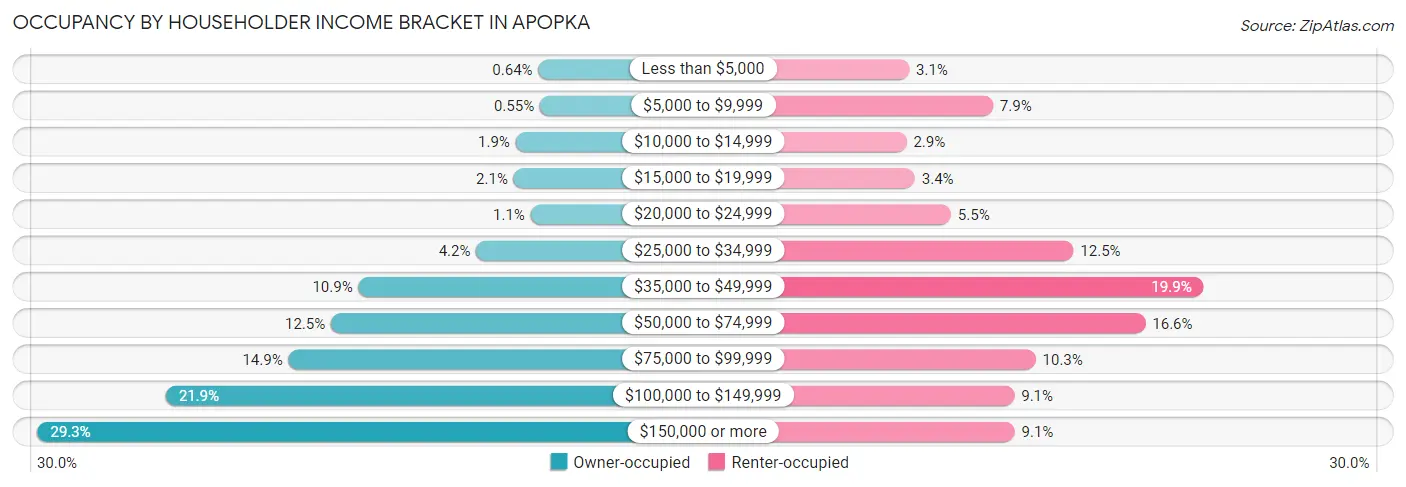
| Income Bracket | Owner-occupied | Renter-occupied |
| Less than $5,000 | 91 (0.6%) | 123 (3.1%) |
| $5,000 to $9,999 | 78 (0.5%) | 315 (7.9%) |
| $10,000 to $14,999 | 275 (1.9%) | 117 (2.9%) |
| $15,000 to $19,999 | 290 (2.1%) | 136 (3.4%) |
| $20,000 to $24,999 | 153 (1.1%) | 219 (5.4%) |
| $25,000 to $34,999 | 593 (4.2%) | 500 (12.4%) |
| $35,000 to $49,999 | 1,544 (10.9%) | 798 (19.9%) |
| $50,000 to $74,999 | 1,767 (12.5%) | 665 (16.6%) |
| $75,000 to $99,999 | 2,110 (14.9%) | 413 (10.3%) |
| $100,000 to $149,999 | 3,101 (21.9%) | 364 (9.1%) |
| $150,000 or more | 4,140 (29.3%) | 365 (9.1%) |
| Total | 14,142 (100.0%) | 4,015 (100.0%) |
Monthly Housing Cost Tiers in Apopka
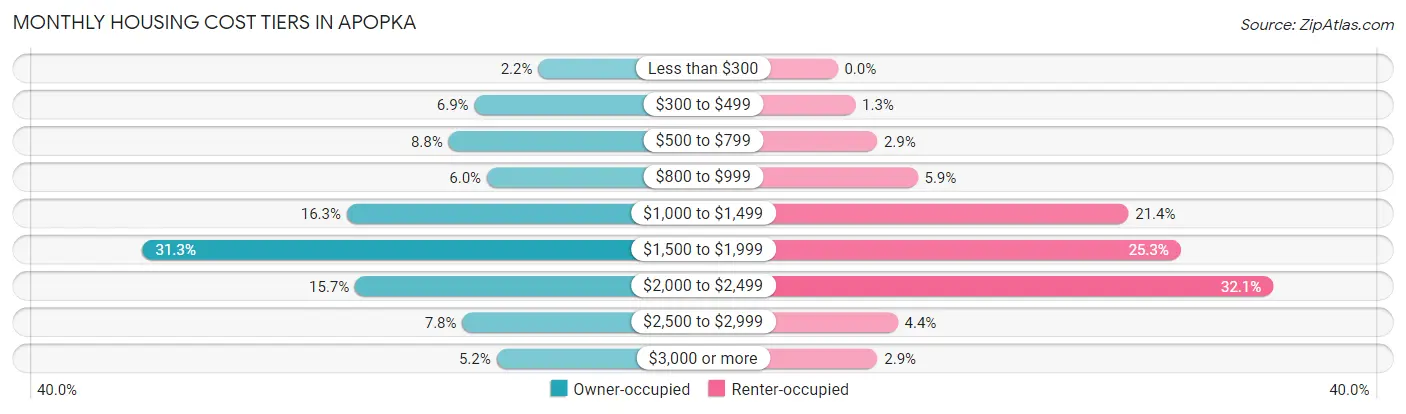
| Monthly Cost | Owner-occupied | Renter-occupied |
| Less than $300 | 307 (2.2%) | 0 (0.0%) |
| $300 to $499 | 971 (6.9%) | 52 (1.3%) |
| $500 to $799 | 1,241 (8.8%) | 117 (2.9%) |
| $800 to $999 | 842 (5.9%) | 237 (5.9%) |
| $1,000 to $1,499 | 2,301 (16.3%) | 860 (21.4%) |
| $1,500 to $1,999 | 4,428 (31.3%) | 1,015 (25.3%) |
| $2,000 to $2,499 | 2,214 (15.7%) | 1,288 (32.1%) |
| $2,500 to $2,999 | 1,097 (7.8%) | 178 (4.4%) |
| $3,000 or more | 741 (5.2%) | 118 (2.9%) |
| Total | 14,142 (100.0%) | 4,015 (100.0%) |
Physical Housing Characteristics in Apopka
Housing Structures in Apopka
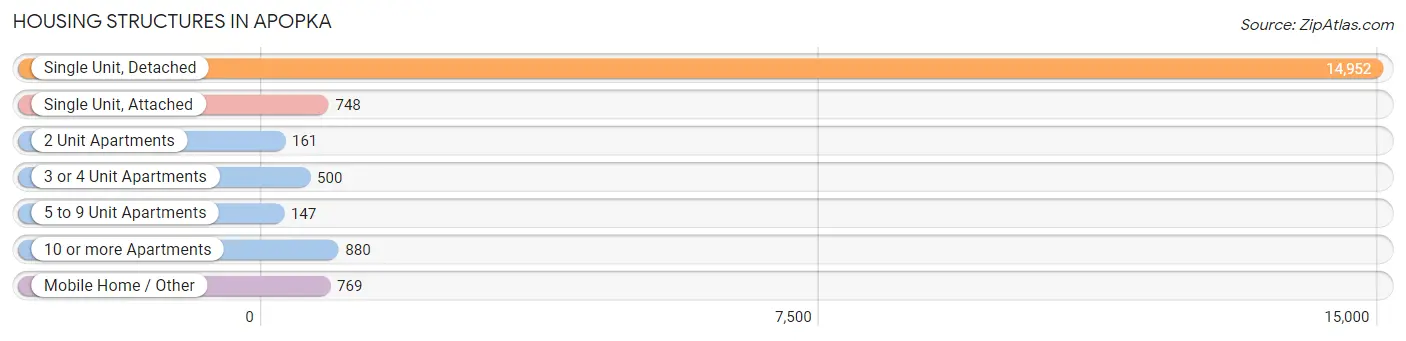
| Structure Type | # Housing Units | % Housing Units |
| Single Unit, Detached | 14,952 | 82.4% |
| Single Unit, Attached | 748 | 4.1% |
| 2 Unit Apartments | 161 | 0.9% |
| 3 or 4 Unit Apartments | 500 | 2.8% |
| 5 to 9 Unit Apartments | 147 | 0.8% |
| 10 or more Apartments | 880 | 4.9% |
| Mobile Home / Other | 769 | 4.2% |
| Total | 18,157 | 100.0% |
Housing Structures by Occupancy in Apopka
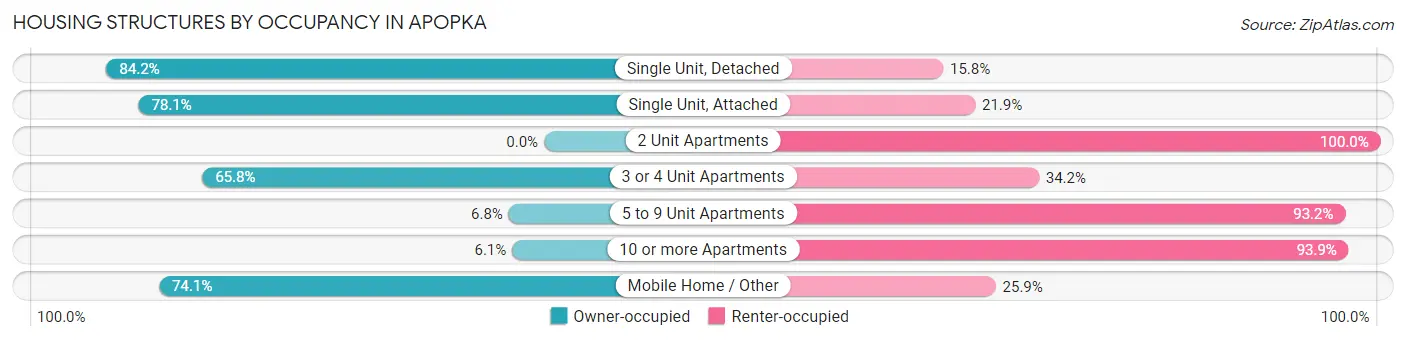
| Structure Type | Owner-occupied | Renter-occupied |
| Single Unit, Detached | 12,595 (84.2%) | 2,357 (15.8%) |
| Single Unit, Attached | 584 (78.1%) | 164 (21.9%) |
| 2 Unit Apartments | 0 (0.0%) | 161 (100.0%) |
| 3 or 4 Unit Apartments | 329 (65.8%) | 171 (34.2%) |
| 5 to 9 Unit Apartments | 10 (6.8%) | 137 (93.2%) |
| 10 or more Apartments | 54 (6.1%) | 826 (93.9%) |
| Mobile Home / Other | 570 (74.1%) | 199 (25.9%) |
| Total | 14,142 (77.9%) | 4,015 (22.1%) |
Housing Structures by Number of Rooms in Apopka
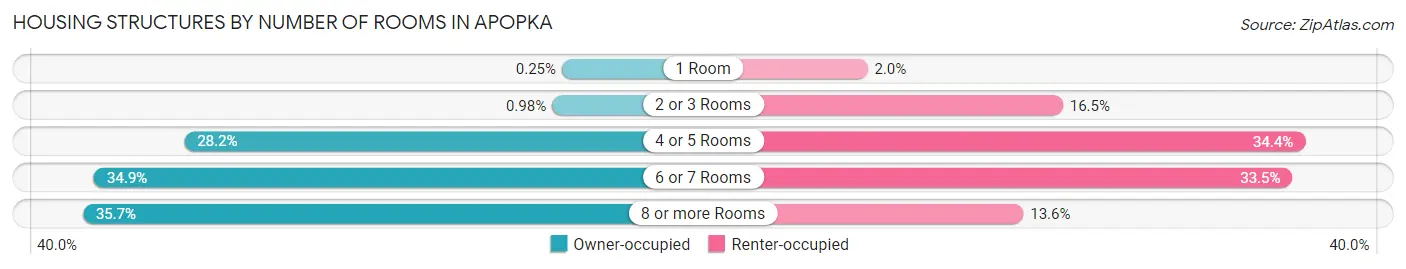
| Number of Rooms | Owner-occupied | Renter-occupied |
| 1 Room | 36 (0.3%) | 82 (2.0%) |
| 2 or 3 Rooms | 138 (1.0%) | 662 (16.5%) |
| 4 or 5 Rooms | 3,987 (28.2%) | 1,382 (34.4%) |
| 6 or 7 Rooms | 4,932 (34.9%) | 1,344 (33.5%) |
| 8 or more Rooms | 5,049 (35.7%) | 545 (13.6%) |
| Total | 14,142 (100.0%) | 4,015 (100.0%) |
Housing Structure by Heating Type in Apopka
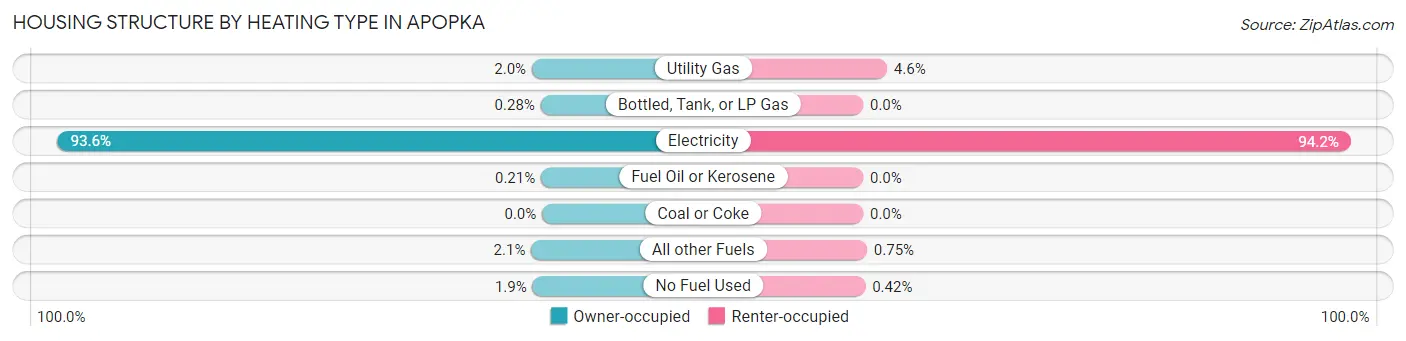
| Heating Type | Owner-occupied | Renter-occupied |
| Utility Gas | 278 (2.0%) | 185 (4.6%) |
| Bottled, Tank, or LP Gas | 39 (0.3%) | 0 (0.0%) |
| Electricity | 13,238 (93.6%) | 3,783 (94.2%) |
| Fuel Oil or Kerosene | 29 (0.2%) | 0 (0.0%) |
| Coal or Coke | 0 (0.0%) | 0 (0.0%) |
| All other Fuels | 297 (2.1%) | 30 (0.7%) |
| No Fuel Used | 261 (1.8%) | 17 (0.4%) |
| Total | 14,142 (100.0%) | 4,015 (100.0%) |
Household Vehicle Usage in Apopka
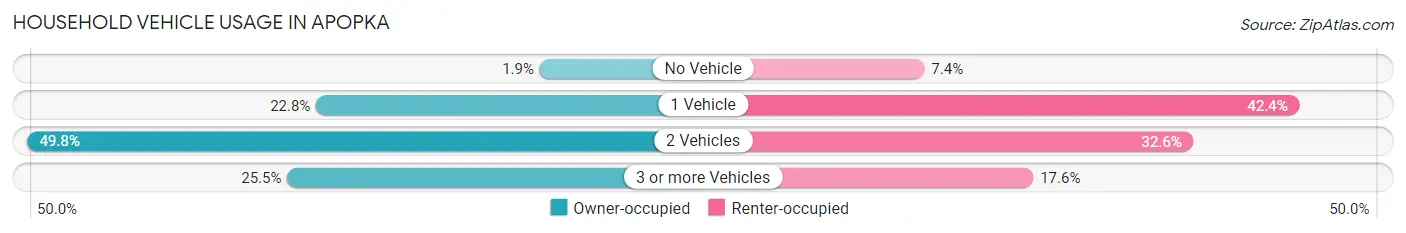
| Vehicles per Household | Owner-occupied | Renter-occupied |
| No Vehicle | 270 (1.9%) | 298 (7.4%) |
| 1 Vehicle | 3,222 (22.8%) | 1,704 (42.4%) |
| 2 Vehicles | 7,046 (49.8%) | 1,307 (32.6%) |
| 3 or more Vehicles | 3,604 (25.5%) | 706 (17.6%) |
| Total | 14,142 (100.0%) | 4,015 (100.0%) |
Real Estate & Mortgages in Apopka
Real Estate and Mortgage Overview in Apopka
| Characteristic | Without Mortgage | With Mortgage |
| Housing Units | 3,136 | 11,006 |
| Median Property Value | $282,300 | $339,500 |
| Median Household Income | $71,944 | $3,488 |
| Monthly Housing Costs | $591 | $712 |
| Real Estate Taxes | $1,889 | $379 |
Property Value by Mortgage Status in Apopka
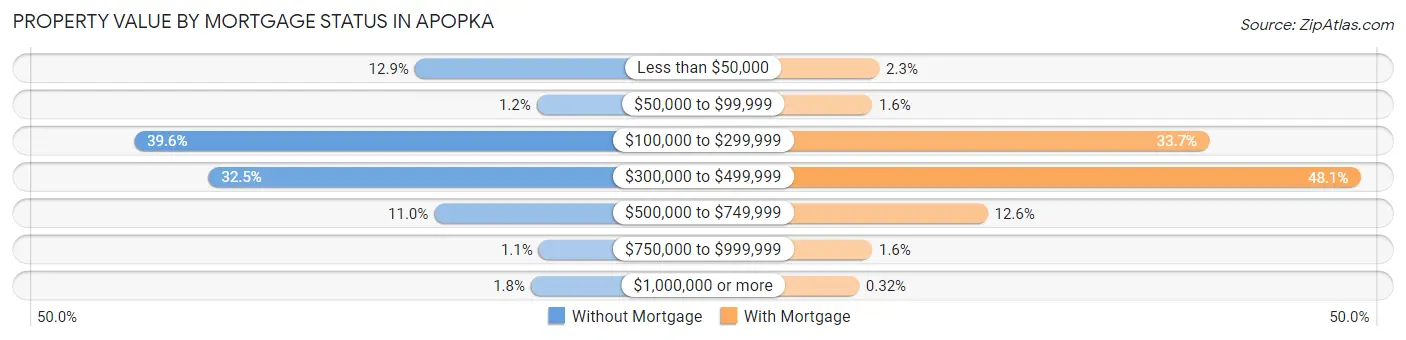
| Property Value | Without Mortgage | With Mortgage |
| Less than $50,000 | 403 (12.9%) | 248 (2.2%) |
| $50,000 to $99,999 | 39 (1.2%) | 173 (1.6%) |
| $100,000 to $299,999 | 1,241 (39.6%) | 3,703 (33.7%) |
| $300,000 to $499,999 | 1,019 (32.5%) | 5,291 (48.1%) |
| $500,000 to $749,999 | 345 (11.0%) | 1,383 (12.6%) |
| $750,000 to $999,999 | 33 (1.1%) | 173 (1.6%) |
| $1,000,000 or more | 56 (1.8%) | 35 (0.3%) |
| Total | 3,136 (100.0%) | 11,006 (100.0%) |
Household Income by Mortgage Status in Apopka
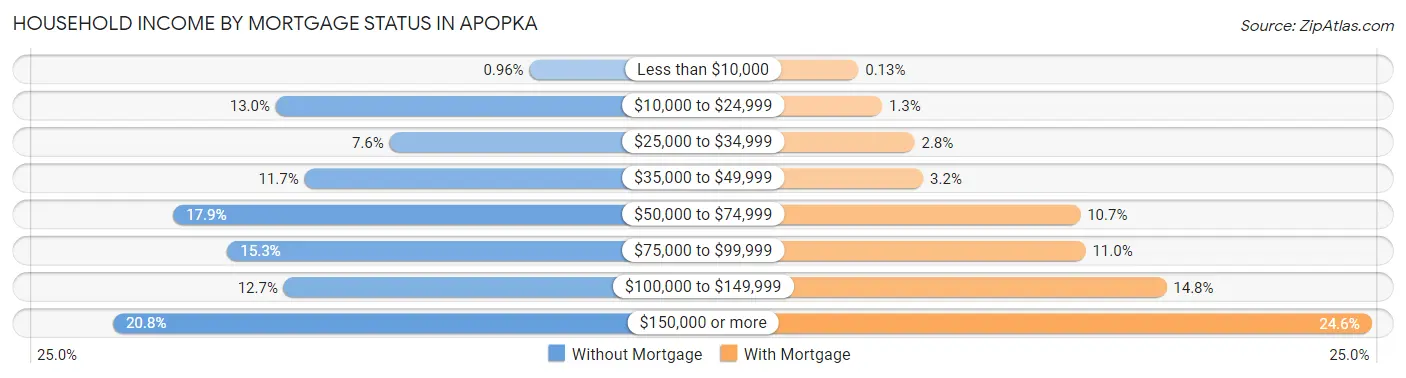
| Household Income | Without Mortgage | With Mortgage |
| Less than $10,000 | 30 (1.0%) | 14 (0.1%) |
| $10,000 to $24,999 | 409 (13.0%) | 139 (1.3%) |
| $25,000 to $34,999 | 239 (7.6%) | 309 (2.8%) |
| $35,000 to $49,999 | 366 (11.7%) | 354 (3.2%) |
| $50,000 to $74,999 | 562 (17.9%) | 1,178 (10.7%) |
| $75,000 to $99,999 | 481 (15.3%) | 1,205 (11.0%) |
| $100,000 to $149,999 | 397 (12.7%) | 1,629 (14.8%) |
| $150,000 or more | 652 (20.8%) | 2,704 (24.6%) |
| Total | 3,136 (100.0%) | 11,006 (100.0%) |
Property Value to Household Income Ratio in Apopka
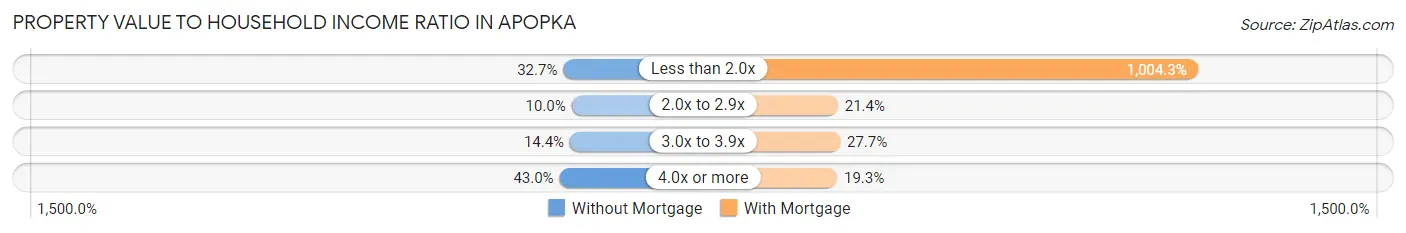
| Value-to-Income Ratio | Without Mortgage | With Mortgage |
| Less than 2.0x | 1,024 (32.7%) | 110,534 (1,004.3%) |
| 2.0x to 2.9x | 312 (10.0%) | 2,357 (21.4%) |
| 3.0x to 3.9x | 452 (14.4%) | 3,043 (27.7%) |
| 4.0x or more | 1,348 (43.0%) | 2,127 (19.3%) |
| Total | 3,136 (100.0%) | 11,006 (100.0%) |
Real Estate Taxes by Mortgage Status in Apopka
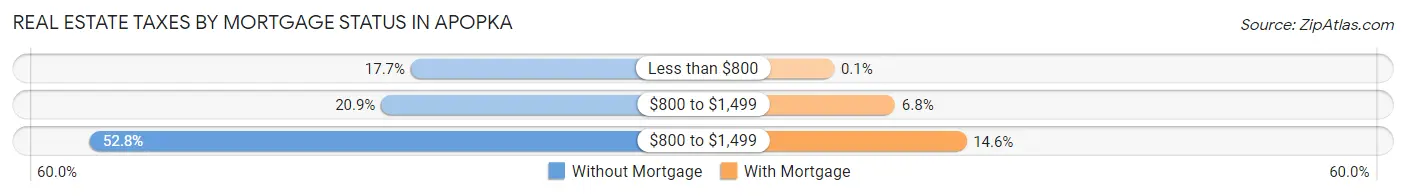
| Property Taxes | Without Mortgage | With Mortgage |
| Less than $800 | 554 (17.7%) | 11 (0.1%) |
| $800 to $1,499 | 656 (20.9%) | 746 (6.8%) |
| $800 to $1,499 | 1,657 (52.8%) | 1,606 (14.6%) |
| Total | 3,136 (100.0%) | 11,006 (100.0%) |
Health & Disability in Apopka
Health Insurance Coverage by Age in Apopka
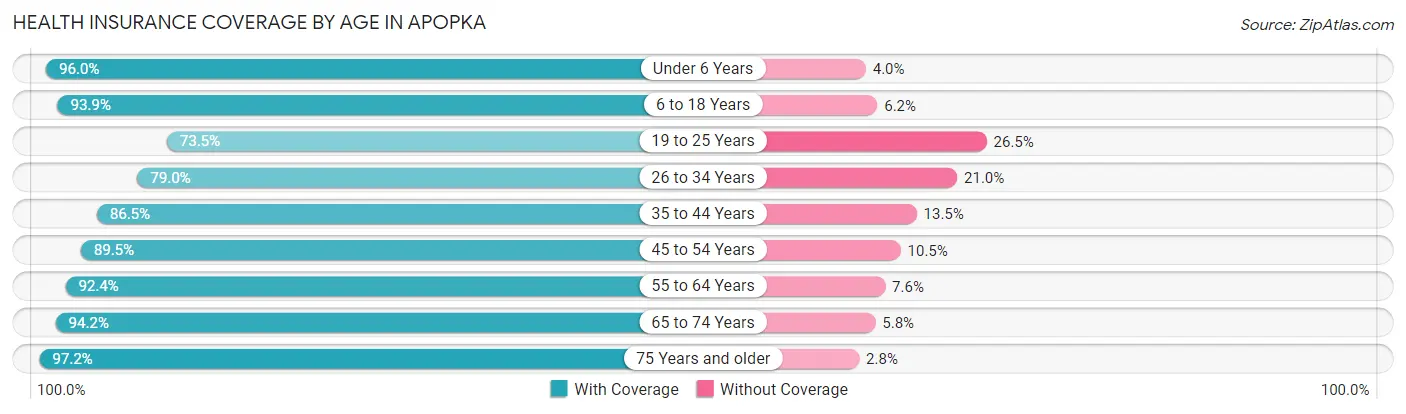
| Age Bracket | With Coverage | Without Coverage |
| Under 6 Years | 3,881 (96.0%) | 162 (4.0%) |
| 6 to 18 Years | 9,151 (93.9%) | 600 (6.1%) |
| 19 to 25 Years | 3,272 (73.5%) | 1,182 (26.5%) |
| 26 to 34 Years | 5,335 (79.0%) | 1,422 (21.0%) |
| 35 to 44 Years | 6,238 (86.5%) | 972 (13.5%) |
| 45 to 54 Years | 7,923 (89.5%) | 930 (10.5%) |
| 55 to 64 Years | 5,699 (92.4%) | 470 (7.6%) |
| 65 to 74 Years | 4,375 (94.2%) | 269 (5.8%) |
| 75 Years and older | 2,947 (97.2%) | 84 (2.8%) |
| Total | 48,821 (88.9%) | 6,091 (11.1%) |
Health Insurance Coverage by Citizenship Status in Apopka
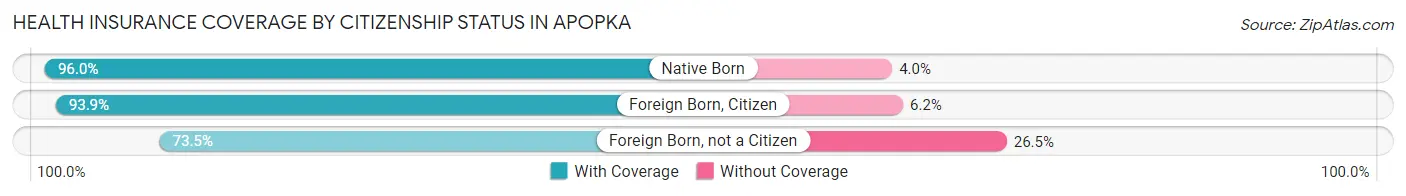
| Citizenship Status | With Coverage | Without Coverage |
| Native Born | 3,881 (96.0%) | 162 (4.0%) |
| Foreign Born, Citizen | 9,151 (93.9%) | 600 (6.1%) |
| Foreign Born, not a Citizen | 3,272 (73.5%) | 1,182 (26.5%) |
Health Insurance Coverage by Household Income in Apopka
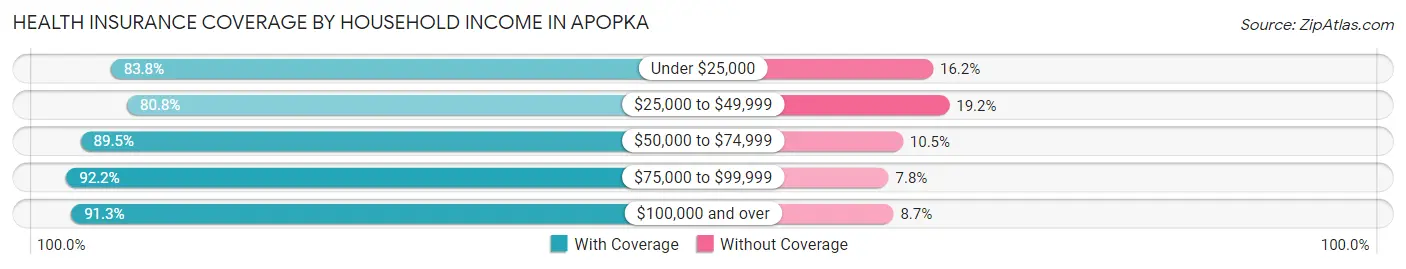
| Household Income | With Coverage | Without Coverage |
| Under $25,000 | 3,340 (83.8%) | 644 (16.2%) |
| $25,000 to $49,999 | 7,275 (80.8%) | 1,730 (19.2%) |
| $50,000 to $74,999 | 6,069 (89.5%) | 712 (10.5%) |
| $75,000 to $99,999 | 6,768 (92.2%) | 575 (7.8%) |
| $100,000 and over | 25,286 (91.3%) | 2,422 (8.7%) |
Public vs Private Health Insurance Coverage by Age in Apopka
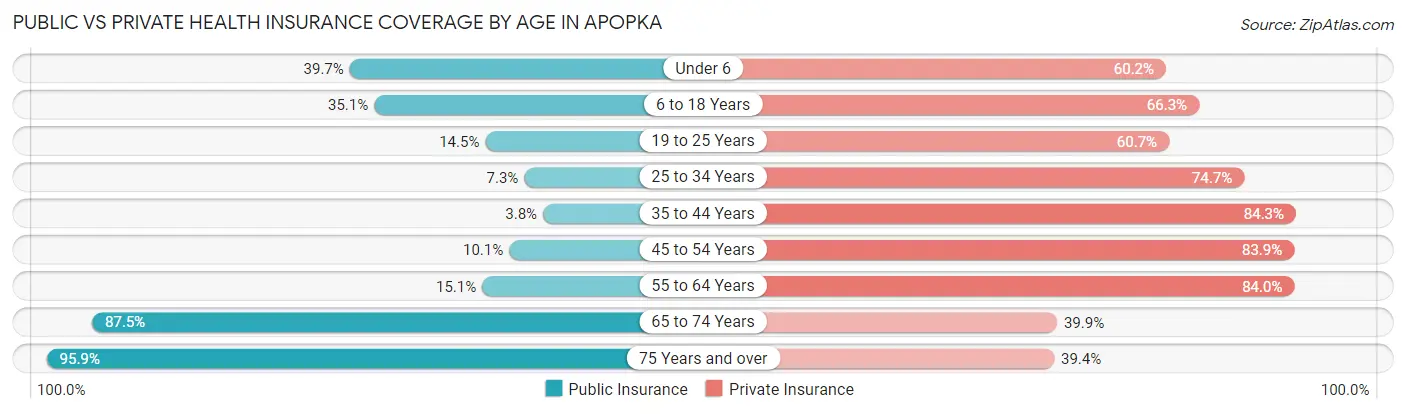
| Age Bracket | Public Insurance | Private Insurance |
| Under 6 | 1,604 (39.7%) | 2,432 (60.2%) |
| 6 to 18 Years | 3,426 (35.1%) | 6,463 (66.3%) |
| 19 to 25 Years | 646 (14.5%) | 2,704 (60.7%) |
| 25 to 34 Years | 491 (7.3%) | 5,046 (74.7%) |
| 35 to 44 Years | 273 (3.8%) | 6,076 (84.3%) |
| 45 to 54 Years | 892 (10.1%) | 7,431 (83.9%) |
| 55 to 64 Years | 931 (15.1%) | 5,180 (84.0%) |
| 65 to 74 Years | 4,063 (87.5%) | 1,855 (39.9%) |
| 75 Years and over | 2,907 (95.9%) | 1,194 (39.4%) |
| Total | 15,233 (27.7%) | 38,381 (69.9%) |
Disability Status by Sex by Age in Apopka
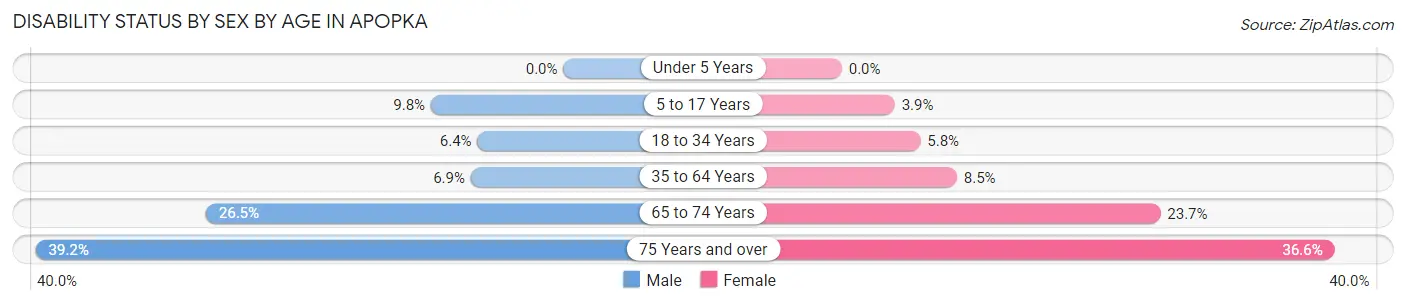
| Age Bracket | Male | Female |
| Under 5 Years | 0 (0.0%) | 0 (0.0%) |
| 5 to 17 Years | 478 (9.8%) | 209 (3.9%) |
| 18 to 34 Years | 386 (6.4%) | 330 (5.8%) |
| 35 to 64 Years | 740 (6.9%) | 978 (8.5%) |
| 65 to 74 Years | 547 (26.5%) | 611 (23.6%) |
| 75 Years and over | 348 (39.2%) | 784 (36.6%) |
Disability Class by Sex by Age in Apopka
Disability Class: Hearing Difficulty
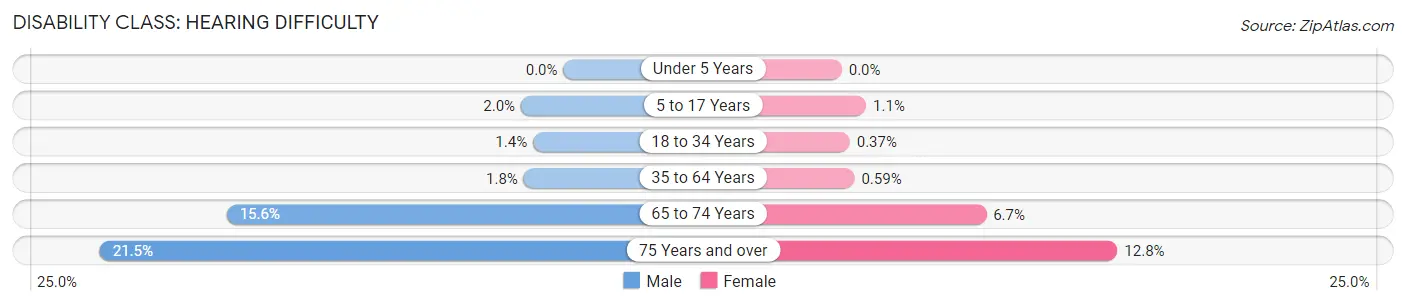
| Age Bracket | Male | Female |
| Under 5 Years | 0 (0.0%) | 0 (0.0%) |
| 5 to 17 Years | 96 (2.0%) | 60 (1.1%) |
| 18 to 34 Years | 85 (1.4%) | 21 (0.4%) |
| 35 to 64 Years | 198 (1.8%) | 68 (0.6%) |
| 65 to 74 Years | 322 (15.6%) | 173 (6.7%) |
| 75 Years and over | 191 (21.5%) | 274 (12.8%) |
Disability Class: Vision Difficulty
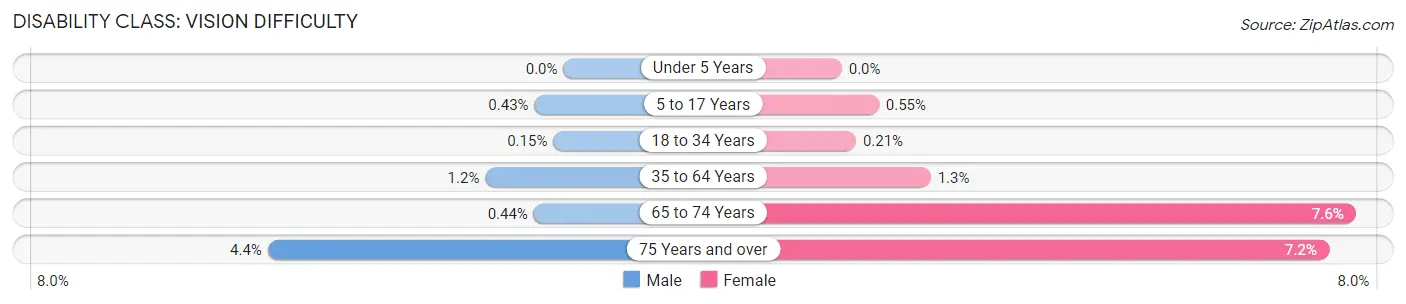
| Age Bracket | Male | Female |
| Under 5 Years | 0 (0.0%) | 0 (0.0%) |
| 5 to 17 Years | 21 (0.4%) | 29 (0.5%) |
| 18 to 34 Years | 9 (0.2%) | 12 (0.2%) |
| 35 to 64 Years | 125 (1.2%) | 151 (1.3%) |
| 65 to 74 Years | 9 (0.4%) | 197 (7.6%) |
| 75 Years and over | 39 (4.4%) | 155 (7.2%) |
Disability Class: Cognitive Difficulty
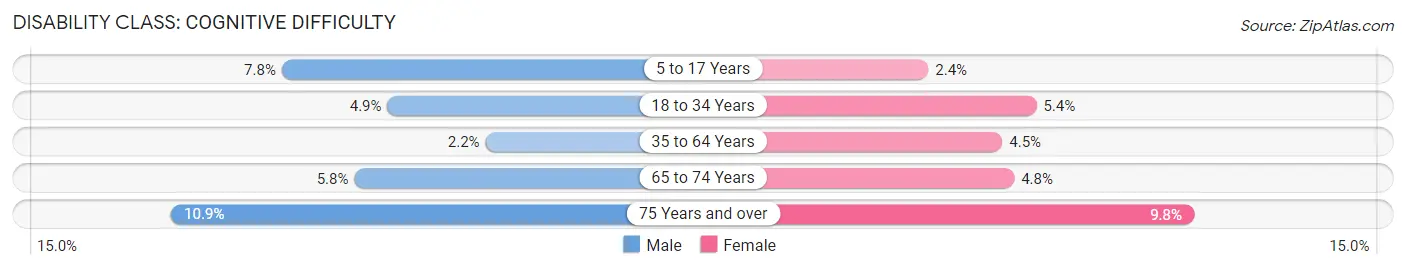
| Age Bracket | Male | Female |
| 5 to 17 Years | 381 (7.8%) | 128 (2.4%) |
| 18 to 34 Years | 296 (4.9%) | 307 (5.4%) |
| 35 to 64 Years | 234 (2.2%) | 512 (4.5%) |
| 65 to 74 Years | 120 (5.8%) | 124 (4.8%) |
| 75 Years and over | 97 (10.9%) | 210 (9.8%) |
Disability Class: Ambulatory Difficulty
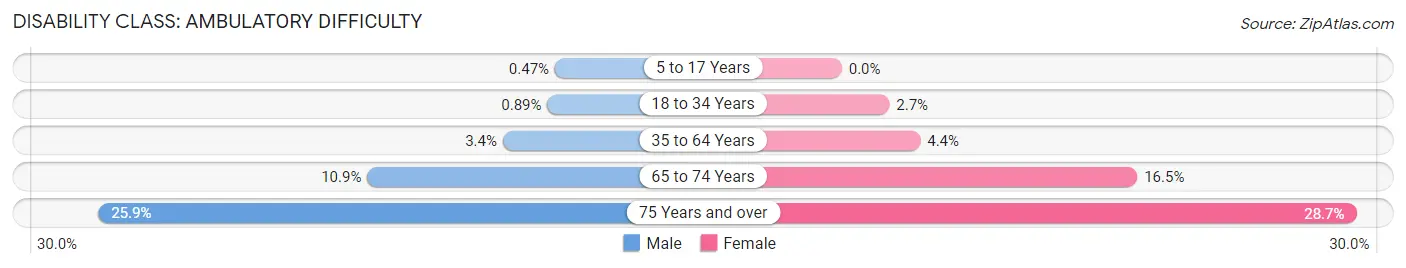
| Age Bracket | Male | Female |
| 5 to 17 Years | 23 (0.5%) | 0 (0.0%) |
| 18 to 34 Years | 54 (0.9%) | 150 (2.6%) |
| 35 to 64 Years | 363 (3.4%) | 501 (4.4%) |
| 65 to 74 Years | 225 (10.9%) | 425 (16.5%) |
| 75 Years and over | 230 (25.9%) | 614 (28.6%) |
Disability Class: Self-Care Difficulty
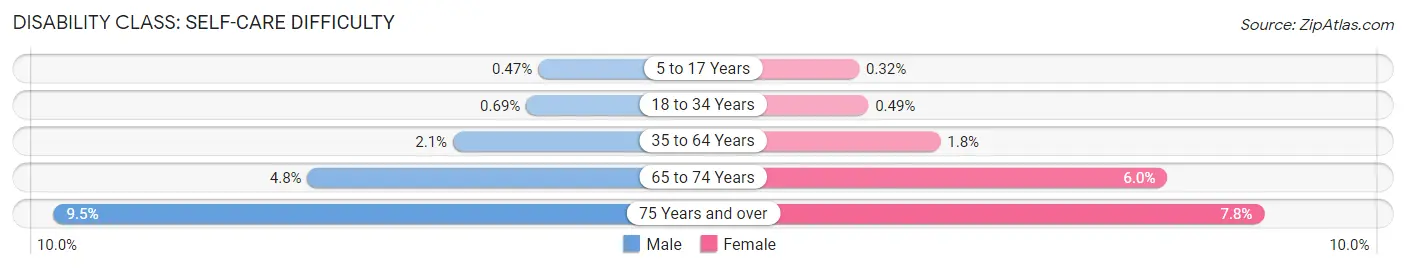
| Age Bracket | Male | Female |
| 5 to 17 Years | 23 (0.5%) | 17 (0.3%) |
| 18 to 34 Years | 42 (0.7%) | 28 (0.5%) |
| 35 to 64 Years | 221 (2.1%) | 210 (1.8%) |
| 65 to 74 Years | 98 (4.8%) | 156 (6.0%) |
| 75 Years and over | 84 (9.5%) | 168 (7.8%) |
Technology Access in Apopka
Computing Device Access in Apopka
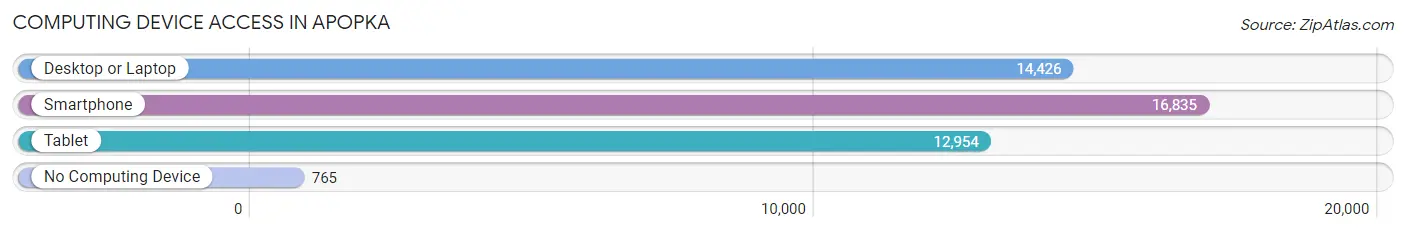
| Device Type | # Households | % Households |
| Desktop or Laptop | 14,426 | 79.4% |
| Smartphone | 16,835 | 92.7% |
| Tablet | 12,954 | 71.3% |
| No Computing Device | 765 | 4.2% |
| Total | 18,157 | 100.0% |
Internet Access in Apopka
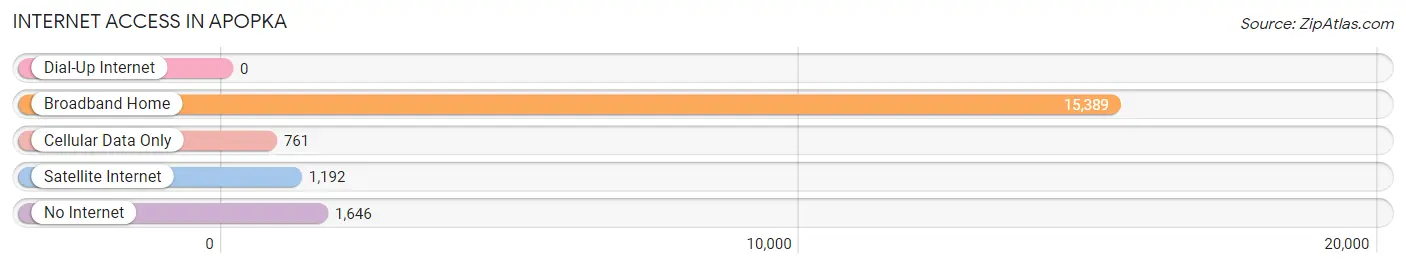
| Internet Type | # Households | % Households |
| Dial-Up Internet | 0 | 0.0% |
| Broadband Home | 15,389 | 84.8% |
| Cellular Data Only | 761 | 4.2% |
| Satellite Internet | 1,192 | 6.6% |
| No Internet | 1,646 | 9.1% |
| Total | 18,157 | 100.0% |
Apopka Summary
Apopka, Florida is a city located in Orange County, Florida, United States. It is part of the Orlando-Kissimmee-Sanford Metropolitan Statistical Area. As of the 2010 census, the city had a population of 41,542, up from 26,969 at the 2000 census. It is the second-largest city in Orange County by population, after Orlando.
History
The area of Apopka was originally inhabited by the Seminole Indians. The name Apopka is derived from the Seminole word for "potato eating place". The area was first settled by European Americans in the 1840s. The city was incorporated in 1882.
Geography
Apopka is located in central Orange County at 28°40′N 81°30′W (28.6667, -81.5000). It is bordered to the north by the city of Altamonte Springs, to the east by the city of Zellwood, to the south by the city of Ocoee, and to the west by the city of Winter Garden.
According to the United States Census Bureau, the city has a total area of 24.2 square miles (62.7 km2), of which 23.9 square miles (61.9 km2) is land and 0.3 square miles (0.8 km2), or 1.17%, is water.
Economy
Apopka is home to a variety of businesses, including manufacturing, retail, and service industries. The city is home to several large employers, including the Florida Department of Corrections, the Florida Department of Transportation, and the Orange County Public Schools.
The city is also home to several large retail centers, including the Apopka Town Center, the Apopka Shopping Center, and the Apopka Village Shopping Center.
Demographics
As of the 2010 census, there were 41,542 people, 14,945 households, and 10,845 families residing in the city. The population density was 1,735.2 people per square mile (669.9/km2). There were 16,072 housing units at an average density of 672.2 per square mile (259.3/km2). The racial makeup of the city was 68.2% White, 16.3% African American, 0.4% Native American, 2.2% Asian, 0.1% Pacific Islander, 10.2% from other races, and 2.7% from two or more races. Hispanic or Latino of any race were 22.2% of the population.
There were 14,945 households, out of which 37.2% had children under the age of 18 living with them, 48.2% were married couples living together, 16.7% had a female householder with no husband present, and 28.7% were non-families. 22.2% of all households were made up of individuals, and 8.2% had someone living alone who was 65 years of age or older. The average household size was 2.77 and the average family size was 3.25.
In the city, the population was spread out, with 27.2% under the age of 18, 9.7% from 18 to 24, 30.2% from 25 to 44, 21.3% from 45 to 64, and 11.6% who were 65 years of age or older. The median age was 34 years. For every 100 females, there were 95.2 males. For every 100 females age 18 and over, there were 91.7 males.
The median income for a household in the city was $41,845, and the median income for a family was $47,813. Males had a median income of $32,717 versus $25,813 for females. The per capita income for the city was $19,845. About 10.2% of families and 13.2% of the population were below the poverty line, including 17.2% of those under age 18 and 8.7% of those age 65 or over.
Common Questions
What is Per Capita Income in Apopka?
Per Capita income in Apopka is $36,244.
What is the Median Family Income in Apopka?
Median Family Income in Apopka is $98,194.
What is the Median Household income in Apopka?
Median Household Income in Apopka is $87,394.
What is Income or Wage Gap in Apopka?
Income or Wage Gap in Apopka is 9.8%.
Women in Apopka earn 90.2 cents for every dollar earned by a man.
What is Inequality or Gini Index in Apopka?
Inequality or Gini Index in Apopka is 0.40.
What is the Total Population of Apopka?
Total Population of Apopka is 55,056.
What is the Total Male Population of Apopka?
Total Male Population of Apopka is 26,441.
What is the Total Female Population of Apopka?
Total Female Population of Apopka is 28,615.
What is the Ratio of Males per 100 Females in Apopka?
There are 92.40 Males per 100 Females in Apopka.
What is the Ratio of Females per 100 Males in Apopka?
There are 108.22 Females per 100 Males in Apopka.
What is the Median Population Age in Apopka?
Median Population Age in Apopka is 38.9 Years.
What is the Average Family Size in Apopka
Average Family Size in Apopka is 3.5 People.
What is the Average Household Size in Apopka
Average Household Size in Apopka is 3.0 People.
How Large is the Labor Force in Apopka?
There are 29,685 People in the Labor Forcein in Apopka.
What is the Percentage of People in the Labor Force in Apopka?
68.2% of People are in the Labor Force in Apopka.
What is the Unemployment Rate in Apopka?
Unemployment Rate in Apopka is 3.4%.