Hallandale Beach, FL Map & Demographics
Hallandale Beach Map
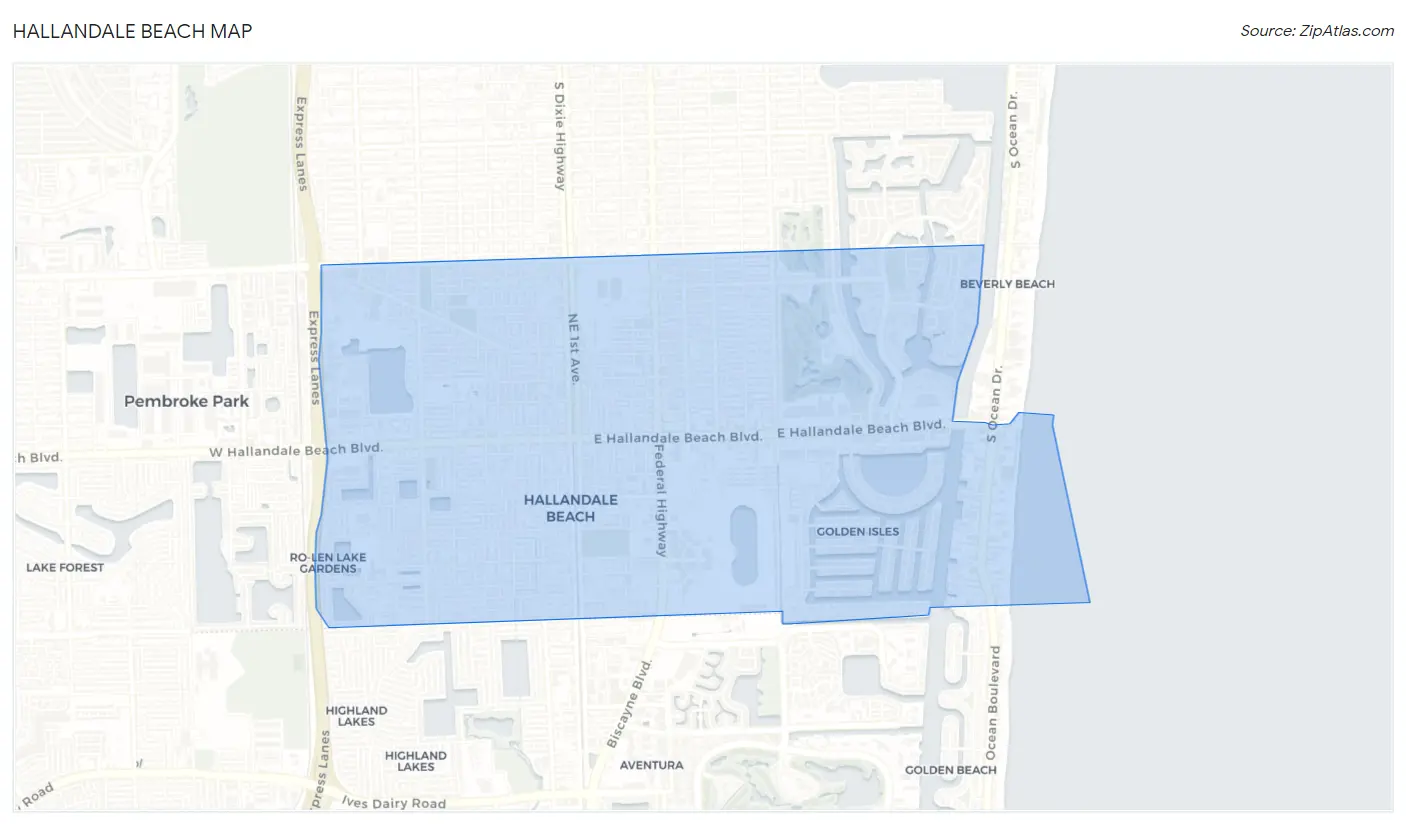
Hallandale Beach Overview
$34,320
PER CAPITA INCOME
$55,039
AVG FAMILY INCOME
$45,417
AVG HOUSEHOLD INCOME
15.9%
WAGE / INCOME GAP [ % ]
84.1¢/ $1
WAGE / INCOME GAP [ $ ]
$10,735
FAMILY INCOME DEFICIT
0.53
INEQUALITY / GINI INDEX
41,102
TOTAL POPULATION
19,299
MALE POPULATION
21,803
FEMALE POPULATION
88.52
MALES / 100 FEMALES
112.97
FEMALES / 100 MALES
46.2
MEDIAN AGE
2.8
AVG FAMILY SIZE
2.1
AVG HOUSEHOLD SIZE
21,573
LABOR FORCE [ PEOPLE ]
61.5%
PERCENT IN LABOR FORCE
9.3%
UNEMPLOYMENT RATE
Hallandale Beach Area Codes
Income in Hallandale Beach
Income Overview in Hallandale Beach
Per Capita Income in Hallandale Beach is $34,320, while median incomes of families and households are $55,039 and $45,417 respectively.
| Characteristic | Number | Measure |
| Per Capita Income | 41,102 | $34,320 |
| Median Family Income | 10,609 | $55,039 |
| Mean Family Income | 10,609 | $80,373 |
| Median Household Income | 19,581 | $45,417 |
| Mean Household Income | 19,581 | $69,353 |
| Income Deficit | 10,609 | $10,735 |
| Wage / Income Gap (%) | 41,102 | 15.88% |
| Wage / Income Gap ($) | 41,102 | 84.12¢ per $1 |
| Gini / Inequality Index | 41,102 | 0.53 |
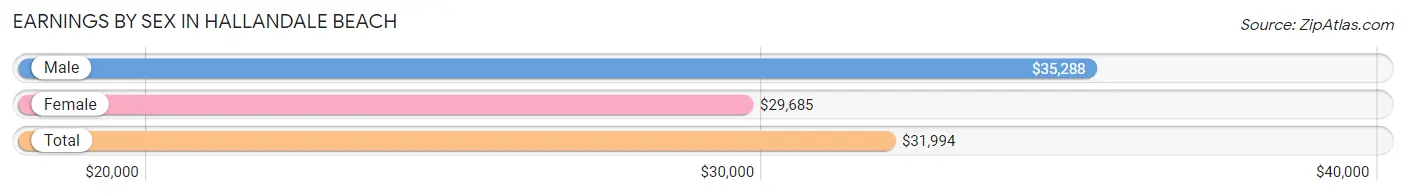
Earnings by Sex in Hallandale Beach
Average Earnings in Hallandale Beach are $31,994, $35,288 for men and $29,685 for women, a difference of 15.9%.
| Sex | Number | Average Earnings |
| Male | 10,592 (48.2%) | $35,288 |
| Female | 11,402 (51.8%) | $29,685 |
| Total | 21,994 (100.0%) | $31,994 |
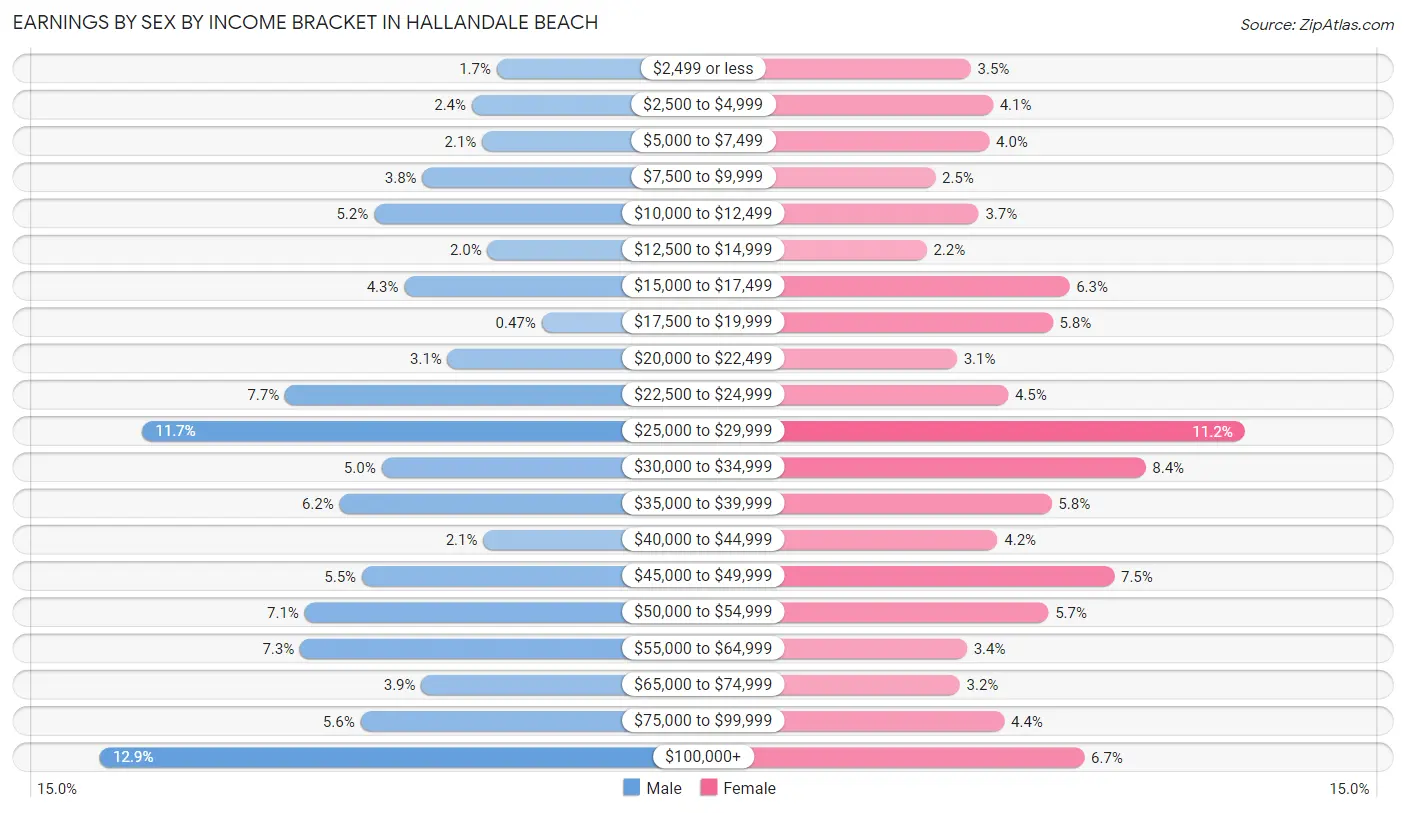
Earnings by Sex by Income Bracket in Hallandale Beach
The most common earnings brackets in Hallandale Beach are $100,000+ for men (1,364 | 12.9%) and $25,000 to $29,999 for women (1,275 | 11.2%).
| Income | Male | Female |
| $2,499 or less | 183 (1.7%) | 397 (3.5%) |
| $2,500 to $4,999 | 257 (2.4%) | 467 (4.1%) |
| $5,000 to $7,499 | 227 (2.1%) | 456 (4.0%) |
| $7,500 to $9,999 | 405 (3.8%) | 283 (2.5%) |
| $10,000 to $12,499 | 549 (5.2%) | 422 (3.7%) |
| $12,500 to $14,999 | 211 (2.0%) | 255 (2.2%) |
| $15,000 to $17,499 | 459 (4.3%) | 713 (6.2%) |
| $17,500 to $19,999 | 50 (0.5%) | 659 (5.8%) |
| $20,000 to $22,499 | 329 (3.1%) | 352 (3.1%) |
| $22,500 to $24,999 | 813 (7.7%) | 516 (4.5%) |
| $25,000 to $29,999 | 1,238 (11.7%) | 1,275 (11.2%) |
| $30,000 to $34,999 | 526 (5.0%) | 957 (8.4%) |
| $35,000 to $39,999 | 651 (6.1%) | 656 (5.8%) |
| $40,000 to $44,999 | 224 (2.1%) | 482 (4.2%) |
| $45,000 to $49,999 | 585 (5.5%) | 856 (7.5%) |
| $50,000 to $54,999 | 755 (7.1%) | 645 (5.7%) |
| $55,000 to $64,999 | 769 (7.3%) | 384 (3.4%) |
| $65,000 to $74,999 | 408 (3.8%) | 362 (3.2%) |
| $75,000 to $99,999 | 589 (5.6%) | 504 (4.4%) |
| $100,000+ | 1,364 (12.9%) | 761 (6.7%) |
| Total | 10,592 (100.0%) | 11,402 (100.0%) |
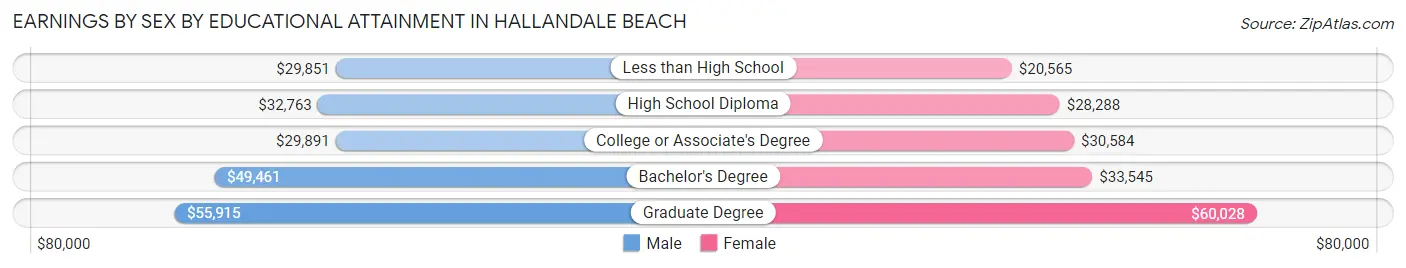
Earnings by Sex by Educational Attainment in Hallandale Beach
Average earnings in Hallandale Beach are $37,426 for men and $31,453 for women, a difference of 16.0%. Men with an educational attainment of graduate degree enjoy the highest average annual earnings of $55,915, while those with less than high school education earn the least with $29,851. Women with an educational attainment of graduate degree earn the most with the average annual earnings of $60,028, while those with less than high school education have the smallest earnings of $20,565.
| Educational Attainment | Male Income | Female Income |
| Less than High School | $29,851 | $20,565 |
| High School Diploma | $32,763 | $28,288 |
| College or Associate's Degree | $29,891 | $30,584 |
| Bachelor's Degree | $49,461 | $33,545 |
| Graduate Degree | $55,915 | $60,028 |
| Total | $37,426 | $31,453 |
Family Income in Hallandale Beach
Family Income Brackets in Hallandale Beach
According to the Hallandale Beach family income data, there are 1,846 families falling into the $50,000 to $74,999 income range, which is the most common income bracket and makes up 17.4% of all families. Conversely, the $10,000 to $14,999 income bracket is the least frequent group with only 233 families (2.2%) belonging to this category.
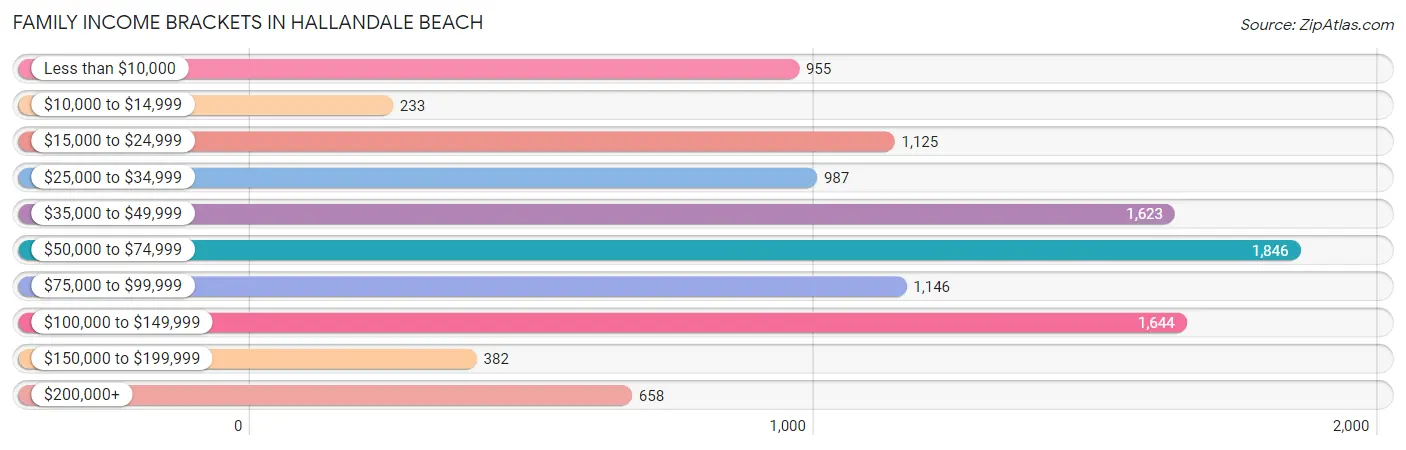
| Income Bracket | # Families | % Families |
| Less than $10,000 | 955 | 9.0% |
| $10,000 to $14,999 | 233 | 2.2% |
| $15,000 to $24,999 | 1,125 | 10.6% |
| $25,000 to $34,999 | 987 | 9.3% |
| $35,000 to $49,999 | 1,623 | 15.3% |
| $50,000 to $74,999 | 1,846 | 17.4% |
| $75,000 to $99,999 | 1,146 | 10.8% |
| $100,000 to $149,999 | 1,644 | 15.5% |
| $150,000 to $199,999 | 382 | 3.6% |
| $200,000+ | 658 | 6.2% |
Family Income by Famaliy Size in Hallandale Beach
3-person families (2,690 | 25.4%) account for the highest median family income in Hallandale Beach with $73,846 per family, while 3-person families (2,690 | 25.4%) have the highest median income of $24,615 per family member.
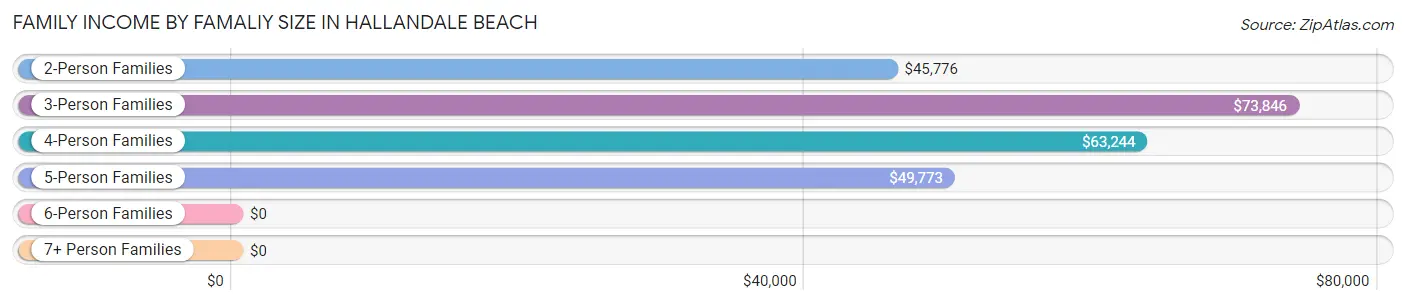
| Income Bracket | # Families | Median Income |
| 2-Person Families | 6,468 (61.0%) | $45,776 |
| 3-Person Families | 2,690 (25.4%) | $73,846 |
| 4-Person Families | 873 (8.2%) | $63,244 |
| 5-Person Families | 504 (4.8%) | $49,773 |
| 6-Person Families | 43 (0.4%) | $0 |
| 7+ Person Families | 31 (0.3%) | $0 |
| Total | 10,609 (100.0%) | $55,039 |
Family Income by Number of Earners in Hallandale Beach
The median family income in Hallandale Beach is $55,039, with families comprising 3+ earners (829) having the highest median family income of $110,771, while families with no earners (2,152) have the lowest median family income of $21,031, accounting for 7.8% and 20.3% of families, respectively.
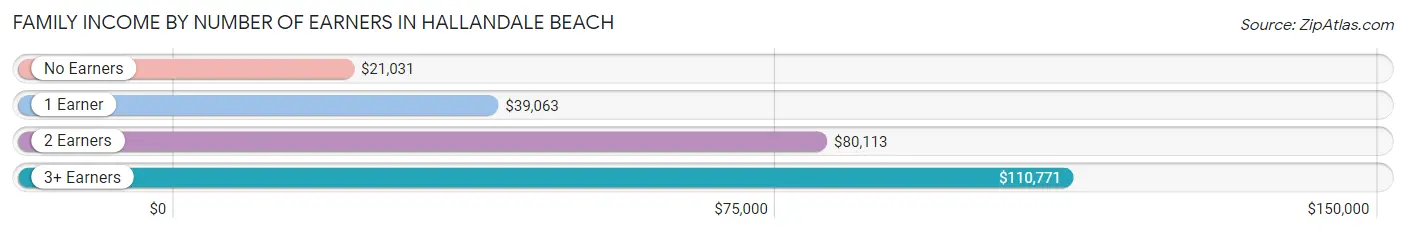
| Number of Earners | # Families | Median Income |
| No Earners | 2,152 (20.3%) | $21,031 |
| 1 Earner | 3,983 (37.5%) | $39,063 |
| 2 Earners | 3,645 (34.4%) | $80,113 |
| 3+ Earners | 829 (7.8%) | $110,771 |
| Total | 10,609 (100.0%) | $55,039 |
Household Income in Hallandale Beach
Household Income Brackets in Hallandale Beach
With 3,074 households falling in the category, the $35,000 to $49,999 income range is the most frequent in Hallandale Beach, accounting for 15.7% of all households. In contrast, only 646 households (3.3%) fall into the $150,000 to $199,999 income bracket, making it the least populous group.
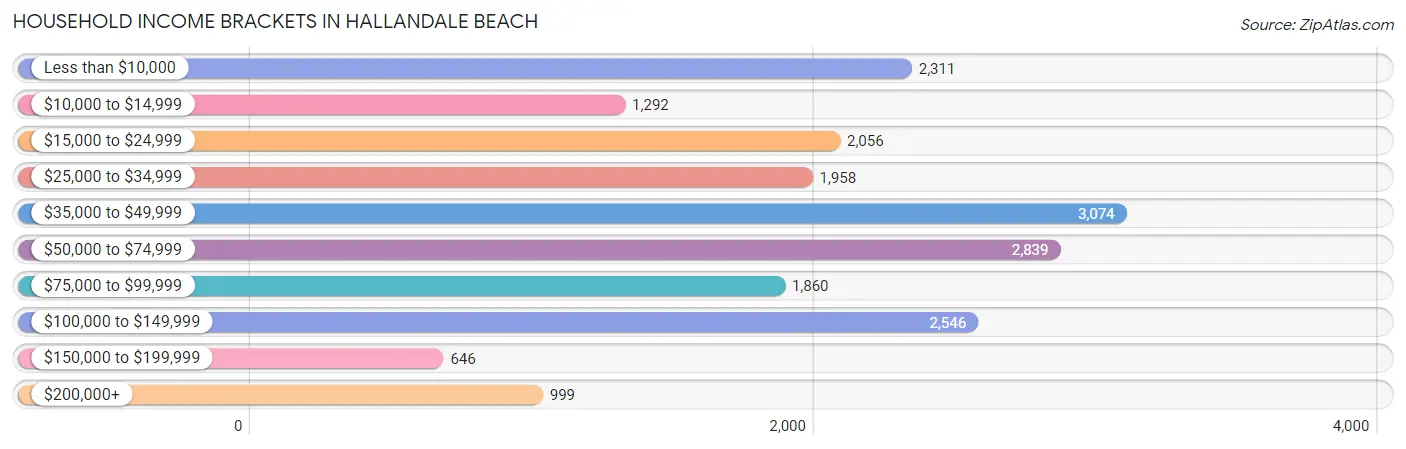
| Income Bracket | # Households | % Households |
| Less than $10,000 | 2,311 | 11.8% |
| $10,000 to $14,999 | 1,292 | 6.6% |
| $15,000 to $24,999 | 2,056 | 10.5% |
| $25,000 to $34,999 | 1,958 | 10.0% |
| $35,000 to $49,999 | 3,074 | 15.7% |
| $50,000 to $74,999 | 2,839 | 14.5% |
| $75,000 to $99,999 | 1,860 | 9.5% |
| $100,000 to $149,999 | 2,546 | 13.0% |
| $150,000 to $199,999 | 646 | 3.3% |
| $200,000+ | 999 | 5.1% |
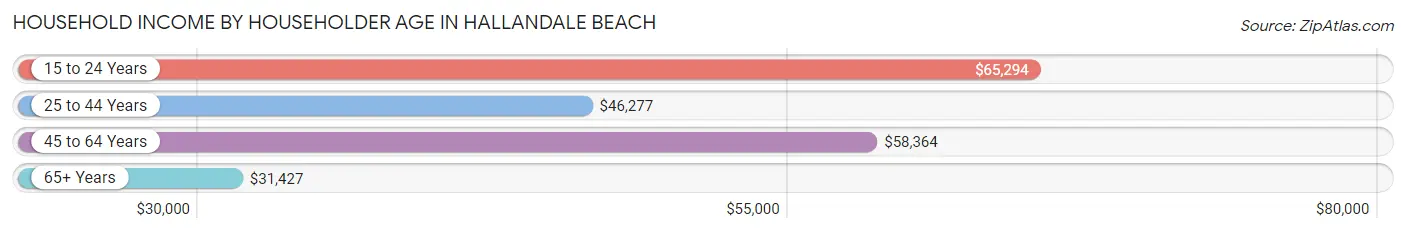
Household Income by Householder Age in Hallandale Beach
The median household income in Hallandale Beach is $45,417, with the highest median household income of $65,294 found in the 15 to 24 years age bracket for the primary householder. A total of 406 households (2.1%) fall into this category. Meanwhile, the 65+ years age bracket for the primary householder has the lowest median household income of $31,427, with 6,362 households (32.5%) in this group.
| Income Bracket | # Households | Median Income |
| 15 to 24 Years | 406 (2.1%) | $65,294 |
| 25 to 44 Years | 5,539 (28.3%) | $46,277 |
| 45 to 64 Years | 7,274 (37.1%) | $58,364 |
| 65+ Years | 6,362 (32.5%) | $31,427 |
| Total | 19,581 (100.0%) | $45,417 |
Poverty in Hallandale Beach
Income Below Poverty by Sex and Age in Hallandale Beach
With 19.8% poverty level for males and 21.8% for females among the residents of Hallandale Beach, 6 to 11 year old males and 15 year old females are the most vulnerable to poverty, with 341 males (36.3%) and 181 females (62.0%) in their respective age groups living below the poverty level.
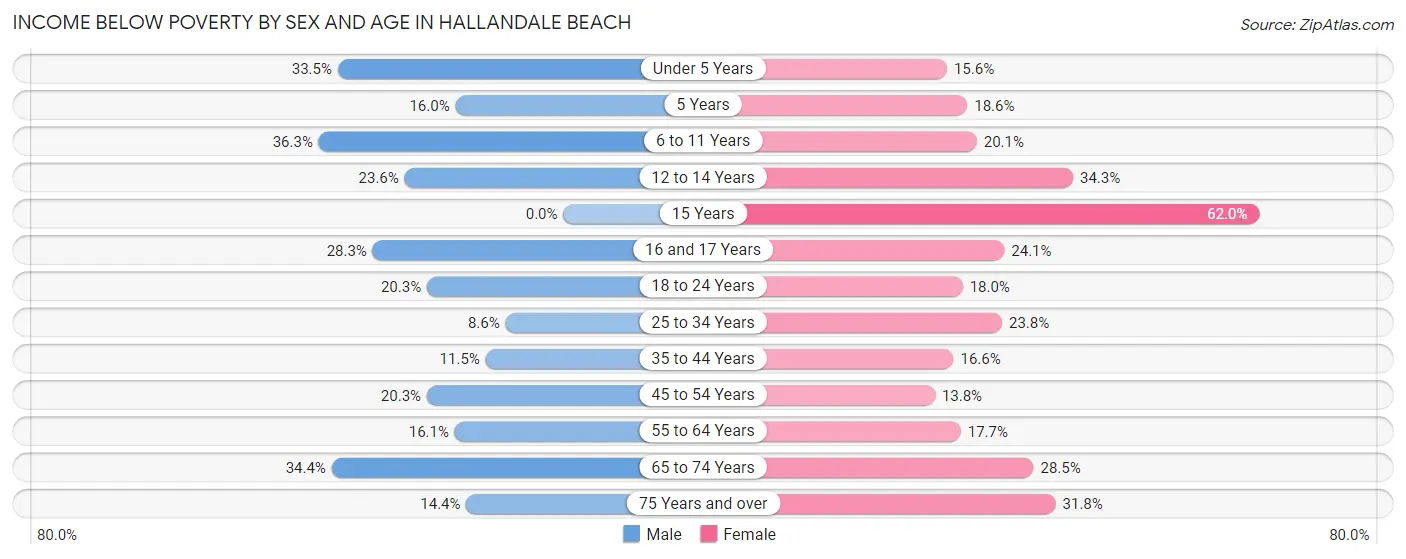
| Age Bracket | Male | Female |
| Under 5 Years | 491 (33.5%) | 181 (15.6%) |
| 5 Years | 33 (16.0%) | 22 (18.6%) |
| 6 to 11 Years | 341 (36.3%) | 172 (20.1%) |
| 12 to 14 Years | 70 (23.6%) | 159 (34.3%) |
| 15 Years | 0 (0.0%) | 181 (62.0%) |
| 16 and 17 Years | 122 (28.3%) | 28 (24.1%) |
| 18 to 24 Years | 287 (20.3%) | 228 (17.9%) |
| 25 to 34 Years | 239 (8.6%) | 742 (23.8%) |
| 35 to 44 Years | 258 (11.5%) | 424 (16.6%) |
| 45 to 54 Years | 379 (20.3%) | 388 (13.8%) |
| 55 to 64 Years | 494 (16.1%) | 689 (17.7%) |
| 65 to 74 Years | 798 (34.4%) | 722 (28.5%) |
| 75 Years and over | 306 (14.4%) | 802 (31.8%) |
| Total | 3,818 (19.8%) | 4,738 (21.8%) |
Income Above Poverty by Sex and Age in Hallandale Beach
According to the poverty statistics in Hallandale Beach, males aged 15 years and females aged 45 to 54 years are the age groups that are most secure financially, with 100.0% of males and 86.2% of females in these age groups living above the poverty line.
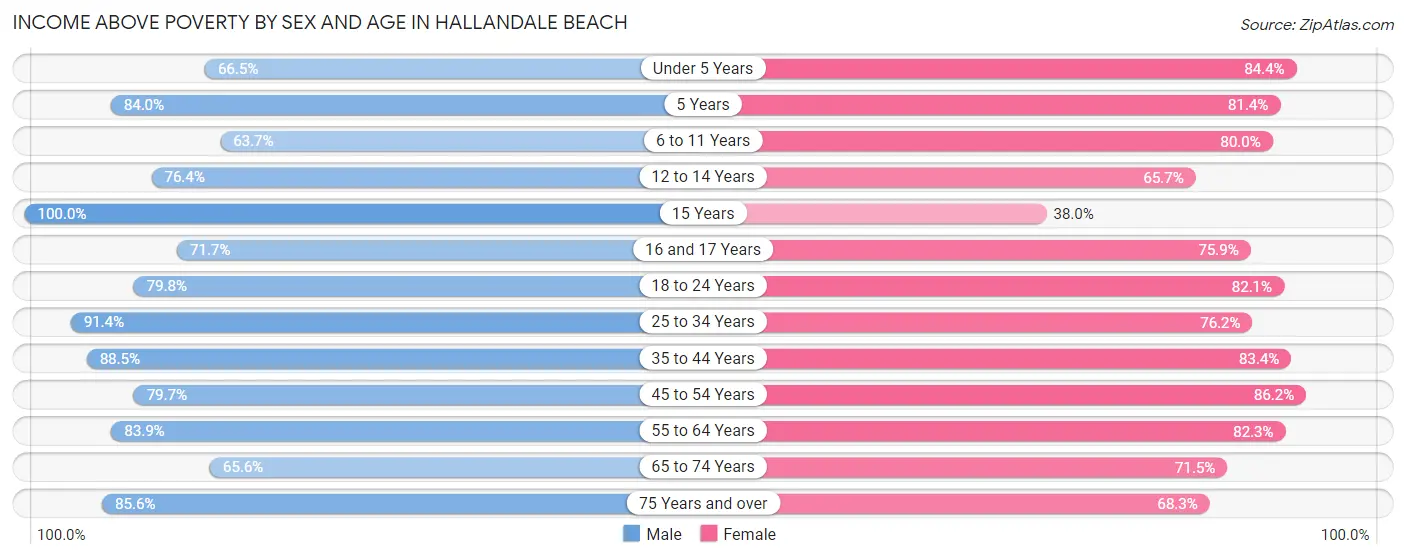
| Age Bracket | Male | Female |
| Under 5 Years | 975 (66.5%) | 978 (84.4%) |
| 5 Years | 173 (84.0%) | 96 (81.4%) |
| 6 to 11 Years | 598 (63.7%) | 686 (79.9%) |
| 12 to 14 Years | 227 (76.4%) | 304 (65.7%) |
| 15 Years | 91 (100.0%) | 111 (38.0%) |
| 16 and 17 Years | 309 (71.7%) | 88 (75.9%) |
| 18 to 24 Years | 1,130 (79.7%) | 1,042 (82.1%) |
| 25 to 34 Years | 2,545 (91.4%) | 2,375 (76.2%) |
| 35 to 44 Years | 1,977 (88.5%) | 2,130 (83.4%) |
| 45 to 54 Years | 1,492 (79.7%) | 2,417 (86.2%) |
| 55 to 64 Years | 2,570 (83.9%) | 3,211 (82.3%) |
| 65 to 74 Years | 1,522 (65.6%) | 1,813 (71.5%) |
| 75 Years and over | 1,819 (85.6%) | 1,724 (68.2%) |
| Total | 15,428 (80.2%) | 16,975 (78.2%) |
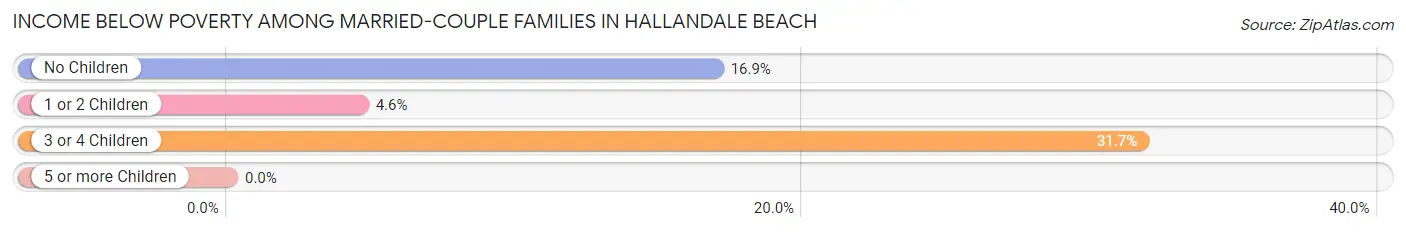
Income Below Poverty Among Married-Couple Families in Hallandale Beach
The poverty statistics for married-couple families in Hallandale Beach show that 14.4% or 935 of the total 6,494 families live below the poverty line. Families with 3 or 4 children have the highest poverty rate of 31.7%, comprising of 46 families. On the other hand, families with 1 or 2 children have the lowest poverty rate of 4.5%, which includes 68 families.
| Children | Above Poverty | Below Poverty |
| No Children | 4,033 (83.1%) | 821 (16.9%) |
| 1 or 2 Children | 1,427 (95.5%) | 68 (4.5%) |
| 3 or 4 Children | 99 (68.3%) | 46 (31.7%) |
| 5 or more Children | 0 (0.0%) | 0 (0.0%) |
| Total | 5,559 (85.6%) | 935 (14.4%) |
Income Below Poverty Among Single-Parent Households in Hallandale Beach
According to the poverty data in Hallandale Beach, 14.1% or 131 single-father households and 25.4% or 808 single-mother households are living below the poverty line. Among single-father households, those with no children have the highest poverty rate, with 82 households (15.2%) experiencing poverty. Likewise, among single-mother households, those with 3 or 4 children have the highest poverty rate, with 116 households (66.7%) falling below the poverty line.
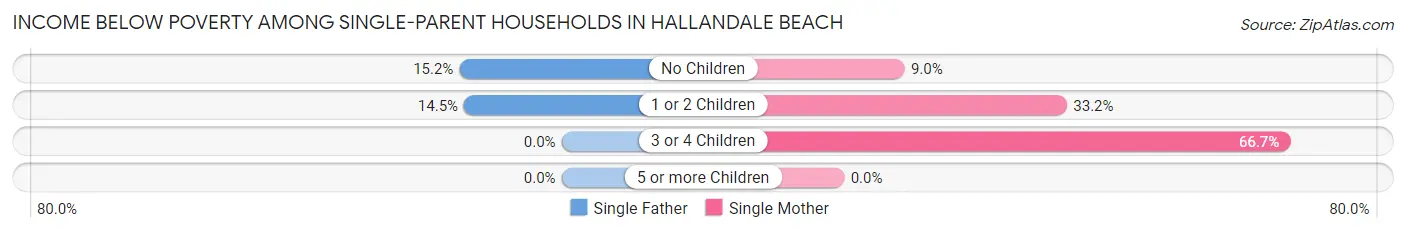
| Children | Single Father | Single Mother |
| No Children | 82 (15.2%) | 114 (9.0%) |
| 1 or 2 Children | 49 (14.5%) | 578 (33.2%) |
| 3 or 4 Children | 0 (0.0%) | 116 (66.7%) |
| 5 or more Children | 0 (0.0%) | 0 (0.0%) |
| Total | 131 (14.1%) | 808 (25.4%) |
Income Below Poverty Among Married-Couple vs Single-Parent Households in Hallandale Beach
The poverty data for Hallandale Beach shows that 935 of the married-couple family households (14.4%) and 939 of the single-parent households (22.8%) are living below the poverty level. Within the married-couple family households, those with 3 or 4 children have the highest poverty rate, with 46 households (31.7%) falling below the poverty line. Among the single-parent households, those with 3 or 4 children have the highest poverty rate, with 116 household (50.9%) living below poverty.
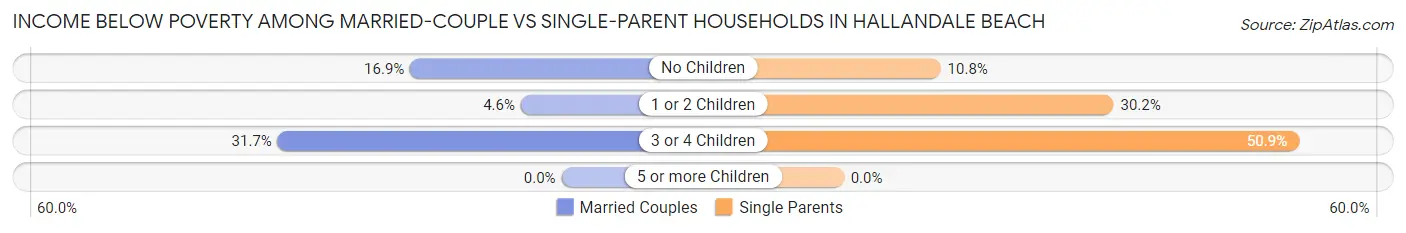
| Children | Married-Couple Families | Single-Parent Households |
| No Children | 821 (16.9%) | 196 (10.8%) |
| 1 or 2 Children | 68 (4.5%) | 627 (30.2%) |
| 3 or 4 Children | 46 (31.7%) | 116 (50.9%) |
| 5 or more Children | 0 (0.0%) | 0 (0.0%) |
| Total | 935 (14.4%) | 939 (22.8%) |
Race in Hallandale Beach
The most populous races in Hallandale Beach are White / Caucasian (23,014 | 56.0%), Hispanic or Latino (15,772 | 38.4%), and Black / African American (7,781 | 18.9%).
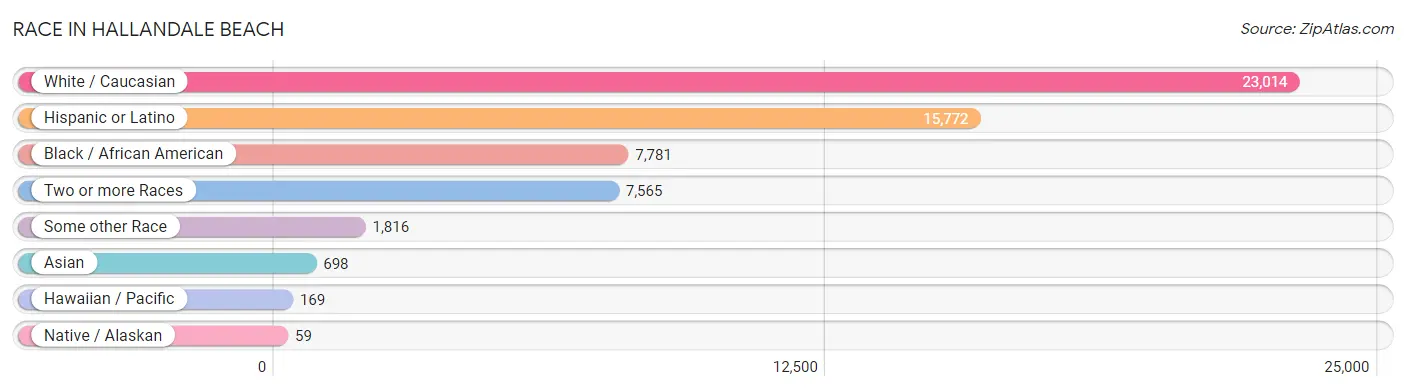
| Race | # Population | % Population |
| Asian | 698 | 1.7% |
| Black / African American | 7,781 | 18.9% |
| Hawaiian / Pacific | 169 | 0.4% |
| Hispanic or Latino | 15,772 | 38.4% |
| Native / Alaskan | 59 | 0.1% |
| White / Caucasian | 23,014 | 56.0% |
| Two or more Races | 7,565 | 18.4% |
| Some other Race | 1,816 | 4.4% |
| Total | 41,102 | 100.0% |
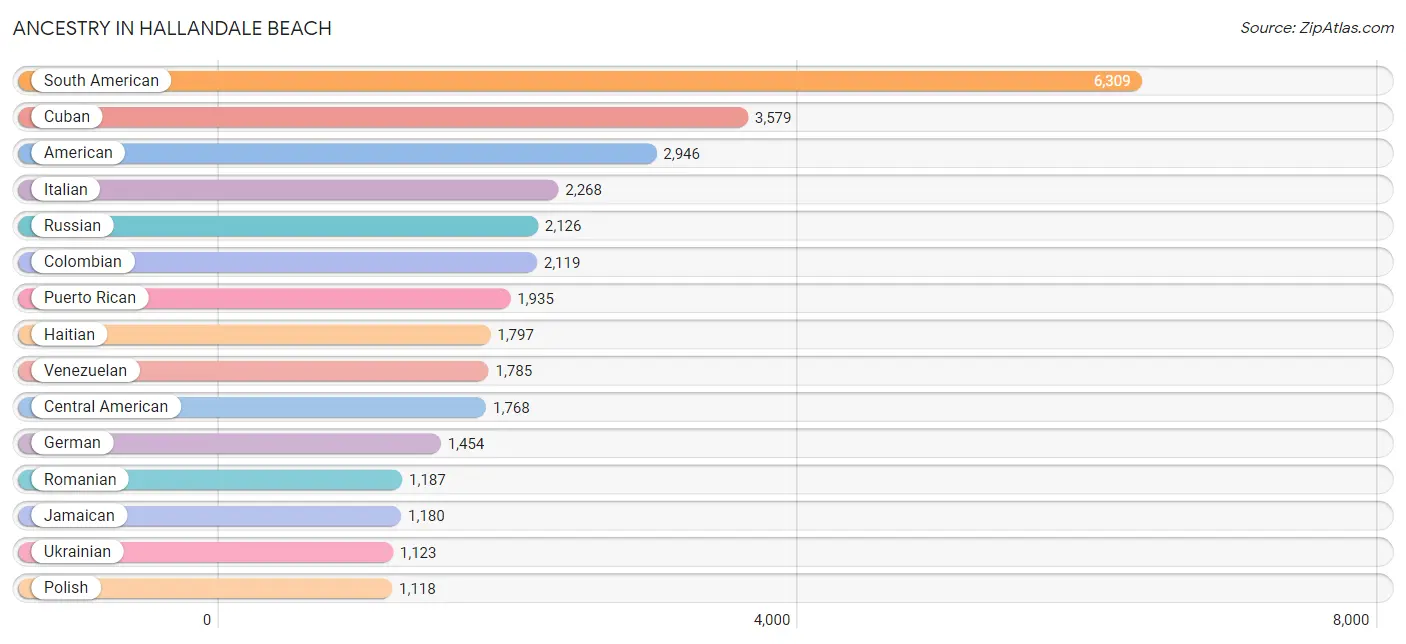
Ancestry in Hallandale Beach
The most populous ancestries reported in Hallandale Beach are South American (6,309 | 15.3%), Cuban (3,579 | 8.7%), American (2,946 | 7.2%), Italian (2,268 | 5.5%), and Russian (2,126 | 5.2%), together accounting for 41.9% of all Hallandale Beach residents.
| Ancestry | # Population | % Population |
| African | 42 | 0.1% |
| American | 2,946 | 7.2% |
| Arab | 531 | 1.3% |
| Argentinean | 677 | 1.7% |
| Armenian | 101 | 0.3% |
| Assyrian / Chaldean / Syriac | 37 | 0.1% |
| Austrian | 9 | 0.0% |
| Bahamian | 199 | 0.5% |
| Belgian | 27 | 0.1% |
| Bhutanese | 22 | 0.1% |
| Bolivian | 105 | 0.3% |
| Brazilian | 590 | 1.4% |
| British | 53 | 0.1% |
| British West Indian | 151 | 0.4% |
| Bulgarian | 148 | 0.4% |
| Burmese | 32 | 0.1% |
| Canadian | 385 | 0.9% |
| Central American | 1,768 | 4.3% |
| Chilean | 231 | 0.6% |
| Chippewa | 11 | 0.0% |
| Colombian | 2,119 | 5.2% |
| Creek | 32 | 0.1% |
| Cuban | 3,579 | 8.7% |
| Czech | 58 | 0.1% |
| Czechoslovakian | 9 | 0.0% |
| Danish | 24 | 0.1% |
| Dominican | 549 | 1.3% |
| Dutch | 89 | 0.2% |
| Eastern European | 209 | 0.5% |
| Ecuadorian | 298 | 0.7% |
| Egyptian | 90 | 0.2% |
| English | 582 | 1.4% |
| Estonian | 14 | 0.0% |
| European | 497 | 1.2% |
| Finnish | 69 | 0.2% |
| French | 596 | 1.5% |
| French Canadian | 251 | 0.6% |
| German | 1,454 | 3.5% |
| Greek | 45 | 0.1% |
| Guamanian / Chamorro | 54 | 0.1% |
| Guatemalan | 219 | 0.5% |
| Haitian | 1,797 | 4.4% |
| Honduran | 1,059 | 2.6% |
| Hungarian | 246 | 0.6% |
| Indian (Asian) | 101 | 0.3% |
| Iranian | 73 | 0.2% |
| Iraqi | 16 | 0.0% |
| Irish | 1,050 | 2.5% |
| Iroquois | 30 | 0.1% |
| Israeli | 179 | 0.4% |
| Italian | 2,268 | 5.5% |
| Jamaican | 1,180 | 2.9% |
| Korean | 147 | 0.4% |
| Lebanese | 15 | 0.0% |
| Lithuanian | 119 | 0.3% |
| Malaysian | 22 | 0.1% |
| Mexican | 638 | 1.5% |
| Native Hawaiian | 101 | 0.3% |
| Navajo | 17 | 0.0% |
| Nicaraguan | 373 | 0.9% |
| Nigerian | 44 | 0.1% |
| Northern European | 24 | 0.1% |
| Pakistani | 45 | 0.1% |
| Panamanian | 23 | 0.1% |
| Peruvian | 785 | 1.9% |
| Polish | 1,118 | 2.7% |
| Portuguese | 85 | 0.2% |
| Puerto Rican | 1,935 | 4.7% |
| Romanian | 1,187 | 2.9% |
| Russian | 2,126 | 5.2% |
| Salvadoran | 94 | 0.2% |
| Scotch-Irish | 68 | 0.2% |
| Scottish | 151 | 0.4% |
| Serbian | 29 | 0.1% |
| Slovak | 29 | 0.1% |
| South African | 11 | 0.0% |
| South American | 6,309 | 15.3% |
| South American Indian | 8 | 0.0% |
| Spaniard | 466 | 1.1% |
| Spanish | 174 | 0.4% |
| Sri Lankan | 21 | 0.1% |
| Subsaharan African | 97 | 0.2% |
| Swedish | 65 | 0.2% |
| Swiss | 17 | 0.0% |
| Syrian | 75 | 0.2% |
| Thai | 147 | 0.4% |
| Trinidadian and Tobagonian | 62 | 0.2% |
| Turkish | 116 | 0.3% |
| U.S. Virgin Islander | 30 | 0.1% |
| Ukrainian | 1,123 | 2.7% |
| Uruguayan | 238 | 0.6% |
| Venezuelan | 1,785 | 4.3% | View All 92 Rows |
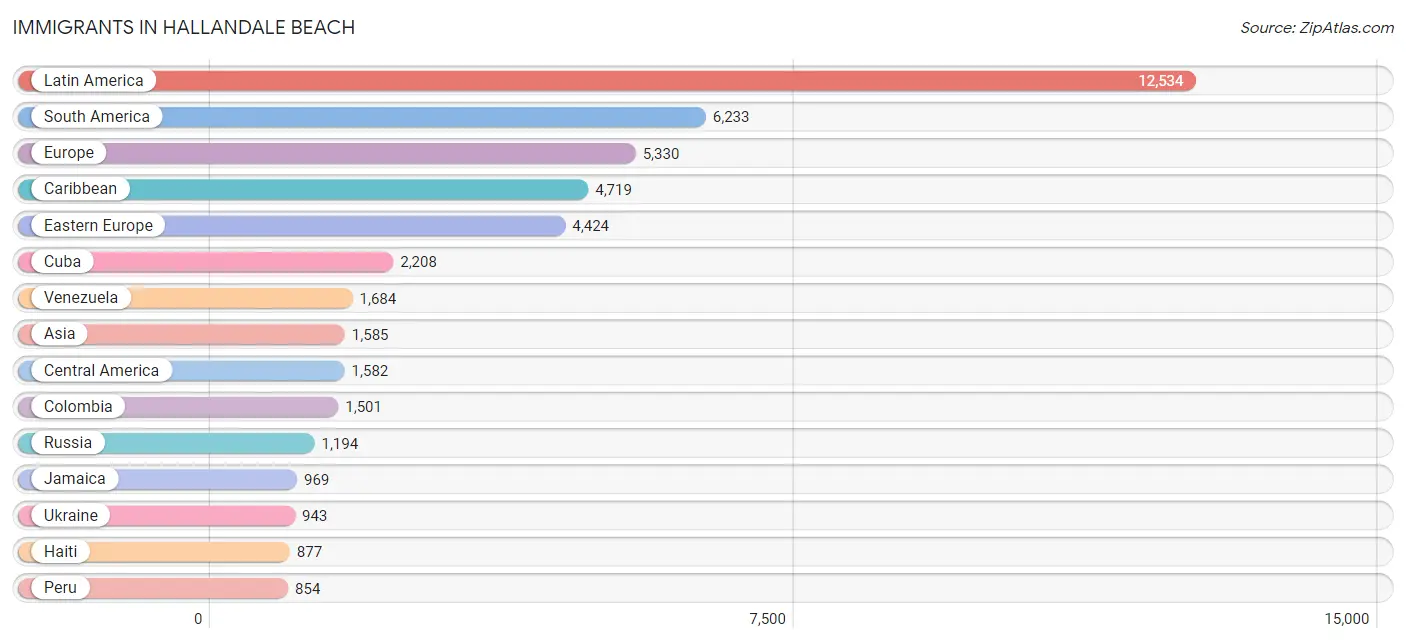
Immigrants in Hallandale Beach
The most numerous immigrant groups reported in Hallandale Beach came from Latin America (12,534 | 30.5%), South America (6,233 | 15.2%), Europe (5,330 | 13.0%), Caribbean (4,719 | 11.5%), and Eastern Europe (4,424 | 10.8%), together accounting for 80.9% of all Hallandale Beach residents.
| Immigration Origin | # Population | % Population |
| Africa | 216 | 0.5% |
| Argentina | 743 | 1.8% |
| Asia | 1,585 | 3.9% |
| Bahamas | 16 | 0.0% |
| Belarus | 199 | 0.5% |
| Belgium | 13 | 0.0% |
| Bolivia | 42 | 0.1% |
| Brazil | 682 | 1.7% |
| Bulgaria | 143 | 0.4% |
| Canada | 740 | 1.8% |
| Caribbean | 4,719 | 11.5% |
| Central America | 1,582 | 3.8% |
| Chile | 210 | 0.5% |
| China | 33 | 0.1% |
| Colombia | 1,501 | 3.6% |
| Cuba | 2,208 | 5.4% |
| Czechoslovakia | 24 | 0.1% |
| Denmark | 14 | 0.0% |
| Dominica | 31 | 0.1% |
| Dominican Republic | 331 | 0.8% |
| Eastern Asia | 50 | 0.1% |
| Eastern Europe | 4,424 | 10.8% |
| Ecuador | 229 | 0.6% |
| Egypt | 40 | 0.1% |
| El Salvador | 168 | 0.4% |
| England | 28 | 0.1% |
| Europe | 5,330 | 13.0% |
| France | 82 | 0.2% |
| Germany | 149 | 0.4% |
| Ghana | 88 | 0.2% |
| Greece | 32 | 0.1% |
| Guatemala | 164 | 0.4% |
| Guyana | 12 | 0.0% |
| Haiti | 877 | 2.1% |
| Honduras | 732 | 1.8% |
| Hong Kong | 11 | 0.0% |
| Hungary | 160 | 0.4% |
| India | 43 | 0.1% |
| Iran | 55 | 0.1% |
| Iraq | 43 | 0.1% |
| Israel | 412 | 1.0% |
| Italy | 286 | 0.7% |
| Jamaica | 969 | 2.4% |
| Kazakhstan | 166 | 0.4% |
| Korea | 17 | 0.0% |
| Laos | 22 | 0.1% |
| Latin America | 12,534 | 30.5% |
| Latvia | 26 | 0.1% |
| Lebanon | 41 | 0.1% |
| Lithuania | 109 | 0.3% |
| Mexico | 234 | 0.6% |
| Moldova | 336 | 0.8% |
| Netherlands | 27 | 0.1% |
| Nicaragua | 284 | 0.7% |
| Nigeria | 21 | 0.1% |
| Northern Africa | 96 | 0.2% |
| Northern Europe | 130 | 0.3% |
| Pakistan | 35 | 0.1% |
| Peru | 854 | 2.1% |
| Philippines | 111 | 0.3% |
| Poland | 145 | 0.4% |
| Romania | 826 | 2.0% |
| Russia | 1,194 | 2.9% |
| Saudi Arabia | 82 | 0.2% |
| South Africa | 11 | 0.0% |
| South America | 6,233 | 15.2% |
| South Central Asia | 562 | 1.4% |
| South Eastern Asia | 199 | 0.5% |
| Southern Europe | 471 | 1.1% |
| Spain | 153 | 0.4% |
| Thailand | 45 | 0.1% |
| Trinidad and Tobago | 109 | 0.3% |
| Turkey | 63 | 0.2% |
| Ukraine | 943 | 2.3% |
| Uruguay | 276 | 0.7% |
| Uzbekistan | 68 | 0.2% |
| Venezuela | 1,684 | 4.1% |
| Vietnam | 21 | 0.1% |
| West Indies | 106 | 0.3% |
| Western Africa | 109 | 0.3% |
| Western Asia | 774 | 1.9% |
| Western Europe | 271 | 0.7% | View All 82 Rows |
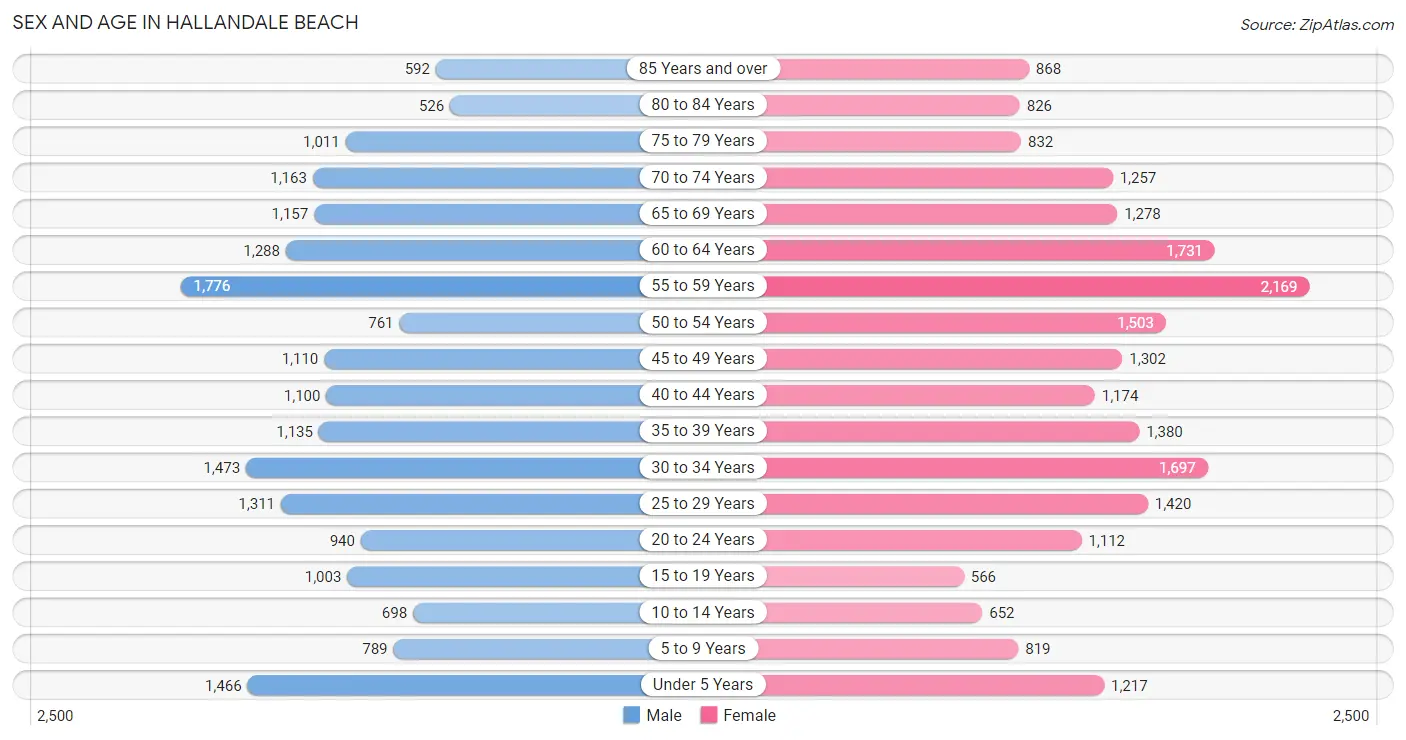
Sex and Age in Hallandale Beach
Sex and Age in Hallandale Beach
The most populous age groups in Hallandale Beach are 55 to 59 Years (1,776 | 9.2%) for men and 55 to 59 Years (2,169 | 10.0%) for women.
| Age Bracket | Male | Female |
| Under 5 Years | 1,466 (7.6%) | 1,217 (5.6%) |
| 5 to 9 Years | 789 (4.1%) | 819 (3.8%) |
| 10 to 14 Years | 698 (3.6%) | 652 (3.0%) |
| 15 to 19 Years | 1,003 (5.2%) | 566 (2.6%) |
| 20 to 24 Years | 940 (4.9%) | 1,112 (5.1%) |
| 25 to 29 Years | 1,311 (6.8%) | 1,420 (6.5%) |
| 30 to 34 Years | 1,473 (7.6%) | 1,697 (7.8%) |
| 35 to 39 Years | 1,135 (5.9%) | 1,380 (6.3%) |
| 40 to 44 Years | 1,100 (5.7%) | 1,174 (5.4%) |
| 45 to 49 Years | 1,110 (5.8%) | 1,302 (6.0%) |
| 50 to 54 Years | 761 (3.9%) | 1,503 (6.9%) |
| 55 to 59 Years | 1,776 (9.2%) | 2,169 (10.0%) |
| 60 to 64 Years | 1,288 (6.7%) | 1,731 (7.9%) |
| 65 to 69 Years | 1,157 (6.0%) | 1,278 (5.9%) |
| 70 to 74 Years | 1,163 (6.0%) | 1,257 (5.8%) |
| 75 to 79 Years | 1,011 (5.2%) | 832 (3.8%) |
| 80 to 84 Years | 526 (2.7%) | 826 (3.8%) |
| 85 Years and over | 592 (3.1%) | 868 (4.0%) |
| Total | 19,299 (100.0%) | 21,803 (100.0%) |
Families and Households in Hallandale Beach
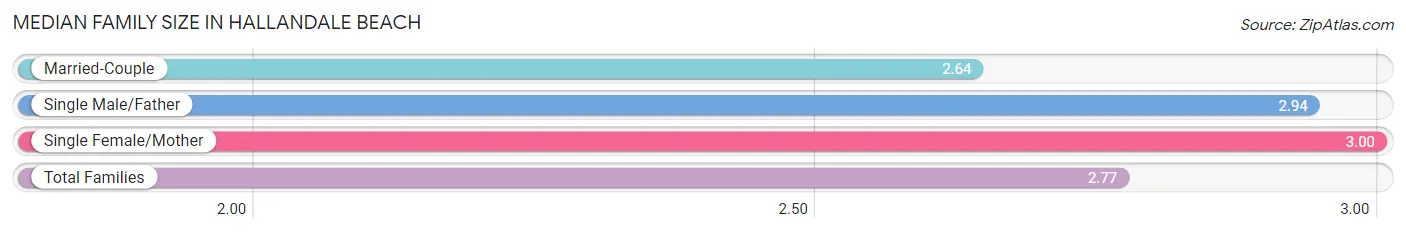
Median Family Size in Hallandale Beach
The median family size in Hallandale Beach is 2.77 persons per family, with single female/mother families (3,186 | 30.0%) accounting for the largest median family size of 3 persons per family. On the other hand, married-couple families (6,494 | 61.2%) represent the smallest median family size with 2.64 persons per family.
| Family Type | # Families | Family Size |
| Married-Couple | 6,494 (61.2%) | 2.64 |
| Single Male/Father | 929 (8.8%) | 2.94 |
| Single Female/Mother | 3,186 (30.0%) | 3.00 |
| Total Families | 10,609 (100.0%) | 2.77 |
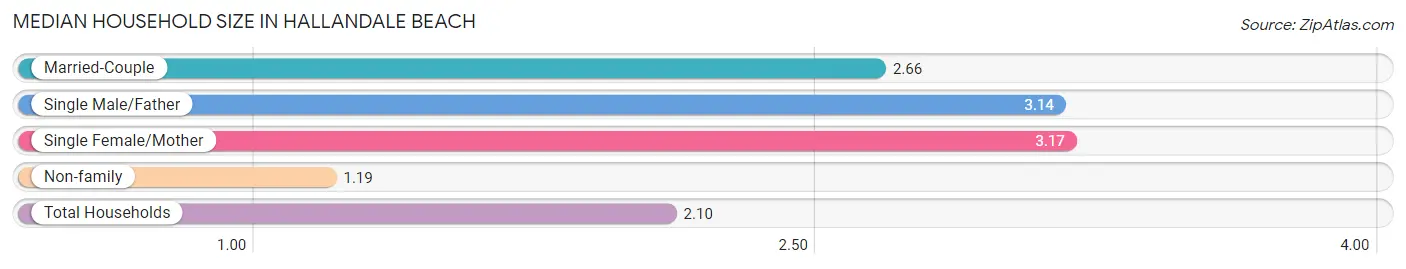
Median Household Size in Hallandale Beach
The median household size in Hallandale Beach is 2.10 persons per household, with single female/mother households (3,186 | 16.3%) accounting for the largest median household size of 3.17 persons per household. non-family households (8,972 | 45.8%) represent the smallest median household size with 1.19 persons per household.
| Household Type | # Households | Household Size |
| Married-Couple | 6,494 (33.2%) | 2.66 |
| Single Male/Father | 929 (4.7%) | 3.14 |
| Single Female/Mother | 3,186 (16.3%) | 3.17 |
| Non-family | 8,972 (45.8%) | 1.19 |
| Total Households | 19,581 (100.0%) | 2.10 |
Household Size by Marriage Status in Hallandale Beach
Out of a total of 19,581 households in Hallandale Beach, 10,609 (54.2%) are family households, while 8,972 (45.8%) are nonfamily households. The most numerous type of family households are 2-person households, comprising 5,975, and the most common type of nonfamily households are 1-person households, comprising 7,726.
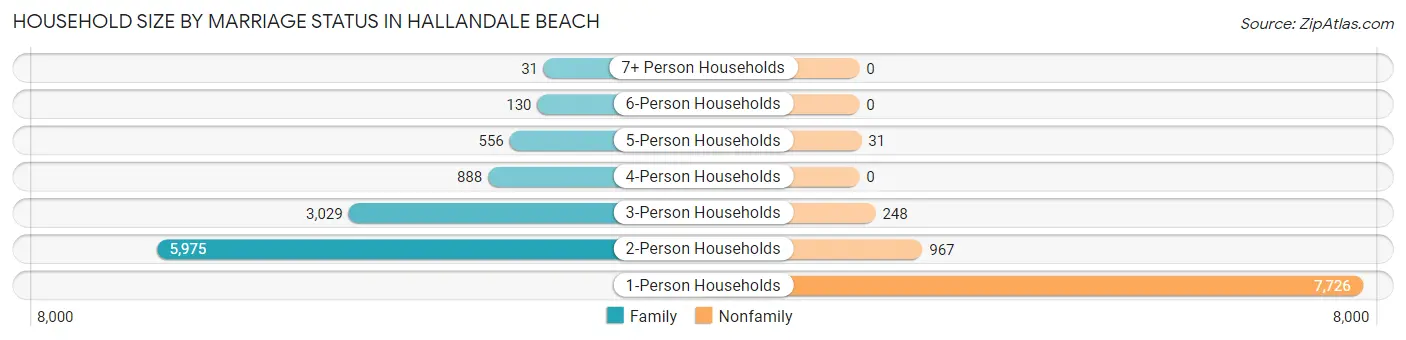
| Household Size | Family Households | Nonfamily Households |
| 1-Person Households | - | 7,726 (39.5%) |
| 2-Person Households | 5,975 (30.5%) | 967 (4.9%) |
| 3-Person Households | 3,029 (15.5%) | 248 (1.3%) |
| 4-Person Households | 888 (4.5%) | 0 (0.0%) |
| 5-Person Households | 556 (2.8%) | 31 (0.2%) |
| 6-Person Households | 130 (0.7%) | 0 (0.0%) |
| 7+ Person Households | 31 (0.2%) | 0 (0.0%) |
| Total | 10,609 (54.2%) | 8,972 (45.8%) |
Female Fertility in Hallandale Beach
Fertility by Age in Hallandale Beach
Average fertility rate in Hallandale Beach is 63.0 births per 1,000 women. Women in the age bracket of 20 to 34 years have the highest fertility rate with 124.0 births per 1,000 women. Women in the age bracket of 20 to 34 years acount for 93.4% of all women with births.
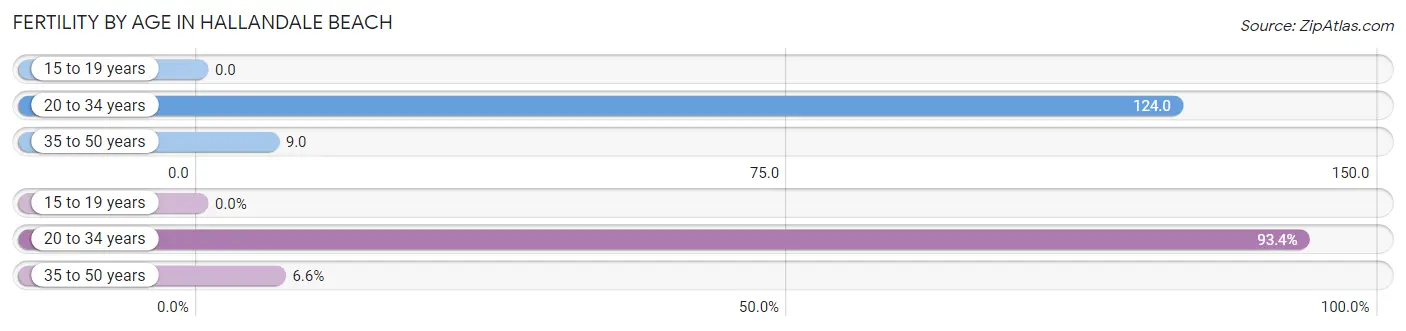
| Age Bracket | Women with Births | Births / 1,000 Women |
| 15 to 19 years | 0 (0.0%) | 0.0 |
| 20 to 34 years | 526 (93.4%) | 124.0 |
| 35 to 50 years | 37 (6.6%) | 9.0 |
| Total | 563 (100.0%) | 63.0 |
Fertility by Age by Marriage Status in Hallandale Beach
43.2% of women with births (563) in Hallandale Beach are married. The highest percentage of unmarried women with births falls into 20 to 34 years age bracket with 60.8% of them unmarried at the time of birth, while the lowest percentage of unmarried women with births belong to 35 to 50 years age bracket with 0.0% of them unmarried.
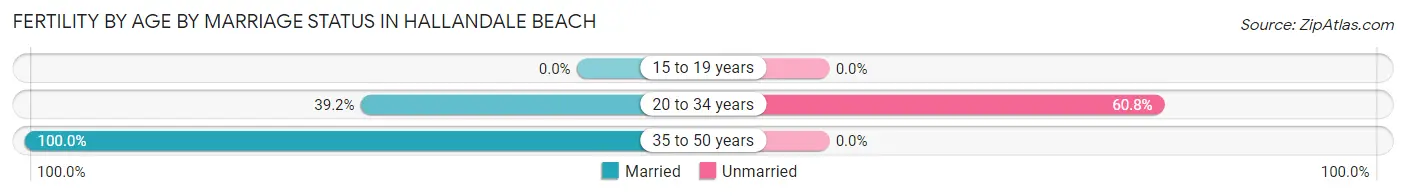
| Age Bracket | Married | Unmarried |
| 15 to 19 years | 0 (0.0%) | 0 (0.0%) |
| 20 to 34 years | 206 (39.2%) | 320 (60.8%) |
| 35 to 50 years | 37 (100.0%) | 0 (0.0%) |
| Total | 243 (43.2%) | 320 (56.8%) |
Fertility by Education in Hallandale Beach
Average fertility rate in Hallandale Beach is 63.0 births per 1,000 women. Women with the education attainment of less than high school have the highest fertility rate of 135.0 births per 1,000 women, while women with the education attainment of high school diploma have the lowest fertility at 29.0 births per 1,000 women. Women with the education attainment of bachelor's degree represent 37.3% of all women with births.
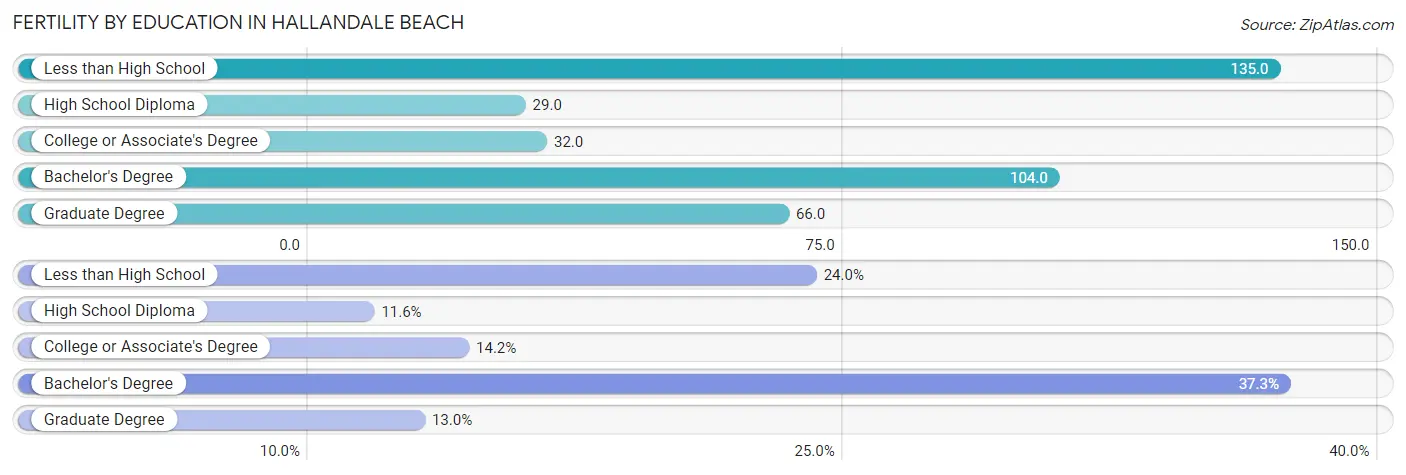
| Educational Attainment | Women with Births | Births / 1,000 Women |
| Less than High School | 135 (24.0%) | 135.0 |
| High School Diploma | 65 (11.6%) | 29.0 |
| College or Associate's Degree | 80 (14.2%) | 32.0 |
| Bachelor's Degree | 210 (37.3%) | 104.0 |
| Graduate Degree | 73 (13.0%) | 66.0 |
| Total | 563 (100.0%) | 63.0 |
Fertility by Education by Marriage Status in Hallandale Beach
56.8% of women with births in Hallandale Beach are unmarried. Women with the educational attainment of high school diploma are most likely to be married with 100.0% of them married at childbirth, while women with the educational attainment of college or associate's degree are least likely to be married with 100.0% of them unmarried at childbirth.
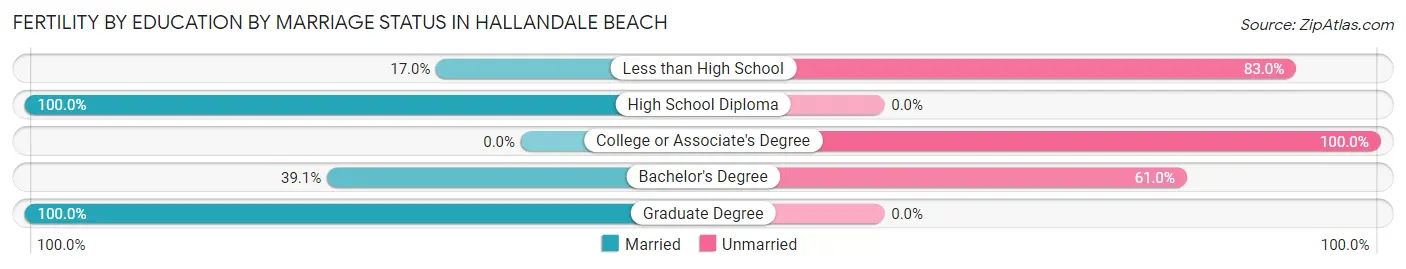
| Educational Attainment | Married | Unmarried |
| Less than High School | 23 (17.0%) | 112 (83.0%) |
| High School Diploma | 65 (100.0%) | 0 (0.0%) |
| College or Associate's Degree | 0 (0.0%) | 80 (100.0%) |
| Bachelor's Degree | 82 (39.1%) | 128 (61.0%) |
| Graduate Degree | 73 (100.0%) | 0 (0.0%) |
| Total | 243 (43.2%) | 320 (56.8%) |
Employment Characteristics in Hallandale Beach
Employment by Class of Employer in Hallandale Beach
Among the 19,002 employed individuals in Hallandale Beach, private company employees (12,043 | 63.4%), self-employed (not incorporated) (2,287 | 12.0%), and self-employed (incorporated) (1,957 | 10.3%) make up the most common classes of employment.
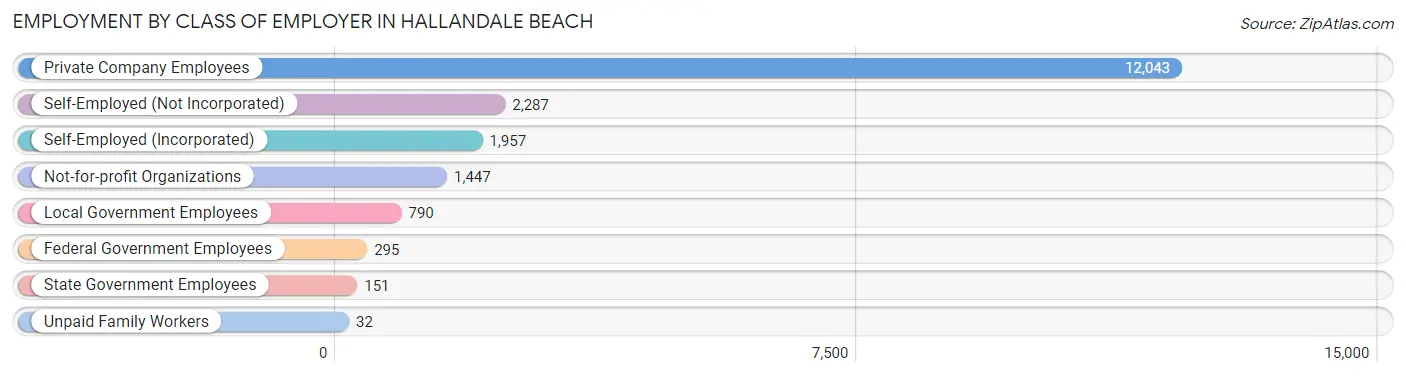
| Employer Class | # Employees | % Employees |
| Private Company Employees | 12,043 | 63.4% |
| Self-Employed (Incorporated) | 1,957 | 10.3% |
| Self-Employed (Not Incorporated) | 2,287 | 12.0% |
| Not-for-profit Organizations | 1,447 | 7.6% |
| Local Government Employees | 790 | 4.2% |
| State Government Employees | 151 | 0.8% |
| Federal Government Employees | 295 | 1.5% |
| Unpaid Family Workers | 32 | 0.2% |
| Total | 19,002 | 100.0% |
Employment Status by Age in Hallandale Beach
According to the labor force statistics for Hallandale Beach, out of the total population over 16 years of age (35,078), 61.5% or 21,573 individuals are in the labor force, with 9.3% or 2,006 of them unemployed. The age group with the highest labor force participation rate is 20 to 24 years, with 85.3% or 1,750 individuals in the labor force. Within the labor force, the 16 to 19 years age range has the highest percentage of unemployed individuals, with 62.7% or 220 of them being unemployed.
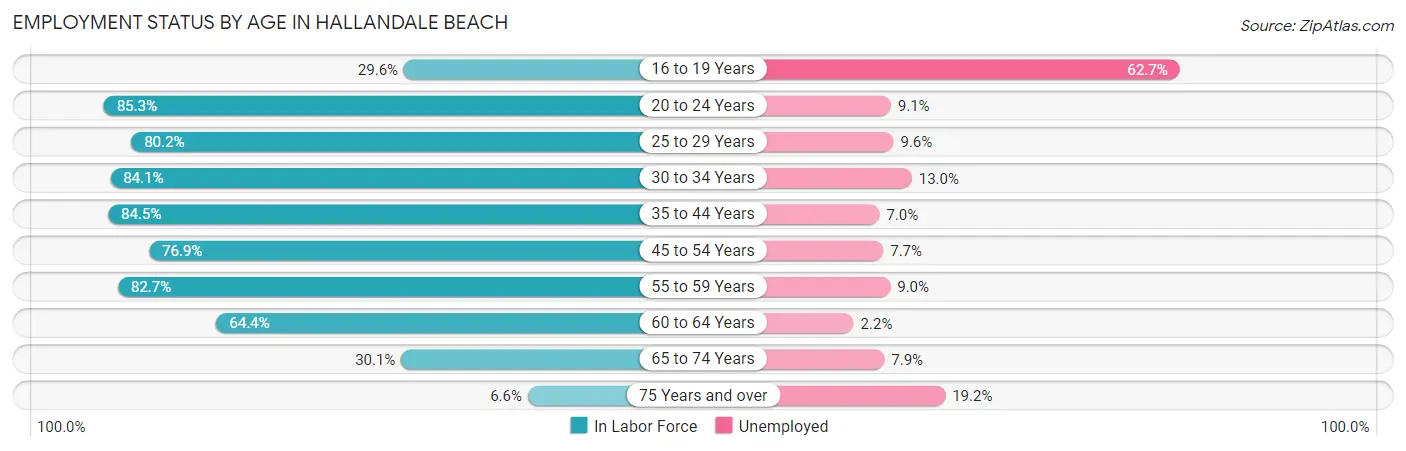
| Age Bracket | In Labor Force | Unemployed |
| 16 to 19 Years | 351 (29.6%) | 220 (62.7%) |
| 20 to 24 Years | 1,750 (85.3%) | 159 (9.1%) |
| 25 to 29 Years | 2,190 (80.2%) | 210 (9.6%) |
| 30 to 34 Years | 2,666 (84.1%) | 347 (13.0%) |
| 35 to 44 Years | 4,047 (84.5%) | 283 (7.0%) |
| 45 to 54 Years | 3,596 (76.9%) | 277 (7.7%) |
| 55 to 59 Years | 3,263 (82.7%) | 294 (9.0%) |
| 60 to 64 Years | 1,944 (64.4%) | 43 (2.2%) |
| 65 to 74 Years | 1,461 (30.1%) | 115 (7.9%) |
| 75 Years and over | 307 (6.6%) | 59 (19.2%) |
| Total | 21,573 (61.5%) | 2,006 (9.3%) |
Employment Status by Educational Attainment in Hallandale Beach
According to labor force statistics for Hallandale Beach, 79.3% of individuals (17,708) out of the total population between 25 and 64 years of age (22,330) are in the labor force, with 8.2% or 1,452 of them being unemployed. The group with the highest labor force participation rate are those with the educational attainment of college / associate degree, with 85.5% or 5,307 individuals in the labor force. Within the labor force, individuals with college / associate degree education have the highest percentage of unemployment, with 11.9% or 632 of them being unemployed.
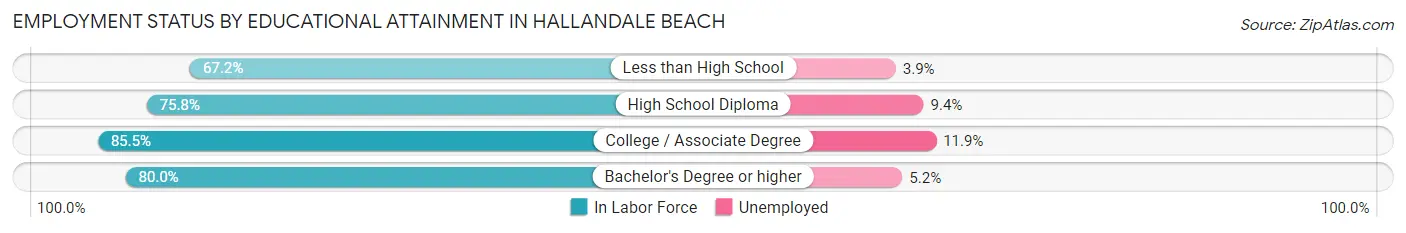
| Educational Attainment | In Labor Force | Unemployed |
| Less than High School | 1,322 (67.2%) | 77 (3.9%) |
| High School Diploma | 4,541 (75.8%) | 563 (9.4%) |
| College / Associate Degree | 5,307 (85.5%) | 739 (11.9%) |
| Bachelor's Degree or higher | 6,532 (80.0%) | 425 (5.2%) |
| Total | 17,708 (79.3%) | 1,831 (8.2%) |
Employment Occupations by Sex in Hallandale Beach
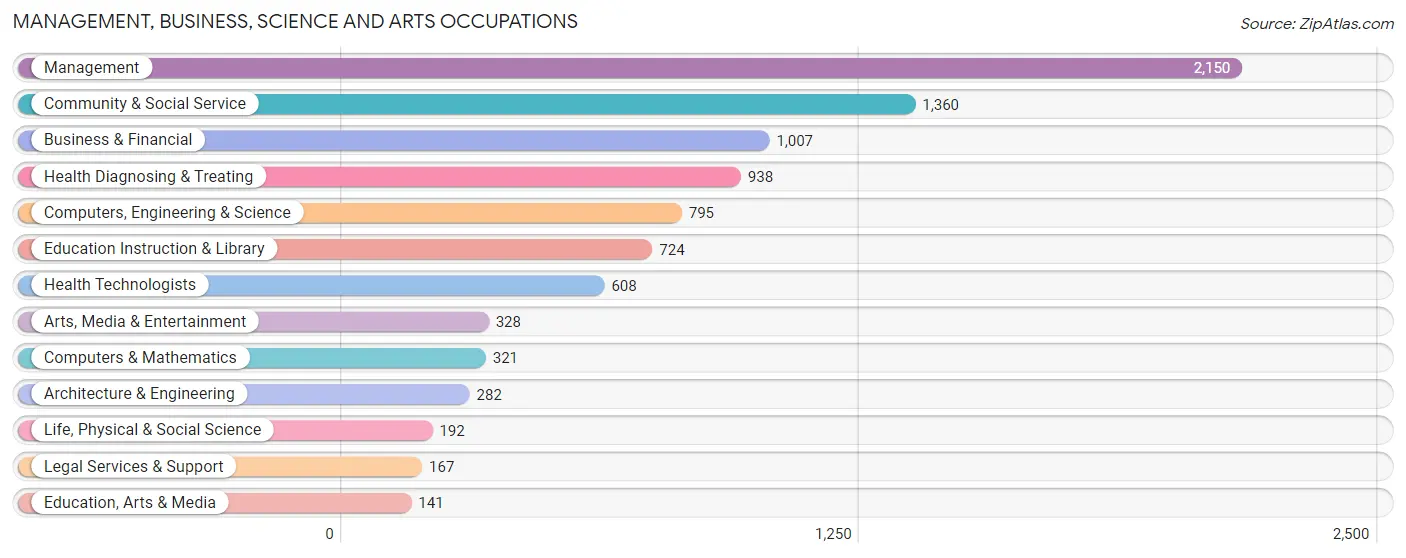
Management, Business, Science and Arts Occupations
The most common Management, Business, Science and Arts occupations in Hallandale Beach are Management (2,150 | 11.0%), Community & Social Service (1,360 | 7.0%), Business & Financial (1,007 | 5.1%), Health Diagnosing & Treating (938 | 4.8%), and Computers, Engineering & Science (795 | 4.1%).
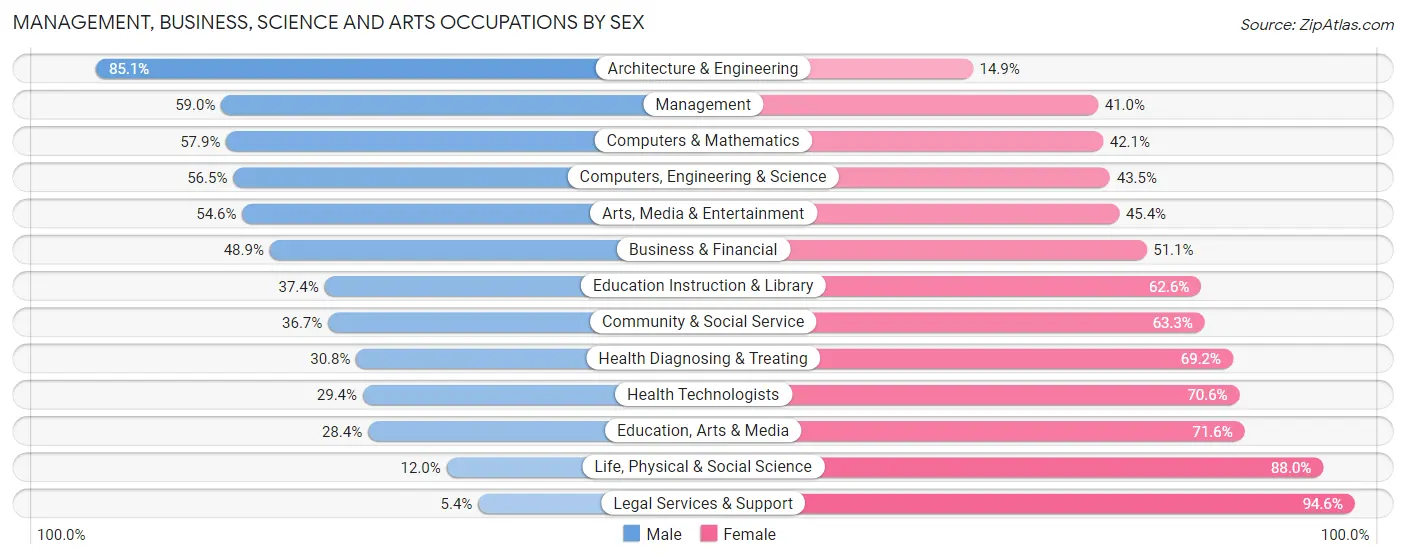
Management, Business, Science and Arts Occupations by Sex
Within the Management, Business, Science and Arts occupations in Hallandale Beach, the most male-oriented occupations are Architecture & Engineering (85.1%), Management (59.0%), and Computers & Mathematics (57.9%), while the most female-oriented occupations are Legal Services & Support (94.6%), Life, Physical & Social Science (88.0%), and Education, Arts & Media (71.6%).
| Occupation | Male | Female |
| Management | 1,268 (59.0%) | 882 (41.0%) |
| Business & Financial | 492 (48.9%) | 515 (51.1%) |
| Computers, Engineering & Science | 449 (56.5%) | 346 (43.5%) |
| Computers & Mathematics | 186 (57.9%) | 135 (42.1%) |
| Architecture & Engineering | 240 (85.1%) | 42 (14.9%) |
| Life, Physical & Social Science | 23 (12.0%) | 169 (88.0%) |
| Community & Social Service | 499 (36.7%) | 861 (63.3%) |
| Education, Arts & Media | 40 (28.4%) | 101 (71.6%) |
| Legal Services & Support | 9 (5.4%) | 158 (94.6%) |
| Education Instruction & Library | 271 (37.4%) | 453 (62.6%) |
| Arts, Media & Entertainment | 179 (54.6%) | 149 (45.4%) |
| Health Diagnosing & Treating | 289 (30.8%) | 649 (69.2%) |
| Health Technologists | 179 (29.4%) | 429 (70.6%) |
| Total (Category) | 2,997 (47.9%) | 3,253 (52.0%) |
| Total (Overall) | 9,518 (48.6%) | 10,053 (51.4%) |
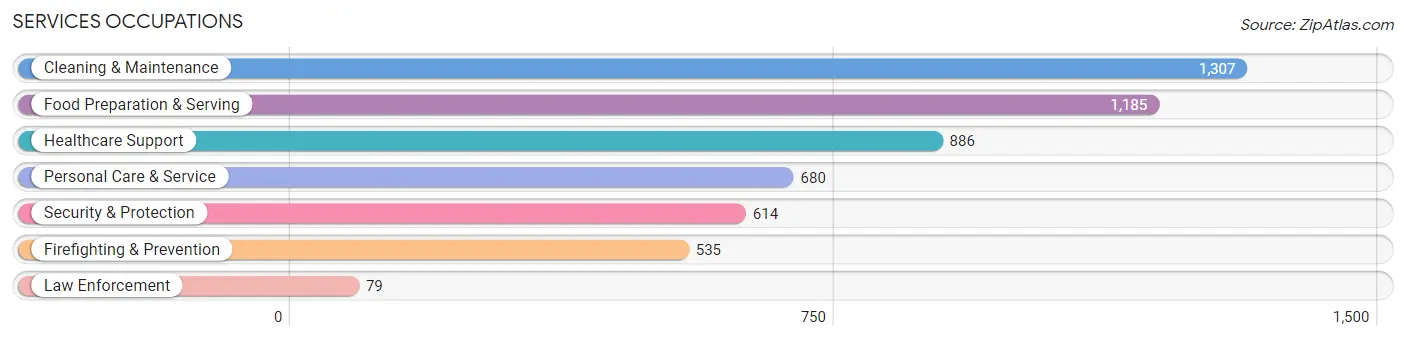
Services Occupations
The most common Services occupations in Hallandale Beach are Cleaning & Maintenance (1,307 | 6.7%), Food Preparation & Serving (1,185 | 6.0%), Healthcare Support (886 | 4.5%), Personal Care & Service (680 | 3.5%), and Security & Protection (614 | 3.1%).
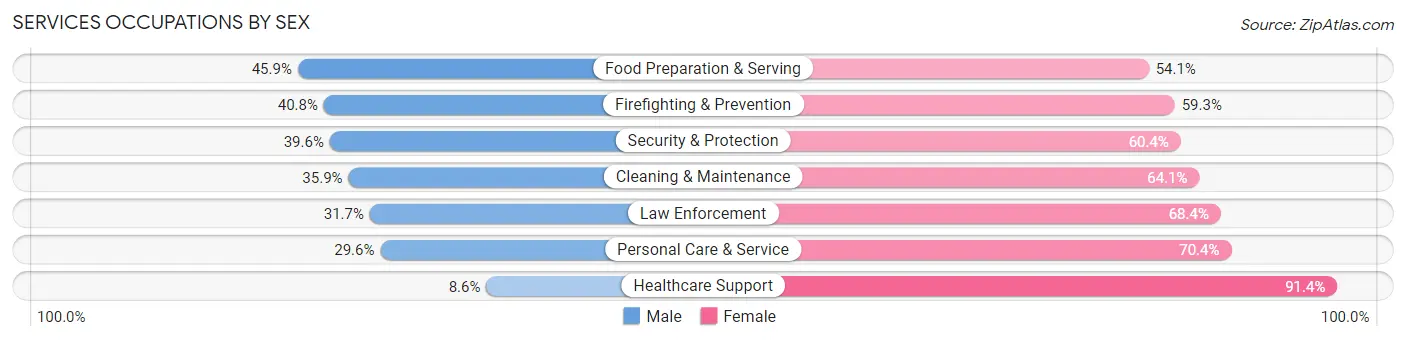
Services Occupations by Sex
Within the Services occupations in Hallandale Beach, the most male-oriented occupations are Food Preparation & Serving (45.9%), Firefighting & Prevention (40.7%), and Security & Protection (39.6%), while the most female-oriented occupations are Healthcare Support (91.4%), Personal Care & Service (70.4%), and Law Enforcement (68.3%).
| Occupation | Male | Female |
| Healthcare Support | 76 (8.6%) | 810 (91.4%) |
| Security & Protection | 243 (39.6%) | 371 (60.4%) |
| Firefighting & Prevention | 218 (40.7%) | 317 (59.3%) |
| Law Enforcement | 25 (31.7%) | 54 (68.3%) |
| Food Preparation & Serving | 544 (45.9%) | 641 (54.1%) |
| Cleaning & Maintenance | 469 (35.9%) | 838 (64.1%) |
| Personal Care & Service | 201 (29.6%) | 479 (70.4%) |
| Total (Category) | 1,533 (32.8%) | 3,139 (67.2%) |
| Total (Overall) | 9,518 (48.6%) | 10,053 (51.4%) |
Sales and Office Occupations
The most common Sales and Office occupations in Hallandale Beach are Sales & Related (2,238 | 11.4%), and Office & Administration (2,026 | 10.3%).
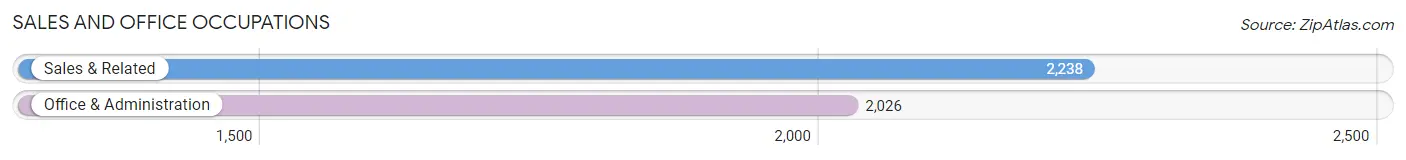
Sales and Office Occupations by Sex
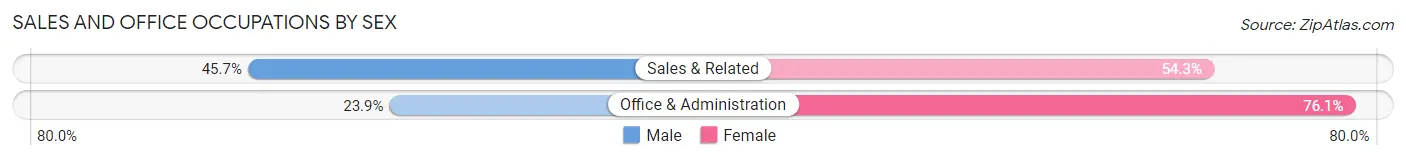
| Occupation | Male | Female |
| Sales & Related | 1,022 (45.7%) | 1,216 (54.3%) |
| Office & Administration | 484 (23.9%) | 1,542 (76.1%) |
| Total (Category) | 1,506 (35.3%) | 2,758 (64.7%) |
| Total (Overall) | 9,518 (48.6%) | 10,053 (51.4%) |
Natural Resources, Construction and Maintenance Occupations
The most common Natural Resources, Construction and Maintenance occupations in Hallandale Beach are Construction & Extraction (1,209 | 6.2%), and Installation, Maintenance & Repair (456 | 2.3%).
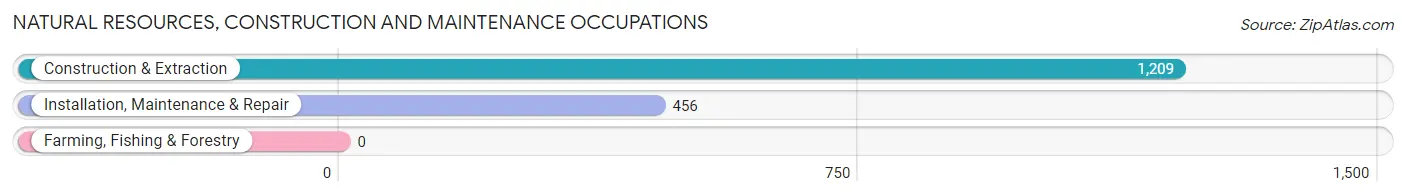
Natural Resources, Construction and Maintenance Occupations by Sex
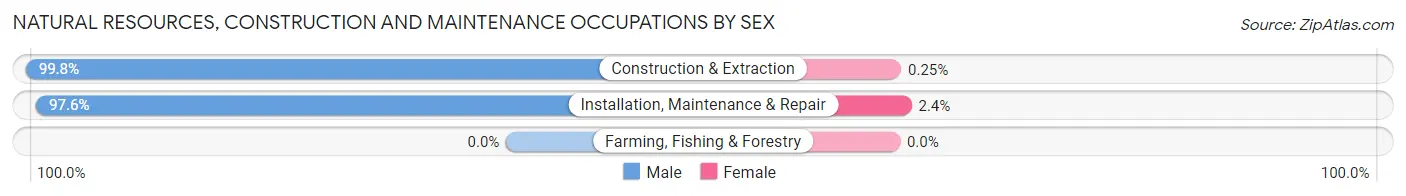
| Occupation | Male | Female |
| Farming, Fishing & Forestry | 0 (0.0%) | 0 (0.0%) |
| Construction & Extraction | 1,206 (99.8%) | 3 (0.3%) |
| Installation, Maintenance & Repair | 445 (97.6%) | 11 (2.4%) |
| Total (Category) | 1,651 (99.2%) | 14 (0.8%) |
| Total (Overall) | 9,518 (48.6%) | 10,053 (51.4%) |
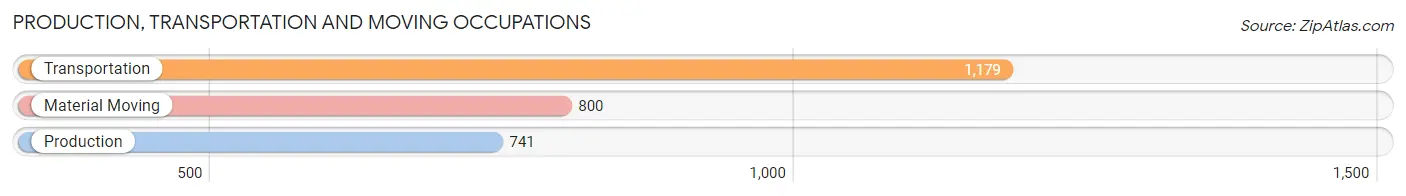
Production, Transportation and Moving Occupations
The most common Production, Transportation and Moving occupations in Hallandale Beach are Transportation (1,179 | 6.0%), Material Moving (800 | 4.1%), and Production (741 | 3.8%).
Production, Transportation and Moving Occupations by Sex
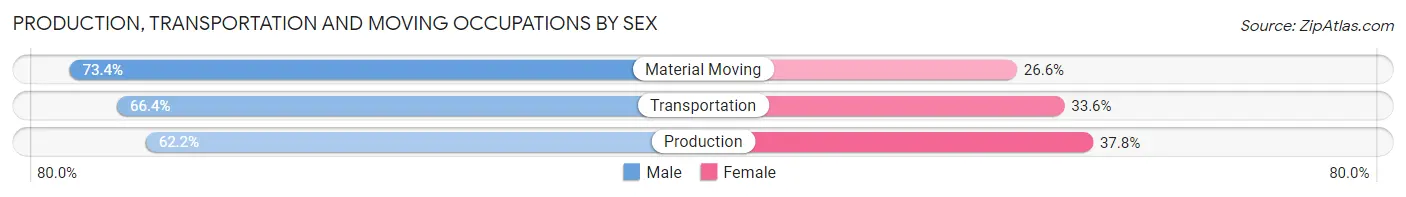
| Occupation | Male | Female |
| Production | 461 (62.2%) | 280 (37.8%) |
| Transportation | 783 (66.4%) | 396 (33.6%) |
| Material Moving | 587 (73.4%) | 213 (26.6%) |
| Total (Category) | 1,831 (67.3%) | 889 (32.7%) |
| Total (Overall) | 9,518 (48.6%) | 10,053 (51.4%) |
Employment Industries by Sex in Hallandale Beach
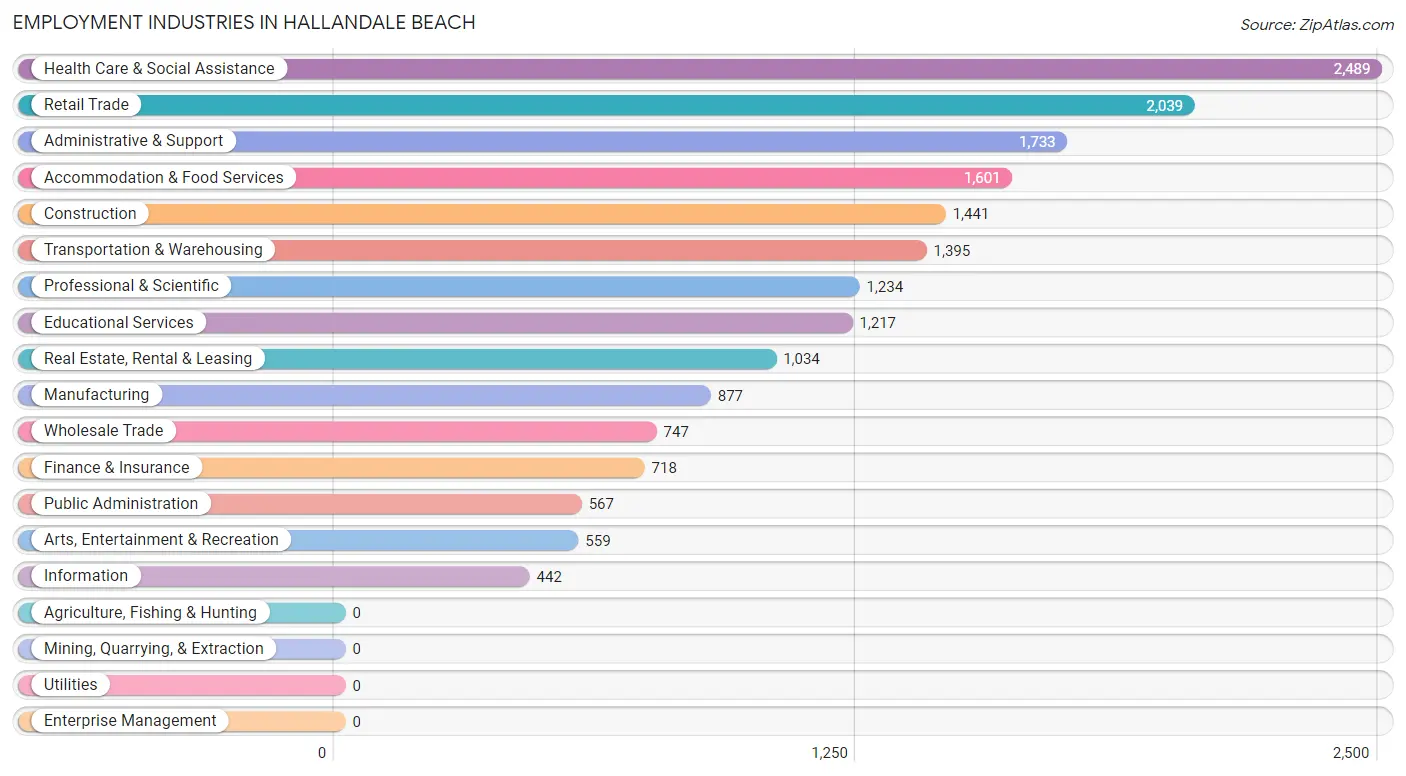
Employment Industries in Hallandale Beach
The major employment industries in Hallandale Beach include Health Care & Social Assistance (2,489 | 12.7%), Retail Trade (2,039 | 10.4%), Administrative & Support (1,733 | 8.8%), Accommodation & Food Services (1,601 | 8.2%), and Construction (1,441 | 7.4%).
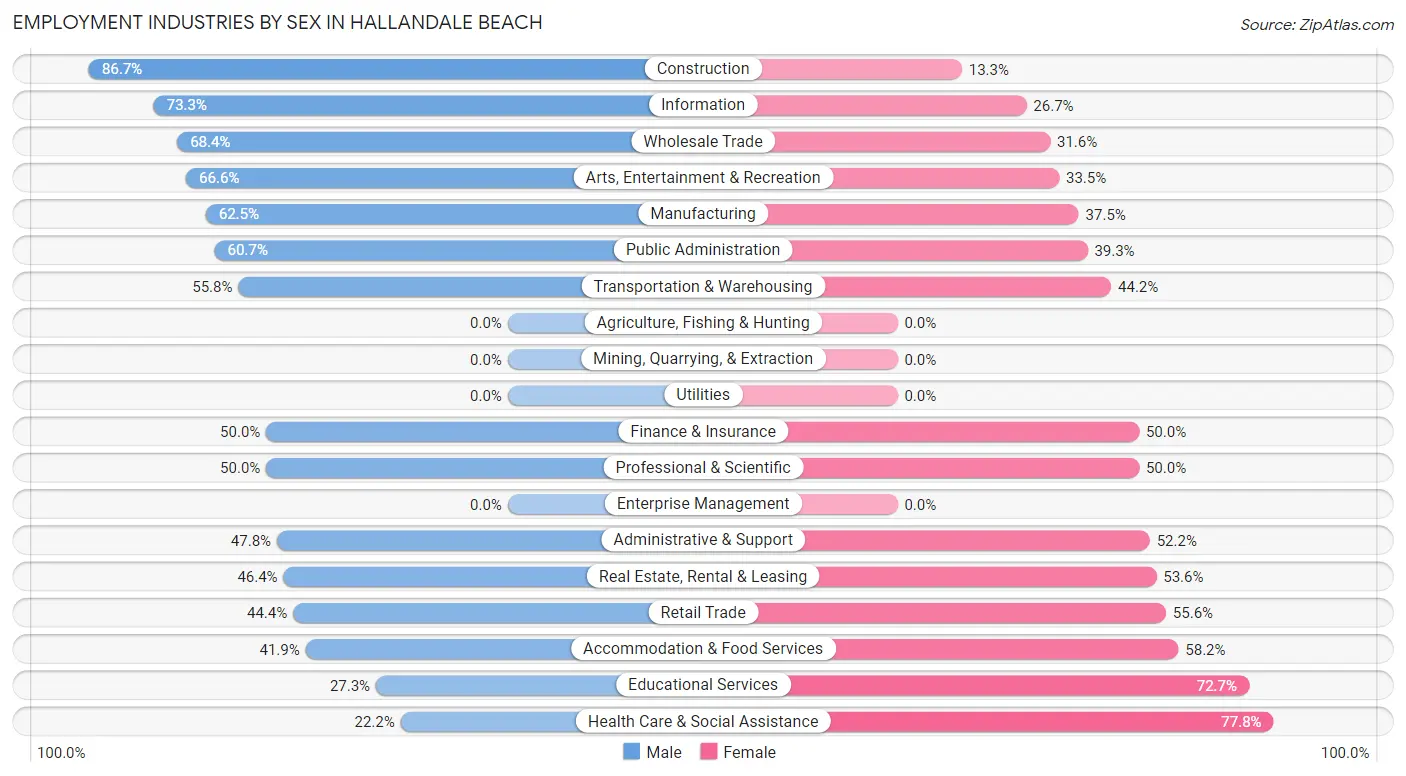
Employment Industries by Sex in Hallandale Beach
The Hallandale Beach industries that see more men than women are Construction (86.7%), Information (73.3%), and Wholesale Trade (68.4%), whereas the industries that tend to have a higher number of women are Health Care & Social Assistance (77.8%), Educational Services (72.7%), and Accommodation & Food Services (58.2%).
| Industry | Male | Female |
| Agriculture, Fishing & Hunting | 0 (0.0%) | 0 (0.0%) |
| Mining, Quarrying, & Extraction | 0 (0.0%) | 0 (0.0%) |
| Construction | 1,249 (86.7%) | 192 (13.3%) |
| Manufacturing | 548 (62.5%) | 329 (37.5%) |
| Wholesale Trade | 511 (68.4%) | 236 (31.6%) |
| Retail Trade | 906 (44.4%) | 1,133 (55.6%) |
| Transportation & Warehousing | 778 (55.8%) | 617 (44.2%) |
| Utilities | 0 (0.0%) | 0 (0.0%) |
| Information | 324 (73.3%) | 118 (26.7%) |
| Finance & Insurance | 359 (50.0%) | 359 (50.0%) |
| Real Estate, Rental & Leasing | 480 (46.4%) | 554 (53.6%) |
| Professional & Scientific | 617 (50.0%) | 617 (50.0%) |
| Enterprise Management | 0 (0.0%) | 0 (0.0%) |
| Administrative & Support | 828 (47.8%) | 905 (52.2%) |
| Educational Services | 332 (27.3%) | 885 (72.7%) |
| Health Care & Social Assistance | 552 (22.2%) | 1,937 (77.8%) |
| Arts, Entertainment & Recreation | 372 (66.5%) | 187 (33.5%) |
| Accommodation & Food Services | 670 (41.8%) | 931 (58.2%) |
| Public Administration | 344 (60.7%) | 223 (39.3%) |
| Total | 9,518 (48.6%) | 10,053 (51.4%) |
Education in Hallandale Beach
School Enrollment in Hallandale Beach
The most common levels of schooling among the 6,427 students in Hallandale Beach are elementary school (1,381 | 21.5%), college / undergraduate (1,352 | 21.0%), and high school (1,225 | 19.1%).
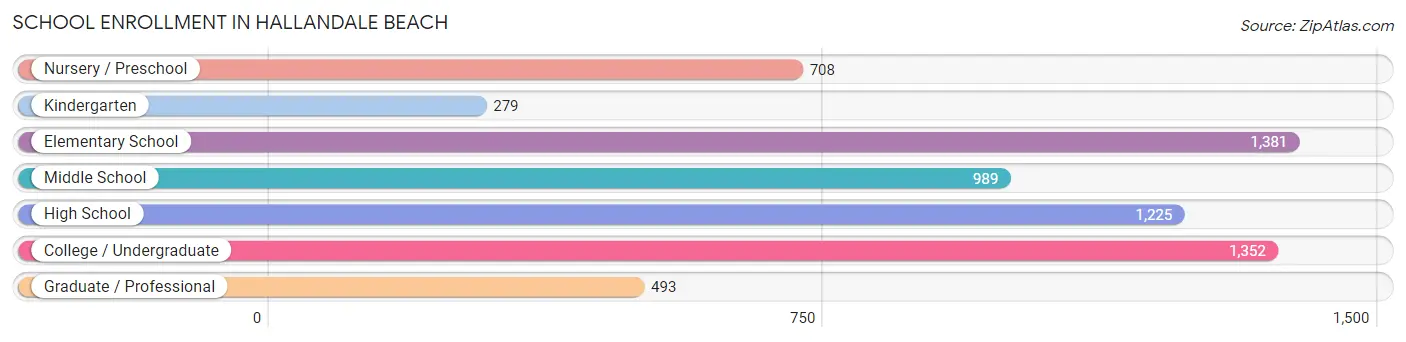
| School Level | # Students | % Students |
| Nursery / Preschool | 708 | 11.0% |
| Kindergarten | 279 | 4.3% |
| Elementary School | 1,381 | 21.5% |
| Middle School | 989 | 15.4% |
| High School | 1,225 | 19.1% |
| College / Undergraduate | 1,352 | 21.0% |
| Graduate / Professional | 493 | 7.7% |
| Total | 6,427 | 100.0% |
School Enrollment by Age by Funding Source in Hallandale Beach
Out of a total of 6,427 students who are enrolled in schools in Hallandale Beach, 1,485 (23.1%) attend a private institution, while the remaining 4,942 (76.9%) are enrolled in public schools. The age group of 3 to 4 year olds has the highest likelihood of being enrolled in private schools, with 293 (51.1% in the age bracket) enrolled. Conversely, the age group of 5 to 9 year old has the lowest likelihood of being enrolled in a private school, with 1,503 (95.4% in the age bracket) attending a public institution.
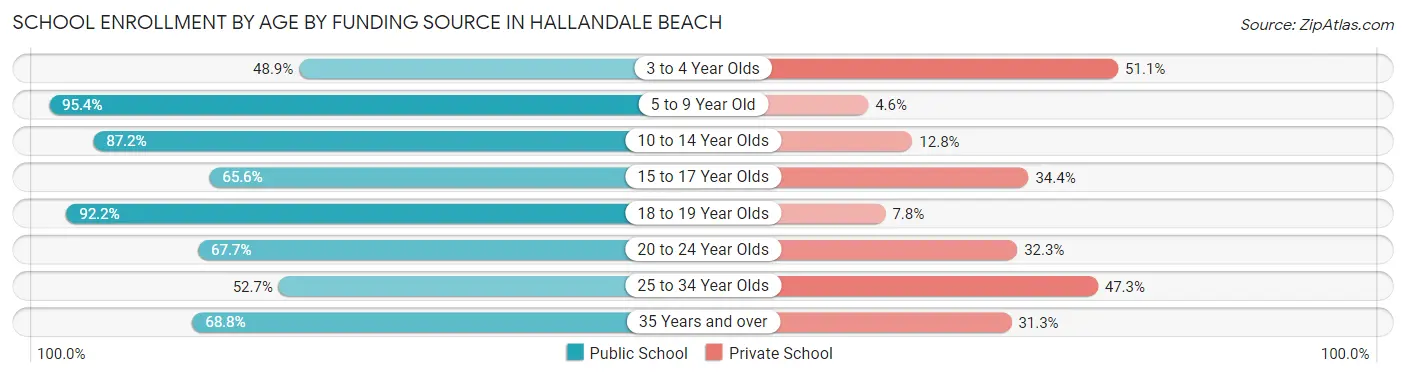
| Age Bracket | Public School | Private School |
| 3 to 4 Year Olds | 280 (48.9%) | 293 (51.1%) |
| 5 to 9 Year Old | 1,503 (95.4%) | 72 (4.6%) |
| 10 to 14 Year Olds | 1,104 (87.2%) | 162 (12.8%) |
| 15 to 17 Year Olds | 505 (65.6%) | 265 (34.4%) |
| 18 to 19 Year Olds | 462 (92.2%) | 39 (7.8%) |
| 20 to 24 Year Olds | 379 (67.7%) | 181 (32.3%) |
| 25 to 34 Year Olds | 336 (52.7%) | 302 (47.3%) |
| 35 Years and over | 374 (68.8%) | 170 (31.2%) |
| Total | 4,942 (76.9%) | 1,485 (23.1%) |
Educational Attainment by Field of Study in Hallandale Beach
Business (2,573 | 21.7%), engineering (1,992 | 16.8%), education (1,328 | 11.2%), science & technology (1,100 | 9.3%), and bio, nature & agricultural (644 | 5.4%) are the most common fields of study among 11,857 individuals in Hallandale Beach who have obtained a bachelor's degree or higher.
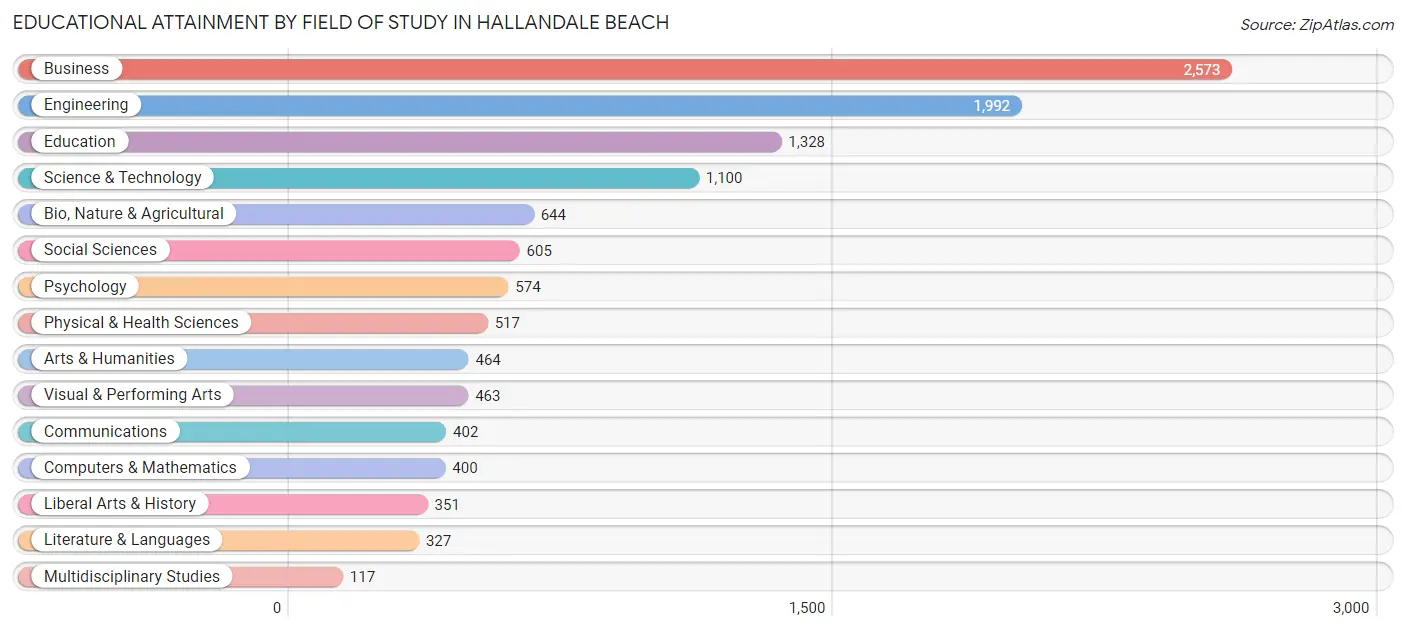
| Field of Study | # Graduates | % Graduates |
| Computers & Mathematics | 400 | 3.4% |
| Bio, Nature & Agricultural | 644 | 5.4% |
| Physical & Health Sciences | 517 | 4.4% |
| Psychology | 574 | 4.8% |
| Social Sciences | 605 | 5.1% |
| Engineering | 1,992 | 16.8% |
| Multidisciplinary Studies | 117 | 1.0% |
| Science & Technology | 1,100 | 9.3% |
| Business | 2,573 | 21.7% |
| Education | 1,328 | 11.2% |
| Literature & Languages | 327 | 2.8% |
| Liberal Arts & History | 351 | 3.0% |
| Visual & Performing Arts | 463 | 3.9% |
| Communications | 402 | 3.4% |
| Arts & Humanities | 464 | 3.9% |
| Total | 11,857 | 100.0% |
Transportation & Commute in Hallandale Beach
Vehicle Availability by Sex in Hallandale Beach
The most prevalent vehicle ownership categories in Hallandale Beach are males with 2 vehicles (4,072, accounting for 43.9%) and females with 2 vehicles (3,415, making up 41.9%).
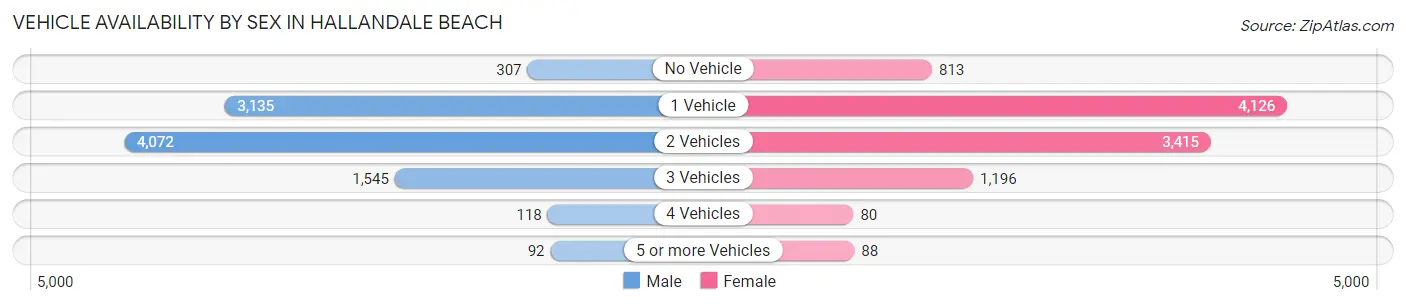
| Vehicles Available | Male | Female |
| No Vehicle | 307 (3.3%) | 813 (8.4%) |
| 1 Vehicle | 3,135 (33.8%) | 4,126 (42.5%) |
| 2 Vehicles | 4,072 (43.9%) | 3,415 (35.1%) |
| 3 Vehicles | 1,545 (16.7%) | 1,196 (12.3%) |
| 4 Vehicles | 118 (1.3%) | 80 (0.8%) |
| 5 or more Vehicles | 92 (1.0%) | 88 (0.9%) |
| Total | 9,269 (100.0%) | 9,718 (100.0%) |
Commute Time in Hallandale Beach
The most frequently occuring commute durations in Hallandale Beach are 30 to 34 minutes (2,895 commuters, 17.2%), 45 to 59 minutes (2,320 commuters, 13.8%), and 15 to 19 minutes (2,234 commuters, 13.2%).
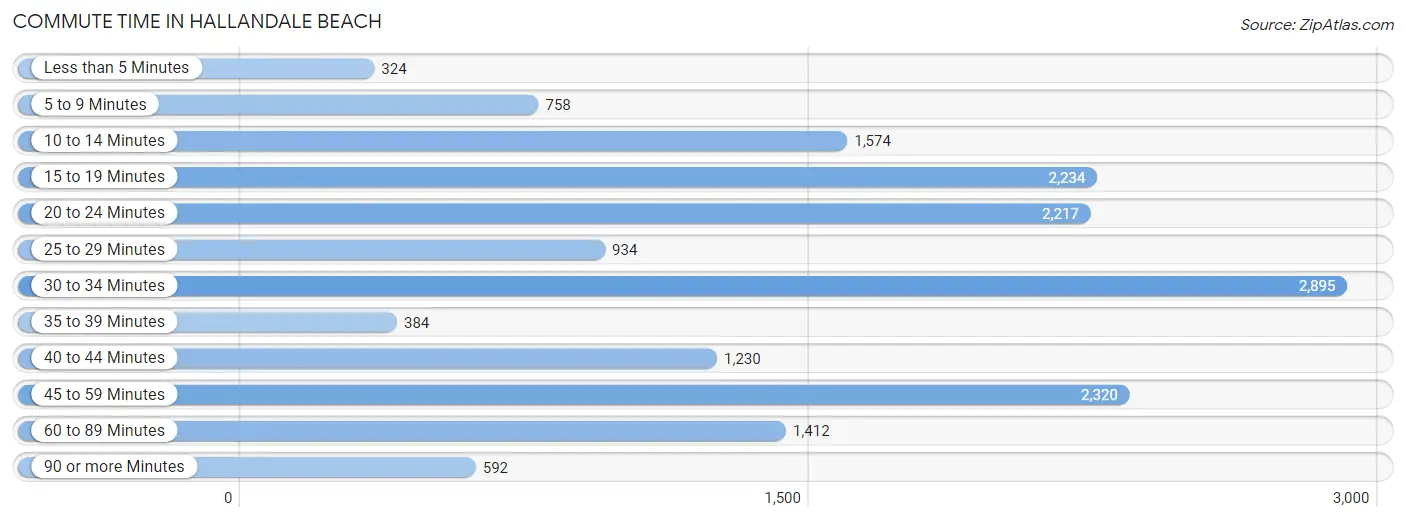
| Commute Time | # Commuters | % Commuters |
| Less than 5 Minutes | 324 | 1.9% |
| 5 to 9 Minutes | 758 | 4.5% |
| 10 to 14 Minutes | 1,574 | 9.3% |
| 15 to 19 Minutes | 2,234 | 13.2% |
| 20 to 24 Minutes | 2,217 | 13.1% |
| 25 to 29 Minutes | 934 | 5.5% |
| 30 to 34 Minutes | 2,895 | 17.2% |
| 35 to 39 Minutes | 384 | 2.3% |
| 40 to 44 Minutes | 1,230 | 7.3% |
| 45 to 59 Minutes | 2,320 | 13.8% |
| 60 to 89 Minutes | 1,412 | 8.4% |
| 90 or more Minutes | 592 | 3.5% |
Commute Time by Sex in Hallandale Beach
The most common commute times in Hallandale Beach are 30 to 34 minutes (1,592 commuters, 19.1%) for males and 15 to 19 minutes (1,398 commuters, 16.4%) for females.
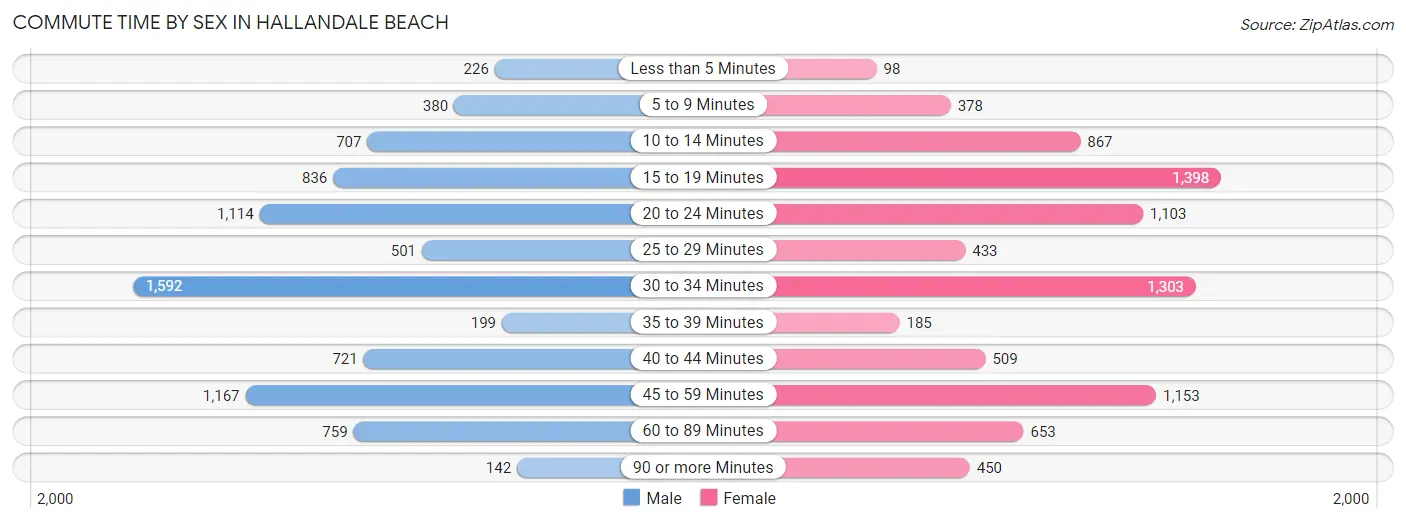
| Commute Time | Male | Female |
| Less than 5 Minutes | 226 (2.7%) | 98 (1.1%) |
| 5 to 9 Minutes | 380 (4.5%) | 378 (4.4%) |
| 10 to 14 Minutes | 707 (8.5%) | 867 (10.2%) |
| 15 to 19 Minutes | 836 (10.0%) | 1,398 (16.4%) |
| 20 to 24 Minutes | 1,114 (13.4%) | 1,103 (12.9%) |
| 25 to 29 Minutes | 501 (6.0%) | 433 (5.1%) |
| 30 to 34 Minutes | 1,592 (19.1%) | 1,303 (15.3%) |
| 35 to 39 Minutes | 199 (2.4%) | 185 (2.2%) |
| 40 to 44 Minutes | 721 (8.6%) | 509 (6.0%) |
| 45 to 59 Minutes | 1,167 (14.0%) | 1,153 (13.5%) |
| 60 to 89 Minutes | 759 (9.1%) | 653 (7.7%) |
| 90 or more Minutes | 142 (1.7%) | 450 (5.3%) |
Time of Departure to Work by Sex in Hallandale Beach
The most frequent times of departure to work in Hallandale Beach are 8:00 AM to 8:29 AM (1,303, 15.6%) for males and 9:00 AM to 9:59 AM (1,311, 15.4%) for females.
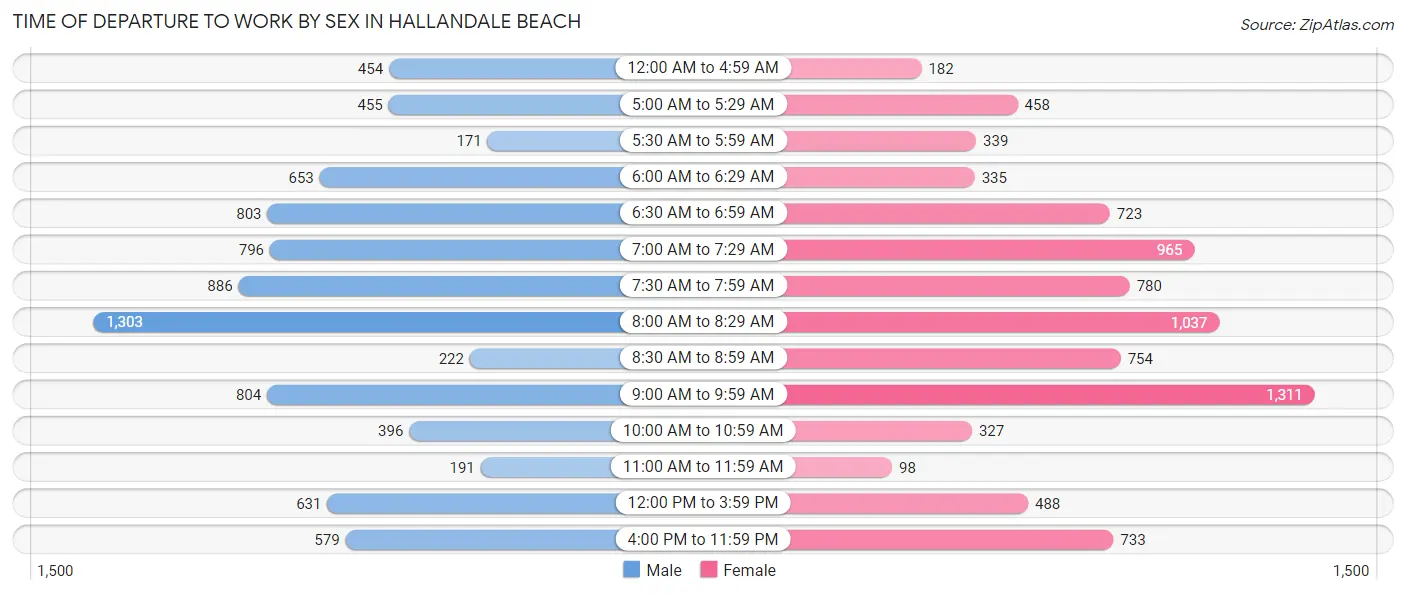
| Time of Departure | Male | Female |
| 12:00 AM to 4:59 AM | 454 (5.4%) | 182 (2.1%) |
| 5:00 AM to 5:29 AM | 455 (5.4%) | 458 (5.4%) |
| 5:30 AM to 5:59 AM | 171 (2.1%) | 339 (4.0%) |
| 6:00 AM to 6:29 AM | 653 (7.8%) | 335 (3.9%) |
| 6:30 AM to 6:59 AM | 803 (9.6%) | 723 (8.5%) |
| 7:00 AM to 7:29 AM | 796 (9.5%) | 965 (11.3%) |
| 7:30 AM to 7:59 AM | 886 (10.6%) | 780 (9.1%) |
| 8:00 AM to 8:29 AM | 1,303 (15.6%) | 1,037 (12.2%) |
| 8:30 AM to 8:59 AM | 222 (2.7%) | 754 (8.8%) |
| 9:00 AM to 9:59 AM | 804 (9.6%) | 1,311 (15.4%) |
| 10:00 AM to 10:59 AM | 396 (4.8%) | 327 (3.8%) |
| 11:00 AM to 11:59 AM | 191 (2.3%) | 98 (1.1%) |
| 12:00 PM to 3:59 PM | 631 (7.6%) | 488 (5.7%) |
| 4:00 PM to 11:59 PM | 579 (6.9%) | 733 (8.6%) |
| Total | 8,344 (100.0%) | 8,530 (100.0%) |
Housing Occupancy in Hallandale Beach
Occupancy by Ownership in Hallandale Beach
Of the total 19,581 dwellings in Hallandale Beach, owner-occupied units account for 10,399 (53.1%), while renter-occupied units make up 9,182 (46.9%).
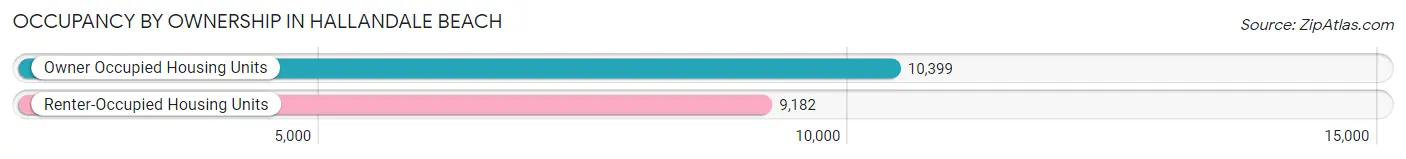
| Occupancy | # Housing Units | % Housing Units |
| Owner Occupied Housing Units | 10,399 | 53.1% |
| Renter-Occupied Housing Units | 9,182 | 46.9% |
| Total Occupied Housing Units | 19,581 | 100.0% |
Occupancy by Household Size in Hallandale Beach
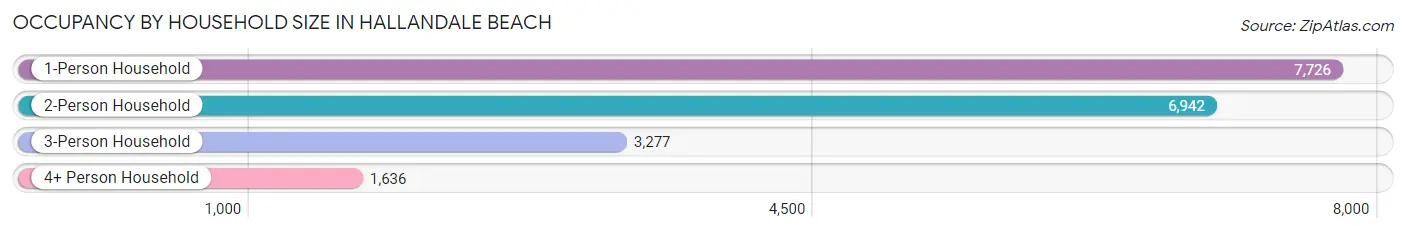
| Household Size | # Housing Units | % Housing Units |
| 1-Person Household | 7,726 | 39.5% |
| 2-Person Household | 6,942 | 35.4% |
| 3-Person Household | 3,277 | 16.7% |
| 4+ Person Household | 1,636 | 8.4% |
| Total Housing Units | 19,581 | 100.0% |
Occupancy by Ownership by Household Size in Hallandale Beach
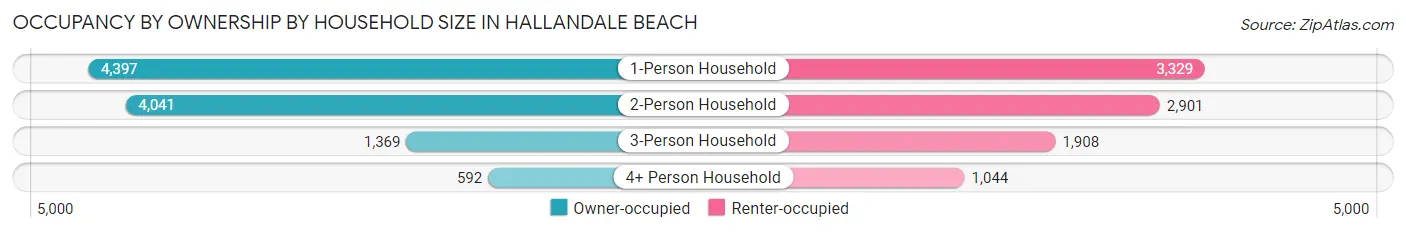
| Household Size | Owner-occupied | Renter-occupied |
| 1-Person Household | 4,397 (56.9%) | 3,329 (43.1%) |
| 2-Person Household | 4,041 (58.2%) | 2,901 (41.8%) |
| 3-Person Household | 1,369 (41.8%) | 1,908 (58.2%) |
| 4+ Person Household | 592 (36.2%) | 1,044 (63.8%) |
| Total Housing Units | 10,399 (53.1%) | 9,182 (46.9%) |
Occupancy by Educational Attainment in Hallandale Beach
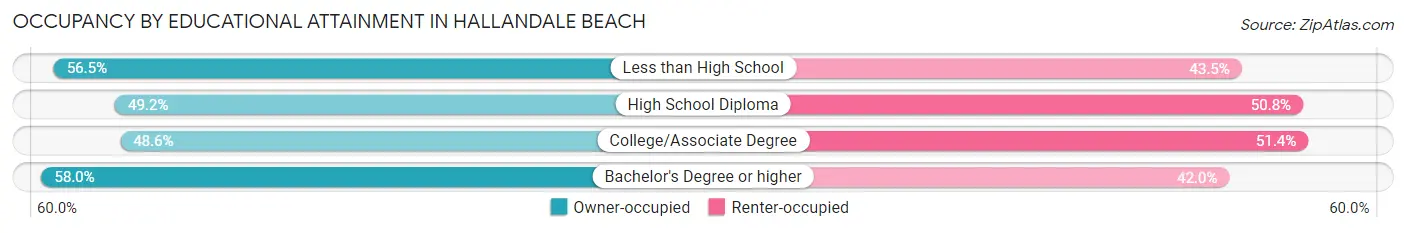
| Household Size | Owner-occupied | Renter-occupied |
| Less than High School | 1,112 (56.5%) | 855 (43.5%) |
| High School Diploma | 2,526 (49.2%) | 2,604 (50.8%) |
| College/Associate Degree | 2,486 (48.6%) | 2,627 (51.4%) |
| Bachelor's Degree or higher | 4,275 (58.0%) | 3,096 (42.0%) |
Occupancy by Age of Householder in Hallandale Beach
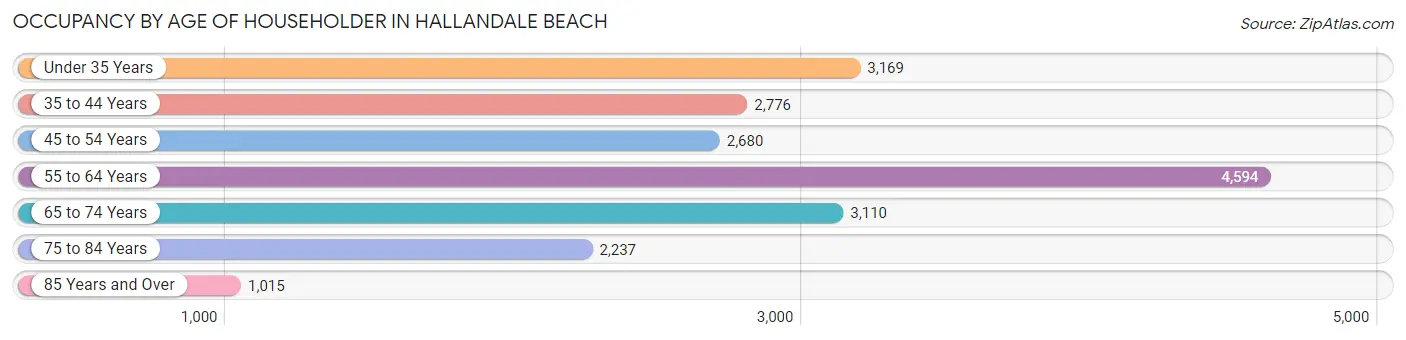
| Age Bracket | # Households | % Households |
| Under 35 Years | 3,169 | 16.2% |
| 35 to 44 Years | 2,776 | 14.2% |
| 45 to 54 Years | 2,680 | 13.7% |
| 55 to 64 Years | 4,594 | 23.5% |
| 65 to 74 Years | 3,110 | 15.9% |
| 75 to 84 Years | 2,237 | 11.4% |
| 85 Years and Over | 1,015 | 5.2% |
| Total | 19,581 | 100.0% |
Housing Finances in Hallandale Beach
Median Income by Occupancy in Hallandale Beach
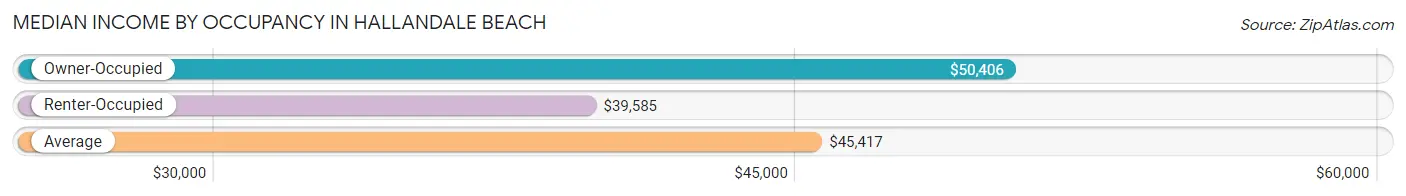
| Occupancy Type | # Households | Median Income |
| Owner-Occupied | 10,399 (53.1%) | $50,406 |
| Renter-Occupied | 9,182 (46.9%) | $39,585 |
| Average | 19,581 (100.0%) | $45,417 |
Occupancy by Householder Income Bracket in Hallandale Beach
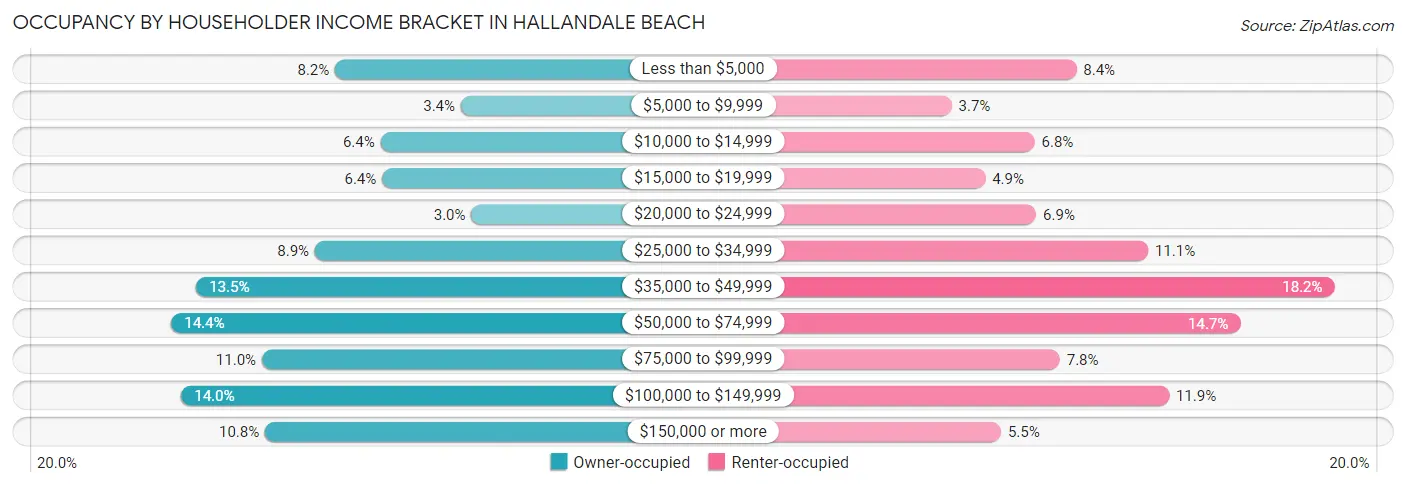
| Income Bracket | Owner-occupied | Renter-occupied |
| Less than $5,000 | 850 (8.2%) | 772 (8.4%) |
| $5,000 to $9,999 | 352 (3.4%) | 336 (3.7%) |
| $10,000 to $14,999 | 670 (6.4%) | 626 (6.8%) |
| $15,000 to $19,999 | 663 (6.4%) | 454 (4.9%) |
| $20,000 to $24,999 | 310 (3.0%) | 632 (6.9%) |
| $25,000 to $34,999 | 930 (8.9%) | 1,023 (11.1%) |
| $35,000 to $49,999 | 1,400 (13.5%) | 1,675 (18.2%) |
| $50,000 to $74,999 | 1,498 (14.4%) | 1,345 (14.6%) |
| $75,000 to $99,999 | 1,140 (11.0%) | 714 (7.8%) |
| $100,000 to $149,999 | 1,459 (14.0%) | 1,096 (11.9%) |
| $150,000 or more | 1,127 (10.8%) | 509 (5.5%) |
| Total | 10,399 (100.0%) | 9,182 (100.0%) |
Monthly Housing Cost Tiers in Hallandale Beach
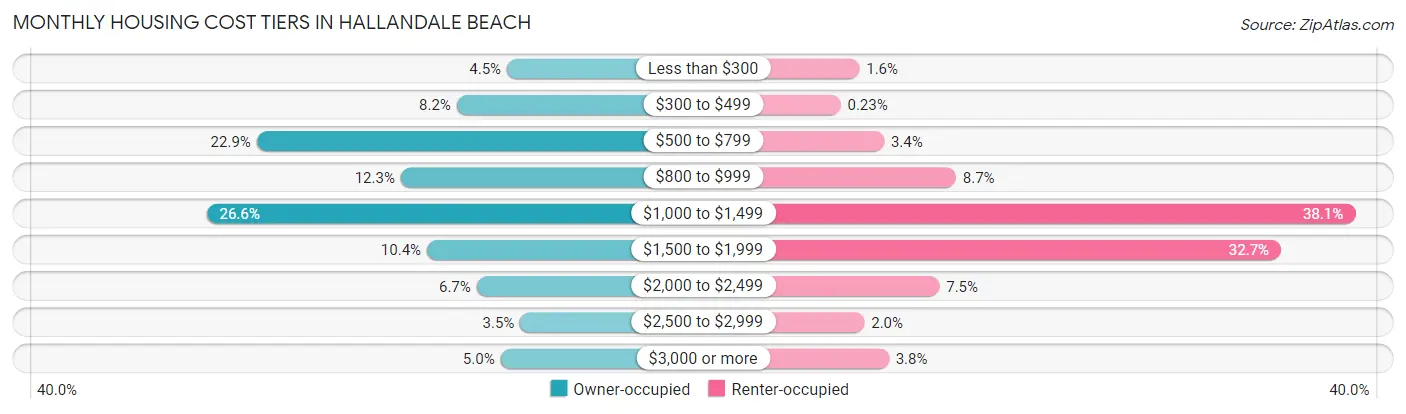
| Monthly Cost | Owner-occupied | Renter-occupied |
| Less than $300 | 466 (4.5%) | 148 (1.6%) |
| $300 to $499 | 851 (8.2%) | 21 (0.2%) |
| $500 to $799 | 2,382 (22.9%) | 315 (3.4%) |
| $800 to $999 | 1,279 (12.3%) | 801 (8.7%) |
| $1,000 to $1,499 | 2,766 (26.6%) | 3,500 (38.1%) |
| $1,500 to $1,999 | 1,078 (10.4%) | 2,999 (32.7%) |
| $2,000 to $2,499 | 698 (6.7%) | 689 (7.5%) |
| $2,500 to $2,999 | 364 (3.5%) | 182 (2.0%) |
| $3,000 or more | 515 (5.0%) | 347 (3.8%) |
| Total | 10,399 (100.0%) | 9,182 (100.0%) |
Physical Housing Characteristics in Hallandale Beach
Housing Structures in Hallandale Beach
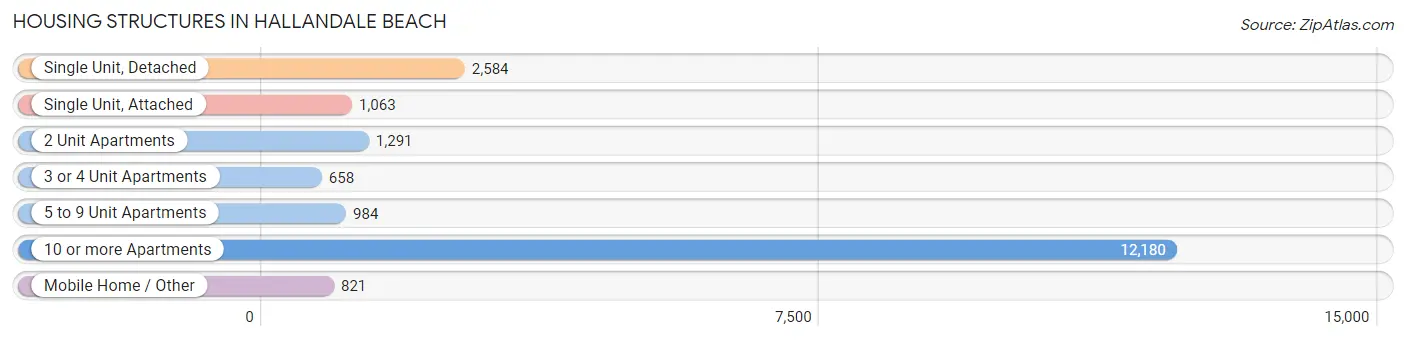
| Structure Type | # Housing Units | % Housing Units |
| Single Unit, Detached | 2,584 | 13.2% |
| Single Unit, Attached | 1,063 | 5.4% |
| 2 Unit Apartments | 1,291 | 6.6% |
| 3 or 4 Unit Apartments | 658 | 3.4% |
| 5 to 9 Unit Apartments | 984 | 5.0% |
| 10 or more Apartments | 12,180 | 62.2% |
| Mobile Home / Other | 821 | 4.2% |
| Total | 19,581 | 100.0% |
Housing Structures by Occupancy in Hallandale Beach
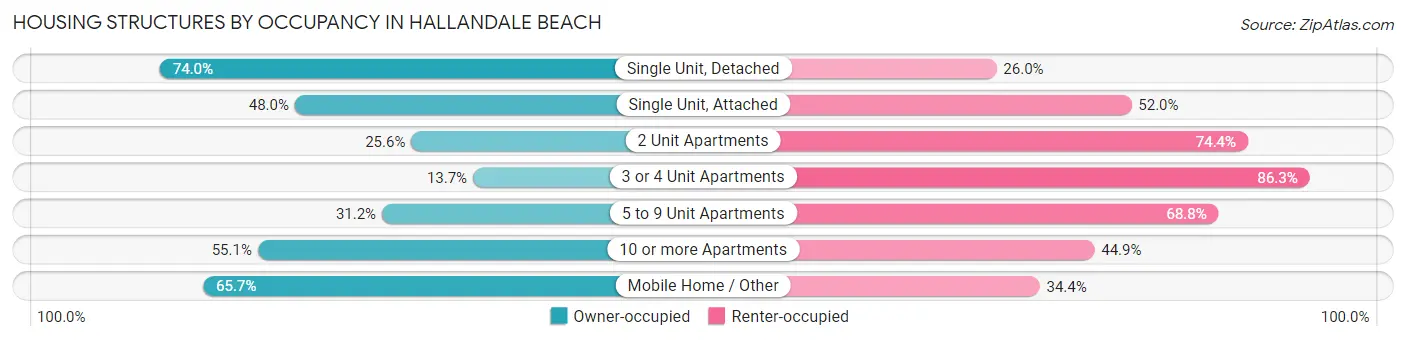
| Structure Type | Owner-occupied | Renter-occupied |
| Single Unit, Detached | 1,911 (74.0%) | 673 (26.0%) |
| Single Unit, Attached | 510 (48.0%) | 553 (52.0%) |
| 2 Unit Apartments | 330 (25.6%) | 961 (74.4%) |
| 3 or 4 Unit Apartments | 90 (13.7%) | 568 (86.3%) |
| 5 to 9 Unit Apartments | 307 (31.2%) | 677 (68.8%) |
| 10 or more Apartments | 6,712 (55.1%) | 5,468 (44.9%) |
| Mobile Home / Other | 539 (65.6%) | 282 (34.4%) |
| Total | 10,399 (53.1%) | 9,182 (46.9%) |
Housing Structures by Number of Rooms in Hallandale Beach
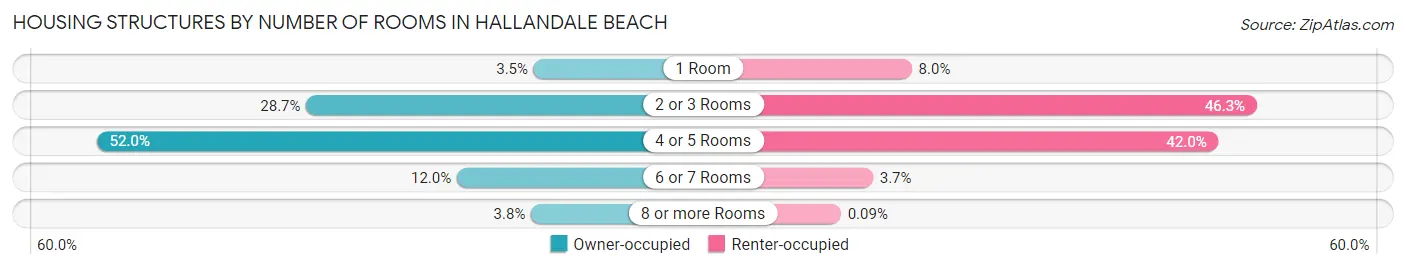
| Number of Rooms | Owner-occupied | Renter-occupied |
| 1 Room | 362 (3.5%) | 731 (8.0%) |
| 2 or 3 Rooms | 2,988 (28.7%) | 4,249 (46.3%) |
| 4 or 5 Rooms | 5,408 (52.0%) | 3,859 (42.0%) |
| 6 or 7 Rooms | 1,249 (12.0%) | 335 (3.6%) |
| 8 or more Rooms | 392 (3.8%) | 8 (0.1%) |
| Total | 10,399 (100.0%) | 9,182 (100.0%) |
Housing Structure by Heating Type in Hallandale Beach
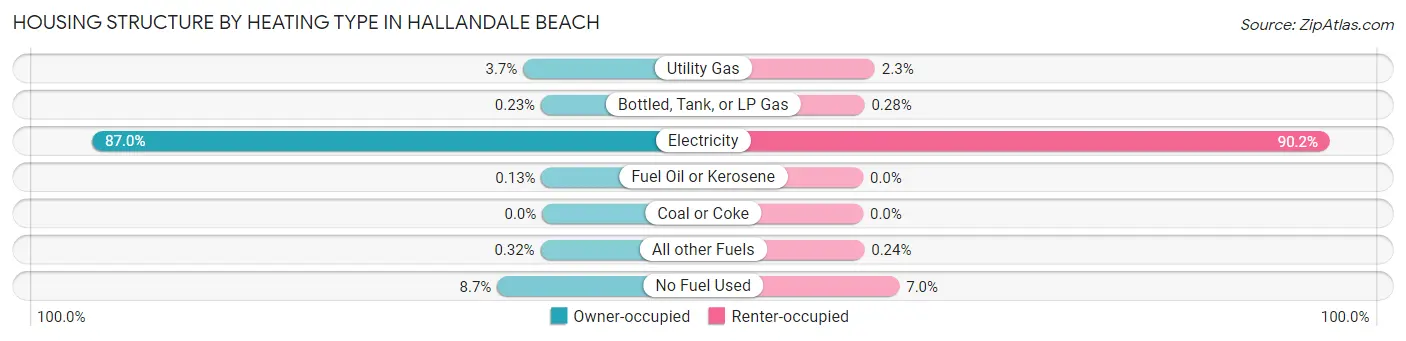
| Heating Type | Owner-occupied | Renter-occupied |
| Utility Gas | 382 (3.7%) | 210 (2.3%) |
| Bottled, Tank, or LP Gas | 24 (0.2%) | 26 (0.3%) |
| Electricity | 9,043 (87.0%) | 8,281 (90.2%) |
| Fuel Oil or Kerosene | 14 (0.1%) | 0 (0.0%) |
| Coal or Coke | 0 (0.0%) | 0 (0.0%) |
| All other Fuels | 33 (0.3%) | 22 (0.2%) |
| No Fuel Used | 903 (8.7%) | 643 (7.0%) |
| Total | 10,399 (100.0%) | 9,182 (100.0%) |
Household Vehicle Usage in Hallandale Beach
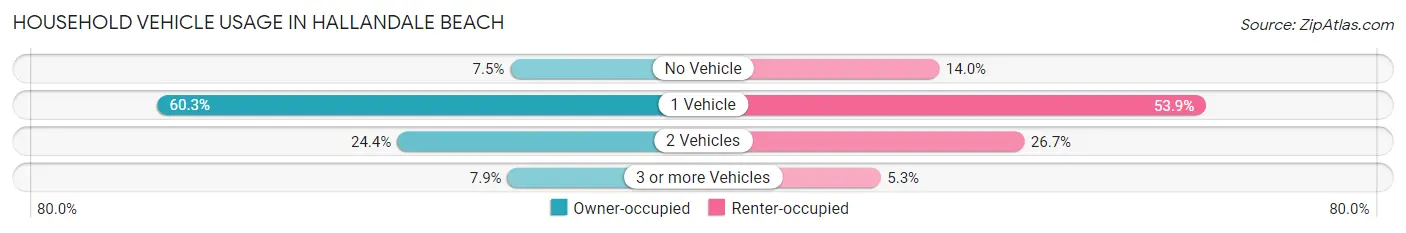
| Vehicles per Household | Owner-occupied | Renter-occupied |
| No Vehicle | 777 (7.5%) | 1,289 (14.0%) |
| 1 Vehicle | 6,267 (60.3%) | 4,953 (53.9%) |
| 2 Vehicles | 2,534 (24.4%) | 2,454 (26.7%) |
| 3 or more Vehicles | 821 (7.9%) | 486 (5.3%) |
| Total | 10,399 (100.0%) | 9,182 (100.0%) |
Real Estate & Mortgages in Hallandale Beach
Real Estate and Mortgage Overview in Hallandale Beach
| Characteristic | Without Mortgage | With Mortgage |
| Housing Units | 6,883 | 3,516 |
| Median Property Value | $239,000 | $256,500 |
| Median Household Income | $39,031 | $693 |
| Monthly Housing Costs | $785 | $409 |
| Real Estate Taxes | $2,596 | $131 |
Property Value by Mortgage Status in Hallandale Beach
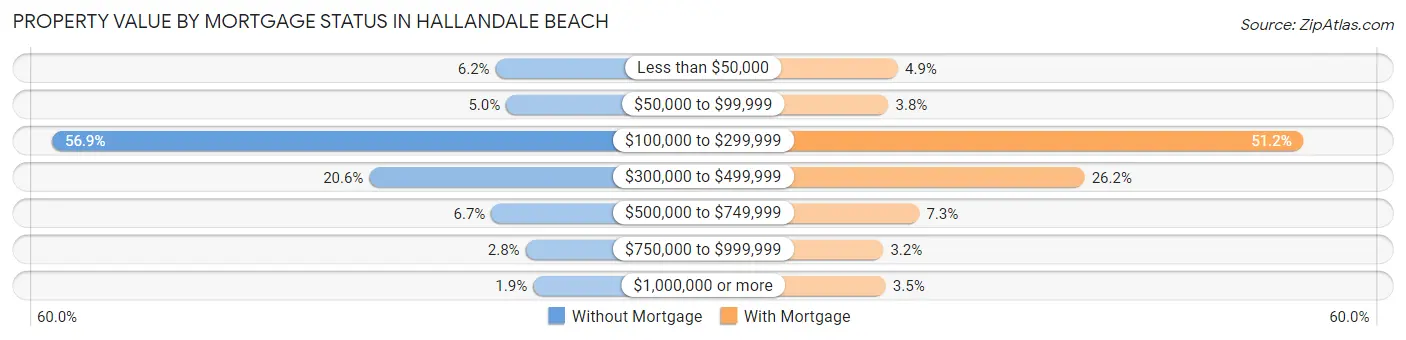
| Property Value | Without Mortgage | With Mortgage |
| Less than $50,000 | 426 (6.2%) | 171 (4.9%) |
| $50,000 to $99,999 | 343 (5.0%) | 133 (3.8%) |
| $100,000 to $299,999 | 3,914 (56.9%) | 1,800 (51.2%) |
| $300,000 to $499,999 | 1,419 (20.6%) | 921 (26.2%) |
| $500,000 to $749,999 | 460 (6.7%) | 257 (7.3%) |
| $750,000 to $999,999 | 190 (2.8%) | 112 (3.2%) |
| $1,000,000 or more | 131 (1.9%) | 122 (3.5%) |
| Total | 6,883 (100.0%) | 3,516 (100.0%) |
Household Income by Mortgage Status in Hallandale Beach
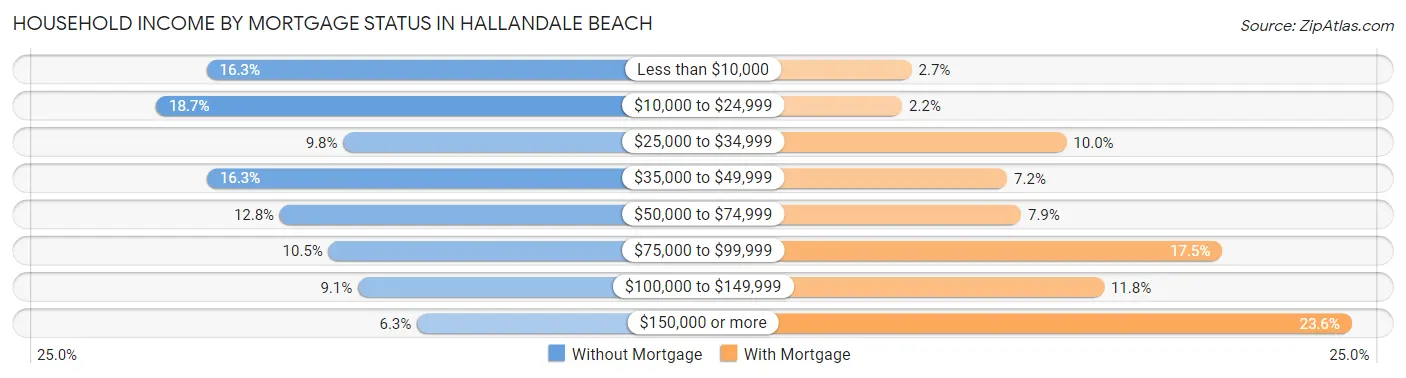
| Household Income | Without Mortgage | With Mortgage |
| Less than $10,000 | 1,124 (16.3%) | 94 (2.7%) |
| $10,000 to $24,999 | 1,290 (18.7%) | 78 (2.2%) |
| $25,000 to $34,999 | 676 (9.8%) | 353 (10.0%) |
| $35,000 to $49,999 | 1,123 (16.3%) | 254 (7.2%) |
| $50,000 to $74,999 | 884 (12.8%) | 277 (7.9%) |
| $75,000 to $99,999 | 724 (10.5%) | 614 (17.5%) |
| $100,000 to $149,999 | 628 (9.1%) | 416 (11.8%) |
| $150,000 or more | 434 (6.3%) | 831 (23.6%) |
| Total | 6,883 (100.0%) | 3,516 (100.0%) |
Property Value to Household Income Ratio in Hallandale Beach
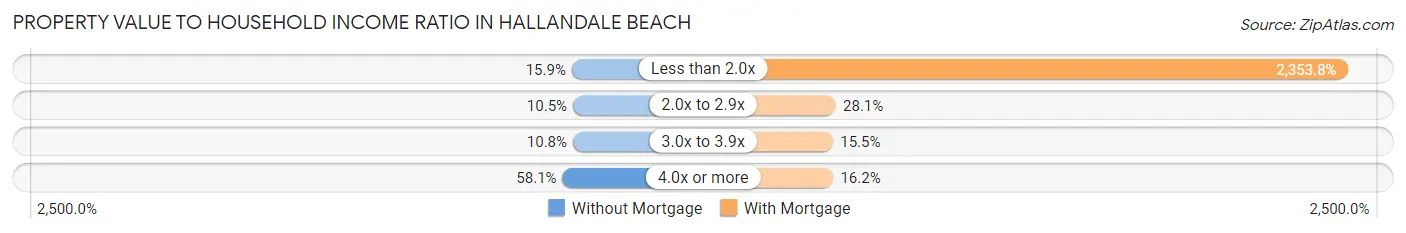
| Value-to-Income Ratio | Without Mortgage | With Mortgage |
| Less than 2.0x | 1,091 (15.9%) | 82,759 (2,353.8%) |
| 2.0x to 2.9x | 722 (10.5%) | 989 (28.1%) |
| 3.0x to 3.9x | 743 (10.8%) | 544 (15.5%) |
| 4.0x or more | 3,999 (58.1%) | 570 (16.2%) |
| Total | 6,883 (100.0%) | 3,516 (100.0%) |
Real Estate Taxes by Mortgage Status in Hallandale Beach
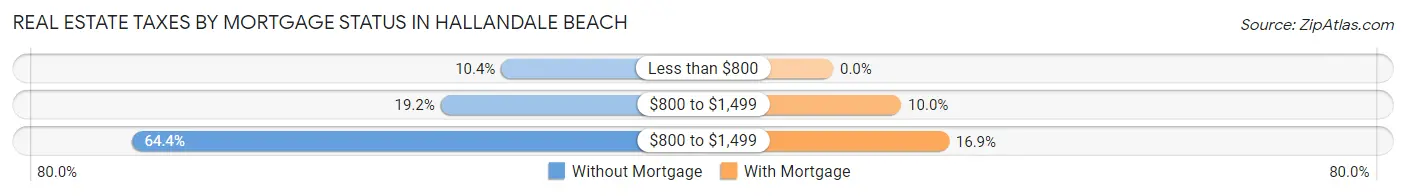
| Property Taxes | Without Mortgage | With Mortgage |
| Less than $800 | 713 (10.4%) | 0 (0.0%) |
| $800 to $1,499 | 1,323 (19.2%) | 350 (10.0%) |
| $800 to $1,499 | 4,430 (64.4%) | 595 (16.9%) |
| Total | 6,883 (100.0%) | 3,516 (100.0%) |
Health & Disability in Hallandale Beach
Health Insurance Coverage by Age in Hallandale Beach
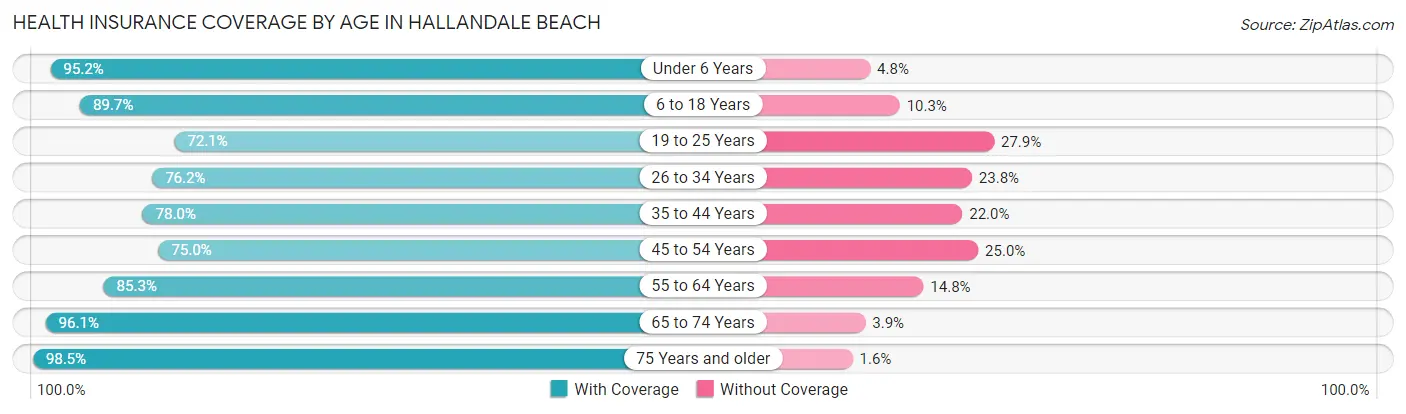
| Age Bracket | With Coverage | Without Coverage |
| Under 6 Years | 2,862 (95.2%) | 145 (4.8%) |
| 6 to 18 Years | 3,613 (89.7%) | 416 (10.3%) |
| 19 to 25 Years | 2,033 (72.1%) | 788 (27.9%) |
| 26 to 34 Years | 4,043 (76.2%) | 1,263 (23.8%) |
| 35 to 44 Years | 3,735 (78.0%) | 1,054 (22.0%) |
| 45 to 54 Years | 3,509 (75.0%) | 1,167 (25.0%) |
| 55 to 64 Years | 5,937 (85.3%) | 1,027 (14.7%) |
| 65 to 74 Years | 4,664 (96.1%) | 191 (3.9%) |
| 75 Years and older | 4,579 (98.5%) | 72 (1.5%) |
| Total | 34,975 (85.1%) | 6,123 (14.9%) |
Health Insurance Coverage by Citizenship Status in Hallandale Beach
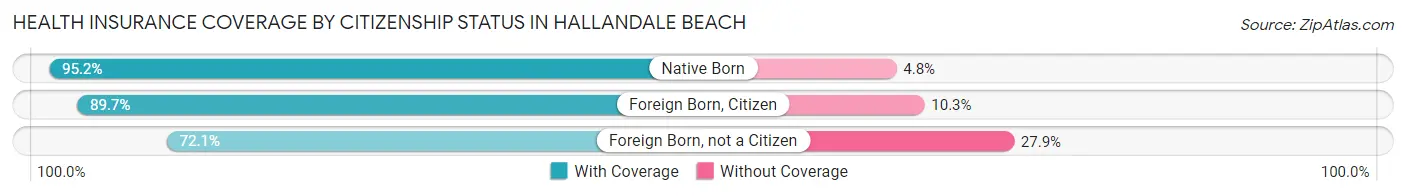
| Citizenship Status | With Coverage | Without Coverage |
| Native Born | 2,862 (95.2%) | 145 (4.8%) |
| Foreign Born, Citizen | 3,613 (89.7%) | 416 (10.3%) |
| Foreign Born, not a Citizen | 2,033 (72.1%) | 788 (27.9%) |
Health Insurance Coverage by Household Income in Hallandale Beach
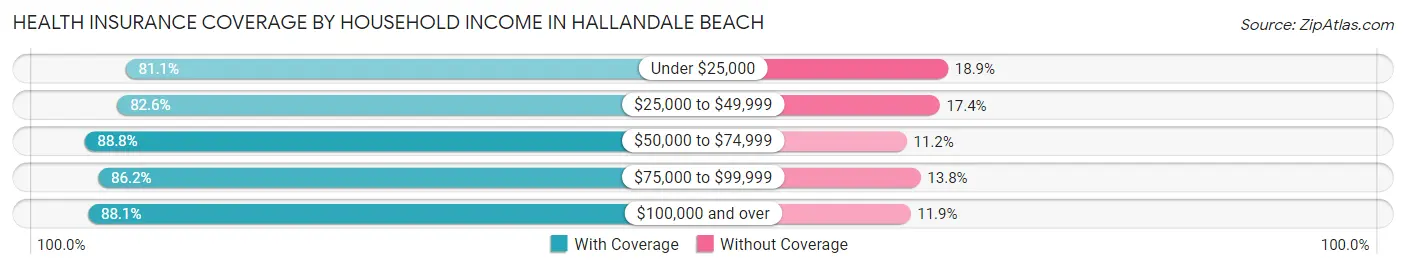
| Household Income | With Coverage | Without Coverage |
| Under $25,000 | 7,653 (81.1%) | 1,787 (18.9%) |
| $25,000 to $49,999 | 7,755 (82.6%) | 1,629 (17.4%) |
| $50,000 to $74,999 | 6,065 (88.8%) | 765 (11.2%) |
| $75,000 to $99,999 | 4,127 (86.2%) | 660 (13.8%) |
| $100,000 and over | 9,333 (88.1%) | 1,260 (11.9%) |
Public vs Private Health Insurance Coverage by Age in Hallandale Beach
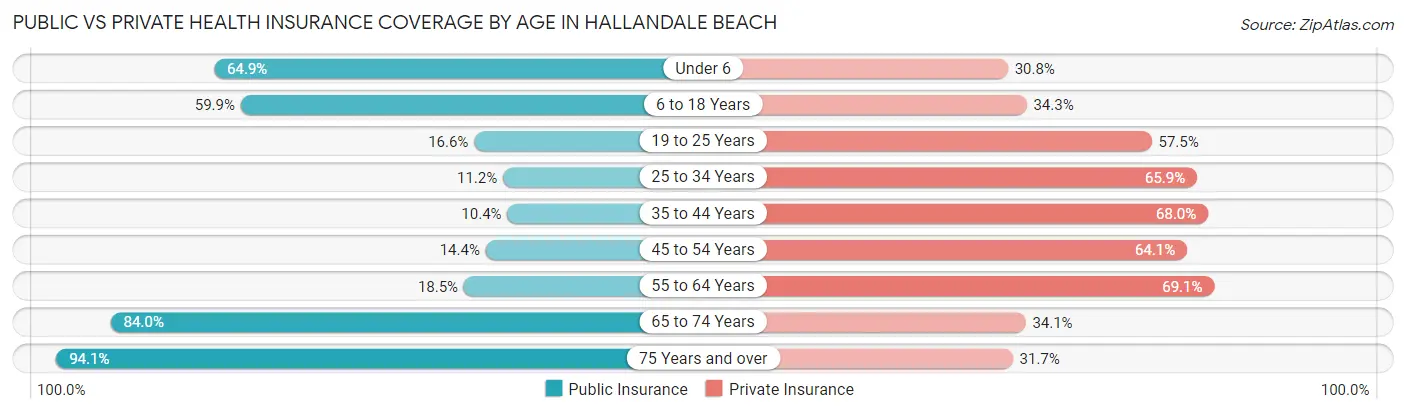
| Age Bracket | Public Insurance | Private Insurance |
| Under 6 | 1,950 (64.8%) | 926 (30.8%) |
| 6 to 18 Years | 2,412 (59.9%) | 1,381 (34.3%) |
| 19 to 25 Years | 467 (16.6%) | 1,622 (57.5%) |
| 25 to 34 Years | 594 (11.2%) | 3,499 (65.9%) |
| 35 to 44 Years | 497 (10.4%) | 3,256 (68.0%) |
| 45 to 54 Years | 674 (14.4%) | 2,996 (64.1%) |
| 55 to 64 Years | 1,285 (18.4%) | 4,814 (69.1%) |
| 65 to 74 Years | 4,080 (84.0%) | 1,655 (34.1%) |
| 75 Years and over | 4,378 (94.1%) | 1,475 (31.7%) |
| Total | 16,337 (39.8%) | 21,624 (52.6%) |
Disability Status by Sex by Age in Hallandale Beach
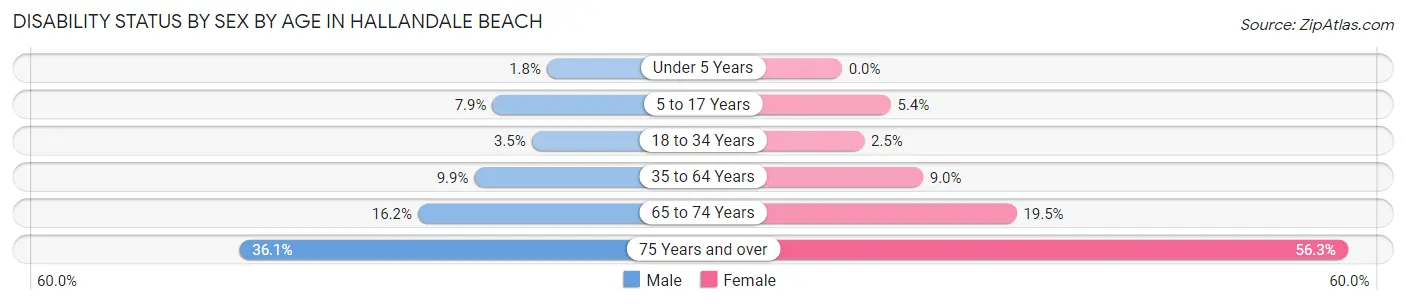
| Age Bracket | Male | Female |
| Under 5 Years | 27 (1.8%) | 0 (0.0%) |
| 5 to 17 Years | 159 (7.9%) | 102 (5.4%) |
| 18 to 34 Years | 149 (3.5%) | 109 (2.5%) |
| 35 to 64 Years | 711 (9.9%) | 835 (9.0%) |
| 65 to 74 Years | 376 (16.2%) | 493 (19.5%) |
| 75 Years and over | 767 (36.1%) | 1,423 (56.3%) |
Disability Class by Sex by Age in Hallandale Beach
Disability Class: Hearing Difficulty
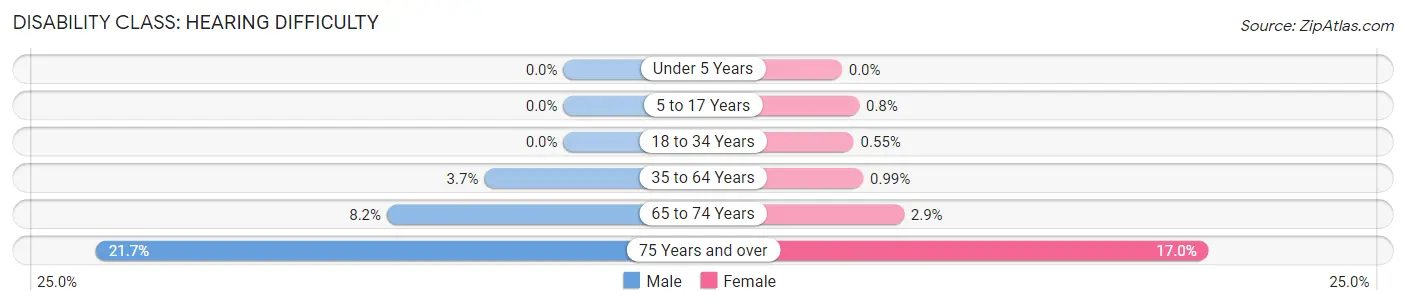
| Age Bracket | Male | Female |
| Under 5 Years | 0 (0.0%) | 0 (0.0%) |
| 5 to 17 Years | 0 (0.0%) | 15 (0.8%) |
| 18 to 34 Years | 0 (0.0%) | 24 (0.5%) |
| 35 to 64 Years | 263 (3.7%) | 92 (1.0%) |
| 65 to 74 Years | 190 (8.2%) | 73 (2.9%) |
| 75 Years and over | 461 (21.7%) | 430 (17.0%) |
Disability Class: Vision Difficulty
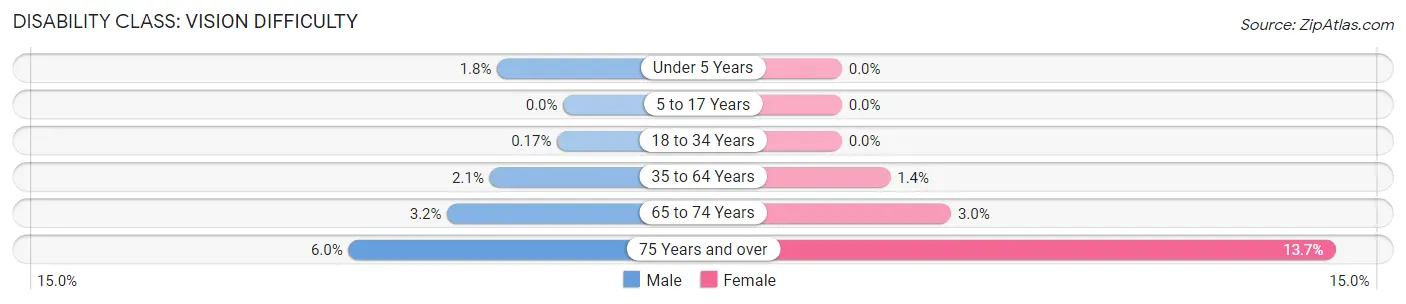
| Age Bracket | Male | Female |
| Under 5 Years | 27 (1.8%) | 0 (0.0%) |
| 5 to 17 Years | 0 (0.0%) | 0 (0.0%) |
| 18 to 34 Years | 7 (0.2%) | 0 (0.0%) |
| 35 to 64 Years | 147 (2.1%) | 125 (1.3%) |
| 65 to 74 Years | 75 (3.2%) | 77 (3.0%) |
| 75 Years and over | 127 (6.0%) | 347 (13.7%) |
Disability Class: Cognitive Difficulty
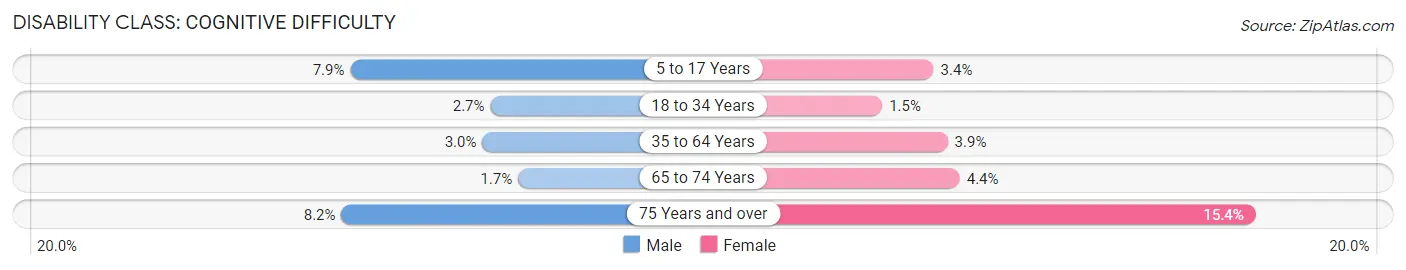
| Age Bracket | Male | Female |
| 5 to 17 Years | 159 (7.9%) | 64 (3.4%) |
| 18 to 34 Years | 114 (2.7%) | 66 (1.5%) |
| 35 to 64 Years | 216 (3.0%) | 364 (3.9%) |
| 65 to 74 Years | 39 (1.7%) | 111 (4.4%) |
| 75 Years and over | 175 (8.2%) | 388 (15.4%) |
Disability Class: Ambulatory Difficulty
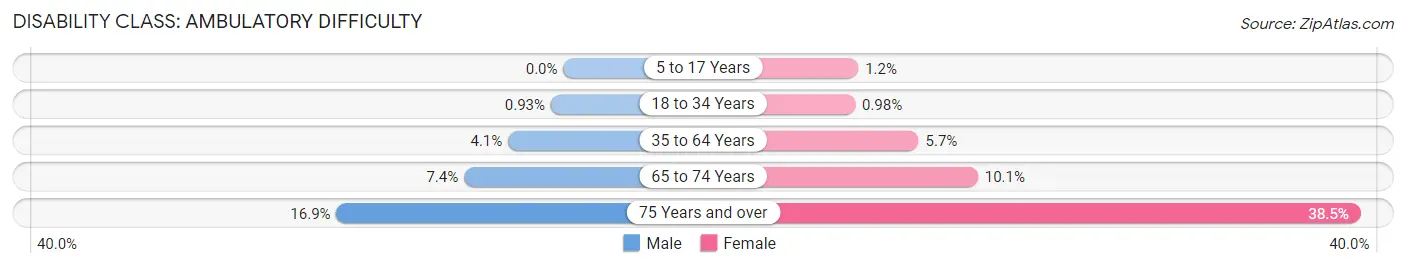
| Age Bracket | Male | Female |
| 5 to 17 Years | 0 (0.0%) | 23 (1.2%) |
| 18 to 34 Years | 39 (0.9%) | 43 (1.0%) |
| 35 to 64 Years | 294 (4.1%) | 528 (5.7%) |
| 65 to 74 Years | 171 (7.4%) | 256 (10.1%) |
| 75 Years and over | 358 (16.9%) | 973 (38.5%) |
Disability Class: Self-Care Difficulty
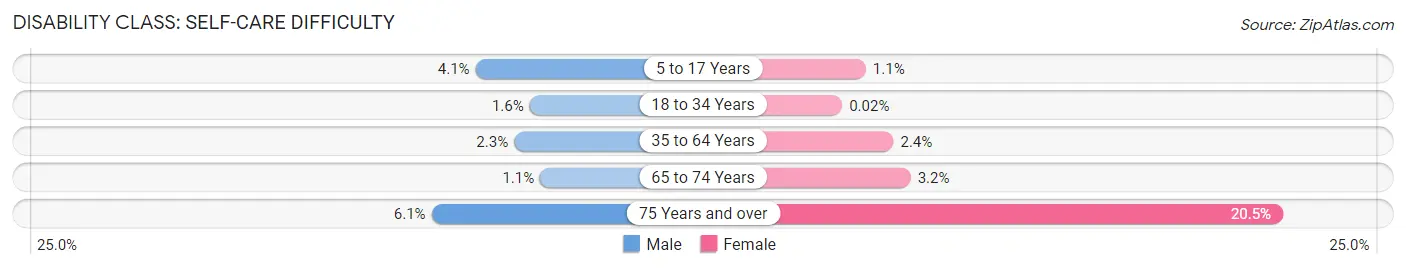
| Age Bracket | Male | Female |
| 5 to 17 Years | 82 (4.1%) | 21 (1.1%) |
| 18 to 34 Years | 66 (1.6%) | 1 (0.0%) |
| 35 to 64 Years | 164 (2.3%) | 222 (2.4%) |
| 65 to 74 Years | 25 (1.1%) | 81 (3.2%) |
| 75 Years and over | 130 (6.1%) | 517 (20.5%) |
Technology Access in Hallandale Beach
Computing Device Access in Hallandale Beach
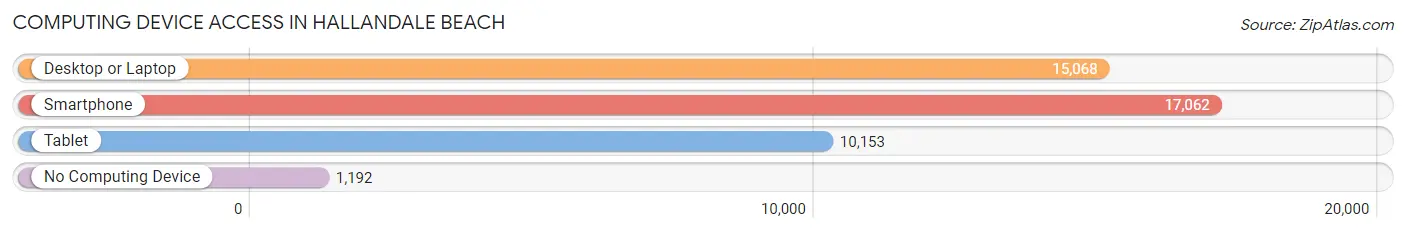
| Device Type | # Households | % Households |
| Desktop or Laptop | 15,068 | 76.9% |
| Smartphone | 17,062 | 87.1% |
| Tablet | 10,153 | 51.8% |
| No Computing Device | 1,192 | 6.1% |
| Total | 19,581 | 100.0% |
Internet Access in Hallandale Beach
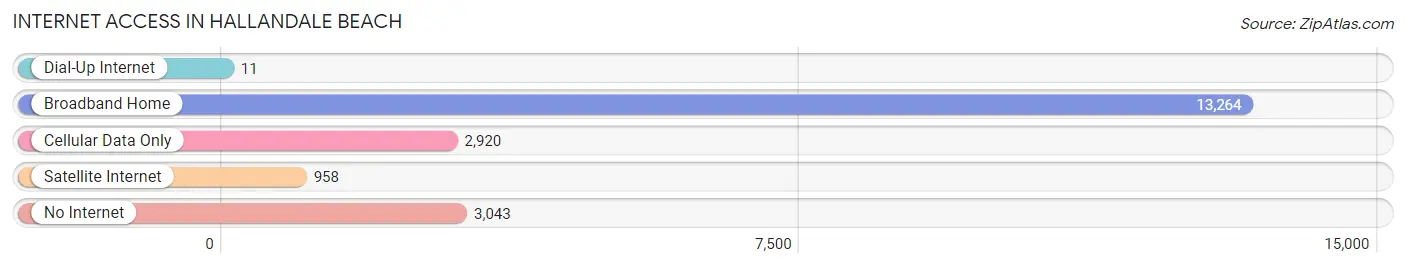
| Internet Type | # Households | % Households |
| Dial-Up Internet | 11 | 0.1% |
| Broadband Home | 13,264 | 67.7% |
| Cellular Data Only | 2,920 | 14.9% |
| Satellite Internet | 958 | 4.9% |
| No Internet | 3,043 | 15.5% |
| Total | 19,581 | 100.0% |
Hallandale Beach Summary
Hallandale Beach is a city located in Broward County, Florida. It is located between Miami and Fort Lauderdale, and is part of the Miami metropolitan area. The city has a population of 39,355 as of the 2010 census, making it the second most populous city in Broward County.
History
Hallandale Beach was originally part of the town of Dania, which was established in 1904. In 1927, the town was incorporated as Hallandale, named after Luther Halland, a worker for the Florida East Coast Railroad. The city was renamed Hallandale Beach in 1999.
Geography
Hallandale Beach is located at 25°58'N 80°09'W (25.97, -80.15). It is bordered by the cities of Hollywood to the north, Aventura to the east, and Pembroke Park to the south. The city has a total area of 4.4 square miles, of which 4.3 square miles is land and 0.1 square miles is water.
Economy
Hallandale Beach has a diverse economy, with a mix of retail, hospitality, and professional services. The city is home to several major employers, including Gulfstream Park Racing and Casino, Memorial Regional Hospital, and the Diplomat Resort and Spa. The city also has a thriving tourism industry, with many hotels, restaurants, and attractions.
Demographics
As of the 2010 census, there were 39,355 people, 17,845 households, and 9,945 families residing in the city. The population density was 9,072.3 people per square mile. The racial makeup of the city was 57.2% White, 28.2% African American, 0.3% Native American, 4.2% Asian, 0.1% Pacific Islander, 6.7% from other races, and 3.3% from two or more races. Hispanic or Latino of any race were 33.2% of the population.
The median income for a household in the city was $37,845, and the median income for a family was $45,845. The per capita income for the city was $22,845. About 17.2% of families and 20.7% of the population were below the poverty line, including 28.2% of those under age 18 and 11.2% of those age 65 or over.
Common Questions
What is Per Capita Income in Hallandale Beach?
Per Capita income in Hallandale Beach is $34,320.
What is the Median Family Income in Hallandale Beach?
Median Family Income in Hallandale Beach is $55,039.
What is the Median Household income in Hallandale Beach?
Median Household Income in Hallandale Beach is $45,417.
What is Income or Wage Gap in Hallandale Beach?
Income or Wage Gap in Hallandale Beach is 15.9%.
Women in Hallandale Beach earn 84.1 cents for every dollar earned by a man.
What is Family Income Deficit in Hallandale Beach?
Family Income Deficit in Hallandale Beach is $10,735.
Families that are below poverty line in Hallandale Beach earn $10,735 less on average than the poverty threshold level.
What is Inequality or Gini Index in Hallandale Beach?
Inequality or Gini Index in Hallandale Beach is 0.53.
What is the Total Population of Hallandale Beach?
Total Population of Hallandale Beach is 41,102.
What is the Total Male Population of Hallandale Beach?
Total Male Population of Hallandale Beach is 19,299.
What is the Total Female Population of Hallandale Beach?
Total Female Population of Hallandale Beach is 21,803.
What is the Ratio of Males per 100 Females in Hallandale Beach?
There are 88.52 Males per 100 Females in Hallandale Beach.
What is the Ratio of Females per 100 Males in Hallandale Beach?
There are 112.97 Females per 100 Males in Hallandale Beach.
What is the Median Population Age in Hallandale Beach?
Median Population Age in Hallandale Beach is 46.2 Years.
What is the Average Family Size in Hallandale Beach
Average Family Size in Hallandale Beach is 2.8 People.
What is the Average Household Size in Hallandale Beach
Average Household Size in Hallandale Beach is 2.1 People.
How Large is the Labor Force in Hallandale Beach?
There are 21,573 People in the Labor Forcein in Hallandale Beach.
What is the Percentage of People in the Labor Force in Hallandale Beach?
61.5% of People are in the Labor Force in Hallandale Beach.
What is the Unemployment Rate in Hallandale Beach?
Unemployment Rate in Hallandale Beach is 9.3%.