Mecosta, MI Map & Demographics
Mecosta Map
Mecosta Overview
$21,573
PER CAPITA INCOME
$56,563
AVG FAMILY INCOME
$67,500
AVG HOUSEHOLD INCOME
14.8%
WAGE / INCOME GAP [ % ]
85.2¢/ $1
WAGE / INCOME GAP [ $ ]
0.33
INEQUALITY / GINI INDEX
505
TOTAL POPULATION
248
MALE POPULATION
257
FEMALE POPULATION
96.50
MALES / 100 FEMALES
103.63
FEMALES / 100 MALES
41.9
MEDIAN AGE
2.7
AVG FAMILY SIZE
2.6
AVG HOUSEHOLD SIZE
216
LABOR FORCE [ PEOPLE ]
49.7%
PERCENT IN LABOR FORCE
10.6%
UNEMPLOYMENT RATE
Mecosta Zip Codes
Mecosta Area Codes
Income in Mecosta
Income Overview in Mecosta
Per Capita Income in Mecosta is $21,573, while median incomes of families and households are $56,563 and $67,500 respectively.
| Characteristic | Number | Measure |
| Per Capita Income | 505 | $21,573 |
| Median Family Income | 140 | $56,563 |
| Mean Family Income | 140 | $60,207 |
| Median Household Income | 192 | $67,500 |
| Mean Household Income | 192 | $63,258 |
| Income Deficit | 140 | $0 |
| Wage / Income Gap (%) | 505 | 14.80% |
| Wage / Income Gap ($) | 505 | 85.20¢ per $1 |
| Gini / Inequality Index | 505 | 0.33 |
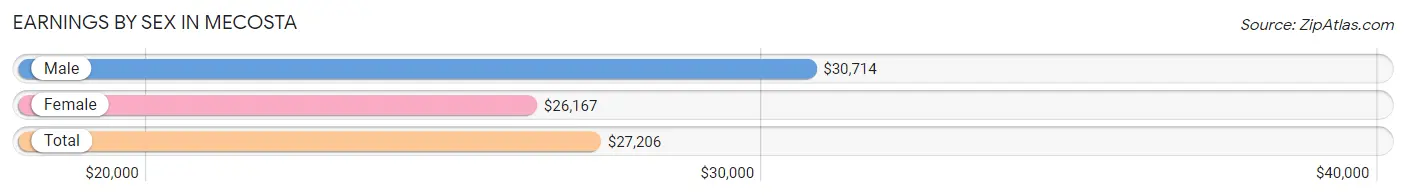
Earnings by Sex in Mecosta
Average Earnings in Mecosta are $27,206, $30,714 for men and $26,167 for women, a difference of 14.8%.
| Sex | Number | Average Earnings |
| Male | 122 (54.0%) | $30,714 |
| Female | 104 (46.0%) | $26,167 |
| Total | 226 (100.0%) | $27,206 |
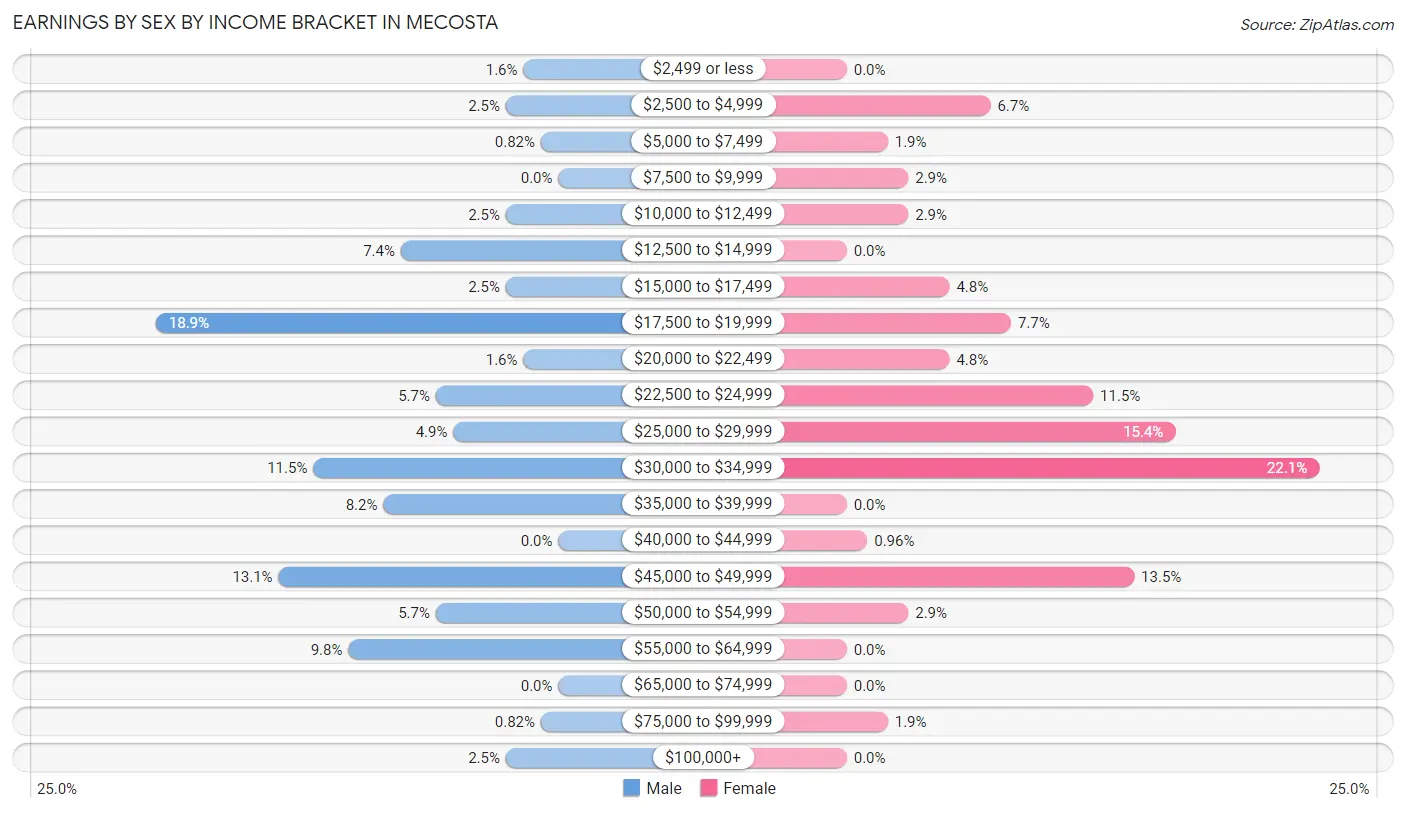
Earnings by Sex by Income Bracket in Mecosta
The most common earnings brackets in Mecosta are $17,500 to $19,999 for men (23 | 18.9%) and $30,000 to $34,999 for women (23 | 22.1%).
| Income | Male | Female |
| $2,499 or less | 2 (1.6%) | 0 (0.0%) |
| $2,500 to $4,999 | 3 (2.5%) | 7 (6.7%) |
| $5,000 to $7,499 | 1 (0.8%) | 2 (1.9%) |
| $7,500 to $9,999 | 0 (0.0%) | 3 (2.9%) |
| $10,000 to $12,499 | 3 (2.5%) | 3 (2.9%) |
| $12,500 to $14,999 | 9 (7.4%) | 0 (0.0%) |
| $15,000 to $17,499 | 3 (2.5%) | 5 (4.8%) |
| $17,500 to $19,999 | 23 (18.9%) | 8 (7.7%) |
| $20,000 to $22,499 | 2 (1.6%) | 5 (4.8%) |
| $22,500 to $24,999 | 7 (5.7%) | 12 (11.5%) |
| $25,000 to $29,999 | 6 (4.9%) | 16 (15.4%) |
| $30,000 to $34,999 | 14 (11.5%) | 23 (22.1%) |
| $35,000 to $39,999 | 10 (8.2%) | 0 (0.0%) |
| $40,000 to $44,999 | 0 (0.0%) | 1 (1.0%) |
| $45,000 to $49,999 | 16 (13.1%) | 14 (13.5%) |
| $50,000 to $54,999 | 7 (5.7%) | 3 (2.9%) |
| $55,000 to $64,999 | 12 (9.8%) | 0 (0.0%) |
| $65,000 to $74,999 | 0 (0.0%) | 0 (0.0%) |
| $75,000 to $99,999 | 1 (0.8%) | 2 (1.9%) |
| $100,000+ | 3 (2.5%) | 0 (0.0%) |
| Total | 122 (100.0%) | 104 (100.0%) |
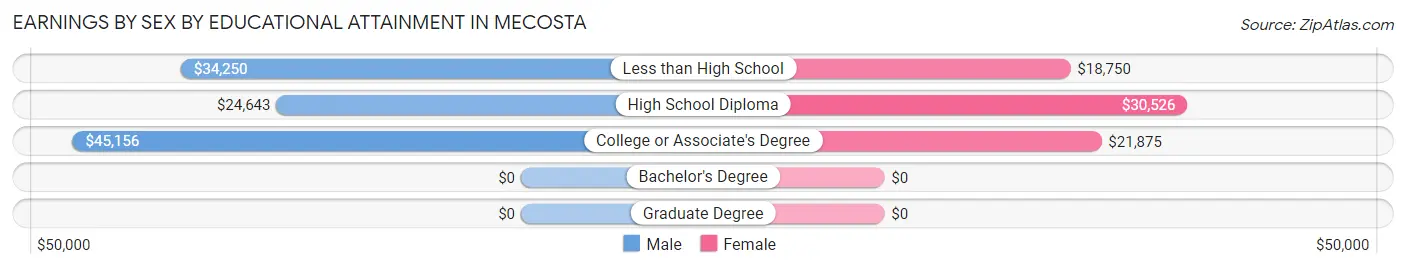
Earnings by Sex by Educational Attainment in Mecosta
Average earnings in Mecosta are $28,750 for men and $26,000 for women, a difference of 9.6%. Men with an educational attainment of college or associate's degree enjoy the highest average annual earnings of $45,156, while those with high school diploma education earn the least with $24,643. Women with an educational attainment of high school diploma earn the most with the average annual earnings of $30,526, while those with less than high school education have the smallest earnings of $18,750.
| Educational Attainment | Male Income | Female Income |
| Less than High School | $34,250 | $18,750 |
| High School Diploma | $24,643 | $30,526 |
| College or Associate's Degree | $45,156 | $21,875 |
| Bachelor's Degree | - | - |
| Graduate Degree | - | - |
| Total | $28,750 | $26,000 |
Family Income in Mecosta
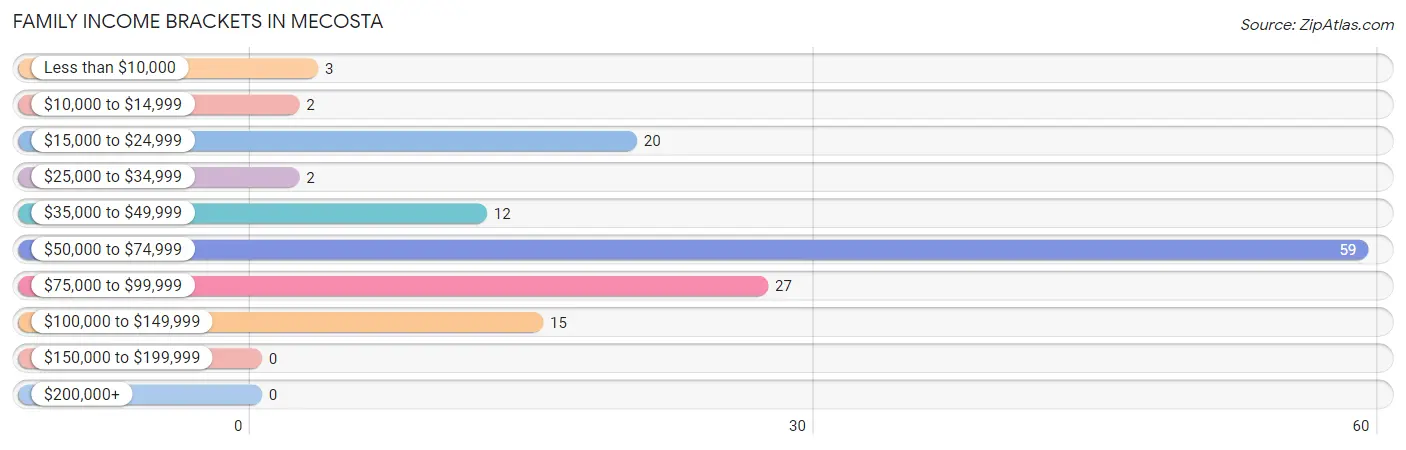
Family Income Brackets in Mecosta
According to the Mecosta family income data, there are 59 families falling into the $50,000 to $74,999 income range, which is the most common income bracket and makes up 42.1% of all families.
| Income Bracket | # Families | % Families |
| Less than $10,000 | 3 | 2.1% |
| $10,000 to $14,999 | 2 | 1.4% |
| $15,000 to $24,999 | 20 | 14.3% |
| $25,000 to $34,999 | 2 | 1.4% |
| $35,000 to $49,999 | 12 | 8.6% |
| $50,000 to $74,999 | 59 | 42.1% |
| $75,000 to $99,999 | 27 | 19.3% |
| $100,000 to $149,999 | 15 | 10.7% |
| $150,000 to $199,999 | 0 | 0.0% |
| $200,000+ | 0 | 0.0% |
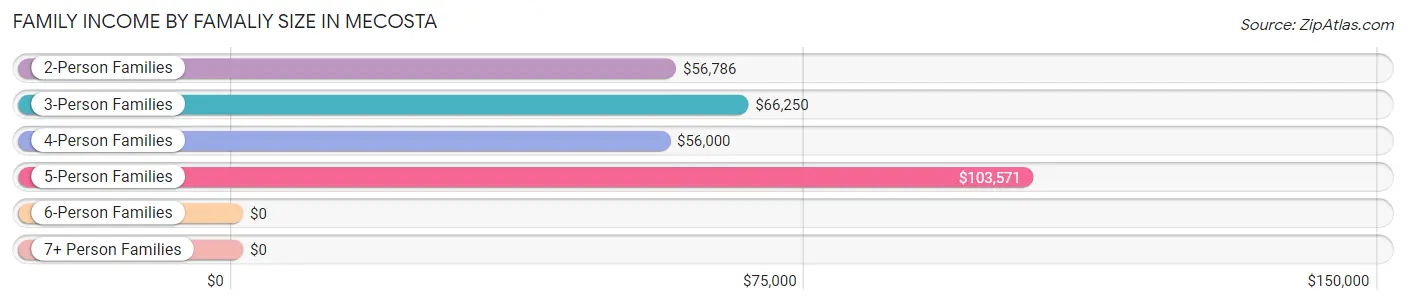
Family Income by Famaliy Size in Mecosta
5-person families (10 | 7.1%) account for the highest median family income in Mecosta with $103,571 per family, while 2-person families (56 | 40.0%) have the highest median income of $28,393 per family member.
| Income Bracket | # Families | Median Income |
| 2-Person Families | 56 (40.0%) | $56,786 |
| 3-Person Families | 33 (23.6%) | $66,250 |
| 4-Person Families | 36 (25.7%) | $56,000 |
| 5-Person Families | 10 (7.1%) | $103,571 |
| 6-Person Families | 5 (3.6%) | $0 |
| 7+ Person Families | 0 (0.0%) | $0 |
| Total | 140 (100.0%) | $56,563 |
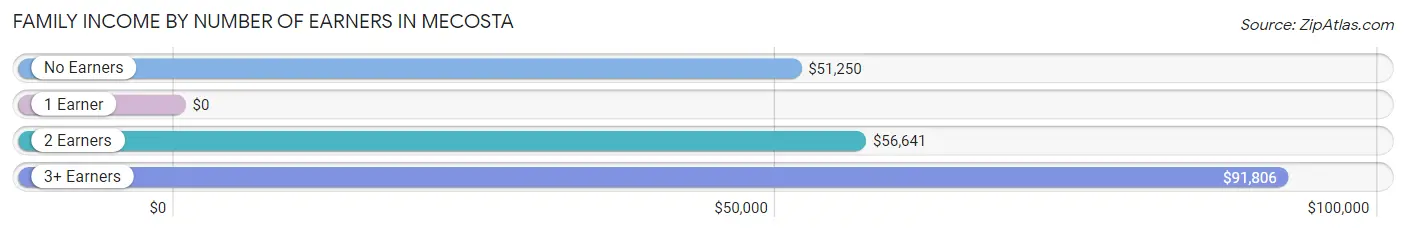
Family Income by Number of Earners in Mecosta
| Number of Earners | # Families | Median Income |
| No Earners | 26 (18.6%) | $51,250 |
| 1 Earner | 35 (25.0%) | $0 |
| 2 Earners | 64 (45.7%) | $56,641 |
| 3+ Earners | 15 (10.7%) | $91,806 |
| Total | 140 (100.0%) | $56,563 |
Household Income in Mecosta
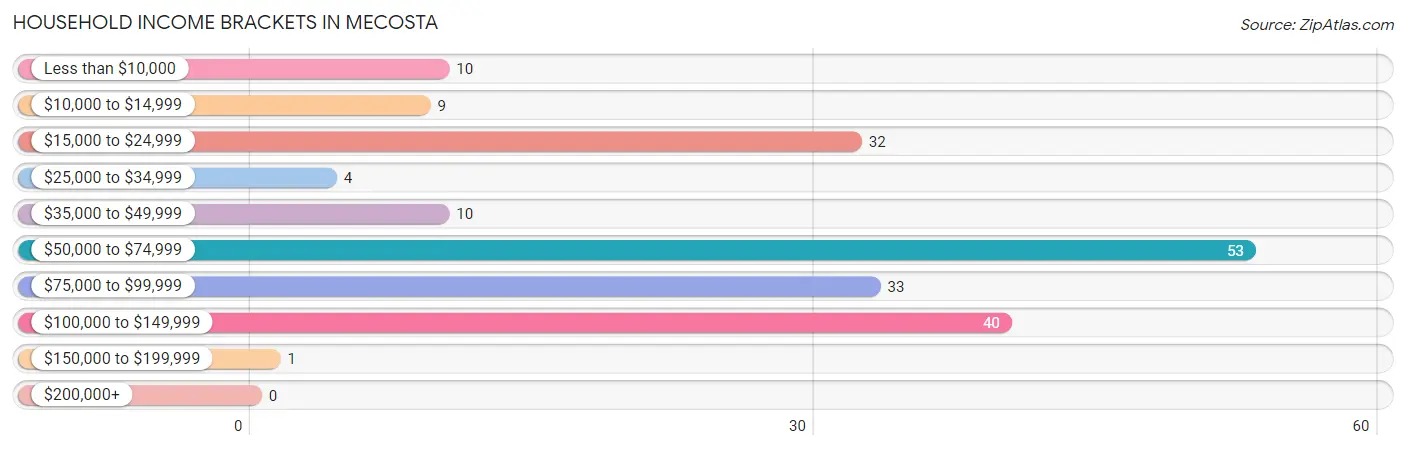
Household Income Brackets in Mecosta
With 53 households falling in the category, the $50,000 to $74,999 income range is the most frequent in Mecosta, accounting for 27.6% of all households.
| Income Bracket | # Households | % Households |
| Less than $10,000 | 10 | 5.2% |
| $10,000 to $14,999 | 9 | 4.7% |
| $15,000 to $24,999 | 32 | 16.7% |
| $25,000 to $34,999 | 4 | 2.1% |
| $35,000 to $49,999 | 10 | 5.2% |
| $50,000 to $74,999 | 53 | 27.6% |
| $75,000 to $99,999 | 33 | 17.2% |
| $100,000 to $149,999 | 40 | 20.8% |
| $150,000 to $199,999 | 1 | 0.5% |
| $200,000+ | 0 | 0.0% |
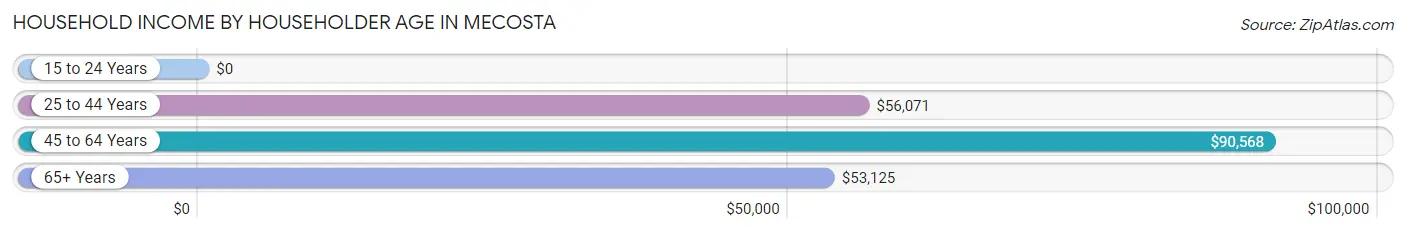
Household Income by Householder Age in Mecosta
The median household income in Mecosta is $67,500, with the highest median household income of $90,568 found in the 45 to 64 years age bracket for the primary householder. A total of 83 households (43.2%) fall into this category. Meanwhile, the 15 to 24 years age bracket for the primary householder has the lowest median household income of $0, with 2 households (1.0%) in this group.
| Income Bracket | # Households | Median Income |
| 15 to 24 Years | 2 (1.0%) | $0 |
| 25 to 44 Years | 58 (30.2%) | $56,071 |
| 45 to 64 Years | 83 (43.2%) | $90,568 |
| 65+ Years | 49 (25.5%) | $53,125 |
| Total | 192 (100.0%) | $67,500 |
Poverty in Mecosta
Income Below Poverty by Sex and Age in Mecosta
With 26.6% poverty level for males and 18.7% for females among the residents of Mecosta, 16 and 17 year old males and 16 and 17 year old females are the most vulnerable to poverty, with 5 males (71.4%) and 5 females (83.3%) in their respective age groups living below the poverty level.
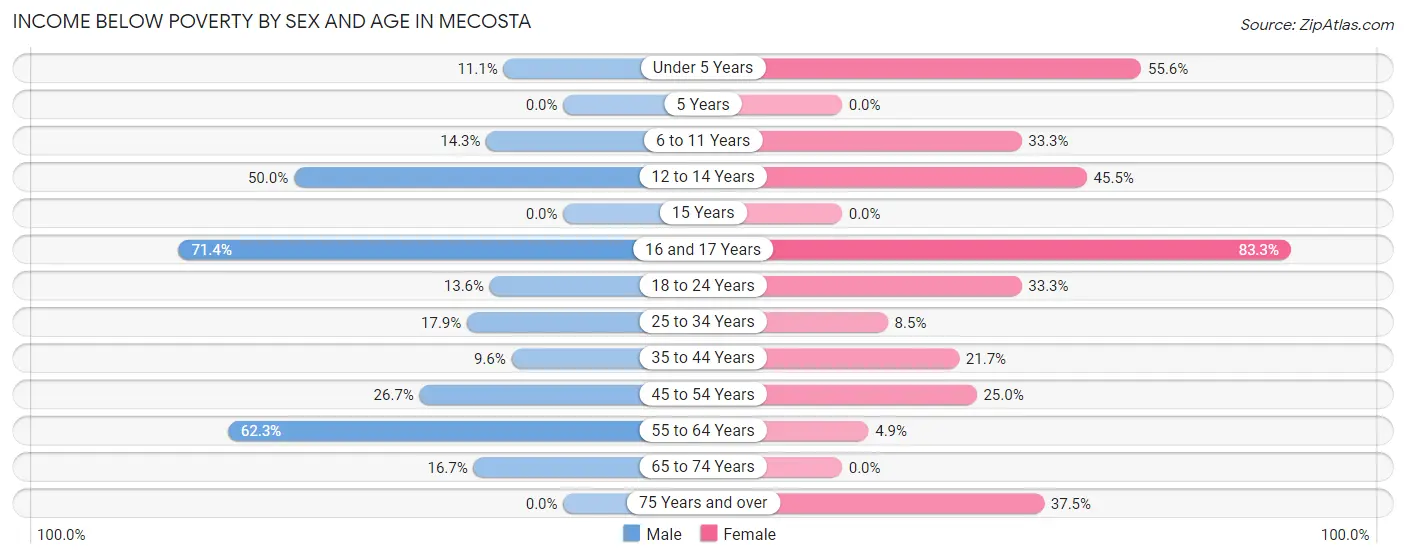
| Age Bracket | Male | Female |
| Under 5 Years | 2 (11.1%) | 10 (55.6%) |
| 5 Years | 0 (0.0%) | 0 (0.0%) |
| 6 to 11 Years | 1 (14.3%) | 2 (33.3%) |
| 12 to 14 Years | 1 (50.0%) | 5 (45.5%) |
| 15 Years | 0 (0.0%) | 0 (0.0%) |
| 16 and 17 Years | 5 (71.4%) | 5 (83.3%) |
| 18 to 24 Years | 3 (13.6%) | 3 (33.3%) |
| 25 to 34 Years | 5 (17.9%) | 4 (8.5%) |
| 35 to 44 Years | 5 (9.6%) | 5 (21.7%) |
| 45 to 54 Years | 8 (26.7%) | 5 (25.0%) |
| 55 to 64 Years | 33 (62.3%) | 3 (4.9%) |
| 65 to 74 Years | 3 (16.7%) | 0 (0.0%) |
| 75 Years and over | 0 (0.0%) | 6 (37.5%) |
| Total | 66 (26.6%) | 48 (18.7%) |
Income Above Poverty by Sex and Age in Mecosta
According to the poverty statistics in Mecosta, males aged 5 years and females aged 15 years are the age groups that are most secure financially, with 100.0% of males and 100.0% of females in these age groups living above the poverty line.
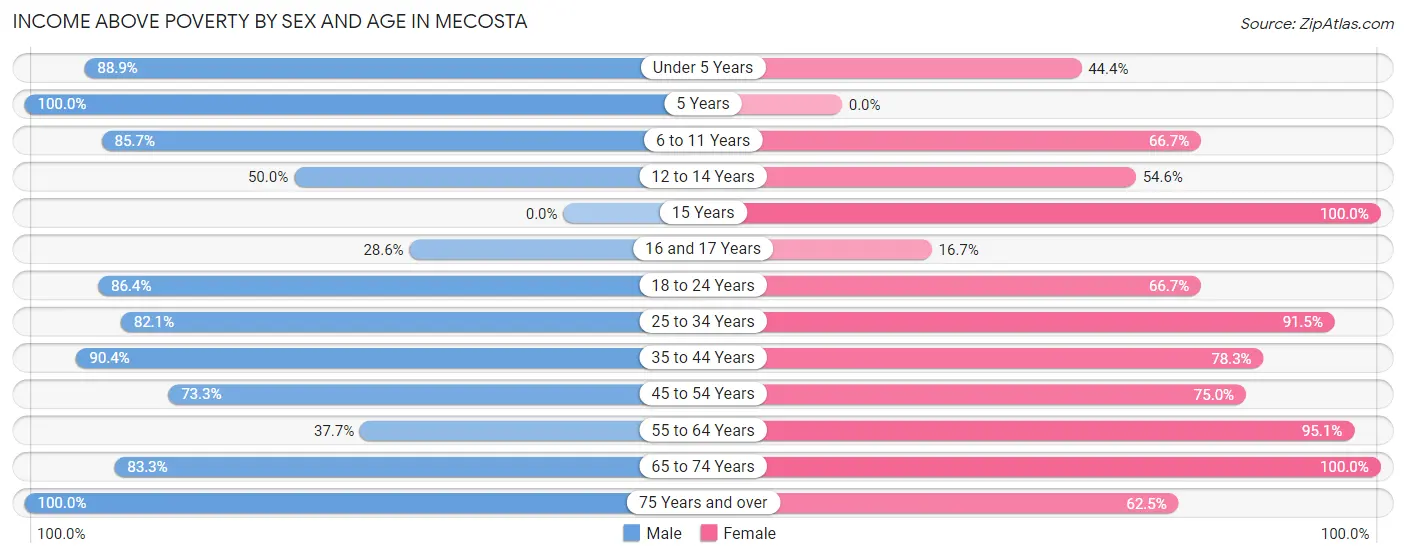
| Age Bracket | Male | Female |
| Under 5 Years | 16 (88.9%) | 8 (44.4%) |
| 5 Years | 1 (100.0%) | 0 (0.0%) |
| 6 to 11 Years | 6 (85.7%) | 4 (66.7%) |
| 12 to 14 Years | 1 (50.0%) | 6 (54.5%) |
| 15 Years | 0 (0.0%) | 7 (100.0%) |
| 16 and 17 Years | 2 (28.6%) | 1 (16.7%) |
| 18 to 24 Years | 19 (86.4%) | 6 (66.7%) |
| 25 to 34 Years | 23 (82.1%) | 43 (91.5%) |
| 35 to 44 Years | 47 (90.4%) | 18 (78.3%) |
| 45 to 54 Years | 22 (73.3%) | 15 (75.0%) |
| 55 to 64 Years | 20 (37.7%) | 58 (95.1%) |
| 65 to 74 Years | 15 (83.3%) | 33 (100.0%) |
| 75 Years and over | 10 (100.0%) | 10 (62.5%) |
| Total | 182 (73.4%) | 209 (81.3%) |
Income Below Poverty Among Married-Couple Families in Mecosta
The poverty statistics for married-couple families in Mecosta show that 10.6% or 7 of the total 66 families live below the poverty line. Families with 1 or 2 children have the highest poverty rate of 28.6%, comprising of 4 families. On the other hand, families with 3 or 4 children have the lowest poverty rate of 0.0%, which includes 0 families.
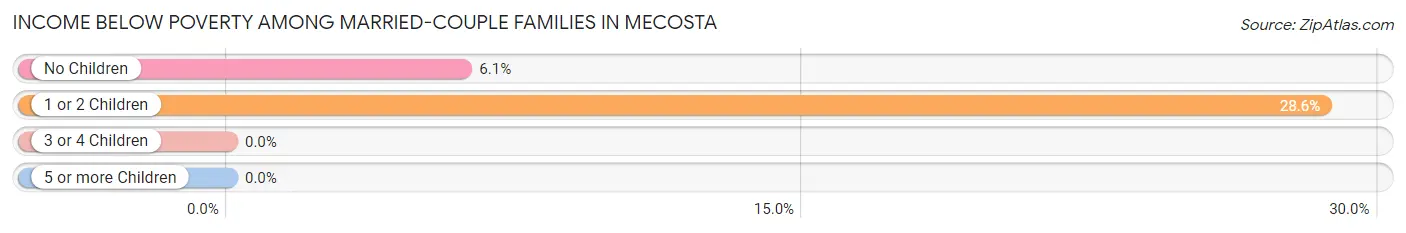
| Children | Above Poverty | Below Poverty |
| No Children | 46 (93.9%) | 3 (6.1%) |
| 1 or 2 Children | 10 (71.4%) | 4 (28.6%) |
| 3 or 4 Children | 3 (100.0%) | 0 (0.0%) |
| 5 or more Children | 0 (0.0%) | 0 (0.0%) |
| Total | 59 (89.4%) | 7 (10.6%) |
Income Below Poverty Among Single-Parent Households in Mecosta
According to the poverty data in Mecosta, 11.1% or 3 single-father households and 17.0% or 8 single-mother households are living below the poverty line. Among single-father households, those with 1 or 2 children have the highest poverty rate, with 3 households (75.0%) experiencing poverty. Likewise, among single-mother households, those with 3 or 4 children have the highest poverty rate, with 6 households (100.0%) falling below the poverty line.
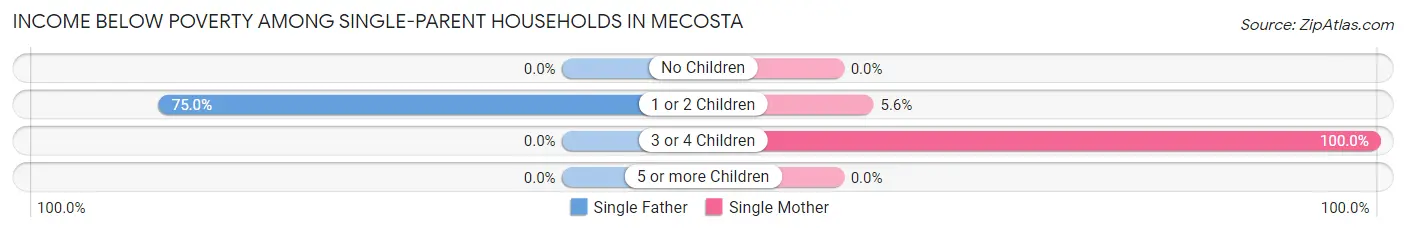
| Children | Single Father | Single Mother |
| No Children | 0 (0.0%) | 0 (0.0%) |
| 1 or 2 Children | 3 (75.0%) | 2 (5.6%) |
| 3 or 4 Children | 0 (0.0%) | 6 (100.0%) |
| 5 or more Children | 0 (0.0%) | 0 (0.0%) |
| Total | 3 (11.1%) | 8 (17.0%) |
Income Below Poverty Among Married-Couple vs Single-Parent Households in Mecosta
The poverty data for Mecosta shows that 7 of the married-couple family households (10.6%) and 11 of the single-parent households (14.9%) are living below the poverty level. Within the married-couple family households, those with 1 or 2 children have the highest poverty rate, with 4 households (28.6%) falling below the poverty line. Among the single-parent households, those with 3 or 4 children have the highest poverty rate, with 6 household (75.0%) living below poverty.
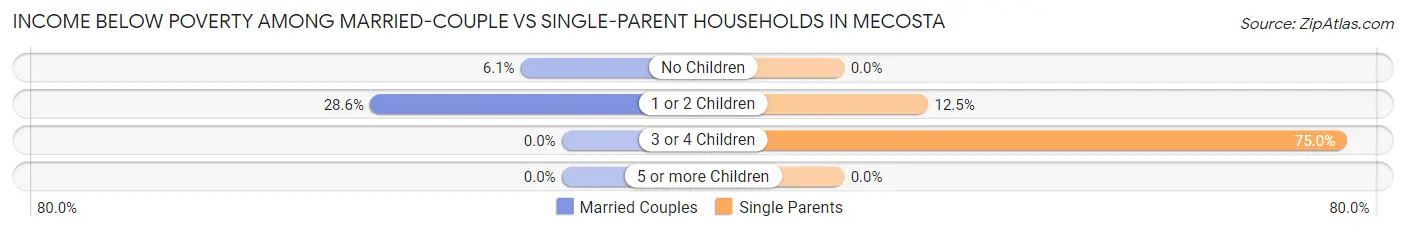
| Children | Married-Couple Families | Single-Parent Households |
| No Children | 3 (6.1%) | 0 (0.0%) |
| 1 or 2 Children | 4 (28.6%) | 5 (12.5%) |
| 3 or 4 Children | 0 (0.0%) | 6 (75.0%) |
| 5 or more Children | 0 (0.0%) | 0 (0.0%) |
| Total | 7 (10.6%) | 11 (14.9%) |
Race in Mecosta
The most populous races in Mecosta are White / Caucasian (459 | 90.9%), Black / African American (24 | 4.8%), and Two or more Races (16 | 3.2%).
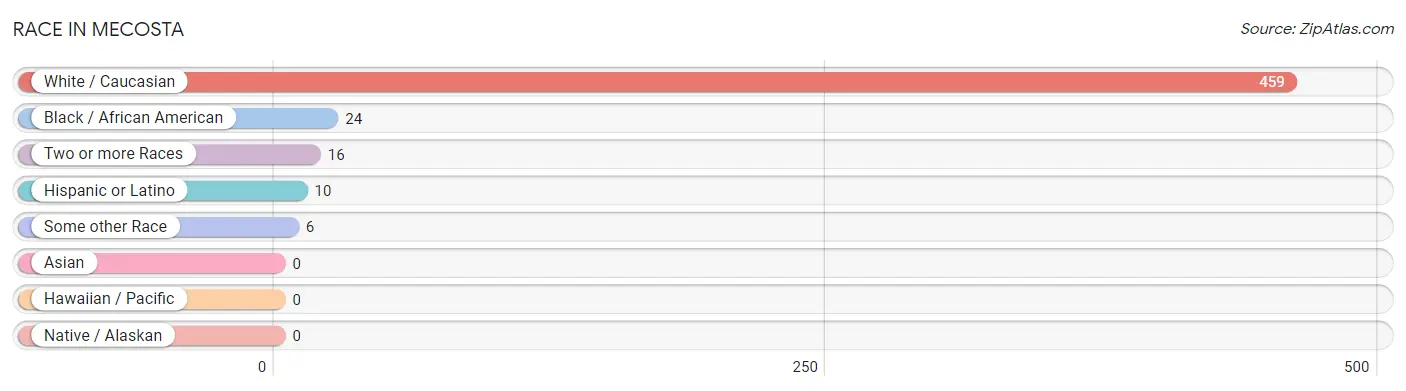
| Race | # Population | % Population |
| Asian | 0 | 0.0% |
| Black / African American | 24 | 4.8% |
| Hawaiian / Pacific | 0 | 0.0% |
| Hispanic or Latino | 10 | 2.0% |
| Native / Alaskan | 0 | 0.0% |
| White / Caucasian | 459 | 90.9% |
| Two or more Races | 16 | 3.2% |
| Some other Race | 6 | 1.2% |
| Total | 505 | 100.0% |
Ancestry in Mecosta
The most populous ancestries reported in Mecosta are German (64 | 12.7%), English (43 | 8.5%), American (30 | 5.9%), Dutch (22 | 4.4%), and Irish (21 | 4.2%), together accounting for 35.6% of all Mecosta residents.
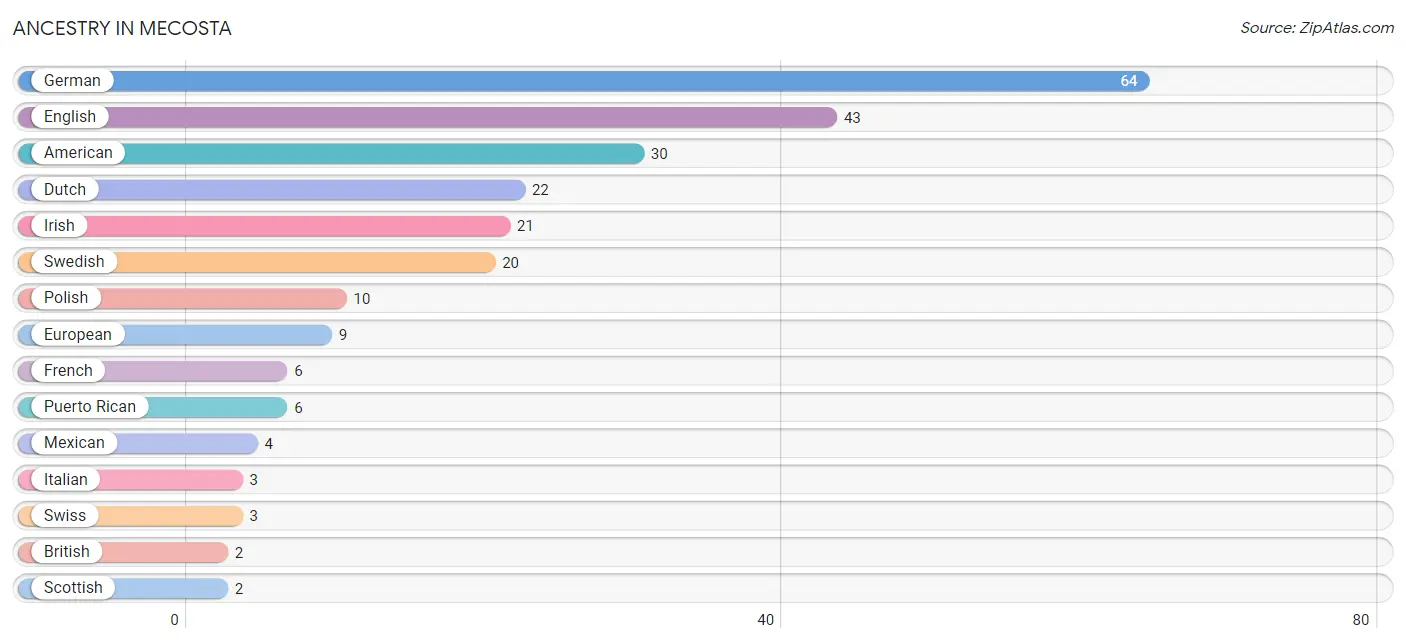
| Ancestry | # Population | % Population |
| American | 30 | 5.9% |
| British | 2 | 0.4% |
| Chippewa | 1 | 0.2% |
| Dutch | 22 | 4.4% |
| English | 43 | 8.5% |
| European | 9 | 1.8% |
| French | 6 | 1.2% |
| German | 64 | 12.7% |
| Irish | 21 | 4.2% |
| Italian | 3 | 0.6% |
| Mexican | 4 | 0.8% |
| Polish | 10 | 2.0% |
| Puerto Rican | 6 | 1.2% |
| Russian | 1 | 0.2% |
| Scottish | 2 | 0.4% |
| Swedish | 20 | 4.0% |
| Swiss | 3 | 0.6% | View All 17 Rows |
Immigrants in Mecosta

| Immigration Origin | # Population | % Population | View All 0 Rows |
Sex and Age in Mecosta
Sex and Age in Mecosta
The most populous age groups in Mecosta are 35 to 39 Years (44 | 17.7%) for men and 60 to 64 Years (48 | 18.7%) for women.
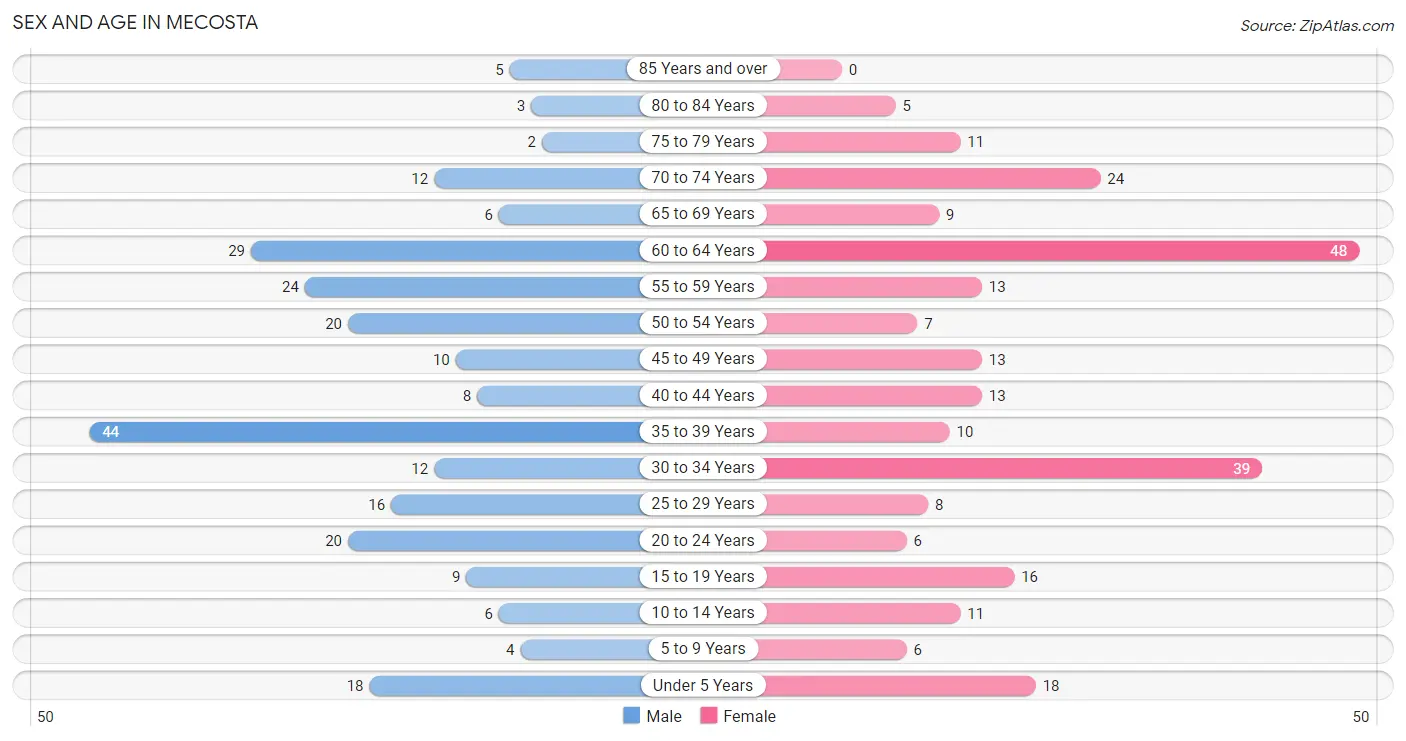
| Age Bracket | Male | Female |
| Under 5 Years | 18 (7.3%) | 18 (7.0%) |
| 5 to 9 Years | 4 (1.6%) | 6 (2.3%) |
| 10 to 14 Years | 6 (2.4%) | 11 (4.3%) |
| 15 to 19 Years | 9 (3.6%) | 16 (6.2%) |
| 20 to 24 Years | 20 (8.1%) | 6 (2.3%) |
| 25 to 29 Years | 16 (6.5%) | 8 (3.1%) |
| 30 to 34 Years | 12 (4.8%) | 39 (15.2%) |
| 35 to 39 Years | 44 (17.7%) | 10 (3.9%) |
| 40 to 44 Years | 8 (3.2%) | 13 (5.1%) |
| 45 to 49 Years | 10 (4.0%) | 13 (5.1%) |
| 50 to 54 Years | 20 (8.1%) | 7 (2.7%) |
| 55 to 59 Years | 24 (9.7%) | 13 (5.1%) |
| 60 to 64 Years | 29 (11.7%) | 48 (18.7%) |
| 65 to 69 Years | 6 (2.4%) | 9 (3.5%) |
| 70 to 74 Years | 12 (4.8%) | 24 (9.3%) |
| 75 to 79 Years | 2 (0.8%) | 11 (4.3%) |
| 80 to 84 Years | 3 (1.2%) | 5 (1.9%) |
| 85 Years and over | 5 (2.0%) | 0 (0.0%) |
| Total | 248 (100.0%) | 257 (100.0%) |
Families and Households in Mecosta
Median Family Size in Mecosta
The median family size in Mecosta is 2.69 persons per family, with single female/mother families (47 | 33.6%) accounting for the largest median family size of 3 persons per family. On the other hand, married-couple families (66 | 47.1%) represent the smallest median family size with 2.52 persons per family.
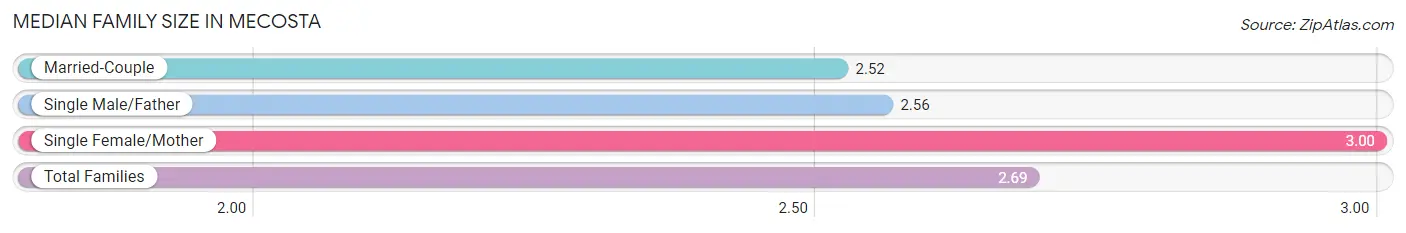
| Family Type | # Families | Family Size |
| Married-Couple | 66 (47.1%) | 2.52 |
| Single Male/Father | 27 (19.3%) | 2.56 |
| Single Female/Mother | 47 (33.6%) | 3.00 |
| Total Families | 140 (100.0%) | 2.69 |
Median Household Size in Mecosta
The median household size in Mecosta is 2.63 persons per household, with single female/mother households (47 | 24.5%) accounting for the largest median household size of 4.3 persons per household. non-family households (52 | 27.1%) represent the smallest median household size with 1.04 persons per household.
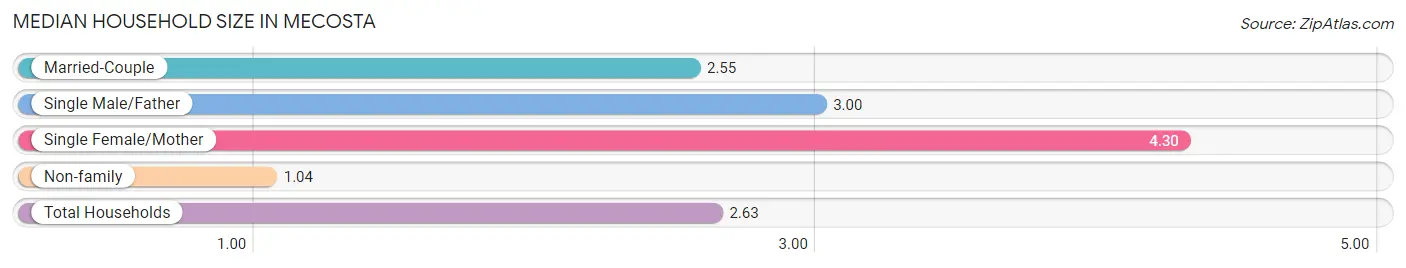
| Household Type | # Households | Household Size |
| Married-Couple | 66 (34.4%) | 2.55 |
| Single Male/Father | 27 (14.1%) | 3.00 |
| Single Female/Mother | 47 (24.5%) | 4.30 |
| Non-family | 52 (27.1%) | 1.04 |
| Total Households | 192 (100.0%) | 2.63 |
Household Size by Marriage Status in Mecosta
Out of a total of 192 households in Mecosta, 140 (72.9%) are family households, while 52 (27.1%) are nonfamily households. The most numerous type of family households are 2-person households, comprising 50, and the most common type of nonfamily households are 1-person households, comprising 48.
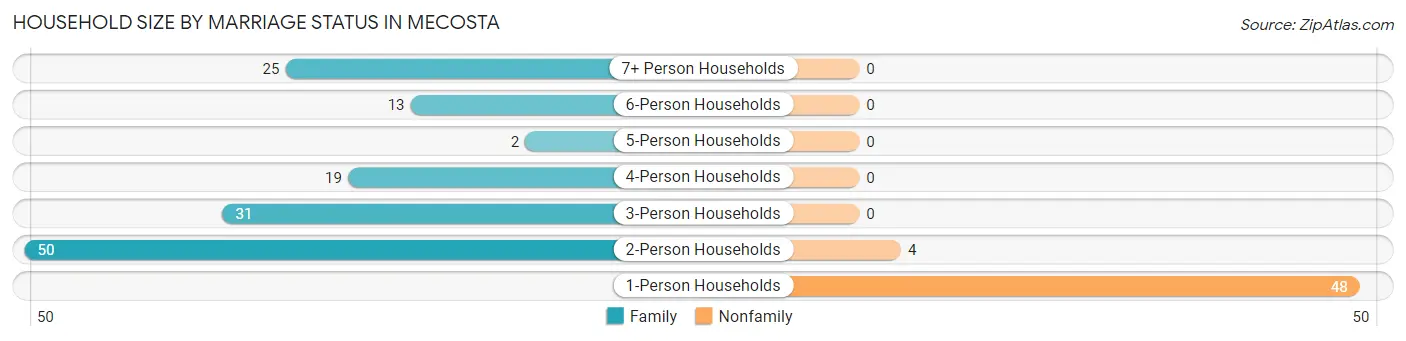
| Household Size | Family Households | Nonfamily Households |
| 1-Person Households | - | 48 (25.0%) |
| 2-Person Households | 50 (26.0%) | 4 (2.1%) |
| 3-Person Households | 31 (16.2%) | 0 (0.0%) |
| 4-Person Households | 19 (9.9%) | 0 (0.0%) |
| 5-Person Households | 2 (1.0%) | 0 (0.0%) |
| 6-Person Households | 13 (6.8%) | 0 (0.0%) |
| 7+ Person Households | 25 (13.0%) | 0 (0.0%) |
| Total | 140 (72.9%) | 52 (27.1%) |
Female Fertility in Mecosta
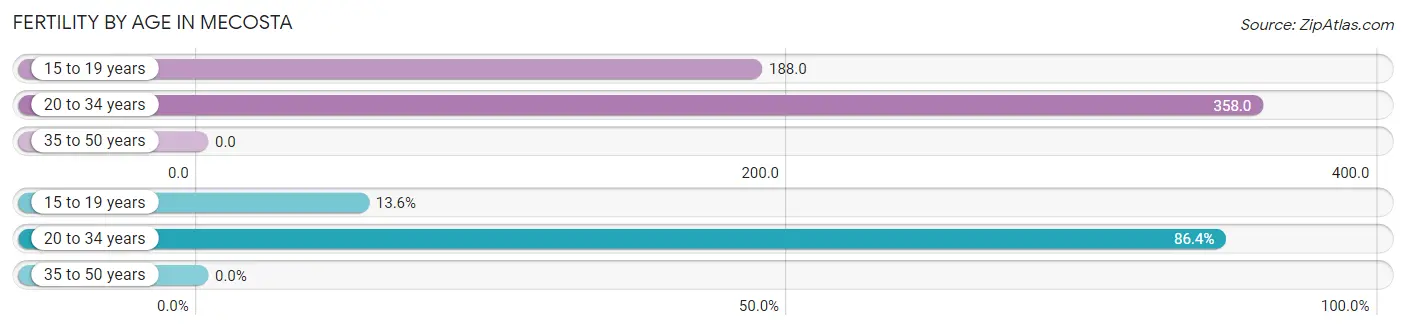
Fertility by Age in Mecosta
Average fertility rate in Mecosta is 210.0 births per 1,000 women. Women in the age bracket of 20 to 34 years have the highest fertility rate with 358.0 births per 1,000 women. Women in the age bracket of 20 to 34 years acount for 86.4% of all women with births.
| Age Bracket | Women with Births | Births / 1,000 Women |
| 15 to 19 years | 3 (13.6%) | 188.0 |
| 20 to 34 years | 19 (86.4%) | 358.0 |
| 35 to 50 years | 0 (0.0%) | 0.0 |
| Total | 22 (100.0%) | 210.0 |
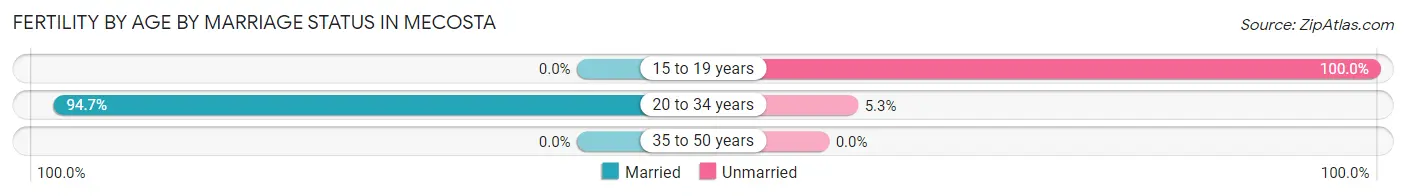
Fertility by Age by Marriage Status in Mecosta
81.8% of women with births (22) in Mecosta are married. The highest percentage of unmarried women with births falls into 15 to 19 years age bracket with 100.0% of them unmarried at the time of birth, while the lowest percentage of unmarried women with births belong to 20 to 34 years age bracket with 5.3% of them unmarried.
| Age Bracket | Married | Unmarried |
| 15 to 19 years | 0 (0.0%) | 3 (100.0%) |
| 20 to 34 years | 18 (94.7%) | 1 (5.3%) |
| 35 to 50 years | 0 (0.0%) | 0 (0.0%) |
| Total | 18 (81.8%) | 4 (18.2%) |
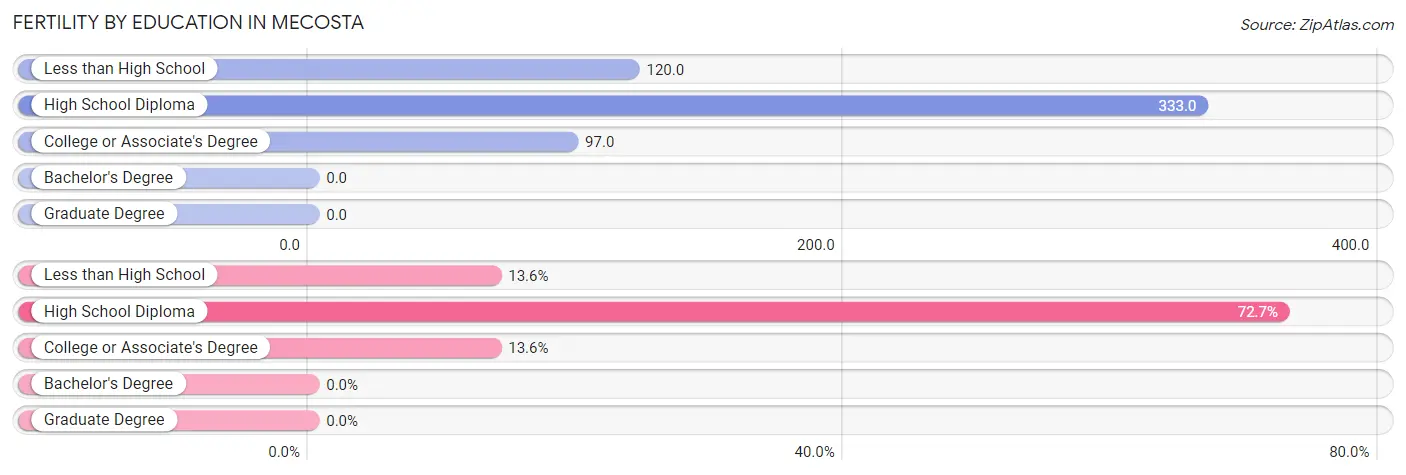
Fertility by Education in Mecosta
| Educational Attainment | Women with Births | Births / 1,000 Women |
| Less than High School | 3 (13.6%) | 120.0 |
| High School Diploma | 16 (72.7%) | 333.0 |
| College or Associate's Degree | 3 (13.6%) | 97.0 |
| Bachelor's Degree | 0 (0.0%) | 0.0 |
| Graduate Degree | 0 (0.0%) | 0.0 |
| Total | 22 (100.0%) | 210.0 |
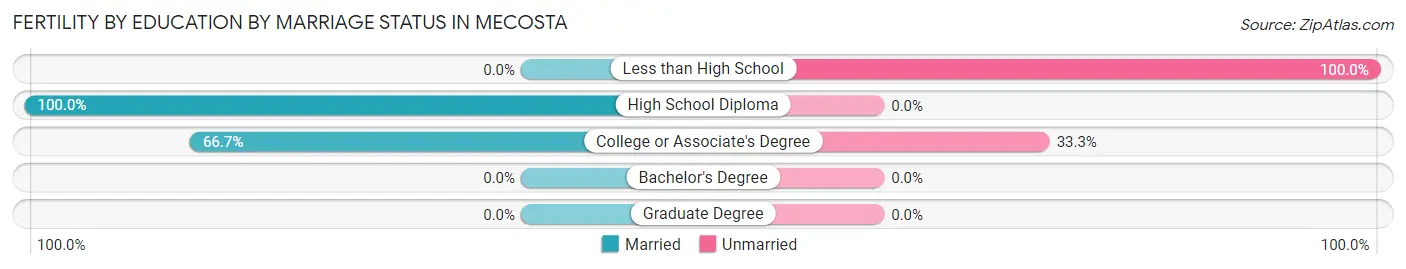
Fertility by Education by Marriage Status in Mecosta
18.2% of women with births in Mecosta are unmarried. Women with the educational attainment of high school diploma are most likely to be married with 100.0% of them married at childbirth, while women with the educational attainment of less than high school are least likely to be married with 100.0% of them unmarried at childbirth.
| Educational Attainment | Married | Unmarried |
| Less than High School | 0 (0.0%) | 3 (100.0%) |
| High School Diploma | 16 (100.0%) | 0 (0.0%) |
| College or Associate's Degree | 2 (66.7%) | 1 (33.3%) |
| Bachelor's Degree | 0 (0.0%) | 0 (0.0%) |
| Graduate Degree | 0 (0.0%) | 0 (0.0%) |
| Total | 18 (81.8%) | 4 (18.2%) |
Employment Characteristics in Mecosta
Employment by Class of Employer in Mecosta
Among the 193 employed individuals in Mecosta, private company employees (176 | 91.2%), not-for-profit organizations (9 | 4.7%), and local government employees (4 | 2.1%) make up the most common classes of employment.
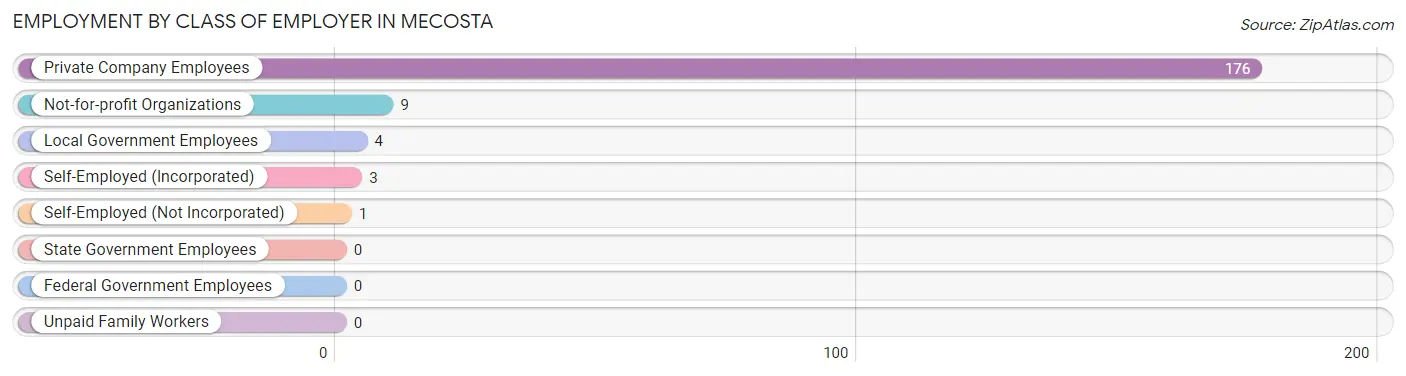
| Employer Class | # Employees | % Employees |
| Private Company Employees | 176 | 91.2% |
| Self-Employed (Incorporated) | 3 | 1.5% |
| Self-Employed (Not Incorporated) | 1 | 0.5% |
| Not-for-profit Organizations | 9 | 4.7% |
| Local Government Employees | 4 | 2.1% |
| State Government Employees | 0 | 0.0% |
| Federal Government Employees | 0 | 0.0% |
| Unpaid Family Workers | 0 | 0.0% |
| Total | 193 | 100.0% |
Employment Status by Age in Mecosta
According to the labor force statistics for Mecosta, out of the total population over 16 years of age (435), 49.7% or 216 individuals are in the labor force, with 10.6% or 23 of them unemployed. The age group with the highest labor force participation rate is 25 to 29 years, with 95.8% or 23 individuals in the labor force. Within the labor force, the 20 to 24 years age range has the highest percentage of unemployed individuals, with 20.0% or 3 of them being unemployed.
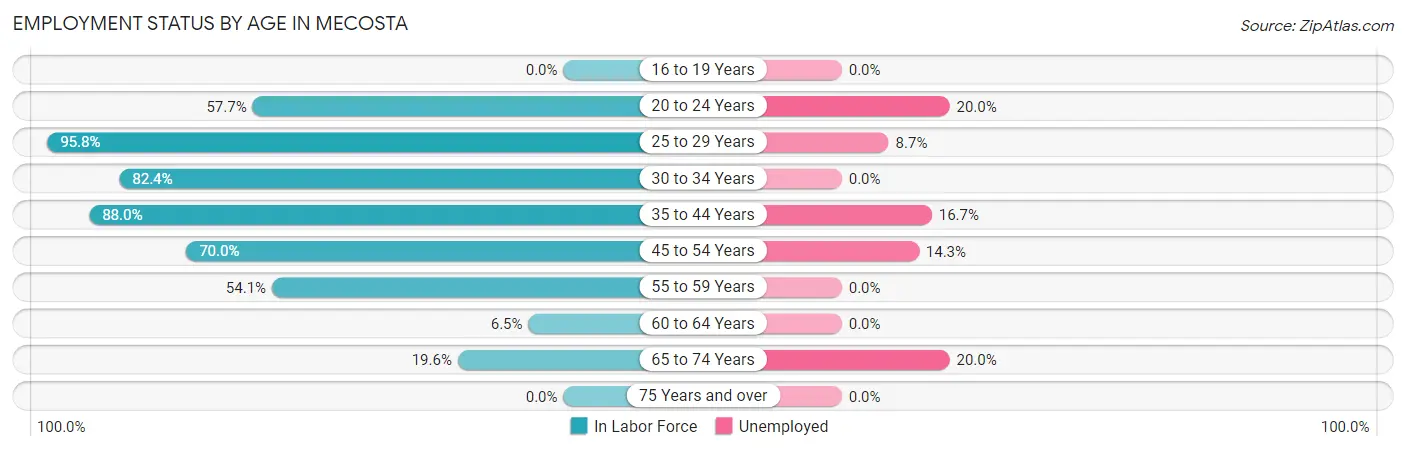
| Age Bracket | In Labor Force | Unemployed |
| 16 to 19 Years | 0 (0.0%) | 0 (0.0%) |
| 20 to 24 Years | 15 (57.7%) | 3 (20.0%) |
| 25 to 29 Years | 23 (95.8%) | 2 (8.7%) |
| 30 to 34 Years | 42 (82.4%) | 0 (0.0%) |
| 35 to 44 Years | 66 (88.0%) | 11 (16.7%) |
| 45 to 54 Years | 35 (70.0%) | 5 (14.3%) |
| 55 to 59 Years | 20 (54.1%) | 0 (0.0%) |
| 60 to 64 Years | 5 (6.5%) | 0 (0.0%) |
| 65 to 74 Years | 10 (19.6%) | 2 (20.0%) |
| 75 Years and over | 0 (0.0%) | 0 (0.0%) |
| Total | 216 (49.7%) | 23 (10.6%) |
Employment Status by Educational Attainment in Mecosta
According to labor force statistics for Mecosta, 60.8% of individuals (191) out of the total population between 25 and 64 years of age (314) are in the labor force, with 9.4% or 18 of them being unemployed. The group with the highest labor force participation rate are those with the educational attainment of college / associate degree, with 81.9% or 59 individuals in the labor force. Within the labor force, individuals with high school diploma education have the highest percentage of unemployment, with 12.6% or 11 of them being unemployed.
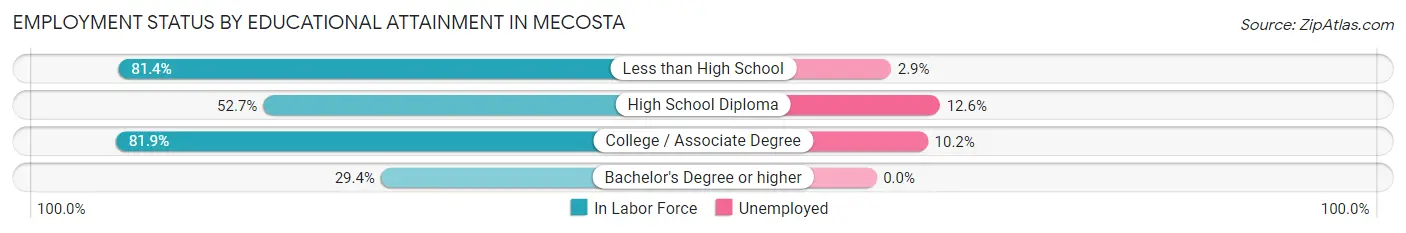
| Educational Attainment | In Labor Force | Unemployed |
| Less than High School | 35 (81.4%) | 1 (2.9%) |
| High School Diploma | 87 (52.7%) | 21 (12.6%) |
| College / Associate Degree | 59 (81.9%) | 7 (10.2%) |
| Bachelor's Degree or higher | 10 (29.4%) | 0 (0.0%) |
| Total | 191 (60.8%) | 30 (9.4%) |
Employment Occupations by Sex in Mecosta
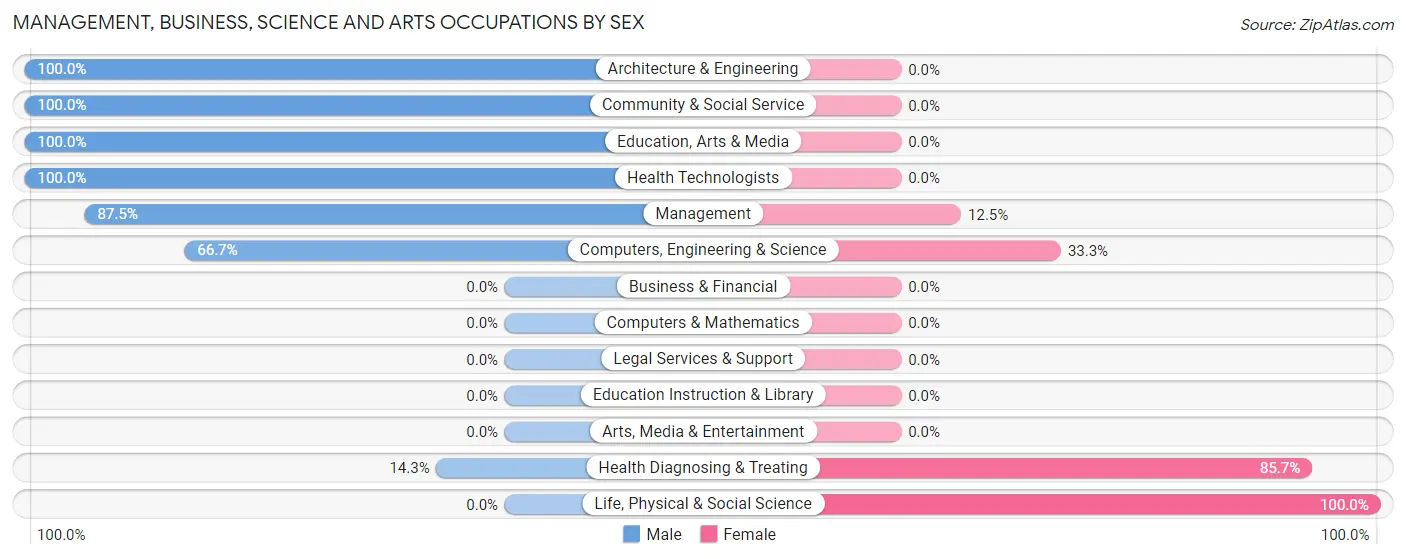
Management, Business, Science and Arts Occupations
The most common Management, Business, Science and Arts occupations in Mecosta are Management (8 | 4.2%), Health Diagnosing & Treating (7 | 3.6%), Computers, Engineering & Science (3 | 1.5%), Architecture & Engineering (2 | 1.0%), and Life, Physical & Social Science (1 | 0.5%).
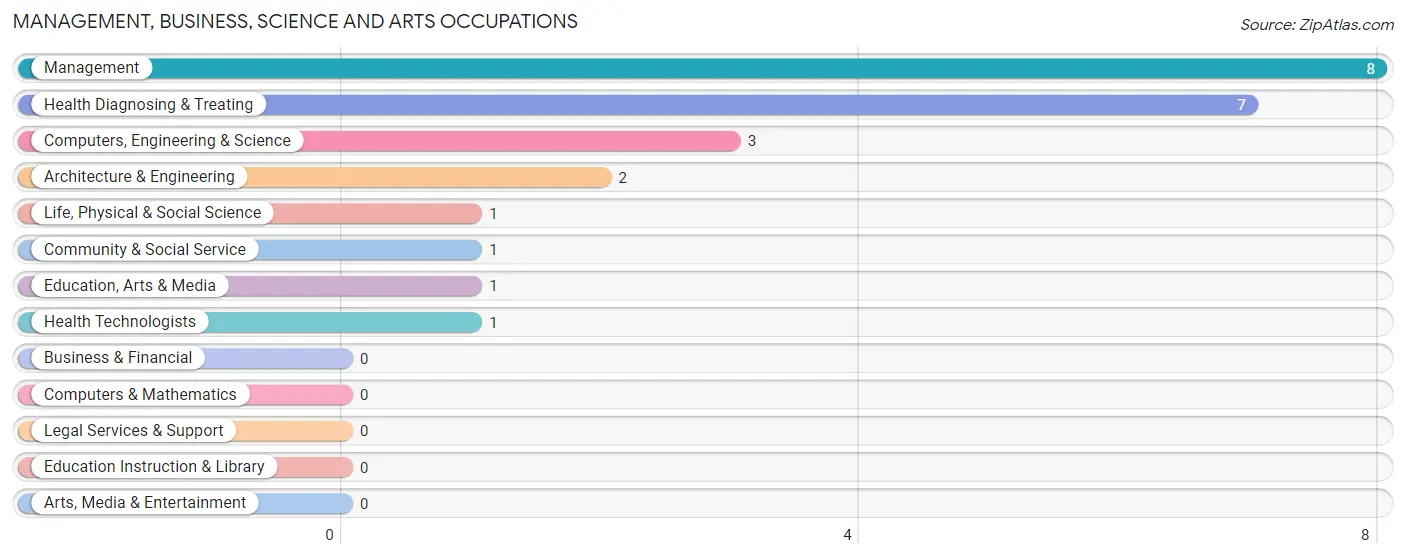
Management, Business, Science and Arts Occupations by Sex
Within the Management, Business, Science and Arts occupations in Mecosta, the most male-oriented occupations are Architecture & Engineering (100.0%), Community & Social Service (100.0%), and Education, Arts & Media (100.0%), while the most female-oriented occupations are Life, Physical & Social Science (100.0%), Health Diagnosing & Treating (85.7%), and Computers, Engineering & Science (33.3%).
| Occupation | Male | Female |
| Management | 7 (87.5%) | 1 (12.5%) |
| Business & Financial | 0 (0.0%) | 0 (0.0%) |
| Computers, Engineering & Science | 2 (66.7%) | 1 (33.3%) |
| Computers & Mathematics | 0 (0.0%) | 0 (0.0%) |
| Architecture & Engineering | 2 (100.0%) | 0 (0.0%) |
| Life, Physical & Social Science | 0 (0.0%) | 1 (100.0%) |
| Community & Social Service | 1 (100.0%) | 0 (0.0%) |
| Education, Arts & Media | 1 (100.0%) | 0 (0.0%) |
| Legal Services & Support | 0 (0.0%) | 0 (0.0%) |
| Education Instruction & Library | 0 (0.0%) | 0 (0.0%) |
| Arts, Media & Entertainment | 0 (0.0%) | 0 (0.0%) |
| Health Diagnosing & Treating | 1 (14.3%) | 6 (85.7%) |
| Health Technologists | 1 (100.0%) | 0 (0.0%) |
| Total (Category) | 11 (57.9%) | 8 (42.1%) |
| Total (Overall) | 99 (51.3%) | 94 (48.7%) |
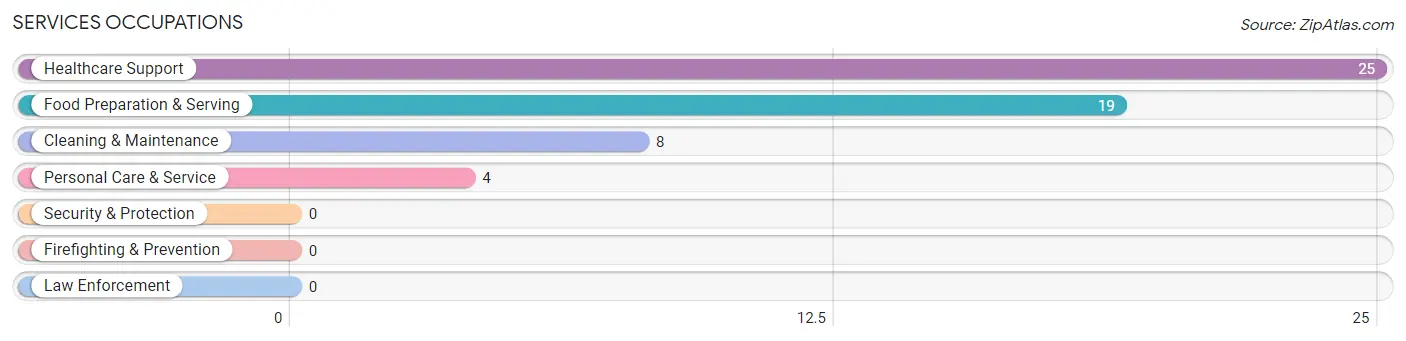
Services Occupations
The most common Services occupations in Mecosta are Healthcare Support (25 | 13.0%), Food Preparation & Serving (19 | 9.8%), Cleaning & Maintenance (8 | 4.2%), and Personal Care & Service (4 | 2.1%).
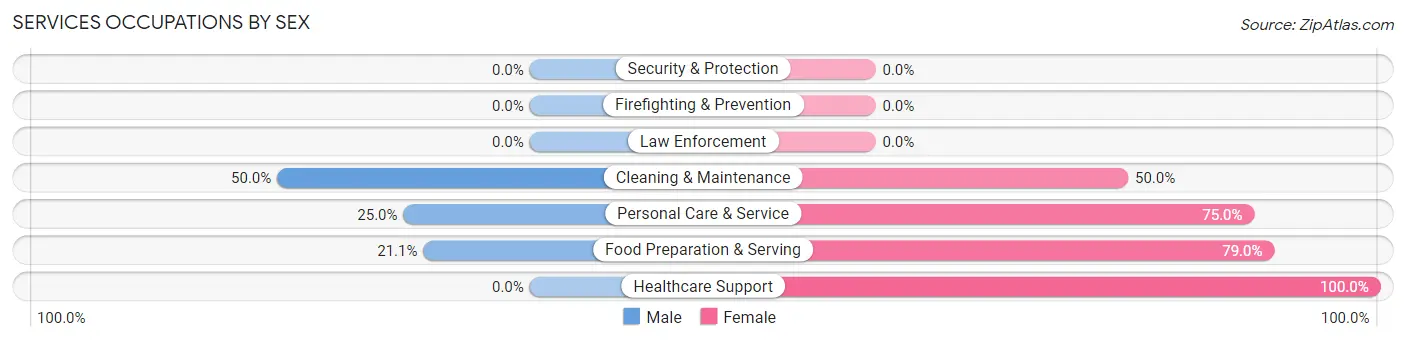
Services Occupations by Sex
Within the Services occupations in Mecosta, the most male-oriented occupations are Cleaning & Maintenance (50.0%), Personal Care & Service (25.0%), and Food Preparation & Serving (21.0%), while the most female-oriented occupations are Healthcare Support (100.0%), Food Preparation & Serving (78.9%), and Personal Care & Service (75.0%).
| Occupation | Male | Female |
| Healthcare Support | 0 (0.0%) | 25 (100.0%) |
| Security & Protection | 0 (0.0%) | 0 (0.0%) |
| Firefighting & Prevention | 0 (0.0%) | 0 (0.0%) |
| Law Enforcement | 0 (0.0%) | 0 (0.0%) |
| Food Preparation & Serving | 4 (21.0%) | 15 (78.9%) |
| Cleaning & Maintenance | 4 (50.0%) | 4 (50.0%) |
| Personal Care & Service | 1 (25.0%) | 3 (75.0%) |
| Total (Category) | 9 (16.1%) | 47 (83.9%) |
| Total (Overall) | 99 (51.3%) | 94 (48.7%) |
Sales and Office Occupations
The most common Sales and Office occupations in Mecosta are Sales & Related (41 | 21.2%), and Office & Administration (3 | 1.5%).

Sales and Office Occupations by Sex

| Occupation | Male | Female |
| Sales & Related | 25 (61.0%) | 16 (39.0%) |
| Office & Administration | 1 (33.3%) | 2 (66.7%) |
| Total (Category) | 26 (59.1%) | 18 (40.9%) |
| Total (Overall) | 99 (51.3%) | 94 (48.7%) |
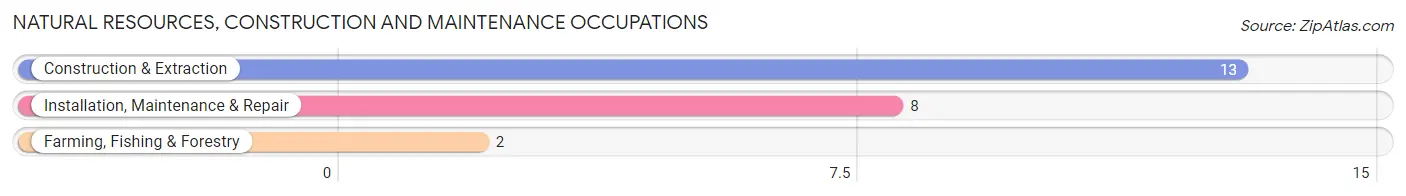
Natural Resources, Construction and Maintenance Occupations
The most common Natural Resources, Construction and Maintenance occupations in Mecosta are Construction & Extraction (13 | 6.7%), Installation, Maintenance & Repair (8 | 4.2%), and Farming, Fishing & Forestry (2 | 1.0%).
Natural Resources, Construction and Maintenance Occupations by Sex
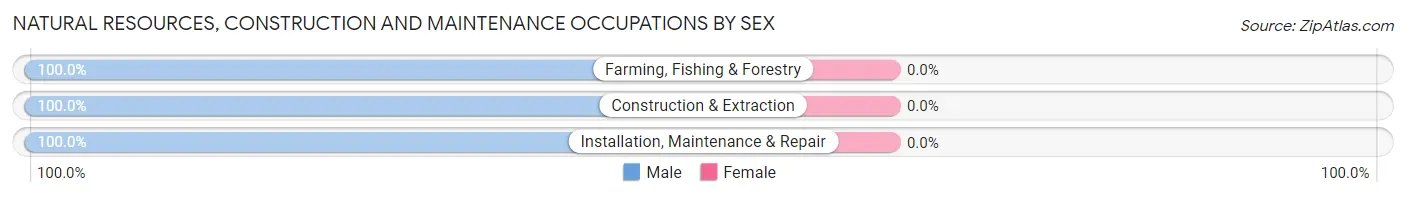
| Occupation | Male | Female |
| Farming, Fishing & Forestry | 2 (100.0%) | 0 (0.0%) |
| Construction & Extraction | 13 (100.0%) | 0 (0.0%) |
| Installation, Maintenance & Repair | 8 (100.0%) | 0 (0.0%) |
| Total (Category) | 23 (100.0%) | 0 (0.0%) |
| Total (Overall) | 99 (51.3%) | 94 (48.7%) |
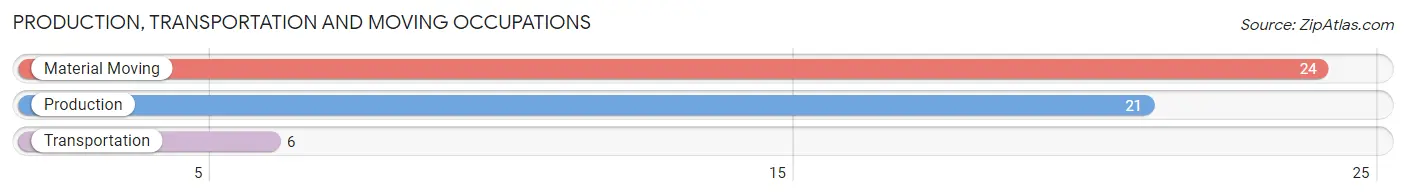
Production, Transportation and Moving Occupations
The most common Production, Transportation and Moving occupations in Mecosta are Material Moving (24 | 12.4%), Production (21 | 10.9%), and Transportation (6 | 3.1%).
Production, Transportation and Moving Occupations by Sex
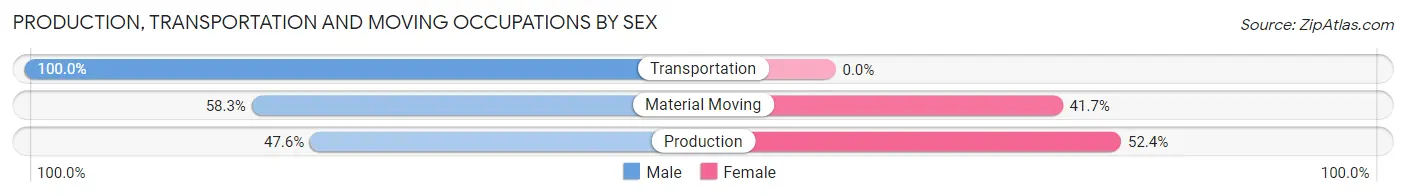
| Occupation | Male | Female |
| Production | 10 (47.6%) | 11 (52.4%) |
| Transportation | 6 (100.0%) | 0 (0.0%) |
| Material Moving | 14 (58.3%) | 10 (41.7%) |
| Total (Category) | 30 (58.8%) | 21 (41.2%) |
| Total (Overall) | 99 (51.3%) | 94 (48.7%) |
Employment Industries by Sex in Mecosta
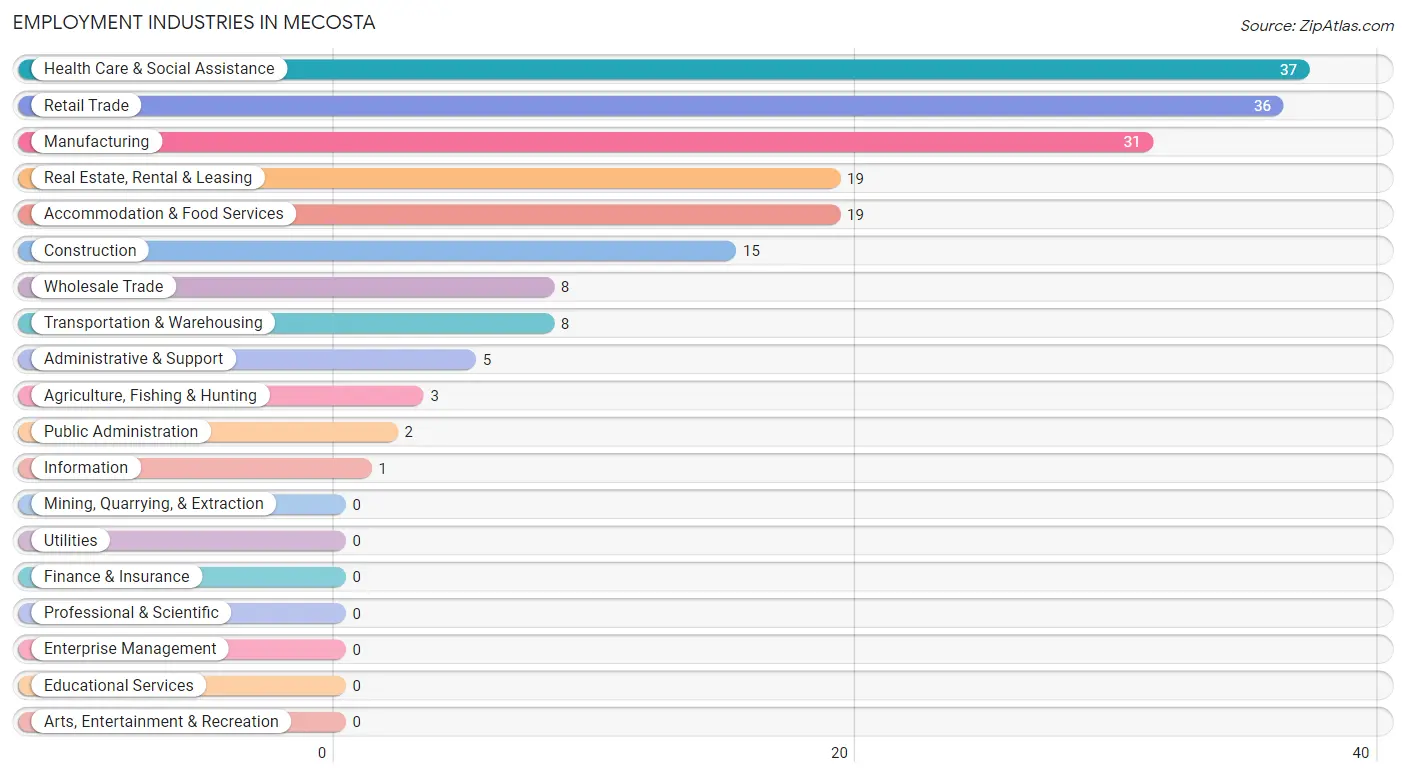
Employment Industries in Mecosta
The major employment industries in Mecosta include Health Care & Social Assistance (37 | 19.2%), Retail Trade (36 | 18.6%), Manufacturing (31 | 16.1%), Real Estate, Rental & Leasing (19 | 9.8%), and Accommodation & Food Services (19 | 9.8%).
Employment Industries by Sex in Mecosta
The Mecosta industries that see more men than women are Agriculture, Fishing & Hunting (100.0%), Construction (100.0%), and Wholesale Trade (100.0%), whereas the industries that tend to have a higher number of women are Accommodation & Food Services (100.0%), Public Administration (100.0%), and Health Care & Social Assistance (89.2%).
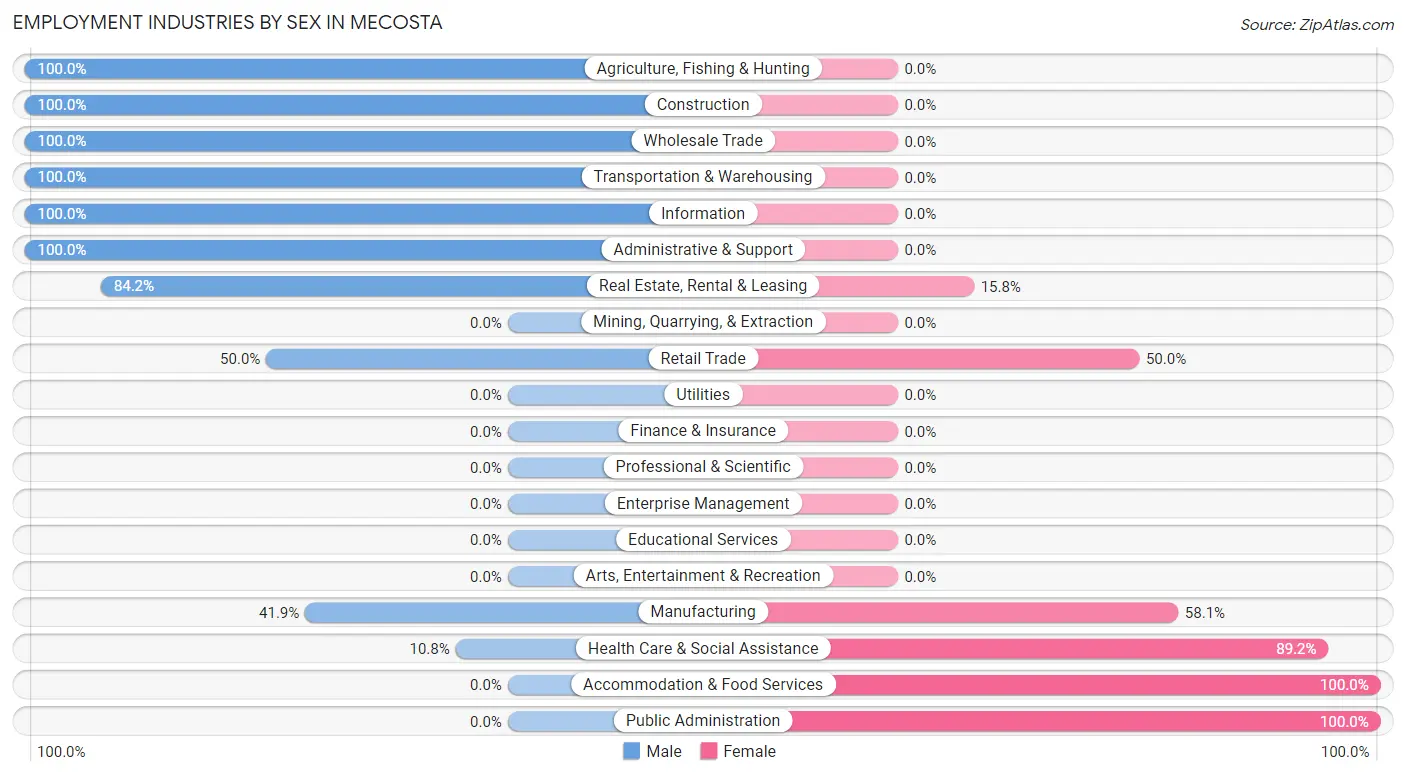
| Industry | Male | Female |
| Agriculture, Fishing & Hunting | 3 (100.0%) | 0 (0.0%) |
| Mining, Quarrying, & Extraction | 0 (0.0%) | 0 (0.0%) |
| Construction | 15 (100.0%) | 0 (0.0%) |
| Manufacturing | 13 (41.9%) | 18 (58.1%) |
| Wholesale Trade | 8 (100.0%) | 0 (0.0%) |
| Retail Trade | 18 (50.0%) | 18 (50.0%) |
| Transportation & Warehousing | 8 (100.0%) | 0 (0.0%) |
| Utilities | 0 (0.0%) | 0 (0.0%) |
| Information | 1 (100.0%) | 0 (0.0%) |
| Finance & Insurance | 0 (0.0%) | 0 (0.0%) |
| Real Estate, Rental & Leasing | 16 (84.2%) | 3 (15.8%) |
| Professional & Scientific | 0 (0.0%) | 0 (0.0%) |
| Enterprise Management | 0 (0.0%) | 0 (0.0%) |
| Administrative & Support | 5 (100.0%) | 0 (0.0%) |
| Educational Services | 0 (0.0%) | 0 (0.0%) |
| Health Care & Social Assistance | 4 (10.8%) | 33 (89.2%) |
| Arts, Entertainment & Recreation | 0 (0.0%) | 0 (0.0%) |
| Accommodation & Food Services | 0 (0.0%) | 19 (100.0%) |
| Public Administration | 0 (0.0%) | 2 (100.0%) |
| Total | 99 (51.3%) | 94 (48.7%) |
Education in Mecosta
School Enrollment in Mecosta
The most common levels of schooling among the 57 students in Mecosta are high school (22 | 38.6%), middle school (14 | 24.6%), and elementary school (11 | 19.3%).
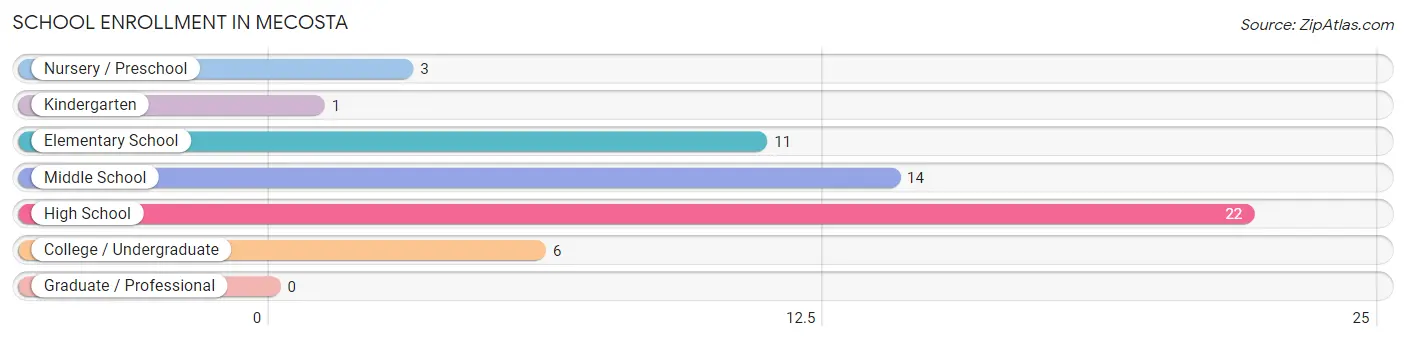
| School Level | # Students | % Students |
| Nursery / Preschool | 3 | 5.3% |
| Kindergarten | 1 | 1.8% |
| Elementary School | 11 | 19.3% |
| Middle School | 14 | 24.6% |
| High School | 22 | 38.6% |
| College / Undergraduate | 6 | 10.5% |
| Graduate / Professional | 0 | 0.0% |
| Total | 57 | 100.0% |
School Enrollment by Age by Funding Source in Mecosta
Out of a total of 57 students who are enrolled in schools in Mecosta, 2 (3.5%) attend a private institution, while the remaining 55 (96.5%) are enrolled in public schools. The age group of 5 to 9 year old has the highest likelihood of being enrolled in private schools, with 1 (10.0% in the age bracket) enrolled. Conversely, the age group of 3 to 4 year olds has the lowest likelihood of being enrolled in a private school, with 3 (100.0% in the age bracket) attending a public institution.
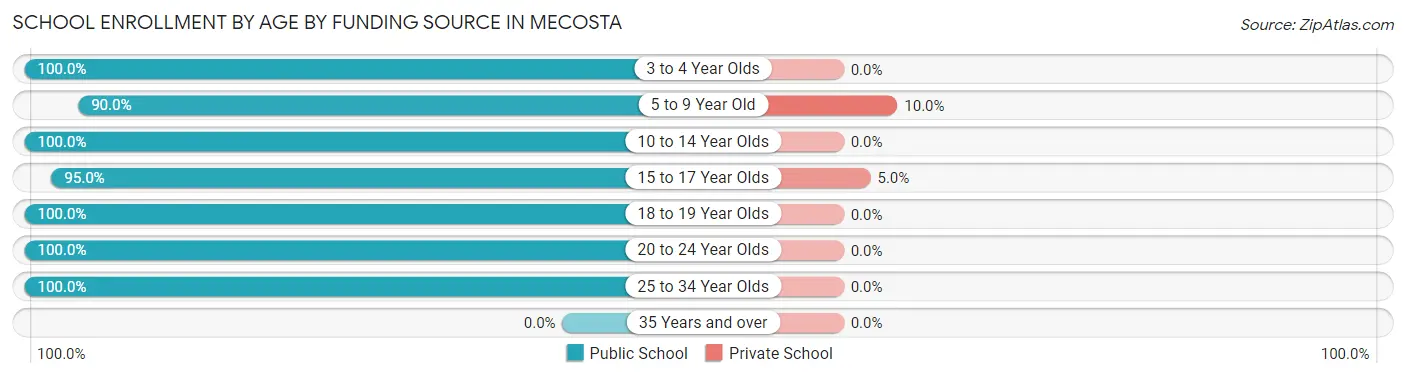
| Age Bracket | Public School | Private School |
| 3 to 4 Year Olds | 3 (100.0%) | 0 (0.0%) |
| 5 to 9 Year Old | 9 (90.0%) | 1 (10.0%) |
| 10 to 14 Year Olds | 16 (100.0%) | 0 (0.0%) |
| 15 to 17 Year Olds | 19 (95.0%) | 1 (5.0%) |
| 18 to 19 Year Olds | 2 (100.0%) | 0 (0.0%) |
| 20 to 24 Year Olds | 1 (100.0%) | 0 (0.0%) |
| 25 to 34 Year Olds | 5 (100.0%) | 0 (0.0%) |
| 35 Years and over | 0 (0.0%) | 0 (0.0%) |
| Total | 55 (96.5%) | 2 (3.5%) |
Educational Attainment by Field of Study in Mecosta
Science & technology (22 | 59.5%), social sciences (9 | 24.3%), arts & humanities (4 | 10.8%), bio, nature & agricultural (1 | 2.7%), and education (1 | 2.7%) are the most common fields of study among 37 individuals in Mecosta who have obtained a bachelor's degree or higher.
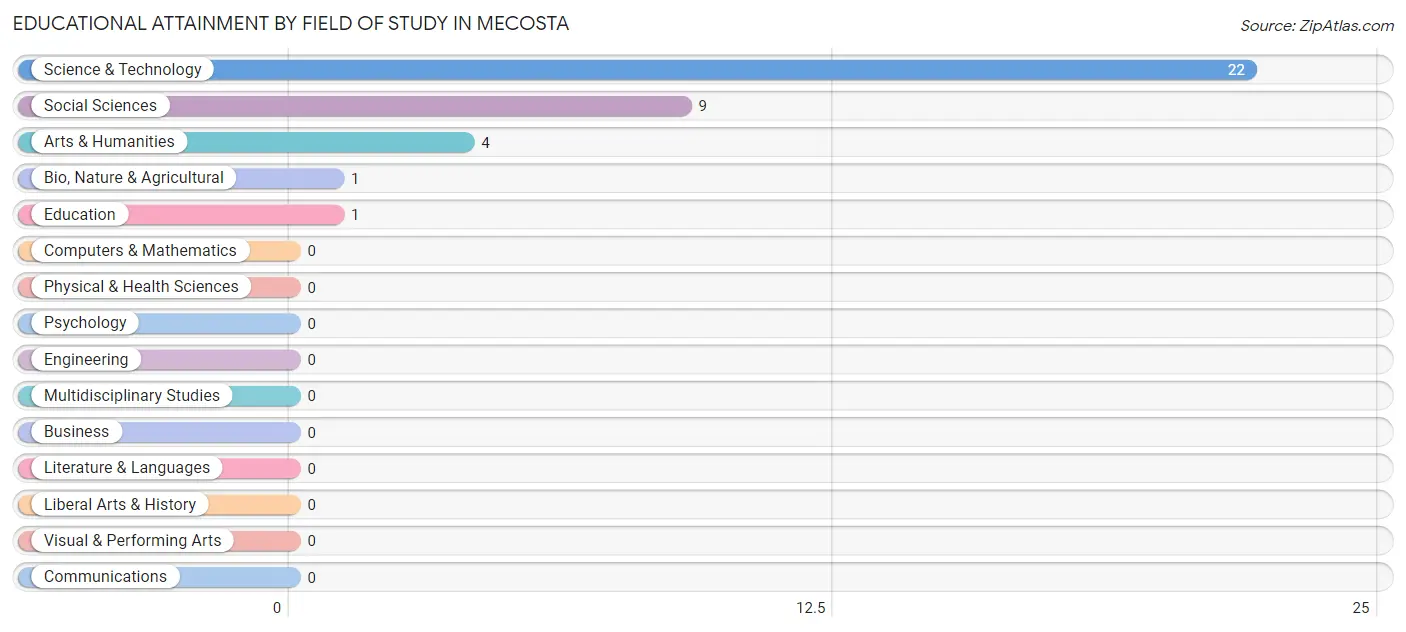
| Field of Study | # Graduates | % Graduates |
| Computers & Mathematics | 0 | 0.0% |
| Bio, Nature & Agricultural | 1 | 2.7% |
| Physical & Health Sciences | 0 | 0.0% |
| Psychology | 0 | 0.0% |
| Social Sciences | 9 | 24.3% |
| Engineering | 0 | 0.0% |
| Multidisciplinary Studies | 0 | 0.0% |
| Science & Technology | 22 | 59.5% |
| Business | 0 | 0.0% |
| Education | 1 | 2.7% |
| Literature & Languages | 0 | 0.0% |
| Liberal Arts & History | 0 | 0.0% |
| Visual & Performing Arts | 0 | 0.0% |
| Communications | 0 | 0.0% |
| Arts & Humanities | 4 | 10.8% |
| Total | 37 | 100.0% |
Transportation & Commute in Mecosta
Vehicle Availability by Sex in Mecosta
The most prevalent vehicle ownership categories in Mecosta are males with 3 vehicles (33, accounting for 33.3%) and females with 3 vehicles (19, making up 35.1%).
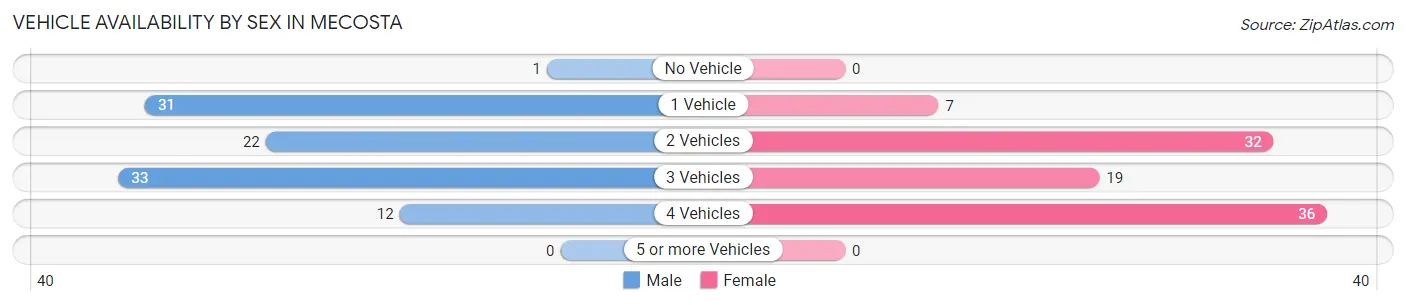
| Vehicles Available | Male | Female |
| No Vehicle | 1 (1.0%) | 0 (0.0%) |
| 1 Vehicle | 31 (31.3%) | 7 (7.4%) |
| 2 Vehicles | 22 (22.2%) | 32 (34.0%) |
| 3 Vehicles | 33 (33.3%) | 19 (20.2%) |
| 4 Vehicles | 12 (12.1%) | 36 (38.3%) |
| 5 or more Vehicles | 0 (0.0%) | 0 (0.0%) |
| Total | 99 (100.0%) | 94 (100.0%) |
Commute Time in Mecosta
The most frequently occuring commute durations in Mecosta are 5 to 9 minutes (50 commuters, 26.2%), 20 to 24 minutes (43 commuters, 22.5%), and 45 to 59 minutes (27 commuters, 14.1%).
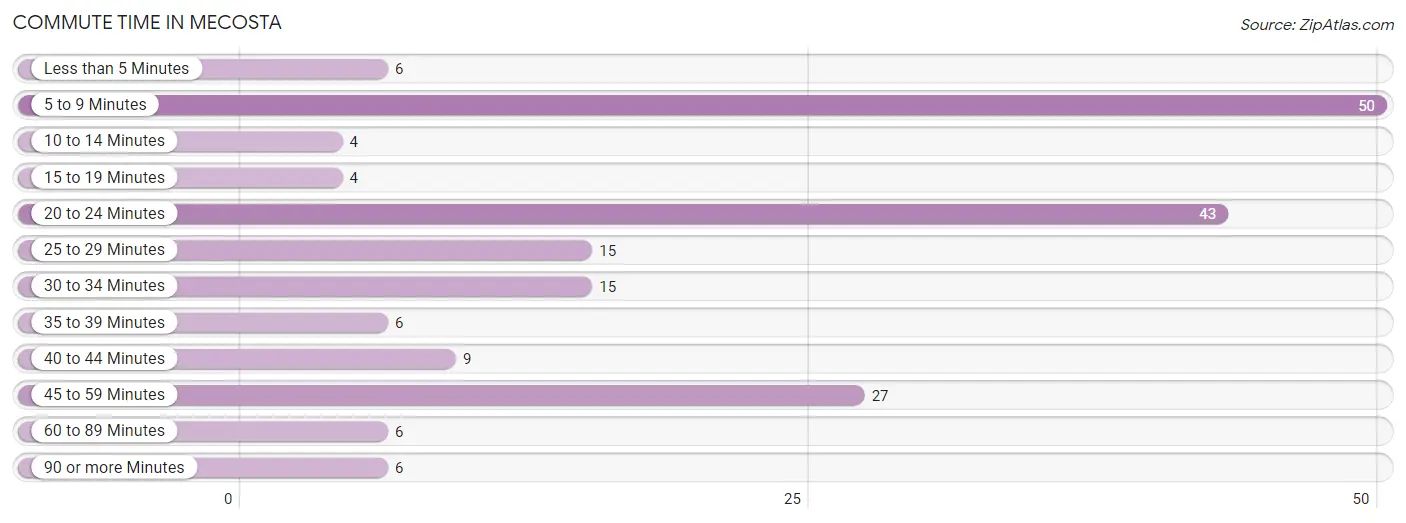
| Commute Time | # Commuters | % Commuters |
| Less than 5 Minutes | 6 | 3.1% |
| 5 to 9 Minutes | 50 | 26.2% |
| 10 to 14 Minutes | 4 | 2.1% |
| 15 to 19 Minutes | 4 | 2.1% |
| 20 to 24 Minutes | 43 | 22.5% |
| 25 to 29 Minutes | 15 | 7.9% |
| 30 to 34 Minutes | 15 | 7.9% |
| 35 to 39 Minutes | 6 | 3.1% |
| 40 to 44 Minutes | 9 | 4.7% |
| 45 to 59 Minutes | 27 | 14.1% |
| 60 to 89 Minutes | 6 | 3.1% |
| 90 or more Minutes | 6 | 3.1% |
Commute Time by Sex in Mecosta
The most common commute times in Mecosta are 5 to 9 minutes (23 commuters, 23.5%) for males and 5 to 9 minutes (27 commuters, 29.0%) for females.
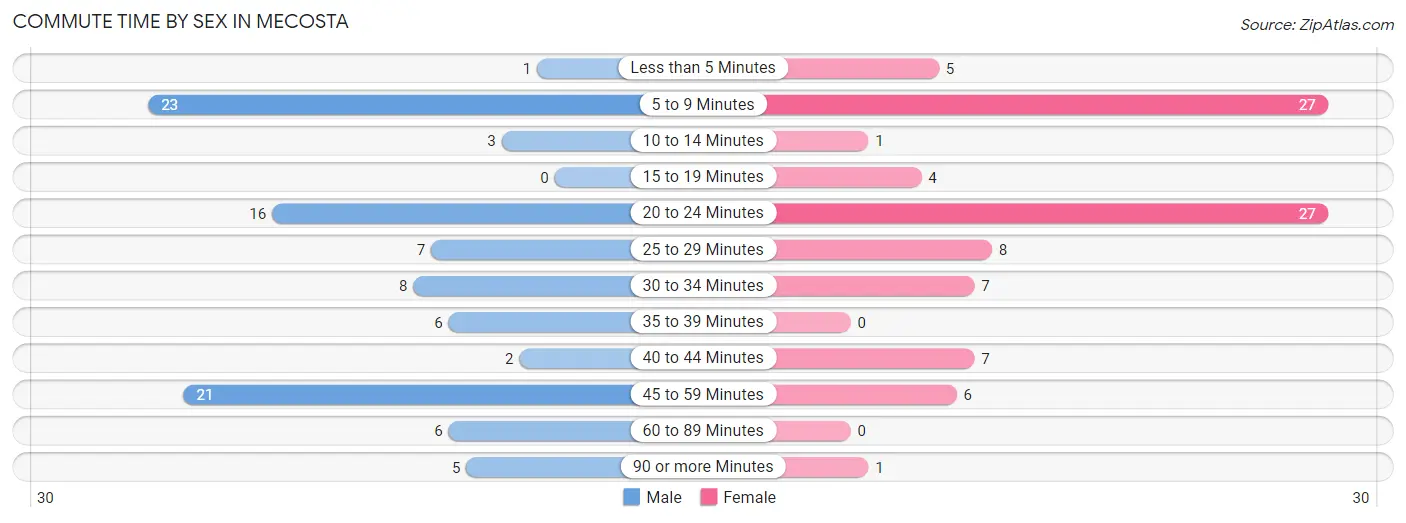
| Commute Time | Male | Female |
| Less than 5 Minutes | 1 (1.0%) | 5 (5.4%) |
| 5 to 9 Minutes | 23 (23.5%) | 27 (29.0%) |
| 10 to 14 Minutes | 3 (3.1%) | 1 (1.1%) |
| 15 to 19 Minutes | 0 (0.0%) | 4 (4.3%) |
| 20 to 24 Minutes | 16 (16.3%) | 27 (29.0%) |
| 25 to 29 Minutes | 7 (7.1%) | 8 (8.6%) |
| 30 to 34 Minutes | 8 (8.2%) | 7 (7.5%) |
| 35 to 39 Minutes | 6 (6.1%) | 0 (0.0%) |
| 40 to 44 Minutes | 2 (2.0%) | 7 (7.5%) |
| 45 to 59 Minutes | 21 (21.4%) | 6 (6.5%) |
| 60 to 89 Minutes | 6 (6.1%) | 0 (0.0%) |
| 90 or more Minutes | 5 (5.1%) | 1 (1.1%) |
Time of Departure to Work by Sex in Mecosta
The most frequent times of departure to work in Mecosta are 12:00 AM to 4:59 AM (27, 27.6%) for males and 6:30 AM to 6:59 AM (27, 29.0%) for females.
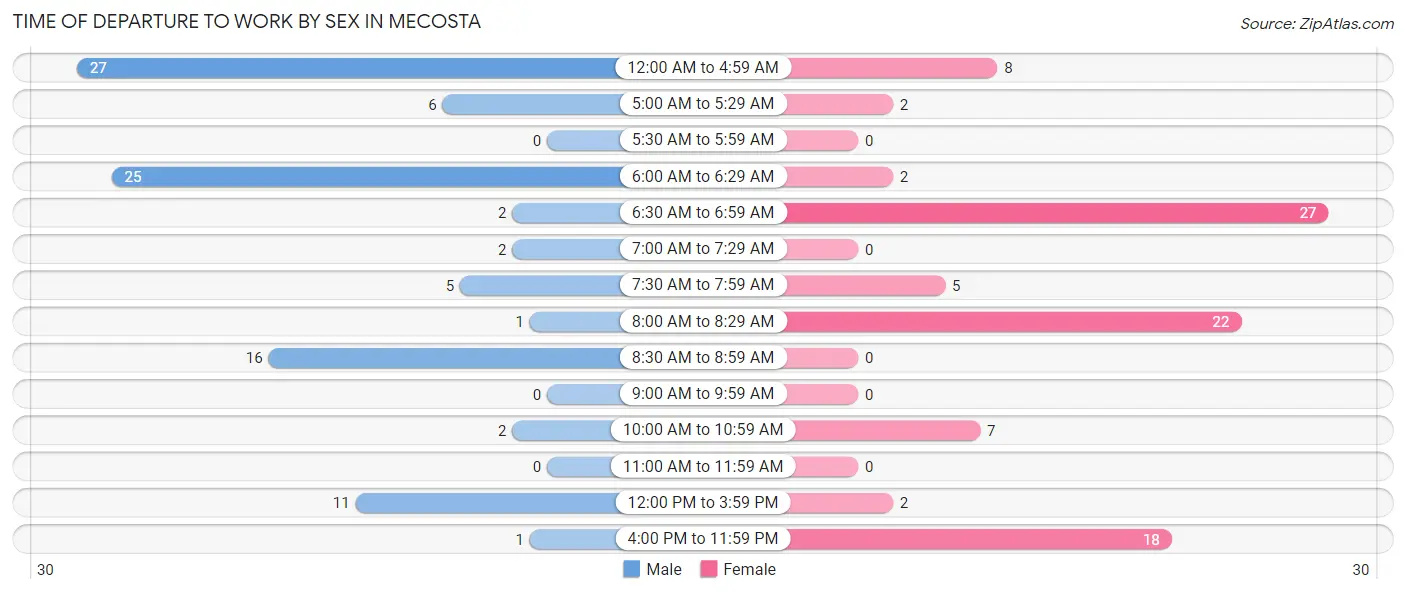
| Time of Departure | Male | Female |
| 12:00 AM to 4:59 AM | 27 (27.6%) | 8 (8.6%) |
| 5:00 AM to 5:29 AM | 6 (6.1%) | 2 (2.1%) |
| 5:30 AM to 5:59 AM | 0 (0.0%) | 0 (0.0%) |
| 6:00 AM to 6:29 AM | 25 (25.5%) | 2 (2.1%) |
| 6:30 AM to 6:59 AM | 2 (2.0%) | 27 (29.0%) |
| 7:00 AM to 7:29 AM | 2 (2.0%) | 0 (0.0%) |
| 7:30 AM to 7:59 AM | 5 (5.1%) | 5 (5.4%) |
| 8:00 AM to 8:29 AM | 1 (1.0%) | 22 (23.7%) |
| 8:30 AM to 8:59 AM | 16 (16.3%) | 0 (0.0%) |
| 9:00 AM to 9:59 AM | 0 (0.0%) | 0 (0.0%) |
| 10:00 AM to 10:59 AM | 2 (2.0%) | 7 (7.5%) |
| 11:00 AM to 11:59 AM | 0 (0.0%) | 0 (0.0%) |
| 12:00 PM to 3:59 PM | 11 (11.2%) | 2 (2.1%) |
| 4:00 PM to 11:59 PM | 1 (1.0%) | 18 (19.4%) |
| Total | 98 (100.0%) | 93 (100.0%) |
Housing Occupancy in Mecosta
Occupancy by Ownership in Mecosta
Of the total 192 dwellings in Mecosta, owner-occupied units account for 169 (88.0%), while renter-occupied units make up 23 (12.0%).
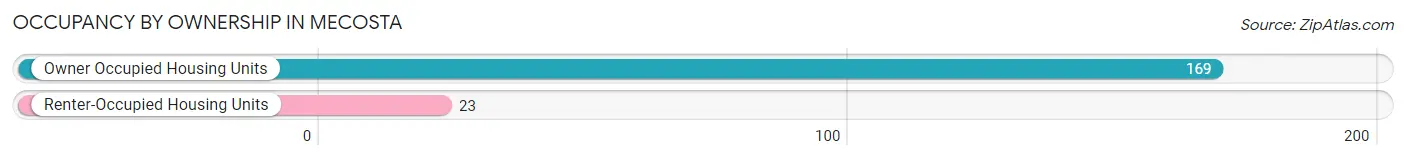
| Occupancy | # Housing Units | % Housing Units |
| Owner Occupied Housing Units | 169 | 88.0% |
| Renter-Occupied Housing Units | 23 | 12.0% |
| Total Occupied Housing Units | 192 | 100.0% |
Occupancy by Household Size in Mecosta
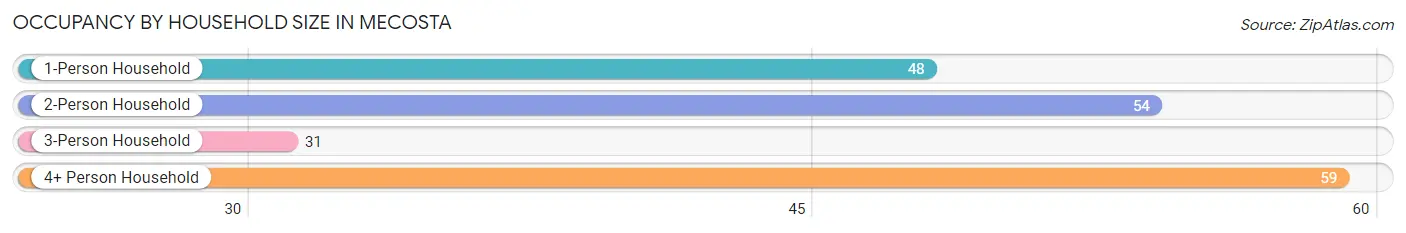
| Household Size | # Housing Units | % Housing Units |
| 1-Person Household | 48 | 25.0% |
| 2-Person Household | 54 | 28.1% |
| 3-Person Household | 31 | 16.2% |
| 4+ Person Household | 59 | 30.7% |
| Total Housing Units | 192 | 100.0% |
Occupancy by Ownership by Household Size in Mecosta
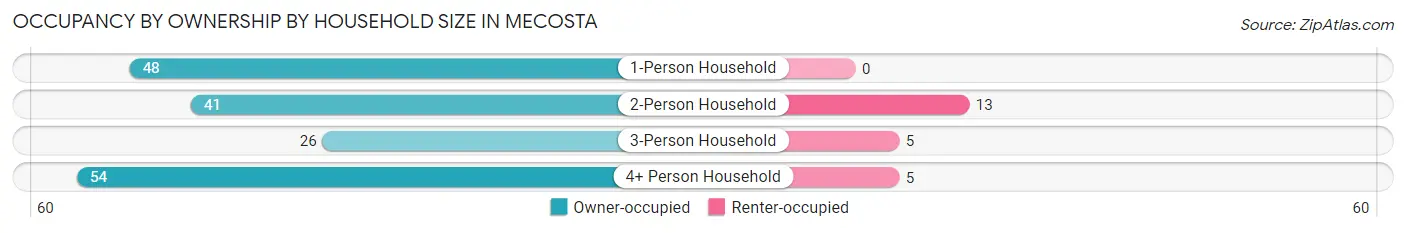
| Household Size | Owner-occupied | Renter-occupied |
| 1-Person Household | 48 (100.0%) | 0 (0.0%) |
| 2-Person Household | 41 (75.9%) | 13 (24.1%) |
| 3-Person Household | 26 (83.9%) | 5 (16.1%) |
| 4+ Person Household | 54 (91.5%) | 5 (8.5%) |
| Total Housing Units | 169 (88.0%) | 23 (12.0%) |
Occupancy by Educational Attainment in Mecosta
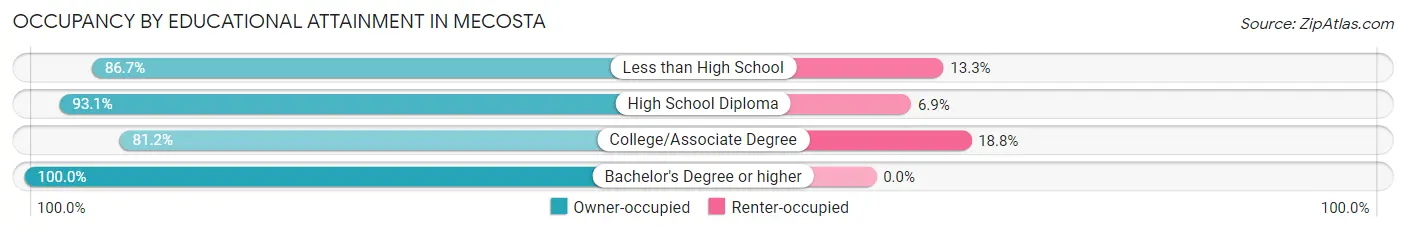
| Household Size | Owner-occupied | Renter-occupied |
| Less than High School | 26 (86.7%) | 4 (13.3%) |
| High School Diploma | 81 (93.1%) | 6 (6.9%) |
| College/Associate Degree | 56 (81.2%) | 13 (18.8%) |
| Bachelor's Degree or higher | 6 (100.0%) | 0 (0.0%) |
Occupancy by Age of Householder in Mecosta
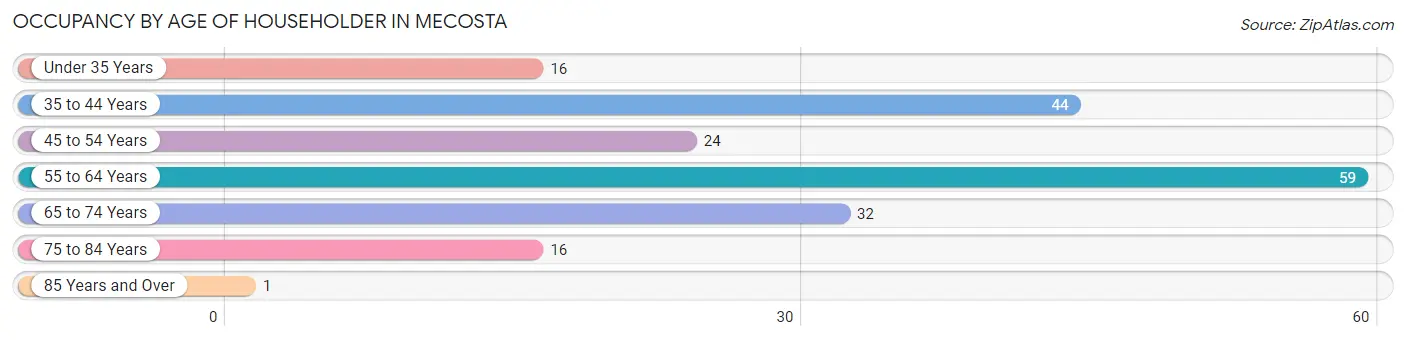
| Age Bracket | # Households | % Households |
| Under 35 Years | 16 | 8.3% |
| 35 to 44 Years | 44 | 22.9% |
| 45 to 54 Years | 24 | 12.5% |
| 55 to 64 Years | 59 | 30.7% |
| 65 to 74 Years | 32 | 16.7% |
| 75 to 84 Years | 16 | 8.3% |
| 85 Years and Over | 1 | 0.5% |
| Total | 192 | 100.0% |
Housing Finances in Mecosta
Median Income by Occupancy in Mecosta
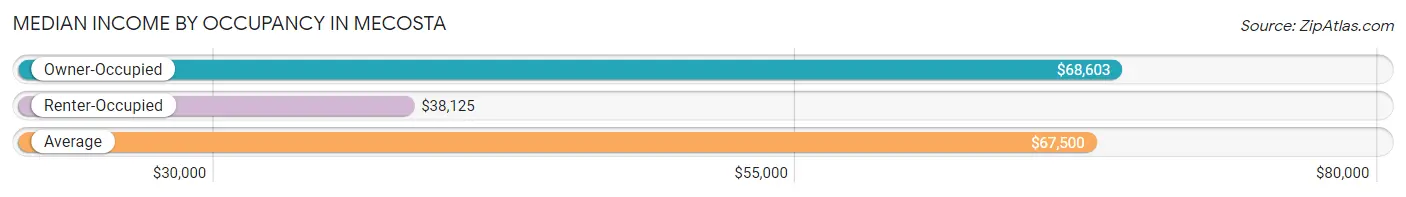
| Occupancy Type | # Households | Median Income |
| Owner-Occupied | 169 (88.0%) | $68,603 |
| Renter-Occupied | 23 (12.0%) | $38,125 |
| Average | 192 (100.0%) | $67,500 |
Occupancy by Householder Income Bracket in Mecosta
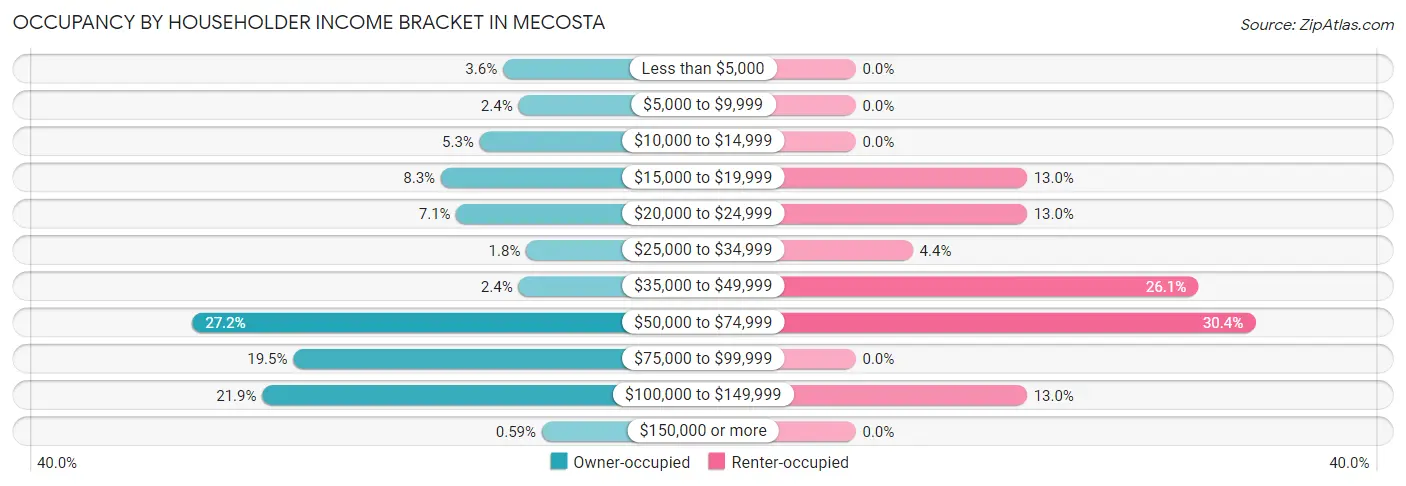
| Income Bracket | Owner-occupied | Renter-occupied |
| Less than $5,000 | 6 (3.5%) | 0 (0.0%) |
| $5,000 to $9,999 | 4 (2.4%) | 0 (0.0%) |
| $10,000 to $14,999 | 9 (5.3%) | 0 (0.0%) |
| $15,000 to $19,999 | 14 (8.3%) | 3 (13.0%) |
| $20,000 to $24,999 | 12 (7.1%) | 3 (13.0%) |
| $25,000 to $34,999 | 3 (1.8%) | 1 (4.3%) |
| $35,000 to $49,999 | 4 (2.4%) | 6 (26.1%) |
| $50,000 to $74,999 | 46 (27.2%) | 7 (30.4%) |
| $75,000 to $99,999 | 33 (19.5%) | 0 (0.0%) |
| $100,000 to $149,999 | 37 (21.9%) | 3 (13.0%) |
| $150,000 or more | 1 (0.6%) | 0 (0.0%) |
| Total | 169 (100.0%) | 23 (100.0%) |
Monthly Housing Cost Tiers in Mecosta
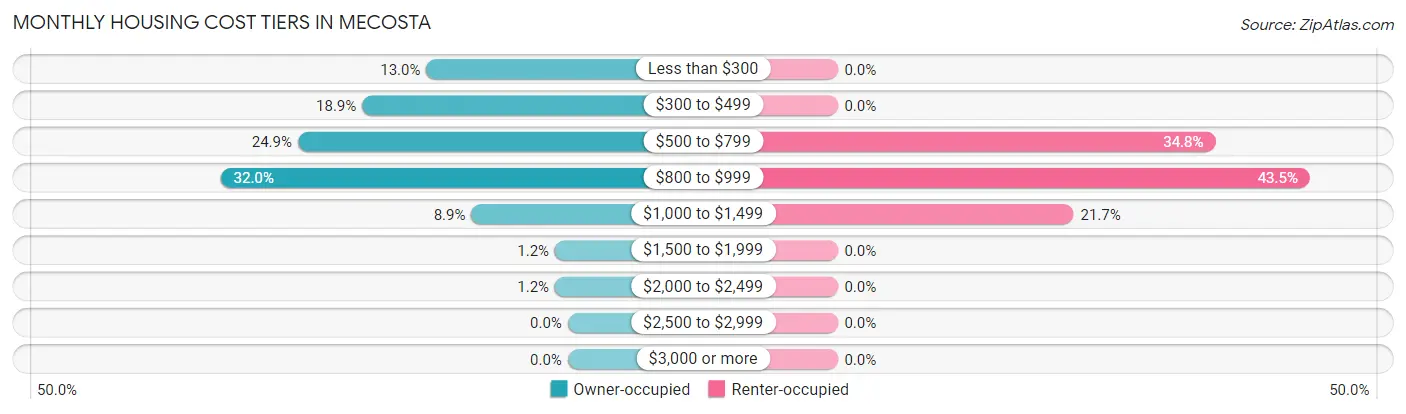
| Monthly Cost | Owner-occupied | Renter-occupied |
| Less than $300 | 22 (13.0%) | 0 (0.0%) |
| $300 to $499 | 32 (18.9%) | 0 (0.0%) |
| $500 to $799 | 42 (24.8%) | 8 (34.8%) |
| $800 to $999 | 54 (32.0%) | 10 (43.5%) |
| $1,000 to $1,499 | 15 (8.9%) | 5 (21.7%) |
| $1,500 to $1,999 | 2 (1.2%) | 0 (0.0%) |
| $2,000 to $2,499 | 2 (1.2%) | 0 (0.0%) |
| $2,500 to $2,999 | 0 (0.0%) | 0 (0.0%) |
| $3,000 or more | 0 (0.0%) | 0 (0.0%) |
| Total | 169 (100.0%) | 23 (100.0%) |
Physical Housing Characteristics in Mecosta
Housing Structures in Mecosta
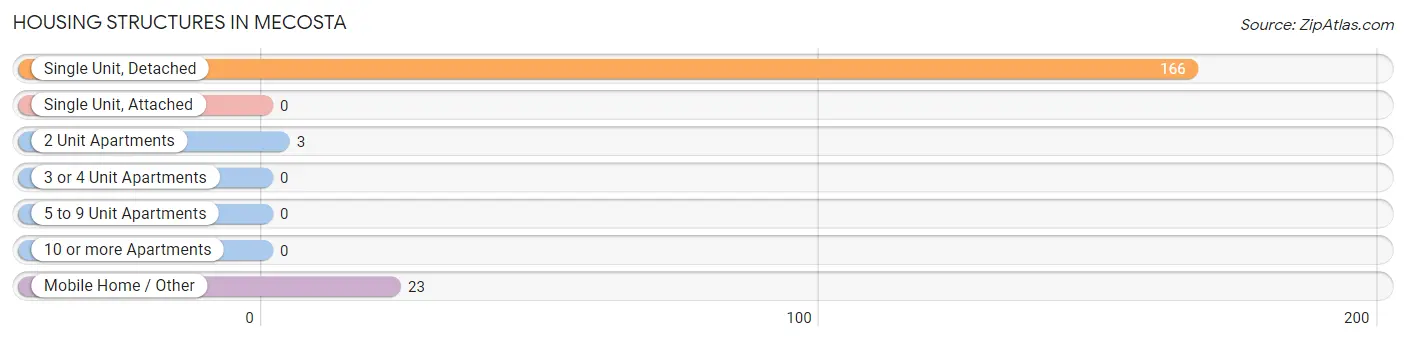
| Structure Type | # Housing Units | % Housing Units |
| Single Unit, Detached | 166 | 86.5% |
| Single Unit, Attached | 0 | 0.0% |
| 2 Unit Apartments | 3 | 1.6% |
| 3 or 4 Unit Apartments | 0 | 0.0% |
| 5 to 9 Unit Apartments | 0 | 0.0% |
| 10 or more Apartments | 0 | 0.0% |
| Mobile Home / Other | 23 | 12.0% |
| Total | 192 | 100.0% |
Housing Structures by Occupancy in Mecosta
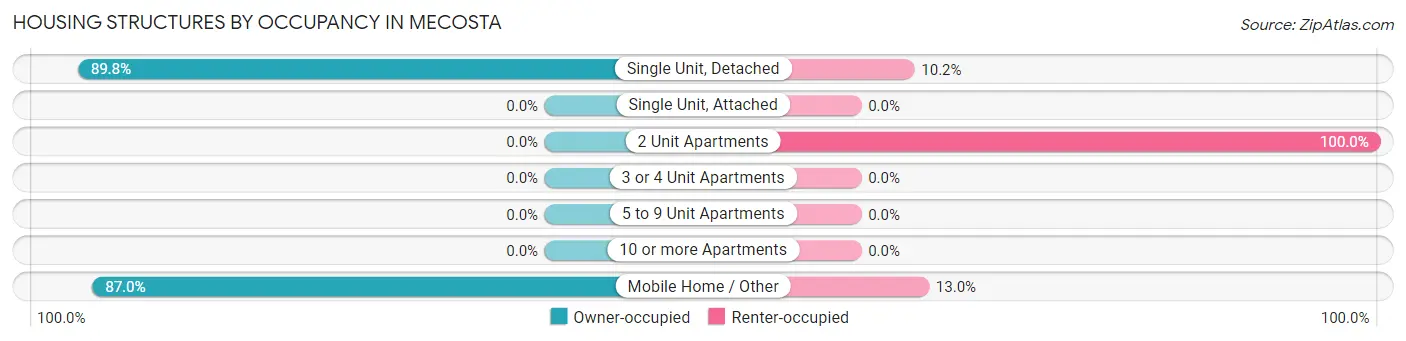
| Structure Type | Owner-occupied | Renter-occupied |
| Single Unit, Detached | 149 (89.8%) | 17 (10.2%) |
| Single Unit, Attached | 0 (0.0%) | 0 (0.0%) |
| 2 Unit Apartments | 0 (0.0%) | 3 (100.0%) |
| 3 or 4 Unit Apartments | 0 (0.0%) | 0 (0.0%) |
| 5 to 9 Unit Apartments | 0 (0.0%) | 0 (0.0%) |
| 10 or more Apartments | 0 (0.0%) | 0 (0.0%) |
| Mobile Home / Other | 20 (87.0%) | 3 (13.0%) |
| Total | 169 (88.0%) | 23 (12.0%) |
Housing Structures by Number of Rooms in Mecosta
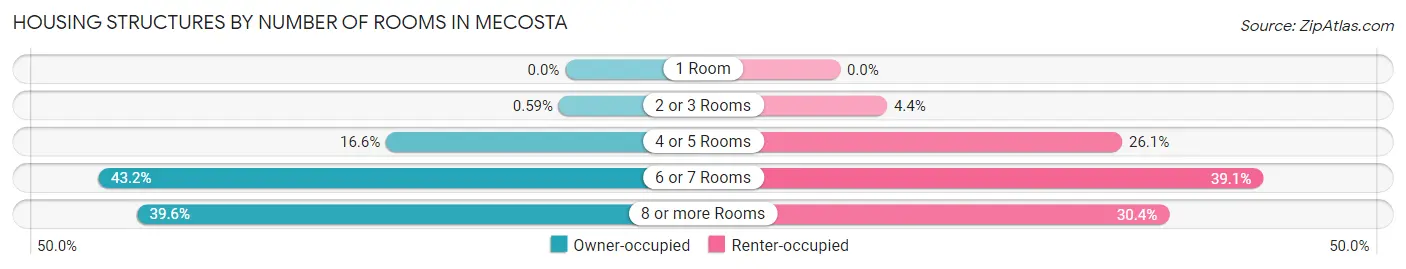
| Number of Rooms | Owner-occupied | Renter-occupied |
| 1 Room | 0 (0.0%) | 0 (0.0%) |
| 2 or 3 Rooms | 1 (0.6%) | 1 (4.3%) |
| 4 or 5 Rooms | 28 (16.6%) | 6 (26.1%) |
| 6 or 7 Rooms | 73 (43.2%) | 9 (39.1%) |
| 8 or more Rooms | 67 (39.6%) | 7 (30.4%) |
| Total | 169 (100.0%) | 23 (100.0%) |
Housing Structure by Heating Type in Mecosta
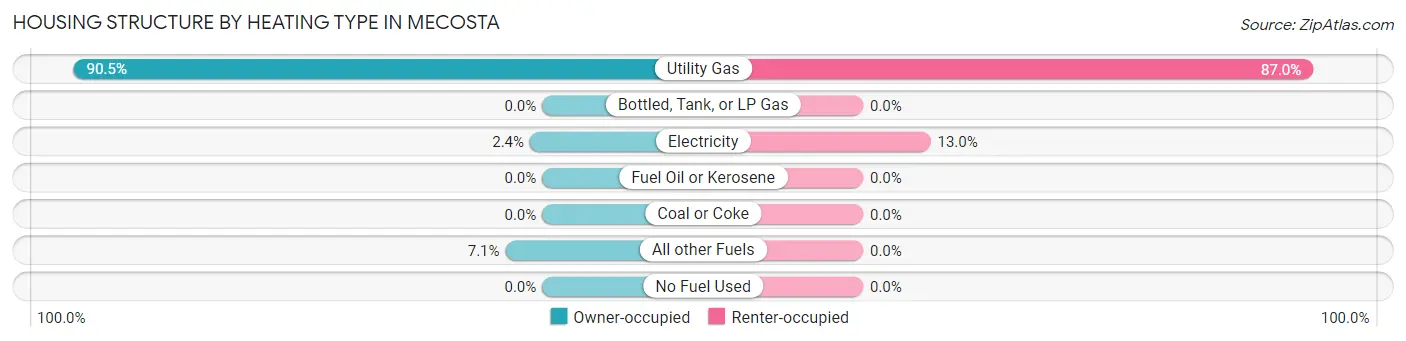
| Heating Type | Owner-occupied | Renter-occupied |
| Utility Gas | 153 (90.5%) | 20 (87.0%) |
| Bottled, Tank, or LP Gas | 0 (0.0%) | 0 (0.0%) |
| Electricity | 4 (2.4%) | 3 (13.0%) |
| Fuel Oil or Kerosene | 0 (0.0%) | 0 (0.0%) |
| Coal or Coke | 0 (0.0%) | 0 (0.0%) |
| All other Fuels | 12 (7.1%) | 0 (0.0%) |
| No Fuel Used | 0 (0.0%) | 0 (0.0%) |
| Total | 169 (100.0%) | 23 (100.0%) |
Household Vehicle Usage in Mecosta
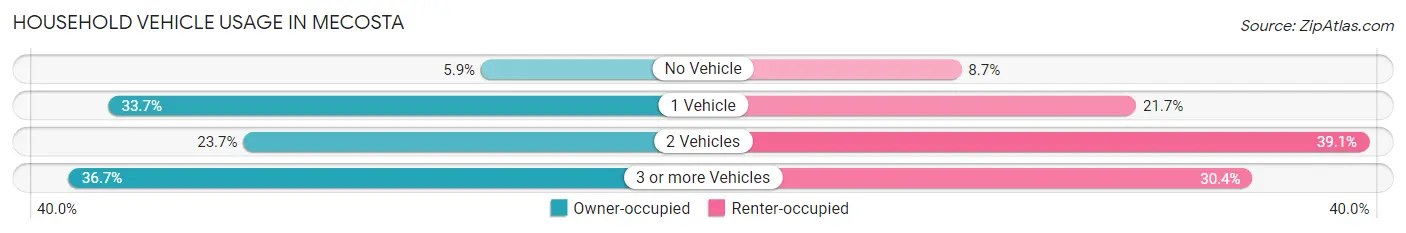
| Vehicles per Household | Owner-occupied | Renter-occupied |
| No Vehicle | 10 (5.9%) | 2 (8.7%) |
| 1 Vehicle | 57 (33.7%) | 5 (21.7%) |
| 2 Vehicles | 40 (23.7%) | 9 (39.1%) |
| 3 or more Vehicles | 62 (36.7%) | 7 (30.4%) |
| Total | 169 (100.0%) | 23 (100.0%) |
Real Estate & Mortgages in Mecosta
Real Estate and Mortgage Overview in Mecosta
| Characteristic | Without Mortgage | With Mortgage |
| Housing Units | 66 | 103 |
| Median Property Value | $70,000 | $95,000 |
| Median Household Income | $67,143 | $0 |
| Monthly Housing Costs | $370 | $0 |
| Real Estate Taxes | $737 | $6 |
Property Value by Mortgage Status in Mecosta
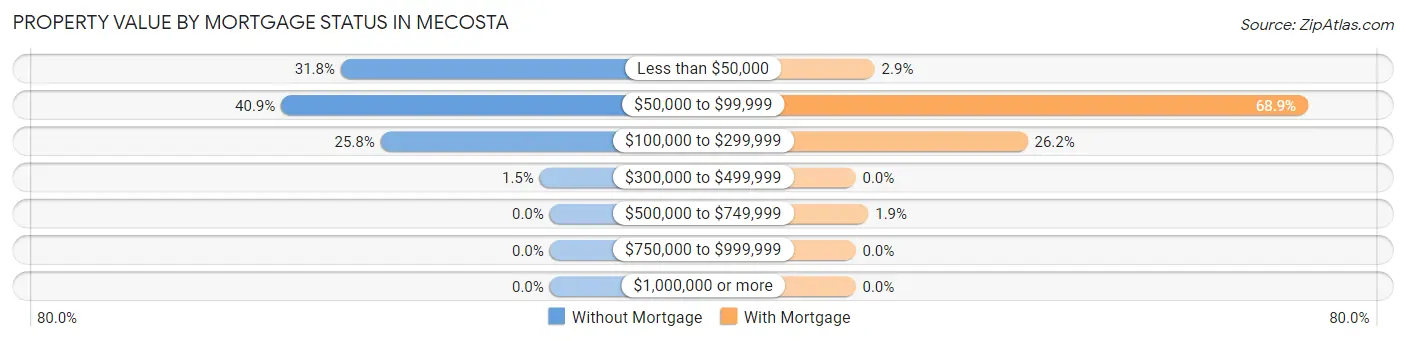
| Property Value | Without Mortgage | With Mortgage |
| Less than $50,000 | 21 (31.8%) | 3 (2.9%) |
| $50,000 to $99,999 | 27 (40.9%) | 71 (68.9%) |
| $100,000 to $299,999 | 17 (25.8%) | 27 (26.2%) |
| $300,000 to $499,999 | 1 (1.5%) | 0 (0.0%) |
| $500,000 to $749,999 | 0 (0.0%) | 2 (1.9%) |
| $750,000 to $999,999 | 0 (0.0%) | 0 (0.0%) |
| $1,000,000 or more | 0 (0.0%) | 0 (0.0%) |
| Total | 66 (100.0%) | 103 (100.0%) |
Household Income by Mortgage Status in Mecosta
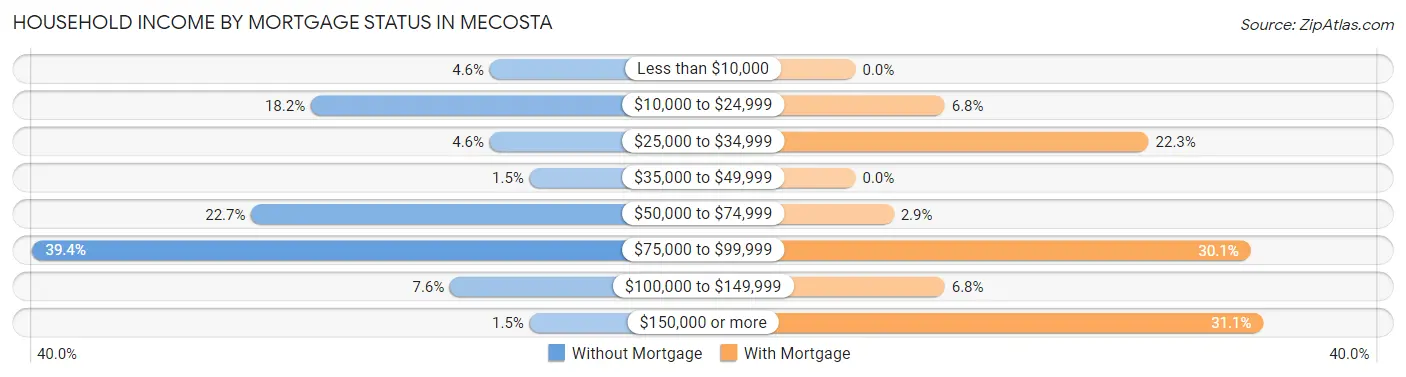
| Household Income | Without Mortgage | With Mortgage |
| Less than $10,000 | 3 (4.5%) | 0 (0.0%) |
| $10,000 to $24,999 | 12 (18.2%) | 7 (6.8%) |
| $25,000 to $34,999 | 3 (4.5%) | 23 (22.3%) |
| $35,000 to $49,999 | 1 (1.5%) | 0 (0.0%) |
| $50,000 to $74,999 | 15 (22.7%) | 3 (2.9%) |
| $75,000 to $99,999 | 26 (39.4%) | 31 (30.1%) |
| $100,000 to $149,999 | 5 (7.6%) | 7 (6.8%) |
| $150,000 or more | 1 (1.5%) | 32 (31.1%) |
| Total | 66 (100.0%) | 103 (100.0%) |
Property Value to Household Income Ratio in Mecosta
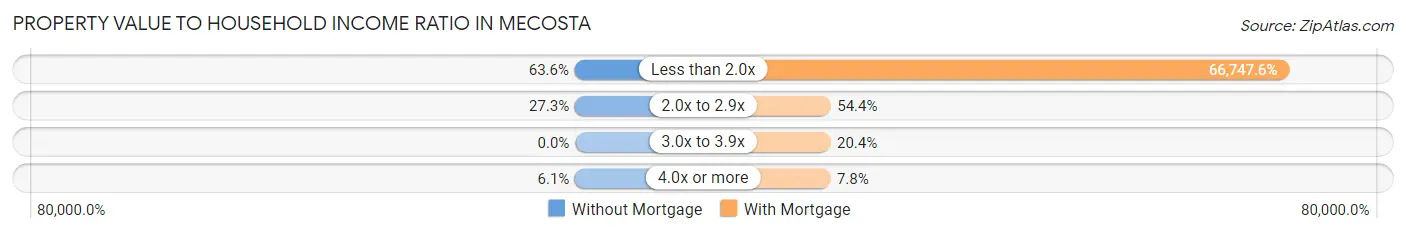
| Value-to-Income Ratio | Without Mortgage | With Mortgage |
| Less than 2.0x | 42 (63.6%) | 68,750 (66,747.6%) |
| 2.0x to 2.9x | 18 (27.3%) | 56 (54.4%) |
| 3.0x to 3.9x | 0 (0.0%) | 21 (20.4%) |
| 4.0x or more | 4 (6.1%) | 8 (7.8%) |
| Total | 66 (100.0%) | 103 (100.0%) |
Real Estate Taxes by Mortgage Status in Mecosta
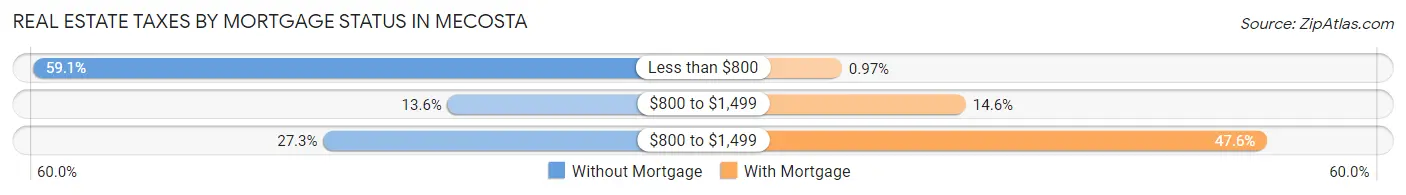
| Property Taxes | Without Mortgage | With Mortgage |
| Less than $800 | 39 (59.1%) | 1 (1.0%) |
| $800 to $1,499 | 9 (13.6%) | 15 (14.6%) |
| $800 to $1,499 | 18 (27.3%) | 49 (47.6%) |
| Total | 66 (100.0%) | 103 (100.0%) |
Health & Disability in Mecosta
Health Insurance Coverage by Age in Mecosta
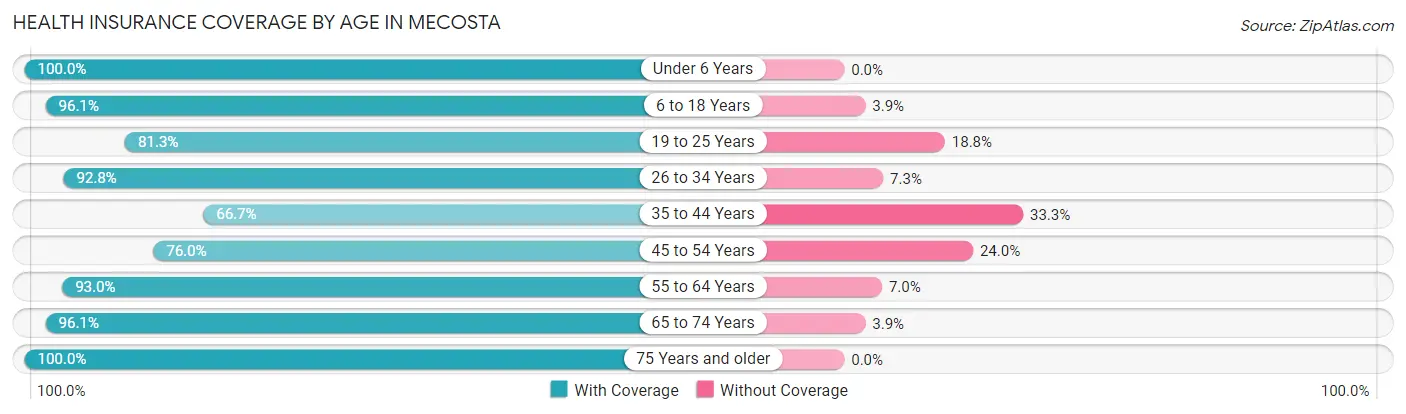
| Age Bracket | With Coverage | Without Coverage |
| Under 6 Years | 37 (100.0%) | 0 (0.0%) |
| 6 to 18 Years | 49 (96.1%) | 2 (3.9%) |
| 19 to 25 Years | 26 (81.2%) | 6 (18.8%) |
| 26 to 34 Years | 64 (92.7%) | 5 (7.2%) |
| 35 to 44 Years | 50 (66.7%) | 25 (33.3%) |
| 45 to 54 Years | 38 (76.0%) | 12 (24.0%) |
| 55 to 64 Years | 106 (93.0%) | 8 (7.0%) |
| 65 to 74 Years | 49 (96.1%) | 2 (3.9%) |
| 75 Years and older | 26 (100.0%) | 0 (0.0%) |
| Total | 445 (88.1%) | 60 (11.9%) |
Health Insurance Coverage by Citizenship Status in Mecosta
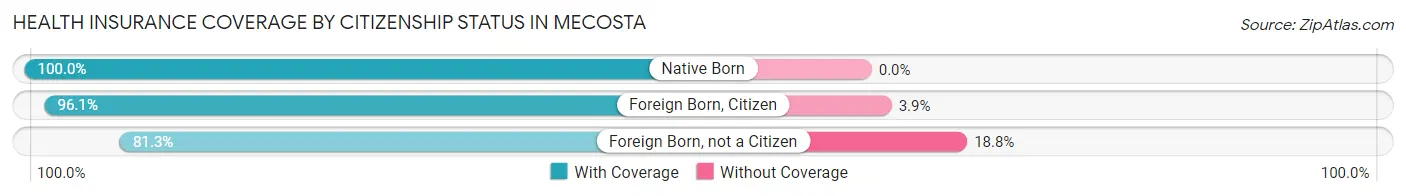
| Citizenship Status | With Coverage | Without Coverage |
| Native Born | 37 (100.0%) | 0 (0.0%) |
| Foreign Born, Citizen | 49 (96.1%) | 2 (3.9%) |
| Foreign Born, not a Citizen | 26 (81.2%) | 6 (18.8%) |
Health Insurance Coverage by Household Income in Mecosta
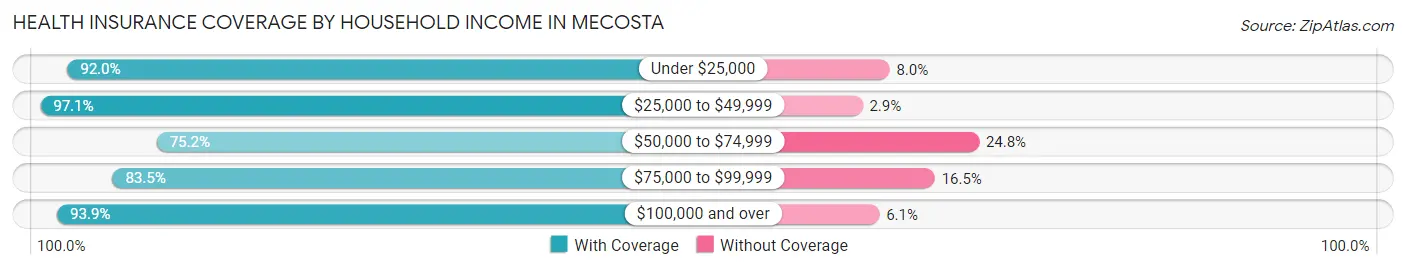
| Household Income | With Coverage | Without Coverage |
| Under $25,000 | 92 (92.0%) | 8 (8.0%) |
| $25,000 to $49,999 | 33 (97.1%) | 1 (2.9%) |
| $50,000 to $74,999 | 79 (75.2%) | 26 (24.8%) |
| $75,000 to $99,999 | 71 (83.5%) | 14 (16.5%) |
| $100,000 and over | 170 (93.9%) | 11 (6.1%) |
Public vs Private Health Insurance Coverage by Age in Mecosta
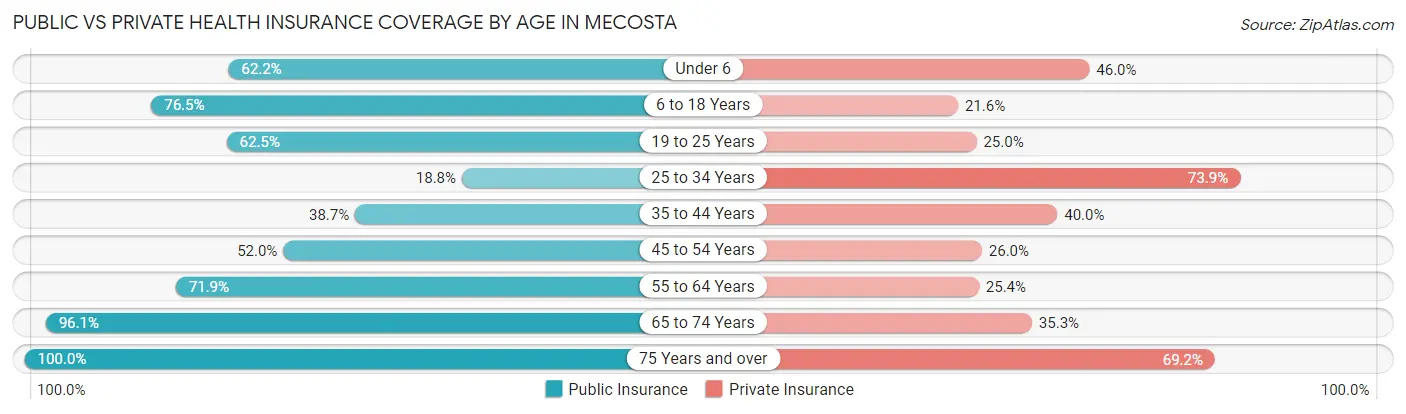
| Age Bracket | Public Insurance | Private Insurance |
| Under 6 | 23 (62.2%) | 17 (46.0%) |
| 6 to 18 Years | 39 (76.5%) | 11 (21.6%) |
| 19 to 25 Years | 20 (62.5%) | 8 (25.0%) |
| 25 to 34 Years | 13 (18.8%) | 51 (73.9%) |
| 35 to 44 Years | 29 (38.7%) | 30 (40.0%) |
| 45 to 54 Years | 26 (52.0%) | 13 (26.0%) |
| 55 to 64 Years | 82 (71.9%) | 29 (25.4%) |
| 65 to 74 Years | 49 (96.1%) | 18 (35.3%) |
| 75 Years and over | 26 (100.0%) | 18 (69.2%) |
| Total | 307 (60.8%) | 195 (38.6%) |
Disability Status by Sex by Age in Mecosta
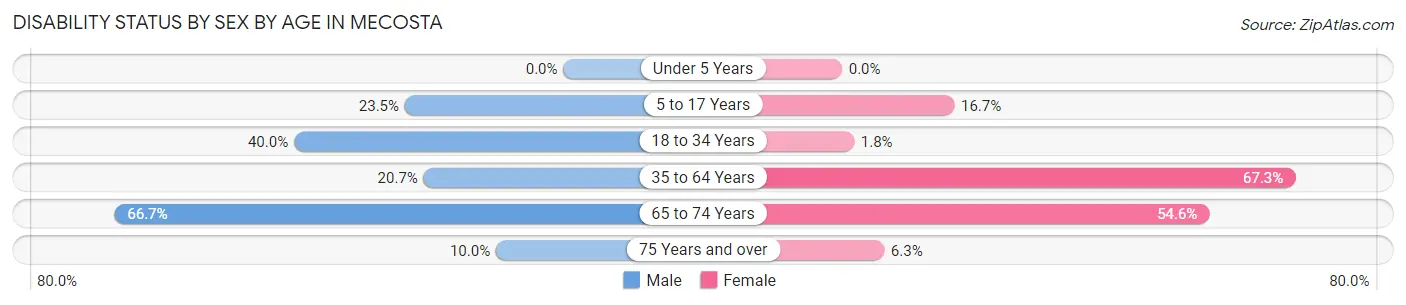
| Age Bracket | Male | Female |
| Under 5 Years | 0 (0.0%) | 0 (0.0%) |
| 5 to 17 Years | 4 (23.5%) | 5 (16.7%) |
| 18 to 34 Years | 20 (40.0%) | 1 (1.8%) |
| 35 to 64 Years | 28 (20.7%) | 70 (67.3%) |
| 65 to 74 Years | 12 (66.7%) | 18 (54.5%) |
| 75 Years and over | 1 (10.0%) | 1 (6.2%) |
Disability Class by Sex by Age in Mecosta
Disability Class: Hearing Difficulty
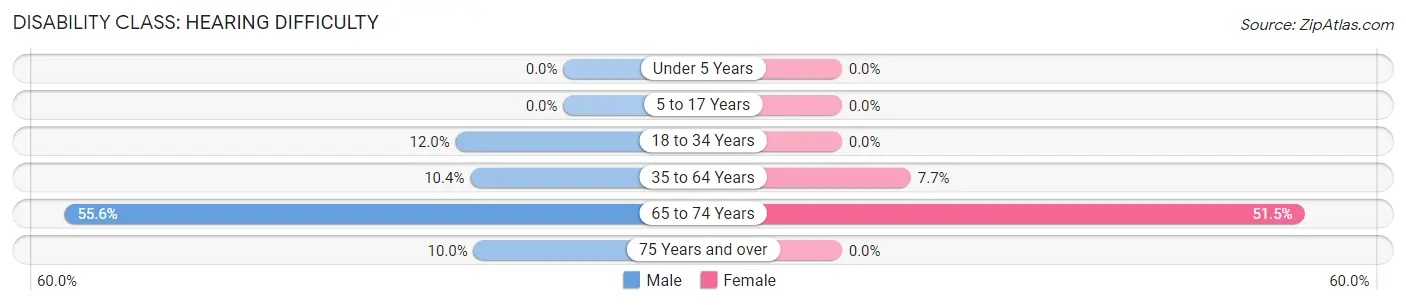
| Age Bracket | Male | Female |
| Under 5 Years | 0 (0.0%) | 0 (0.0%) |
| 5 to 17 Years | 0 (0.0%) | 0 (0.0%) |
| 18 to 34 Years | 6 (12.0%) | 0 (0.0%) |
| 35 to 64 Years | 14 (10.4%) | 8 (7.7%) |
| 65 to 74 Years | 10 (55.6%) | 17 (51.5%) |
| 75 Years and over | 1 (10.0%) | 0 (0.0%) |
Disability Class: Vision Difficulty
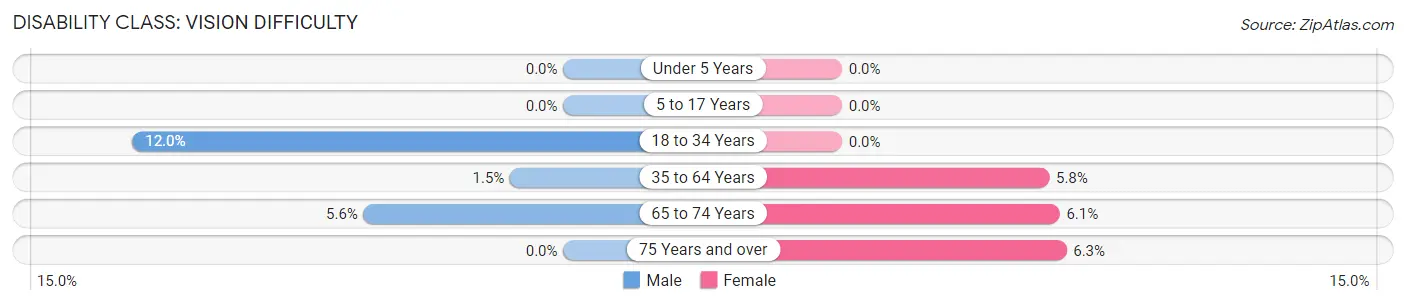
| Age Bracket | Male | Female |
| Under 5 Years | 0 (0.0%) | 0 (0.0%) |
| 5 to 17 Years | 0 (0.0%) | 0 (0.0%) |
| 18 to 34 Years | 6 (12.0%) | 0 (0.0%) |
| 35 to 64 Years | 2 (1.5%) | 6 (5.8%) |
| 65 to 74 Years | 1 (5.6%) | 2 (6.1%) |
| 75 Years and over | 0 (0.0%) | 1 (6.2%) |
Disability Class: Cognitive Difficulty
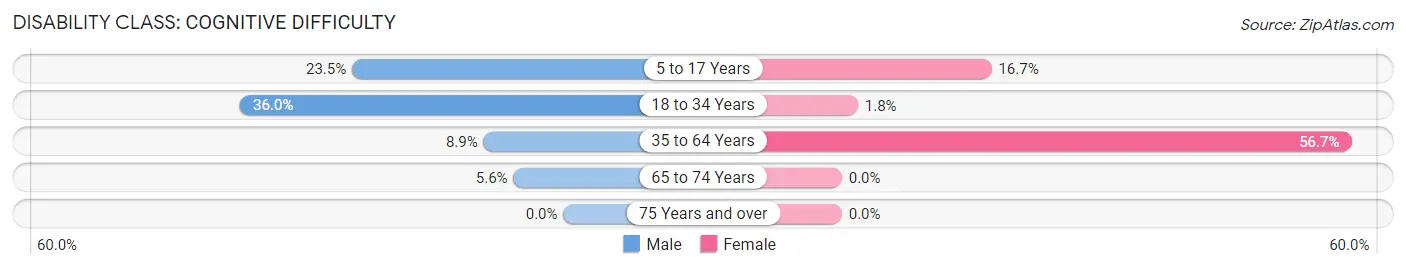
| Age Bracket | Male | Female |
| 5 to 17 Years | 4 (23.5%) | 5 (16.7%) |
| 18 to 34 Years | 18 (36.0%) | 1 (1.8%) |
| 35 to 64 Years | 12 (8.9%) | 59 (56.7%) |
| 65 to 74 Years | 1 (5.6%) | 0 (0.0%) |
| 75 Years and over | 0 (0.0%) | 0 (0.0%) |
Disability Class: Ambulatory Difficulty
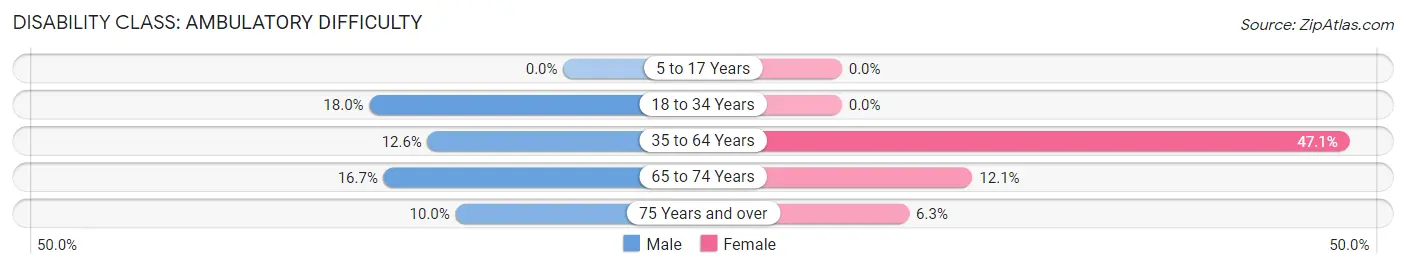
| Age Bracket | Male | Female |
| 5 to 17 Years | 0 (0.0%) | 0 (0.0%) |
| 18 to 34 Years | 9 (18.0%) | 0 (0.0%) |
| 35 to 64 Years | 17 (12.6%) | 49 (47.1%) |
| 65 to 74 Years | 3 (16.7%) | 4 (12.1%) |
| 75 Years and over | 1 (10.0%) | 1 (6.2%) |
Disability Class: Self-Care Difficulty
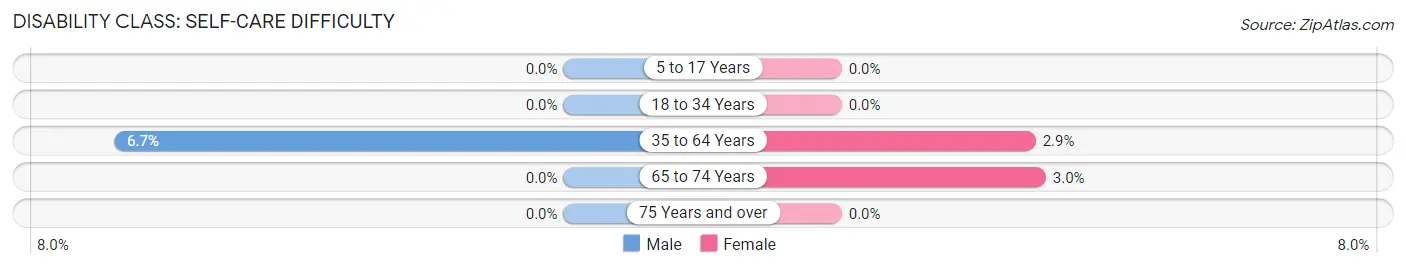
| Age Bracket | Male | Female |
| 5 to 17 Years | 0 (0.0%) | 0 (0.0%) |
| 18 to 34 Years | 0 (0.0%) | 0 (0.0%) |
| 35 to 64 Years | 9 (6.7%) | 3 (2.9%) |
| 65 to 74 Years | 0 (0.0%) | 1 (3.0%) |
| 75 Years and over | 0 (0.0%) | 0 (0.0%) |
Technology Access in Mecosta
Computing Device Access in Mecosta
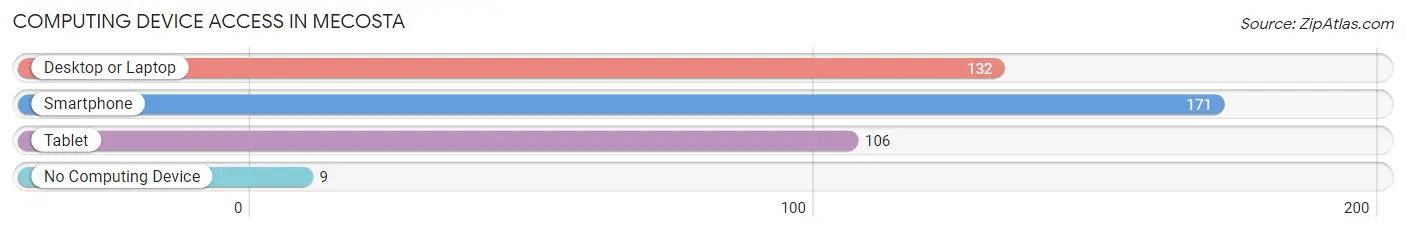
| Device Type | # Households | % Households |
| Desktop or Laptop | 132 | 68.8% |
| Smartphone | 171 | 89.1% |
| Tablet | 106 | 55.2% |
| No Computing Device | 9 | 4.7% |
| Total | 192 | 100.0% |
Internet Access in Mecosta
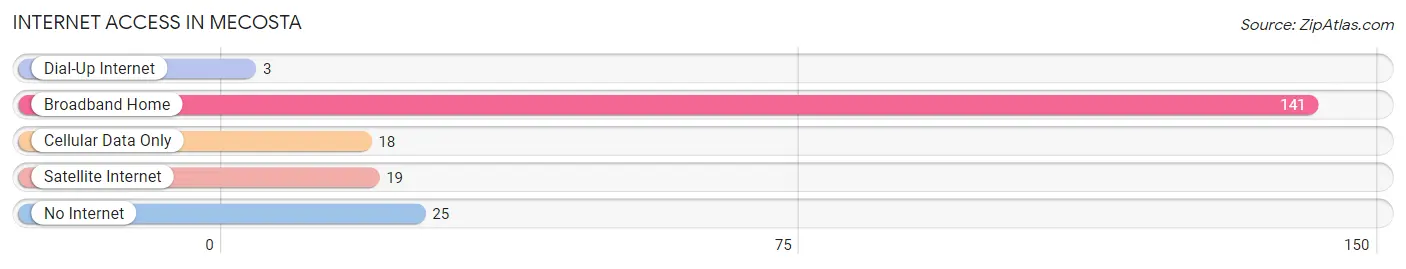
| Internet Type | # Households | % Households |
| Dial-Up Internet | 3 | 1.6% |
| Broadband Home | 141 | 73.4% |
| Cellular Data Only | 18 | 9.4% |
| Satellite Internet | 19 | 9.9% |
| No Internet | 25 | 13.0% |
| Total | 192 | 100.0% |
Mecosta Summary
Mecosta, Michigan is a small town located in the heart of Michigan’s Lower Peninsula. It is situated in Mecosta County, which is part of the Central Michigan region. The town is located on the Muskegon River, and is home to a population of approximately 1,500 people.
History
Mecosta was first settled in 1855 by a group of settlers from New York. The town was named after Chief Mecosta, a leader of the Potawatomi tribe. The town was officially incorporated in 1871.
In the late 19th century, Mecosta was a thriving lumber town. The town was home to several sawmills, and the lumber industry was the primary source of employment for the town’s residents. The lumber industry declined in the early 20th century, and the town’s economy shifted to agriculture.
In the mid-20th century, Mecosta began to experience a resurgence in its economy. The town was home to several manufacturing plants, and the population began to grow. In the late 20th century, the town experienced a decline in its manufacturing industry, and the population began to decline.
Geography
Mecosta is located in the Central Michigan region of the Lower Peninsula. The town is situated on the Muskegon River, and is surrounded by rolling hills and forests. The town is located approximately 30 miles north of Grand Rapids, and is approximately 90 miles from Detroit.
The climate in Mecosta is typical of the Midwest, with cold winters and warm summers. The average temperature in the winter is around 25 degrees Fahrenheit, and the average temperature in the summer is around 75 degrees Fahrenheit.
Economy
The economy of Mecosta is largely based on agriculture and tourism. The town is home to several farms, and the surrounding area is known for its production of apples, cherries, and other fruits and vegetables. The town is also home to several wineries, and the area is known for its production of wine.
The town is also home to several small businesses, including restaurants, shops, and other services. The town is also home to several manufacturing plants, and the town’s economy is bolstered by the presence of these businesses.
Demographics
As of the 2010 census, the population of Mecosta was 1,500. The town is predominantly white, with approximately 95% of the population identifying as white. The town is also home to a small Hispanic population, with approximately 4% of the population identifying as Hispanic. The town is also home to a small African American population, with approximately 1% of the population identifying as African American.
The median household income in Mecosta is approximately $40,000, and the median home value is approximately $100,000. The town has a low unemployment rate, and the town’s residents are largely employed in the agricultural and manufacturing industries.
Mecosta is a small town with a rich history and a vibrant economy. The town is home to a diverse population, and the town’s economy is largely based on agriculture and tourism. The town is also home to several small businesses, and the town’s economy is bolstered by the presence of these businesses. The town is a great place to live, work, and raise a family.
Common Questions
What is Per Capita Income in Mecosta?
Per Capita income in Mecosta is $21,573.
What is the Median Family Income in Mecosta?
Median Family Income in Mecosta is $56,563.
What is the Median Household income in Mecosta?
Median Household Income in Mecosta is $67,500.
What is Income or Wage Gap in Mecosta?
Income or Wage Gap in Mecosta is 14.8%.
Women in Mecosta earn 85.2 cents for every dollar earned by a man.
What is Inequality or Gini Index in Mecosta?
Inequality or Gini Index in Mecosta is 0.33.
What is the Total Population of Mecosta?
Total Population of Mecosta is 505.
What is the Total Male Population of Mecosta?
Total Male Population of Mecosta is 248.
What is the Total Female Population of Mecosta?
Total Female Population of Mecosta is 257.
What is the Ratio of Males per 100 Females in Mecosta?
There are 96.50 Males per 100 Females in Mecosta.
What is the Ratio of Females per 100 Males in Mecosta?
There are 103.63 Females per 100 Males in Mecosta.
What is the Median Population Age in Mecosta?
Median Population Age in Mecosta is 41.9 Years.
What is the Average Family Size in Mecosta
Average Family Size in Mecosta is 2.7 People.
What is the Average Household Size in Mecosta
Average Household Size in Mecosta is 2.6 People.
How Large is the Labor Force in Mecosta?
There are 216 People in the Labor Forcein in Mecosta.
What is the Percentage of People in the Labor Force in Mecosta?
49.7% of People are in the Labor Force in Mecosta.
What is the Unemployment Rate in Mecosta?
Unemployment Rate in Mecosta is 10.6%.