Northview, MI Map & Demographics
Northview Map
Northview Overview
$43,561
PER CAPITA INCOME
$93,380
AVG FAMILY INCOME
$77,783
AVG HOUSEHOLD INCOME
35.8%
WAGE / INCOME GAP [ % ]
64.2¢/ $1
WAGE / INCOME GAP [ $ ]
0.43
INEQUALITY / GINI INDEX
15,428
TOTAL POPULATION
7,434
MALE POPULATION
7,994
FEMALE POPULATION
92.99
MALES / 100 FEMALES
107.53
FEMALES / 100 MALES
40.7
MEDIAN AGE
2.8
AVG FAMILY SIZE
2.4
AVG HOUSEHOLD SIZE
8,876
LABOR FORCE [ PEOPLE ]
69.5%
PERCENT IN LABOR FORCE
5.6%
UNEMPLOYMENT RATE
Income in Northview
Income Overview in Northview
Per Capita Income in Northview is $43,561, while median incomes of families and households are $93,380 and $77,783 respectively.
| Characteristic | Number | Measure |
| Per Capita Income | 15,428 | $43,561 |
| Median Family Income | 4,405 | $93,380 |
| Mean Family Income | 4,405 | $117,822 |
| Median Household Income | 6,491 | $77,783 |
| Mean Household Income | 6,491 | $102,777 |
| Income Deficit | 4,405 | $0 |
| Wage / Income Gap (%) | 15,428 | 35.78% |
| Wage / Income Gap ($) | 15,428 | 64.22¢ per $1 |
| Gini / Inequality Index | 15,428 | 0.43 |
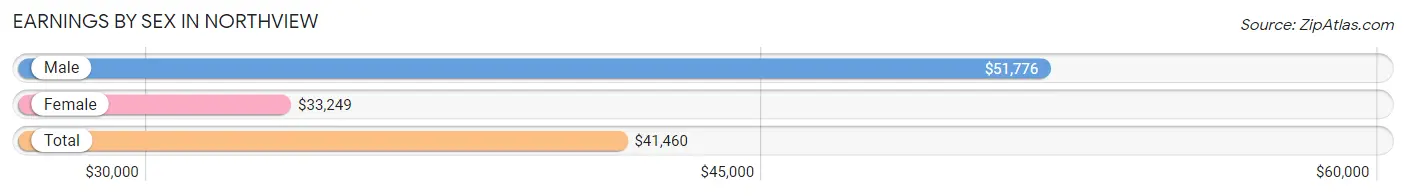
Earnings by Sex in Northview
Average Earnings in Northview are $41,460, $51,776 for men and $33,249 for women, a difference of 35.8%.
| Sex | Number | Average Earnings |
| Male | 4,891 (52.4%) | $51,776 |
| Female | 4,438 (47.6%) | $33,249 |
| Total | 9,329 (100.0%) | $41,460 |
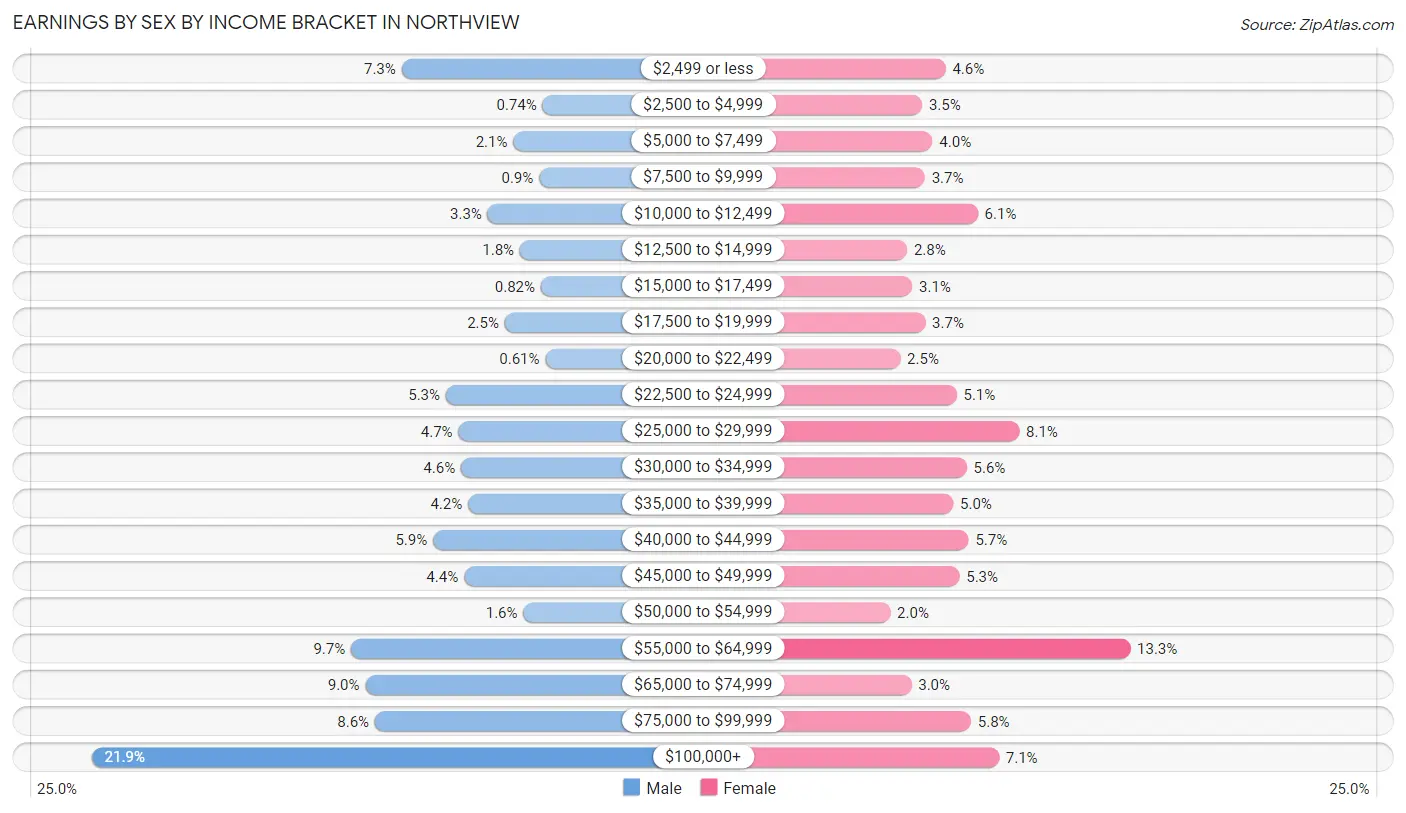
Earnings by Sex by Income Bracket in Northview
The most common earnings brackets in Northview are $100,000+ for men (1,069 | 21.9%) and $55,000 to $64,999 for women (589 | 13.3%).
| Income | Male | Female |
| $2,499 or less | 359 (7.3%) | 205 (4.6%) |
| $2,500 to $4,999 | 36 (0.7%) | 156 (3.5%) |
| $5,000 to $7,499 | 103 (2.1%) | 178 (4.0%) |
| $7,500 to $9,999 | 44 (0.9%) | 162 (3.6%) |
| $10,000 to $12,499 | 162 (3.3%) | 272 (6.1%) |
| $12,500 to $14,999 | 88 (1.8%) | 125 (2.8%) |
| $15,000 to $17,499 | 40 (0.8%) | 136 (3.1%) |
| $17,500 to $19,999 | 123 (2.5%) | 163 (3.7%) |
| $20,000 to $22,499 | 30 (0.6%) | 111 (2.5%) |
| $22,500 to $24,999 | 258 (5.3%) | 228 (5.1%) |
| $25,000 to $29,999 | 229 (4.7%) | 358 (8.1%) |
| $30,000 to $34,999 | 223 (4.6%) | 249 (5.6%) |
| $35,000 to $39,999 | 207 (4.2%) | 221 (5.0%) |
| $40,000 to $44,999 | 287 (5.9%) | 253 (5.7%) |
| $45,000 to $49,999 | 216 (4.4%) | 234 (5.3%) |
| $50,000 to $54,999 | 80 (1.6%) | 90 (2.0%) |
| $55,000 to $64,999 | 475 (9.7%) | 589 (13.3%) |
| $65,000 to $74,999 | 442 (9.0%) | 134 (3.0%) |
| $75,000 to $99,999 | 420 (8.6%) | 258 (5.8%) |
| $100,000+ | 1,069 (21.9%) | 316 (7.1%) |
| Total | 4,891 (100.0%) | 4,438 (100.0%) |
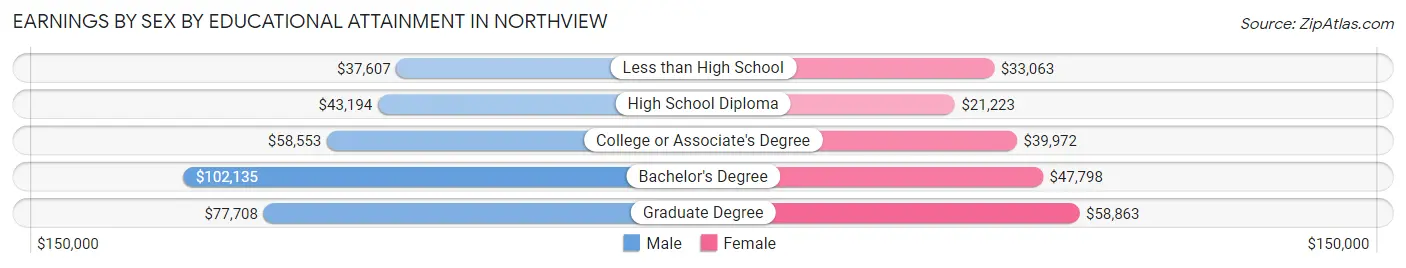
Earnings by Sex by Educational Attainment in Northview
Average earnings in Northview are $63,528 for men and $36,986 for women, a difference of 41.8%. Men with an educational attainment of bachelor's degree enjoy the highest average annual earnings of $102,135, while those with less than high school education earn the least with $37,607. Women with an educational attainment of graduate degree earn the most with the average annual earnings of $58,863, while those with high school diploma education have the smallest earnings of $21,223.
| Educational Attainment | Male Income | Female Income |
| Less than High School | $37,607 | $33,063 |
| High School Diploma | $43,194 | $21,223 |
| College or Associate's Degree | $58,553 | $39,972 |
| Bachelor's Degree | $102,135 | $47,798 |
| Graduate Degree | $77,708 | $58,863 |
| Total | $63,528 | $36,986 |
Family Income in Northview
Family Income Brackets in Northview
According to the Northview family income data, there are 947 families falling into the $100,000 to $149,999 income range, which is the most common income bracket and makes up 21.5% of all families. Conversely, the less than $10,000 income bracket is the least frequent group with only 70 families (1.6%) belonging to this category.
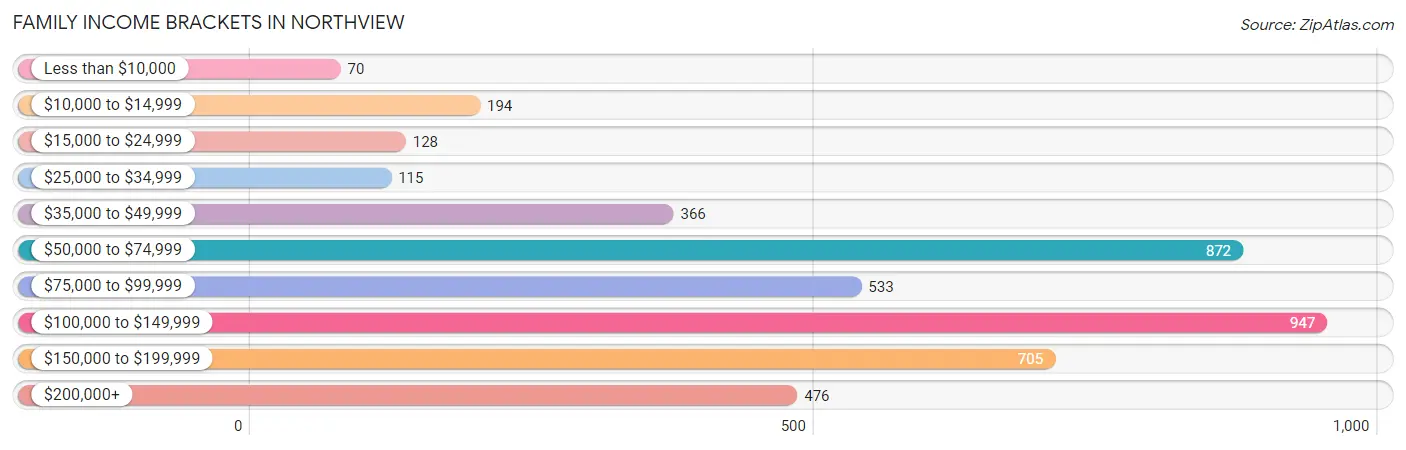
| Income Bracket | # Families | % Families |
| Less than $10,000 | 70 | 1.6% |
| $10,000 to $14,999 | 194 | 4.4% |
| $15,000 to $24,999 | 128 | 2.9% |
| $25,000 to $34,999 | 115 | 2.6% |
| $35,000 to $49,999 | 366 | 8.3% |
| $50,000 to $74,999 | 872 | 19.8% |
| $75,000 to $99,999 | 533 | 12.1% |
| $100,000 to $149,999 | 947 | 21.5% |
| $150,000 to $199,999 | 705 | 16.0% |
| $200,000+ | 476 | 10.8% |
Family Income by Famaliy Size in Northview
6-person families (63 | 1.4%) account for the highest median family income in Northview with $175,284 per family, while 2-person families (2,167 | 49.2%) have the highest median income of $45,012 per family member.
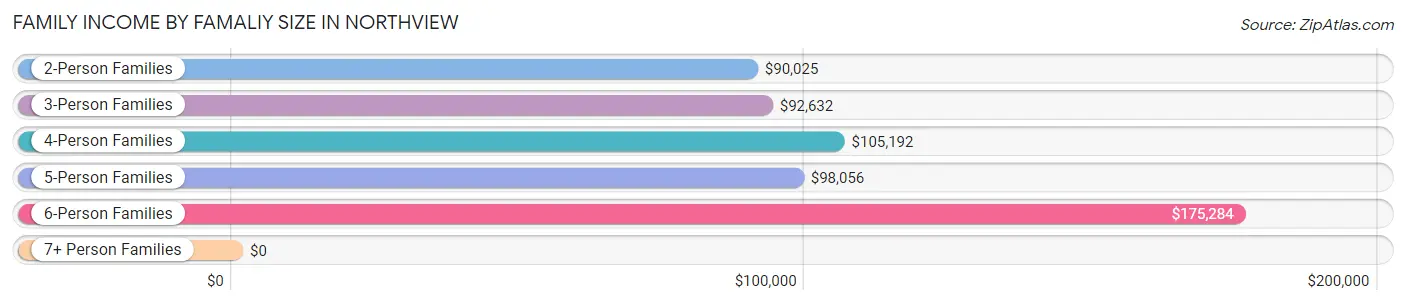
| Income Bracket | # Families | Median Income |
| 2-Person Families | 2,167 (49.2%) | $90,025 |
| 3-Person Families | 1,386 (31.5%) | $92,632 |
| 4-Person Families | 572 (13.0%) | $105,192 |
| 5-Person Families | 176 (4.0%) | $98,056 |
| 6-Person Families | 63 (1.4%) | $175,284 |
| 7+ Person Families | 41 (0.9%) | $0 |
| Total | 4,405 (100.0%) | $93,380 |
Family Income by Number of Earners in Northview
The median family income in Northview is $93,380, with families comprising 3+ earners (558) having the highest median family income of $161,098, while families with no earners (601) have the lowest median family income of $51,988, accounting for 12.7% and 13.6% of families, respectively.
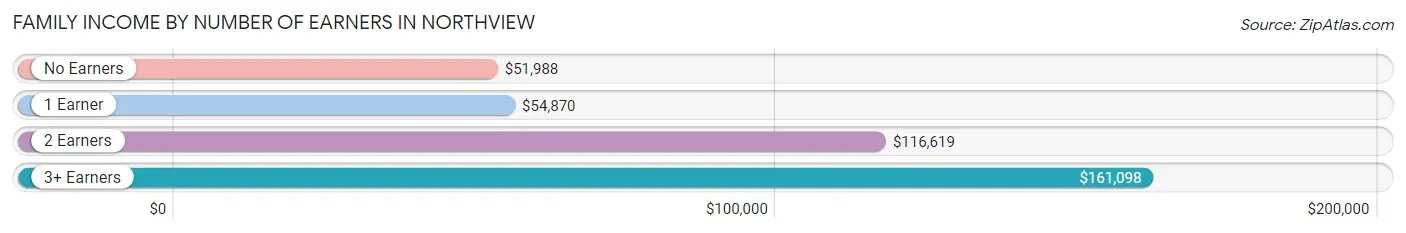
| Number of Earners | # Families | Median Income |
| No Earners | 601 (13.6%) | $51,988 |
| 1 Earner | 1,245 (28.3%) | $54,870 |
| 2 Earners | 2,001 (45.4%) | $116,619 |
| 3+ Earners | 558 (12.7%) | $161,098 |
| Total | 4,405 (100.0%) | $93,380 |
Household Income in Northview
Household Income Brackets in Northview
With 1,266 households falling in the category, the $100,000 to $149,999 income range is the most frequent in Northview, accounting for 19.5% of all households. In contrast, only 78 households (1.2%) fall into the less than $10,000 income bracket, making it the least populous group.
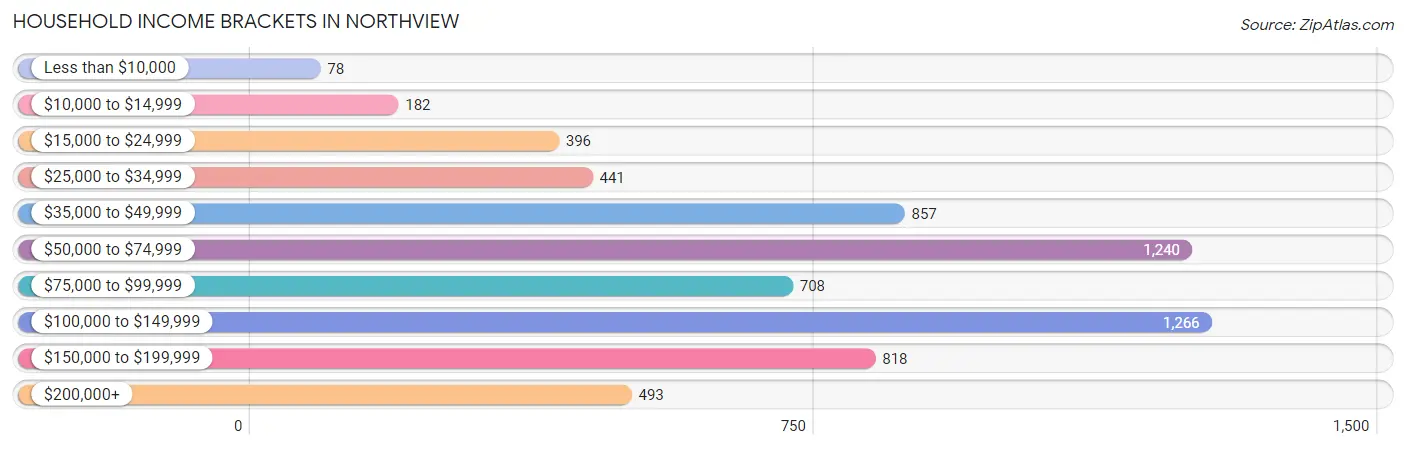
| Income Bracket | # Households | % Households |
| Less than $10,000 | 78 | 1.2% |
| $10,000 to $14,999 | 182 | 2.8% |
| $15,000 to $24,999 | 396 | 6.1% |
| $25,000 to $34,999 | 441 | 6.8% |
| $35,000 to $49,999 | 857 | 13.2% |
| $50,000 to $74,999 | 1,240 | 19.1% |
| $75,000 to $99,999 | 708 | 10.9% |
| $100,000 to $149,999 | 1,266 | 19.5% |
| $150,000 to $199,999 | 818 | 12.6% |
| $200,000+ | 493 | 7.6% |
Household Income by Householder Age in Northview
The median household income in Northview is $77,783, with the highest median household income of $94,095 found in the 25 to 44 years age bracket for the primary householder. A total of 2,053 households (31.6%) fall into this category. Meanwhile, the 65+ years age bracket for the primary householder has the lowest median household income of $55,521, with 2,012 households (31.0%) in this group.
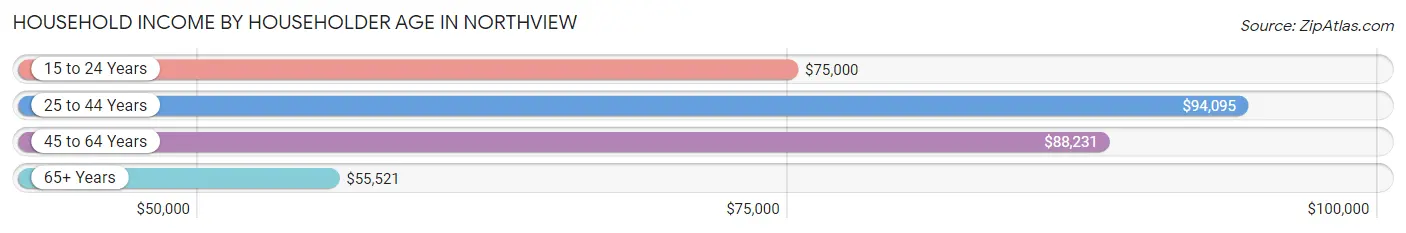
| Income Bracket | # Households | Median Income |
| 15 to 24 Years | 212 (3.3%) | $75,000 |
| 25 to 44 Years | 2,053 (31.6%) | $94,095 |
| 45 to 64 Years | 2,214 (34.1%) | $88,231 |
| 65+ Years | 2,012 (31.0%) | $55,521 |
| Total | 6,491 (100.0%) | $77,783 |
Poverty in Northview
Income Below Poverty by Sex and Age in Northview
With 7.8% poverty level for males and 9.1% for females among the residents of Northview, 16 and 17 year old males and under 5 year old females are the most vulnerable to poverty, with 142 males (47.2%) and 151 females (45.5%) in their respective age groups living below the poverty level.
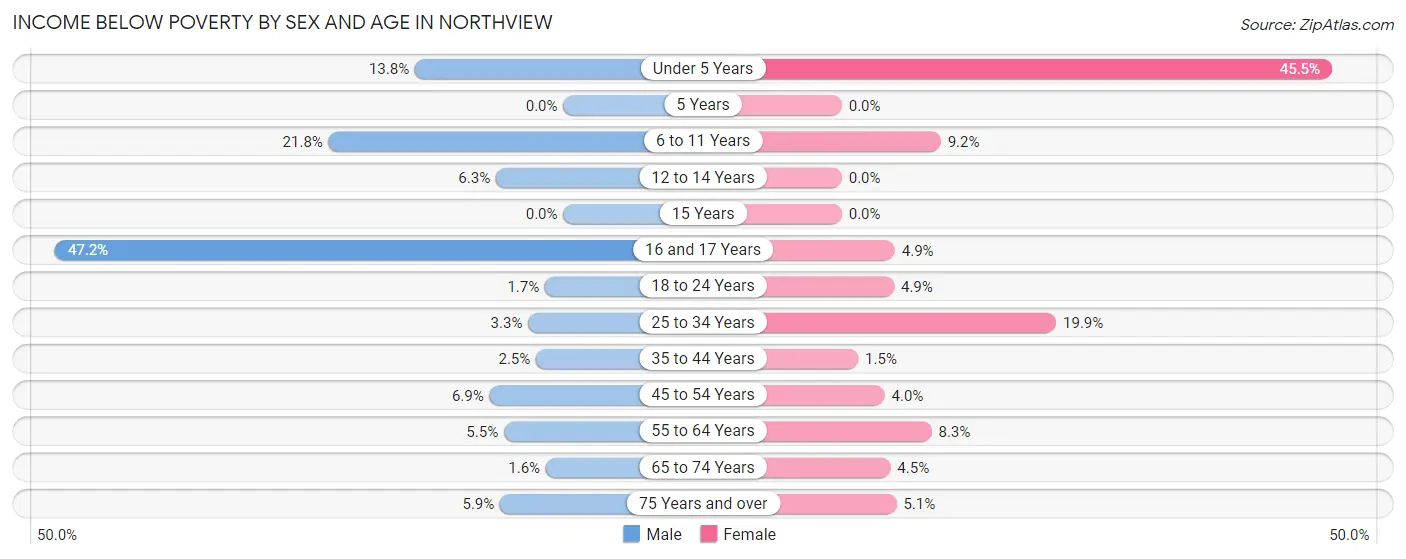
| Age Bracket | Male | Female |
| Under 5 Years | 46 (13.8%) | 151 (45.5%) |
| 5 Years | 0 (0.0%) | 0 (0.0%) |
| 6 to 11 Years | 147 (21.8%) | 47 (9.2%) |
| 12 to 14 Years | 14 (6.2%) | 0 (0.0%) |
| 15 Years | 0 (0.0%) | 0 (0.0%) |
| 16 and 17 Years | 142 (47.2%) | 12 (4.9%) |
| 18 to 24 Years | 12 (1.7%) | 19 (4.9%) |
| 25 to 34 Years | 29 (3.3%) | 265 (19.9%) |
| 35 to 44 Years | 26 (2.5%) | 13 (1.5%) |
| 45 to 54 Years | 57 (6.9%) | 37 (4.0%) |
| 55 to 64 Years | 59 (5.5%) | 92 (8.3%) |
| 65 to 74 Years | 9 (1.6%) | 46 (4.5%) |
| 75 Years and over | 41 (5.9%) | 41 (5.1%) |
| Total | 582 (7.8%) | 723 (9.1%) |
Income Above Poverty by Sex and Age in Northview
According to the poverty statistics in Northview, males aged 5 years and females aged 5 years are the age groups that are most secure financially, with 100.0% of males and 100.0% of females in these age groups living above the poverty line.
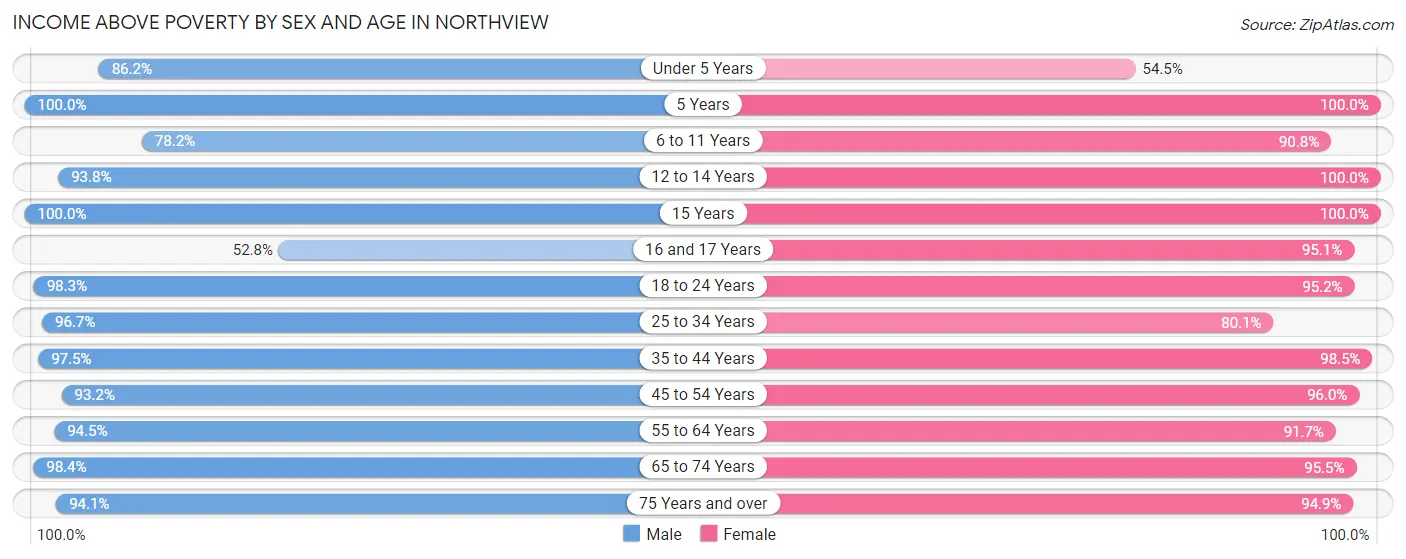
| Age Bracket | Male | Female |
| Under 5 Years | 288 (86.2%) | 181 (54.5%) |
| 5 Years | 90 (100.0%) | 60 (100.0%) |
| 6 to 11 Years | 528 (78.2%) | 465 (90.8%) |
| 12 to 14 Years | 210 (93.8%) | 269 (100.0%) |
| 15 Years | 27 (100.0%) | 89 (100.0%) |
| 16 and 17 Years | 159 (52.8%) | 232 (95.1%) |
| 18 to 24 Years | 692 (98.3%) | 373 (95.2%) |
| 25 to 34 Years | 861 (96.7%) | 1,067 (80.1%) |
| 35 to 44 Years | 1,002 (97.5%) | 840 (98.5%) |
| 45 to 54 Years | 775 (93.1%) | 895 (96.0%) |
| 55 to 64 Years | 1,012 (94.5%) | 1,012 (91.7%) |
| 65 to 74 Years | 548 (98.4%) | 975 (95.5%) |
| 75 Years and over | 658 (94.1%) | 768 (94.9%) |
| Total | 6,850 (92.2%) | 7,226 (90.9%) |
Income Below Poverty Among Married-Couple Families in Northview
The poverty statistics for married-couple families in Northview show that 4.8% or 162 of the total 3,399 families live below the poverty line. Families with 3 or 4 children have the highest poverty rate of 10.3%, comprising of 22 families. On the other hand, families with no children have the lowest poverty rate of 4.0%, which includes 94 families.
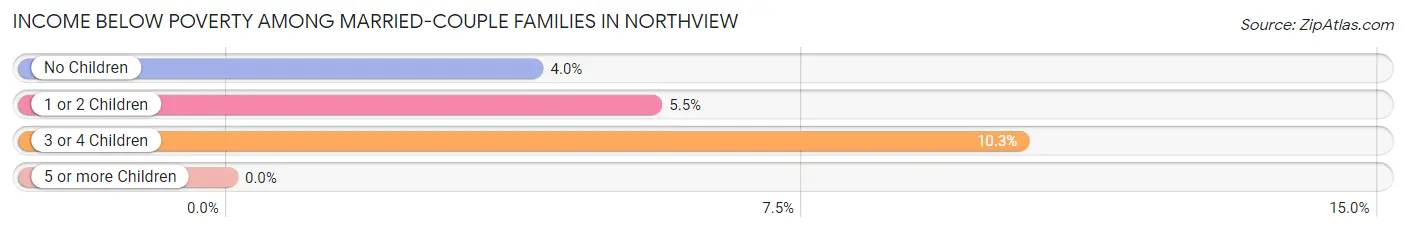
| Children | Above Poverty | Below Poverty |
| No Children | 2,261 (96.0%) | 94 (4.0%) |
| 1 or 2 Children | 785 (94.5%) | 46 (5.5%) |
| 3 or 4 Children | 191 (89.7%) | 22 (10.3%) |
| 5 or more Children | 0 (0.0%) | 0 (0.0%) |
| Total | 3,237 (95.2%) | 162 (4.8%) |
Income Below Poverty Among Single-Parent Households in Northview
According to the poverty data in Northview, 13.5% or 26 single-father households and 20.5% or 167 single-mother households are living below the poverty line. Among single-father households, those with 1 or 2 children have the highest poverty rate, with 26 households (16.2%) experiencing poverty. Likewise, among single-mother households, those with 1 or 2 children have the highest poverty rate, with 143 households (24.3%) falling below the poverty line.
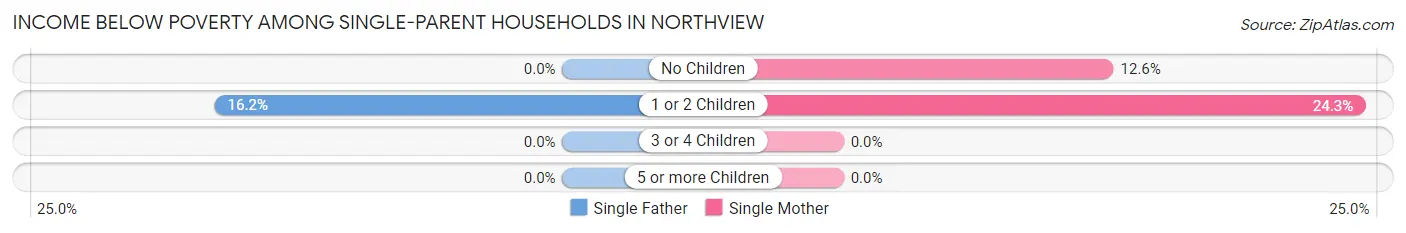
| Children | Single Father | Single Mother |
| No Children | 0 (0.0%) | 24 (12.6%) |
| 1 or 2 Children | 26 (16.2%) | 143 (24.3%) |
| 3 or 4 Children | 0 (0.0%) | 0 (0.0%) |
| 5 or more Children | 0 (0.0%) | 0 (0.0%) |
| Total | 26 (13.5%) | 167 (20.5%) |
Income Below Poverty Among Married-Couple vs Single-Parent Households in Northview
The poverty data for Northview shows that 162 of the married-couple family households (4.8%) and 193 of the single-parent households (19.2%) are living below the poverty level. Within the married-couple family households, those with 3 or 4 children have the highest poverty rate, with 22 households (10.3%) falling below the poverty line. Among the single-parent households, those with 1 or 2 children have the highest poverty rate, with 169 household (22.5%) living below poverty.
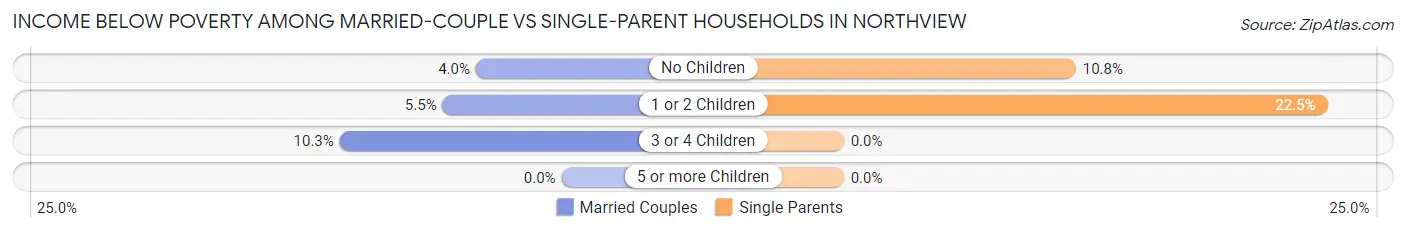
| Children | Married-Couple Families | Single-Parent Households |
| No Children | 94 (4.0%) | 24 (10.8%) |
| 1 or 2 Children | 46 (5.5%) | 169 (22.5%) |
| 3 or 4 Children | 22 (10.3%) | 0 (0.0%) |
| 5 or more Children | 0 (0.0%) | 0 (0.0%) |
| Total | 162 (4.8%) | 193 (19.2%) |
Race in Northview
The most populous races in Northview are White / Caucasian (13,717 | 88.9%), Two or more Races (972 | 6.3%), and Hispanic or Latino (606 | 3.9%).
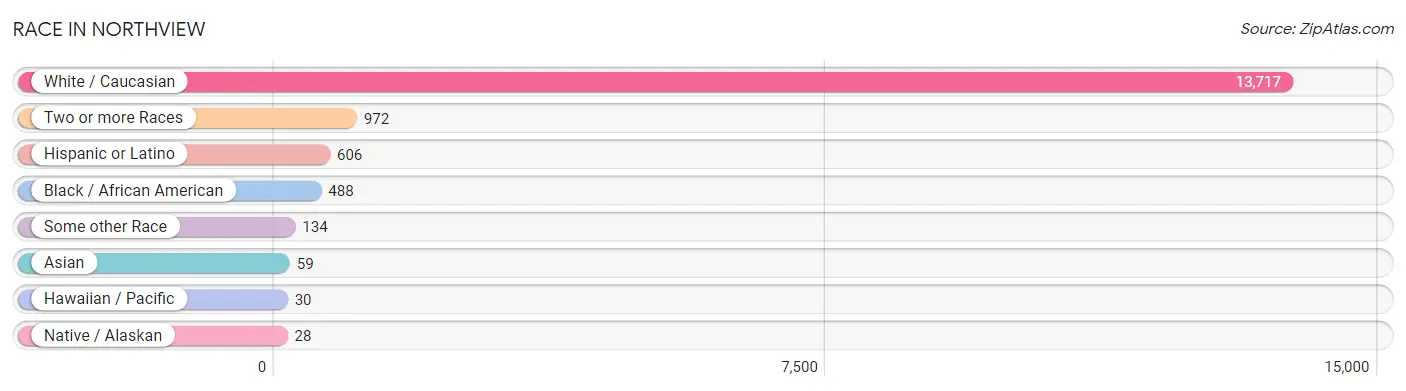
| Race | # Population | % Population |
| Asian | 59 | 0.4% |
| Black / African American | 488 | 3.2% |
| Hawaiian / Pacific | 30 | 0.2% |
| Hispanic or Latino | 606 | 3.9% |
| Native / Alaskan | 28 | 0.2% |
| White / Caucasian | 13,717 | 88.9% |
| Two or more Races | 972 | 6.3% |
| Some other Race | 134 | 0.9% |
| Total | 15,428 | 100.0% |
Ancestry in Northview
The most populous ancestries reported in Northview are German (3,367 | 21.8%), Irish (2,332 | 15.1%), Dutch (2,275 | 14.7%), English (1,761 | 11.4%), and Polish (1,366 | 8.8%), together accounting for 72.0% of all Northview residents.
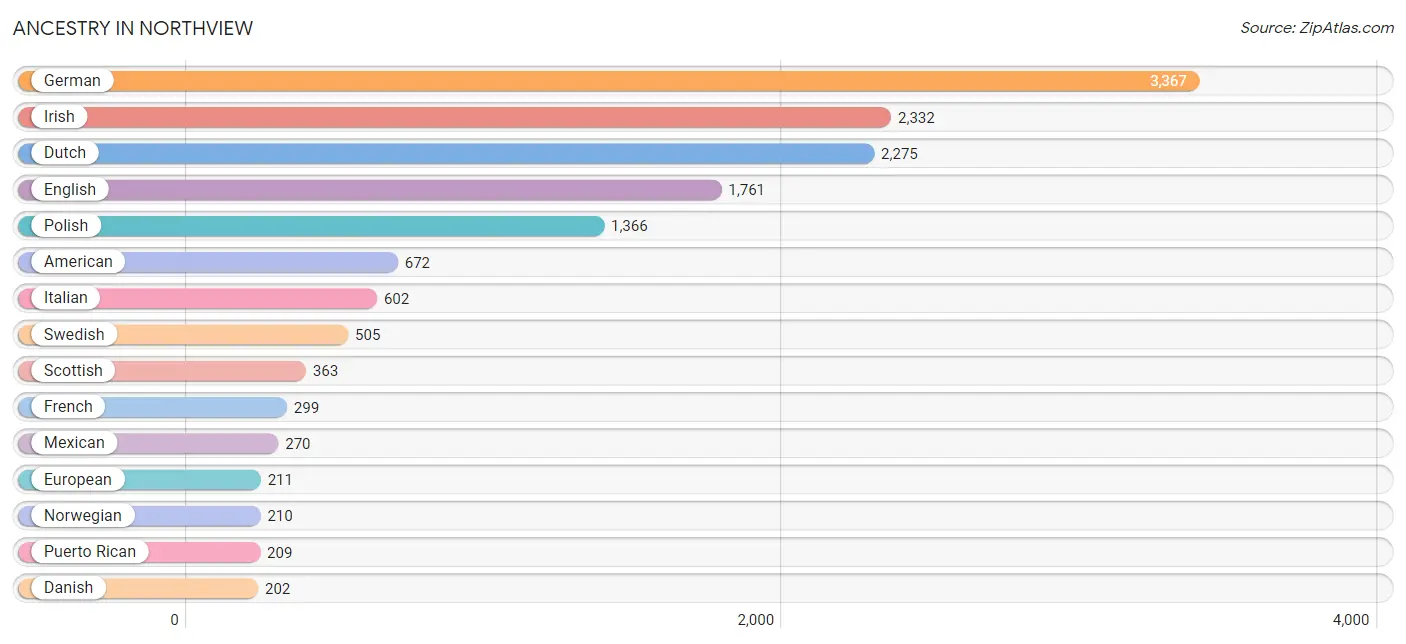
| Ancestry | # Population | % Population |
| American | 672 | 4.4% |
| Arab | 129 | 0.8% |
| Austrian | 79 | 0.5% |
| Belgian | 47 | 0.3% |
| Blackfeet | 9 | 0.1% |
| Brazilian | 28 | 0.2% |
| British | 45 | 0.3% |
| Burmese | 96 | 0.6% |
| Canadian | 29 | 0.2% |
| Cherokee | 141 | 0.9% |
| Chippewa | 12 | 0.1% |
| Colombian | 20 | 0.1% |
| Cuban | 44 | 0.3% |
| Czech | 41 | 0.3% |
| Czechoslovakian | 22 | 0.1% |
| Danish | 202 | 1.3% |
| Dominican | 18 | 0.1% |
| Dutch | 2,275 | 14.7% |
| Eastern European | 36 | 0.2% |
| English | 1,761 | 11.4% |
| Ethiopian | 103 | 0.7% |
| European | 211 | 1.4% |
| Finnish | 112 | 0.7% |
| French | 299 | 1.9% |
| French Canadian | 137 | 0.9% |
| German | 3,367 | 21.8% |
| Greek | 18 | 0.1% |
| Haitian | 25 | 0.2% |
| Hungarian | 65 | 0.4% |
| Irish | 2,332 | 15.1% |
| Italian | 602 | 3.9% |
| Jamaican | 37 | 0.2% |
| Korean | 28 | 0.2% |
| Lebanese | 52 | 0.3% |
| Lithuanian | 143 | 0.9% |
| Luxembourger | 15 | 0.1% |
| Mexican | 270 | 1.8% |
| Native Hawaiian | 30 | 0.2% |
| Northern European | 52 | 0.3% |
| Norwegian | 210 | 1.4% |
| Palestinian | 17 | 0.1% |
| Pennsylvania German | 4 | 0.0% |
| Polish | 1,366 | 8.8% |
| Potawatomi | 49 | 0.3% |
| Puerto Rican | 209 | 1.3% |
| Russian | 117 | 0.8% |
| Samoan | 53 | 0.3% |
| Scotch-Irish | 27 | 0.2% |
| Scottish | 363 | 2.4% |
| Slovak | 4 | 0.0% |
| South African | 10 | 0.1% |
| South American | 20 | 0.1% |
| Spaniard | 36 | 0.2% |
| Sri Lankan | 25 | 0.2% |
| Subsaharan African | 113 | 0.7% |
| Swedish | 505 | 3.3% |
| Swiss | 51 | 0.3% |
| Thai | 8 | 0.1% |
| Ukrainian | 20 | 0.1% |
| Welsh | 101 | 0.6% |
| Yugoslavian | 65 | 0.4% | View All 61 Rows |
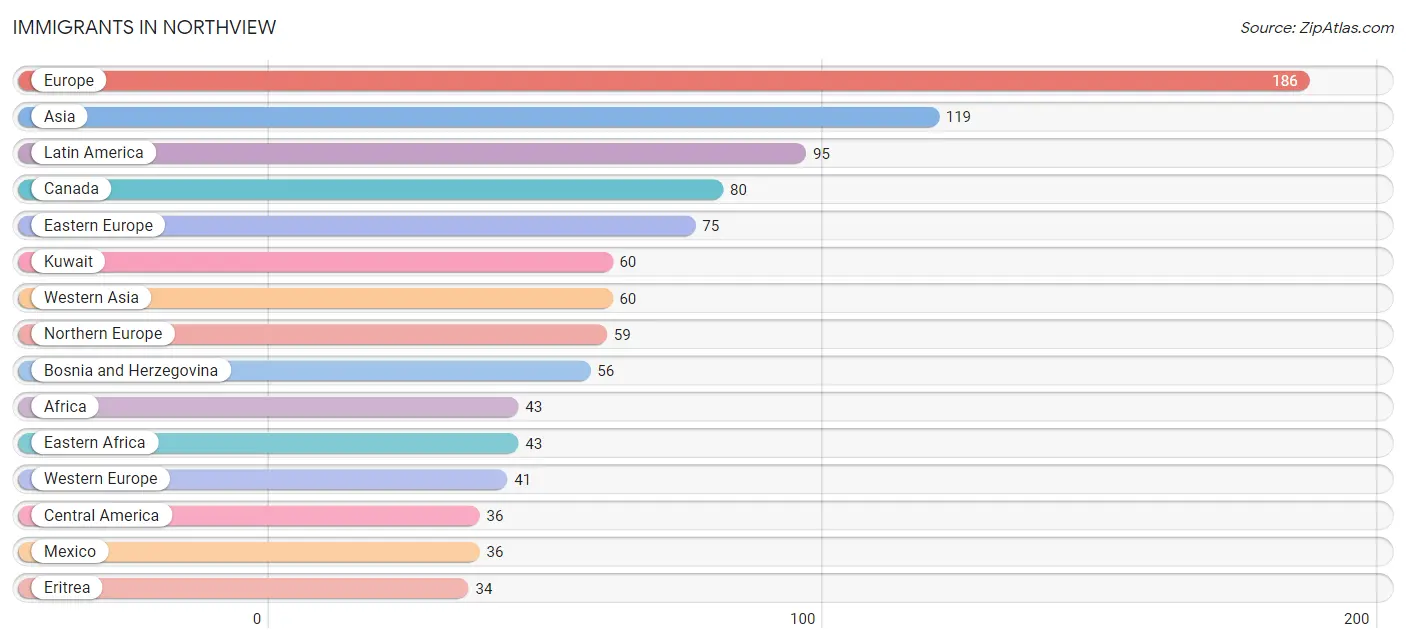
Immigrants in Northview
The most numerous immigrant groups reported in Northview came from Europe (186 | 1.2%), Asia (119 | 0.8%), Latin America (95 | 0.6%), Canada (80 | 0.5%), and Eastern Europe (75 | 0.5%), together accounting for 3.6% of all Northview residents.
| Immigration Origin | # Population | % Population |
| Africa | 43 | 0.3% |
| Asia | 119 | 0.8% |
| Bosnia and Herzegovina | 56 | 0.4% |
| Brazil | 14 | 0.1% |
| Canada | 80 | 0.5% |
| Caribbean | 25 | 0.2% |
| Central America | 36 | 0.2% |
| Colombia | 20 | 0.1% |
| Eastern Africa | 43 | 0.3% |
| Eastern Asia | 26 | 0.2% |
| Eastern Europe | 75 | 0.5% |
| England | 17 | 0.1% |
| Eritrea | 34 | 0.2% |
| Ethiopia | 9 | 0.1% |
| Europe | 186 | 1.2% |
| Germany | 14 | 0.1% |
| Haiti | 25 | 0.2% |
| Korea | 26 | 0.2% |
| Kuwait | 60 | 0.4% |
| Latin America | 95 | 0.6% |
| Mexico | 36 | 0.2% |
| Netherlands | 27 | 0.2% |
| Northern Europe | 59 | 0.4% |
| Philippines | 8 | 0.1% |
| Poland | 8 | 0.1% |
| South America | 34 | 0.2% |
| South Eastern Asia | 33 | 0.2% |
| Southern Europe | 11 | 0.1% |
| Spain | 11 | 0.1% |
| Ukraine | 11 | 0.1% |
| Vietnam | 25 | 0.2% |
| Western Asia | 60 | 0.4% |
| Western Europe | 41 | 0.3% | View All 33 Rows |
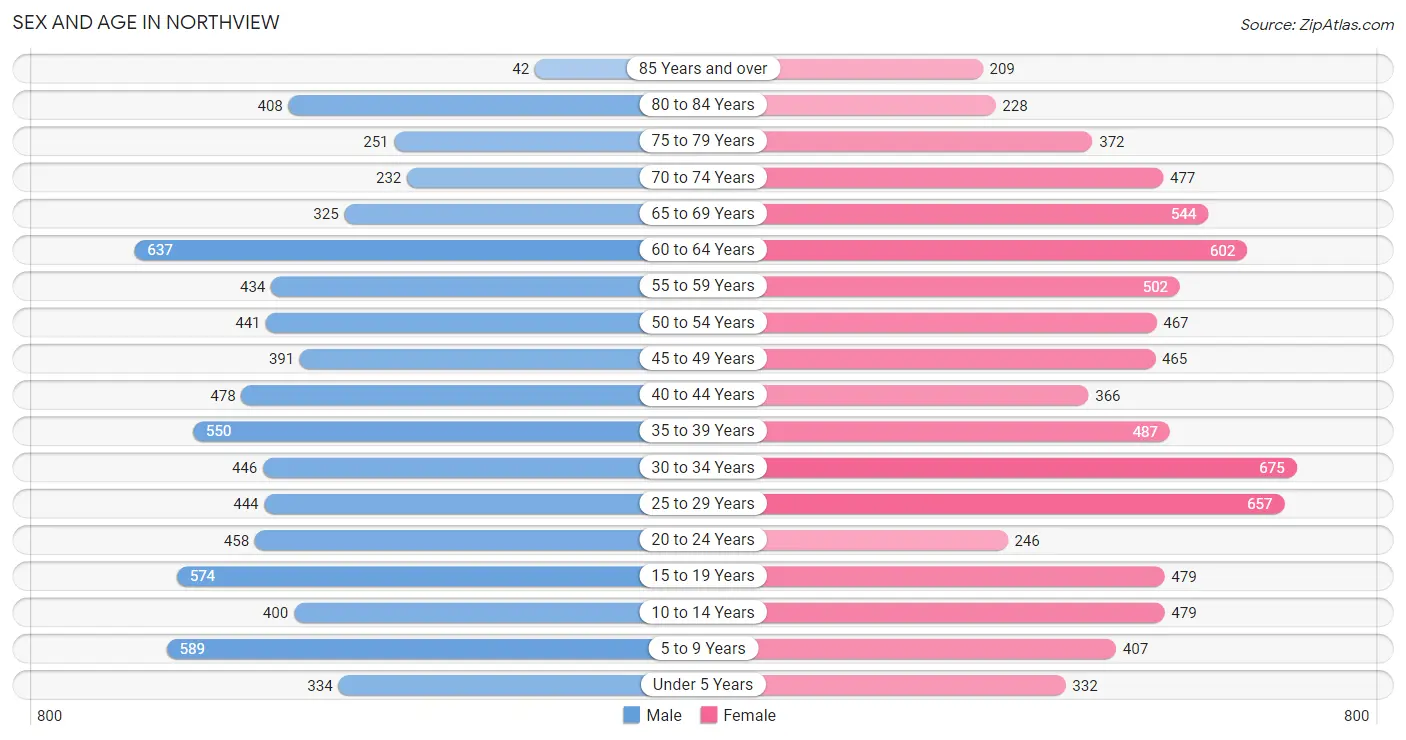
Sex and Age in Northview
Sex and Age in Northview
The most populous age groups in Northview are 60 to 64 Years (637 | 8.6%) for men and 30 to 34 Years (675 | 8.4%) for women.
| Age Bracket | Male | Female |
| Under 5 Years | 334 (4.5%) | 332 (4.2%) |
| 5 to 9 Years | 589 (7.9%) | 407 (5.1%) |
| 10 to 14 Years | 400 (5.4%) | 479 (6.0%) |
| 15 to 19 Years | 574 (7.7%) | 479 (6.0%) |
| 20 to 24 Years | 458 (6.2%) | 246 (3.1%) |
| 25 to 29 Years | 444 (6.0%) | 657 (8.2%) |
| 30 to 34 Years | 446 (6.0%) | 675 (8.4%) |
| 35 to 39 Years | 550 (7.4%) | 487 (6.1%) |
| 40 to 44 Years | 478 (6.4%) | 366 (4.6%) |
| 45 to 49 Years | 391 (5.3%) | 465 (5.8%) |
| 50 to 54 Years | 441 (5.9%) | 467 (5.8%) |
| 55 to 59 Years | 434 (5.8%) | 502 (6.3%) |
| 60 to 64 Years | 637 (8.6%) | 602 (7.5%) |
| 65 to 69 Years | 325 (4.4%) | 544 (6.8%) |
| 70 to 74 Years | 232 (3.1%) | 477 (6.0%) |
| 75 to 79 Years | 251 (3.4%) | 372 (4.6%) |
| 80 to 84 Years | 408 (5.5%) | 228 (2.9%) |
| 85 Years and over | 42 (0.6%) | 209 (2.6%) |
| Total | 7,434 (100.0%) | 7,994 (100.0%) |
Families and Households in Northview
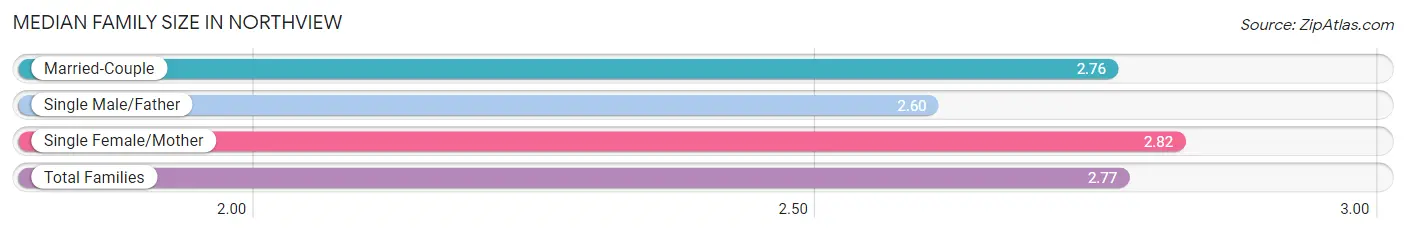
Median Family Size in Northview
The median family size in Northview is 2.77 persons per family, with single female/mother families (814 | 18.5%) accounting for the largest median family size of 2.82 persons per family. On the other hand, single male/father families (192 | 4.4%) represent the smallest median family size with 2.60 persons per family.
| Family Type | # Families | Family Size |
| Married-Couple | 3,399 (77.2%) | 2.76 |
| Single Male/Father | 192 (4.4%) | 2.60 |
| Single Female/Mother | 814 (18.5%) | 2.82 |
| Total Families | 4,405 (100.0%) | 2.77 |
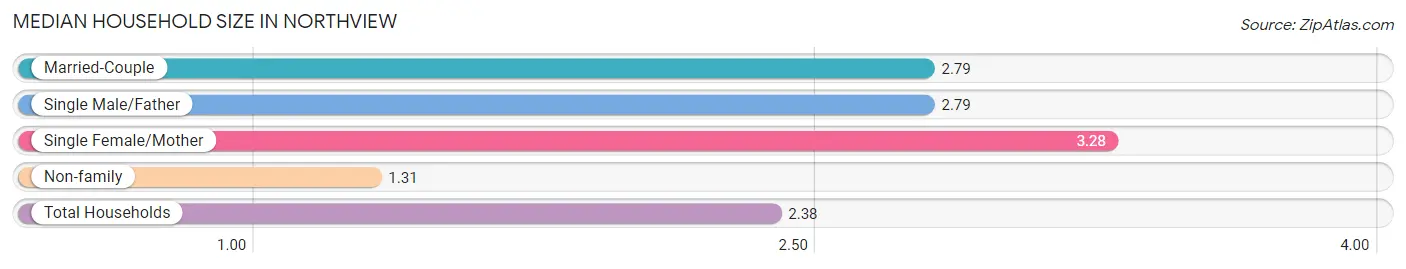
Median Household Size in Northview
The median household size in Northview is 2.38 persons per household, with single female/mother households (814 | 12.5%) accounting for the largest median household size of 3.28 persons per household. non-family households (2,086 | 32.1%) represent the smallest median household size with 1.31 persons per household.
| Household Type | # Households | Household Size |
| Married-Couple | 3,399 (52.4%) | 2.79 |
| Single Male/Father | 192 (3.0%) | 2.79 |
| Single Female/Mother | 814 (12.5%) | 3.28 |
| Non-family | 2,086 (32.1%) | 1.31 |
| Total Households | 6,491 (100.0%) | 2.38 |
Household Size by Marriage Status in Northview
Out of a total of 6,491 households in Northview, 4,405 (67.9%) are family households, while 2,086 (32.1%) are nonfamily households. The most numerous type of family households are 2-person households, comprising 1,995, and the most common type of nonfamily households are 1-person households, comprising 1,616.
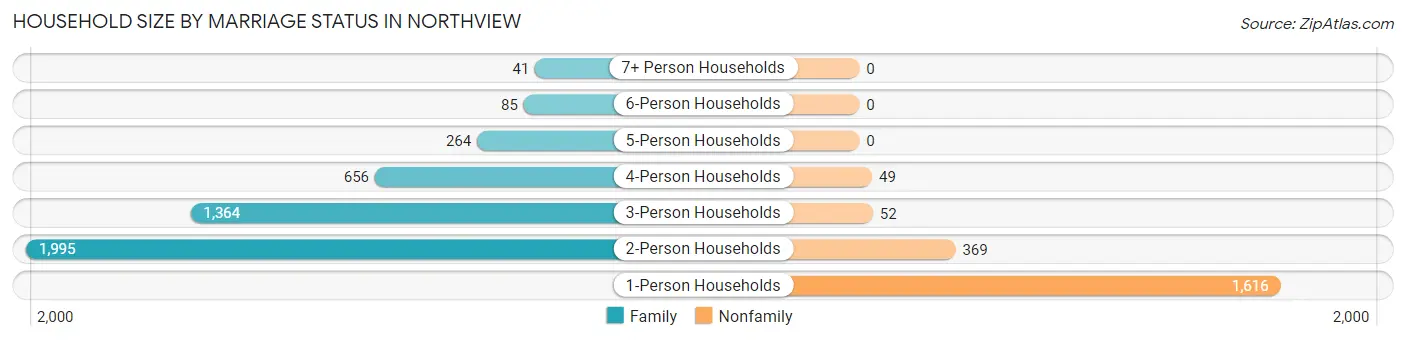
| Household Size | Family Households | Nonfamily Households |
| 1-Person Households | - | 1,616 (24.9%) |
| 2-Person Households | 1,995 (30.7%) | 369 (5.7%) |
| 3-Person Households | 1,364 (21.0%) | 52 (0.8%) |
| 4-Person Households | 656 (10.1%) | 49 (0.7%) |
| 5-Person Households | 264 (4.1%) | 0 (0.0%) |
| 6-Person Households | 85 (1.3%) | 0 (0.0%) |
| 7+ Person Households | 41 (0.6%) | 0 (0.0%) |
| Total | 4,405 (67.9%) | 2,086 (32.1%) |
Female Fertility in Northview
Fertility by Age in Northview
Average fertility rate in Northview is 23.0 births per 1,000 women. Women in the age bracket of 20 to 34 years have the highest fertility rate with 40.0 births per 1,000 women. Women in the age bracket of 20 to 34 years acount for 81.8% of all women with births.
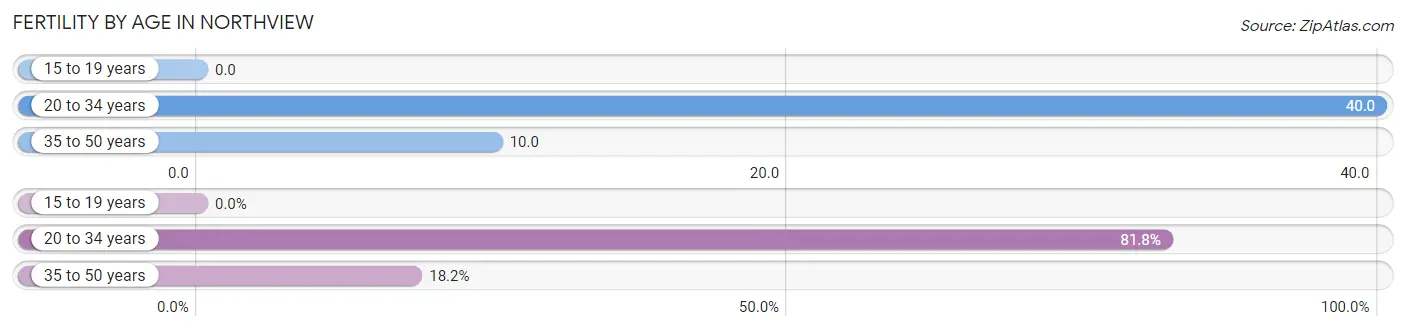
| Age Bracket | Women with Births | Births / 1,000 Women |
| 15 to 19 years | 0 (0.0%) | 0.0 |
| 20 to 34 years | 63 (81.8%) | 40.0 |
| 35 to 50 years | 14 (18.2%) | 10.0 |
| Total | 77 (100.0%) | 23.0 |
Fertility by Age by Marriage Status in Northview
71.4% of women with births (77) in Northview are married. The highest percentage of unmarried women with births falls into 20 to 34 years age bracket with 34.9% of them unmarried at the time of birth, while the lowest percentage of unmarried women with births belong to 35 to 50 years age bracket with 0.0% of them unmarried.
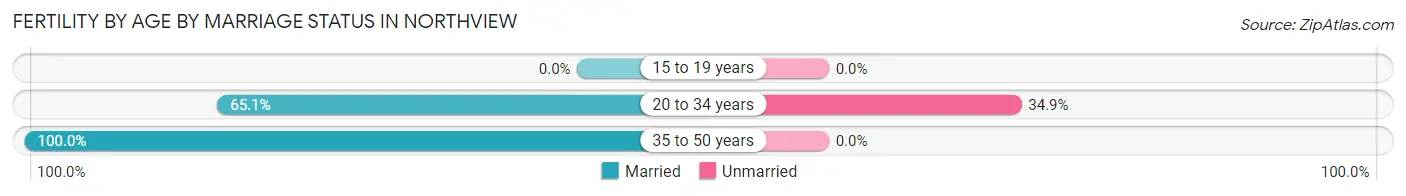
| Age Bracket | Married | Unmarried |
| 15 to 19 years | 0 (0.0%) | 0 (0.0%) |
| 20 to 34 years | 41 (65.1%) | 22 (34.9%) |
| 35 to 50 years | 14 (100.0%) | 0 (0.0%) |
| Total | 55 (71.4%) | 22 (28.6%) |
Fertility by Education in Northview
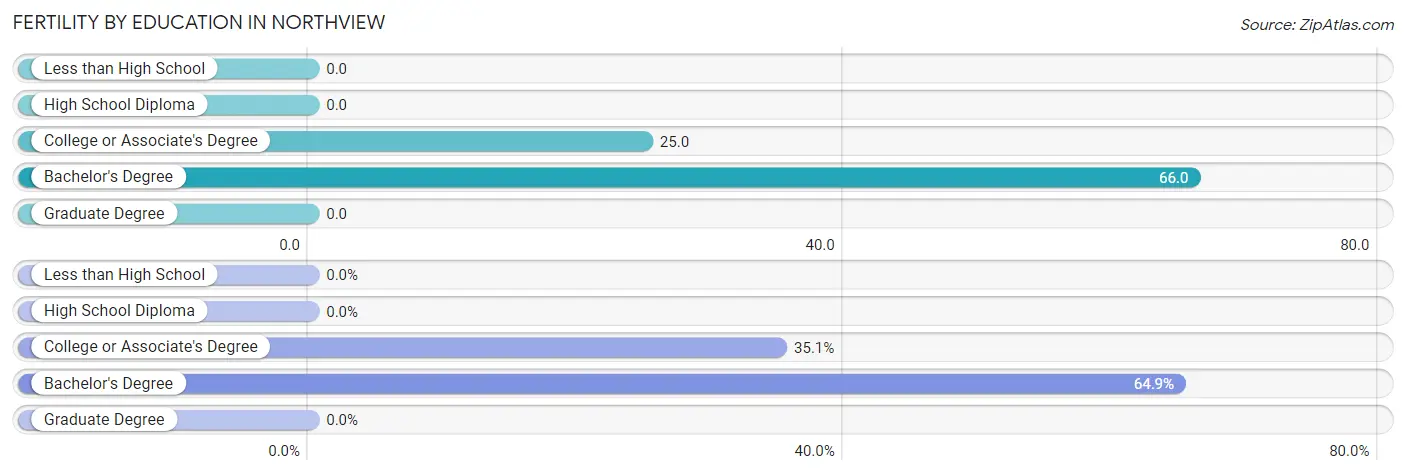
| Educational Attainment | Women with Births | Births / 1,000 Women |
| Less than High School | 0 (0.0%) | 0.0 |
| High School Diploma | 0 (0.0%) | 0.0 |
| College or Associate's Degree | 27 (35.1%) | 25.0 |
| Bachelor's Degree | 50 (64.9%) | 66.0 |
| Graduate Degree | 0 (0.0%) | 0.0 |
| Total | 77 (100.0%) | 23.0 |
Fertility by Education by Marriage Status in Northview
28.6% of women with births in Northview are unmarried. Women with the educational attainment of college or associate's degree are most likely to be married with 100.0% of them married at childbirth, while women with the educational attainment of bachelor's degree are least likely to be married with 44.0% of them unmarried at childbirth.
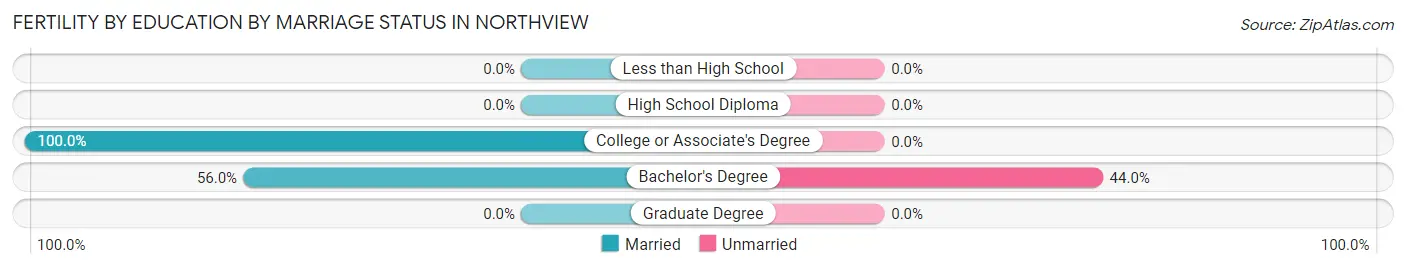
| Educational Attainment | Married | Unmarried |
| Less than High School | 0 (0.0%) | 0 (0.0%) |
| High School Diploma | 0 (0.0%) | 0 (0.0%) |
| College or Associate's Degree | 27 (100.0%) | 0 (0.0%) |
| Bachelor's Degree | 28 (56.0%) | 22 (44.0%) |
| Graduate Degree | 0 (0.0%) | 0 (0.0%) |
| Total | 55 (71.4%) | 22 (28.6%) |
Employment Characteristics in Northview
Employment by Class of Employer in Northview
Among the 8,303 employed individuals in Northview, private company employees (5,612 | 67.6%), not-for-profit organizations (880 | 10.6%), and self-employed (not incorporated) (523 | 6.3%) make up the most common classes of employment.
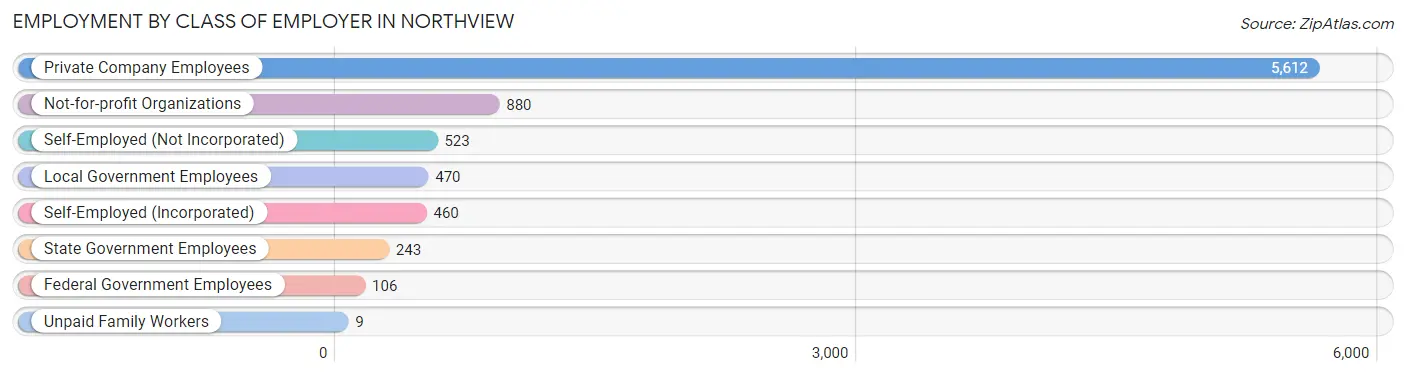
| Employer Class | # Employees | % Employees |
| Private Company Employees | 5,612 | 67.6% |
| Self-Employed (Incorporated) | 460 | 5.5% |
| Self-Employed (Not Incorporated) | 523 | 6.3% |
| Not-for-profit Organizations | 880 | 10.6% |
| Local Government Employees | 470 | 5.7% |
| State Government Employees | 243 | 2.9% |
| Federal Government Employees | 106 | 1.3% |
| Unpaid Family Workers | 9 | 0.1% |
| Total | 8,303 | 100.0% |
Employment Status by Age in Northview
According to the labor force statistics for Northview, out of the total population over 16 years of age (12,771), 69.5% or 8,876 individuals are in the labor force, with 5.6% or 497 of them unemployed. The age group with the highest labor force participation rate is 25 to 29 years, with 99.5% or 1,095 individuals in the labor force. Within the labor force, the 16 to 19 years age range has the highest percentage of unemployed individuals, with 31.4% or 177 of them being unemployed.
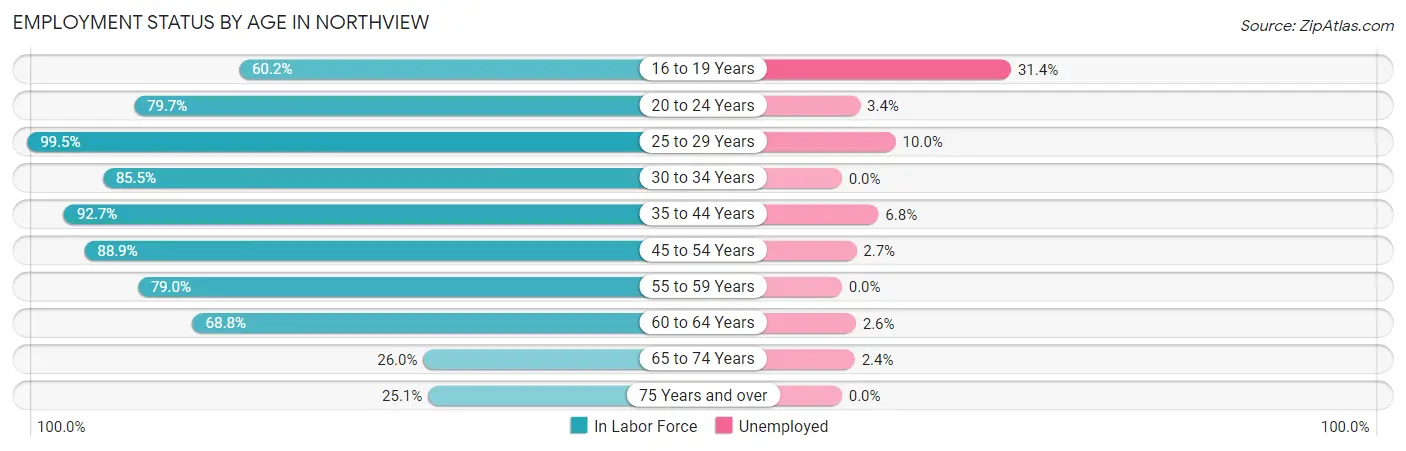
| Age Bracket | In Labor Force | Unemployed |
| 16 to 19 Years | 564 (60.2%) | 177 (31.4%) |
| 20 to 24 Years | 561 (79.7%) | 19 (3.4%) |
| 25 to 29 Years | 1,095 (99.5%) | 110 (10.0%) |
| 30 to 34 Years | 958 (85.5%) | 0 (0.0%) |
| 35 to 44 Years | 1,744 (92.7%) | 119 (6.8%) |
| 45 to 54 Years | 1,568 (88.9%) | 42 (2.7%) |
| 55 to 59 Years | 739 (79.0%) | 0 (0.0%) |
| 60 to 64 Years | 852 (68.8%) | 22 (2.6%) |
| 65 to 74 Years | 410 (26.0%) | 10 (2.4%) |
| 75 Years and over | 379 (25.1%) | 0 (0.0%) |
| Total | 8,876 (69.5%) | 497 (5.6%) |
Employment Status by Educational Attainment in Northview
According to labor force statistics for Northview, 86.5% of individuals (6,956) out of the total population between 25 and 64 years of age (8,042) are in the labor force, with 4.2% or 292 of them being unemployed. The group with the highest labor force participation rate are those with the educational attainment of bachelor's degree or higher, with 93.1% or 2,737 individuals in the labor force. Within the labor force, individuals with college / associate degree education have the highest percentage of unemployment, with 8.0% or 202 of them being unemployed.
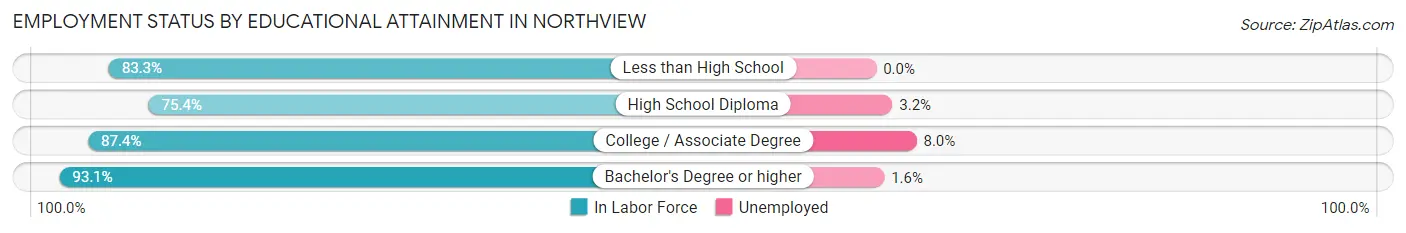
| Educational Attainment | In Labor Force | Unemployed |
| Less than High School | 289 (83.3%) | 0 (0.0%) |
| High School Diploma | 1,412 (75.4%) | 60 (3.2%) |
| College / Associate Degree | 2,519 (87.4%) | 231 (8.0%) |
| Bachelor's Degree or higher | 2,737 (93.1%) | 47 (1.6%) |
| Total | 6,956 (86.5%) | 338 (4.2%) |
Employment Occupations by Sex in Northview
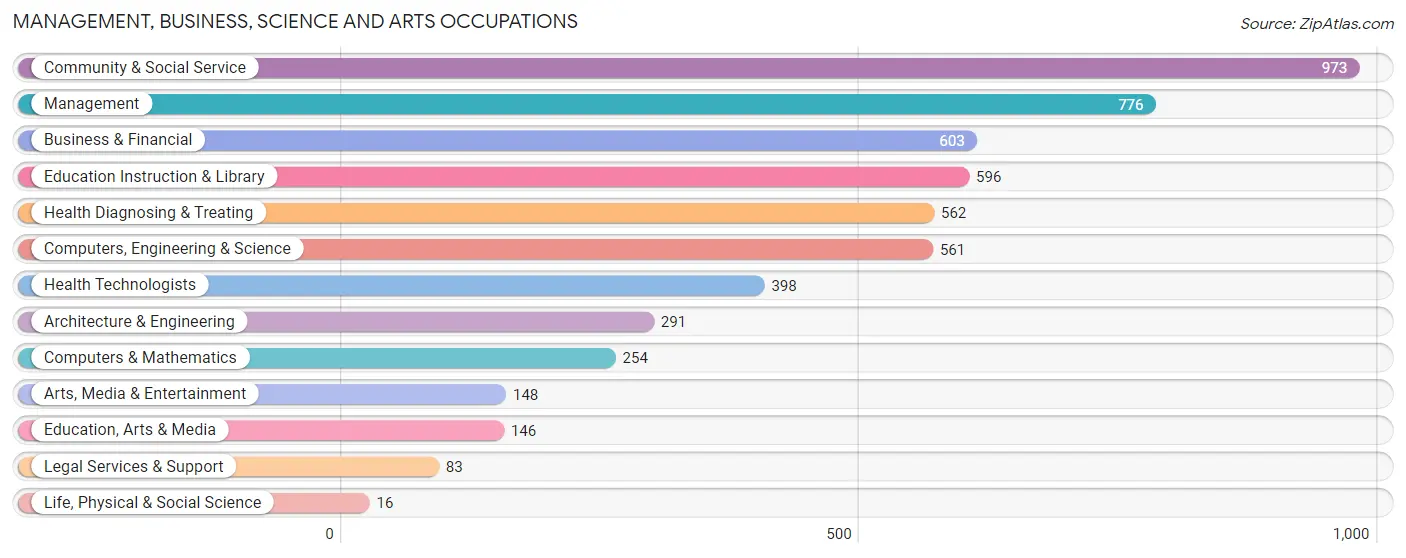
Management, Business, Science and Arts Occupations
The most common Management, Business, Science and Arts occupations in Northview are Community & Social Service (973 | 11.6%), Management (776 | 9.3%), Business & Financial (603 | 7.2%), Education Instruction & Library (596 | 7.1%), and Health Diagnosing & Treating (562 | 6.7%).
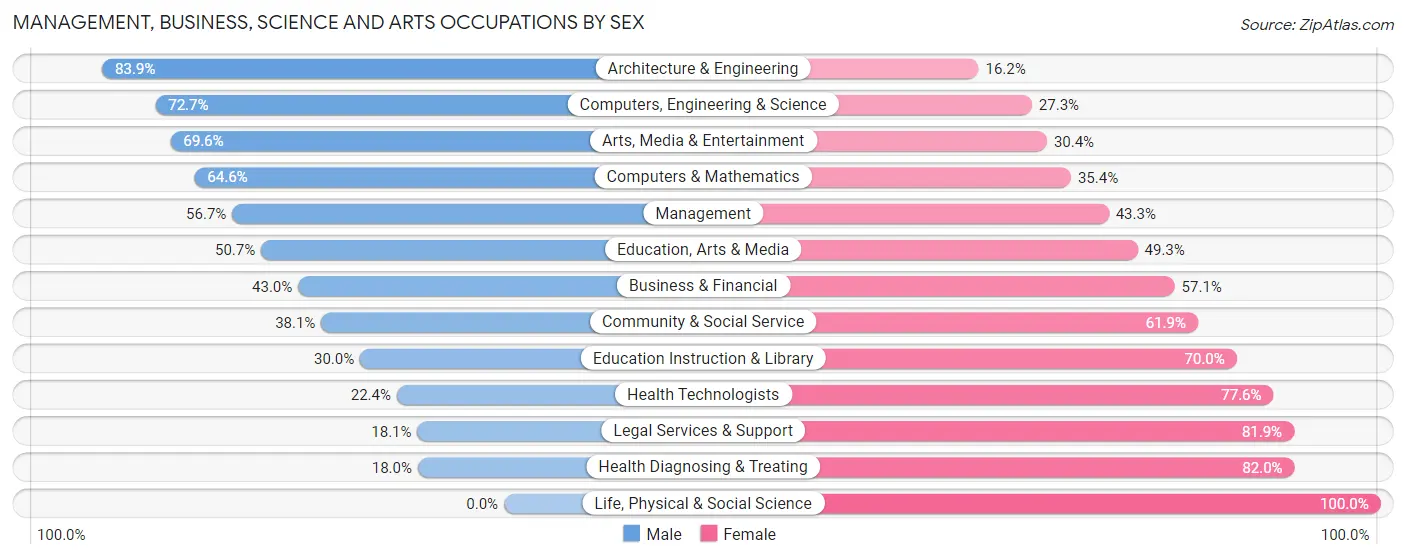
Management, Business, Science and Arts Occupations by Sex
Within the Management, Business, Science and Arts occupations in Northview, the most male-oriented occupations are Architecture & Engineering (83.9%), Computers, Engineering & Science (72.7%), and Arts, Media & Entertainment (69.6%), while the most female-oriented occupations are Life, Physical & Social Science (100.0%), Health Diagnosing & Treating (82.0%), and Legal Services & Support (81.9%).
| Occupation | Male | Female |
| Management | 440 (56.7%) | 336 (43.3%) |
| Business & Financial | 259 (42.9%) | 344 (57.1%) |
| Computers, Engineering & Science | 408 (72.7%) | 153 (27.3%) |
| Computers & Mathematics | 164 (64.6%) | 90 (35.4%) |
| Architecture & Engineering | 244 (83.9%) | 47 (16.2%) |
| Life, Physical & Social Science | 0 (0.0%) | 16 (100.0%) |
| Community & Social Service | 371 (38.1%) | 602 (61.9%) |
| Education, Arts & Media | 74 (50.7%) | 72 (49.3%) |
| Legal Services & Support | 15 (18.1%) | 68 (81.9%) |
| Education Instruction & Library | 179 (30.0%) | 417 (70.0%) |
| Arts, Media & Entertainment | 103 (69.6%) | 45 (30.4%) |
| Health Diagnosing & Treating | 101 (18.0%) | 461 (82.0%) |
| Health Technologists | 89 (22.4%) | 309 (77.6%) |
| Total (Category) | 1,579 (45.4%) | 1,896 (54.6%) |
| Total (Overall) | 4,338 (51.8%) | 4,036 (48.2%) |
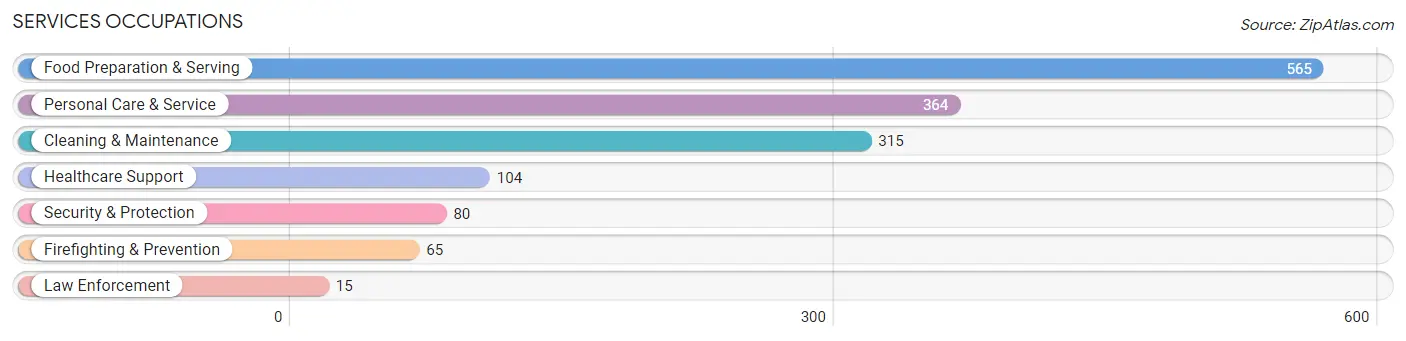
Services Occupations
The most common Services occupations in Northview are Food Preparation & Serving (565 | 6.8%), Personal Care & Service (364 | 4.3%), Cleaning & Maintenance (315 | 3.8%), Healthcare Support (104 | 1.2%), and Security & Protection (80 | 1.0%).
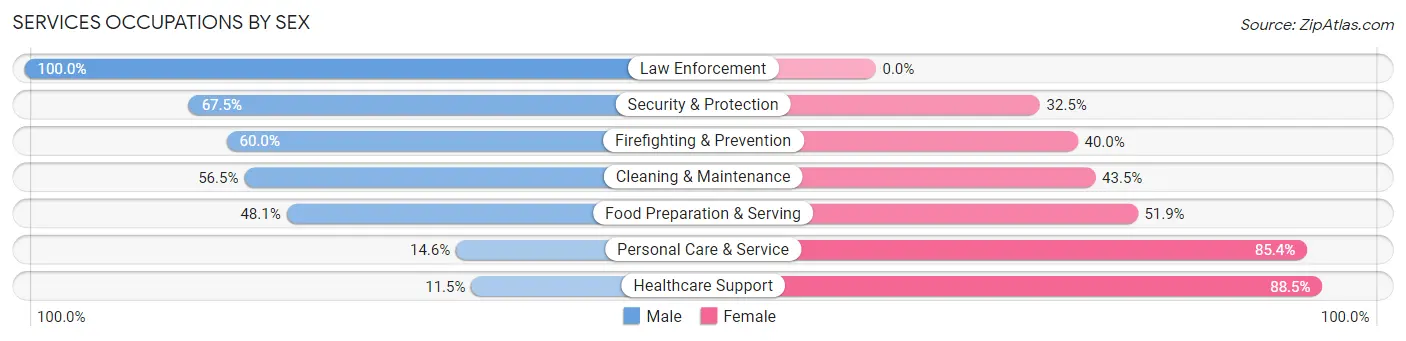
Services Occupations by Sex
Within the Services occupations in Northview, the most male-oriented occupations are Law Enforcement (100.0%), Security & Protection (67.5%), and Firefighting & Prevention (60.0%), while the most female-oriented occupations are Healthcare Support (88.5%), Personal Care & Service (85.4%), and Food Preparation & Serving (51.9%).
| Occupation | Male | Female |
| Healthcare Support | 12 (11.5%) | 92 (88.5%) |
| Security & Protection | 54 (67.5%) | 26 (32.5%) |
| Firefighting & Prevention | 39 (60.0%) | 26 (40.0%) |
| Law Enforcement | 15 (100.0%) | 0 (0.0%) |
| Food Preparation & Serving | 272 (48.1%) | 293 (51.9%) |
| Cleaning & Maintenance | 178 (56.5%) | 137 (43.5%) |
| Personal Care & Service | 53 (14.6%) | 311 (85.4%) |
| Total (Category) | 569 (39.9%) | 859 (60.2%) |
| Total (Overall) | 4,338 (51.8%) | 4,036 (48.2%) |
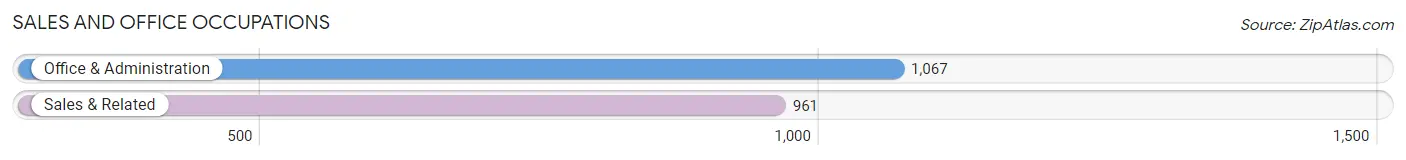
Sales and Office Occupations
The most common Sales and Office occupations in Northview are Office & Administration (1,067 | 12.7%), and Sales & Related (961 | 11.5%).
Sales and Office Occupations by Sex
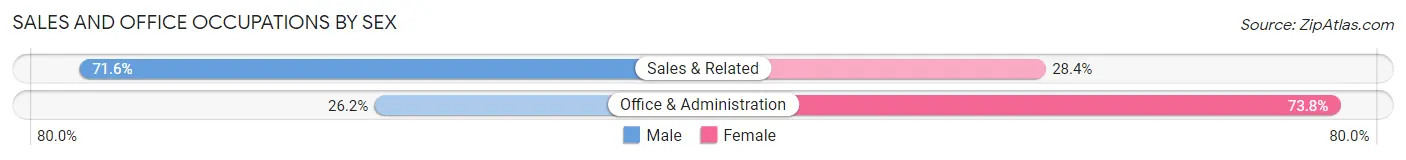
| Occupation | Male | Female |
| Sales & Related | 688 (71.6%) | 273 (28.4%) |
| Office & Administration | 280 (26.2%) | 787 (73.8%) |
| Total (Category) | 968 (47.7%) | 1,060 (52.3%) |
| Total (Overall) | 4,338 (51.8%) | 4,036 (48.2%) |
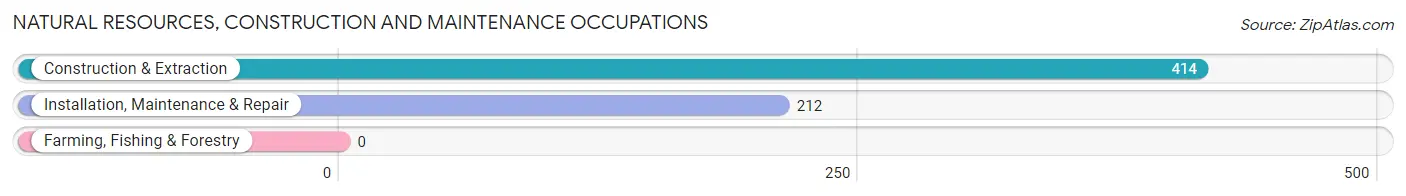
Natural Resources, Construction and Maintenance Occupations
The most common Natural Resources, Construction and Maintenance occupations in Northview are Construction & Extraction (414 | 4.9%), and Installation, Maintenance & Repair (212 | 2.5%).
Natural Resources, Construction and Maintenance Occupations by Sex
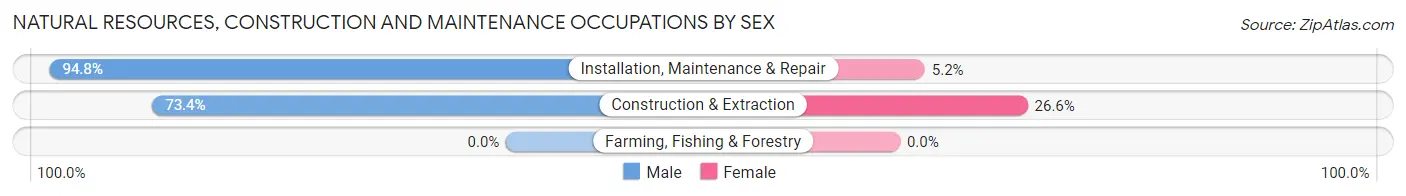
| Occupation | Male | Female |
| Farming, Fishing & Forestry | 0 (0.0%) | 0 (0.0%) |
| Construction & Extraction | 304 (73.4%) | 110 (26.6%) |
| Installation, Maintenance & Repair | 201 (94.8%) | 11 (5.2%) |
| Total (Category) | 505 (80.7%) | 121 (19.3%) |
| Total (Overall) | 4,338 (51.8%) | 4,036 (48.2%) |
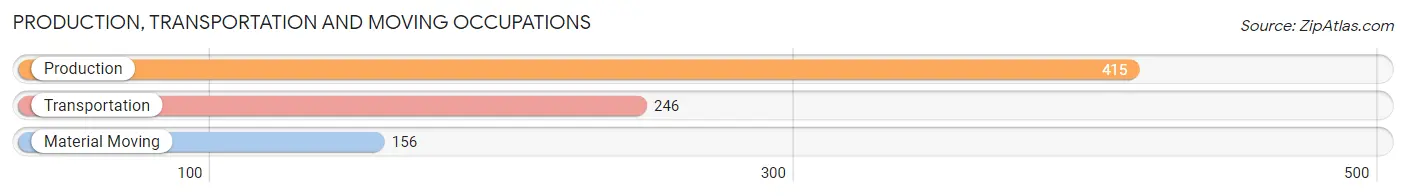
Production, Transportation and Moving Occupations
The most common Production, Transportation and Moving occupations in Northview are Production (415 | 5.0%), Transportation (246 | 2.9%), and Material Moving (156 | 1.9%).
Production, Transportation and Moving Occupations by Sex
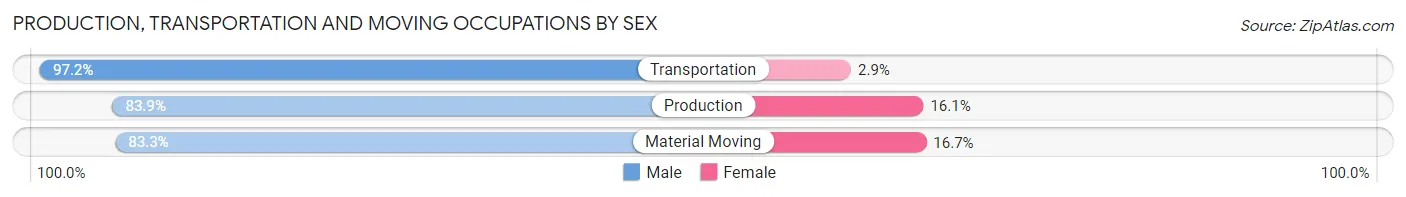
| Occupation | Male | Female |
| Production | 348 (83.9%) | 67 (16.1%) |
| Transportation | 239 (97.2%) | 7 (2.9%) |
| Material Moving | 130 (83.3%) | 26 (16.7%) |
| Total (Category) | 717 (87.8%) | 100 (12.2%) |
| Total (Overall) | 4,338 (51.8%) | 4,036 (48.2%) |
Employment Industries by Sex in Northview
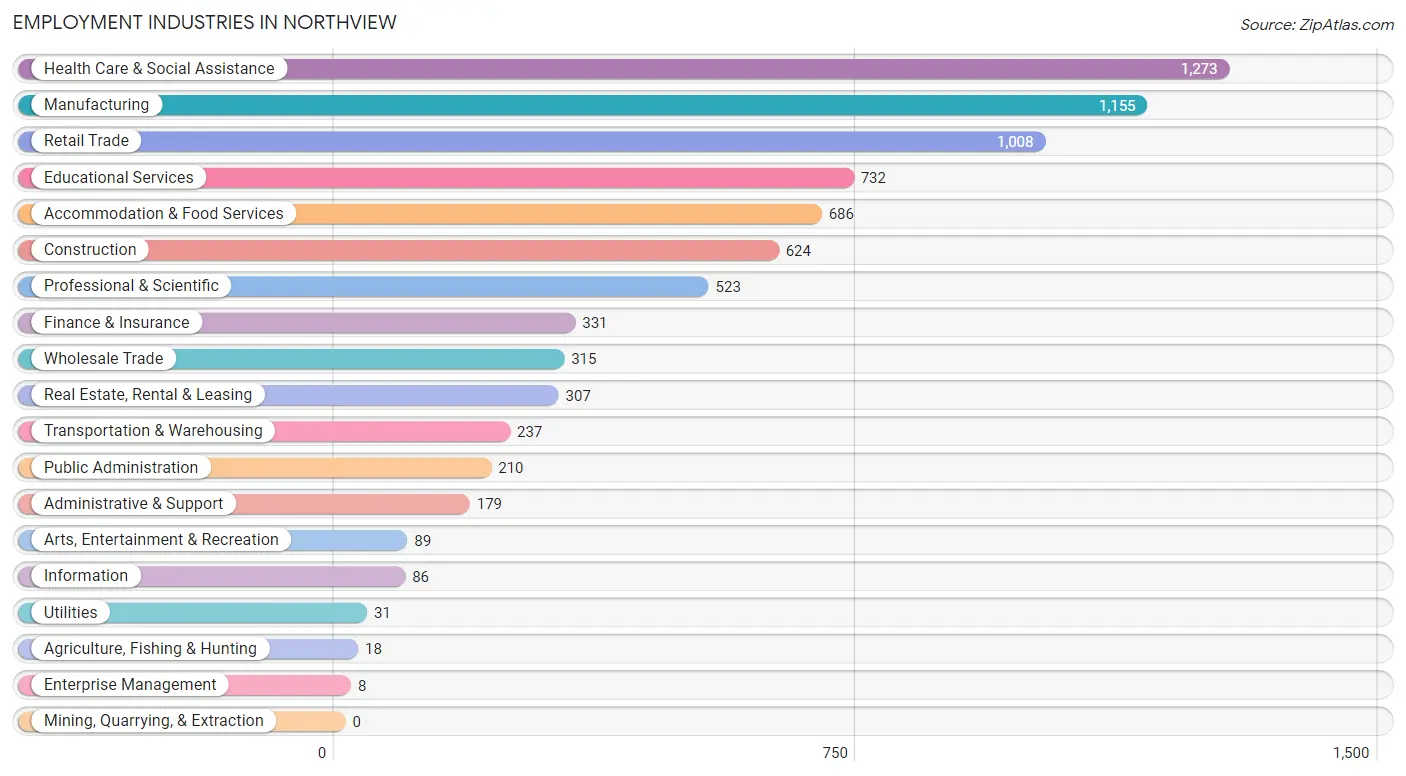
Employment Industries in Northview
The major employment industries in Northview include Health Care & Social Assistance (1,273 | 15.2%), Manufacturing (1,155 | 13.8%), Retail Trade (1,008 | 12.0%), Educational Services (732 | 8.7%), and Accommodation & Food Services (686 | 8.2%).
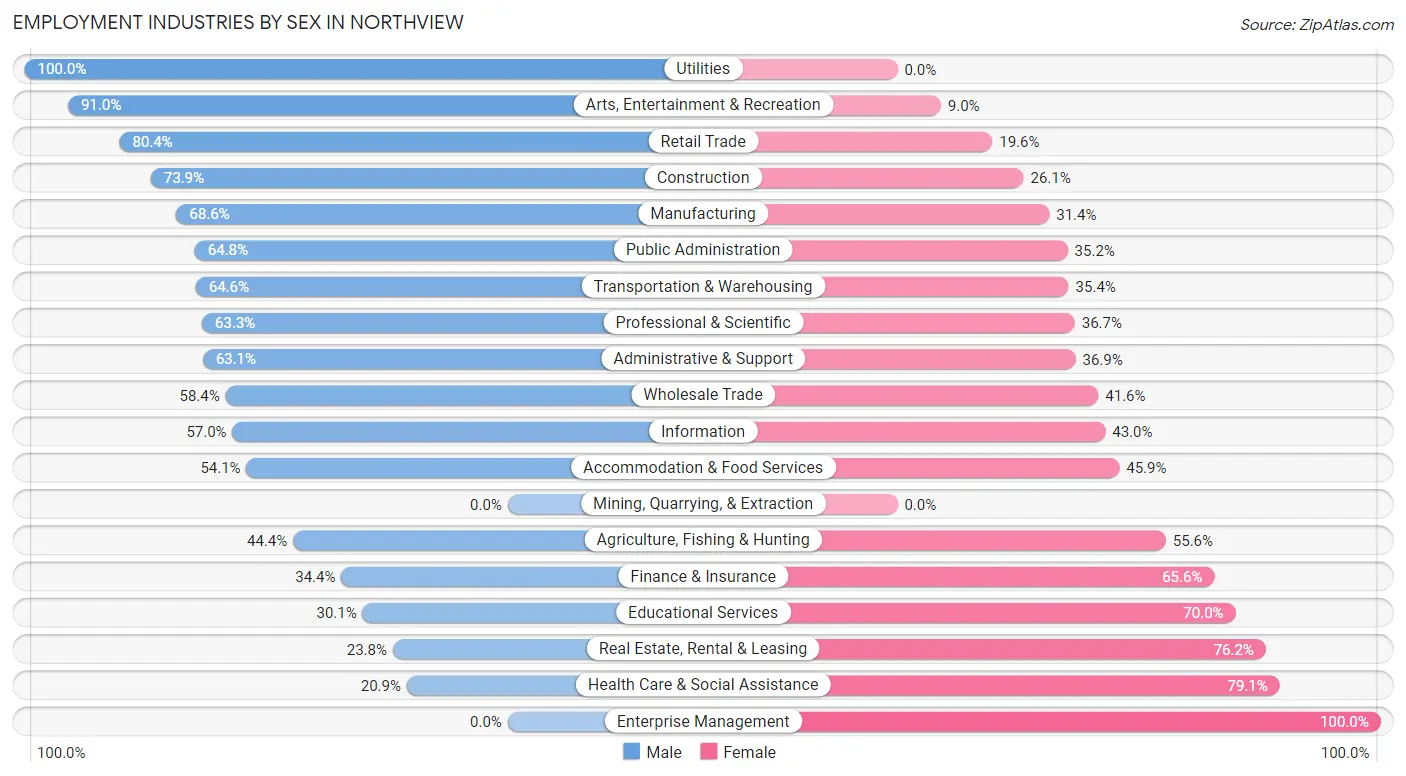
Employment Industries by Sex in Northview
The Northview industries that see more men than women are Utilities (100.0%), Arts, Entertainment & Recreation (91.0%), and Retail Trade (80.4%), whereas the industries that tend to have a higher number of women are Enterprise Management (100.0%), Health Care & Social Assistance (79.1%), and Real Estate, Rental & Leasing (76.2%).
| Industry | Male | Female |
| Agriculture, Fishing & Hunting | 8 (44.4%) | 10 (55.6%) |
| Mining, Quarrying, & Extraction | 0 (0.0%) | 0 (0.0%) |
| Construction | 461 (73.9%) | 163 (26.1%) |
| Manufacturing | 792 (68.6%) | 363 (31.4%) |
| Wholesale Trade | 184 (58.4%) | 131 (41.6%) |
| Retail Trade | 810 (80.4%) | 198 (19.6%) |
| Transportation & Warehousing | 153 (64.6%) | 84 (35.4%) |
| Utilities | 31 (100.0%) | 0 (0.0%) |
| Information | 49 (57.0%) | 37 (43.0%) |
| Finance & Insurance | 114 (34.4%) | 217 (65.6%) |
| Real Estate, Rental & Leasing | 73 (23.8%) | 234 (76.2%) |
| Professional & Scientific | 331 (63.3%) | 192 (36.7%) |
| Enterprise Management | 0 (0.0%) | 8 (100.0%) |
| Administrative & Support | 113 (63.1%) | 66 (36.9%) |
| Educational Services | 220 (30.0%) | 512 (70.0%) |
| Health Care & Social Assistance | 266 (20.9%) | 1,007 (79.1%) |
| Arts, Entertainment & Recreation | 81 (91.0%) | 8 (9.0%) |
| Accommodation & Food Services | 371 (54.1%) | 315 (45.9%) |
| Public Administration | 136 (64.8%) | 74 (35.2%) |
| Total | 4,338 (51.8%) | 4,036 (48.2%) |
Education in Northview
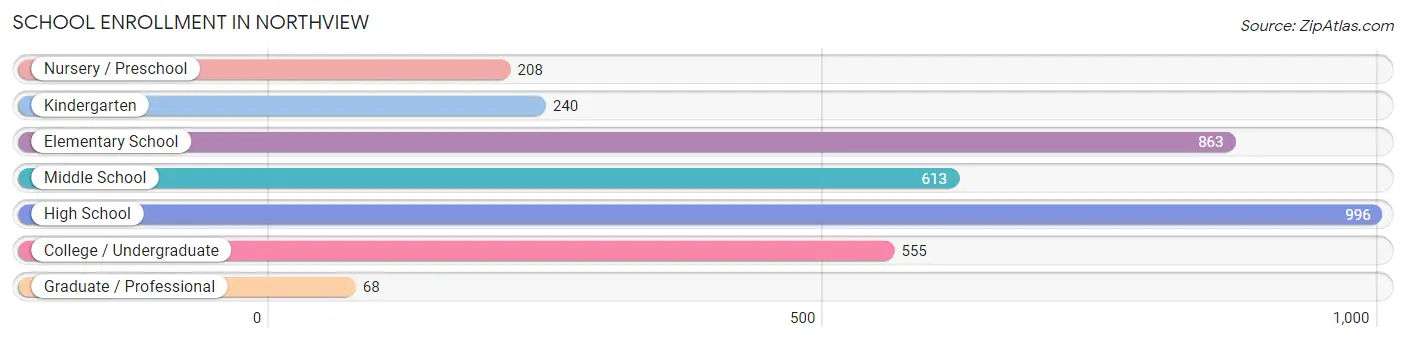
School Enrollment in Northview
The most common levels of schooling among the 3,543 students in Northview are high school (996 | 28.1%), elementary school (863 | 24.4%), and middle school (613 | 17.3%).
| School Level | # Students | % Students |
| Nursery / Preschool | 208 | 5.9% |
| Kindergarten | 240 | 6.8% |
| Elementary School | 863 | 24.4% |
| Middle School | 613 | 17.3% |
| High School | 996 | 28.1% |
| College / Undergraduate | 555 | 15.7% |
| Graduate / Professional | 68 | 1.9% |
| Total | 3,543 | 100.0% |
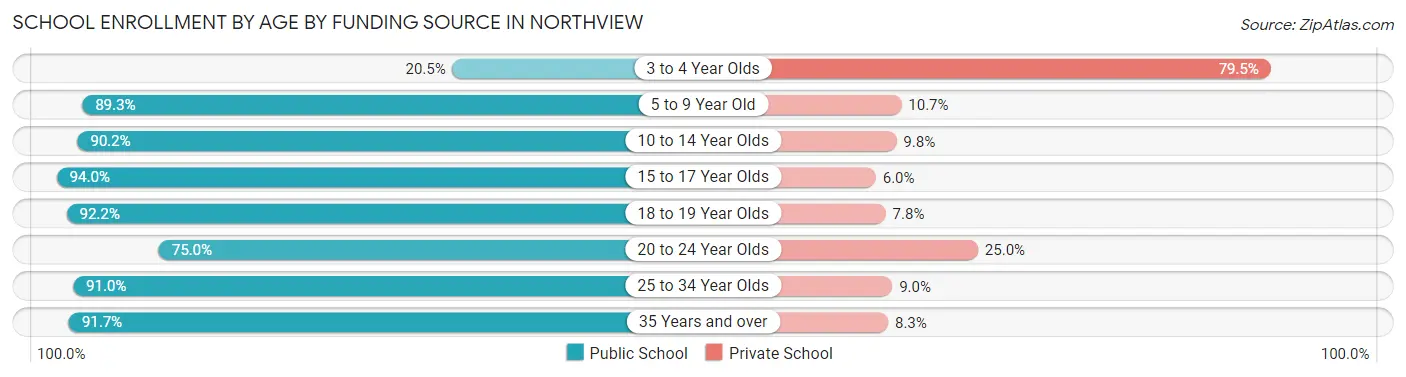
School Enrollment by Age by Funding Source in Northview
Out of a total of 3,543 students who are enrolled in schools in Northview, 471 (13.3%) attend a private institution, while the remaining 3,072 (86.7%) are enrolled in public schools. The age group of 3 to 4 year olds has the highest likelihood of being enrolled in private schools, with 136 (79.5% in the age bracket) enrolled. Conversely, the age group of 15 to 17 year olds has the lowest likelihood of being enrolled in a private school, with 613 (94.0% in the age bracket) attending a public institution.
| Age Bracket | Public School | Private School |
| 3 to 4 Year Olds | 35 (20.5%) | 136 (79.5%) |
| 5 to 9 Year Old | 889 (89.3%) | 107 (10.7%) |
| 10 to 14 Year Olds | 744 (90.2%) | 81 (9.8%) |
| 15 to 17 Year Olds | 613 (94.0%) | 39 (6.0%) |
| 18 to 19 Year Olds | 283 (92.2%) | 24 (7.8%) |
| 20 to 24 Year Olds | 156 (75.0%) | 52 (25.0%) |
| 25 to 34 Year Olds | 151 (91.0%) | 15 (9.0%) |
| 35 Years and over | 200 (91.7%) | 18 (8.3%) |
| Total | 3,072 (86.7%) | 471 (13.3%) |
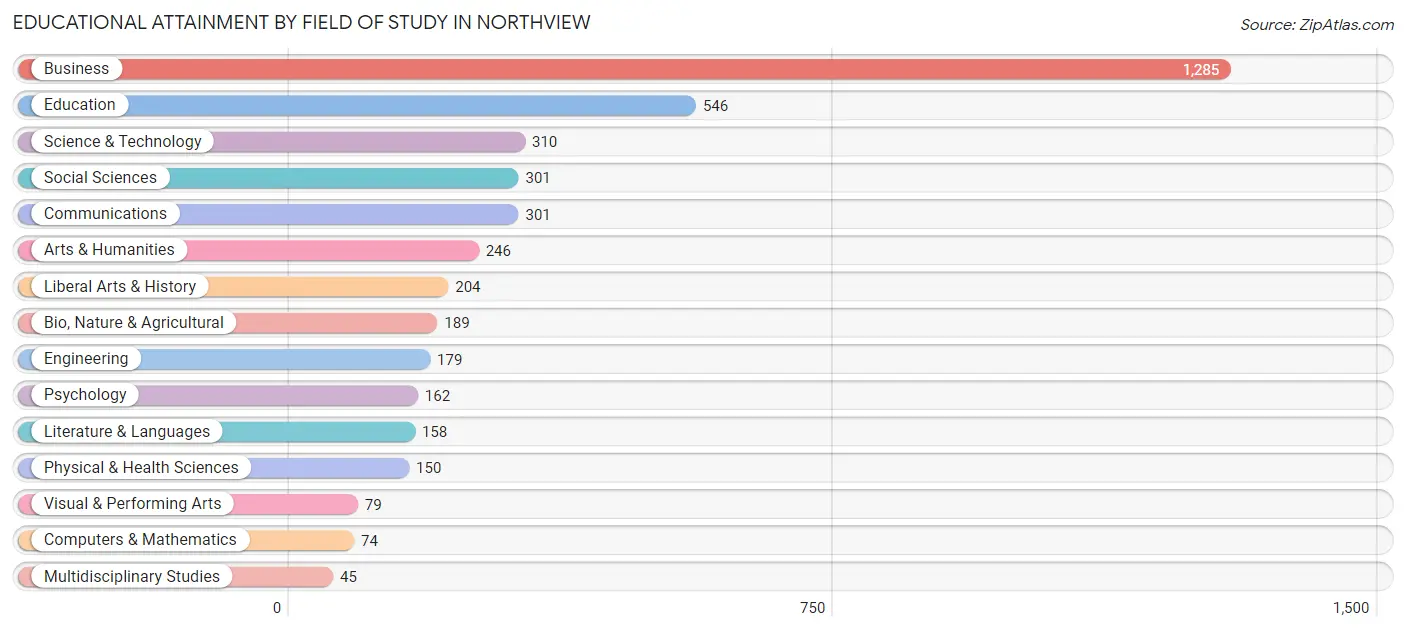
Educational Attainment by Field of Study in Northview
Business (1,285 | 30.4%), education (546 | 12.9%), science & technology (310 | 7.3%), social sciences (301 | 7.1%), and communications (301 | 7.1%) are the most common fields of study among 4,229 individuals in Northview who have obtained a bachelor's degree or higher.
| Field of Study | # Graduates | % Graduates |
| Computers & Mathematics | 74 | 1.8% |
| Bio, Nature & Agricultural | 189 | 4.5% |
| Physical & Health Sciences | 150 | 3.5% |
| Psychology | 162 | 3.8% |
| Social Sciences | 301 | 7.1% |
| Engineering | 179 | 4.2% |
| Multidisciplinary Studies | 45 | 1.1% |
| Science & Technology | 310 | 7.3% |
| Business | 1,285 | 30.4% |
| Education | 546 | 12.9% |
| Literature & Languages | 158 | 3.7% |
| Liberal Arts & History | 204 | 4.8% |
| Visual & Performing Arts | 79 | 1.9% |
| Communications | 301 | 7.1% |
| Arts & Humanities | 246 | 5.8% |
| Total | 4,229 | 100.0% |
Transportation & Commute in Northview
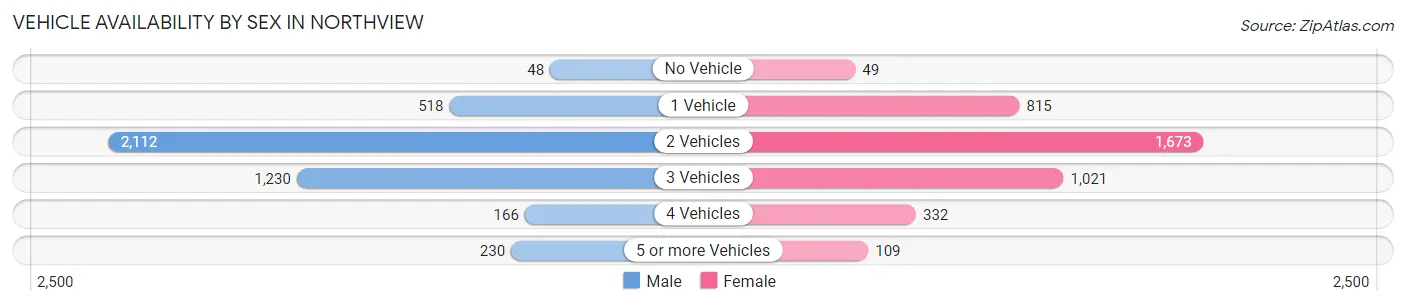
Vehicle Availability by Sex in Northview
The most prevalent vehicle ownership categories in Northview are males with 2 vehicles (2,112, accounting for 49.1%) and females with 2 vehicles (1,673, making up 52.8%).
| Vehicles Available | Male | Female |
| No Vehicle | 48 (1.1%) | 49 (1.2%) |
| 1 Vehicle | 518 (12.0%) | 815 (20.4%) |
| 2 Vehicles | 2,112 (49.1%) | 1,673 (41.8%) |
| 3 Vehicles | 1,230 (28.6%) | 1,021 (25.5%) |
| 4 Vehicles | 166 (3.9%) | 332 (8.3%) |
| 5 or more Vehicles | 230 (5.3%) | 109 (2.7%) |
| Total | 4,304 (100.0%) | 3,999 (100.0%) |
Commute Time in Northview
The most frequently occuring commute durations in Northview are 20 to 24 minutes (1,701 commuters, 22.7%), 15 to 19 minutes (1,531 commuters, 20.4%), and 5 to 9 minutes (1,272 commuters, 16.9%).
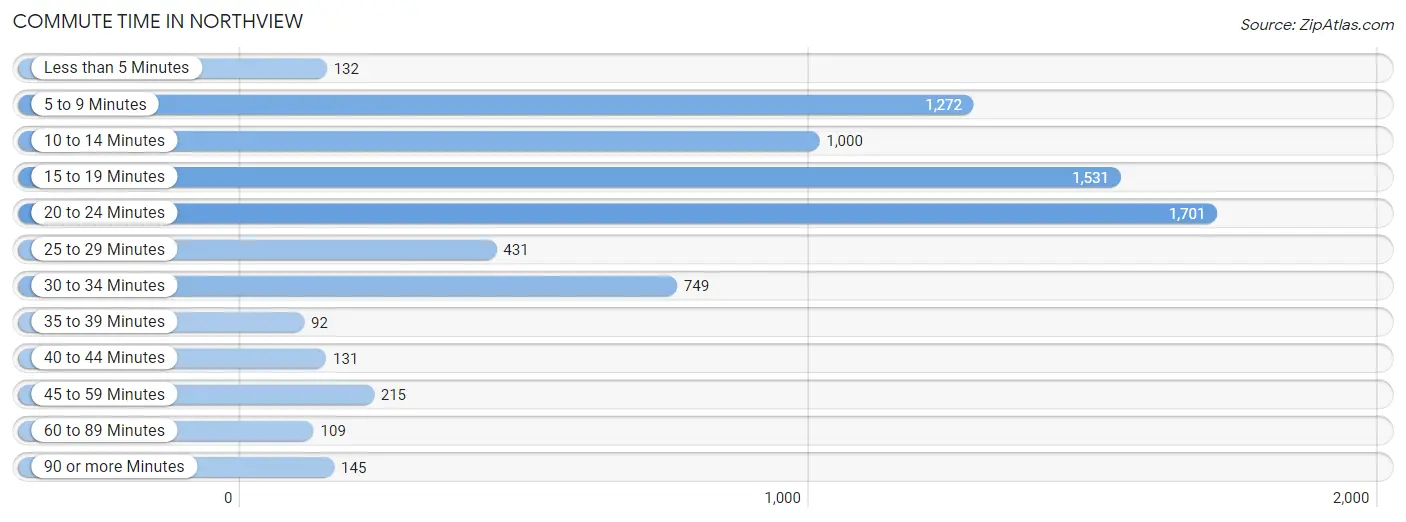
| Commute Time | # Commuters | % Commuters |
| Less than 5 Minutes | 132 | 1.8% |
| 5 to 9 Minutes | 1,272 | 16.9% |
| 10 to 14 Minutes | 1,000 | 13.3% |
| 15 to 19 Minutes | 1,531 | 20.4% |
| 20 to 24 Minutes | 1,701 | 22.7% |
| 25 to 29 Minutes | 431 | 5.7% |
| 30 to 34 Minutes | 749 | 10.0% |
| 35 to 39 Minutes | 92 | 1.2% |
| 40 to 44 Minutes | 131 | 1.7% |
| 45 to 59 Minutes | 215 | 2.9% |
| 60 to 89 Minutes | 109 | 1.5% |
| 90 or more Minutes | 145 | 1.9% |
Commute Time by Sex in Northview
The most common commute times in Northview are 15 to 19 minutes (1,005 commuters, 25.5%) for males and 5 to 9 minutes (923 commuters, 25.8%) for females.
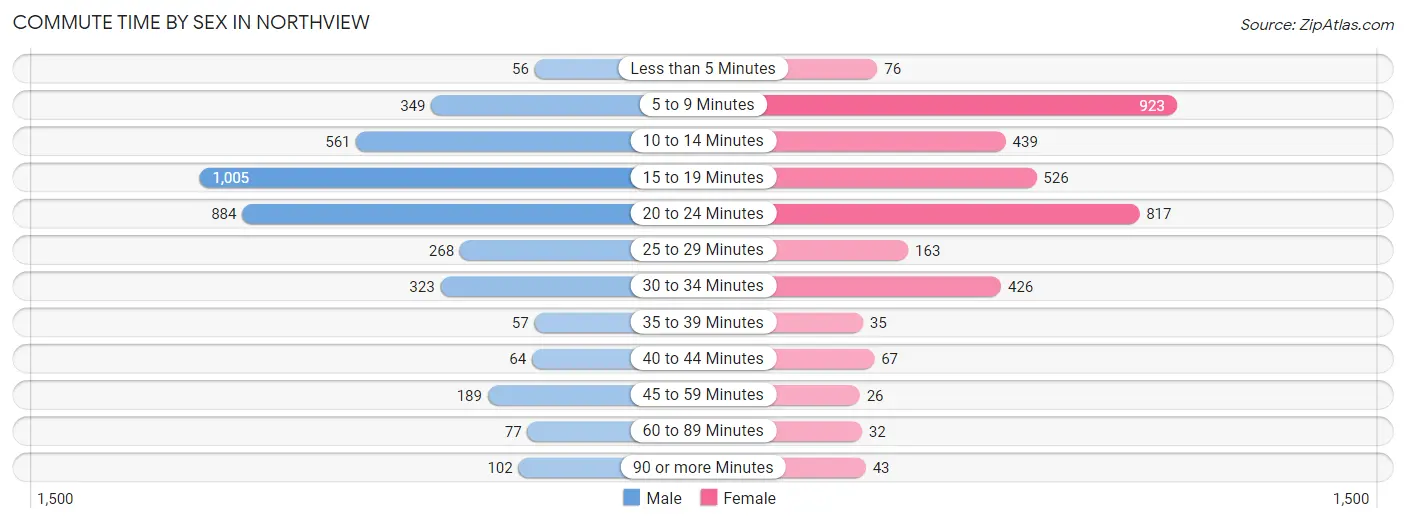
| Commute Time | Male | Female |
| Less than 5 Minutes | 56 (1.4%) | 76 (2.1%) |
| 5 to 9 Minutes | 349 (8.9%) | 923 (25.8%) |
| 10 to 14 Minutes | 561 (14.3%) | 439 (12.3%) |
| 15 to 19 Minutes | 1,005 (25.5%) | 526 (14.7%) |
| 20 to 24 Minutes | 884 (22.5%) | 817 (22.9%) |
| 25 to 29 Minutes | 268 (6.8%) | 163 (4.6%) |
| 30 to 34 Minutes | 323 (8.2%) | 426 (11.9%) |
| 35 to 39 Minutes | 57 (1.5%) | 35 (1.0%) |
| 40 to 44 Minutes | 64 (1.6%) | 67 (1.9%) |
| 45 to 59 Minutes | 189 (4.8%) | 26 (0.7%) |
| 60 to 89 Minutes | 77 (2.0%) | 32 (0.9%) |
| 90 or more Minutes | 102 (2.6%) | 43 (1.2%) |
Time of Departure to Work by Sex in Northview
The most frequent times of departure to work in Northview are 8:00 AM to 8:29 AM (634, 16.1%) for males and 7:00 AM to 7:29 AM (636, 17.8%) for females.
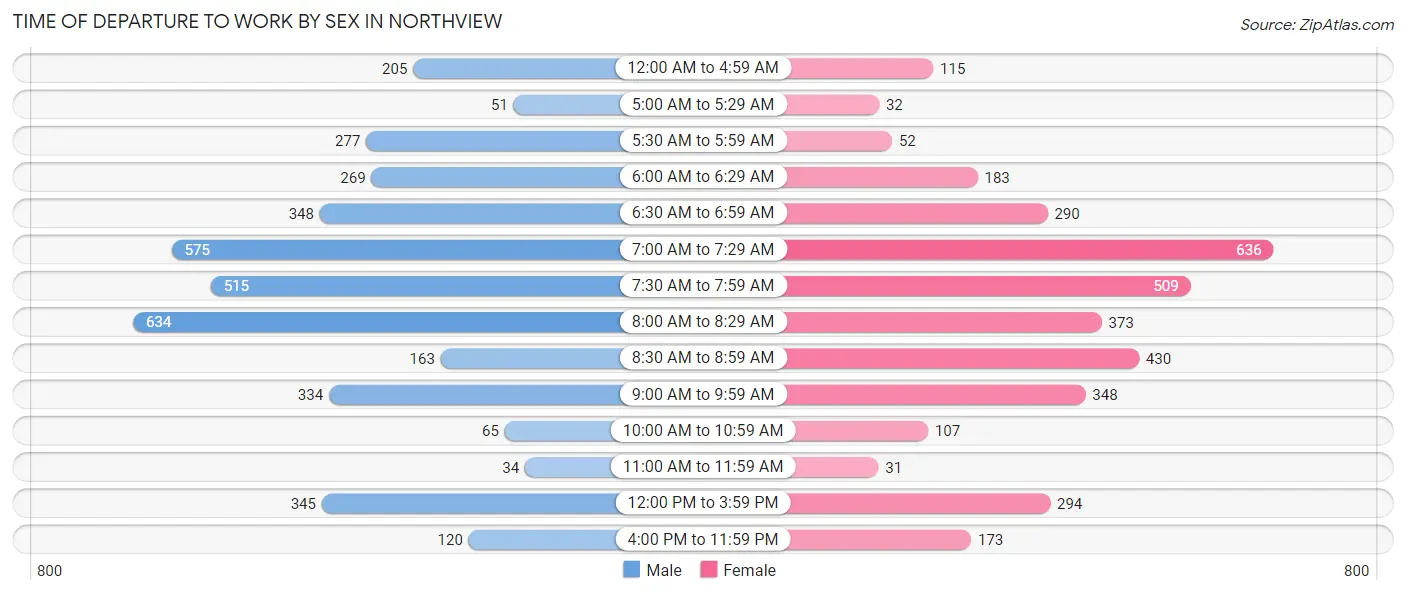
| Time of Departure | Male | Female |
| 12:00 AM to 4:59 AM | 205 (5.2%) | 115 (3.2%) |
| 5:00 AM to 5:29 AM | 51 (1.3%) | 32 (0.9%) |
| 5:30 AM to 5:59 AM | 277 (7.0%) | 52 (1.5%) |
| 6:00 AM to 6:29 AM | 269 (6.8%) | 183 (5.1%) |
| 6:30 AM to 6:59 AM | 348 (8.8%) | 290 (8.1%) |
| 7:00 AM to 7:29 AM | 575 (14.6%) | 636 (17.8%) |
| 7:30 AM to 7:59 AM | 515 (13.1%) | 509 (14.2%) |
| 8:00 AM to 8:29 AM | 634 (16.1%) | 373 (10.4%) |
| 8:30 AM to 8:59 AM | 163 (4.1%) | 430 (12.0%) |
| 9:00 AM to 9:59 AM | 334 (8.5%) | 348 (9.7%) |
| 10:00 AM to 10:59 AM | 65 (1.7%) | 107 (3.0%) |
| 11:00 AM to 11:59 AM | 34 (0.9%) | 31 (0.9%) |
| 12:00 PM to 3:59 PM | 345 (8.8%) | 294 (8.2%) |
| 4:00 PM to 11:59 PM | 120 (3.0%) | 173 (4.8%) |
| Total | 3,935 (100.0%) | 3,573 (100.0%) |
Housing Occupancy in Northview
Occupancy by Ownership in Northview
Of the total 6,491 dwellings in Northview, owner-occupied units account for 4,983 (76.8%), while renter-occupied units make up 1,508 (23.2%).
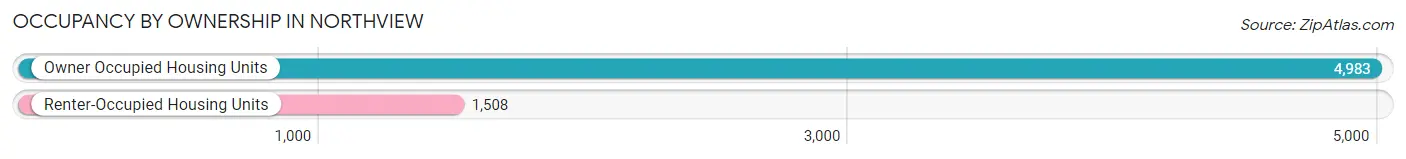
| Occupancy | # Housing Units | % Housing Units |
| Owner Occupied Housing Units | 4,983 | 76.8% |
| Renter-Occupied Housing Units | 1,508 | 23.2% |
| Total Occupied Housing Units | 6,491 | 100.0% |
Occupancy by Household Size in Northview
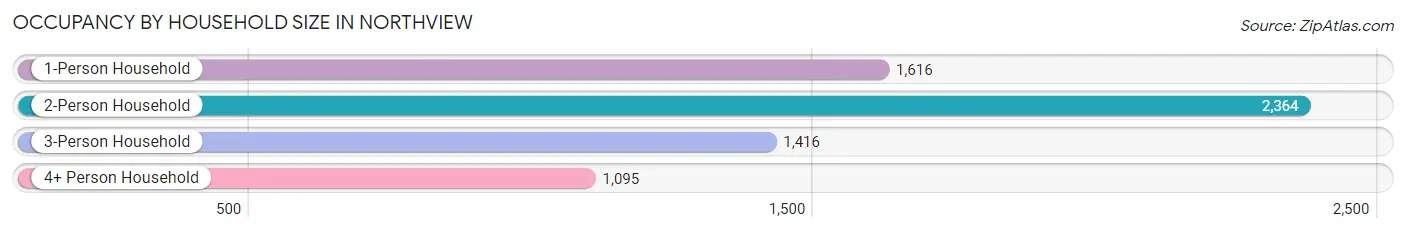
| Household Size | # Housing Units | % Housing Units |
| 1-Person Household | 1,616 | 24.9% |
| 2-Person Household | 2,364 | 36.4% |
| 3-Person Household | 1,416 | 21.8% |
| 4+ Person Household | 1,095 | 16.9% |
| Total Housing Units | 6,491 | 100.0% |
Occupancy by Ownership by Household Size in Northview
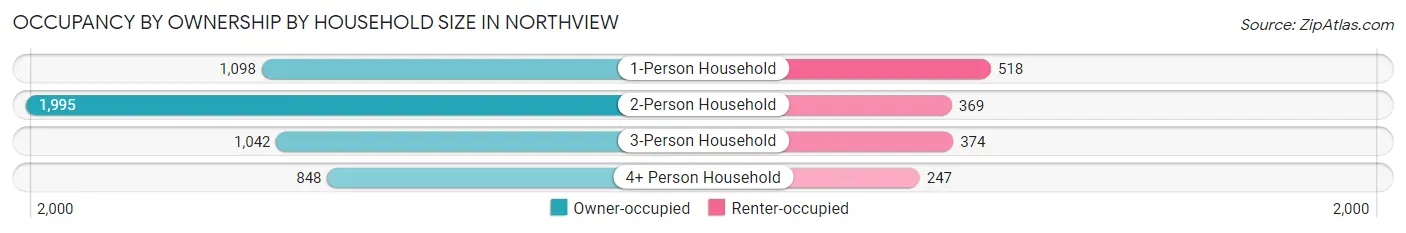
| Household Size | Owner-occupied | Renter-occupied |
| 1-Person Household | 1,098 (67.9%) | 518 (32.1%) |
| 2-Person Household | 1,995 (84.4%) | 369 (15.6%) |
| 3-Person Household | 1,042 (73.6%) | 374 (26.4%) |
| 4+ Person Household | 848 (77.4%) | 247 (22.6%) |
| Total Housing Units | 4,983 (76.8%) | 1,508 (23.2%) |
Occupancy by Educational Attainment in Northview
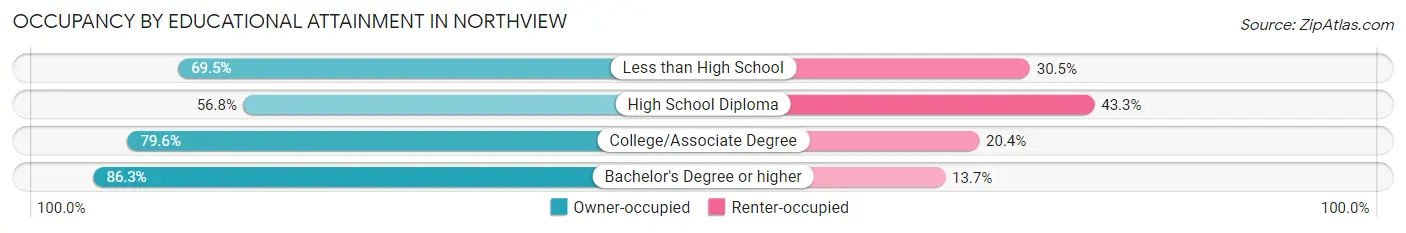
| Household Size | Owner-occupied | Renter-occupied |
| Less than High School | 137 (69.5%) | 60 (30.5%) |
| High School Diploma | 828 (56.8%) | 631 (43.2%) |
| College/Associate Degree | 1,844 (79.6%) | 473 (20.4%) |
| Bachelor's Degree or higher | 2,174 (86.3%) | 344 (13.7%) |
Occupancy by Age of Householder in Northview
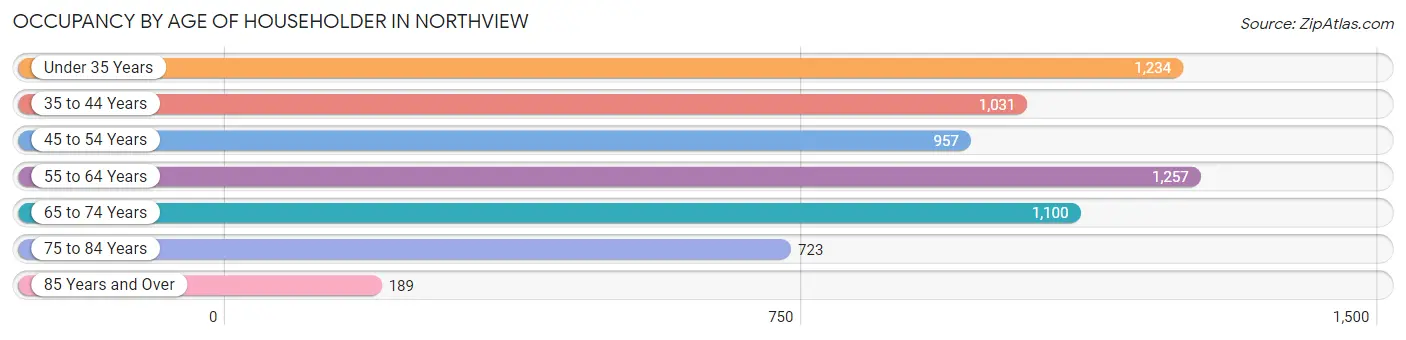
| Age Bracket | # Households | % Households |
| Under 35 Years | 1,234 | 19.0% |
| 35 to 44 Years | 1,031 | 15.9% |
| 45 to 54 Years | 957 | 14.7% |
| 55 to 64 Years | 1,257 | 19.4% |
| 65 to 74 Years | 1,100 | 17.0% |
| 75 to 84 Years | 723 | 11.1% |
| 85 Years and Over | 189 | 2.9% |
| Total | 6,491 | 100.0% |
Housing Finances in Northview
Median Income by Occupancy in Northview
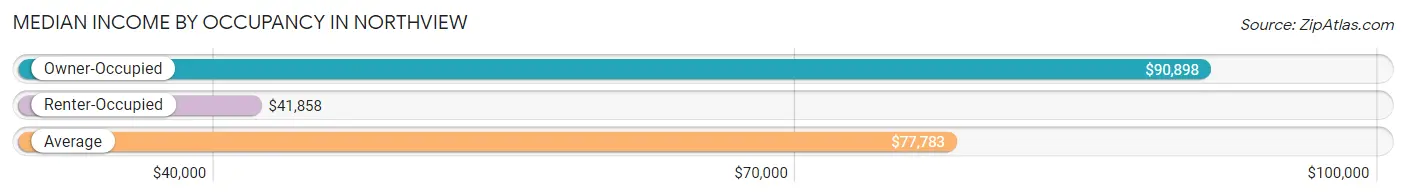
| Occupancy Type | # Households | Median Income |
| Owner-Occupied | 4,983 (76.8%) | $90,898 |
| Renter-Occupied | 1,508 (23.2%) | $41,858 |
| Average | 6,491 (100.0%) | $77,783 |
Occupancy by Householder Income Bracket in Northview
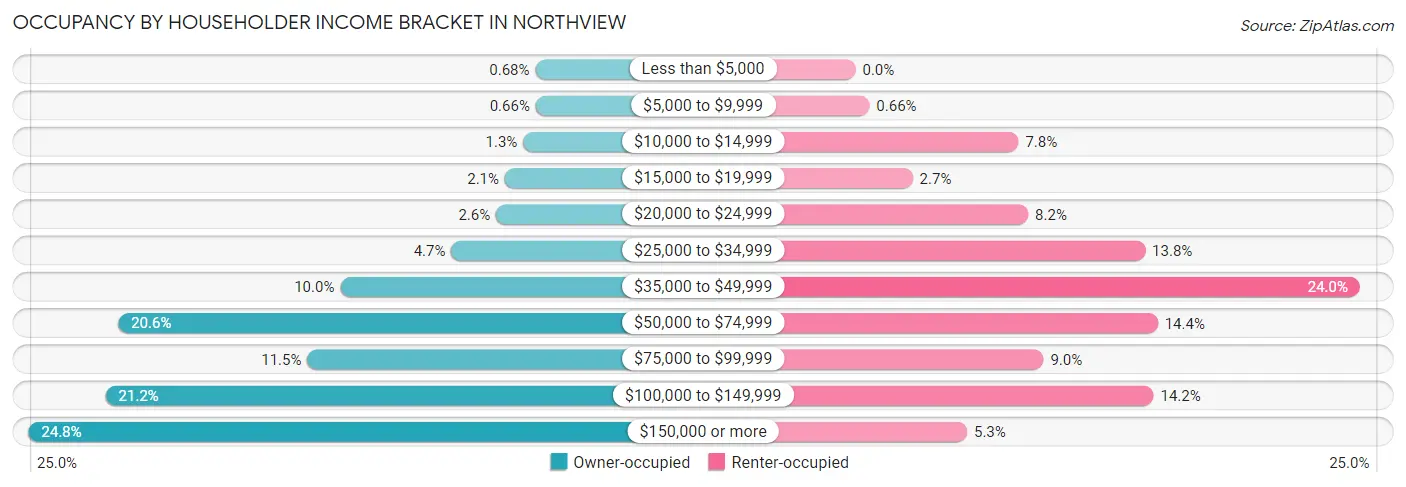
| Income Bracket | Owner-occupied | Renter-occupied |
| Less than $5,000 | 34 (0.7%) | 0 (0.0%) |
| $5,000 to $9,999 | 33 (0.7%) | 10 (0.7%) |
| $10,000 to $14,999 | 63 (1.3%) | 117 (7.8%) |
| $15,000 to $19,999 | 106 (2.1%) | 41 (2.7%) |
| $20,000 to $24,999 | 127 (2.5%) | 124 (8.2%) |
| $25,000 to $34,999 | 233 (4.7%) | 208 (13.8%) |
| $35,000 to $49,999 | 497 (10.0%) | 362 (24.0%) |
| $50,000 to $74,999 | 1,024 (20.5%) | 217 (14.4%) |
| $75,000 to $99,999 | 575 (11.5%) | 135 (8.9%) |
| $100,000 to $149,999 | 1,054 (21.1%) | 214 (14.2%) |
| $150,000 or more | 1,237 (24.8%) | 80 (5.3%) |
| Total | 4,983 (100.0%) | 1,508 (100.0%) |
Monthly Housing Cost Tiers in Northview
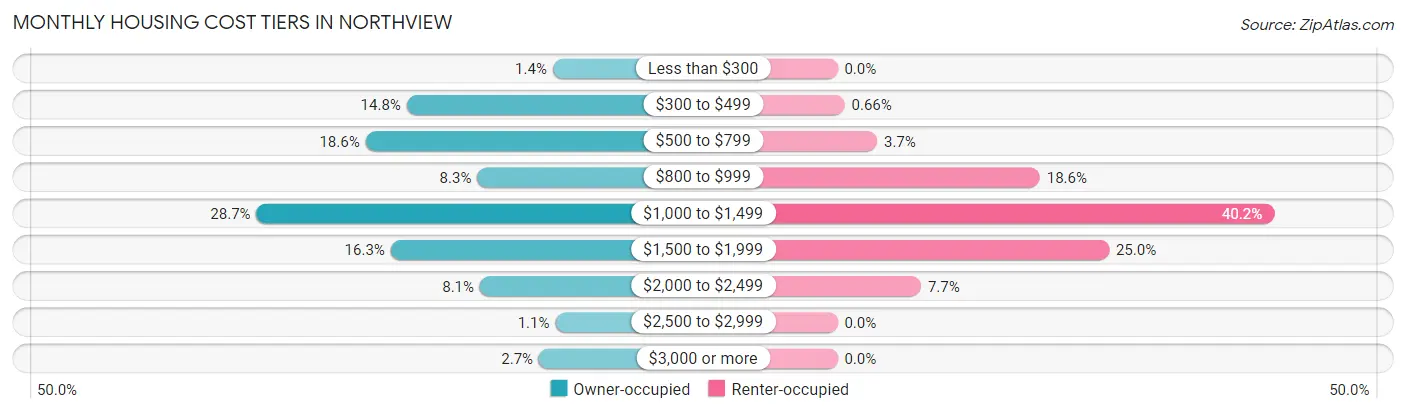
| Monthly Cost | Owner-occupied | Renter-occupied |
| Less than $300 | 69 (1.4%) | 0 (0.0%) |
| $300 to $499 | 739 (14.8%) | 10 (0.7%) |
| $500 to $799 | 928 (18.6%) | 55 (3.6%) |
| $800 to $999 | 415 (8.3%) | 281 (18.6%) |
| $1,000 to $1,499 | 1,428 (28.7%) | 606 (40.2%) |
| $1,500 to $1,999 | 812 (16.3%) | 377 (25.0%) |
| $2,000 to $2,499 | 403 (8.1%) | 116 (7.7%) |
| $2,500 to $2,999 | 57 (1.1%) | 0 (0.0%) |
| $3,000 or more | 132 (2.6%) | 0 (0.0%) |
| Total | 4,983 (100.0%) | 1,508 (100.0%) |
Physical Housing Characteristics in Northview
Housing Structures in Northview
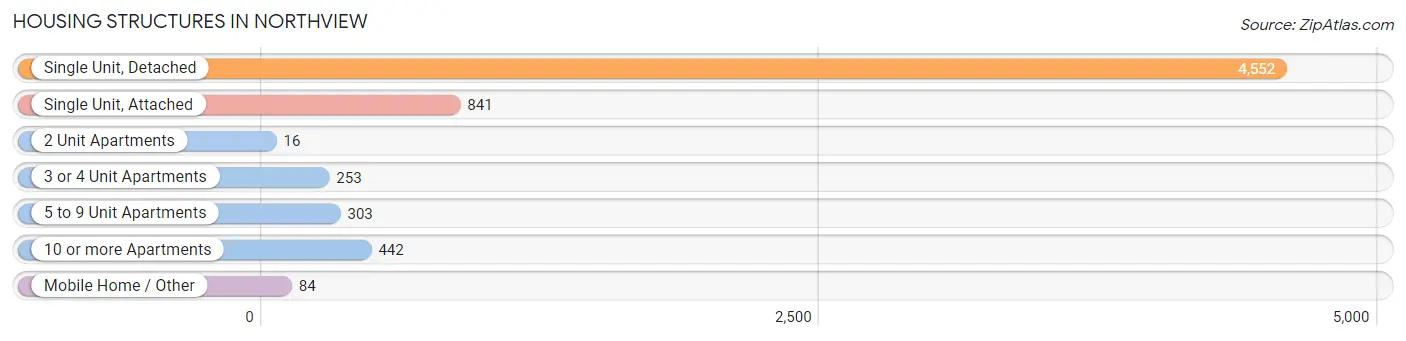
| Structure Type | # Housing Units | % Housing Units |
| Single Unit, Detached | 4,552 | 70.1% |
| Single Unit, Attached | 841 | 13.0% |
| 2 Unit Apartments | 16 | 0.3% |
| 3 or 4 Unit Apartments | 253 | 3.9% |
| 5 to 9 Unit Apartments | 303 | 4.7% |
| 10 or more Apartments | 442 | 6.8% |
| Mobile Home / Other | 84 | 1.3% |
| Total | 6,491 | 100.0% |
Housing Structures by Occupancy in Northview
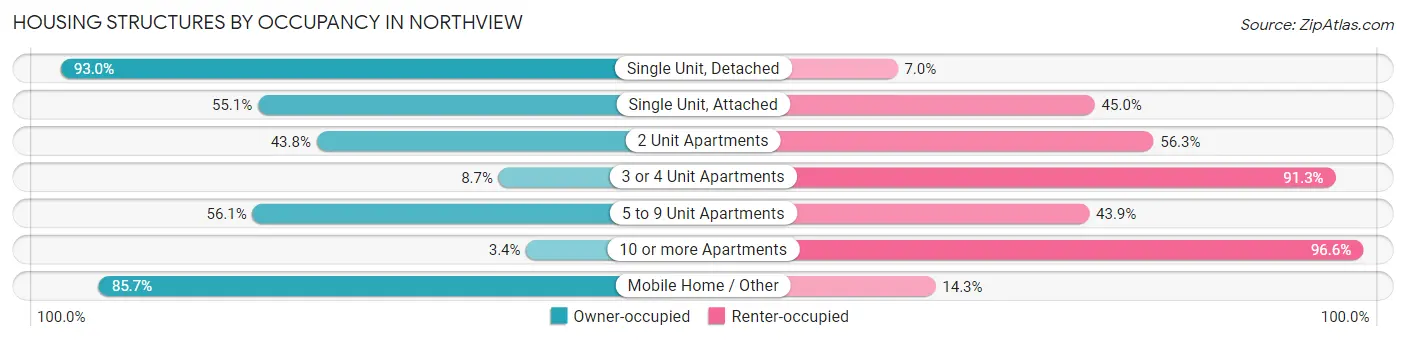
| Structure Type | Owner-occupied | Renter-occupied |
| Single Unit, Detached | 4,234 (93.0%) | 318 (7.0%) |
| Single Unit, Attached | 463 (55.0%) | 378 (45.0%) |
| 2 Unit Apartments | 7 (43.8%) | 9 (56.2%) |
| 3 or 4 Unit Apartments | 22 (8.7%) | 231 (91.3%) |
| 5 to 9 Unit Apartments | 170 (56.1%) | 133 (43.9%) |
| 10 or more Apartments | 15 (3.4%) | 427 (96.6%) |
| Mobile Home / Other | 72 (85.7%) | 12 (14.3%) |
| Total | 4,983 (76.8%) | 1,508 (23.2%) |
Housing Structures by Number of Rooms in Northview
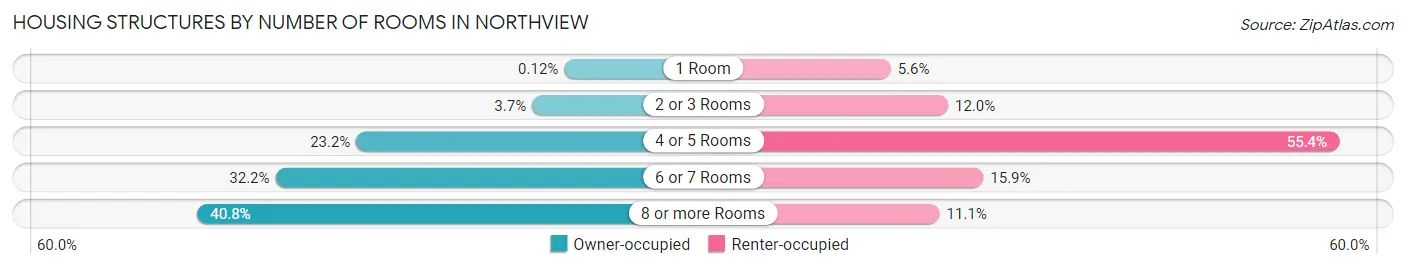
| Number of Rooms | Owner-occupied | Renter-occupied |
| 1 Room | 6 (0.1%) | 85 (5.6%) |
| 2 or 3 Rooms | 184 (3.7%) | 181 (12.0%) |
| 4 or 5 Rooms | 1,156 (23.2%) | 835 (55.4%) |
| 6 or 7 Rooms | 1,603 (32.2%) | 240 (15.9%) |
| 8 or more Rooms | 2,034 (40.8%) | 167 (11.1%) |
| Total | 4,983 (100.0%) | 1,508 (100.0%) |
Housing Structure by Heating Type in Northview
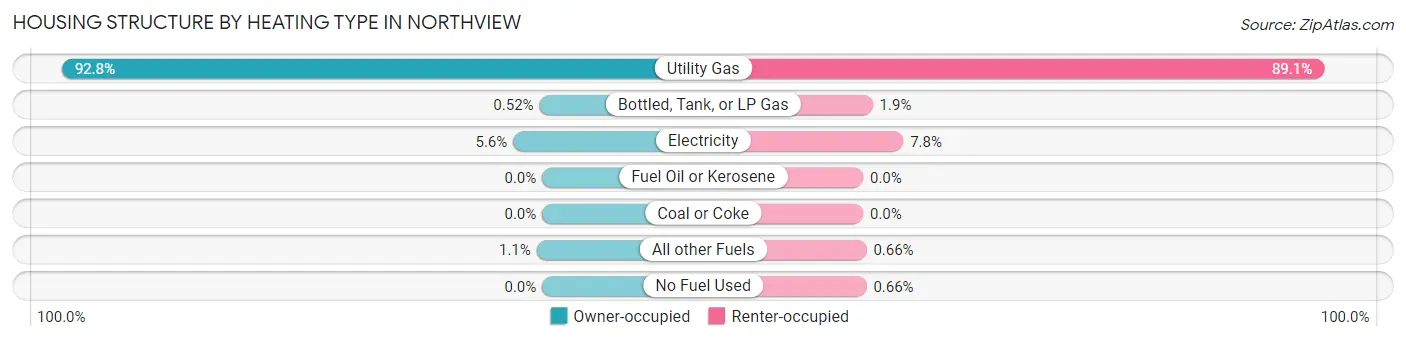
| Heating Type | Owner-occupied | Renter-occupied |
| Utility Gas | 4,625 (92.8%) | 1,343 (89.1%) |
| Bottled, Tank, or LP Gas | 26 (0.5%) | 28 (1.9%) |
| Electricity | 279 (5.6%) | 117 (7.8%) |
| Fuel Oil or Kerosene | 0 (0.0%) | 0 (0.0%) |
| Coal or Coke | 0 (0.0%) | 0 (0.0%) |
| All other Fuels | 53 (1.1%) | 10 (0.7%) |
| No Fuel Used | 0 (0.0%) | 10 (0.7%) |
| Total | 4,983 (100.0%) | 1,508 (100.0%) |
Household Vehicle Usage in Northview
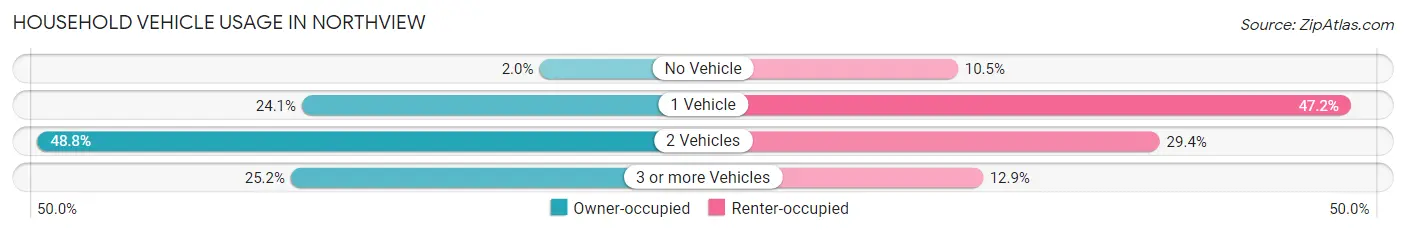
| Vehicles per Household | Owner-occupied | Renter-occupied |
| No Vehicle | 97 (1.9%) | 159 (10.5%) |
| 1 Vehicle | 1,202 (24.1%) | 712 (47.2%) |
| 2 Vehicles | 2,431 (48.8%) | 443 (29.4%) |
| 3 or more Vehicles | 1,253 (25.2%) | 194 (12.9%) |
| Total | 4,983 (100.0%) | 1,508 (100.0%) |
Real Estate & Mortgages in Northview
Real Estate and Mortgage Overview in Northview
| Characteristic | Without Mortgage | With Mortgage |
| Housing Units | 2,103 | 2,880 |
| Median Property Value | $246,400 | $238,300 |
| Median Household Income | $69,774 | $709 |
| Monthly Housing Costs | $564 | $132 |
| Real Estate Taxes | $2,905 | $39 |
Property Value by Mortgage Status in Northview
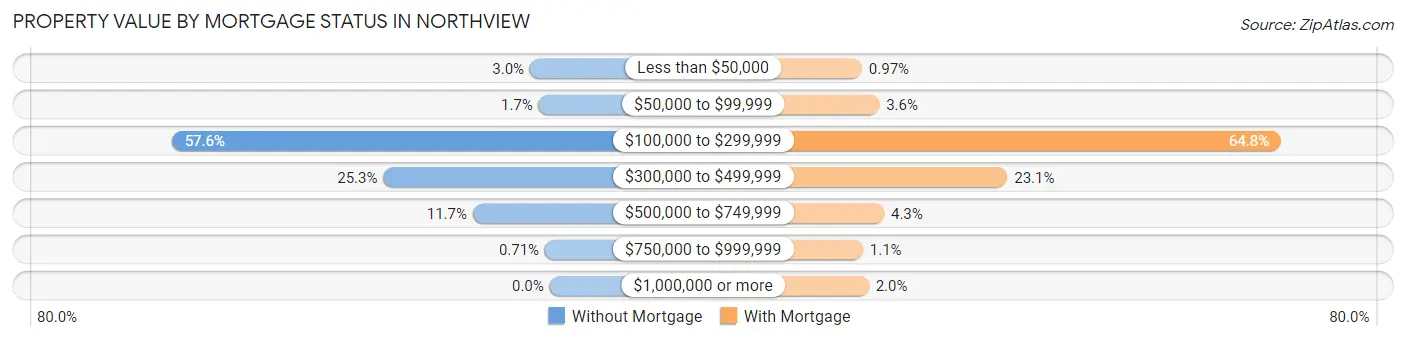
| Property Value | Without Mortgage | With Mortgage |
| Less than $50,000 | 63 (3.0%) | 28 (1.0%) |
| $50,000 to $99,999 | 35 (1.7%) | 104 (3.6%) |
| $100,000 to $299,999 | 1,211 (57.6%) | 1,867 (64.8%) |
| $300,000 to $499,999 | 533 (25.3%) | 666 (23.1%) |
| $500,000 to $749,999 | 246 (11.7%) | 125 (4.3%) |
| $750,000 to $999,999 | 15 (0.7%) | 32 (1.1%) |
| $1,000,000 or more | 0 (0.0%) | 58 (2.0%) |
| Total | 2,103 (100.0%) | 2,880 (100.0%) |
Household Income by Mortgage Status in Northview
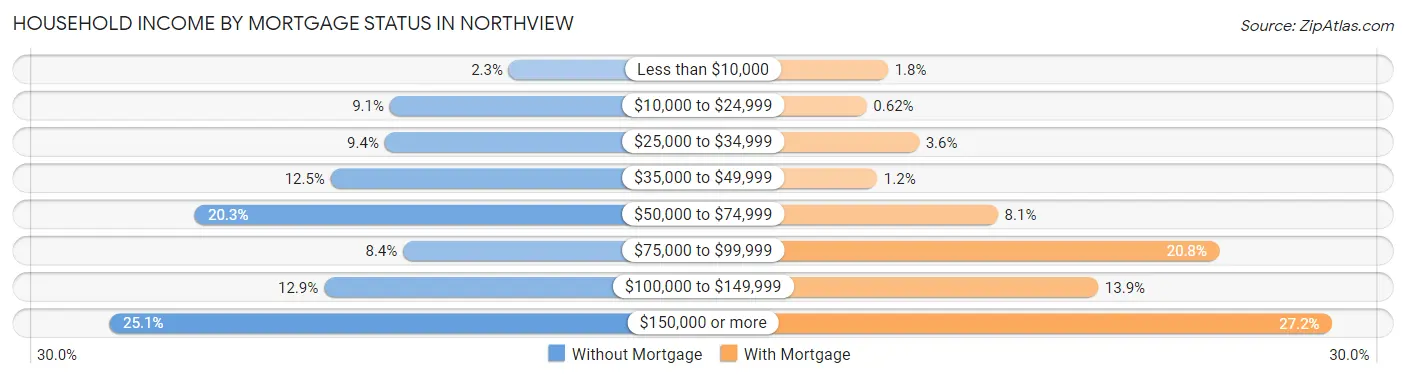
| Household Income | Without Mortgage | With Mortgage |
| Less than $10,000 | 49 (2.3%) | 53 (1.8%) |
| $10,000 to $24,999 | 192 (9.1%) | 18 (0.6%) |
| $25,000 to $34,999 | 198 (9.4%) | 104 (3.6%) |
| $35,000 to $49,999 | 263 (12.5%) | 35 (1.2%) |
| $50,000 to $74,999 | 426 (20.3%) | 234 (8.1%) |
| $75,000 to $99,999 | 176 (8.4%) | 598 (20.8%) |
| $100,000 to $149,999 | 271 (12.9%) | 399 (13.9%) |
| $150,000 or more | 528 (25.1%) | 783 (27.2%) |
| Total | 2,103 (100.0%) | 2,880 (100.0%) |
Property Value to Household Income Ratio in Northview
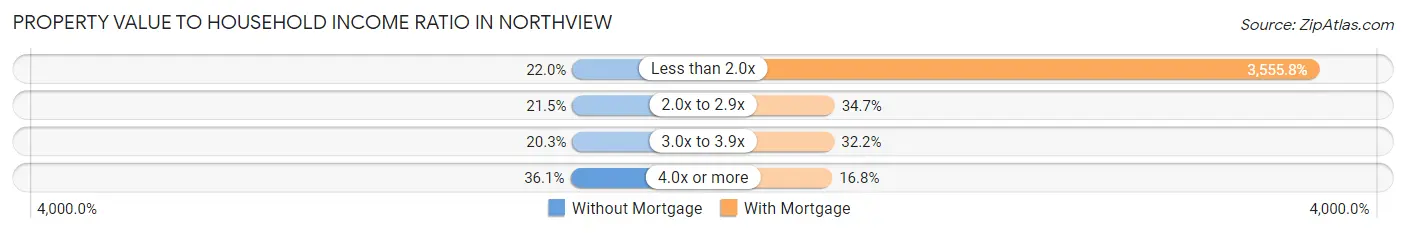
| Value-to-Income Ratio | Without Mortgage | With Mortgage |
| Less than 2.0x | 463 (22.0%) | 102,407 (3,555.8%) |
| 2.0x to 2.9x | 453 (21.5%) | 1,000 (34.7%) |
| 3.0x to 3.9x | 427 (20.3%) | 926 (32.2%) |
| 4.0x or more | 760 (36.1%) | 483 (16.8%) |
| Total | 2,103 (100.0%) | 2,880 (100.0%) |
Real Estate Taxes by Mortgage Status in Northview
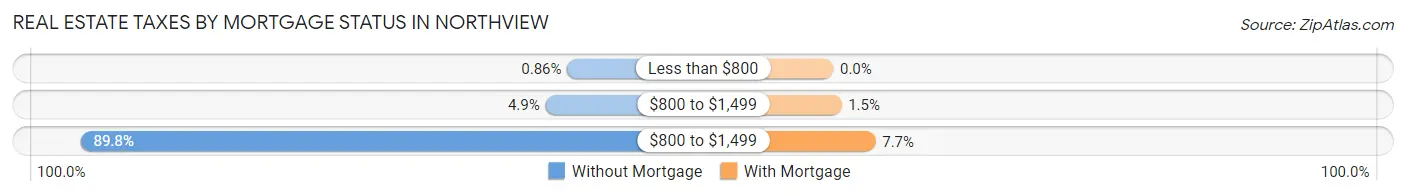
| Property Taxes | Without Mortgage | With Mortgage |
| Less than $800 | 18 (0.9%) | 0 (0.0%) |
| $800 to $1,499 | 102 (4.9%) | 43 (1.5%) |
| $800 to $1,499 | 1,888 (89.8%) | 222 (7.7%) |
| Total | 2,103 (100.0%) | 2,880 (100.0%) |
Health & Disability in Northview
Health Insurance Coverage by Age in Northview
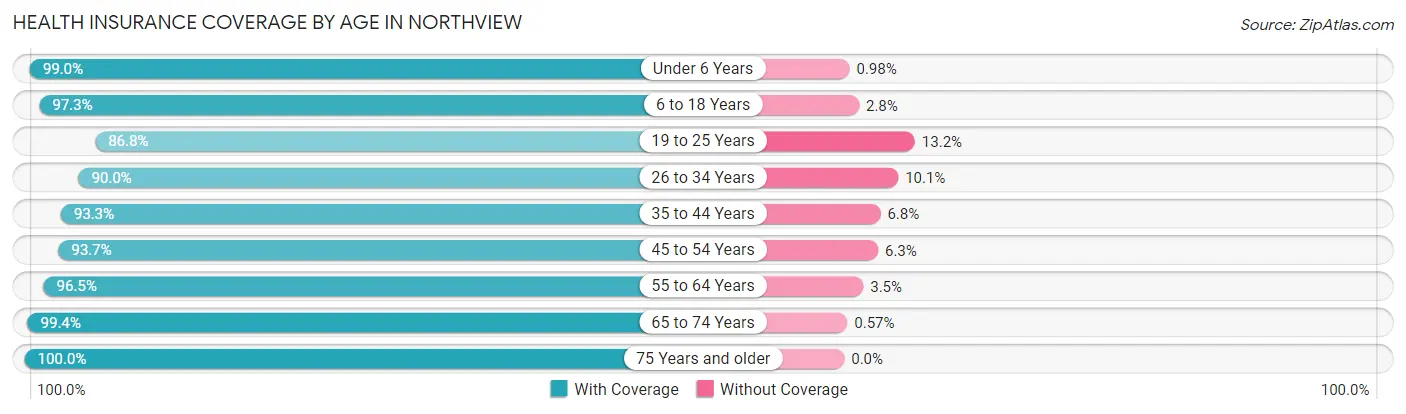
| Age Bracket | With Coverage | Without Coverage |
| Under 6 Years | 808 (99.0%) | 8 (1.0%) |
| 6 to 18 Years | 2,614 (97.3%) | 74 (2.8%) |
| 19 to 25 Years | 857 (86.8%) | 130 (13.2%) |
| 26 to 34 Years | 1,825 (89.9%) | 204 (10.1%) |
| 35 to 44 Years | 1,754 (93.2%) | 127 (6.8%) |
| 45 to 54 Years | 1,653 (93.7%) | 111 (6.3%) |
| 55 to 64 Years | 2,098 (96.5%) | 77 (3.5%) |
| 65 to 74 Years | 1,569 (99.4%) | 9 (0.6%) |
| 75 Years and older | 1,508 (100.0%) | 0 (0.0%) |
| Total | 14,686 (95.2%) | 740 (4.8%) |
Health Insurance Coverage by Citizenship Status in Northview
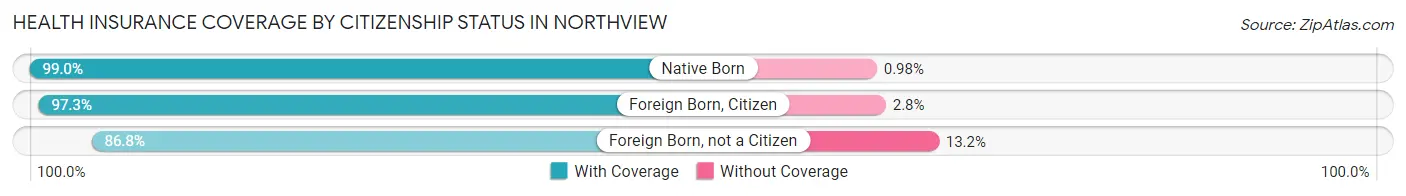
| Citizenship Status | With Coverage | Without Coverage |
| Native Born | 808 (99.0%) | 8 (1.0%) |
| Foreign Born, Citizen | 2,614 (97.3%) | 74 (2.8%) |
| Foreign Born, not a Citizen | 857 (86.8%) | 130 (13.2%) |
Health Insurance Coverage by Household Income in Northview
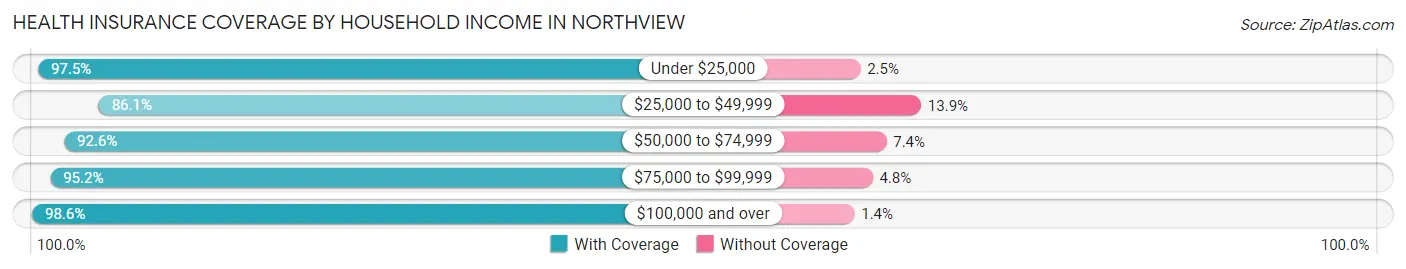
| Household Income | With Coverage | Without Coverage |
| Under $25,000 | 1,125 (97.5%) | 29 (2.5%) |
| $25,000 to $49,999 | 1,915 (86.1%) | 309 (13.9%) |
| $50,000 to $74,999 | 2,517 (92.6%) | 201 (7.4%) |
| $75,000 to $99,999 | 1,961 (95.2%) | 99 (4.8%) |
| $100,000 and over | 7,162 (98.6%) | 102 (1.4%) |
Public vs Private Health Insurance Coverage by Age in Northview
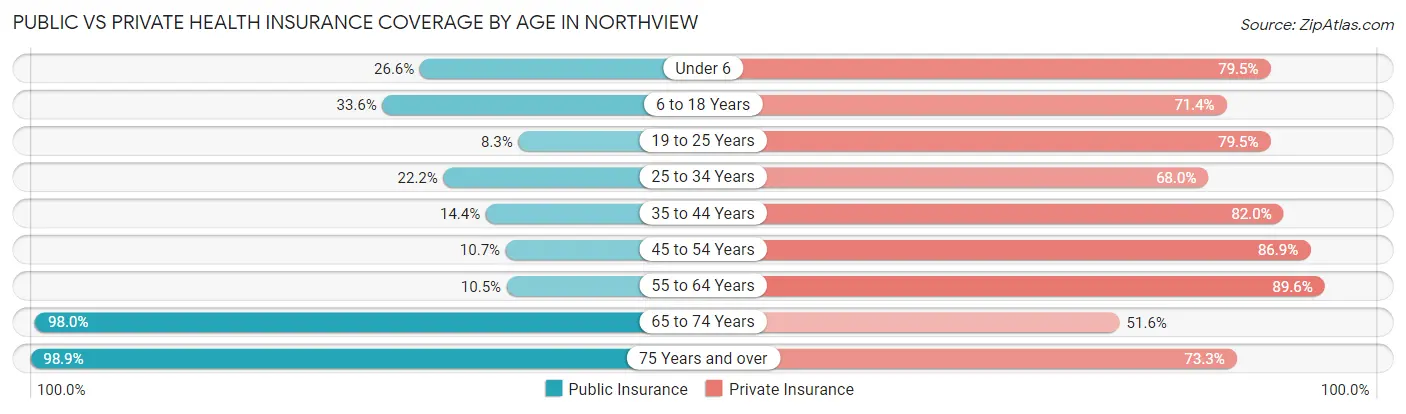
| Age Bracket | Public Insurance | Private Insurance |
| Under 6 | 217 (26.6%) | 649 (79.5%) |
| 6 to 18 Years | 902 (33.6%) | 1,919 (71.4%) |
| 19 to 25 Years | 82 (8.3%) | 785 (79.5%) |
| 25 to 34 Years | 451 (22.2%) | 1,380 (68.0%) |
| 35 to 44 Years | 270 (14.3%) | 1,542 (82.0%) |
| 45 to 54 Years | 188 (10.7%) | 1,533 (86.9%) |
| 55 to 64 Years | 228 (10.5%) | 1,949 (89.6%) |
| 65 to 74 Years | 1,547 (98.0%) | 814 (51.6%) |
| 75 Years and over | 1,492 (98.9%) | 1,105 (73.3%) |
| Total | 5,377 (34.9%) | 11,676 (75.7%) |
Disability Status by Sex by Age in Northview
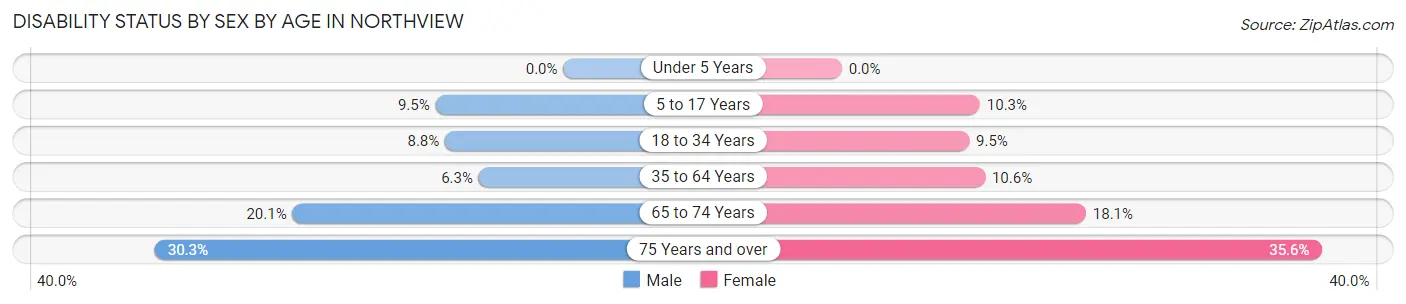
| Age Bracket | Male | Female |
| Under 5 Years | 0 (0.0%) | 0 (0.0%) |
| 5 to 17 Years | 125 (9.5%) | 125 (10.2%) |
| 18 to 34 Years | 140 (8.8%) | 163 (9.5%) |
| 35 to 64 Years | 184 (6.3%) | 307 (10.6%) |
| 65 to 74 Years | 112 (20.1%) | 185 (18.1%) |
| 75 Years and over | 212 (30.3%) | 288 (35.6%) |
Disability Class by Sex by Age in Northview
Disability Class: Hearing Difficulty
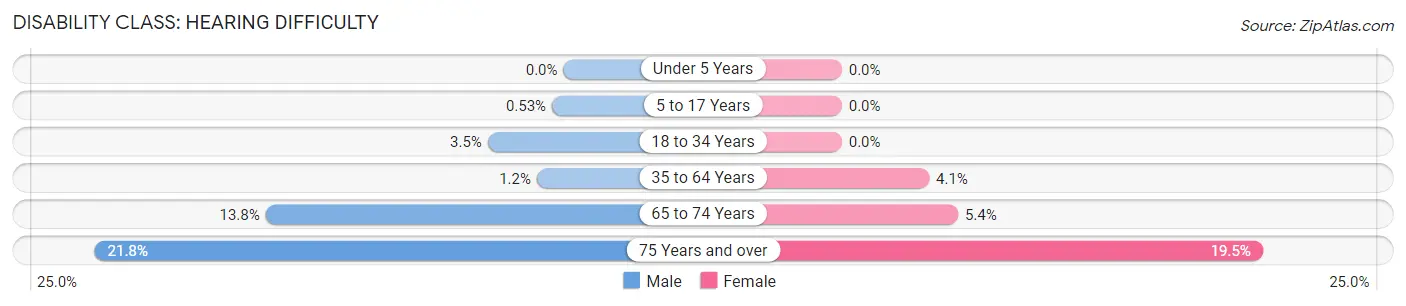
| Age Bracket | Male | Female |
| Under 5 Years | 0 (0.0%) | 0 (0.0%) |
| 5 to 17 Years | 7 (0.5%) | 0 (0.0%) |
| 18 to 34 Years | 56 (3.5%) | 0 (0.0%) |
| 35 to 64 Years | 36 (1.2%) | 117 (4.1%) |
| 65 to 74 Years | 77 (13.8%) | 55 (5.4%) |
| 75 Years and over | 152 (21.7%) | 158 (19.5%) |
Disability Class: Vision Difficulty
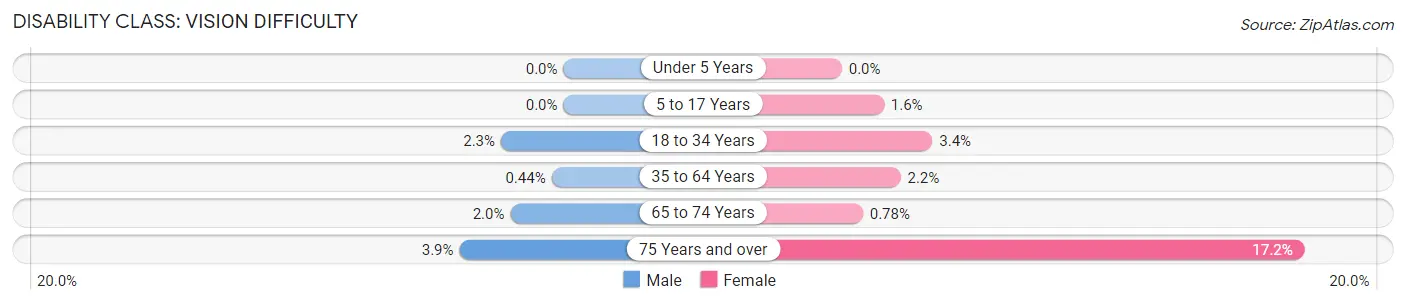
| Age Bracket | Male | Female |
| Under 5 Years | 0 (0.0%) | 0 (0.0%) |
| 5 to 17 Years | 0 (0.0%) | 19 (1.6%) |
| 18 to 34 Years | 37 (2.3%) | 58 (3.4%) |
| 35 to 64 Years | 13 (0.4%) | 63 (2.2%) |
| 65 to 74 Years | 11 (2.0%) | 8 (0.8%) |
| 75 Years and over | 27 (3.9%) | 139 (17.2%) |
Disability Class: Cognitive Difficulty
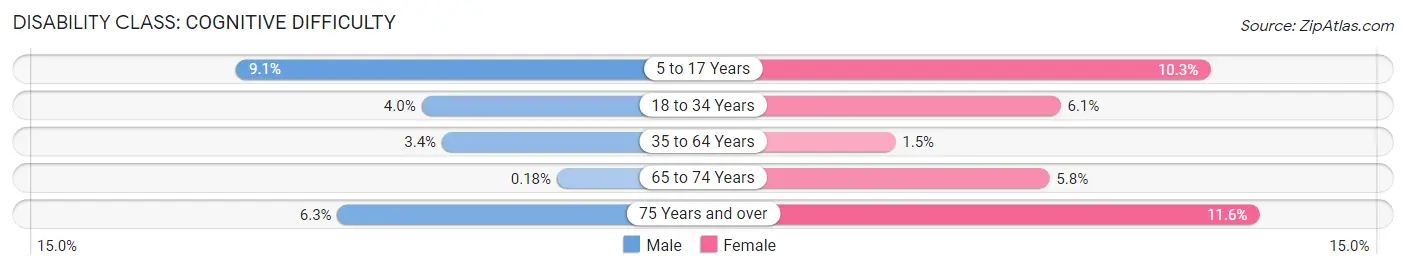
| Age Bracket | Male | Female |
| 5 to 17 Years | 120 (9.1%) | 125 (10.2%) |
| 18 to 34 Years | 63 (4.0%) | 105 (6.1%) |
| 35 to 64 Years | 99 (3.4%) | 43 (1.5%) |
| 65 to 74 Years | 1 (0.2%) | 59 (5.8%) |
| 75 Years and over | 44 (6.3%) | 94 (11.6%) |
Disability Class: Ambulatory Difficulty
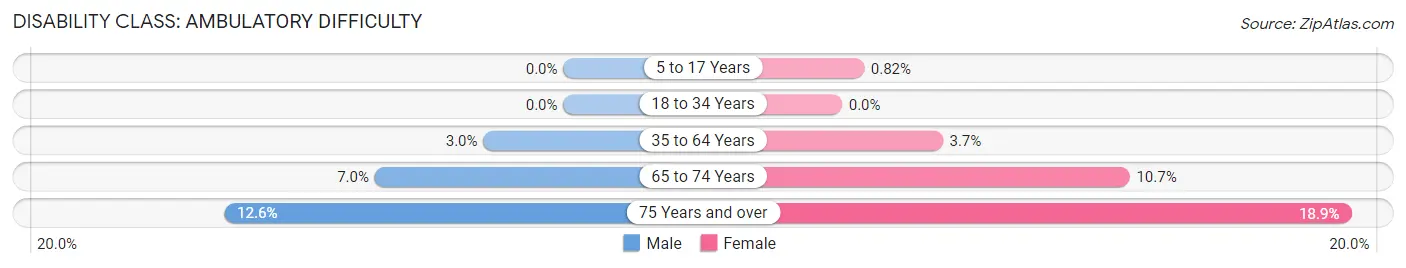
| Age Bracket | Male | Female |
| 5 to 17 Years | 0 (0.0%) | 10 (0.8%) |
| 18 to 34 Years | 0 (0.0%) | 0 (0.0%) |
| 35 to 64 Years | 87 (3.0%) | 108 (3.7%) |
| 65 to 74 Years | 39 (7.0%) | 109 (10.7%) |
| 75 Years and over | 88 (12.6%) | 153 (18.9%) |
Disability Class: Self-Care Difficulty
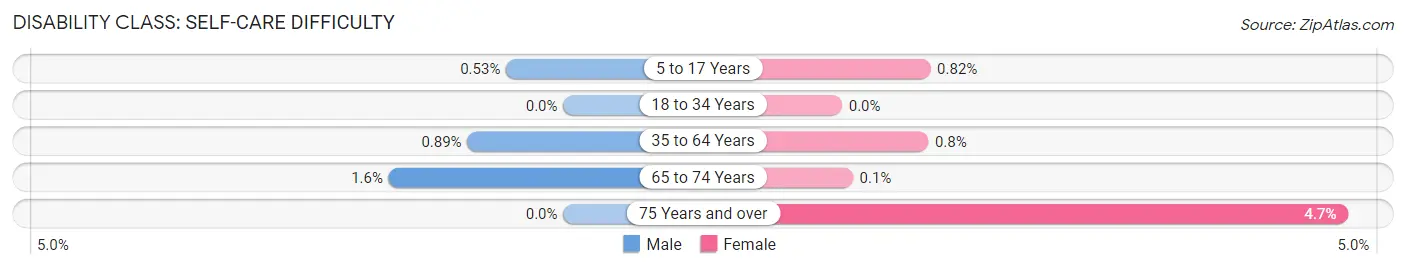
| Age Bracket | Male | Female |
| 5 to 17 Years | 7 (0.5%) | 10 (0.8%) |
| 18 to 34 Years | 0 (0.0%) | 0 (0.0%) |
| 35 to 64 Years | 26 (0.9%) | 23 (0.8%) |
| 65 to 74 Years | 9 (1.6%) | 1 (0.1%) |
| 75 Years and over | 0 (0.0%) | 38 (4.7%) |
Technology Access in Northview
Computing Device Access in Northview
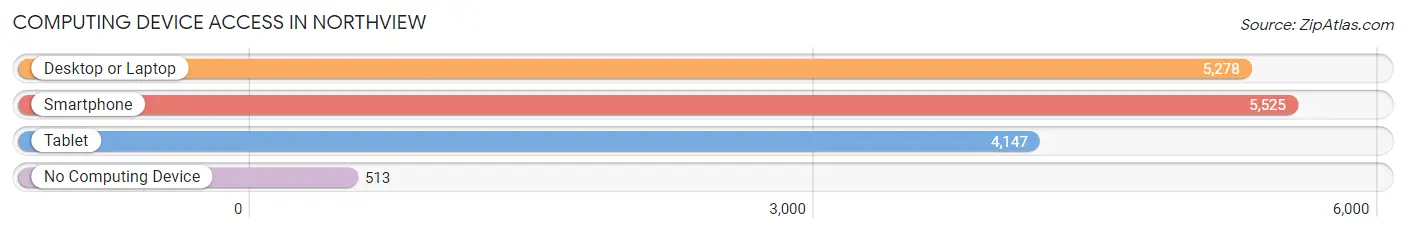
| Device Type | # Households | % Households |
| Desktop or Laptop | 5,278 | 81.3% |
| Smartphone | 5,525 | 85.1% |
| Tablet | 4,147 | 63.9% |
| No Computing Device | 513 | 7.9% |
| Total | 6,491 | 100.0% |
Internet Access in Northview
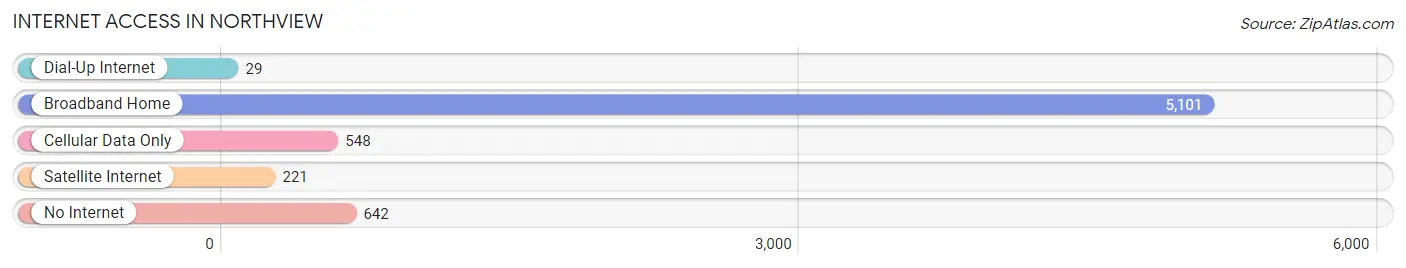
| Internet Type | # Households | % Households |
| Dial-Up Internet | 29 | 0.4% |
| Broadband Home | 5,101 | 78.6% |
| Cellular Data Only | 548 | 8.4% |
| Satellite Internet | 221 | 3.4% |
| No Internet | 642 | 9.9% |
| Total | 6,491 | 100.0% |
Northview Summary
History
Northview is a small city located in Kent County, Michigan. It is situated just north of Grand Rapids, the second largest city in the state. The city was founded in 1871 and was originally known as Northview Station. The city was named after the nearby Northview Station, which was a stop on the Grand Rapids and Indiana Railroad.
The city was originally a farming community, but in the early 1900s, it began to experience rapid growth due to the influx of immigrants from Europe. Many of these immigrants were of Dutch descent and they brought with them their culture and traditions. This influx of immigrants helped to shape the city’s culture and identity.
In the 1950s, the city experienced a period of rapid growth and development. This was due to the construction of the Northview Mall, which was the first shopping mall in the area. The mall was a major draw for shoppers from all over the region and helped to spur the city’s growth.
In the late 1970s, the city experienced a period of decline due to the closure of the Northview Mall. This led to a decrease in population and a decrease in economic activity. However, in the late 1990s, the city began to experience a resurgence due to the construction of the Northview Community Center. This center provided a variety of services and activities for the community and helped to revitalize the city.
Today, Northview is a vibrant and diverse city with a population of over 10,000 people. The city is home to a variety of businesses, including retail stores, restaurants, and professional services. The city is also home to a number of parks and recreational facilities, making it a great place to live and work.
Geography
Northview is located in Kent County, Michigan. It is situated just north of Grand Rapids, the second largest city in the state. The city is bordered by the Grand River to the east and the Rogue River to the west. The city is located in a flat area of land, with the highest point being just over 500 feet above sea level.
The city has a total area of 4.3 square miles, with 0.2 square miles of water. The city is located in a humid continental climate zone, with hot summers and cold winters. The average annual temperature is around 50 degrees Fahrenheit.
Economy
Northview’s economy is largely based on retail and services. The city is home to a variety of retail stores, restaurants, and professional services. The city is also home to a number of manufacturing companies, including automotive parts and furniture.
The city is also home to a number of educational institutions, including Northview High School and Northview Middle School. The city is also home to a number of parks and recreational facilities, making it a great place to live and work.
Demographics
As of the 2010 census, the population of Northview was 10,845. The racial makeup of the city was 87.3% White, 5.3% African American, 0.7% Native American, 1.2% Asian, 0.1% Pacific Islander, and 4.4% from other races. The median household income was $45,845 and the median family income was $54,845.
The city is home to a variety of religious denominations, including Catholic, Protestant, and Jewish. The city is also home to a variety of cultural and ethnic groups, including Dutch, German, Irish, and Polish.
Conclusion
Northview is a small city located in Kent County, Michigan. It is situated just north of Grand Rapids, the second largest city in the state. The city was founded in 1871 and was originally known as Northview Station. The city was named after the nearby Northview Station, which was a stop on the Grand Rapids and Indiana Railroad. The city has a population of over 10,000 people and is home to a variety of businesses, including retail stores, restaurants, and professional services. The city is also home to a number of parks and recreational facilities, making it a great place to live and work. The city is home to a variety of religious denominations, including Catholic, Protestant, and Jewish. The city is also home to a variety of cultural and ethnic groups, including Dutch, German, Irish, and Polish.
Common Questions
What is Per Capita Income in Northview?
Per Capita income in Northview is $43,561.
What is the Median Family Income in Northview?
Median Family Income in Northview is $93,380.
What is the Median Household income in Northview?
Median Household Income in Northview is $77,783.
What is Income or Wage Gap in Northview?
Income or Wage Gap in Northview is 35.8%.
Women in Northview earn 64.2 cents for every dollar earned by a man.
What is Inequality or Gini Index in Northview?
Inequality or Gini Index in Northview is 0.43.
What is the Total Population of Northview?
Total Population of Northview is 15,428.
What is the Total Male Population of Northview?
Total Male Population of Northview is 7,434.
What is the Total Female Population of Northview?
Total Female Population of Northview is 7,994.
What is the Ratio of Males per 100 Females in Northview?
There are 92.99 Males per 100 Females in Northview.
What is the Ratio of Females per 100 Males in Northview?
There are 107.53 Females per 100 Males in Northview.
What is the Median Population Age in Northview?
Median Population Age in Northview is 40.7 Years.
What is the Average Family Size in Northview
Average Family Size in Northview is 2.8 People.
What is the Average Household Size in Northview
Average Household Size in Northview is 2.4 People.
How Large is the Labor Force in Northview?
There are 8,876 People in the Labor Forcein in Northview.
What is the Percentage of People in the Labor Force in Northview?
69.5% of People are in the Labor Force in Northview.
What is the Unemployment Rate in Northview?
Unemployment Rate in Northview is 5.6%.