Zip Codes with the Highest Percentage of Population Employed in Real Estate, Rental & Leasing in Howell, MI
RELATED REPORTS & OPTIONS
Real Estate, Rental & Leasing
Howell
Compare Zip Codes
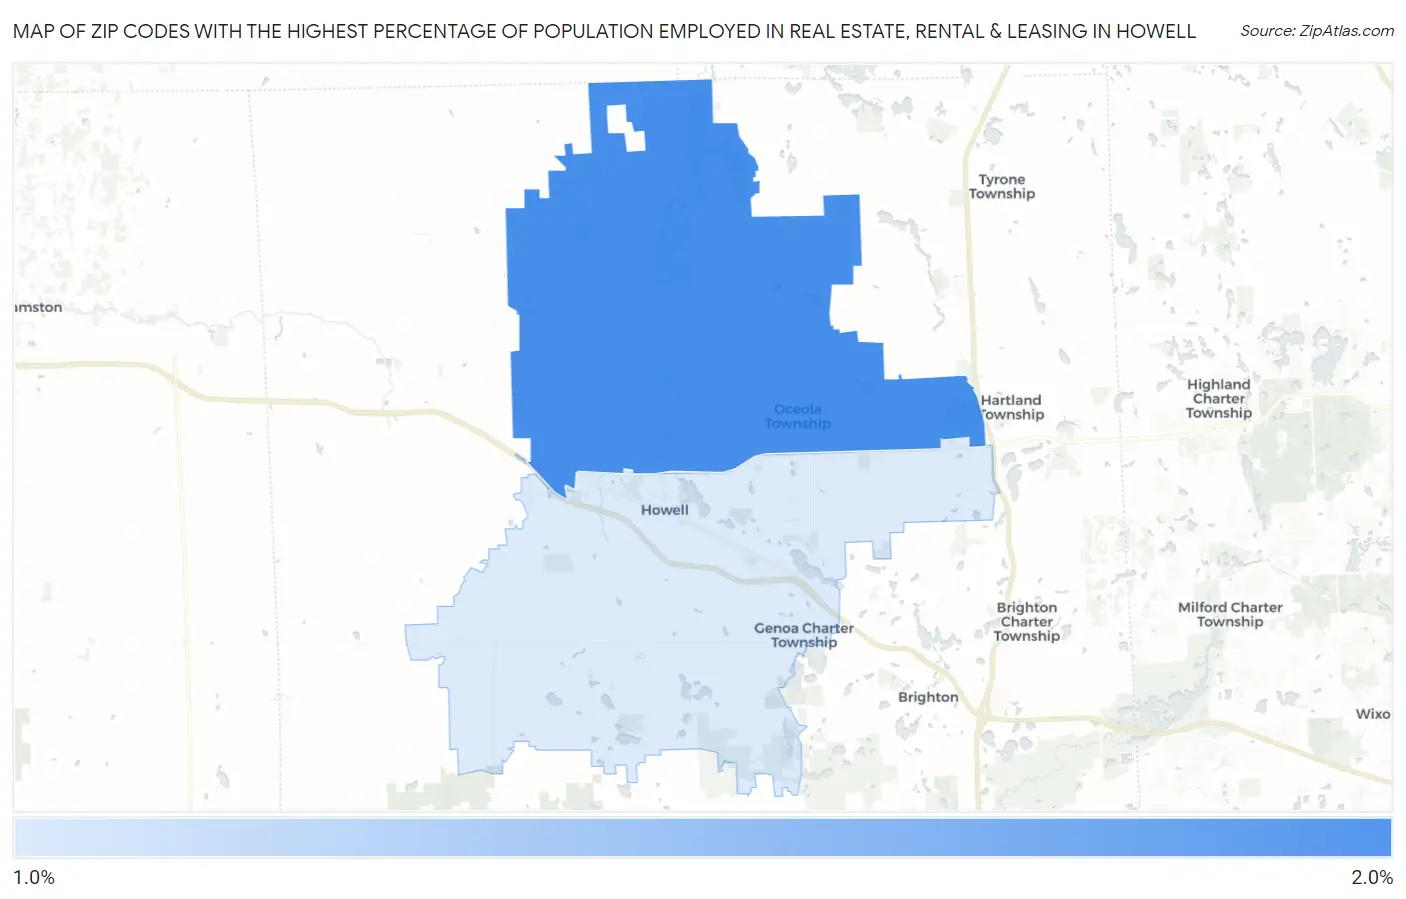
Map of Zip Codes with the Highest Percentage of Population Employed in Real Estate, Rental & Leasing in Howell
1.4%
1.5%
Zip Codes with the Highest Percentage of Population Employed in Real Estate, Rental & Leasing in Howell, MI
| Zip Code | % Employed | vs State | vs National | |
| 1. | 48855 | 1.5% | 1.5%(+0.009)#322 | 1.9%(-0.378)#11,051 |
| 2. | 48843 | 1.4% | 1.5%(-0.063)#342 | 1.9%(-0.449)#11,633 |
1
Common Questions
What are the Top Zip Codes with the Highest Percentage of Population Employed in Real Estate, Rental & Leasing in Howell, MI?
Top Zip Codes with the Highest Percentage of Population Employed in Real Estate, Rental & Leasing in Howell, MI are:
What zip code has the Highest Percentage of Population Employed in Real Estate, Rental & Leasing in Howell, MI?
48855 has the Highest Percentage of Population Employed in Real Estate, Rental & Leasing in Howell, MI with 1.5%.
What is the Percentage of Population Employed in Real Estate, Rental & Leasing in Howell, MI?
Percentage of Population Employed in Real Estate, Rental & Leasing in Howell is 1.0%.
What is the Percentage of Population Employed in Real Estate, Rental & Leasing in Michigan?
Percentage of Population Employed in Real Estate, Rental & Leasing in Michigan is 1.5%.
What is the Percentage of Population Employed in Real Estate, Rental & Leasing in the United States?
Percentage of Population Employed in Real Estate, Rental & Leasing in the United States is 1.9%.