Stronach, MI Map & Demographics
Stronach Map
Stronach Overview
$29,147
PER CAPITA INCOME
$53,333
AVG FAMILY INCOME
$55,000
AVG HOUSEHOLD INCOME
25.6%
WAGE / INCOME GAP [ % ]
74.4¢/ $1
WAGE / INCOME GAP [ $ ]
0.33
INEQUALITY / GINI INDEX
192
TOTAL POPULATION
74
MALE POPULATION
118
FEMALE POPULATION
62.71
MALES / 100 FEMALES
159.46
FEMALES / 100 MALES
46.5
MEDIAN AGE
2.6
AVG FAMILY SIZE
2.5
AVG HOUSEHOLD SIZE
96
LABOR FORCE [ PEOPLE ]
62.3%
PERCENT IN LABOR FORCE
Stronach Area Codes
Income in Stronach
Income Overview in Stronach
Per Capita Income in Stronach is $29,147, while median incomes of families and households are $53,333 and $55,000 respectively.
| Characteristic | Number | Measure |
| Per Capita Income | 192 | $29,147 |
| Median Family Income | 60 | $53,333 |
| Mean Family Income | 60 | $64,640 |
| Median Household Income | 76 | $55,000 |
| Mean Household Income | 76 | $70,068 |
| Income Deficit | 60 | $0 |
| Wage / Income Gap (%) | 192 | 25.64% |
| Wage / Income Gap ($) | 192 | 74.36¢ per $1 |
| Gini / Inequality Index | 192 | 0.33 |
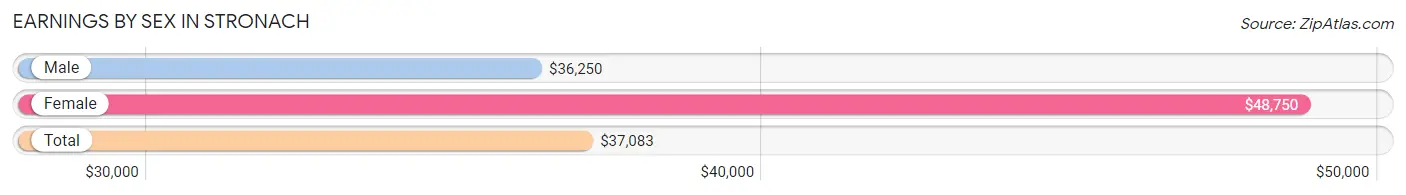
Earnings by Sex in Stronach
Average Earnings in Stronach are $37,083, $36,250 for men and $48,750 for women, a difference of 25.6%.
| Sex | Number | Average Earnings |
| Male | 50 (49.0%) | $36,250 |
| Female | 52 (51.0%) | $48,750 |
| Total | 102 (100.0%) | $37,083 |
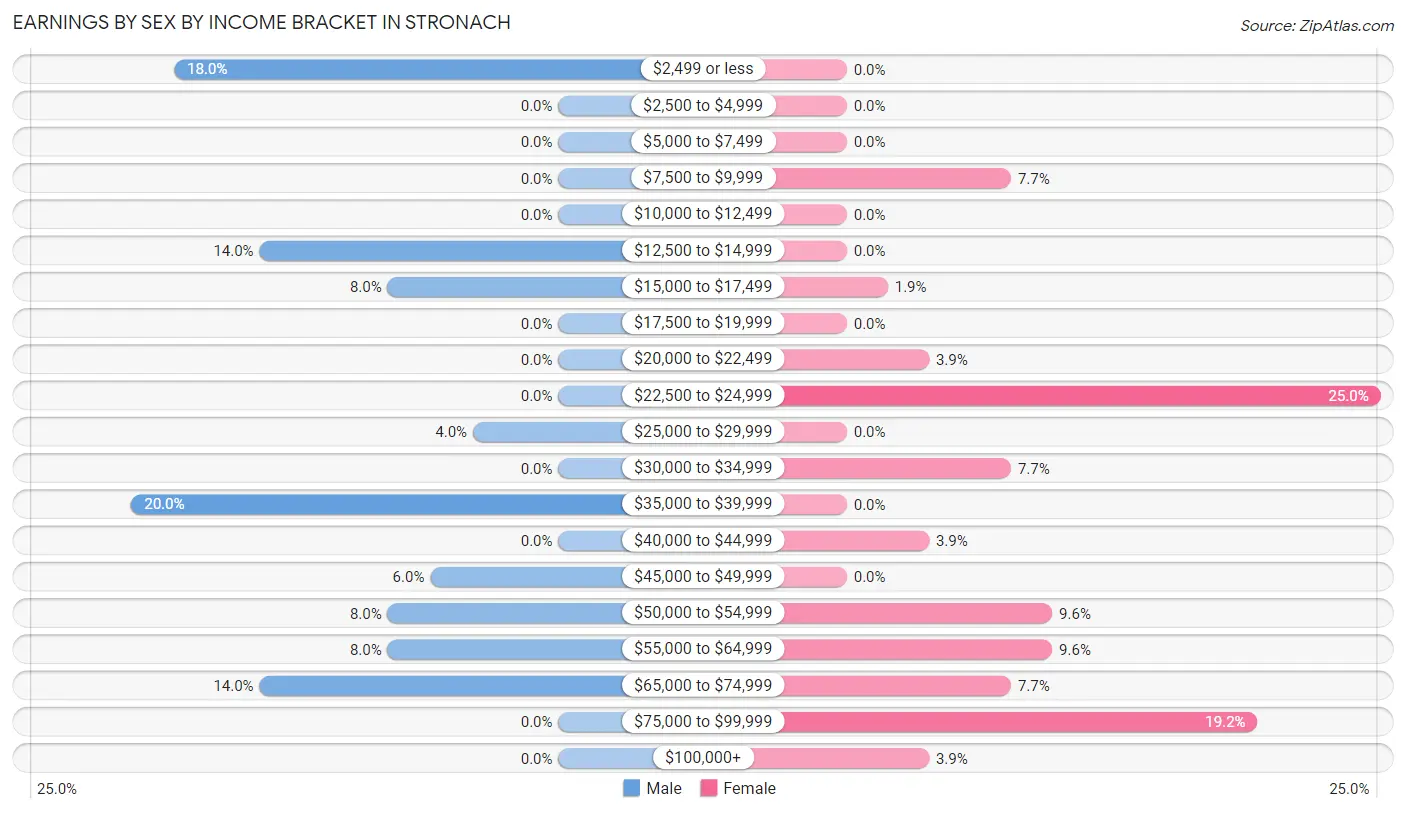
Earnings by Sex by Income Bracket in Stronach
The most common earnings brackets in Stronach are $35,000 to $39,999 for men (10 | 20.0%) and $22,500 to $24,999 for women (13 | 25.0%).
| Income | Male | Female |
| $2,499 or less | 9 (18.0%) | 0 (0.0%) |
| $2,500 to $4,999 | 0 (0.0%) | 0 (0.0%) |
| $5,000 to $7,499 | 0 (0.0%) | 0 (0.0%) |
| $7,500 to $9,999 | 0 (0.0%) | 4 (7.7%) |
| $10,000 to $12,499 | 0 (0.0%) | 0 (0.0%) |
| $12,500 to $14,999 | 7 (14.0%) | 0 (0.0%) |
| $15,000 to $17,499 | 4 (8.0%) | 1 (1.9%) |
| $17,500 to $19,999 | 0 (0.0%) | 0 (0.0%) |
| $20,000 to $22,499 | 0 (0.0%) | 2 (3.8%) |
| $22,500 to $24,999 | 0 (0.0%) | 13 (25.0%) |
| $25,000 to $29,999 | 2 (4.0%) | 0 (0.0%) |
| $30,000 to $34,999 | 0 (0.0%) | 4 (7.7%) |
| $35,000 to $39,999 | 10 (20.0%) | 0 (0.0%) |
| $40,000 to $44,999 | 0 (0.0%) | 2 (3.8%) |
| $45,000 to $49,999 | 3 (6.0%) | 0 (0.0%) |
| $50,000 to $54,999 | 4 (8.0%) | 5 (9.6%) |
| $55,000 to $64,999 | 4 (8.0%) | 5 (9.6%) |
| $65,000 to $74,999 | 7 (14.0%) | 4 (7.7%) |
| $75,000 to $99,999 | 0 (0.0%) | 10 (19.2%) |
| $100,000+ | 0 (0.0%) | 2 (3.8%) |
| Total | 50 (100.0%) | 52 (100.0%) |
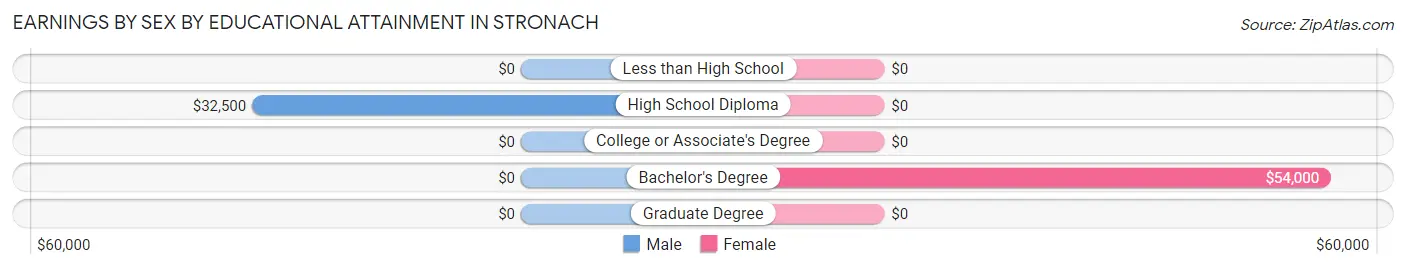
Earnings by Sex by Educational Attainment in Stronach
Average earnings in Stronach are $35,625 for men and $53,000 for women, a difference of 32.8%. Men with an educational attainment of high school diploma enjoy the highest average annual earnings of $32,500, while those with high school diploma education earn the least with $32,500. Women with an educational attainment of bachelor's degree earn the most with the average annual earnings of $54,000, while those with bachelor's degree education have the smallest earnings of $54,000.
| Educational Attainment | Male Income | Female Income |
| Less than High School | - | - |
| High School Diploma | $32,500 | $0 |
| College or Associate's Degree | - | - |
| Bachelor's Degree | - | - |
| Graduate Degree | - | - |
| Total | $35,625 | $53,000 |
Family Income in Stronach
Family Income Brackets in Stronach
According to the Stronach family income data, there are 23 families falling into the $50,000 to $74,999 income range, which is the most common income bracket and makes up 38.3% of all families.
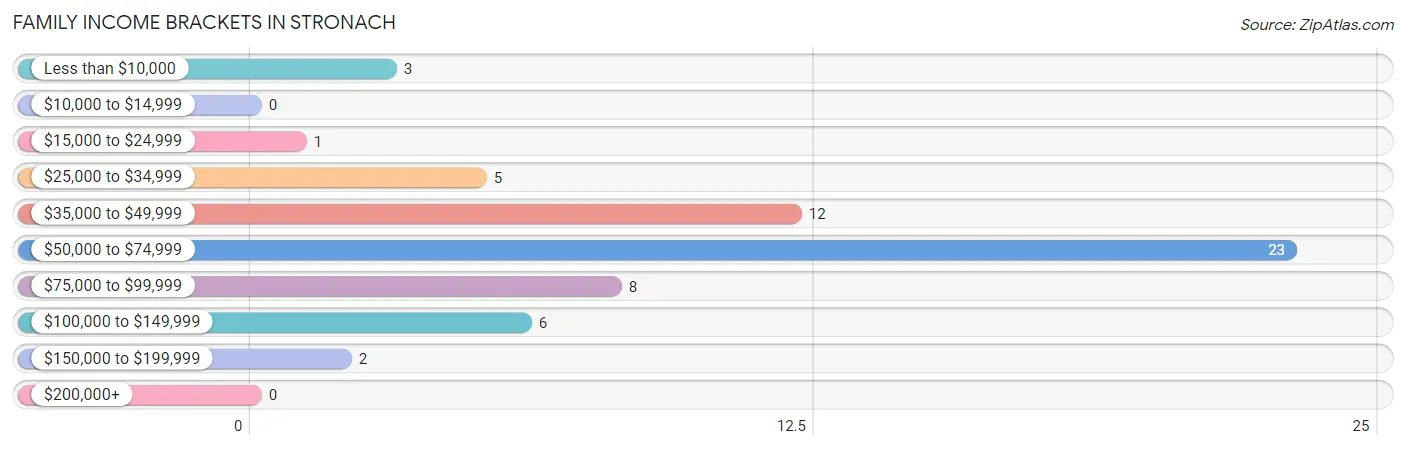
| Income Bracket | # Families | % Families |
| Less than $10,000 | 3 | 5.0% |
| $10,000 to $14,999 | 0 | 0.0% |
| $15,000 to $24,999 | 1 | 1.7% |
| $25,000 to $34,999 | 5 | 8.3% |
| $35,000 to $49,999 | 12 | 20.0% |
| $50,000 to $74,999 | 23 | 38.3% |
| $75,000 to $99,999 | 8 | 13.3% |
| $100,000 to $149,999 | 6 | 10.0% |
| $150,000 to $199,999 | 2 | 3.3% |
| $200,000+ | 0 | 0.0% |
Family Income by Famaliy Size in Stronach
3-person families (11 | 18.3%) account for the highest median family income in Stronach with $75,625 per family, while 2-person families (43 | 71.7%) have the highest median income of $25,860 per family member.
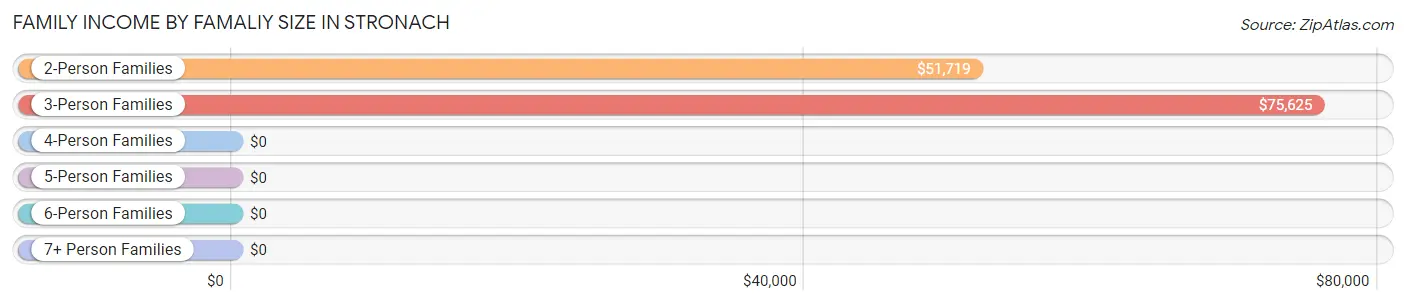
| Income Bracket | # Families | Median Income |
| 2-Person Families | 43 (71.7%) | $51,719 |
| 3-Person Families | 11 (18.3%) | $75,625 |
| 4-Person Families | 6 (10.0%) | $0 |
| 5-Person Families | 0 (0.0%) | $0 |
| 6-Person Families | 0 (0.0%) | $0 |
| 7+ Person Families | 0 (0.0%) | $0 |
| Total | 60 (100.0%) | $53,333 |
Family Income by Number of Earners in Stronach
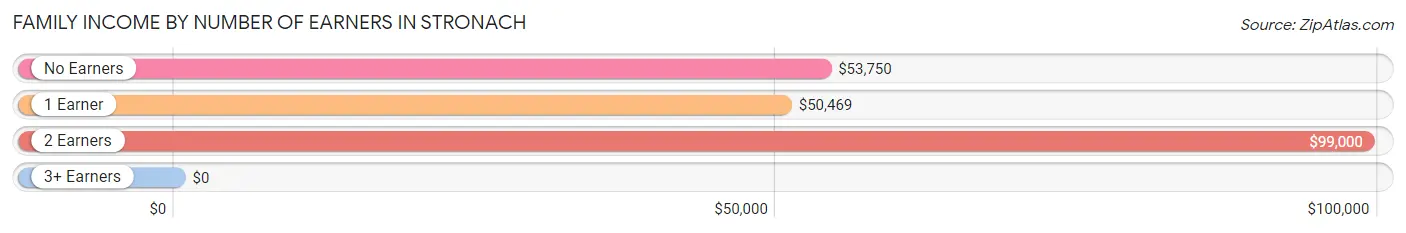
| Number of Earners | # Families | Median Income |
| No Earners | 9 (15.0%) | $53,750 |
| 1 Earner | 31 (51.7%) | $50,469 |
| 2 Earners | 20 (33.3%) | $99,000 |
| 3+ Earners | 0 (0.0%) | $0 |
| Total | 60 (100.0%) | $53,333 |
Household Income in Stronach
Household Income Brackets in Stronach
With 28 households falling in the category, the $50,000 to $74,999 income range is the most frequent in Stronach, accounting for 36.8% of all households. In contrast, only 1 households (1.3%) fall into the $15,000 to $24,999 income bracket, making it the least populous group.
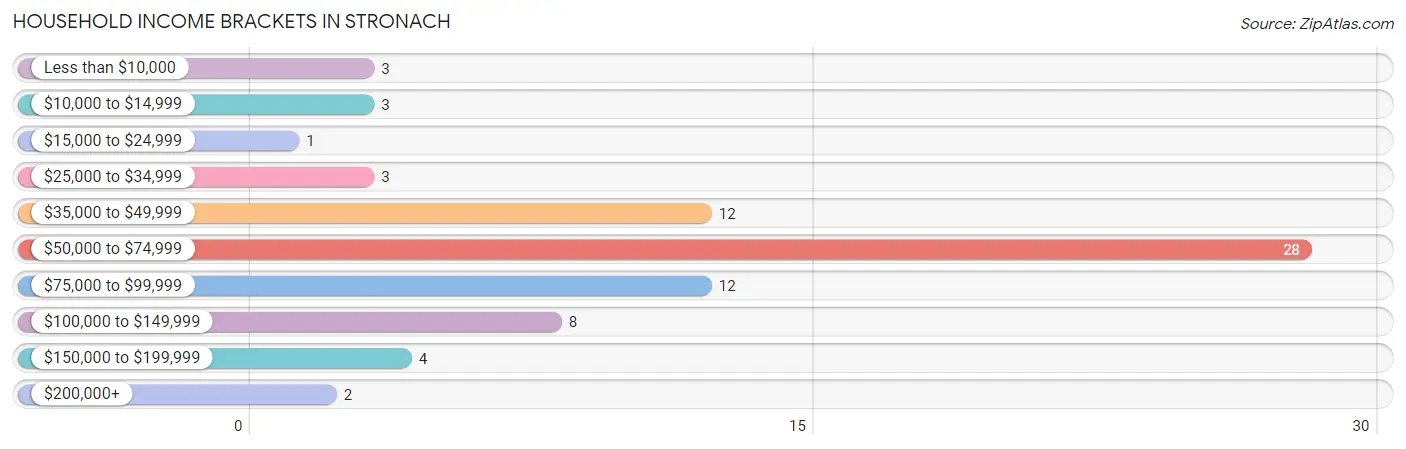
| Income Bracket | # Households | % Households |
| Less than $10,000 | 3 | 3.9% |
| $10,000 to $14,999 | 3 | 3.9% |
| $15,000 to $24,999 | 1 | 1.3% |
| $25,000 to $34,999 | 3 | 3.9% |
| $35,000 to $49,999 | 12 | 15.8% |
| $50,000 to $74,999 | 28 | 36.8% |
| $75,000 to $99,999 | 12 | 15.8% |
| $100,000 to $149,999 | 8 | 10.5% |
| $150,000 to $199,999 | 4 | 5.3% |
| $200,000+ | 2 | 2.6% |
Household Income by Householder Age in Stronach
The median household income in Stronach is $55,000, with the highest median household income of $76,667 found in the 25 to 44 years age bracket for the primary householder. A total of 20 households (26.3%) fall into this category.
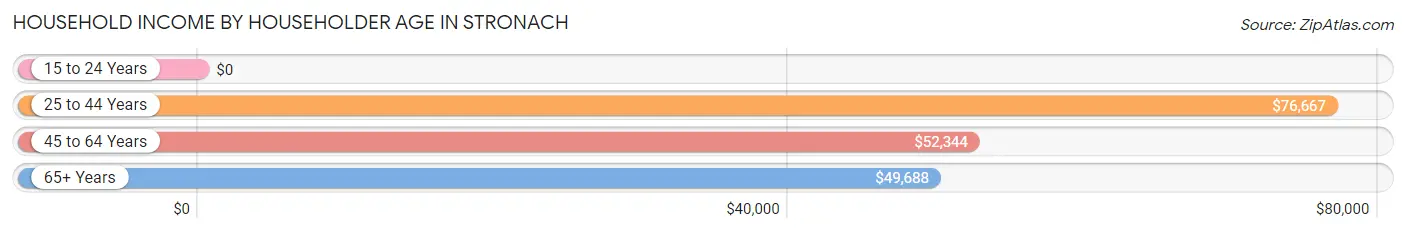
| Income Bracket | # Households | Median Income |
| 15 to 24 Years | 0 (0.0%) | $0 |
| 25 to 44 Years | 20 (26.3%) | $76,667 |
| 45 to 64 Years | 39 (51.3%) | $52,344 |
| 65+ Years | 17 (22.4%) | $49,688 |
| Total | 76 (100.0%) | $55,000 |
Poverty in Stronach
Income Below Poverty by Sex and Age in Stronach
With 9.5% poverty level for males and 8.7% for females among the residents of Stronach, under 5 year old males and 25 to 34 year old females are the most vulnerable to poverty, with 2 males (100.0%) and 7 females (43.8%) in their respective age groups living below the poverty level.
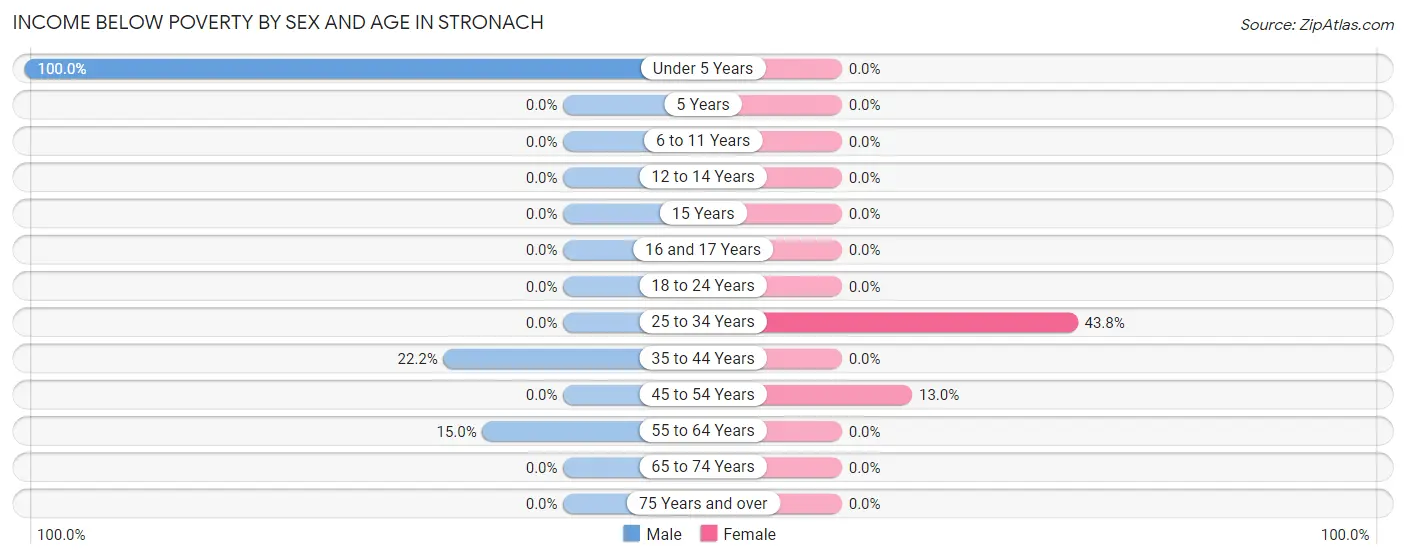
| Age Bracket | Male | Female |
| Under 5 Years | 2 (100.0%) | 0 (0.0%) |
| 5 Years | 0 (0.0%) | 0 (0.0%) |
| 6 to 11 Years | 0 (0.0%) | 0 (0.0%) |
| 12 to 14 Years | 0 (0.0%) | 0 (0.0%) |
| 15 Years | 0 (0.0%) | 0 (0.0%) |
| 16 and 17 Years | 0 (0.0%) | 0 (0.0%) |
| 18 to 24 Years | 0 (0.0%) | 0 (0.0%) |
| 25 to 34 Years | 0 (0.0%) | 7 (43.8%) |
| 35 to 44 Years | 2 (22.2%) | 0 (0.0%) |
| 45 to 54 Years | 0 (0.0%) | 3 (13.0%) |
| 55 to 64 Years | 3 (15.0%) | 0 (0.0%) |
| 65 to 74 Years | 0 (0.0%) | 0 (0.0%) |
| 75 Years and over | 0 (0.0%) | 0 (0.0%) |
| Total | 7 (9.5%) | 10 (8.7%) |
Income Above Poverty by Sex and Age in Stronach
According to the poverty statistics in Stronach, males aged 5 years and females aged under 5 years are the age groups that are most secure financially, with 100.0% of males and 100.0% of females in these age groups living above the poverty line.
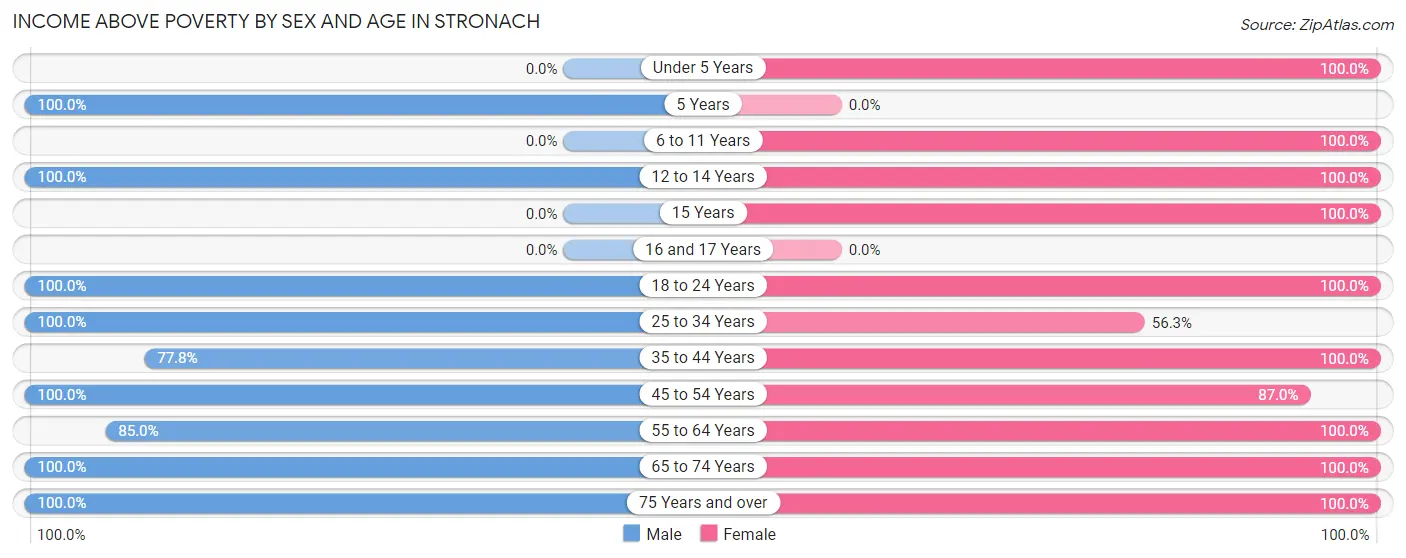
| Age Bracket | Male | Female |
| Under 5 Years | 0 (0.0%) | 6 (100.0%) |
| 5 Years | 2 (100.0%) | 0 (0.0%) |
| 6 to 11 Years | 0 (0.0%) | 13 (100.0%) |
| 12 to 14 Years | 3 (100.0%) | 5 (100.0%) |
| 15 Years | 0 (0.0%) | 4 (100.0%) |
| 16 and 17 Years | 0 (0.0%) | 0 (0.0%) |
| 18 to 24 Years | 3 (100.0%) | 2 (100.0%) |
| 25 to 34 Years | 9 (100.0%) | 9 (56.2%) |
| 35 to 44 Years | 7 (77.8%) | 13 (100.0%) |
| 45 to 54 Years | 12 (100.0%) | 20 (87.0%) |
| 55 to 64 Years | 17 (85.0%) | 18 (100.0%) |
| 65 to 74 Years | 11 (100.0%) | 9 (100.0%) |
| 75 Years and over | 3 (100.0%) | 6 (100.0%) |
| Total | 67 (90.5%) | 105 (91.3%) |
Income Below Poverty Among Married-Couple Families in Stronach
The poverty statistics for married-couple families in Stronach show that 2.2% or 1 of the total 45 families live below the poverty line. Families with 1 or 2 children have the highest poverty rate of 9.1%, comprising of 1 families. On the other hand, families with no children have the lowest poverty rate of 0.0%, which includes 0 families.
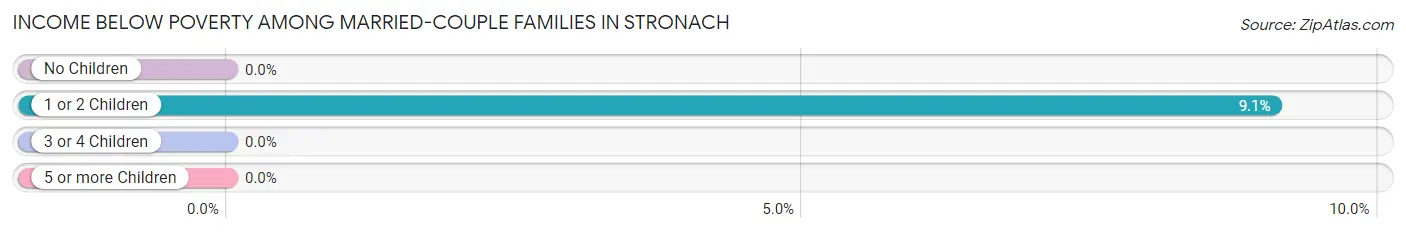
| Children | Above Poverty | Below Poverty |
| No Children | 34 (100.0%) | 0 (0.0%) |
| 1 or 2 Children | 10 (90.9%) | 1 (9.1%) |
| 3 or 4 Children | 0 (0.0%) | 0 (0.0%) |
| 5 or more Children | 0 (0.0%) | 0 (0.0%) |
| Total | 44 (97.8%) | 1 (2.2%) |
Income Below Poverty Among Single-Parent Households in Stronach
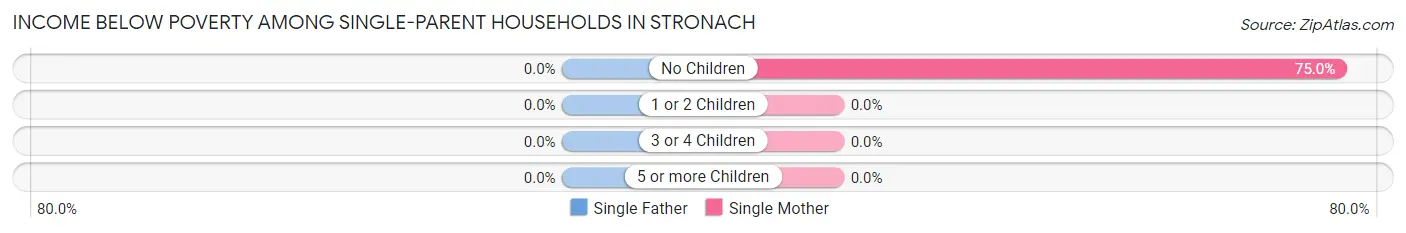
| Children | Single Father | Single Mother |
| No Children | 0 (0.0%) | 3 (75.0%) |
| 1 or 2 Children | 0 (0.0%) | 0 (0.0%) |
| 3 or 4 Children | 0 (0.0%) | 0 (0.0%) |
| 5 or more Children | 0 (0.0%) | 0 (0.0%) |
| Total | 0 (0.0%) | 3 (37.5%) |
Income Below Poverty Among Married-Couple vs Single-Parent Households in Stronach
The poverty data for Stronach shows that 1 of the married-couple family households (2.2%) and 3 of the single-parent households (20.0%) are living below the poverty level. Within the married-couple family households, those with 1 or 2 children have the highest poverty rate, with 1 households (9.1%) falling below the poverty line. Among the single-parent households, those with no children have the highest poverty rate, with 3 household (33.3%) living below poverty.
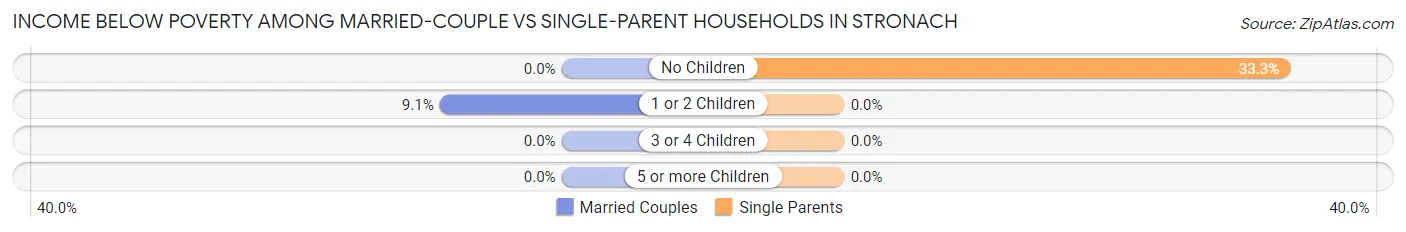
| Children | Married-Couple Families | Single-Parent Households |
| No Children | 0 (0.0%) | 3 (33.3%) |
| 1 or 2 Children | 1 (9.1%) | 0 (0.0%) |
| 3 or 4 Children | 0 (0.0%) | 0 (0.0%) |
| 5 or more Children | 0 (0.0%) | 0 (0.0%) |
| Total | 1 (2.2%) | 3 (20.0%) |
Race in Stronach
The most populous races in Stronach are White / Caucasian (179 | 93.2%), Hispanic or Latino (9 | 4.7%), and Asian (5 | 2.6%).
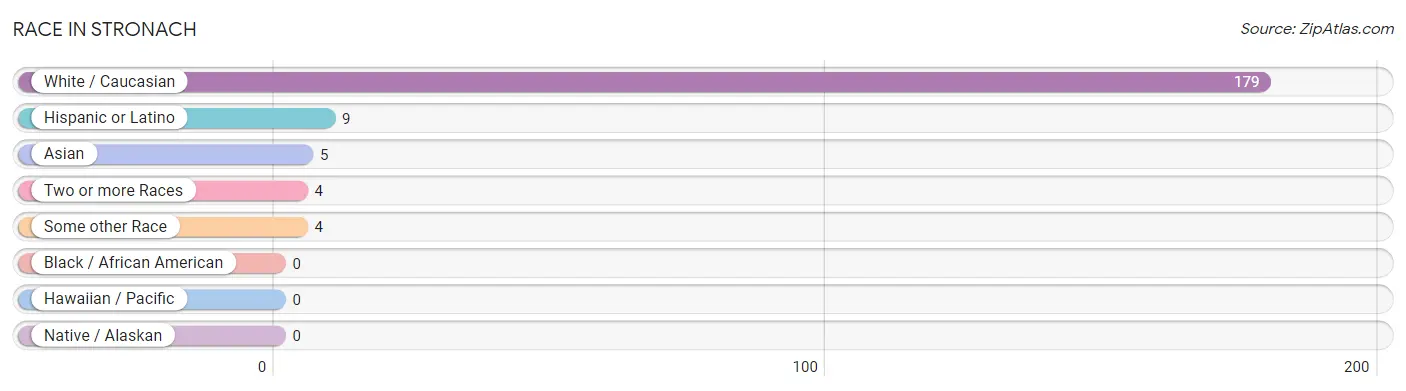
| Race | # Population | % Population |
| Asian | 5 | 2.6% |
| Black / African American | 0 | 0.0% |
| Hawaiian / Pacific | 0 | 0.0% |
| Hispanic or Latino | 9 | 4.7% |
| Native / Alaskan | 0 | 0.0% |
| White / Caucasian | 179 | 93.2% |
| Two or more Races | 4 | 2.1% |
| Some other Race | 4 | 2.1% |
| Total | 192 | 100.0% |
Ancestry in Stronach
The most populous ancestries reported in Stronach are Polish (87 | 45.3%), German (49 | 25.5%), Irish (27 | 14.1%), English (18 | 9.4%), and French Canadian (16 | 8.3%), together accounting for 102.6% of all Stronach residents.
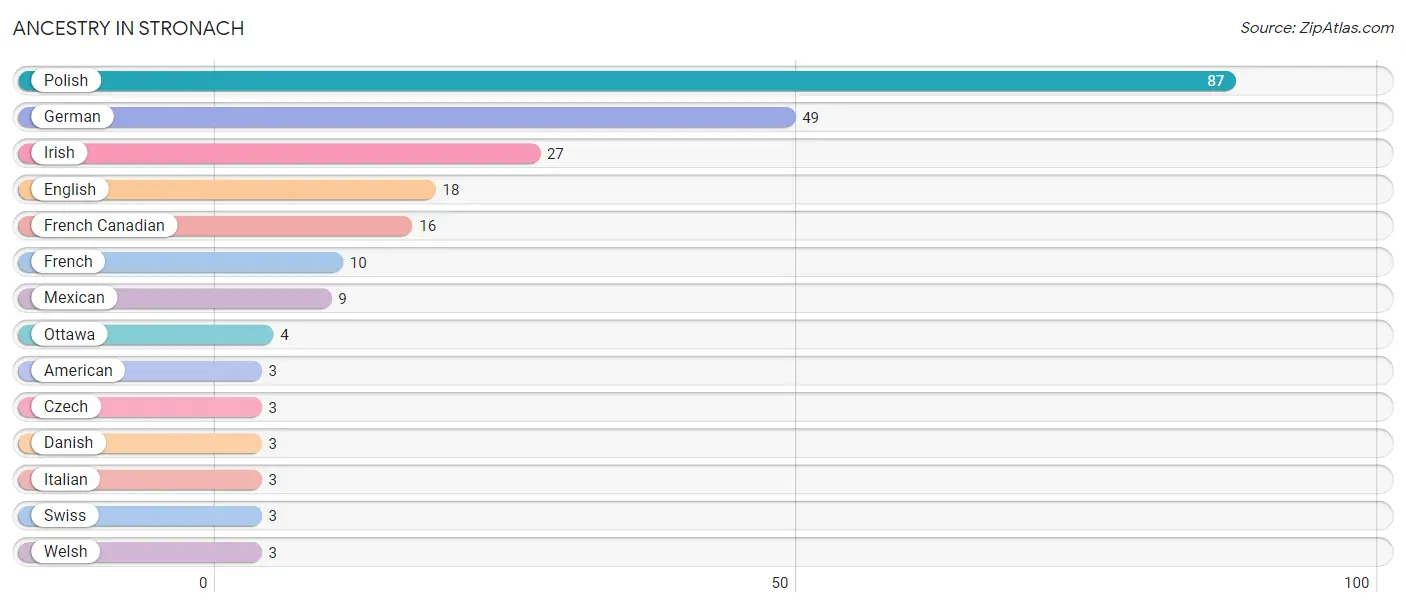
| Ancestry | # Population | % Population |
| American | 3 | 1.6% |
| Czech | 3 | 1.6% |
| Danish | 3 | 1.6% |
| English | 18 | 9.4% |
| French | 10 | 5.2% |
| French Canadian | 16 | 8.3% |
| German | 49 | 25.5% |
| Irish | 27 | 14.1% |
| Italian | 3 | 1.6% |
| Mexican | 9 | 4.7% |
| Ottawa | 4 | 2.1% |
| Polish | 87 | 45.3% |
| Swiss | 3 | 1.6% |
| Welsh | 3 | 1.6% | View All 14 Rows |
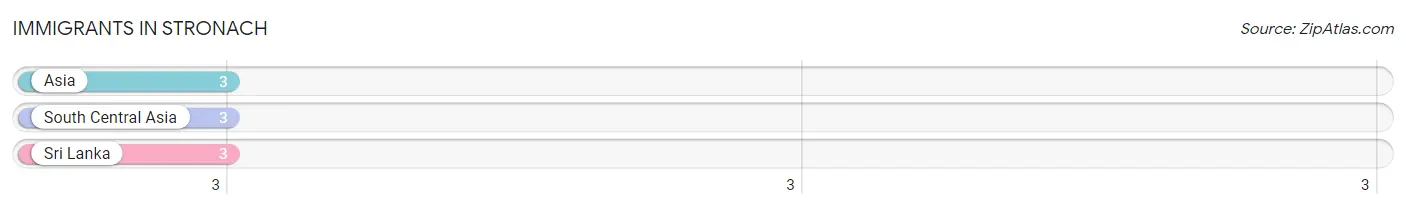
Immigrants in Stronach
The most numerous immigrant groups reported in Stronach came from Asia (3 | 1.6%), South Central Asia (3 | 1.6%), and Sri Lanka (3 | 1.6%), together accounting for 4.7% of all Stronach residents.
| Immigration Origin | # Population | % Population |
| Asia | 3 | 1.6% |
| South Central Asia | 3 | 1.6% |
| Sri Lanka | 3 | 1.6% | View All 3 Rows |
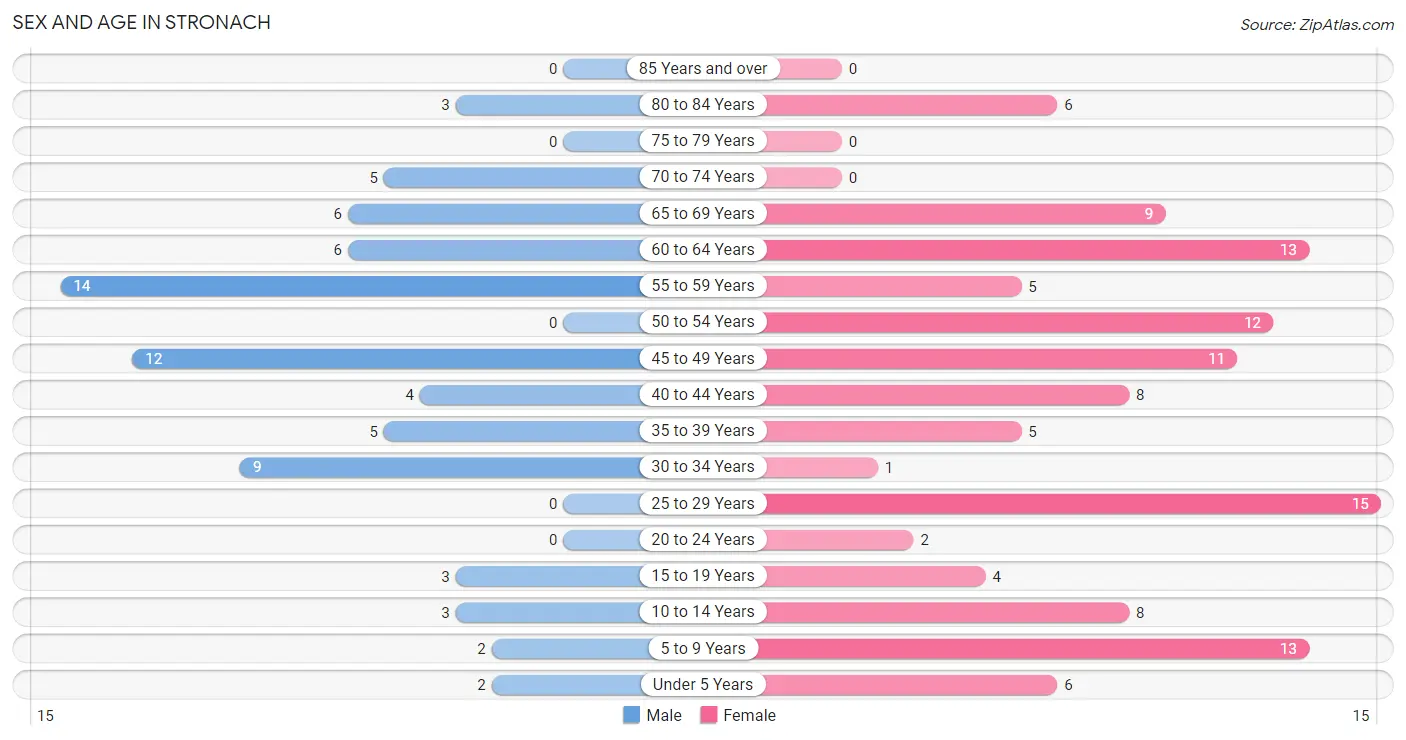
Sex and Age in Stronach
Sex and Age in Stronach
The most populous age groups in Stronach are 55 to 59 Years (14 | 18.9%) for men and 25 to 29 Years (15 | 12.7%) for women.
| Age Bracket | Male | Female |
| Under 5 Years | 2 (2.7%) | 6 (5.1%) |
| 5 to 9 Years | 2 (2.7%) | 13 (11.0%) |
| 10 to 14 Years | 3 (4.1%) | 8 (6.8%) |
| 15 to 19 Years | 3 (4.1%) | 4 (3.4%) |
| 20 to 24 Years | 0 (0.0%) | 2 (1.7%) |
| 25 to 29 Years | 0 (0.0%) | 15 (12.7%) |
| 30 to 34 Years | 9 (12.2%) | 1 (0.9%) |
| 35 to 39 Years | 5 (6.8%) | 5 (4.2%) |
| 40 to 44 Years | 4 (5.4%) | 8 (6.8%) |
| 45 to 49 Years | 12 (16.2%) | 11 (9.3%) |
| 50 to 54 Years | 0 (0.0%) | 12 (10.2%) |
| 55 to 59 Years | 14 (18.9%) | 5 (4.2%) |
| 60 to 64 Years | 6 (8.1%) | 13 (11.0%) |
| 65 to 69 Years | 6 (8.1%) | 9 (7.6%) |
| 70 to 74 Years | 5 (6.8%) | 0 (0.0%) |
| 75 to 79 Years | 0 (0.0%) | 0 (0.0%) |
| 80 to 84 Years | 3 (4.1%) | 6 (5.1%) |
| 85 Years and over | 0 (0.0%) | 0 (0.0%) |
| Total | 74 (100.0%) | 118 (100.0%) |
Families and Households in Stronach
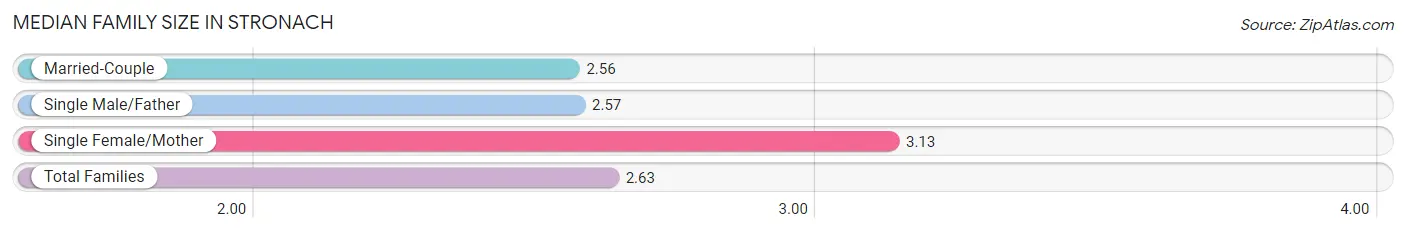
Median Family Size in Stronach
The median family size in Stronach is 2.63 persons per family, with single female/mother families (8 | 13.3%) accounting for the largest median family size of 3.13 persons per family. On the other hand, married-couple families (45 | 75.0%) represent the smallest median family size with 2.56 persons per family.
| Family Type | # Families | Family Size |
| Married-Couple | 45 (75.0%) | 2.56 |
| Single Male/Father | 7 (11.7%) | 2.57 |
| Single Female/Mother | 8 (13.3%) | 3.13 |
| Total Families | 60 (100.0%) | 2.63 |
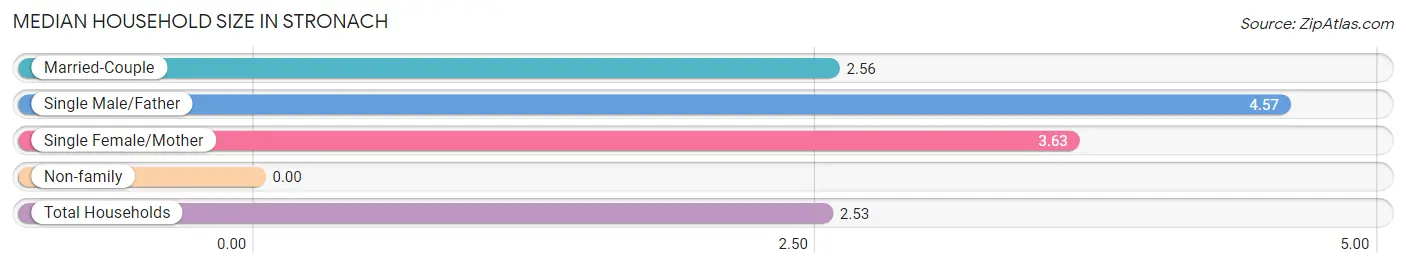
Median Household Size in Stronach
| Household Type | # Households | Household Size |
| Married-Couple | 45 (59.2%) | 2.56 |
| Single Male/Father | 7 (9.2%) | 4.57 |
| Single Female/Mother | 8 (10.5%) | 3.63 |
| Non-family | 16 (21.0%) | - |
| Total Households | 76 (100.0%) | 2.53 |
Household Size by Marriage Status in Stronach
Out of a total of 76 households in Stronach, 60 (78.9%) are family households, while 16 (21.0%) are nonfamily households. The most numerous type of family households are 2-person households, comprising 38, and the most common type of nonfamily households are 1-person households, comprising 16.
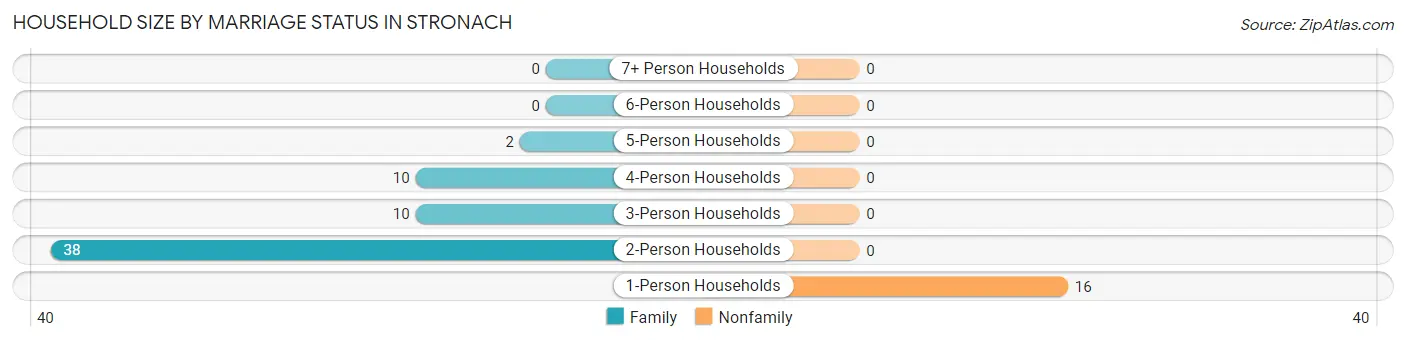
| Household Size | Family Households | Nonfamily Households |
| 1-Person Households | - | 16 (21.0%) |
| 2-Person Households | 38 (50.0%) | 0 (0.0%) |
| 3-Person Households | 10 (13.2%) | 0 (0.0%) |
| 4-Person Households | 10 (13.2%) | 0 (0.0%) |
| 5-Person Households | 2 (2.6%) | 0 (0.0%) |
| 6-Person Households | 0 (0.0%) | 0 (0.0%) |
| 7+ Person Households | 0 (0.0%) | 0 (0.0%) |
| Total | 60 (78.9%) | 16 (21.0%) |
Female Fertility in Stronach
Fertility by Age in Stronach
Average fertility rate in Stronach is 61.0 births per 1,000 women. Women in the age bracket of 20 to 34 years have the highest fertility rate with 167.0 births per 1,000 women. Women in the age bracket of 20 to 34 years acount for 100.0% of all women with births.
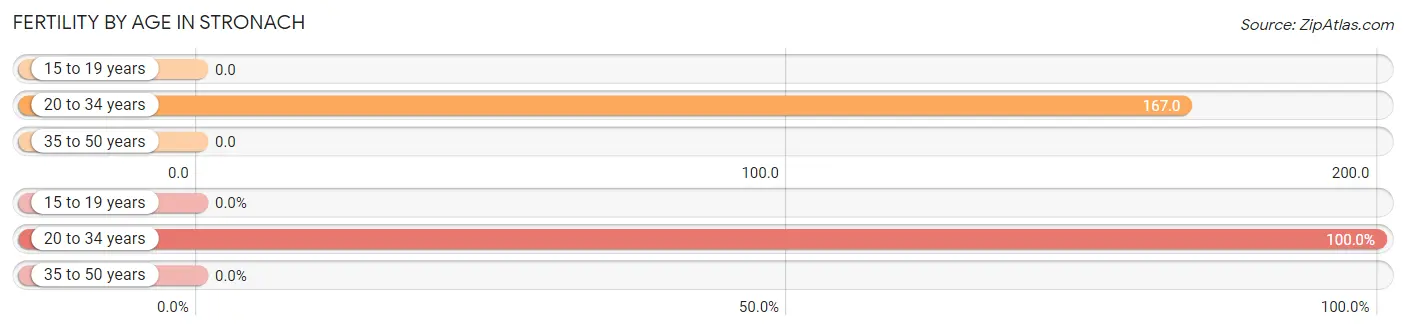
| Age Bracket | Women with Births | Births / 1,000 Women |
| 15 to 19 years | 0 (0.0%) | 0.0 |
| 20 to 34 years | 3 (100.0%) | 167.0 |
| 35 to 50 years | 0 (0.0%) | 0.0 |
| Total | 3 (100.0%) | 61.0 |
Fertility by Age by Marriage Status in Stronach
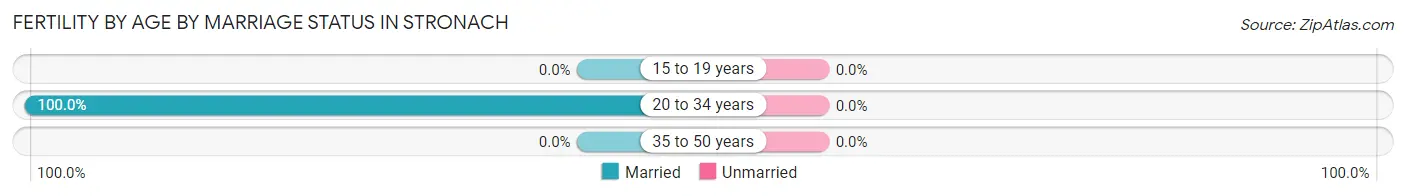
| Age Bracket | Married | Unmarried |
| 15 to 19 years | 0 (0.0%) | 0 (0.0%) |
| 20 to 34 years | 3 (100.0%) | 0 (0.0%) |
| 35 to 50 years | 0 (0.0%) | 0 (0.0%) |
| Total | 3 (100.0%) | 0 (0.0%) |
Fertility by Education in Stronach
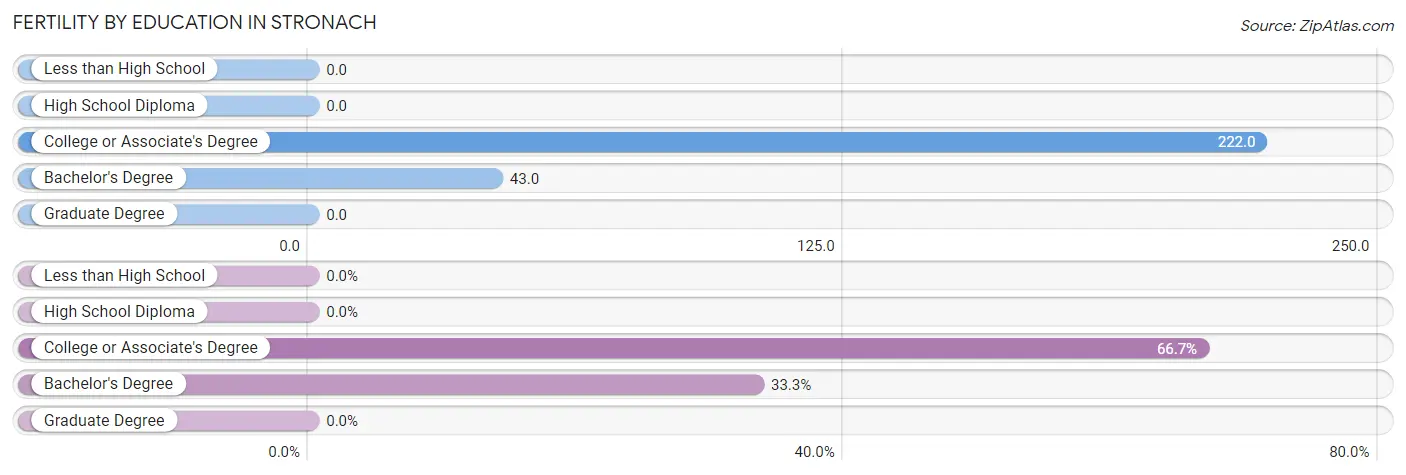
| Educational Attainment | Women with Births | Births / 1,000 Women |
| Less than High School | 0 (0.0%) | 0.0 |
| High School Diploma | 0 (0.0%) | 0.0 |
| College or Associate's Degree | 2 (66.7%) | 222.0 |
| Bachelor's Degree | 1 (33.3%) | 43.0 |
| Graduate Degree | 0 (0.0%) | 0.0 |
| Total | 3 (100.0%) | 61.0 |
Fertility by Education by Marriage Status in Stronach
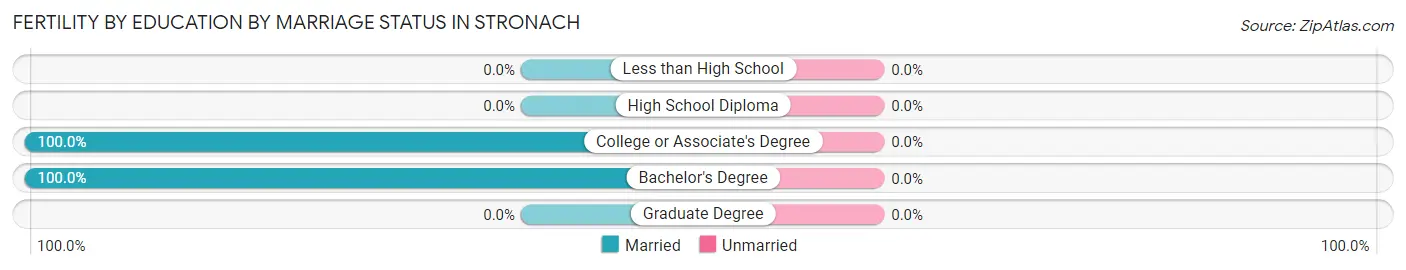
| Educational Attainment | Married | Unmarried |
| Less than High School | 0 (0.0%) | 0 (0.0%) |
| High School Diploma | 0 (0.0%) | 0 (0.0%) |
| College or Associate's Degree | 2 (100.0%) | 0 (0.0%) |
| Bachelor's Degree | 1 (100.0%) | 0 (0.0%) |
| Graduate Degree | 0 (0.0%) | 0 (0.0%) |
| Total | 3 (100.0%) | 0 (0.0%) |
Employment Characteristics in Stronach
Employment by Class of Employer in Stronach
Among the 96 employed individuals in Stronach, private company employees (68 | 70.8%), not-for-profit organizations (12 | 12.5%), and local government employees (11 | 11.5%) make up the most common classes of employment.
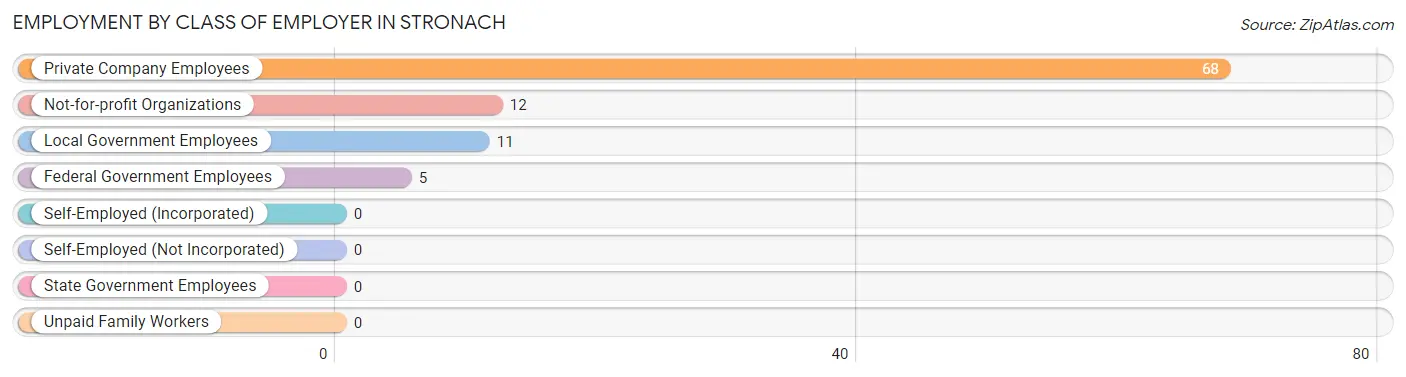
| Employer Class | # Employees | % Employees |
| Private Company Employees | 68 | 70.8% |
| Self-Employed (Incorporated) | 0 | 0.0% |
| Self-Employed (Not Incorporated) | 0 | 0.0% |
| Not-for-profit Organizations | 12 | 12.5% |
| Local Government Employees | 11 | 11.5% |
| State Government Employees | 0 | 0.0% |
| Federal Government Employees | 5 | 5.2% |
| Unpaid Family Workers | 0 | 0.0% |
| Total | 96 | 100.0% |
Employment Status by Age in Stronach
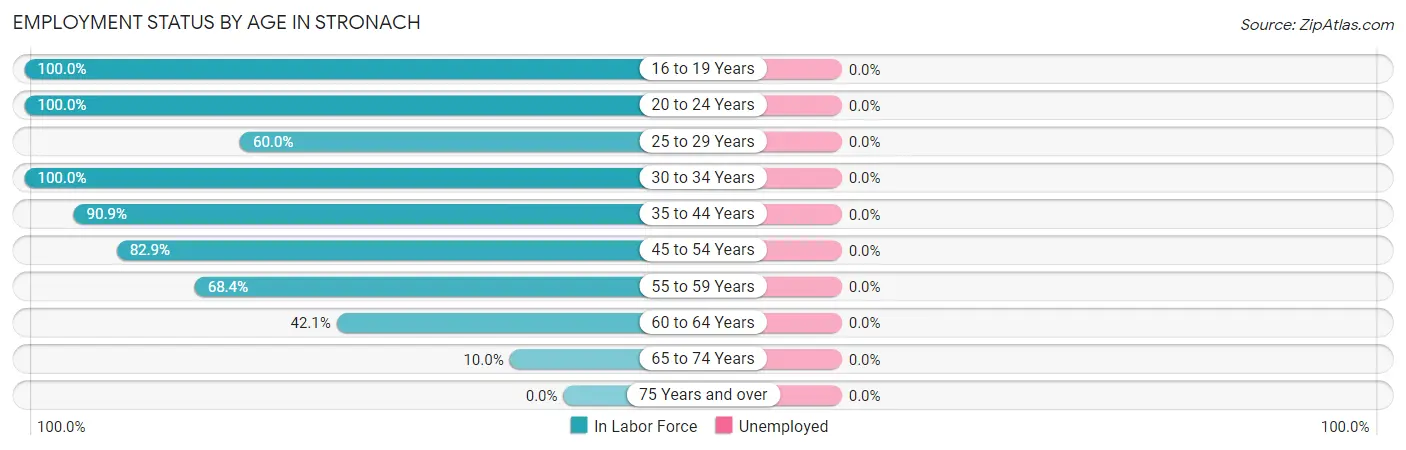
| Age Bracket | In Labor Force | Unemployed |
| 16 to 19 Years | 3 (100.0%) | 0 (0.0%) |
| 20 to 24 Years | 2 (100.0%) | 0 (0.0%) |
| 25 to 29 Years | 9 (60.0%) | 0 (0.0%) |
| 30 to 34 Years | 10 (100.0%) | 0 (0.0%) |
| 35 to 44 Years | 20 (90.9%) | 0 (0.0%) |
| 45 to 54 Years | 29 (82.9%) | 0 (0.0%) |
| 55 to 59 Years | 13 (68.4%) | 0 (0.0%) |
| 60 to 64 Years | 8 (42.1%) | 0 (0.0%) |
| 65 to 74 Years | 2 (10.0%) | 0 (0.0%) |
| 75 Years and over | 0 (0.0%) | 0 (0.0%) |
| Total | 96 (62.3%) | 0 (0.0%) |
Employment Status by Educational Attainment in Stronach
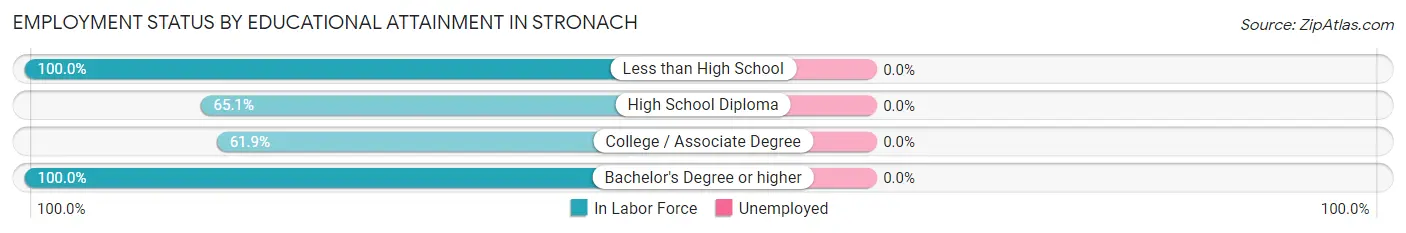
| Educational Attainment | In Labor Force | Unemployed |
| Less than High School | 4 (100.0%) | 0 (0.0%) |
| High School Diploma | 28 (65.1%) | 0 (0.0%) |
| College / Associate Degree | 26 (61.9%) | 0 (0.0%) |
| Bachelor's Degree or higher | 31 (100.0%) | 0 (0.0%) |
| Total | 89 (74.2%) | 0 (0.0%) |
Employment Occupations by Sex in Stronach
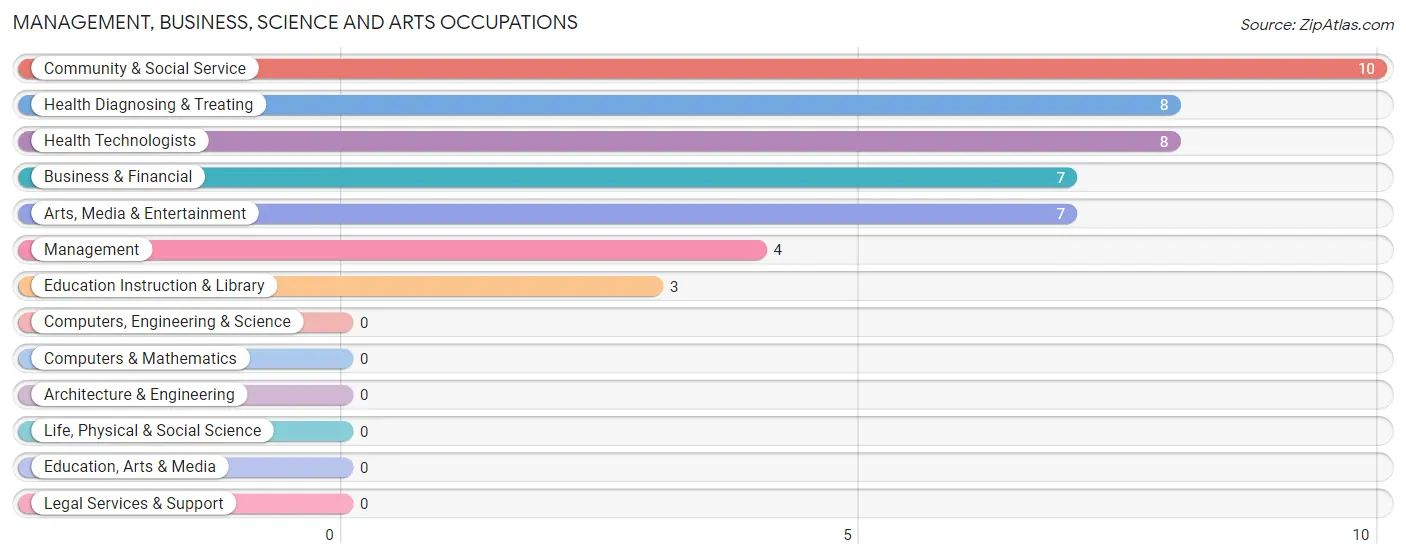
Management, Business, Science and Arts Occupations
The most common Management, Business, Science and Arts occupations in Stronach are Community & Social Service (10 | 10.4%), Health Diagnosing & Treating (8 | 8.3%), Health Technologists (8 | 8.3%), Business & Financial (7 | 7.3%), and Arts, Media & Entertainment (7 | 7.3%).
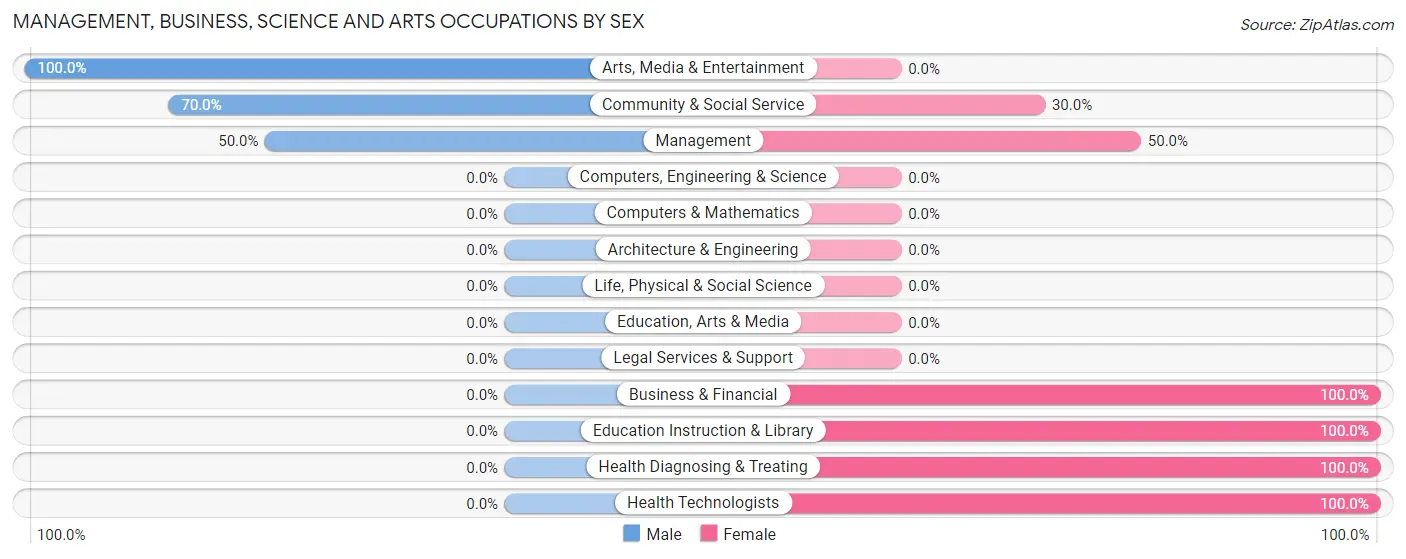
Management, Business, Science and Arts Occupations by Sex
Within the Management, Business, Science and Arts occupations in Stronach, the most male-oriented occupations are Arts, Media & Entertainment (100.0%), Community & Social Service (70.0%), and Management (50.0%), while the most female-oriented occupations are Business & Financial (100.0%), Education Instruction & Library (100.0%), and Health Diagnosing & Treating (100.0%).
| Occupation | Male | Female |
| Management | 2 (50.0%) | 2 (50.0%) |
| Business & Financial | 0 (0.0%) | 7 (100.0%) |
| Computers, Engineering & Science | 0 (0.0%) | 0 (0.0%) |
| Computers & Mathematics | 0 (0.0%) | 0 (0.0%) |
| Architecture & Engineering | 0 (0.0%) | 0 (0.0%) |
| Life, Physical & Social Science | 0 (0.0%) | 0 (0.0%) |
| Community & Social Service | 7 (70.0%) | 3 (30.0%) |
| Education, Arts & Media | 0 (0.0%) | 0 (0.0%) |
| Legal Services & Support | 0 (0.0%) | 0 (0.0%) |
| Education Instruction & Library | 0 (0.0%) | 3 (100.0%) |
| Arts, Media & Entertainment | 7 (100.0%) | 0 (0.0%) |
| Health Diagnosing & Treating | 0 (0.0%) | 8 (100.0%) |
| Health Technologists | 0 (0.0%) | 8 (100.0%) |
| Total (Category) | 9 (31.0%) | 20 (69.0%) |
| Total (Overall) | 44 (45.8%) | 52 (54.2%) |
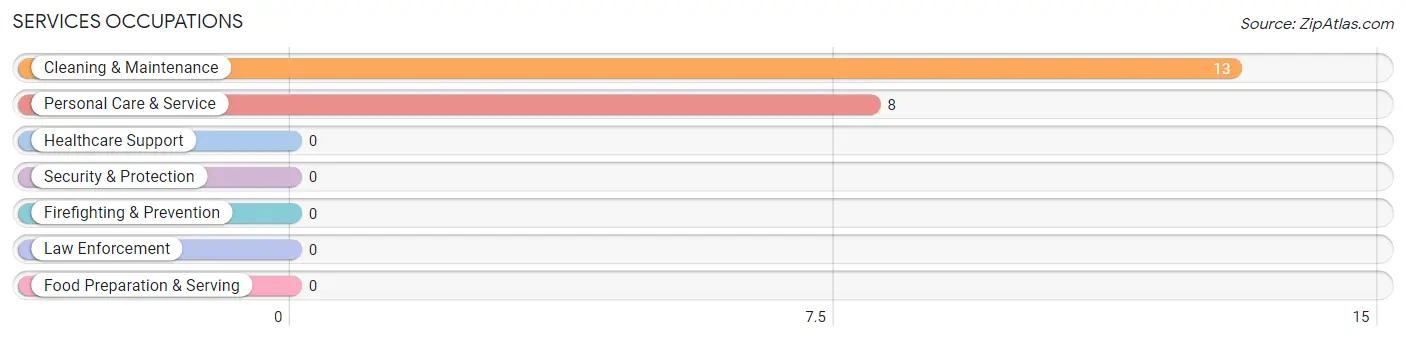
Services Occupations
The most common Services occupations in Stronach are Cleaning & Maintenance (13 | 13.5%), and Personal Care & Service (8 | 8.3%).
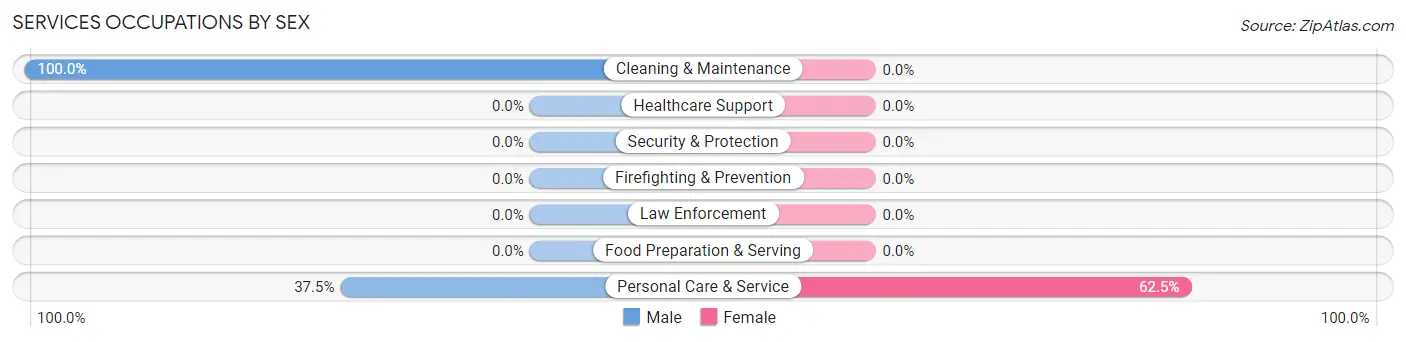
Services Occupations by Sex
| Occupation | Male | Female |
| Healthcare Support | 0 (0.0%) | 0 (0.0%) |
| Security & Protection | 0 (0.0%) | 0 (0.0%) |
| Firefighting & Prevention | 0 (0.0%) | 0 (0.0%) |
| Law Enforcement | 0 (0.0%) | 0 (0.0%) |
| Food Preparation & Serving | 0 (0.0%) | 0 (0.0%) |
| Cleaning & Maintenance | 13 (100.0%) | 0 (0.0%) |
| Personal Care & Service | 3 (37.5%) | 5 (62.5%) |
| Total (Category) | 16 (76.2%) | 5 (23.8%) |
| Total (Overall) | 44 (45.8%) | 52 (54.2%) |
Sales and Office Occupations
The most common Sales and Office occupations in Stronach are Office & Administration (14 | 14.6%), and Sales & Related (10 | 10.4%).
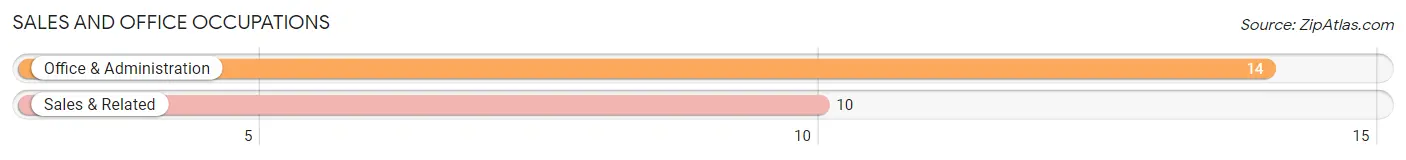
Sales and Office Occupations by Sex
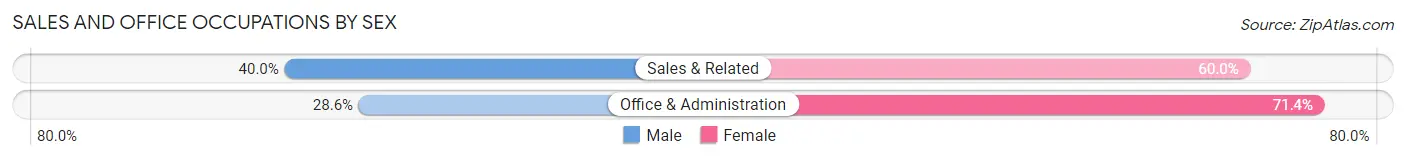
| Occupation | Male | Female |
| Sales & Related | 4 (40.0%) | 6 (60.0%) |
| Office & Administration | 4 (28.6%) | 10 (71.4%) |
| Total (Category) | 8 (33.3%) | 16 (66.7%) |
| Total (Overall) | 44 (45.8%) | 52 (54.2%) |
Natural Resources, Construction and Maintenance Occupations
The most common Natural Resources, Construction and Maintenance occupations in Stronach are Construction & Extraction (3 | 3.1%), and Installation, Maintenance & Repair (2 | 2.1%).
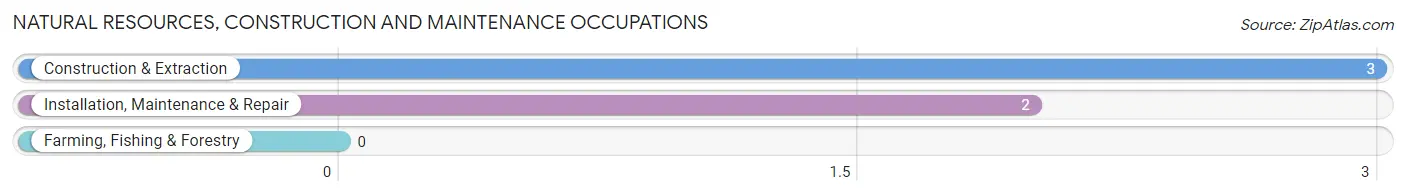
Natural Resources, Construction and Maintenance Occupations by Sex
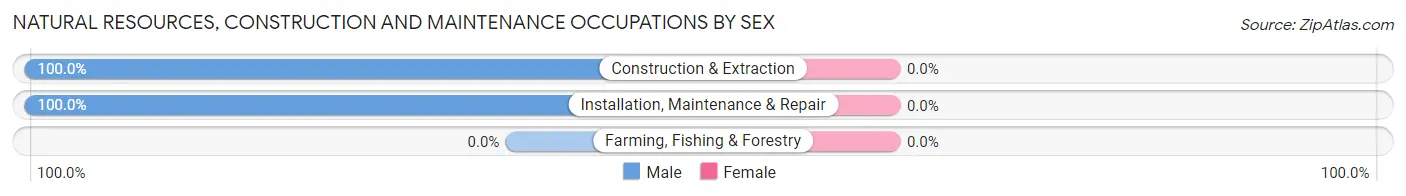
| Occupation | Male | Female |
| Farming, Fishing & Forestry | 0 (0.0%) | 0 (0.0%) |
| Construction & Extraction | 3 (100.0%) | 0 (0.0%) |
| Installation, Maintenance & Repair | 2 (100.0%) | 0 (0.0%) |
| Total (Category) | 5 (100.0%) | 0 (0.0%) |
| Total (Overall) | 44 (45.8%) | 52 (54.2%) |
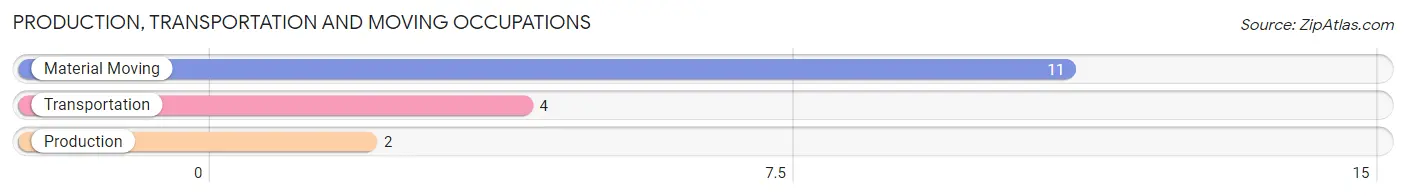
Production, Transportation and Moving Occupations
The most common Production, Transportation and Moving occupations in Stronach are Material Moving (11 | 11.5%), Transportation (4 | 4.2%), and Production (2 | 2.1%).
Production, Transportation and Moving Occupations by Sex
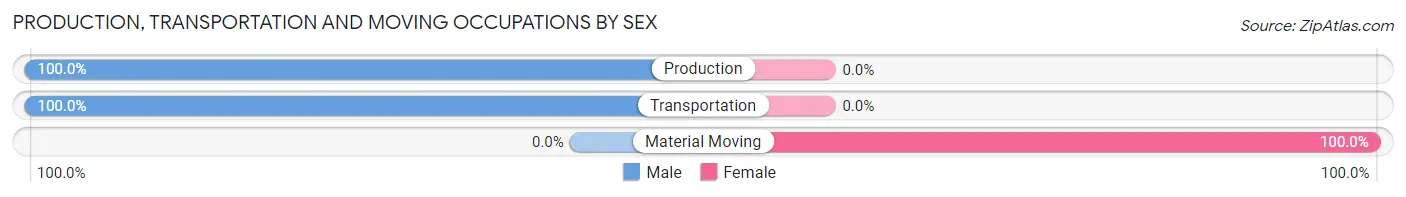
| Occupation | Male | Female |
| Production | 2 (100.0%) | 0 (0.0%) |
| Transportation | 4 (100.0%) | 0 (0.0%) |
| Material Moving | 0 (0.0%) | 11 (100.0%) |
| Total (Category) | 6 (35.3%) | 11 (64.7%) |
| Total (Overall) | 44 (45.8%) | 52 (54.2%) |
Employment Industries by Sex in Stronach
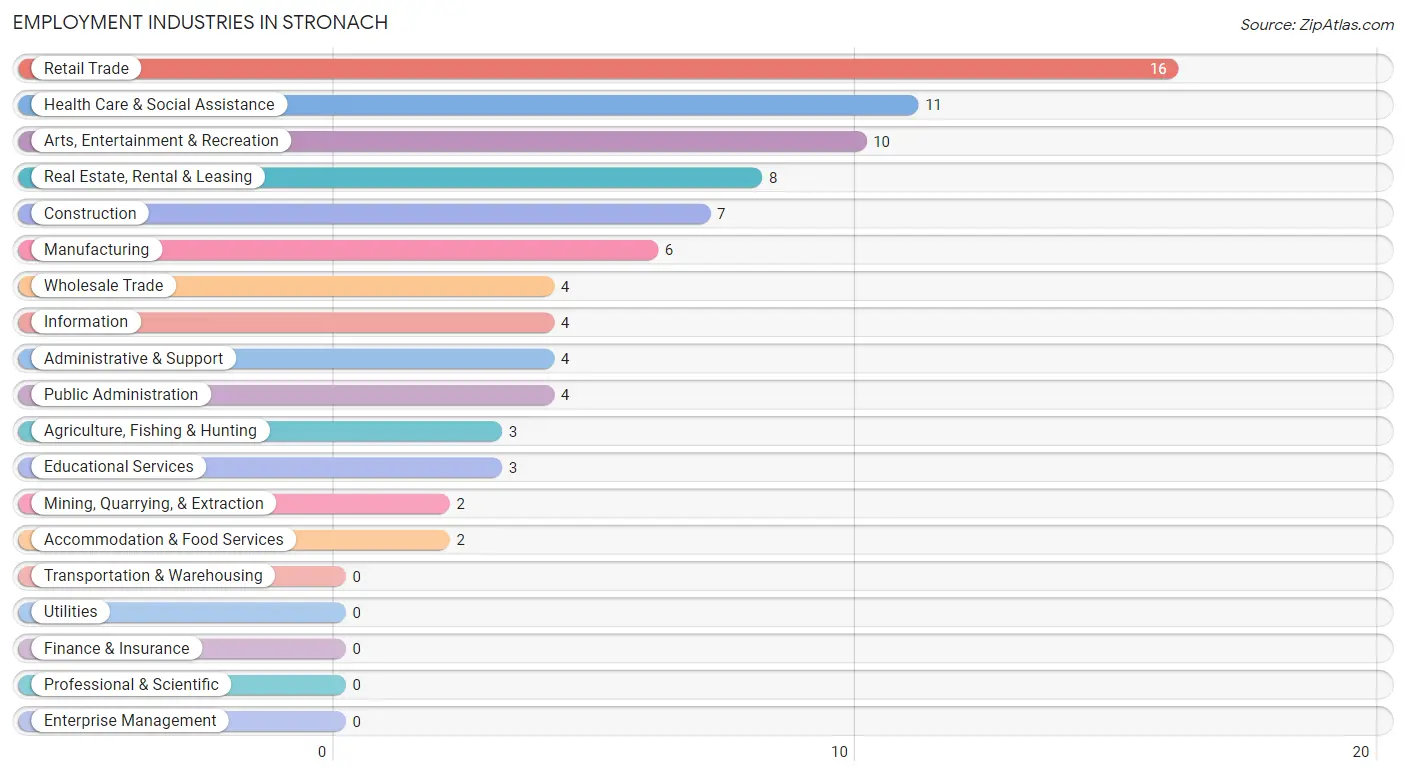
Employment Industries in Stronach
The major employment industries in Stronach include Retail Trade (16 | 16.7%), Health Care & Social Assistance (11 | 11.5%), Arts, Entertainment & Recreation (10 | 10.4%), Real Estate, Rental & Leasing (8 | 8.3%), and Construction (7 | 7.3%).
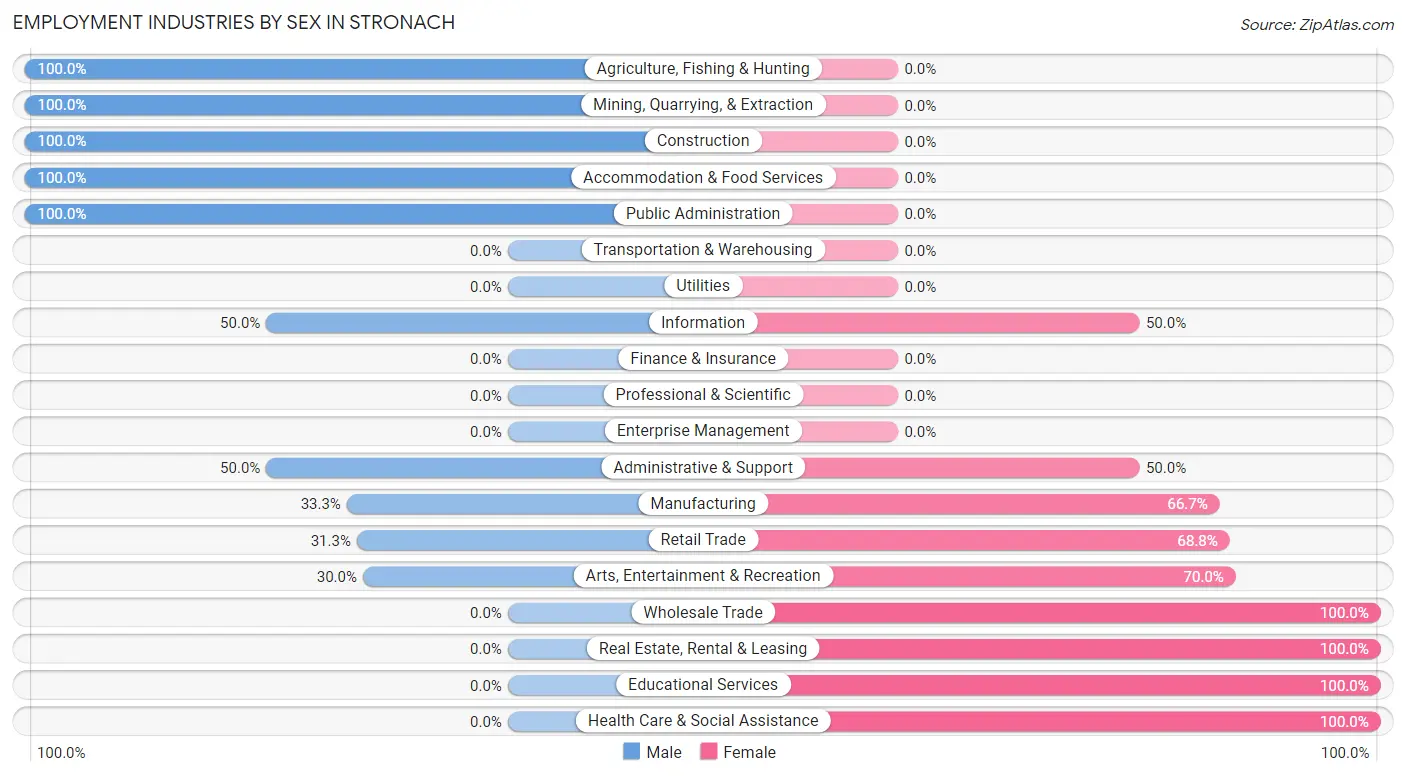
Employment Industries by Sex in Stronach
The Stronach industries that see more men than women are Agriculture, Fishing & Hunting (100.0%), Mining, Quarrying, & Extraction (100.0%), and Construction (100.0%), whereas the industries that tend to have a higher number of women are Wholesale Trade (100.0%), Real Estate, Rental & Leasing (100.0%), and Educational Services (100.0%).
| Industry | Male | Female |
| Agriculture, Fishing & Hunting | 3 (100.0%) | 0 (0.0%) |
| Mining, Quarrying, & Extraction | 2 (100.0%) | 0 (0.0%) |
| Construction | 7 (100.0%) | 0 (0.0%) |
| Manufacturing | 2 (33.3%) | 4 (66.7%) |
| Wholesale Trade | 0 (0.0%) | 4 (100.0%) |
| Retail Trade | 5 (31.2%) | 11 (68.8%) |
| Transportation & Warehousing | 0 (0.0%) | 0 (0.0%) |
| Utilities | 0 (0.0%) | 0 (0.0%) |
| Information | 2 (50.0%) | 2 (50.0%) |
| Finance & Insurance | 0 (0.0%) | 0 (0.0%) |
| Real Estate, Rental & Leasing | 0 (0.0%) | 8 (100.0%) |
| Professional & Scientific | 0 (0.0%) | 0 (0.0%) |
| Enterprise Management | 0 (0.0%) | 0 (0.0%) |
| Administrative & Support | 2 (50.0%) | 2 (50.0%) |
| Educational Services | 0 (0.0%) | 3 (100.0%) |
| Health Care & Social Assistance | 0 (0.0%) | 11 (100.0%) |
| Arts, Entertainment & Recreation | 3 (30.0%) | 7 (70.0%) |
| Accommodation & Food Services | 2 (100.0%) | 0 (0.0%) |
| Public Administration | 4 (100.0%) | 0 (0.0%) |
| Total | 44 (45.8%) | 52 (54.2%) |
Education in Stronach
School Enrollment in Stronach
The most common levels of schooling among the 31 students in Stronach are middle school (11 | 35.5%), elementary school (8 | 25.8%), and kindergarten (5 | 16.1%).
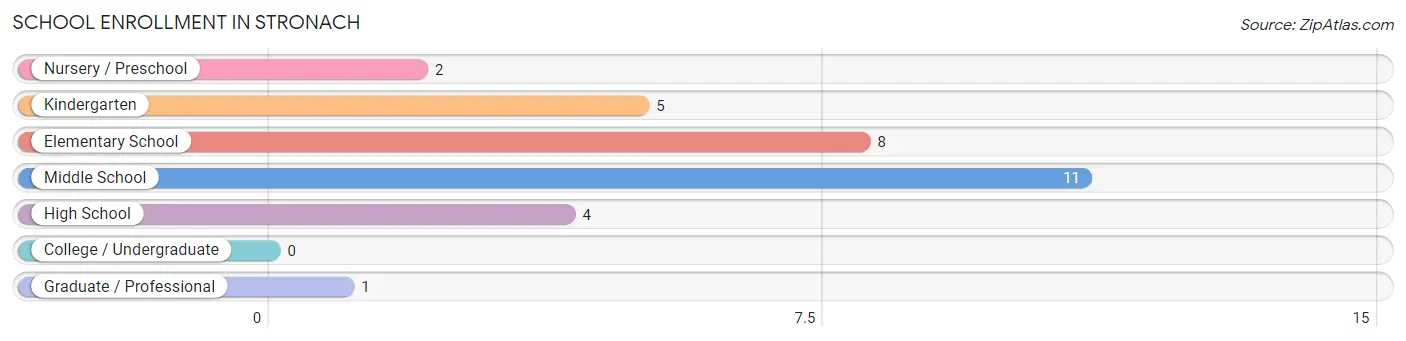
| School Level | # Students | % Students |
| Nursery / Preschool | 2 | 6.5% |
| Kindergarten | 5 | 16.1% |
| Elementary School | 8 | 25.8% |
| Middle School | 11 | 35.5% |
| High School | 4 | 12.9% |
| College / Undergraduate | 0 | 0.0% |
| Graduate / Professional | 1 | 3.2% |
| Total | 31 | 100.0% |
School Enrollment by Age by Funding Source in Stronach
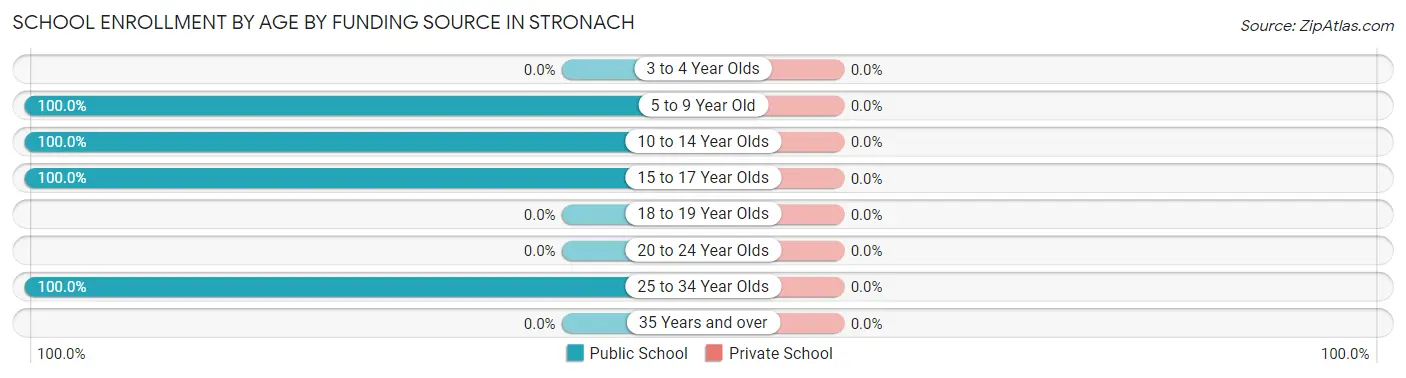
| Age Bracket | Public School | Private School |
| 3 to 4 Year Olds | 0 (0.0%) | 0 (0.0%) |
| 5 to 9 Year Old | 15 (100.0%) | 0 (0.0%) |
| 10 to 14 Year Olds | 11 (100.0%) | 0 (0.0%) |
| 15 to 17 Year Olds | 4 (100.0%) | 0 (0.0%) |
| 18 to 19 Year Olds | 0 (0.0%) | 0 (0.0%) |
| 20 to 24 Year Olds | 0 (0.0%) | 0 (0.0%) |
| 25 to 34 Year Olds | 1 (100.0%) | 0 (0.0%) |
| 35 Years and over | 0 (0.0%) | 0 (0.0%) |
| Total | 31 (100.0%) | 0 (0.0%) |
Educational Attainment by Field of Study in Stronach
Education (11 | 35.5%), science & technology (7 | 22.6%), business (7 | 22.6%), bio, nature & agricultural (4 | 12.9%), and psychology (2 | 6.5%) are the most common fields of study among 31 individuals in Stronach who have obtained a bachelor's degree or higher.
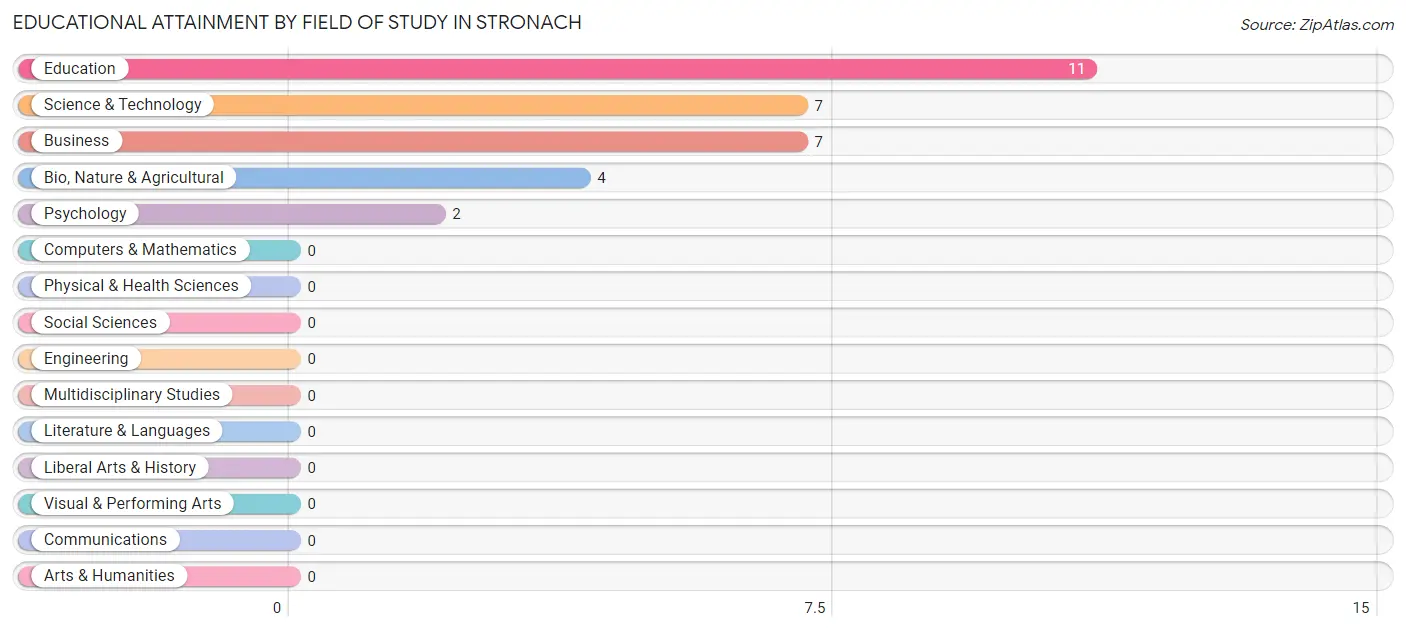
| Field of Study | # Graduates | % Graduates |
| Computers & Mathematics | 0 | 0.0% |
| Bio, Nature & Agricultural | 4 | 12.9% |
| Physical & Health Sciences | 0 | 0.0% |
| Psychology | 2 | 6.5% |
| Social Sciences | 0 | 0.0% |
| Engineering | 0 | 0.0% |
| Multidisciplinary Studies | 0 | 0.0% |
| Science & Technology | 7 | 22.6% |
| Business | 7 | 22.6% |
| Education | 11 | 35.5% |
| Literature & Languages | 0 | 0.0% |
| Liberal Arts & History | 0 | 0.0% |
| Visual & Performing Arts | 0 | 0.0% |
| Communications | 0 | 0.0% |
| Arts & Humanities | 0 | 0.0% |
| Total | 31 | 100.0% |
Transportation & Commute in Stronach
Vehicle Availability by Sex in Stronach
The most prevalent vehicle ownership categories in Stronach are males with 2 vehicles (18, accounting for 40.9%) and females with 2 vehicles (25, making up 34.6%).
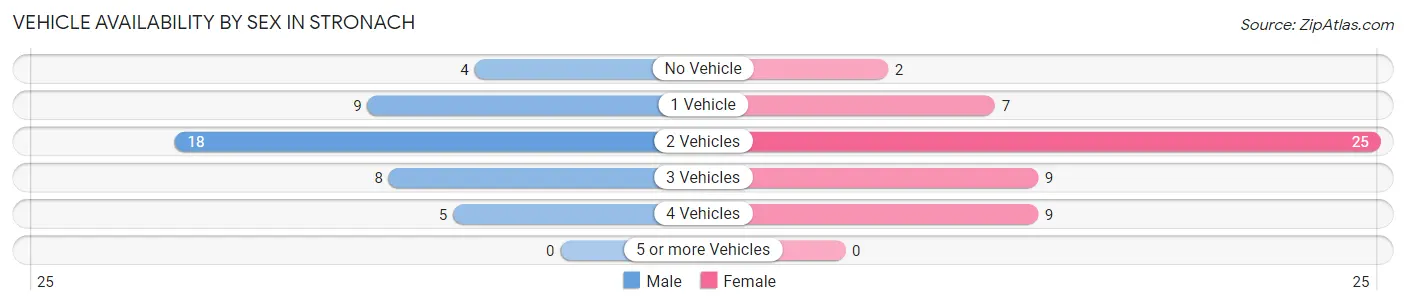
| Vehicles Available | Male | Female |
| No Vehicle | 4 (9.1%) | 2 (3.8%) |
| 1 Vehicle | 9 (20.4%) | 7 (13.5%) |
| 2 Vehicles | 18 (40.9%) | 25 (48.1%) |
| 3 Vehicles | 8 (18.2%) | 9 (17.3%) |
| 4 Vehicles | 5 (11.4%) | 9 (17.3%) |
| 5 or more Vehicles | 0 (0.0%) | 0 (0.0%) |
| Total | 44 (100.0%) | 52 (100.0%) |
Commute Time in Stronach
The most frequently occuring commute durations in Stronach are 10 to 14 minutes (49 commuters, 53.8%), 15 to 19 minutes (12 commuters, 13.2%), and 30 to 34 minutes (10 commuters, 11.0%).
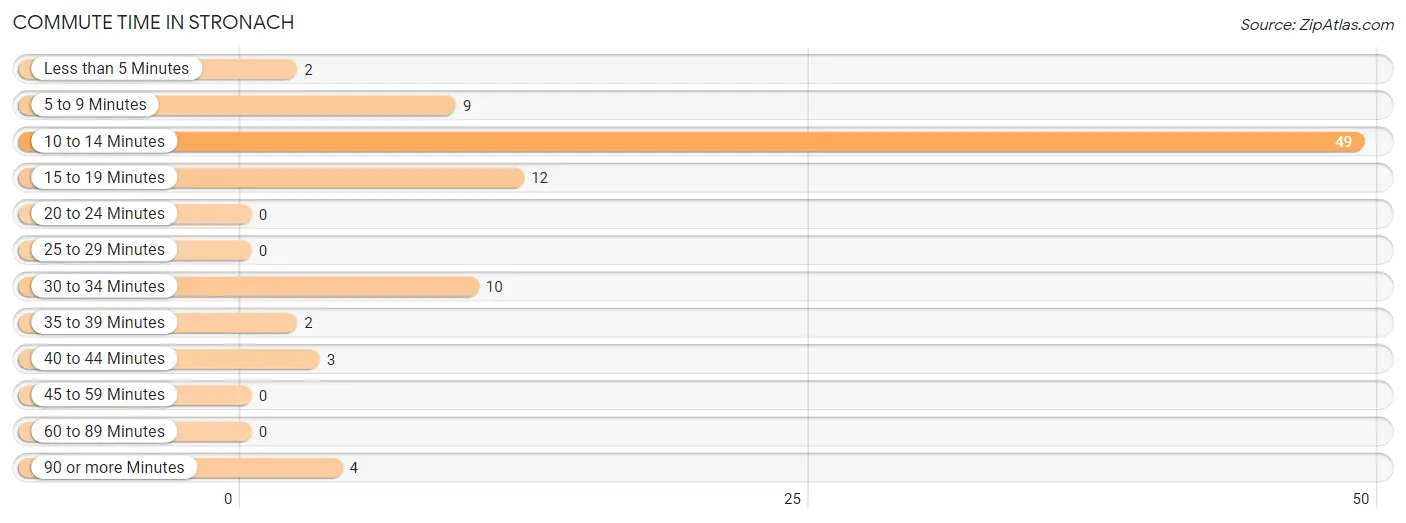
| Commute Time | # Commuters | % Commuters |
| Less than 5 Minutes | 2 | 2.2% |
| 5 to 9 Minutes | 9 | 9.9% |
| 10 to 14 Minutes | 49 | 53.8% |
| 15 to 19 Minutes | 12 | 13.2% |
| 20 to 24 Minutes | 0 | 0.0% |
| 25 to 29 Minutes | 0 | 0.0% |
| 30 to 34 Minutes | 10 | 11.0% |
| 35 to 39 Minutes | 2 | 2.2% |
| 40 to 44 Minutes | 3 | 3.3% |
| 45 to 59 Minutes | 0 | 0.0% |
| 60 to 89 Minutes | 0 | 0.0% |
| 90 or more Minutes | 4 | 4.4% |
Commute Time by Sex in Stronach
The most common commute times in Stronach are 10 to 14 minutes (14 commuters, 31.8%) for males and 10 to 14 minutes (35 commuters, 74.5%) for females.
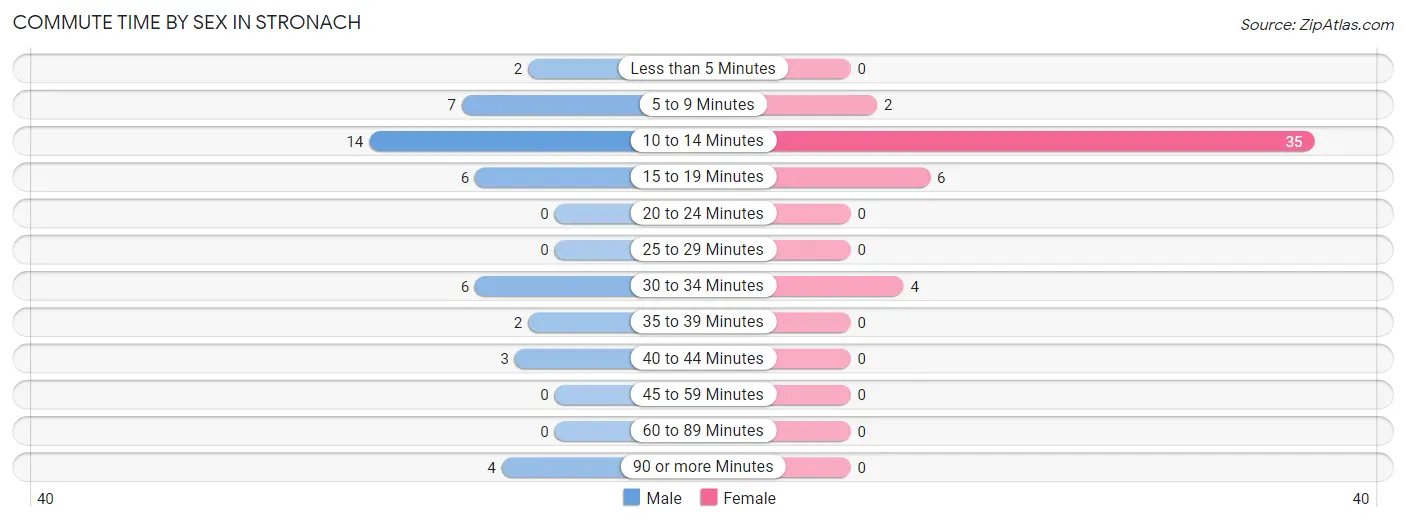
| Commute Time | Male | Female |
| Less than 5 Minutes | 2 (4.5%) | 0 (0.0%) |
| 5 to 9 Minutes | 7 (15.9%) | 2 (4.3%) |
| 10 to 14 Minutes | 14 (31.8%) | 35 (74.5%) |
| 15 to 19 Minutes | 6 (13.6%) | 6 (12.8%) |
| 20 to 24 Minutes | 0 (0.0%) | 0 (0.0%) |
| 25 to 29 Minutes | 0 (0.0%) | 0 (0.0%) |
| 30 to 34 Minutes | 6 (13.6%) | 4 (8.5%) |
| 35 to 39 Minutes | 2 (4.5%) | 0 (0.0%) |
| 40 to 44 Minutes | 3 (6.8%) | 0 (0.0%) |
| 45 to 59 Minutes | 0 (0.0%) | 0 (0.0%) |
| 60 to 89 Minutes | 0 (0.0%) | 0 (0.0%) |
| 90 or more Minutes | 4 (9.1%) | 0 (0.0%) |
Time of Departure to Work by Sex in Stronach
The most frequent times of departure to work in Stronach are 6:30 AM to 6:59 AM (13, 29.5%) for males and 8:30 AM to 8:59 AM (10, 21.3%) for females.
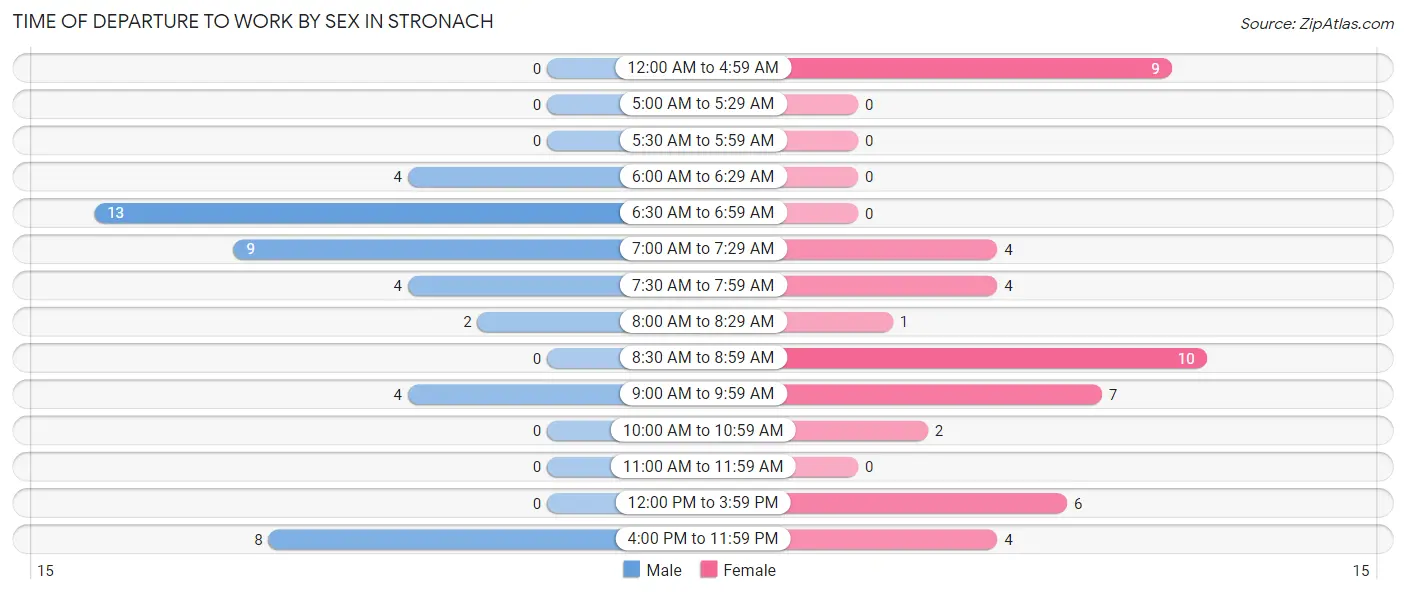
| Time of Departure | Male | Female |
| 12:00 AM to 4:59 AM | 0 (0.0%) | 9 (19.2%) |
| 5:00 AM to 5:29 AM | 0 (0.0%) | 0 (0.0%) |
| 5:30 AM to 5:59 AM | 0 (0.0%) | 0 (0.0%) |
| 6:00 AM to 6:29 AM | 4 (9.1%) | 0 (0.0%) |
| 6:30 AM to 6:59 AM | 13 (29.5%) | 0 (0.0%) |
| 7:00 AM to 7:29 AM | 9 (20.4%) | 4 (8.5%) |
| 7:30 AM to 7:59 AM | 4 (9.1%) | 4 (8.5%) |
| 8:00 AM to 8:29 AM | 2 (4.5%) | 1 (2.1%) |
| 8:30 AM to 8:59 AM | 0 (0.0%) | 10 (21.3%) |
| 9:00 AM to 9:59 AM | 4 (9.1%) | 7 (14.9%) |
| 10:00 AM to 10:59 AM | 0 (0.0%) | 2 (4.3%) |
| 11:00 AM to 11:59 AM | 0 (0.0%) | 0 (0.0%) |
| 12:00 PM to 3:59 PM | 0 (0.0%) | 6 (12.8%) |
| 4:00 PM to 11:59 PM | 8 (18.2%) | 4 (8.5%) |
| Total | 44 (100.0%) | 47 (100.0%) |
Housing Occupancy in Stronach
Occupancy by Ownership in Stronach
Of the total 76 dwellings in Stronach, owner-occupied units account for 62 (81.6%), while renter-occupied units make up 14 (18.4%).
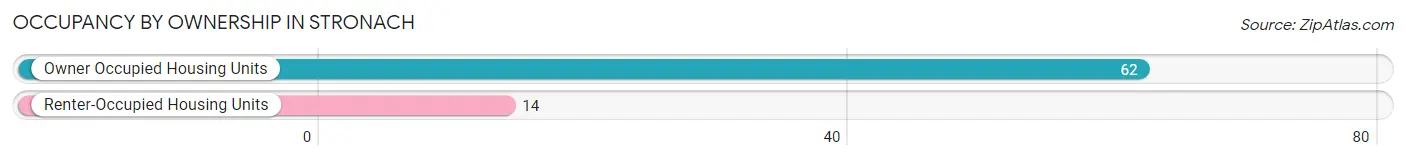
| Occupancy | # Housing Units | % Housing Units |
| Owner Occupied Housing Units | 62 | 81.6% |
| Renter-Occupied Housing Units | 14 | 18.4% |
| Total Occupied Housing Units | 76 | 100.0% |
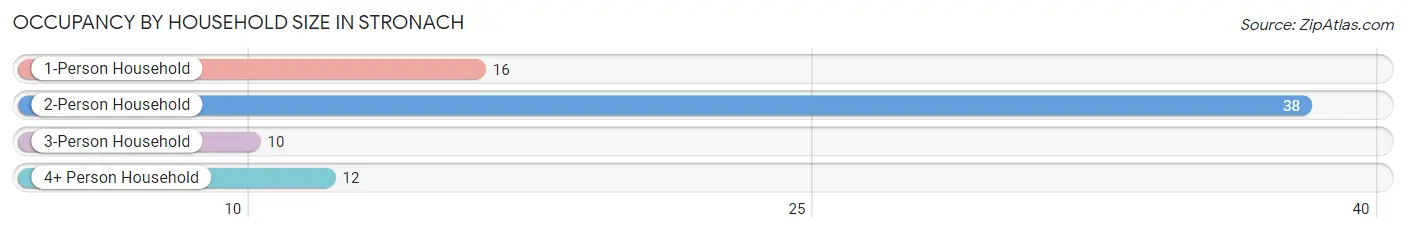
Occupancy by Household Size in Stronach
| Household Size | # Housing Units | % Housing Units |
| 1-Person Household | 16 | 21.0% |
| 2-Person Household | 38 | 50.0% |
| 3-Person Household | 10 | 13.2% |
| 4+ Person Household | 12 | 15.8% |
| Total Housing Units | 76 | 100.0% |
Occupancy by Ownership by Household Size in Stronach
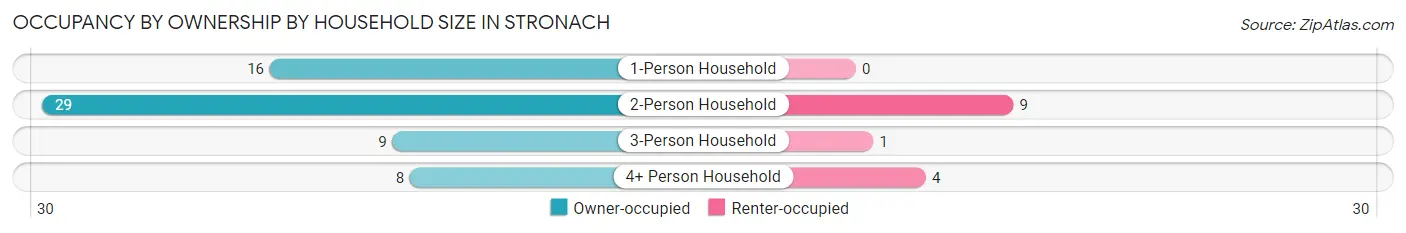
| Household Size | Owner-occupied | Renter-occupied |
| 1-Person Household | 16 (100.0%) | 0 (0.0%) |
| 2-Person Household | 29 (76.3%) | 9 (23.7%) |
| 3-Person Household | 9 (90.0%) | 1 (10.0%) |
| 4+ Person Household | 8 (66.7%) | 4 (33.3%) |
| Total Housing Units | 62 (81.6%) | 14 (18.4%) |
Occupancy by Educational Attainment in Stronach
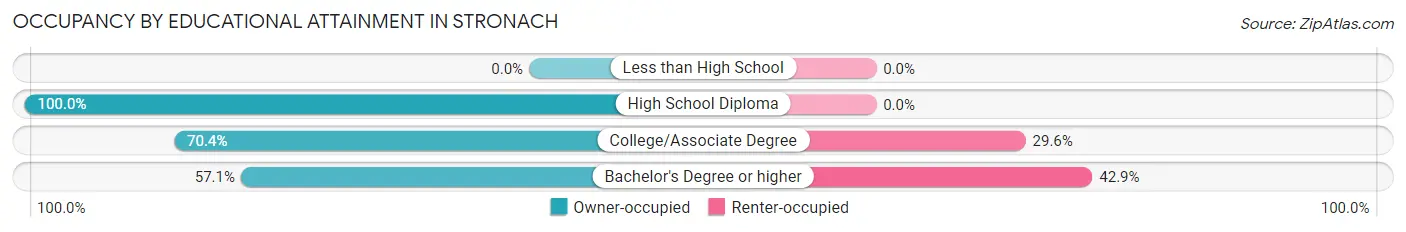
| Household Size | Owner-occupied | Renter-occupied |
| Less than High School | 0 (0.0%) | 0 (0.0%) |
| High School Diploma | 35 (100.0%) | 0 (0.0%) |
| College/Associate Degree | 19 (70.4%) | 8 (29.6%) |
| Bachelor's Degree or higher | 8 (57.1%) | 6 (42.9%) |
Occupancy by Age of Householder in Stronach
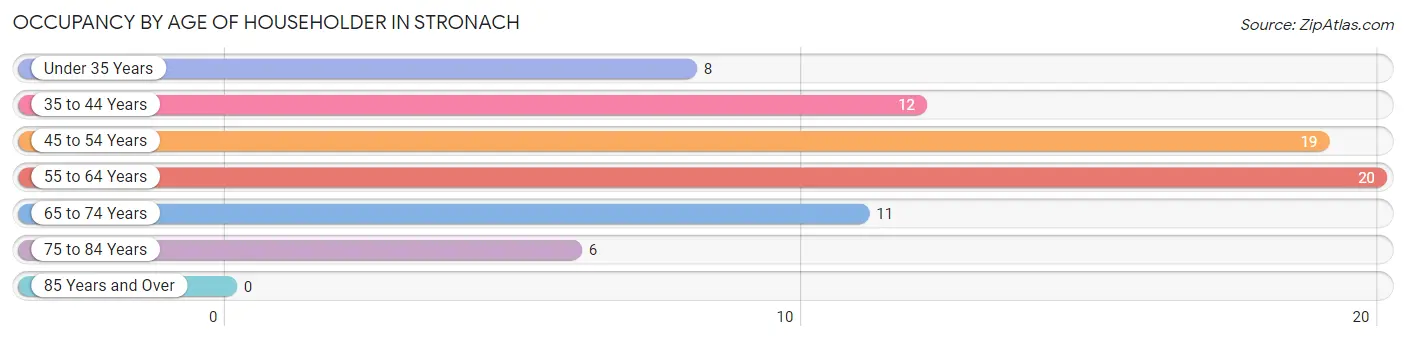
| Age Bracket | # Households | % Households |
| Under 35 Years | 8 | 10.5% |
| 35 to 44 Years | 12 | 15.8% |
| 45 to 54 Years | 19 | 25.0% |
| 55 to 64 Years | 20 | 26.3% |
| 65 to 74 Years | 11 | 14.5% |
| 75 to 84 Years | 6 | 7.9% |
| 85 Years and Over | 0 | 0.0% |
| Total | 76 | 100.0% |
Housing Finances in Stronach
Median Income by Occupancy in Stronach
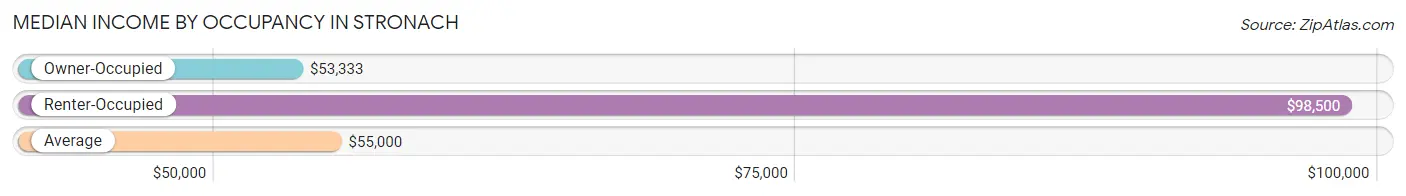
| Occupancy Type | # Households | Median Income |
| Owner-Occupied | 62 (81.6%) | $53,333 |
| Renter-Occupied | 14 (18.4%) | $98,500 |
| Average | 76 (100.0%) | $55,000 |
Occupancy by Householder Income Bracket in Stronach
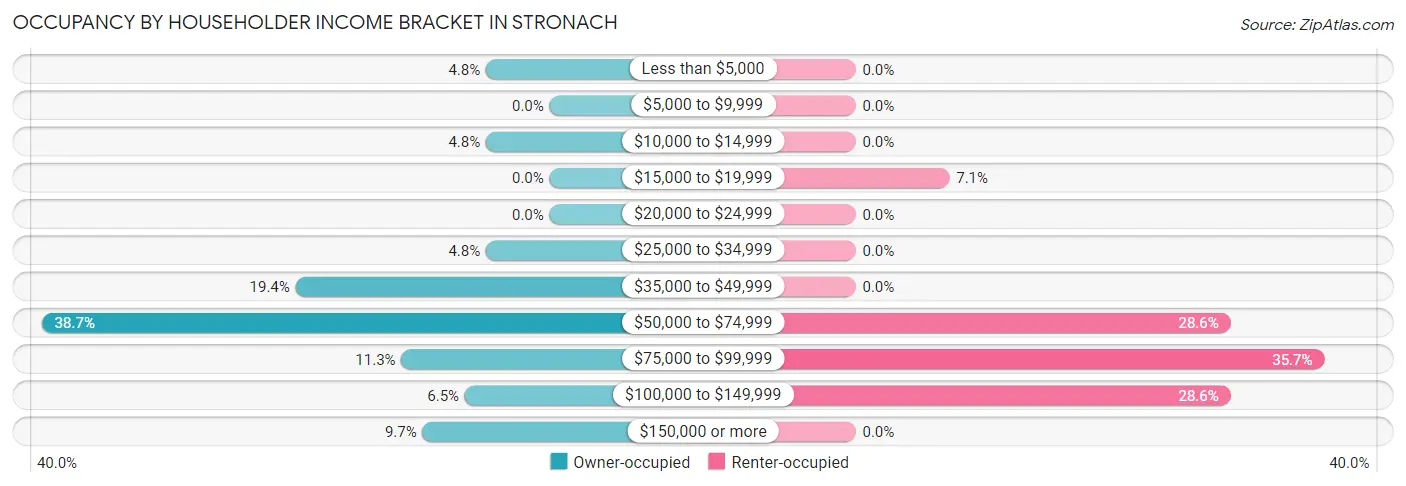
| Income Bracket | Owner-occupied | Renter-occupied |
| Less than $5,000 | 3 (4.8%) | 0 (0.0%) |
| $5,000 to $9,999 | 0 (0.0%) | 0 (0.0%) |
| $10,000 to $14,999 | 3 (4.8%) | 0 (0.0%) |
| $15,000 to $19,999 | 0 (0.0%) | 1 (7.1%) |
| $20,000 to $24,999 | 0 (0.0%) | 0 (0.0%) |
| $25,000 to $34,999 | 3 (4.8%) | 0 (0.0%) |
| $35,000 to $49,999 | 12 (19.4%) | 0 (0.0%) |
| $50,000 to $74,999 | 24 (38.7%) | 4 (28.6%) |
| $75,000 to $99,999 | 7 (11.3%) | 5 (35.7%) |
| $100,000 to $149,999 | 4 (6.5%) | 4 (28.6%) |
| $150,000 or more | 6 (9.7%) | 0 (0.0%) |
| Total | 62 (100.0%) | 14 (100.0%) |
Monthly Housing Cost Tiers in Stronach
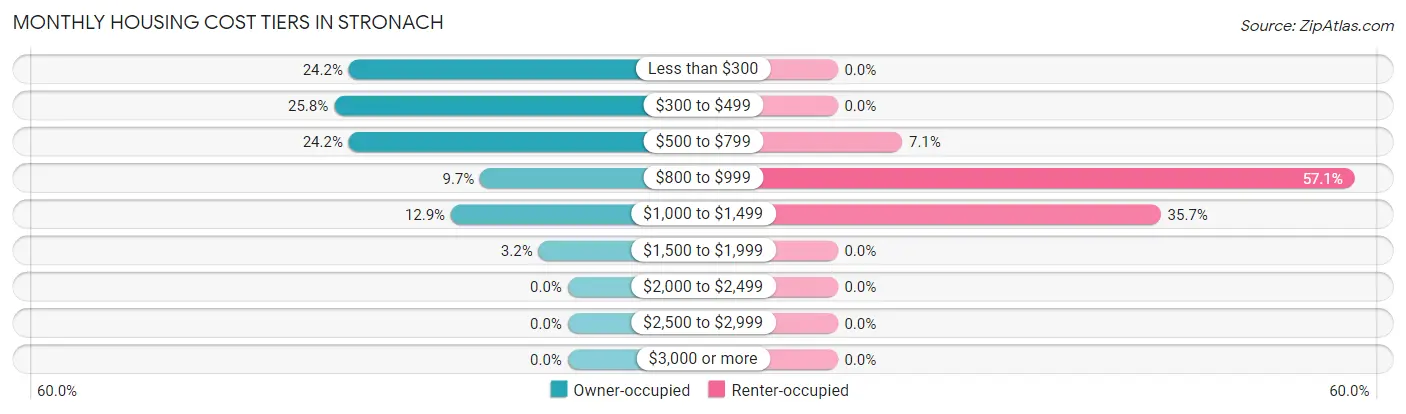
| Monthly Cost | Owner-occupied | Renter-occupied |
| Less than $300 | 15 (24.2%) | 0 (0.0%) |
| $300 to $499 | 16 (25.8%) | 0 (0.0%) |
| $500 to $799 | 15 (24.2%) | 1 (7.1%) |
| $800 to $999 | 6 (9.7%) | 8 (57.1%) |
| $1,000 to $1,499 | 8 (12.9%) | 5 (35.7%) |
| $1,500 to $1,999 | 2 (3.2%) | 0 (0.0%) |
| $2,000 to $2,499 | 0 (0.0%) | 0 (0.0%) |
| $2,500 to $2,999 | 0 (0.0%) | 0 (0.0%) |
| $3,000 or more | 0 (0.0%) | 0 (0.0%) |
| Total | 62 (100.0%) | 14 (100.0%) |
Physical Housing Characteristics in Stronach
Housing Structures in Stronach
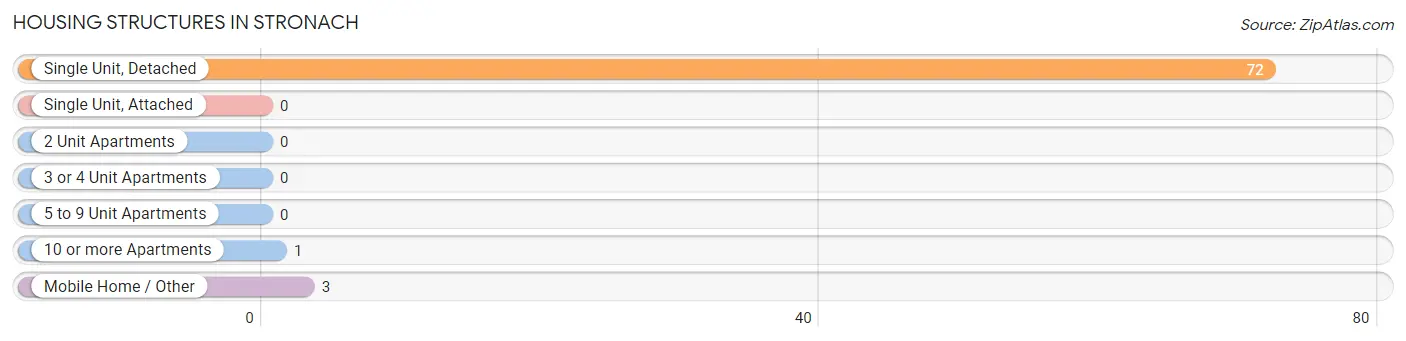
| Structure Type | # Housing Units | % Housing Units |
| Single Unit, Detached | 72 | 94.7% |
| Single Unit, Attached | 0 | 0.0% |
| 2 Unit Apartments | 0 | 0.0% |
| 3 or 4 Unit Apartments | 0 | 0.0% |
| 5 to 9 Unit Apartments | 0 | 0.0% |
| 10 or more Apartments | 1 | 1.3% |
| Mobile Home / Other | 3 | 4.0% |
| Total | 76 | 100.0% |
Housing Structures by Occupancy in Stronach
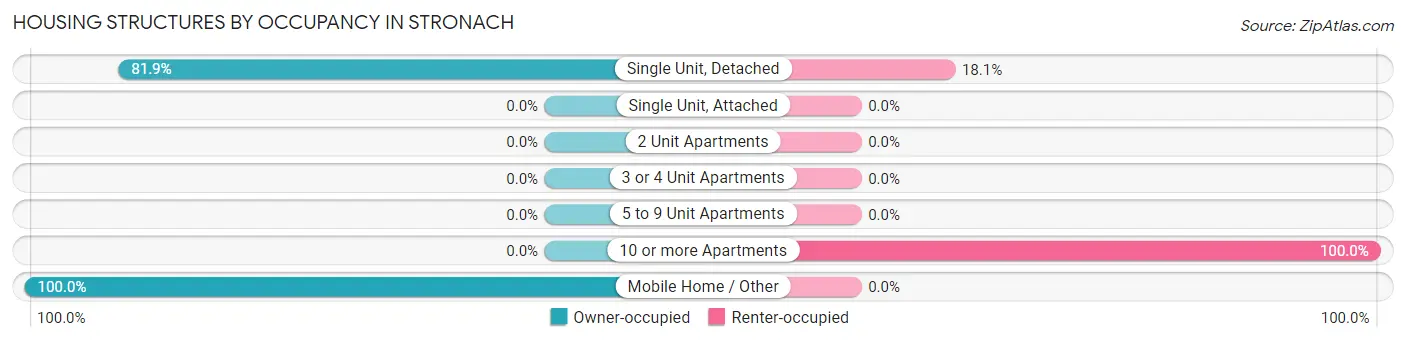
| Structure Type | Owner-occupied | Renter-occupied |
| Single Unit, Detached | 59 (81.9%) | 13 (18.1%) |
| Single Unit, Attached | 0 (0.0%) | 0 (0.0%) |
| 2 Unit Apartments | 0 (0.0%) | 0 (0.0%) |
| 3 or 4 Unit Apartments | 0 (0.0%) | 0 (0.0%) |
| 5 to 9 Unit Apartments | 0 (0.0%) | 0 (0.0%) |
| 10 or more Apartments | 0 (0.0%) | 1 (100.0%) |
| Mobile Home / Other | 3 (100.0%) | 0 (0.0%) |
| Total | 62 (81.6%) | 14 (18.4%) |
Housing Structures by Number of Rooms in Stronach
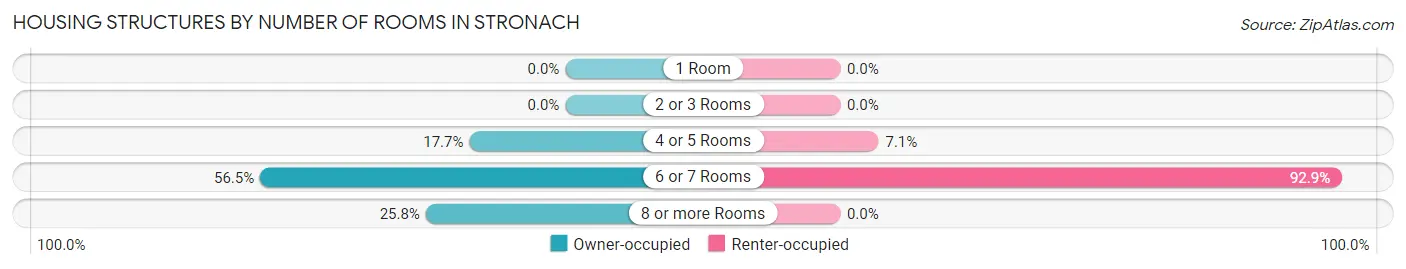
| Number of Rooms | Owner-occupied | Renter-occupied |
| 1 Room | 0 (0.0%) | 0 (0.0%) |
| 2 or 3 Rooms | 0 (0.0%) | 0 (0.0%) |
| 4 or 5 Rooms | 11 (17.7%) | 1 (7.1%) |
| 6 or 7 Rooms | 35 (56.5%) | 13 (92.9%) |
| 8 or more Rooms | 16 (25.8%) | 0 (0.0%) |
| Total | 62 (100.0%) | 14 (100.0%) |
Housing Structure by Heating Type in Stronach
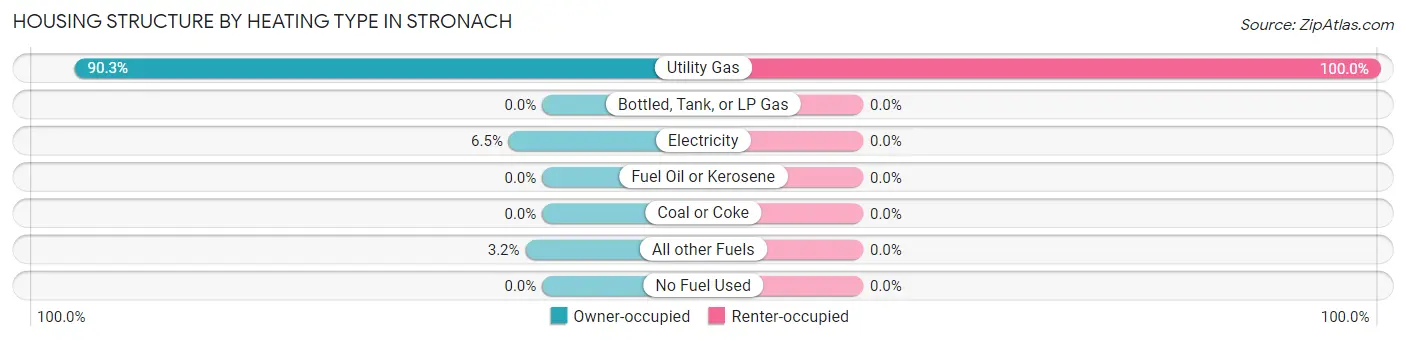
| Heating Type | Owner-occupied | Renter-occupied |
| Utility Gas | 56 (90.3%) | 14 (100.0%) |
| Bottled, Tank, or LP Gas | 0 (0.0%) | 0 (0.0%) |
| Electricity | 4 (6.5%) | 0 (0.0%) |
| Fuel Oil or Kerosene | 0 (0.0%) | 0 (0.0%) |
| Coal or Coke | 0 (0.0%) | 0 (0.0%) |
| All other Fuels | 2 (3.2%) | 0 (0.0%) |
| No Fuel Used | 0 (0.0%) | 0 (0.0%) |
| Total | 62 (100.0%) | 14 (100.0%) |
Household Vehicle Usage in Stronach
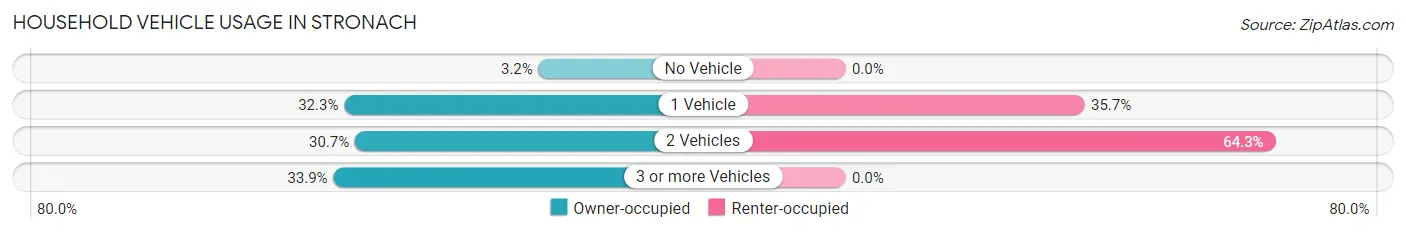
| Vehicles per Household | Owner-occupied | Renter-occupied |
| No Vehicle | 2 (3.2%) | 0 (0.0%) |
| 1 Vehicle | 20 (32.3%) | 5 (35.7%) |
| 2 Vehicles | 19 (30.6%) | 9 (64.3%) |
| 3 or more Vehicles | 21 (33.9%) | 0 (0.0%) |
| Total | 62 (100.0%) | 14 (100.0%) |
Real Estate & Mortgages in Stronach
Real Estate and Mortgage Overview in Stronach
| Characteristic | Without Mortgage | With Mortgage |
| Housing Units | 35 | 27 |
| Median Property Value | $97,700 | $131,300 |
| Median Household Income | $50,750 | $6 |
| Monthly Housing Costs | $375 | $0 |
| Real Estate Taxes | $1,233 | $4 |
Property Value by Mortgage Status in Stronach
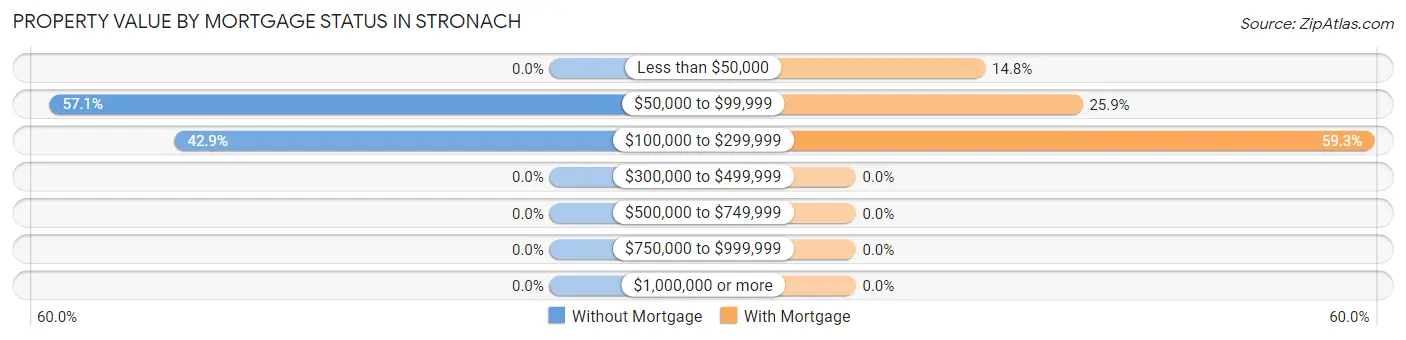
| Property Value | Without Mortgage | With Mortgage |
| Less than $50,000 | 0 (0.0%) | 4 (14.8%) |
| $50,000 to $99,999 | 20 (57.1%) | 7 (25.9%) |
| $100,000 to $299,999 | 15 (42.9%) | 16 (59.3%) |
| $300,000 to $499,999 | 0 (0.0%) | 0 (0.0%) |
| $500,000 to $749,999 | 0 (0.0%) | 0 (0.0%) |
| $750,000 to $999,999 | 0 (0.0%) | 0 (0.0%) |
| $1,000,000 or more | 0 (0.0%) | 0 (0.0%) |
| Total | 35 (100.0%) | 27 (100.0%) |
Household Income by Mortgage Status in Stronach
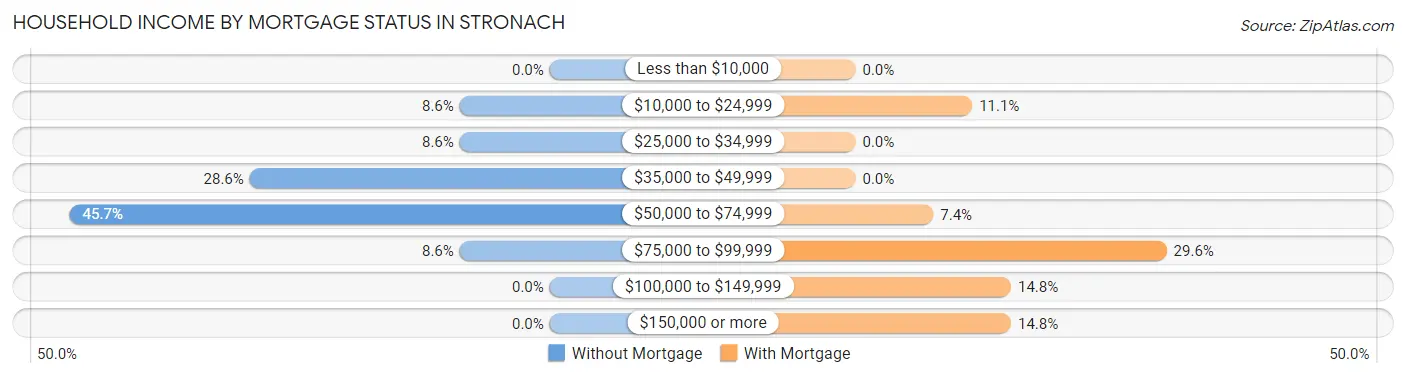
| Household Income | Without Mortgage | With Mortgage |
| Less than $10,000 | 0 (0.0%) | 0 (0.0%) |
| $10,000 to $24,999 | 3 (8.6%) | 3 (11.1%) |
| $25,000 to $34,999 | 3 (8.6%) | 0 (0.0%) |
| $35,000 to $49,999 | 10 (28.6%) | 0 (0.0%) |
| $50,000 to $74,999 | 16 (45.7%) | 2 (7.4%) |
| $75,000 to $99,999 | 3 (8.6%) | 8 (29.6%) |
| $100,000 to $149,999 | 0 (0.0%) | 4 (14.8%) |
| $150,000 or more | 0 (0.0%) | 4 (14.8%) |
| Total | 35 (100.0%) | 27 (100.0%) |
Property Value to Household Income Ratio in Stronach
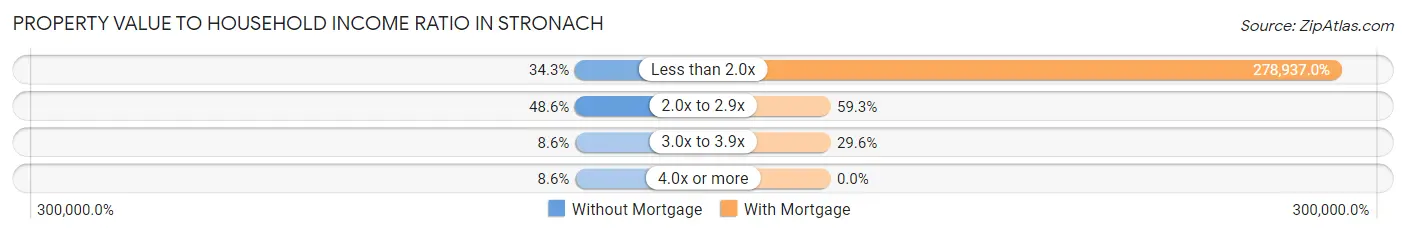
| Value-to-Income Ratio | Without Mortgage | With Mortgage |
| Less than 2.0x | 12 (34.3%) | 75,313 (278,937.0%) |
| 2.0x to 2.9x | 17 (48.6%) | 16 (59.3%) |
| 3.0x to 3.9x | 3 (8.6%) | 8 (29.6%) |
| 4.0x or more | 3 (8.6%) | 0 (0.0%) |
| Total | 35 (100.0%) | 27 (100.0%) |
Real Estate Taxes by Mortgage Status in Stronach
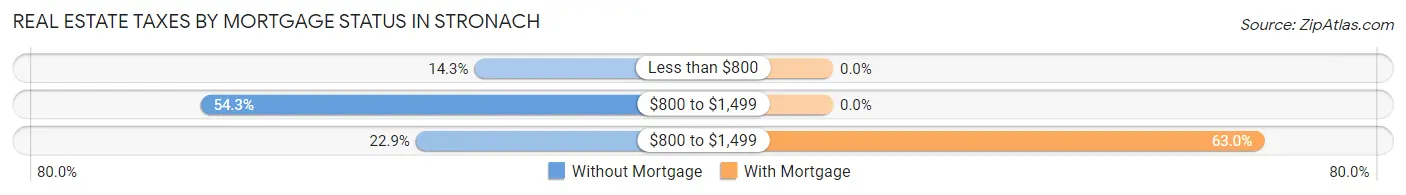
| Property Taxes | Without Mortgage | With Mortgage |
| Less than $800 | 5 (14.3%) | 0 (0.0%) |
| $800 to $1,499 | 19 (54.3%) | 0 (0.0%) |
| $800 to $1,499 | 8 (22.9%) | 17 (63.0%) |
| Total | 35 (100.0%) | 27 (100.0%) |
Health & Disability in Stronach
Health Insurance Coverage by Age in Stronach
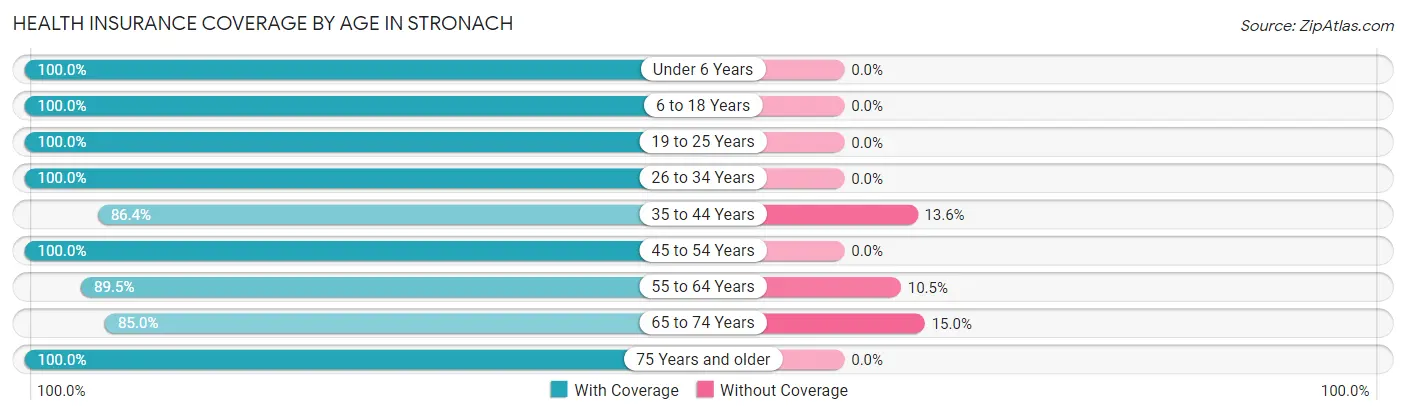
| Age Bracket | With Coverage | Without Coverage |
| Under 6 Years | 10 (100.0%) | 0 (0.0%) |
| 6 to 18 Years | 31 (100.0%) | 0 (0.0%) |
| 19 to 25 Years | 2 (100.0%) | 0 (0.0%) |
| 26 to 34 Years | 25 (100.0%) | 0 (0.0%) |
| 35 to 44 Years | 19 (86.4%) | 3 (13.6%) |
| 45 to 54 Years | 35 (100.0%) | 0 (0.0%) |
| 55 to 64 Years | 34 (89.5%) | 4 (10.5%) |
| 65 to 74 Years | 17 (85.0%) | 3 (15.0%) |
| 75 Years and older | 9 (100.0%) | 0 (0.0%) |
| Total | 182 (94.8%) | 10 (5.2%) |
Health Insurance Coverage by Citizenship Status in Stronach
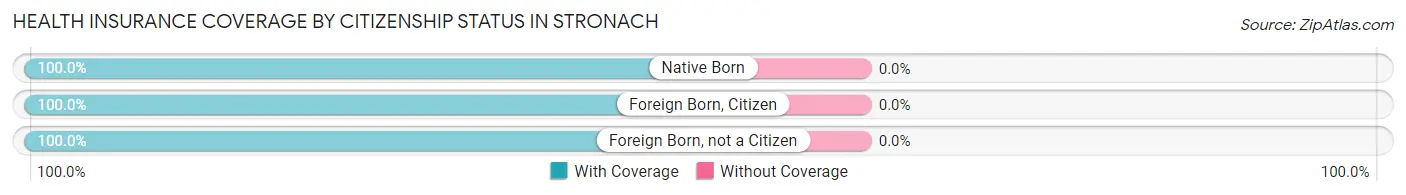
| Citizenship Status | With Coverage | Without Coverage |
| Native Born | 10 (100.0%) | 0 (0.0%) |
| Foreign Born, Citizen | 31 (100.0%) | 0 (0.0%) |
| Foreign Born, not a Citizen | 2 (100.0%) | 0 (0.0%) |
Health Insurance Coverage by Household Income in Stronach
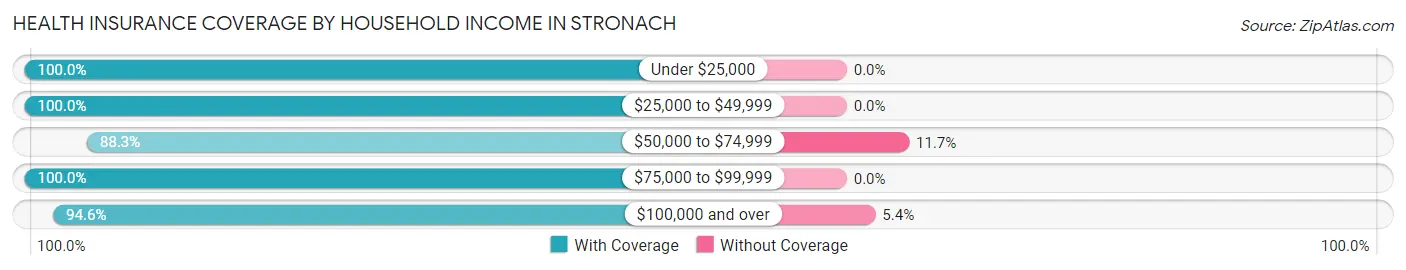
| Household Income | With Coverage | Without Coverage |
| Under $25,000 | 17 (100.0%) | 0 (0.0%) |
| $25,000 to $49,999 | 37 (100.0%) | 0 (0.0%) |
| $50,000 to $74,999 | 53 (88.3%) | 7 (11.7%) |
| $75,000 to $99,999 | 22 (100.0%) | 0 (0.0%) |
| $100,000 and over | 53 (94.6%) | 3 (5.4%) |
Public vs Private Health Insurance Coverage by Age in Stronach
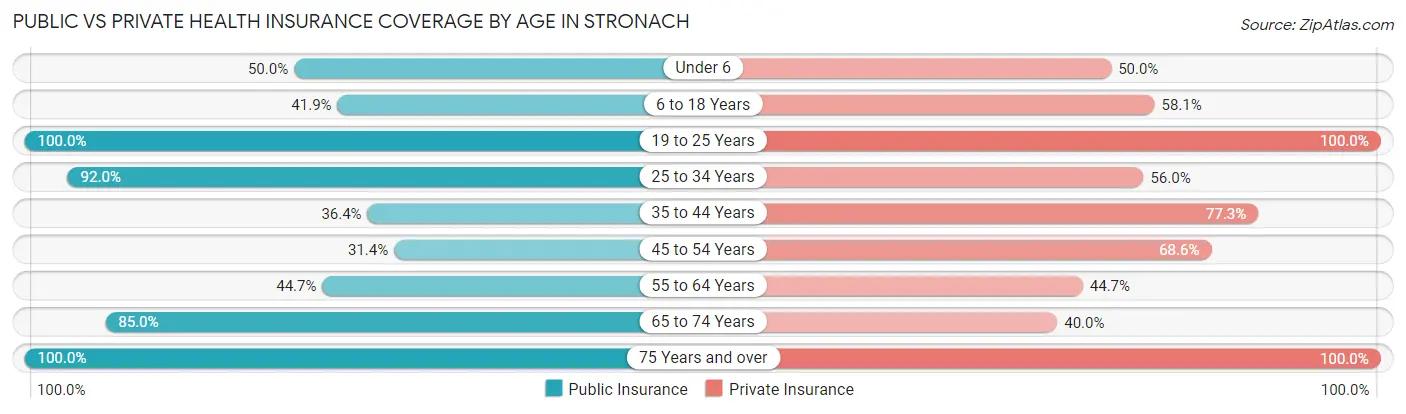
| Age Bracket | Public Insurance | Private Insurance |
| Under 6 | 5 (50.0%) | 5 (50.0%) |
| 6 to 18 Years | 13 (41.9%) | 18 (58.1%) |
| 19 to 25 Years | 2 (100.0%) | 2 (100.0%) |
| 25 to 34 Years | 23 (92.0%) | 14 (56.0%) |
| 35 to 44 Years | 8 (36.4%) | 17 (77.3%) |
| 45 to 54 Years | 11 (31.4%) | 24 (68.6%) |
| 55 to 64 Years | 17 (44.7%) | 17 (44.7%) |
| 65 to 74 Years | 17 (85.0%) | 8 (40.0%) |
| 75 Years and over | 9 (100.0%) | 9 (100.0%) |
| Total | 105 (54.7%) | 114 (59.4%) |
Disability Status by Sex by Age in Stronach
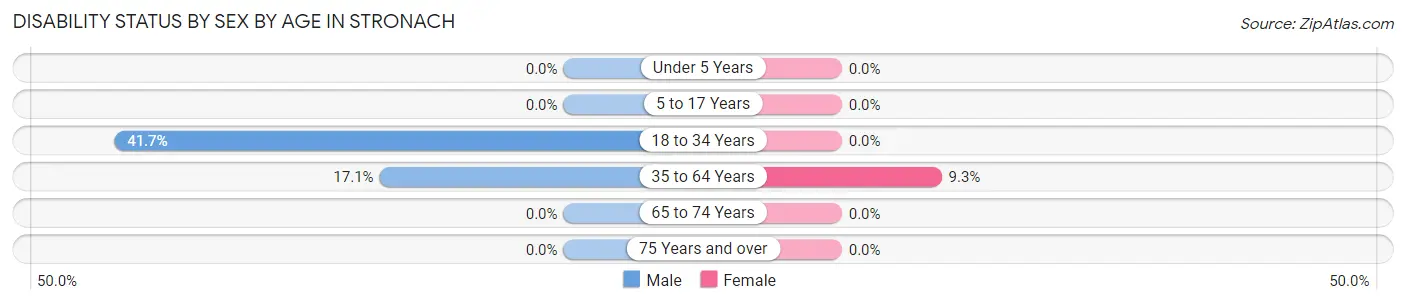
| Age Bracket | Male | Female |
| Under 5 Years | 0 (0.0%) | 0 (0.0%) |
| 5 to 17 Years | 0 (0.0%) | 0 (0.0%) |
| 18 to 34 Years | 5 (41.7%) | 0 (0.0%) |
| 35 to 64 Years | 7 (17.1%) | 5 (9.3%) |
| 65 to 74 Years | 0 (0.0%) | 0 (0.0%) |
| 75 Years and over | 0 (0.0%) | 0 (0.0%) |
Disability Class by Sex by Age in Stronach
Disability Class: Hearing Difficulty
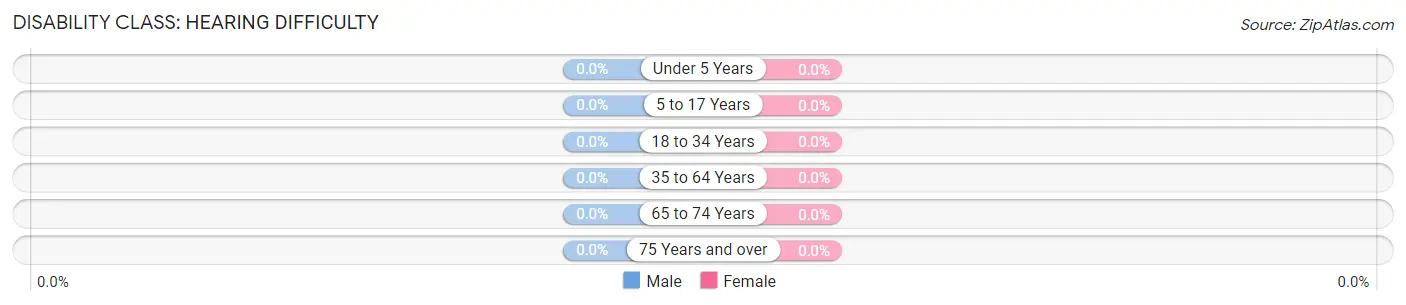
| Age Bracket | Male | Female |
| Under 5 Years | 0 (0.0%) | 0 (0.0%) |
| 5 to 17 Years | 0 (0.0%) | 0 (0.0%) |
| 18 to 34 Years | 0 (0.0%) | 0 (0.0%) |
| 35 to 64 Years | 0 (0.0%) | 0 (0.0%) |
| 65 to 74 Years | 0 (0.0%) | 0 (0.0%) |
| 75 Years and over | 0 (0.0%) | 0 (0.0%) |
Disability Class: Vision Difficulty
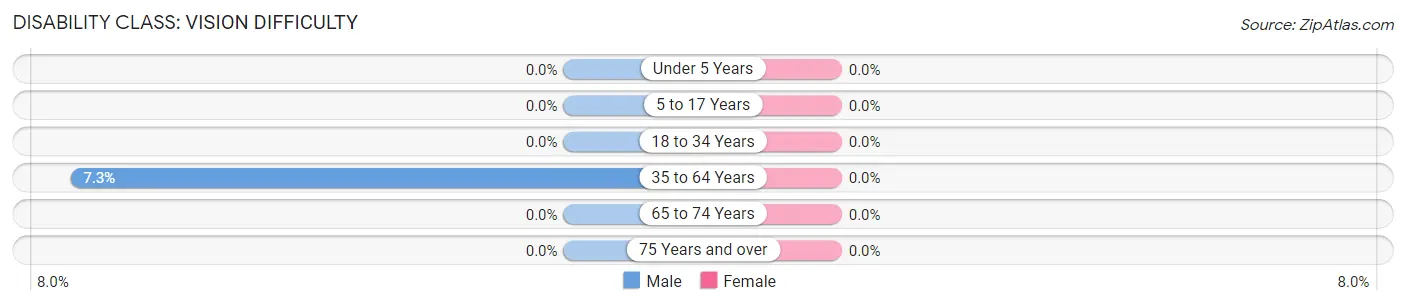
| Age Bracket | Male | Female |
| Under 5 Years | 0 (0.0%) | 0 (0.0%) |
| 5 to 17 Years | 0 (0.0%) | 0 (0.0%) |
| 18 to 34 Years | 0 (0.0%) | 0 (0.0%) |
| 35 to 64 Years | 3 (7.3%) | 0 (0.0%) |
| 65 to 74 Years | 0 (0.0%) | 0 (0.0%) |
| 75 Years and over | 0 (0.0%) | 0 (0.0%) |
Disability Class: Cognitive Difficulty
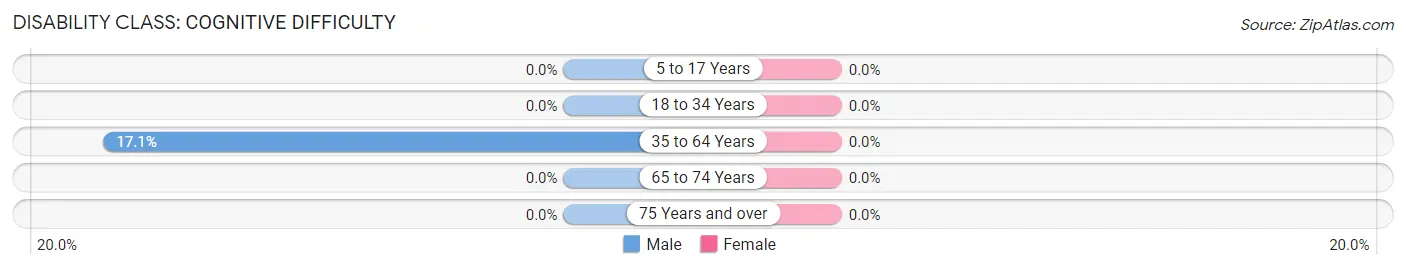
| Age Bracket | Male | Female |
| 5 to 17 Years | 0 (0.0%) | 0 (0.0%) |
| 18 to 34 Years | 0 (0.0%) | 0 (0.0%) |
| 35 to 64 Years | 7 (17.1%) | 0 (0.0%) |
| 65 to 74 Years | 0 (0.0%) | 0 (0.0%) |
| 75 Years and over | 0 (0.0%) | 0 (0.0%) |
Disability Class: Ambulatory Difficulty
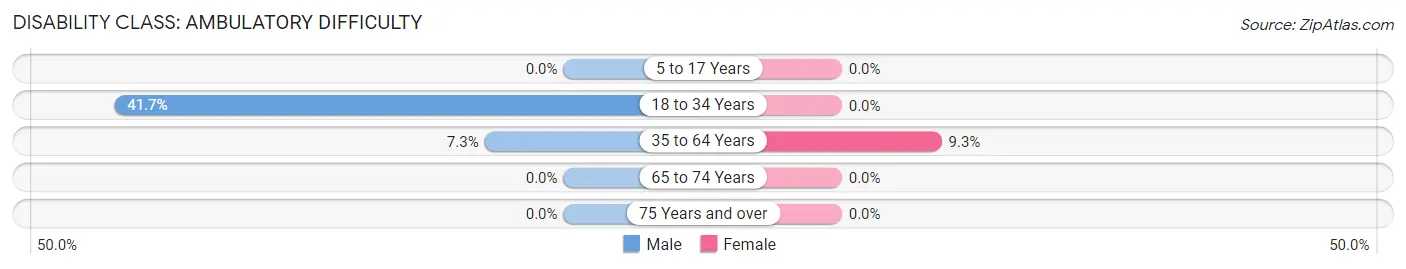
| Age Bracket | Male | Female |
| 5 to 17 Years | 0 (0.0%) | 0 (0.0%) |
| 18 to 34 Years | 5 (41.7%) | 0 (0.0%) |
| 35 to 64 Years | 3 (7.3%) | 5 (9.3%) |
| 65 to 74 Years | 0 (0.0%) | 0 (0.0%) |
| 75 Years and over | 0 (0.0%) | 0 (0.0%) |
Disability Class: Self-Care Difficulty

| Age Bracket | Male | Female |
| 5 to 17 Years | 0 (0.0%) | 0 (0.0%) |
| 18 to 34 Years | 5 (41.7%) | 0 (0.0%) |
| 35 to 64 Years | 3 (7.3%) | 5 (9.3%) |
| 65 to 74 Years | 0 (0.0%) | 0 (0.0%) |
| 75 Years and over | 0 (0.0%) | 0 (0.0%) |
Technology Access in Stronach
Computing Device Access in Stronach
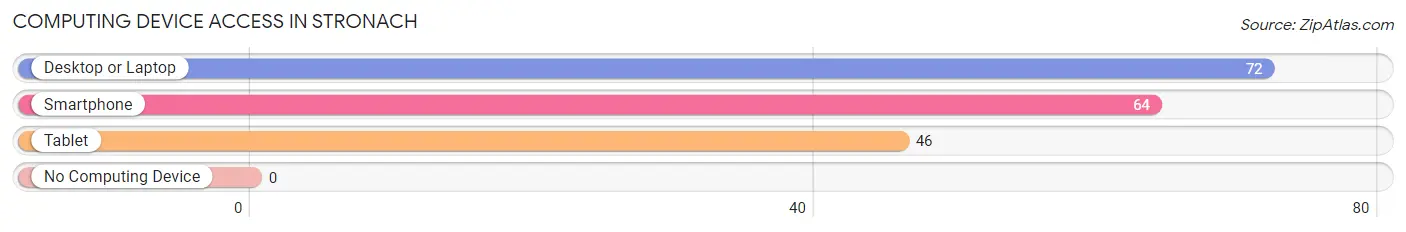
| Device Type | # Households | % Households |
| Desktop or Laptop | 72 | 94.7% |
| Smartphone | 64 | 84.2% |
| Tablet | 46 | 60.5% |
| No Computing Device | 0 | 0.0% |
| Total | 76 | 100.0% |
Internet Access in Stronach
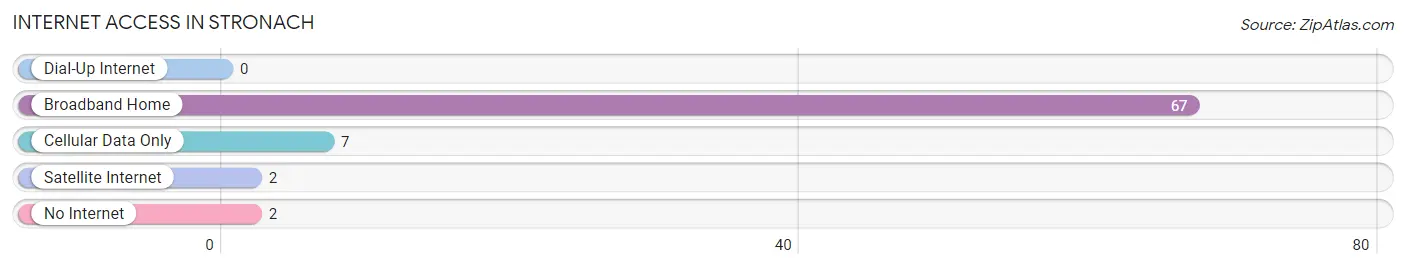
| Internet Type | # Households | % Households |
| Dial-Up Internet | 0 | 0.0% |
| Broadband Home | 67 | 88.2% |
| Cellular Data Only | 7 | 9.2% |
| Satellite Internet | 2 | 2.6% |
| No Internet | 2 | 2.6% |
| Total | 76 | 100.0% |
Stronach Summary
Stronach is a small unincorporated community located in Manistee County, Michigan. It is situated in the northwest corner of the county, approximately 10 miles south of the city of Manistee. The community is located on the Manistee River, which is a major tributary of Lake Michigan. Stronach is surrounded by the Manistee National Forest and is home to a variety of wildlife, including deer, bear, and other small mammals.
History
Stronach was first settled in the late 1800s by a group of Finnish immigrants. The settlers were attracted to the area due to its abundance of natural resources, including timber and fish. The community was named after a local lumberman, John Stronach, who owned a sawmill in the area. The sawmill was the primary source of employment for the early settlers.
In the early 1900s, Stronach began to grow as a logging and fishing community. The Manistee River was a major source of income for the community, as it provided an abundance of fish and other aquatic life. The river also provided a means of transportation for the settlers, as they were able to use it to transport logs and other goods to nearby towns.
In the mid-1900s, Stronach began to experience a decline in population as the logging industry began to decline. The sawmill closed in the 1950s, and many of the residents moved away in search of employment. The population of Stronach has remained relatively stable since then, with a population of approximately 200 people in 2020.
Geography
Stronach is located in the northwest corner of Manistee County, approximately 10 miles south of the city of Manistee. The community is situated on the Manistee River, which is a major tributary of Lake Michigan. The area is surrounded by the Manistee National Forest, which is home to a variety of wildlife, including deer, bear, and other small mammals.
The terrain of Stronach is mostly flat, with some rolling hills. The area is heavily forested, with a mix of hardwood and coniferous trees. The climate of the area is generally mild, with cold winters and warm summers.
Economy
The economy of Stronach is largely based on tourism and recreation. The area is home to several campgrounds, fishing spots, and other outdoor recreational activities. The Manistee River is a popular destination for fishing, canoeing, and kayaking. The area is also home to several small businesses, including a general store, a gas station, and a restaurant.
Demographics
As of the 2010 census, the population of Stronach was approximately 200 people. The racial makeup of the community was 97.5% White, 0.5% African American, 0.5% Native American, and 1.5% from other races. The median household income was $37,500, and the median age was 44 years. The majority of the population was employed in the tourism and recreation industry.
Common Questions
What is Per Capita Income in Stronach?
Per Capita income in Stronach is $29,147.
What is the Median Family Income in Stronach?
Median Family Income in Stronach is $53,333.
What is the Median Household income in Stronach?
Median Household Income in Stronach is $55,000.
What is Income or Wage Gap in Stronach?
Income or Wage Gap in Stronach is 25.6%.
Women in Stronach earn 74.4 cents for every dollar earned by a man.
What is Inequality or Gini Index in Stronach?
Inequality or Gini Index in Stronach is 0.33.
What is the Total Population of Stronach?
Total Population of Stronach is 192.
What is the Total Male Population of Stronach?
Total Male Population of Stronach is 74.
What is the Total Female Population of Stronach?
Total Female Population of Stronach is 118.
What is the Ratio of Males per 100 Females in Stronach?
There are 62.71 Males per 100 Females in Stronach.
What is the Ratio of Females per 100 Males in Stronach?
There are 159.46 Females per 100 Males in Stronach.
What is the Median Population Age in Stronach?
Median Population Age in Stronach is 46.5 Years.
What is the Average Family Size in Stronach
Average Family Size in Stronach is 2.6 People.
What is the Average Household Size in Stronach
Average Household Size in Stronach is 2.5 People.
How Large is the Labor Force in Stronach?
There are 96 People in the Labor Forcein in Stronach.
What is the Percentage of People in the Labor Force in Stronach?
62.3% of People are in the Labor Force in Stronach.