Wolf Lake, MI Map & Demographics
Wolf Lake Map
Wolf Lake Overview
$22,800
PER CAPITA INCOME
$51,375
AVG FAMILY INCOME
$48,836
AVG HOUSEHOLD INCOME
42.8%
WAGE / INCOME GAP [ % ]
57.2¢/ $1
WAGE / INCOME GAP [ $ ]
0.39
INEQUALITY / GINI INDEX
4,128
TOTAL POPULATION
2,061
MALE POPULATION
2,067
FEMALE POPULATION
99.71
MALES / 100 FEMALES
100.29
FEMALES / 100 MALES
38.0
MEDIAN AGE
3.2
AVG FAMILY SIZE
2.6
AVG HOUSEHOLD SIZE
2,018
LABOR FORCE [ PEOPLE ]
60.5%
PERCENT IN LABOR FORCE
10.8%
UNEMPLOYMENT RATE
Income in Wolf Lake
Income Overview in Wolf Lake
Per Capita Income in Wolf Lake is $22,800, while median incomes of families and households are $51,375 and $48,836 respectively.
| Characteristic | Number | Measure |
| Per Capita Income | 4,128 | $22,800 |
| Median Family Income | 967 | $51,375 |
| Mean Family Income | 967 | $65,730 |
| Median Household Income | 1,569 | $48,836 |
| Mean Household Income | 1,569 | $58,833 |
| Income Deficit | 967 | $0 |
| Wage / Income Gap (%) | 4,128 | 42.80% |
| Wage / Income Gap ($) | 4,128 | 57.20¢ per $1 |
| Gini / Inequality Index | 4,128 | 0.39 |
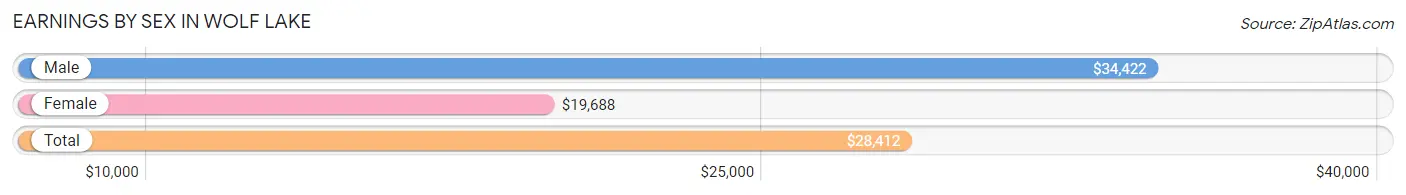
Earnings by Sex in Wolf Lake
Average Earnings in Wolf Lake are $28,412, $34,422 for men and $19,688 for women, a difference of 42.8%.
| Sex | Number | Average Earnings |
| Male | 1,109 (54.4%) | $34,422 |
| Female | 931 (45.6%) | $19,688 |
| Total | 2,040 (100.0%) | $28,412 |
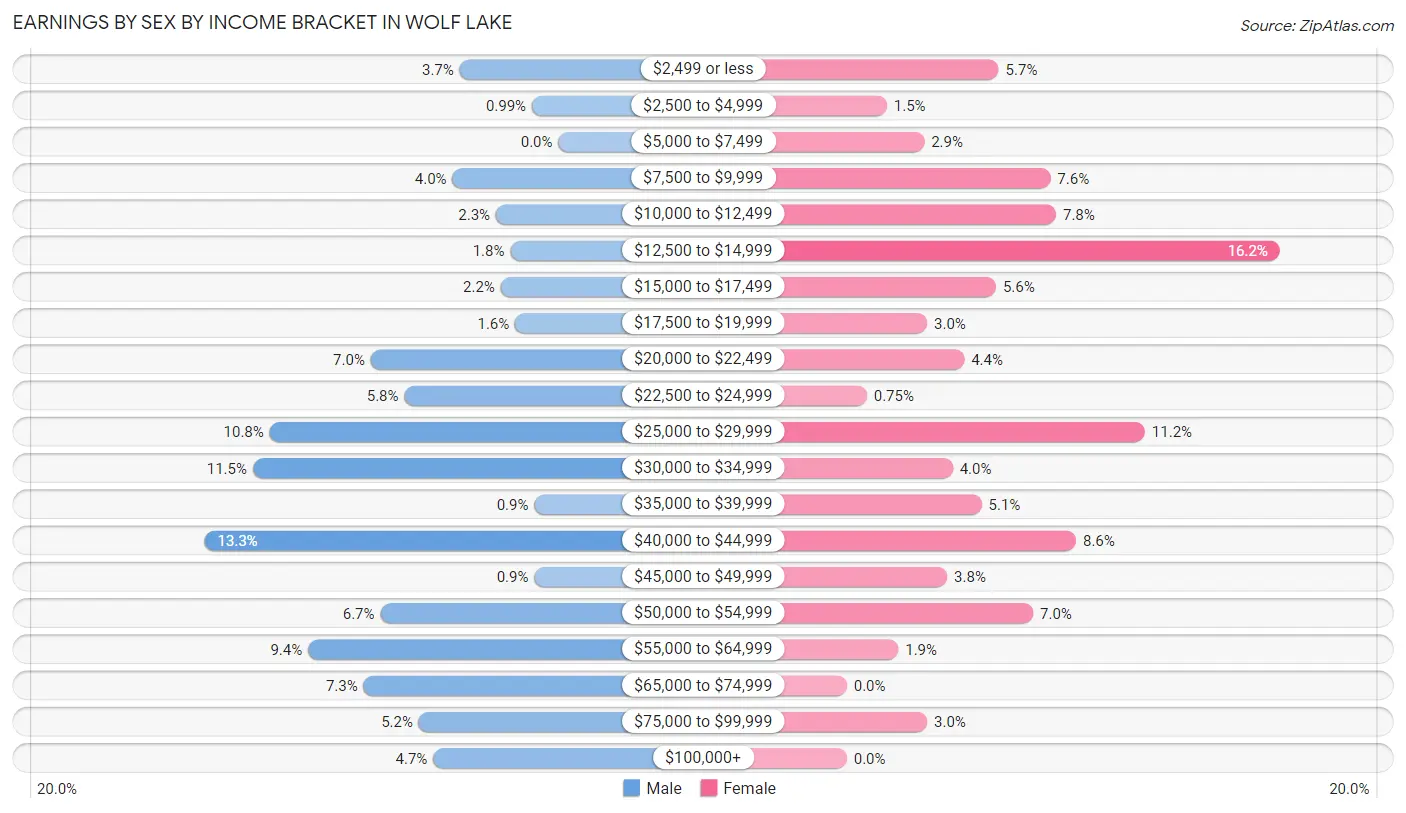
Earnings by Sex by Income Bracket in Wolf Lake
The most common earnings brackets in Wolf Lake are $40,000 to $44,999 for men (147 | 13.3%) and $12,500 to $14,999 for women (151 | 16.2%).
| Income | Male | Female |
| $2,499 or less | 41 (3.7%) | 53 (5.7%) |
| $2,500 to $4,999 | 11 (1.0%) | 14 (1.5%) |
| $5,000 to $7,499 | 0 (0.0%) | 27 (2.9%) |
| $7,500 to $9,999 | 44 (4.0%) | 71 (7.6%) |
| $10,000 to $12,499 | 26 (2.3%) | 73 (7.8%) |
| $12,500 to $14,999 | 20 (1.8%) | 151 (16.2%) |
| $15,000 to $17,499 | 24 (2.2%) | 52 (5.6%) |
| $17,500 to $19,999 | 18 (1.6%) | 28 (3.0%) |
| $20,000 to $22,499 | 78 (7.0%) | 41 (4.4%) |
| $22,500 to $24,999 | 64 (5.8%) | 7 (0.7%) |
| $25,000 to $29,999 | 120 (10.8%) | 104 (11.2%) |
| $30,000 to $34,999 | 127 (11.5%) | 37 (4.0%) |
| $35,000 to $39,999 | 10 (0.9%) | 47 (5.1%) |
| $40,000 to $44,999 | 147 (13.3%) | 80 (8.6%) |
| $45,000 to $49,999 | 10 (0.9%) | 35 (3.8%) |
| $50,000 to $54,999 | 74 (6.7%) | 65 (7.0%) |
| $55,000 to $64,999 | 104 (9.4%) | 18 (1.9%) |
| $65,000 to $74,999 | 81 (7.3%) | 0 (0.0%) |
| $75,000 to $99,999 | 58 (5.2%) | 28 (3.0%) |
| $100,000+ | 52 (4.7%) | 0 (0.0%) |
| Total | 1,109 (100.0%) | 931 (100.0%) |
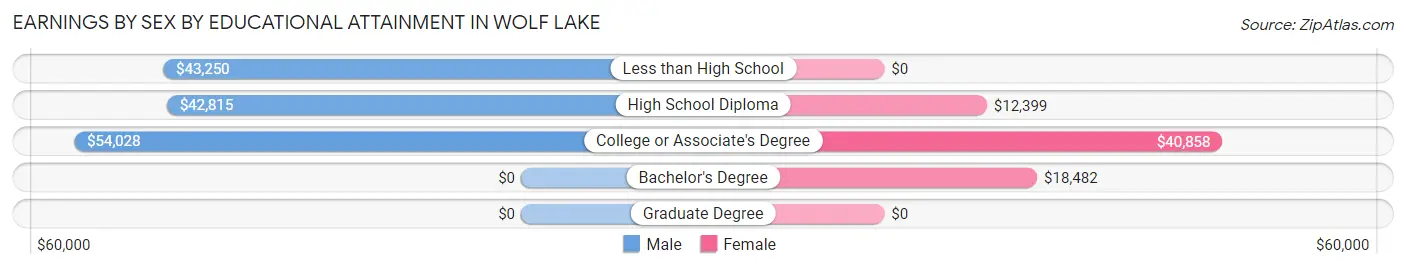
Earnings by Sex by Educational Attainment in Wolf Lake
Average earnings in Wolf Lake are $43,655 for men and $28,333 for women, a difference of 35.1%. Men with an educational attainment of college or associate's degree enjoy the highest average annual earnings of $54,028, while those with high school diploma education earn the least with $42,815. Women with an educational attainment of college or associate's degree earn the most with the average annual earnings of $40,858, while those with high school diploma education have the smallest earnings of $12,399.
| Educational Attainment | Male Income | Female Income |
| Less than High School | $43,250 | $0 |
| High School Diploma | $42,815 | $12,399 |
| College or Associate's Degree | $54,028 | $40,858 |
| Bachelor's Degree | - | - |
| Graduate Degree | - | - |
| Total | $43,655 | $28,333 |
Family Income in Wolf Lake
Family Income Brackets in Wolf Lake
According to the Wolf Lake family income data, there are 274 families falling into the $25,000 to $34,999 income range, which is the most common income bracket and makes up 28.3% of all families. Conversely, the $10,000 to $14,999 income bracket is the least frequent group with only 10 families (1.0%) belonging to this category.
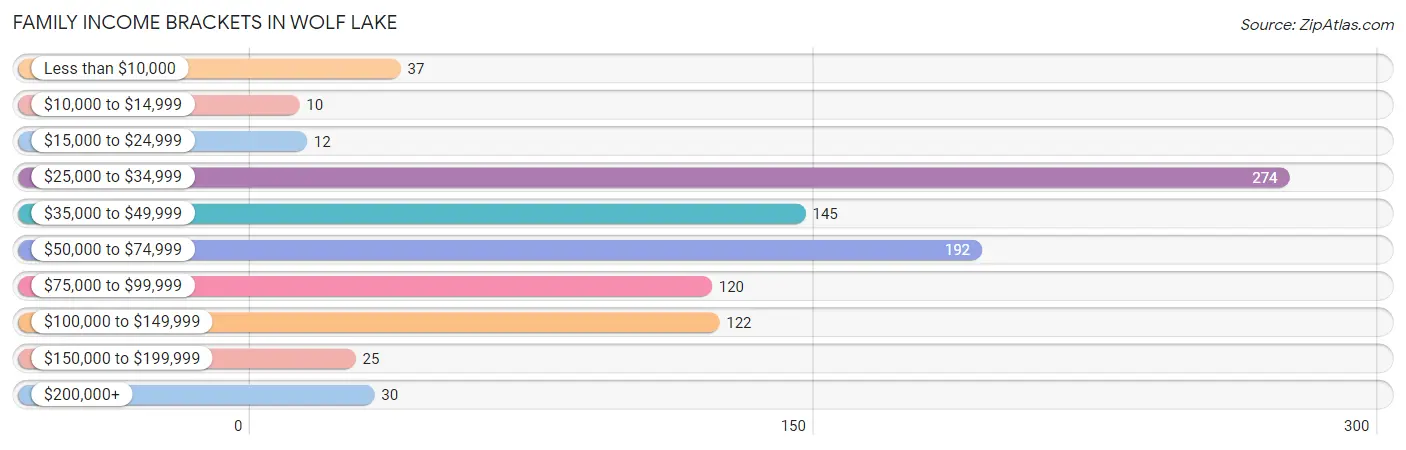
| Income Bracket | # Families | % Families |
| Less than $10,000 | 37 | 3.8% |
| $10,000 to $14,999 | 10 | 1.0% |
| $15,000 to $24,999 | 12 | 1.2% |
| $25,000 to $34,999 | 274 | 28.3% |
| $35,000 to $49,999 | 145 | 15.0% |
| $50,000 to $74,999 | 192 | 19.9% |
| $75,000 to $99,999 | 120 | 12.4% |
| $100,000 to $149,999 | 122 | 12.6% |
| $150,000 to $199,999 | 25 | 2.6% |
| $200,000+ | 30 | 3.1% |
Family Income by Famaliy Size in Wolf Lake
2-person families (358 | 37.0%) account for the highest median family income in Wolf Lake with $61,698 per family, while 2-person families (358 | 37.0%) have the highest median income of $30,849 per family member.
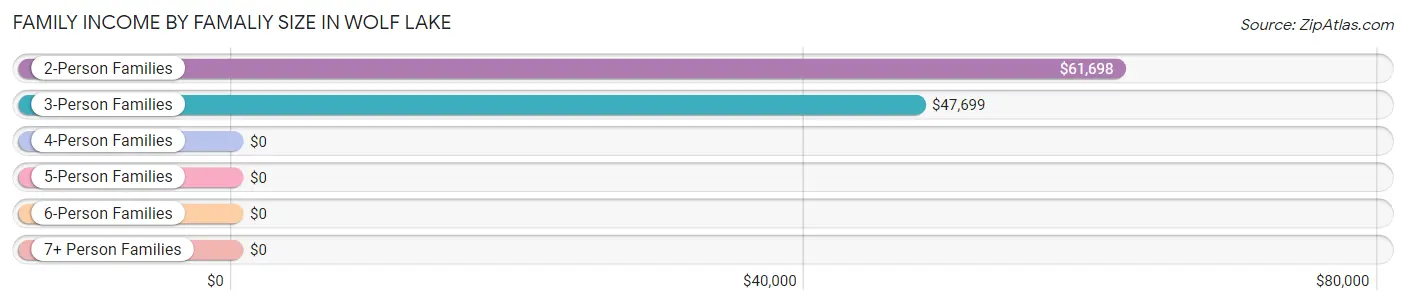
| Income Bracket | # Families | Median Income |
| 2-Person Families | 358 (37.0%) | $61,698 |
| 3-Person Families | 183 (18.9%) | $47,699 |
| 4-Person Families | 336 (34.7%) | $0 |
| 5-Person Families | 76 (7.9%) | $0 |
| 6-Person Families | 14 (1.5%) | $0 |
| 7+ Person Families | 0 (0.0%) | $0 |
| Total | 967 (100.0%) | $51,375 |
Family Income by Number of Earners in Wolf Lake
The median family income in Wolf Lake is $51,375, with families comprising 3+ earners (109) having the highest median family income of $97,250, while families with no earners (226) have the lowest median family income of $33,807, accounting for 11.3% and 23.4% of families, respectively.
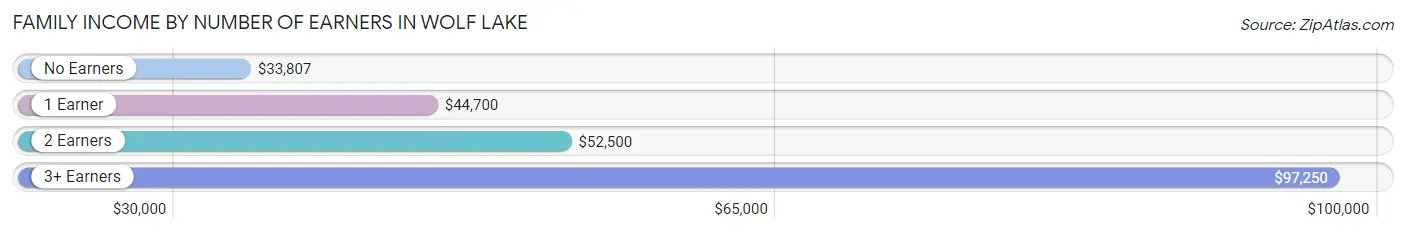
| Number of Earners | # Families | Median Income |
| No Earners | 226 (23.4%) | $33,807 |
| 1 Earner | 284 (29.4%) | $44,700 |
| 2 Earners | 348 (36.0%) | $52,500 |
| 3+ Earners | 109 (11.3%) | $97,250 |
| Total | 967 (100.0%) | $51,375 |
Household Income in Wolf Lake
Household Income Brackets in Wolf Lake
With 326 households falling in the category, the $25,000 to $34,999 income range is the most frequent in Wolf Lake, accounting for 20.8% of all households. In contrast, only 30 households (1.9%) fall into the $200,000+ income bracket, making it the least populous group.
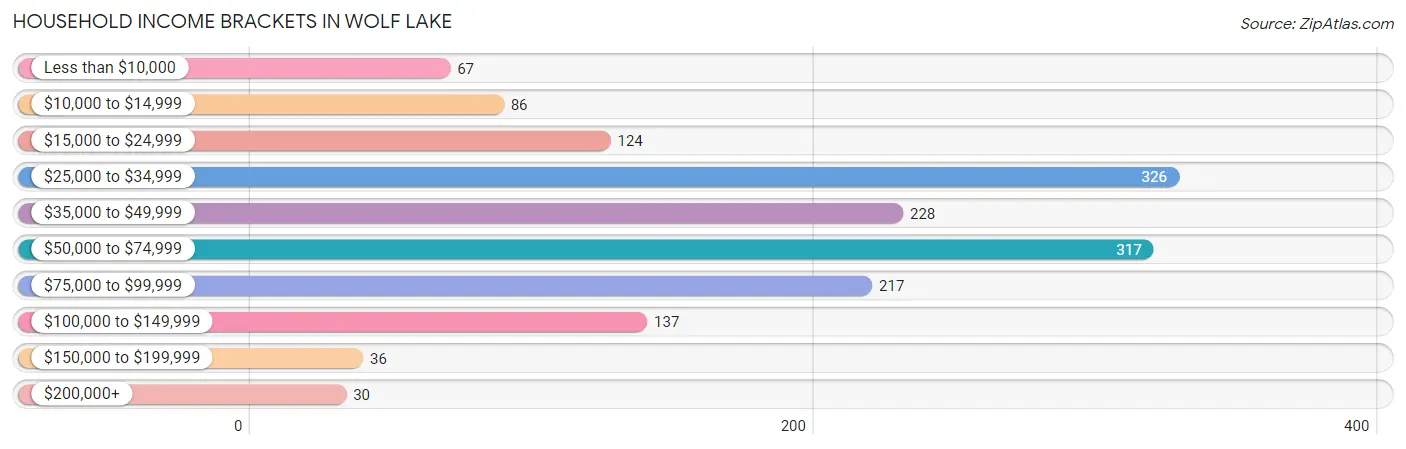
| Income Bracket | # Households | % Households |
| Less than $10,000 | 67 | 4.3% |
| $10,000 to $14,999 | 86 | 5.5% |
| $15,000 to $24,999 | 124 | 7.9% |
| $25,000 to $34,999 | 326 | 20.8% |
| $35,000 to $49,999 | 228 | 14.5% |
| $50,000 to $74,999 | 317 | 20.2% |
| $75,000 to $99,999 | 217 | 13.8% |
| $100,000 to $149,999 | 137 | 8.7% |
| $150,000 to $199,999 | 36 | 2.3% |
| $200,000+ | 30 | 1.9% |
Household Income by Householder Age in Wolf Lake
The median household income in Wolf Lake is $48,836, with the highest median household income of $66,930 found in the 25 to 44 years age bracket for the primary householder. A total of 450 households (28.7%) fall into this category. Meanwhile, the 15 to 24 years age bracket for the primary householder has the lowest median household income of $0, with 67 households (4.3%) in this group.
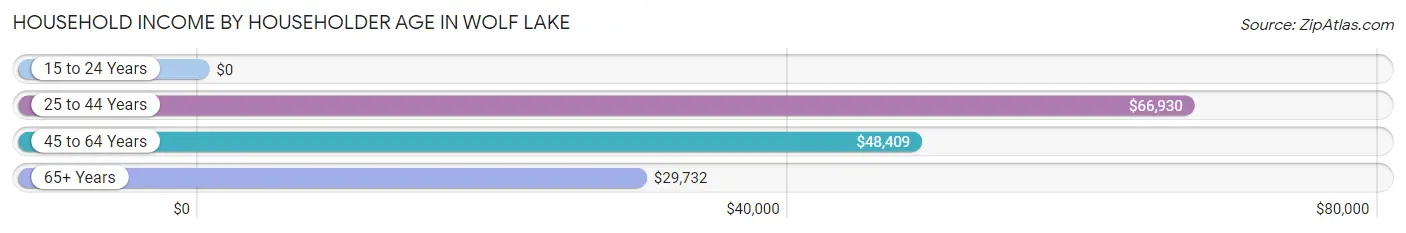
| Income Bracket | # Households | Median Income |
| 15 to 24 Years | 67 (4.3%) | $0 |
| 25 to 44 Years | 450 (28.7%) | $66,930 |
| 45 to 64 Years | 688 (43.9%) | $48,409 |
| 65+ Years | 364 (23.2%) | $29,732 |
| Total | 1,569 (100.0%) | $48,836 |
Poverty in Wolf Lake
Income Below Poverty by Sex and Age in Wolf Lake
With 13.8% poverty level for males and 14.2% for females among the residents of Wolf Lake, 16 and 17 year old males and under 5 year old females are the most vulnerable to poverty, with 16 males (37.2%) and 23 females (34.3%) in their respective age groups living below the poverty level.
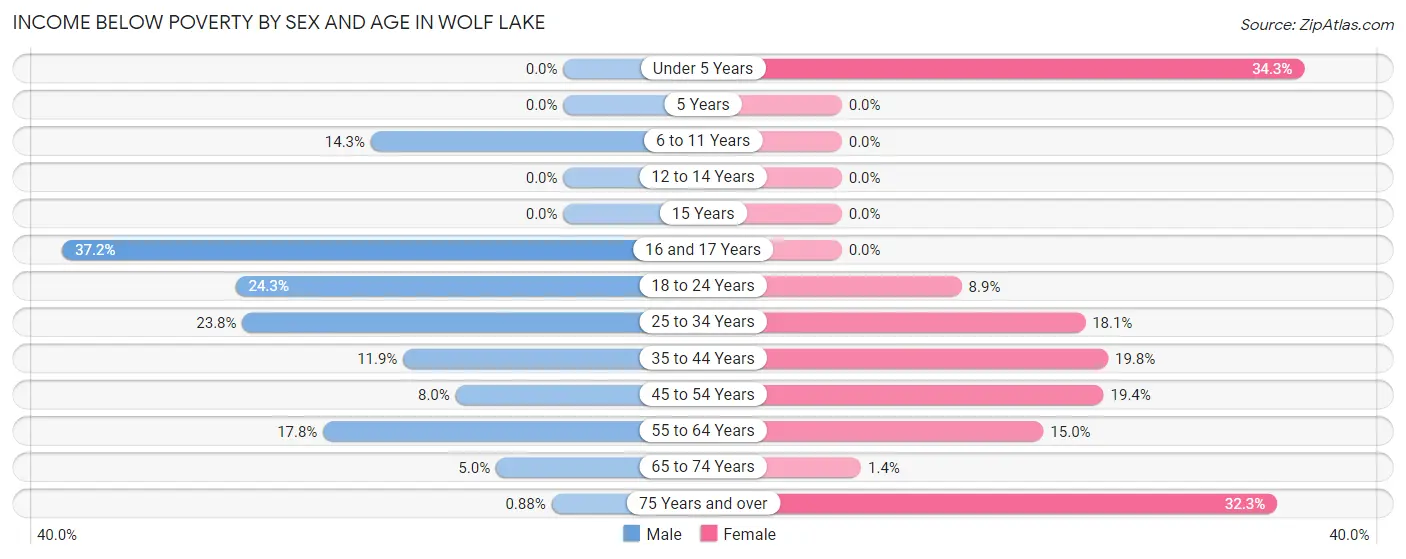
| Age Bracket | Male | Female |
| Under 5 Years | 0 (0.0%) | 23 (34.3%) |
| 5 Years | 0 (0.0%) | 0 (0.0%) |
| 6 to 11 Years | 12 (14.3%) | 0 (0.0%) |
| 12 to 14 Years | 0 (0.0%) | 0 (0.0%) |
| 15 Years | 0 (0.0%) | 0 (0.0%) |
| 16 and 17 Years | 16 (37.2%) | 0 (0.0%) |
| 18 to 24 Years | 65 (24.3%) | 29 (8.9%) |
| 25 to 34 Years | 71 (23.8%) | 43 (18.1%) |
| 35 to 44 Years | 29 (11.9%) | 35 (19.8%) |
| 45 to 54 Years | 24 (8.0%) | 69 (19.4%) |
| 55 to 64 Years | 56 (17.8%) | 28 (15.0%) |
| 65 to 74 Years | 6 (5.0%) | 2 (1.4%) |
| 75 Years and over | 1 (0.9%) | 64 (32.3%) |
| Total | 280 (13.8%) | 293 (14.2%) |
Income Above Poverty by Sex and Age in Wolf Lake
According to the poverty statistics in Wolf Lake, males aged under 5 years and females aged 5 years are the age groups that are most secure financially, with 100.0% of males and 100.0% of females in these age groups living above the poverty line.
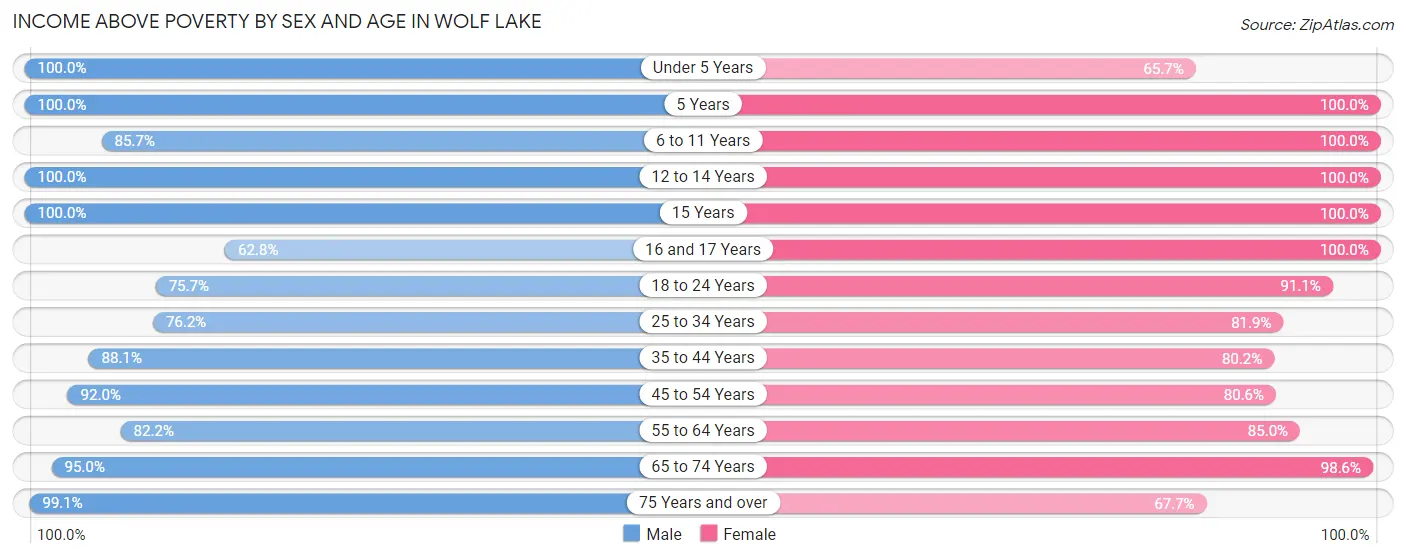
| Age Bracket | Male | Female |
| Under 5 Years | 88 (100.0%) | 44 (65.7%) |
| 5 Years | 89 (100.0%) | 15 (100.0%) |
| 6 to 11 Years | 72 (85.7%) | 190 (100.0%) |
| 12 to 14 Years | 41 (100.0%) | 128 (100.0%) |
| 15 Years | 21 (100.0%) | 32 (100.0%) |
| 16 and 17 Years | 27 (62.8%) | 14 (100.0%) |
| 18 to 24 Years | 202 (75.7%) | 297 (91.1%) |
| 25 to 34 Years | 227 (76.2%) | 195 (81.9%) |
| 35 to 44 Years | 215 (88.1%) | 142 (80.2%) |
| 45 to 54 Years | 276 (92.0%) | 286 (80.6%) |
| 55 to 64 Years | 258 (82.2%) | 159 (85.0%) |
| 65 to 74 Years | 114 (95.0%) | 138 (98.6%) |
| 75 Years and over | 113 (99.1%) | 134 (67.7%) |
| Total | 1,743 (86.2%) | 1,774 (85.8%) |
Income Below Poverty Among Married-Couple Families in Wolf Lake
The poverty statistics for married-couple families in Wolf Lake show that 5.6% or 44 of the total 780 families live below the poverty line. Families with no children have the highest poverty rate of 6.7%, comprising of 27 families. On the other hand, families with 3 or 4 children have the lowest poverty rate of 0.0%, which includes 0 families.
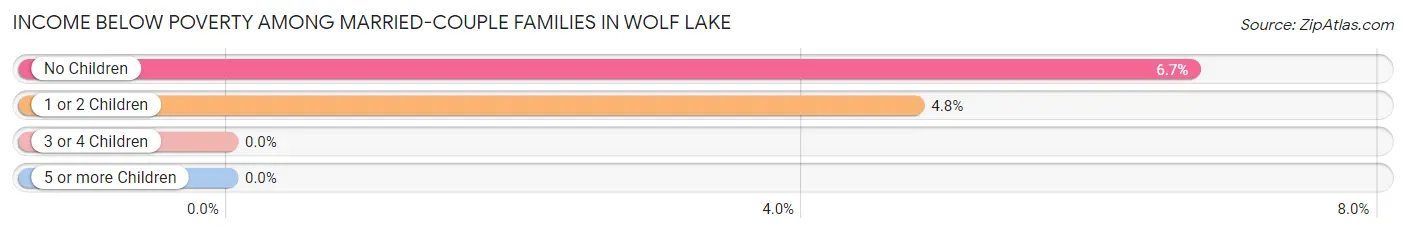
| Children | Above Poverty | Below Poverty |
| No Children | 376 (93.3%) | 27 (6.7%) |
| 1 or 2 Children | 339 (95.2%) | 17 (4.8%) |
| 3 or 4 Children | 21 (100.0%) | 0 (0.0%) |
| 5 or more Children | 0 (0.0%) | 0 (0.0%) |
| Total | 736 (94.4%) | 44 (5.6%) |
Income Below Poverty Among Single-Parent Households in Wolf Lake
According to the poverty data in Wolf Lake, 49.3% or 35 single-father households and 20.7% or 24 single-mother households are living below the poverty line. Among single-father households, those with no children have the highest poverty rate, with 10 households (100.0%) experiencing poverty. Likewise, among single-mother households, those with no children have the highest poverty rate, with 12 households (30.8%) falling below the poverty line.
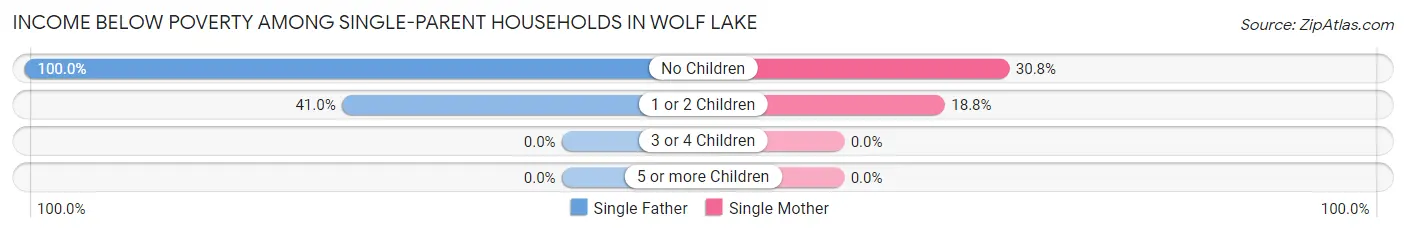
| Children | Single Father | Single Mother |
| No Children | 10 (100.0%) | 12 (30.8%) |
| 1 or 2 Children | 25 (41.0%) | 12 (18.8%) |
| 3 or 4 Children | 0 (0.0%) | 0 (0.0%) |
| 5 or more Children | 0 (0.0%) | 0 (0.0%) |
| Total | 35 (49.3%) | 24 (20.7%) |
Income Below Poverty Among Married-Couple vs Single-Parent Households in Wolf Lake
The poverty data for Wolf Lake shows that 44 of the married-couple family households (5.6%) and 59 of the single-parent households (31.6%) are living below the poverty level. Within the married-couple family households, those with no children have the highest poverty rate, with 27 households (6.7%) falling below the poverty line. Among the single-parent households, those with no children have the highest poverty rate, with 22 household (44.9%) living below poverty.
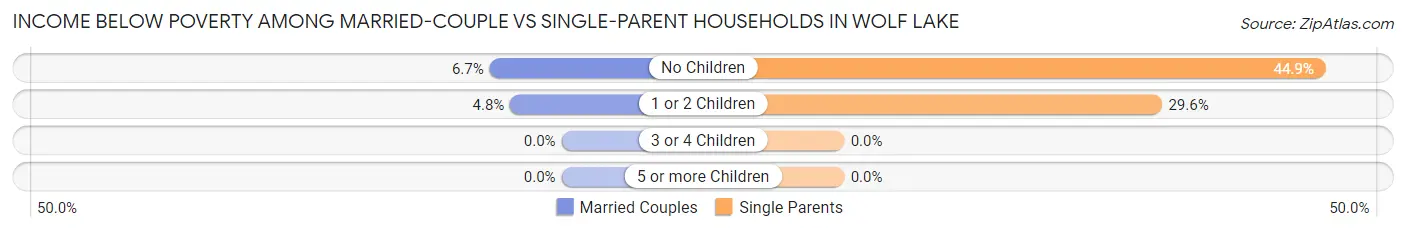
| Children | Married-Couple Families | Single-Parent Households |
| No Children | 27 (6.7%) | 22 (44.9%) |
| 1 or 2 Children | 17 (4.8%) | 37 (29.6%) |
| 3 or 4 Children | 0 (0.0%) | 0 (0.0%) |
| 5 or more Children | 0 (0.0%) | 0 (0.0%) |
| Total | 44 (5.6%) | 59 (31.6%) |
Race in Wolf Lake
The most populous races in Wolf Lake are White / Caucasian (3,947 | 95.6%), Hispanic or Latino (71 | 1.7%), and Two or more Races (69 | 1.7%).
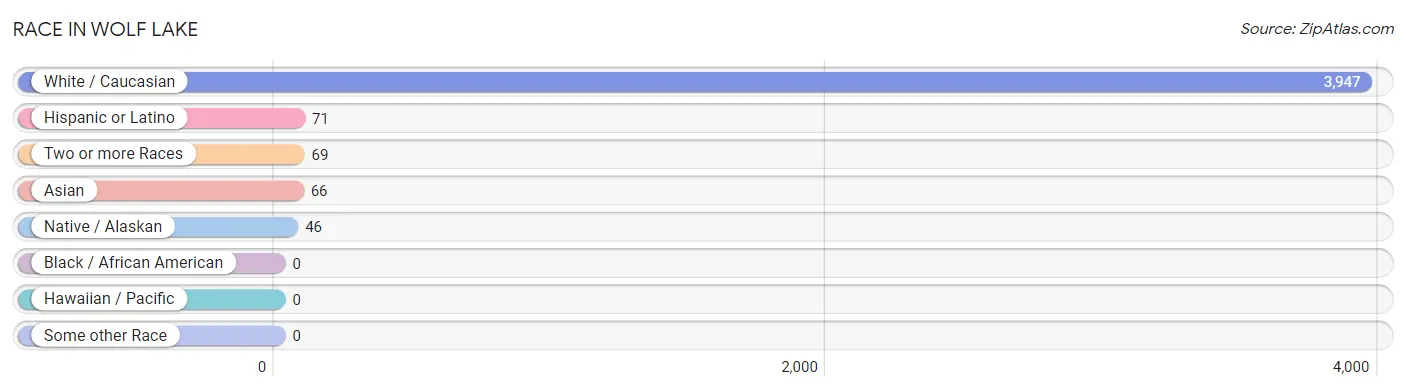
| Race | # Population | % Population |
| Asian | 66 | 1.6% |
| Black / African American | 0 | 0.0% |
| Hawaiian / Pacific | 0 | 0.0% |
| Hispanic or Latino | 71 | 1.7% |
| Native / Alaskan | 46 | 1.1% |
| White / Caucasian | 3,947 | 95.6% |
| Two or more Races | 69 | 1.7% |
| Some other Race | 0 | 0.0% |
| Total | 4,128 | 100.0% |
Ancestry in Wolf Lake
The most populous ancestries reported in Wolf Lake are German (842 | 20.4%), Dutch (527 | 12.8%), English (244 | 5.9%), Irish (151 | 3.7%), and American (149 | 3.6%), together accounting for 46.4% of all Wolf Lake residents.
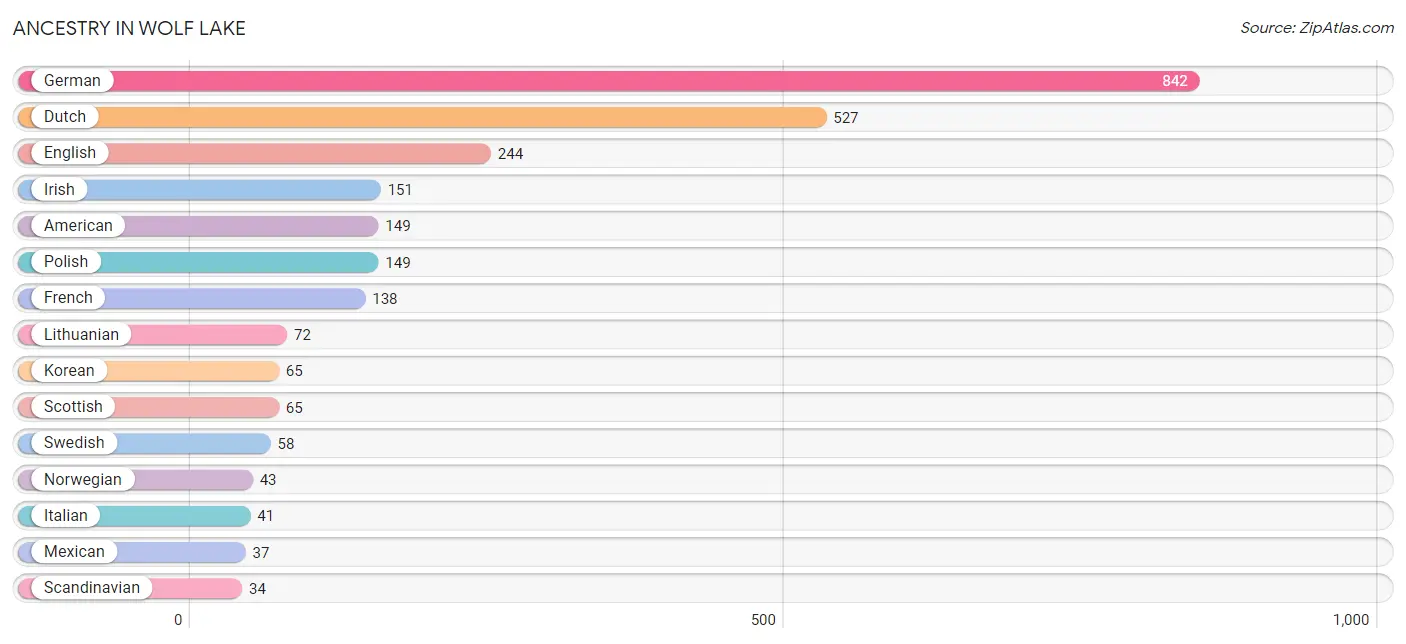
| Ancestry | # Population | % Population |
| American | 149 | 3.6% |
| British | 15 | 0.4% |
| Burmese | 1 | 0.0% |
| Canadian | 18 | 0.4% |
| Cherokee | 9 | 0.2% |
| Chippewa | 18 | 0.4% |
| Colombian | 8 | 0.2% |
| Croatian | 18 | 0.4% |
| Czech | 29 | 0.7% |
| Danish | 12 | 0.3% |
| Dutch | 527 | 12.8% |
| English | 244 | 5.9% |
| French | 138 | 3.3% |
| German | 842 | 20.4% |
| Irish | 151 | 3.7% |
| Italian | 41 | 1.0% |
| Korean | 65 | 1.6% |
| Lithuanian | 72 | 1.7% |
| Mexican | 37 | 0.9% |
| Norwegian | 43 | 1.0% |
| Polish | 149 | 3.6% |
| Potawatomi | 27 | 0.6% |
| Puerto Rican | 26 | 0.6% |
| Scandinavian | 34 | 0.8% |
| Scottish | 65 | 1.6% |
| South American | 8 | 0.2% |
| Swedish | 58 | 1.4% |
| Ukrainian | 34 | 0.8% | View All 28 Rows |
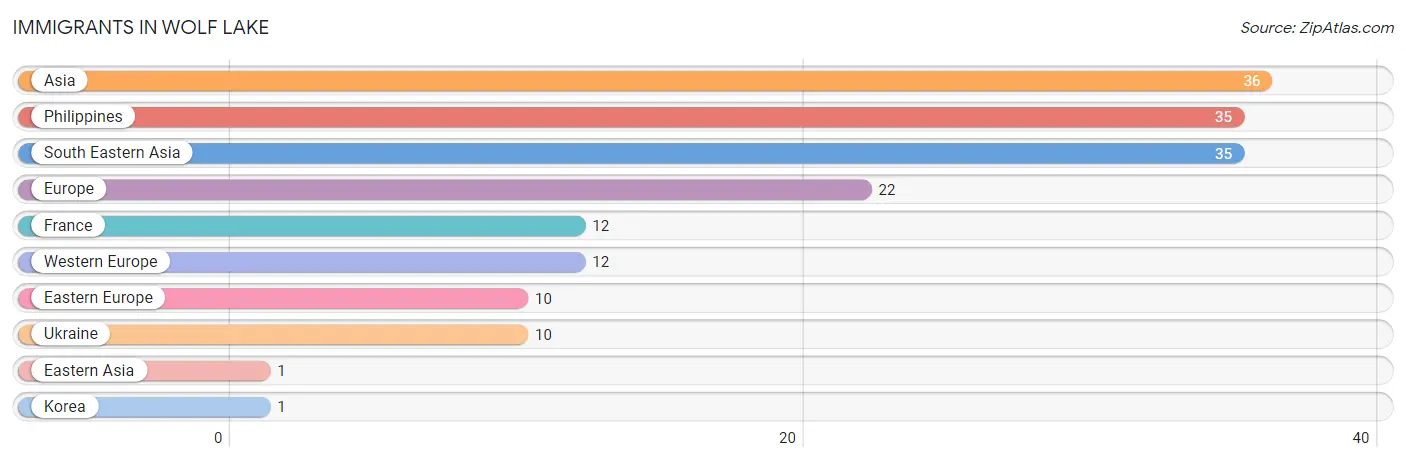
Immigrants in Wolf Lake
The most numerous immigrant groups reported in Wolf Lake came from Asia (36 | 0.9%), Philippines (35 | 0.9%), South Eastern Asia (35 | 0.9%), Europe (22 | 0.5%), and France (12 | 0.3%), together accounting for 3.4% of all Wolf Lake residents.
| Immigration Origin | # Population | % Population |
| Asia | 36 | 0.9% |
| Eastern Asia | 1 | 0.0% |
| Eastern Europe | 10 | 0.2% |
| Europe | 22 | 0.5% |
| France | 12 | 0.3% |
| Korea | 1 | 0.0% |
| Philippines | 35 | 0.9% |
| South Eastern Asia | 35 | 0.9% |
| Ukraine | 10 | 0.2% |
| Western Europe | 12 | 0.3% | View All 10 Rows |
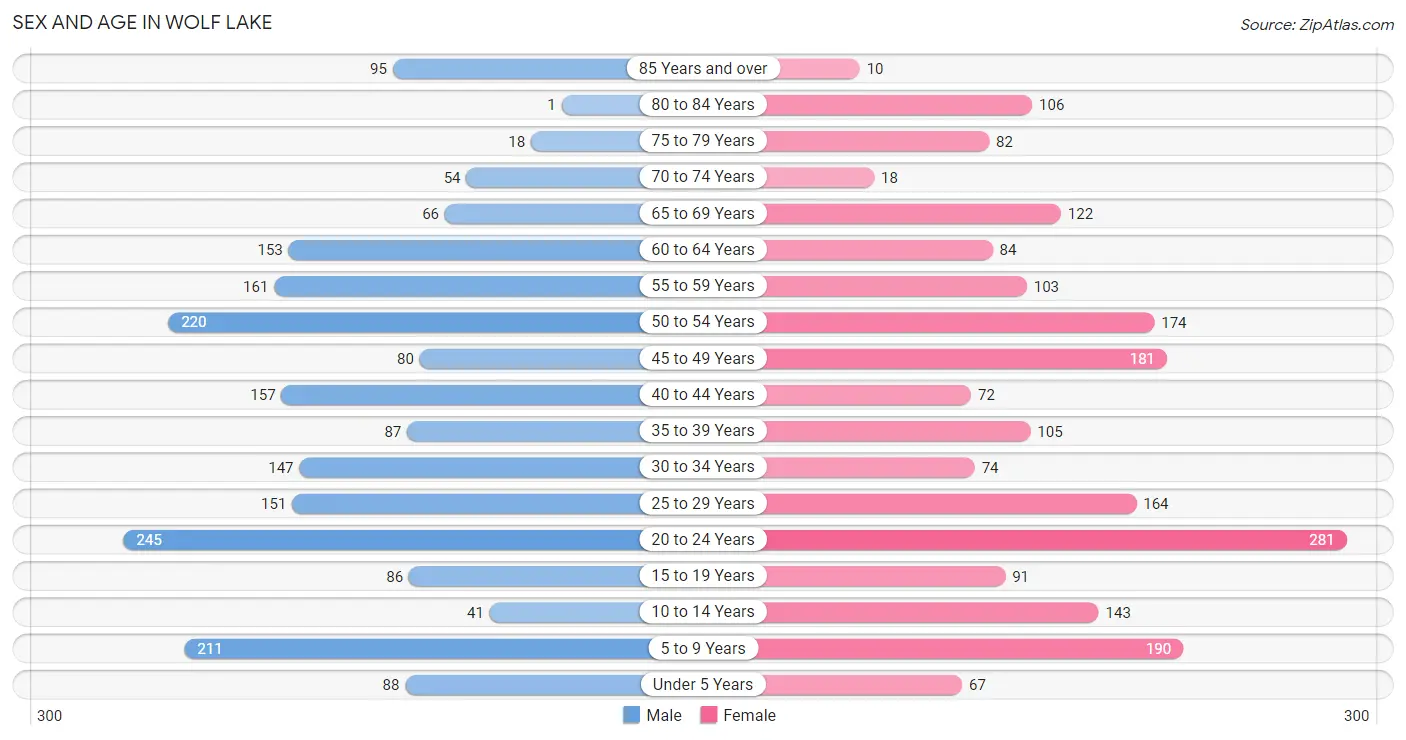
Sex and Age in Wolf Lake
Sex and Age in Wolf Lake
The most populous age groups in Wolf Lake are 20 to 24 Years (245 | 11.9%) for men and 20 to 24 Years (281 | 13.6%) for women.
| Age Bracket | Male | Female |
| Under 5 Years | 88 (4.3%) | 67 (3.2%) |
| 5 to 9 Years | 211 (10.2%) | 190 (9.2%) |
| 10 to 14 Years | 41 (2.0%) | 143 (6.9%) |
| 15 to 19 Years | 86 (4.2%) | 91 (4.4%) |
| 20 to 24 Years | 245 (11.9%) | 281 (13.6%) |
| 25 to 29 Years | 151 (7.3%) | 164 (7.9%) |
| 30 to 34 Years | 147 (7.1%) | 74 (3.6%) |
| 35 to 39 Years | 87 (4.2%) | 105 (5.1%) |
| 40 to 44 Years | 157 (7.6%) | 72 (3.5%) |
| 45 to 49 Years | 80 (3.9%) | 181 (8.8%) |
| 50 to 54 Years | 220 (10.7%) | 174 (8.4%) |
| 55 to 59 Years | 161 (7.8%) | 103 (5.0%) |
| 60 to 64 Years | 153 (7.4%) | 84 (4.1%) |
| 65 to 69 Years | 66 (3.2%) | 122 (5.9%) |
| 70 to 74 Years | 54 (2.6%) | 18 (0.9%) |
| 75 to 79 Years | 18 (0.9%) | 82 (4.0%) |
| 80 to 84 Years | 1 (0.1%) | 106 (5.1%) |
| 85 Years and over | 95 (4.6%) | 10 (0.5%) |
| Total | 2,061 (100.0%) | 2,067 (100.0%) |
Families and Households in Wolf Lake
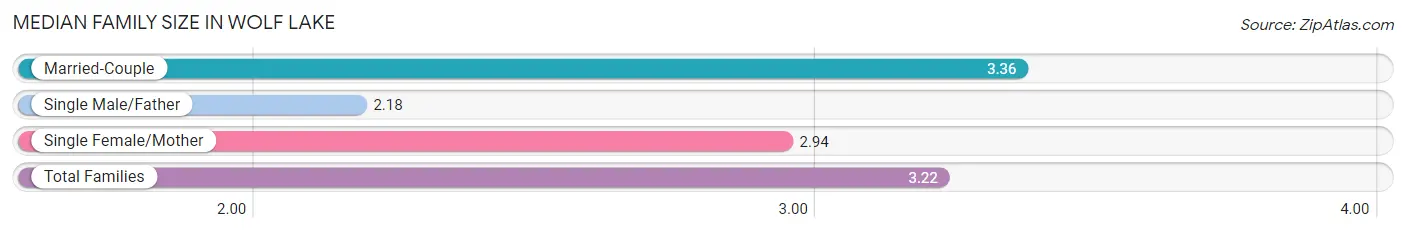
Median Family Size in Wolf Lake
The median family size in Wolf Lake is 3.22 persons per family, with married-couple families (780 | 80.7%) accounting for the largest median family size of 3.36 persons per family. On the other hand, single male/father families (71 | 7.3%) represent the smallest median family size with 2.18 persons per family.
| Family Type | # Families | Family Size |
| Married-Couple | 780 (80.7%) | 3.36 |
| Single Male/Father | 71 (7.3%) | 2.18 |
| Single Female/Mother | 116 (12.0%) | 2.94 |
| Total Families | 967 (100.0%) | 3.22 |
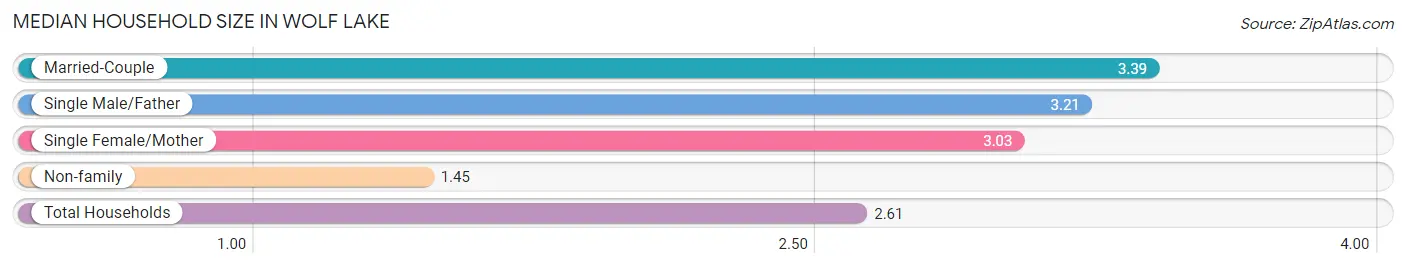
Median Household Size in Wolf Lake
The median household size in Wolf Lake is 2.61 persons per household, with married-couple households (780 | 49.7%) accounting for the largest median household size of 3.39 persons per household. non-family households (602 | 38.4%) represent the smallest median household size with 1.45 persons per household.
| Household Type | # Households | Household Size |
| Married-Couple | 780 (49.7%) | 3.39 |
| Single Male/Father | 71 (4.5%) | 3.21 |
| Single Female/Mother | 116 (7.4%) | 3.03 |
| Non-family | 602 (38.4%) | 1.45 |
| Total Households | 1,569 (100.0%) | 2.61 |
Household Size by Marriage Status in Wolf Lake
Out of a total of 1,569 households in Wolf Lake, 967 (61.6%) are family households, while 602 (38.4%) are nonfamily households. The most numerous type of family households are 4-person households, comprising 367, and the most common type of nonfamily households are 1-person households, comprising 406.
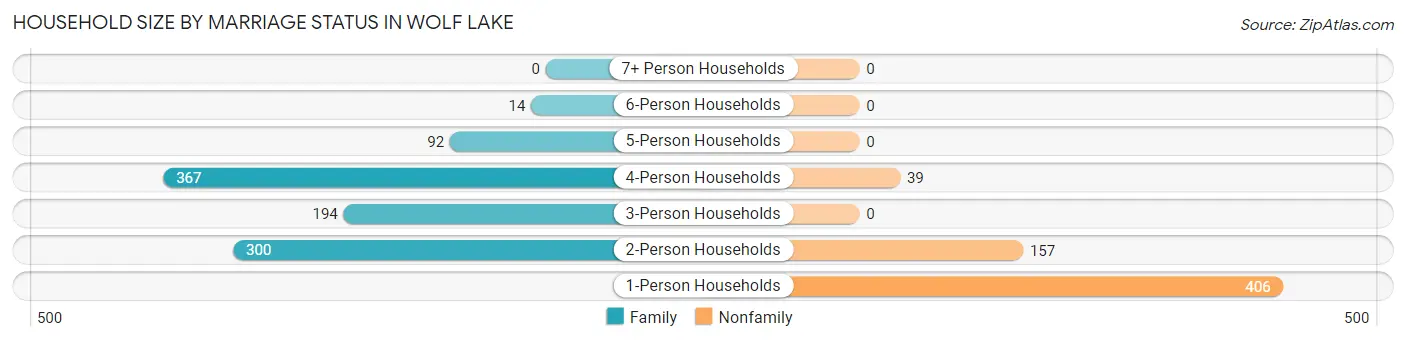
| Household Size | Family Households | Nonfamily Households |
| 1-Person Households | - | 406 (25.9%) |
| 2-Person Households | 300 (19.1%) | 157 (10.0%) |
| 3-Person Households | 194 (12.4%) | 0 (0.0%) |
| 4-Person Households | 367 (23.4%) | 39 (2.5%) |
| 5-Person Households | 92 (5.9%) | 0 (0.0%) |
| 6-Person Households | 14 (0.9%) | 0 (0.0%) |
| 7+ Person Households | 0 (0.0%) | 0 (0.0%) |
| Total | 967 (61.6%) | 602 (38.4%) |
Female Fertility in Wolf Lake
Fertility by Age in Wolf Lake
| Age Bracket | Women with Births | Births / 1,000 Women |
| 15 to 19 years | 0 (0.0%) | 0.0 |
| 20 to 34 years | 0 (0.0%) | 0.0 |
| 35 to 50 years | 0 (0.0%) | 0.0 |
| Total | 0 (0.0%) | 0.0 |
Fertility by Age by Marriage Status in Wolf Lake
| Age Bracket | Married | Unmarried |
| 15 to 19 years | 0 (0.0%) | 0 (0.0%) |
| 20 to 34 years | 0 (0.0%) | 0 (0.0%) |
| 35 to 50 years | 0 (0.0%) | 0 (0.0%) |
| Total | 0 (0.0%) | 0 (0.0%) |
Fertility by Education in Wolf Lake
| Educational Attainment | Women with Births | Births / 1,000 Women |
| Less than High School | 0 (0.0%) | 0.0 |
| High School Diploma | 0 (0.0%) | 0.0 |
| College or Associate's Degree | 0 (0.0%) | 0.0 |
| Bachelor's Degree | 0 (0.0%) | 0.0 |
| Graduate Degree | 0 (0.0%) | 0.0 |
| Total | 0 (0.0%) | 0.0 |
Fertility by Education by Marriage Status in Wolf Lake
| Educational Attainment | Married | Unmarried |
| Less than High School | 0 (0.0%) | 0 (0.0%) |
| High School Diploma | 0 (0.0%) | 0 (0.0%) |
| College or Associate's Degree | 0 (0.0%) | 0 (0.0%) |
| Bachelor's Degree | 0 (0.0%) | 0 (0.0%) |
| Graduate Degree | 0 (0.0%) | 0 (0.0%) |
| Total | 0 (0.0%) | 0 (0.0%) |
Employment Characteristics in Wolf Lake
Employment by Class of Employer in Wolf Lake
Among the 1,790 employed individuals in Wolf Lake, private company employees (1,509 | 84.3%), not-for-profit organizations (113 | 6.3%), and local government employees (73 | 4.1%) make up the most common classes of employment.
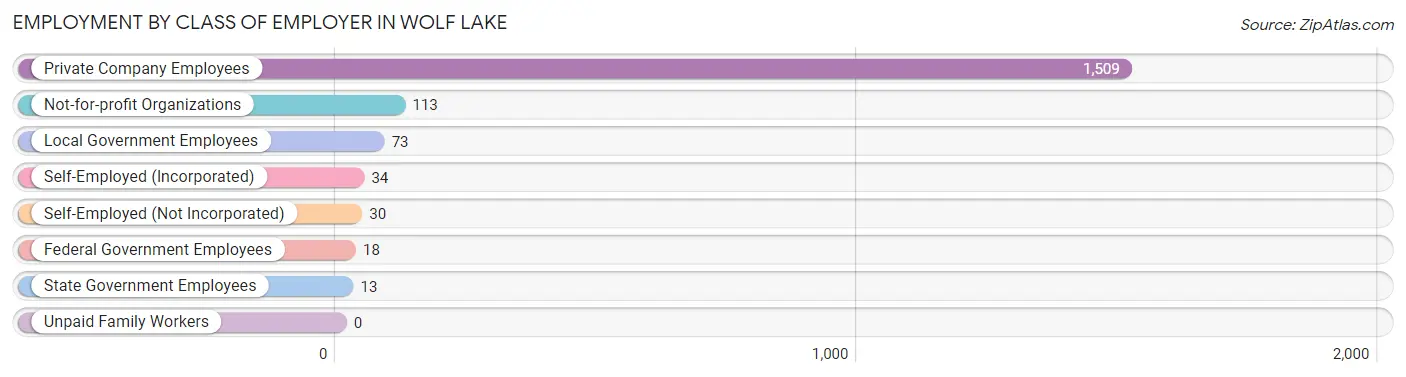
| Employer Class | # Employees | % Employees |
| Private Company Employees | 1,509 | 84.3% |
| Self-Employed (Incorporated) | 34 | 1.9% |
| Self-Employed (Not Incorporated) | 30 | 1.7% |
| Not-for-profit Organizations | 113 | 6.3% |
| Local Government Employees | 73 | 4.1% |
| State Government Employees | 13 | 0.7% |
| Federal Government Employees | 18 | 1.0% |
| Unpaid Family Workers | 0 | 0.0% |
| Total | 1,790 | 100.0% |
Employment Status by Age in Wolf Lake
According to the labor force statistics for Wolf Lake, out of the total population over 16 years of age (3,335), 60.5% or 2,018 individuals are in the labor force, with 10.8% or 218 of them unemployed. The age group with the highest labor force participation rate is 30 to 34 years, with 100.0% or 221 individuals in the labor force. Within the labor force, the 20 to 24 years age range has the highest percentage of unemployed individuals, with 34.6% or 137 of them being unemployed.
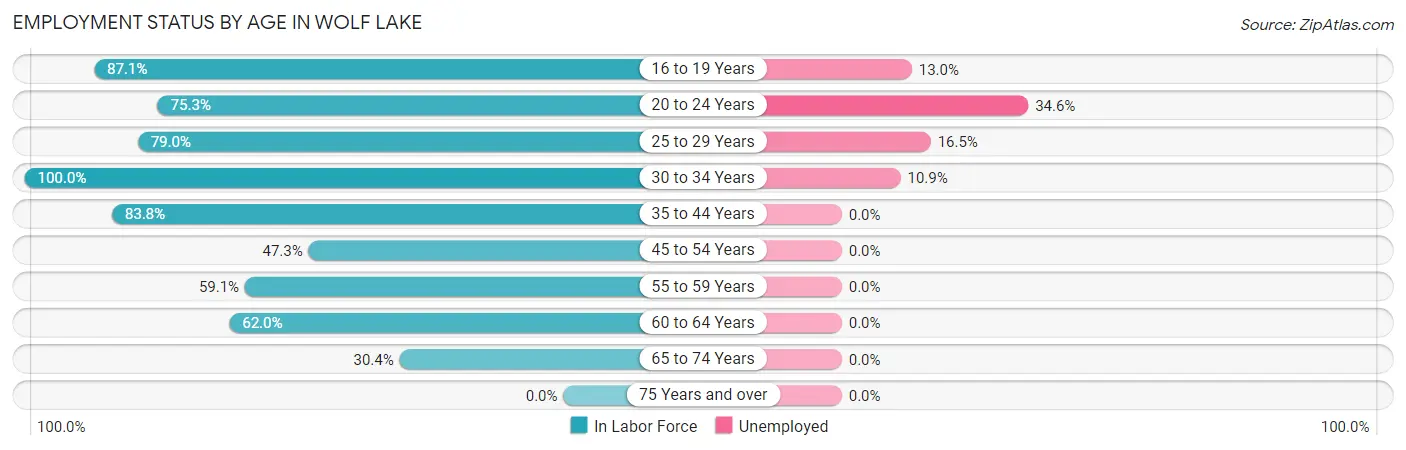
| Age Bracket | In Labor Force | Unemployed |
| 16 to 19 Years | 108 (87.1%) | 14 (13.0%) |
| 20 to 24 Years | 396 (75.3%) | 137 (34.6%) |
| 25 to 29 Years | 249 (79.0%) | 41 (16.5%) |
| 30 to 34 Years | 221 (100.0%) | 24 (10.9%) |
| 35 to 44 Years | 353 (83.8%) | 0 (0.0%) |
| 45 to 54 Years | 310 (47.3%) | 0 (0.0%) |
| 55 to 59 Years | 156 (59.1%) | 0 (0.0%) |
| 60 to 64 Years | 147 (62.0%) | 0 (0.0%) |
| 65 to 74 Years | 79 (30.4%) | 0 (0.0%) |
| 75 Years and over | 0 (0.0%) | 0 (0.0%) |
| Total | 2,018 (60.5%) | 218 (10.8%) |
Employment Status by Educational Attainment in Wolf Lake
According to labor force statistics for Wolf Lake, 68.0% of individuals (1,437) out of the total population between 25 and 64 years of age (2,113) are in the labor force, with 4.6% or 66 of them being unemployed. The group with the highest labor force participation rate are those with the educational attainment of high school diploma, with 74.6% or 859 individuals in the labor force. Within the labor force, individuals with less than high school education have the highest percentage of unemployment, with 8.9% or 7 of them being unemployed.
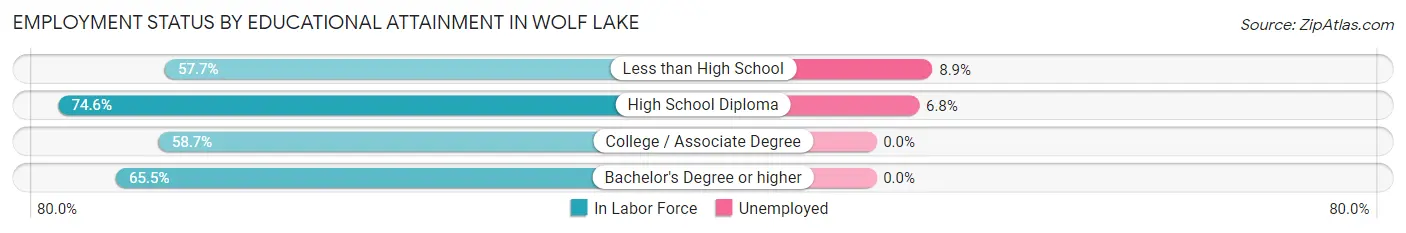
| Educational Attainment | In Labor Force | Unemployed |
| Less than High School | 79 (57.7%) | 12 (8.9%) |
| High School Diploma | 859 (74.6%) | 78 (6.8%) |
| College / Associate Degree | 365 (58.7%) | 0 (0.0%) |
| Bachelor's Degree or higher | 133 (65.5%) | 0 (0.0%) |
| Total | 1,437 (68.0%) | 97 (4.6%) |
Employment Occupations by Sex in Wolf Lake
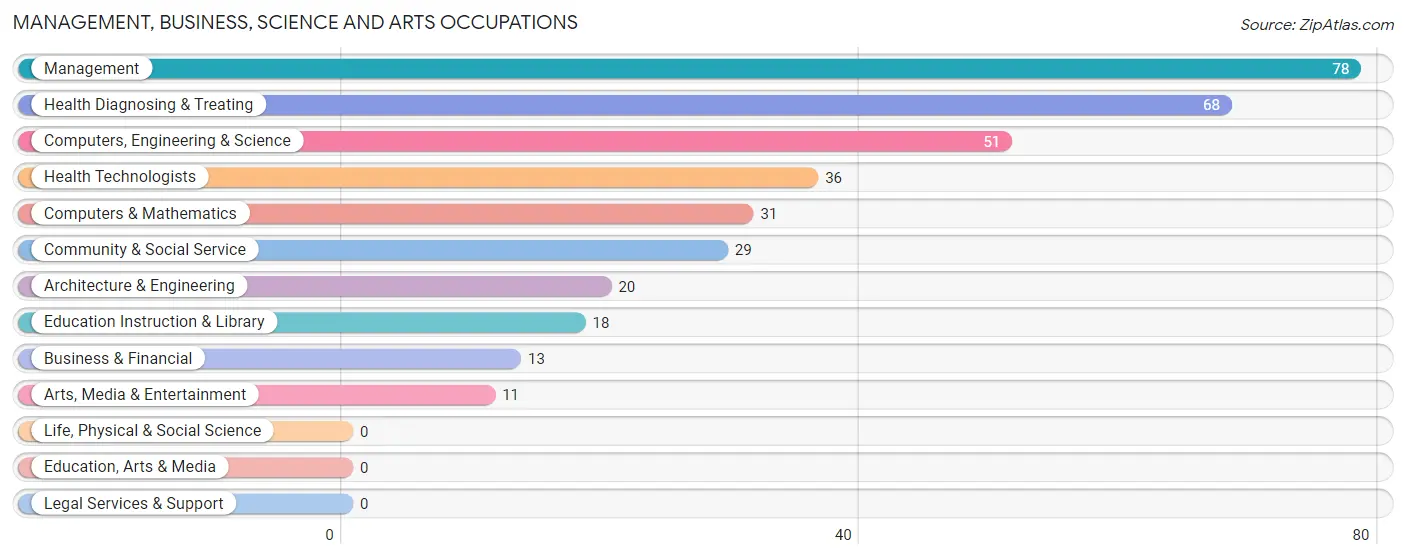
Management, Business, Science and Arts Occupations
The most common Management, Business, Science and Arts occupations in Wolf Lake are Management (78 | 4.4%), Health Diagnosing & Treating (68 | 3.8%), Computers, Engineering & Science (51 | 2.9%), Health Technologists (36 | 2.0%), and Computers & Mathematics (31 | 1.7%).
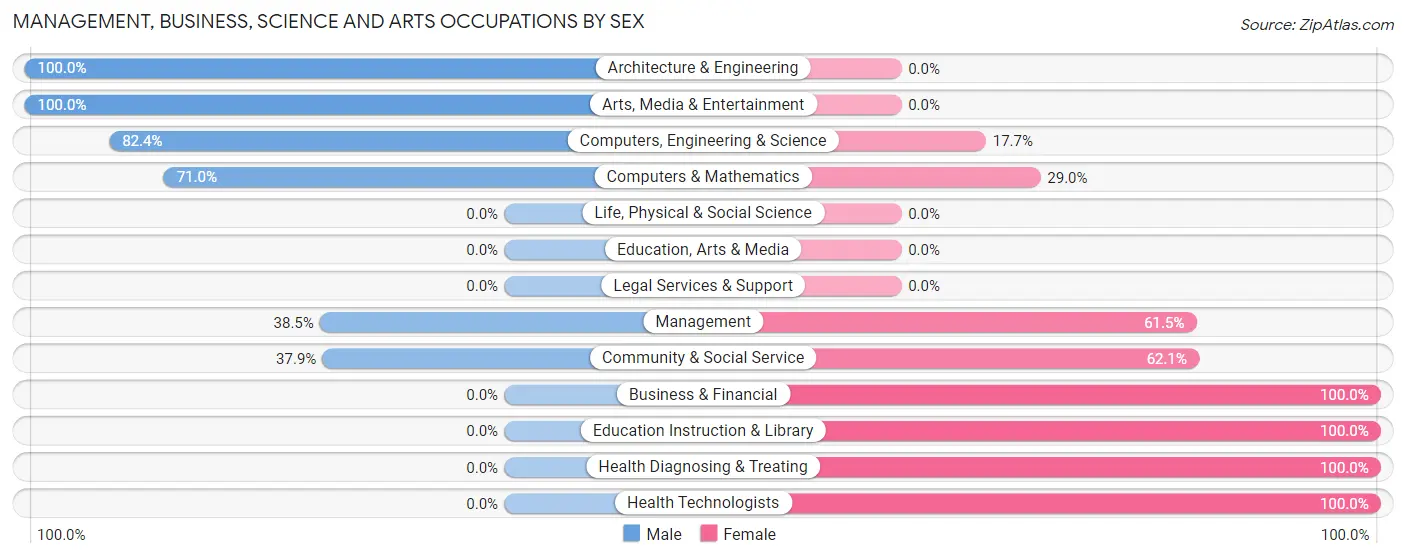
Management, Business, Science and Arts Occupations by Sex
Within the Management, Business, Science and Arts occupations in Wolf Lake, the most male-oriented occupations are Architecture & Engineering (100.0%), Arts, Media & Entertainment (100.0%), and Computers, Engineering & Science (82.4%), while the most female-oriented occupations are Business & Financial (100.0%), Education Instruction & Library (100.0%), and Health Diagnosing & Treating (100.0%).
| Occupation | Male | Female |
| Management | 30 (38.5%) | 48 (61.5%) |
| Business & Financial | 0 (0.0%) | 13 (100.0%) |
| Computers, Engineering & Science | 42 (82.4%) | 9 (17.6%) |
| Computers & Mathematics | 22 (71.0%) | 9 (29.0%) |
| Architecture & Engineering | 20 (100.0%) | 0 (0.0%) |
| Life, Physical & Social Science | 0 (0.0%) | 0 (0.0%) |
| Community & Social Service | 11 (37.9%) | 18 (62.1%) |
| Education, Arts & Media | 0 (0.0%) | 0 (0.0%) |
| Legal Services & Support | 0 (0.0%) | 0 (0.0%) |
| Education Instruction & Library | 0 (0.0%) | 18 (100.0%) |
| Arts, Media & Entertainment | 11 (100.0%) | 0 (0.0%) |
| Health Diagnosing & Treating | 0 (0.0%) | 68 (100.0%) |
| Health Technologists | 0 (0.0%) | 36 (100.0%) |
| Total (Category) | 83 (34.7%) | 156 (65.3%) |
| Total (Overall) | 1,024 (57.4%) | 761 (42.6%) |
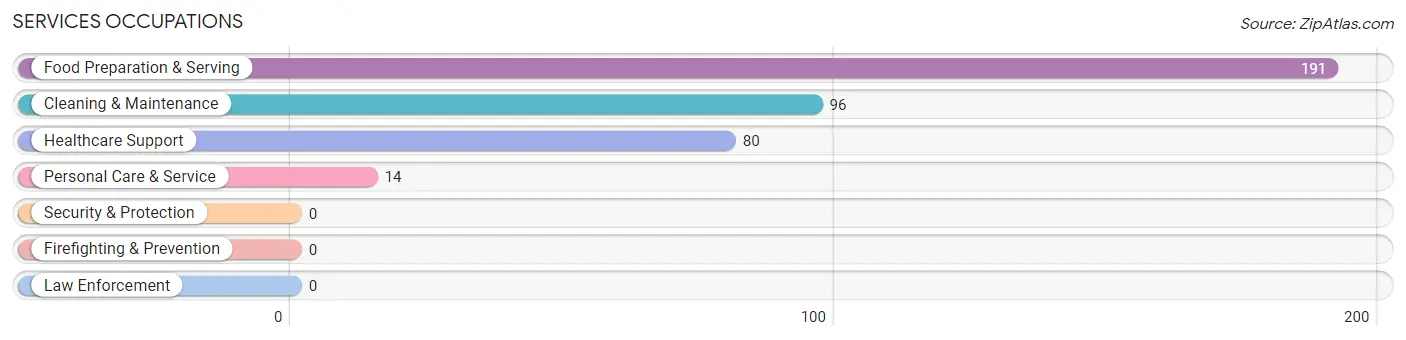
Services Occupations
The most common Services occupations in Wolf Lake are Food Preparation & Serving (191 | 10.7%), Cleaning & Maintenance (96 | 5.4%), Healthcare Support (80 | 4.5%), and Personal Care & Service (14 | 0.8%).
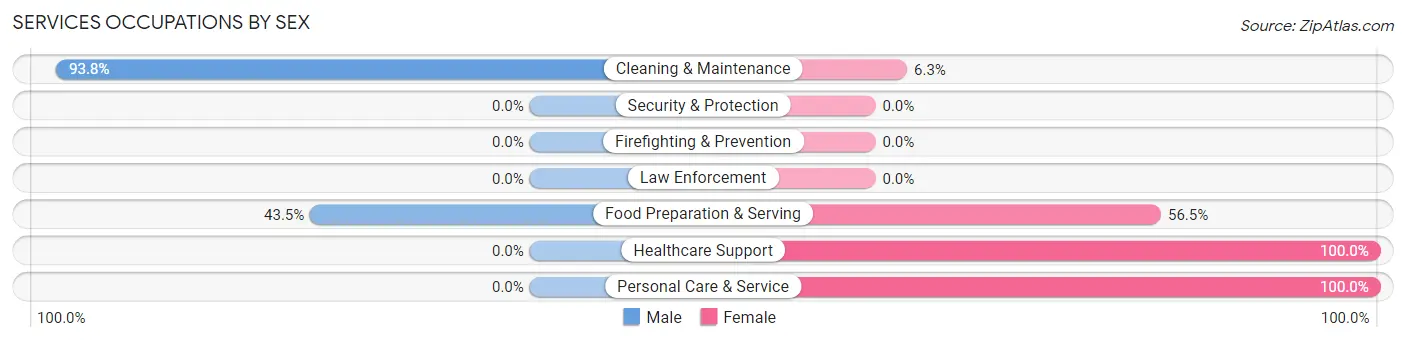
Services Occupations by Sex
Within the Services occupations in Wolf Lake, the most male-oriented occupations are Cleaning & Maintenance (93.8%), and Food Preparation & Serving (43.5%), while the most female-oriented occupations are Healthcare Support (100.0%), Personal Care & Service (100.0%), and Food Preparation & Serving (56.5%).
| Occupation | Male | Female |
| Healthcare Support | 0 (0.0%) | 80 (100.0%) |
| Security & Protection | 0 (0.0%) | 0 (0.0%) |
| Firefighting & Prevention | 0 (0.0%) | 0 (0.0%) |
| Law Enforcement | 0 (0.0%) | 0 (0.0%) |
| Food Preparation & Serving | 83 (43.5%) | 108 (56.5%) |
| Cleaning & Maintenance | 90 (93.8%) | 6 (6.2%) |
| Personal Care & Service | 0 (0.0%) | 14 (100.0%) |
| Total (Category) | 173 (45.4%) | 208 (54.6%) |
| Total (Overall) | 1,024 (57.4%) | 761 (42.6%) |
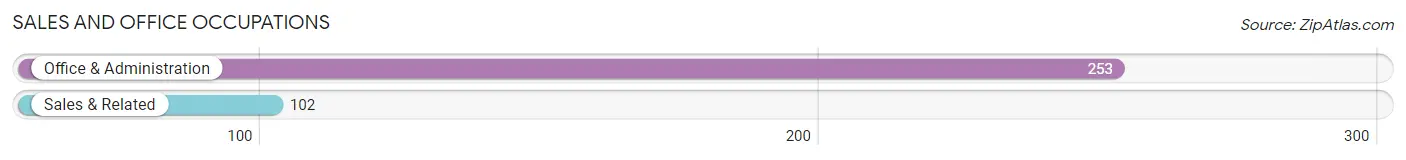
Sales and Office Occupations
The most common Sales and Office occupations in Wolf Lake are Office & Administration (253 | 14.2%), and Sales & Related (102 | 5.7%).
Sales and Office Occupations by Sex
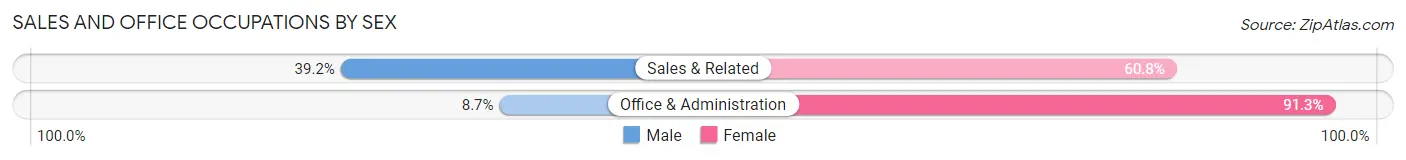
| Occupation | Male | Female |
| Sales & Related | 40 (39.2%) | 62 (60.8%) |
| Office & Administration | 22 (8.7%) | 231 (91.3%) |
| Total (Category) | 62 (17.5%) | 293 (82.5%) |
| Total (Overall) | 1,024 (57.4%) | 761 (42.6%) |
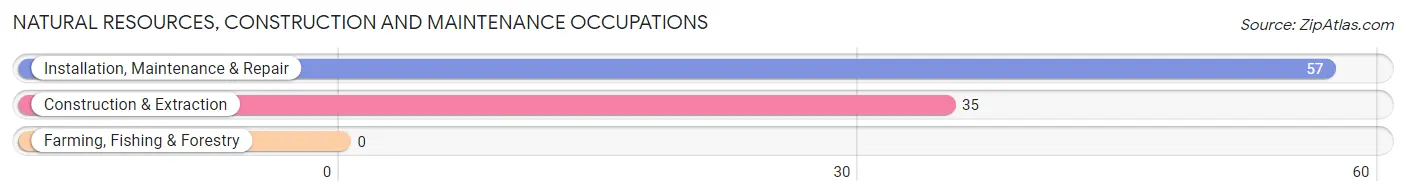
Natural Resources, Construction and Maintenance Occupations
The most common Natural Resources, Construction and Maintenance occupations in Wolf Lake are Installation, Maintenance & Repair (57 | 3.2%), and Construction & Extraction (35 | 2.0%).
Natural Resources, Construction and Maintenance Occupations by Sex
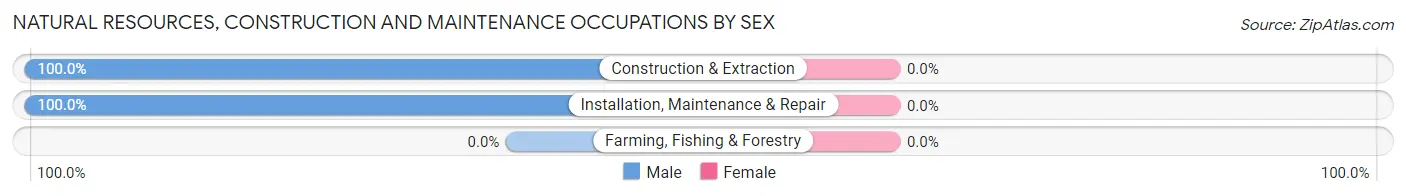
| Occupation | Male | Female |
| Farming, Fishing & Forestry | 0 (0.0%) | 0 (0.0%) |
| Construction & Extraction | 35 (100.0%) | 0 (0.0%) |
| Installation, Maintenance & Repair | 57 (100.0%) | 0 (0.0%) |
| Total (Category) | 92 (100.0%) | 0 (0.0%) |
| Total (Overall) | 1,024 (57.4%) | 761 (42.6%) |
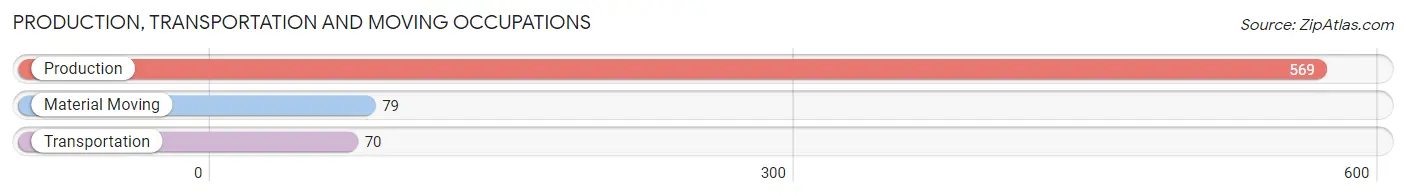
Production, Transportation and Moving Occupations
The most common Production, Transportation and Moving occupations in Wolf Lake are Production (569 | 31.9%), Material Moving (79 | 4.4%), and Transportation (70 | 3.9%).
Production, Transportation and Moving Occupations by Sex
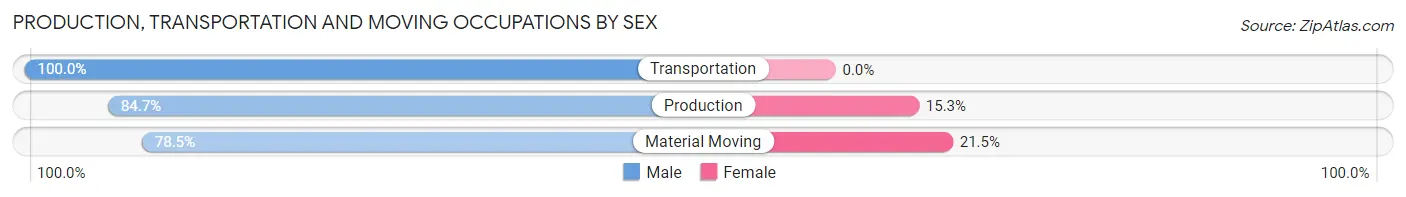
| Occupation | Male | Female |
| Production | 482 (84.7%) | 87 (15.3%) |
| Transportation | 70 (100.0%) | 0 (0.0%) |
| Material Moving | 62 (78.5%) | 17 (21.5%) |
| Total (Category) | 614 (85.5%) | 104 (14.5%) |
| Total (Overall) | 1,024 (57.4%) | 761 (42.6%) |
Employment Industries by Sex in Wolf Lake
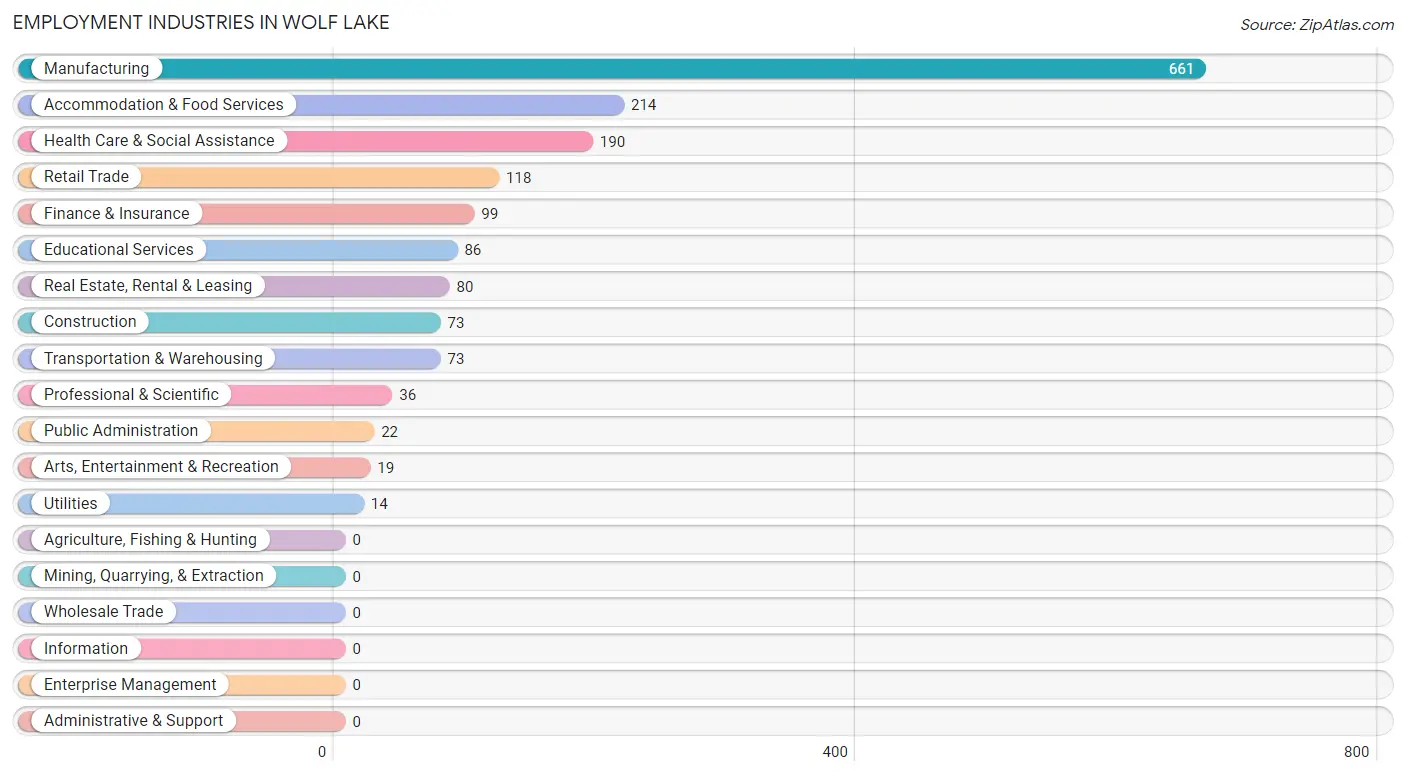
Employment Industries in Wolf Lake
The major employment industries in Wolf Lake include Manufacturing (661 | 37.0%), Accommodation & Food Services (214 | 12.0%), Health Care & Social Assistance (190 | 10.6%), Retail Trade (118 | 6.6%), and Finance & Insurance (99 | 5.6%).
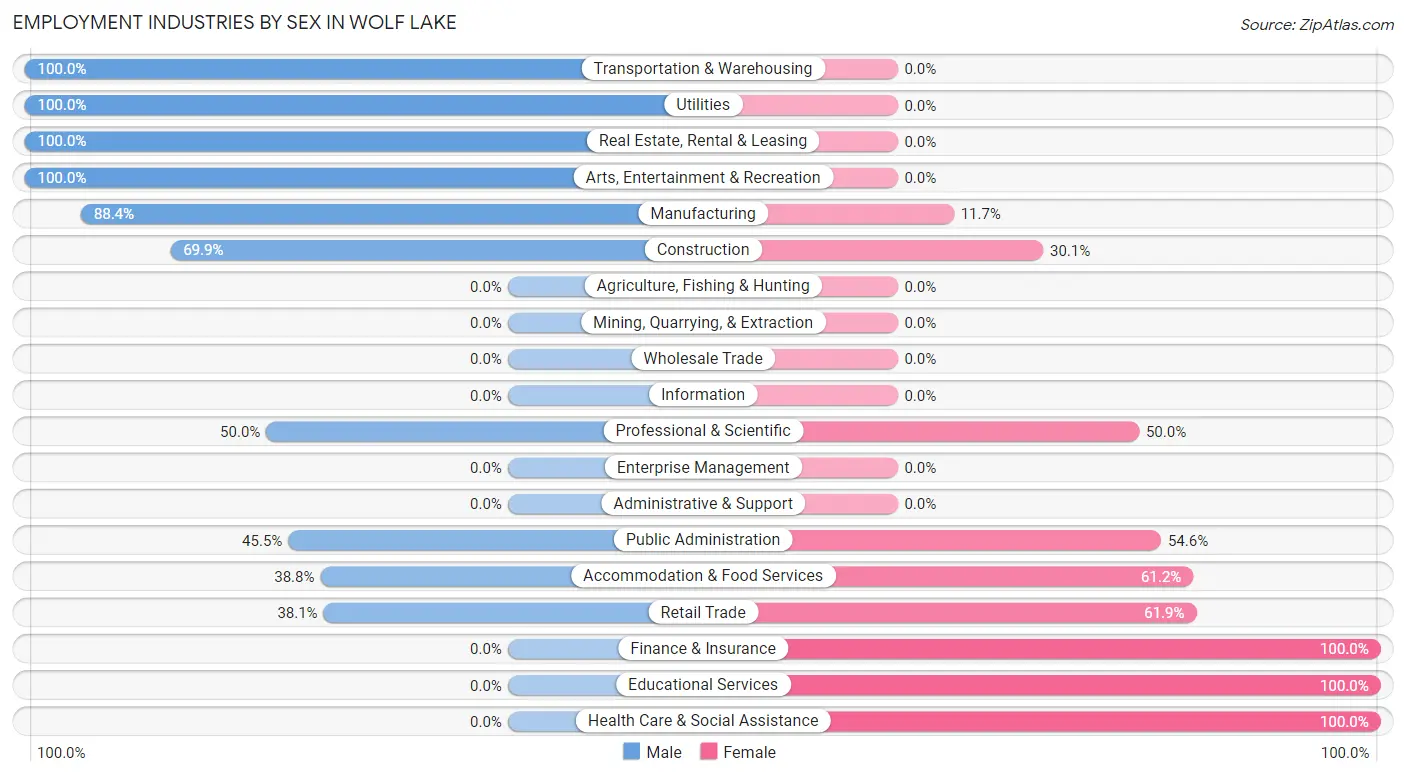
Employment Industries by Sex in Wolf Lake
The Wolf Lake industries that see more men than women are Transportation & Warehousing (100.0%), Utilities (100.0%), and Real Estate, Rental & Leasing (100.0%), whereas the industries that tend to have a higher number of women are Finance & Insurance (100.0%), Educational Services (100.0%), and Health Care & Social Assistance (100.0%).
| Industry | Male | Female |
| Agriculture, Fishing & Hunting | 0 (0.0%) | 0 (0.0%) |
| Mining, Quarrying, & Extraction | 0 (0.0%) | 0 (0.0%) |
| Construction | 51 (69.9%) | 22 (30.1%) |
| Manufacturing | 584 (88.3%) | 77 (11.7%) |
| Wholesale Trade | 0 (0.0%) | 0 (0.0%) |
| Retail Trade | 45 (38.1%) | 73 (61.9%) |
| Transportation & Warehousing | 73 (100.0%) | 0 (0.0%) |
| Utilities | 14 (100.0%) | 0 (0.0%) |
| Information | 0 (0.0%) | 0 (0.0%) |
| Finance & Insurance | 0 (0.0%) | 99 (100.0%) |
| Real Estate, Rental & Leasing | 80 (100.0%) | 0 (0.0%) |
| Professional & Scientific | 18 (50.0%) | 18 (50.0%) |
| Enterprise Management | 0 (0.0%) | 0 (0.0%) |
| Administrative & Support | 0 (0.0%) | 0 (0.0%) |
| Educational Services | 0 (0.0%) | 86 (100.0%) |
| Health Care & Social Assistance | 0 (0.0%) | 190 (100.0%) |
| Arts, Entertainment & Recreation | 19 (100.0%) | 0 (0.0%) |
| Accommodation & Food Services | 83 (38.8%) | 131 (61.2%) |
| Public Administration | 10 (45.5%) | 12 (54.5%) |
| Total | 1,024 (57.4%) | 761 (42.6%) |
Education in Wolf Lake
School Enrollment in Wolf Lake
The most common levels of schooling among the 909 students in Wolf Lake are elementary school (281 | 30.9%), college / undergraduate (204 | 22.4%), and middle school (154 | 16.9%).
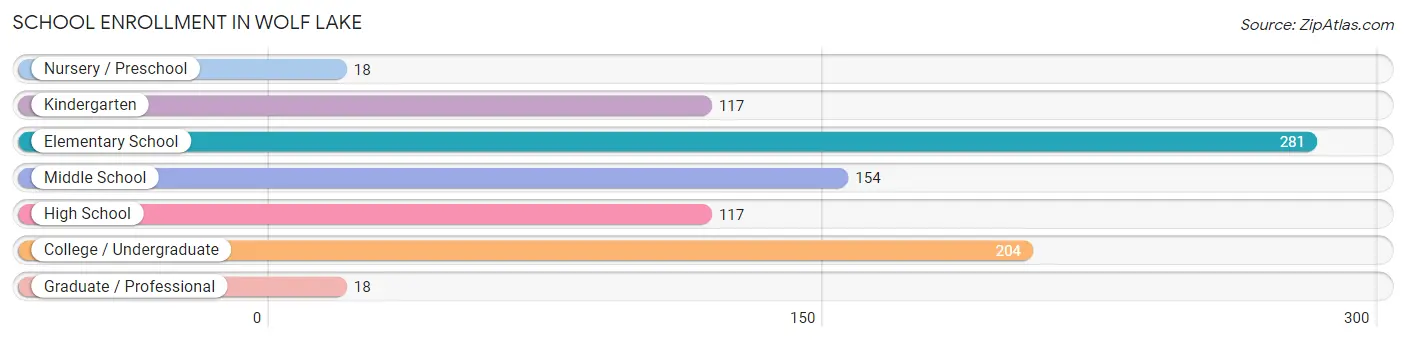
| School Level | # Students | % Students |
| Nursery / Preschool | 18 | 2.0% |
| Kindergarten | 117 | 12.9% |
| Elementary School | 281 | 30.9% |
| Middle School | 154 | 16.9% |
| High School | 117 | 12.9% |
| College / Undergraduate | 204 | 22.4% |
| Graduate / Professional | 18 | 2.0% |
| Total | 909 | 100.0% |
School Enrollment by Age by Funding Source in Wolf Lake
Out of a total of 909 students who are enrolled in schools in Wolf Lake, 153 (16.8%) attend a private institution, while the remaining 756 (83.2%) are enrolled in public schools. The age group of 20 to 24 year olds has the highest likelihood of being enrolled in private schools, with 114 (100.0% in the age bracket) enrolled. Conversely, the age group of 5 to 9 year old has the lowest likelihood of being enrolled in a private school, with 401 (100.0% in the age bracket) attending a public institution.
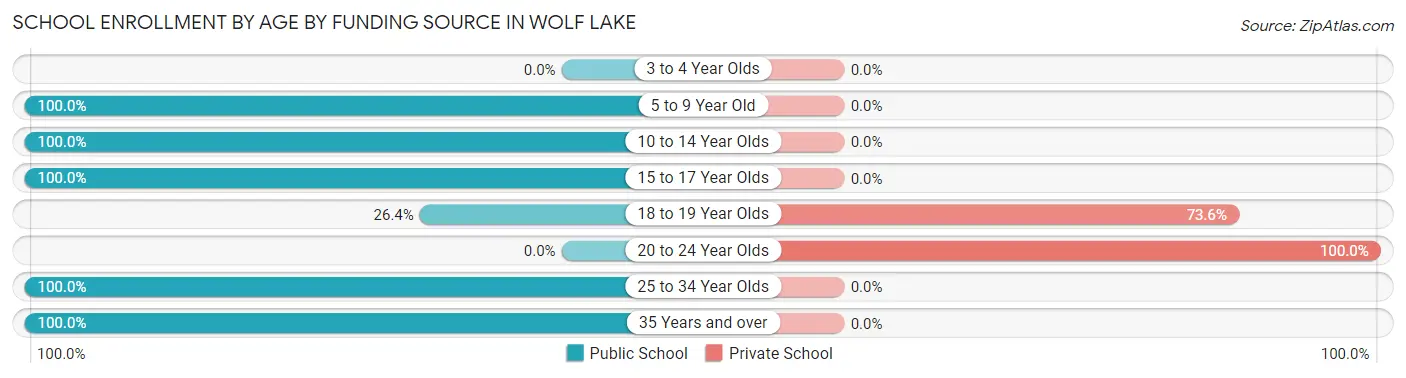
| Age Bracket | Public School | Private School |
| 3 to 4 Year Olds | 0 (0.0%) | 0 (0.0%) |
| 5 to 9 Year Old | 401 (100.0%) | 0 (0.0%) |
| 10 to 14 Year Olds | 184 (100.0%) | 0 (0.0%) |
| 15 to 17 Year Olds | 94 (100.0%) | 0 (0.0%) |
| 18 to 19 Year Olds | 14 (26.4%) | 39 (73.6%) |
| 20 to 24 Year Olds | 0 (0.0%) | 114 (100.0%) |
| 25 to 34 Year Olds | 27 (100.0%) | 0 (0.0%) |
| 35 Years and over | 36 (100.0%) | 0 (0.0%) |
| Total | 756 (83.2%) | 153 (16.8%) |
Educational Attainment by Field of Study in Wolf Lake
Science & technology (84 | 37.7%), social sciences (28 | 12.6%), physical & health sciences (21 | 9.4%), engineering (20 | 9.0%), and business (18 | 8.1%) are the most common fields of study among 223 individuals in Wolf Lake who have obtained a bachelor's degree or higher.
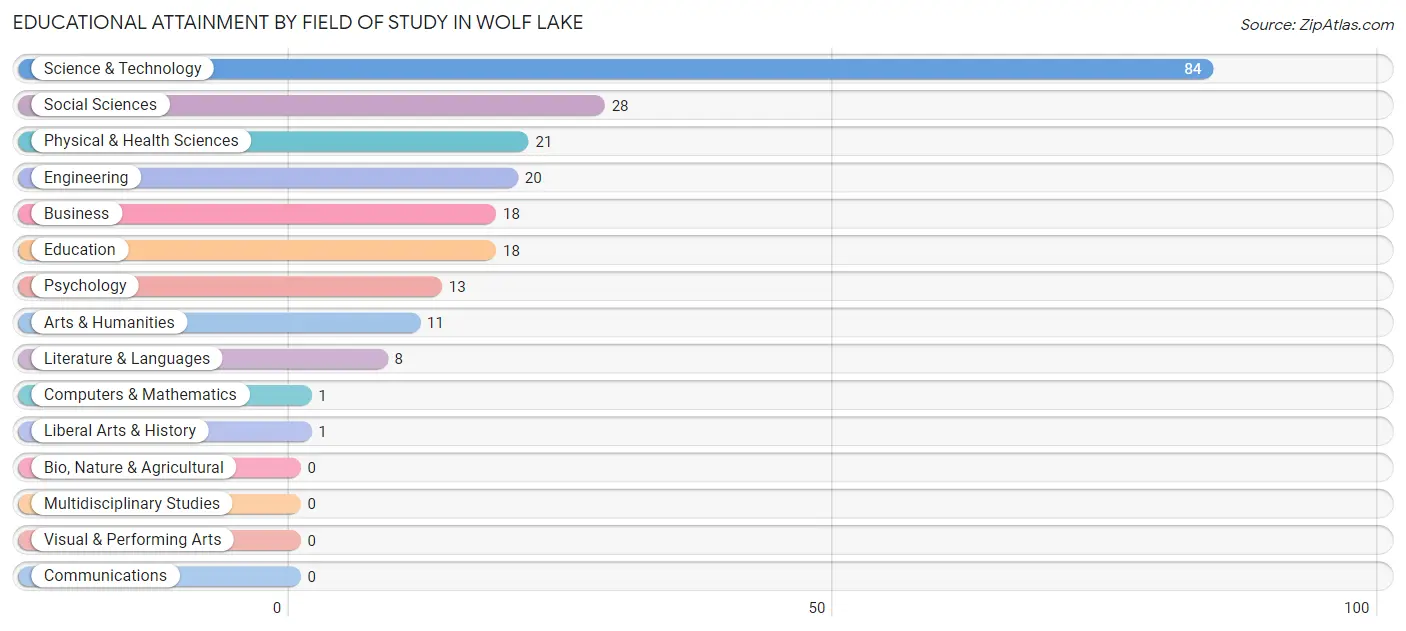
| Field of Study | # Graduates | % Graduates |
| Computers & Mathematics | 1 | 0.4% |
| Bio, Nature & Agricultural | 0 | 0.0% |
| Physical & Health Sciences | 21 | 9.4% |
| Psychology | 13 | 5.8% |
| Social Sciences | 28 | 12.6% |
| Engineering | 20 | 9.0% |
| Multidisciplinary Studies | 0 | 0.0% |
| Science & Technology | 84 | 37.7% |
| Business | 18 | 8.1% |
| Education | 18 | 8.1% |
| Literature & Languages | 8 | 3.6% |
| Liberal Arts & History | 1 | 0.4% |
| Visual & Performing Arts | 0 | 0.0% |
| Communications | 0 | 0.0% |
| Arts & Humanities | 11 | 4.9% |
| Total | 223 | 100.0% |
Transportation & Commute in Wolf Lake
Vehicle Availability by Sex in Wolf Lake
The most prevalent vehicle ownership categories in Wolf Lake are males with 2 vehicles (533, accounting for 51.1%) and females with 2 vehicles (436, making up 71.3%).
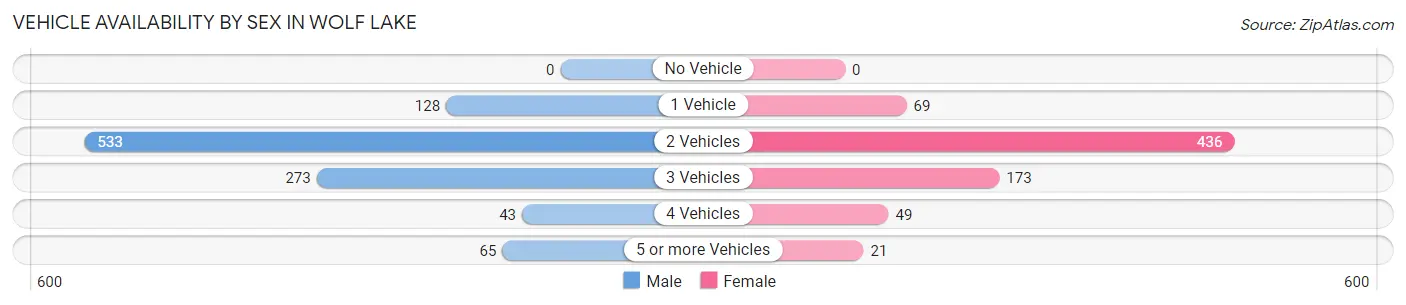
| Vehicles Available | Male | Female |
| No Vehicle | 0 (0.0%) | 0 (0.0%) |
| 1 Vehicle | 128 (12.3%) | 69 (9.2%) |
| 2 Vehicles | 533 (51.1%) | 436 (58.3%) |
| 3 Vehicles | 273 (26.2%) | 173 (23.1%) |
| 4 Vehicles | 43 (4.1%) | 49 (6.6%) |
| 5 or more Vehicles | 65 (6.2%) | 21 (2.8%) |
| Total | 1,042 (100.0%) | 748 (100.0%) |
Commute Time in Wolf Lake
The most frequently occuring commute durations in Wolf Lake are 15 to 19 minutes (387 commuters, 22.0%), 20 to 24 minutes (323 commuters, 18.4%), and 45 to 59 minutes (190 commuters, 10.8%).
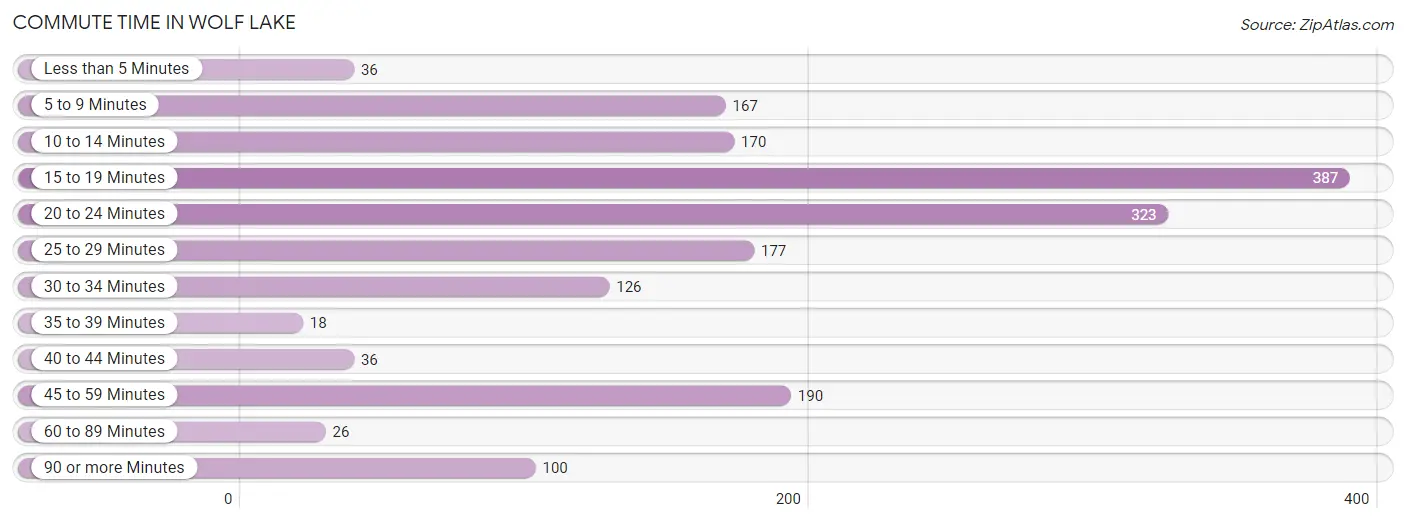
| Commute Time | # Commuters | % Commuters |
| Less than 5 Minutes | 36 | 2.1% |
| 5 to 9 Minutes | 167 | 9.5% |
| 10 to 14 Minutes | 170 | 9.7% |
| 15 to 19 Minutes | 387 | 22.0% |
| 20 to 24 Minutes | 323 | 18.4% |
| 25 to 29 Minutes | 177 | 10.1% |
| 30 to 34 Minutes | 126 | 7.2% |
| 35 to 39 Minutes | 18 | 1.0% |
| 40 to 44 Minutes | 36 | 2.1% |
| 45 to 59 Minutes | 190 | 10.8% |
| 60 to 89 Minutes | 26 | 1.5% |
| 90 or more Minutes | 100 | 5.7% |
Commute Time by Sex in Wolf Lake
The most common commute times in Wolf Lake are 20 to 24 minutes (264 commuters, 25.6%) for males and 15 to 19 minutes (161 commuters, 22.2%) for females.
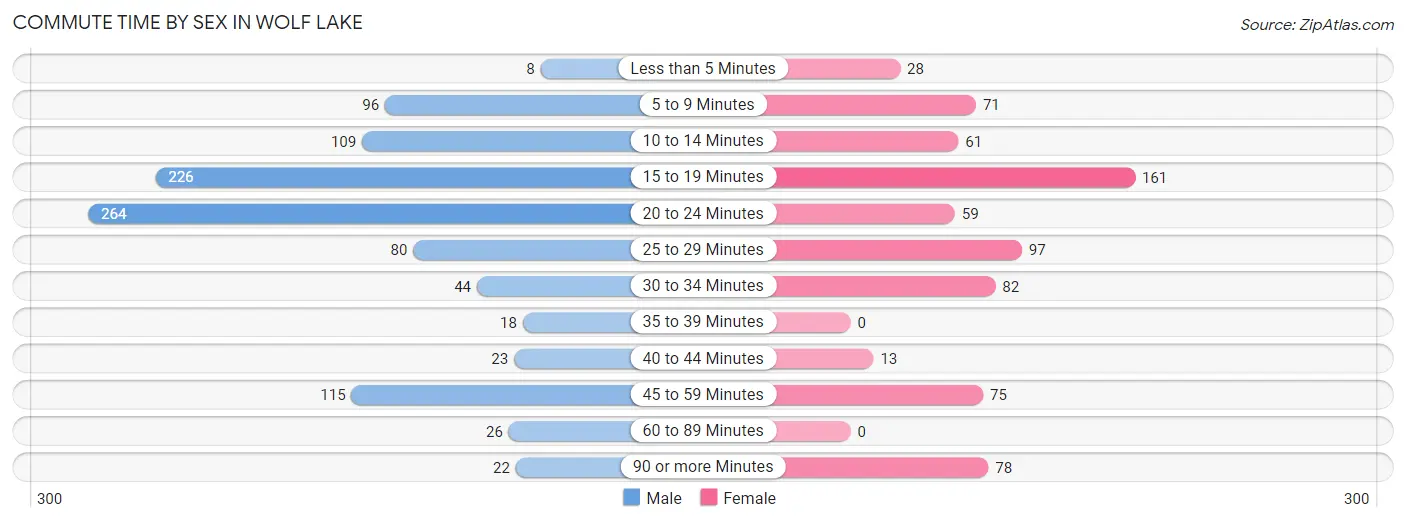
| Commute Time | Male | Female |
| Less than 5 Minutes | 8 (0.8%) | 28 (3.9%) |
| 5 to 9 Minutes | 96 (9.3%) | 71 (9.8%) |
| 10 to 14 Minutes | 109 (10.6%) | 61 (8.4%) |
| 15 to 19 Minutes | 226 (21.9%) | 161 (22.2%) |
| 20 to 24 Minutes | 264 (25.6%) | 59 (8.1%) |
| 25 to 29 Minutes | 80 (7.8%) | 97 (13.4%) |
| 30 to 34 Minutes | 44 (4.3%) | 82 (11.3%) |
| 35 to 39 Minutes | 18 (1.8%) | 0 (0.0%) |
| 40 to 44 Minutes | 23 (2.2%) | 13 (1.8%) |
| 45 to 59 Minutes | 115 (11.2%) | 75 (10.3%) |
| 60 to 89 Minutes | 26 (2.5%) | 0 (0.0%) |
| 90 or more Minutes | 22 (2.1%) | 78 (10.8%) |
Time of Departure to Work by Sex in Wolf Lake
The most frequent times of departure to work in Wolf Lake are 12:00 PM to 3:59 PM (191, 18.5%) for males and 7:00 AM to 7:29 AM (196, 27.0%) for females.
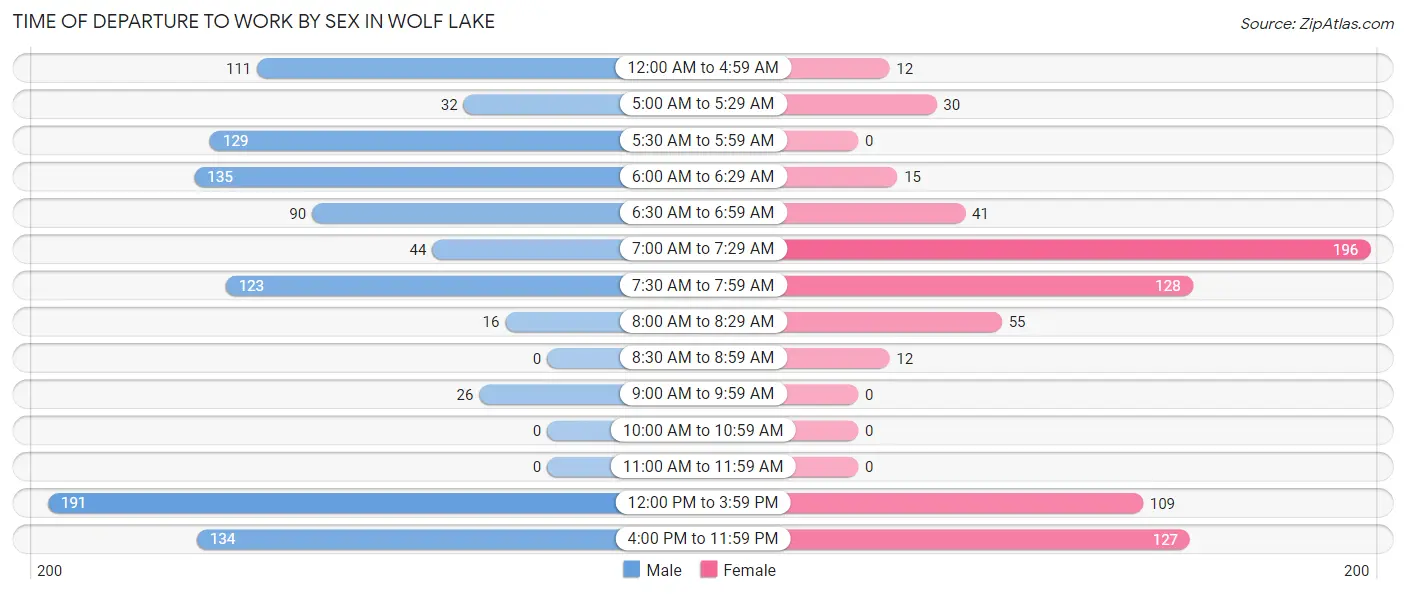
| Time of Departure | Male | Female |
| 12:00 AM to 4:59 AM | 111 (10.8%) | 12 (1.7%) |
| 5:00 AM to 5:29 AM | 32 (3.1%) | 30 (4.1%) |
| 5:30 AM to 5:59 AM | 129 (12.5%) | 0 (0.0%) |
| 6:00 AM to 6:29 AM | 135 (13.1%) | 15 (2.1%) |
| 6:30 AM to 6:59 AM | 90 (8.7%) | 41 (5.7%) |
| 7:00 AM to 7:29 AM | 44 (4.3%) | 196 (27.0%) |
| 7:30 AM to 7:59 AM | 123 (11.9%) | 128 (17.7%) |
| 8:00 AM to 8:29 AM | 16 (1.5%) | 55 (7.6%) |
| 8:30 AM to 8:59 AM | 0 (0.0%) | 12 (1.7%) |
| 9:00 AM to 9:59 AM | 26 (2.5%) | 0 (0.0%) |
| 10:00 AM to 10:59 AM | 0 (0.0%) | 0 (0.0%) |
| 11:00 AM to 11:59 AM | 0 (0.0%) | 0 (0.0%) |
| 12:00 PM to 3:59 PM | 191 (18.5%) | 109 (15.0%) |
| 4:00 PM to 11:59 PM | 134 (13.0%) | 127 (17.5%) |
| Total | 1,031 (100.0%) | 725 (100.0%) |
Housing Occupancy in Wolf Lake
Occupancy by Ownership in Wolf Lake
Of the total 1,569 dwellings in Wolf Lake, owner-occupied units account for 1,349 (86.0%), while renter-occupied units make up 220 (14.0%).
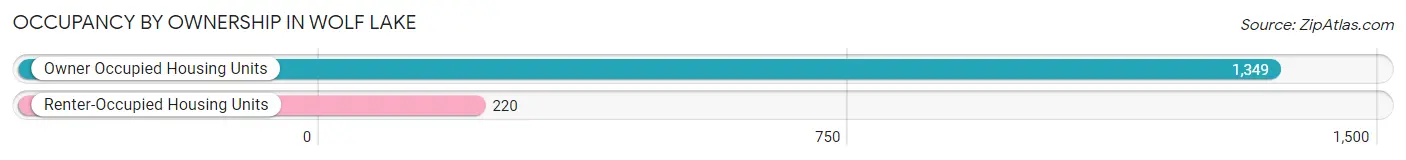
| Occupancy | # Housing Units | % Housing Units |
| Owner Occupied Housing Units | 1,349 | 86.0% |
| Renter-Occupied Housing Units | 220 | 14.0% |
| Total Occupied Housing Units | 1,569 | 100.0% |
Occupancy by Household Size in Wolf Lake
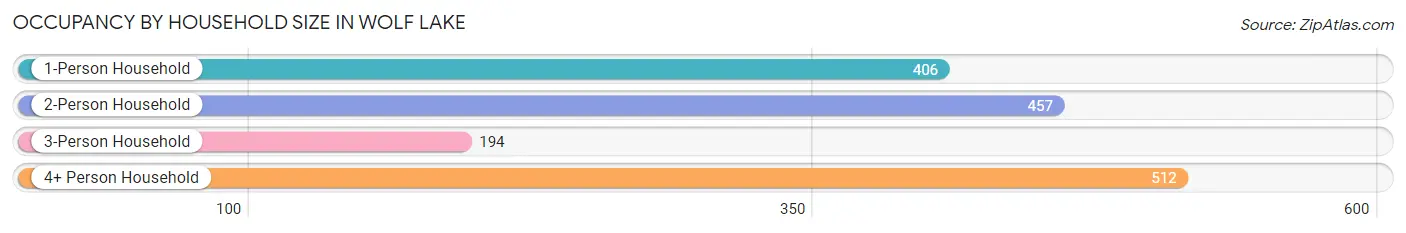
| Household Size | # Housing Units | % Housing Units |
| 1-Person Household | 406 | 25.9% |
| 2-Person Household | 457 | 29.1% |
| 3-Person Household | 194 | 12.4% |
| 4+ Person Household | 512 | 32.6% |
| Total Housing Units | 1,569 | 100.0% |
Occupancy by Ownership by Household Size in Wolf Lake
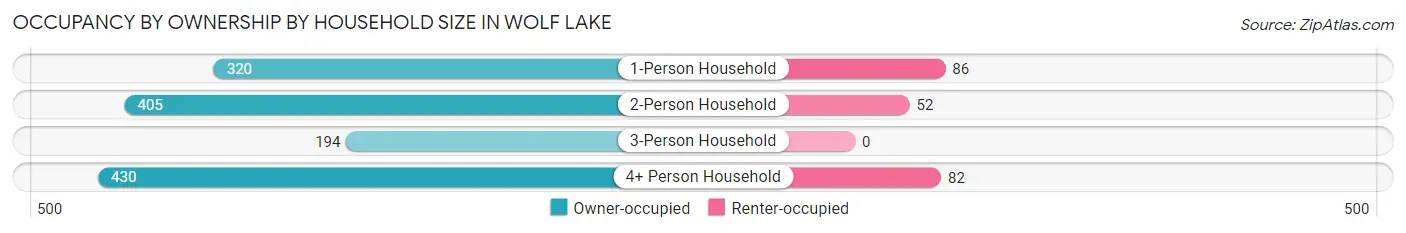
| Household Size | Owner-occupied | Renter-occupied |
| 1-Person Household | 320 (78.8%) | 86 (21.2%) |
| 2-Person Household | 405 (88.6%) | 52 (11.4%) |
| 3-Person Household | 194 (100.0%) | 0 (0.0%) |
| 4+ Person Household | 430 (84.0%) | 82 (16.0%) |
| Total Housing Units | 1,349 (86.0%) | 220 (14.0%) |
Occupancy by Educational Attainment in Wolf Lake
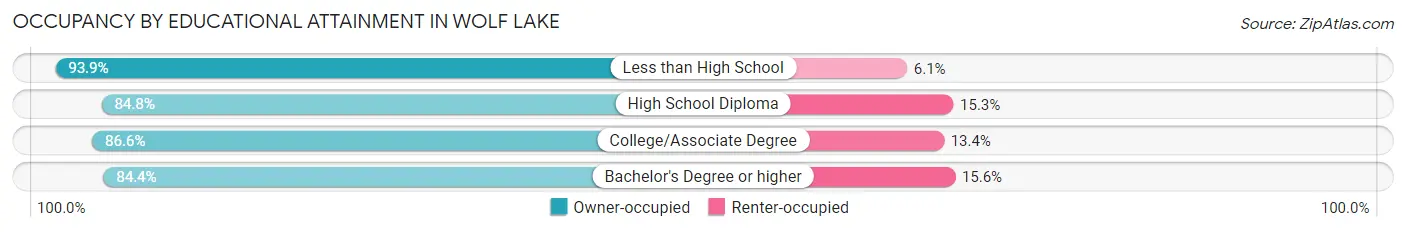
| Household Size | Owner-occupied | Renter-occupied |
| Less than High School | 108 (93.9%) | 7 (6.1%) |
| High School Diploma | 706 (84.8%) | 127 (15.2%) |
| College/Associate Degree | 427 (86.6%) | 66 (13.4%) |
| Bachelor's Degree or higher | 108 (84.4%) | 20 (15.6%) |
Occupancy by Age of Householder in Wolf Lake
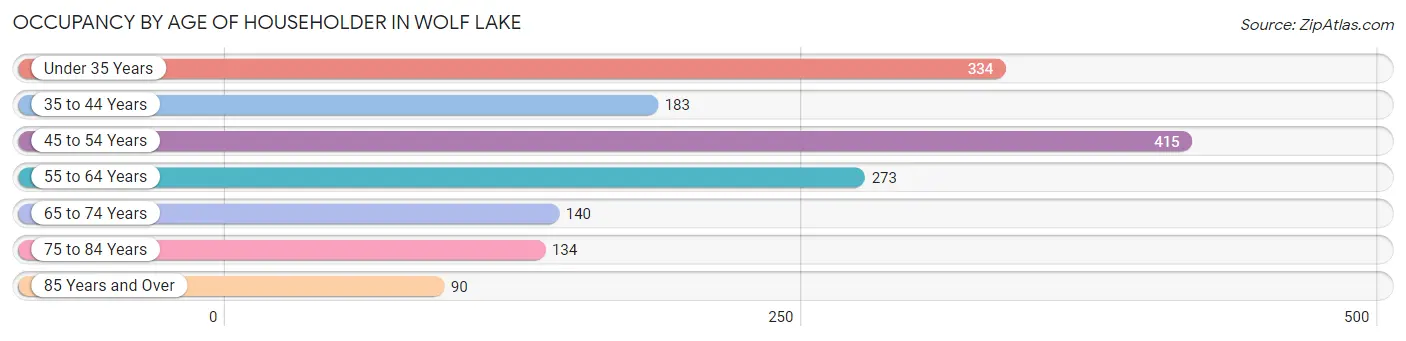
| Age Bracket | # Households | % Households |
| Under 35 Years | 334 | 21.3% |
| 35 to 44 Years | 183 | 11.7% |
| 45 to 54 Years | 415 | 26.5% |
| 55 to 64 Years | 273 | 17.4% |
| 65 to 74 Years | 140 | 8.9% |
| 75 to 84 Years | 134 | 8.5% |
| 85 Years and Over | 90 | 5.7% |
| Total | 1,569 | 100.0% |
Housing Finances in Wolf Lake
Median Income by Occupancy in Wolf Lake
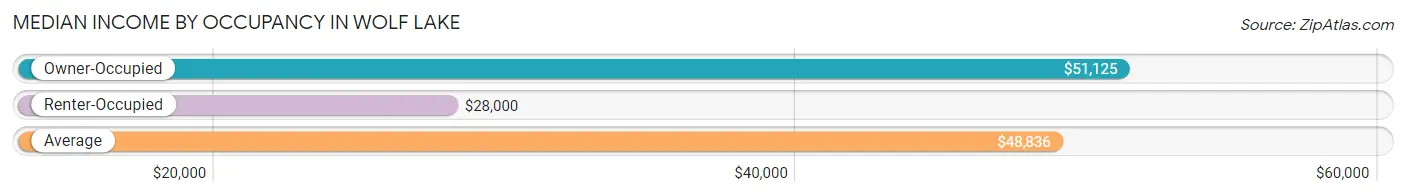
| Occupancy Type | # Households | Median Income |
| Owner-Occupied | 1,349 (86.0%) | $51,125 |
| Renter-Occupied | 220 (14.0%) | $28,000 |
| Average | 1,569 (100.0%) | $48,836 |
Occupancy by Householder Income Bracket in Wolf Lake
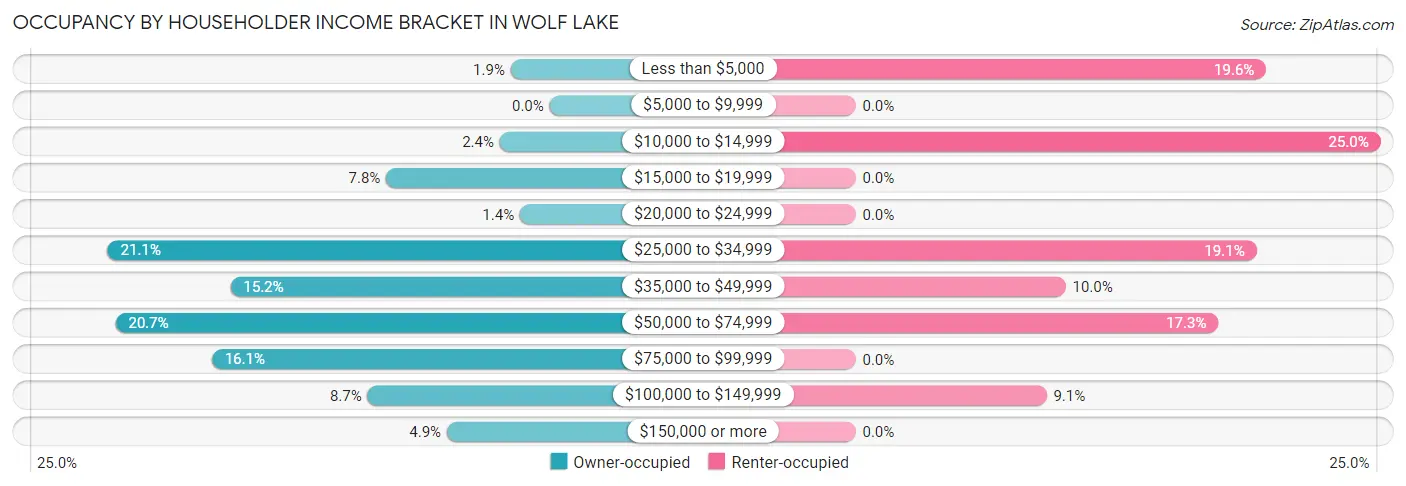
| Income Bracket | Owner-occupied | Renter-occupied |
| Less than $5,000 | 25 (1.8%) | 43 (19.6%) |
| $5,000 to $9,999 | 0 (0.0%) | 0 (0.0%) |
| $10,000 to $14,999 | 32 (2.4%) | 55 (25.0%) |
| $15,000 to $19,999 | 105 (7.8%) | 0 (0.0%) |
| $20,000 to $24,999 | 19 (1.4%) | 0 (0.0%) |
| $25,000 to $34,999 | 284 (21.0%) | 42 (19.1%) |
| $35,000 to $49,999 | 205 (15.2%) | 22 (10.0%) |
| $50,000 to $74,999 | 279 (20.7%) | 38 (17.3%) |
| $75,000 to $99,999 | 217 (16.1%) | 0 (0.0%) |
| $100,000 to $149,999 | 117 (8.7%) | 20 (9.1%) |
| $150,000 or more | 66 (4.9%) | 0 (0.0%) |
| Total | 1,349 (100.0%) | 220 (100.0%) |
Monthly Housing Cost Tiers in Wolf Lake
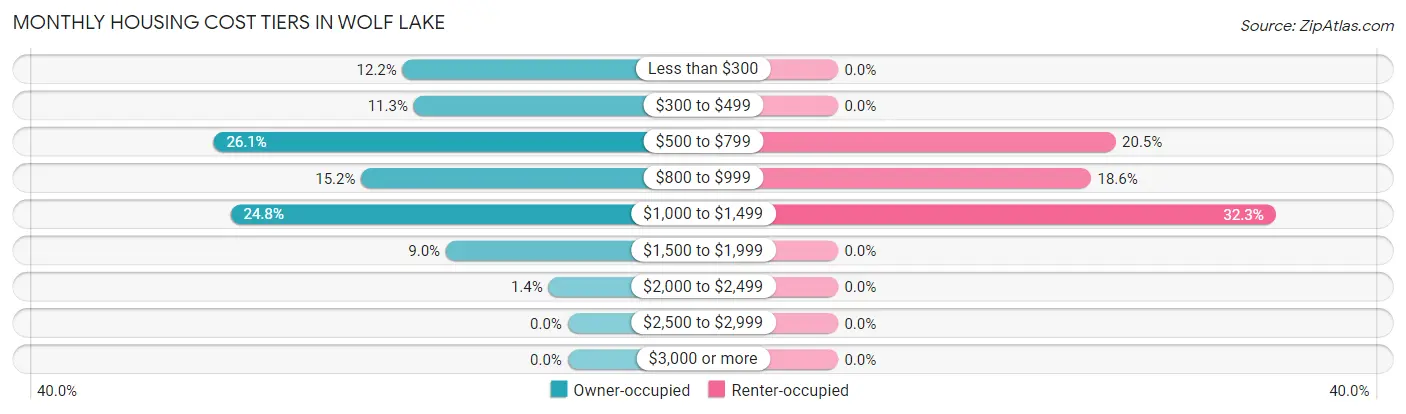
| Monthly Cost | Owner-occupied | Renter-occupied |
| Less than $300 | 164 (12.2%) | 0 (0.0%) |
| $300 to $499 | 153 (11.3%) | 0 (0.0%) |
| $500 to $799 | 352 (26.1%) | 45 (20.4%) |
| $800 to $999 | 205 (15.2%) | 41 (18.6%) |
| $1,000 to $1,499 | 335 (24.8%) | 71 (32.3%) |
| $1,500 to $1,999 | 121 (9.0%) | 0 (0.0%) |
| $2,000 to $2,499 | 19 (1.4%) | 0 (0.0%) |
| $2,500 to $2,999 | 0 (0.0%) | 0 (0.0%) |
| $3,000 or more | 0 (0.0%) | 0 (0.0%) |
| Total | 1,349 (100.0%) | 220 (100.0%) |
Physical Housing Characteristics in Wolf Lake
Housing Structures in Wolf Lake
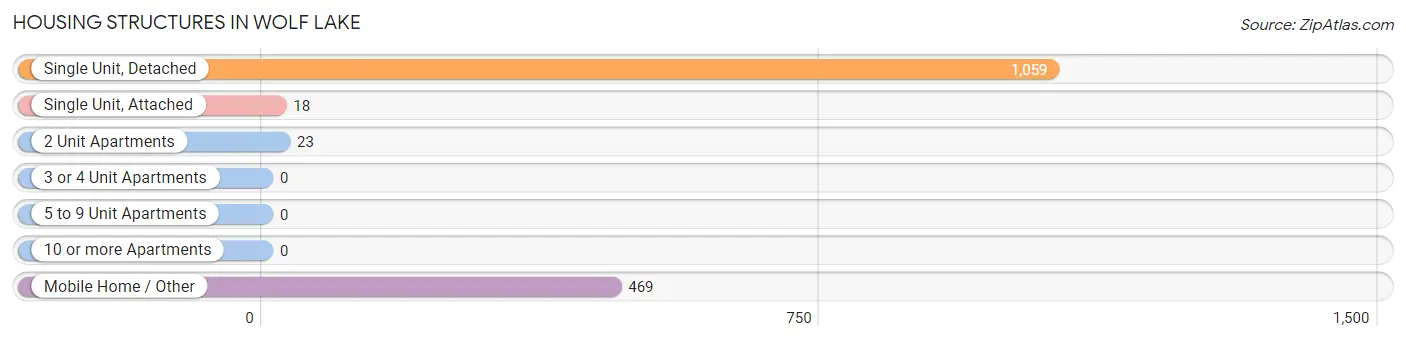
| Structure Type | # Housing Units | % Housing Units |
| Single Unit, Detached | 1,059 | 67.5% |
| Single Unit, Attached | 18 | 1.1% |
| 2 Unit Apartments | 23 | 1.5% |
| 3 or 4 Unit Apartments | 0 | 0.0% |
| 5 to 9 Unit Apartments | 0 | 0.0% |
| 10 or more Apartments | 0 | 0.0% |
| Mobile Home / Other | 469 | 29.9% |
| Total | 1,569 | 100.0% |
Housing Structures by Occupancy in Wolf Lake
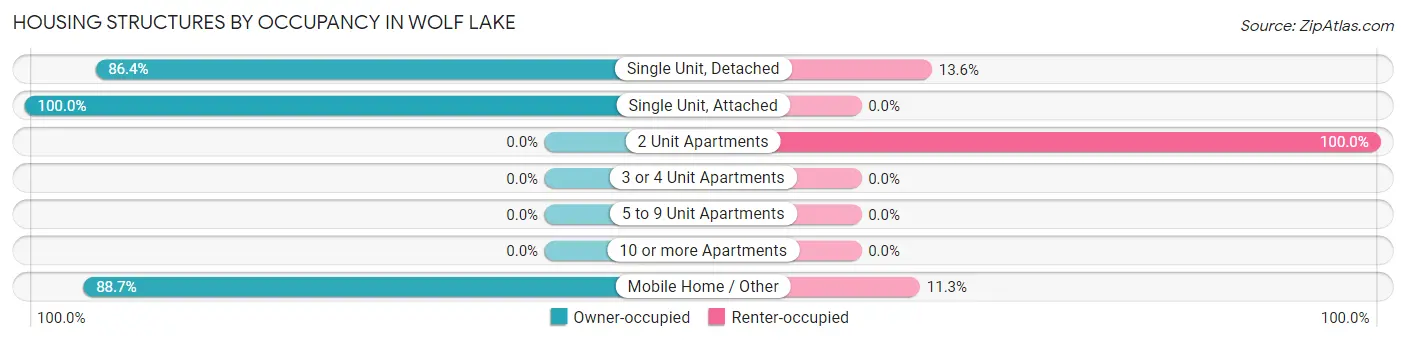
| Structure Type | Owner-occupied | Renter-occupied |
| Single Unit, Detached | 915 (86.4%) | 144 (13.6%) |
| Single Unit, Attached | 18 (100.0%) | 0 (0.0%) |
| 2 Unit Apartments | 0 (0.0%) | 23 (100.0%) |
| 3 or 4 Unit Apartments | 0 (0.0%) | 0 (0.0%) |
| 5 to 9 Unit Apartments | 0 (0.0%) | 0 (0.0%) |
| 10 or more Apartments | 0 (0.0%) | 0 (0.0%) |
| Mobile Home / Other | 416 (88.7%) | 53 (11.3%) |
| Total | 1,349 (86.0%) | 220 (14.0%) |
Housing Structures by Number of Rooms in Wolf Lake
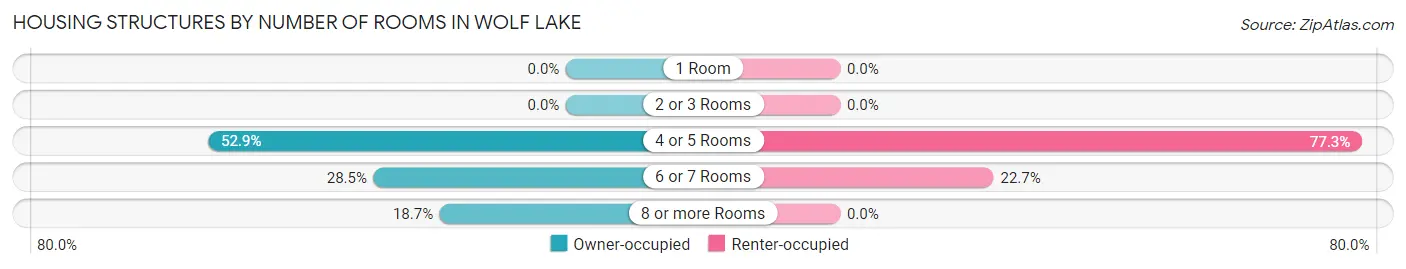
| Number of Rooms | Owner-occupied | Renter-occupied |
| 1 Room | 0 (0.0%) | 0 (0.0%) |
| 2 or 3 Rooms | 0 (0.0%) | 0 (0.0%) |
| 4 or 5 Rooms | 713 (52.8%) | 170 (77.3%) |
| 6 or 7 Rooms | 384 (28.5%) | 50 (22.7%) |
| 8 or more Rooms | 252 (18.7%) | 0 (0.0%) |
| Total | 1,349 (100.0%) | 220 (100.0%) |
Housing Structure by Heating Type in Wolf Lake
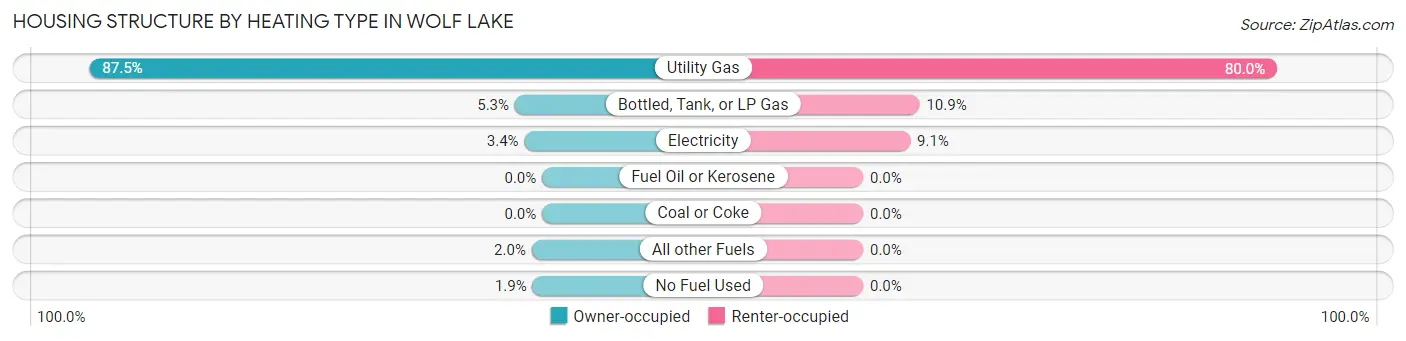
| Heating Type | Owner-occupied | Renter-occupied |
| Utility Gas | 1,180 (87.5%) | 176 (80.0%) |
| Bottled, Tank, or LP Gas | 71 (5.3%) | 24 (10.9%) |
| Electricity | 46 (3.4%) | 20 (9.1%) |
| Fuel Oil or Kerosene | 0 (0.0%) | 0 (0.0%) |
| Coal or Coke | 0 (0.0%) | 0 (0.0%) |
| All other Fuels | 27 (2.0%) | 0 (0.0%) |
| No Fuel Used | 25 (1.8%) | 0 (0.0%) |
| Total | 1,349 (100.0%) | 220 (100.0%) |
Household Vehicle Usage in Wolf Lake
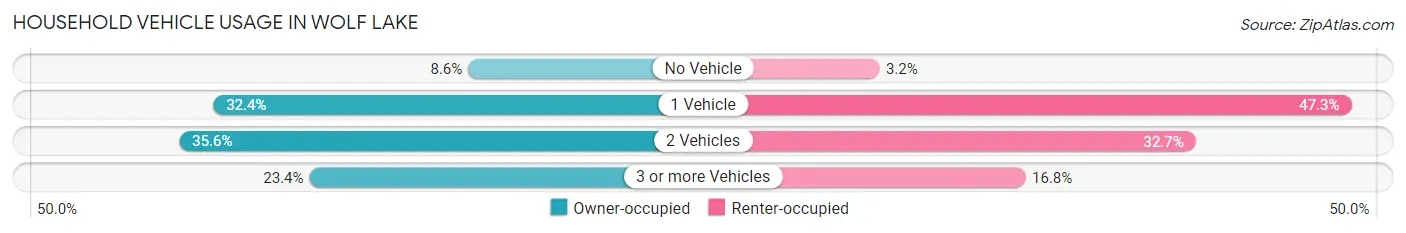
| Vehicles per Household | Owner-occupied | Renter-occupied |
| No Vehicle | 116 (8.6%) | 7 (3.2%) |
| 1 Vehicle | 437 (32.4%) | 104 (47.3%) |
| 2 Vehicles | 480 (35.6%) | 72 (32.7%) |
| 3 or more Vehicles | 316 (23.4%) | 37 (16.8%) |
| Total | 1,349 (100.0%) | 220 (100.0%) |
Real Estate & Mortgages in Wolf Lake
Real Estate and Mortgage Overview in Wolf Lake
| Characteristic | Without Mortgage | With Mortgage |
| Housing Units | 656 | 693 |
| Median Property Value | - | - |
| Median Household Income | $41,833 | $47 |
| Monthly Housing Costs | $509 | $0 |
| Real Estate Taxes | $1,645 | $37 |
Property Value by Mortgage Status in Wolf Lake
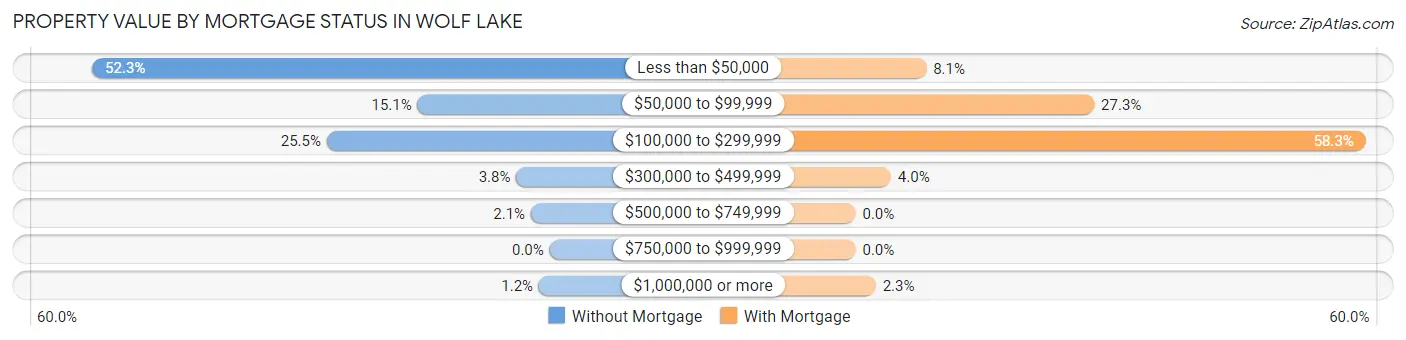
| Property Value | Without Mortgage | With Mortgage |
| Less than $50,000 | 343 (52.3%) | 56 (8.1%) |
| $50,000 to $99,999 | 99 (15.1%) | 189 (27.3%) |
| $100,000 to $299,999 | 167 (25.5%) | 404 (58.3%) |
| $300,000 to $499,999 | 25 (3.8%) | 28 (4.0%) |
| $500,000 to $749,999 | 14 (2.1%) | 0 (0.0%) |
| $750,000 to $999,999 | 0 (0.0%) | 0 (0.0%) |
| $1,000,000 or more | 8 (1.2%) | 16 (2.3%) |
| Total | 656 (100.0%) | 693 (100.0%) |
Household Income by Mortgage Status in Wolf Lake
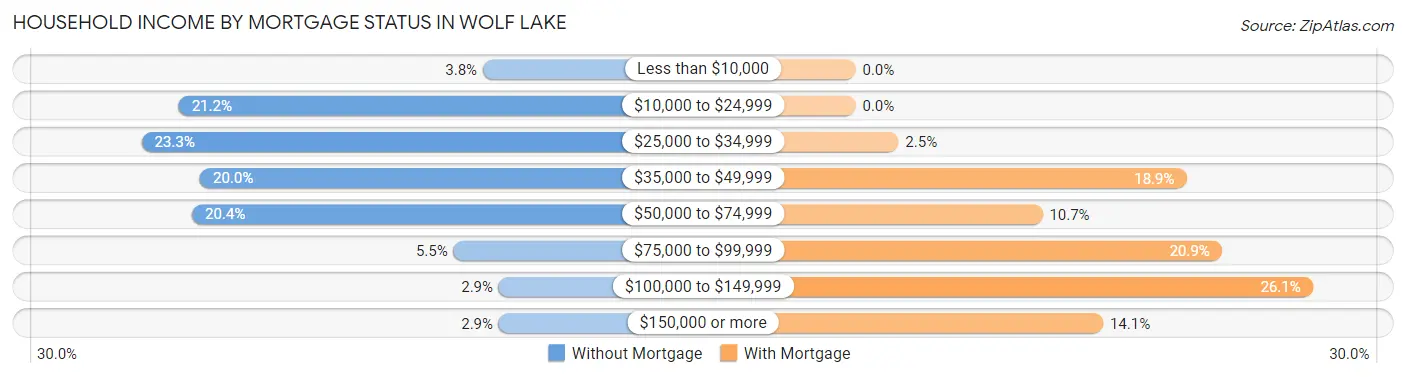
| Household Income | Without Mortgage | With Mortgage |
| Less than $10,000 | 25 (3.8%) | 0 (0.0%) |
| $10,000 to $24,999 | 139 (21.2%) | 0 (0.0%) |
| $25,000 to $34,999 | 153 (23.3%) | 17 (2.5%) |
| $35,000 to $49,999 | 131 (20.0%) | 131 (18.9%) |
| $50,000 to $74,999 | 134 (20.4%) | 74 (10.7%) |
| $75,000 to $99,999 | 36 (5.5%) | 145 (20.9%) |
| $100,000 to $149,999 | 19 (2.9%) | 181 (26.1%) |
| $150,000 or more | 19 (2.9%) | 98 (14.1%) |
| Total | 656 (100.0%) | 693 (100.0%) |
Property Value to Household Income Ratio in Wolf Lake
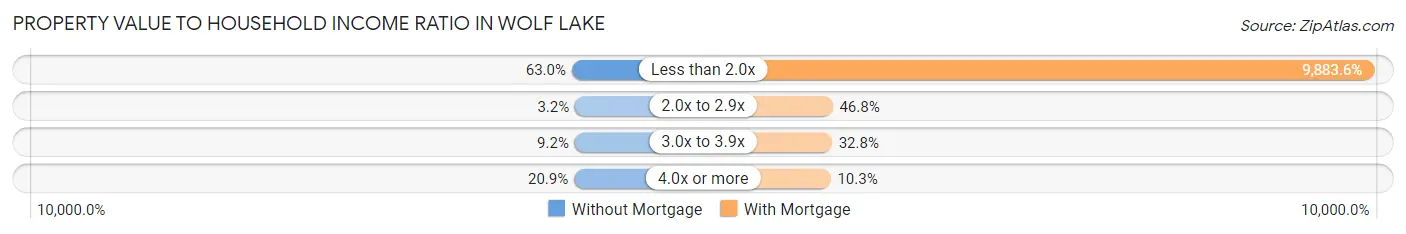
| Value-to-Income Ratio | Without Mortgage | With Mortgage |
| Less than 2.0x | 413 (63.0%) | 68,493 (9,883.5%) |
| 2.0x to 2.9x | 21 (3.2%) | 324 (46.8%) |
| 3.0x to 3.9x | 60 (9.1%) | 227 (32.8%) |
| 4.0x or more | 137 (20.9%) | 71 (10.2%) |
| Total | 656 (100.0%) | 693 (100.0%) |
Real Estate Taxes by Mortgage Status in Wolf Lake
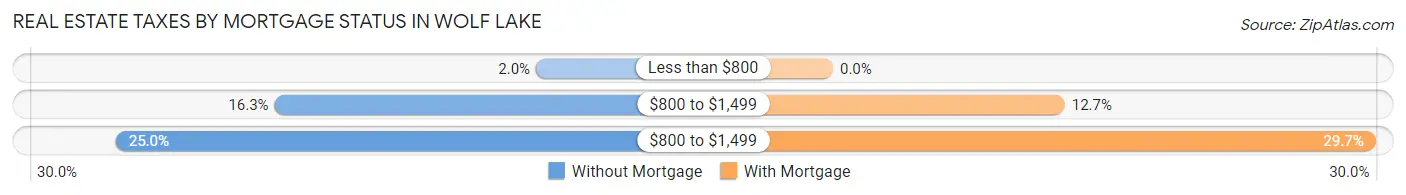
| Property Taxes | Without Mortgage | With Mortgage |
| Less than $800 | 13 (2.0%) | 0 (0.0%) |
| $800 to $1,499 | 107 (16.3%) | 88 (12.7%) |
| $800 to $1,499 | 164 (25.0%) | 206 (29.7%) |
| Total | 656 (100.0%) | 693 (100.0%) |
Health & Disability in Wolf Lake
Health Insurance Coverage by Age in Wolf Lake
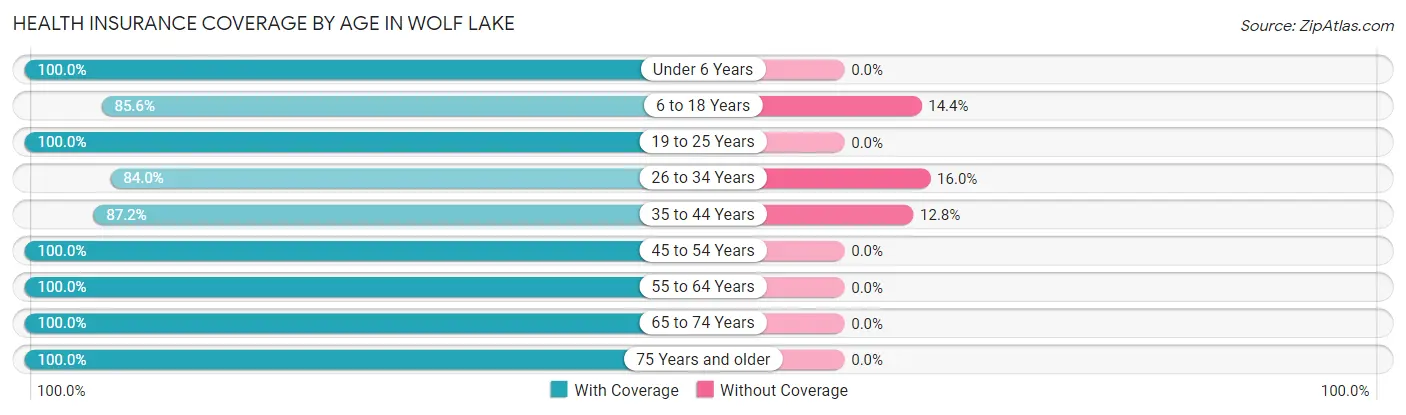
| Age Bracket | With Coverage | Without Coverage |
| Under 6 Years | 259 (100.0%) | 0 (0.0%) |
| 6 to 18 Years | 513 (85.6%) | 86 (14.4%) |
| 19 to 25 Years | 615 (100.0%) | 0 (0.0%) |
| 26 to 34 Years | 425 (84.0%) | 81 (16.0%) |
| 35 to 44 Years | 367 (87.2%) | 54 (12.8%) |
| 45 to 54 Years | 637 (100.0%) | 0 (0.0%) |
| 55 to 64 Years | 501 (100.0%) | 0 (0.0%) |
| 65 to 74 Years | 260 (100.0%) | 0 (0.0%) |
| 75 Years and older | 312 (100.0%) | 0 (0.0%) |
| Total | 3,889 (94.6%) | 221 (5.4%) |
Health Insurance Coverage by Citizenship Status in Wolf Lake
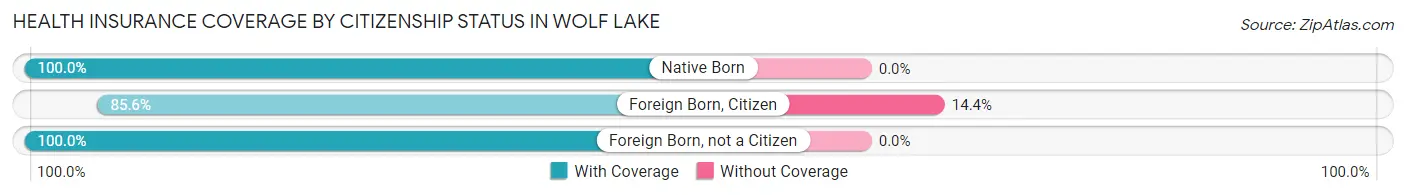
| Citizenship Status | With Coverage | Without Coverage |
| Native Born | 259 (100.0%) | 0 (0.0%) |
| Foreign Born, Citizen | 513 (85.6%) | 86 (14.4%) |
| Foreign Born, not a Citizen | 615 (100.0%) | 0 (0.0%) |
Health Insurance Coverage by Household Income in Wolf Lake
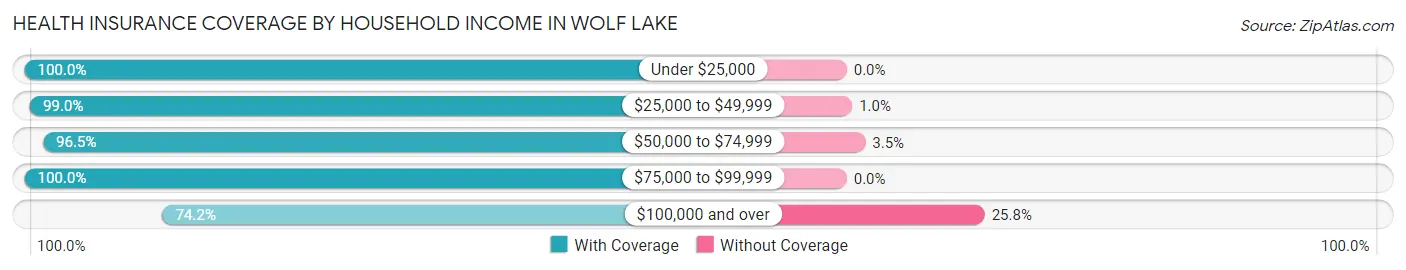
| Household Income | With Coverage | Without Coverage |
| Under $25,000 | 390 (100.0%) | 0 (0.0%) |
| $25,000 to $49,999 | 1,671 (99.0%) | 17 (1.0%) |
| $50,000 to $74,999 | 780 (96.5%) | 28 (3.5%) |
| $75,000 to $99,999 | 514 (100.0%) | 0 (0.0%) |
| $100,000 and over | 505 (74.2%) | 176 (25.8%) |
Public vs Private Health Insurance Coverage by Age in Wolf Lake
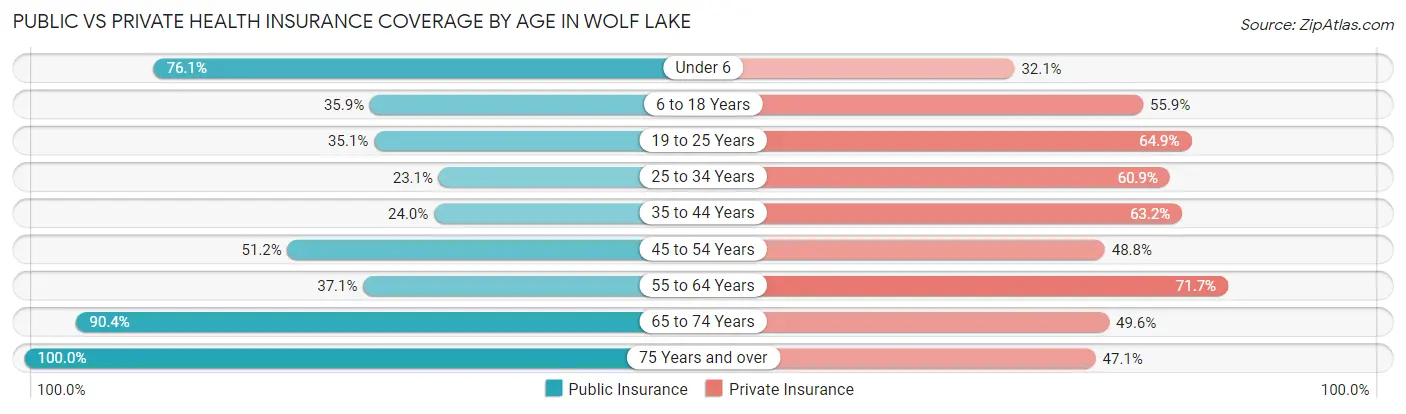
| Age Bracket | Public Insurance | Private Insurance |
| Under 6 | 197 (76.1%) | 83 (32.1%) |
| 6 to 18 Years | 215 (35.9%) | 335 (55.9%) |
| 19 to 25 Years | 216 (35.1%) | 399 (64.9%) |
| 25 to 34 Years | 117 (23.1%) | 308 (60.9%) |
| 35 to 44 Years | 101 (24.0%) | 266 (63.2%) |
| 45 to 54 Years | 326 (51.2%) | 311 (48.8%) |
| 55 to 64 Years | 186 (37.1%) | 359 (71.7%) |
| 65 to 74 Years | 235 (90.4%) | 129 (49.6%) |
| 75 Years and over | 312 (100.0%) | 147 (47.1%) |
| Total | 1,905 (46.4%) | 2,337 (56.9%) |
Disability Status by Sex by Age in Wolf Lake
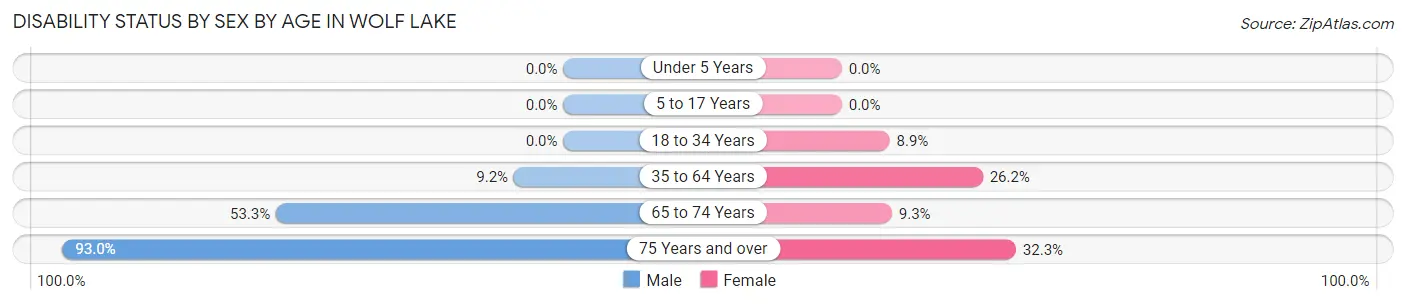
| Age Bracket | Male | Female |
| Under 5 Years | 0 (0.0%) | 0 (0.0%) |
| 5 to 17 Years | 0 (0.0%) | 0 (0.0%) |
| 18 to 34 Years | 0 (0.0%) | 50 (8.9%) |
| 35 to 64 Years | 77 (9.2%) | 188 (26.2%) |
| 65 to 74 Years | 64 (53.3%) | 13 (9.3%) |
| 75 Years and over | 106 (93.0%) | 64 (32.3%) |
Disability Class by Sex by Age in Wolf Lake
Disability Class: Hearing Difficulty
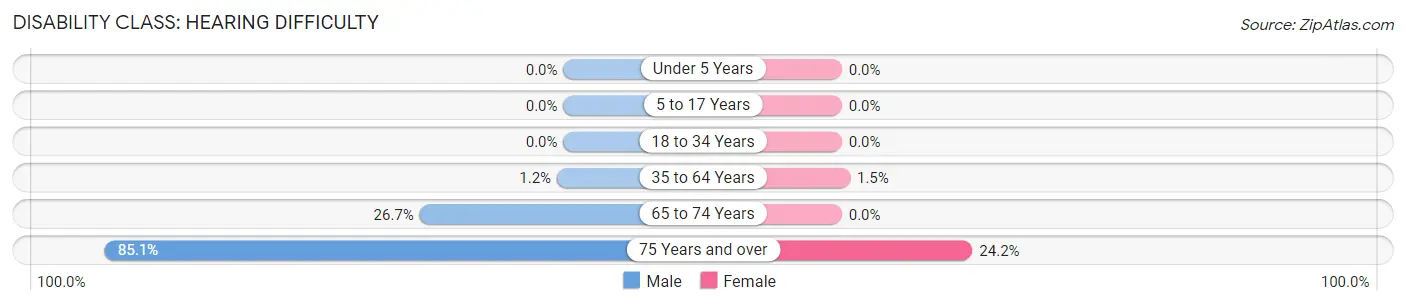
| Age Bracket | Male | Female |
| Under 5 Years | 0 (0.0%) | 0 (0.0%) |
| 5 to 17 Years | 0 (0.0%) | 0 (0.0%) |
| 18 to 34 Years | 0 (0.0%) | 0 (0.0%) |
| 35 to 64 Years | 10 (1.2%) | 11 (1.5%) |
| 65 to 74 Years | 32 (26.7%) | 0 (0.0%) |
| 75 Years and over | 97 (85.1%) | 48 (24.2%) |
Disability Class: Vision Difficulty
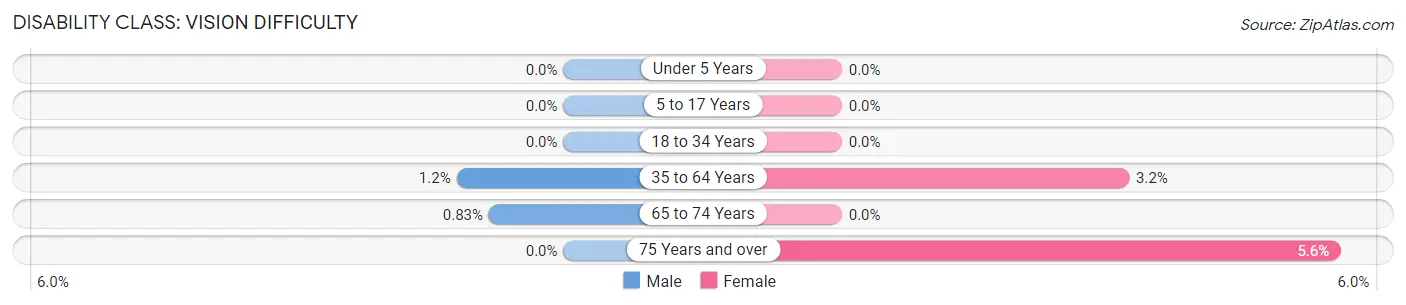
| Age Bracket | Male | Female |
| Under 5 Years | 0 (0.0%) | 0 (0.0%) |
| 5 to 17 Years | 0 (0.0%) | 0 (0.0%) |
| 18 to 34 Years | 0 (0.0%) | 0 (0.0%) |
| 35 to 64 Years | 10 (1.2%) | 23 (3.2%) |
| 65 to 74 Years | 1 (0.8%) | 0 (0.0%) |
| 75 Years and over | 0 (0.0%) | 11 (5.6%) |
Disability Class: Cognitive Difficulty
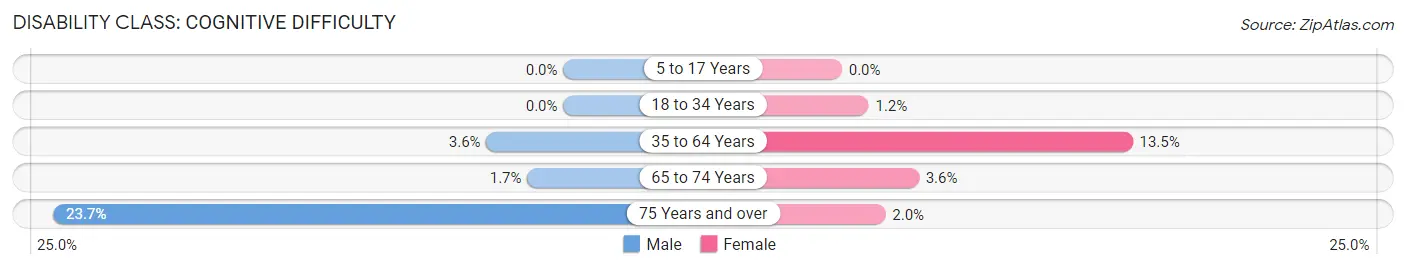
| Age Bracket | Male | Female |
| 5 to 17 Years | 0 (0.0%) | 0 (0.0%) |
| 18 to 34 Years | 0 (0.0%) | 7 (1.2%) |
| 35 to 64 Years | 30 (3.6%) | 97 (13.5%) |
| 65 to 74 Years | 2 (1.7%) | 5 (3.6%) |
| 75 Years and over | 27 (23.7%) | 4 (2.0%) |
Disability Class: Ambulatory Difficulty
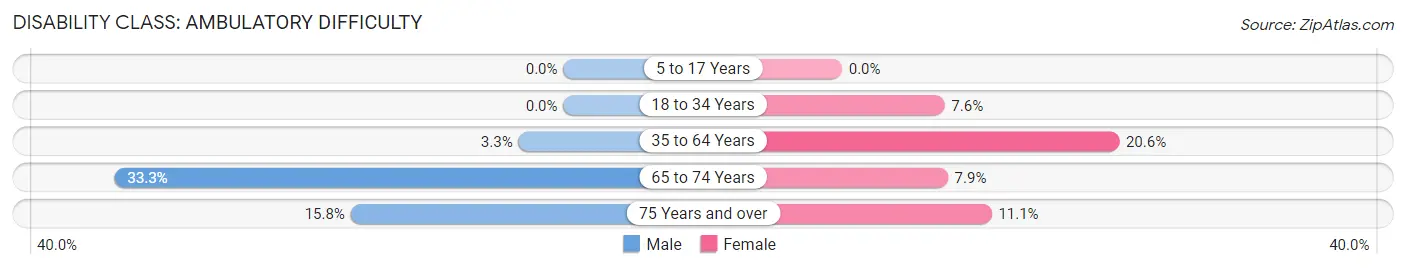
| Age Bracket | Male | Female |
| 5 to 17 Years | 0 (0.0%) | 0 (0.0%) |
| 18 to 34 Years | 0 (0.0%) | 43 (7.6%) |
| 35 to 64 Years | 28 (3.3%) | 148 (20.6%) |
| 65 to 74 Years | 40 (33.3%) | 11 (7.9%) |
| 75 Years and over | 18 (15.8%) | 22 (11.1%) |
Disability Class: Self-Care Difficulty
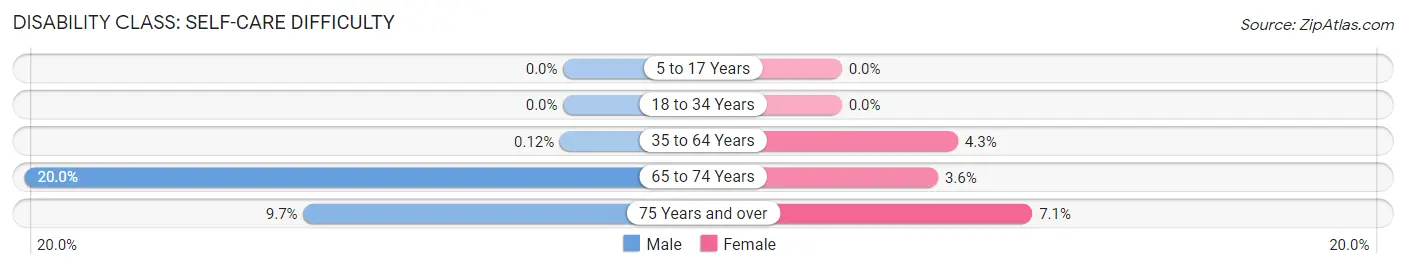
| Age Bracket | Male | Female |
| 5 to 17 Years | 0 (0.0%) | 0 (0.0%) |
| 18 to 34 Years | 0 (0.0%) | 0 (0.0%) |
| 35 to 64 Years | 1 (0.1%) | 31 (4.3%) |
| 65 to 74 Years | 24 (20.0%) | 5 (3.6%) |
| 75 Years and over | 11 (9.7%) | 14 (7.1%) |
Technology Access in Wolf Lake
Computing Device Access in Wolf Lake
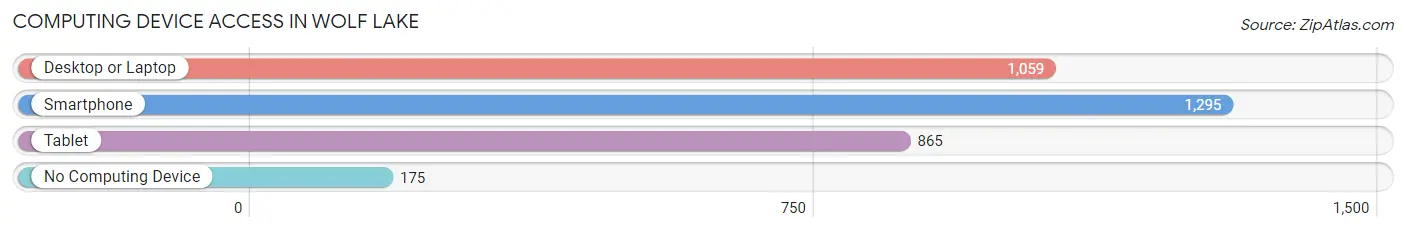
| Device Type | # Households | % Households |
| Desktop or Laptop | 1,059 | 67.5% |
| Smartphone | 1,295 | 82.5% |
| Tablet | 865 | 55.1% |
| No Computing Device | 175 | 11.2% |
| Total | 1,569 | 100.0% |
Internet Access in Wolf Lake
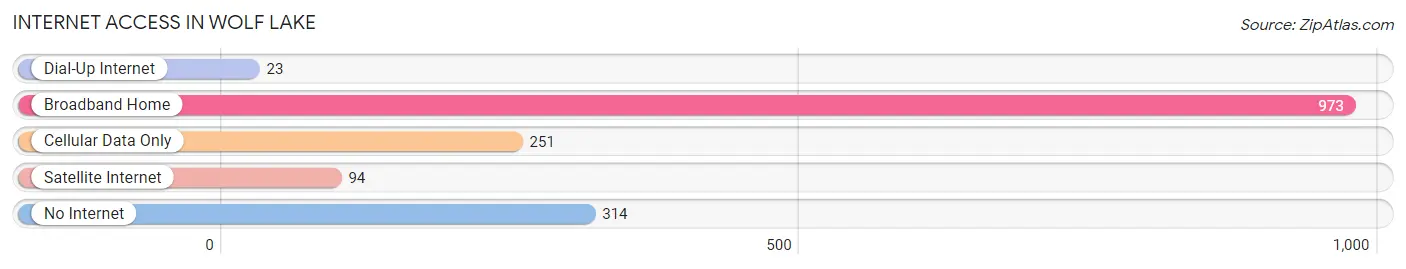
| Internet Type | # Households | % Households |
| Dial-Up Internet | 23 | 1.5% |
| Broadband Home | 973 | 62.0% |
| Cellular Data Only | 251 | 16.0% |
| Satellite Internet | 94 | 6.0% |
| No Internet | 314 | 20.0% |
| Total | 1,569 | 100.0% |
Wolf Lake Summary
Wolf Lake is a small unincorporated community located in the Upper Peninsula of Michigan. It is situated in the western part of Menominee County, near the Wisconsin border. The population of Wolf Lake was estimated to be around 200 people in 2020.
History
Wolf Lake was first settled in the late 1800s by a group of Finnish immigrants. The town was originally called “Kauppila” after the Finnish word for “trading post”. The name was later changed to Wolf Lake in honor of the wolves that roamed the area.
The town was a logging and farming community for many years. In the early 1900s, the Wolf Lake Lumber Company was established and the town became a hub for the lumber industry. The company operated until the 1950s when the lumber industry began to decline.
Geography
Wolf Lake is located in the western part of Menominee County, near the Wisconsin border. The town is situated on the banks of Wolf Lake, a small lake that is part of the Menominee River system. The lake is surrounded by forests and wetlands, making it a popular destination for fishing and hunting.
The town is located about 25 miles from the city of Menominee and about 50 miles from the city of Escanaba. The nearest major airport is in Green Bay, Wisconsin, which is about 90 miles away.
Economy
Wolf Lake is a small, rural community with a limited economy. The town is home to a few small businesses, including a general store, a gas station, and a few restaurants. The town also has a small sawmill and a few logging companies.
The town is also home to a few tourist attractions, including a museum and a nature center. The town is also home to a few campgrounds and resorts, which attract visitors from all over the region.
Demographics
The population of Wolf Lake was estimated to be around 200 people in 2020. The town is predominantly white, with a small percentage of Native American and African American residents. The median household income in Wolf Lake is around $30,000, which is lower than the national average.
The town is served by the Menominee County School District, which includes a K-12 school. The town also has a few churches, including a Lutheran church and a Catholic church.
Conclusion
Wolf Lake is a small, rural community located in the Upper Peninsula of Michigan. The town has a long history of logging and farming, and is now home to a few small businesses and tourist attractions. The population of Wolf Lake is predominantly white, with a small percentage of Native American and African American residents. The town is served by the Menominee County School District and has a few churches.
Common Questions
What is Per Capita Income in Wolf Lake?
Per Capita income in Wolf Lake is $22,800.
What is the Median Family Income in Wolf Lake?
Median Family Income in Wolf Lake is $51,375.
What is the Median Household income in Wolf Lake?
Median Household Income in Wolf Lake is $48,836.
What is Income or Wage Gap in Wolf Lake?
Income or Wage Gap in Wolf Lake is 42.8%.
Women in Wolf Lake earn 57.2 cents for every dollar earned by a man.
What is Inequality or Gini Index in Wolf Lake?
Inequality or Gini Index in Wolf Lake is 0.39.
What is the Total Population of Wolf Lake?
Total Population of Wolf Lake is 4,128.
What is the Total Male Population of Wolf Lake?
Total Male Population of Wolf Lake is 2,061.
What is the Total Female Population of Wolf Lake?
Total Female Population of Wolf Lake is 2,067.
What is the Ratio of Males per 100 Females in Wolf Lake?
There are 99.71 Males per 100 Females in Wolf Lake.
What is the Ratio of Females per 100 Males in Wolf Lake?
There are 100.29 Females per 100 Males in Wolf Lake.
What is the Median Population Age in Wolf Lake?
Median Population Age in Wolf Lake is 38.0 Years.
What is the Average Family Size in Wolf Lake
Average Family Size in Wolf Lake is 3.2 People.
What is the Average Household Size in Wolf Lake
Average Household Size in Wolf Lake is 2.6 People.
How Large is the Labor Force in Wolf Lake?
There are 2,018 People in the Labor Forcein in Wolf Lake.
What is the Percentage of People in the Labor Force in Wolf Lake?
60.5% of People are in the Labor Force in Wolf Lake.
What is the Unemployment Rate in Wolf Lake?
Unemployment Rate in Wolf Lake is 10.8%.