Zip Codes with the Highest Percentage of Population Employed in Real Estate, Rental & Leasing in Utica, MI
RELATED REPORTS & OPTIONS
Real Estate, Rental & Leasing
Utica
Compare Zip Codes
Map of Zip Codes with the Highest Percentage of Population Employed in Real Estate, Rental & Leasing in Utica
1.5%
2.0%
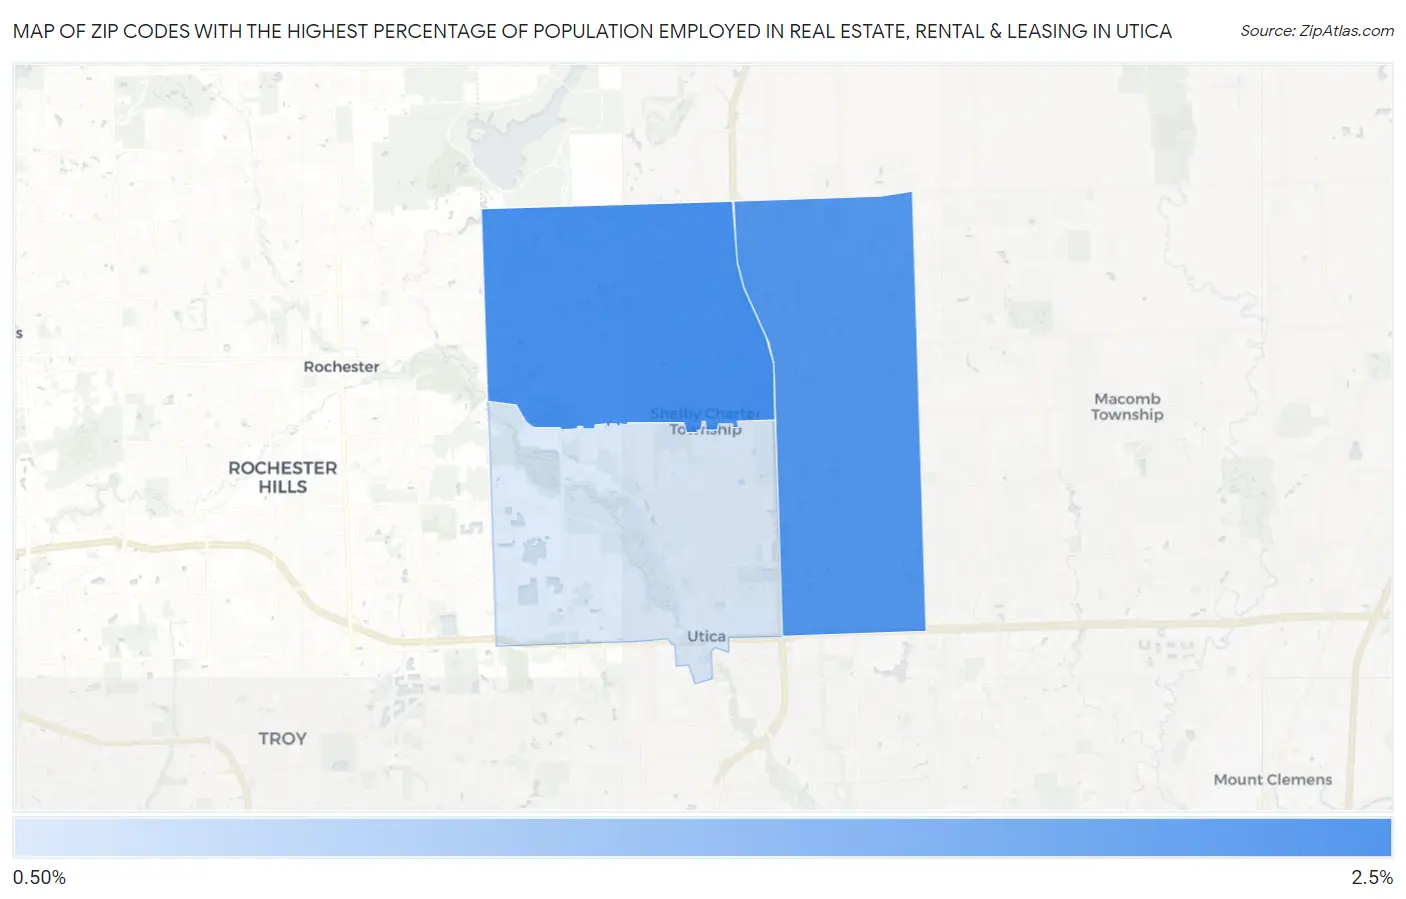
Zip Codes with the Highest Percentage of Population Employed in Real Estate, Rental & Leasing in Utica, MI
| Zip Code | % Employed | vs State | vs National | |
| 1. | 48316 | 2.0% | 1.5%(+0.521)#199 | 1.9%(+0.134)#7,708 |
| 2. | 48315 | 2.0% | 1.5%(+0.478)#201 | 1.9%(+0.092)#7,930 |
| 3. | 48317 | 1.5% | 1.5%(-0.052)#339 | 1.9%(-0.439)#11,551 |
1
Common Questions
What are the Top Zip Codes with the Highest Percentage of Population Employed in Real Estate, Rental & Leasing in Utica, MI?
Top Zip Codes with the Highest Percentage of Population Employed in Real Estate, Rental & Leasing in Utica, MI are:
What zip code has the Highest Percentage of Population Employed in Real Estate, Rental & Leasing in Utica, MI?
48316 has the Highest Percentage of Population Employed in Real Estate, Rental & Leasing in Utica, MI with 2.0%.
What is the Percentage of Population Employed in Real Estate, Rental & Leasing in Utica, MI?
Percentage of Population Employed in Real Estate, Rental & Leasing in Utica is 1.8%.
What is the Percentage of Population Employed in Real Estate, Rental & Leasing in Michigan?
Percentage of Population Employed in Real Estate, Rental & Leasing in Michigan is 1.5%.
What is the Percentage of Population Employed in Real Estate, Rental & Leasing in the United States?
Percentage of Population Employed in Real Estate, Rental & Leasing in the United States is 1.9%.