Cutlerville, MI Map & Demographics
Cutlerville Map
Cutlerville Overview
$28,311
PER CAPITA INCOME
$71,397
AVG FAMILY INCOME
$62,308
AVG HOUSEHOLD INCOME
10.3%
WAGE / INCOME GAP [ % ]
89.7¢/ $1
WAGE / INCOME GAP [ $ ]
0.38
INEQUALITY / GINI INDEX
19,281
TOTAL POPULATION
9,745
MALE POPULATION
9,536
FEMALE POPULATION
102.19
MALES / 100 FEMALES
97.86
FEMALES / 100 MALES
33.0
MEDIAN AGE
3.3
AVG FAMILY SIZE
2.8
AVG HOUSEHOLD SIZE
10,605
LABOR FORCE [ PEOPLE ]
74.7%
PERCENT IN LABOR FORCE
4.5%
UNEMPLOYMENT RATE
Income in Cutlerville
Income Overview in Cutlerville
Per Capita Income in Cutlerville is $28,311, while median incomes of families and households are $71,397 and $62,308 respectively.
| Characteristic | Number | Measure |
| Per Capita Income | 19,281 | $28,311 |
| Median Family Income | 4,576 | $71,397 |
| Mean Family Income | 4,576 | $84,936 |
| Median Household Income | 6,893 | $62,308 |
| Mean Household Income | 6,893 | $77,559 |
| Income Deficit | 4,576 | $0 |
| Wage / Income Gap (%) | 19,281 | 10.33% |
| Wage / Income Gap ($) | 19,281 | 89.67¢ per $1 |
| Gini / Inequality Index | 19,281 | 0.38 |
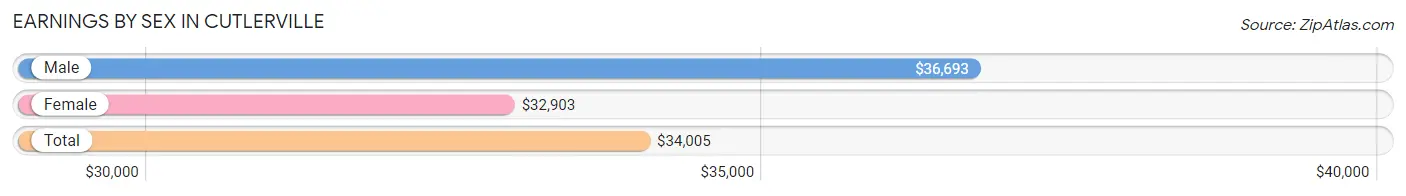
Earnings by Sex in Cutlerville
Average Earnings in Cutlerville are $34,005, $36,693 for men and $32,903 for women, a difference of 10.3%.
| Sex | Number | Average Earnings |
| Male | 5,960 (54.2%) | $36,693 |
| Female | 5,040 (45.8%) | $32,903 |
| Total | 11,000 (100.0%) | $34,005 |
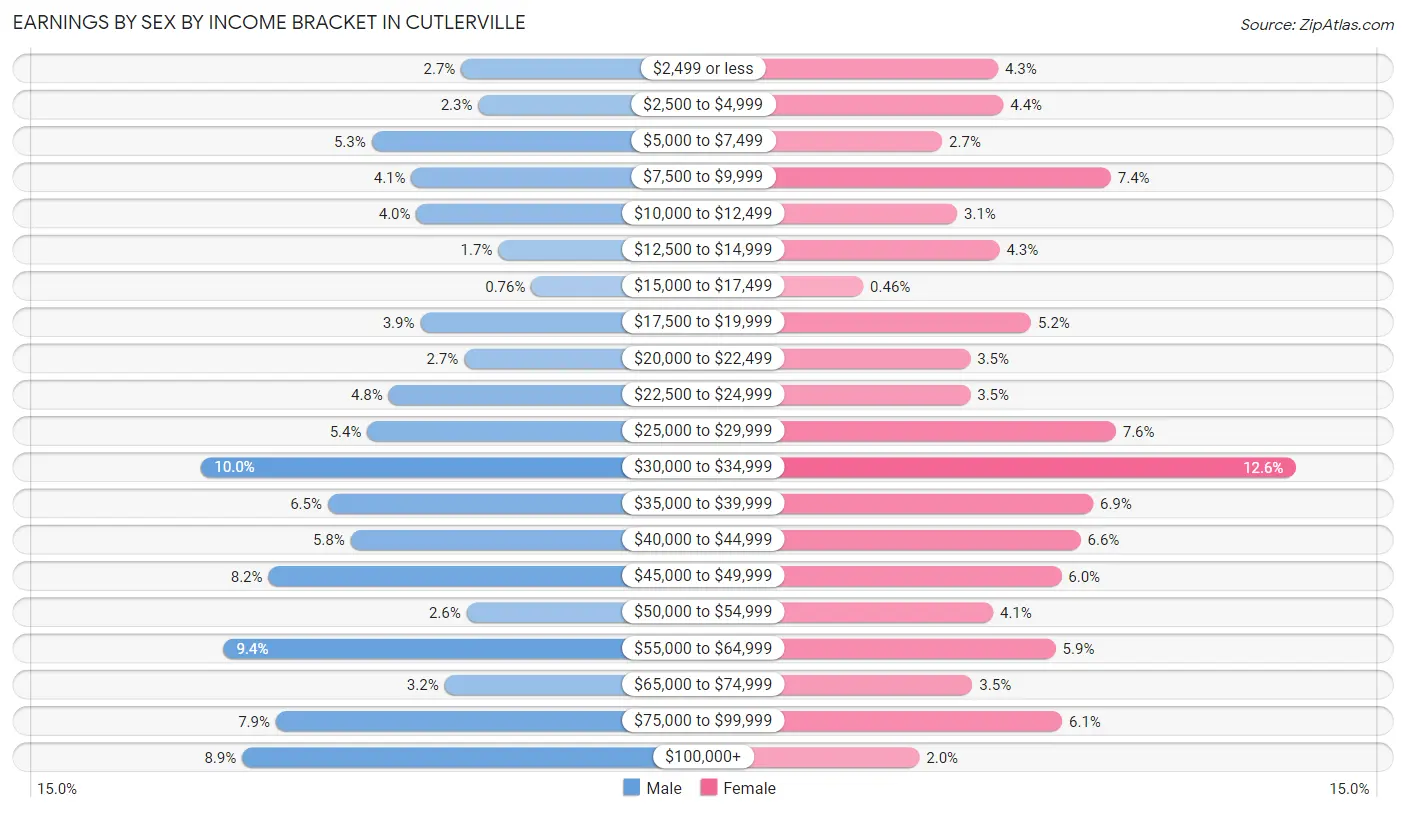
Earnings by Sex by Income Bracket in Cutlerville
The most common earnings brackets in Cutlerville are $30,000 to $34,999 for men (598 | 10.0%) and $30,000 to $34,999 for women (635 | 12.6%).
| Income | Male | Female |
| $2,499 or less | 163 (2.7%) | 214 (4.3%) |
| $2,500 to $4,999 | 134 (2.2%) | 222 (4.4%) |
| $5,000 to $7,499 | 313 (5.2%) | 135 (2.7%) |
| $7,500 to $9,999 | 246 (4.1%) | 374 (7.4%) |
| $10,000 to $12,499 | 238 (4.0%) | 156 (3.1%) |
| $12,500 to $14,999 | 101 (1.7%) | 216 (4.3%) |
| $15,000 to $17,499 | 45 (0.8%) | 23 (0.5%) |
| $17,500 to $19,999 | 231 (3.9%) | 261 (5.2%) |
| $20,000 to $22,499 | 158 (2.6%) | 175 (3.5%) |
| $22,500 to $24,999 | 284 (4.8%) | 175 (3.5%) |
| $25,000 to $29,999 | 320 (5.4%) | 381 (7.6%) |
| $30,000 to $34,999 | 598 (10.0%) | 635 (12.6%) |
| $35,000 to $39,999 | 386 (6.5%) | 349 (6.9%) |
| $40,000 to $44,999 | 348 (5.8%) | 331 (6.6%) |
| $45,000 to $49,999 | 486 (8.2%) | 304 (6.0%) |
| $50,000 to $54,999 | 154 (2.6%) | 207 (4.1%) |
| $55,000 to $64,999 | 561 (9.4%) | 296 (5.9%) |
| $65,000 to $74,999 | 191 (3.2%) | 178 (3.5%) |
| $75,000 to $99,999 | 473 (7.9%) | 305 (6.0%) |
| $100,000+ | 530 (8.9%) | 103 (2.0%) |
| Total | 5,960 (100.0%) | 5,040 (100.0%) |
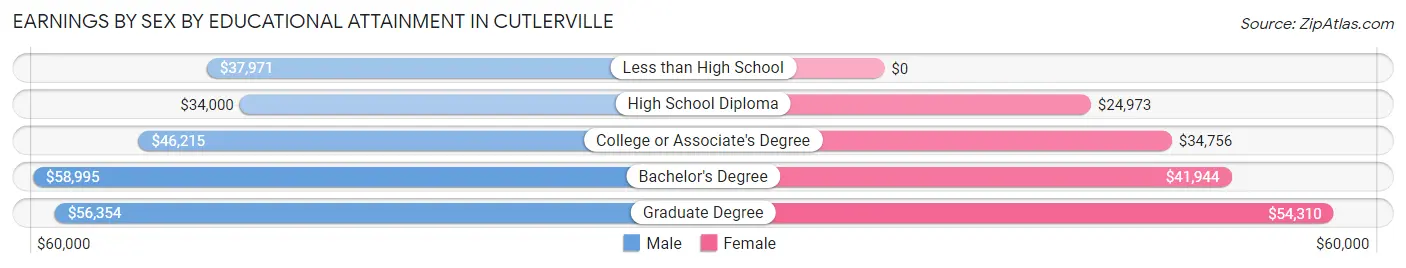
Earnings by Sex by Educational Attainment in Cutlerville
Average earnings in Cutlerville are $41,880 for men and $34,129 for women, a difference of 18.5%. Men with an educational attainment of bachelor's degree enjoy the highest average annual earnings of $58,995, while those with high school diploma education earn the least with $34,000. Women with an educational attainment of graduate degree earn the most with the average annual earnings of $54,310, while those with high school diploma education have the smallest earnings of $24,973.
| Educational Attainment | Male Income | Female Income |
| Less than High School | $37,971 | $0 |
| High School Diploma | $34,000 | $24,973 |
| College or Associate's Degree | $46,215 | $34,756 |
| Bachelor's Degree | $58,995 | $41,944 |
| Graduate Degree | $56,354 | $54,310 |
| Total | $41,880 | $34,129 |
Family Income in Cutlerville
Family Income Brackets in Cutlerville
According to the Cutlerville family income data, there are 1,080 families falling into the $50,000 to $74,999 income range, which is the most common income bracket and makes up 23.6% of all families. Conversely, the $10,000 to $14,999 income bracket is the least frequent group with only 69 families (1.5%) belonging to this category.
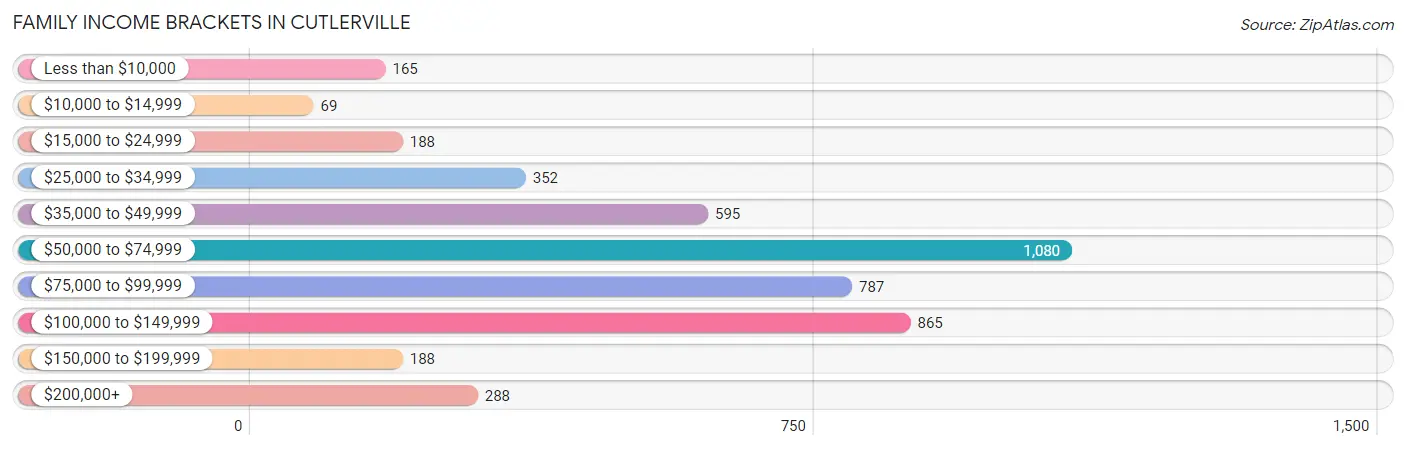
| Income Bracket | # Families | % Families |
| Less than $10,000 | 165 | 3.6% |
| $10,000 to $14,999 | 69 | 1.5% |
| $15,000 to $24,999 | 188 | 4.1% |
| $25,000 to $34,999 | 352 | 7.7% |
| $35,000 to $49,999 | 595 | 13.0% |
| $50,000 to $74,999 | 1,080 | 23.6% |
| $75,000 to $99,999 | 787 | 17.2% |
| $100,000 to $149,999 | 865 | 18.9% |
| $150,000 to $199,999 | 188 | 4.1% |
| $200,000+ | 288 | 6.3% |
Family Income by Famaliy Size in Cutlerville
7+ person families (235 | 5.1%) account for the highest median family income in Cutlerville with $142,776 per family, while 2-person families (2,195 | 48.0%) have the highest median income of $29,966 per family member.
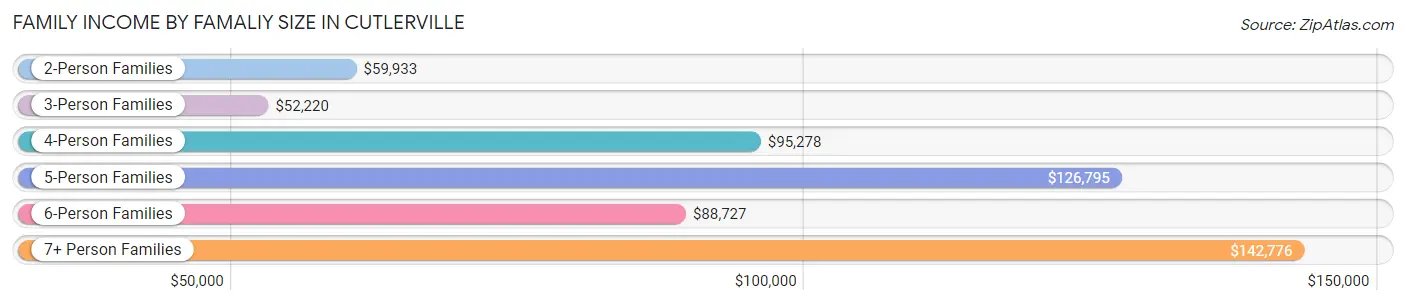
| Income Bracket | # Families | Median Income |
| 2-Person Families | 2,195 (48.0%) | $59,933 |
| 3-Person Families | 819 (17.9%) | $52,220 |
| 4-Person Families | 658 (14.4%) | $95,278 |
| 5-Person Families | 370 (8.1%) | $126,795 |
| 6-Person Families | 299 (6.5%) | $88,727 |
| 7+ Person Families | 235 (5.1%) | $142,776 |
| Total | 4,576 (100.0%) | $71,397 |
Family Income by Number of Earners in Cutlerville
The median family income in Cutlerville is $71,397, with families comprising 3+ earners (603) having the highest median family income of $136,037, while families with no earners (469) have the lowest median family income of $44,082, accounting for 13.2% and 10.2% of families, respectively.
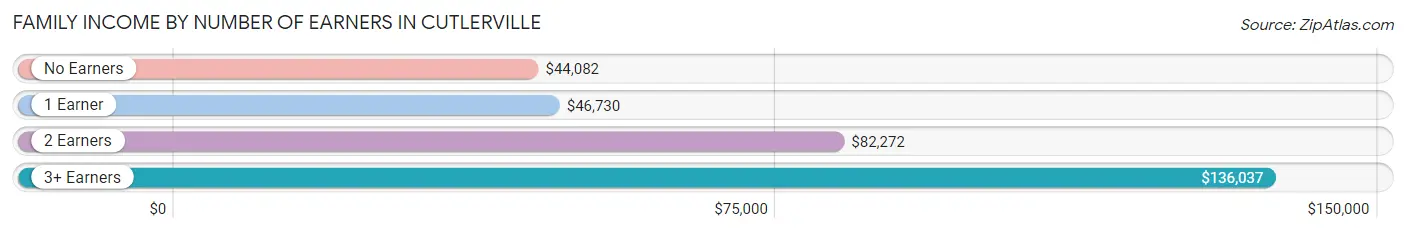
| Number of Earners | # Families | Median Income |
| No Earners | 469 (10.2%) | $44,082 |
| 1 Earner | 1,445 (31.6%) | $46,730 |
| 2 Earners | 2,059 (45.0%) | $82,272 |
| 3+ Earners | 603 (13.2%) | $136,037 |
| Total | 4,576 (100.0%) | $71,397 |
Household Income in Cutlerville
Household Income Brackets in Cutlerville
With 1,703 households falling in the category, the $50,000 to $74,999 income range is the most frequent in Cutlerville, accounting for 24.7% of all households. In contrast, only 186 households (2.7%) fall into the $10,000 to $14,999 income bracket, making it the least populous group.
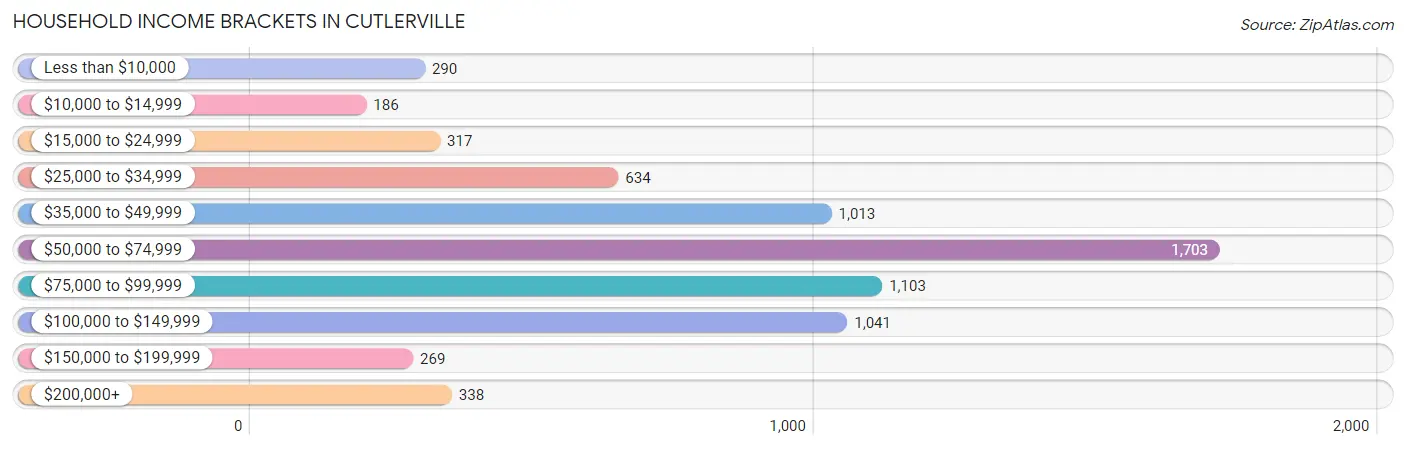
| Income Bracket | # Households | % Households |
| Less than $10,000 | 290 | 4.2% |
| $10,000 to $14,999 | 186 | 2.7% |
| $15,000 to $24,999 | 317 | 4.6% |
| $25,000 to $34,999 | 634 | 9.2% |
| $35,000 to $49,999 | 1,013 | 14.7% |
| $50,000 to $74,999 | 1,703 | 24.7% |
| $75,000 to $99,999 | 1,103 | 16.0% |
| $100,000 to $149,999 | 1,041 | 15.1% |
| $150,000 to $199,999 | 269 | 3.9% |
| $200,000+ | 338 | 4.9% |
Household Income by Householder Age in Cutlerville
The median household income in Cutlerville is $62,308, with the highest median household income of $73,239 found in the 25 to 44 years age bracket for the primary householder. A total of 2,525 households (36.6%) fall into this category. Meanwhile, the 65+ years age bracket for the primary householder has the lowest median household income of $46,056, with 1,321 households (19.2%) in this group.
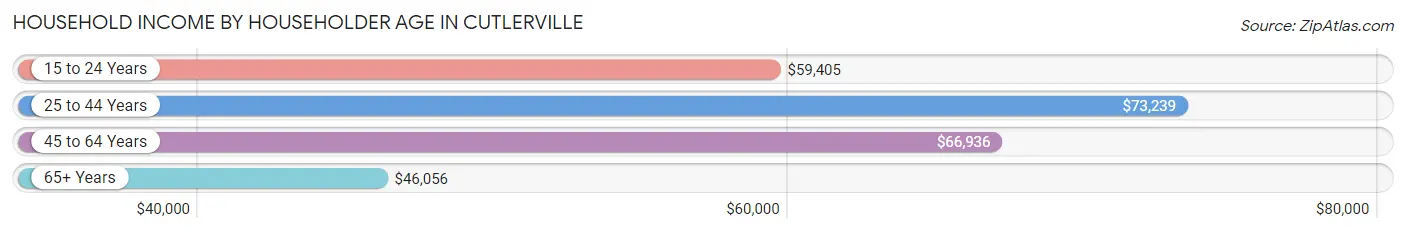
| Income Bracket | # Households | Median Income |
| 15 to 24 Years | 314 (4.6%) | $59,405 |
| 25 to 44 Years | 2,525 (36.6%) | $73,239 |
| 45 to 64 Years | 2,733 (39.7%) | $66,936 |
| 65+ Years | 1,321 (19.2%) | $46,056 |
| Total | 6,893 (100.0%) | $62,308 |
Poverty in Cutlerville
Income Below Poverty by Sex and Age in Cutlerville
With 11.5% poverty level for males and 13.6% for females among the residents of Cutlerville, 15 year old males and 15 year old females are the most vulnerable to poverty, with 81 males (42.9%) and 23 females (31.9%) in their respective age groups living below the poverty level.
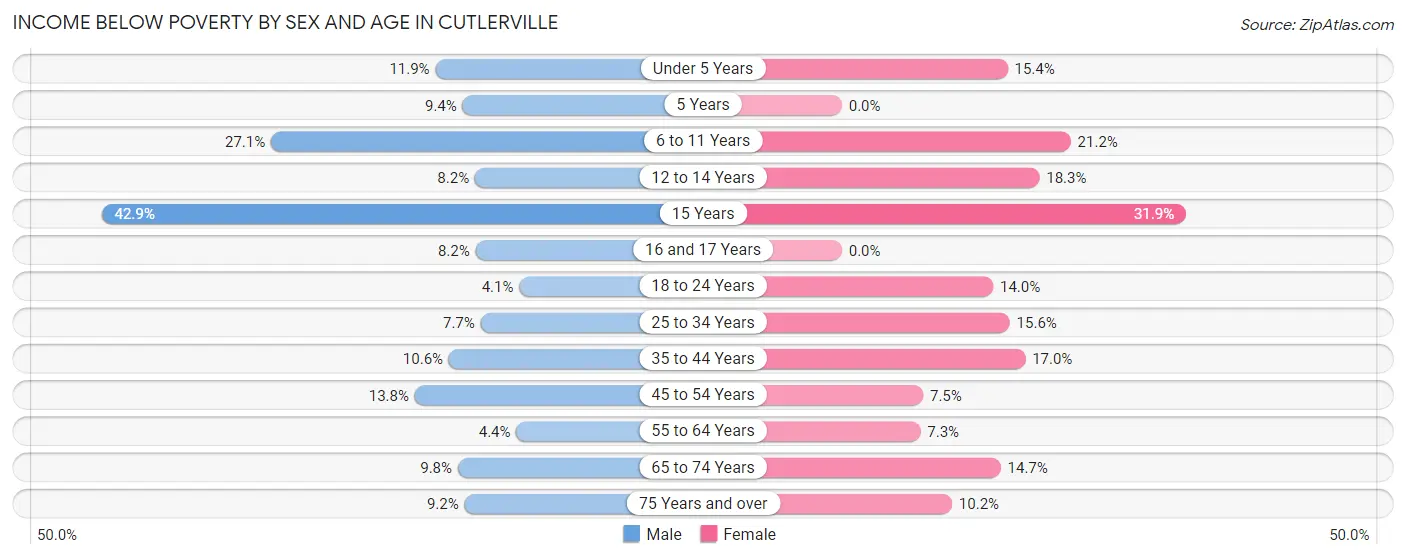
| Age Bracket | Male | Female |
| Under 5 Years | 73 (11.9%) | 130 (15.4%) |
| 5 Years | 10 (9.3%) | 0 (0.0%) |
| 6 to 11 Years | 293 (27.1%) | 175 (21.2%) |
| 12 to 14 Years | 41 (8.2%) | 101 (18.3%) |
| 15 Years | 81 (42.9%) | 23 (31.9%) |
| 16 and 17 Years | 11 (8.2%) | 0 (0.0%) |
| 18 to 24 Years | 32 (4.1%) | 82 (14.0%) |
| 25 to 34 Years | 124 (7.7%) | 228 (15.6%) |
| 35 to 44 Years | 132 (10.6%) | 226 (17.0%) |
| 45 to 54 Years | 166 (13.8%) | 62 (7.5%) |
| 55 to 64 Years | 55 (4.4%) | 84 (7.3%) |
| 65 to 74 Years | 42 (9.8%) | 116 (14.7%) |
| 75 Years and over | 42 (9.2%) | 57 (10.2%) |
| Total | 1,102 (11.5%) | 1,284 (13.6%) |
Income Above Poverty by Sex and Age in Cutlerville
According to the poverty statistics in Cutlerville, males aged 18 to 24 years and females aged 5 years are the age groups that are most secure financially, with 95.9% of males and 100.0% of females in these age groups living above the poverty line.
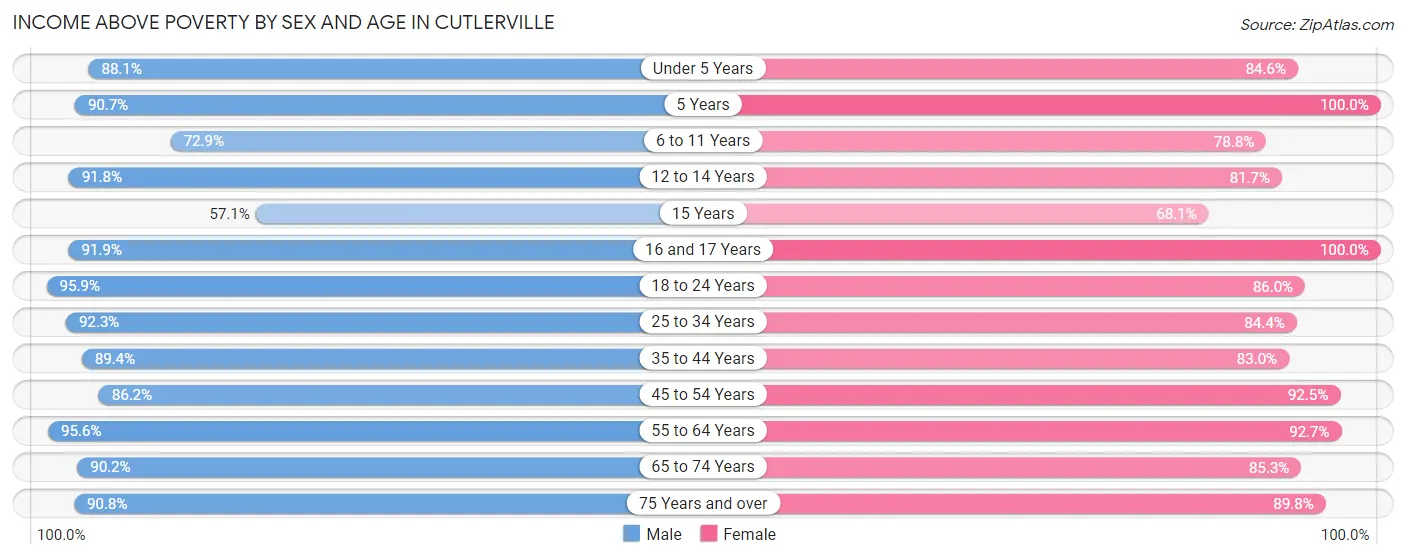
| Age Bracket | Male | Female |
| Under 5 Years | 542 (88.1%) | 715 (84.6%) |
| 5 Years | 97 (90.6%) | 106 (100.0%) |
| 6 to 11 Years | 787 (72.9%) | 649 (78.8%) |
| 12 to 14 Years | 459 (91.8%) | 450 (81.7%) |
| 15 Years | 108 (57.1%) | 49 (68.1%) |
| 16 and 17 Years | 124 (91.8%) | 322 (100.0%) |
| 18 to 24 Years | 751 (95.9%) | 502 (86.0%) |
| 25 to 34 Years | 1,491 (92.3%) | 1,235 (84.4%) |
| 35 to 44 Years | 1,111 (89.4%) | 1,102 (83.0%) |
| 45 to 54 Years | 1,038 (86.2%) | 760 (92.5%) |
| 55 to 64 Years | 1,206 (95.6%) | 1,069 (92.7%) |
| 65 to 74 Years | 387 (90.2%) | 671 (85.3%) |
| 75 Years and over | 416 (90.8%) | 501 (89.8%) |
| Total | 8,517 (88.5%) | 8,131 (86.4%) |
Income Below Poverty Among Married-Couple Families in Cutlerville
The poverty statistics for married-couple families in Cutlerville show that 4.3% or 128 of the total 2,987 families live below the poverty line. Families with 5 or more children have the highest poverty rate of 40.0%, comprising of 40 families. On the other hand, families with no children have the lowest poverty rate of 2.4%, which includes 37 families.
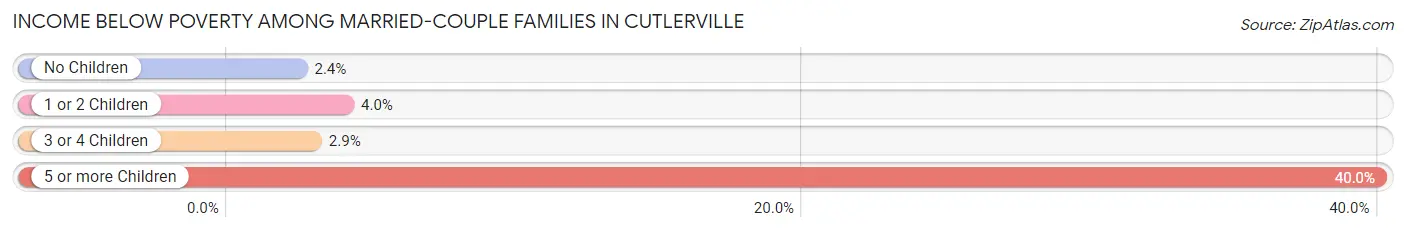
| Children | Above Poverty | Below Poverty |
| No Children | 1,493 (97.6%) | 37 (2.4%) |
| 1 or 2 Children | 973 (96.0%) | 41 (4.0%) |
| 3 or 4 Children | 333 (97.1%) | 10 (2.9%) |
| 5 or more Children | 60 (60.0%) | 40 (40.0%) |
| Total | 2,859 (95.7%) | 128 (4.3%) |
Income Below Poverty Among Single-Parent Households in Cutlerville
According to the poverty data in Cutlerville, 7.2% or 34 single-father households and 24.9% or 277 single-mother households are living below the poverty line. Among single-father households, those with 1 or 2 children have the highest poverty rate, with 26 households (19.6%) experiencing poverty. Likewise, among single-mother households, those with 1 or 2 children have the highest poverty rate, with 192 households (39.8%) falling below the poverty line.
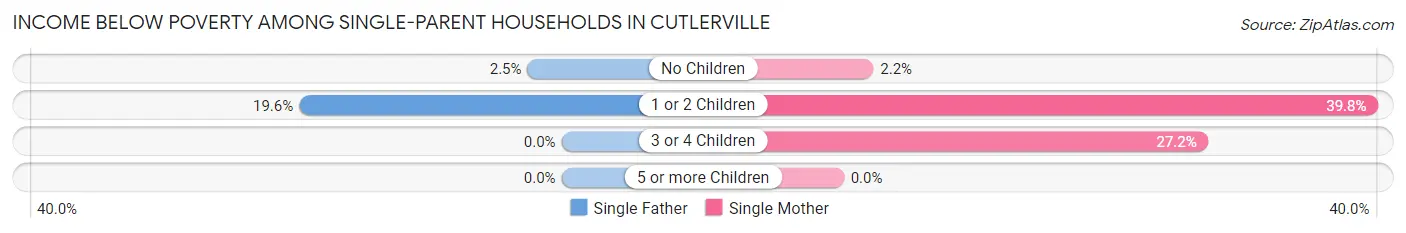
| Children | Single Father | Single Mother |
| No Children | 8 (2.5%) | 7 (2.2%) |
| 1 or 2 Children | 26 (19.6%) | 192 (39.8%) |
| 3 or 4 Children | 0 (0.0%) | 78 (27.2%) |
| 5 or more Children | 0 (0.0%) | 0 (0.0%) |
| Total | 34 (7.2%) | 277 (24.9%) |
Income Below Poverty Among Married-Couple vs Single-Parent Households in Cutlerville
The poverty data for Cutlerville shows that 128 of the married-couple family households (4.3%) and 311 of the single-parent households (19.6%) are living below the poverty level. Within the married-couple family households, those with 5 or more children have the highest poverty rate, with 40 households (40.0%) falling below the poverty line. Among the single-parent households, those with 1 or 2 children have the highest poverty rate, with 218 household (35.4%) living below poverty.
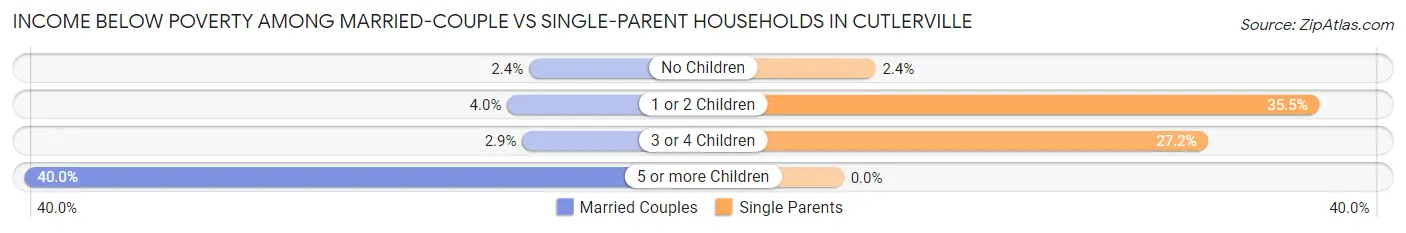
| Children | Married-Couple Families | Single-Parent Households |
| No Children | 37 (2.4%) | 15 (2.4%) |
| 1 or 2 Children | 41 (4.0%) | 218 (35.4%) |
| 3 or 4 Children | 10 (2.9%) | 78 (27.2%) |
| 5 or more Children | 40 (40.0%) | 0 (0.0%) |
| Total | 128 (4.3%) | 311 (19.6%) |
Race in Cutlerville
The most populous races in Cutlerville are White / Caucasian (12,957 | 67.2%), Black / African American (2,341 | 12.1%), and Hispanic or Latino (2,142 | 11.1%).
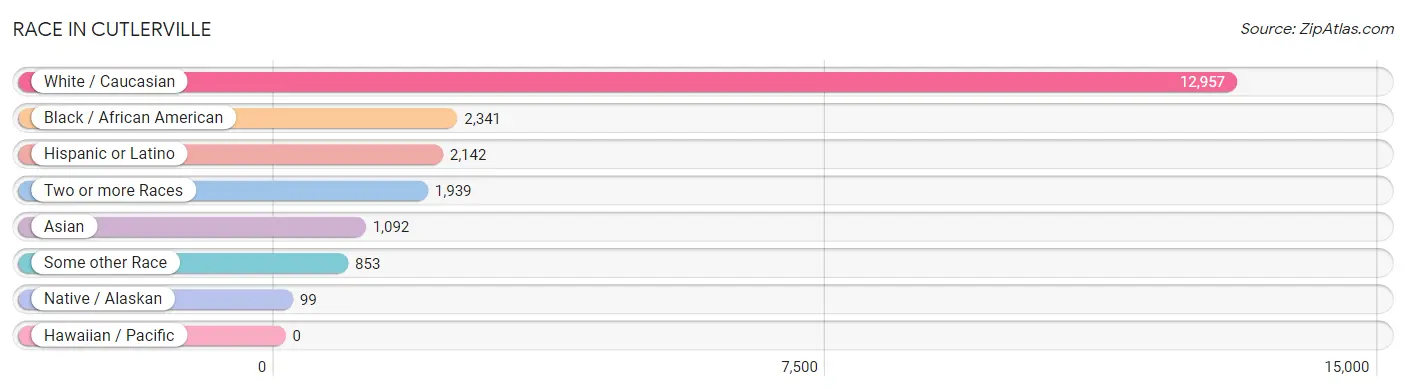
| Race | # Population | % Population |
| Asian | 1,092 | 5.7% |
| Black / African American | 2,341 | 12.1% |
| Hawaiian / Pacific | 0 | 0.0% |
| Hispanic or Latino | 2,142 | 11.1% |
| Native / Alaskan | 99 | 0.5% |
| White / Caucasian | 12,957 | 67.2% |
| Two or more Races | 1,939 | 10.1% |
| Some other Race | 853 | 4.4% |
| Total | 19,281 | 100.0% |
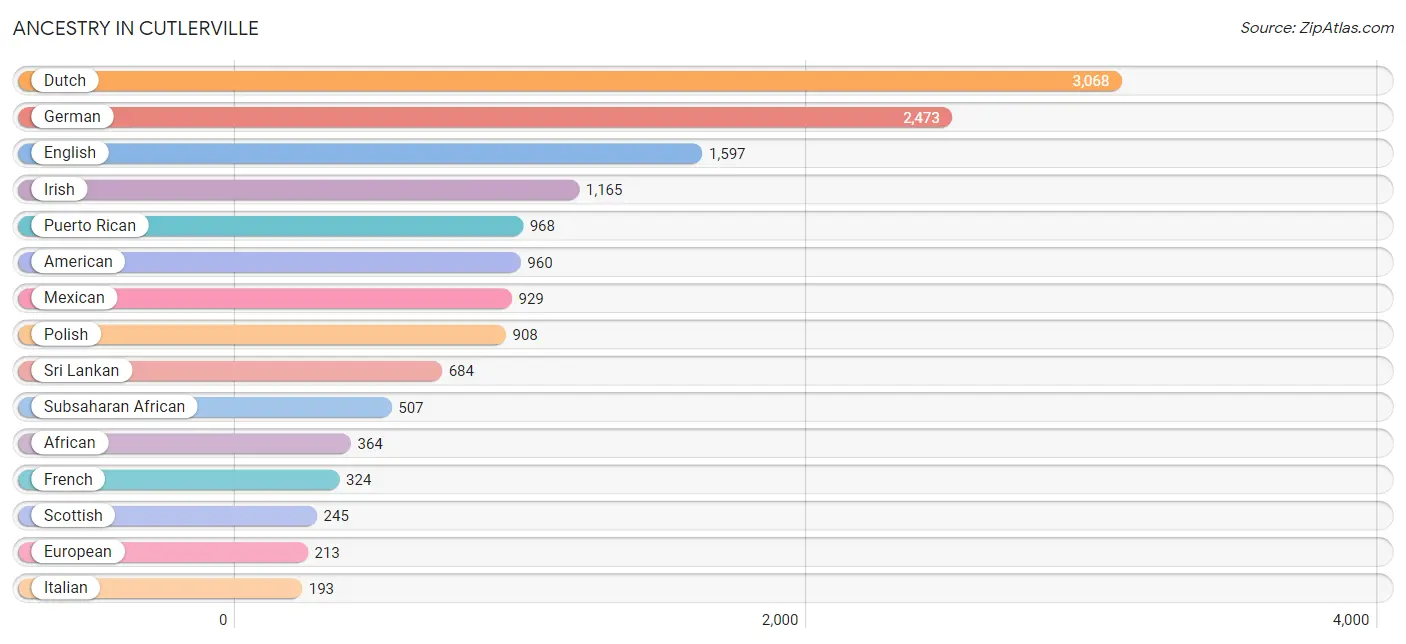
Ancestry in Cutlerville
The most populous ancestries reported in Cutlerville are Dutch (3,068 | 15.9%), German (2,473 | 12.8%), English (1,597 | 8.3%), Irish (1,165 | 6.0%), and Puerto Rican (968 | 5.0%), together accounting for 48.1% of all Cutlerville residents.
| Ancestry | # Population | % Population |
| African | 364 | 1.9% |
| American | 960 | 5.0% |
| Arab | 121 | 0.6% |
| Armenian | 11 | 0.1% |
| Belgian | 45 | 0.2% |
| Bhutanese | 20 | 0.1% |
| Brazilian | 91 | 0.5% |
| British | 56 | 0.3% |
| Burmese | 14 | 0.1% |
| Cajun | 16 | 0.1% |
| Canadian | 35 | 0.2% |
| Celtic | 10 | 0.1% |
| Central American | 96 | 0.5% |
| Central American Indian | 89 | 0.5% |
| Cherokee | 116 | 0.6% |
| Croatian | 14 | 0.1% |
| Cuban | 63 | 0.3% |
| Czech | 56 | 0.3% |
| Danish | 108 | 0.6% |
| Dominican | 75 | 0.4% |
| Dutch | 3,068 | 15.9% |
| English | 1,597 | 8.3% |
| European | 213 | 1.1% |
| Finnish | 47 | 0.2% |
| French | 324 | 1.7% |
| French Canadian | 188 | 1.0% |
| German | 2,473 | 12.8% |
| German Russian | 156 | 0.8% |
| Greek | 124 | 0.6% |
| Guatemalan | 88 | 0.5% |
| Honduran | 8 | 0.0% |
| Hungarian | 155 | 0.8% |
| Indian (Asian) | 157 | 0.8% |
| Indonesian | 121 | 0.6% |
| Irish | 1,165 | 6.0% |
| Italian | 193 | 1.0% |
| Jamaican | 33 | 0.2% |
| Japanese | 14 | 0.1% |
| Latvian | 17 | 0.1% |
| Liberian | 28 | 0.2% |
| Lithuanian | 79 | 0.4% |
| Mexican | 929 | 4.8% |
| Mexican American Indian | 20 | 0.1% |
| Navajo | 12 | 0.1% |
| Norwegian | 136 | 0.7% |
| Ottawa | 70 | 0.4% |
| Pakistani | 32 | 0.2% |
| Pennsylvania German | 15 | 0.1% |
| Polish | 908 | 4.7% |
| Portuguese | 31 | 0.2% |
| Potawatomi | 6 | 0.0% |
| Puerto Rican | 968 | 5.0% |
| Russian | 44 | 0.2% |
| Scandinavian | 98 | 0.5% |
| Scotch-Irish | 9 | 0.1% |
| Scottish | 245 | 1.3% |
| Sri Lankan | 684 | 3.5% |
| Subsaharan African | 507 | 2.6% |
| Swedish | 111 | 0.6% |
| Swiss | 12 | 0.1% |
| Thai | 35 | 0.2% |
| Tlingit-Haida | 6 | 0.0% |
| Ukrainian | 26 | 0.1% |
| Welsh | 17 | 0.1% |
| Yugoslavian | 37 | 0.2% | View All 65 Rows |
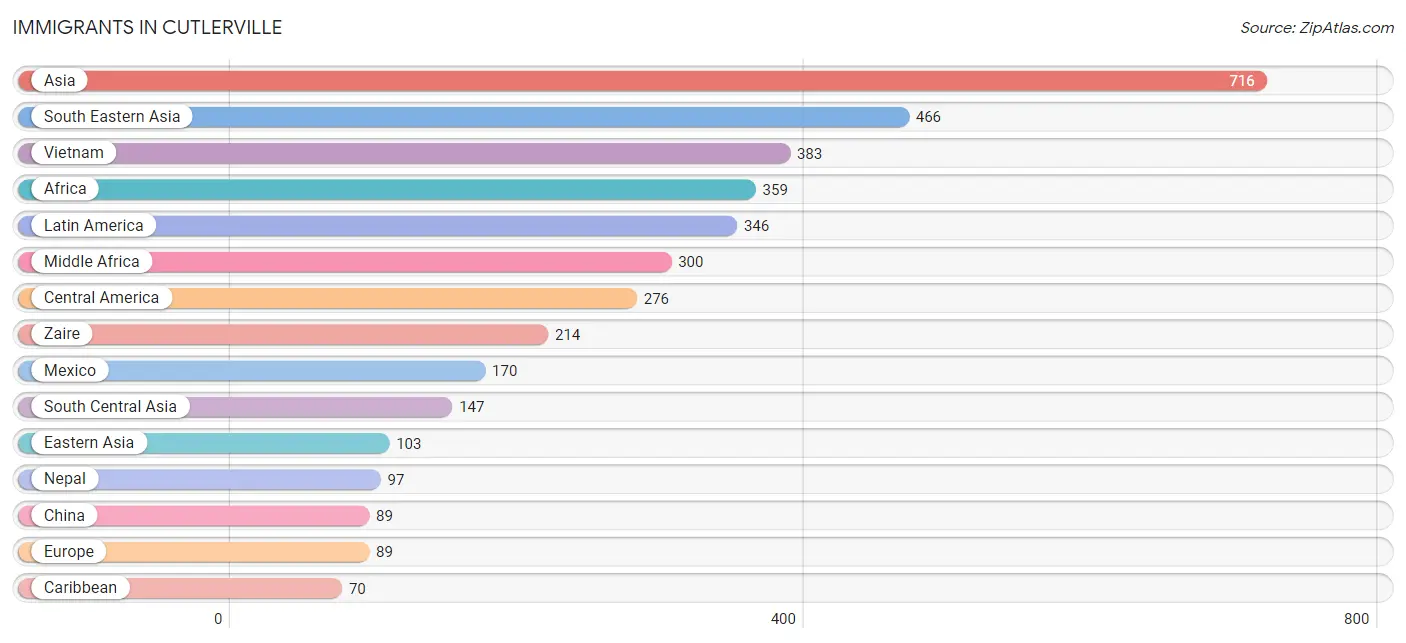
Immigrants in Cutlerville
The most numerous immigrant groups reported in Cutlerville came from Asia (716 | 3.7%), South Eastern Asia (466 | 2.4%), Vietnam (383 | 2.0%), Africa (359 | 1.9%), and Latin America (346 | 1.8%), together accounting for 11.8% of all Cutlerville residents.
| Immigration Origin | # Population | % Population |
| Africa | 359 | 1.9% |
| Asia | 716 | 3.7% |
| Bangladesh | 12 | 0.1% |
| Bosnia and Herzegovina | 37 | 0.2% |
| Cameroon | 50 | 0.3% |
| Canada | 40 | 0.2% |
| Caribbean | 70 | 0.4% |
| Central America | 276 | 1.4% |
| China | 89 | 0.5% |
| Congo | 36 | 0.2% |
| Cuba | 30 | 0.2% |
| Denmark | 8 | 0.0% |
| Dominican Republic | 40 | 0.2% |
| Eastern Africa | 31 | 0.2% |
| Eastern Asia | 103 | 0.5% |
| Eastern Europe | 37 | 0.2% |
| England | 15 | 0.1% |
| Europe | 89 | 0.5% |
| Guatemala | 70 | 0.4% |
| Honduras | 36 | 0.2% |
| Ireland | 8 | 0.0% |
| Korea | 14 | 0.1% |
| Latin America | 346 | 1.8% |
| Liberia | 28 | 0.2% |
| Mexico | 170 | 0.9% |
| Middle Africa | 300 | 1.6% |
| Nepal | 97 | 0.5% |
| Netherlands | 21 | 0.1% |
| Northern Europe | 31 | 0.2% |
| Oceania | 12 | 0.1% |
| South Central Asia | 147 | 0.8% |
| South Eastern Asia | 466 | 2.4% |
| Vietnam | 383 | 2.0% |
| Western Africa | 28 | 0.2% |
| Western Europe | 21 | 0.1% |
| Zaire | 214 | 1.1% | View All 36 Rows |
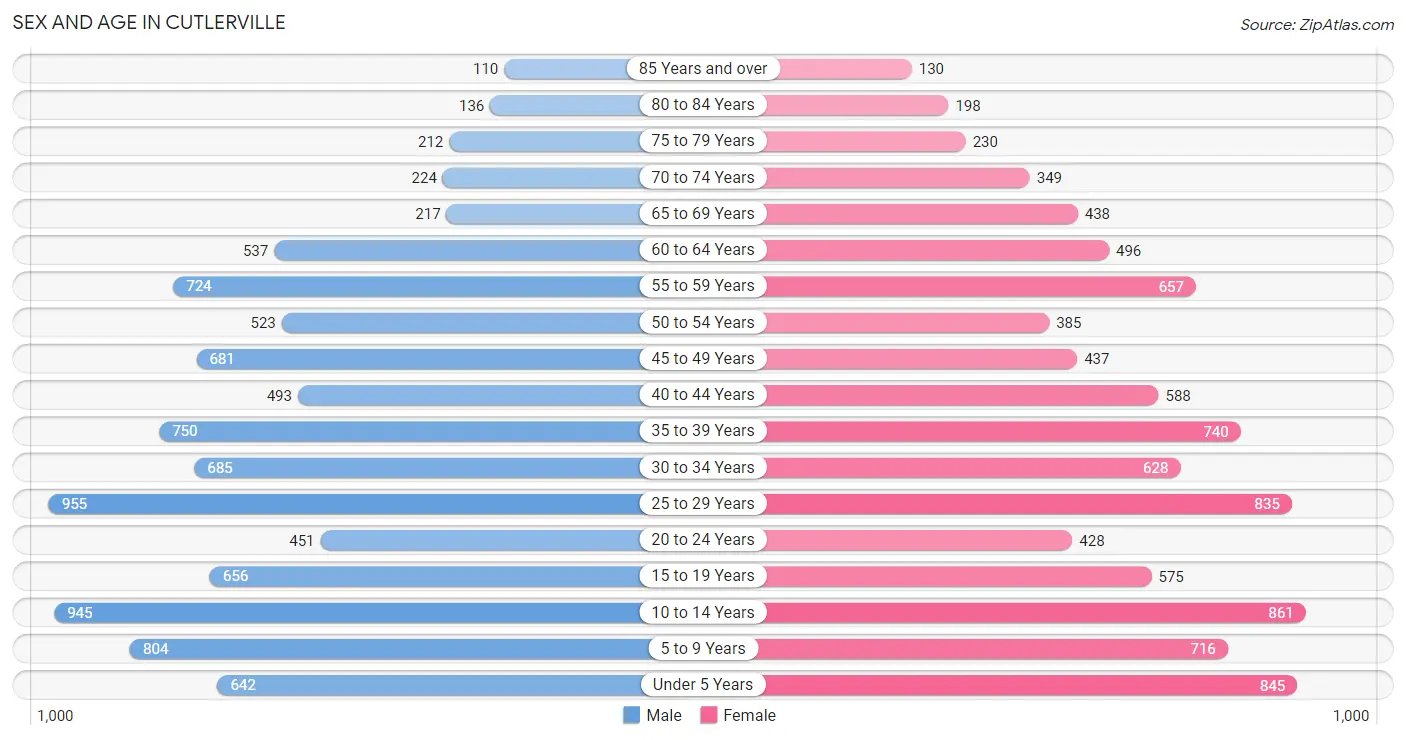
Sex and Age in Cutlerville
Sex and Age in Cutlerville
The most populous age groups in Cutlerville are 25 to 29 Years (955 | 9.8%) for men and 10 to 14 Years (861 | 9.0%) for women.
| Age Bracket | Male | Female |
| Under 5 Years | 642 (6.6%) | 845 (8.9%) |
| 5 to 9 Years | 804 (8.3%) | 716 (7.5%) |
| 10 to 14 Years | 945 (9.7%) | 861 (9.0%) |
| 15 to 19 Years | 656 (6.7%) | 575 (6.0%) |
| 20 to 24 Years | 451 (4.6%) | 428 (4.5%) |
| 25 to 29 Years | 955 (9.8%) | 835 (8.8%) |
| 30 to 34 Years | 685 (7.0%) | 628 (6.6%) |
| 35 to 39 Years | 750 (7.7%) | 740 (7.8%) |
| 40 to 44 Years | 493 (5.1%) | 588 (6.2%) |
| 45 to 49 Years | 681 (7.0%) | 437 (4.6%) |
| 50 to 54 Years | 523 (5.4%) | 385 (4.0%) |
| 55 to 59 Years | 724 (7.4%) | 657 (6.9%) |
| 60 to 64 Years | 537 (5.5%) | 496 (5.2%) |
| 65 to 69 Years | 217 (2.2%) | 438 (4.6%) |
| 70 to 74 Years | 224 (2.3%) | 349 (3.7%) |
| 75 to 79 Years | 212 (2.2%) | 230 (2.4%) |
| 80 to 84 Years | 136 (1.4%) | 198 (2.1%) |
| 85 Years and over | 110 (1.1%) | 130 (1.4%) |
| Total | 9,745 (100.0%) | 9,536 (100.0%) |
Families and Households in Cutlerville
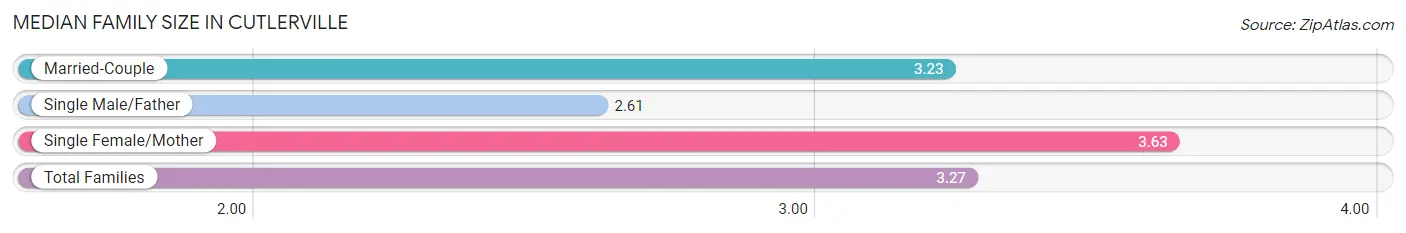
Median Family Size in Cutlerville
The median family size in Cutlerville is 3.27 persons per family, with single female/mother families (1,114 | 24.3%) accounting for the largest median family size of 3.63 persons per family. On the other hand, single male/father families (475 | 10.4%) represent the smallest median family size with 2.61 persons per family.
| Family Type | # Families | Family Size |
| Married-Couple | 2,987 (65.3%) | 3.23 |
| Single Male/Father | 475 (10.4%) | 2.61 |
| Single Female/Mother | 1,114 (24.3%) | 3.63 |
| Total Families | 4,576 (100.0%) | 3.27 |
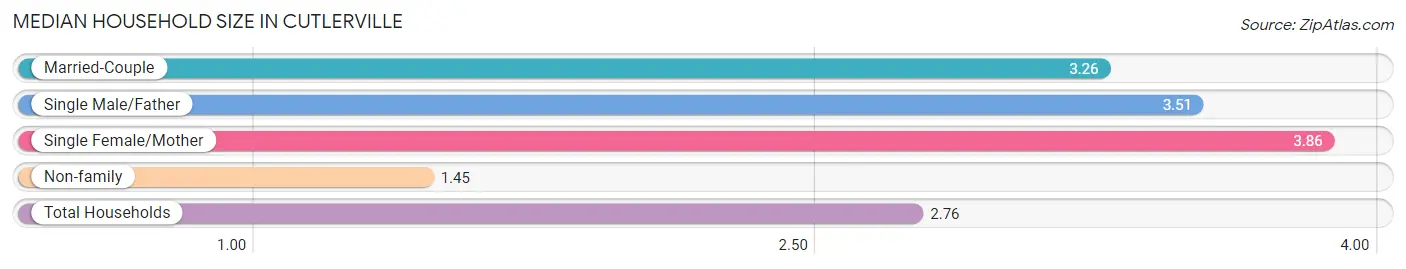
Median Household Size in Cutlerville
The median household size in Cutlerville is 2.76 persons per household, with single female/mother households (1,114 | 16.2%) accounting for the largest median household size of 3.86 persons per household. non-family households (2,317 | 33.6%) represent the smallest median household size with 1.45 persons per household.
| Household Type | # Households | Household Size |
| Married-Couple | 2,987 (43.3%) | 3.26 |
| Single Male/Father | 475 (6.9%) | 3.51 |
| Single Female/Mother | 1,114 (16.2%) | 3.86 |
| Non-family | 2,317 (33.6%) | 1.45 |
| Total Households | 6,893 (100.0%) | 2.76 |
Household Size by Marriage Status in Cutlerville
Out of a total of 6,893 households in Cutlerville, 4,576 (66.4%) are family households, while 2,317 (33.6%) are nonfamily households. The most numerous type of family households are 2-person households, comprising 1,852, and the most common type of nonfamily households are 1-person households, comprising 1,609.
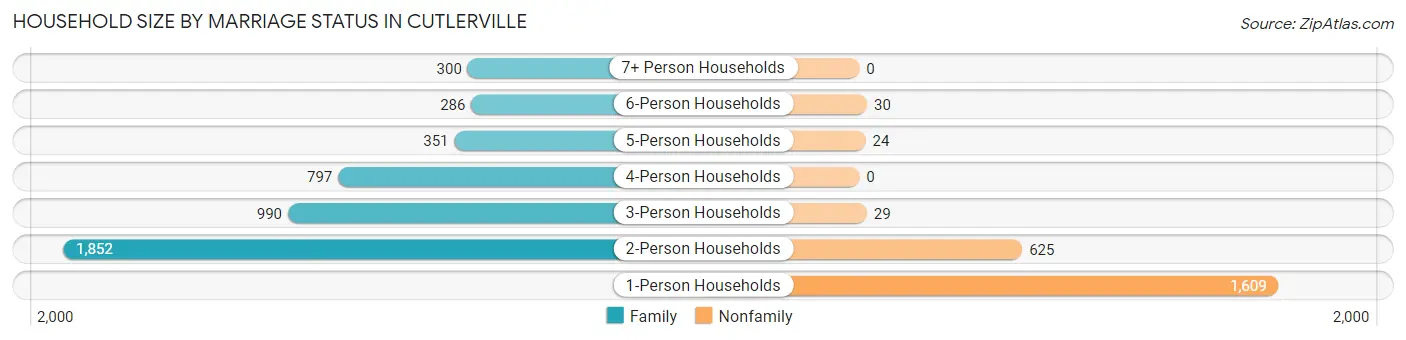
| Household Size | Family Households | Nonfamily Households |
| 1-Person Households | - | 1,609 (23.3%) |
| 2-Person Households | 1,852 (26.9%) | 625 (9.1%) |
| 3-Person Households | 990 (14.4%) | 29 (0.4%) |
| 4-Person Households | 797 (11.6%) | 0 (0.0%) |
| 5-Person Households | 351 (5.1%) | 24 (0.4%) |
| 6-Person Households | 286 (4.2%) | 30 (0.4%) |
| 7+ Person Households | 300 (4.3%) | 0 (0.0%) |
| Total | 4,576 (66.4%) | 2,317 (33.6%) |
Female Fertility in Cutlerville
Fertility by Age in Cutlerville
Average fertility rate in Cutlerville is 47.0 births per 1,000 women. Women in the age bracket of 35 to 50 years have the highest fertility rate with 73.0 births per 1,000 women. Women in the age bracket of 35 to 50 years acount for 67.8% of all women with births.
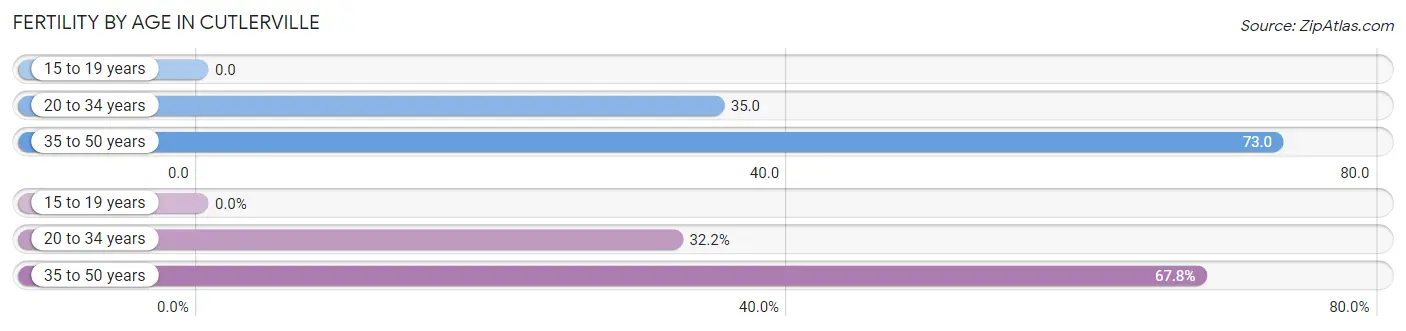
| Age Bracket | Women with Births | Births / 1,000 Women |
| 15 to 19 years | 0 (0.0%) | 0.0 |
| 20 to 34 years | 66 (32.2%) | 35.0 |
| 35 to 50 years | 139 (67.8%) | 73.0 |
| Total | 205 (100.0%) | 47.0 |
Fertility by Age by Marriage Status in Cutlerville
61.5% of women with births (205) in Cutlerville are married. The highest percentage of unmarried women with births falls into 35 to 50 years age bracket with 39.6% of them unmarried at the time of birth, while the lowest percentage of unmarried women with births belong to 20 to 34 years age bracket with 36.4% of them unmarried.
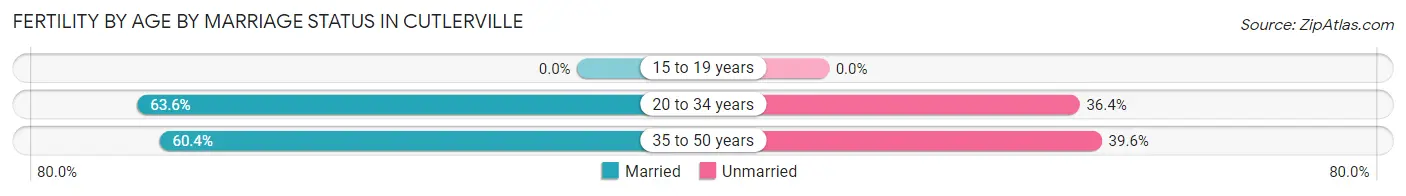
| Age Bracket | Married | Unmarried |
| 15 to 19 years | 0 (0.0%) | 0 (0.0%) |
| 20 to 34 years | 42 (63.6%) | 24 (36.4%) |
| 35 to 50 years | 84 (60.4%) | 55 (39.6%) |
| Total | 126 (61.5%) | 79 (38.5%) |
Fertility by Education in Cutlerville
Average fertility rate in Cutlerville is 47.0 births per 1,000 women. Women with the education attainment of high school diploma have the highest fertility rate of 67.0 births per 1,000 women, while women with the education attainment of college or associate's degree have the lowest fertility at 29.0 births per 1,000 women. Women with the education attainment of high school diploma represent 43.9% of all women with births.
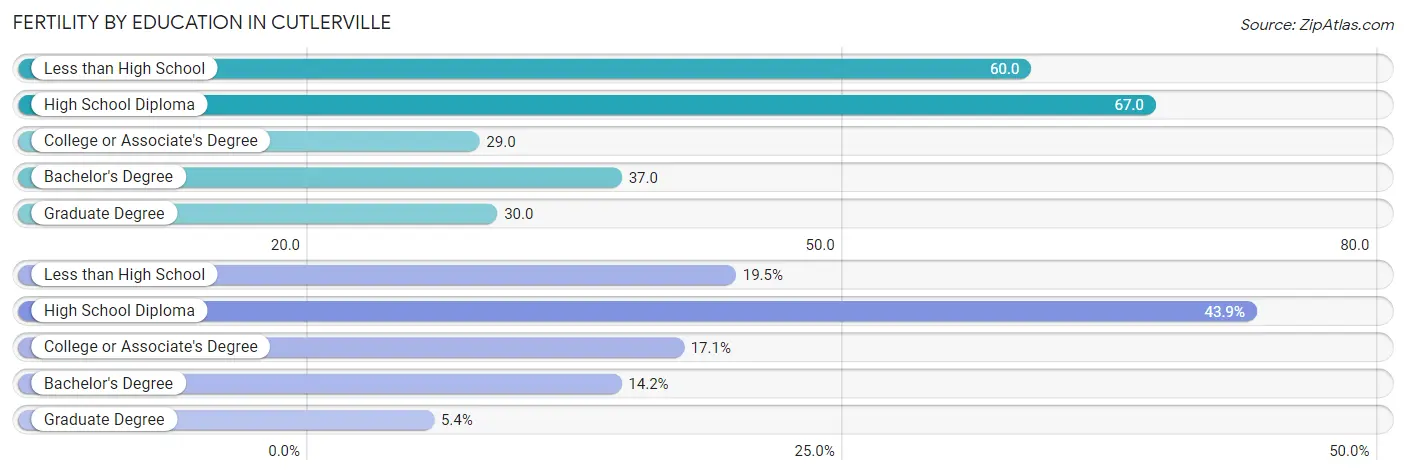
| Educational Attainment | Women with Births | Births / 1,000 Women |
| Less than High School | 40 (19.5%) | 60.0 |
| High School Diploma | 90 (43.9%) | 67.0 |
| College or Associate's Degree | 35 (17.1%) | 29.0 |
| Bachelor's Degree | 29 (14.1%) | 37.0 |
| Graduate Degree | 11 (5.4%) | 30.0 |
| Total | 205 (100.0%) | 47.0 |
Fertility by Education by Marriage Status in Cutlerville
38.5% of women with births in Cutlerville are unmarried. Women with the educational attainment of less than high school are most likely to be married with 100.0% of them married at childbirth, while women with the educational attainment of high school diploma are least likely to be married with 87.8% of them unmarried at childbirth.
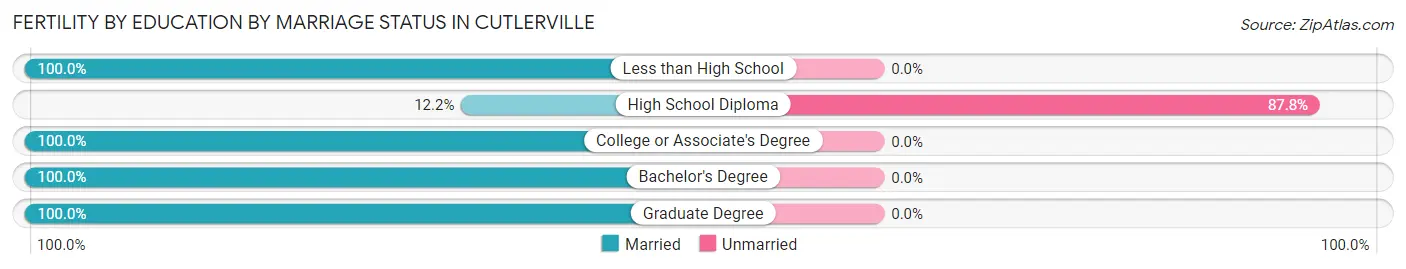
| Educational Attainment | Married | Unmarried |
| Less than High School | 40 (100.0%) | 0 (0.0%) |
| High School Diploma | 11 (12.2%) | 79 (87.8%) |
| College or Associate's Degree | 35 (100.0%) | 0 (0.0%) |
| Bachelor's Degree | 29 (100.0%) | 0 (0.0%) |
| Graduate Degree | 11 (100.0%) | 0 (0.0%) |
| Total | 126 (61.5%) | 79 (38.5%) |
Employment Characteristics in Cutlerville
Employment by Class of Employer in Cutlerville
Among the 9,986 employed individuals in Cutlerville, private company employees (8,023 | 80.3%), not-for-profit organizations (757 | 7.6%), and self-employed (not incorporated) (528 | 5.3%) make up the most common classes of employment.
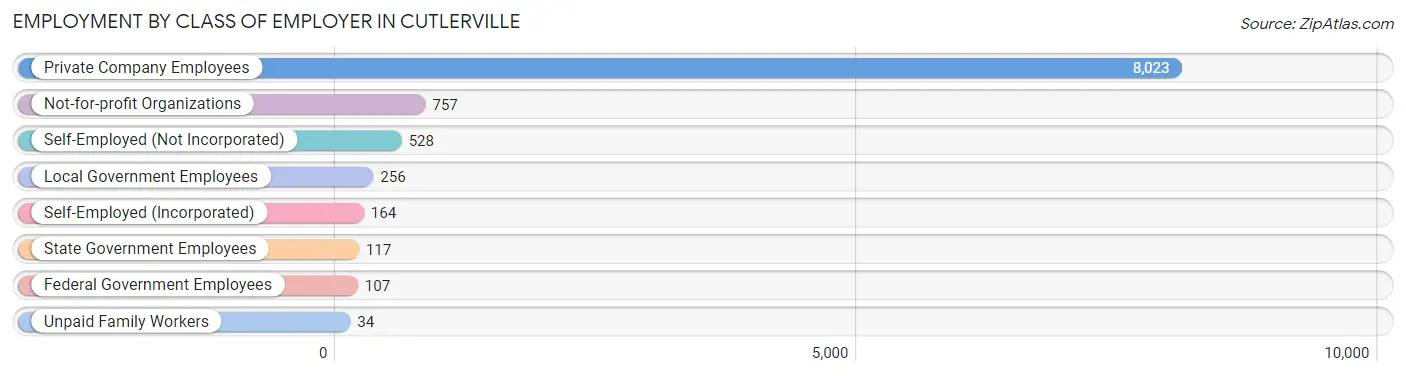
| Employer Class | # Employees | % Employees |
| Private Company Employees | 8,023 | 80.3% |
| Self-Employed (Incorporated) | 164 | 1.6% |
| Self-Employed (Not Incorporated) | 528 | 5.3% |
| Not-for-profit Organizations | 757 | 7.6% |
| Local Government Employees | 256 | 2.6% |
| State Government Employees | 117 | 1.2% |
| Federal Government Employees | 107 | 1.1% |
| Unpaid Family Workers | 34 | 0.3% |
| Total | 9,986 | 100.0% |
Employment Status by Age in Cutlerville
According to the labor force statistics for Cutlerville, out of the total population over 16 years of age (14,197), 74.7% or 10,605 individuals are in the labor force, with 4.5% or 477 of them unemployed. The age group with the highest labor force participation rate is 45 to 54 years, with 92.9% or 1,882 individuals in the labor force. Within the labor force, the 16 to 19 years age range has the highest percentage of unemployed individuals, with 11.9% or 86 of them being unemployed.
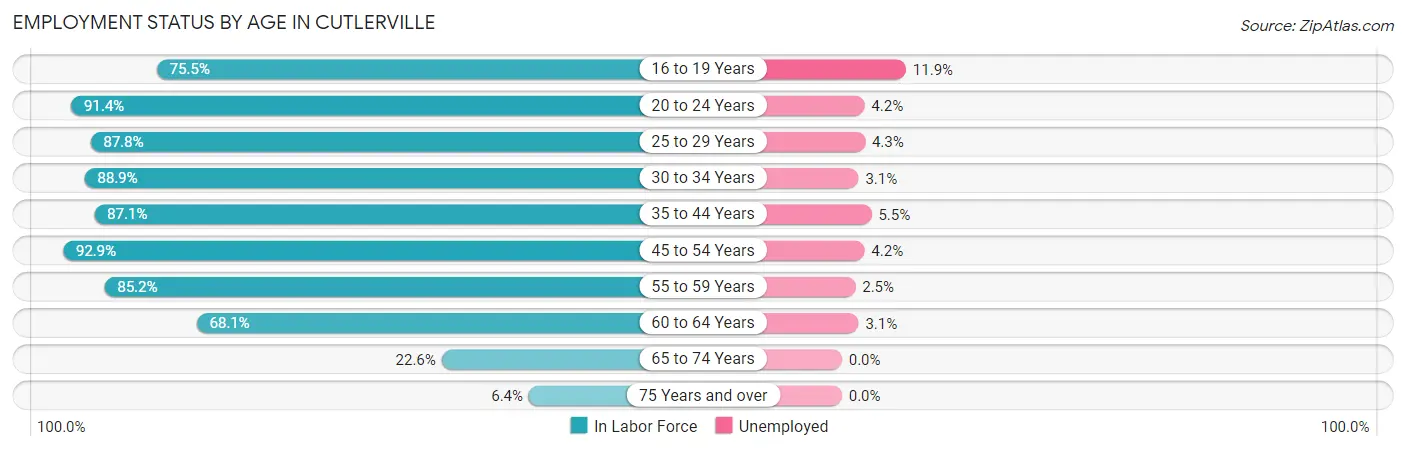
| Age Bracket | In Labor Force | Unemployed |
| 16 to 19 Years | 725 (75.5%) | 86 (11.9%) |
| 20 to 24 Years | 803 (91.4%) | 34 (4.2%) |
| 25 to 29 Years | 1,572 (87.8%) | 68 (4.3%) |
| 30 to 34 Years | 1,167 (88.9%) | 36 (3.1%) |
| 35 to 44 Years | 2,239 (87.1%) | 123 (5.5%) |
| 45 to 54 Years | 1,882 (92.9%) | 79 (4.2%) |
| 55 to 59 Years | 1,177 (85.2%) | 29 (2.5%) |
| 60 to 64 Years | 703 (68.1%) | 22 (3.1%) |
| 65 to 74 Years | 278 (22.6%) | 0 (0.0%) |
| 75 Years and over | 65 (6.4%) | 0 (0.0%) |
| Total | 10,605 (74.7%) | 477 (4.5%) |
Employment Status by Educational Attainment in Cutlerville
According to labor force statistics for Cutlerville, 86.4% of individuals (8,738) out of the total population between 25 and 64 years of age (10,114) are in the labor force, with 4.1% or 358 of them being unemployed. The group with the highest labor force participation rate are those with the educational attainment of bachelor's degree or higher, with 95.1% or 2,331 individuals in the labor force. Within the labor force, individuals with less than high school education have the highest percentage of unemployment, with 10.0% or 74 of them being unemployed.
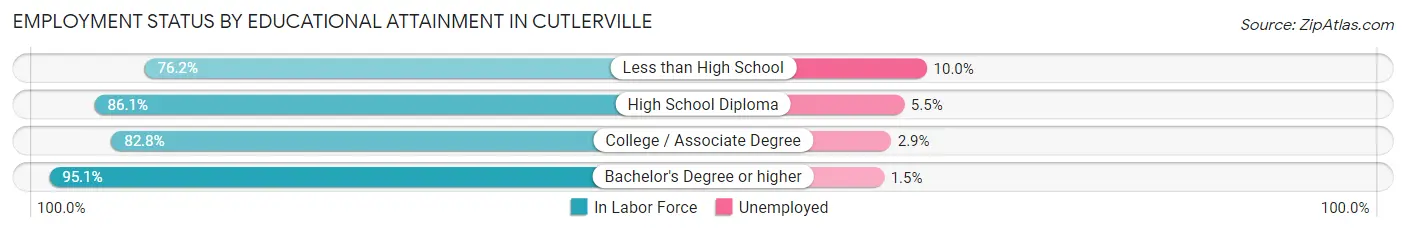
| Educational Attainment | In Labor Force | Unemployed |
| Less than High School | 739 (76.2%) | 97 (10.0%) |
| High School Diploma | 3,339 (86.1%) | 213 (5.5%) |
| College / Associate Degree | 2,331 (82.8%) | 82 (2.9%) |
| Bachelor's Degree or higher | 2,331 (95.1%) | 37 (1.5%) |
| Total | 8,738 (86.4%) | 415 (4.1%) |
Employment Occupations by Sex in Cutlerville
Management, Business, Science and Arts Occupations
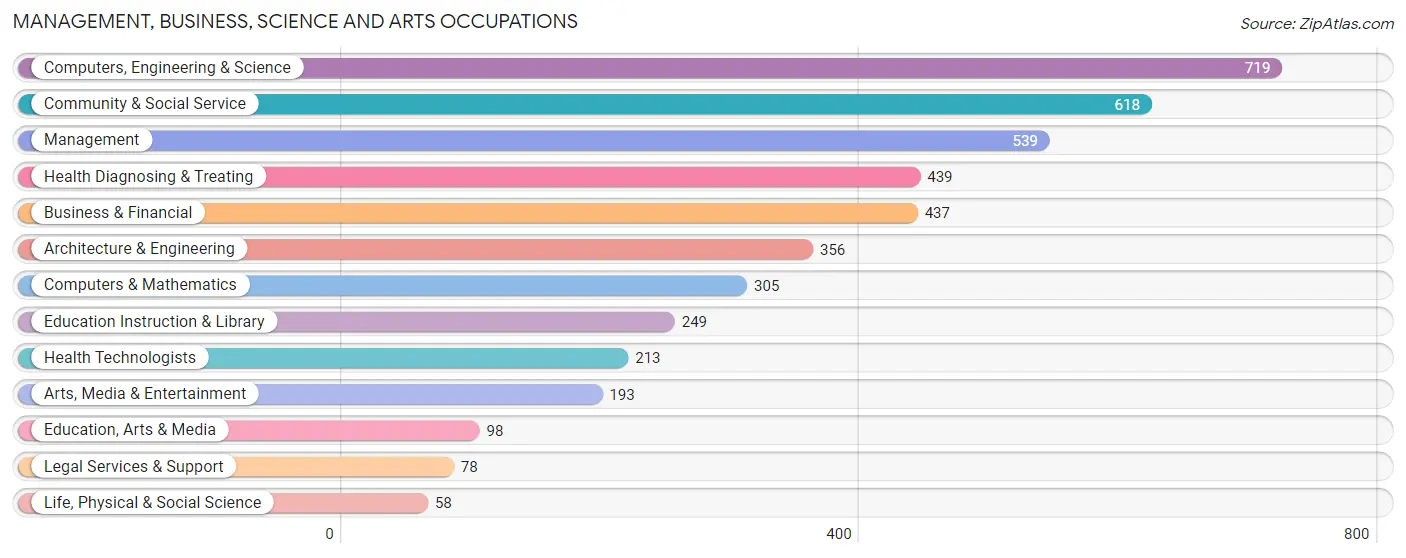
The most common Management, Business, Science and Arts occupations in Cutlerville are Computers, Engineering & Science (719 | 7.1%), Community & Social Service (618 | 6.1%), Management (539 | 5.3%), Health Diagnosing & Treating (439 | 4.3%), and Business & Financial (437 | 4.3%).
Management, Business, Science and Arts Occupations by Sex
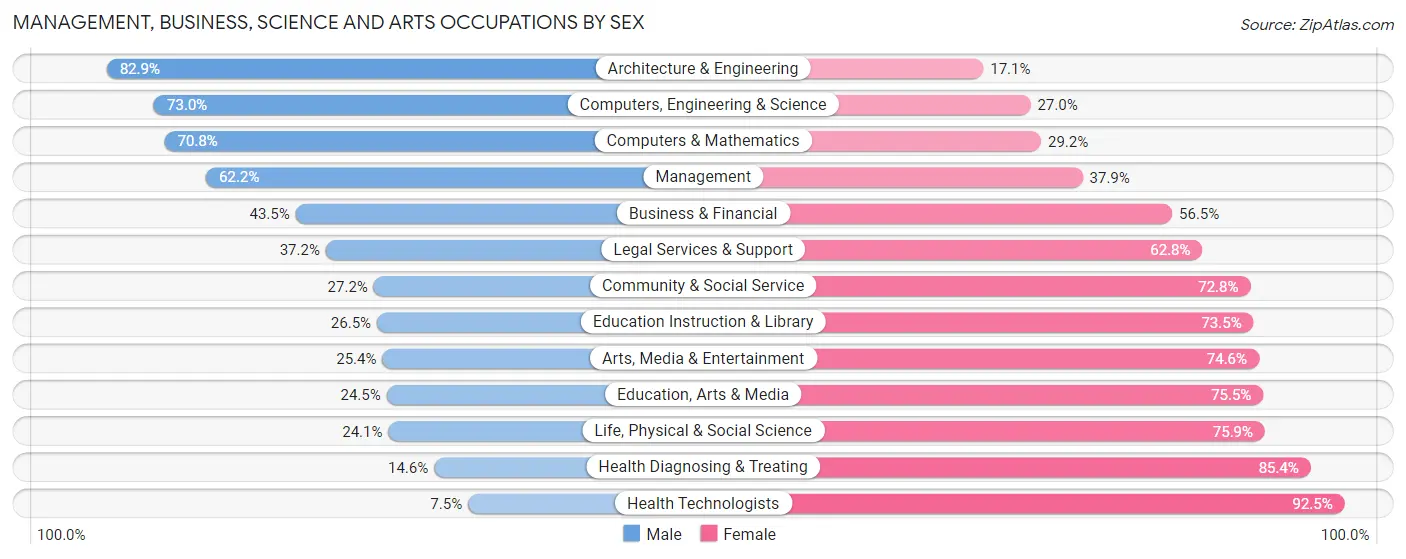
Within the Management, Business, Science and Arts occupations in Cutlerville, the most male-oriented occupations are Architecture & Engineering (82.9%), Computers, Engineering & Science (73.0%), and Computers & Mathematics (70.8%), while the most female-oriented occupations are Health Technologists (92.5%), Health Diagnosing & Treating (85.4%), and Life, Physical & Social Science (75.9%).
| Occupation | Male | Female |
| Management | 335 (62.2%) | 204 (37.9%) |
| Business & Financial | 190 (43.5%) | 247 (56.5%) |
| Computers, Engineering & Science | 525 (73.0%) | 194 (27.0%) |
| Computers & Mathematics | 216 (70.8%) | 89 (29.2%) |
| Architecture & Engineering | 295 (82.9%) | 61 (17.1%) |
| Life, Physical & Social Science | 14 (24.1%) | 44 (75.9%) |
| Community & Social Service | 168 (27.2%) | 450 (72.8%) |
| Education, Arts & Media | 24 (24.5%) | 74 (75.5%) |
| Legal Services & Support | 29 (37.2%) | 49 (62.8%) |
| Education Instruction & Library | 66 (26.5%) | 183 (73.5%) |
| Arts, Media & Entertainment | 49 (25.4%) | 144 (74.6%) |
| Health Diagnosing & Treating | 64 (14.6%) | 375 (85.4%) |
| Health Technologists | 16 (7.5%) | 197 (92.5%) |
| Total (Category) | 1,282 (46.6%) | 1,470 (53.4%) |
| Total (Overall) | 5,481 (54.1%) | 4,652 (45.9%) |
Services Occupations
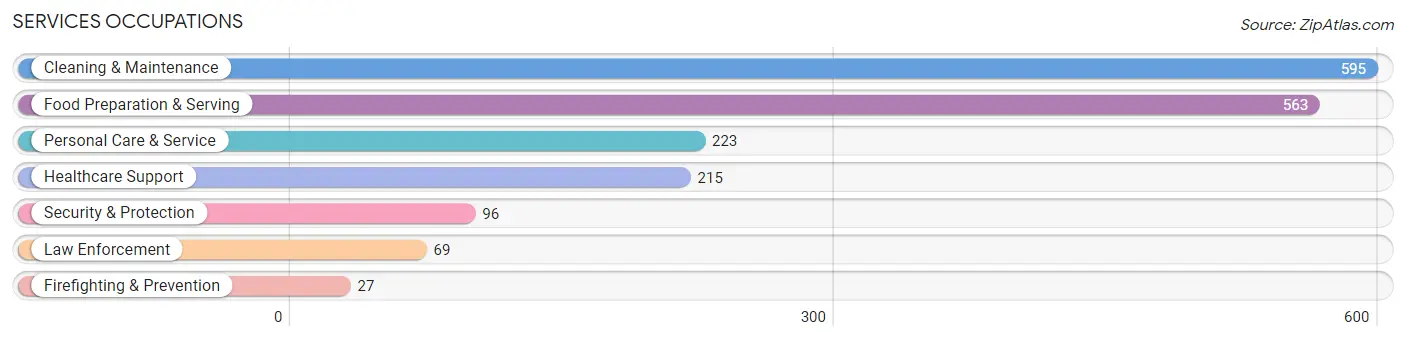
The most common Services occupations in Cutlerville are Cleaning & Maintenance (595 | 5.9%), Food Preparation & Serving (563 | 5.6%), Personal Care & Service (223 | 2.2%), Healthcare Support (215 | 2.1%), and Security & Protection (96 | 0.9%).
Services Occupations by Sex
Within the Services occupations in Cutlerville, the most male-oriented occupations are Cleaning & Maintenance (73.8%), Law Enforcement (69.6%), and Security & Protection (67.7%), while the most female-oriented occupations are Healthcare Support (94.4%), Personal Care & Service (80.3%), and Food Preparation & Serving (52.0%).

| Occupation | Male | Female |
| Healthcare Support | 12 (5.6%) | 203 (94.4%) |
| Security & Protection | 65 (67.7%) | 31 (32.3%) |
| Firefighting & Prevention | 17 (63.0%) | 10 (37.0%) |
| Law Enforcement | 48 (69.6%) | 21 (30.4%) |
| Food Preparation & Serving | 270 (48.0%) | 293 (52.0%) |
| Cleaning & Maintenance | 439 (73.8%) | 156 (26.2%) |
| Personal Care & Service | 44 (19.7%) | 179 (80.3%) |
| Total (Category) | 830 (49.0%) | 862 (50.9%) |
| Total (Overall) | 5,481 (54.1%) | 4,652 (45.9%) |
Sales and Office Occupations
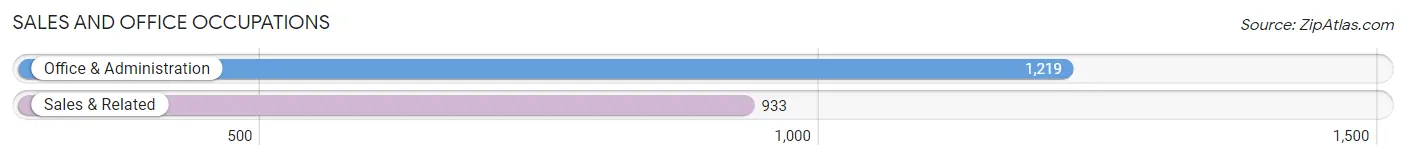
The most common Sales and Office occupations in Cutlerville are Office & Administration (1,219 | 12.0%), and Sales & Related (933 | 9.2%).
Sales and Office Occupations by Sex
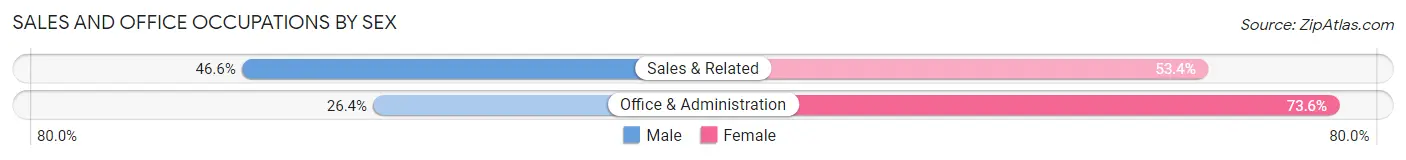
| Occupation | Male | Female |
| Sales & Related | 435 (46.6%) | 498 (53.4%) |
| Office & Administration | 322 (26.4%) | 897 (73.6%) |
| Total (Category) | 757 (35.2%) | 1,395 (64.8%) |
| Total (Overall) | 5,481 (54.1%) | 4,652 (45.9%) |
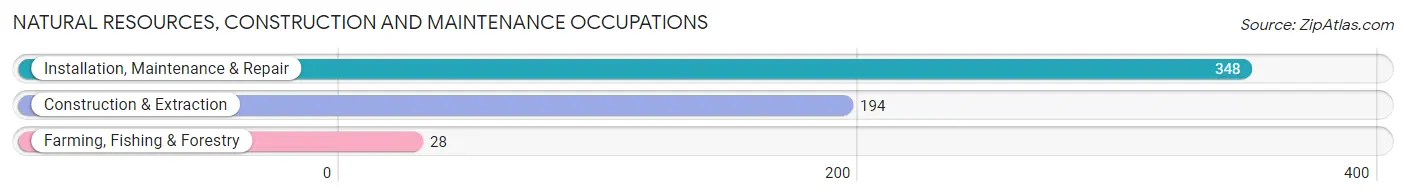
Natural Resources, Construction and Maintenance Occupations
The most common Natural Resources, Construction and Maintenance occupations in Cutlerville are Installation, Maintenance & Repair (348 | 3.4%), Construction & Extraction (194 | 1.9%), and Farming, Fishing & Forestry (28 | 0.3%).
Natural Resources, Construction and Maintenance Occupations by Sex
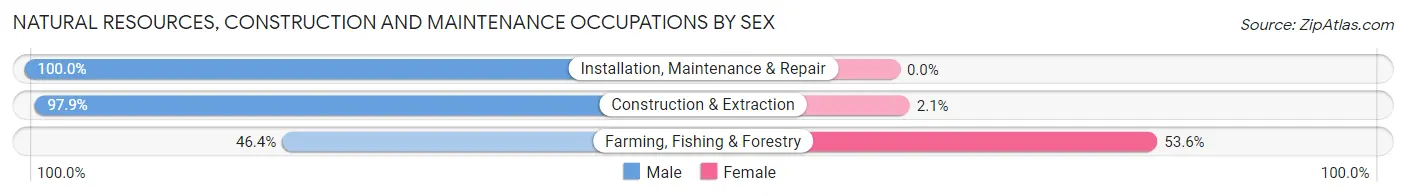
| Occupation | Male | Female |
| Farming, Fishing & Forestry | 13 (46.4%) | 15 (53.6%) |
| Construction & Extraction | 190 (97.9%) | 4 (2.1%) |
| Installation, Maintenance & Repair | 348 (100.0%) | 0 (0.0%) |
| Total (Category) | 551 (96.7%) | 19 (3.3%) |
| Total (Overall) | 5,481 (54.1%) | 4,652 (45.9%) |
Production, Transportation and Moving Occupations
The most common Production, Transportation and Moving occupations in Cutlerville are Production (1,579 | 15.6%), Material Moving (805 | 7.9%), and Transportation (583 | 5.8%).
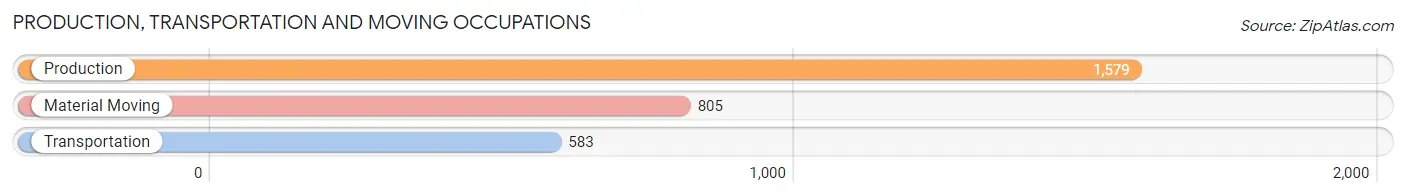
Production, Transportation and Moving Occupations by Sex
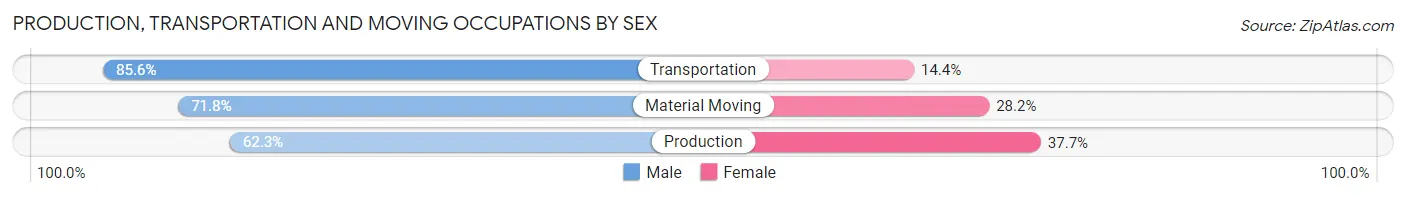
| Occupation | Male | Female |
| Production | 984 (62.3%) | 595 (37.7%) |
| Transportation | 499 (85.6%) | 84 (14.4%) |
| Material Moving | 578 (71.8%) | 227 (28.2%) |
| Total (Category) | 2,061 (69.5%) | 906 (30.5%) |
| Total (Overall) | 5,481 (54.1%) | 4,652 (45.9%) |
Employment Industries by Sex in Cutlerville
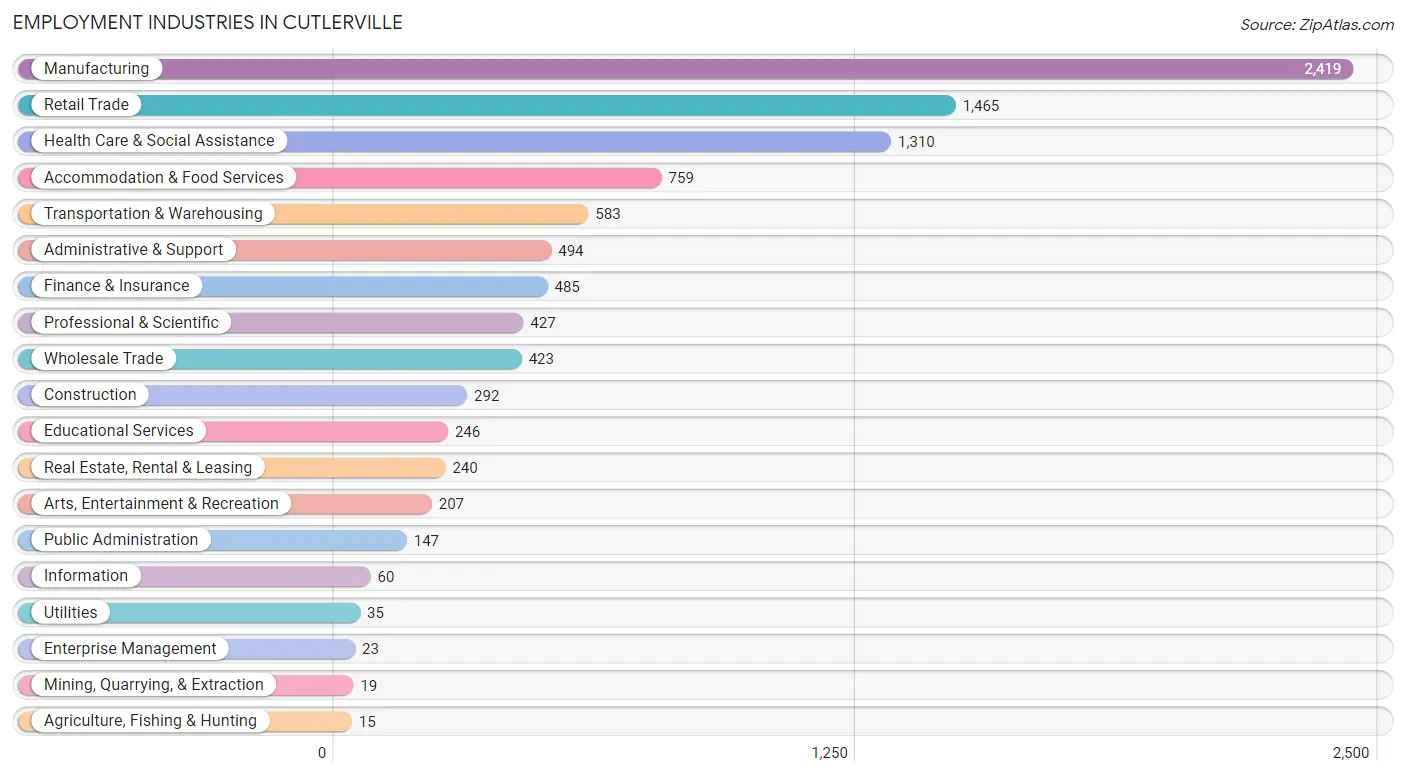
Employment Industries in Cutlerville
The major employment industries in Cutlerville include Manufacturing (2,419 | 23.9%), Retail Trade (1,465 | 14.5%), Health Care & Social Assistance (1,310 | 12.9%), Accommodation & Food Services (759 | 7.5%), and Transportation & Warehousing (583 | 5.8%).
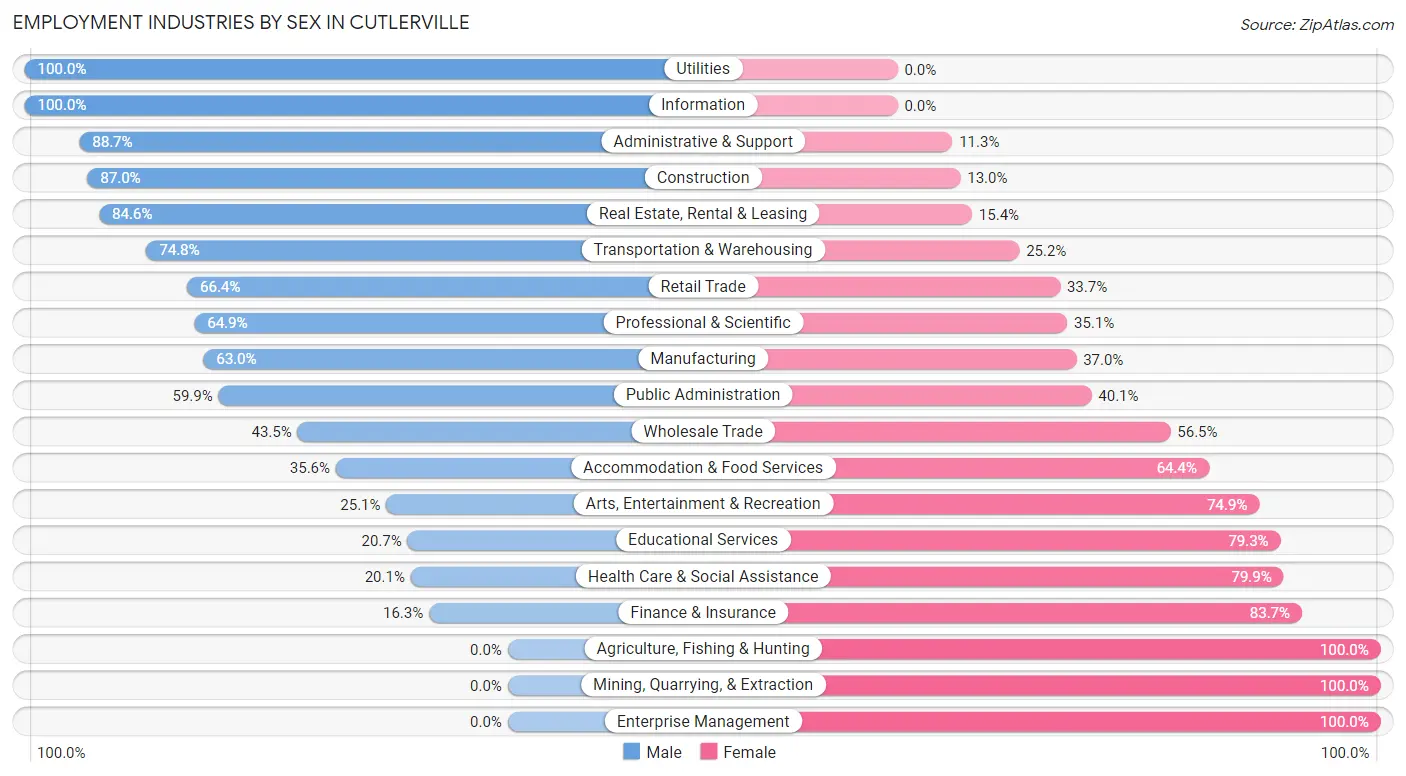
Employment Industries by Sex in Cutlerville
The Cutlerville industries that see more men than women are Utilities (100.0%), Information (100.0%), and Administrative & Support (88.7%), whereas the industries that tend to have a higher number of women are Agriculture, Fishing & Hunting (100.0%), Mining, Quarrying, & Extraction (100.0%), and Enterprise Management (100.0%).
| Industry | Male | Female |
| Agriculture, Fishing & Hunting | 0 (0.0%) | 15 (100.0%) |
| Mining, Quarrying, & Extraction | 0 (0.0%) | 19 (100.0%) |
| Construction | 254 (87.0%) | 38 (13.0%) |
| Manufacturing | 1,524 (63.0%) | 895 (37.0%) |
| Wholesale Trade | 184 (43.5%) | 239 (56.5%) |
| Retail Trade | 972 (66.3%) | 493 (33.7%) |
| Transportation & Warehousing | 436 (74.8%) | 147 (25.2%) |
| Utilities | 35 (100.0%) | 0 (0.0%) |
| Information | 60 (100.0%) | 0 (0.0%) |
| Finance & Insurance | 79 (16.3%) | 406 (83.7%) |
| Real Estate, Rental & Leasing | 203 (84.6%) | 37 (15.4%) |
| Professional & Scientific | 277 (64.9%) | 150 (35.1%) |
| Enterprise Management | 0 (0.0%) | 23 (100.0%) |
| Administrative & Support | 438 (88.7%) | 56 (11.3%) |
| Educational Services | 51 (20.7%) | 195 (79.3%) |
| Health Care & Social Assistance | 263 (20.1%) | 1,047 (79.9%) |
| Arts, Entertainment & Recreation | 52 (25.1%) | 155 (74.9%) |
| Accommodation & Food Services | 270 (35.6%) | 489 (64.4%) |
| Public Administration | 88 (59.9%) | 59 (40.1%) |
| Total | 5,481 (54.1%) | 4,652 (45.9%) |
Education in Cutlerville
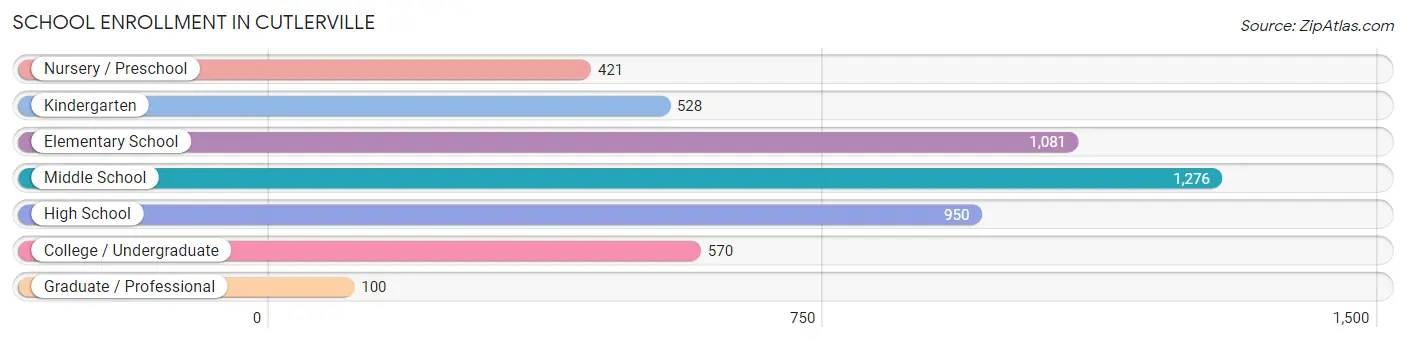
School Enrollment in Cutlerville
The most common levels of schooling among the 4,926 students in Cutlerville are middle school (1,276 | 25.9%), elementary school (1,081 | 21.9%), and high school (950 | 19.3%).
| School Level | # Students | % Students |
| Nursery / Preschool | 421 | 8.6% |
| Kindergarten | 528 | 10.7% |
| Elementary School | 1,081 | 21.9% |
| Middle School | 1,276 | 25.9% |
| High School | 950 | 19.3% |
| College / Undergraduate | 570 | 11.6% |
| Graduate / Professional | 100 | 2.0% |
| Total | 4,926 | 100.0% |
School Enrollment by Age by Funding Source in Cutlerville
Out of a total of 4,926 students who are enrolled in schools in Cutlerville, 813 (16.5%) attend a private institution, while the remaining 4,113 (83.5%) are enrolled in public schools. The age group of 25 to 34 year olds has the highest likelihood of being enrolled in private schools, with 140 (48.8% in the age bracket) enrolled. Conversely, the age group of 35 years and over has the lowest likelihood of being enrolled in a private school, with 120 (91.6% in the age bracket) attending a public institution.
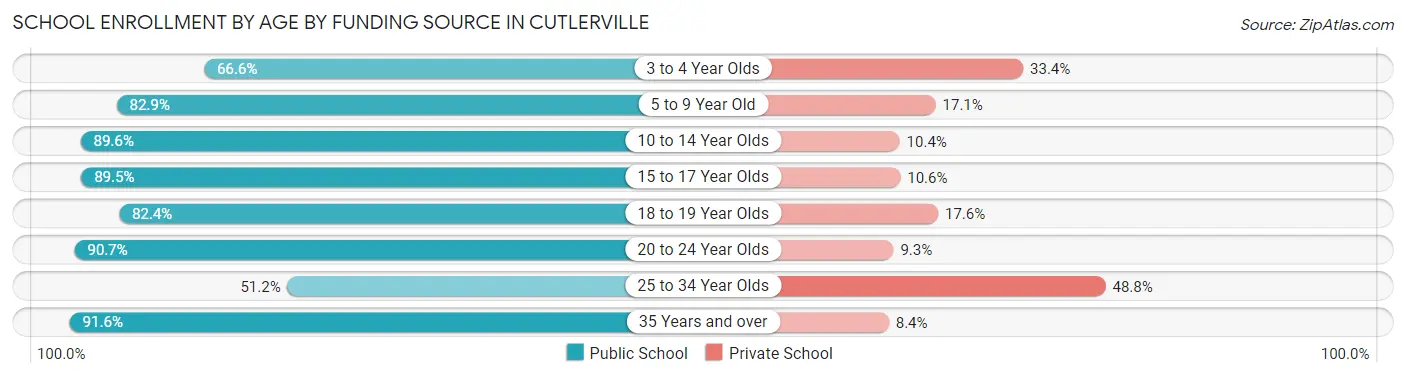
| Age Bracket | Public School | Private School |
| 3 to 4 Year Olds | 265 (66.6%) | 133 (33.4%) |
| 5 to 9 Year Old | 1,103 (82.9%) | 228 (17.1%) |
| 10 to 14 Year Olds | 1,537 (89.6%) | 179 (10.4%) |
| 15 to 17 Year Olds | 653 (89.4%) | 77 (10.5%) |
| 18 to 19 Year Olds | 150 (82.4%) | 32 (17.6%) |
| 20 to 24 Year Olds | 137 (90.7%) | 14 (9.3%) |
| 25 to 34 Year Olds | 147 (51.2%) | 140 (48.8%) |
| 35 Years and over | 120 (91.6%) | 11 (8.4%) |
| Total | 4,113 (83.5%) | 813 (16.5%) |
Educational Attainment by Field of Study in Cutlerville
Business (713 | 24.6%), science & technology (338 | 11.7%), arts & humanities (326 | 11.3%), liberal arts & history (307 | 10.6%), and engineering (215 | 7.4%) are the most common fields of study among 2,896 individuals in Cutlerville who have obtained a bachelor's degree or higher.
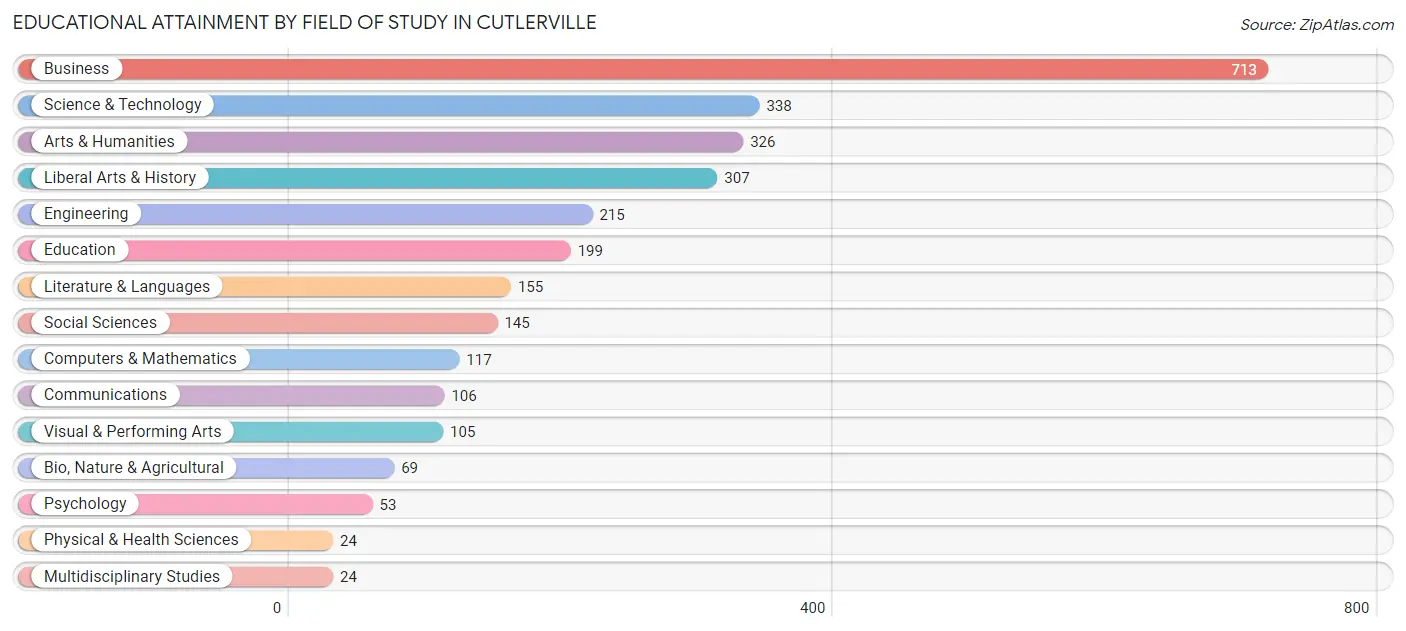
| Field of Study | # Graduates | % Graduates |
| Computers & Mathematics | 117 | 4.0% |
| Bio, Nature & Agricultural | 69 | 2.4% |
| Physical & Health Sciences | 24 | 0.8% |
| Psychology | 53 | 1.8% |
| Social Sciences | 145 | 5.0% |
| Engineering | 215 | 7.4% |
| Multidisciplinary Studies | 24 | 0.8% |
| Science & Technology | 338 | 11.7% |
| Business | 713 | 24.6% |
| Education | 199 | 6.9% |
| Literature & Languages | 155 | 5.3% |
| Liberal Arts & History | 307 | 10.6% |
| Visual & Performing Arts | 105 | 3.6% |
| Communications | 106 | 3.7% |
| Arts & Humanities | 326 | 11.3% |
| Total | 2,896 | 100.0% |
Transportation & Commute in Cutlerville
Vehicle Availability by Sex in Cutlerville
The most prevalent vehicle ownership categories in Cutlerville are males with 2 vehicles (2,412, accounting for 44.6%) and females with 2 vehicles (2,096, making up 52.7%).
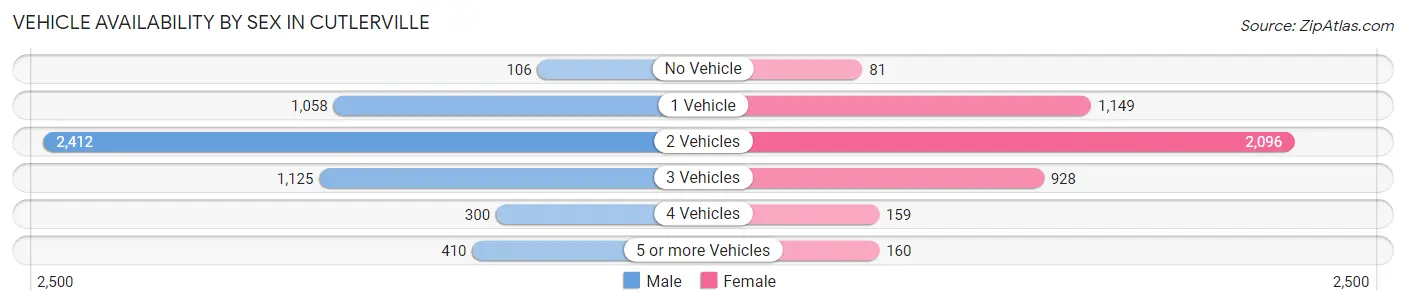
| Vehicles Available | Male | Female |
| No Vehicle | 106 (2.0%) | 81 (1.8%) |
| 1 Vehicle | 1,058 (19.6%) | 1,149 (25.1%) |
| 2 Vehicles | 2,412 (44.6%) | 2,096 (45.8%) |
| 3 Vehicles | 1,125 (20.8%) | 928 (20.3%) |
| 4 Vehicles | 300 (5.5%) | 159 (3.5%) |
| 5 or more Vehicles | 410 (7.6%) | 160 (3.5%) |
| Total | 5,411 (100.0%) | 4,573 (100.0%) |
Commute Time in Cutlerville
The most frequently occuring commute durations in Cutlerville are 15 to 19 minutes (2,114 commuters, 22.4%), 10 to 14 minutes (1,608 commuters, 17.1%), and 20 to 24 minutes (1,589 commuters, 16.9%).
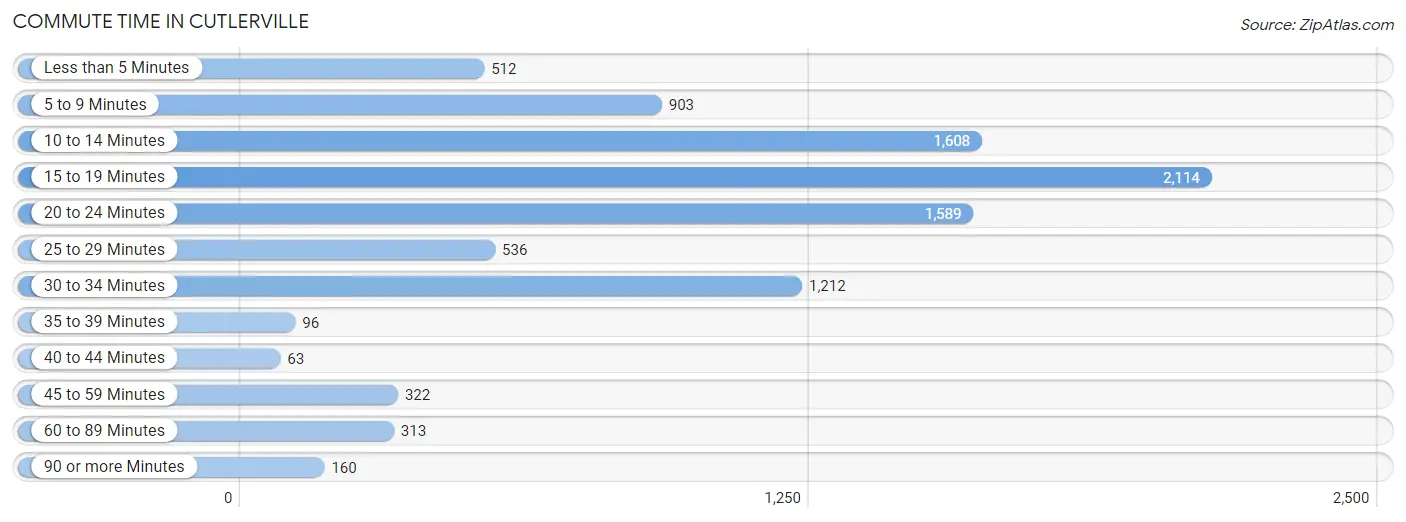
| Commute Time | # Commuters | % Commuters |
| Less than 5 Minutes | 512 | 5.4% |
| 5 to 9 Minutes | 903 | 9.6% |
| 10 to 14 Minutes | 1,608 | 17.1% |
| 15 to 19 Minutes | 2,114 | 22.4% |
| 20 to 24 Minutes | 1,589 | 16.9% |
| 25 to 29 Minutes | 536 | 5.7% |
| 30 to 34 Minutes | 1,212 | 12.9% |
| 35 to 39 Minutes | 96 | 1.0% |
| 40 to 44 Minutes | 63 | 0.7% |
| 45 to 59 Minutes | 322 | 3.4% |
| 60 to 89 Minutes | 313 | 3.3% |
| 90 or more Minutes | 160 | 1.7% |
Commute Time by Sex in Cutlerville
The most common commute times in Cutlerville are 15 to 19 minutes (1,254 commuters, 24.2%) for males and 15 to 19 minutes (860 commuters, 20.3%) for females.
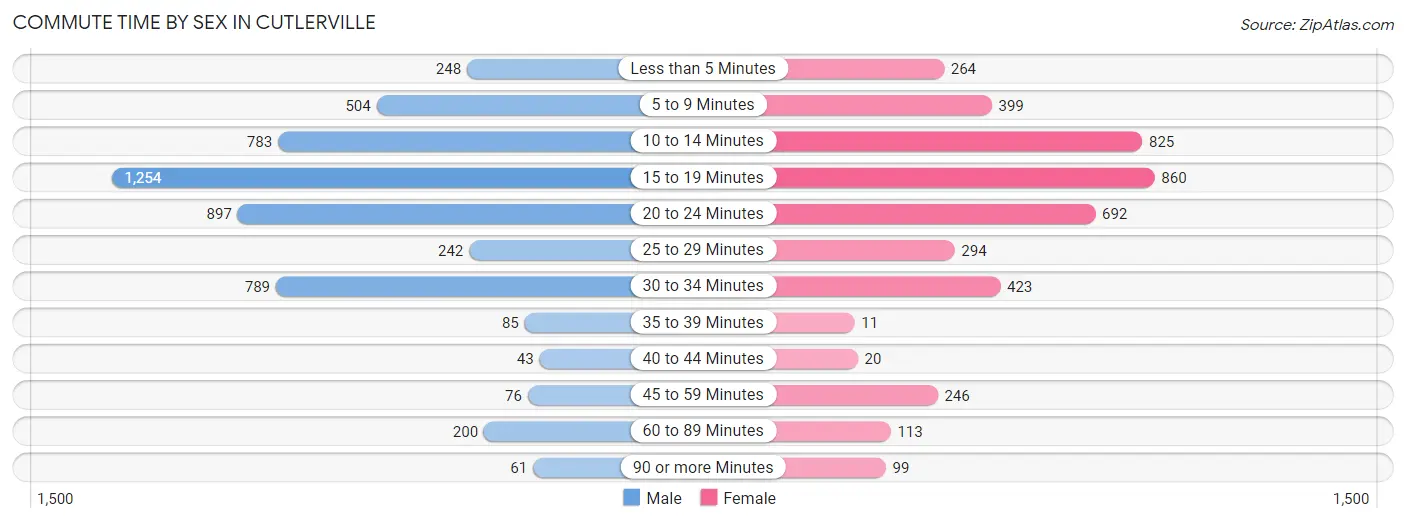
| Commute Time | Male | Female |
| Less than 5 Minutes | 248 (4.8%) | 264 (6.2%) |
| 5 to 9 Minutes | 504 (9.7%) | 399 (9.4%) |
| 10 to 14 Minutes | 783 (15.1%) | 825 (19.4%) |
| 15 to 19 Minutes | 1,254 (24.2%) | 860 (20.3%) |
| 20 to 24 Minutes | 897 (17.3%) | 692 (16.3%) |
| 25 to 29 Minutes | 242 (4.7%) | 294 (6.9%) |
| 30 to 34 Minutes | 789 (15.2%) | 423 (10.0%) |
| 35 to 39 Minutes | 85 (1.6%) | 11 (0.3%) |
| 40 to 44 Minutes | 43 (0.8%) | 20 (0.5%) |
| 45 to 59 Minutes | 76 (1.5%) | 246 (5.8%) |
| 60 to 89 Minutes | 200 (3.9%) | 113 (2.7%) |
| 90 or more Minutes | 61 (1.2%) | 99 (2.3%) |
Time of Departure to Work by Sex in Cutlerville
The most frequent times of departure to work in Cutlerville are 6:30 AM to 6:59 AM (765, 14.8%) for males and 7:00 AM to 7:29 AM (660, 15.5%) for females.
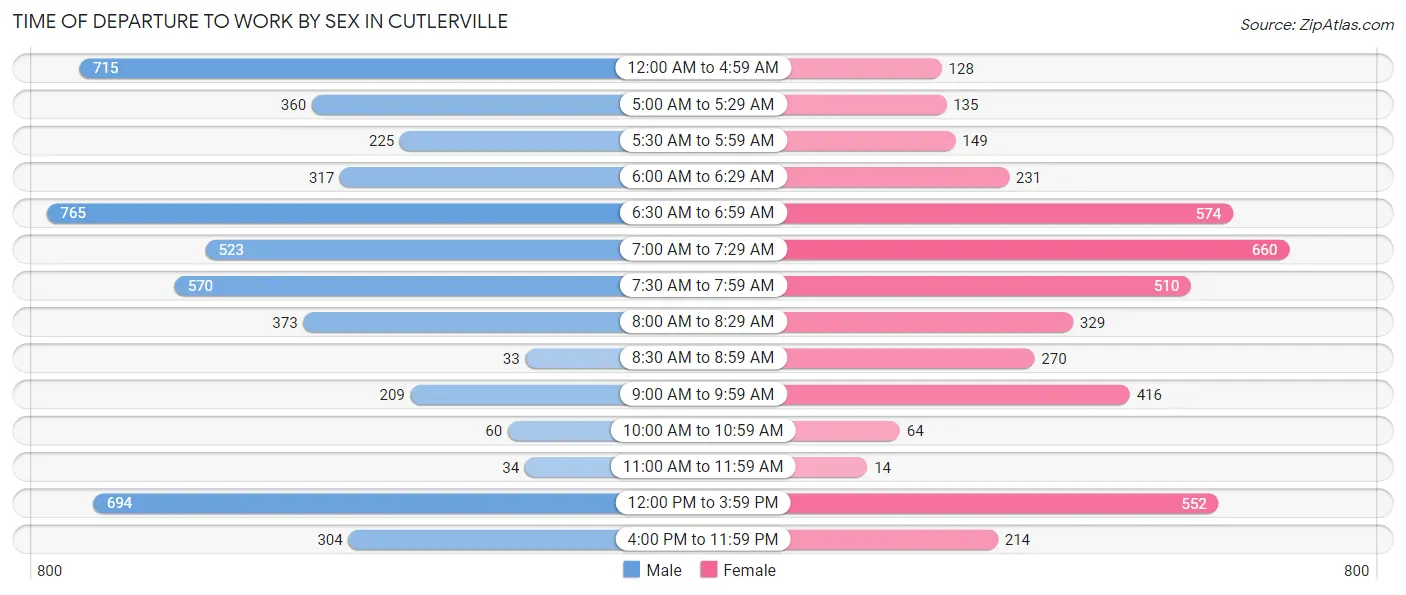
| Time of Departure | Male | Female |
| 12:00 AM to 4:59 AM | 715 (13.8%) | 128 (3.0%) |
| 5:00 AM to 5:29 AM | 360 (7.0%) | 135 (3.2%) |
| 5:30 AM to 5:59 AM | 225 (4.3%) | 149 (3.5%) |
| 6:00 AM to 6:29 AM | 317 (6.1%) | 231 (5.4%) |
| 6:30 AM to 6:59 AM | 765 (14.8%) | 574 (13.5%) |
| 7:00 AM to 7:29 AM | 523 (10.1%) | 660 (15.5%) |
| 7:30 AM to 7:59 AM | 570 (11.0%) | 510 (12.0%) |
| 8:00 AM to 8:29 AM | 373 (7.2%) | 329 (7.7%) |
| 8:30 AM to 8:59 AM | 33 (0.6%) | 270 (6.4%) |
| 9:00 AM to 9:59 AM | 209 (4.0%) | 416 (9.8%) |
| 10:00 AM to 10:59 AM | 60 (1.2%) | 64 (1.5%) |
| 11:00 AM to 11:59 AM | 34 (0.7%) | 14 (0.3%) |
| 12:00 PM to 3:59 PM | 694 (13.4%) | 552 (13.0%) |
| 4:00 PM to 11:59 PM | 304 (5.9%) | 214 (5.0%) |
| Total | 5,182 (100.0%) | 4,246 (100.0%) |
Housing Occupancy in Cutlerville
Occupancy by Ownership in Cutlerville
Of the total 6,893 dwellings in Cutlerville, owner-occupied units account for 4,734 (68.7%), while renter-occupied units make up 2,159 (31.3%).
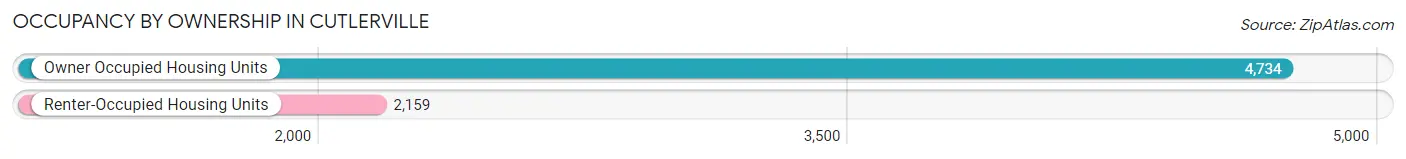
| Occupancy | # Housing Units | % Housing Units |
| Owner Occupied Housing Units | 4,734 | 68.7% |
| Renter-Occupied Housing Units | 2,159 | 31.3% |
| Total Occupied Housing Units | 6,893 | 100.0% |
Occupancy by Household Size in Cutlerville
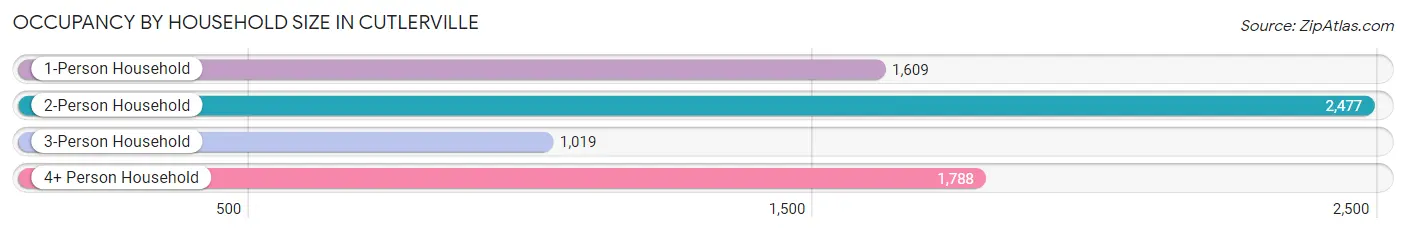
| Household Size | # Housing Units | % Housing Units |
| 1-Person Household | 1,609 | 23.3% |
| 2-Person Household | 2,477 | 35.9% |
| 3-Person Household | 1,019 | 14.8% |
| 4+ Person Household | 1,788 | 25.9% |
| Total Housing Units | 6,893 | 100.0% |
Occupancy by Ownership by Household Size in Cutlerville
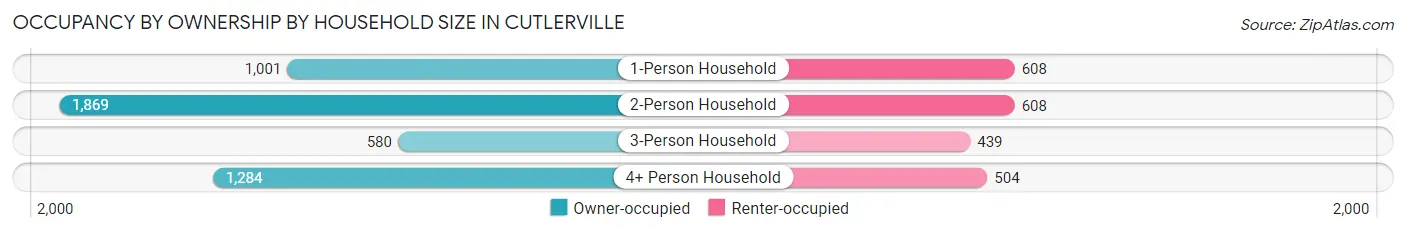
| Household Size | Owner-occupied | Renter-occupied |
| 1-Person Household | 1,001 (62.2%) | 608 (37.8%) |
| 2-Person Household | 1,869 (75.4%) | 608 (24.5%) |
| 3-Person Household | 580 (56.9%) | 439 (43.1%) |
| 4+ Person Household | 1,284 (71.8%) | 504 (28.2%) |
| Total Housing Units | 4,734 (68.7%) | 2,159 (31.3%) |
Occupancy by Educational Attainment in Cutlerville
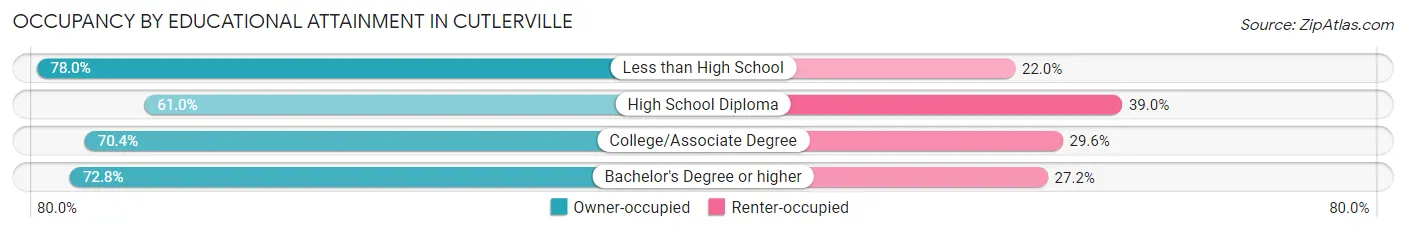
| Household Size | Owner-occupied | Renter-occupied |
| Less than High School | 563 (78.0%) | 159 (22.0%) |
| High School Diploma | 1,405 (61.0%) | 898 (39.0%) |
| College/Associate Degree | 1,492 (70.4%) | 626 (29.6%) |
| Bachelor's Degree or higher | 1,274 (72.8%) | 476 (27.2%) |
Occupancy by Age of Householder in Cutlerville
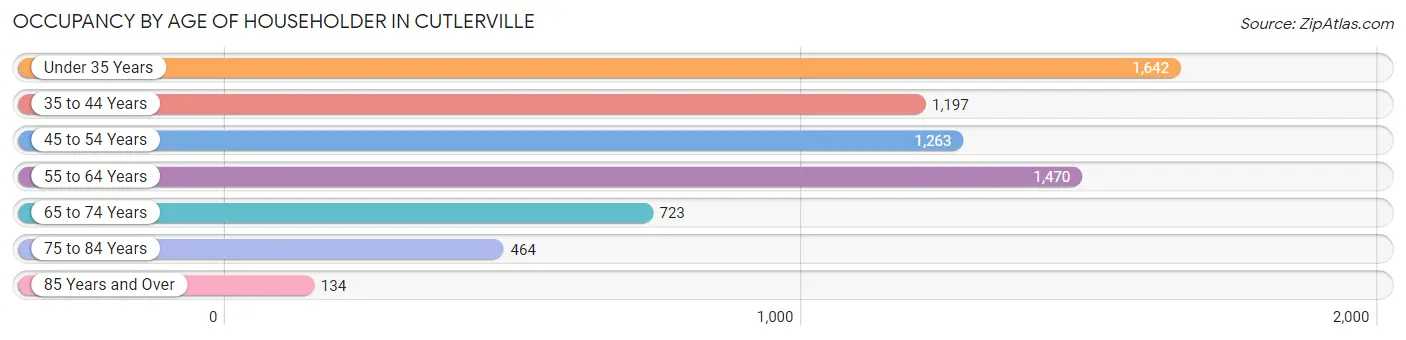
| Age Bracket | # Households | % Households |
| Under 35 Years | 1,642 | 23.8% |
| 35 to 44 Years | 1,197 | 17.4% |
| 45 to 54 Years | 1,263 | 18.3% |
| 55 to 64 Years | 1,470 | 21.3% |
| 65 to 74 Years | 723 | 10.5% |
| 75 to 84 Years | 464 | 6.7% |
| 85 Years and Over | 134 | 1.9% |
| Total | 6,893 | 100.0% |
Housing Finances in Cutlerville
Median Income by Occupancy in Cutlerville
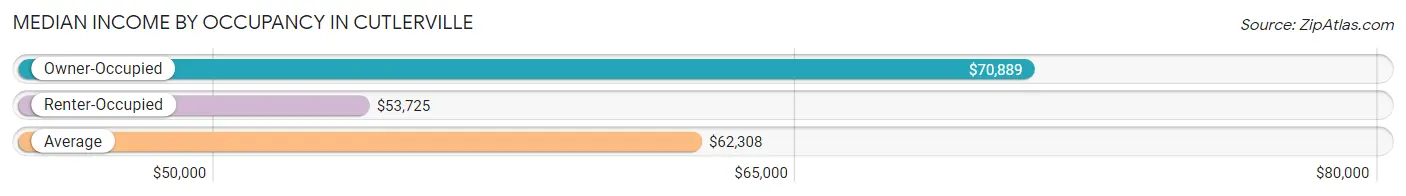
| Occupancy Type | # Households | Median Income |
| Owner-Occupied | 4,734 (68.7%) | $70,889 |
| Renter-Occupied | 2,159 (31.3%) | $53,725 |
| Average | 6,893 (100.0%) | $62,308 |
Occupancy by Householder Income Bracket in Cutlerville
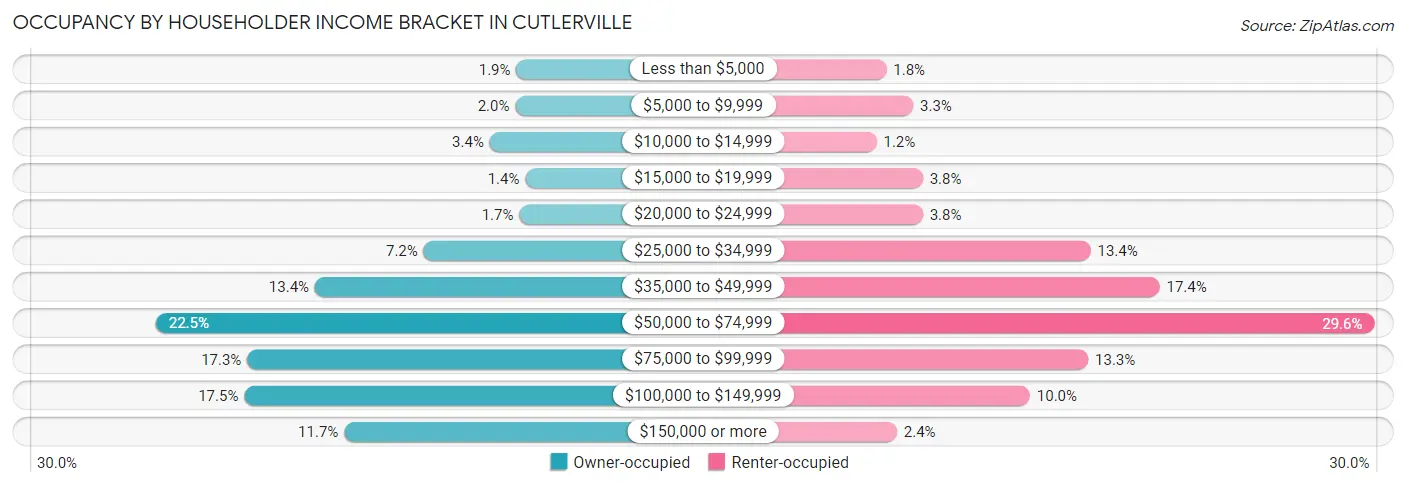
| Income Bracket | Owner-occupied | Renter-occupied |
| Less than $5,000 | 90 (1.9%) | 38 (1.8%) |
| $5,000 to $9,999 | 93 (2.0%) | 71 (3.3%) |
| $10,000 to $14,999 | 162 (3.4%) | 26 (1.2%) |
| $15,000 to $19,999 | 66 (1.4%) | 83 (3.8%) |
| $20,000 to $24,999 | 82 (1.7%) | 83 (3.8%) |
| $25,000 to $34,999 | 341 (7.2%) | 290 (13.4%) |
| $35,000 to $49,999 | 635 (13.4%) | 375 (17.4%) |
| $50,000 to $74,999 | 1,065 (22.5%) | 640 (29.6%) |
| $75,000 to $99,999 | 818 (17.3%) | 287 (13.3%) |
| $100,000 to $149,999 | 826 (17.4%) | 215 (10.0%) |
| $150,000 or more | 556 (11.7%) | 51 (2.4%) |
| Total | 4,734 (100.0%) | 2,159 (100.0%) |
Monthly Housing Cost Tiers in Cutlerville
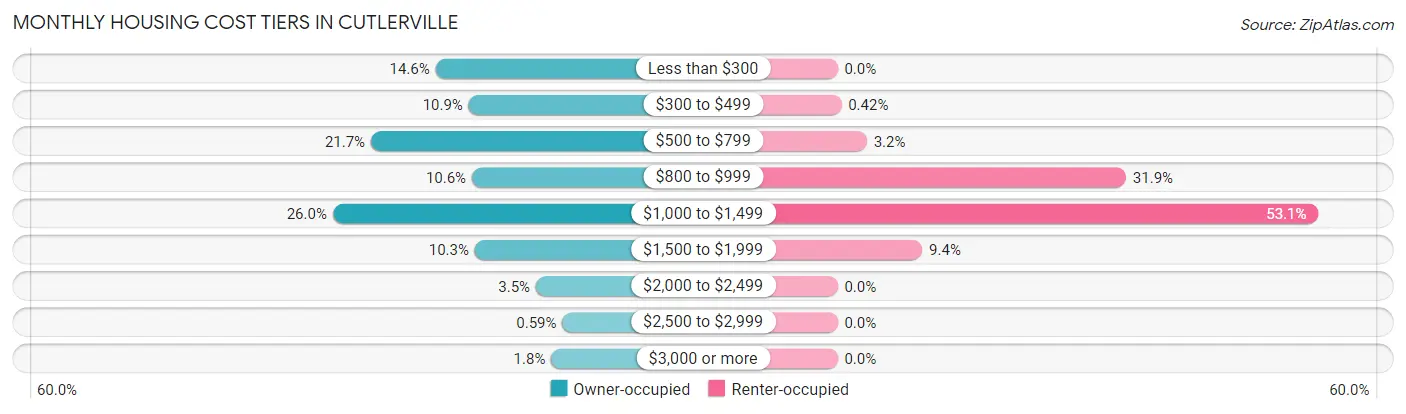
| Monthly Cost | Owner-occupied | Renter-occupied |
| Less than $300 | 691 (14.6%) | 0 (0.0%) |
| $300 to $499 | 518 (10.9%) | 9 (0.4%) |
| $500 to $799 | 1,029 (21.7%) | 70 (3.2%) |
| $800 to $999 | 501 (10.6%) | 688 (31.9%) |
| $1,000 to $1,499 | 1,229 (26.0%) | 1,147 (53.1%) |
| $1,500 to $1,999 | 486 (10.3%) | 202 (9.4%) |
| $2,000 to $2,499 | 166 (3.5%) | 0 (0.0%) |
| $2,500 to $2,999 | 28 (0.6%) | 0 (0.0%) |
| $3,000 or more | 86 (1.8%) | 0 (0.0%) |
| Total | 4,734 (100.0%) | 2,159 (100.0%) |
Physical Housing Characteristics in Cutlerville
Housing Structures in Cutlerville
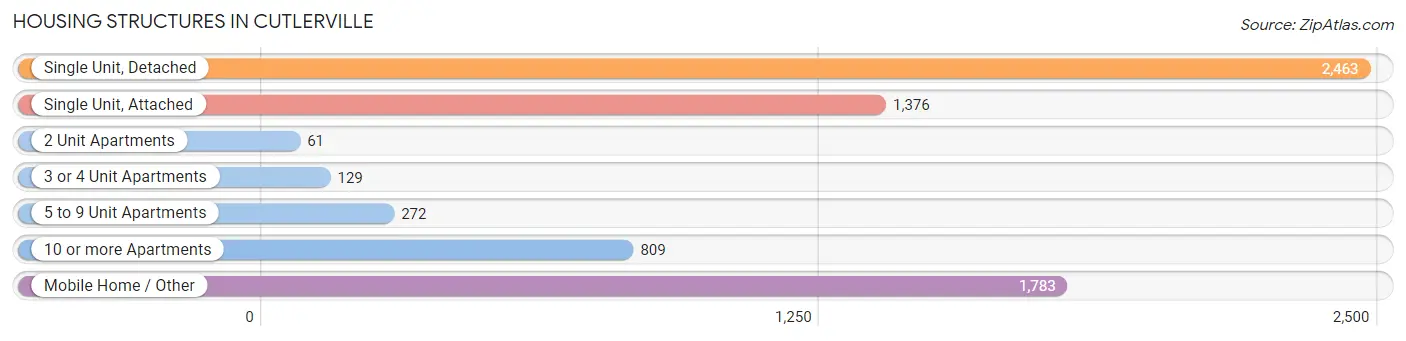
| Structure Type | # Housing Units | % Housing Units |
| Single Unit, Detached | 2,463 | 35.7% |
| Single Unit, Attached | 1,376 | 20.0% |
| 2 Unit Apartments | 61 | 0.9% |
| 3 or 4 Unit Apartments | 129 | 1.9% |
| 5 to 9 Unit Apartments | 272 | 4.0% |
| 10 or more Apartments | 809 | 11.7% |
| Mobile Home / Other | 1,783 | 25.9% |
| Total | 6,893 | 100.0% |
Housing Structures by Occupancy in Cutlerville
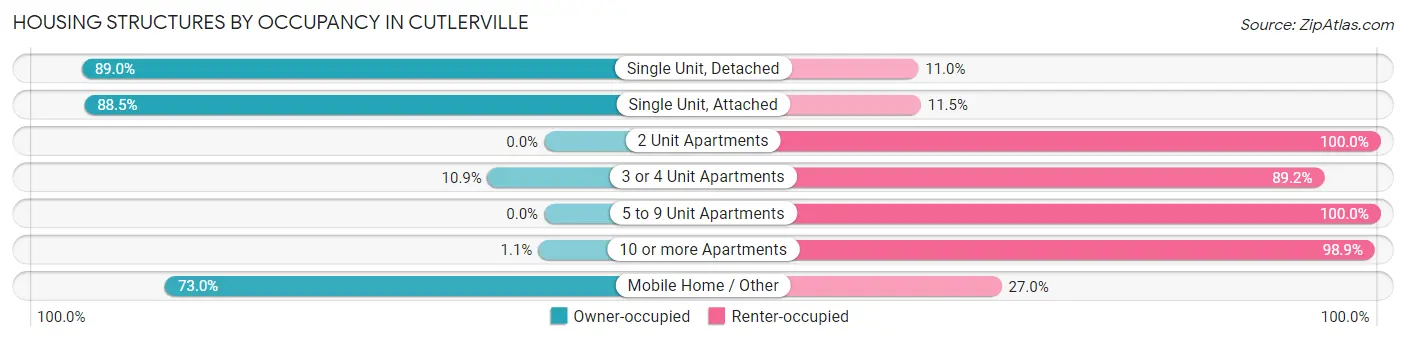
| Structure Type | Owner-occupied | Renter-occupied |
| Single Unit, Detached | 2,192 (89.0%) | 271 (11.0%) |
| Single Unit, Attached | 1,218 (88.5%) | 158 (11.5%) |
| 2 Unit Apartments | 0 (0.0%) | 61 (100.0%) |
| 3 or 4 Unit Apartments | 14 (10.8%) | 115 (89.1%) |
| 5 to 9 Unit Apartments | 0 (0.0%) | 272 (100.0%) |
| 10 or more Apartments | 9 (1.1%) | 800 (98.9%) |
| Mobile Home / Other | 1,301 (73.0%) | 482 (27.0%) |
| Total | 4,734 (68.7%) | 2,159 (31.3%) |
Housing Structures by Number of Rooms in Cutlerville

| Number of Rooms | Owner-occupied | Renter-occupied |
| 1 Room | 44 (0.9%) | 57 (2.6%) |
| 2 or 3 Rooms | 190 (4.0%) | 564 (26.1%) |
| 4 or 5 Rooms | 1,703 (36.0%) | 1,091 (50.5%) |
| 6 or 7 Rooms | 1,623 (34.3%) | 280 (13.0%) |
| 8 or more Rooms | 1,174 (24.8%) | 167 (7.7%) |
| Total | 4,734 (100.0%) | 2,159 (100.0%) |
Housing Structure by Heating Type in Cutlerville
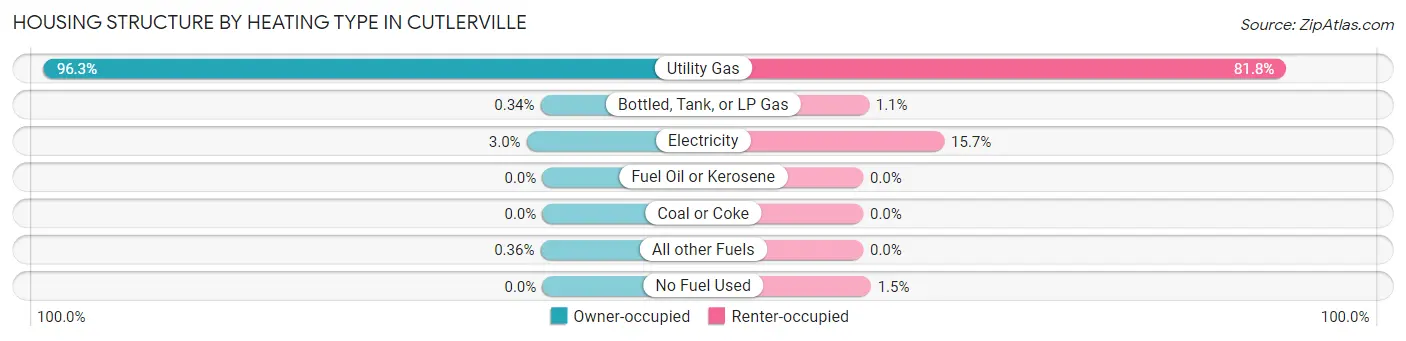
| Heating Type | Owner-occupied | Renter-occupied |
| Utility Gas | 4,558 (96.3%) | 1,765 (81.8%) |
| Bottled, Tank, or LP Gas | 16 (0.3%) | 24 (1.1%) |
| Electricity | 143 (3.0%) | 338 (15.7%) |
| Fuel Oil or Kerosene | 0 (0.0%) | 0 (0.0%) |
| Coal or Coke | 0 (0.0%) | 0 (0.0%) |
| All other Fuels | 17 (0.4%) | 0 (0.0%) |
| No Fuel Used | 0 (0.0%) | 32 (1.5%) |
| Total | 4,734 (100.0%) | 2,159 (100.0%) |
Household Vehicle Usage in Cutlerville
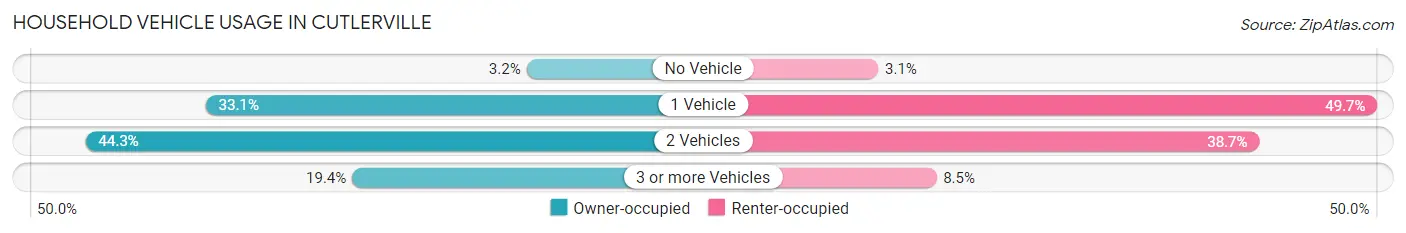
| Vehicles per Household | Owner-occupied | Renter-occupied |
| No Vehicle | 149 (3.2%) | 67 (3.1%) |
| 1 Vehicle | 1,567 (33.1%) | 1,073 (49.7%) |
| 2 Vehicles | 2,098 (44.3%) | 835 (38.7%) |
| 3 or more Vehicles | 920 (19.4%) | 184 (8.5%) |
| Total | 4,734 (100.0%) | 2,159 (100.0%) |
Real Estate & Mortgages in Cutlerville
Real Estate and Mortgage Overview in Cutlerville
| Characteristic | Without Mortgage | With Mortgage |
| Housing Units | 2,496 | 2,238 |
| Median Property Value | $130,600 | $228,900 |
| Median Household Income | $58,086 | $448 |
| Monthly Housing Costs | $510 | $86 |
| Real Estate Taxes | $1,901 | $227 |
Property Value by Mortgage Status in Cutlerville
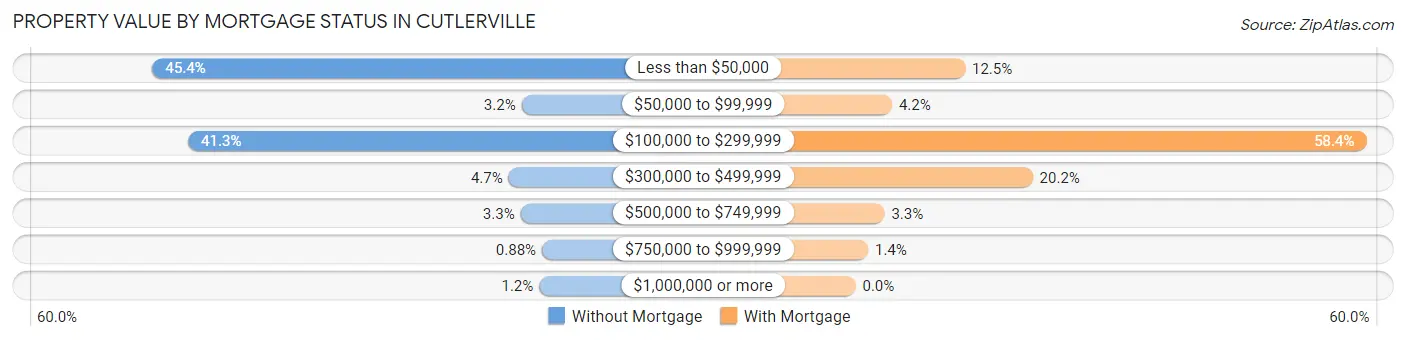
| Property Value | Without Mortgage | With Mortgage |
| Less than $50,000 | 1,133 (45.4%) | 280 (12.5%) |
| $50,000 to $99,999 | 80 (3.2%) | 93 (4.2%) |
| $100,000 to $299,999 | 1,031 (41.3%) | 1,306 (58.4%) |
| $300,000 to $499,999 | 117 (4.7%) | 453 (20.2%) |
| $500,000 to $749,999 | 83 (3.3%) | 74 (3.3%) |
| $750,000 to $999,999 | 22 (0.9%) | 32 (1.4%) |
| $1,000,000 or more | 30 (1.2%) | 0 (0.0%) |
| Total | 2,496 (100.0%) | 2,238 (100.0%) |
Household Income by Mortgage Status in Cutlerville
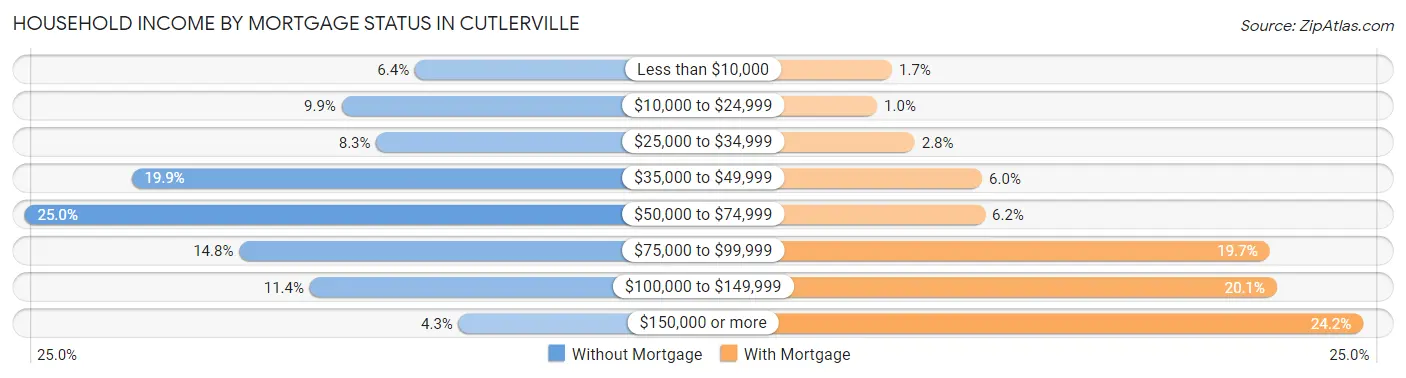
| Household Income | Without Mortgage | With Mortgage |
| Less than $10,000 | 160 (6.4%) | 39 (1.7%) |
| $10,000 to $24,999 | 247 (9.9%) | 23 (1.0%) |
| $25,000 to $34,999 | 206 (8.3%) | 63 (2.8%) |
| $35,000 to $49,999 | 497 (19.9%) | 135 (6.0%) |
| $50,000 to $74,999 | 624 (25.0%) | 138 (6.2%) |
| $75,000 to $99,999 | 369 (14.8%) | 441 (19.7%) |
| $100,000 to $149,999 | 285 (11.4%) | 449 (20.1%) |
| $150,000 or more | 108 (4.3%) | 541 (24.2%) |
| Total | 2,496 (100.0%) | 2,238 (100.0%) |
Property Value to Household Income Ratio in Cutlerville
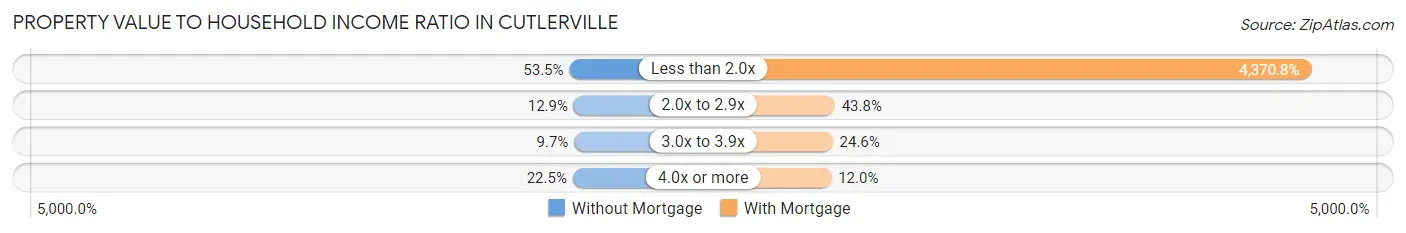
| Value-to-Income Ratio | Without Mortgage | With Mortgage |
| Less than 2.0x | 1,336 (53.5%) | 97,819 (4,370.8%) |
| 2.0x to 2.9x | 322 (12.9%) | 980 (43.8%) |
| 3.0x to 3.9x | 242 (9.7%) | 550 (24.6%) |
| 4.0x or more | 561 (22.5%) | 268 (12.0%) |
| Total | 2,496 (100.0%) | 2,238 (100.0%) |
Real Estate Taxes by Mortgage Status in Cutlerville
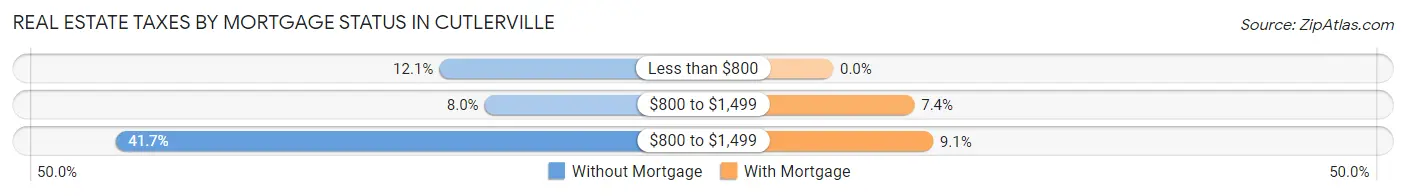
| Property Taxes | Without Mortgage | With Mortgage |
| Less than $800 | 303 (12.1%) | 0 (0.0%) |
| $800 to $1,499 | 200 (8.0%) | 166 (7.4%) |
| $800 to $1,499 | 1,041 (41.7%) | 204 (9.1%) |
| Total | 2,496 (100.0%) | 2,238 (100.0%) |
Health & Disability in Cutlerville
Health Insurance Coverage by Age in Cutlerville
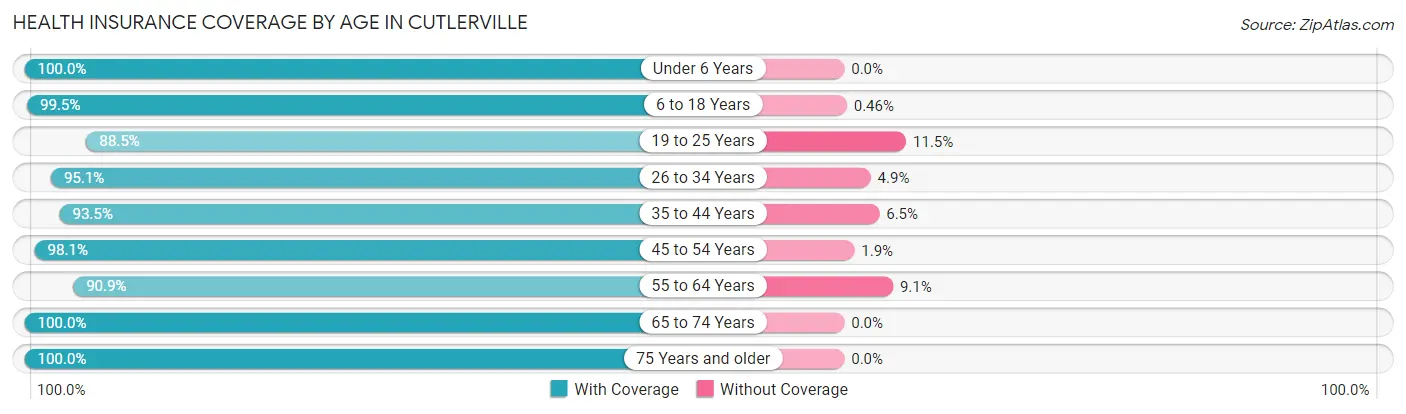
| Age Bracket | With Coverage | Without Coverage |
| Under 6 Years | 1,700 (100.0%) | 0 (0.0%) |
| 6 to 18 Years | 3,896 (99.5%) | 18 (0.5%) |
| 19 to 25 Years | 1,642 (88.5%) | 214 (11.5%) |
| 26 to 34 Years | 2,379 (95.1%) | 123 (4.9%) |
| 35 to 44 Years | 2,403 (93.5%) | 168 (6.5%) |
| 45 to 54 Years | 1,988 (98.1%) | 38 (1.9%) |
| 55 to 64 Years | 2,195 (90.9%) | 219 (9.1%) |
| 65 to 74 Years | 1,216 (100.0%) | 0 (0.0%) |
| 75 Years and older | 1,016 (100.0%) | 0 (0.0%) |
| Total | 18,435 (95.9%) | 780 (4.1%) |
Health Insurance Coverage by Citizenship Status in Cutlerville
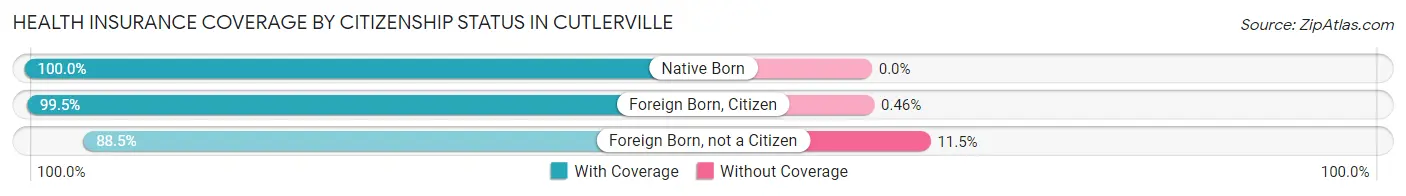
| Citizenship Status | With Coverage | Without Coverage |
| Native Born | 1,700 (100.0%) | 0 (0.0%) |
| Foreign Born, Citizen | 3,896 (99.5%) | 18 (0.5%) |
| Foreign Born, not a Citizen | 1,642 (88.5%) | 214 (11.5%) |
Health Insurance Coverage by Household Income in Cutlerville
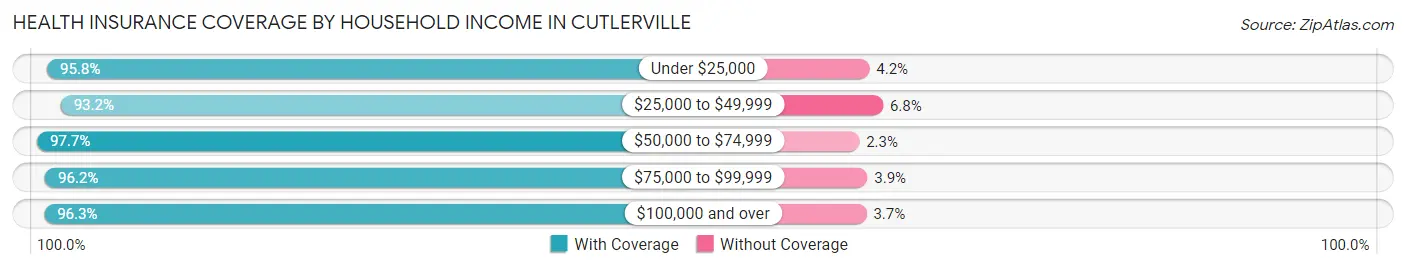
| Household Income | With Coverage | Without Coverage |
| Under $25,000 | 1,383 (95.8%) | 61 (4.2%) |
| $25,000 to $49,999 | 3,628 (93.2%) | 264 (6.8%) |
| $50,000 to $74,999 | 4,032 (97.7%) | 96 (2.3%) |
| $75,000 to $99,999 | 3,618 (96.2%) | 145 (3.8%) |
| $100,000 and over | 5,607 (96.3%) | 214 (3.7%) |
Public vs Private Health Insurance Coverage by Age in Cutlerville
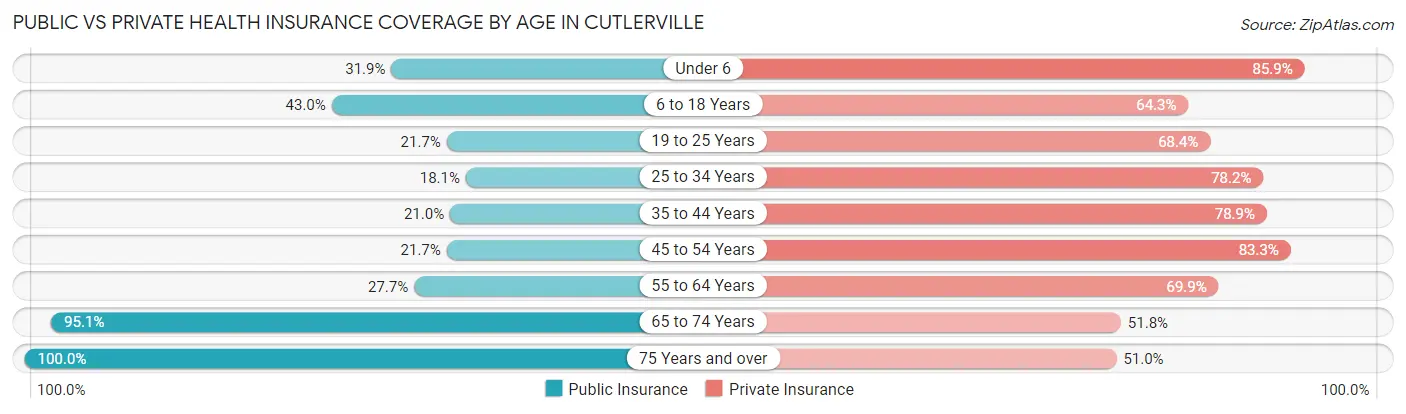
| Age Bracket | Public Insurance | Private Insurance |
| Under 6 | 543 (31.9%) | 1,460 (85.9%) |
| 6 to 18 Years | 1,684 (43.0%) | 2,517 (64.3%) |
| 19 to 25 Years | 402 (21.7%) | 1,269 (68.4%) |
| 25 to 34 Years | 453 (18.1%) | 1,957 (78.2%) |
| 35 to 44 Years | 541 (21.0%) | 2,028 (78.9%) |
| 45 to 54 Years | 439 (21.7%) | 1,688 (83.3%) |
| 55 to 64 Years | 669 (27.7%) | 1,688 (69.9%) |
| 65 to 74 Years | 1,156 (95.1%) | 630 (51.8%) |
| 75 Years and over | 1,016 (100.0%) | 518 (51.0%) |
| Total | 6,903 (35.9%) | 13,755 (71.6%) |
Disability Status by Sex by Age in Cutlerville
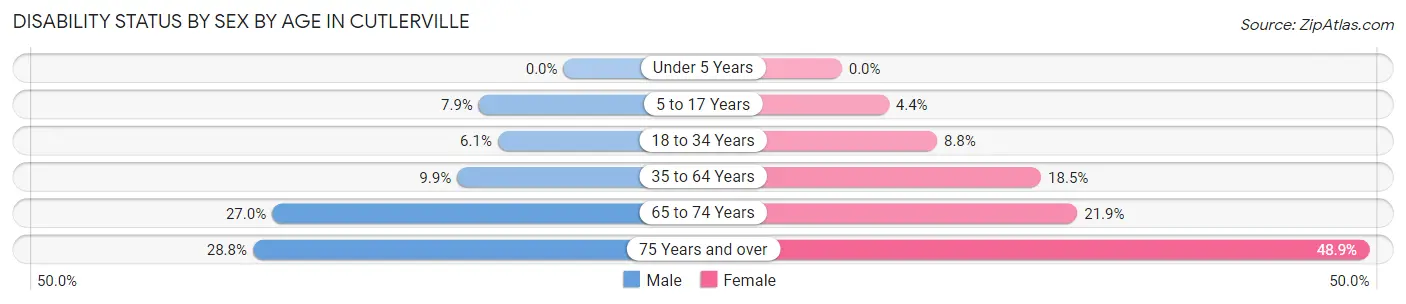
| Age Bracket | Male | Female |
| Under 5 Years | 0 (0.0%) | 0 (0.0%) |
| 5 to 17 Years | 163 (7.9%) | 86 (4.4%) |
| 18 to 34 Years | 146 (6.1%) | 181 (8.8%) |
| 35 to 64 Years | 366 (9.9%) | 611 (18.5%) |
| 65 to 74 Years | 116 (27.0%) | 172 (21.9%) |
| 75 Years and over | 132 (28.8%) | 273 (48.9%) |
Disability Class by Sex by Age in Cutlerville
Disability Class: Hearing Difficulty
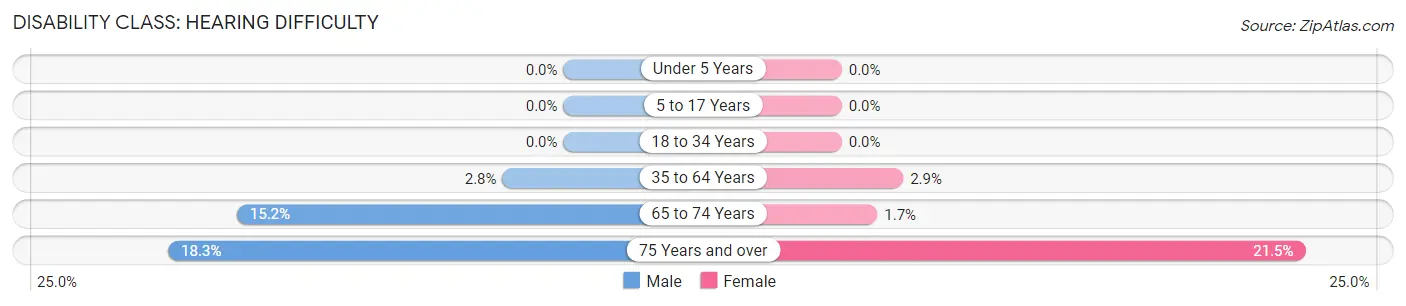
| Age Bracket | Male | Female |
| Under 5 Years | 0 (0.0%) | 0 (0.0%) |
| 5 to 17 Years | 0 (0.0%) | 0 (0.0%) |
| 18 to 34 Years | 0 (0.0%) | 0 (0.0%) |
| 35 to 64 Years | 105 (2.8%) | 94 (2.9%) |
| 65 to 74 Years | 65 (15.1%) | 13 (1.7%) |
| 75 Years and over | 84 (18.3%) | 120 (21.5%) |
Disability Class: Vision Difficulty
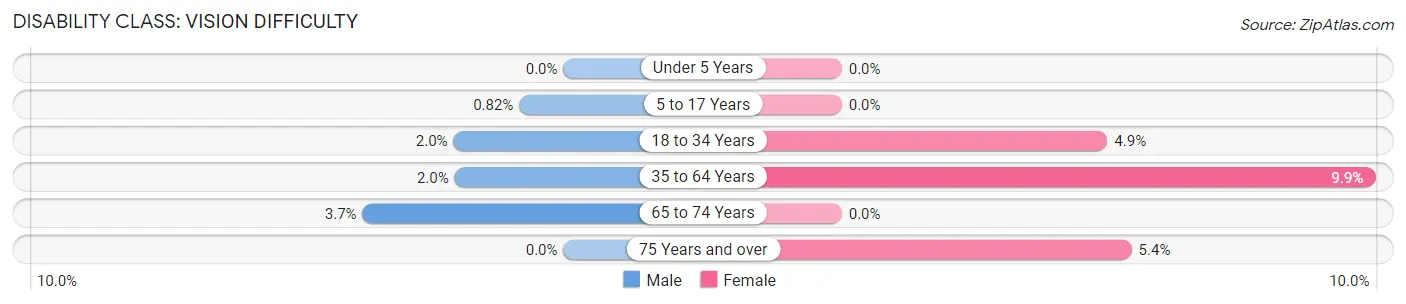
| Age Bracket | Male | Female |
| Under 5 Years | 0 (0.0%) | 0 (0.0%) |
| 5 to 17 Years | 17 (0.8%) | 0 (0.0%) |
| 18 to 34 Years | 49 (2.0%) | 101 (4.9%) |
| 35 to 64 Years | 75 (2.0%) | 327 (9.9%) |
| 65 to 74 Years | 16 (3.7%) | 0 (0.0%) |
| 75 Years and over | 0 (0.0%) | 30 (5.4%) |
Disability Class: Cognitive Difficulty
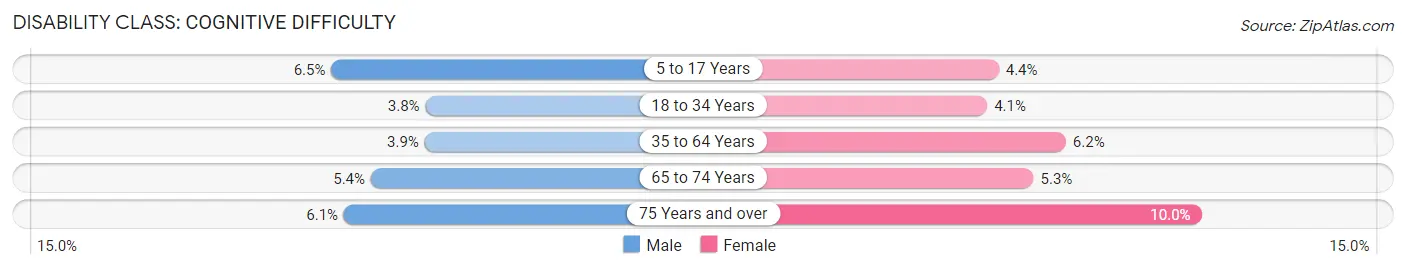
| Age Bracket | Male | Female |
| 5 to 17 Years | 134 (6.5%) | 86 (4.4%) |
| 18 to 34 Years | 92 (3.8%) | 83 (4.1%) |
| 35 to 64 Years | 143 (3.9%) | 206 (6.2%) |
| 65 to 74 Years | 23 (5.4%) | 42 (5.3%) |
| 75 Years and over | 28 (6.1%) | 56 (10.0%) |
Disability Class: Ambulatory Difficulty
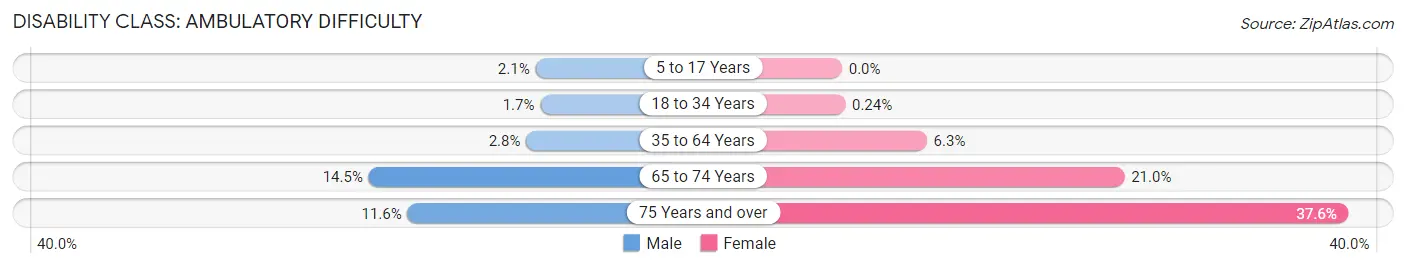
| Age Bracket | Male | Female |
| 5 to 17 Years | 43 (2.1%) | 0 (0.0%) |
| 18 to 34 Years | 41 (1.7%) | 5 (0.2%) |
| 35 to 64 Years | 102 (2.8%) | 208 (6.3%) |
| 65 to 74 Years | 62 (14.4%) | 165 (21.0%) |
| 75 Years and over | 53 (11.6%) | 210 (37.6%) |
Disability Class: Self-Care Difficulty
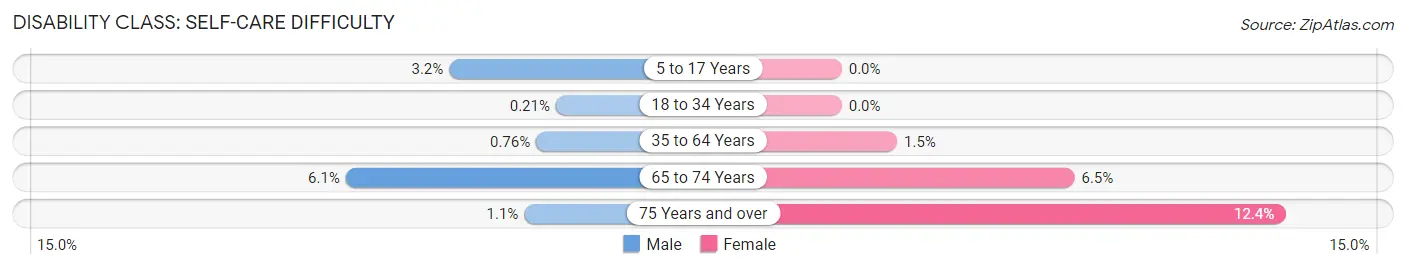
| Age Bracket | Male | Female |
| 5 to 17 Years | 66 (3.2%) | 0 (0.0%) |
| 18 to 34 Years | 5 (0.2%) | 0 (0.0%) |
| 35 to 64 Years | 28 (0.8%) | 51 (1.5%) |
| 65 to 74 Years | 26 (6.1%) | 51 (6.5%) |
| 75 Years and over | 5 (1.1%) | 69 (12.4%) |
Technology Access in Cutlerville
Computing Device Access in Cutlerville
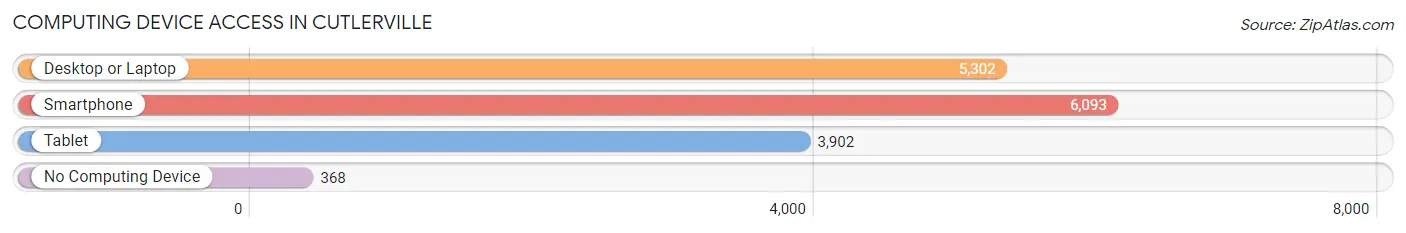
| Device Type | # Households | % Households |
| Desktop or Laptop | 5,302 | 76.9% |
| Smartphone | 6,093 | 88.4% |
| Tablet | 3,902 | 56.6% |
| No Computing Device | 368 | 5.3% |
| Total | 6,893 | 100.0% |
Internet Access in Cutlerville
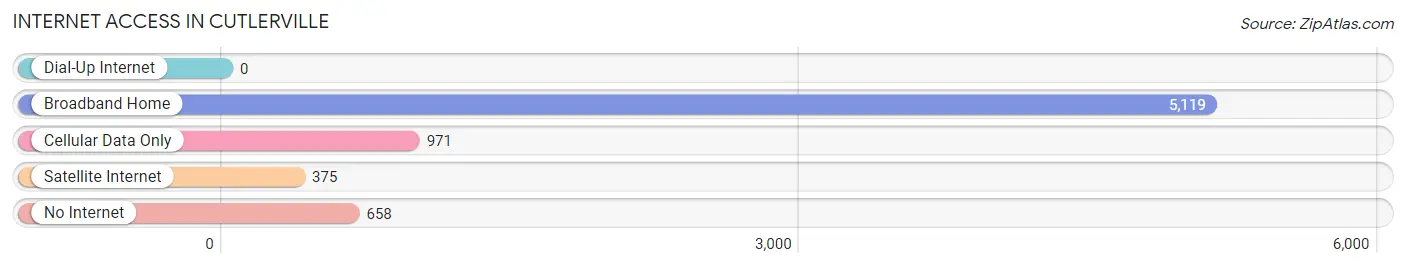
| Internet Type | # Households | % Households |
| Dial-Up Internet | 0 | 0.0% |
| Broadband Home | 5,119 | 74.3% |
| Cellular Data Only | 971 | 14.1% |
| Satellite Internet | 375 | 5.4% |
| No Internet | 658 | 9.6% |
| Total | 6,893 | 100.0% |
Cutlerville Summary
Cutlerville, Michigan is a small unincorporated community located in Kent County, Michigan. It is situated just south of Grand Rapids, the county seat. Cutlerville is a small, rural community with a population of just over 4,000 people.
History
Cutlerville was first settled in 1836 by a group of Dutch immigrants. The town was named after the Cutlers, a prominent family in the area. The Cutlers were farmers and owned a large amount of land in the area. The town was officially incorporated in 1867.
In the late 19th century, Cutlerville was a thriving agricultural community. The town was home to several large farms, as well as a number of small businesses. The town also had a post office, a school, and a church.
In the early 20th century, Cutlerville began to experience a decline in population. This was due to the fact that many of the town’s residents moved away to find work in the larger cities of Michigan. By the 1950s, the population of Cutlerville had dropped to just over 1,000 people.
Geography
Cutlerville is located in the southwestern corner of Kent County, Michigan. It is situated just south of Grand Rapids, the county seat. The town is bordered by the cities of Wyoming and Grandville to the north, and the townships of Gaines and Byron to the south.
The terrain of Cutlerville is mostly flat, with some rolling hills in the northern part of the town. The town is located in the Grand River Valley, which is a major agricultural region in Michigan. The Grand River runs through the town, providing a source of water for the local farms.
Economy
Cutlerville’s economy is largely based on agriculture. The town is home to several large farms, as well as a number of small businesses. The town also has a few retail stores, restaurants, and other services.
The town is also home to a number of manufacturing companies, including a plastics factory and a metal fabrication plant. These companies provide jobs for many of the town’s residents.
Demographics
As of the 2010 census, Cutlerville had a population of 4,072 people. The racial makeup of the town was 94.3% White, 1.3% African American, 0.7% Native American, 0.7% Asian, 0.1% Pacific Islander, and 2.9% from other races. Hispanic or Latino of any race were 4.2% of the population.
The median household income in Cutlerville was $45,938, and the median family income was $51,938. The per capita income for the town was $20,938. About 8.3% of families and 10.2% of the population were below the poverty line, including 14.2% of those under age 18 and 6.2% of those age 65 or over.
Cutlerville is a small, rural community with a rich history and a strong agricultural economy. The town is home to a diverse population, and is a great place to live and work.
Common Questions
What is Per Capita Income in Cutlerville?
Per Capita income in Cutlerville is $28,311.
What is the Median Family Income in Cutlerville?
Median Family Income in Cutlerville is $71,397.
What is the Median Household income in Cutlerville?
Median Household Income in Cutlerville is $62,308.
What is Income or Wage Gap in Cutlerville?
Income or Wage Gap in Cutlerville is 10.3%.
Women in Cutlerville earn 89.7 cents for every dollar earned by a man.
What is Inequality or Gini Index in Cutlerville?
Inequality or Gini Index in Cutlerville is 0.38.
What is the Total Population of Cutlerville?
Total Population of Cutlerville is 19,281.
What is the Total Male Population of Cutlerville?
Total Male Population of Cutlerville is 9,745.
What is the Total Female Population of Cutlerville?
Total Female Population of Cutlerville is 9,536.
What is the Ratio of Males per 100 Females in Cutlerville?
There are 102.19 Males per 100 Females in Cutlerville.
What is the Ratio of Females per 100 Males in Cutlerville?
There are 97.86 Females per 100 Males in Cutlerville.
What is the Median Population Age in Cutlerville?
Median Population Age in Cutlerville is 33.0 Years.
What is the Average Family Size in Cutlerville
Average Family Size in Cutlerville is 3.3 People.
What is the Average Household Size in Cutlerville
Average Household Size in Cutlerville is 2.8 People.
How Large is the Labor Force in Cutlerville?
There are 10,605 People in the Labor Forcein in Cutlerville.
What is the Percentage of People in the Labor Force in Cutlerville?
74.7% of People are in the Labor Force in Cutlerville.
What is the Unemployment Rate in Cutlerville?
Unemployment Rate in Cutlerville is 4.5%.