Zip Codes with the Highest Percentage of Population Employed in Computer & Mathematics in Laurel, MD

RELATED REPORTS & OPTIONS

Computer & Mathematics
Population
Families and Households
Female Fertility
Female Fertility (Unmarried)
Race (Community Size)
Race (Percentage)
Ancestry (Community Size)
AfricanAmericanArabArgentineanArmenianAustralianAustrianBarbadianBhutaneseBlackfeetBrazilianBritishBritish West IndianBurmeseCanadianCentral AmericanCentral American IndianCherokeeChileanColombianCubanCzechDanishDominicanDutchEastern EuropeanEgyptianEnglishEthiopianEuropeanFilipinoFinnishFrenchFrench CanadianGermanGhanaianGreekGuamanian / ChamorroGuatemalanGuyaneseHaitianHonduranHungarianIndian (Asian)IndonesianIranianIrishItalianJamaicanJordanianKenyanKoreanLebaneseLiberianLithuanianMalaysianMexicanNicaraguanNigerianNorwegianPakistaniPanamanianPennsylvania GermanPeruvianPolishPortuguesePuerto RicanRomanianRussianSalvadoranScandinavianScotch-IrishScottishSenegaleseSerbianSierra LeoneanSlovakSloveneSouth AmericanSpaniardSpanishSri LankanSubsaharan AfricanSudaneseSwedishSwissSyrianThaiTrinidadian and TobagonianU.S. Virgin IslanderUgandanUkrainianVenezuelanWelshWest Indian
Ancestry (Percentage)
AfricanAmericanArabArgentineanArmenianAustralianAustrianBarbadianBhutaneseBlackfeetBrazilianBritishBritish West IndianBurmeseCanadianCentral AmericanCentral American IndianCherokeeChileanColombianCubanCzechDanishDominicanDutchEastern EuropeanEgyptianEnglishEthiopianEuropeanFilipinoFinnishFrenchFrench CanadianGermanGhanaianGreekGuamanian / ChamorroGuatemalanGuyaneseHaitianHonduranHungarianIndian (Asian)IndonesianIranianIrishItalianJamaicanJordanianKenyanKoreanLebaneseLiberianLithuanianMalaysianMexicanNicaraguanNigerianNorwegianPakistaniPanamanianPennsylvania GermanPeruvianPolishPortuguesePuerto RicanRomanianRussianSalvadoranScandinavianScotch-IrishScottishSenegaleseSerbianSierra LeoneanSlovakSloveneSouth AmericanSpaniardSpanishSri LankanSubsaharan AfricanSudaneseSwedishSwissSyrianThaiTrinidadian and TobagonianU.S. Virgin IslanderUgandanUkrainianVenezuelanWelshWest Indian
Immigrant Origin (Total)
Immigrant Origin (Percentage)
Income
Income (Families)
Income (Households)
Poverty
Poverty (Families)
Unemployment
Employment Occupations
Employment Industries
Employer Class
Commute Time
Commute Means
School Enrollment
Education by Degree Field
Occupancy
Finances
Physical Characteristics
Laurel
Compare Zip Codes
Comparison Subject

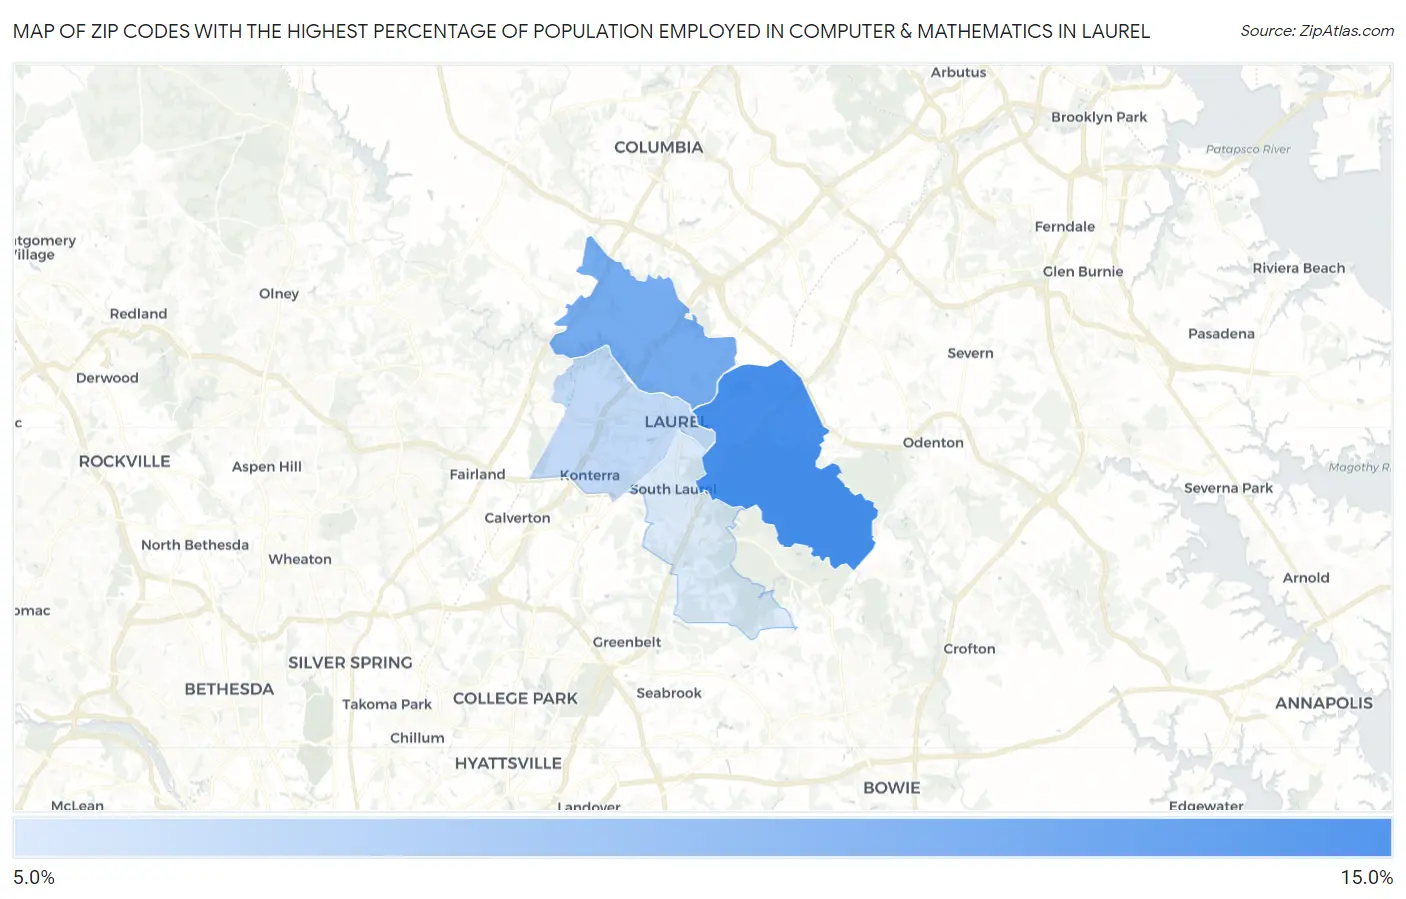
Map of Zip Codes with the Highest Percentage of Population Employed in Computer & Mathematics in Laurel

0.0%
15.0%
Zip Codes with the Highest Percentage of Population Employed in Computer & Mathematics in Laurel Map

Zip Codes with the Highest Percentage of Population Employed in Computer & Mathematics in Laurel, MD

Zip Code % Employed vs State vs National
1.2072411.5%6.1%(+5.40)#303.5%(+8.01)#484
2.207239.8%6.1%(+3.68)#483.5%(+6.29)#741
3.207077.0%6.1%(+0.827)#1123.5%(+3.44)#1,648
4.207086.0%6.1%(-0.133)#1503.5%(+2.48)#2,308

Common Questions

What are the Top 3 Zip Codes with the Highest Percentage of Population Employed in Computer & Mathematics in Laurel, MD?
Top 3 Zip Codes with the Highest Percentage of Population Employed in Computer & Mathematics in Laurel, MD are:
#1
11.5%
#2
9.8%
#3
7.0%
What zip code has the Highest Percentage of Population Employed in Computer & Mathematics in Laurel, MD?
20724 has the Highest Percentage of Population Employed in Computer & Mathematics in Laurel, MD with 11.5%.
What is the Percentage of Population Employed in Computer & Mathematics in Laurel, MD?
Percentage of Population Employed in Computer & Mathematics in Laurel is 7.4%.
What is the Percentage of Population Employed in Computer & Mathematics in Maryland?
Percentage of Population Employed in Computer & Mathematics in Maryland is 6.1%.
What is the Percentage of Population Employed in Computer & Mathematics in the United States?
Percentage of Population Employed in Computer & Mathematics in the United States is 3.5%.