St George Island, MD Map & Demographics
St George Island Map
St George Island Overview
$67,370
PER CAPITA INCOME
$227,227
AVG HOUSEHOLD INCOME
0.06
INEQUALITY / GINI INDEX
208
TOTAL POPULATION
123
MALE POPULATION
85
FEMALE POPULATION
144.71
MALES / 100 FEMALES
69.11
FEMALES / 100 MALES
16.4
MEDIAN AGE
3.9
AVG FAMILY SIZE
3.6
AVG HOUSEHOLD SIZE
97
LABOR FORCE [ PEOPLE ]
89.0%
PERCENT IN LABOR FORCE
Income in St George Island
Income Overview in St George Island
| Characteristic | Number | Measure |
| Per Capita Income | 208 | $67,370 |
| Median Family Income | 41 | $0 |
| Mean Family Income | 41 | $0 |
| Median Household Income | 57 | $227,227 |
| Mean Household Income | 57 | $247,981 |
| Income Deficit | 41 | $0 |
| Wage / Income Gap (%) | 208 | 0.00% |
| Wage / Income Gap ($) | 208 | 100.00¢ per $1 |
| Gini / Inequality Index | 208 | 0.06 |
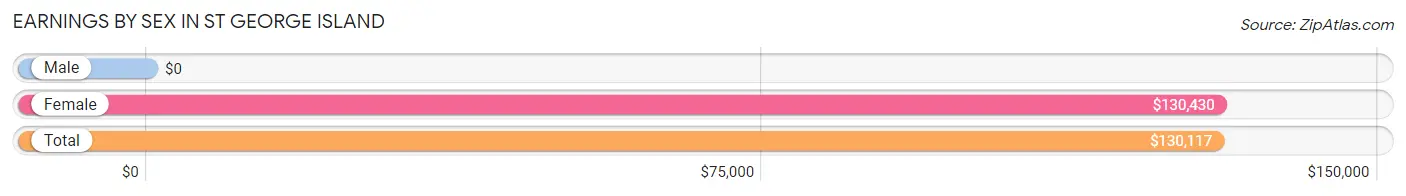
Earnings by Sex in St George Island
| Sex | Number | Average Earnings |
| Male | 56 (51.4%) | $0 |
| Female | 53 (48.6%) | $130,430 |
| Total | 109 (100.0%) | $130,117 |
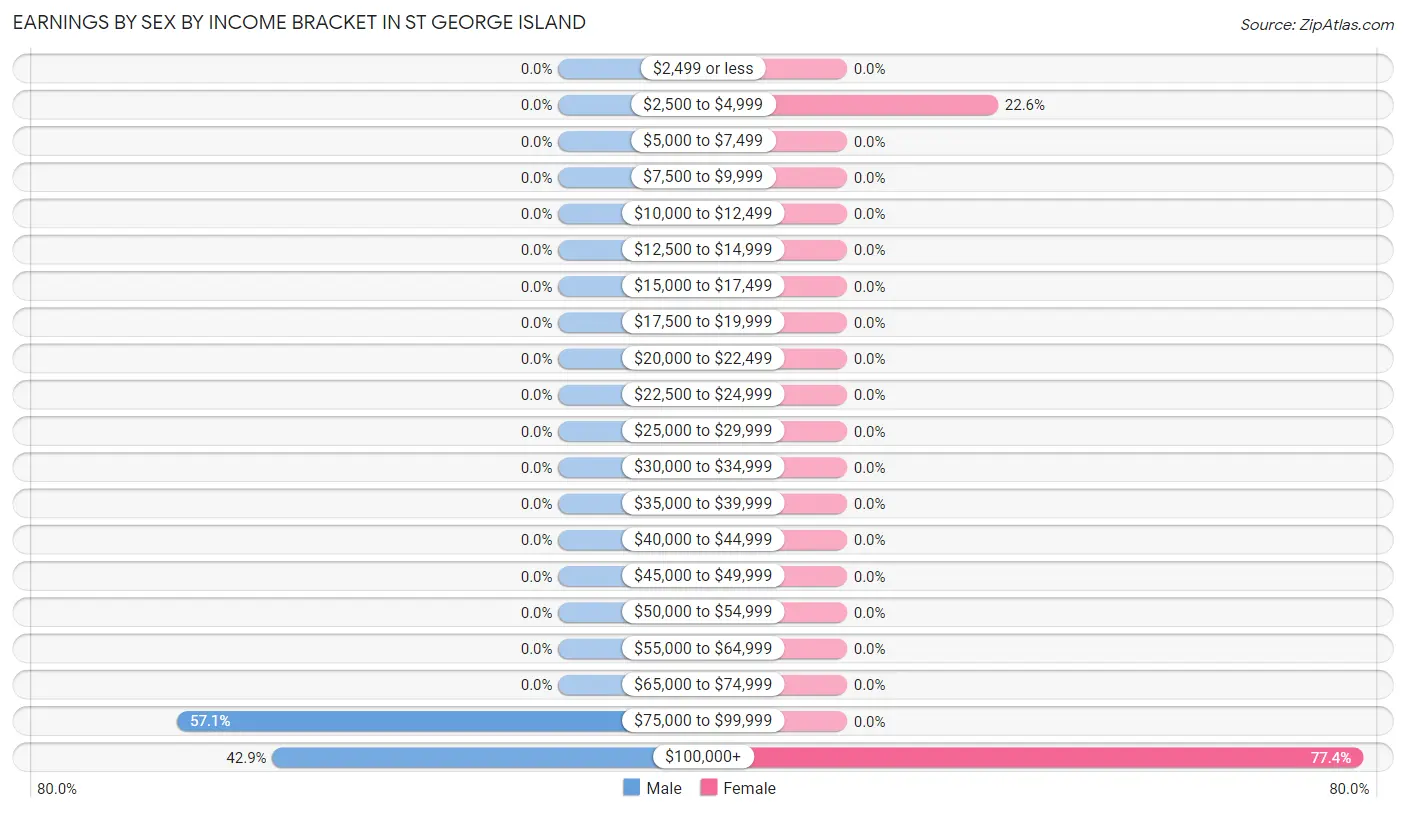
Earnings by Sex by Income Bracket in St George Island
The most common earnings brackets in St George Island are $75,000 to $99,999 for men (32 | 57.1%) and $100,000+ for women (41 | 77.4%).
| Income | Male | Female |
| $2,499 or less | 0 (0.0%) | 0 (0.0%) |
| $2,500 to $4,999 | 0 (0.0%) | 12 (22.6%) |
| $5,000 to $7,499 | 0 (0.0%) | 0 (0.0%) |
| $7,500 to $9,999 | 0 (0.0%) | 0 (0.0%) |
| $10,000 to $12,499 | 0 (0.0%) | 0 (0.0%) |
| $12,500 to $14,999 | 0 (0.0%) | 0 (0.0%) |
| $15,000 to $17,499 | 0 (0.0%) | 0 (0.0%) |
| $17,500 to $19,999 | 0 (0.0%) | 0 (0.0%) |
| $20,000 to $22,499 | 0 (0.0%) | 0 (0.0%) |
| $22,500 to $24,999 | 0 (0.0%) | 0 (0.0%) |
| $25,000 to $29,999 | 0 (0.0%) | 0 (0.0%) |
| $30,000 to $34,999 | 0 (0.0%) | 0 (0.0%) |
| $35,000 to $39,999 | 0 (0.0%) | 0 (0.0%) |
| $40,000 to $44,999 | 0 (0.0%) | 0 (0.0%) |
| $45,000 to $49,999 | 0 (0.0%) | 0 (0.0%) |
| $50,000 to $54,999 | 0 (0.0%) | 0 (0.0%) |
| $55,000 to $64,999 | 0 (0.0%) | 0 (0.0%) |
| $65,000 to $74,999 | 0 (0.0%) | 0 (0.0%) |
| $75,000 to $99,999 | 32 (57.1%) | 0 (0.0%) |
| $100,000+ | 24 (42.9%) | 41 (77.4%) |
| Total | 56 (100.0%) | 53 (100.0%) |
Earnings by Sex by Educational Attainment in St George Island
| Educational Attainment | Male Income | Female Income |
| Less than High School | - | - |
| High School Diploma | - | - |
| College or Associate's Degree | - | - |
| Bachelor's Degree | - | - |
| Graduate Degree | - | - |
| Total | - | - |
Family Income in St George Island
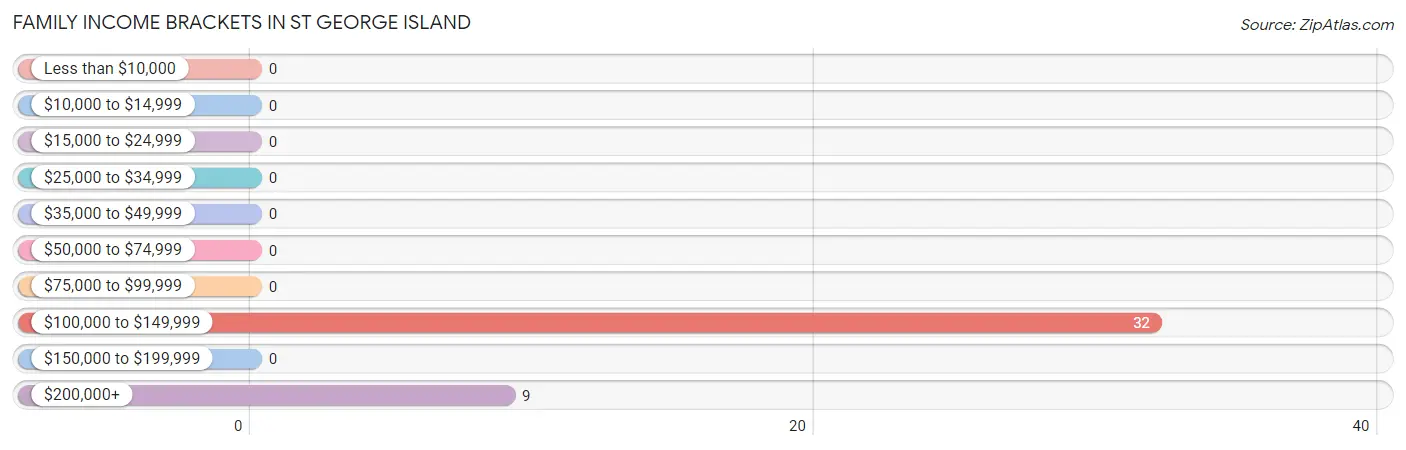
Family Income Brackets in St George Island
According to the St George Island family income data, there are 32 families falling into the $100,000 to $149,999 income range, which is the most common income bracket and makes up 78.0% of all families.
| Income Bracket | # Families | % Families |
| Less than $10,000 | 0 | 0.0% |
| $10,000 to $14,999 | 0 | 0.0% |
| $15,000 to $24,999 | 0 | 0.0% |
| $25,000 to $34,999 | 0 | 0.0% |
| $35,000 to $49,999 | 0 | 0.0% |
| $50,000 to $74,999 | 0 | 0.0% |
| $75,000 to $99,999 | 0 | 0.0% |
| $100,000 to $149,999 | 32 | 78.0% |
| $150,000 to $199,999 | 0 | 0.0% |
| $200,000+ | 9 | 22.0% |
Family Income by Famaliy Size in St George Island
| Income Bracket | # Families | Median Income |
| 2-Person Families | 0 (0.0%) | $0 |
| 3-Person Families | 0 (0.0%) | $0 |
| 4-Person Families | 41 (100.0%) | $0 |
| 5-Person Families | 0 (0.0%) | $0 |
| 6-Person Families | 0 (0.0%) | $0 |
| 7+ Person Families | 0 (0.0%) | $0 |
| Total | 41 (100.0%) | $0 |
Family Income by Number of Earners in St George Island
| Number of Earners | # Families | Median Income |
| No Earners | 0 (0.0%) | $0 |
| 1 Earner | 32 (78.0%) | $0 |
| 2 Earners | 0 (0.0%) | $0 |
| 3+ Earners | 9 (22.0%) | $0 |
| Total | 41 (100.0%) | $0 |
Household Income in St George Island
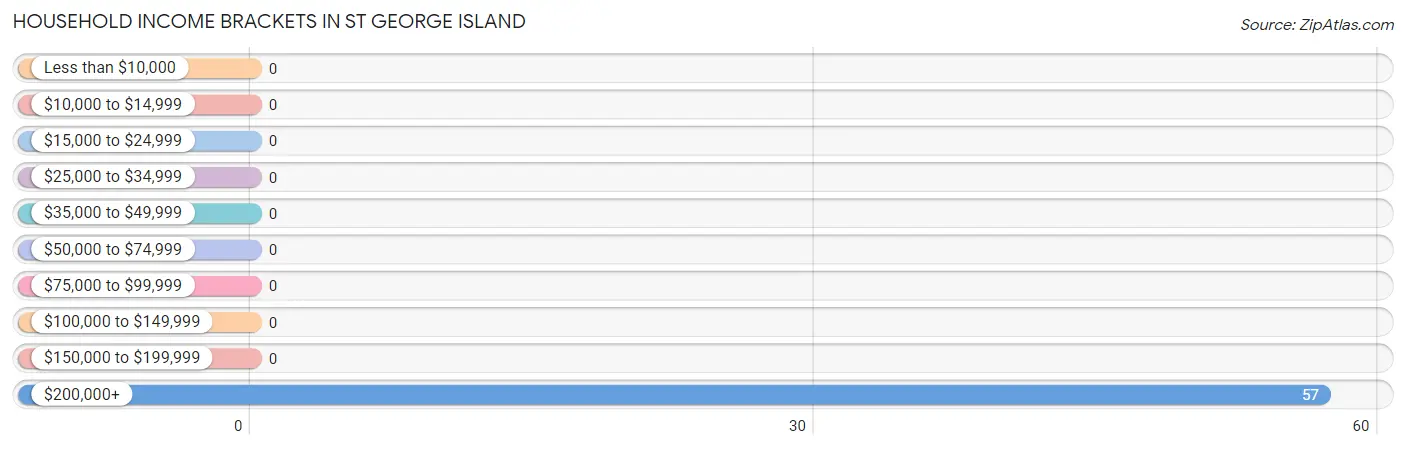
Household Income Brackets in St George Island
With 57 households falling in the category, the $200,000+ income range is the most frequent in St George Island, accounting for 100.0% of all households.
| Income Bracket | # Households | % Households |
| Less than $10,000 | 0 | 0.0% |
| $10,000 to $14,999 | 0 | 0.0% |
| $15,000 to $24,999 | 0 | 0.0% |
| $25,000 to $34,999 | 0 | 0.0% |
| $35,000 to $49,999 | 0 | 0.0% |
| $50,000 to $74,999 | 0 | 0.0% |
| $75,000 to $99,999 | 0 | 0.0% |
| $100,000 to $149,999 | 0 | 0.0% |
| $150,000 to $199,999 | 0 | 0.0% |
| $200,000+ | 57 | 100.0% |
Household Income by Householder Age in St George Island
| Income Bracket | # Households | Median Income |
| 15 to 24 Years | 0 (0.0%) | $0 |
| 25 to 44 Years | 41 (71.9%) | $0 |
| 45 to 64 Years | 16 (28.1%) | $0 |
| 65+ Years | 0 (0.0%) | $0 |
| Total | 57 (100.0%) | $227,227 |
Poverty in St George Island
Income Below Poverty by Sex and Age in St George Island
| Age Bracket | Male | Female |
| Under 5 Years | 0 (0.0%) | 0 (0.0%) |
| 5 Years | 0 (0.0%) | 0 (0.0%) |
| 6 to 11 Years | 0 (0.0%) | 0 (0.0%) |
| 12 to 14 Years | 0 (0.0%) | 0 (0.0%) |
| 15 Years | 0 (0.0%) | 0 (0.0%) |
| 16 and 17 Years | 0 (0.0%) | 0 (0.0%) |
| 18 to 24 Years | 0 (0.0%) | 0 (0.0%) |
| 25 to 34 Years | 0 (0.0%) | 0 (0.0%) |
| 35 to 44 Years | 0 (0.0%) | 0 (0.0%) |
| 45 to 54 Years | 0 (0.0%) | 0 (0.0%) |
| 55 to 64 Years | 0 (0.0%) | 0 (0.0%) |
| 65 to 74 Years | 0 (0.0%) | 0 (0.0%) |
| 75 Years and over | 0 (0.0%) | 0 (0.0%) |
| Total | 0 (0.0%) | 0 (0.0%) |
Income Above Poverty by Sex and Age in St George Island
According to the poverty statistics in St George Island, males aged 6 to 11 years and females aged under 5 years are the age groups that are most secure financially, with 100.0% of males and 100.0% of females in these age groups living above the poverty line.
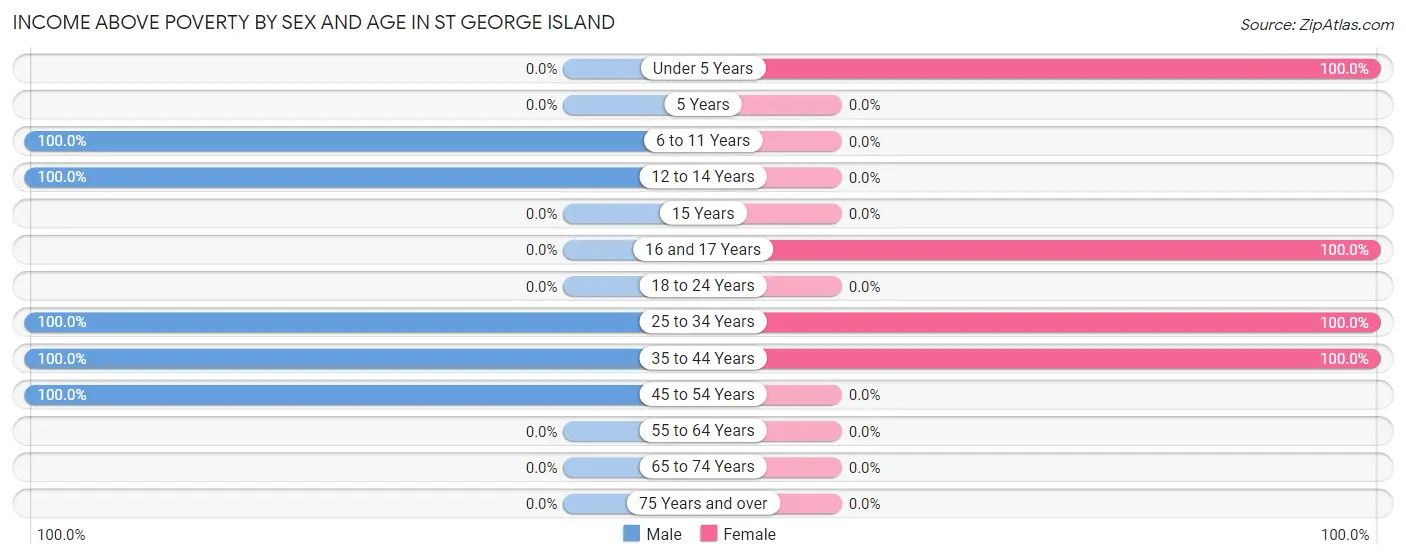
| Age Bracket | Male | Female |
| Under 5 Years | 0 (0.0%) | 32 (100.0%) |
| 5 Years | 0 (0.0%) | 0 (0.0%) |
| 6 to 11 Years | 38 (100.0%) | 0 (0.0%) |
| 12 to 14 Years | 29 (100.0%) | 0 (0.0%) |
| 15 Years | 0 (0.0%) | 0 (0.0%) |
| 16 and 17 Years | 0 (0.0%) | 12 (100.0%) |
| 18 to 24 Years | 0 (0.0%) | 0 (0.0%) |
| 25 to 34 Years | 8 (100.0%) | 9 (100.0%) |
| 35 to 44 Years | 32 (100.0%) | 32 (100.0%) |
| 45 to 54 Years | 16 (100.0%) | 0 (0.0%) |
| 55 to 64 Years | 0 (0.0%) | 0 (0.0%) |
| 65 to 74 Years | 0 (0.0%) | 0 (0.0%) |
| 75 Years and over | 0 (0.0%) | 0 (0.0%) |
| Total | 123 (100.0%) | 85 (100.0%) |
Income Below Poverty Among Married-Couple Families in St George Island
| Children | Above Poverty | Below Poverty |
| No Children | 0 (0.0%) | 0 (0.0%) |
| 1 or 2 Children | 9 (100.0%) | 0 (0.0%) |
| 3 or 4 Children | 0 (0.0%) | 0 (0.0%) |
| 5 or more Children | 0 (0.0%) | 0 (0.0%) |
| Total | 9 (100.0%) | 0 (0.0%) |
Income Below Poverty Among Single-Parent Households in St George Island
| Children | Single Father | Single Mother |
| No Children | 0 (0.0%) | 0 (0.0%) |
| 1 or 2 Children | 0 (0.0%) | 0 (0.0%) |
| 3 or 4 Children | 0 (0.0%) | 0 (0.0%) |
| 5 or more Children | 0 (0.0%) | 0 (0.0%) |
| Total | 0 (0.0%) | 0 (0.0%) |
Income Below Poverty Among Married-Couple vs Single-Parent Households in St George Island
| Children | Married-Couple Families | Single-Parent Households |
| No Children | 0 (0.0%) | 0 (0.0%) |
| 1 or 2 Children | 0 (0.0%) | 0 (0.0%) |
| 3 or 4 Children | 0 (0.0%) | 0 (0.0%) |
| 5 or more Children | 0 (0.0%) | 0 (0.0%) |
| Total | 0 (0.0%) | 0 (0.0%) |
Race in St George Island
The most populous races in St George Island are , and White / Caucasian (208 | 100.0%).
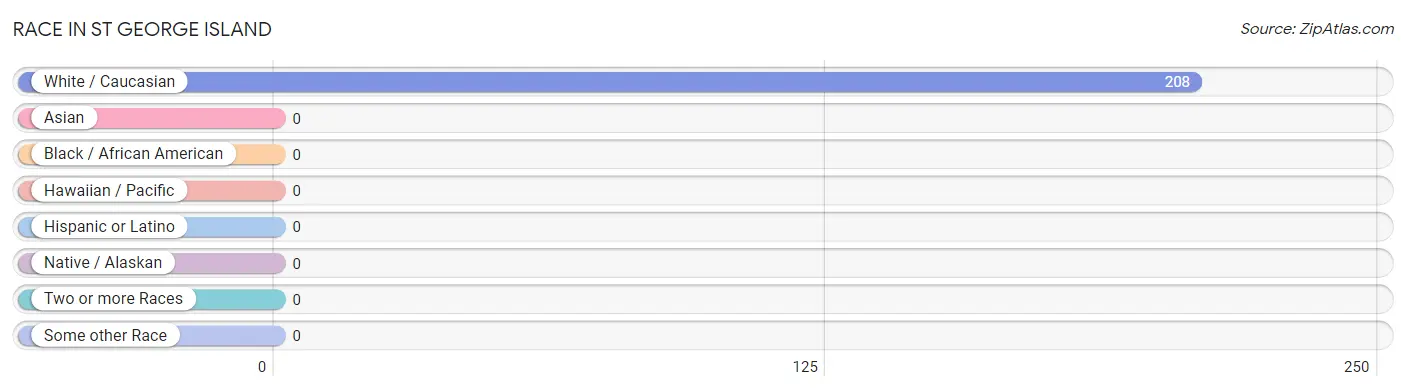
| Race | # Population | % Population |
| Asian | 0 | 0.0% |
| Black / African American | 0 | 0.0% |
| Hawaiian / Pacific | 0 | 0.0% |
| Hispanic or Latino | 0 | 0.0% |
| Native / Alaskan | 0 | 0.0% |
| White / Caucasian | 208 | 100.0% |
| Two or more Races | 0 | 0.0% |
| Some other Race | 0 | 0.0% |
| Total | 208 | 100.0% |
Ancestry in St George Island
The most populous ancestries reported in St George Island are Danish (121 | 58.2%), Irish (91 | 43.8%), German (77 | 37.0%), Welsh (31 | 14.9%), and Norwegian (8 | 3.8%), together accounting for 157.7% of all St George Island residents.
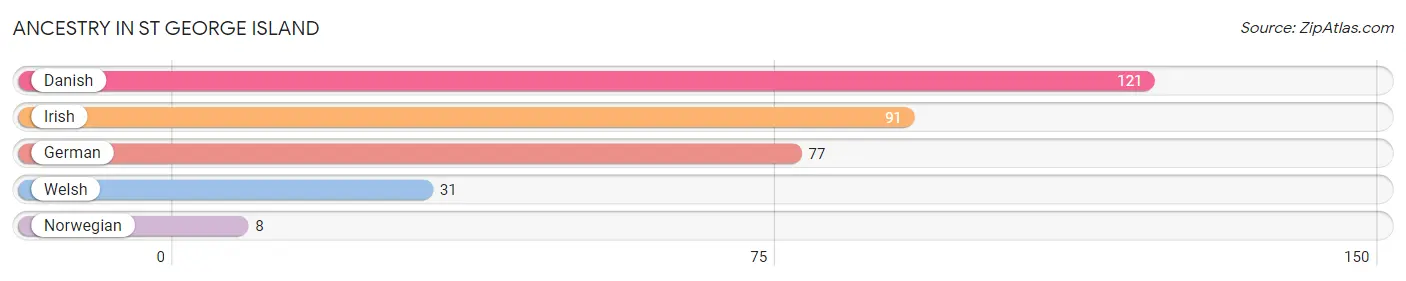
| Ancestry | # Population | % Population |
| Danish | 121 | 58.2% |
| German | 77 | 37.0% |
| Irish | 91 | 43.8% |
| Norwegian | 8 | 3.8% |
| Welsh | 31 | 14.9% | View All 5 Rows |
Immigrants in St George Island

| Immigration Origin | # Population | % Population | View All 0 Rows |
Sex and Age in St George Island
Sex and Age in St George Island
The most populous age groups in St George Island are 10 to 14 Years (39 | 31.7%) for men and Under 5 Years (32 | 37.7%) for women.
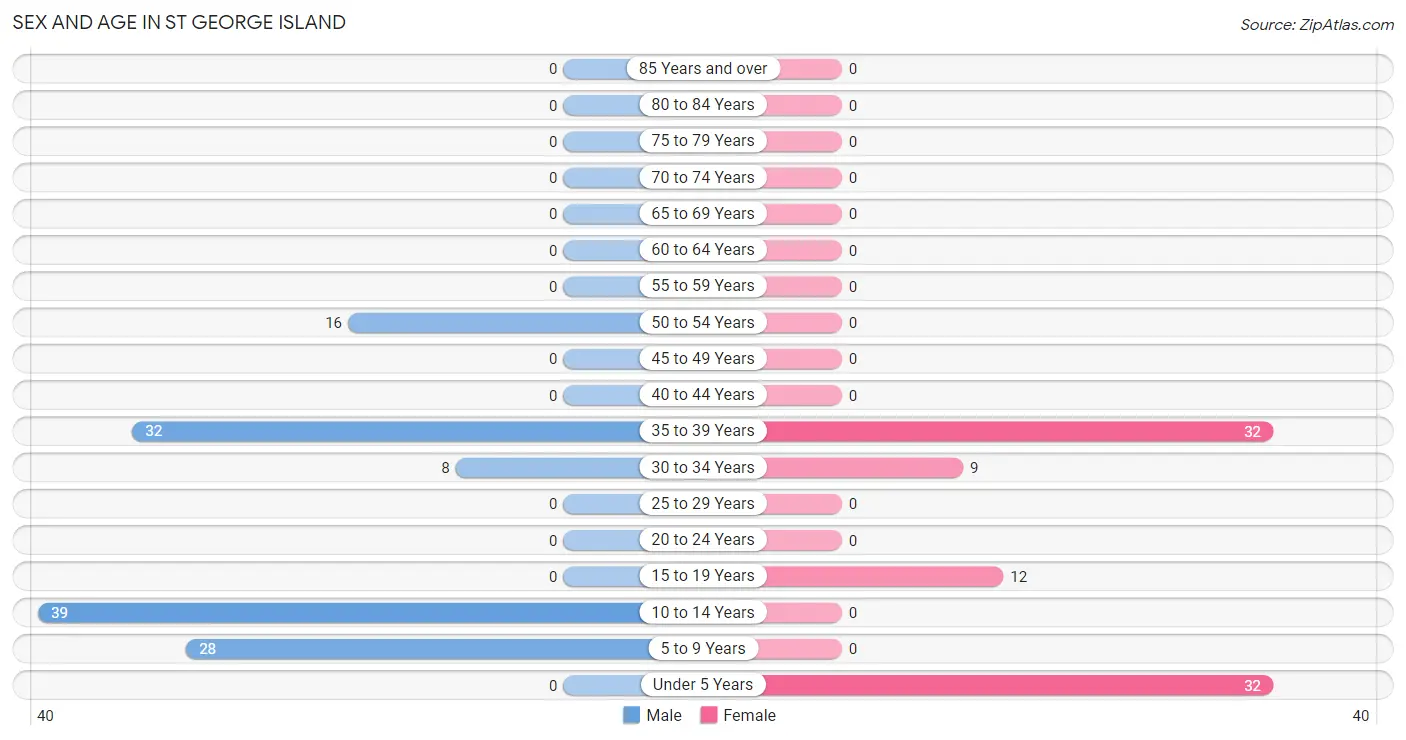
| Age Bracket | Male | Female |
| Under 5 Years | 0 (0.0%) | 32 (37.7%) |
| 5 to 9 Years | 28 (22.8%) | 0 (0.0%) |
| 10 to 14 Years | 39 (31.7%) | 0 (0.0%) |
| 15 to 19 Years | 0 (0.0%) | 12 (14.1%) |
| 20 to 24 Years | 0 (0.0%) | 0 (0.0%) |
| 25 to 29 Years | 0 (0.0%) | 0 (0.0%) |
| 30 to 34 Years | 8 (6.5%) | 9 (10.6%) |
| 35 to 39 Years | 32 (26.0%) | 32 (37.7%) |
| 40 to 44 Years | 0 (0.0%) | 0 (0.0%) |
| 45 to 49 Years | 0 (0.0%) | 0 (0.0%) |
| 50 to 54 Years | 16 (13.0%) | 0 (0.0%) |
| 55 to 59 Years | 0 (0.0%) | 0 (0.0%) |
| 60 to 64 Years | 0 (0.0%) | 0 (0.0%) |
| 65 to 69 Years | 0 (0.0%) | 0 (0.0%) |
| 70 to 74 Years | 0 (0.0%) | 0 (0.0%) |
| 75 to 79 Years | 0 (0.0%) | 0 (0.0%) |
| 80 to 84 Years | 0 (0.0%) | 0 (0.0%) |
| 85 Years and over | 0 (0.0%) | 0 (0.0%) |
| Total | 123 (100.0%) | 85 (100.0%) |
Families and Households in St George Island
Median Family Size in St George Island
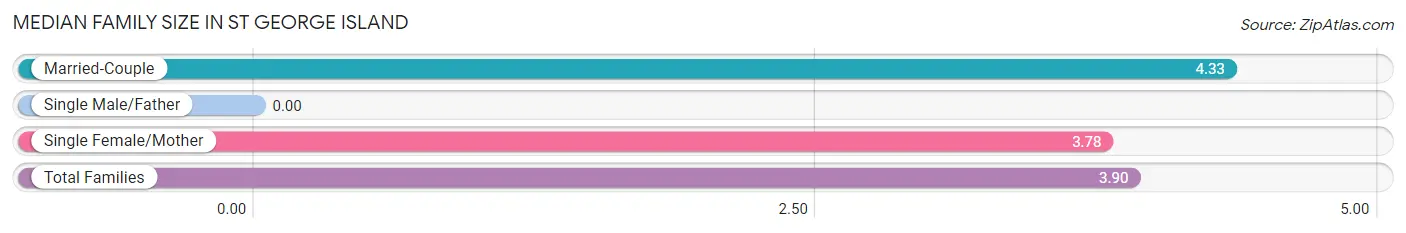
| Family Type | # Families | Family Size |
| Married-Couple | 9 (22.0%) | 4.33 |
| Single Male/Father | 0 (0.0%) | - |
| Single Female/Mother | 32 (78.0%) | 3.78 |
| Total Families | 41 (100.0%) | 3.90 |
Median Household Size in St George Island
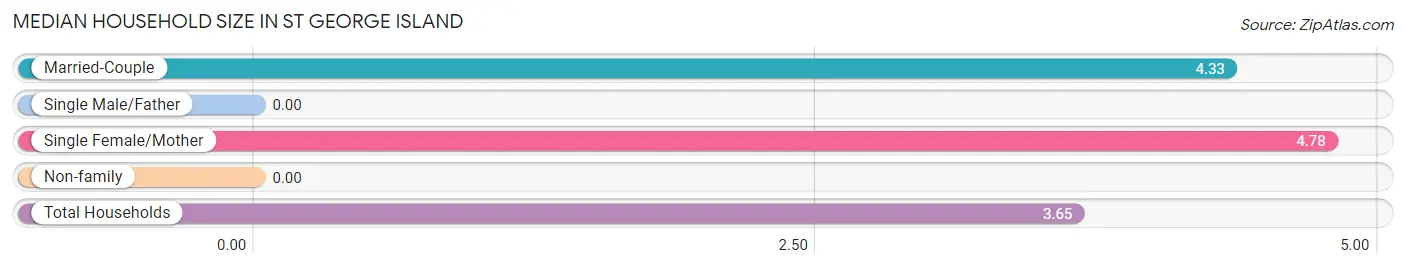
| Household Type | # Households | Household Size |
| Married-Couple | 9 (15.8%) | 4.33 |
| Single Male/Father | 0 (0.0%) | - |
| Single Female/Mother | 32 (56.1%) | 4.78 |
| Non-family | 16 (28.1%) | - |
| Total Households | 57 (100.0%) | 3.65 |
Household Size by Marriage Status in St George Island
Out of a total of 57 households in St George Island, 41 (71.9%) are family households, while 16 (28.1%) are nonfamily households. The most numerous type of family households are 5-person households, comprising 32, and the most common type of nonfamily households are 1-person households, comprising 16.
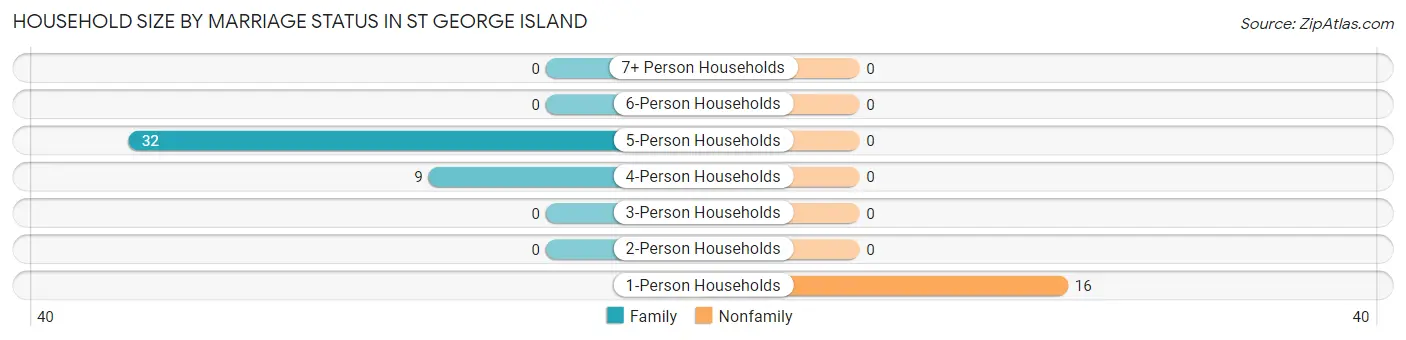
| Household Size | Family Households | Nonfamily Households |
| 1-Person Households | - | 16 (28.1%) |
| 2-Person Households | 0 (0.0%) | 0 (0.0%) |
| 3-Person Households | 0 (0.0%) | 0 (0.0%) |
| 4-Person Households | 9 (15.8%) | 0 (0.0%) |
| 5-Person Households | 32 (56.1%) | 0 (0.0%) |
| 6-Person Households | 0 (0.0%) | 0 (0.0%) |
| 7+ Person Households | 0 (0.0%) | 0 (0.0%) |
| Total | 41 (71.9%) | 16 (28.1%) |
Female Fertility in St George Island
Fertility by Age in St George Island
| Age Bracket | Women with Births | Births / 1,000 Women |
| 15 to 19 years | 0 (0.0%) | 0.0 |
| 20 to 34 years | 0 (0.0%) | 0.0 |
| 35 to 50 years | 0 (0.0%) | 0.0 |
| Total | 0 (0.0%) | 0.0 |
Fertility by Age by Marriage Status in St George Island
| Age Bracket | Married | Unmarried |
| 15 to 19 years | 0 (0.0%) | 0 (0.0%) |
| 20 to 34 years | 0 (0.0%) | 0 (0.0%) |
| 35 to 50 years | 0 (0.0%) | 0 (0.0%) |
| Total | 0 (0.0%) | 0 (0.0%) |
Fertility by Education in St George Island
| Educational Attainment | Women with Births | Births / 1,000 Women |
| Less than High School | 0 (0.0%) | 0.0 |
| High School Diploma | 0 (0.0%) | 0.0 |
| College or Associate's Degree | 0 (0.0%) | 0.0 |
| Bachelor's Degree | 0 (0.0%) | 0.0 |
| Graduate Degree | 0 (0.0%) | 0.0 |
| Total | 0 (0.0%) | 0.0 |
Fertility by Education by Marriage Status in St George Island
| Educational Attainment | Married | Unmarried |
| Less than High School | 0 (0.0%) | 0 (0.0%) |
| High School Diploma | 0 (0.0%) | 0 (0.0%) |
| College or Associate's Degree | 0 (0.0%) | 0 (0.0%) |
| Bachelor's Degree | 0 (0.0%) | 0 (0.0%) |
| Graduate Degree | 0 (0.0%) | 0 (0.0%) |
| Total | 0 (0.0%) | 0 (0.0%) |
Employment Characteristics in St George Island
Employment by Class of Employer in St George Island
Among the 97 employed individuals in St George Island, private company employees (80 | 82.5%), and federal government employees (17 | 17.5%) make up the most common classes of employment.
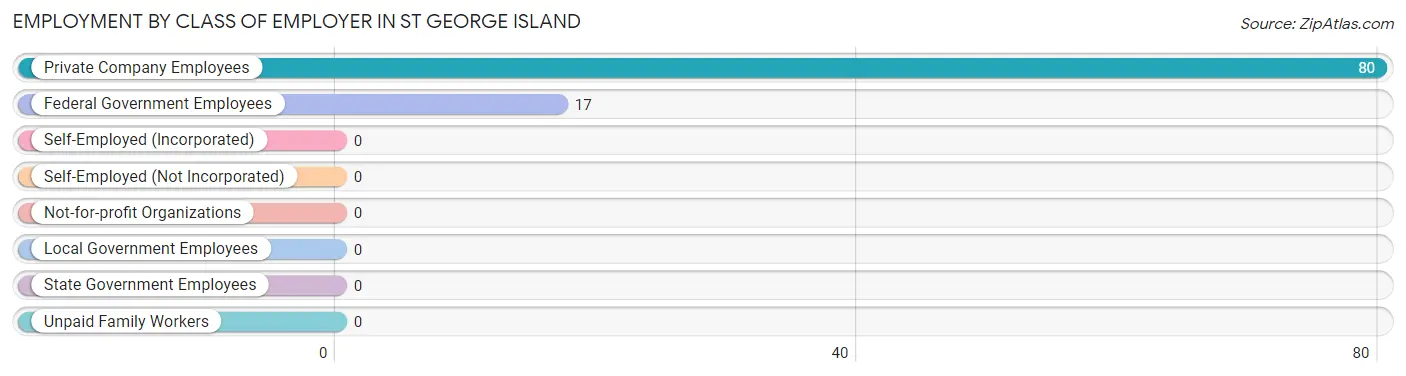
| Employer Class | # Employees | % Employees |
| Private Company Employees | 80 | 82.5% |
| Self-Employed (Incorporated) | 0 | 0.0% |
| Self-Employed (Not Incorporated) | 0 | 0.0% |
| Not-for-profit Organizations | 0 | 0.0% |
| Local Government Employees | 0 | 0.0% |
| State Government Employees | 0 | 0.0% |
| Federal Government Employees | 17 | 17.5% |
| Unpaid Family Workers | 0 | 0.0% |
| Total | 97 | 100.0% |
Employment Status by Age in St George Island
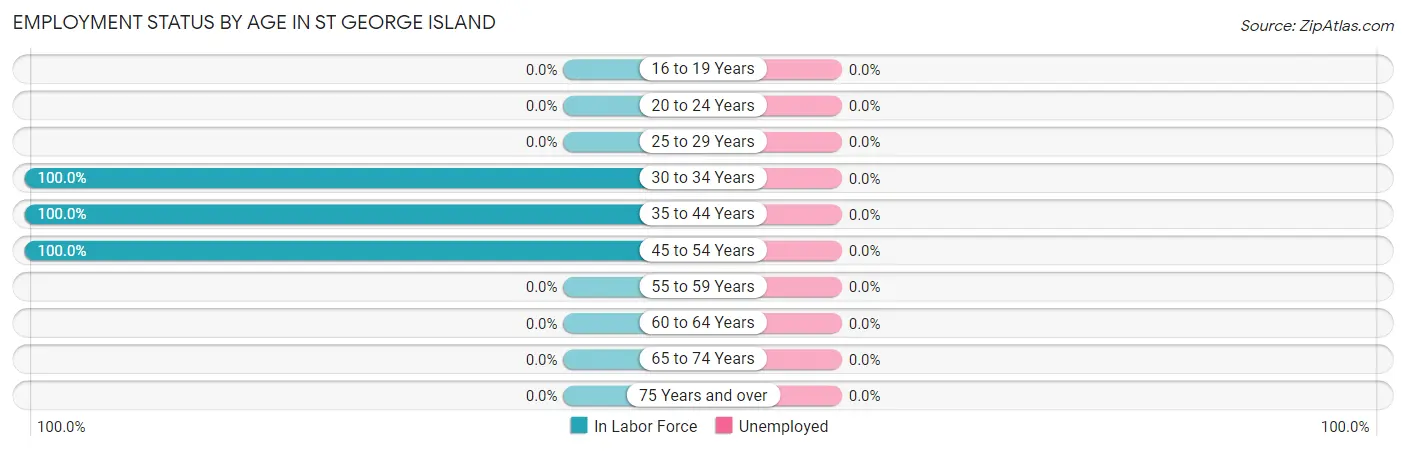
| Age Bracket | In Labor Force | Unemployed |
| 16 to 19 Years | 0 (0.0%) | 0 (0.0%) |
| 20 to 24 Years | 0 (0.0%) | 0 (0.0%) |
| 25 to 29 Years | 0 (0.0%) | 0 (0.0%) |
| 30 to 34 Years | 17 (100.0%) | 0 (0.0%) |
| 35 to 44 Years | 64 (100.0%) | 0 (0.0%) |
| 45 to 54 Years | 16 (100.0%) | 0 (0.0%) |
| 55 to 59 Years | 0 (0.0%) | 0 (0.0%) |
| 60 to 64 Years | 0 (0.0%) | 0 (0.0%) |
| 65 to 74 Years | 0 (0.0%) | 0 (0.0%) |
| 75 Years and over | 0 (0.0%) | 0 (0.0%) |
| Total | 97 (89.0%) | 0 (0.0%) |
Employment Status by Educational Attainment in St George Island
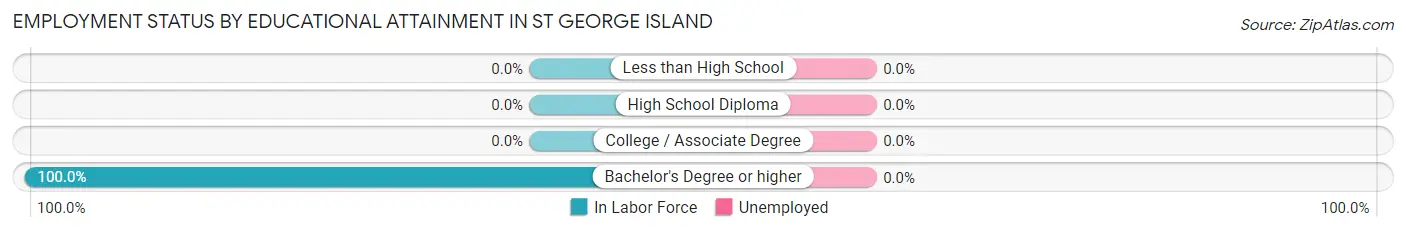
| Educational Attainment | In Labor Force | Unemployed |
| Less than High School | 0 (0.0%) | 0 (0.0%) |
| High School Diploma | 0 (0.0%) | 0 (0.0%) |
| College / Associate Degree | 0 (0.0%) | 0 (0.0%) |
| Bachelor's Degree or higher | 97 (100.0%) | 0 (0.0%) |
| Total | 97 (100.0%) | 0 (0.0%) |
Employment Occupations by Sex in St George Island
Management, Business, Science and Arts Occupations
The most common Management, Business, Science and Arts occupations in St George Island are Management (32 | 33.0%), Business & Financial (24 | 24.7%), Computers, Engineering & Science (9 | 9.3%), and Computers & Mathematics (9 | 9.3%).
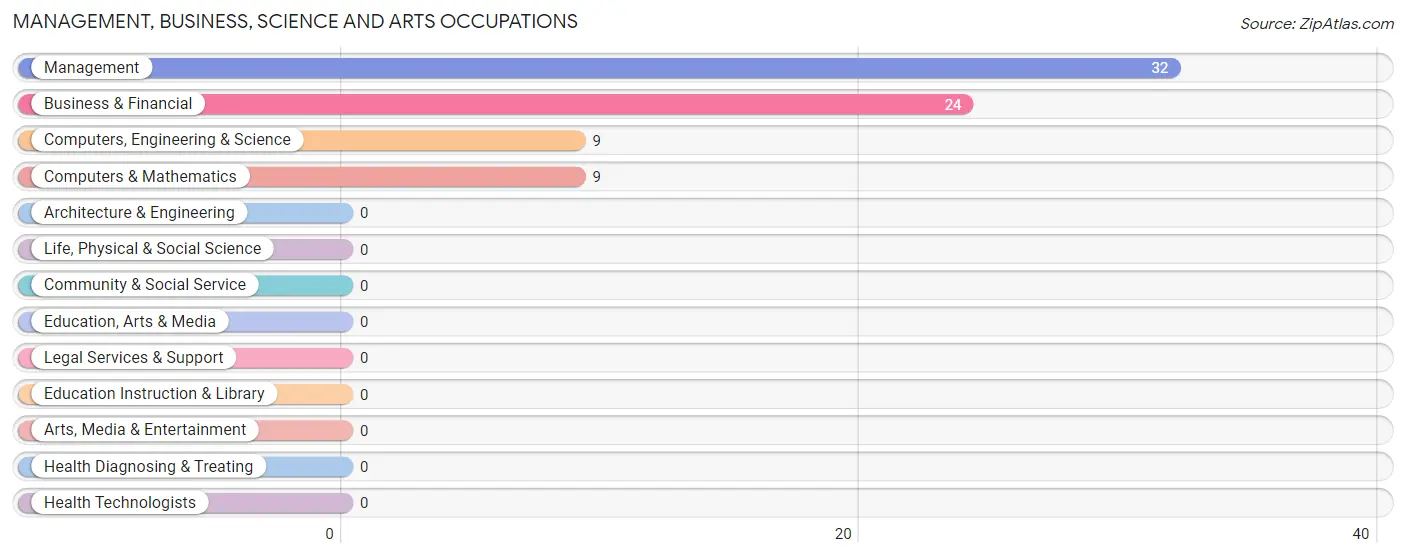
Management, Business, Science and Arts Occupations by Sex
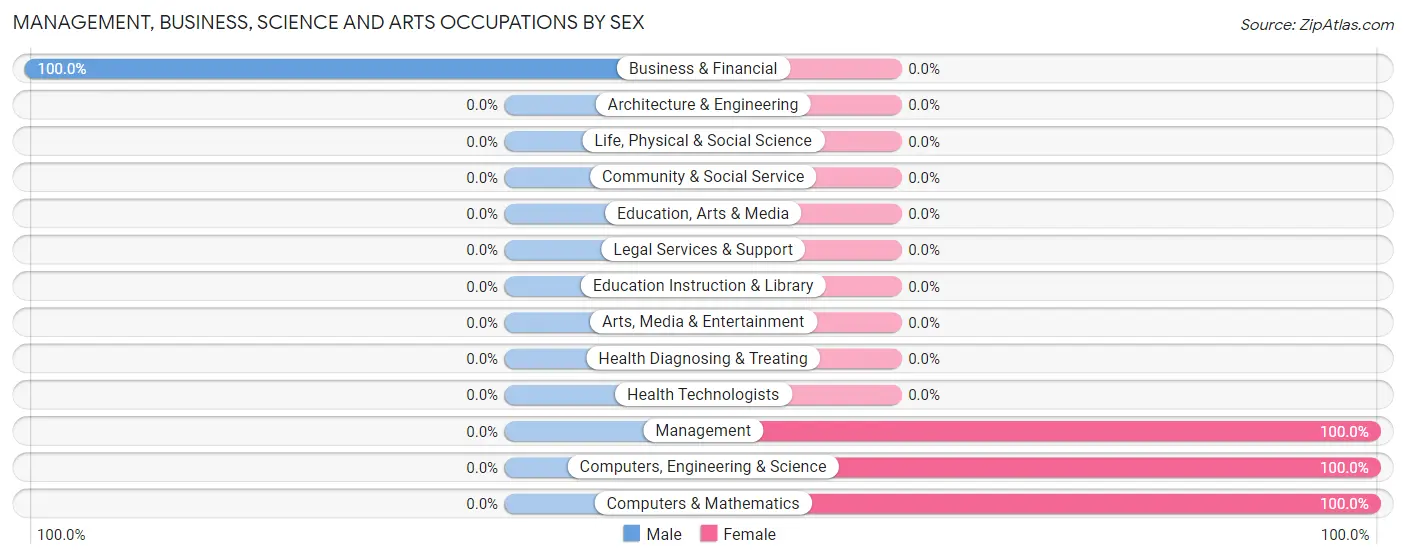
| Occupation | Male | Female |
| Management | 0 (0.0%) | 32 (100.0%) |
| Business & Financial | 24 (100.0%) | 0 (0.0%) |
| Computers, Engineering & Science | 0 (0.0%) | 9 (100.0%) |
| Computers & Mathematics | 0 (0.0%) | 9 (100.0%) |
| Architecture & Engineering | 0 (0.0%) | 0 (0.0%) |
| Life, Physical & Social Science | 0 (0.0%) | 0 (0.0%) |
| Community & Social Service | 0 (0.0%) | 0 (0.0%) |
| Education, Arts & Media | 0 (0.0%) | 0 (0.0%) |
| Legal Services & Support | 0 (0.0%) | 0 (0.0%) |
| Education Instruction & Library | 0 (0.0%) | 0 (0.0%) |
| Arts, Media & Entertainment | 0 (0.0%) | 0 (0.0%) |
| Health Diagnosing & Treating | 0 (0.0%) | 0 (0.0%) |
| Health Technologists | 0 (0.0%) | 0 (0.0%) |
| Total (Category) | 24 (36.9%) | 41 (63.1%) |
| Total (Overall) | 56 (57.7%) | 41 (42.3%) |
Services Occupations
Services Occupations by Sex
| Occupation | Male | Female |
| Healthcare Support | 0 (0.0%) | 0 (0.0%) |
| Security & Protection | 0 (0.0%) | 0 (0.0%) |
| Firefighting & Prevention | 0 (0.0%) | 0 (0.0%) |
| Law Enforcement | 0 (0.0%) | 0 (0.0%) |
| Food Preparation & Serving | 0 (0.0%) | 0 (0.0%) |
| Cleaning & Maintenance | 0 (0.0%) | 0 (0.0%) |
| Personal Care & Service | 0 (0.0%) | 0 (0.0%) |
| Total (Category) | 0 (0.0%) | 0 (0.0%) |
| Total (Overall) | 56 (57.7%) | 41 (42.3%) |
Sales and Office Occupations
The most common Sales and Office occupations in St George Island are , and Sales & Related (32 | 33.0%).
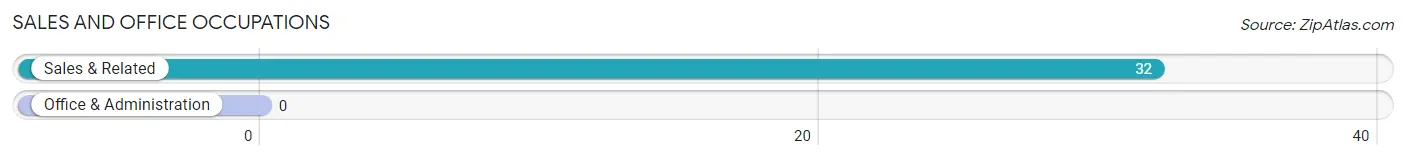
Sales and Office Occupations by Sex

| Occupation | Male | Female |
| Sales & Related | 32 (100.0%) | 0 (0.0%) |
| Office & Administration | 0 (0.0%) | 0 (0.0%) |
| Total (Category) | 32 (100.0%) | 0 (0.0%) |
| Total (Overall) | 56 (57.7%) | 41 (42.3%) |
Natural Resources, Construction and Maintenance Occupations
Natural Resources, Construction and Maintenance Occupations by Sex
| Occupation | Male | Female |
| Farming, Fishing & Forestry | 0 (0.0%) | 0 (0.0%) |
| Construction & Extraction | 0 (0.0%) | 0 (0.0%) |
| Installation, Maintenance & Repair | 0 (0.0%) | 0 (0.0%) |
| Total (Category) | 0 (0.0%) | 0 (0.0%) |
| Total (Overall) | 56 (57.7%) | 41 (42.3%) |
Production, Transportation and Moving Occupations
Production, Transportation and Moving Occupations by Sex
| Occupation | Male | Female |
| Production | 0 (0.0%) | 0 (0.0%) |
| Transportation | 0 (0.0%) | 0 (0.0%) |
| Material Moving | 0 (0.0%) | 0 (0.0%) |
| Total (Category) | 0 (0.0%) | 0 (0.0%) |
| Total (Overall) | 56 (57.7%) | 41 (42.3%) |
Employment Industries by Sex in St George Island
Employment Industries in St George Island
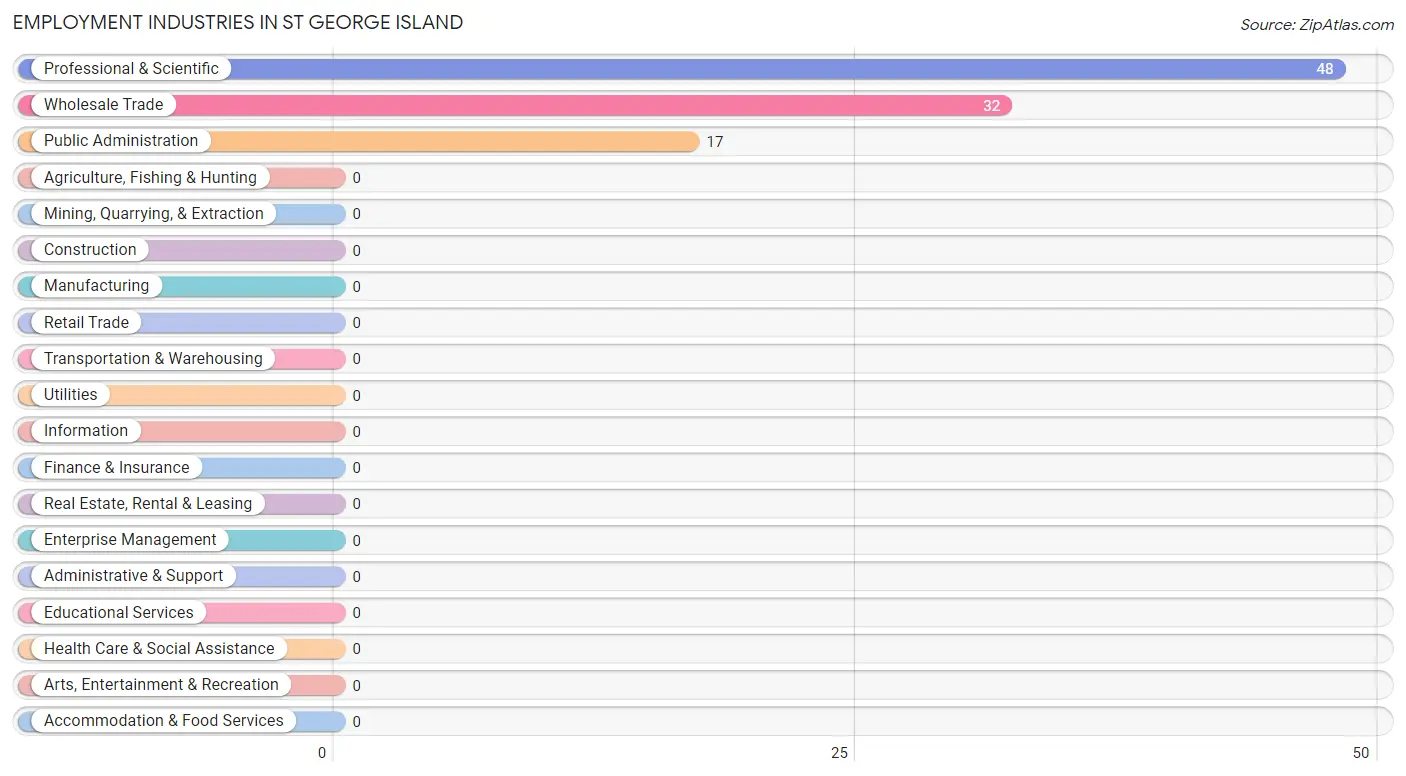
The major employment industries in St George Island include Professional & Scientific (48 | 49.5%), Wholesale Trade (32 | 33.0%), and Public Administration (17 | 17.5%).
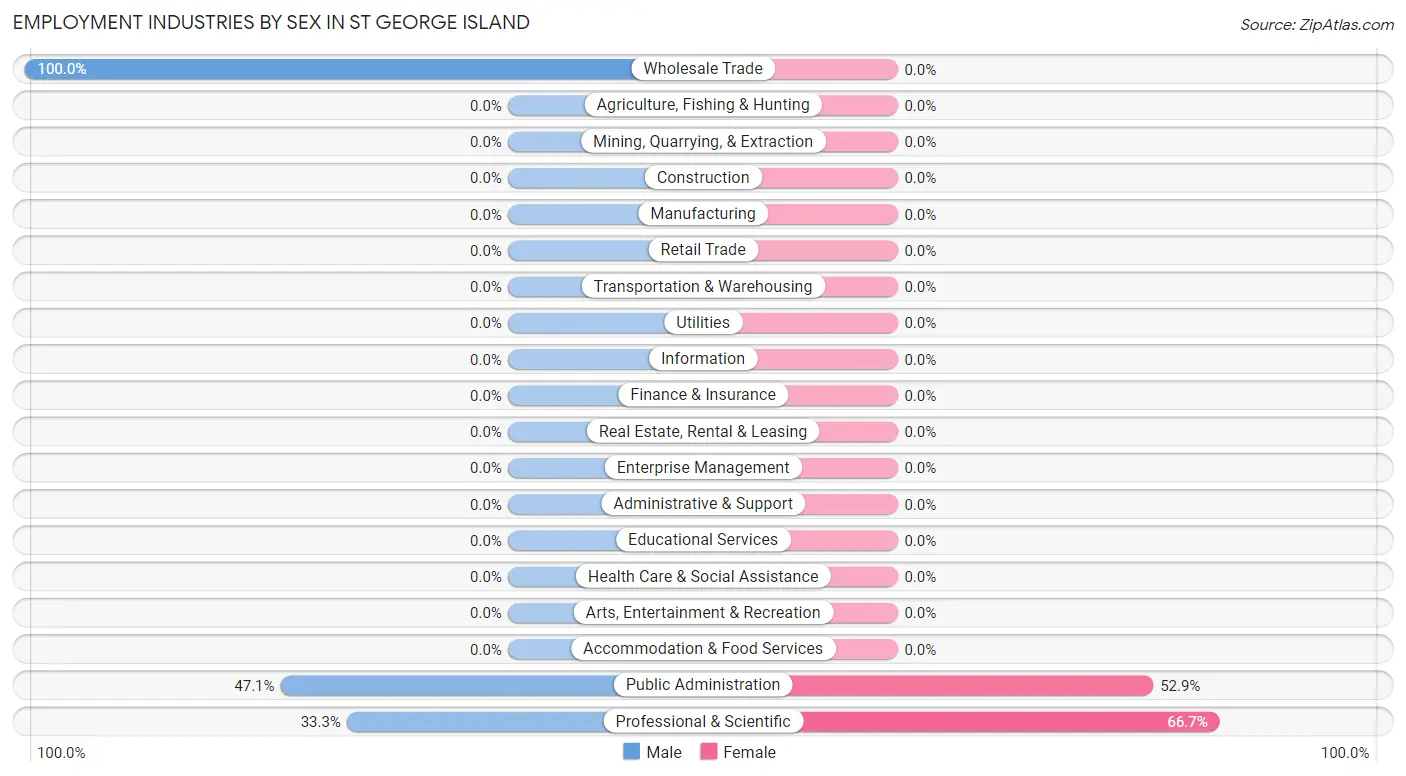
Employment Industries by Sex in St George Island
The St George Island industries that see more men than women are Wholesale Trade (100.0%), Public Administration (47.1%), and Professional & Scientific (33.3%), whereas the industries that tend to have a higher number of women are Professional & Scientific (66.7%), and Public Administration (52.9%).
| Industry | Male | Female |
| Agriculture, Fishing & Hunting | 0 (0.0%) | 0 (0.0%) |
| Mining, Quarrying, & Extraction | 0 (0.0%) | 0 (0.0%) |
| Construction | 0 (0.0%) | 0 (0.0%) |
| Manufacturing | 0 (0.0%) | 0 (0.0%) |
| Wholesale Trade | 32 (100.0%) | 0 (0.0%) |
| Retail Trade | 0 (0.0%) | 0 (0.0%) |
| Transportation & Warehousing | 0 (0.0%) | 0 (0.0%) |
| Utilities | 0 (0.0%) | 0 (0.0%) |
| Information | 0 (0.0%) | 0 (0.0%) |
| Finance & Insurance | 0 (0.0%) | 0 (0.0%) |
| Real Estate, Rental & Leasing | 0 (0.0%) | 0 (0.0%) |
| Professional & Scientific | 16 (33.3%) | 32 (66.7%) |
| Enterprise Management | 0 (0.0%) | 0 (0.0%) |
| Administrative & Support | 0 (0.0%) | 0 (0.0%) |
| Educational Services | 0 (0.0%) | 0 (0.0%) |
| Health Care & Social Assistance | 0 (0.0%) | 0 (0.0%) |
| Arts, Entertainment & Recreation | 0 (0.0%) | 0 (0.0%) |
| Accommodation & Food Services | 0 (0.0%) | 0 (0.0%) |
| Public Administration | 8 (47.1%) | 9 (52.9%) |
| Total | 56 (57.7%) | 41 (42.3%) |
Education in St George Island
School Enrollment in St George Island
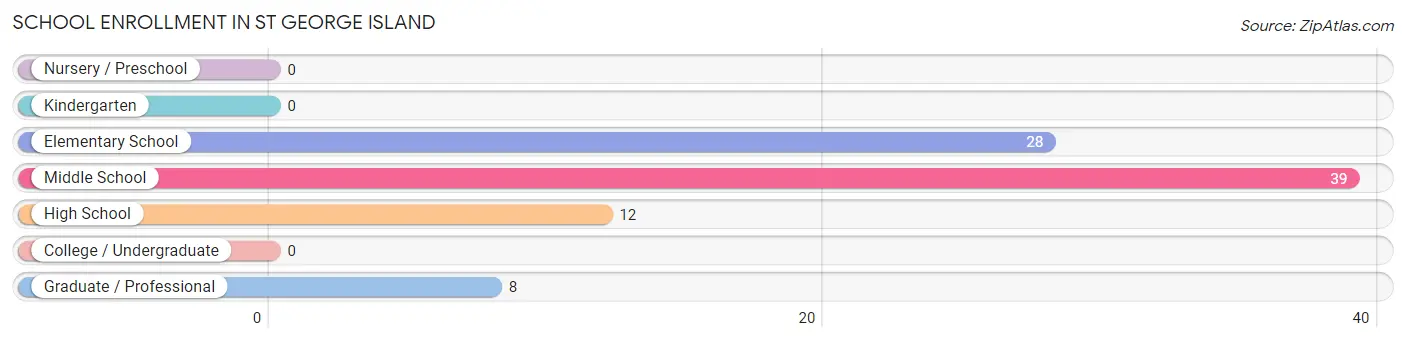
The most common levels of schooling among the 87 students in St George Island are middle school (39 | 44.8%), elementary school (28 | 32.2%), and high school (12 | 13.8%).
| School Level | # Students | % Students |
| Nursery / Preschool | 0 | 0.0% |
| Kindergarten | 0 | 0.0% |
| Elementary School | 28 | 32.2% |
| Middle School | 39 | 44.8% |
| High School | 12 | 13.8% |
| College / Undergraduate | 0 | 0.0% |
| Graduate / Professional | 8 | 9.2% |
| Total | 87 | 100.0% |
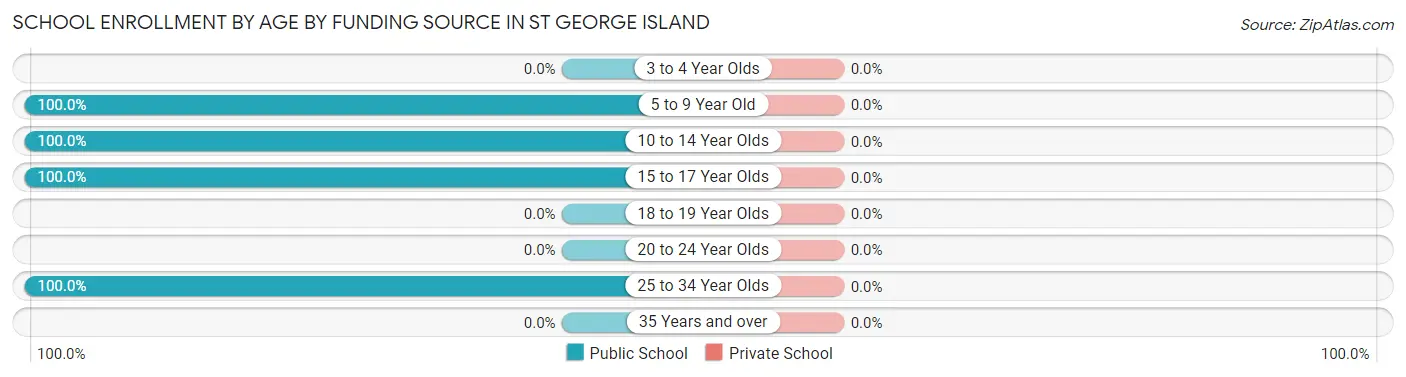
School Enrollment by Age by Funding Source in St George Island
| Age Bracket | Public School | Private School |
| 3 to 4 Year Olds | 0 (0.0%) | 0 (0.0%) |
| 5 to 9 Year Old | 28 (100.0%) | 0 (0.0%) |
| 10 to 14 Year Olds | 39 (100.0%) | 0 (0.0%) |
| 15 to 17 Year Olds | 12 (100.0%) | 0 (0.0%) |
| 18 to 19 Year Olds | 0 (0.0%) | 0 (0.0%) |
| 20 to 24 Year Olds | 0 (0.0%) | 0 (0.0%) |
| 25 to 34 Year Olds | 8 (100.0%) | 0 (0.0%) |
| 35 Years and over | 0 (0.0%) | 0 (0.0%) |
| Total | 87 (100.0%) | 0 (0.0%) |
Educational Attainment by Field of Study in St George Island
Bio, nature & agricultural (41 | 42.3%), education (32 | 33.0%), and engineering (24 | 24.7%) are the most common fields of study among 97 individuals in St George Island who have obtained a bachelor's degree or higher.
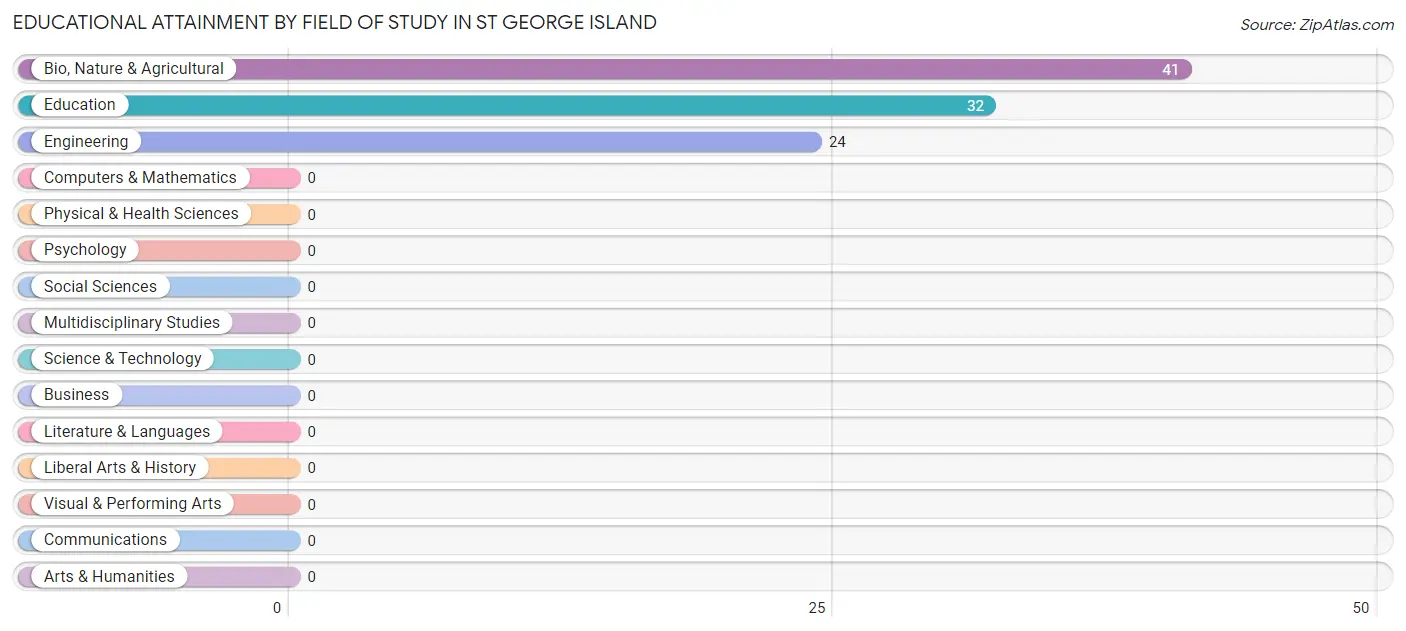
| Field of Study | # Graduates | % Graduates |
| Computers & Mathematics | 0 | 0.0% |
| Bio, Nature & Agricultural | 41 | 42.3% |
| Physical & Health Sciences | 0 | 0.0% |
| Psychology | 0 | 0.0% |
| Social Sciences | 0 | 0.0% |
| Engineering | 24 | 24.7% |
| Multidisciplinary Studies | 0 | 0.0% |
| Science & Technology | 0 | 0.0% |
| Business | 0 | 0.0% |
| Education | 32 | 33.0% |
| Literature & Languages | 0 | 0.0% |
| Liberal Arts & History | 0 | 0.0% |
| Visual & Performing Arts | 0 | 0.0% |
| Communications | 0 | 0.0% |
| Arts & Humanities | 0 | 0.0% |
| Total | 97 | 100.0% |
Transportation & Commute in St George Island
Vehicle Availability by Sex in St George Island
The most prevalent vehicle ownership categories in St George Island are males with 4 vehicles (32, accounting for 57.1%) and females with 4 vehicles (32, making up 78.0%).
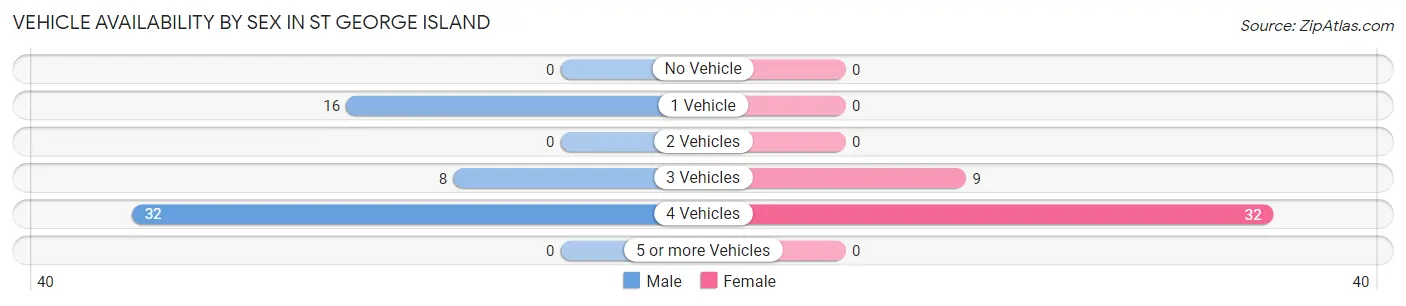
| Vehicles Available | Male | Female |
| No Vehicle | 0 (0.0%) | 0 (0.0%) |
| 1 Vehicle | 16 (28.6%) | 0 (0.0%) |
| 2 Vehicles | 0 (0.0%) | 0 (0.0%) |
| 3 Vehicles | 8 (14.3%) | 9 (22.0%) |
| 4 Vehicles | 32 (57.1%) | 32 (78.0%) |
| 5 or more Vehicles | 0 (0.0%) | 0 (0.0%) |
| Total | 56 (100.0%) | 41 (100.0%) |
Commute Time in St George Island
The most frequently occuring commute durations in St George Island are 30 to 34 minutes (49 commuters, 50.5%), 60 to 89 minutes (32 commuters, 33.0%), and 25 to 29 minutes (16 commuters, 16.5%).
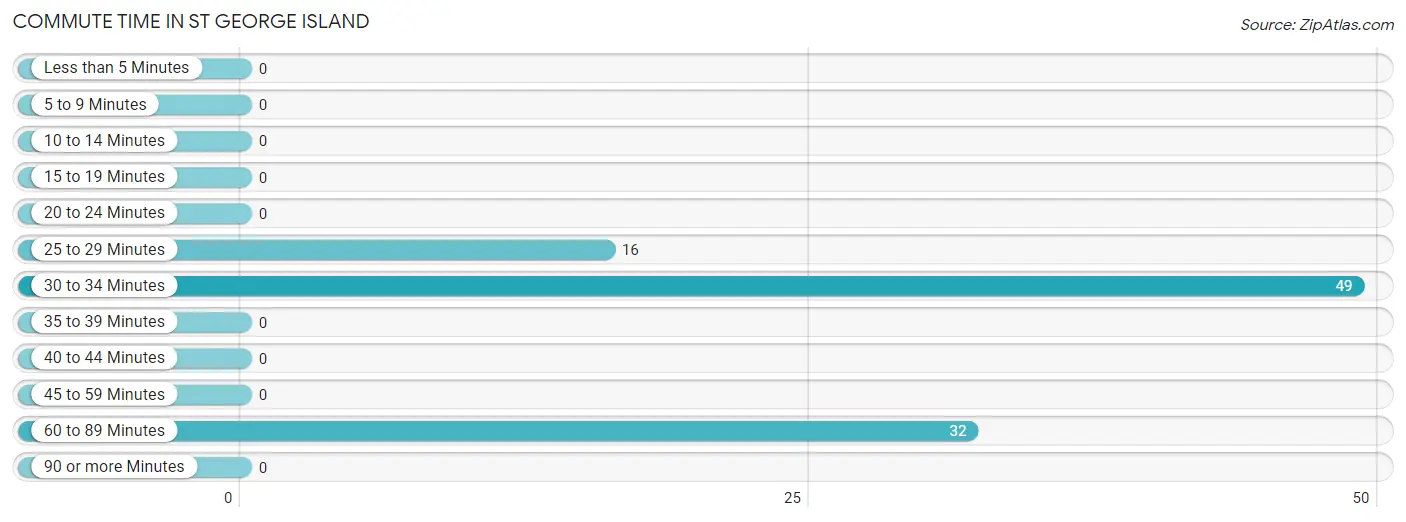
| Commute Time | # Commuters | % Commuters |
| Less than 5 Minutes | 0 | 0.0% |
| 5 to 9 Minutes | 0 | 0.0% |
| 10 to 14 Minutes | 0 | 0.0% |
| 15 to 19 Minutes | 0 | 0.0% |
| 20 to 24 Minutes | 0 | 0.0% |
| 25 to 29 Minutes | 16 | 16.5% |
| 30 to 34 Minutes | 49 | 50.5% |
| 35 to 39 Minutes | 0 | 0.0% |
| 40 to 44 Minutes | 0 | 0.0% |
| 45 to 59 Minutes | 0 | 0.0% |
| 60 to 89 Minutes | 32 | 33.0% |
| 90 or more Minutes | 0 | 0.0% |
Commute Time by Sex in St George Island
The most common commute times in St George Island are 60 to 89 minutes (32 commuters, 57.1%) for males and 30 to 34 minutes (41 commuters, 100.0%) for females.
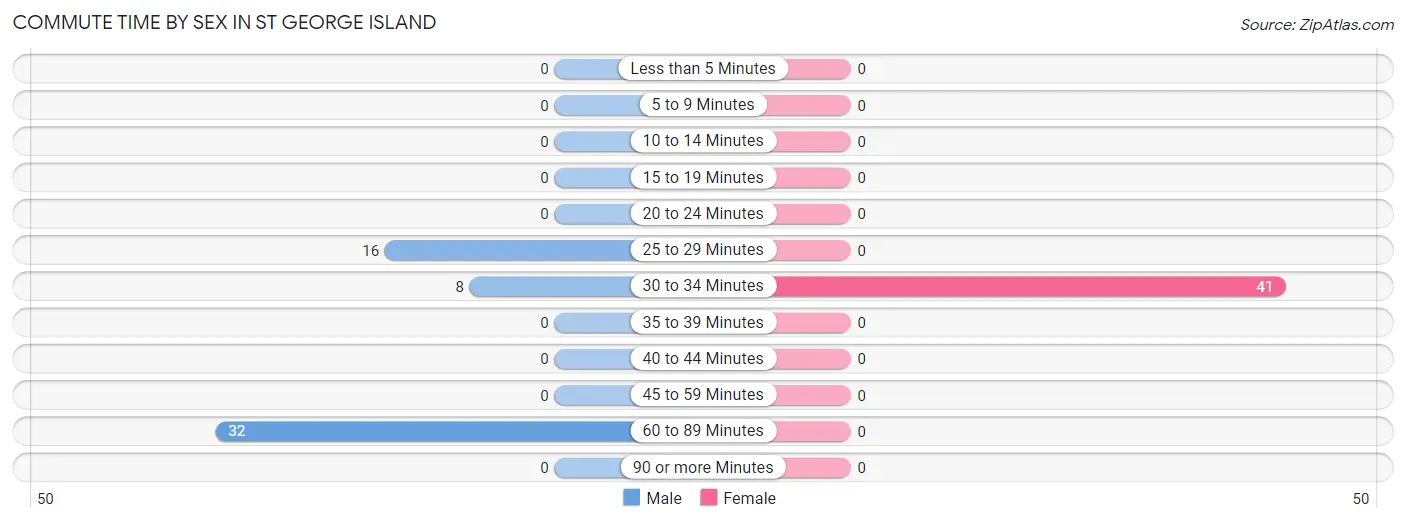
| Commute Time | Male | Female |
| Less than 5 Minutes | 0 (0.0%) | 0 (0.0%) |
| 5 to 9 Minutes | 0 (0.0%) | 0 (0.0%) |
| 10 to 14 Minutes | 0 (0.0%) | 0 (0.0%) |
| 15 to 19 Minutes | 0 (0.0%) | 0 (0.0%) |
| 20 to 24 Minutes | 0 (0.0%) | 0 (0.0%) |
| 25 to 29 Minutes | 16 (28.6%) | 0 (0.0%) |
| 30 to 34 Minutes | 8 (14.3%) | 41 (100.0%) |
| 35 to 39 Minutes | 0 (0.0%) | 0 (0.0%) |
| 40 to 44 Minutes | 0 (0.0%) | 0 (0.0%) |
| 45 to 59 Minutes | 0 (0.0%) | 0 (0.0%) |
| 60 to 89 Minutes | 32 (57.1%) | 0 (0.0%) |
| 90 or more Minutes | 0 (0.0%) | 0 (0.0%) |
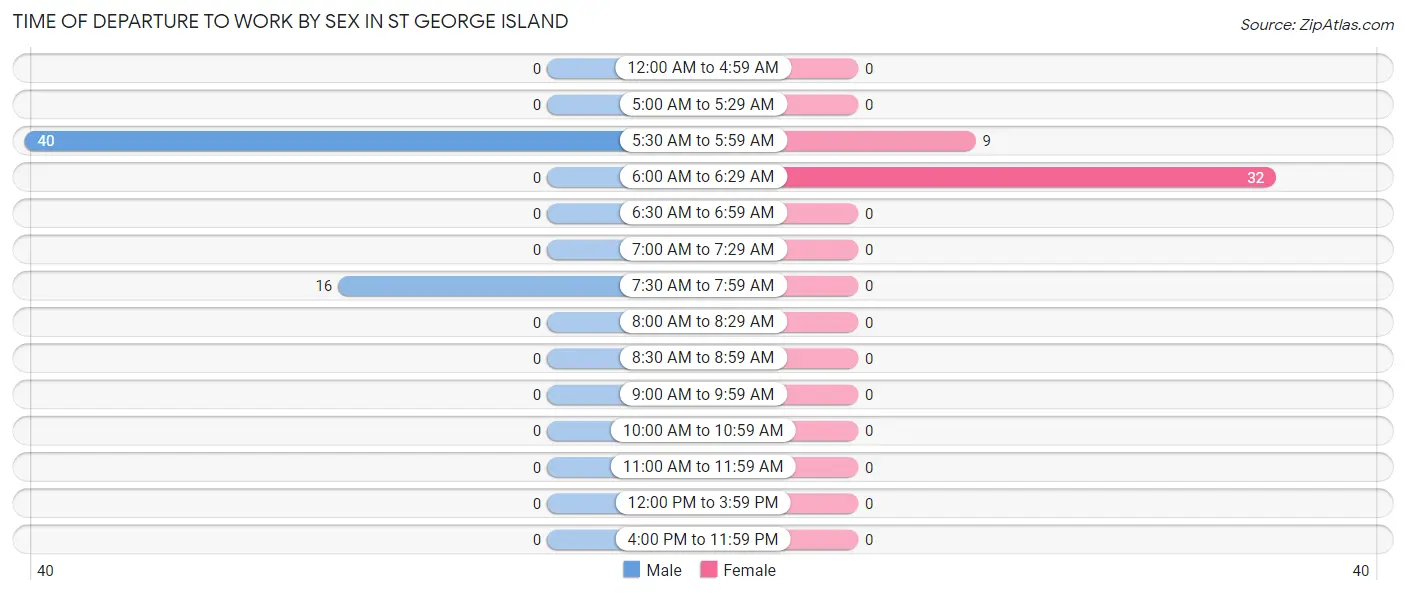
Time of Departure to Work by Sex in St George Island
The most frequent times of departure to work in St George Island are 5:30 AM to 5:59 AM (40, 71.4%) for males and 6:00 AM to 6:29 AM (32, 78.0%) for females.
| Time of Departure | Male | Female |
| 12:00 AM to 4:59 AM | 0 (0.0%) | 0 (0.0%) |
| 5:00 AM to 5:29 AM | 0 (0.0%) | 0 (0.0%) |
| 5:30 AM to 5:59 AM | 40 (71.4%) | 9 (22.0%) |
| 6:00 AM to 6:29 AM | 0 (0.0%) | 32 (78.0%) |
| 6:30 AM to 6:59 AM | 0 (0.0%) | 0 (0.0%) |
| 7:00 AM to 7:29 AM | 0 (0.0%) | 0 (0.0%) |
| 7:30 AM to 7:59 AM | 16 (28.6%) | 0 (0.0%) |
| 8:00 AM to 8:29 AM | 0 (0.0%) | 0 (0.0%) |
| 8:30 AM to 8:59 AM | 0 (0.0%) | 0 (0.0%) |
| 9:00 AM to 9:59 AM | 0 (0.0%) | 0 (0.0%) |
| 10:00 AM to 10:59 AM | 0 (0.0%) | 0 (0.0%) |
| 11:00 AM to 11:59 AM | 0 (0.0%) | 0 (0.0%) |
| 12:00 PM to 3:59 PM | 0 (0.0%) | 0 (0.0%) |
| 4:00 PM to 11:59 PM | 0 (0.0%) | 0 (0.0%) |
| Total | 56 (100.0%) | 41 (100.0%) |
Housing Occupancy in St George Island
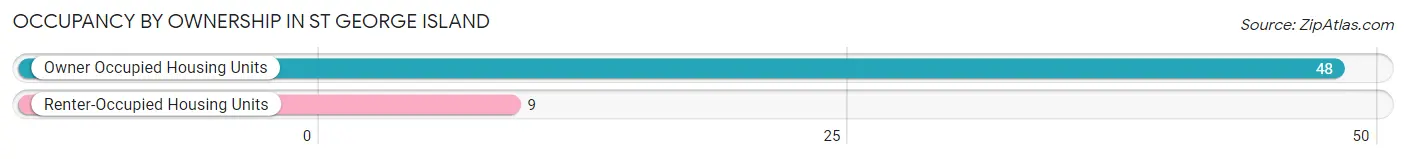
Occupancy by Ownership in St George Island
Of the total 57 dwellings in St George Island, owner-occupied units account for 48 (84.2%), while renter-occupied units make up 9 (15.8%).
| Occupancy | # Housing Units | % Housing Units |
| Owner Occupied Housing Units | 48 | 84.2% |
| Renter-Occupied Housing Units | 9 | 15.8% |
| Total Occupied Housing Units | 57 | 100.0% |
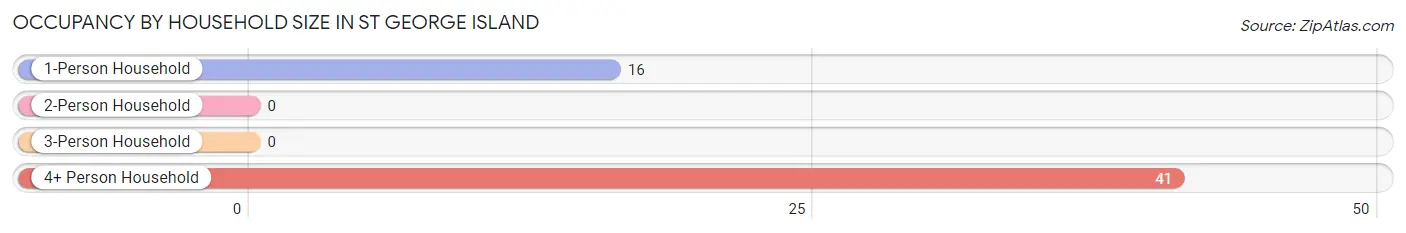
Occupancy by Household Size in St George Island
| Household Size | # Housing Units | % Housing Units |
| 1-Person Household | 16 | 28.1% |
| 2-Person Household | 0 | 0.0% |
| 3-Person Household | 0 | 0.0% |
| 4+ Person Household | 41 | 71.9% |
| Total Housing Units | 57 | 100.0% |
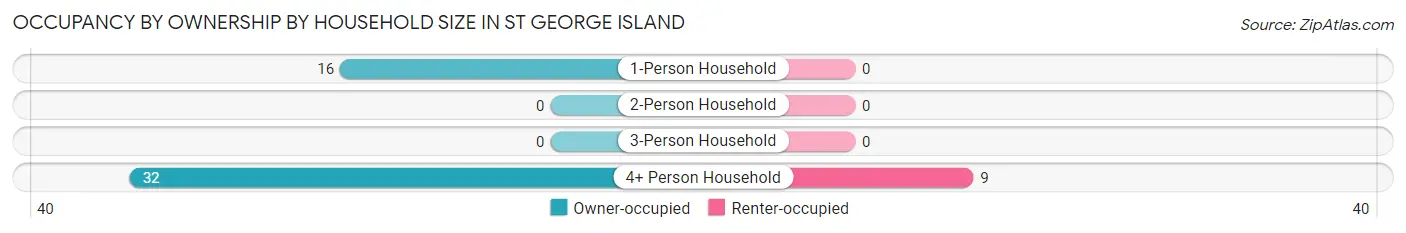
Occupancy by Ownership by Household Size in St George Island
| Household Size | Owner-occupied | Renter-occupied |
| 1-Person Household | 16 (100.0%) | 0 (0.0%) |
| 2-Person Household | 0 (0.0%) | 0 (0.0%) |
| 3-Person Household | 0 (0.0%) | 0 (0.0%) |
| 4+ Person Household | 32 (78.0%) | 9 (22.0%) |
| Total Housing Units | 48 (84.2%) | 9 (15.8%) |
Occupancy by Educational Attainment in St George Island
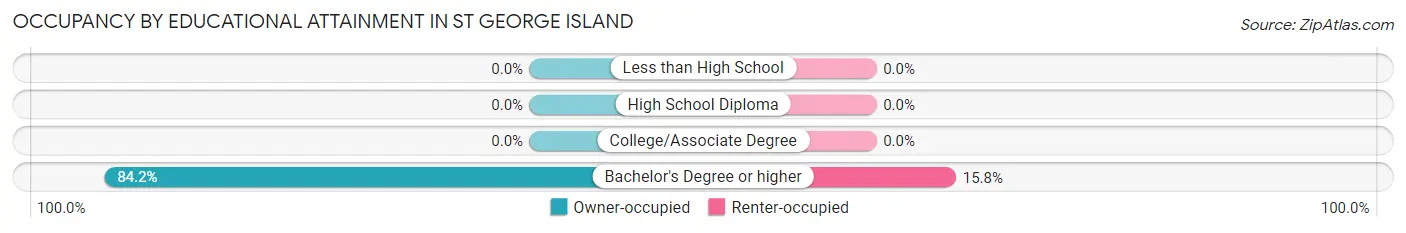
| Household Size | Owner-occupied | Renter-occupied |
| Less than High School | 0 (0.0%) | 0 (0.0%) |
| High School Diploma | 0 (0.0%) | 0 (0.0%) |
| College/Associate Degree | 0 (0.0%) | 0 (0.0%) |
| Bachelor's Degree or higher | 48 (84.2%) | 9 (15.8%) |
Occupancy by Age of Householder in St George Island
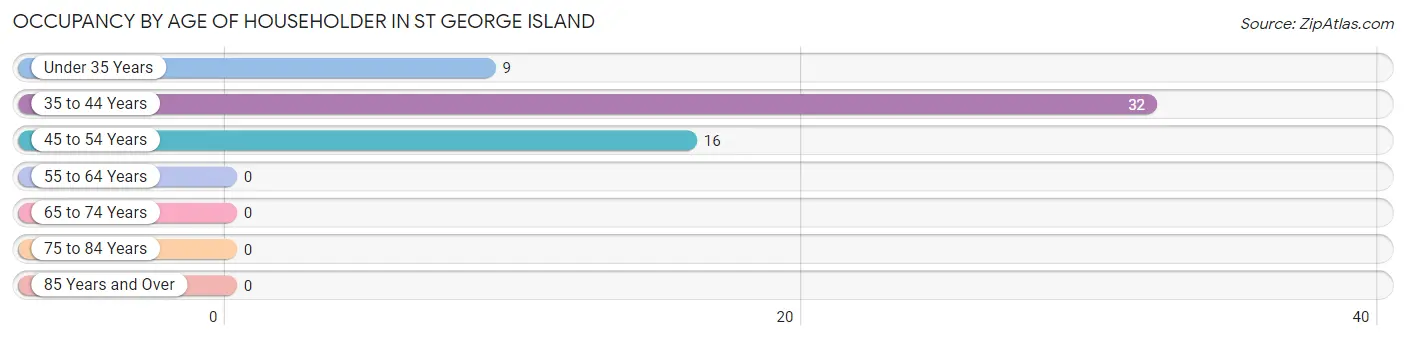
| Age Bracket | # Households | % Households |
| Under 35 Years | 9 | 15.8% |
| 35 to 44 Years | 32 | 56.1% |
| 45 to 54 Years | 16 | 28.1% |
| 55 to 64 Years | 0 | 0.0% |
| 65 to 74 Years | 0 | 0.0% |
| 75 to 84 Years | 0 | 0.0% |
| 85 Years and Over | 0 | 0.0% |
| Total | 57 | 100.0% |
Housing Finances in St George Island
Median Income by Occupancy in St George Island
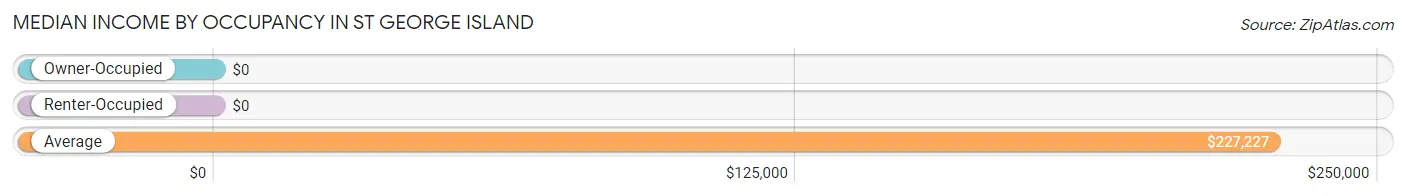
| Occupancy Type | # Households | Median Income |
| Owner-Occupied | 48 (84.2%) | $0 |
| Renter-Occupied | 9 (15.8%) | $0 |
| Average | 57 (100.0%) | $227,227 |
Occupancy by Householder Income Bracket in St George Island
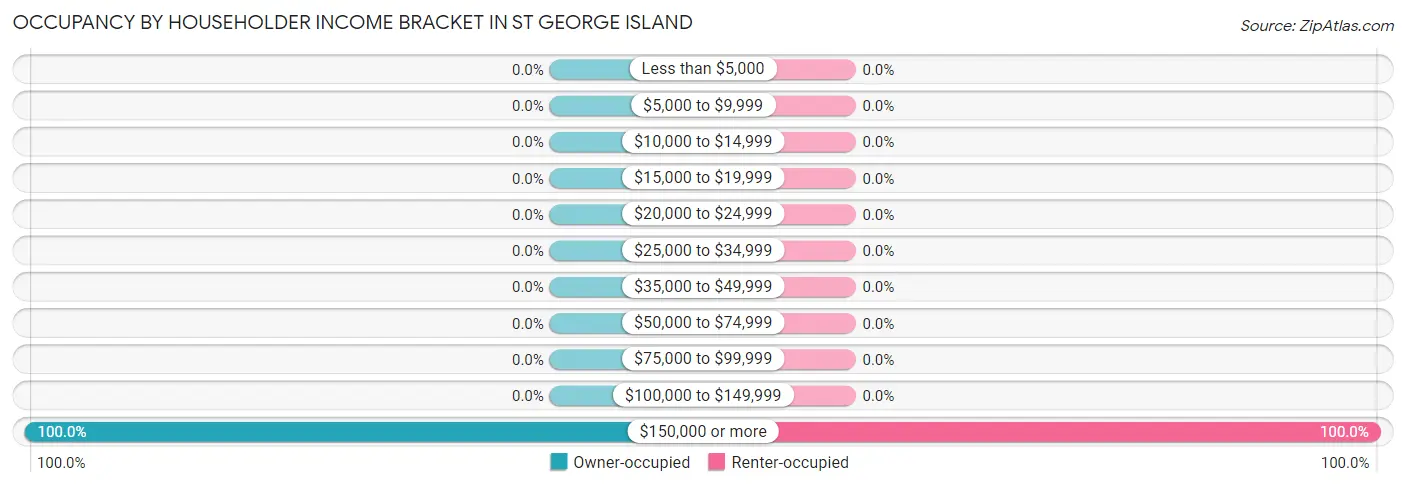
| Income Bracket | Owner-occupied | Renter-occupied |
| Less than $5,000 | 0 (0.0%) | 0 (0.0%) |
| $5,000 to $9,999 | 0 (0.0%) | 0 (0.0%) |
| $10,000 to $14,999 | 0 (0.0%) | 0 (0.0%) |
| $15,000 to $19,999 | 0 (0.0%) | 0 (0.0%) |
| $20,000 to $24,999 | 0 (0.0%) | 0 (0.0%) |
| $25,000 to $34,999 | 0 (0.0%) | 0 (0.0%) |
| $35,000 to $49,999 | 0 (0.0%) | 0 (0.0%) |
| $50,000 to $74,999 | 0 (0.0%) | 0 (0.0%) |
| $75,000 to $99,999 | 0 (0.0%) | 0 (0.0%) |
| $100,000 to $149,999 | 0 (0.0%) | 0 (0.0%) |
| $150,000 or more | 48 (100.0%) | 9 (100.0%) |
| Total | 48 (100.0%) | 9 (100.0%) |
Monthly Housing Cost Tiers in St George Island
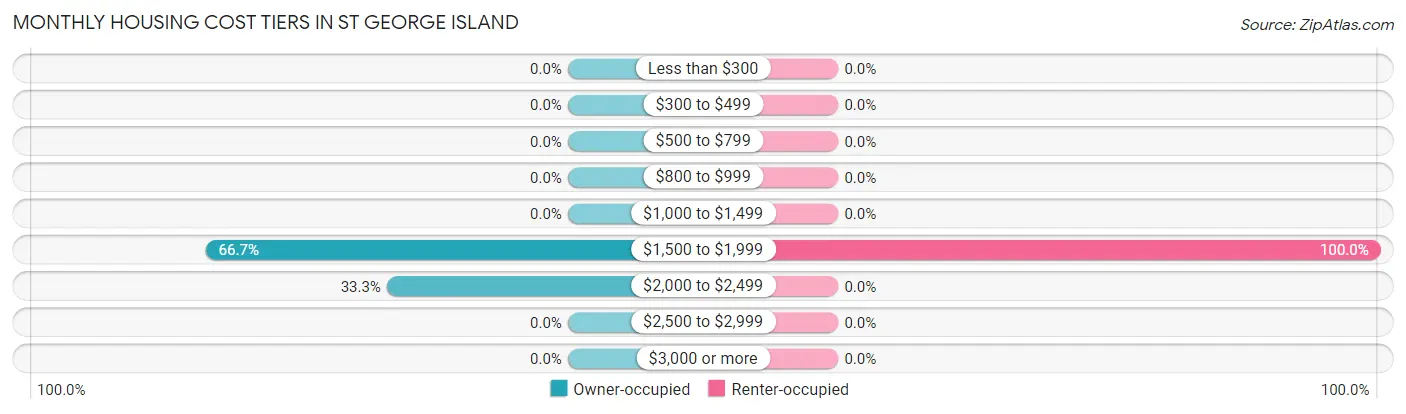
| Monthly Cost | Owner-occupied | Renter-occupied |
| Less than $300 | 0 (0.0%) | 0 (0.0%) |
| $300 to $499 | 0 (0.0%) | 0 (0.0%) |
| $500 to $799 | 0 (0.0%) | 0 (0.0%) |
| $800 to $999 | 0 (0.0%) | 0 (0.0%) |
| $1,000 to $1,499 | 0 (0.0%) | 0 (0.0%) |
| $1,500 to $1,999 | 32 (66.7%) | 9 (100.0%) |
| $2,000 to $2,499 | 16 (33.3%) | 0 (0.0%) |
| $2,500 to $2,999 | 0 (0.0%) | 0 (0.0%) |
| $3,000 or more | 0 (0.0%) | 0 (0.0%) |
| Total | 48 (100.0%) | 9 (100.0%) |
Physical Housing Characteristics in St George Island
Housing Structures in St George Island
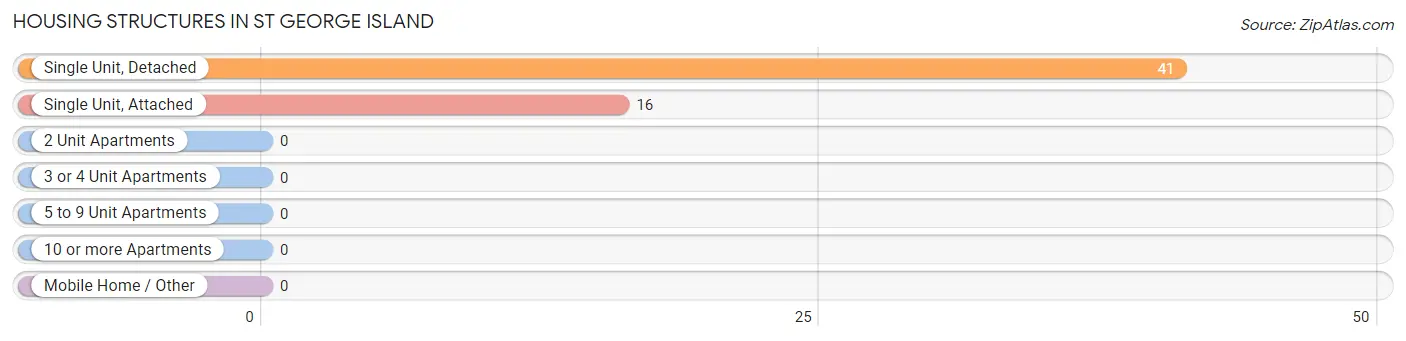
| Structure Type | # Housing Units | % Housing Units |
| Single Unit, Detached | 41 | 71.9% |
| Single Unit, Attached | 16 | 28.1% |
| 2 Unit Apartments | 0 | 0.0% |
| 3 or 4 Unit Apartments | 0 | 0.0% |
| 5 to 9 Unit Apartments | 0 | 0.0% |
| 10 or more Apartments | 0 | 0.0% |
| Mobile Home / Other | 0 | 0.0% |
| Total | 57 | 100.0% |
Housing Structures by Occupancy in St George Island
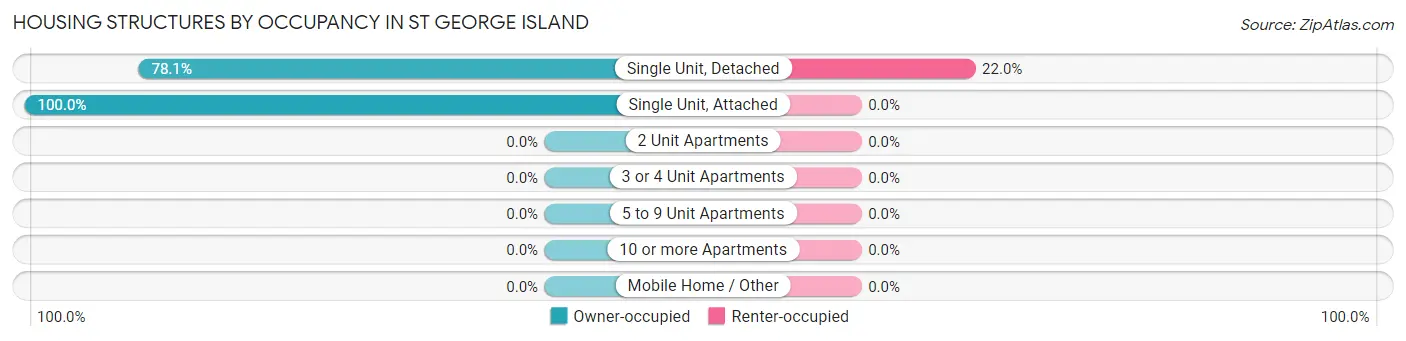
| Structure Type | Owner-occupied | Renter-occupied |
| Single Unit, Detached | 32 (78.0%) | 9 (22.0%) |
| Single Unit, Attached | 16 (100.0%) | 0 (0.0%) |
| 2 Unit Apartments | 0 (0.0%) | 0 (0.0%) |
| 3 or 4 Unit Apartments | 0 (0.0%) | 0 (0.0%) |
| 5 to 9 Unit Apartments | 0 (0.0%) | 0 (0.0%) |
| 10 or more Apartments | 0 (0.0%) | 0 (0.0%) |
| Mobile Home / Other | 0 (0.0%) | 0 (0.0%) |
| Total | 48 (84.2%) | 9 (15.8%) |
Housing Structures by Number of Rooms in St George Island
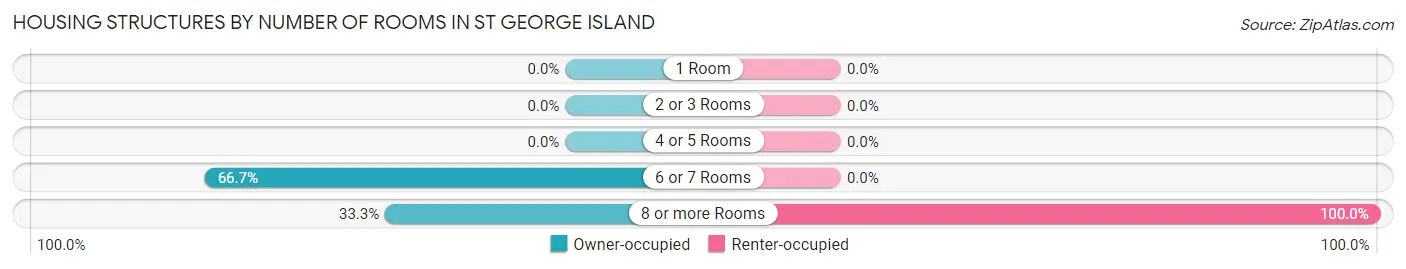
| Number of Rooms | Owner-occupied | Renter-occupied |
| 1 Room | 0 (0.0%) | 0 (0.0%) |
| 2 or 3 Rooms | 0 (0.0%) | 0 (0.0%) |
| 4 or 5 Rooms | 0 (0.0%) | 0 (0.0%) |
| 6 or 7 Rooms | 32 (66.7%) | 0 (0.0%) |
| 8 or more Rooms | 16 (33.3%) | 9 (100.0%) |
| Total | 48 (100.0%) | 9 (100.0%) |
Housing Structure by Heating Type in St George Island
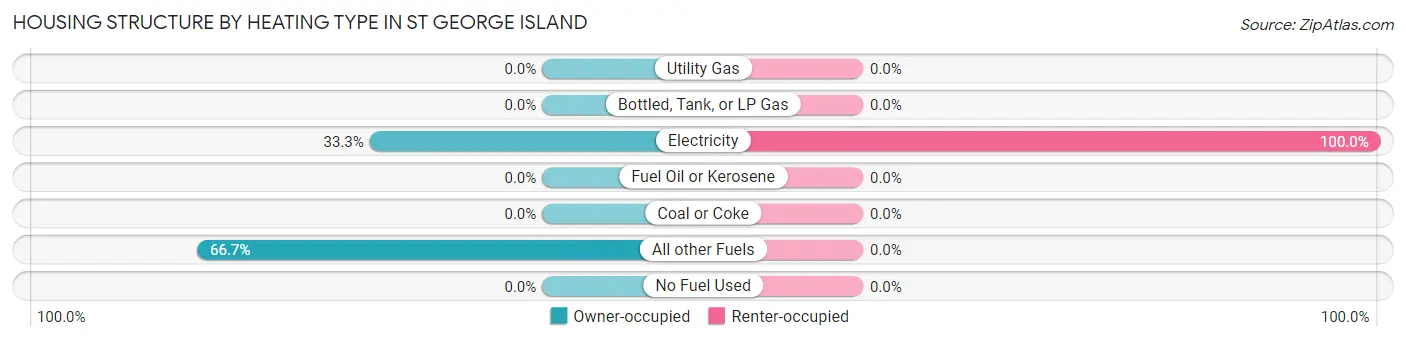
| Heating Type | Owner-occupied | Renter-occupied |
| Utility Gas | 0 (0.0%) | 0 (0.0%) |
| Bottled, Tank, or LP Gas | 0 (0.0%) | 0 (0.0%) |
| Electricity | 16 (33.3%) | 9 (100.0%) |
| Fuel Oil or Kerosene | 0 (0.0%) | 0 (0.0%) |
| Coal or Coke | 0 (0.0%) | 0 (0.0%) |
| All other Fuels | 32 (66.7%) | 0 (0.0%) |
| No Fuel Used | 0 (0.0%) | 0 (0.0%) |
| Total | 48 (100.0%) | 9 (100.0%) |
Household Vehicle Usage in St George Island
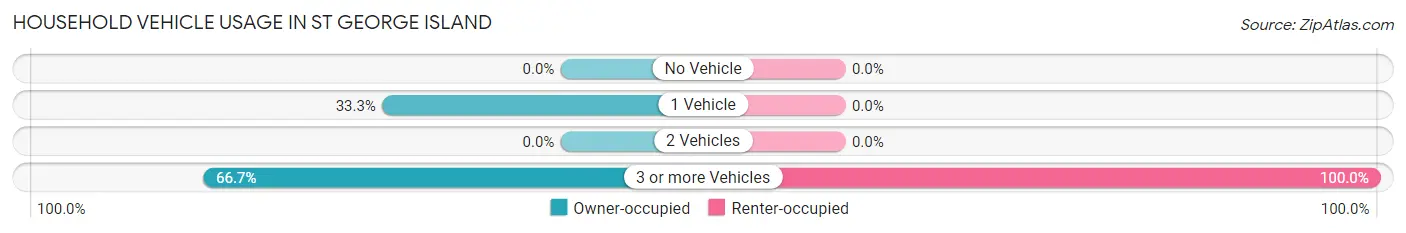
| Vehicles per Household | Owner-occupied | Renter-occupied |
| No Vehicle | 0 (0.0%) | 0 (0.0%) |
| 1 Vehicle | 16 (33.3%) | 0 (0.0%) |
| 2 Vehicles | 0 (0.0%) | 0 (0.0%) |
| 3 or more Vehicles | 32 (66.7%) | 9 (100.0%) |
| Total | 48 (100.0%) | 9 (100.0%) |
Real Estate & Mortgages in St George Island
Real Estate and Mortgage Overview in St George Island
| Characteristic | Without Mortgage | With Mortgage |
| Housing Units | 0 | 48 |
| Median Property Value | - | - |
| Median Household Income | - | - |
| Monthly Housing Costs | - | - |
| Real Estate Taxes | - | - |
Property Value by Mortgage Status in St George Island
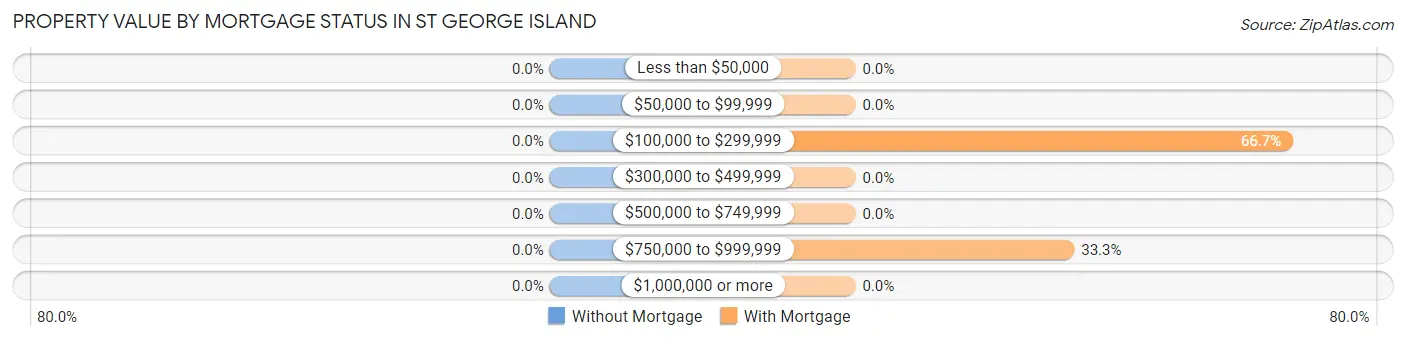
| Property Value | Without Mortgage | With Mortgage |
| Less than $50,000 | 0 (0.0%) | 0 (0.0%) |
| $50,000 to $99,999 | 0 (0.0%) | 0 (0.0%) |
| $100,000 to $299,999 | 0 (0.0%) | 32 (66.7%) |
| $300,000 to $499,999 | 0 (0.0%) | 0 (0.0%) |
| $500,000 to $749,999 | 0 (0.0%) | 0 (0.0%) |
| $750,000 to $999,999 | 0 (0.0%) | 16 (33.3%) |
| $1,000,000 or more | 0 (0.0%) | 0 (0.0%) |
| Total | 0 (0.0%) | 48 (100.0%) |
Household Income by Mortgage Status in St George Island
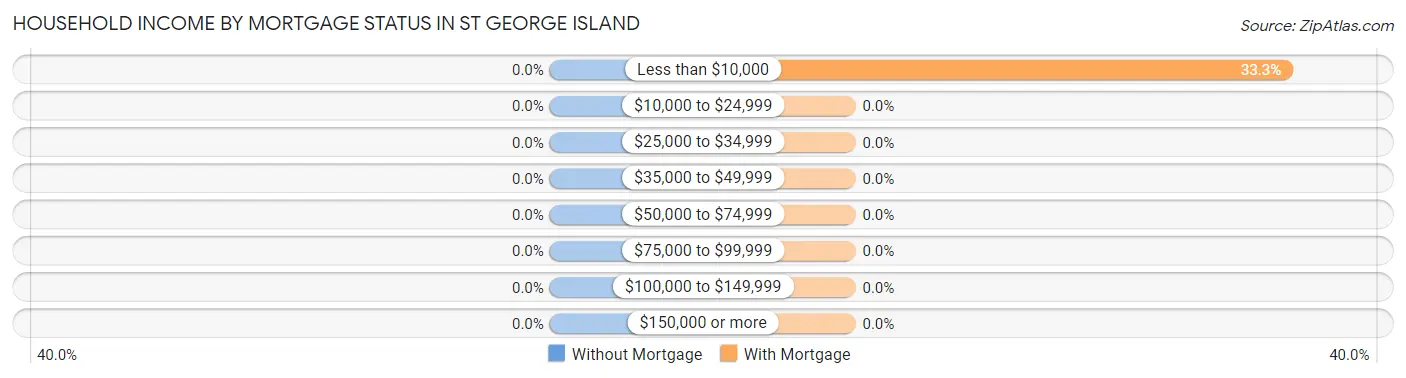
| Household Income | Without Mortgage | With Mortgage |
| Less than $10,000 | 0 (0.0%) | 16 (33.3%) |
| $10,000 to $24,999 | 0 (0.0%) | 0 (0.0%) |
| $25,000 to $34,999 | 0 (0.0%) | 0 (0.0%) |
| $35,000 to $49,999 | 0 (0.0%) | 0 (0.0%) |
| $50,000 to $74,999 | 0 (0.0%) | 0 (0.0%) |
| $75,000 to $99,999 | 0 (0.0%) | 0 (0.0%) |
| $100,000 to $149,999 | 0 (0.0%) | 0 (0.0%) |
| $150,000 or more | 0 (0.0%) | 0 (0.0%) |
| Total | 0 (0.0%) | 48 (100.0%) |
Property Value to Household Income Ratio in St George Island
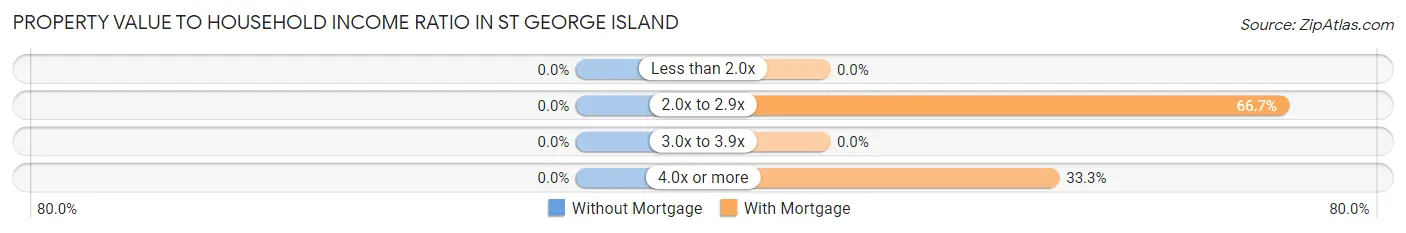
| Value-to-Income Ratio | Without Mortgage | With Mortgage |
| Less than 2.0x | 0 (0.0%) | 0 (0.0%) |
| 2.0x to 2.9x | 0 (0.0%) | 32 (66.7%) |
| 3.0x to 3.9x | 0 (0.0%) | 0 (0.0%) |
| 4.0x or more | 0 (0.0%) | 16 (33.3%) |
| Total | 0 (0.0%) | 48 (100.0%) |
Real Estate Taxes by Mortgage Status in St George Island
| Property Taxes | Without Mortgage | With Mortgage |
| Less than $800 | 0 (0.0%) | 0 (0.0%) |
| $800 to $1,499 | 0 (0.0%) | 0 (0.0%) |
| $800 to $1,499 | 0 (0.0%) | 0 (0.0%) |
| Total | 0 (0.0%) | 48 (100.0%) |
Health & Disability in St George Island
Health Insurance Coverage by Age in St George Island
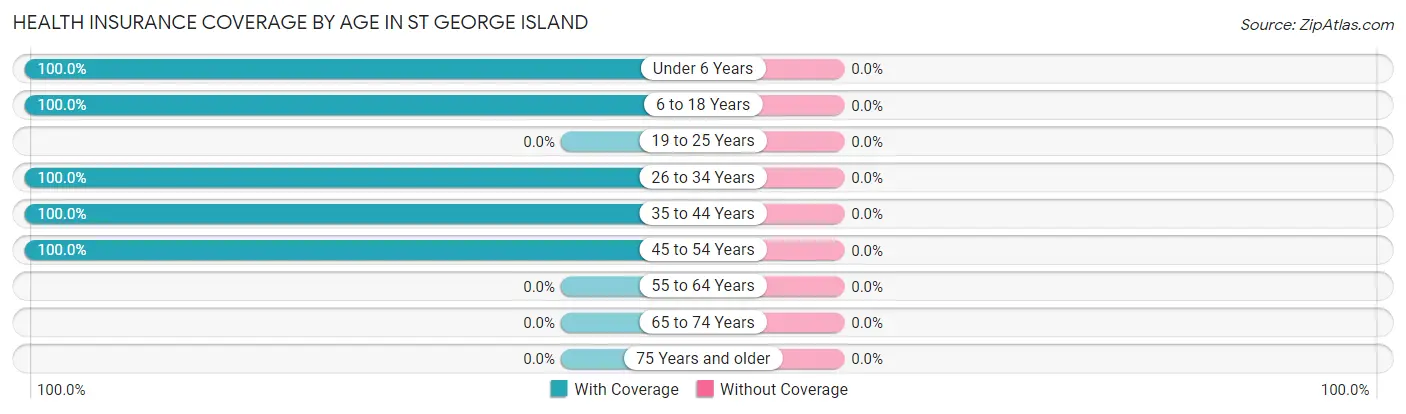
| Age Bracket | With Coverage | Without Coverage |
| Under 6 Years | 32 (100.0%) | 0 (0.0%) |
| 6 to 18 Years | 79 (100.0%) | 0 (0.0%) |
| 19 to 25 Years | 0 (0.0%) | 0 (0.0%) |
| 26 to 34 Years | 17 (100.0%) | 0 (0.0%) |
| 35 to 44 Years | 64 (100.0%) | 0 (0.0%) |
| 45 to 54 Years | 16 (100.0%) | 0 (0.0%) |
| 55 to 64 Years | 0 (0.0%) | 0 (0.0%) |
| 65 to 74 Years | 0 (0.0%) | 0 (0.0%) |
| 75 Years and older | 0 (0.0%) | 0 (0.0%) |
| Total | 208 (100.0%) | 0 (0.0%) |
Health Insurance Coverage by Citizenship Status in St George Island
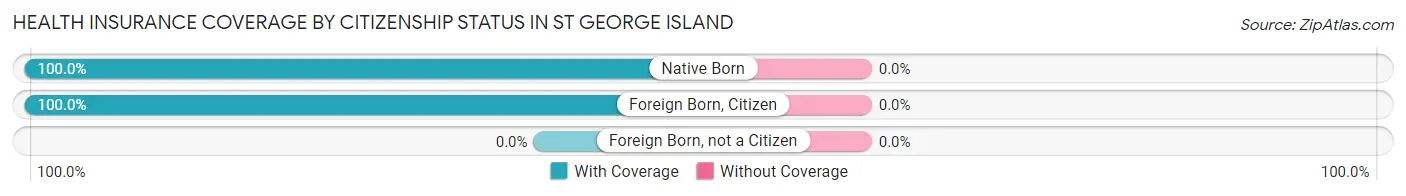
| Citizenship Status | With Coverage | Without Coverage |
| Native Born | 32 (100.0%) | 0 (0.0%) |
| Foreign Born, Citizen | 79 (100.0%) | 0 (0.0%) |
| Foreign Born, not a Citizen | 0 (0.0%) | 0 (0.0%) |
Health Insurance Coverage by Household Income in St George Island
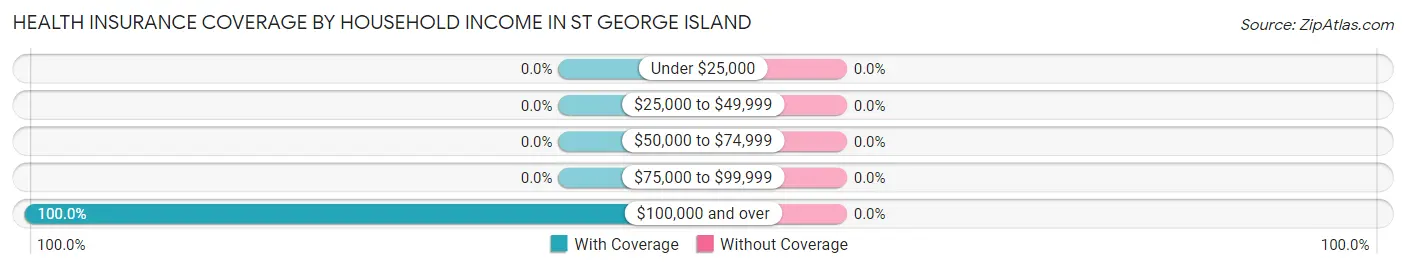
| Household Income | With Coverage | Without Coverage |
| Under $25,000 | 0 (0.0%) | 0 (0.0%) |
| $25,000 to $49,999 | 0 (0.0%) | 0 (0.0%) |
| $50,000 to $74,999 | 0 (0.0%) | 0 (0.0%) |
| $75,000 to $99,999 | 0 (0.0%) | 0 (0.0%) |
| $100,000 and over | 208 (100.0%) | 0 (0.0%) |
Public vs Private Health Insurance Coverage by Age in St George Island
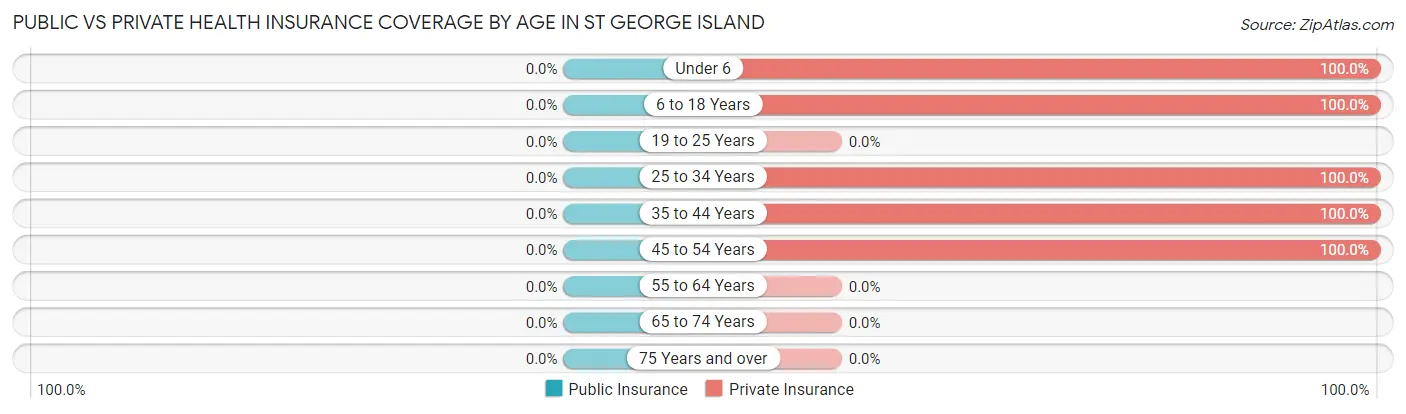
| Age Bracket | Public Insurance | Private Insurance |
| Under 6 | 0 (0.0%) | 32 (100.0%) |
| 6 to 18 Years | 0 (0.0%) | 79 (100.0%) |
| 19 to 25 Years | 0 (0.0%) | 0 (0.0%) |
| 25 to 34 Years | 0 (0.0%) | 17 (100.0%) |
| 35 to 44 Years | 0 (0.0%) | 64 (100.0%) |
| 45 to 54 Years | 0 (0.0%) | 16 (100.0%) |
| 55 to 64 Years | 0 (0.0%) | 0 (0.0%) |
| 65 to 74 Years | 0 (0.0%) | 0 (0.0%) |
| 75 Years and over | 0 (0.0%) | 0 (0.0%) |
| Total | 0 (0.0%) | 208 (100.0%) |
Disability Status by Sex by Age in St George Island
| Age Bracket | Male | Female |
| Under 5 Years | 0 (0.0%) | 0 (0.0%) |
| 5 to 17 Years | 0 (0.0%) | 0 (0.0%) |
| 18 to 34 Years | 0 (0.0%) | 0 (0.0%) |
| 35 to 64 Years | 0 (0.0%) | 0 (0.0%) |
| 65 to 74 Years | 0 (0.0%) | 0 (0.0%) |
| 75 Years and over | 0 (0.0%) | 0 (0.0%) |
Disability Class by Sex by Age in St George Island
Disability Class: Hearing Difficulty
| Age Bracket | Male | Female |
| Under 5 Years | 0 (0.0%) | 0 (0.0%) |
| 5 to 17 Years | 0 (0.0%) | 0 (0.0%) |
| 18 to 34 Years | 0 (0.0%) | 0 (0.0%) |
| 35 to 64 Years | 0 (0.0%) | 0 (0.0%) |
| 65 to 74 Years | 0 (0.0%) | 0 (0.0%) |
| 75 Years and over | 0 (0.0%) | 0 (0.0%) |
Disability Class: Vision Difficulty
| Age Bracket | Male | Female |
| Under 5 Years | 0 (0.0%) | 0 (0.0%) |
| 5 to 17 Years | 0 (0.0%) | 0 (0.0%) |
| 18 to 34 Years | 0 (0.0%) | 0 (0.0%) |
| 35 to 64 Years | 0 (0.0%) | 0 (0.0%) |
| 65 to 74 Years | 0 (0.0%) | 0 (0.0%) |
| 75 Years and over | 0 (0.0%) | 0 (0.0%) |
Disability Class: Cognitive Difficulty
| Age Bracket | Male | Female |
| 5 to 17 Years | 0 (0.0%) | 0 (0.0%) |
| 18 to 34 Years | 0 (0.0%) | 0 (0.0%) |
| 35 to 64 Years | 0 (0.0%) | 0 (0.0%) |
| 65 to 74 Years | 0 (0.0%) | 0 (0.0%) |
| 75 Years and over | 0 (0.0%) | 0 (0.0%) |
Disability Class: Ambulatory Difficulty
| Age Bracket | Male | Female |
| 5 to 17 Years | 0 (0.0%) | 0 (0.0%) |
| 18 to 34 Years | 0 (0.0%) | 0 (0.0%) |
| 35 to 64 Years | 0 (0.0%) | 0 (0.0%) |
| 65 to 74 Years | 0 (0.0%) | 0 (0.0%) |
| 75 Years and over | 0 (0.0%) | 0 (0.0%) |
Disability Class: Self-Care Difficulty
| Age Bracket | Male | Female |
| 5 to 17 Years | 0 (0.0%) | 0 (0.0%) |
| 18 to 34 Years | 0 (0.0%) | 0 (0.0%) |
| 35 to 64 Years | 0 (0.0%) | 0 (0.0%) |
| 65 to 74 Years | 0 (0.0%) | 0 (0.0%) |
| 75 Years and over | 0 (0.0%) | 0 (0.0%) |
Technology Access in St George Island
Computing Device Access in St George Island
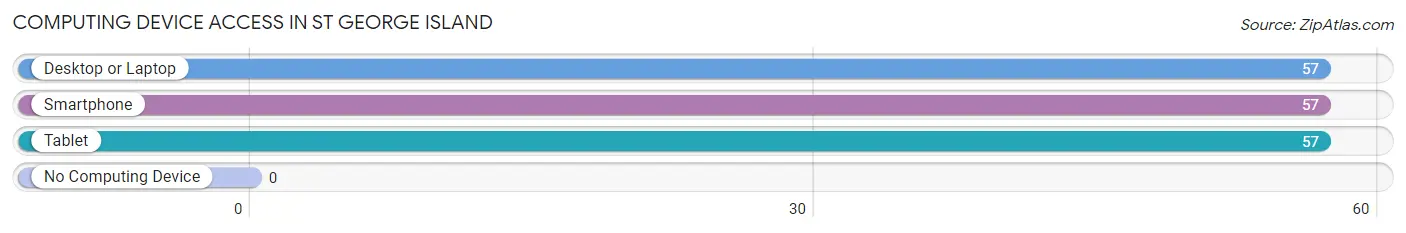
| Device Type | # Households | % Households |
| Desktop or Laptop | 57 | 100.0% |
| Smartphone | 57 | 100.0% |
| Tablet | 57 | 100.0% |
| No Computing Device | 0 | 0.0% |
| Total | 57 | 100.0% |
Internet Access in St George Island
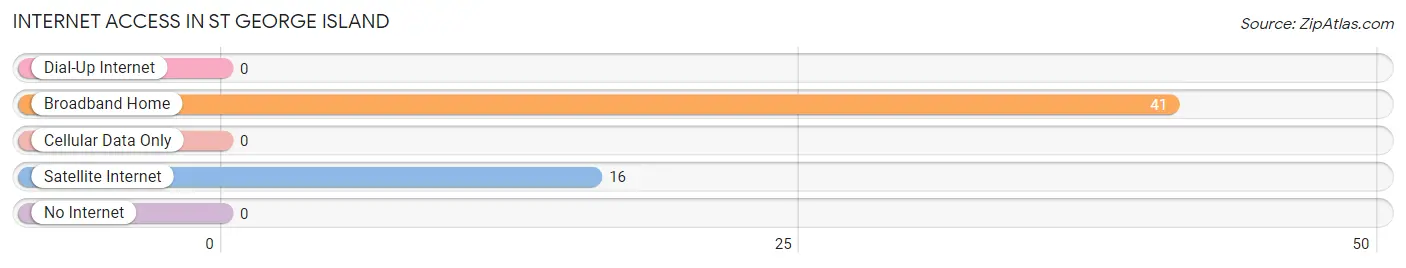
| Internet Type | # Households | % Households |
| Dial-Up Internet | 0 | 0.0% |
| Broadband Home | 41 | 71.9% |
| Cellular Data Only | 0 | 0.0% |
| Satellite Internet | 16 | 28.1% |
| No Internet | 0 | 0.0% |
| Total | 57 | 100.0% |
St George Island Summary
St. George Island is a small island located in the Chesapeake Bay in Maryland. It is part of Talbot County and is situated between the towns of Easton and St. Michaels. The island is approximately 8 miles long and 1 mile wide, and is home to a population of about 1,000 people.
History
The history of St. George Island dates back to the 1600s when it was first inhabited by Native Americans. The island was later settled by English colonists in the 1700s and was used for farming and fishing. In the 1800s, the island was used for oystering and crabbing, and the population grew to around 500 people.
In the early 1900s, the island was used for vacationing and recreation. The first hotel was built in the 1920s, and the island became a popular destination for tourists. In the 1950s, the island was developed further with the construction of a bridge connecting it to the mainland.
Geography
St. George Island is located in the Chesapeake Bay in Maryland. It is part of Talbot County and is situated between the towns of Easton and St. Michaels. The island is approximately 8 miles long and 1 mile wide, and is home to a population of about 1,000 people.
The island is mostly flat and is composed of sandy soil. The terrain is mostly marshland and wetlands, with some areas of higher elevation. The island is surrounded by shallow waters and is home to a variety of wildlife, including birds, fish, and crabs.
Economy
The economy of St. George Island is largely based on tourism. The island is a popular destination for vacationers, and there are a variety of hotels, restaurants, and shops on the island. The island is also home to a number of marinas, which provide services for boaters.
The island is also home to a number of commercial fishing operations, which provide seafood to local restaurants and markets. The island is also home to a number of oyster farms, which provide oysters to local restaurants and markets.
Demographics
As of the 2010 census, the population of St. George Island was 1,000 people. The population is mostly white (90.2%), with a small percentage of African Americans (4.2%) and Hispanics (2.2%). The median household income is $50,000, and the median age is 45.
The island is home to a variety of religious denominations, including Catholic, Protestant, and Jewish. The island is also home to a number of non-profit organizations, including the St. George Island Historical Society and the St. George Island Nature Conservancy.
Conclusion
St. George Island is a small island located in the Chesapeake Bay in Maryland. It is part of Talbot County and is situated between the towns of Easton and St. Michaels. The island is approximately 8 miles long and 1 mile wide, and is home to a population of about 1,000 people. The economy of the island is largely based on tourism, and the population is mostly white. The island is home to a variety of religious denominations, and is also home to a number of non-profit organizations.
Common Questions
What is Per Capita Income in St George Island?
Per Capita income in St George Island is $67,370.
What is the Median Household income in St George Island?
Median Household Income in St George Island is $227,227.
What is Inequality or Gini Index in St George Island?
Inequality or Gini Index in St George Island is 0.06.
What is the Total Population of St George Island?
Total Population of St George Island is 208.
What is the Total Male Population of St George Island?
Total Male Population of St George Island is 123.
What is the Total Female Population of St George Island?
Total Female Population of St George Island is 85.
What is the Ratio of Males per 100 Females in St George Island?
There are 144.71 Males per 100 Females in St George Island.
What is the Ratio of Females per 100 Males in St George Island?
There are 69.11 Females per 100 Males in St George Island.
What is the Median Population Age in St George Island?
Median Population Age in St George Island is 16.4 Years.
What is the Average Family Size in St George Island
Average Family Size in St George Island is 3.9 People.
What is the Average Household Size in St George Island
Average Household Size in St George Island is 3.6 People.
How Large is the Labor Force in St George Island?
There are 97 People in the Labor Forcein in St George Island.
What is the Percentage of People in the Labor Force in St George Island?
89.0% of People are in the Labor Force in St George Island.