Silverton, OR Map & Demographics
Silverton Map
Silverton Overview
$34,161
PER CAPITA INCOME
$89,433
AVG FAMILY INCOME
$75,167
AVG HOUSEHOLD INCOME
30.8%
WAGE / INCOME GAP [ % ]
69.2¢/ $1
WAGE / INCOME GAP [ $ ]
0.42
INEQUALITY / GINI INDEX
10,439
TOTAL POPULATION
5,075
MALE POPULATION
5,364
FEMALE POPULATION
94.61
MALES / 100 FEMALES
105.69
FEMALES / 100 MALES
38.2
MEDIAN AGE
3.2
AVG FAMILY SIZE
2.7
AVG HOUSEHOLD SIZE
4,861
LABOR FORCE [ PEOPLE ]
61.8%
PERCENT IN LABOR FORCE
5.7%
UNEMPLOYMENT RATE
Silverton Zip Codes
Income in Silverton
Income Overview in Silverton
Per Capita Income in Silverton is $34,161, while median incomes of families and households are $89,433 and $75,167 respectively.
| Characteristic | Number | Measure |
| Per Capita Income | 10,439 | $34,161 |
| Median Family Income | 2,545 | $89,433 |
| Mean Family Income | 2,545 | $104,800 |
| Median Household Income | 3,818 | $75,167 |
| Mean Household Income | 3,818 | $90,426 |
| Income Deficit | 2,545 | $0 |
| Wage / Income Gap (%) | 10,439 | 30.84% |
| Wage / Income Gap ($) | 10,439 | 69.16¢ per $1 |
| Gini / Inequality Index | 10,439 | 0.42 |
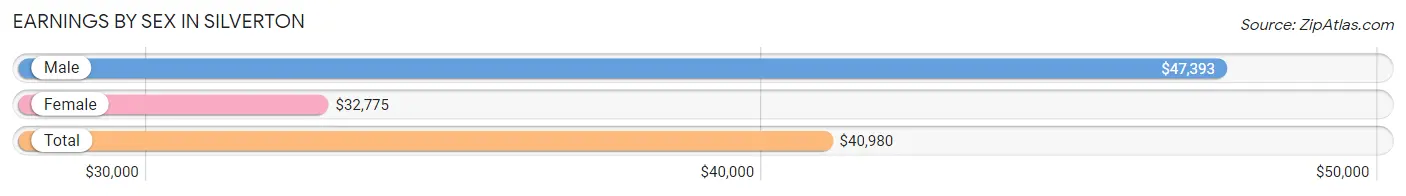
Earnings by Sex in Silverton
Average Earnings in Silverton are $40,980, $47,393 for men and $32,775 for women, a difference of 30.8%.
| Sex | Number | Average Earnings |
| Male | 2,537 (48.9%) | $47,393 |
| Female | 2,655 (51.1%) | $32,775 |
| Total | 5,192 (100.0%) | $40,980 |
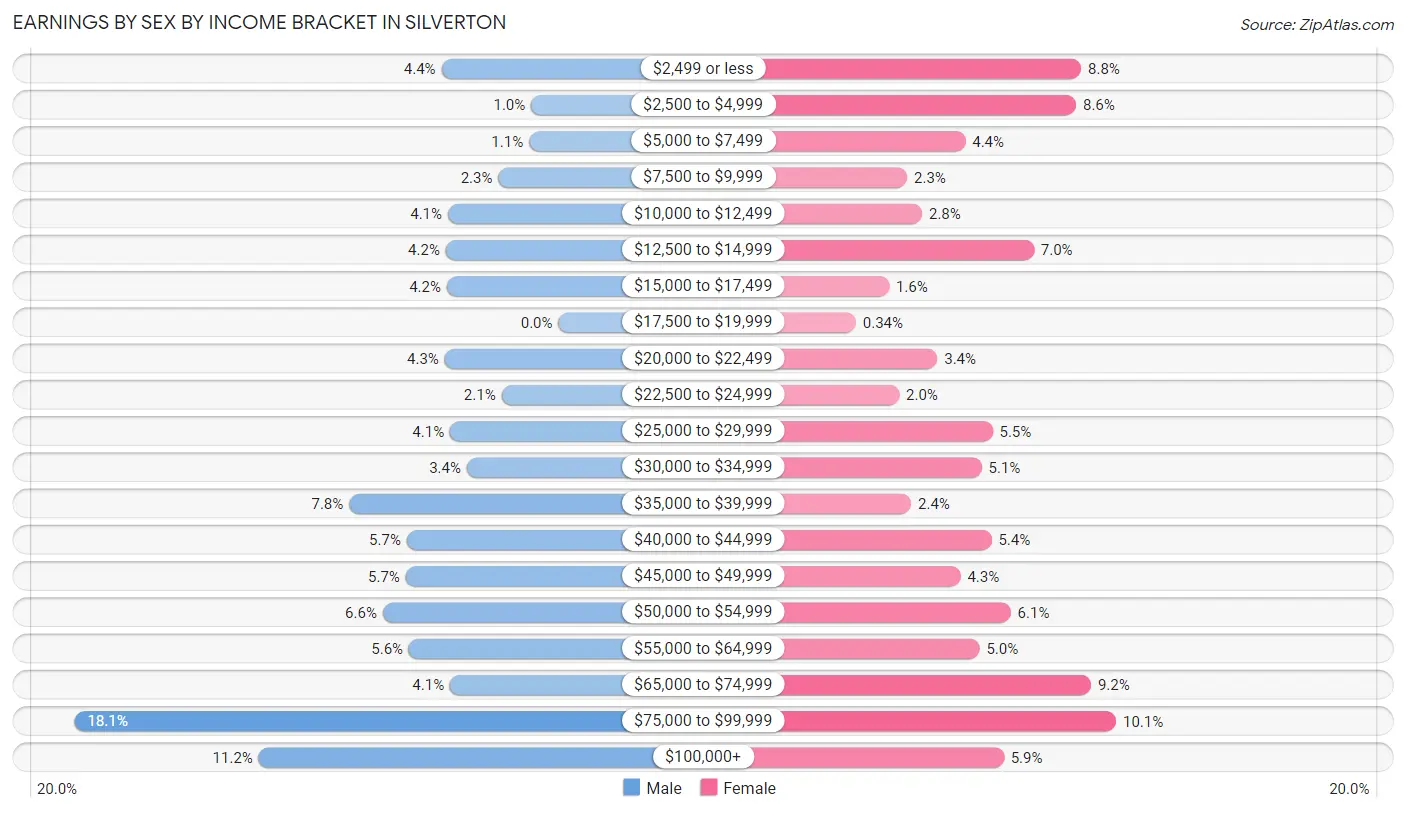
Earnings by Sex by Income Bracket in Silverton
The most common earnings brackets in Silverton are $75,000 to $99,999 for men (460 | 18.1%) and $75,000 to $99,999 for women (268 | 10.1%).
| Income | Male | Female |
| $2,499 or less | 111 (4.4%) | 233 (8.8%) |
| $2,500 to $4,999 | 26 (1.0%) | 228 (8.6%) |
| $5,000 to $7,499 | 28 (1.1%) | 118 (4.4%) |
| $7,500 to $9,999 | 57 (2.2%) | 60 (2.3%) |
| $10,000 to $12,499 | 105 (4.1%) | 75 (2.8%) |
| $12,500 to $14,999 | 107 (4.2%) | 186 (7.0%) |
| $15,000 to $17,499 | 106 (4.2%) | 42 (1.6%) |
| $17,500 to $19,999 | 0 (0.0%) | 9 (0.3%) |
| $20,000 to $22,499 | 108 (4.3%) | 90 (3.4%) |
| $22,500 to $24,999 | 54 (2.1%) | 52 (2.0%) |
| $25,000 to $29,999 | 103 (4.1%) | 145 (5.5%) |
| $30,000 to $34,999 | 87 (3.4%) | 134 (5.1%) |
| $35,000 to $39,999 | 199 (7.8%) | 64 (2.4%) |
| $40,000 to $44,999 | 144 (5.7%) | 144 (5.4%) |
| $45,000 to $49,999 | 145 (5.7%) | 113 (4.3%) |
| $50,000 to $54,999 | 167 (6.6%) | 163 (6.1%) |
| $55,000 to $64,999 | 142 (5.6%) | 132 (5.0%) |
| $65,000 to $74,999 | 103 (4.1%) | 243 (9.1%) |
| $75,000 to $99,999 | 460 (18.1%) | 268 (10.1%) |
| $100,000+ | 285 (11.2%) | 156 (5.9%) |
| Total | 2,537 (100.0%) | 2,655 (100.0%) |
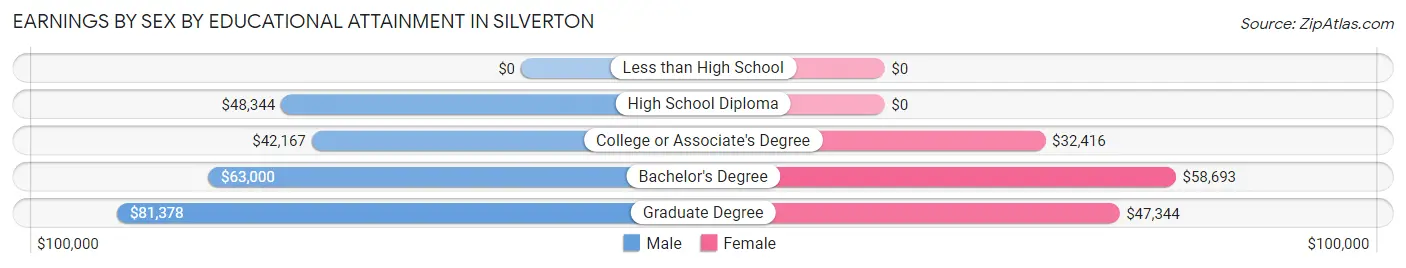
Earnings by Sex by Educational Attainment in Silverton
Average earnings in Silverton are $50,878 for men and $36,518 for women, a difference of 28.2%. Men with an educational attainment of graduate degree enjoy the highest average annual earnings of $81,378, while those with college or associate's degree education earn the least with $42,167. Women with an educational attainment of bachelor's degree earn the most with the average annual earnings of $58,693, while those with college or associate's degree education have the smallest earnings of $32,416.
| Educational Attainment | Male Income | Female Income |
| Less than High School | - | - |
| High School Diploma | $48,344 | $0 |
| College or Associate's Degree | $42,167 | $32,416 |
| Bachelor's Degree | $63,000 | $58,693 |
| Graduate Degree | $81,378 | $47,344 |
| Total | $50,878 | $36,518 |
Family Income in Silverton
Family Income Brackets in Silverton
According to the Silverton family income data, there are 540 families falling into the $100,000 to $149,999 income range, which is the most common income bracket and makes up 21.2% of all families. Conversely, the $10,000 to $14,999 income bracket is the least frequent group with only 33 families (1.3%) belonging to this category.
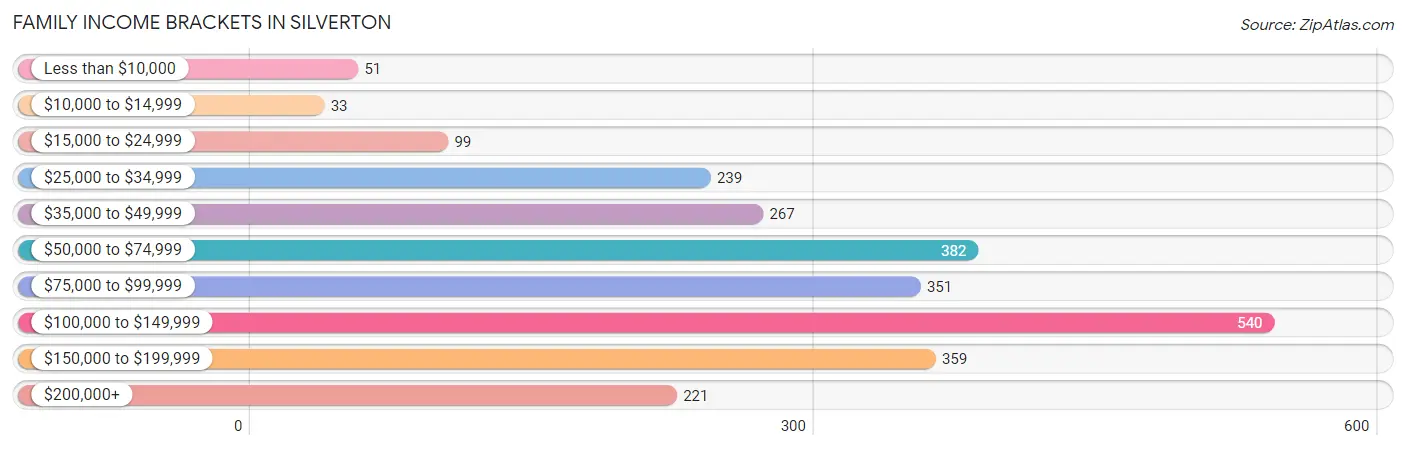
| Income Bracket | # Families | % Families |
| Less than $10,000 | 51 | 2.0% |
| $10,000 to $14,999 | 33 | 1.3% |
| $15,000 to $24,999 | 99 | 3.9% |
| $25,000 to $34,999 | 239 | 9.4% |
| $35,000 to $49,999 | 267 | 10.5% |
| $50,000 to $74,999 | 382 | 15.0% |
| $75,000 to $99,999 | 351 | 13.8% |
| $100,000 to $149,999 | 540 | 21.2% |
| $150,000 to $199,999 | 359 | 14.1% |
| $200,000+ | 221 | 8.7% |
Family Income by Famaliy Size in Silverton
5-person families (202 | 7.9%) account for the highest median family income in Silverton with $125,250 per family, while 2-person families (1,165 | 45.8%) have the highest median income of $33,840 per family member.
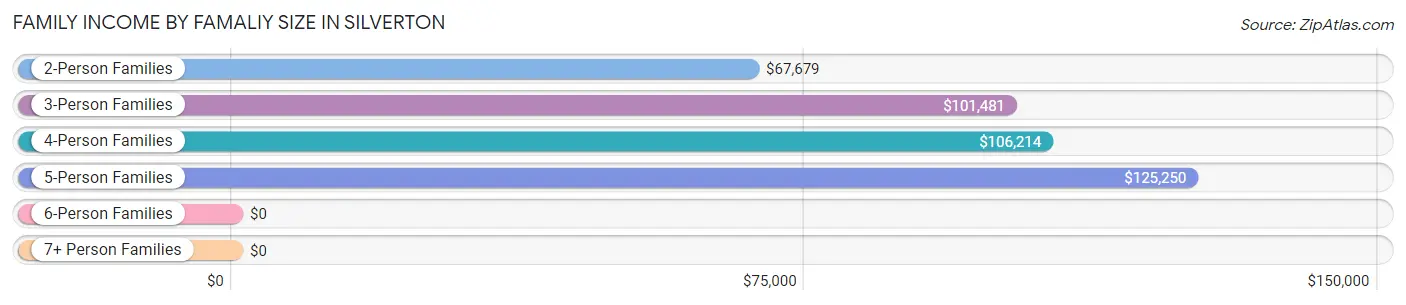
| Income Bracket | # Families | Median Income |
| 2-Person Families | 1,165 (45.8%) | $67,679 |
| 3-Person Families | 662 (26.0%) | $101,481 |
| 4-Person Families | 368 (14.5%) | $106,214 |
| 5-Person Families | 202 (7.9%) | $125,250 |
| 6-Person Families | 70 (2.8%) | $0 |
| 7+ Person Families | 78 (3.1%) | $0 |
| Total | 2,545 (100.0%) | $89,433 |
Family Income by Number of Earners in Silverton
The median family income in Silverton is $89,433, with families comprising 3+ earners (315) having the highest median family income of $149,395, while families with 1 earner (756) have the lowest median family income of $44,657, accounting for 12.4% and 29.7% of families, respectively.
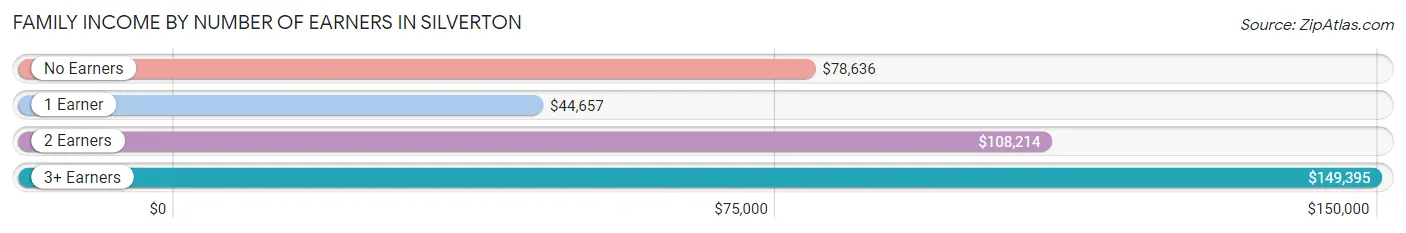
| Number of Earners | # Families | Median Income |
| No Earners | 432 (17.0%) | $78,636 |
| 1 Earner | 756 (29.7%) | $44,657 |
| 2 Earners | 1,042 (40.9%) | $108,214 |
| 3+ Earners | 315 (12.4%) | $149,395 |
| Total | 2,545 (100.0%) | $89,433 |
Household Income in Silverton
Household Income Brackets in Silverton
With 714 households falling in the category, the $100,000 to $149,999 income range is the most frequent in Silverton, accounting for 18.7% of all households. In contrast, only 149 households (3.9%) fall into the $10,000 to $14,999 income bracket, making it the least populous group.
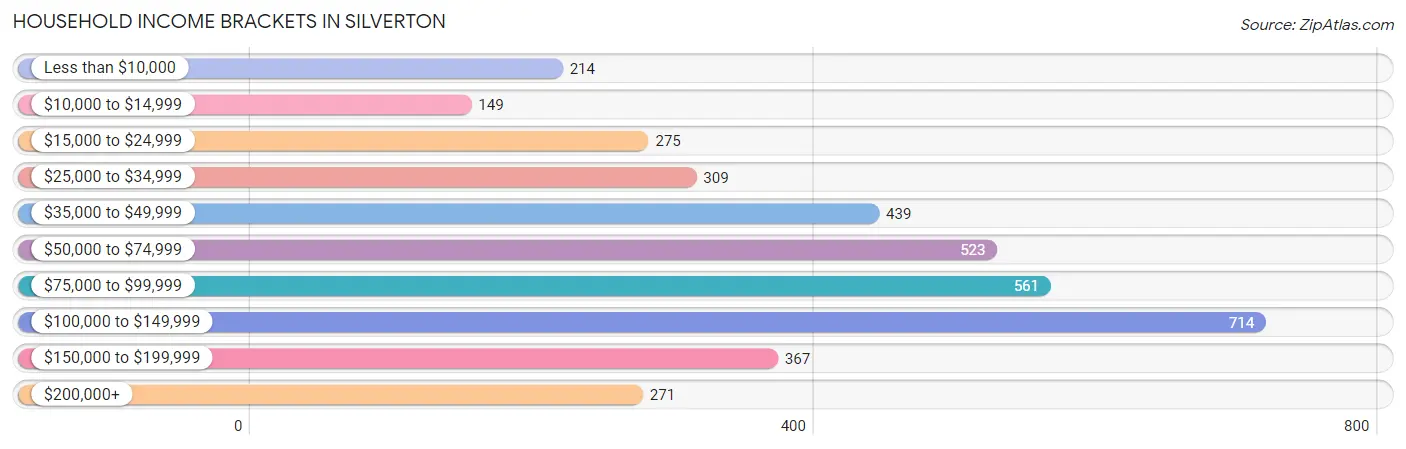
| Income Bracket | # Households | % Households |
| Less than $10,000 | 214 | 5.6% |
| $10,000 to $14,999 | 149 | 3.9% |
| $15,000 to $24,999 | 275 | 7.2% |
| $25,000 to $34,999 | 309 | 8.1% |
| $35,000 to $49,999 | 439 | 11.5% |
| $50,000 to $74,999 | 523 | 13.7% |
| $75,000 to $99,999 | 561 | 14.7% |
| $100,000 to $149,999 | 714 | 18.7% |
| $150,000 to $199,999 | 367 | 9.6% |
| $200,000+ | 271 | 7.1% |
Household Income by Householder Age in Silverton
The median household income in Silverton is $75,167, with the highest median household income of $88,571 found in the 45 to 64 years age bracket for the primary householder. A total of 1,416 households (37.1%) fall into this category. Meanwhile, the 15 to 24 years age bracket for the primary householder has the lowest median household income of $0, with 37 households (1.0%) in this group.
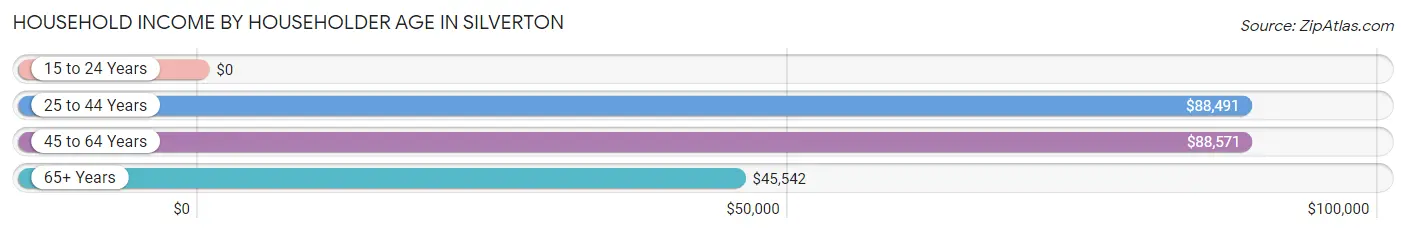
| Income Bracket | # Households | Median Income |
| 15 to 24 Years | 37 (1.0%) | $0 |
| 25 to 44 Years | 1,208 (31.6%) | $88,491 |
| 45 to 64 Years | 1,416 (37.1%) | $88,571 |
| 65+ Years | 1,157 (30.3%) | $45,542 |
| Total | 3,818 (100.0%) | $75,167 |
Poverty in Silverton
Income Below Poverty by Sex and Age in Silverton
With 10.5% poverty level for males and 13.5% for females among the residents of Silverton, 12 to 14 year old males and 16 and 17 year old females are the most vulnerable to poverty, with 106 males (31.8%) and 58 females (39.2%) in their respective age groups living below the poverty level.
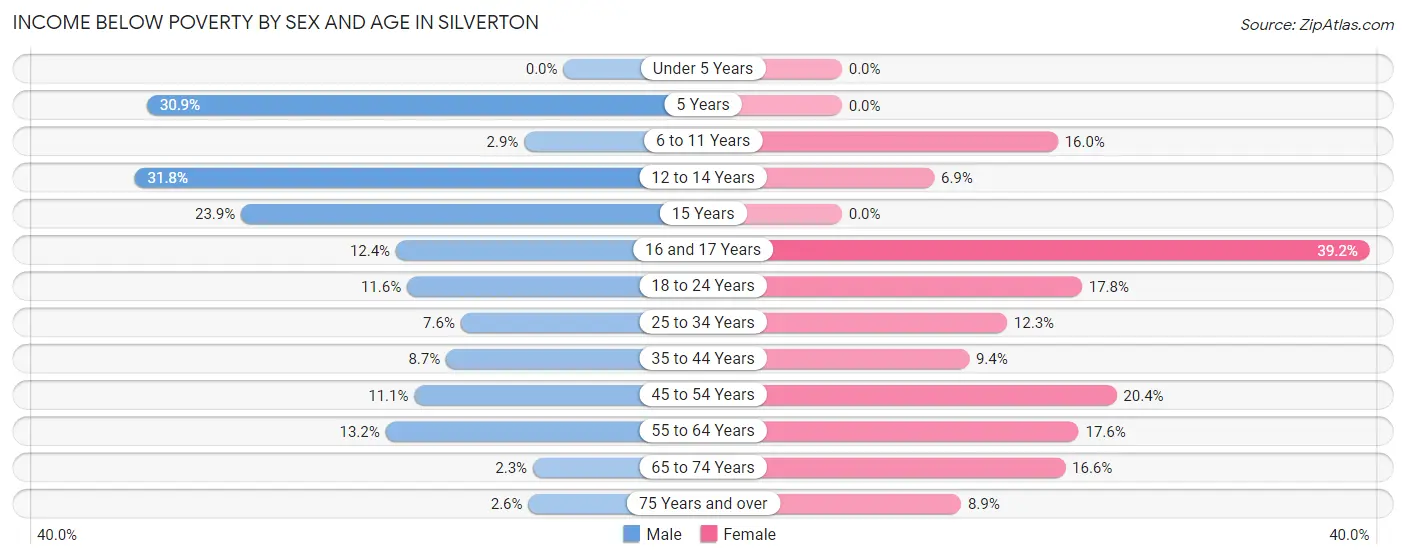
| Age Bracket | Male | Female |
| Under 5 Years | 0 (0.0%) | 0 (0.0%) |
| 5 Years | 47 (30.9%) | 0 (0.0%) |
| 6 to 11 Years | 9 (2.9%) | 76 (16.0%) |
| 12 to 14 Years | 106 (31.8%) | 15 (6.9%) |
| 15 Years | 28 (23.9%) | 0 (0.0%) |
| 16 and 17 Years | 22 (12.4%) | 58 (39.2%) |
| 18 to 24 Years | 36 (11.6%) | 31 (17.8%) |
| 25 to 34 Years | 51 (7.6%) | 78 (12.3%) |
| 35 to 44 Years | 62 (8.7%) | 76 (9.4%) |
| 45 to 54 Years | 57 (11.1%) | 95 (20.4%) |
| 55 to 64 Years | 82 (13.2%) | 164 (17.6%) |
| 65 to 74 Years | 11 (2.3%) | 95 (16.6%) |
| 75 Years and over | 7 (2.6%) | 30 (8.8%) |
| Total | 518 (10.5%) | 718 (13.5%) |
Income Above Poverty by Sex and Age in Silverton
According to the poverty statistics in Silverton, males aged under 5 years and females aged under 5 years are the age groups that are most secure financially, with 100.0% of males and 100.0% of females in these age groups living above the poverty line.
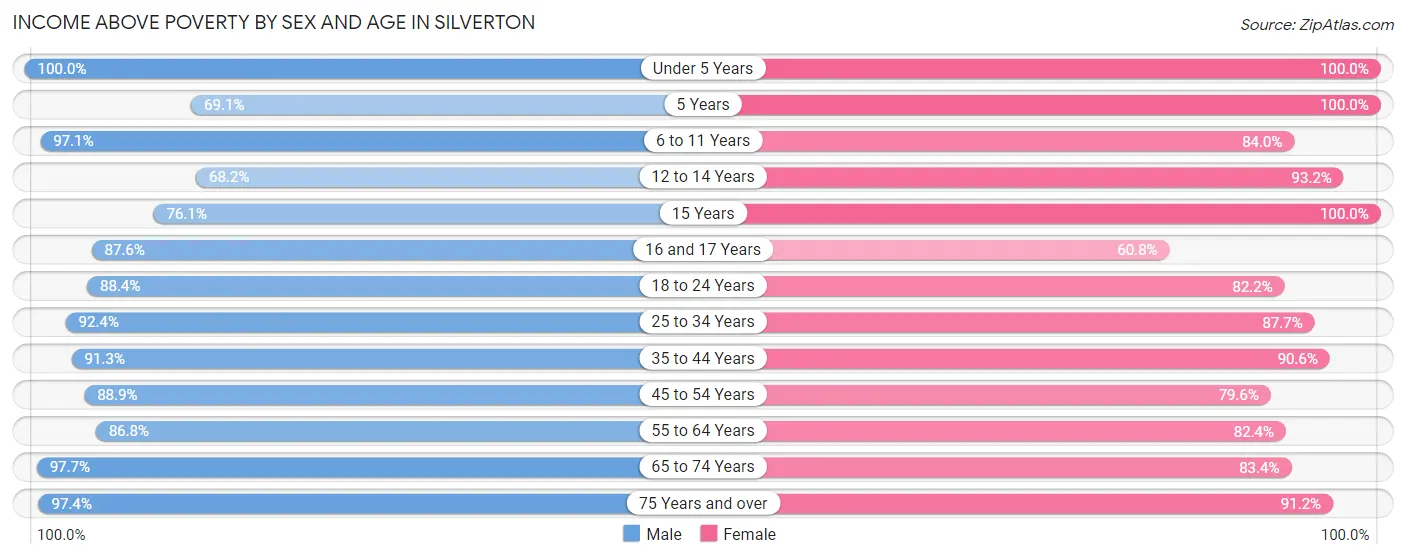
| Age Bracket | Male | Female |
| Under 5 Years | 240 (100.0%) | 436 (100.0%) |
| 5 Years | 105 (69.1%) | 89 (100.0%) |
| 6 to 11 Years | 300 (97.1%) | 398 (84.0%) |
| 12 to 14 Years | 227 (68.2%) | 204 (93.1%) |
| 15 Years | 89 (76.1%) | 14 (100.0%) |
| 16 and 17 Years | 155 (87.6%) | 90 (60.8%) |
| 18 to 24 Years | 274 (88.4%) | 143 (82.2%) |
| 25 to 34 Years | 618 (92.4%) | 558 (87.7%) |
| 35 to 44 Years | 650 (91.3%) | 729 (90.6%) |
| 45 to 54 Years | 458 (88.9%) | 371 (79.6%) |
| 55 to 64 Years | 539 (86.8%) | 769 (82.4%) |
| 65 to 74 Years | 475 (97.7%) | 478 (83.4%) |
| 75 Years and over | 262 (97.4%) | 309 (91.1%) |
| Total | 4,392 (89.4%) | 4,588 (86.5%) |
Income Below Poverty Among Married-Couple Families in Silverton
The poverty statistics for married-couple families in Silverton show that 5.6% or 105 of the total 1,864 families live below the poverty line. Families with 5 or more children have the highest poverty rate of 100.0%, comprising of 38 families. On the other hand, families with 1 or 2 children have the lowest poverty rate of 2.8%, which includes 17 families.
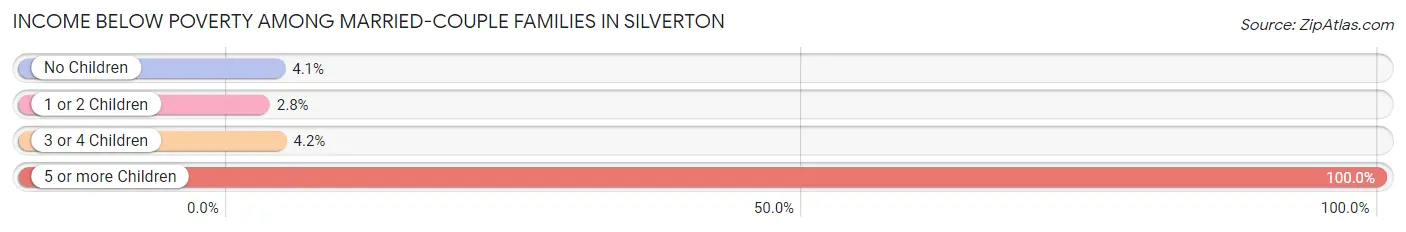
| Children | Above Poverty | Below Poverty |
| No Children | 981 (95.9%) | 42 (4.1%) |
| 1 or 2 Children | 597 (97.2%) | 17 (2.8%) |
| 3 or 4 Children | 181 (95.8%) | 8 (4.2%) |
| 5 or more Children | 0 (0.0%) | 38 (100.0%) |
| Total | 1,759 (94.4%) | 105 (5.6%) |
Income Below Poverty Among Single-Parent Households in Silverton
According to the poverty data in Silverton, 3.6% or 8 single-father households and 5.2% or 24 single-mother households are living below the poverty line. Among single-father households, those with 1 or 2 children have the highest poverty rate, with 8 households (6.2%) experiencing poverty. Likewise, among single-mother households, those with 3 or 4 children have the highest poverty rate, with 7 households (23.3%) falling below the poverty line.
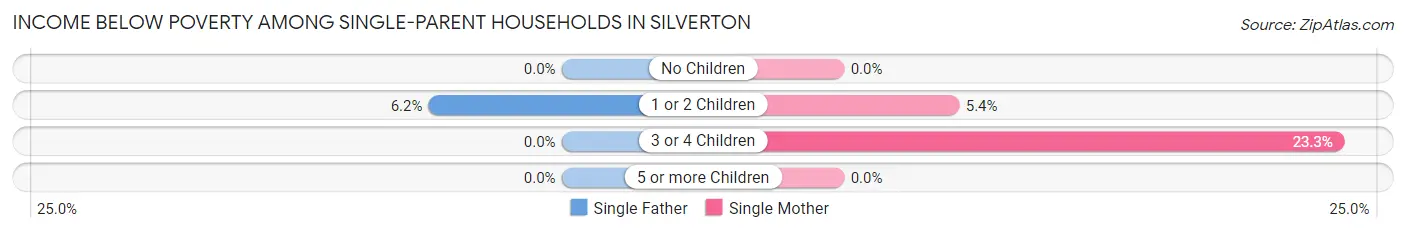
| Children | Single Father | Single Mother |
| No Children | 0 (0.0%) | 0 (0.0%) |
| 1 or 2 Children | 8 (6.2%) | 17 (5.4%) |
| 3 or 4 Children | 0 (0.0%) | 7 (23.3%) |
| 5 or more Children | 0 (0.0%) | 0 (0.0%) |
| Total | 8 (3.6%) | 24 (5.2%) |
Income Below Poverty Among Married-Couple vs Single-Parent Households in Silverton
The poverty data for Silverton shows that 105 of the married-couple family households (5.6%) and 32 of the single-parent households (4.7%) are living below the poverty level. Within the married-couple family households, those with 5 or more children have the highest poverty rate, with 38 households (100.0%) falling below the poverty line. Among the single-parent households, those with 3 or 4 children have the highest poverty rate, with 7 household (17.5%) living below poverty.
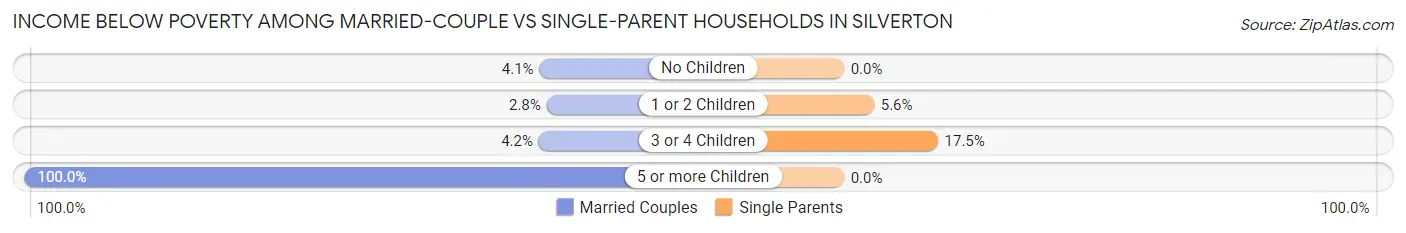
| Children | Married-Couple Families | Single-Parent Households |
| No Children | 42 (4.1%) | 0 (0.0%) |
| 1 or 2 Children | 17 (2.8%) | 25 (5.6%) |
| 3 or 4 Children | 8 (4.2%) | 7 (17.5%) |
| 5 or more Children | 38 (100.0%) | 0 (0.0%) |
| Total | 105 (5.6%) | 32 (4.7%) |
Race in Silverton
The most populous races in Silverton are White / Caucasian (8,371 | 80.2%), Hispanic or Latino (1,253 | 12.0%), and Two or more Races (1,113 | 10.7%).
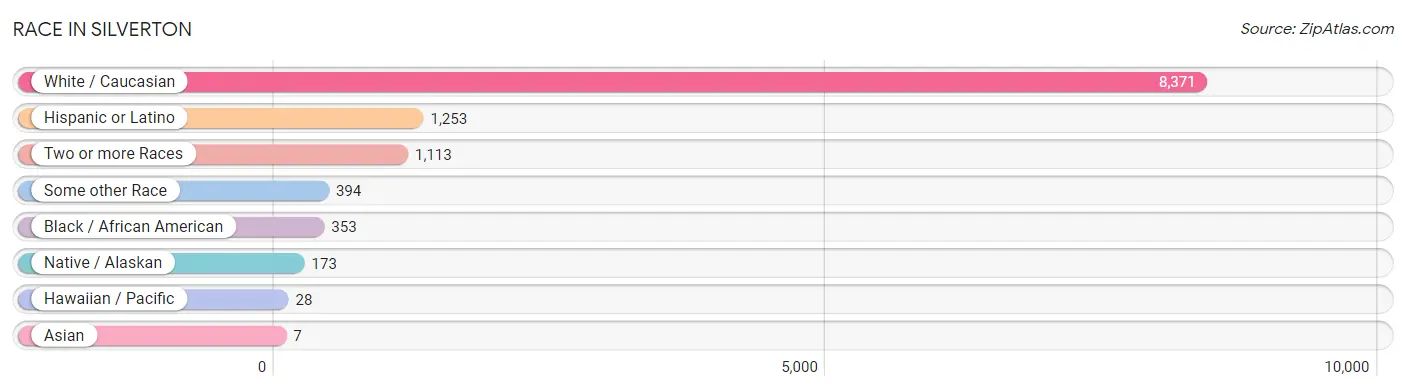
| Race | # Population | % Population |
| Asian | 7 | 0.1% |
| Black / African American | 353 | 3.4% |
| Hawaiian / Pacific | 28 | 0.3% |
| Hispanic or Latino | 1,253 | 12.0% |
| Native / Alaskan | 173 | 1.7% |
| White / Caucasian | 8,371 | 80.2% |
| Two or more Races | 1,113 | 10.7% |
| Some other Race | 394 | 3.8% |
| Total | 10,439 | 100.0% |
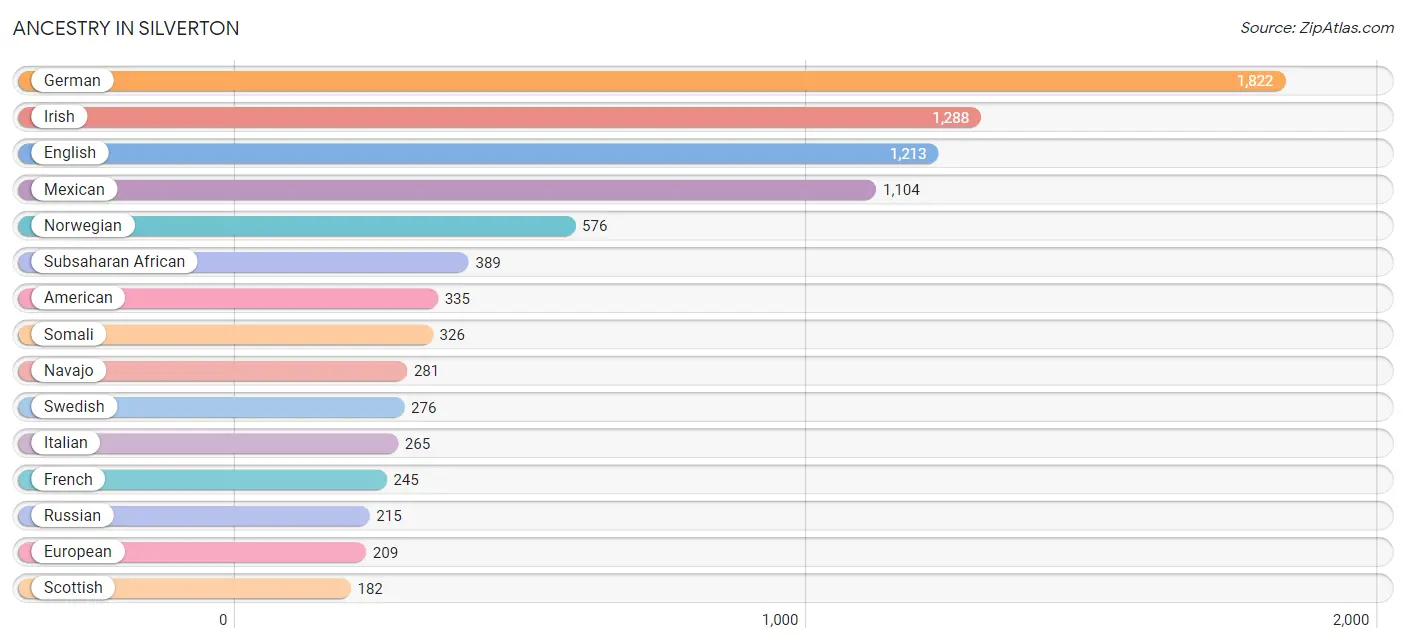
Ancestry in Silverton
The most populous ancestries reported in Silverton are German (1,822 | 17.4%), Irish (1,288 | 12.3%), English (1,213 | 11.6%), Mexican (1,104 | 10.6%), and Norwegian (576 | 5.5%), together accounting for 57.5% of all Silverton residents.
| Ancestry | # Population | % Population |
| African | 38 | 0.4% |
| American | 335 | 3.2% |
| Apache | 56 | 0.5% |
| Arab | 7 | 0.1% |
| Basque | 31 | 0.3% |
| Belgian | 7 | 0.1% |
| Bhutanese | 16 | 0.2% |
| British | 115 | 1.1% |
| Burmese | 33 | 0.3% |
| Canadian | 116 | 1.1% |
| Central American | 29 | 0.3% |
| Colombian | 12 | 0.1% |
| Costa Rican | 9 | 0.1% |
| Czech | 109 | 1.0% |
| Czechoslovakian | 16 | 0.2% |
| Danish | 107 | 1.0% |
| Delaware | 8 | 0.1% |
| Dutch | 140 | 1.3% |
| Eastern European | 39 | 0.4% |
| English | 1,213 | 11.6% |
| European | 209 | 2.0% |
| Fijian | 28 | 0.3% |
| Finnish | 13 | 0.1% |
| French | 245 | 2.4% |
| French Canadian | 42 | 0.4% |
| German | 1,822 | 17.4% |
| Greek | 7 | 0.1% |
| Guatemalan | 20 | 0.2% |
| Hungarian | 60 | 0.6% |
| Indian (Asian) | 26 | 0.3% |
| Iranian | 9 | 0.1% |
| Irish | 1,288 | 12.3% |
| Italian | 265 | 2.5% |
| Korean | 164 | 1.6% |
| Latvian | 33 | 0.3% |
| Liberian | 25 | 0.2% |
| Lithuanian | 12 | 0.1% |
| Mexican | 1,104 | 10.6% |
| Native Hawaiian | 14 | 0.1% |
| Navajo | 281 | 2.7% |
| Northern European | 26 | 0.3% |
| Norwegian | 576 | 5.5% |
| Palestinian | 7 | 0.1% |
| Polish | 109 | 1.0% |
| Portuguese | 17 | 0.2% |
| Puerto Rican | 41 | 0.4% |
| Puget Sound Salish | 16 | 0.2% |
| Russian | 215 | 2.1% |
| Scandinavian | 73 | 0.7% |
| Scotch-Irish | 67 | 0.6% |
| Scottish | 182 | 1.7% |
| Slovak | 15 | 0.1% |
| Somali | 326 | 3.1% |
| South American | 12 | 0.1% |
| Spaniard | 8 | 0.1% |
| Spanish | 41 | 0.4% |
| Subsaharan African | 389 | 3.7% |
| Swedish | 276 | 2.6% |
| Swiss | 41 | 0.4% |
| Tlingit-Haida | 31 | 0.3% |
| Ukrainian | 64 | 0.6% |
| Welsh | 47 | 0.4% | View All 62 Rows |
Immigrants in Silverton
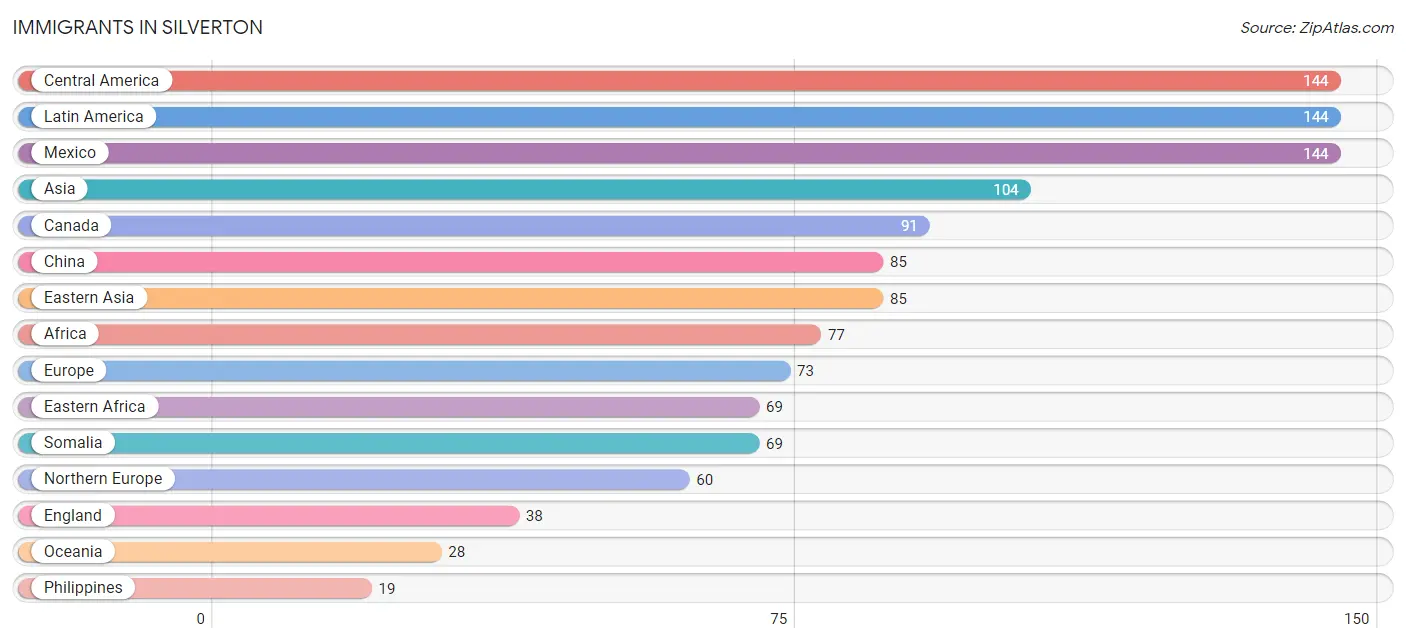
The most numerous immigrant groups reported in Silverton came from Central America (144 | 1.4%), Latin America (144 | 1.4%), Mexico (144 | 1.4%), Asia (104 | 1.0%), and Canada (91 | 0.9%), together accounting for 6.0% of all Silverton residents.
| Immigration Origin | # Population | % Population |
| Africa | 77 | 0.7% |
| Asia | 104 | 1.0% |
| Canada | 91 | 0.9% |
| Central America | 144 | 1.4% |
| China | 85 | 0.8% |
| Eastern Africa | 69 | 0.7% |
| Eastern Asia | 85 | 0.8% |
| England | 38 | 0.4% |
| Europe | 73 | 0.7% |
| Latin America | 144 | 1.4% |
| Liberia | 8 | 0.1% |
| Mexico | 144 | 1.4% |
| Netherlands | 13 | 0.1% |
| Northern Europe | 60 | 0.6% |
| Oceania | 28 | 0.3% |
| Philippines | 19 | 0.2% |
| Somalia | 69 | 0.7% |
| South Eastern Asia | 19 | 0.2% |
| Western Africa | 8 | 0.1% |
| Western Europe | 13 | 0.1% | View All 20 Rows |
Sex and Age in Silverton
Sex and Age in Silverton
The most populous age groups in Silverton are 10 to 14 Years (504 | 9.9%) for men and 55 to 59 Years (485 | 9.0%) for women.
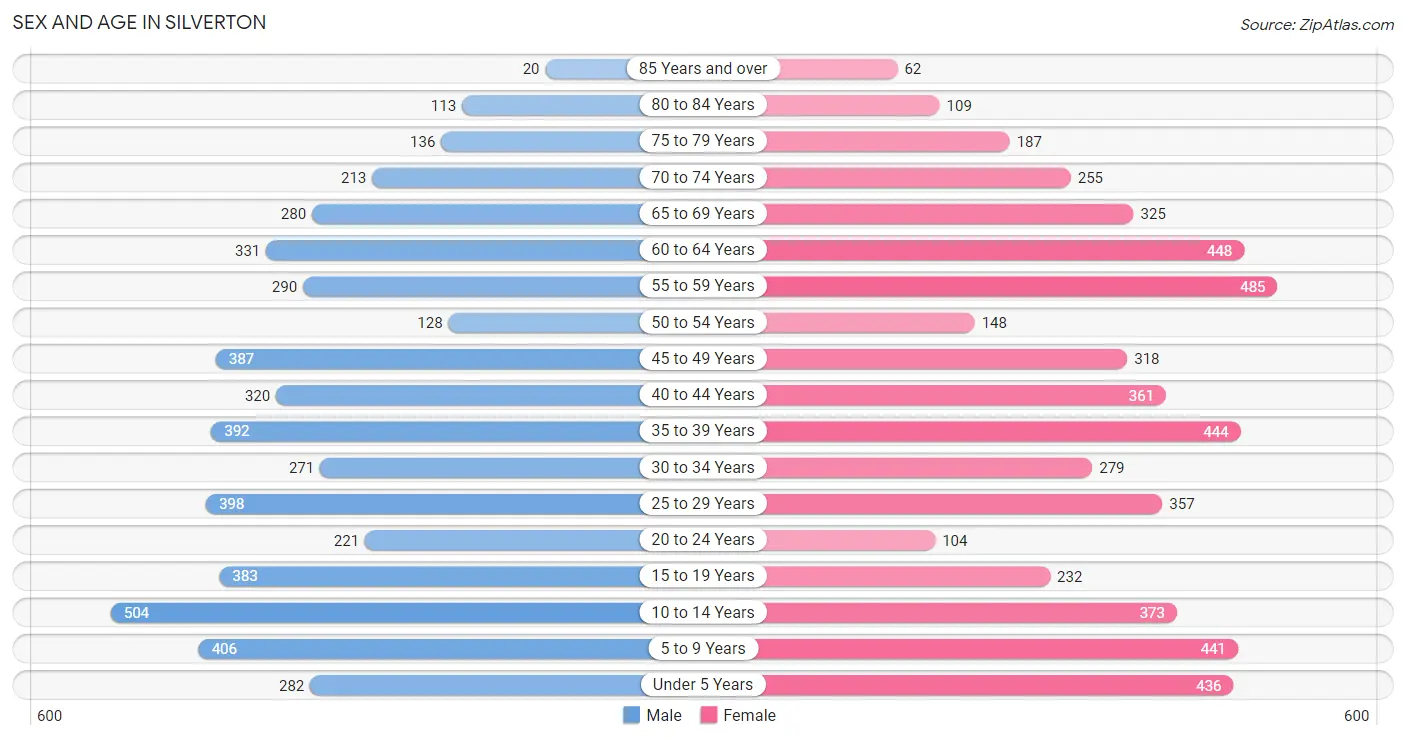
| Age Bracket | Male | Female |
| Under 5 Years | 282 (5.6%) | 436 (8.1%) |
| 5 to 9 Years | 406 (8.0%) | 441 (8.2%) |
| 10 to 14 Years | 504 (9.9%) | 373 (7.0%) |
| 15 to 19 Years | 383 (7.5%) | 232 (4.3%) |
| 20 to 24 Years | 221 (4.3%) | 104 (1.9%) |
| 25 to 29 Years | 398 (7.8%) | 357 (6.7%) |
| 30 to 34 Years | 271 (5.3%) | 279 (5.2%) |
| 35 to 39 Years | 392 (7.7%) | 444 (8.3%) |
| 40 to 44 Years | 320 (6.3%) | 361 (6.7%) |
| 45 to 49 Years | 387 (7.6%) | 318 (5.9%) |
| 50 to 54 Years | 128 (2.5%) | 148 (2.8%) |
| 55 to 59 Years | 290 (5.7%) | 485 (9.0%) |
| 60 to 64 Years | 331 (6.5%) | 448 (8.4%) |
| 65 to 69 Years | 280 (5.5%) | 325 (6.1%) |
| 70 to 74 Years | 213 (4.2%) | 255 (4.8%) |
| 75 to 79 Years | 136 (2.7%) | 187 (3.5%) |
| 80 to 84 Years | 113 (2.2%) | 109 (2.0%) |
| 85 Years and over | 20 (0.4%) | 62 (1.2%) |
| Total | 5,075 (100.0%) | 5,364 (100.0%) |
Families and Households in Silverton
Median Family Size in Silverton
The median family size in Silverton is 3.23 persons per family, with married-couple families (1,864 | 73.2%) accounting for the largest median family size of 3.43 persons per family. On the other hand, single male/father families (224 | 8.8%) represent the smallest median family size with 2.56 persons per family.
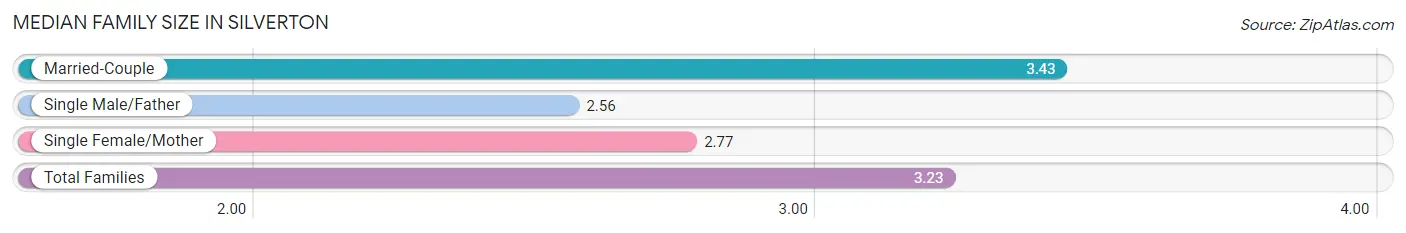
| Family Type | # Families | Family Size |
| Married-Couple | 1,864 (73.2%) | 3.43 |
| Single Male/Father | 224 (8.8%) | 2.56 |
| Single Female/Mother | 457 (18.0%) | 2.77 |
| Total Families | 2,545 (100.0%) | 3.23 |
Median Household Size in Silverton
The median household size in Silverton is 2.71 persons per household, with married-couple households (1,864 | 48.8%) accounting for the largest median household size of 3.44 persons per household. non-family households (1,273 | 33.3%) represent the smallest median household size with 1.35 persons per household.
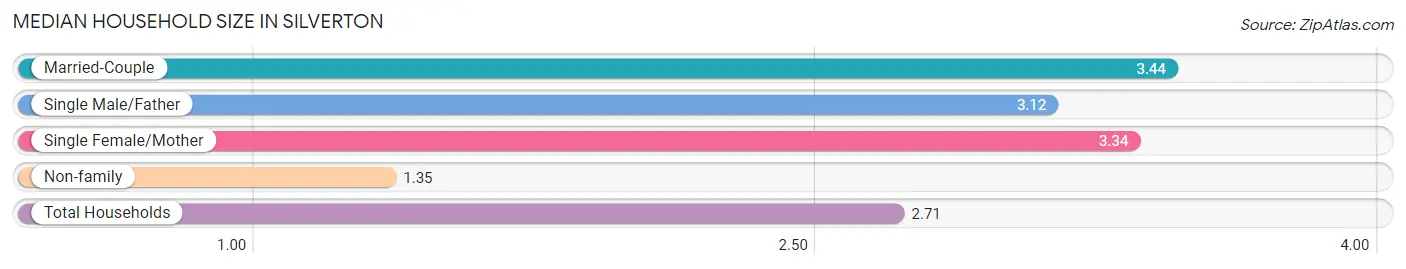
| Household Type | # Households | Household Size |
| Married-Couple | 1,864 (48.8%) | 3.44 |
| Single Male/Father | 224 (5.9%) | 3.12 |
| Single Female/Mother | 457 (12.0%) | 3.34 |
| Non-family | 1,273 (33.3%) | 1.35 |
| Total Households | 3,818 (100.0%) | 2.71 |
Household Size by Marriage Status in Silverton
Out of a total of 3,818 households in Silverton, 2,545 (66.7%) are family households, while 1,273 (33.3%) are nonfamily households. The most numerous type of family households are 2-person households, comprising 1,100, and the most common type of nonfamily households are 1-person households, comprising 1,095.
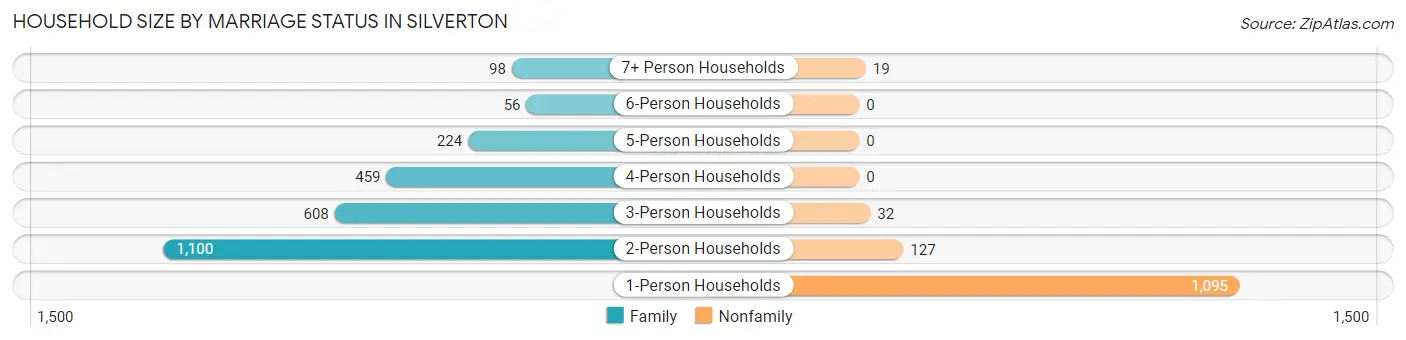
| Household Size | Family Households | Nonfamily Households |
| 1-Person Households | - | 1,095 (28.7%) |
| 2-Person Households | 1,100 (28.8%) | 127 (3.3%) |
| 3-Person Households | 608 (15.9%) | 32 (0.8%) |
| 4-Person Households | 459 (12.0%) | 0 (0.0%) |
| 5-Person Households | 224 (5.9%) | 0 (0.0%) |
| 6-Person Households | 56 (1.5%) | 0 (0.0%) |
| 7+ Person Households | 98 (2.6%) | 19 (0.5%) |
| Total | 2,545 (66.7%) | 1,273 (33.3%) |
Female Fertility in Silverton
Fertility by Age in Silverton
Average fertility rate in Silverton is 110.0 births per 1,000 women. Women in the age bracket of 20 to 34 years have the highest fertility rate with 124.0 births per 1,000 women. Women in the age bracket of 35 to 50 years acount for 60.3% of all women with births.
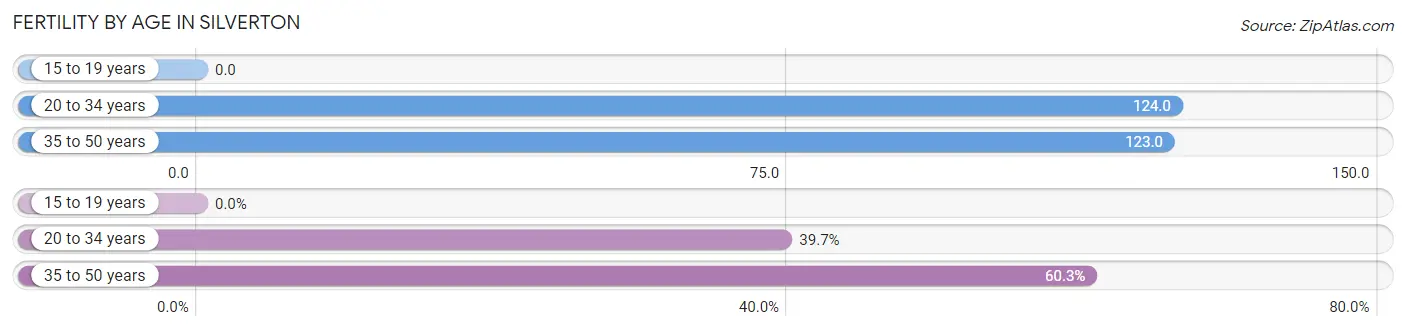
| Age Bracket | Women with Births | Births / 1,000 Women |
| 15 to 19 years | 0 (0.0%) | 0.0 |
| 20 to 34 years | 92 (39.7%) | 124.0 |
| 35 to 50 years | 140 (60.3%) | 123.0 |
| Total | 232 (100.0%) | 110.0 |
Fertility by Age by Marriage Status in Silverton
33.6% of women with births (232) in Silverton are married. The highest percentage of unmarried women with births falls into 35 to 50 years age bracket with 79.3% of them unmarried at the time of birth, while the lowest percentage of unmarried women with births belong to 20 to 34 years age bracket with 46.7% of them unmarried.
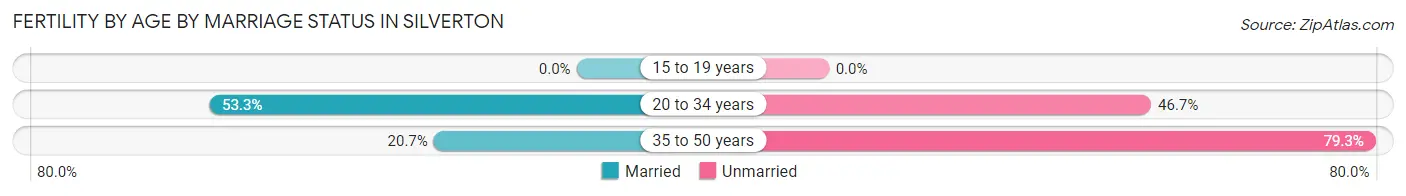
| Age Bracket | Married | Unmarried |
| 15 to 19 years | 0 (0.0%) | 0 (0.0%) |
| 20 to 34 years | 49 (53.3%) | 43 (46.7%) |
| 35 to 50 years | 29 (20.7%) | 111 (79.3%) |
| Total | 78 (33.6%) | 154 (66.4%) |
Fertility by Education in Silverton
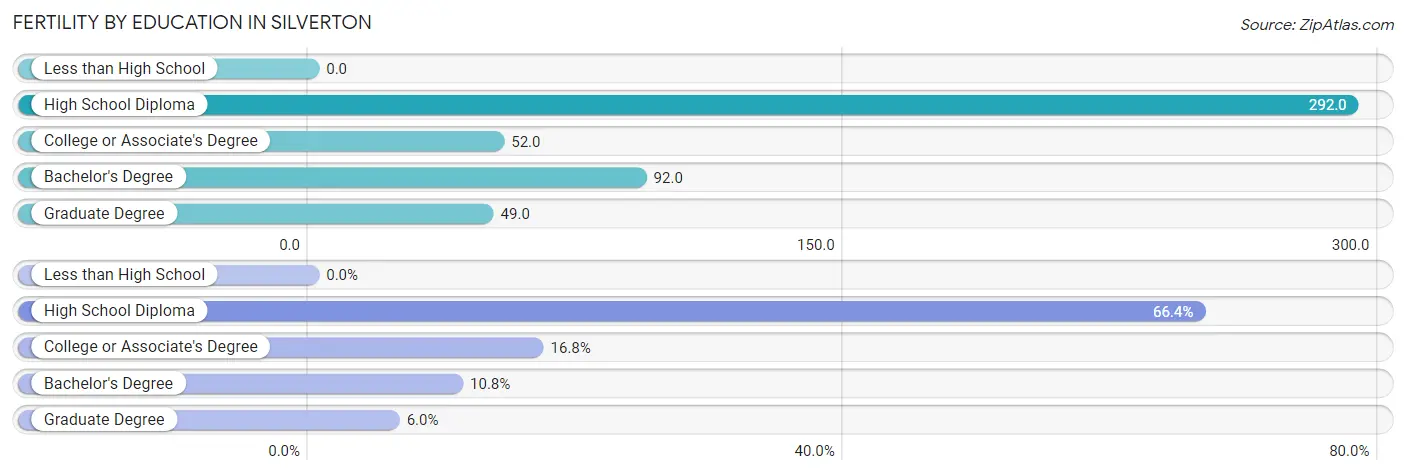
| Educational Attainment | Women with Births | Births / 1,000 Women |
| Less than High School | 0 (0.0%) | 0.0 |
| High School Diploma | 154 (66.4%) | 292.0 |
| College or Associate's Degree | 39 (16.8%) | 52.0 |
| Bachelor's Degree | 25 (10.8%) | 92.0 |
| Graduate Degree | 14 (6.0%) | 49.0 |
| Total | 232 (100.0%) | 110.0 |
Fertility by Education by Marriage Status in Silverton
66.4% of women with births in Silverton are unmarried. Women with the educational attainment of college or associate's degree are most likely to be married with 100.0% of them married at childbirth, while women with the educational attainment of high school diploma are least likely to be married with 100.0% of them unmarried at childbirth.
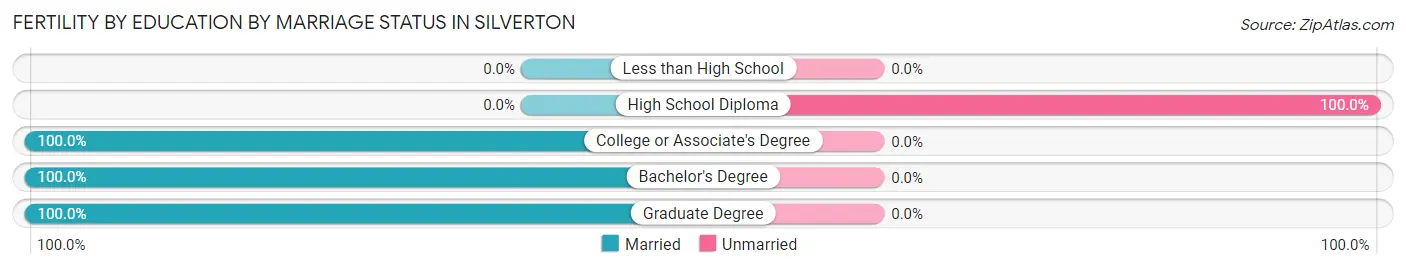
| Educational Attainment | Married | Unmarried |
| Less than High School | 0 (0.0%) | 0 (0.0%) |
| High School Diploma | 0 (0.0%) | 154 (100.0%) |
| College or Associate's Degree | 39 (100.0%) | 0 (0.0%) |
| Bachelor's Degree | 25 (100.0%) | 0 (0.0%) |
| Graduate Degree | 14 (100.0%) | 0 (0.0%) |
| Total | 78 (33.6%) | 154 (66.4%) |
Employment Characteristics in Silverton
Employment by Class of Employer in Silverton
Among the 4,529 employed individuals in Silverton, private company employees (2,531 | 55.9%), local government employees (635 | 14.0%), and not-for-profit organizations (489 | 10.8%) make up the most common classes of employment.
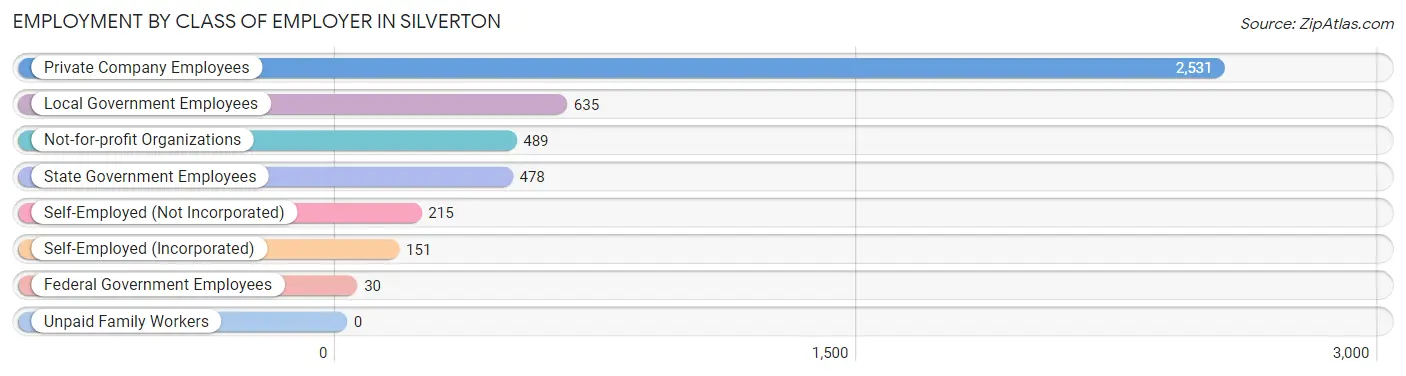
| Employer Class | # Employees | % Employees |
| Private Company Employees | 2,531 | 55.9% |
| Self-Employed (Incorporated) | 151 | 3.3% |
| Self-Employed (Not Incorporated) | 215 | 4.8% |
| Not-for-profit Organizations | 489 | 10.8% |
| Local Government Employees | 635 | 14.0% |
| State Government Employees | 478 | 10.5% |
| Federal Government Employees | 30 | 0.7% |
| Unpaid Family Workers | 0 | 0.0% |
| Total | 4,529 | 100.0% |
Employment Status by Age in Silverton
According to the labor force statistics for Silverton, out of the total population over 16 years of age (7,866), 61.8% or 4,861 individuals are in the labor force, with 5.7% or 277 of them unemployed. The age group with the highest labor force participation rate is 25 to 29 years, with 91.0% or 687 individuals in the labor force. Within the labor force, the 20 to 24 years age range has the highest percentage of unemployed individuals, with 47.7% or 115 of them being unemployed.
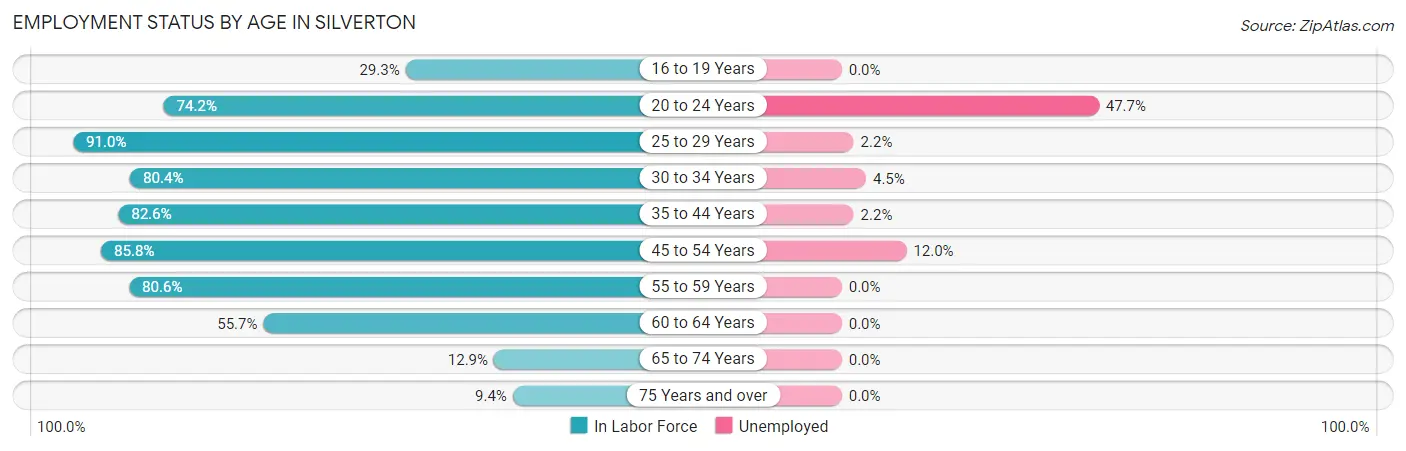
| Age Bracket | In Labor Force | Unemployed |
| 16 to 19 Years | 142 (29.3%) | 0 (0.0%) |
| 20 to 24 Years | 241 (74.2%) | 115 (47.7%) |
| 25 to 29 Years | 687 (91.0%) | 15 (2.2%) |
| 30 to 34 Years | 442 (80.4%) | 20 (4.5%) |
| 35 to 44 Years | 1,253 (82.6%) | 28 (2.2%) |
| 45 to 54 Years | 842 (85.8%) | 101 (12.0%) |
| 55 to 59 Years | 625 (80.6%) | 0 (0.0%) |
| 60 to 64 Years | 434 (55.7%) | 0 (0.0%) |
| 65 to 74 Years | 138 (12.9%) | 0 (0.0%) |
| 75 Years and over | 59 (9.4%) | 0 (0.0%) |
| Total | 4,861 (61.8%) | 277 (5.7%) |
Employment Status by Educational Attainment in Silverton
According to labor force statistics for Silverton, 80.0% of individuals (4,286) out of the total population between 25 and 64 years of age (5,357) are in the labor force, with 3.8% or 163 of them being unemployed. The group with the highest labor force participation rate are those with the educational attainment of college / associate degree, with 89.6% or 1,771 individuals in the labor force. Within the labor force, individuals with high school diploma education have the highest percentage of unemployment, with 6.1% or 60 of them being unemployed.
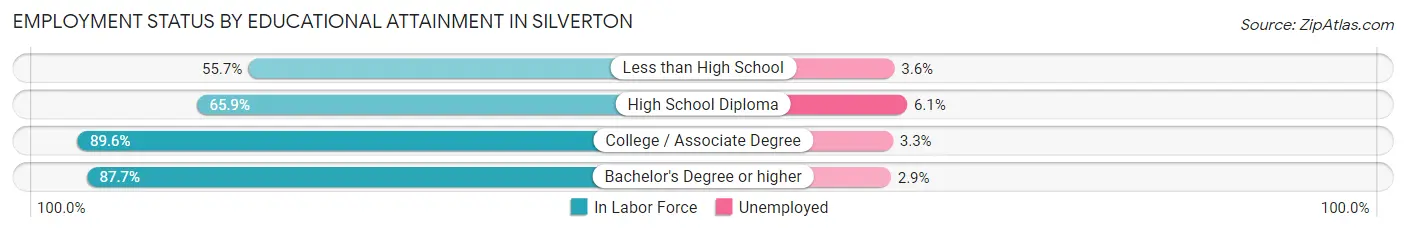
| Educational Attainment | In Labor Force | Unemployed |
| Less than High School | 220 (55.7%) | 14 (3.6%) |
| High School Diploma | 987 (65.9%) | 91 (6.1%) |
| College / Associate Degree | 1,771 (89.6%) | 65 (3.3%) |
| Bachelor's Degree or higher | 1,305 (87.7%) | 43 (2.9%) |
| Total | 4,286 (80.0%) | 204 (3.8%) |
Employment Occupations by Sex in Silverton
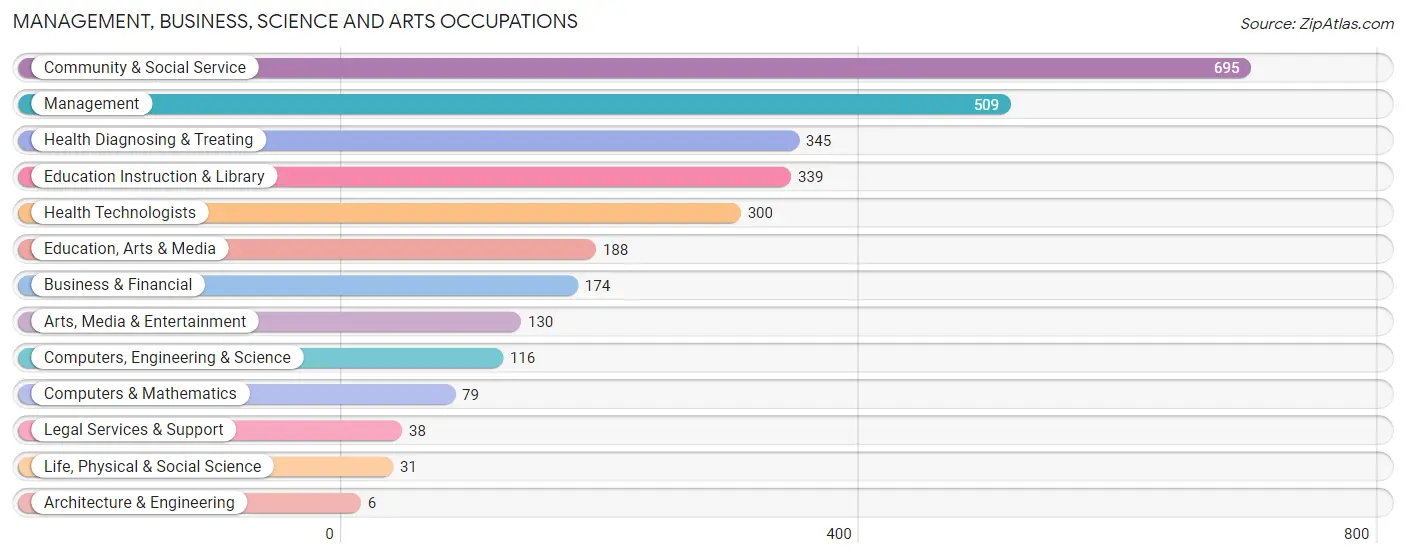
Management, Business, Science and Arts Occupations
The most common Management, Business, Science and Arts occupations in Silverton are Community & Social Service (695 | 15.2%), Management (509 | 11.1%), Health Diagnosing & Treating (345 | 7.5%), Education Instruction & Library (339 | 7.4%), and Health Technologists (300 | 6.5%).
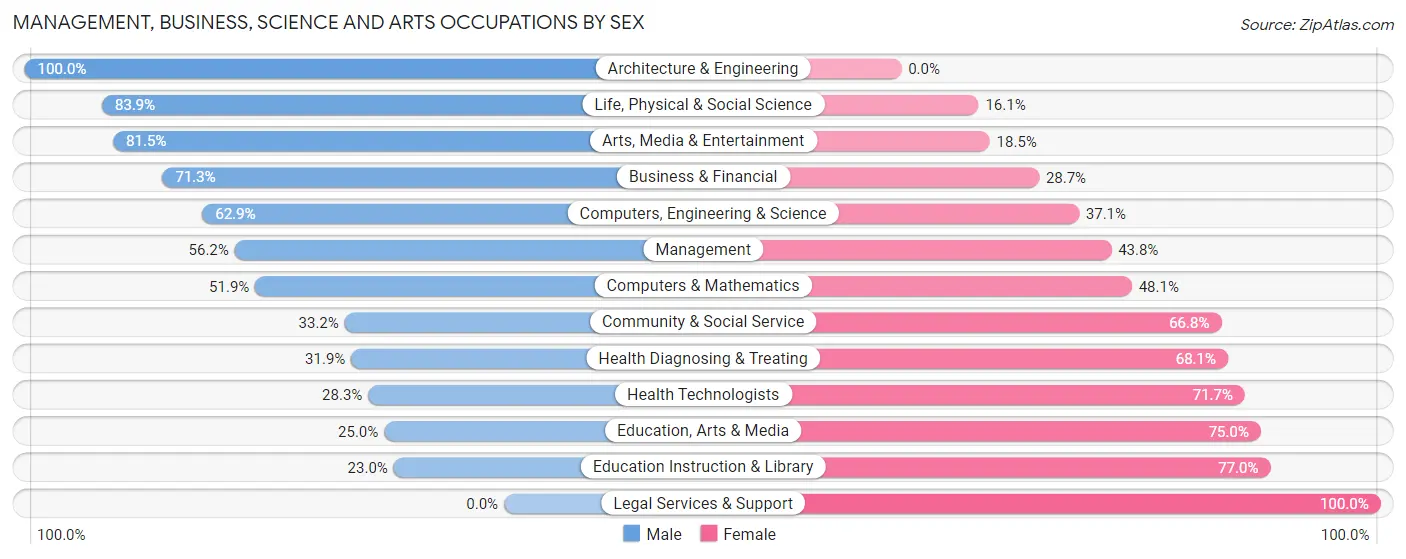
Management, Business, Science and Arts Occupations by Sex
Within the Management, Business, Science and Arts occupations in Silverton, the most male-oriented occupations are Architecture & Engineering (100.0%), Life, Physical & Social Science (83.9%), and Arts, Media & Entertainment (81.5%), while the most female-oriented occupations are Legal Services & Support (100.0%), Education Instruction & Library (77.0%), and Education, Arts & Media (75.0%).
| Occupation | Male | Female |
| Management | 286 (56.2%) | 223 (43.8%) |
| Business & Financial | 124 (71.3%) | 50 (28.7%) |
| Computers, Engineering & Science | 73 (62.9%) | 43 (37.1%) |
| Computers & Mathematics | 41 (51.9%) | 38 (48.1%) |
| Architecture & Engineering | 6 (100.0%) | 0 (0.0%) |
| Life, Physical & Social Science | 26 (83.9%) | 5 (16.1%) |
| Community & Social Service | 231 (33.2%) | 464 (66.8%) |
| Education, Arts & Media | 47 (25.0%) | 141 (75.0%) |
| Legal Services & Support | 0 (0.0%) | 38 (100.0%) |
| Education Instruction & Library | 78 (23.0%) | 261 (77.0%) |
| Arts, Media & Entertainment | 106 (81.5%) | 24 (18.5%) |
| Health Diagnosing & Treating | 110 (31.9%) | 235 (68.1%) |
| Health Technologists | 85 (28.3%) | 215 (71.7%) |
| Total (Category) | 824 (44.8%) | 1,015 (55.2%) |
| Total (Overall) | 2,314 (50.5%) | 2,270 (49.5%) |
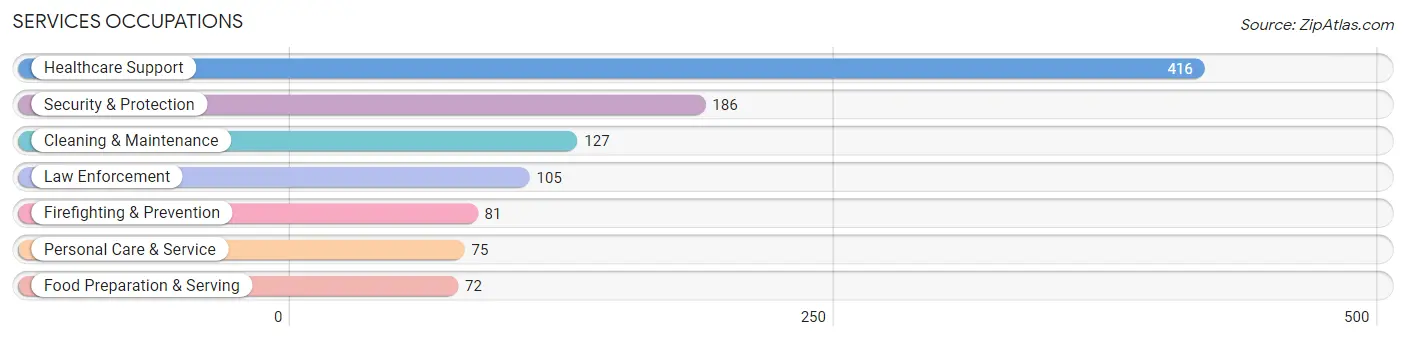
Services Occupations
The most common Services occupations in Silverton are Healthcare Support (416 | 9.1%), Security & Protection (186 | 4.1%), Cleaning & Maintenance (127 | 2.8%), Law Enforcement (105 | 2.3%), and Firefighting & Prevention (81 | 1.8%).
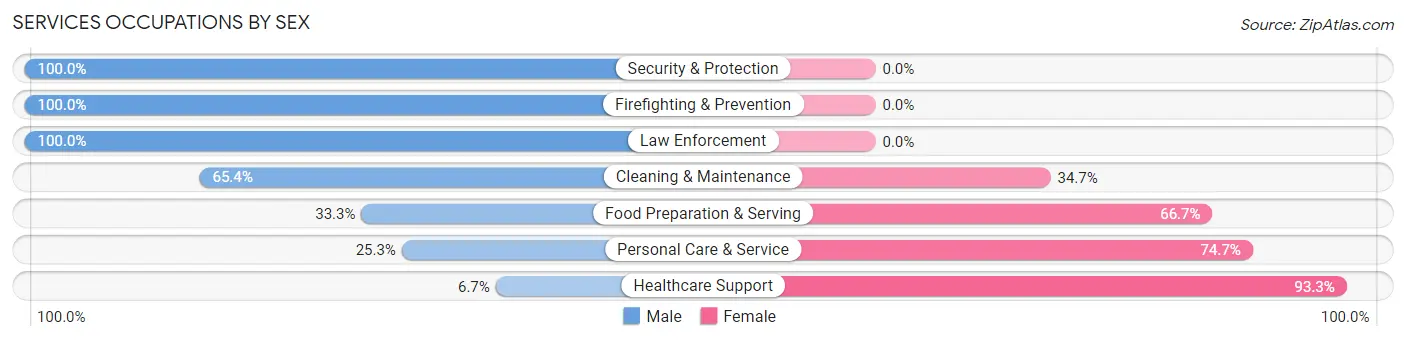
Services Occupations by Sex
Within the Services occupations in Silverton, the most male-oriented occupations are Security & Protection (100.0%), Firefighting & Prevention (100.0%), and Law Enforcement (100.0%), while the most female-oriented occupations are Healthcare Support (93.3%), Personal Care & Service (74.7%), and Food Preparation & Serving (66.7%).
| Occupation | Male | Female |
| Healthcare Support | 28 (6.7%) | 388 (93.3%) |
| Security & Protection | 186 (100.0%) | 0 (0.0%) |
| Firefighting & Prevention | 81 (100.0%) | 0 (0.0%) |
| Law Enforcement | 105 (100.0%) | 0 (0.0%) |
| Food Preparation & Serving | 24 (33.3%) | 48 (66.7%) |
| Cleaning & Maintenance | 83 (65.3%) | 44 (34.6%) |
| Personal Care & Service | 19 (25.3%) | 56 (74.7%) |
| Total (Category) | 340 (38.8%) | 536 (61.2%) |
| Total (Overall) | 2,314 (50.5%) | 2,270 (49.5%) |
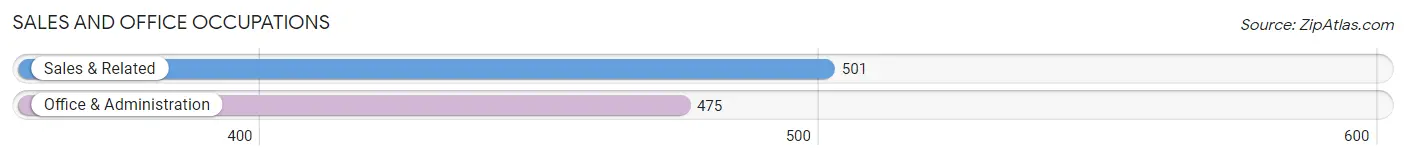
Sales and Office Occupations
The most common Sales and Office occupations in Silverton are Sales & Related (501 | 10.9%), and Office & Administration (475 | 10.4%).
Sales and Office Occupations by Sex
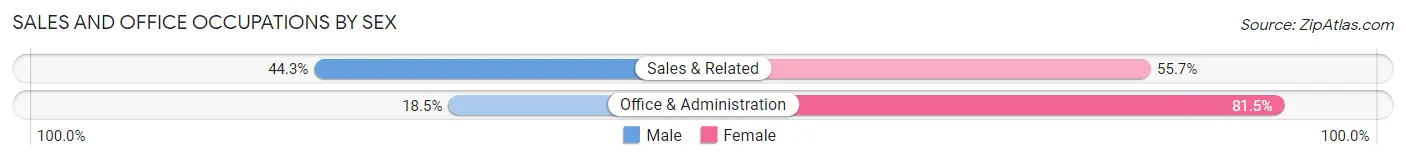
| Occupation | Male | Female |
| Sales & Related | 222 (44.3%) | 279 (55.7%) |
| Office & Administration | 88 (18.5%) | 387 (81.5%) |
| Total (Category) | 310 (31.8%) | 666 (68.2%) |
| Total (Overall) | 2,314 (50.5%) | 2,270 (49.5%) |
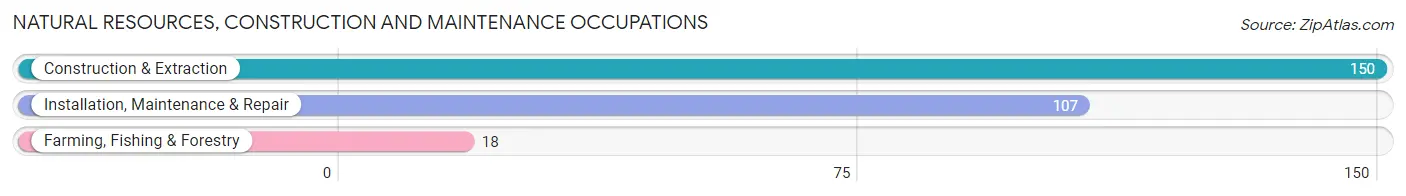
Natural Resources, Construction and Maintenance Occupations
The most common Natural Resources, Construction and Maintenance occupations in Silverton are Construction & Extraction (150 | 3.3%), Installation, Maintenance & Repair (107 | 2.3%), and Farming, Fishing & Forestry (18 | 0.4%).
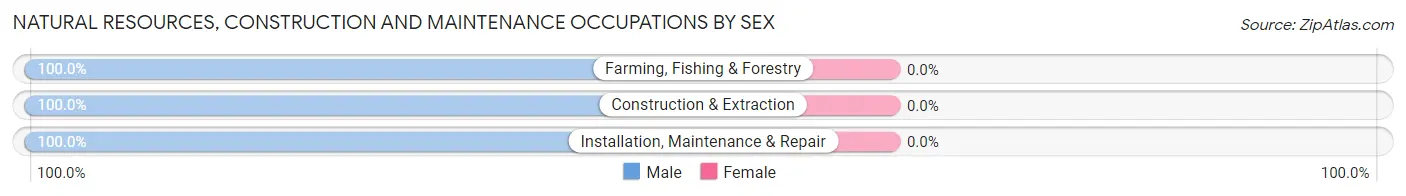
Natural Resources, Construction and Maintenance Occupations by Sex
| Occupation | Male | Female |
| Farming, Fishing & Forestry | 18 (100.0%) | 0 (0.0%) |
| Construction & Extraction | 150 (100.0%) | 0 (0.0%) |
| Installation, Maintenance & Repair | 107 (100.0%) | 0 (0.0%) |
| Total (Category) | 275 (100.0%) | 0 (0.0%) |
| Total (Overall) | 2,314 (50.5%) | 2,270 (49.5%) |
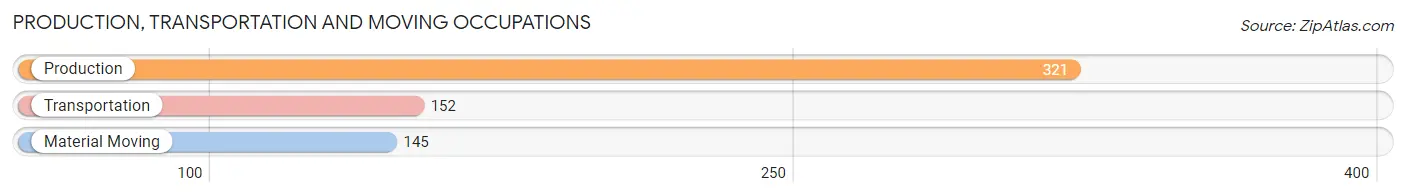
Production, Transportation and Moving Occupations
The most common Production, Transportation and Moving occupations in Silverton are Production (321 | 7.0%), Transportation (152 | 3.3%), and Material Moving (145 | 3.2%).
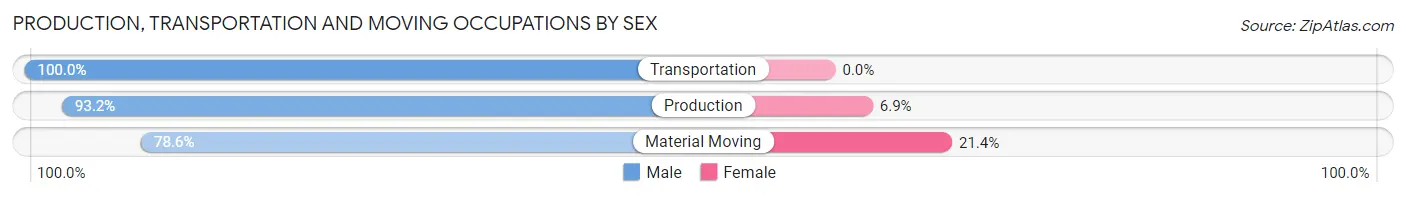
Production, Transportation and Moving Occupations by Sex
| Occupation | Male | Female |
| Production | 299 (93.1%) | 22 (6.9%) |
| Transportation | 152 (100.0%) | 0 (0.0%) |
| Material Moving | 114 (78.6%) | 31 (21.4%) |
| Total (Category) | 565 (91.4%) | 53 (8.6%) |
| Total (Overall) | 2,314 (50.5%) | 2,270 (49.5%) |
Employment Industries by Sex in Silverton
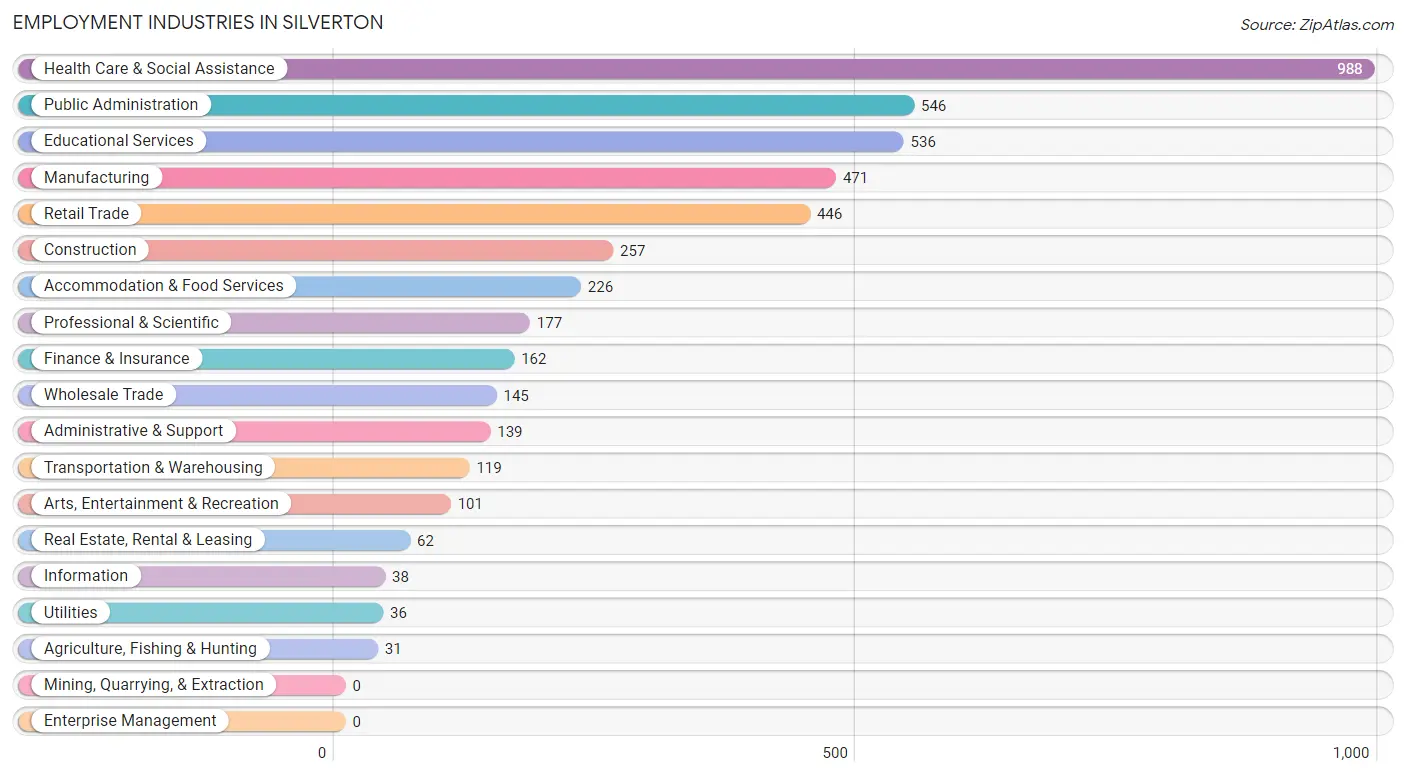
Employment Industries in Silverton
The major employment industries in Silverton include Health Care & Social Assistance (988 | 21.5%), Public Administration (546 | 11.9%), Educational Services (536 | 11.7%), Manufacturing (471 | 10.3%), and Retail Trade (446 | 9.7%).
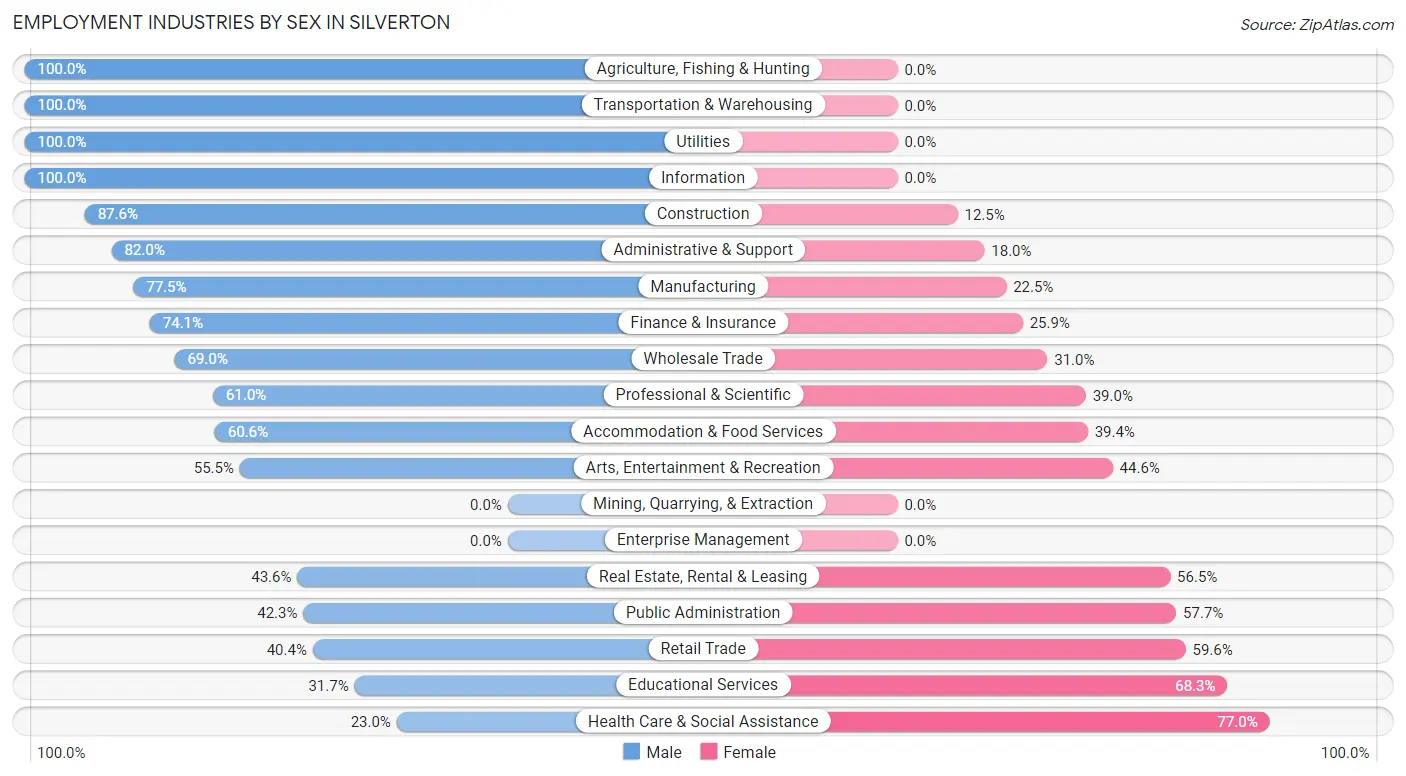
Employment Industries by Sex in Silverton
The Silverton industries that see more men than women are Agriculture, Fishing & Hunting (100.0%), Transportation & Warehousing (100.0%), and Utilities (100.0%), whereas the industries that tend to have a higher number of women are Health Care & Social Assistance (77.0%), Educational Services (68.3%), and Retail Trade (59.6%).
| Industry | Male | Female |
| Agriculture, Fishing & Hunting | 31 (100.0%) | 0 (0.0%) |
| Mining, Quarrying, & Extraction | 0 (0.0%) | 0 (0.0%) |
| Construction | 225 (87.5%) | 32 (12.4%) |
| Manufacturing | 365 (77.5%) | 106 (22.5%) |
| Wholesale Trade | 100 (69.0%) | 45 (31.0%) |
| Retail Trade | 180 (40.4%) | 266 (59.6%) |
| Transportation & Warehousing | 119 (100.0%) | 0 (0.0%) |
| Utilities | 36 (100.0%) | 0 (0.0%) |
| Information | 38 (100.0%) | 0 (0.0%) |
| Finance & Insurance | 120 (74.1%) | 42 (25.9%) |
| Real Estate, Rental & Leasing | 27 (43.5%) | 35 (56.5%) |
| Professional & Scientific | 108 (61.0%) | 69 (39.0%) |
| Enterprise Management | 0 (0.0%) | 0 (0.0%) |
| Administrative & Support | 114 (82.0%) | 25 (18.0%) |
| Educational Services | 170 (31.7%) | 366 (68.3%) |
| Health Care & Social Assistance | 227 (23.0%) | 761 (77.0%) |
| Arts, Entertainment & Recreation | 56 (55.4%) | 45 (44.6%) |
| Accommodation & Food Services | 137 (60.6%) | 89 (39.4%) |
| Public Administration | 231 (42.3%) | 315 (57.7%) |
| Total | 2,314 (50.5%) | 2,270 (49.5%) |
Education in Silverton
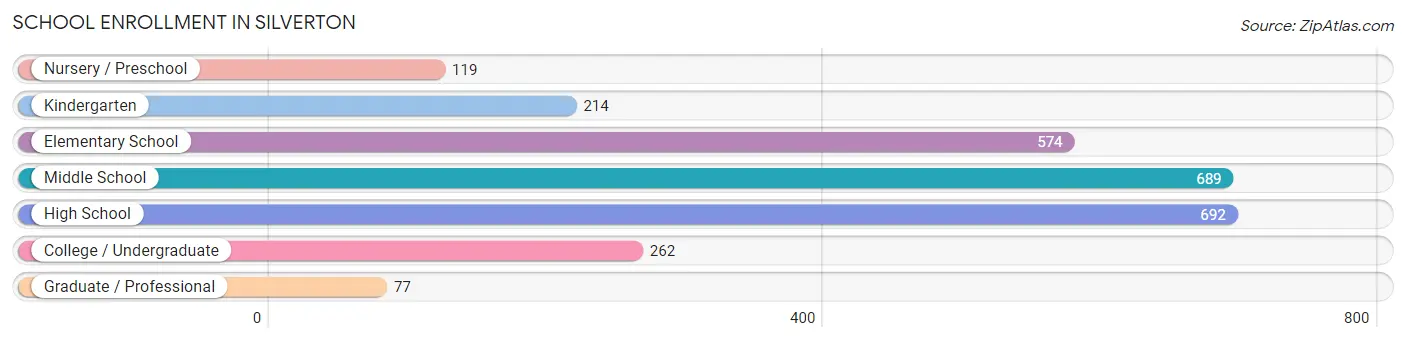
School Enrollment in Silverton
The most common levels of schooling among the 2,627 students in Silverton are high school (692 | 26.3%), middle school (689 | 26.2%), and elementary school (574 | 21.8%).
| School Level | # Students | % Students |
| Nursery / Preschool | 119 | 4.5% |
| Kindergarten | 214 | 8.2% |
| Elementary School | 574 | 21.8% |
| Middle School | 689 | 26.2% |
| High School | 692 | 26.3% |
| College / Undergraduate | 262 | 10.0% |
| Graduate / Professional | 77 | 2.9% |
| Total | 2,627 | 100.0% |
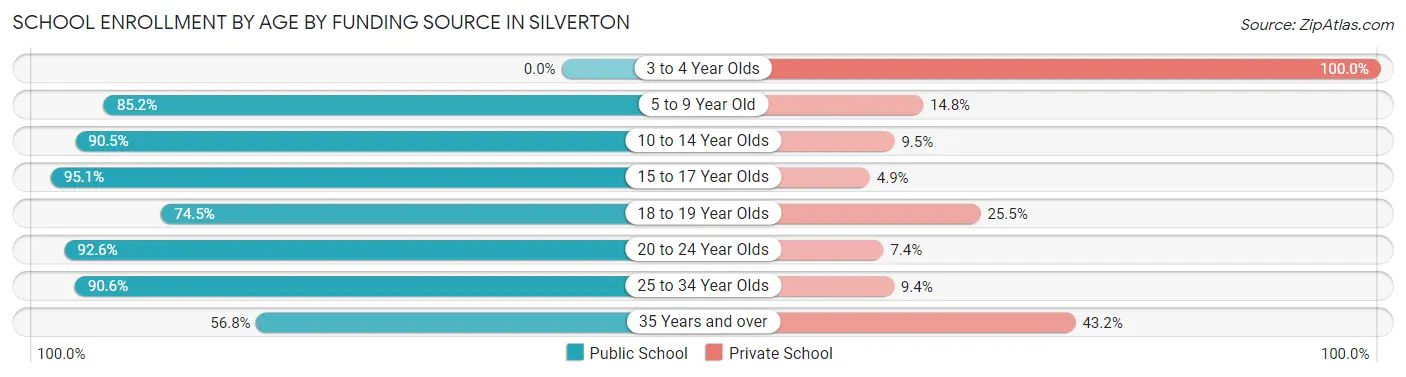
School Enrollment by Age by Funding Source in Silverton
Out of a total of 2,627 students who are enrolled in schools in Silverton, 407 (15.5%) attend a private institution, while the remaining 2,220 (84.5%) are enrolled in public schools. The age group of 3 to 4 year olds has the highest likelihood of being enrolled in private schools, with 76 (100.0% in the age bracket) enrolled. Conversely, the age group of 15 to 17 year olds has the lowest likelihood of being enrolled in a private school, with 409 (95.1% in the age bracket) attending a public institution.
| Age Bracket | Public School | Private School |
| 3 to 4 Year Olds | 0 (0.0%) | 76 (100.0%) |
| 5 to 9 Year Old | 675 (85.2%) | 117 (14.8%) |
| 10 to 14 Year Olds | 794 (90.5%) | 83 (9.5%) |
| 15 to 17 Year Olds | 409 (95.1%) | 21 (4.9%) |
| 18 to 19 Year Olds | 38 (74.5%) | 13 (25.5%) |
| 20 to 24 Year Olds | 50 (92.6%) | 4 (7.4%) |
| 25 to 34 Year Olds | 155 (90.6%) | 16 (9.4%) |
| 35 Years and over | 100 (56.8%) | 76 (43.2%) |
| Total | 2,220 (84.5%) | 407 (15.5%) |
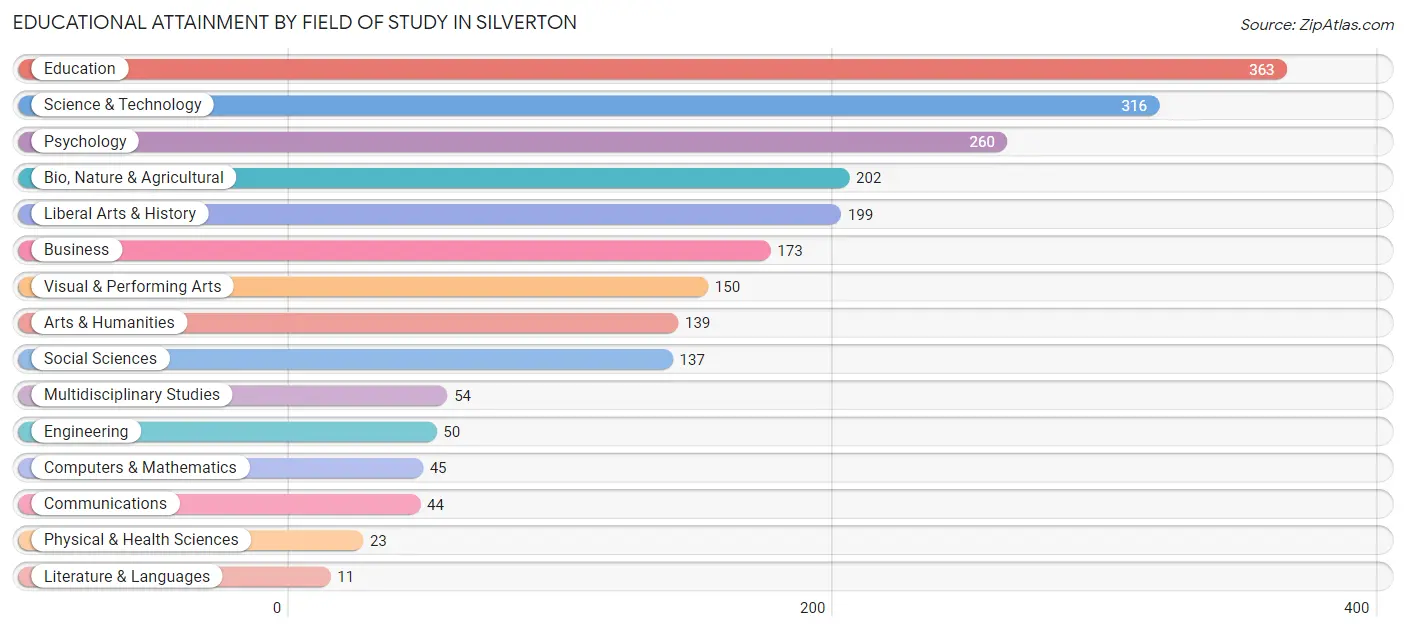
Educational Attainment by Field of Study in Silverton
Education (363 | 16.8%), science & technology (316 | 14.6%), psychology (260 | 12.0%), bio, nature & agricultural (202 | 9.3%), and liberal arts & history (199 | 9.2%) are the most common fields of study among 2,166 individuals in Silverton who have obtained a bachelor's degree or higher.
| Field of Study | # Graduates | % Graduates |
| Computers & Mathematics | 45 | 2.1% |
| Bio, Nature & Agricultural | 202 | 9.3% |
| Physical & Health Sciences | 23 | 1.1% |
| Psychology | 260 | 12.0% |
| Social Sciences | 137 | 6.3% |
| Engineering | 50 | 2.3% |
| Multidisciplinary Studies | 54 | 2.5% |
| Science & Technology | 316 | 14.6% |
| Business | 173 | 8.0% |
| Education | 363 | 16.8% |
| Literature & Languages | 11 | 0.5% |
| Liberal Arts & History | 199 | 9.2% |
| Visual & Performing Arts | 150 | 6.9% |
| Communications | 44 | 2.0% |
| Arts & Humanities | 139 | 6.4% |
| Total | 2,166 | 100.0% |
Transportation & Commute in Silverton
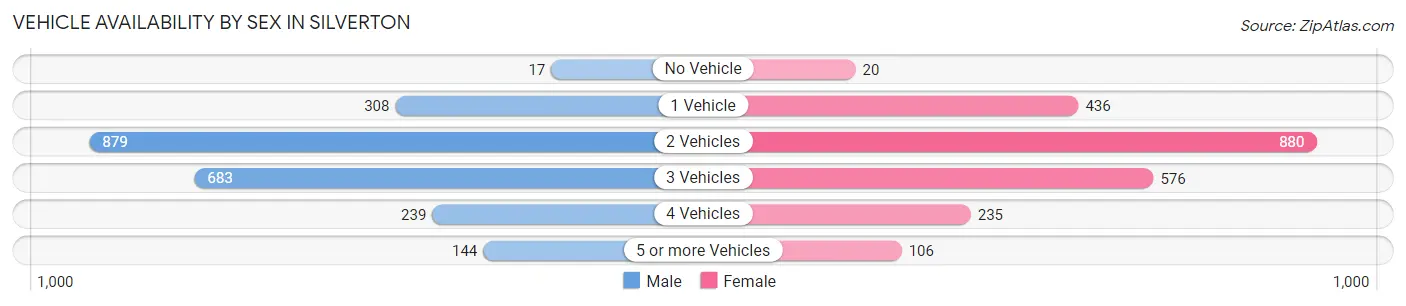
Vehicle Availability by Sex in Silverton
The most prevalent vehicle ownership categories in Silverton are males with 2 vehicles (879, accounting for 38.7%) and females with 2 vehicles (880, making up 39.0%).
| Vehicles Available | Male | Female |
| No Vehicle | 17 (0.7%) | 20 (0.9%) |
| 1 Vehicle | 308 (13.6%) | 436 (19.4%) |
| 2 Vehicles | 879 (38.7%) | 880 (39.1%) |
| 3 Vehicles | 683 (30.1%) | 576 (25.6%) |
| 4 Vehicles | 239 (10.5%) | 235 (10.4%) |
| 5 or more Vehicles | 144 (6.3%) | 106 (4.7%) |
| Total | 2,270 (100.0%) | 2,253 (100.0%) |
Commute Time in Silverton
The most frequently occuring commute durations in Silverton are 30 to 34 minutes (619 commuters, 15.9%), 5 to 9 minutes (545 commuters, 14.0%), and 10 to 14 minutes (510 commuters, 13.1%).
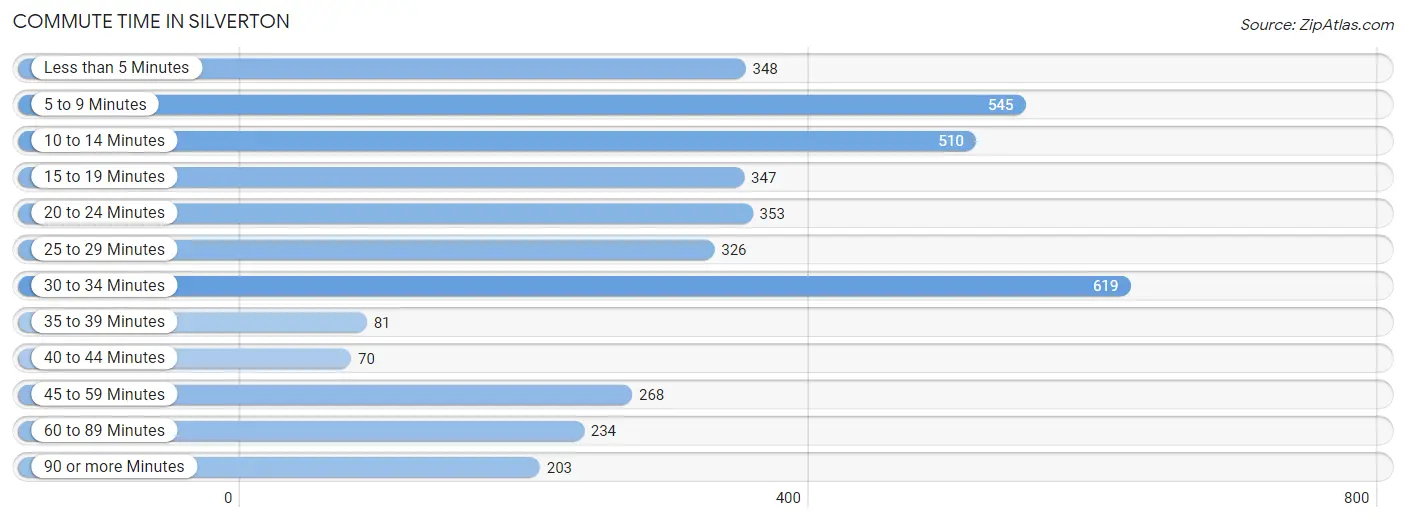
| Commute Time | # Commuters | % Commuters |
| Less than 5 Minutes | 348 | 8.9% |
| 5 to 9 Minutes | 545 | 14.0% |
| 10 to 14 Minutes | 510 | 13.1% |
| 15 to 19 Minutes | 347 | 8.9% |
| 20 to 24 Minutes | 353 | 9.0% |
| 25 to 29 Minutes | 326 | 8.4% |
| 30 to 34 Minutes | 619 | 15.9% |
| 35 to 39 Minutes | 81 | 2.1% |
| 40 to 44 Minutes | 70 | 1.8% |
| 45 to 59 Minutes | 268 | 6.9% |
| 60 to 89 Minutes | 234 | 6.0% |
| 90 or more Minutes | 203 | 5.2% |
Commute Time by Sex in Silverton
The most common commute times in Silverton are 10 to 14 minutes (313 commuters, 15.2%) for males and 30 to 34 minutes (393 commuters, 21.3%) for females.
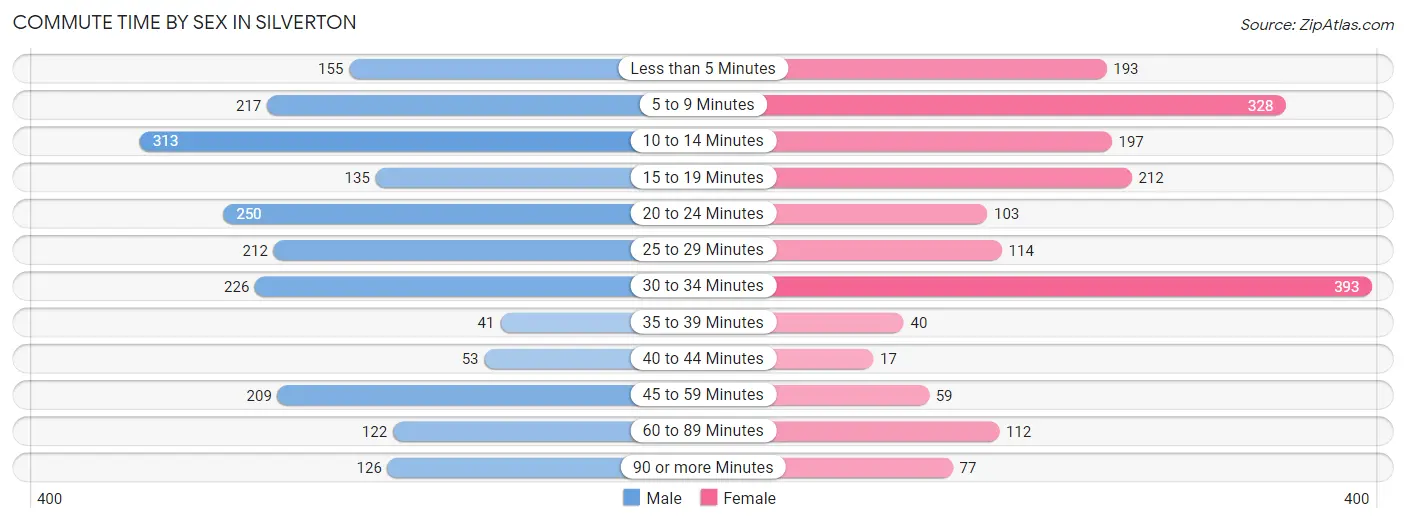
| Commute Time | Male | Female |
| Less than 5 Minutes | 155 (7.5%) | 193 (10.5%) |
| 5 to 9 Minutes | 217 (10.5%) | 328 (17.8%) |
| 10 to 14 Minutes | 313 (15.2%) | 197 (10.7%) |
| 15 to 19 Minutes | 135 (6.6%) | 212 (11.5%) |
| 20 to 24 Minutes | 250 (12.1%) | 103 (5.6%) |
| 25 to 29 Minutes | 212 (10.3%) | 114 (6.2%) |
| 30 to 34 Minutes | 226 (11.0%) | 393 (21.3%) |
| 35 to 39 Minutes | 41 (2.0%) | 40 (2.2%) |
| 40 to 44 Minutes | 53 (2.6%) | 17 (0.9%) |
| 45 to 59 Minutes | 209 (10.2%) | 59 (3.2%) |
| 60 to 89 Minutes | 122 (5.9%) | 112 (6.1%) |
| 90 or more Minutes | 126 (6.1%) | 77 (4.2%) |
Time of Departure to Work by Sex in Silverton
The most frequent times of departure to work in Silverton are 5:00 AM to 5:29 AM (322, 15.6%) for males and 7:00 AM to 7:29 AM (439, 23.8%) for females.
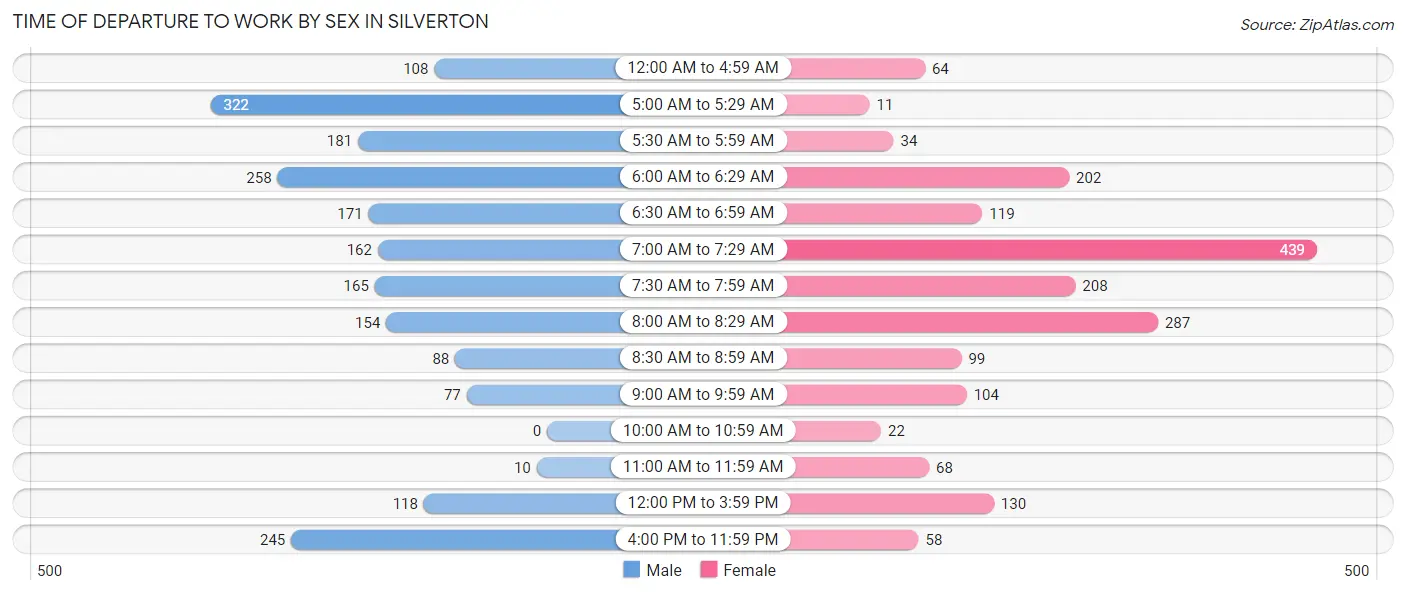
| Time of Departure | Male | Female |
| 12:00 AM to 4:59 AM | 108 (5.2%) | 64 (3.5%) |
| 5:00 AM to 5:29 AM | 322 (15.6%) | 11 (0.6%) |
| 5:30 AM to 5:59 AM | 181 (8.8%) | 34 (1.8%) |
| 6:00 AM to 6:29 AM | 258 (12.5%) | 202 (11.0%) |
| 6:30 AM to 6:59 AM | 171 (8.3%) | 119 (6.5%) |
| 7:00 AM to 7:29 AM | 162 (7.9%) | 439 (23.8%) |
| 7:30 AM to 7:59 AM | 165 (8.0%) | 208 (11.3%) |
| 8:00 AM to 8:29 AM | 154 (7.5%) | 287 (15.6%) |
| 8:30 AM to 8:59 AM | 88 (4.3%) | 99 (5.4%) |
| 9:00 AM to 9:59 AM | 77 (3.7%) | 104 (5.6%) |
| 10:00 AM to 10:59 AM | 0 (0.0%) | 22 (1.2%) |
| 11:00 AM to 11:59 AM | 10 (0.5%) | 68 (3.7%) |
| 12:00 PM to 3:59 PM | 118 (5.7%) | 130 (7.0%) |
| 4:00 PM to 11:59 PM | 245 (11.9%) | 58 (3.1%) |
| Total | 2,059 (100.0%) | 1,845 (100.0%) |
Housing Occupancy in Silverton
Occupancy by Ownership in Silverton
Of the total 3,818 dwellings in Silverton, owner-occupied units account for 2,295 (60.1%), while renter-occupied units make up 1,523 (39.9%).
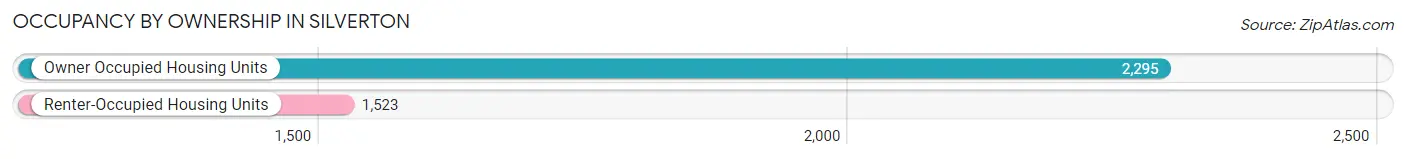
| Occupancy | # Housing Units | % Housing Units |
| Owner Occupied Housing Units | 2,295 | 60.1% |
| Renter-Occupied Housing Units | 1,523 | 39.9% |
| Total Occupied Housing Units | 3,818 | 100.0% |
Occupancy by Household Size in Silverton
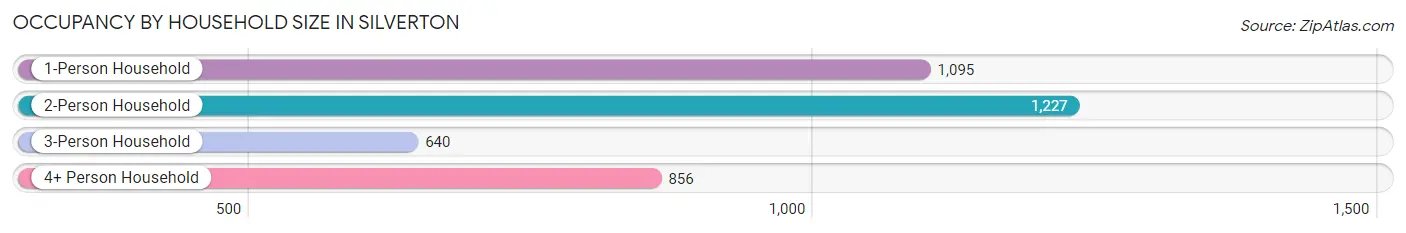
| Household Size | # Housing Units | % Housing Units |
| 1-Person Household | 1,095 | 28.7% |
| 2-Person Household | 1,227 | 32.1% |
| 3-Person Household | 640 | 16.8% |
| 4+ Person Household | 856 | 22.4% |
| Total Housing Units | 3,818 | 100.0% |
Occupancy by Ownership by Household Size in Silverton
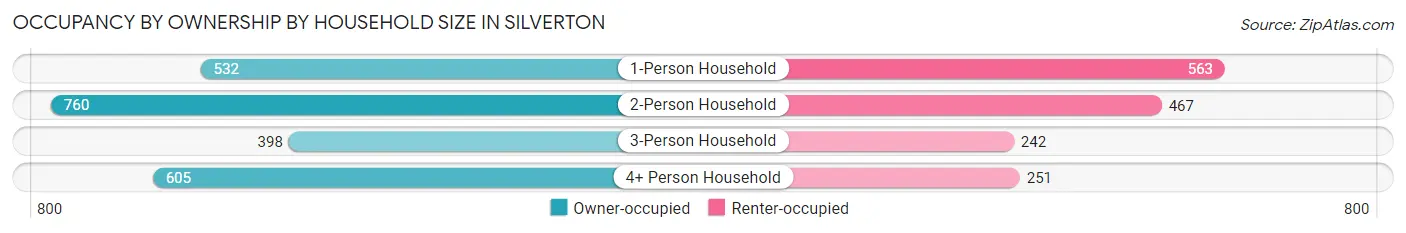
| Household Size | Owner-occupied | Renter-occupied |
| 1-Person Household | 532 (48.6%) | 563 (51.4%) |
| 2-Person Household | 760 (61.9%) | 467 (38.1%) |
| 3-Person Household | 398 (62.2%) | 242 (37.8%) |
| 4+ Person Household | 605 (70.7%) | 251 (29.3%) |
| Total Housing Units | 2,295 (60.1%) | 1,523 (39.9%) |
Occupancy by Educational Attainment in Silverton
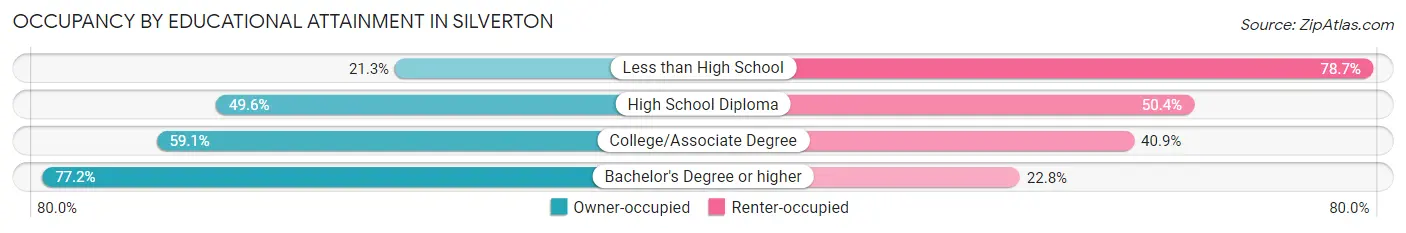
| Household Size | Owner-occupied | Renter-occupied |
| Less than High School | 44 (21.3%) | 163 (78.7%) |
| High School Diploma | 450 (49.6%) | 457 (50.4%) |
| College/Associate Degree | 934 (59.1%) | 647 (40.9%) |
| Bachelor's Degree or higher | 867 (77.2%) | 256 (22.8%) |
Occupancy by Age of Householder in Silverton
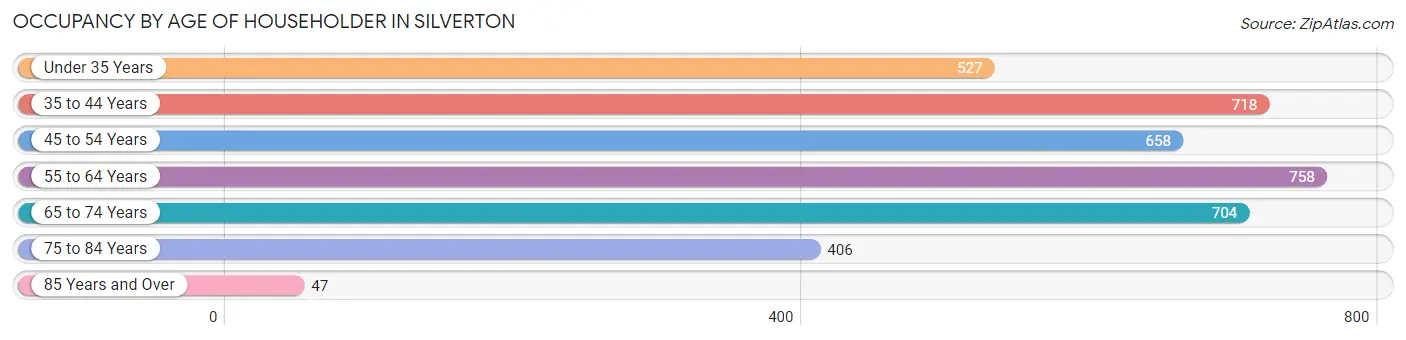
| Age Bracket | # Households | % Households |
| Under 35 Years | 527 | 13.8% |
| 35 to 44 Years | 718 | 18.8% |
| 45 to 54 Years | 658 | 17.2% |
| 55 to 64 Years | 758 | 19.9% |
| 65 to 74 Years | 704 | 18.4% |
| 75 to 84 Years | 406 | 10.6% |
| 85 Years and Over | 47 | 1.2% |
| Total | 3,818 | 100.0% |
Housing Finances in Silverton
Median Income by Occupancy in Silverton
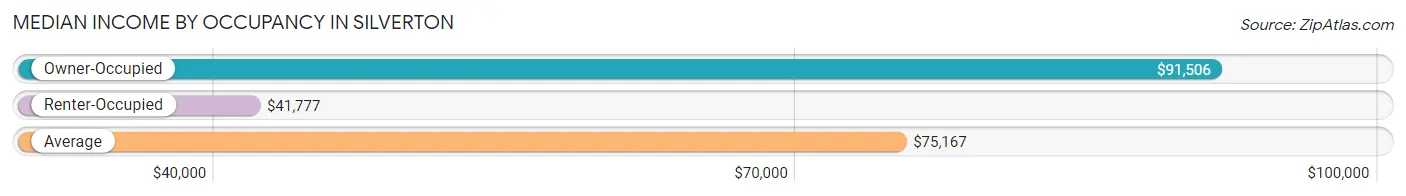
| Occupancy Type | # Households | Median Income |
| Owner-Occupied | 2,295 (60.1%) | $91,506 |
| Renter-Occupied | 1,523 (39.9%) | $41,777 |
| Average | 3,818 (100.0%) | $75,167 |
Occupancy by Householder Income Bracket in Silverton
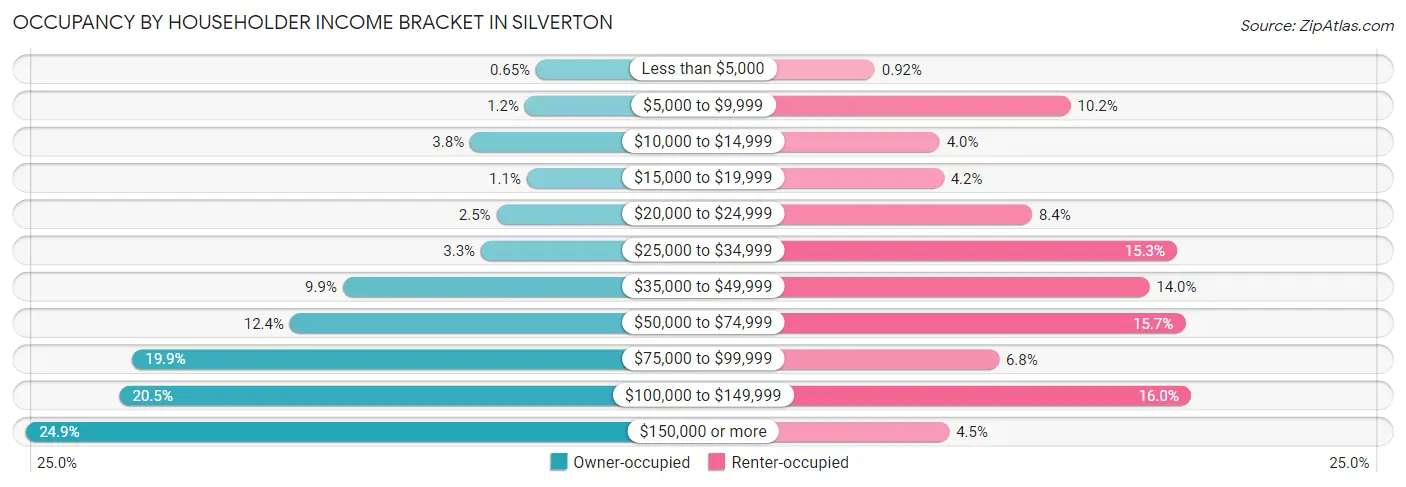
| Income Bracket | Owner-occupied | Renter-occupied |
| Less than $5,000 | 15 (0.6%) | 14 (0.9%) |
| $5,000 to $9,999 | 27 (1.2%) | 156 (10.2%) |
| $10,000 to $14,999 | 87 (3.8%) | 61 (4.0%) |
| $15,000 to $19,999 | 25 (1.1%) | 64 (4.2%) |
| $20,000 to $24,999 | 58 (2.5%) | 128 (8.4%) |
| $25,000 to $34,999 | 75 (3.3%) | 233 (15.3%) |
| $35,000 to $49,999 | 226 (9.9%) | 213 (14.0%) |
| $50,000 to $74,999 | 284 (12.4%) | 239 (15.7%) |
| $75,000 to $99,999 | 456 (19.9%) | 104 (6.8%) |
| $100,000 to $149,999 | 470 (20.5%) | 243 (16.0%) |
| $150,000 or more | 572 (24.9%) | 68 (4.5%) |
| Total | 2,295 (100.0%) | 1,523 (100.0%) |
Monthly Housing Cost Tiers in Silverton
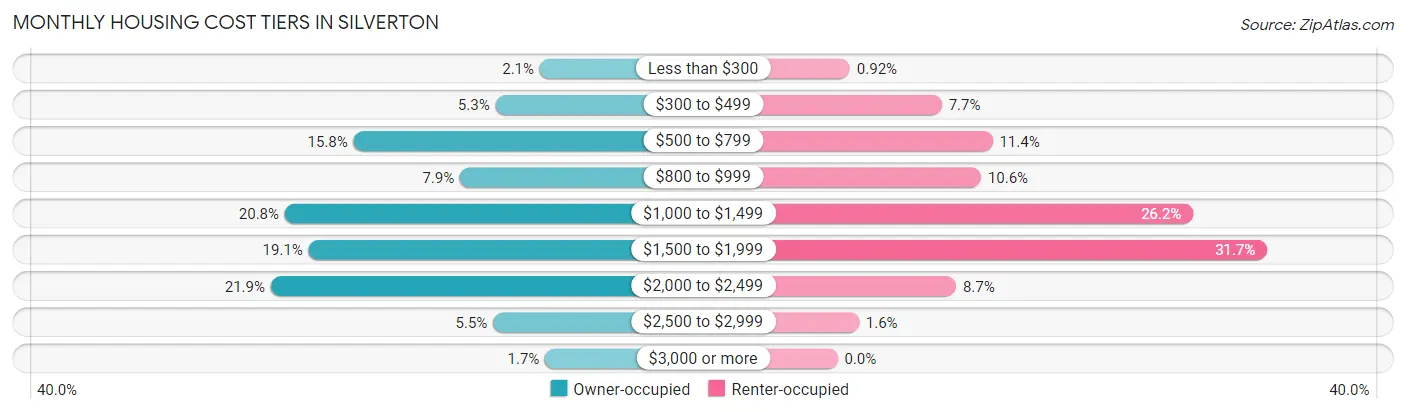
| Monthly Cost | Owner-occupied | Renter-occupied |
| Less than $300 | 47 (2.1%) | 14 (0.9%) |
| $300 to $499 | 122 (5.3%) | 117 (7.7%) |
| $500 to $799 | 362 (15.8%) | 174 (11.4%) |
| $800 to $999 | 182 (7.9%) | 161 (10.6%) |
| $1,000 to $1,499 | 478 (20.8%) | 399 (26.2%) |
| $1,500 to $1,999 | 438 (19.1%) | 482 (31.7%) |
| $2,000 to $2,499 | 502 (21.9%) | 133 (8.7%) |
| $2,500 to $2,999 | 126 (5.5%) | 24 (1.6%) |
| $3,000 or more | 38 (1.7%) | 0 (0.0%) |
| Total | 2,295 (100.0%) | 1,523 (100.0%) |
Physical Housing Characteristics in Silverton
Housing Structures in Silverton
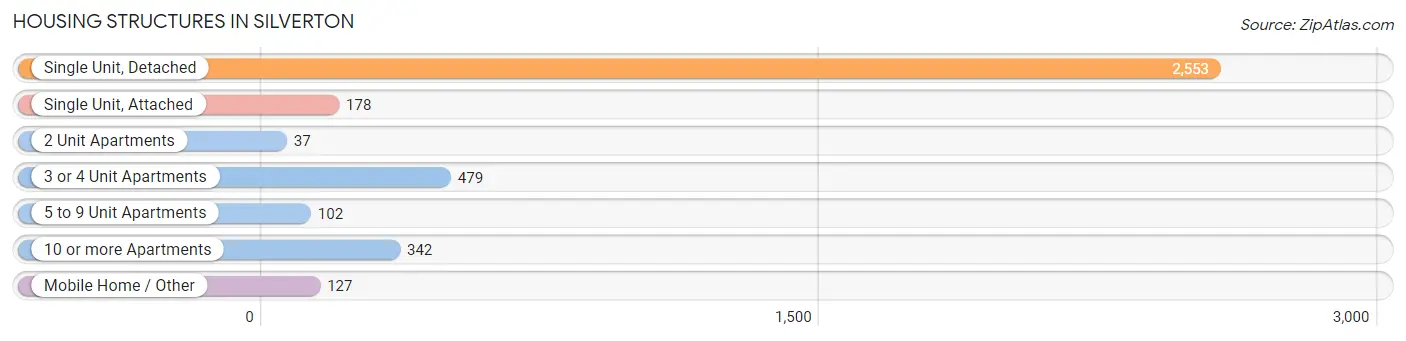
| Structure Type | # Housing Units | % Housing Units |
| Single Unit, Detached | 2,553 | 66.9% |
| Single Unit, Attached | 178 | 4.7% |
| 2 Unit Apartments | 37 | 1.0% |
| 3 or 4 Unit Apartments | 479 | 12.6% |
| 5 to 9 Unit Apartments | 102 | 2.7% |
| 10 or more Apartments | 342 | 9.0% |
| Mobile Home / Other | 127 | 3.3% |
| Total | 3,818 | 100.0% |
Housing Structures by Occupancy in Silverton
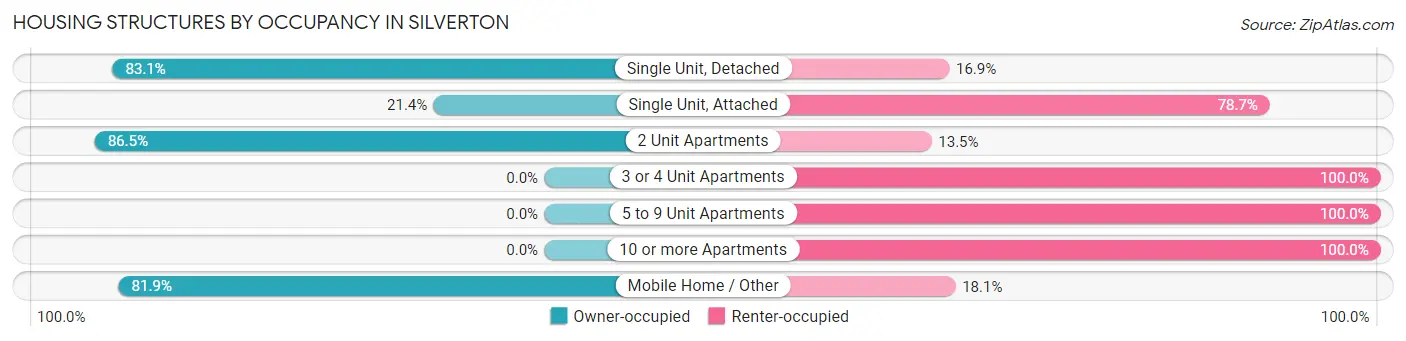
| Structure Type | Owner-occupied | Renter-occupied |
| Single Unit, Detached | 2,121 (83.1%) | 432 (16.9%) |
| Single Unit, Attached | 38 (21.3%) | 140 (78.6%) |
| 2 Unit Apartments | 32 (86.5%) | 5 (13.5%) |
| 3 or 4 Unit Apartments | 0 (0.0%) | 479 (100.0%) |
| 5 to 9 Unit Apartments | 0 (0.0%) | 102 (100.0%) |
| 10 or more Apartments | 0 (0.0%) | 342 (100.0%) |
| Mobile Home / Other | 104 (81.9%) | 23 (18.1%) |
| Total | 2,295 (60.1%) | 1,523 (39.9%) |
Housing Structures by Number of Rooms in Silverton
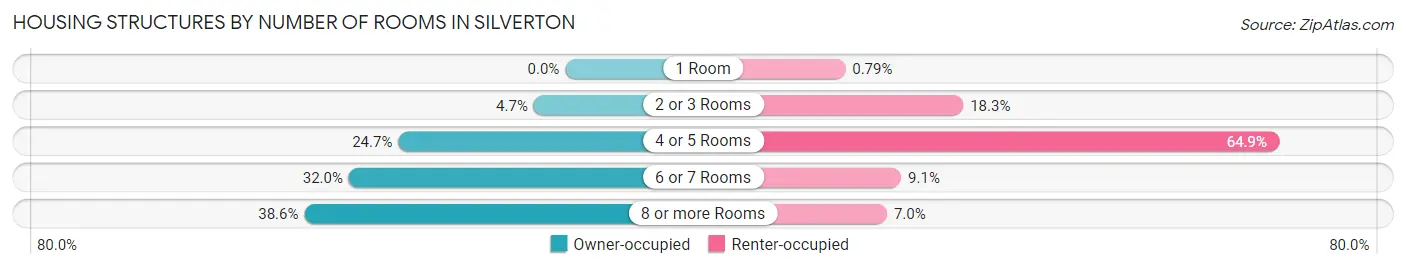
| Number of Rooms | Owner-occupied | Renter-occupied |
| 1 Room | 0 (0.0%) | 12 (0.8%) |
| 2 or 3 Rooms | 107 (4.7%) | 278 (18.2%) |
| 4 or 5 Rooms | 567 (24.7%) | 989 (64.9%) |
| 6 or 7 Rooms | 735 (32.0%) | 138 (9.1%) |
| 8 or more Rooms | 886 (38.6%) | 106 (7.0%) |
| Total | 2,295 (100.0%) | 1,523 (100.0%) |
Housing Structure by Heating Type in Silverton
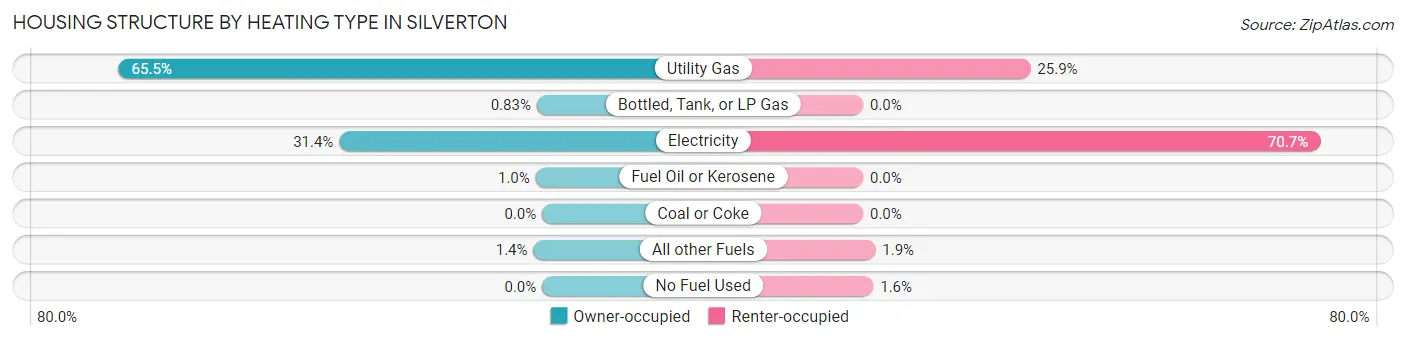
| Heating Type | Owner-occupied | Renter-occupied |
| Utility Gas | 1,502 (65.4%) | 394 (25.9%) |
| Bottled, Tank, or LP Gas | 19 (0.8%) | 0 (0.0%) |
| Electricity | 720 (31.4%) | 1,076 (70.7%) |
| Fuel Oil or Kerosene | 23 (1.0%) | 0 (0.0%) |
| Coal or Coke | 0 (0.0%) | 0 (0.0%) |
| All other Fuels | 31 (1.3%) | 29 (1.9%) |
| No Fuel Used | 0 (0.0%) | 24 (1.6%) |
| Total | 2,295 (100.0%) | 1,523 (100.0%) |
Household Vehicle Usage in Silverton
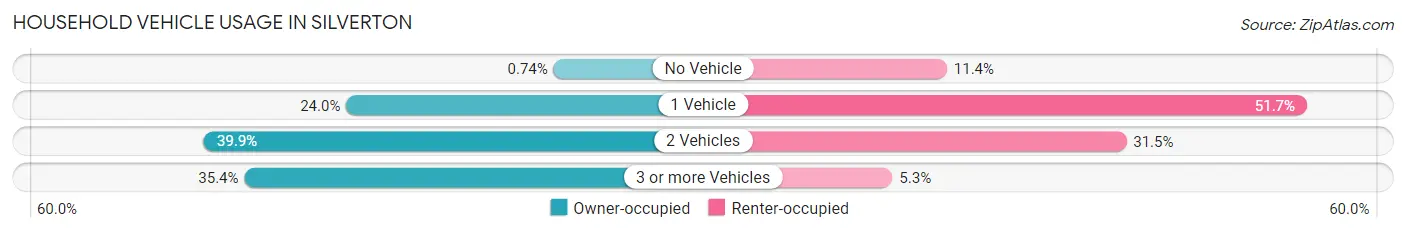
| Vehicles per Household | Owner-occupied | Renter-occupied |
| No Vehicle | 17 (0.7%) | 174 (11.4%) |
| 1 Vehicle | 550 (24.0%) | 788 (51.7%) |
| 2 Vehicles | 916 (39.9%) | 480 (31.5%) |
| 3 or more Vehicles | 812 (35.4%) | 81 (5.3%) |
| Total | 2,295 (100.0%) | 1,523 (100.0%) |
Real Estate & Mortgages in Silverton
Real Estate and Mortgage Overview in Silverton
| Characteristic | Without Mortgage | With Mortgage |
| Housing Units | 693 | 1,602 |
| Median Property Value | $444,600 | $389,700 |
| Median Household Income | $55,074 | $507 |
| Monthly Housing Costs | $701 | $38 |
| Real Estate Taxes | $4,286 | $7 |
Property Value by Mortgage Status in Silverton
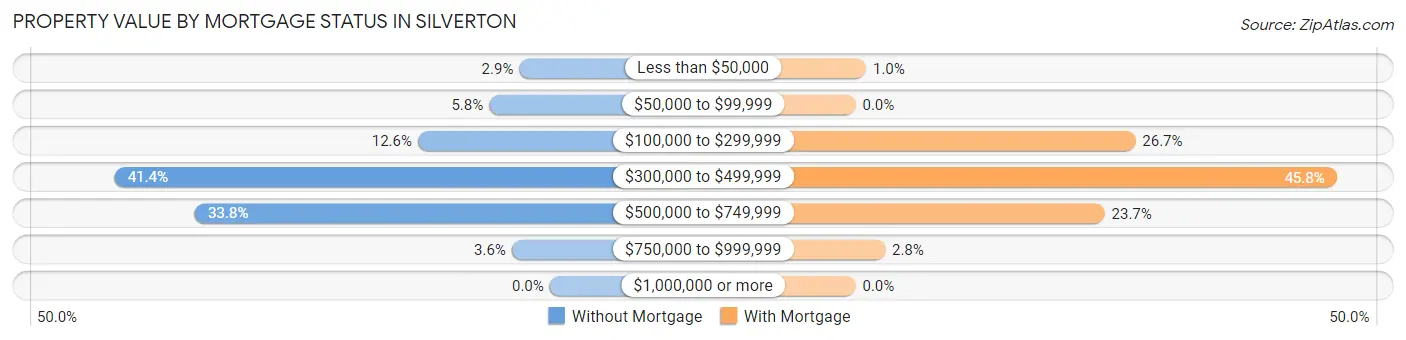
| Property Value | Without Mortgage | With Mortgage |
| Less than $50,000 | 20 (2.9%) | 16 (1.0%) |
| $50,000 to $99,999 | 40 (5.8%) | 0 (0.0%) |
| $100,000 to $299,999 | 87 (12.6%) | 427 (26.7%) |
| $300,000 to $499,999 | 287 (41.4%) | 734 (45.8%) |
| $500,000 to $749,999 | 234 (33.8%) | 380 (23.7%) |
| $750,000 to $999,999 | 25 (3.6%) | 45 (2.8%) |
| $1,000,000 or more | 0 (0.0%) | 0 (0.0%) |
| Total | 693 (100.0%) | 1,602 (100.0%) |
Household Income by Mortgage Status in Silverton
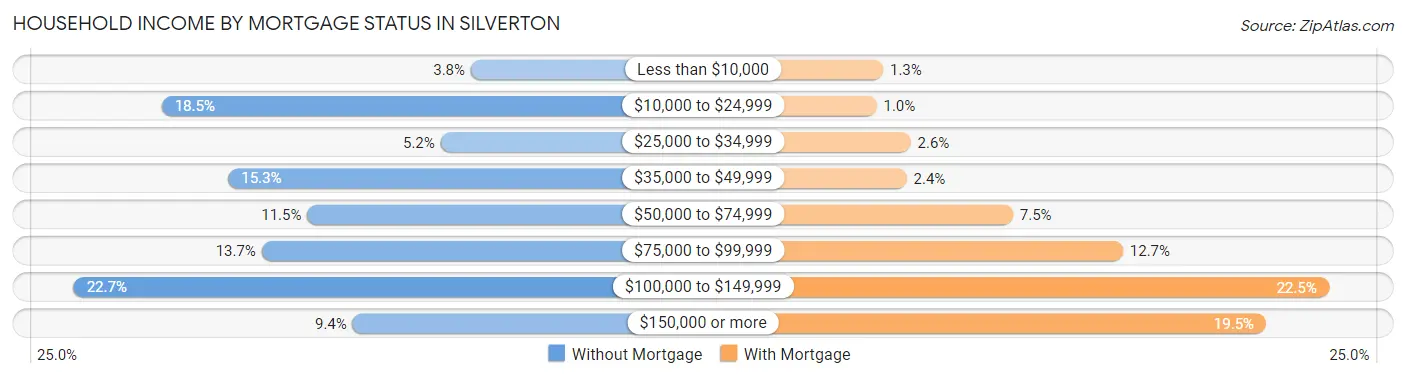
| Household Income | Without Mortgage | With Mortgage |
| Less than $10,000 | 26 (3.7%) | 21 (1.3%) |
| $10,000 to $24,999 | 128 (18.5%) | 16 (1.0%) |
| $25,000 to $34,999 | 36 (5.2%) | 42 (2.6%) |
| $35,000 to $49,999 | 106 (15.3%) | 39 (2.4%) |
| $50,000 to $74,999 | 80 (11.5%) | 120 (7.5%) |
| $75,000 to $99,999 | 95 (13.7%) | 204 (12.7%) |
| $100,000 to $149,999 | 157 (22.7%) | 361 (22.5%) |
| $150,000 or more | 65 (9.4%) | 313 (19.5%) |
| Total | 693 (100.0%) | 1,602 (100.0%) |
Property Value to Household Income Ratio in Silverton
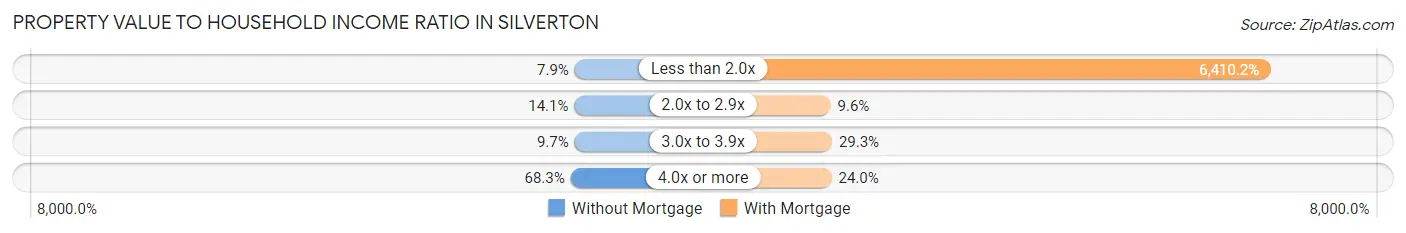
| Value-to-Income Ratio | Without Mortgage | With Mortgage |
| Less than 2.0x | 55 (7.9%) | 102,692 (6,410.2%) |
| 2.0x to 2.9x | 98 (14.1%) | 153 (9.6%) |
| 3.0x to 3.9x | 67 (9.7%) | 470 (29.3%) |
| 4.0x or more | 473 (68.2%) | 385 (24.0%) |
| Total | 693 (100.0%) | 1,602 (100.0%) |
Real Estate Taxes by Mortgage Status in Silverton
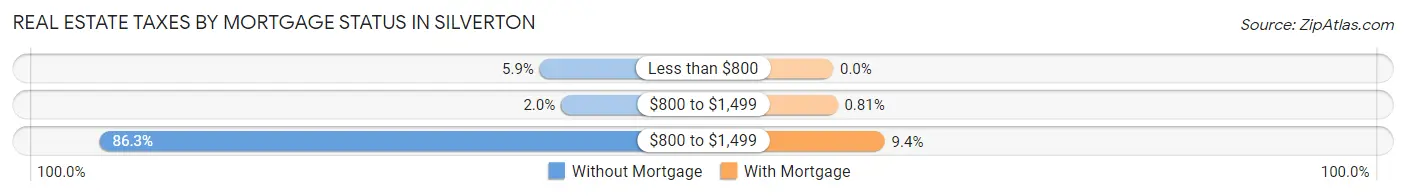
| Property Taxes | Without Mortgage | With Mortgage |
| Less than $800 | 41 (5.9%) | 0 (0.0%) |
| $800 to $1,499 | 14 (2.0%) | 13 (0.8%) |
| $800 to $1,499 | 598 (86.3%) | 151 (9.4%) |
| Total | 693 (100.0%) | 1,602 (100.0%) |
Health & Disability in Silverton
Health Insurance Coverage by Age in Silverton
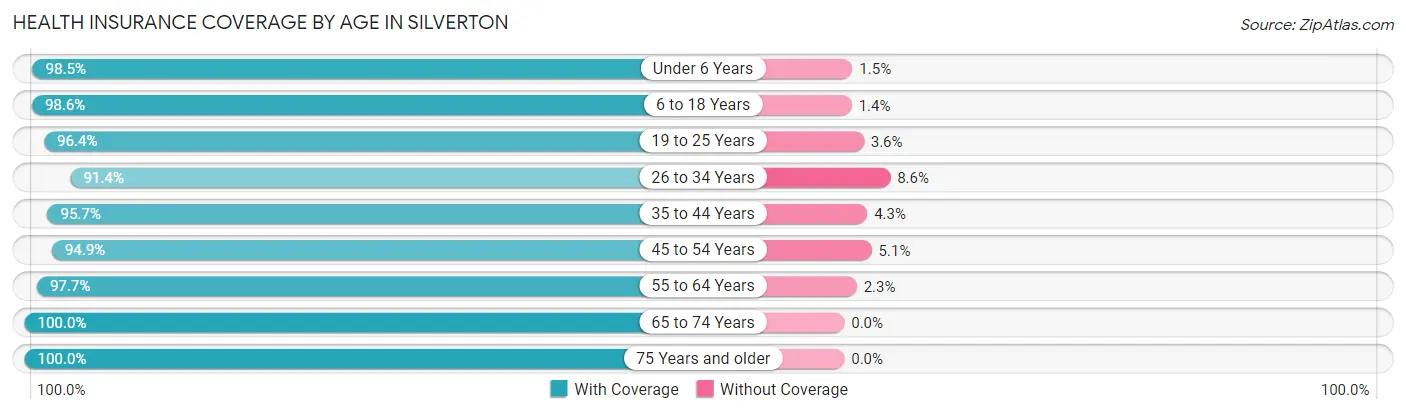
| Age Bracket | With Coverage | Without Coverage |
| Under 6 Years | 978 (98.5%) | 15 (1.5%) |
| 6 to 18 Years | 1,932 (98.6%) | 27 (1.4%) |
| 19 to 25 Years | 557 (96.4%) | 21 (3.6%) |
| 26 to 34 Years | 1,058 (91.4%) | 99 (8.6%) |
| 35 to 44 Years | 1,452 (95.7%) | 65 (4.3%) |
| 45 to 54 Years | 931 (94.9%) | 50 (5.1%) |
| 55 to 64 Years | 1,518 (97.7%) | 36 (2.3%) |
| 65 to 74 Years | 1,059 (100.0%) | 0 (0.0%) |
| 75 Years and older | 608 (100.0%) | 0 (0.0%) |
| Total | 10,093 (97.0%) | 313 (3.0%) |
Health Insurance Coverage by Citizenship Status in Silverton
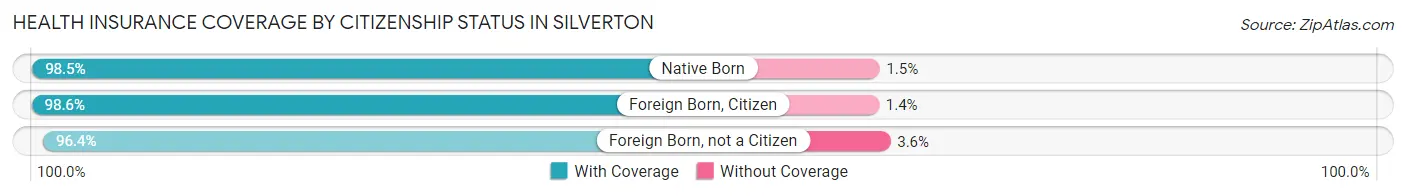
| Citizenship Status | With Coverage | Without Coverage |
| Native Born | 978 (98.5%) | 15 (1.5%) |
| Foreign Born, Citizen | 1,932 (98.6%) | 27 (1.4%) |
| Foreign Born, not a Citizen | 557 (96.4%) | 21 (3.6%) |
Health Insurance Coverage by Household Income in Silverton
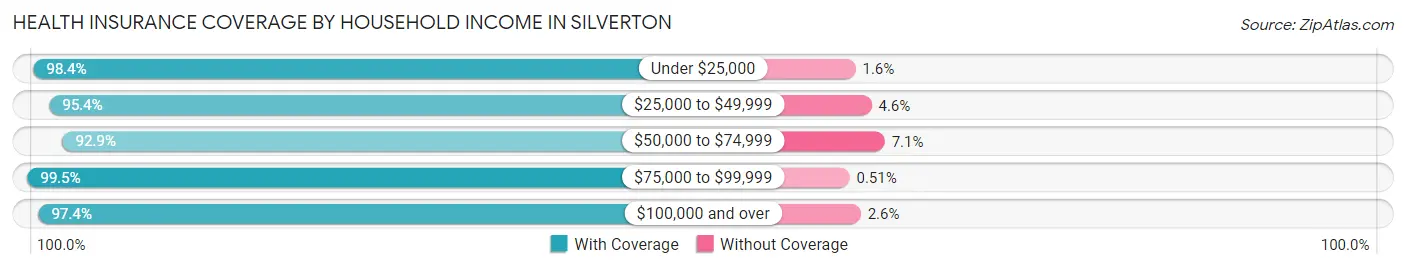
| Household Income | With Coverage | Without Coverage |
| Under $25,000 | 900 (98.4%) | 15 (1.6%) |
| $25,000 to $49,999 | 1,874 (95.4%) | 91 (4.6%) |
| $50,000 to $74,999 | 1,085 (92.9%) | 83 (7.1%) |
| $75,000 to $99,999 | 1,936 (99.5%) | 10 (0.5%) |
| $100,000 and over | 4,254 (97.4%) | 114 (2.6%) |
Public vs Private Health Insurance Coverage by Age in Silverton
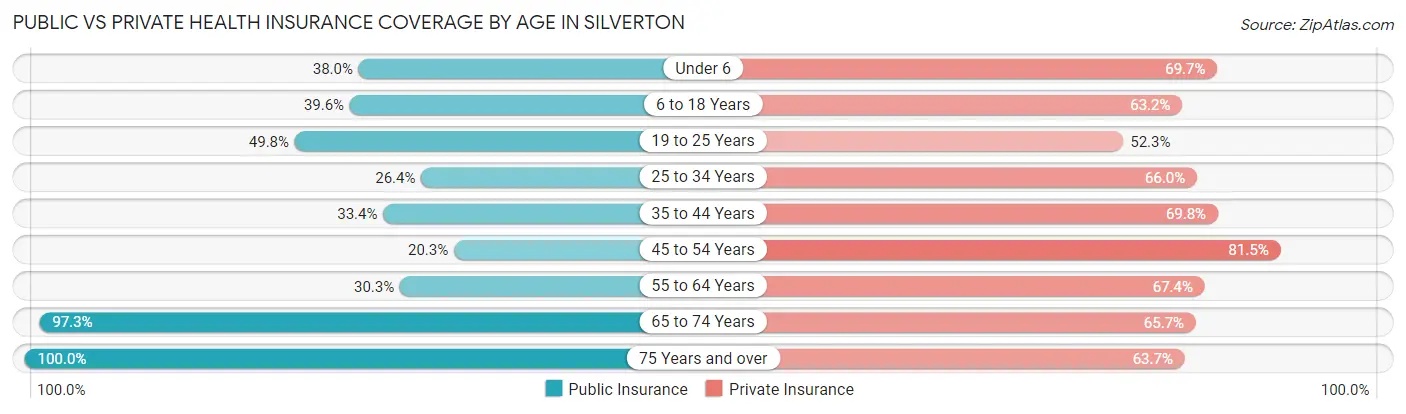
| Age Bracket | Public Insurance | Private Insurance |
| Under 6 | 377 (38.0%) | 692 (69.7%) |
| 6 to 18 Years | 776 (39.6%) | 1,238 (63.2%) |
| 19 to 25 Years | 288 (49.8%) | 302 (52.2%) |
| 25 to 34 Years | 305 (26.4%) | 763 (65.9%) |
| 35 to 44 Years | 507 (33.4%) | 1,059 (69.8%) |
| 45 to 54 Years | 199 (20.3%) | 799 (81.5%) |
| 55 to 64 Years | 471 (30.3%) | 1,047 (67.4%) |
| 65 to 74 Years | 1,030 (97.3%) | 696 (65.7%) |
| 75 Years and over | 608 (100.0%) | 387 (63.6%) |
| Total | 4,561 (43.8%) | 6,983 (67.1%) |
Disability Status by Sex by Age in Silverton
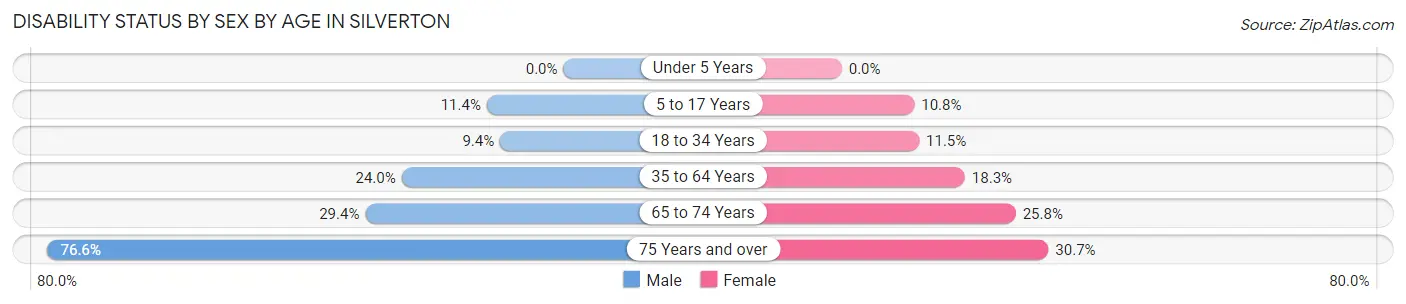
| Age Bracket | Male | Female |
| Under 5 Years | 0 (0.0%) | 0 (0.0%) |
| 5 to 17 Years | 137 (11.4%) | 105 (10.8%) |
| 18 to 34 Years | 92 (9.4%) | 93 (11.5%) |
| 35 to 64 Years | 444 (24.0%) | 403 (18.3%) |
| 65 to 74 Years | 143 (29.4%) | 148 (25.8%) |
| 75 Years and over | 206 (76.6%) | 104 (30.7%) |
Disability Class by Sex by Age in Silverton
Disability Class: Hearing Difficulty
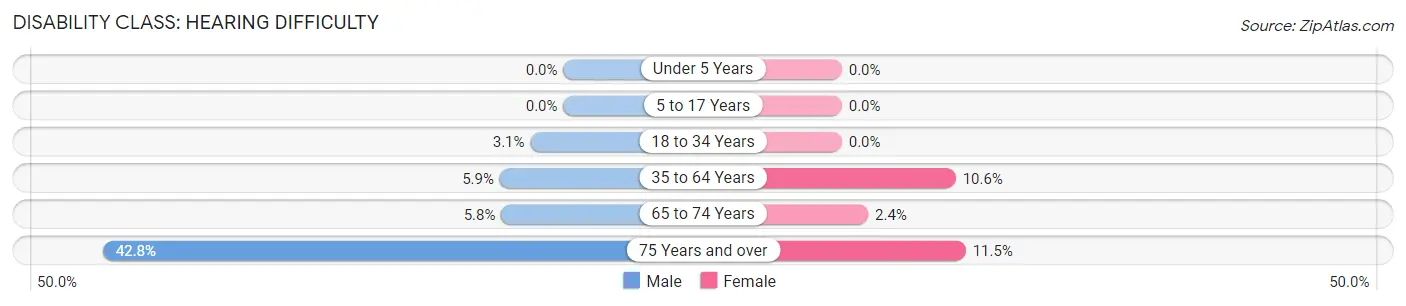
| Age Bracket | Male | Female |
| Under 5 Years | 0 (0.0%) | 0 (0.0%) |
| 5 to 17 Years | 0 (0.0%) | 0 (0.0%) |
| 18 to 34 Years | 30 (3.1%) | 0 (0.0%) |
| 35 to 64 Years | 109 (5.9%) | 233 (10.6%) |
| 65 to 74 Years | 28 (5.8%) | 14 (2.4%) |
| 75 Years and over | 115 (42.7%) | 39 (11.5%) |
Disability Class: Vision Difficulty
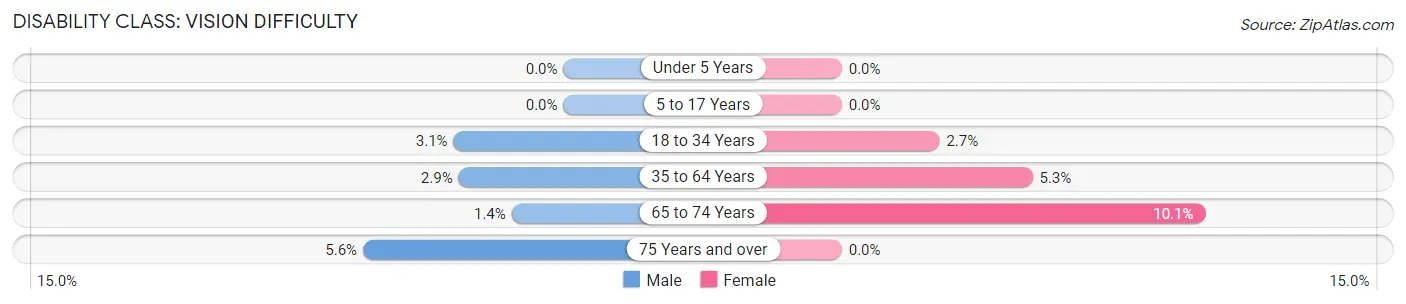
| Age Bracket | Male | Female |
| Under 5 Years | 0 (0.0%) | 0 (0.0%) |
| 5 to 17 Years | 0 (0.0%) | 0 (0.0%) |
| 18 to 34 Years | 30 (3.1%) | 22 (2.7%) |
| 35 to 64 Years | 54 (2.9%) | 117 (5.3%) |
| 65 to 74 Years | 7 (1.4%) | 58 (10.1%) |
| 75 Years and over | 15 (5.6%) | 0 (0.0%) |
Disability Class: Cognitive Difficulty
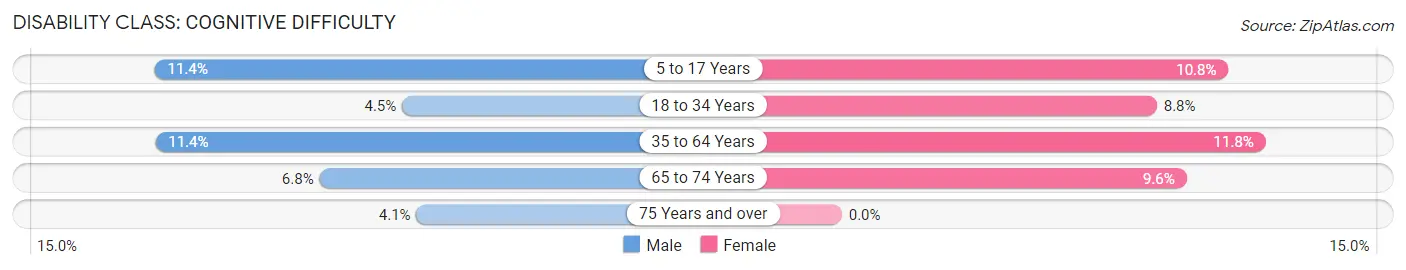
| Age Bracket | Male | Female |
| 5 to 17 Years | 137 (11.4%) | 105 (10.8%) |
| 18 to 34 Years | 44 (4.5%) | 71 (8.8%) |
| 35 to 64 Years | 210 (11.4%) | 260 (11.8%) |
| 65 to 74 Years | 33 (6.8%) | 55 (9.6%) |
| 75 Years and over | 11 (4.1%) | 0 (0.0%) |
Disability Class: Ambulatory Difficulty
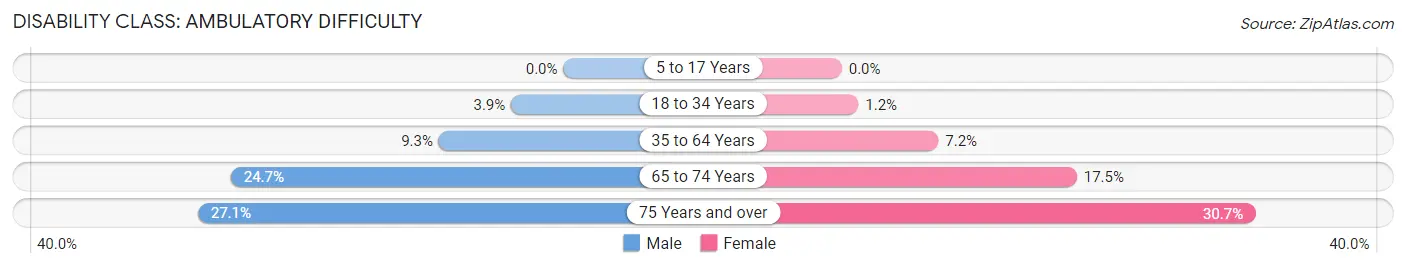
| Age Bracket | Male | Female |
| 5 to 17 Years | 0 (0.0%) | 0 (0.0%) |
| 18 to 34 Years | 38 (3.9%) | 10 (1.2%) |
| 35 to 64 Years | 171 (9.2%) | 158 (7.2%) |
| 65 to 74 Years | 120 (24.7%) | 100 (17.4%) |
| 75 Years and over | 73 (27.1%) | 104 (30.7%) |
Disability Class: Self-Care Difficulty
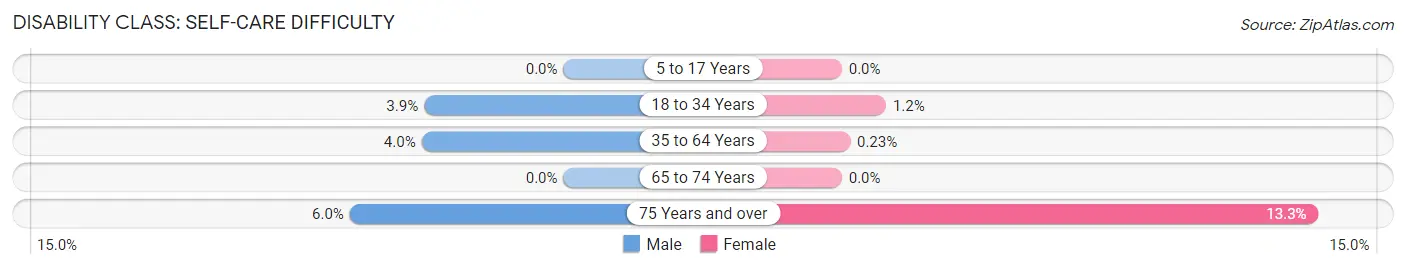
| Age Bracket | Male | Female |
| 5 to 17 Years | 0 (0.0%) | 0 (0.0%) |
| 18 to 34 Years | 38 (3.9%) | 10 (1.2%) |
| 35 to 64 Years | 73 (4.0%) | 5 (0.2%) |
| 65 to 74 Years | 0 (0.0%) | 0 (0.0%) |
| 75 Years and over | 16 (5.9%) | 45 (13.3%) |
Technology Access in Silverton
Computing Device Access in Silverton
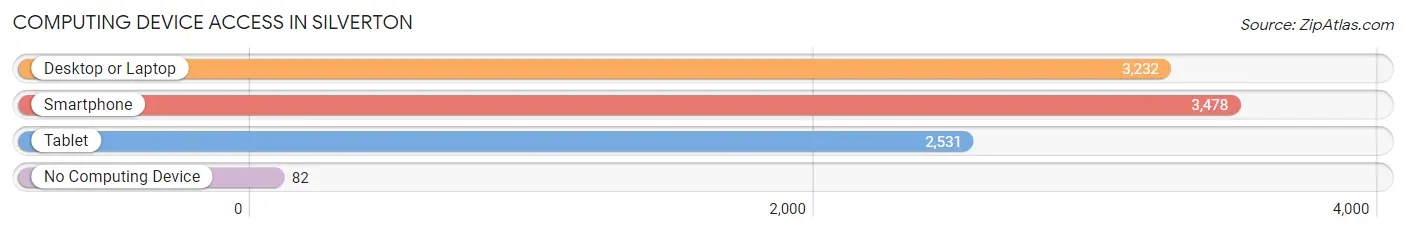
| Device Type | # Households | % Households |
| Desktop or Laptop | 3,232 | 84.7% |
| Smartphone | 3,478 | 91.1% |
| Tablet | 2,531 | 66.3% |
| No Computing Device | 82 | 2.1% |
| Total | 3,818 | 100.0% |
Internet Access in Silverton
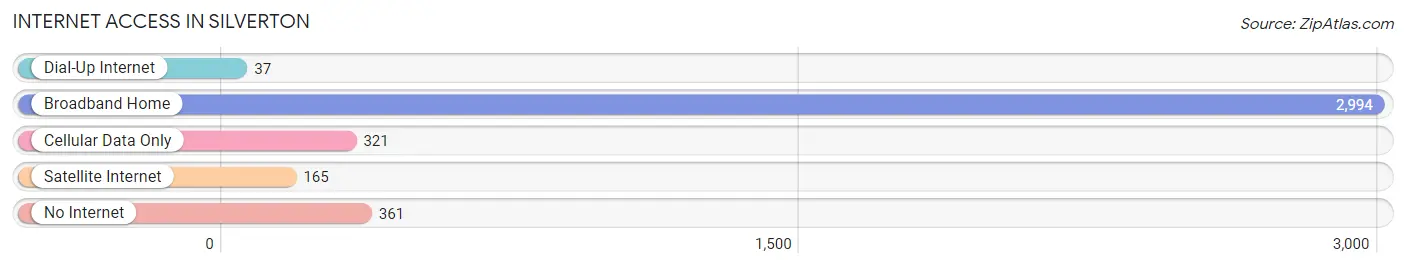
| Internet Type | # Households | % Households |
| Dial-Up Internet | 37 | 1.0% |
| Broadband Home | 2,994 | 78.4% |
| Cellular Data Only | 321 | 8.4% |
| Satellite Internet | 165 | 4.3% |
| No Internet | 361 | 9.5% |
| Total | 3,818 | 100.0% |
Silverton Summary
Silverton, Oregon is a small city located in Marion County, Oregon, United States. It is located about 20 miles east of Salem, the state capital. The city has a population of about 9,000 people and is part of the Salem Metropolitan Statistical Area.
History
Silverton was founded in 1854 by a group of settlers from the Willamette Valley. The city was named after the silver mines that were discovered in the area. The first post office was established in 1855 and the city was incorporated in 1885.
The city was an important center for the timber industry in the late 19th and early 20th centuries. The Silverton Lumber Company was established in 1887 and was one of the largest employers in the area. The company was eventually sold to the Weyerhaeuser Company in the 1950s.
Geography
Silverton is located in the foothills of the Cascade Mountains in the Willamette Valley. The city is situated at an elevation of about 500 feet above sea level. The city is surrounded by rolling hills and is located near the Silver Creek and the North Santiam River.
The climate in Silverton is mild and temperate. The average high temperature in the summer is around 80 degrees Fahrenheit and the average low temperature in the winter is around 30 degrees Fahrenheit.
Economy
Silverton’s economy is largely based on agriculture and tourism. The city is home to several wineries and vineyards, as well as a number of small businesses. The city is also home to a number of manufacturing companies, including a paper mill and a wood products plant.
The city is also home to a number of educational institutions, including Silverton High School, Silverton Middle School, and Silverton Elementary School.
Demographics
As of the 2010 census, the population of Silverton was 8,722. The racial makeup of the city was 90.2% White, 0.7% African American, 0.7% Native American, 0.7% Asian, 0.2% Pacific Islander, 4.3% from other races, and 3.1% from two or more races. Hispanic or Latino of any race were 8.2% of the population.
The median income for a household in Silverton was $41,944 and the median income for a family was $50,944. The per capita income for the city was $20,944. About 11.2% of families and 14.2% of the population were below the poverty line, including 18.2% of those under age 18 and 8.2% of those age 65 or over.
Silverton is a small city with a rich history and a diverse economy. The city is home to a number of educational institutions, businesses, and wineries, and is a popular tourist destination. The city has a population of about 9,000 people and is part of the Salem Metropolitan Statistical Area.
Common Questions
What is Per Capita Income in Silverton?
Per Capita income in Silverton is $34,161.
What is the Median Family Income in Silverton?
Median Family Income in Silverton is $89,433.
What is the Median Household income in Silverton?
Median Household Income in Silverton is $75,167.
What is Income or Wage Gap in Silverton?
Income or Wage Gap in Silverton is 30.8%.
Women in Silverton earn 69.2 cents for every dollar earned by a man.
What is Inequality or Gini Index in Silverton?
Inequality or Gini Index in Silverton is 0.42.
What is the Total Population of Silverton?
Total Population of Silverton is 10,439.
What is the Total Male Population of Silverton?
Total Male Population of Silverton is 5,075.
What is the Total Female Population of Silverton?
Total Female Population of Silverton is 5,364.
What is the Ratio of Males per 100 Females in Silverton?
There are 94.61 Males per 100 Females in Silverton.
What is the Ratio of Females per 100 Males in Silverton?
There are 105.69 Females per 100 Males in Silverton.
What is the Median Population Age in Silverton?
Median Population Age in Silverton is 38.2 Years.
What is the Average Family Size in Silverton
Average Family Size in Silverton is 3.2 People.
What is the Average Household Size in Silverton
Average Household Size in Silverton is 2.7 People.
How Large is the Labor Force in Silverton?
There are 4,861 People in the Labor Forcein in Silverton.
What is the Percentage of People in the Labor Force in Silverton?
61.8% of People are in the Labor Force in Silverton.
What is the Unemployment Rate in Silverton?
Unemployment Rate in Silverton is 5.7%.