Coon Rapids, MN Map & Demographics
Coon Rapids Map
Coon Rapids Overview
$38,885
PER CAPITA INCOME
$96,833
AVG FAMILY INCOME
$85,445
AVG HOUSEHOLD INCOME
23.8%
WAGE / INCOME GAP [ % ]
76.2¢/ $1
WAGE / INCOME GAP [ $ ]
$6,950
FAMILY INCOME DEFICIT
0.36
INEQUALITY / GINI INDEX
63,296
TOTAL POPULATION
31,794
MALE POPULATION
31,502
FEMALE POPULATION
100.93
MALES / 100 FEMALES
99.08
FEMALES / 100 MALES
39.2
MEDIAN AGE
3.1
AVG FAMILY SIZE
2.6
AVG HOUSEHOLD SIZE
36,100
LABOR FORCE [ PEOPLE ]
69.9%
PERCENT IN LABOR FORCE
4.2%
UNEMPLOYMENT RATE
Coon Rapids Area Codes
Income in Coon Rapids
Income Overview in Coon Rapids
Per Capita Income in Coon Rapids is $38,885, while median incomes of families and households are $96,833 and $85,445 respectively.
| Characteristic | Number | Measure |
| Per Capita Income | 63,296 | $38,885 |
| Median Family Income | 16,002 | $96,833 |
| Mean Family Income | 16,002 | $110,341 |
| Median Household Income | 24,574 | $85,445 |
| Mean Household Income | 24,574 | $96,417 |
| Income Deficit | 16,002 | $6,950 |
| Wage / Income Gap (%) | 63,296 | 23.84% |
| Wage / Income Gap ($) | 63,296 | 76.16¢ per $1 |
| Gini / Inequality Index | 63,296 | 0.36 |
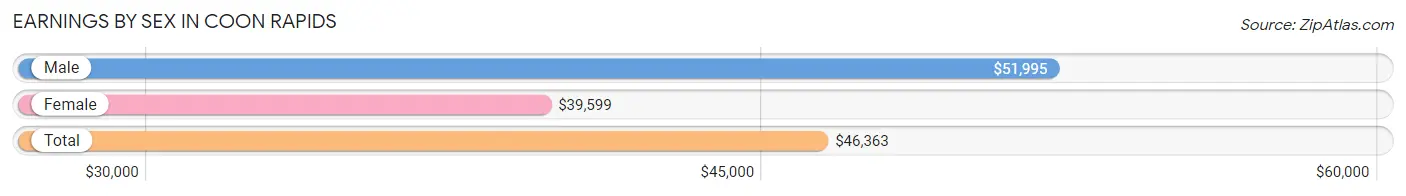
Earnings by Sex in Coon Rapids
Average Earnings in Coon Rapids are $46,363, $51,995 for men and $39,599 for women, a difference of 23.8%.
| Sex | Number | Average Earnings |
| Male | 19,437 (51.8%) | $51,995 |
| Female | 18,105 (48.2%) | $39,599 |
| Total | 37,542 (100.0%) | $46,363 |
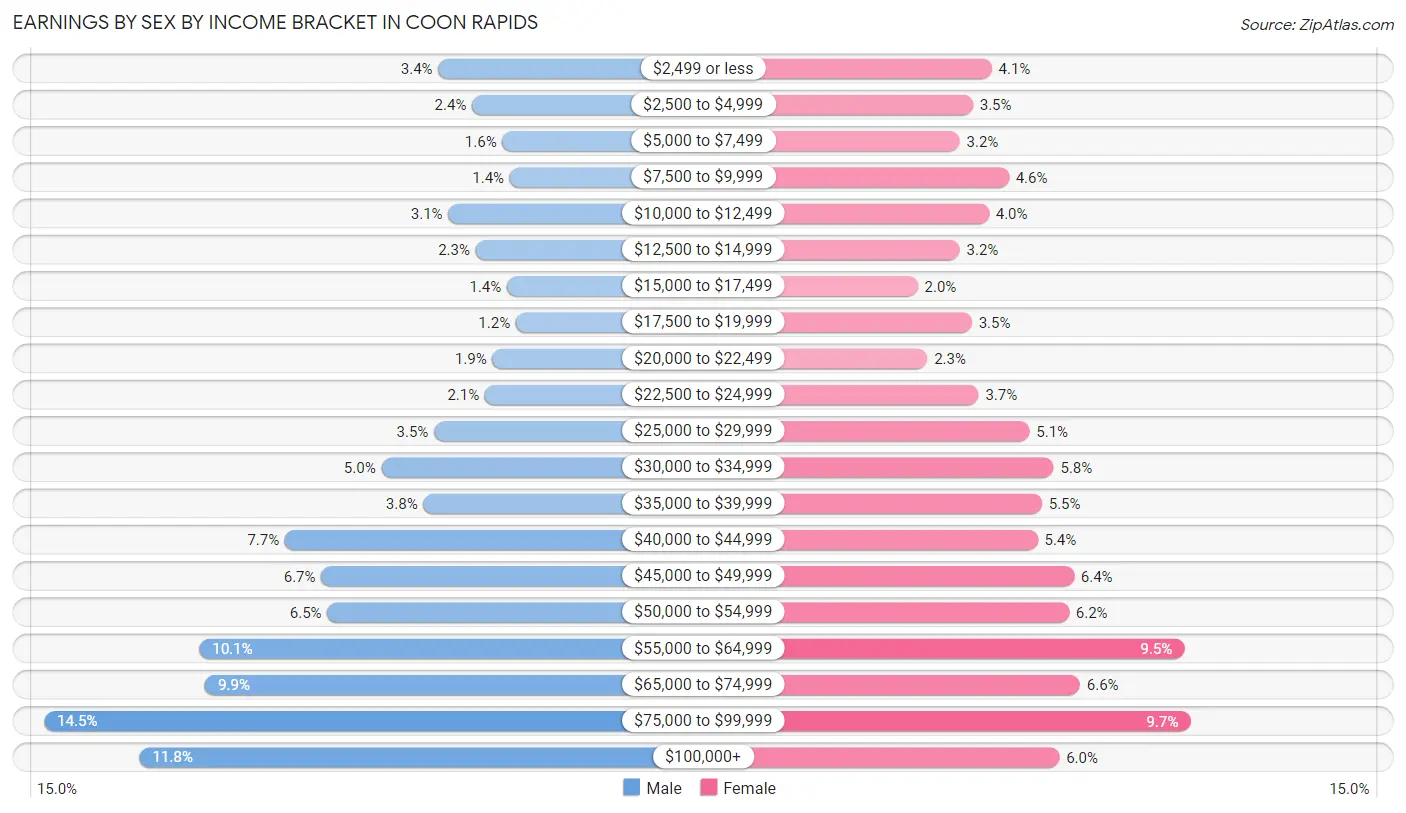
Earnings by Sex by Income Bracket in Coon Rapids
The most common earnings brackets in Coon Rapids are $75,000 to $99,999 for men (2,809 | 14.4%) and $75,000 to $99,999 for women (1,748 | 9.7%).
| Income | Male | Female |
| $2,499 or less | 655 (3.4%) | 737 (4.1%) |
| $2,500 to $4,999 | 470 (2.4%) | 641 (3.5%) |
| $5,000 to $7,499 | 306 (1.6%) | 574 (3.2%) |
| $7,500 to $9,999 | 264 (1.4%) | 824 (4.5%) |
| $10,000 to $12,499 | 601 (3.1%) | 723 (4.0%) |
| $12,500 to $14,999 | 451 (2.3%) | 574 (3.2%) |
| $15,000 to $17,499 | 279 (1.4%) | 361 (2.0%) |
| $17,500 to $19,999 | 231 (1.2%) | 635 (3.5%) |
| $20,000 to $22,499 | 360 (1.8%) | 409 (2.3%) |
| $22,500 to $24,999 | 401 (2.1%) | 669 (3.7%) |
| $25,000 to $29,999 | 678 (3.5%) | 928 (5.1%) |
| $30,000 to $34,999 | 966 (5.0%) | 1,052 (5.8%) |
| $35,000 to $39,999 | 737 (3.8%) | 992 (5.5%) |
| $40,000 to $44,999 | 1,493 (7.7%) | 970 (5.4%) |
| $45,000 to $49,999 | 1,295 (6.7%) | 1,156 (6.4%) |
| $50,000 to $54,999 | 1,262 (6.5%) | 1,129 (6.2%) |
| $55,000 to $64,999 | 1,962 (10.1%) | 1,717 (9.5%) |
| $65,000 to $74,999 | 1,930 (9.9%) | 1,185 (6.6%) |
| $75,000 to $99,999 | 2,809 (14.4%) | 1,748 (9.7%) |
| $100,000+ | 2,287 (11.8%) | 1,081 (6.0%) |
| Total | 19,437 (100.0%) | 18,105 (100.0%) |
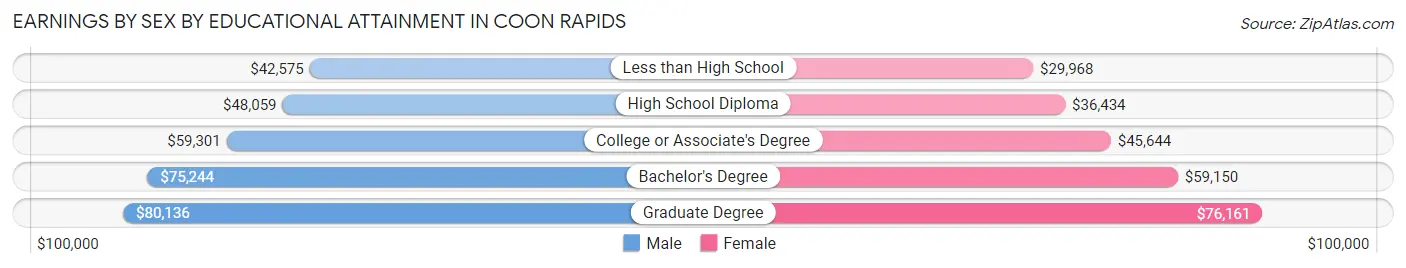
Earnings by Sex by Educational Attainment in Coon Rapids
Average earnings in Coon Rapids are $57,395 for men and $45,892 for women, a difference of 20.0%. Men with an educational attainment of graduate degree enjoy the highest average annual earnings of $80,136, while those with less than high school education earn the least with $42,575. Women with an educational attainment of graduate degree earn the most with the average annual earnings of $76,161, while those with less than high school education have the smallest earnings of $29,968.
| Educational Attainment | Male Income | Female Income |
| Less than High School | $42,575 | $29,968 |
| High School Diploma | $48,059 | $36,434 |
| College or Associate's Degree | $59,301 | $45,644 |
| Bachelor's Degree | $75,244 | $59,150 |
| Graduate Degree | $80,136 | $76,161 |
| Total | $57,395 | $45,892 |
Family Income in Coon Rapids
Family Income Brackets in Coon Rapids
According to the Coon Rapids family income data, there are 3,936 families falling into the $100,000 to $149,999 income range, which is the most common income bracket and makes up 24.6% of all families. Conversely, the less than $10,000 income bracket is the least frequent group with only 112 families (0.7%) belonging to this category.
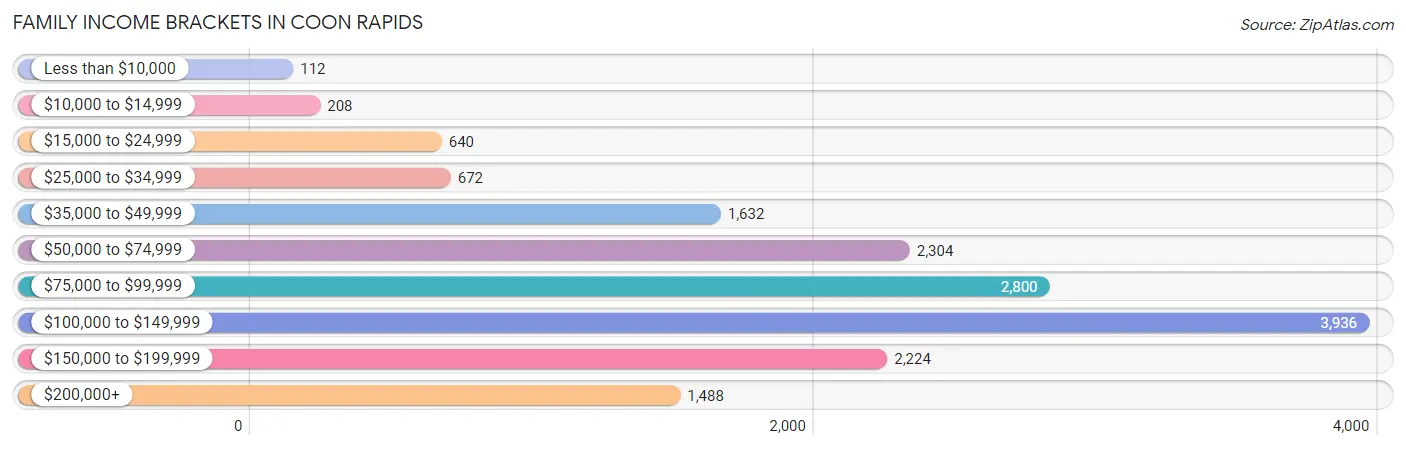
| Income Bracket | # Families | % Families |
| Less than $10,000 | 112 | 0.7% |
| $10,000 to $14,999 | 208 | 1.3% |
| $15,000 to $24,999 | 640 | 4.0% |
| $25,000 to $34,999 | 672 | 4.2% |
| $35,000 to $49,999 | 1,632 | 10.2% |
| $50,000 to $74,999 | 2,304 | 14.4% |
| $75,000 to $99,999 | 2,800 | 17.5% |
| $100,000 to $149,999 | 3,936 | 24.6% |
| $150,000 to $199,999 | 2,224 | 13.9% |
| $200,000+ | 1,488 | 9.3% |
Family Income by Famaliy Size in Coon Rapids
7+ person families (166 | 1.0%) account for the highest median family income in Coon Rapids with $143,654 per family, while 2-person families (7,937 | 49.6%) have the highest median income of $40,578 per family member.
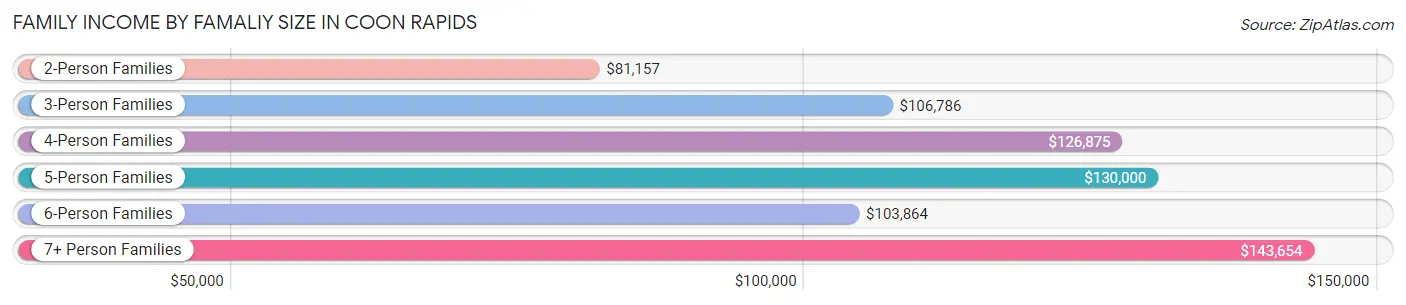
| Income Bracket | # Families | Median Income |
| 2-Person Families | 7,937 (49.6%) | $81,157 |
| 3-Person Families | 3,248 (20.3%) | $106,786 |
| 4-Person Families | 2,761 (17.2%) | $126,875 |
| 5-Person Families | 1,374 (8.6%) | $130,000 |
| 6-Person Families | 516 (3.2%) | $103,864 |
| 7+ Person Families | 166 (1.0%) | $143,654 |
| Total | 16,002 (100.0%) | $96,833 |
Family Income by Number of Earners in Coon Rapids
The median family income in Coon Rapids is $96,833, with families comprising 3+ earners (2,578) having the highest median family income of $148,100, while families with no earners (2,262) have the lowest median family income of $59,618, accounting for 16.1% and 14.1% of families, respectively.
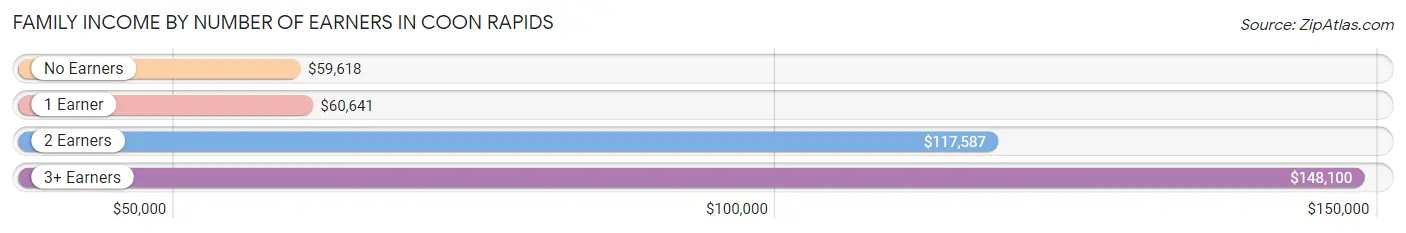
| Number of Earners | # Families | Median Income |
| No Earners | 2,262 (14.1%) | $59,618 |
| 1 Earner | 4,422 (27.6%) | $60,641 |
| 2 Earners | 6,740 (42.1%) | $117,587 |
| 3+ Earners | 2,578 (16.1%) | $148,100 |
| Total | 16,002 (100.0%) | $96,833 |
Household Income in Coon Rapids
Household Income Brackets in Coon Rapids
With 5,308 households falling in the category, the $100,000 to $149,999 income range is the most frequent in Coon Rapids, accounting for 21.6% of all households. In contrast, only 467 households (1.9%) fall into the less than $10,000 income bracket, making it the least populous group.
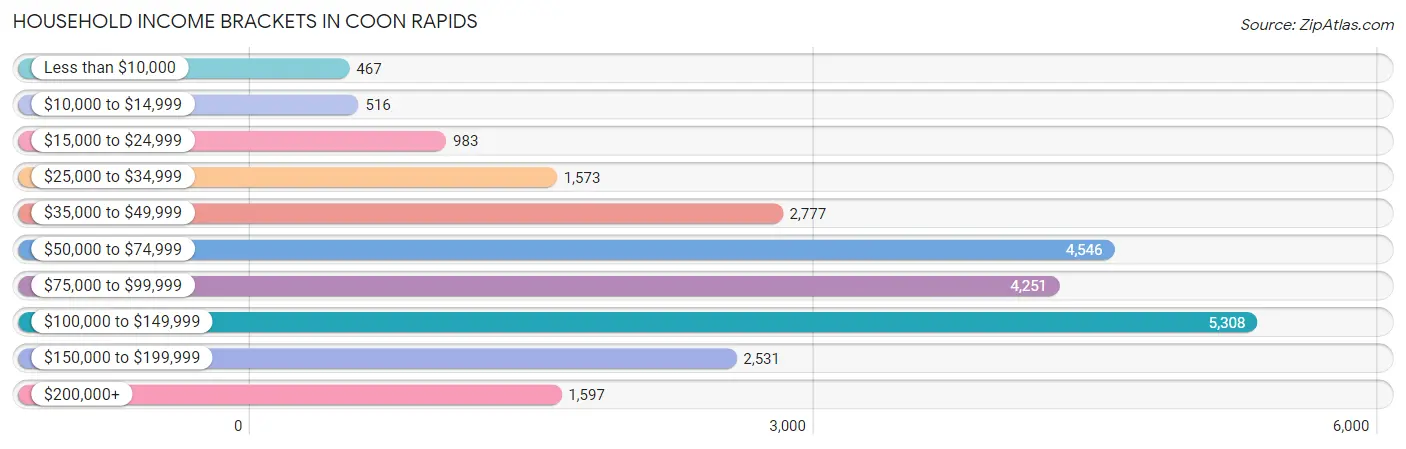
| Income Bracket | # Households | % Households |
| Less than $10,000 | 467 | 1.9% |
| $10,000 to $14,999 | 516 | 2.1% |
| $15,000 to $24,999 | 983 | 4.0% |
| $25,000 to $34,999 | 1,573 | 6.4% |
| $35,000 to $49,999 | 2,777 | 11.3% |
| $50,000 to $74,999 | 4,546 | 18.5% |
| $75,000 to $99,999 | 4,251 | 17.3% |
| $100,000 to $149,999 | 5,308 | 21.6% |
| $150,000 to $199,999 | 2,531 | 10.3% |
| $200,000+ | 1,597 | 6.5% |
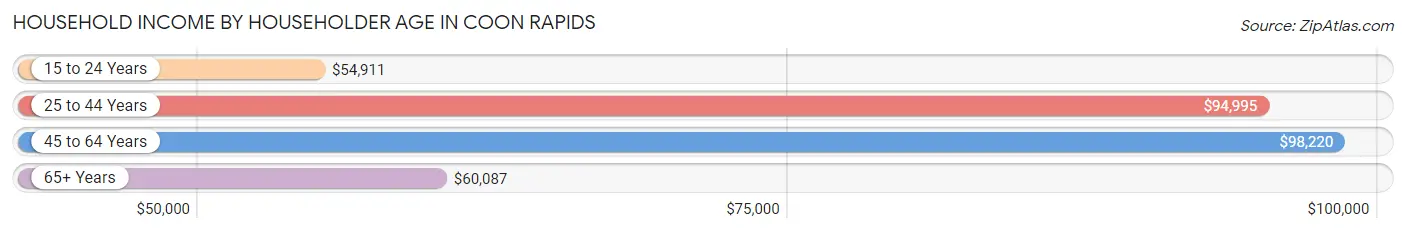
Household Income by Householder Age in Coon Rapids
The median household income in Coon Rapids is $85,445, with the highest median household income of $98,220 found in the 45 to 64 years age bracket for the primary householder. A total of 8,813 households (35.9%) fall into this category. Meanwhile, the 15 to 24 years age bracket for the primary householder has the lowest median household income of $54,911, with 670 households (2.7%) in this group.
| Income Bracket | # Households | Median Income |
| 15 to 24 Years | 670 (2.7%) | $54,911 |
| 25 to 44 Years | 8,303 (33.8%) | $94,995 |
| 45 to 64 Years | 8,813 (35.9%) | $98,220 |
| 65+ Years | 6,788 (27.6%) | $60,087 |
| Total | 24,574 (100.0%) | $85,445 |
Poverty in Coon Rapids
Income Below Poverty by Sex and Age in Coon Rapids
With 6.9% poverty level for males and 8.5% for females among the residents of Coon Rapids, under 5 year old males and 6 to 11 year old females are the most vulnerable to poverty, with 268 males (15.4%) and 291 females (14.8%) in their respective age groups living below the poverty level.
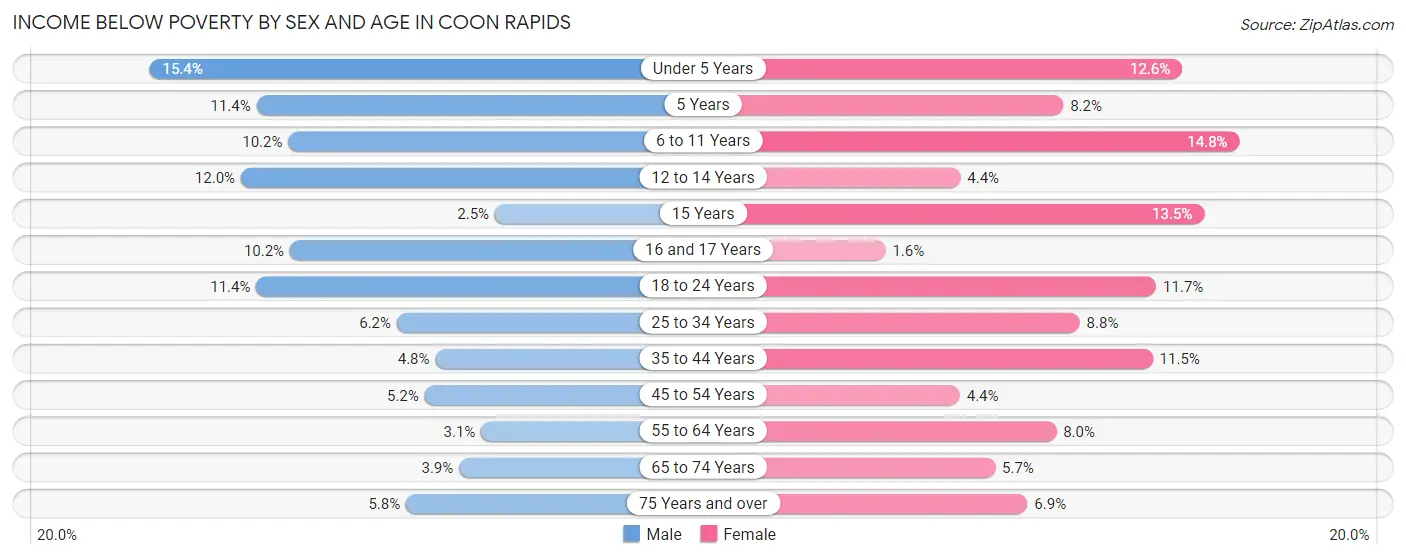
| Age Bracket | Male | Female |
| Under 5 Years | 268 (15.4%) | 194 (12.6%) |
| 5 Years | 32 (11.4%) | 12 (8.2%) |
| 6 to 11 Years | 248 (10.2%) | 291 (14.8%) |
| 12 to 14 Years | 166 (12.0%) | 54 (4.4%) |
| 15 Years | 13 (2.5%) | 48 (13.5%) |
| 16 and 17 Years | 118 (10.2%) | 13 (1.6%) |
| 18 to 24 Years | 301 (11.4%) | 317 (11.7%) |
| 25 to 34 Years | 277 (6.2%) | 391 (8.8%) |
| 35 to 44 Years | 202 (4.8%) | 485 (11.5%) |
| 45 to 54 Years | 218 (5.1%) | 176 (4.4%) |
| 55 to 64 Years | 125 (3.0%) | 314 (8.0%) |
| 65 to 74 Years | 97 (3.9%) | 179 (5.7%) |
| 75 Years and over | 111 (5.8%) | 195 (6.9%) |
| Total | 2,176 (6.9%) | 2,669 (8.5%) |
Income Above Poverty by Sex and Age in Coon Rapids
According to the poverty statistics in Coon Rapids, males aged 15 years and females aged 16 and 17 years are the age groups that are most secure financially, with 97.5% of males and 98.4% of females in these age groups living above the poverty line.
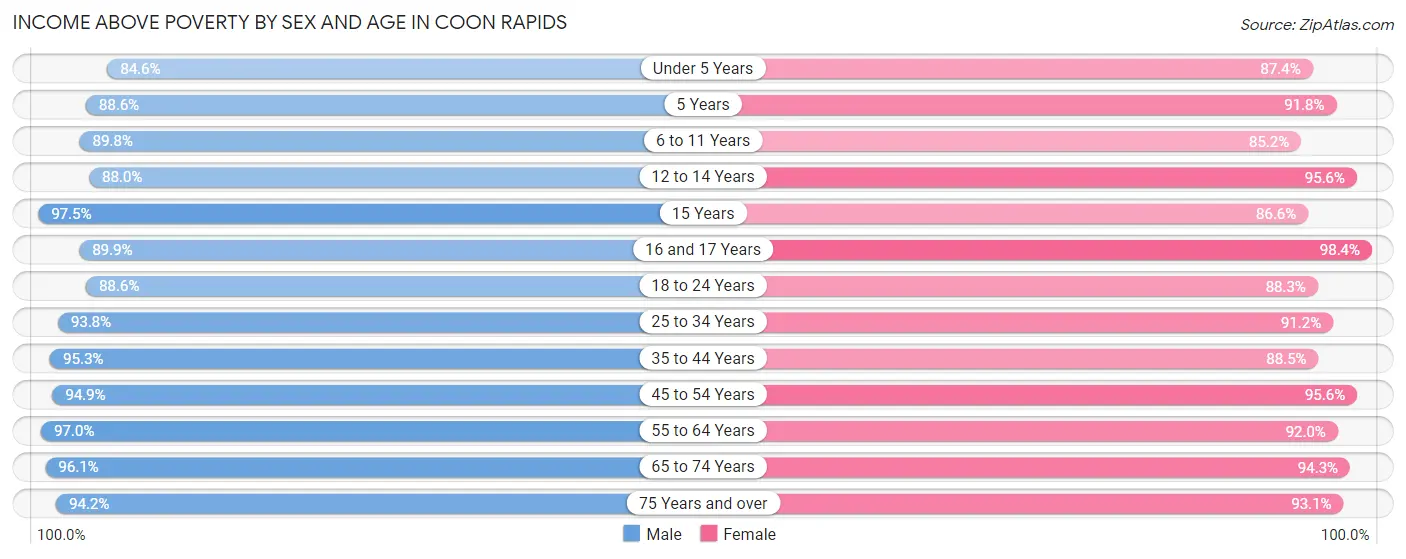
| Age Bracket | Male | Female |
| Under 5 Years | 1,477 (84.6%) | 1,342 (87.4%) |
| 5 Years | 249 (88.6%) | 134 (91.8%) |
| 6 to 11 Years | 2,182 (89.8%) | 1,681 (85.2%) |
| 12 to 14 Years | 1,221 (88.0%) | 1,174 (95.6%) |
| 15 Years | 498 (97.5%) | 309 (86.6%) |
| 16 and 17 Years | 1,045 (89.8%) | 787 (98.4%) |
| 18 to 24 Years | 2,340 (88.6%) | 2,399 (88.3%) |
| 25 to 34 Years | 4,207 (93.8%) | 4,039 (91.2%) |
| 35 to 44 Years | 4,048 (95.3%) | 3,719 (88.5%) |
| 45 to 54 Years | 4,016 (94.9%) | 3,841 (95.6%) |
| 55 to 64 Years | 3,970 (97.0%) | 3,630 (92.0%) |
| 65 to 74 Years | 2,407 (96.1%) | 2,968 (94.3%) |
| 75 Years and over | 1,791 (94.2%) | 2,637 (93.1%) |
| Total | 29,451 (93.1%) | 28,660 (91.5%) |
Income Below Poverty Among Married-Couple Families in Coon Rapids
The poverty statistics for married-couple families in Coon Rapids show that 2.7% or 306 of the total 11,442 families live below the poverty line. Families with 3 or 4 children have the highest poverty rate of 11.2%, comprising of 96 families. On the other hand, families with no children have the lowest poverty rate of 1.5%, which includes 102 families.
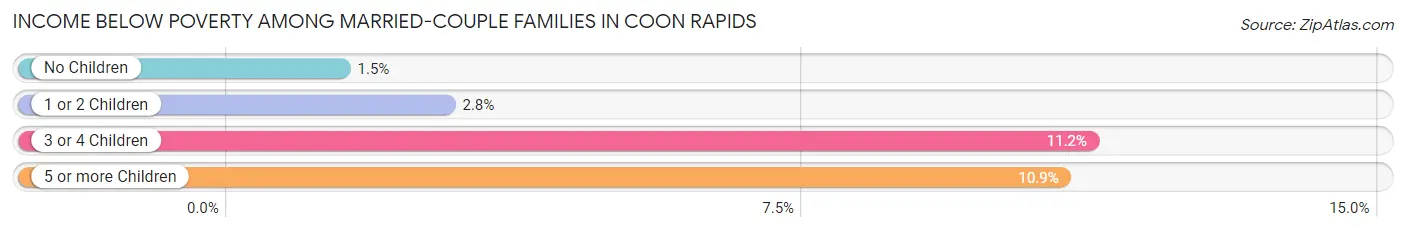
| Children | Above Poverty | Below Poverty |
| No Children | 6,816 (98.5%) | 102 (1.5%) |
| 1 or 2 Children | 3,521 (97.2%) | 103 (2.8%) |
| 3 or 4 Children | 758 (88.8%) | 96 (11.2%) |
| 5 or more Children | 41 (89.1%) | 5 (10.9%) |
| Total | 11,136 (97.3%) | 306 (2.7%) |
Income Below Poverty Among Single-Parent Households in Coon Rapids
According to the poverty data in Coon Rapids, 6.6% or 92 single-father households and 17.6% or 558 single-mother households are living below the poverty line. Among single-father households, those with 1 or 2 children have the highest poverty rate, with 84 households (12.2%) experiencing poverty. Likewise, among single-mother households, those with 5 or more children have the highest poverty rate, with 22 households (100.0%) falling below the poverty line.
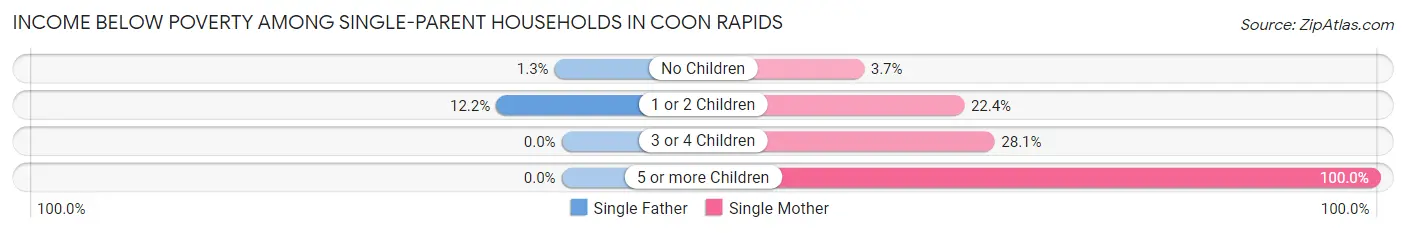
| Children | Single Father | Single Mother |
| No Children | 8 (1.3%) | 38 (3.7%) |
| 1 or 2 Children | 84 (12.2%) | 395 (22.4%) |
| 3 or 4 Children | 0 (0.0%) | 103 (28.1%) |
| 5 or more Children | 0 (0.0%) | 22 (100.0%) |
| Total | 92 (6.6%) | 558 (17.6%) |
Income Below Poverty Among Married-Couple vs Single-Parent Households in Coon Rapids
The poverty data for Coon Rapids shows that 306 of the married-couple family households (2.7%) and 650 of the single-parent households (14.2%) are living below the poverty level. Within the married-couple family households, those with 3 or 4 children have the highest poverty rate, with 96 households (11.2%) falling below the poverty line. Among the single-parent households, those with 5 or more children have the highest poverty rate, with 22 household (100.0%) living below poverty.
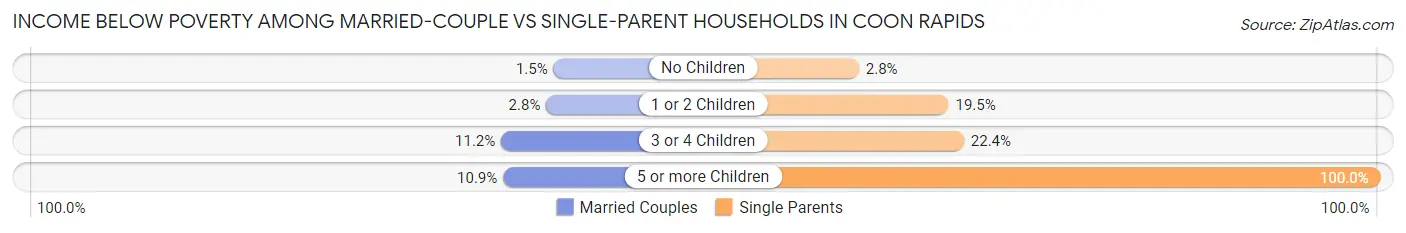
| Children | Married-Couple Families | Single-Parent Households |
| No Children | 102 (1.5%) | 46 (2.8%) |
| 1 or 2 Children | 103 (2.8%) | 479 (19.5%) |
| 3 or 4 Children | 96 (11.2%) | 103 (22.4%) |
| 5 or more Children | 5 (10.9%) | 22 (100.0%) |
| Total | 306 (2.7%) | 650 (14.2%) |
Race in Coon Rapids
The most populous races in Coon Rapids are White / Caucasian (48,645 | 76.8%), Black / African American (5,750 | 9.1%), and Two or more Races (4,037 | 6.4%).
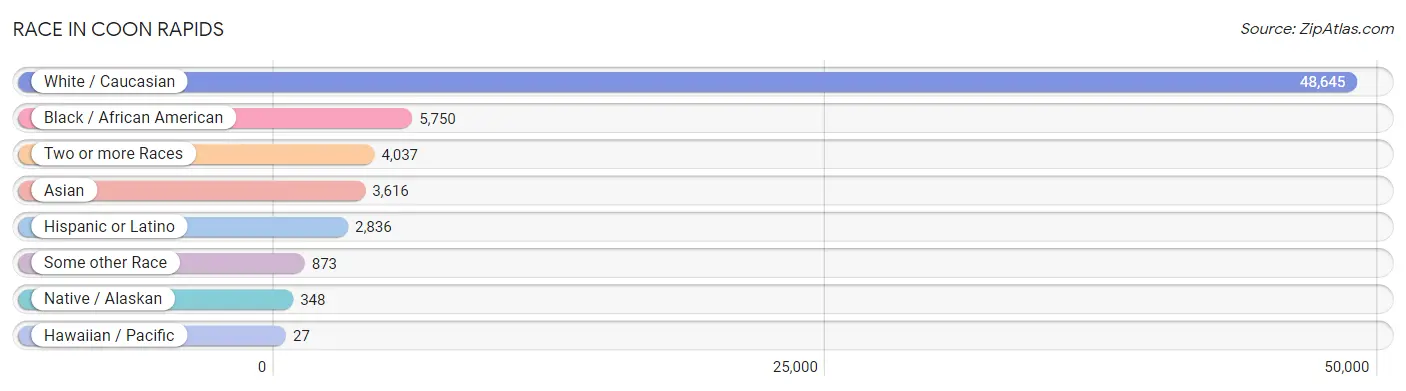
| Race | # Population | % Population |
| Asian | 3,616 | 5.7% |
| Black / African American | 5,750 | 9.1% |
| Hawaiian / Pacific | 27 | 0.0% |
| Hispanic or Latino | 2,836 | 4.5% |
| Native / Alaskan | 348 | 0.5% |
| White / Caucasian | 48,645 | 76.8% |
| Two or more Races | 4,037 | 6.4% |
| Some other Race | 873 | 1.4% |
| Total | 63,296 | 100.0% |
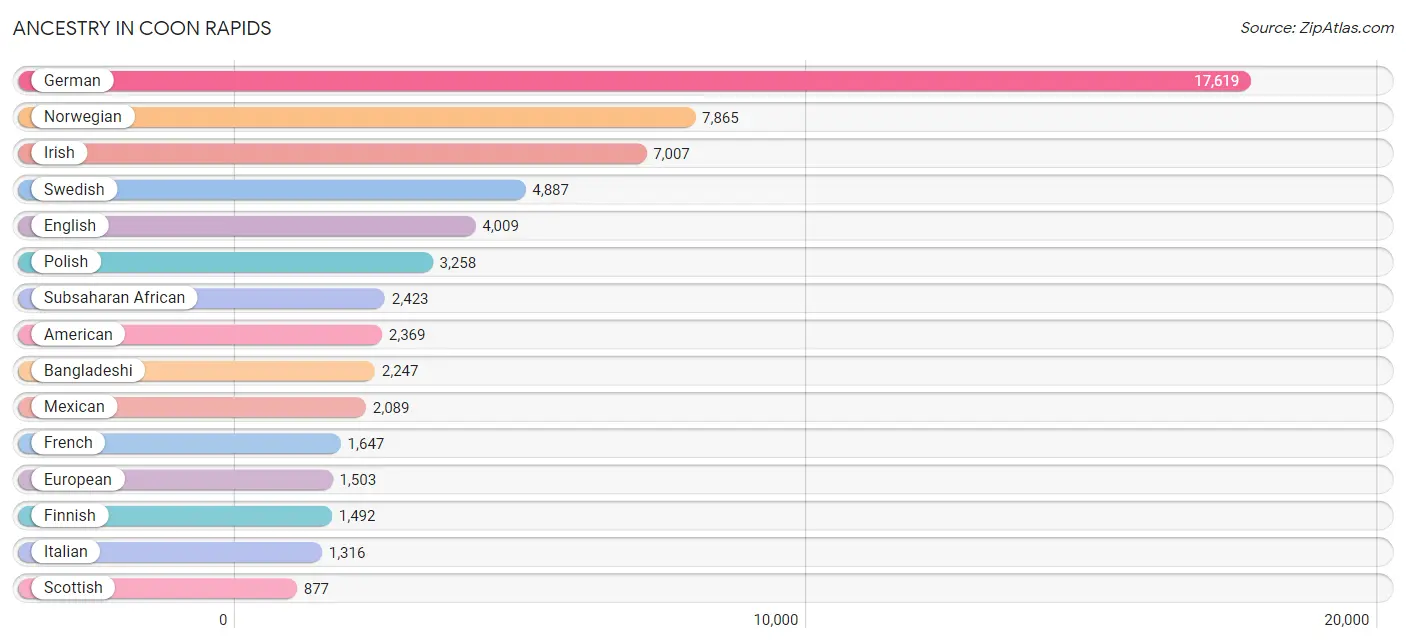
Ancestry in Coon Rapids
The most populous ancestries reported in Coon Rapids are German (17,619 | 27.8%), Norwegian (7,865 | 12.4%), Irish (7,007 | 11.1%), Swedish (4,887 | 7.7%), and English (4,009 | 6.3%), together accounting for 65.4% of all Coon Rapids residents.
| Ancestry | # Population | % Population |
| Afghan | 67 | 0.1% |
| African | 624 | 1.0% |
| Albanian | 8 | 0.0% |
| Alsatian | 11 | 0.0% |
| American | 2,369 | 3.7% |
| Arab | 494 | 0.8% |
| Argentinean | 40 | 0.1% |
| Australian | 36 | 0.1% |
| Austrian | 89 | 0.1% |
| Bangladeshi | 2,247 | 3.5% |
| Belgian | 30 | 0.1% |
| Bhutanese | 90 | 0.1% |
| Brazilian | 85 | 0.1% |
| British | 123 | 0.2% |
| Bulgarian | 19 | 0.0% |
| Burmese | 307 | 0.5% |
| Cajun | 5 | 0.0% |
| Canadian | 73 | 0.1% |
| Celtic | 11 | 0.0% |
| Central American | 179 | 0.3% |
| Cherokee | 43 | 0.1% |
| Chilean | 6 | 0.0% |
| Chippewa | 484 | 0.8% |
| Choctaw | 11 | 0.0% |
| Colombian | 20 | 0.0% |
| Costa Rican | 20 | 0.0% |
| Cree | 8 | 0.0% |
| Creek | 2 | 0.0% |
| Croatian | 92 | 0.2% |
| Cuban | 123 | 0.2% |
| Czech | 537 | 0.9% |
| Czechoslovakian | 121 | 0.2% |
| Danish | 717 | 1.1% |
| Dominican | 4 | 0.0% |
| Dutch | 528 | 0.8% |
| Eastern European | 198 | 0.3% |
| Ecuadorian | 15 | 0.0% |
| Egyptian | 50 | 0.1% |
| English | 4,009 | 6.3% |
| Ethiopian | 352 | 0.6% |
| European | 1,503 | 2.4% |
| Finnish | 1,492 | 2.4% |
| French | 1,647 | 2.6% |
| French American Indian | 33 | 0.1% |
| French Canadian | 726 | 1.1% |
| German | 17,619 | 27.8% |
| German Russian | 8 | 0.0% |
| Ghanaian | 58 | 0.1% |
| Greek | 72 | 0.1% |
| Guamanian / Chamorro | 103 | 0.2% |
| Guatemalan | 92 | 0.2% |
| Guyanese | 52 | 0.1% |
| Honduran | 4 | 0.0% |
| Hungarian | 153 | 0.2% |
| Icelander | 75 | 0.1% |
| Indian (Asian) | 112 | 0.2% |
| Inupiat | 26 | 0.0% |
| Iraqi | 175 | 0.3% |
| Irish | 7,007 | 11.1% |
| Iroquois | 23 | 0.0% |
| Italian | 1,316 | 2.1% |
| Jamaican | 180 | 0.3% |
| Japanese | 109 | 0.2% |
| Kenyan | 293 | 0.5% |
| Korean | 453 | 0.7% |
| Latvian | 19 | 0.0% |
| Lebanese | 10 | 0.0% |
| Liberian | 81 | 0.1% |
| Lithuanian | 62 | 0.1% |
| Luxembourger | 34 | 0.1% |
| Malaysian | 189 | 0.3% |
| Mexican | 2,089 | 3.3% |
| Moroccan | 67 | 0.1% |
| Navajo | 12 | 0.0% |
| Nigerian | 383 | 0.6% |
| Northern European | 155 | 0.2% |
| Norwegian | 7,865 | 12.4% |
| Palestinian | 22 | 0.0% |
| Panamanian | 44 | 0.1% |
| Peruvian | 28 | 0.0% |
| Polish | 3,258 | 5.1% |
| Portuguese | 25 | 0.0% |
| Puerto Rican | 295 | 0.5% |
| Romanian | 5 | 0.0% |
| Russian | 431 | 0.7% |
| Salvadoran | 19 | 0.0% |
| Samoan | 12 | 0.0% |
| Scandinavian | 573 | 0.9% |
| Scotch-Irish | 260 | 0.4% |
| Scottish | 877 | 1.4% |
| Serbian | 24 | 0.0% |
| Sioux | 116 | 0.2% |
| Slavic | 7 | 0.0% |
| Slovak | 239 | 0.4% |
| Slovene | 37 | 0.1% |
| Somali | 433 | 0.7% |
| South American | 109 | 0.2% |
| South American Indian | 85 | 0.1% |
| Spaniard | 5 | 0.0% |
| Spanish | 13 | 0.0% |
| Sri Lankan | 419 | 0.7% |
| Subsaharan African | 2,423 | 3.8% |
| Swedish | 4,887 | 7.7% |
| Swiss | 116 | 0.2% |
| Thai | 130 | 0.2% |
| Ukrainian | 508 | 0.8% |
| Welsh | 555 | 0.9% |
| Yugoslavian | 93 | 0.2% | View All 108 Rows |
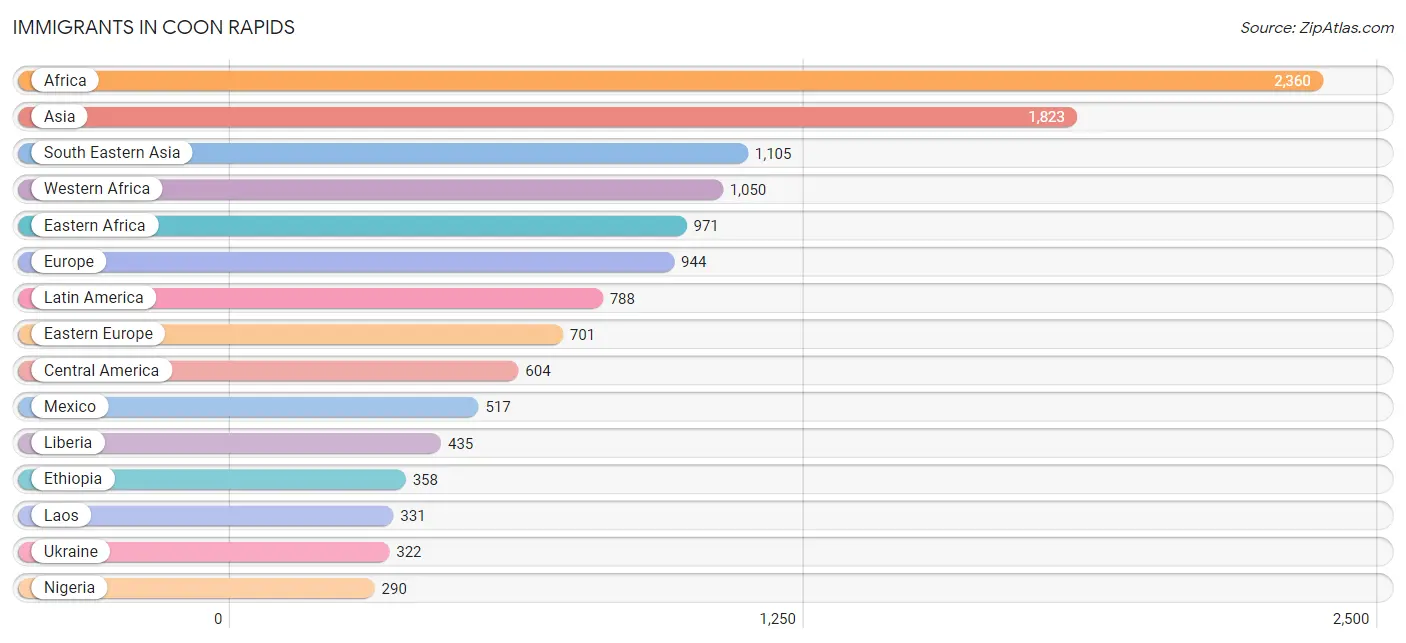
Immigrants in Coon Rapids
The most numerous immigrant groups reported in Coon Rapids came from Africa (2,360 | 3.7%), Asia (1,823 | 2.9%), South Eastern Asia (1,105 | 1.8%), Western Africa (1,050 | 1.7%), and Eastern Africa (971 | 1.5%), together accounting for 11.5% of all Coon Rapids residents.
| Immigration Origin | # Population | % Population |
| Afghanistan | 40 | 0.1% |
| Africa | 2,360 | 3.7% |
| Argentina | 8 | 0.0% |
| Asia | 1,823 | 2.9% |
| Australia | 11 | 0.0% |
| Austria | 22 | 0.0% |
| Bangladesh | 7 | 0.0% |
| Barbados | 5 | 0.0% |
| Belarus | 77 | 0.1% |
| Bosnia and Herzegovina | 126 | 0.2% |
| Brazil | 37 | 0.1% |
| Cambodia | 47 | 0.1% |
| Cameroon | 124 | 0.2% |
| Canada | 55 | 0.1% |
| Caribbean | 9 | 0.0% |
| Central America | 604 | 0.9% |
| China | 43 | 0.1% |
| Colombia | 5 | 0.0% |
| Costa Rica | 20 | 0.0% |
| Croatia | 13 | 0.0% |
| Denmark | 5 | 0.0% |
| Dominican Republic | 4 | 0.0% |
| Eastern Africa | 971 | 1.5% |
| Eastern Asia | 242 | 0.4% |
| Eastern Europe | 701 | 1.1% |
| Ecuador | 24 | 0.0% |
| Egypt | 66 | 0.1% |
| El Salvador | 9 | 0.0% |
| England | 46 | 0.1% |
| Eritrea | 43 | 0.1% |
| Ethiopia | 358 | 0.6% |
| Europe | 944 | 1.5% |
| Germany | 114 | 0.2% |
| Ghana | 133 | 0.2% |
| Guatemala | 54 | 0.1% |
| Guyana | 19 | 0.0% |
| Honduras | 4 | 0.0% |
| Hungary | 14 | 0.0% |
| India | 25 | 0.0% |
| Iraq | 212 | 0.3% |
| Japan | 48 | 0.1% |
| Kazakhstan | 30 | 0.1% |
| Kenya | 260 | 0.4% |
| Korea | 151 | 0.2% |
| Laos | 331 | 0.5% |
| Latin America | 788 | 1.2% |
| Latvia | 8 | 0.0% |
| Liberia | 435 | 0.7% |
| Malaysia | 12 | 0.0% |
| Mexico | 517 | 0.8% |
| Middle Africa | 124 | 0.2% |
| Moldova | 14 | 0.0% |
| Morocco | 38 | 0.1% |
| Netherlands | 26 | 0.0% |
| Nigeria | 290 | 0.5% |
| Northern Africa | 128 | 0.2% |
| Northern Europe | 81 | 0.1% |
| Oceania | 23 | 0.0% |
| Pakistan | 73 | 0.1% |
| Peru | 40 | 0.1% |
| Philippines | 202 | 0.3% |
| Poland | 39 | 0.1% |
| Russia | 39 | 0.1% |
| Saudi Arabia | 5 | 0.0% |
| Scotland | 12 | 0.0% |
| Sierra Leone | 86 | 0.1% |
| Somalia | 236 | 0.4% |
| South America | 175 | 0.3% |
| South Central Asia | 229 | 0.4% |
| South Eastern Asia | 1,105 | 1.8% |
| Sri Lanka | 54 | 0.1% |
| Sudan | 24 | 0.0% |
| Sweden | 14 | 0.0% |
| Syria | 22 | 0.0% |
| Thailand | 251 | 0.4% |
| Uganda | 51 | 0.1% |
| Ukraine | 322 | 0.5% |
| Vietnam | 262 | 0.4% |
| Western Africa | 1,050 | 1.7% |
| Western Asia | 247 | 0.4% |
| Western Europe | 162 | 0.3% | View All 81 Rows |
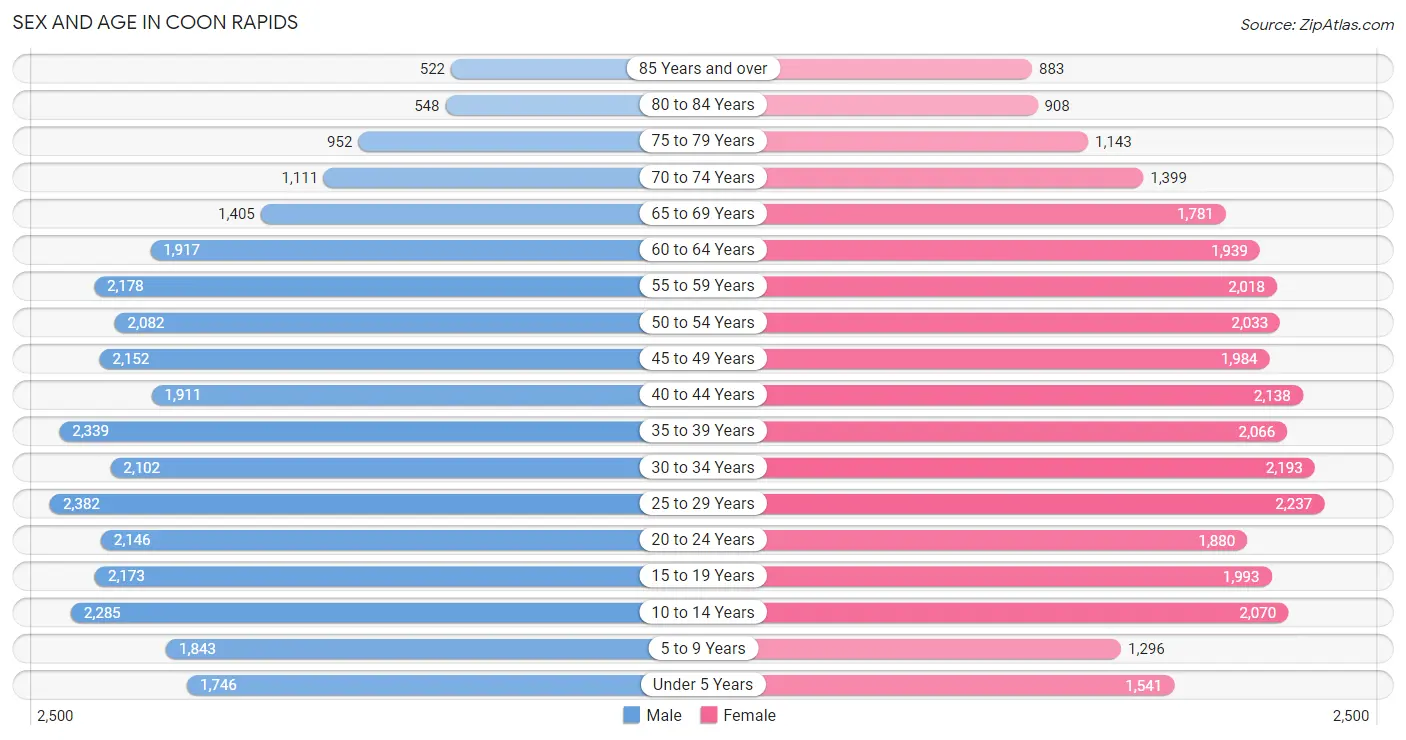
Sex and Age in Coon Rapids
Sex and Age in Coon Rapids
The most populous age groups in Coon Rapids are 25 to 29 Years (2,382 | 7.5%) for men and 25 to 29 Years (2,237 | 7.1%) for women.
| Age Bracket | Male | Female |
| Under 5 Years | 1,746 (5.5%) | 1,541 (4.9%) |
| 5 to 9 Years | 1,843 (5.8%) | 1,296 (4.1%) |
| 10 to 14 Years | 2,285 (7.2%) | 2,070 (6.6%) |
| 15 to 19 Years | 2,173 (6.8%) | 1,993 (6.3%) |
| 20 to 24 Years | 2,146 (6.8%) | 1,880 (6.0%) |
| 25 to 29 Years | 2,382 (7.5%) | 2,237 (7.1%) |
| 30 to 34 Years | 2,102 (6.6%) | 2,193 (7.0%) |
| 35 to 39 Years | 2,339 (7.4%) | 2,066 (6.6%) |
| 40 to 44 Years | 1,911 (6.0%) | 2,138 (6.8%) |
| 45 to 49 Years | 2,152 (6.8%) | 1,984 (6.3%) |
| 50 to 54 Years | 2,082 (6.6%) | 2,033 (6.5%) |
| 55 to 59 Years | 2,178 (6.9%) | 2,018 (6.4%) |
| 60 to 64 Years | 1,917 (6.0%) | 1,939 (6.2%) |
| 65 to 69 Years | 1,405 (4.4%) | 1,781 (5.7%) |
| 70 to 74 Years | 1,111 (3.5%) | 1,399 (4.4%) |
| 75 to 79 Years | 952 (3.0%) | 1,143 (3.6%) |
| 80 to 84 Years | 548 (1.7%) | 908 (2.9%) |
| 85 Years and over | 522 (1.6%) | 883 (2.8%) |
| Total | 31,794 (100.0%) | 31,502 (100.0%) |
Families and Households in Coon Rapids
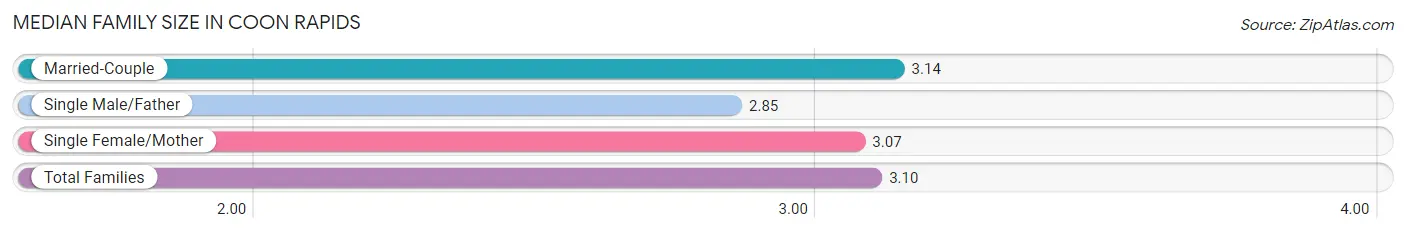
Median Family Size in Coon Rapids
The median family size in Coon Rapids is 3.10 persons per family, with married-couple families (11,442 | 71.5%) accounting for the largest median family size of 3.14 persons per family. On the other hand, single male/father families (1,391 | 8.7%) represent the smallest median family size with 2.85 persons per family.
| Family Type | # Families | Family Size |
| Married-Couple | 11,442 (71.5%) | 3.14 |
| Single Male/Father | 1,391 (8.7%) | 2.85 |
| Single Female/Mother | 3,169 (19.8%) | 3.07 |
| Total Families | 16,002 (100.0%) | 3.10 |
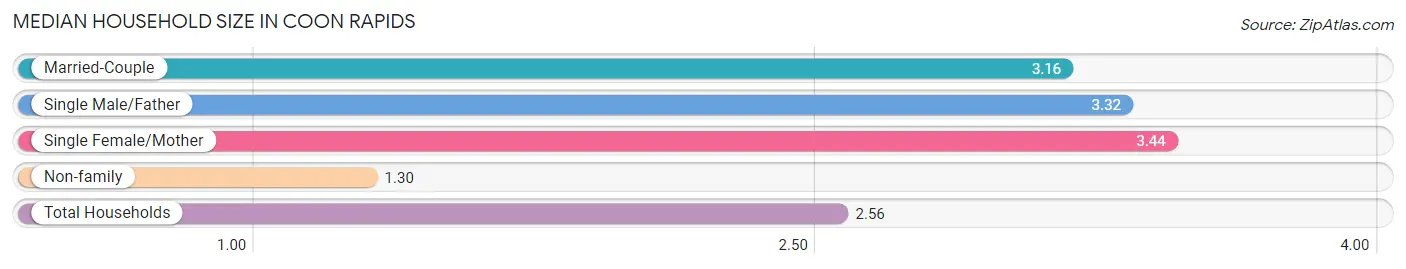
Median Household Size in Coon Rapids
The median household size in Coon Rapids is 2.56 persons per household, with single female/mother households (3,169 | 12.9%) accounting for the largest median household size of 3.44 persons per household. non-family households (8,572 | 34.9%) represent the smallest median household size with 1.30 persons per household.
| Household Type | # Households | Household Size |
| Married-Couple | 11,442 (46.6%) | 3.16 |
| Single Male/Father | 1,391 (5.7%) | 3.32 |
| Single Female/Mother | 3,169 (12.9%) | 3.44 |
| Non-family | 8,572 (34.9%) | 1.30 |
| Total Households | 24,574 (100.0%) | 2.56 |
Household Size by Marriage Status in Coon Rapids
Out of a total of 24,574 households in Coon Rapids, 16,002 (65.1%) are family households, while 8,572 (34.9%) are nonfamily households. The most numerous type of family households are 2-person households, comprising 7,201, and the most common type of nonfamily households are 1-person households, comprising 6,589.
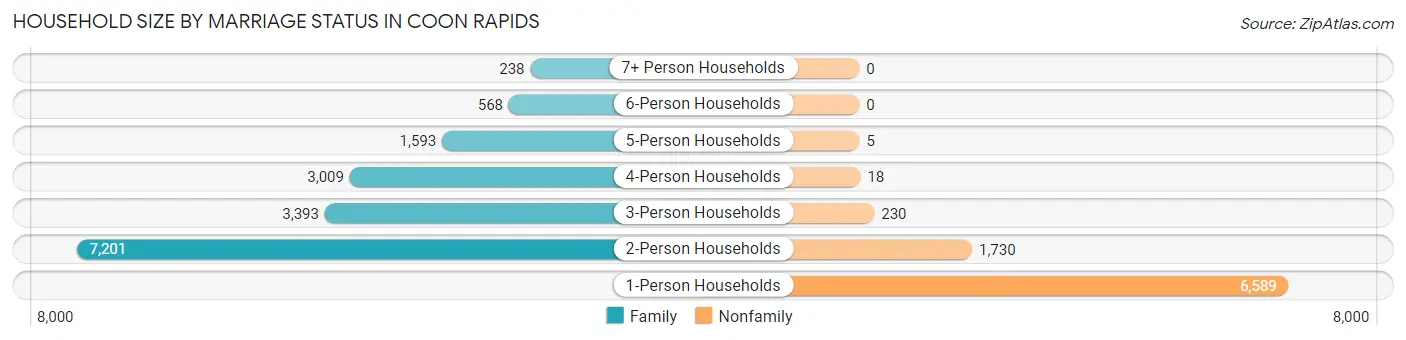
| Household Size | Family Households | Nonfamily Households |
| 1-Person Households | - | 6,589 (26.8%) |
| 2-Person Households | 7,201 (29.3%) | 1,730 (7.0%) |
| 3-Person Households | 3,393 (13.8%) | 230 (0.9%) |
| 4-Person Households | 3,009 (12.2%) | 18 (0.1%) |
| 5-Person Households | 1,593 (6.5%) | 5 (0.0%) |
| 6-Person Households | 568 (2.3%) | 0 (0.0%) |
| 7+ Person Households | 238 (1.0%) | 0 (0.0%) |
| Total | 16,002 (65.1%) | 8,572 (34.9%) |
Female Fertility in Coon Rapids
Fertility by Age in Coon Rapids
Average fertility rate in Coon Rapids is 59.0 births per 1,000 women. Women in the age bracket of 20 to 34 years have the highest fertility rate with 110.0 births per 1,000 women. Women in the age bracket of 20 to 34 years acount for 79.0% of all women with births.
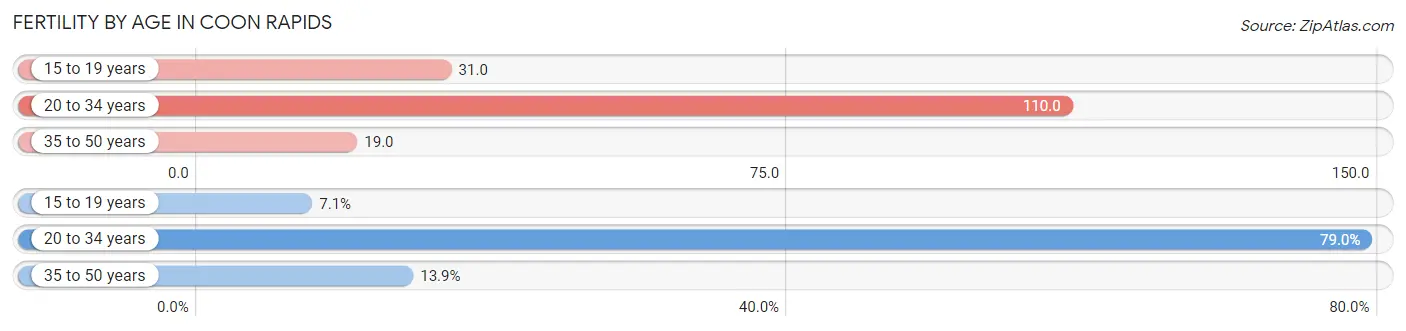
| Age Bracket | Women with Births | Births / 1,000 Women |
| 15 to 19 years | 62 (7.1%) | 31.0 |
| 20 to 34 years | 692 (79.0%) | 110.0 |
| 35 to 50 years | 122 (13.9%) | 19.0 |
| Total | 876 (100.0%) | 59.0 |
Fertility by Age by Marriage Status in Coon Rapids
51.3% of women with births (876) in Coon Rapids are married. The highest percentage of unmarried women with births falls into 15 to 19 years age bracket with 100.0% of them unmarried at the time of birth, while the lowest percentage of unmarried women with births belong to 35 to 50 years age bracket with 0.0% of them unmarried.
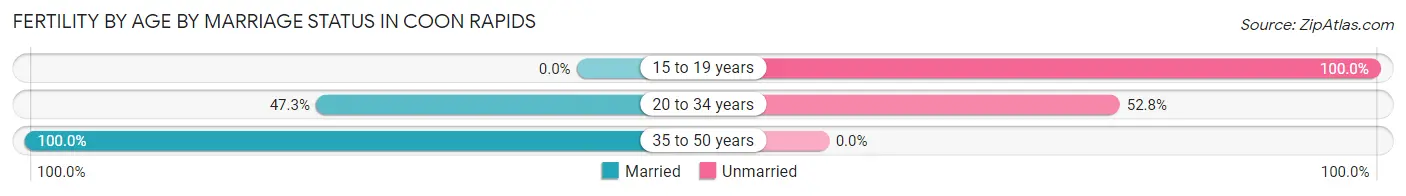
| Age Bracket | Married | Unmarried |
| 15 to 19 years | 0 (0.0%) | 62 (100.0%) |
| 20 to 34 years | 327 (47.2%) | 365 (52.7%) |
| 35 to 50 years | 122 (100.0%) | 0 (0.0%) |
| Total | 449 (51.3%) | 427 (48.7%) |
Fertility by Education in Coon Rapids
Average fertility rate in Coon Rapids is 59.0 births per 1,000 women. Women with the education attainment of high school diploma have the highest fertility rate of 70.0 births per 1,000 women, while women with the education attainment of graduate degree have the lowest fertility at 44.0 births per 1,000 women. Women with the education attainment of college or associate's degree represent 43.4% of all women with births.
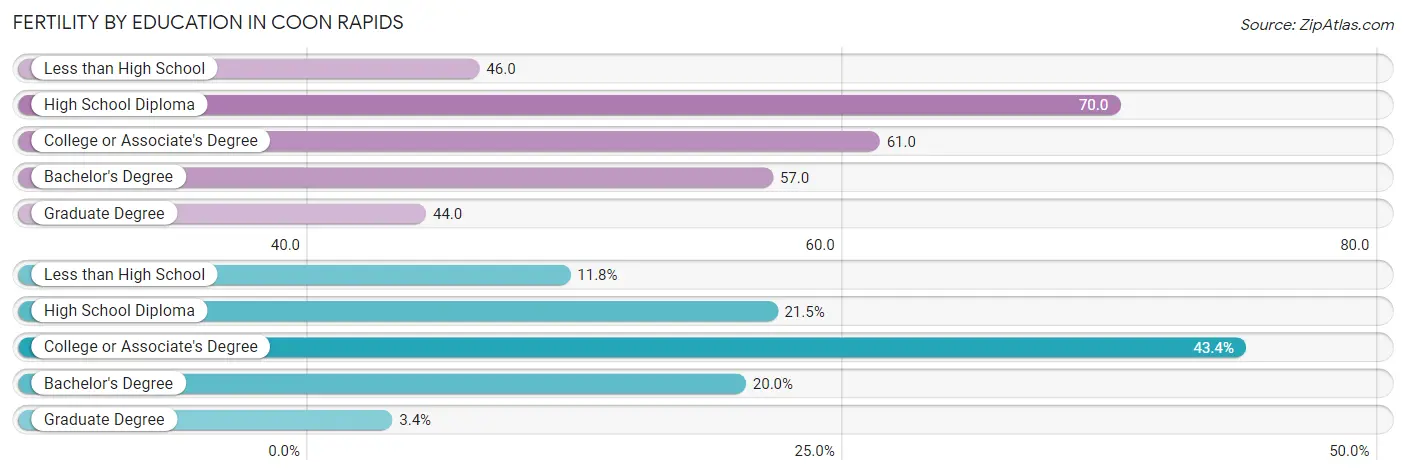
| Educational Attainment | Women with Births | Births / 1,000 Women |
| Less than High School | 103 (11.8%) | 46.0 |
| High School Diploma | 188 (21.5%) | 70.0 |
| College or Associate's Degree | 380 (43.4%) | 61.0 |
| Bachelor's Degree | 175 (20.0%) | 57.0 |
| Graduate Degree | 30 (3.4%) | 44.0 |
| Total | 876 (100.0%) | 59.0 |
Fertility by Education by Marriage Status in Coon Rapids
48.7% of women with births in Coon Rapids are unmarried. Women with the educational attainment of bachelor's degree are most likely to be married with 100.0% of them married at childbirth, while women with the educational attainment of less than high school are least likely to be married with 90.3% of them unmarried at childbirth.
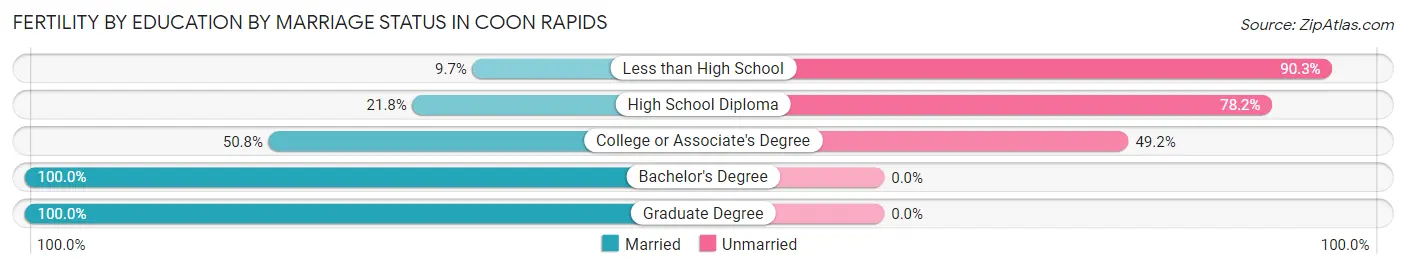
| Educational Attainment | Married | Unmarried |
| Less than High School | 10 (9.7%) | 93 (90.3%) |
| High School Diploma | 41 (21.8%) | 147 (78.2%) |
| College or Associate's Degree | 193 (50.8%) | 187 (49.2%) |
| Bachelor's Degree | 175 (100.0%) | 0 (0.0%) |
| Graduate Degree | 30 (100.0%) | 0 (0.0%) |
| Total | 449 (51.3%) | 427 (48.7%) |
Employment Characteristics in Coon Rapids
Employment by Class of Employer in Coon Rapids
Among the 33,813 employed individuals in Coon Rapids, private company employees (25,345 | 75.0%), not-for-profit organizations (2,768 | 8.2%), and local government employees (2,136 | 6.3%) make up the most common classes of employment.
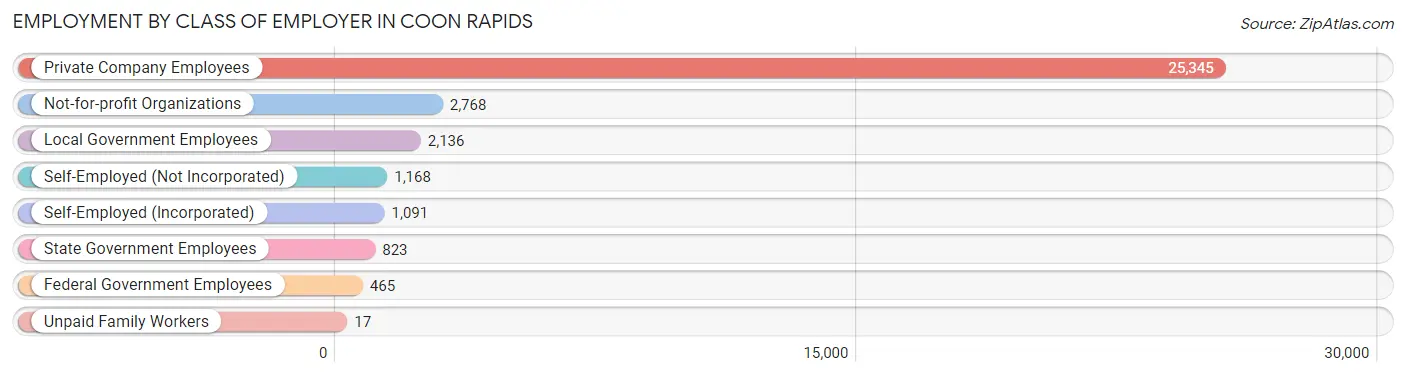
| Employer Class | # Employees | % Employees |
| Private Company Employees | 25,345 | 75.0% |
| Self-Employed (Incorporated) | 1,091 | 3.2% |
| Self-Employed (Not Incorporated) | 1,168 | 3.5% |
| Not-for-profit Organizations | 2,768 | 8.2% |
| Local Government Employees | 2,136 | 6.3% |
| State Government Employees | 823 | 2.4% |
| Federal Government Employees | 465 | 1.4% |
| Unpaid Family Workers | 17 | 0.1% |
| Total | 33,813 | 100.0% |
Employment Status by Age in Coon Rapids
According to the labor force statistics for Coon Rapids, out of the total population over 16 years of age (51,645), 69.9% or 36,100 individuals are in the labor force, with 4.2% or 1,516 of them unemployed. The age group with the highest labor force participation rate is 25 to 29 years, with 90.1% or 4,162 individuals in the labor force. Within the labor force, the 16 to 19 years age range has the highest percentage of unemployed individuals, with 13.7% or 259 of them being unemployed.
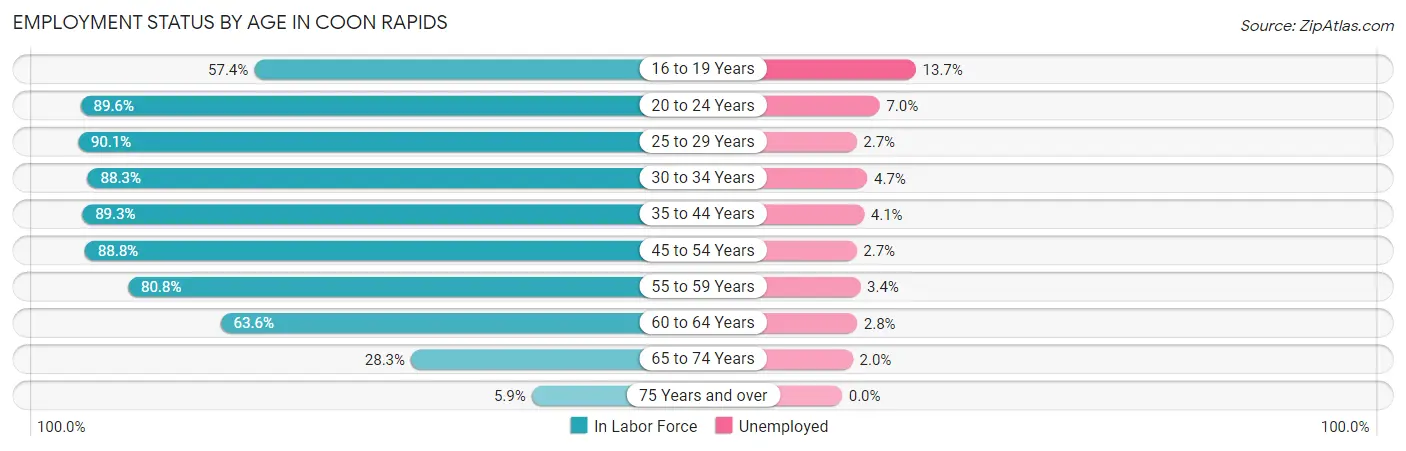
| Age Bracket | In Labor Force | Unemployed |
| 16 to 19 Years | 1,892 (57.4%) | 259 (13.7%) |
| 20 to 24 Years | 3,607 (89.6%) | 252 (7.0%) |
| 25 to 29 Years | 4,162 (90.1%) | 112 (2.7%) |
| 30 to 34 Years | 3,792 (88.3%) | 178 (4.7%) |
| 35 to 44 Years | 7,549 (89.3%) | 310 (4.1%) |
| 45 to 54 Years | 7,327 (88.8%) | 198 (2.7%) |
| 55 to 59 Years | 3,390 (80.8%) | 115 (3.4%) |
| 60 to 64 Years | 2,452 (63.6%) | 69 (2.8%) |
| 65 to 74 Years | 1,612 (28.3%) | 32 (2.0%) |
| 75 Years and over | 292 (5.9%) | 0 (0.0%) |
| Total | 36,100 (69.9%) | 1,516 (4.2%) |
Employment Status by Educational Attainment in Coon Rapids
According to labor force statistics for Coon Rapids, 85.2% of individuals (28,688) out of the total population between 25 and 64 years of age (33,671) are in the labor force, with 3.4% or 975 of them being unemployed. The group with the highest labor force participation rate are those with the educational attainment of bachelor's degree or higher, with 91.5% or 7,950 individuals in the labor force. Within the labor force, individuals with less than high school education have the highest percentage of unemployment, with 13.0% or 144 of them being unemployed.
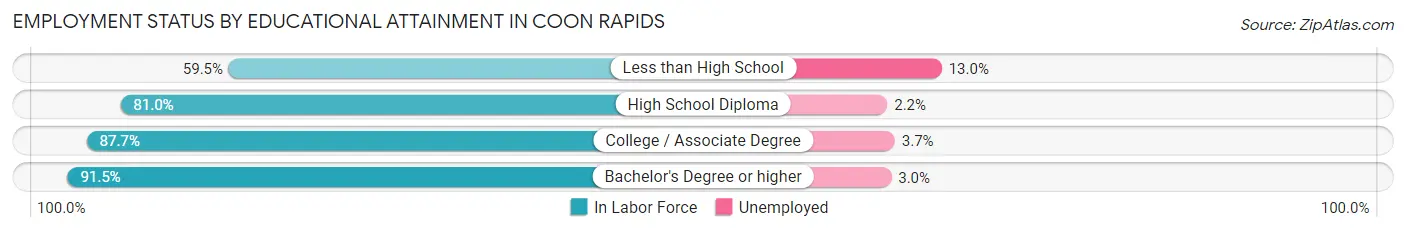
| Educational Attainment | In Labor Force | Unemployed |
| Less than High School | 1,105 (59.5%) | 241 (13.0%) |
| High School Diploma | 7,952 (81.0%) | 216 (2.2%) |
| College / Associate Degree | 11,672 (87.7%) | 492 (3.7%) |
| Bachelor's Degree or higher | 7,950 (91.5%) | 261 (3.0%) |
| Total | 28,688 (85.2%) | 1,145 (3.4%) |
Employment Occupations by Sex in Coon Rapids
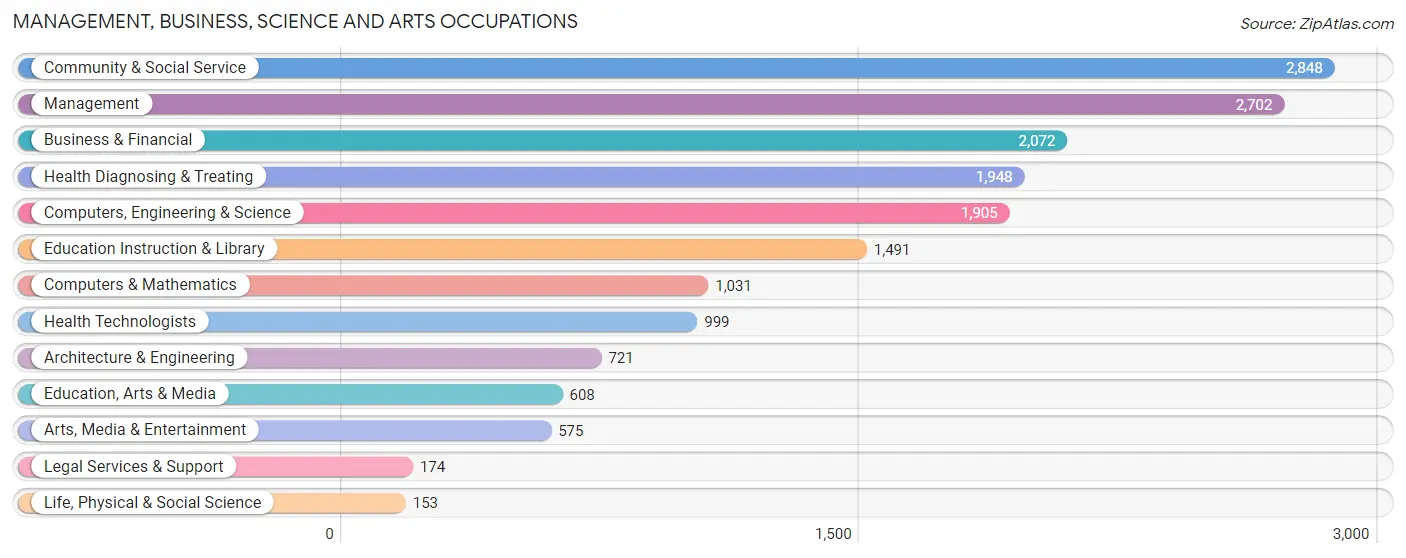
Management, Business, Science and Arts Occupations
The most common Management, Business, Science and Arts occupations in Coon Rapids are Community & Social Service (2,848 | 8.3%), Management (2,702 | 7.8%), Business & Financial (2,072 | 6.0%), Health Diagnosing & Treating (1,948 | 5.7%), and Computers, Engineering & Science (1,905 | 5.5%).
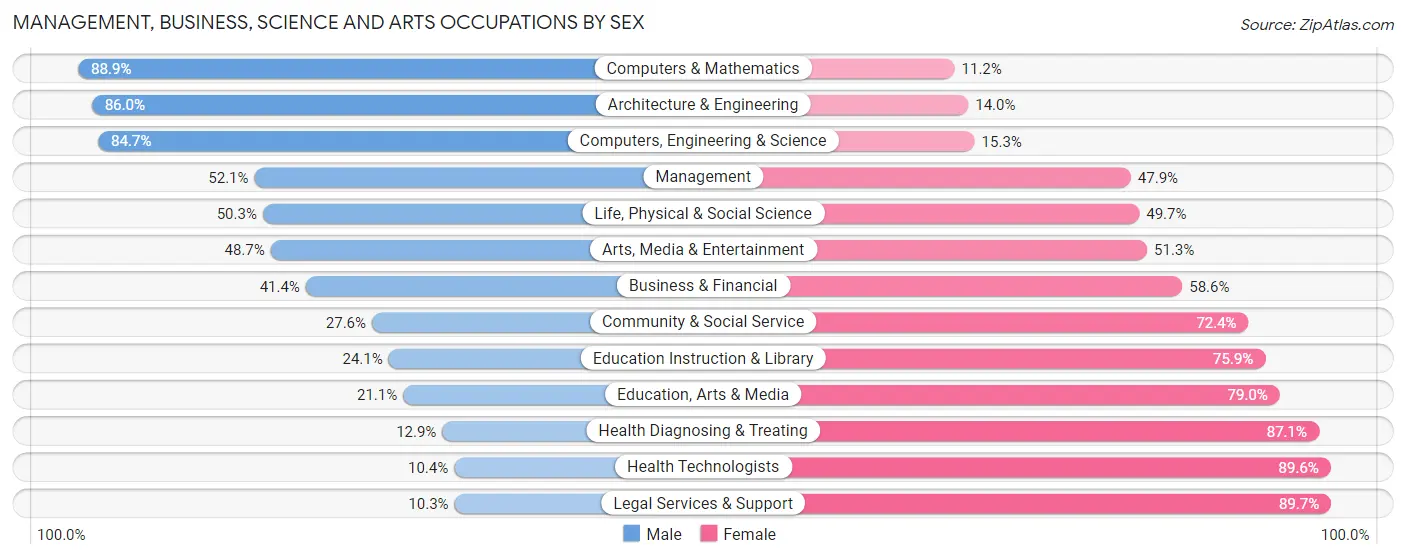
Management, Business, Science and Arts Occupations by Sex
Within the Management, Business, Science and Arts occupations in Coon Rapids, the most male-oriented occupations are Computers & Mathematics (88.8%), Architecture & Engineering (86.0%), and Computers, Engineering & Science (84.7%), while the most female-oriented occupations are Legal Services & Support (89.7%), Health Technologists (89.6%), and Health Diagnosing & Treating (87.1%).
| Occupation | Male | Female |
| Management | 1,407 (52.1%) | 1,295 (47.9%) |
| Business & Financial | 857 (41.4%) | 1,215 (58.6%) |
| Computers, Engineering & Science | 1,613 (84.7%) | 292 (15.3%) |
| Computers & Mathematics | 916 (88.8%) | 115 (11.2%) |
| Architecture & Engineering | 620 (86.0%) | 101 (14.0%) |
| Life, Physical & Social Science | 77 (50.3%) | 76 (49.7%) |
| Community & Social Service | 785 (27.6%) | 2,063 (72.4%) |
| Education, Arts & Media | 128 (21.0%) | 480 (78.9%) |
| Legal Services & Support | 18 (10.3%) | 156 (89.7%) |
| Education Instruction & Library | 359 (24.1%) | 1,132 (75.9%) |
| Arts, Media & Entertainment | 280 (48.7%) | 295 (51.3%) |
| Health Diagnosing & Treating | 251 (12.9%) | 1,697 (87.1%) |
| Health Technologists | 104 (10.4%) | 895 (89.6%) |
| Total (Category) | 4,913 (42.8%) | 6,562 (57.2%) |
| Total (Overall) | 17,963 (52.1%) | 16,535 (47.9%) |
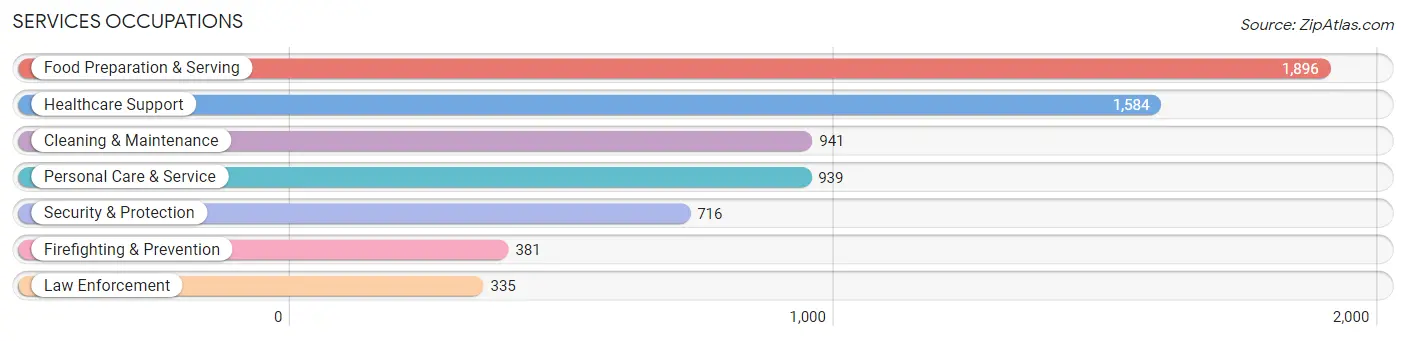
Services Occupations
The most common Services occupations in Coon Rapids are Food Preparation & Serving (1,896 | 5.5%), Healthcare Support (1,584 | 4.6%), Cleaning & Maintenance (941 | 2.7%), Personal Care & Service (939 | 2.7%), and Security & Protection (716 | 2.1%).
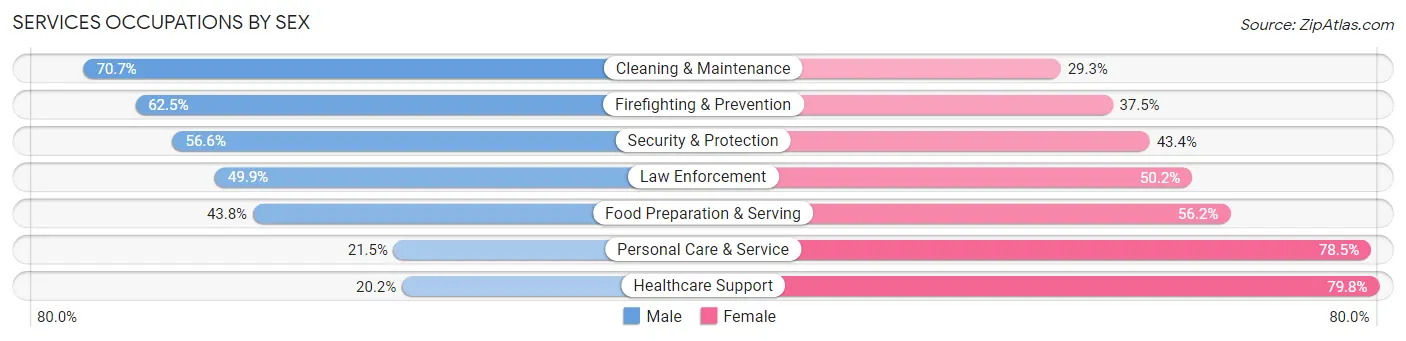
Services Occupations by Sex
Within the Services occupations in Coon Rapids, the most male-oriented occupations are Cleaning & Maintenance (70.7%), Firefighting & Prevention (62.5%), and Security & Protection (56.6%), while the most female-oriented occupations are Healthcare Support (79.8%), Personal Care & Service (78.5%), and Food Preparation & Serving (56.2%).
| Occupation | Male | Female |
| Healthcare Support | 320 (20.2%) | 1,264 (79.8%) |
| Security & Protection | 405 (56.6%) | 311 (43.4%) |
| Firefighting & Prevention | 238 (62.5%) | 143 (37.5%) |
| Law Enforcement | 167 (49.8%) | 168 (50.1%) |
| Food Preparation & Serving | 831 (43.8%) | 1,065 (56.2%) |
| Cleaning & Maintenance | 665 (70.7%) | 276 (29.3%) |
| Personal Care & Service | 202 (21.5%) | 737 (78.5%) |
| Total (Category) | 2,423 (39.9%) | 3,653 (60.1%) |
| Total (Overall) | 17,963 (52.1%) | 16,535 (47.9%) |
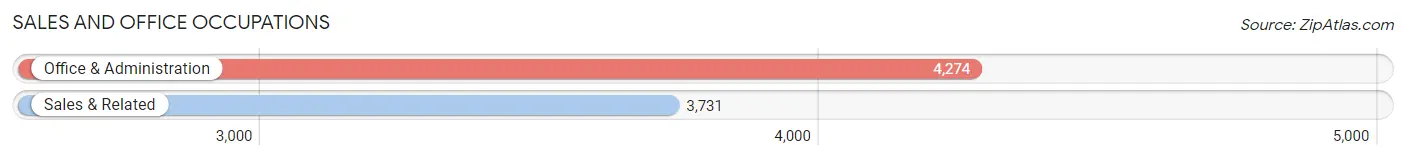
Sales and Office Occupations
The most common Sales and Office occupations in Coon Rapids are Office & Administration (4,274 | 12.4%), and Sales & Related (3,731 | 10.8%).
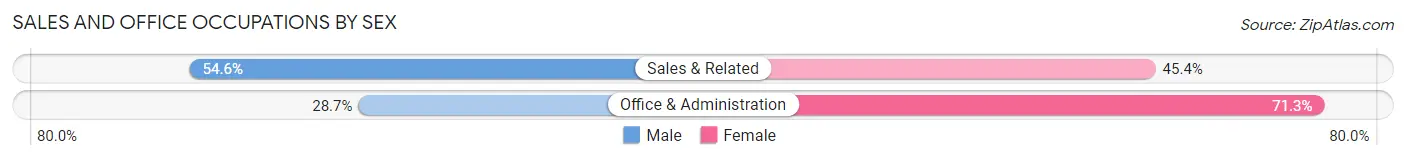
Sales and Office Occupations by Sex
| Occupation | Male | Female |
| Sales & Related | 2,037 (54.6%) | 1,694 (45.4%) |
| Office & Administration | 1,225 (28.7%) | 3,049 (71.3%) |
| Total (Category) | 3,262 (40.7%) | 4,743 (59.3%) |
| Total (Overall) | 17,963 (52.1%) | 16,535 (47.9%) |
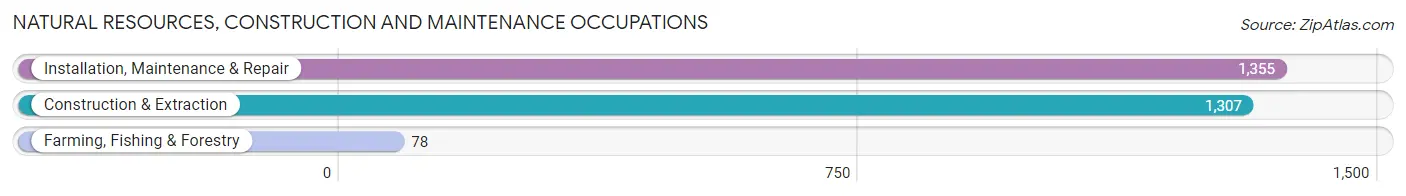
Natural Resources, Construction and Maintenance Occupations
The most common Natural Resources, Construction and Maintenance occupations in Coon Rapids are Installation, Maintenance & Repair (1,355 | 3.9%), Construction & Extraction (1,307 | 3.8%), and Farming, Fishing & Forestry (78 | 0.2%).
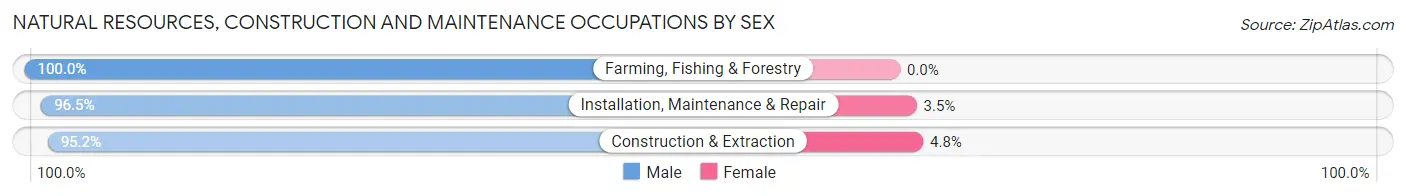
Natural Resources, Construction and Maintenance Occupations by Sex
| Occupation | Male | Female |
| Farming, Fishing & Forestry | 78 (100.0%) | 0 (0.0%) |
| Construction & Extraction | 1,244 (95.2%) | 63 (4.8%) |
| Installation, Maintenance & Repair | 1,308 (96.5%) | 47 (3.5%) |
| Total (Category) | 2,630 (96.0%) | 110 (4.0%) |
| Total (Overall) | 17,963 (52.1%) | 16,535 (47.9%) |
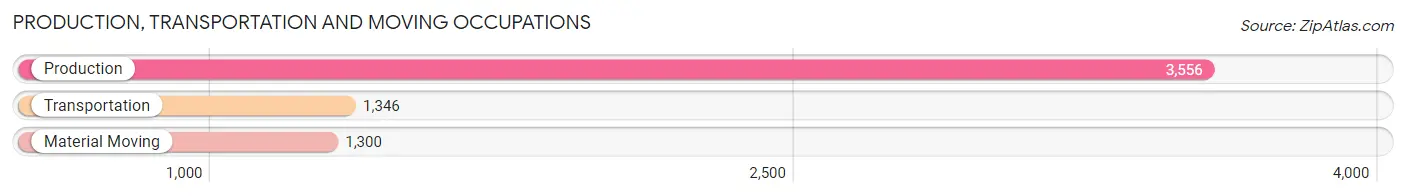
Production, Transportation and Moving Occupations
The most common Production, Transportation and Moving occupations in Coon Rapids are Production (3,556 | 10.3%), Transportation (1,346 | 3.9%), and Material Moving (1,300 | 3.8%).
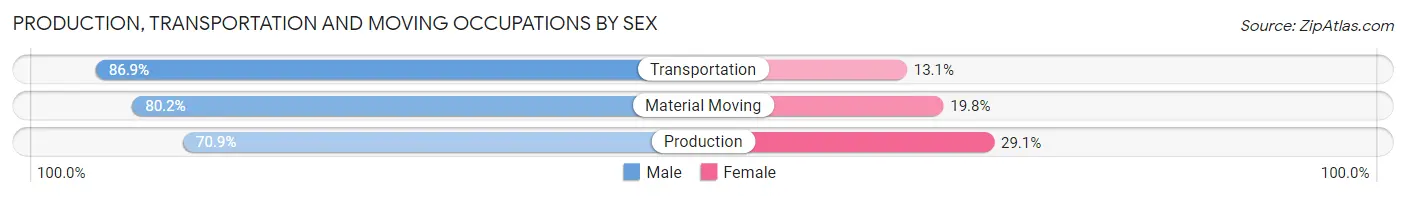
Production, Transportation and Moving Occupations by Sex
| Occupation | Male | Female |
| Production | 2,522 (70.9%) | 1,034 (29.1%) |
| Transportation | 1,170 (86.9%) | 176 (13.1%) |
| Material Moving | 1,043 (80.2%) | 257 (19.8%) |
| Total (Category) | 4,735 (76.3%) | 1,467 (23.6%) |
| Total (Overall) | 17,963 (52.1%) | 16,535 (47.9%) |
Employment Industries by Sex in Coon Rapids
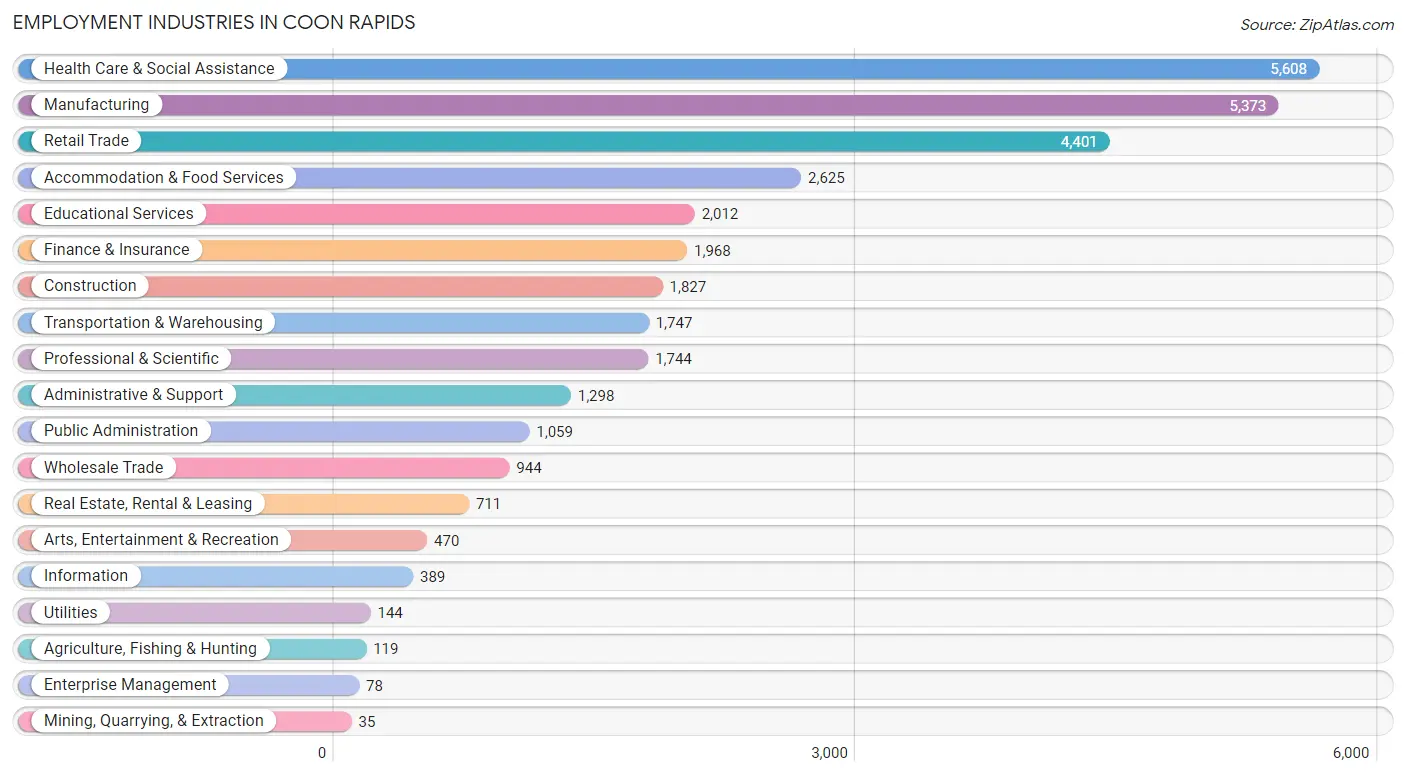
Employment Industries in Coon Rapids
The major employment industries in Coon Rapids include Health Care & Social Assistance (5,608 | 16.3%), Manufacturing (5,373 | 15.6%), Retail Trade (4,401 | 12.8%), Accommodation & Food Services (2,625 | 7.6%), and Educational Services (2,012 | 5.8%).
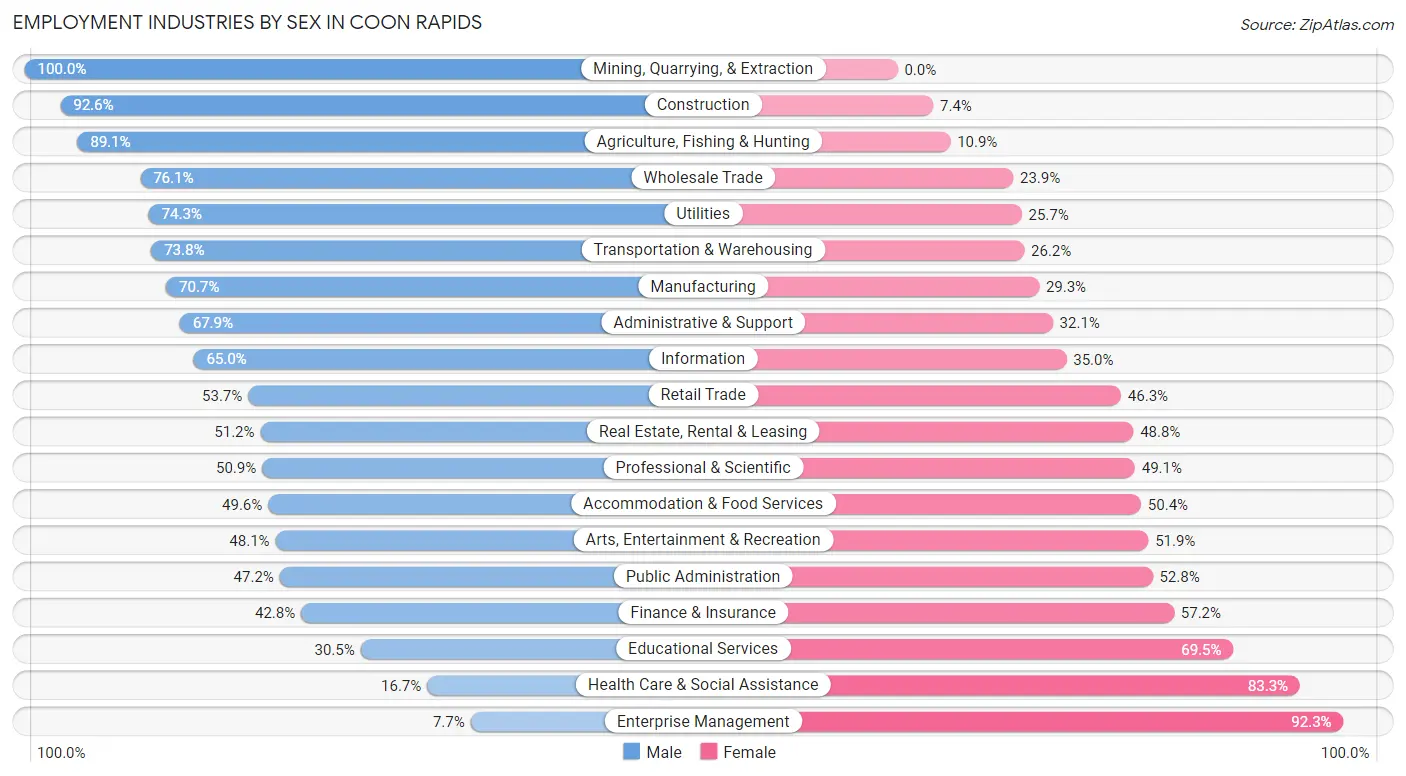
Employment Industries by Sex in Coon Rapids
The Coon Rapids industries that see more men than women are Mining, Quarrying, & Extraction (100.0%), Construction (92.6%), and Agriculture, Fishing & Hunting (89.1%), whereas the industries that tend to have a higher number of women are Enterprise Management (92.3%), Health Care & Social Assistance (83.3%), and Educational Services (69.5%).
| Industry | Male | Female |
| Agriculture, Fishing & Hunting | 106 (89.1%) | 13 (10.9%) |
| Mining, Quarrying, & Extraction | 35 (100.0%) | 0 (0.0%) |
| Construction | 1,692 (92.6%) | 135 (7.4%) |
| Manufacturing | 3,799 (70.7%) | 1,574 (29.3%) |
| Wholesale Trade | 718 (76.1%) | 226 (23.9%) |
| Retail Trade | 2,365 (53.7%) | 2,036 (46.3%) |
| Transportation & Warehousing | 1,289 (73.8%) | 458 (26.2%) |
| Utilities | 107 (74.3%) | 37 (25.7%) |
| Information | 253 (65.0%) | 136 (35.0%) |
| Finance & Insurance | 842 (42.8%) | 1,126 (57.2%) |
| Real Estate, Rental & Leasing | 364 (51.2%) | 347 (48.8%) |
| Professional & Scientific | 887 (50.9%) | 857 (49.1%) |
| Enterprise Management | 6 (7.7%) | 72 (92.3%) |
| Administrative & Support | 881 (67.9%) | 417 (32.1%) |
| Educational Services | 613 (30.5%) | 1,399 (69.5%) |
| Health Care & Social Assistance | 936 (16.7%) | 4,672 (83.3%) |
| Arts, Entertainment & Recreation | 226 (48.1%) | 244 (51.9%) |
| Accommodation & Food Services | 1,302 (49.6%) | 1,323 (50.4%) |
| Public Administration | 500 (47.2%) | 559 (52.8%) |
| Total | 17,963 (52.1%) | 16,535 (47.9%) |
Education in Coon Rapids
School Enrollment in Coon Rapids
The most common levels of schooling among the 14,114 students in Coon Rapids are high school (3,921 | 27.8%), middle school (3,417 | 24.2%), and elementary school (2,727 | 19.3%).
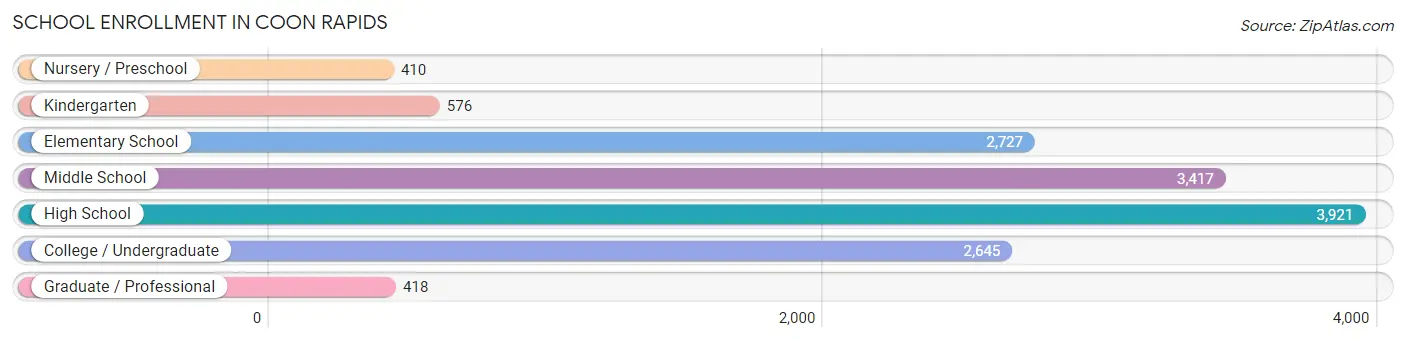
| School Level | # Students | % Students |
| Nursery / Preschool | 410 | 2.9% |
| Kindergarten | 576 | 4.1% |
| Elementary School | 2,727 | 19.3% |
| Middle School | 3,417 | 24.2% |
| High School | 3,921 | 27.8% |
| College / Undergraduate | 2,645 | 18.7% |
| Graduate / Professional | 418 | 3.0% |
| Total | 14,114 | 100.0% |
School Enrollment by Age by Funding Source in Coon Rapids
Out of a total of 14,114 students who are enrolled in schools in Coon Rapids, 1,228 (8.7%) attend a private institution, while the remaining 12,886 (91.3%) are enrolled in public schools. The age group of 3 to 4 year olds has the highest likelihood of being enrolled in private schools, with 150 (43.6% in the age bracket) enrolled. Conversely, the age group of 10 to 14 year olds has the lowest likelihood of being enrolled in a private school, with 4,074 (95.6% in the age bracket) attending a public institution.
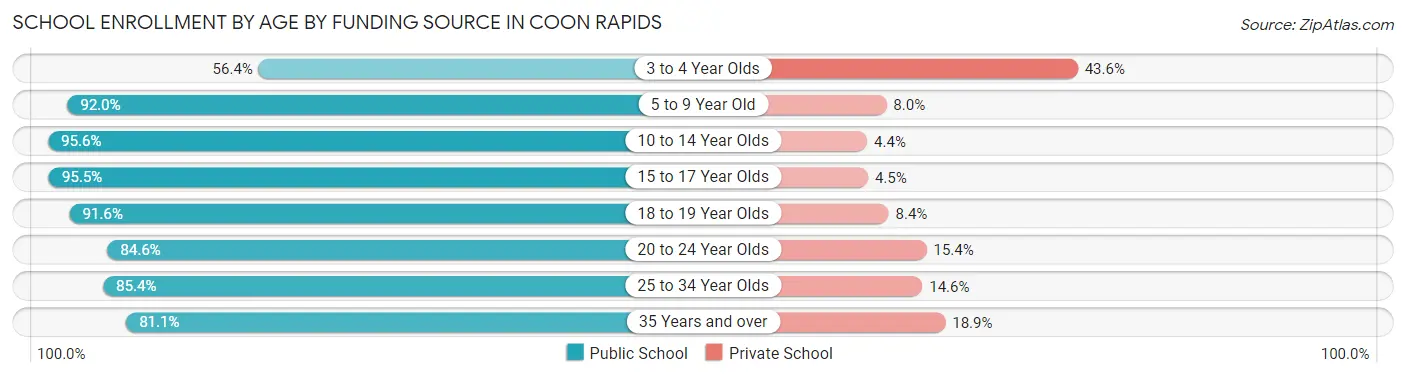
| Age Bracket | Public School | Private School |
| 3 to 4 Year Olds | 194 (56.4%) | 150 (43.6%) |
| 5 to 9 Year Old | 2,718 (92.0%) | 235 (8.0%) |
| 10 to 14 Year Olds | 4,074 (95.6%) | 186 (4.4%) |
| 15 to 17 Year Olds | 2,700 (95.5%) | 128 (4.5%) |
| 18 to 19 Year Olds | 876 (91.6%) | 80 (8.4%) |
| 20 to 24 Year Olds | 1,140 (84.6%) | 208 (15.4%) |
| 25 to 34 Year Olds | 612 (85.4%) | 105 (14.6%) |
| 35 Years and over | 574 (81.1%) | 134 (18.9%) |
| Total | 12,886 (91.3%) | 1,228 (8.7%) |
Educational Attainment by Field of Study in Coon Rapids
Business (2,765 | 22.9%), education (1,545 | 12.8%), science & technology (1,303 | 10.8%), arts & humanities (1,005 | 8.3%), and psychology (876 | 7.2%) are the most common fields of study among 12,083 individuals in Coon Rapids who have obtained a bachelor's degree or higher.
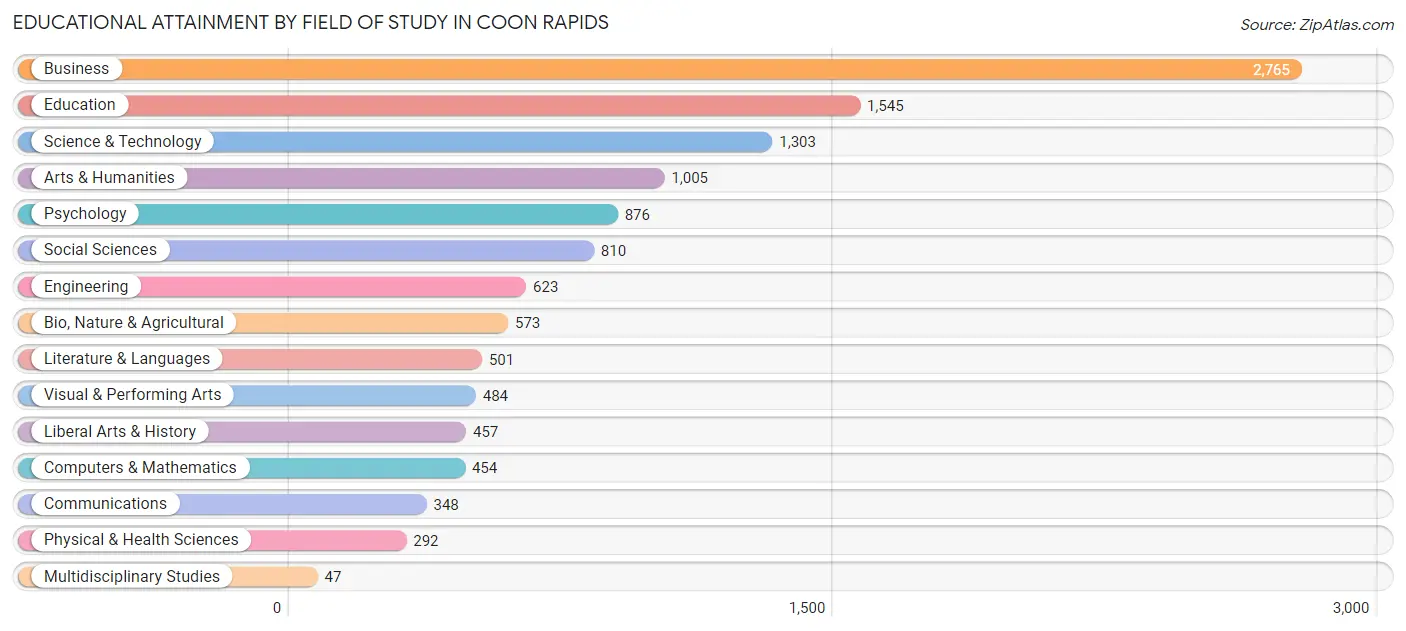
| Field of Study | # Graduates | % Graduates |
| Computers & Mathematics | 454 | 3.8% |
| Bio, Nature & Agricultural | 573 | 4.7% |
| Physical & Health Sciences | 292 | 2.4% |
| Psychology | 876 | 7.2% |
| Social Sciences | 810 | 6.7% |
| Engineering | 623 | 5.2% |
| Multidisciplinary Studies | 47 | 0.4% |
| Science & Technology | 1,303 | 10.8% |
| Business | 2,765 | 22.9% |
| Education | 1,545 | 12.8% |
| Literature & Languages | 501 | 4.2% |
| Liberal Arts & History | 457 | 3.8% |
| Visual & Performing Arts | 484 | 4.0% |
| Communications | 348 | 2.9% |
| Arts & Humanities | 1,005 | 8.3% |
| Total | 12,083 | 100.0% |
Transportation & Commute in Coon Rapids
Vehicle Availability by Sex in Coon Rapids
The most prevalent vehicle ownership categories in Coon Rapids are males with 2 vehicles (8,210, accounting for 46.1%) and females with 2 vehicles (7,127, making up 51.6%).
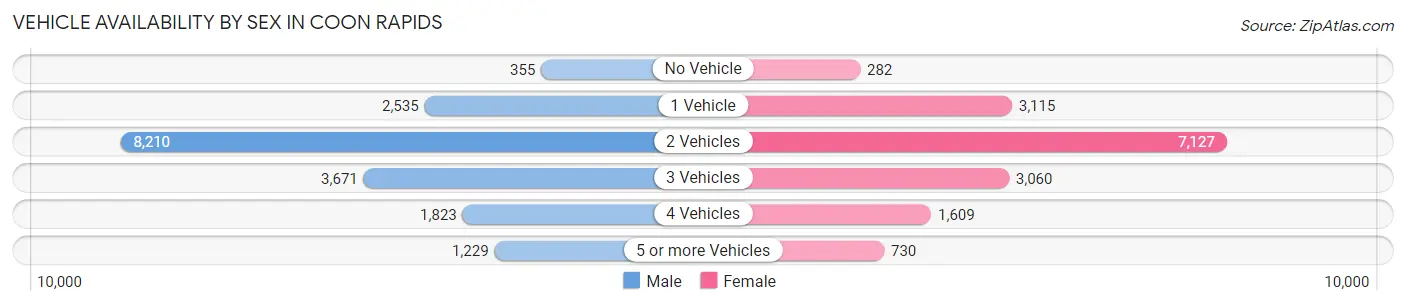
| Vehicles Available | Male | Female |
| No Vehicle | 355 (2.0%) | 282 (1.8%) |
| 1 Vehicle | 2,535 (14.2%) | 3,115 (19.6%) |
| 2 Vehicles | 8,210 (46.1%) | 7,127 (44.8%) |
| 3 Vehicles | 3,671 (20.6%) | 3,060 (19.2%) |
| 4 Vehicles | 1,823 (10.2%) | 1,609 (10.1%) |
| 5 or more Vehicles | 1,229 (6.9%) | 730 (4.6%) |
| Total | 17,823 (100.0%) | 15,923 (100.0%) |
Commute Time in Coon Rapids
The most frequently occuring commute durations in Coon Rapids are 20 to 24 minutes (5,568 commuters, 18.3%), 15 to 19 minutes (4,519 commuters, 14.9%), and 30 to 34 minutes (4,432 commuters, 14.6%).
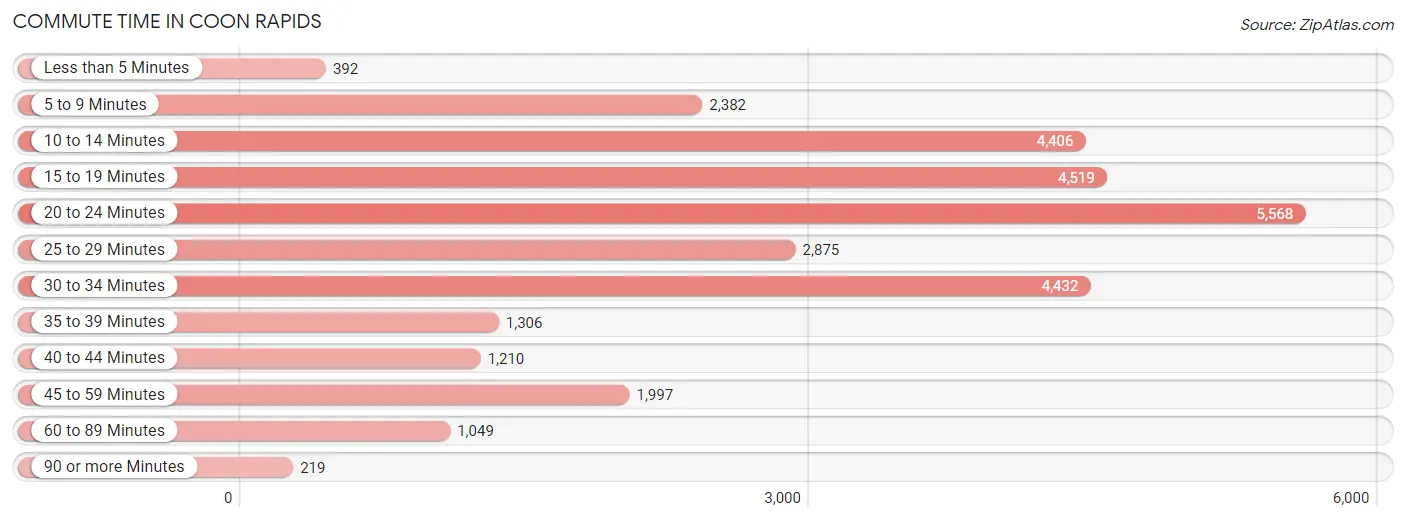
| Commute Time | # Commuters | % Commuters |
| Less than 5 Minutes | 392 | 1.3% |
| 5 to 9 Minutes | 2,382 | 7.9% |
| 10 to 14 Minutes | 4,406 | 14.5% |
| 15 to 19 Minutes | 4,519 | 14.9% |
| 20 to 24 Minutes | 5,568 | 18.3% |
| 25 to 29 Minutes | 2,875 | 9.5% |
| 30 to 34 Minutes | 4,432 | 14.6% |
| 35 to 39 Minutes | 1,306 | 4.3% |
| 40 to 44 Minutes | 1,210 | 4.0% |
| 45 to 59 Minutes | 1,997 | 6.6% |
| 60 to 89 Minutes | 1,049 | 3.5% |
| 90 or more Minutes | 219 | 0.7% |
Commute Time by Sex in Coon Rapids
The most common commute times in Coon Rapids are 20 to 24 minutes (2,844 commuters, 17.3%) for males and 20 to 24 minutes (2,724 commuters, 19.6%) for females.
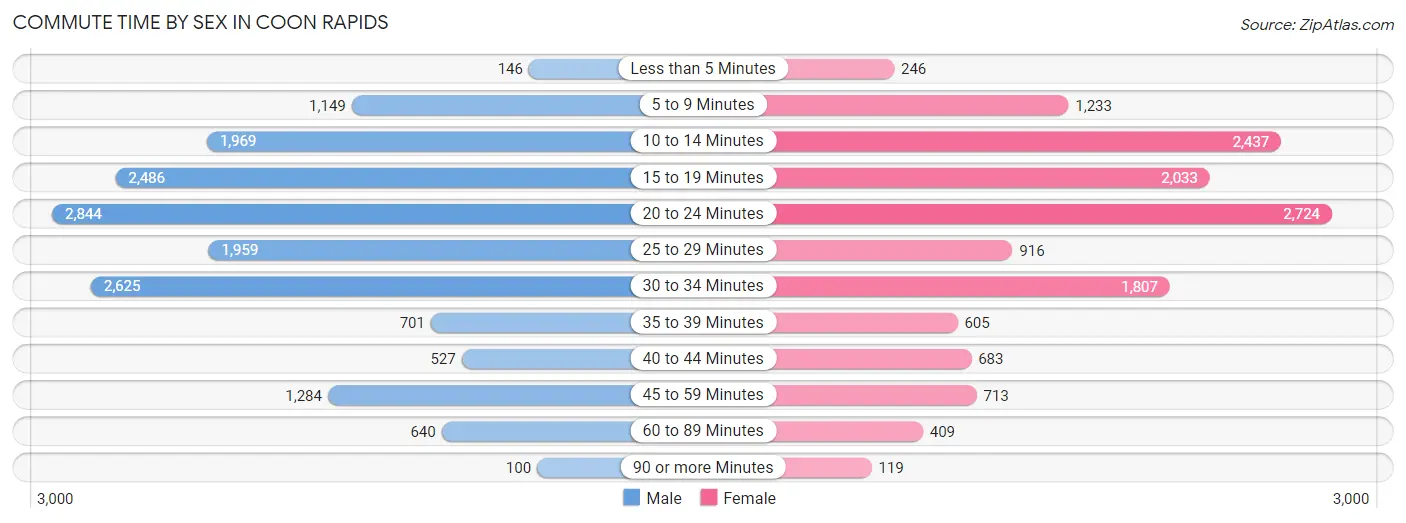
| Commute Time | Male | Female |
| Less than 5 Minutes | 146 (0.9%) | 246 (1.8%) |
| 5 to 9 Minutes | 1,149 (7.0%) | 1,233 (8.8%) |
| 10 to 14 Minutes | 1,969 (12.0%) | 2,437 (17.5%) |
| 15 to 19 Minutes | 2,486 (15.1%) | 2,033 (14.6%) |
| 20 to 24 Minutes | 2,844 (17.3%) | 2,724 (19.6%) |
| 25 to 29 Minutes | 1,959 (11.9%) | 916 (6.6%) |
| 30 to 34 Minutes | 2,625 (16.0%) | 1,807 (13.0%) |
| 35 to 39 Minutes | 701 (4.3%) | 605 (4.3%) |
| 40 to 44 Minutes | 527 (3.2%) | 683 (4.9%) |
| 45 to 59 Minutes | 1,284 (7.8%) | 713 (5.1%) |
| 60 to 89 Minutes | 640 (3.9%) | 409 (2.9%) |
| 90 or more Minutes | 100 (0.6%) | 119 (0.9%) |
Time of Departure to Work by Sex in Coon Rapids
The most frequent times of departure to work in Coon Rapids are 7:00 AM to 7:29 AM (2,281, 13.9%) for males and 7:00 AM to 7:29 AM (1,798, 12.9%) for females.
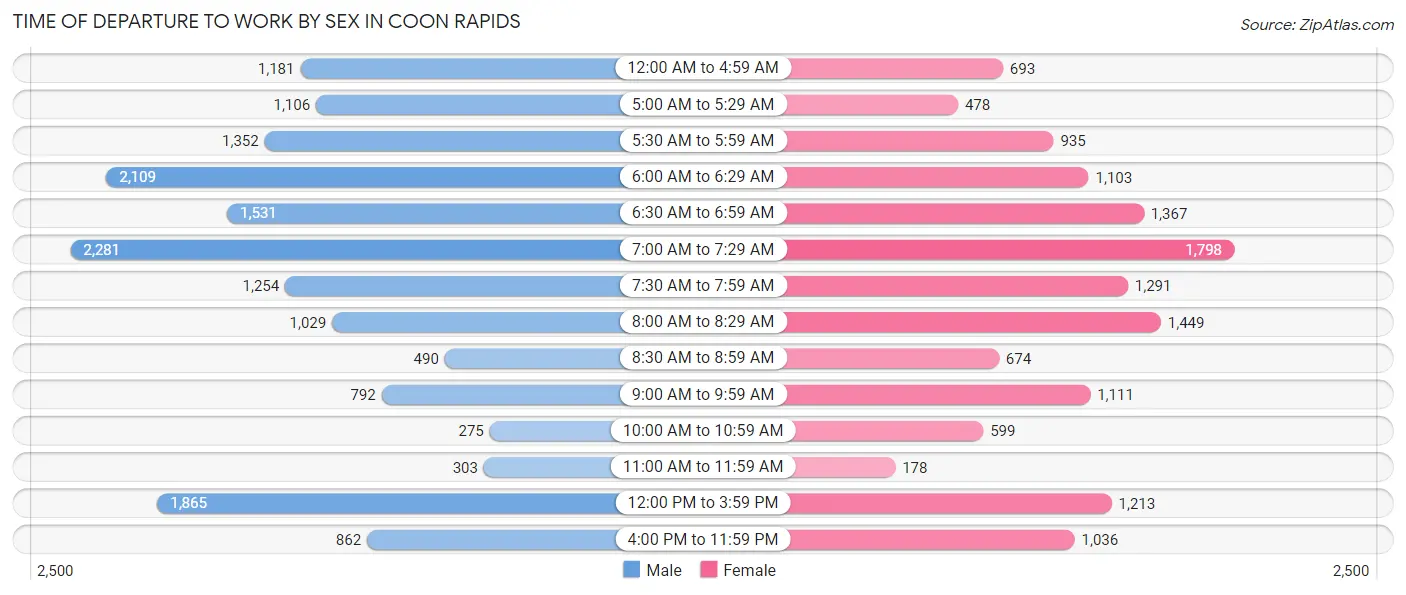
| Time of Departure | Male | Female |
| 12:00 AM to 4:59 AM | 1,181 (7.2%) | 693 (5.0%) |
| 5:00 AM to 5:29 AM | 1,106 (6.7%) | 478 (3.4%) |
| 5:30 AM to 5:59 AM | 1,352 (8.2%) | 935 (6.7%) |
| 6:00 AM to 6:29 AM | 2,109 (12.8%) | 1,103 (7.9%) |
| 6:30 AM to 6:59 AM | 1,531 (9.3%) | 1,367 (9.8%) |
| 7:00 AM to 7:29 AM | 2,281 (13.9%) | 1,798 (12.9%) |
| 7:30 AM to 7:59 AM | 1,254 (7.6%) | 1,291 (9.3%) |
| 8:00 AM to 8:29 AM | 1,029 (6.3%) | 1,449 (10.4%) |
| 8:30 AM to 8:59 AM | 490 (3.0%) | 674 (4.8%) |
| 9:00 AM to 9:59 AM | 792 (4.8%) | 1,111 (8.0%) |
| 10:00 AM to 10:59 AM | 275 (1.7%) | 599 (4.3%) |
| 11:00 AM to 11:59 AM | 303 (1.8%) | 178 (1.3%) |
| 12:00 PM to 3:59 PM | 1,865 (11.4%) | 1,213 (8.7%) |
| 4:00 PM to 11:59 PM | 862 (5.2%) | 1,036 (7.4%) |
| Total | 16,430 (100.0%) | 13,925 (100.0%) |
Housing Occupancy in Coon Rapids
Occupancy by Ownership in Coon Rapids
Of the total 24,574 dwellings in Coon Rapids, owner-occupied units account for 18,380 (74.8%), while renter-occupied units make up 6,194 (25.2%).
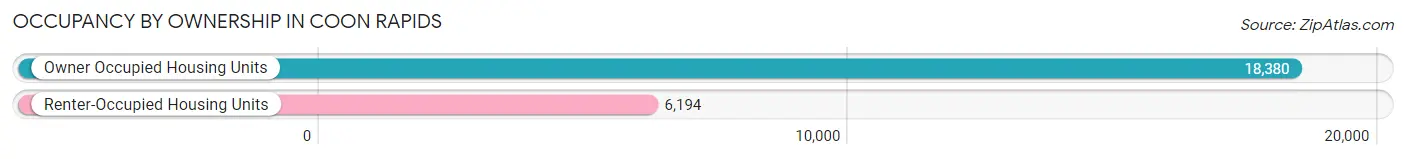
| Occupancy | # Housing Units | % Housing Units |
| Owner Occupied Housing Units | 18,380 | 74.8% |
| Renter-Occupied Housing Units | 6,194 | 25.2% |
| Total Occupied Housing Units | 24,574 | 100.0% |
Occupancy by Household Size in Coon Rapids
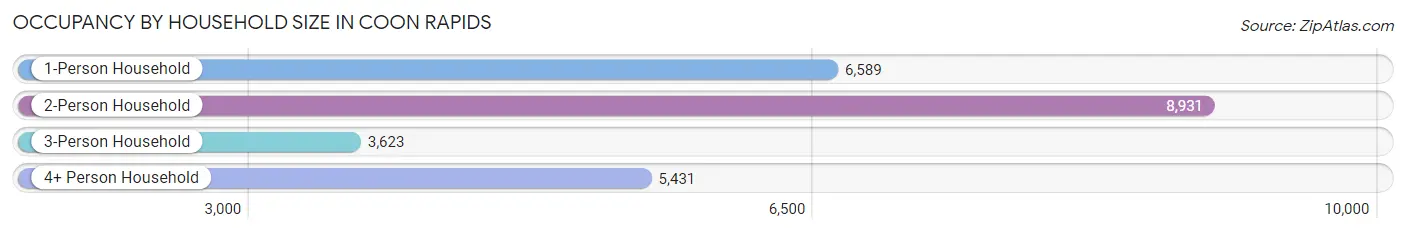
| Household Size | # Housing Units | % Housing Units |
| 1-Person Household | 6,589 | 26.8% |
| 2-Person Household | 8,931 | 36.3% |
| 3-Person Household | 3,623 | 14.7% |
| 4+ Person Household | 5,431 | 22.1% |
| Total Housing Units | 24,574 | 100.0% |
Occupancy by Ownership by Household Size in Coon Rapids
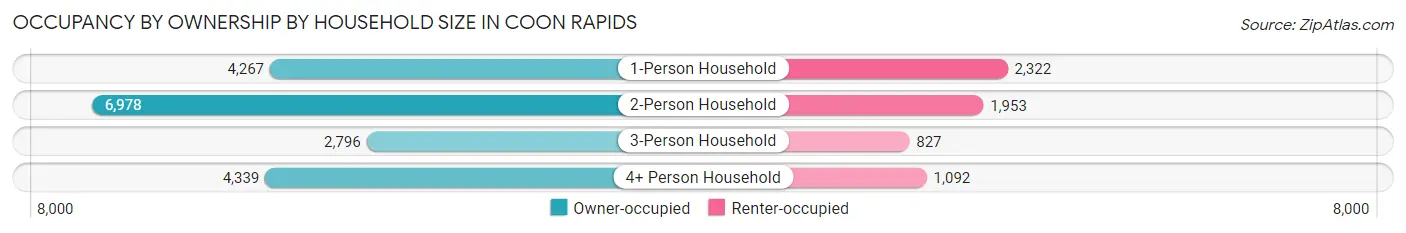
| Household Size | Owner-occupied | Renter-occupied |
| 1-Person Household | 4,267 (64.8%) | 2,322 (35.2%) |
| 2-Person Household | 6,978 (78.1%) | 1,953 (21.9%) |
| 3-Person Household | 2,796 (77.2%) | 827 (22.8%) |
| 4+ Person Household | 4,339 (79.9%) | 1,092 (20.1%) |
| Total Housing Units | 18,380 (74.8%) | 6,194 (25.2%) |
Occupancy by Educational Attainment in Coon Rapids
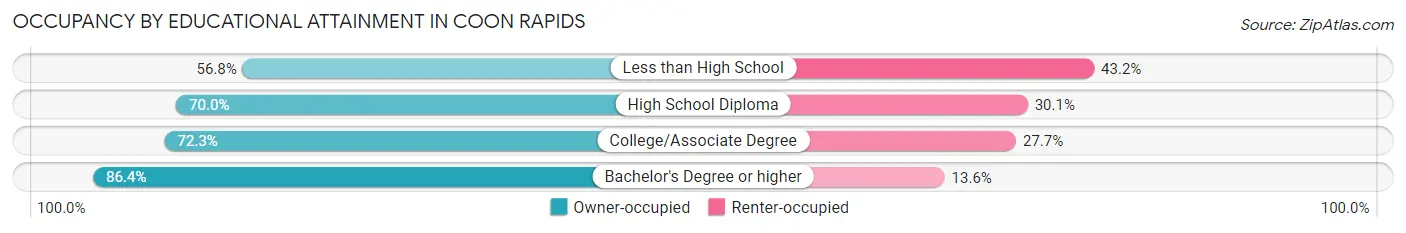
| Household Size | Owner-occupied | Renter-occupied |
| Less than High School | 532 (56.8%) | 405 (43.2%) |
| High School Diploma | 4,939 (70.0%) | 2,122 (30.0%) |
| College/Associate Degree | 7,233 (72.3%) | 2,775 (27.7%) |
| Bachelor's Degree or higher | 5,676 (86.4%) | 892 (13.6%) |
Occupancy by Age of Householder in Coon Rapids
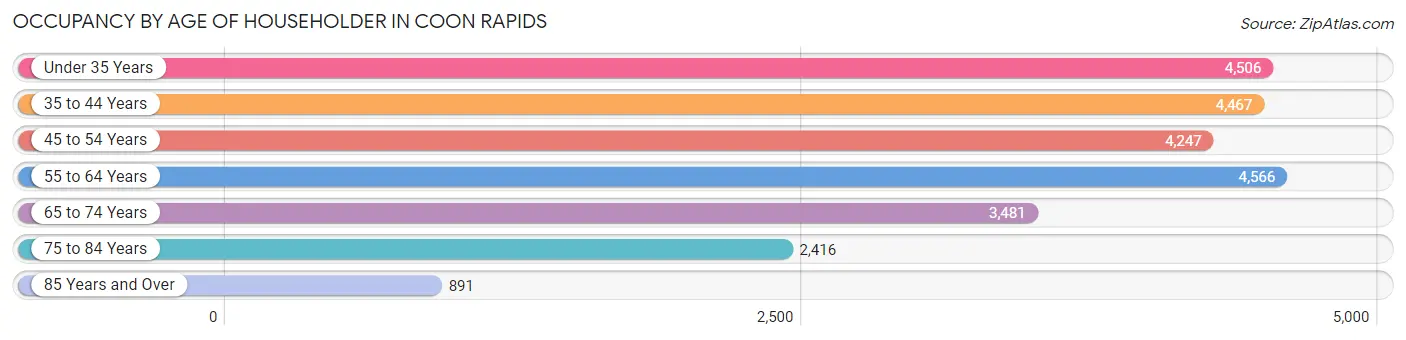
| Age Bracket | # Households | % Households |
| Under 35 Years | 4,506 | 18.3% |
| 35 to 44 Years | 4,467 | 18.2% |
| 45 to 54 Years | 4,247 | 17.3% |
| 55 to 64 Years | 4,566 | 18.6% |
| 65 to 74 Years | 3,481 | 14.2% |
| 75 to 84 Years | 2,416 | 9.8% |
| 85 Years and Over | 891 | 3.6% |
| Total | 24,574 | 100.0% |
Housing Finances in Coon Rapids
Median Income by Occupancy in Coon Rapids
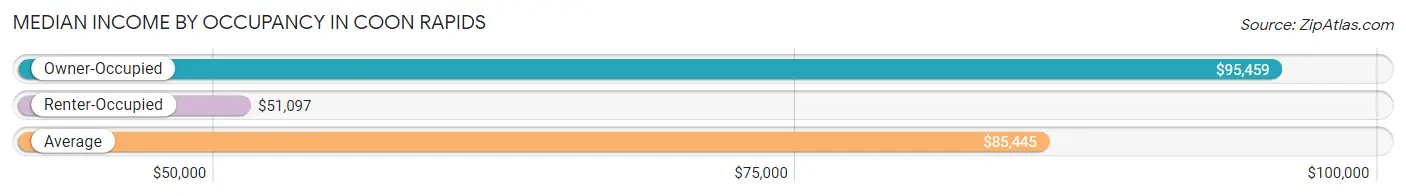
| Occupancy Type | # Households | Median Income |
| Owner-Occupied | 18,380 (74.8%) | $95,459 |
| Renter-Occupied | 6,194 (25.2%) | $51,097 |
| Average | 24,574 (100.0%) | $85,445 |
Occupancy by Householder Income Bracket in Coon Rapids
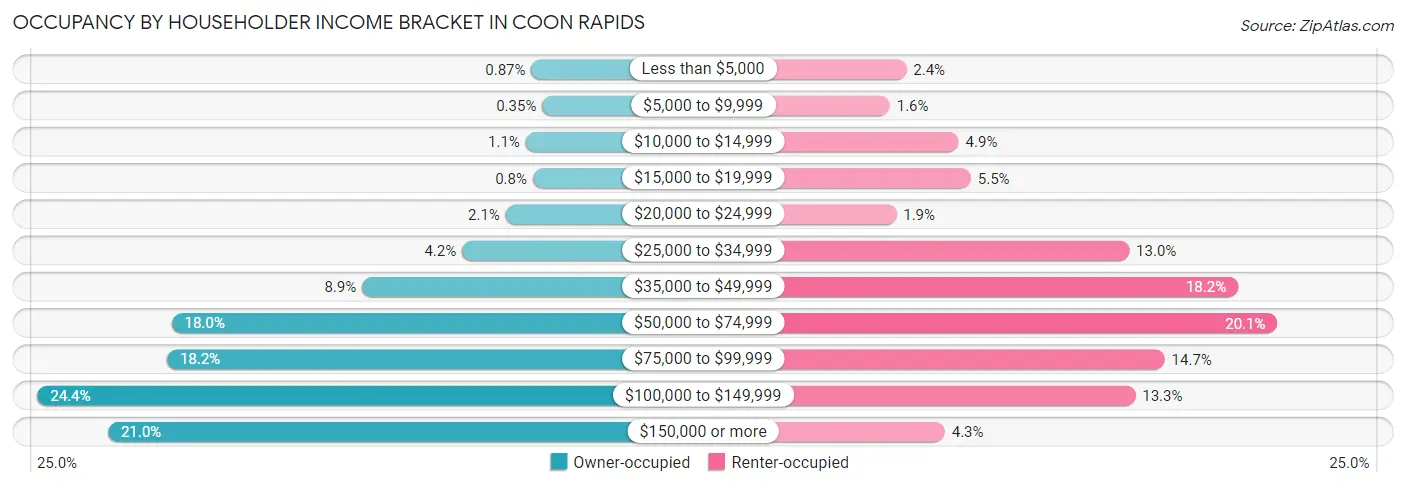
| Income Bracket | Owner-occupied | Renter-occupied |
| Less than $5,000 | 160 (0.9%) | 150 (2.4%) |
| $5,000 to $9,999 | 65 (0.4%) | 101 (1.6%) |
| $10,000 to $14,999 | 210 (1.1%) | 304 (4.9%) |
| $15,000 to $19,999 | 147 (0.8%) | 340 (5.5%) |
| $20,000 to $24,999 | 385 (2.1%) | 120 (1.9%) |
| $25,000 to $34,999 | 766 (4.2%) | 807 (13.0%) |
| $35,000 to $49,999 | 1,642 (8.9%) | 1,128 (18.2%) |
| $50,000 to $74,999 | 3,309 (18.0%) | 1,244 (20.1%) |
| $75,000 to $99,999 | 3,348 (18.2%) | 912 (14.7%) |
| $100,000 to $149,999 | 4,483 (24.4%) | 825 (13.3%) |
| $150,000 or more | 3,865 (21.0%) | 263 (4.3%) |
| Total | 18,380 (100.0%) | 6,194 (100.0%) |
Monthly Housing Cost Tiers in Coon Rapids
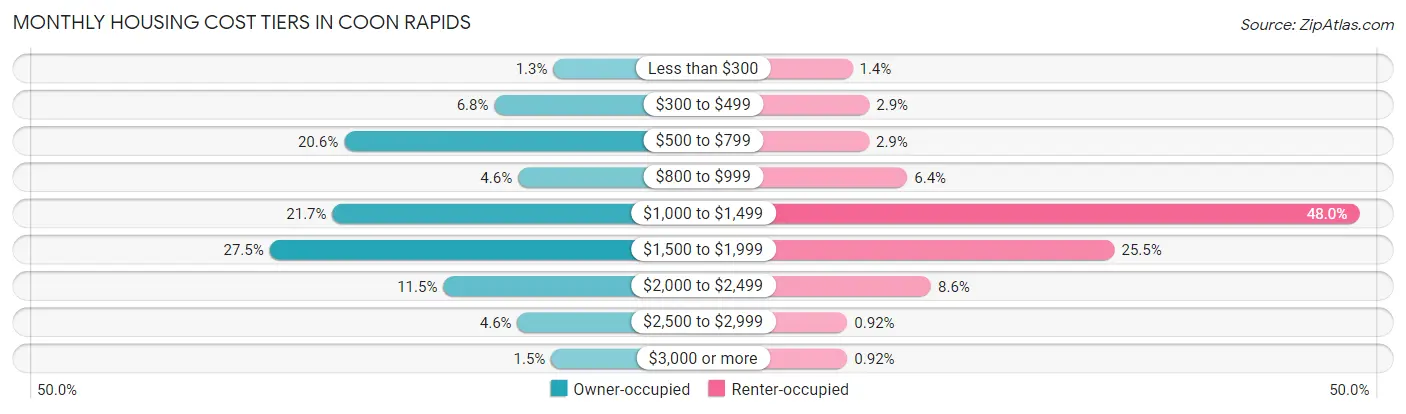
| Monthly Cost | Owner-occupied | Renter-occupied |
| Less than $300 | 244 (1.3%) | 86 (1.4%) |
| $300 to $499 | 1,242 (6.8%) | 182 (2.9%) |
| $500 to $799 | 3,787 (20.6%) | 180 (2.9%) |
| $800 to $999 | 842 (4.6%) | 399 (6.4%) |
| $1,000 to $1,499 | 3,983 (21.7%) | 2,974 (48.0%) |
| $1,500 to $1,999 | 5,045 (27.5%) | 1,580 (25.5%) |
| $2,000 to $2,499 | 2,107 (11.5%) | 534 (8.6%) |
| $2,500 to $2,999 | 851 (4.6%) | 57 (0.9%) |
| $3,000 or more | 279 (1.5%) | 57 (0.9%) |
| Total | 18,380 (100.0%) | 6,194 (100.0%) |
Physical Housing Characteristics in Coon Rapids
Housing Structures in Coon Rapids
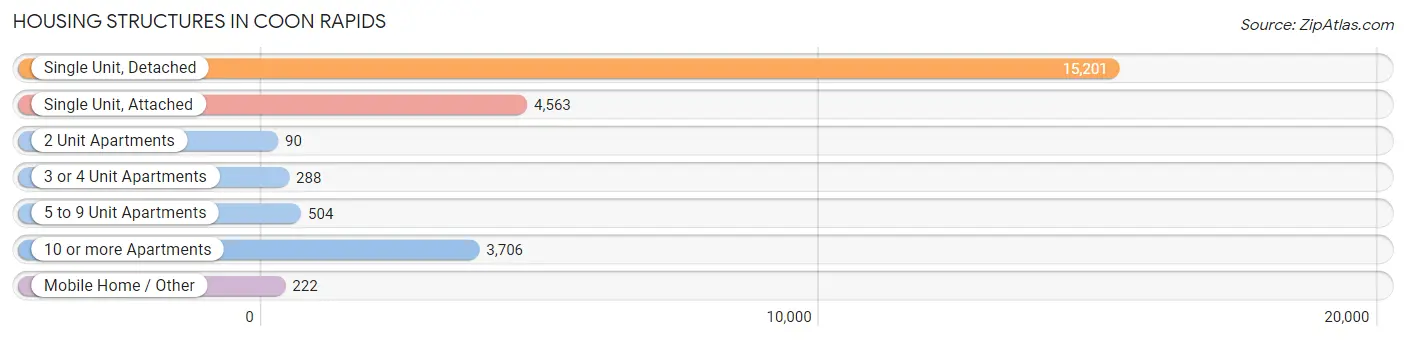
| Structure Type | # Housing Units | % Housing Units |
| Single Unit, Detached | 15,201 | 61.9% |
| Single Unit, Attached | 4,563 | 18.6% |
| 2 Unit Apartments | 90 | 0.4% |
| 3 or 4 Unit Apartments | 288 | 1.2% |
| 5 to 9 Unit Apartments | 504 | 2.1% |
| 10 or more Apartments | 3,706 | 15.1% |
| Mobile Home / Other | 222 | 0.9% |
| Total | 24,574 | 100.0% |
Housing Structures by Occupancy in Coon Rapids
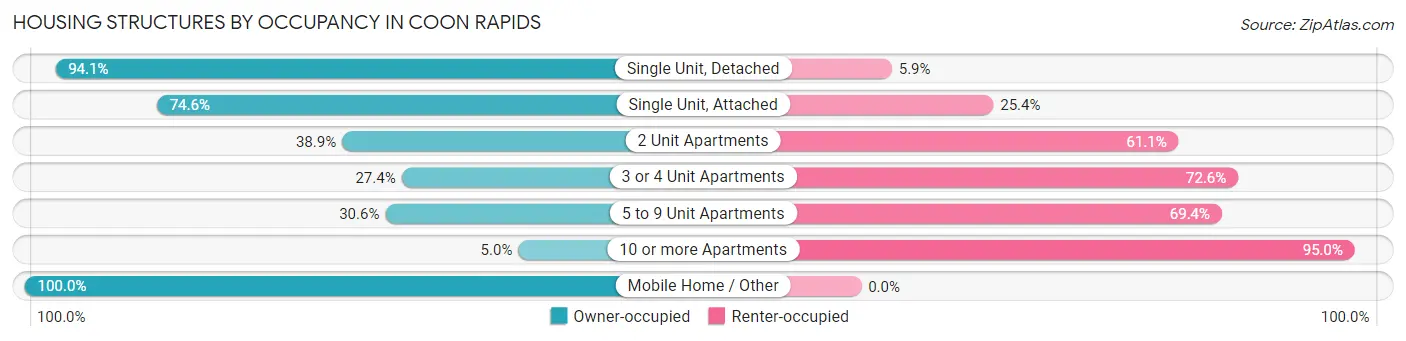
| Structure Type | Owner-occupied | Renter-occupied |
| Single Unit, Detached | 14,304 (94.1%) | 897 (5.9%) |
| Single Unit, Attached | 3,402 (74.6%) | 1,161 (25.4%) |
| 2 Unit Apartments | 35 (38.9%) | 55 (61.1%) |
| 3 or 4 Unit Apartments | 79 (27.4%) | 209 (72.6%) |
| 5 to 9 Unit Apartments | 154 (30.6%) | 350 (69.4%) |
| 10 or more Apartments | 184 (5.0%) | 3,522 (95.0%) |
| Mobile Home / Other | 222 (100.0%) | 0 (0.0%) |
| Total | 18,380 (74.8%) | 6,194 (25.2%) |
Housing Structures by Number of Rooms in Coon Rapids
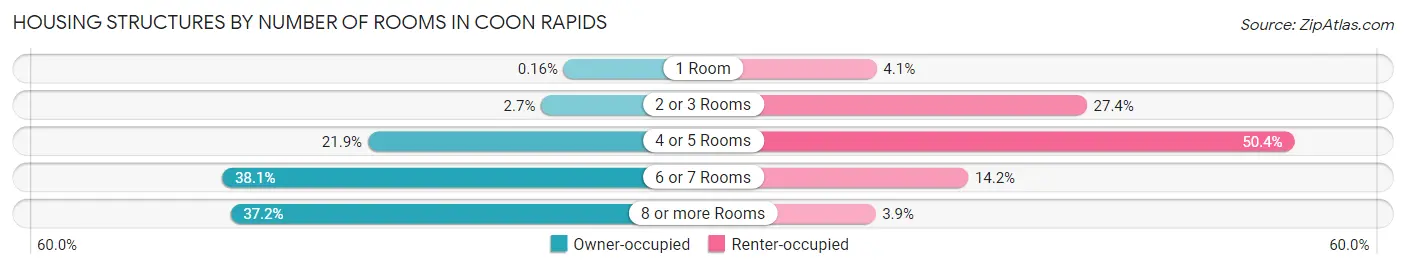
| Number of Rooms | Owner-occupied | Renter-occupied |
| 1 Room | 30 (0.2%) | 251 (4.1%) |
| 2 or 3 Rooms | 489 (2.7%) | 1,696 (27.4%) |
| 4 or 5 Rooms | 4,026 (21.9%) | 3,124 (50.4%) |
| 6 or 7 Rooms | 7,001 (38.1%) | 880 (14.2%) |
| 8 or more Rooms | 6,834 (37.2%) | 243 (3.9%) |
| Total | 18,380 (100.0%) | 6,194 (100.0%) |
Housing Structure by Heating Type in Coon Rapids
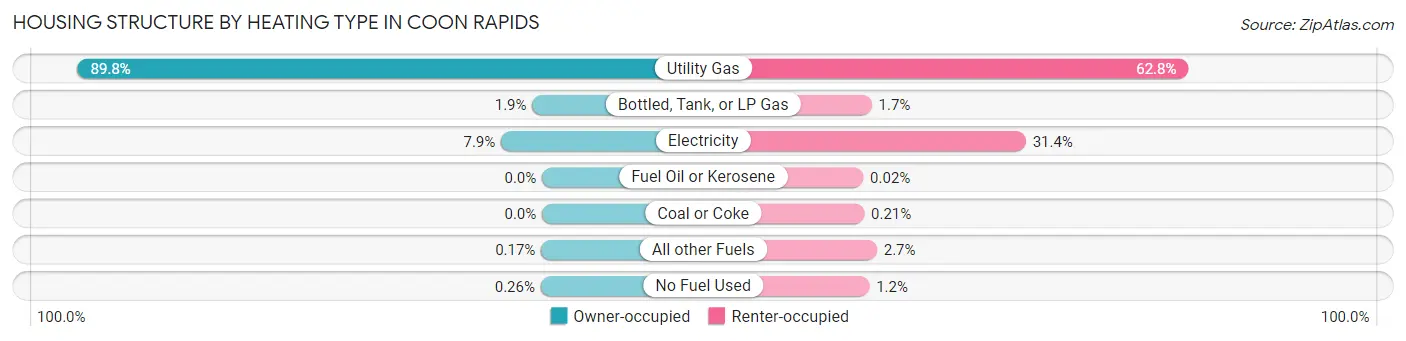
| Heating Type | Owner-occupied | Renter-occupied |
| Utility Gas | 16,501 (89.8%) | 3,892 (62.8%) |
| Bottled, Tank, or LP Gas | 345 (1.9%) | 103 (1.7%) |
| Electricity | 1,456 (7.9%) | 1,947 (31.4%) |
| Fuel Oil or Kerosene | 0 (0.0%) | 1 (0.0%) |
| Coal or Coke | 0 (0.0%) | 13 (0.2%) |
| All other Fuels | 31 (0.2%) | 164 (2.6%) |
| No Fuel Used | 47 (0.3%) | 74 (1.2%) |
| Total | 18,380 (100.0%) | 6,194 (100.0%) |
Household Vehicle Usage in Coon Rapids
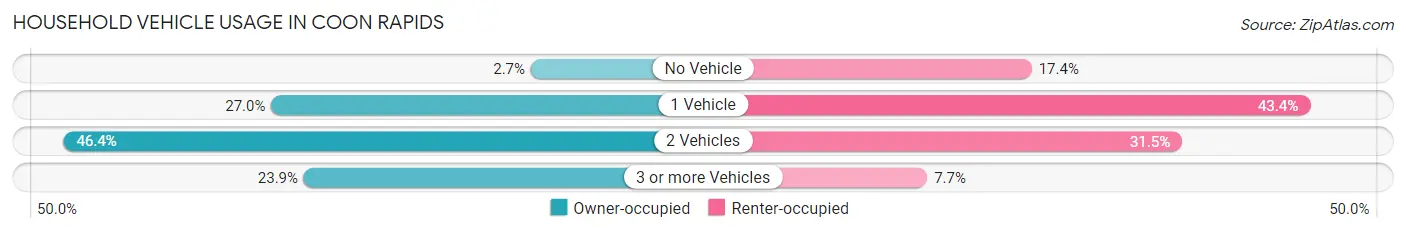
| Vehicles per Household | Owner-occupied | Renter-occupied |
| No Vehicle | 503 (2.7%) | 1,080 (17.4%) |
| 1 Vehicle | 4,957 (27.0%) | 2,689 (43.4%) |
| 2 Vehicles | 8,522 (46.4%) | 1,949 (31.5%) |
| 3 or more Vehicles | 4,398 (23.9%) | 476 (7.7%) |
| Total | 18,380 (100.0%) | 6,194 (100.0%) |
Real Estate & Mortgages in Coon Rapids
Real Estate and Mortgage Overview in Coon Rapids
| Characteristic | Without Mortgage | With Mortgage |
| Housing Units | 5,356 | 13,024 |
| Median Property Value | $268,100 | $268,700 |
| Median Household Income | $77,781 | $3,068 |
| Monthly Housing Costs | $587 | $279 |
| Real Estate Taxes | $2,673 | $239 |
Property Value by Mortgage Status in Coon Rapids
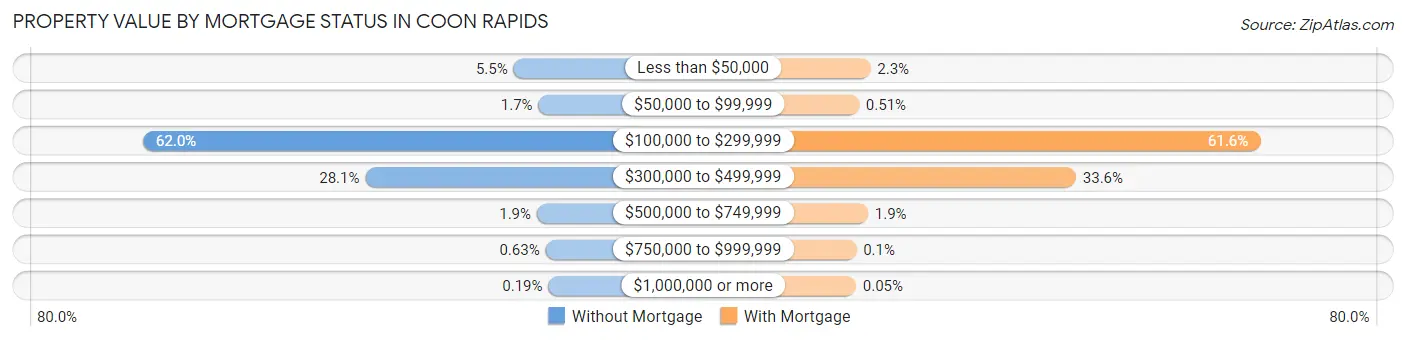
| Property Value | Without Mortgage | With Mortgage |
| Less than $50,000 | 294 (5.5%) | 294 (2.3%) |
| $50,000 to $99,999 | 91 (1.7%) | 66 (0.5%) |
| $100,000 to $299,999 | 3,319 (62.0%) | 8,028 (61.6%) |
| $300,000 to $499,999 | 1,504 (28.1%) | 4,372 (33.6%) |
| $500,000 to $749,999 | 104 (1.9%) | 244 (1.9%) |
| $750,000 to $999,999 | 34 (0.6%) | 13 (0.1%) |
| $1,000,000 or more | 10 (0.2%) | 7 (0.1%) |
| Total | 5,356 (100.0%) | 13,024 (100.0%) |
Household Income by Mortgage Status in Coon Rapids
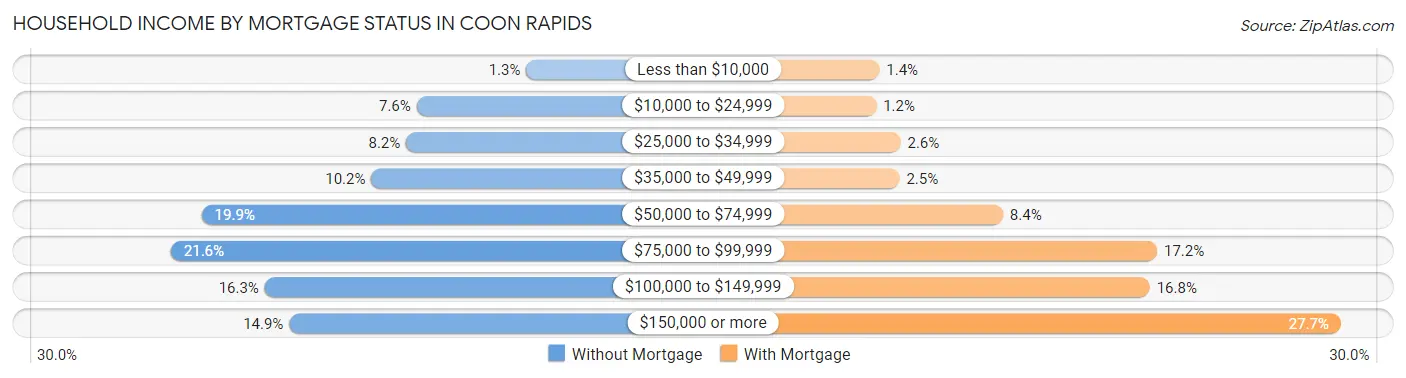
| Household Income | Without Mortgage | With Mortgage |
| Less than $10,000 | 71 (1.3%) | 177 (1.4%) |
| $10,000 to $24,999 | 407 (7.6%) | 154 (1.2%) |
| $25,000 to $34,999 | 439 (8.2%) | 335 (2.6%) |
| $35,000 to $49,999 | 546 (10.2%) | 327 (2.5%) |
| $50,000 to $74,999 | 1,065 (19.9%) | 1,096 (8.4%) |
| $75,000 to $99,999 | 1,159 (21.6%) | 2,244 (17.2%) |
| $100,000 to $149,999 | 872 (16.3%) | 2,189 (16.8%) |
| $150,000 or more | 797 (14.9%) | 3,611 (27.7%) |
| Total | 5,356 (100.0%) | 13,024 (100.0%) |
Property Value to Household Income Ratio in Coon Rapids
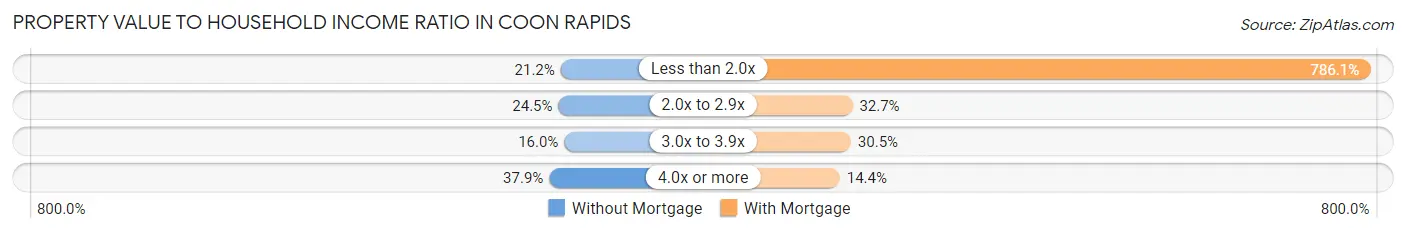
| Value-to-Income Ratio | Without Mortgage | With Mortgage |
| Less than 2.0x | 1,137 (21.2%) | 102,386 (786.1%) |
| 2.0x to 2.9x | 1,311 (24.5%) | 4,263 (32.7%) |
| 3.0x to 3.9x | 859 (16.0%) | 3,968 (30.5%) |
| 4.0x or more | 2,030 (37.9%) | 1,872 (14.4%) |
| Total | 5,356 (100.0%) | 13,024 (100.0%) |
Real Estate Taxes by Mortgage Status in Coon Rapids
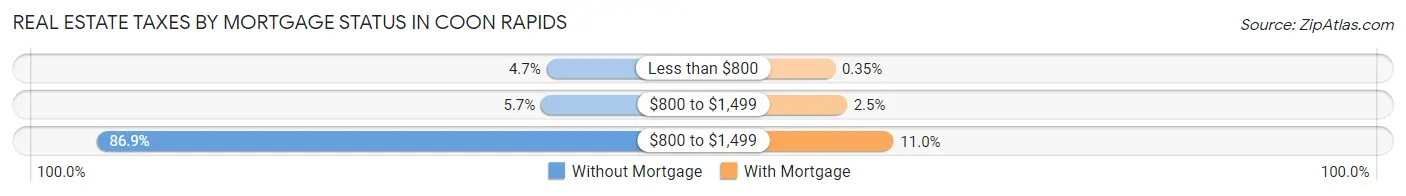
| Property Taxes | Without Mortgage | With Mortgage |
| Less than $800 | 250 (4.7%) | 45 (0.4%) |
| $800 to $1,499 | 303 (5.7%) | 325 (2.5%) |
| $800 to $1,499 | 4,653 (86.9%) | 1,436 (11.0%) |
| Total | 5,356 (100.0%) | 13,024 (100.0%) |
Health & Disability in Coon Rapids
Health Insurance Coverage by Age in Coon Rapids
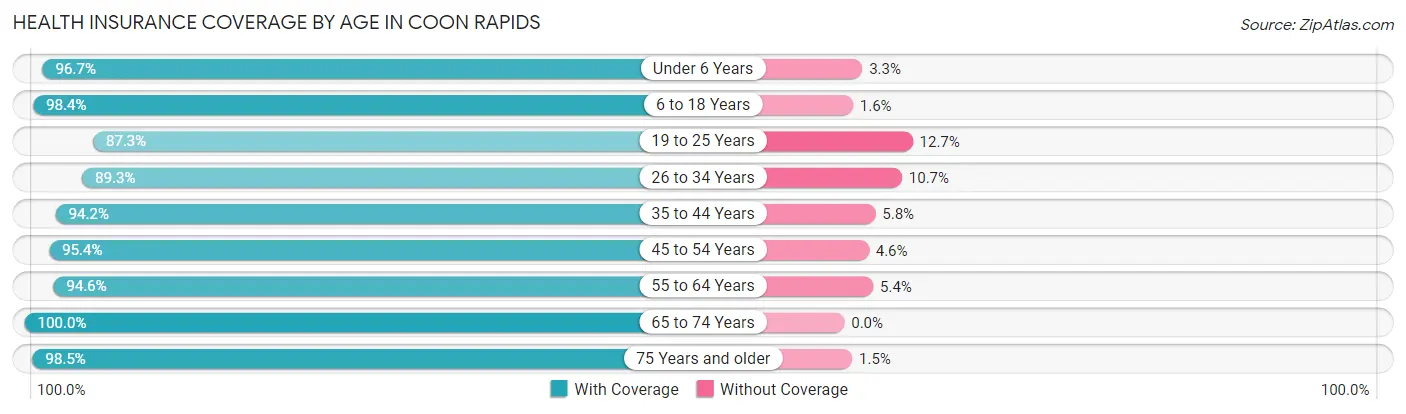
| Age Bracket | With Coverage | Without Coverage |
| Under 6 Years | 3,590 (96.7%) | 124 (3.3%) |
| 6 to 18 Years | 10,479 (98.4%) | 169 (1.6%) |
| 19 to 25 Years | 4,813 (87.3%) | 703 (12.7%) |
| 26 to 34 Years | 7,108 (89.3%) | 854 (10.7%) |
| 35 to 44 Years | 7,953 (94.2%) | 489 (5.8%) |
| 45 to 54 Years | 7,874 (95.4%) | 377 (4.6%) |
| 55 to 64 Years | 7,607 (94.6%) | 432 (5.4%) |
| 65 to 74 Years | 5,651 (100.0%) | 0 (0.0%) |
| 75 Years and older | 4,665 (98.5%) | 69 (1.5%) |
| Total | 59,740 (94.9%) | 3,217 (5.1%) |
Health Insurance Coverage by Citizenship Status in Coon Rapids
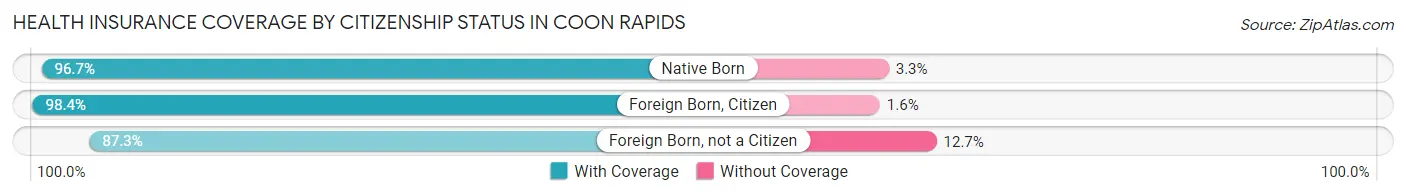
| Citizenship Status | With Coverage | Without Coverage |
| Native Born | 3,590 (96.7%) | 124 (3.3%) |
| Foreign Born, Citizen | 10,479 (98.4%) | 169 (1.6%) |
| Foreign Born, not a Citizen | 4,813 (87.3%) | 703 (12.7%) |
Health Insurance Coverage by Household Income in Coon Rapids
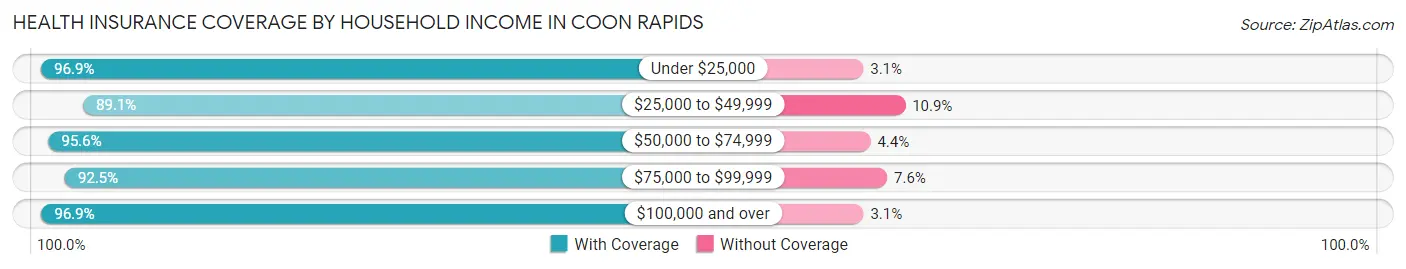
| Household Income | With Coverage | Without Coverage |
| Under $25,000 | 3,070 (96.9%) | 98 (3.1%) |
| $25,000 to $49,999 | 7,492 (89.1%) | 920 (10.9%) |
| $50,000 to $74,999 | 8,747 (95.6%) | 406 (4.4%) |
| $75,000 to $99,999 | 9,901 (92.4%) | 808 (7.5%) |
| $100,000 and over | 30,329 (96.9%) | 980 (3.1%) |
Public vs Private Health Insurance Coverage by Age in Coon Rapids
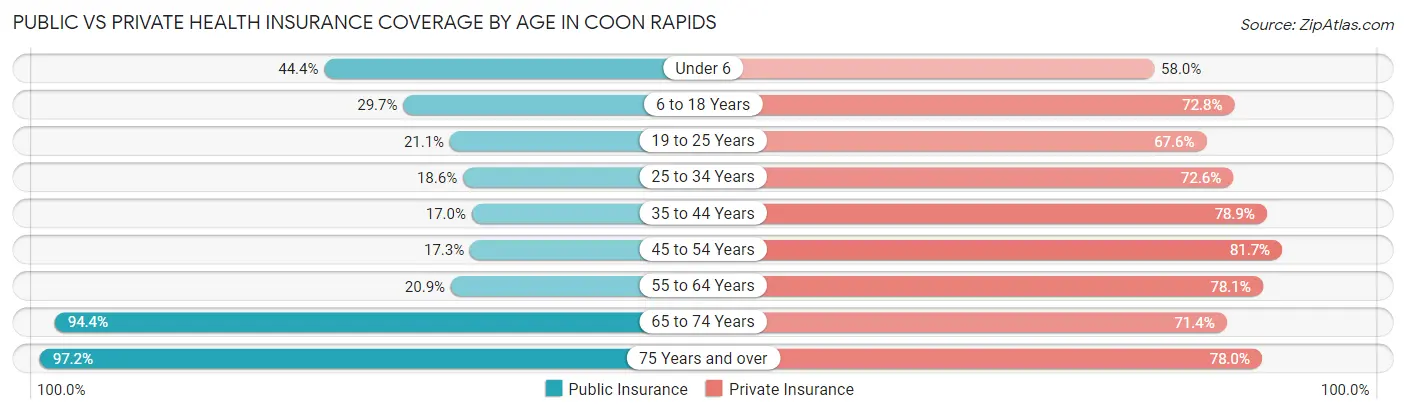
| Age Bracket | Public Insurance | Private Insurance |
| Under 6 | 1,648 (44.4%) | 2,153 (58.0%) |
| 6 to 18 Years | 3,163 (29.7%) | 7,756 (72.8%) |
| 19 to 25 Years | 1,161 (21.0%) | 3,731 (67.6%) |
| 25 to 34 Years | 1,483 (18.6%) | 5,783 (72.6%) |
| 35 to 44 Years | 1,434 (17.0%) | 6,657 (78.9%) |
| 45 to 54 Years | 1,429 (17.3%) | 6,740 (81.7%) |
| 55 to 64 Years | 1,678 (20.9%) | 6,278 (78.1%) |
| 65 to 74 Years | 5,334 (94.4%) | 4,035 (71.4%) |
| 75 Years and over | 4,600 (97.2%) | 3,690 (77.9%) |
| Total | 21,930 (34.8%) | 46,823 (74.4%) |
Disability Status by Sex by Age in Coon Rapids
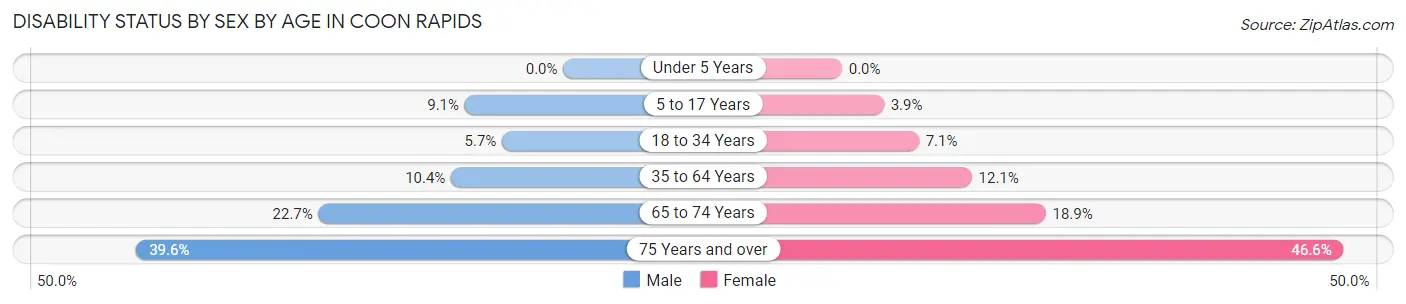
| Age Bracket | Male | Female |
| Under 5 Years | 0 (0.0%) | 0 (0.0%) |
| 5 to 17 Years | 530 (9.1%) | 176 (3.9%) |
| 18 to 34 Years | 402 (5.7%) | 510 (7.1%) |
| 35 to 64 Years | 1,310 (10.4%) | 1,464 (12.0%) |
| 65 to 74 Years | 569 (22.7%) | 595 (18.9%) |
| 75 Years and over | 754 (39.6%) | 1,319 (46.6%) |
Disability Class by Sex by Age in Coon Rapids
Disability Class: Hearing Difficulty
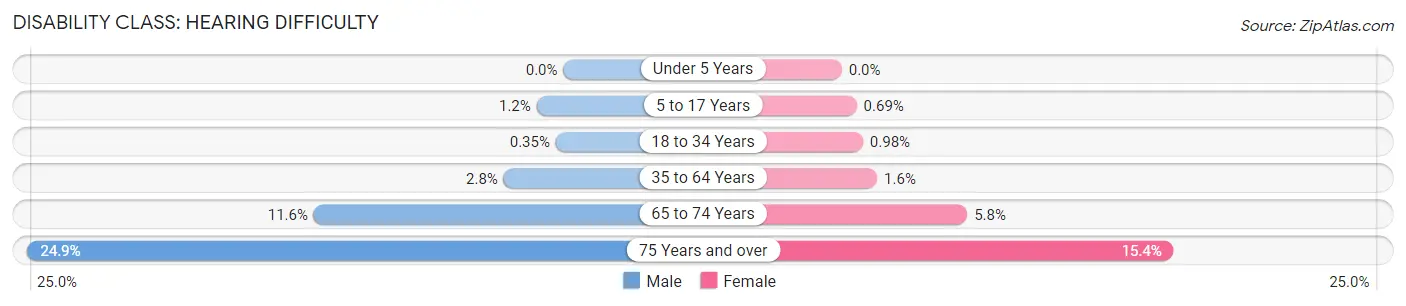
| Age Bracket | Male | Female |
| Under 5 Years | 0 (0.0%) | 0 (0.0%) |
| 5 to 17 Years | 72 (1.2%) | 31 (0.7%) |
| 18 to 34 Years | 25 (0.4%) | 70 (1.0%) |
| 35 to 64 Years | 348 (2.8%) | 199 (1.6%) |
| 65 to 74 Years | 290 (11.6%) | 183 (5.8%) |
| 75 Years and over | 473 (24.9%) | 436 (15.4%) |
Disability Class: Vision Difficulty
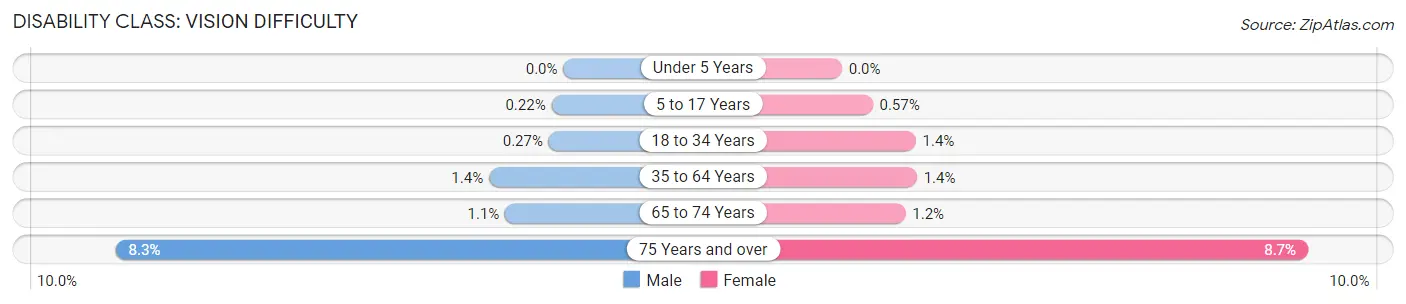
| Age Bracket | Male | Female |
| Under 5 Years | 0 (0.0%) | 0 (0.0%) |
| 5 to 17 Years | 13 (0.2%) | 26 (0.6%) |
| 18 to 34 Years | 19 (0.3%) | 98 (1.4%) |
| 35 to 64 Years | 173 (1.4%) | 169 (1.4%) |
| 65 to 74 Years | 27 (1.1%) | 37 (1.2%) |
| 75 Years and over | 158 (8.3%) | 245 (8.6%) |
Disability Class: Cognitive Difficulty
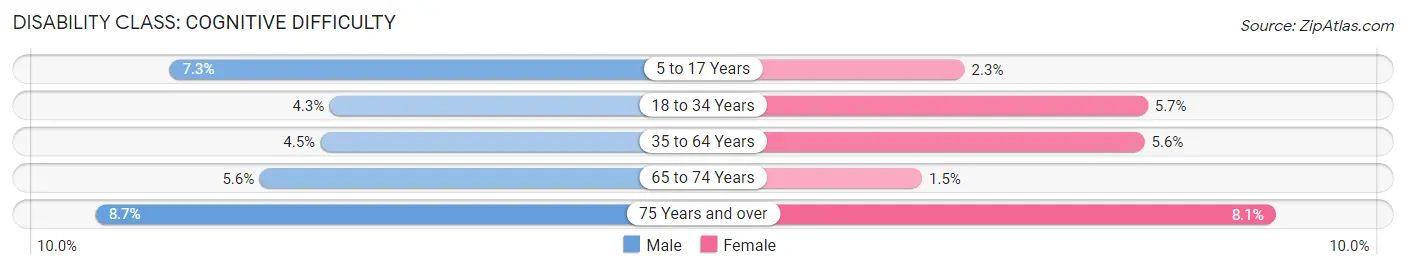
| Age Bracket | Male | Female |
| 5 to 17 Years | 424 (7.3%) | 103 (2.3%) |
| 18 to 34 Years | 307 (4.3%) | 406 (5.7%) |
| 35 to 64 Years | 566 (4.5%) | 683 (5.6%) |
| 65 to 74 Years | 141 (5.6%) | 47 (1.5%) |
| 75 Years and over | 165 (8.7%) | 228 (8.1%) |
Disability Class: Ambulatory Difficulty
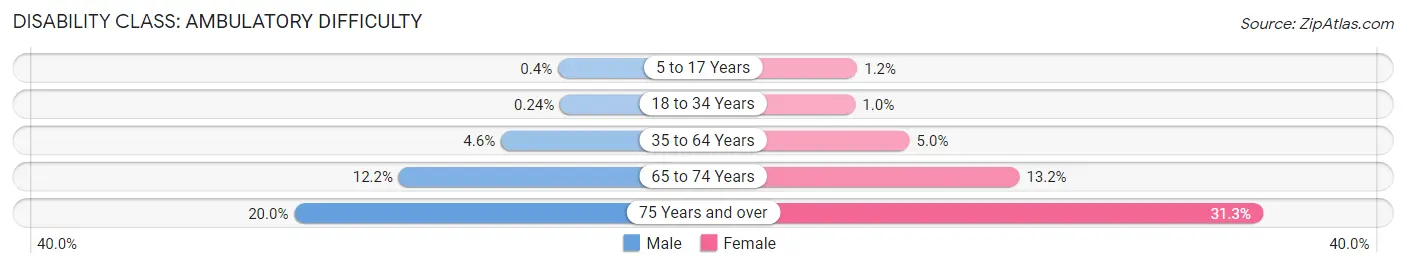
| Age Bracket | Male | Female |
| 5 to 17 Years | 23 (0.4%) | 52 (1.1%) |
| 18 to 34 Years | 17 (0.2%) | 72 (1.0%) |
| 35 to 64 Years | 582 (4.6%) | 613 (5.0%) |
| 65 to 74 Years | 306 (12.2%) | 415 (13.2%) |
| 75 Years and over | 380 (20.0%) | 885 (31.2%) |
Disability Class: Self-Care Difficulty
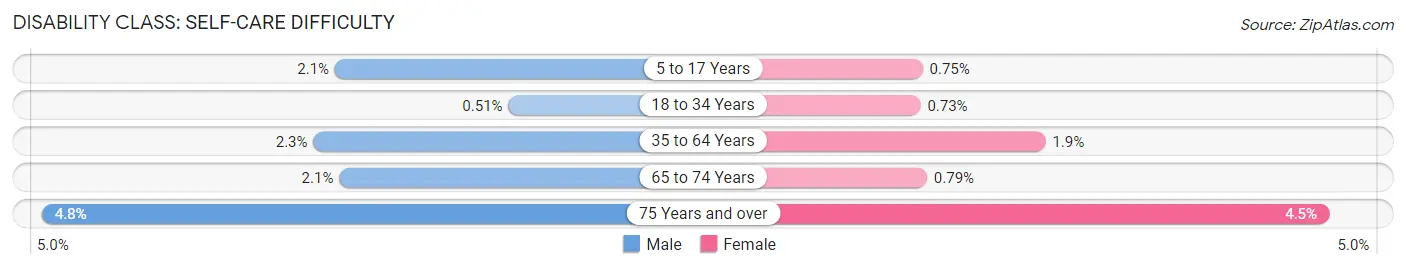
| Age Bracket | Male | Female |
| 5 to 17 Years | 123 (2.1%) | 34 (0.7%) |
| 18 to 34 Years | 36 (0.5%) | 52 (0.7%) |
| 35 to 64 Years | 292 (2.3%) | 230 (1.9%) |
| 65 to 74 Years | 52 (2.1%) | 25 (0.8%) |
| 75 Years and over | 92 (4.8%) | 128 (4.5%) |
Technology Access in Coon Rapids
Computing Device Access in Coon Rapids
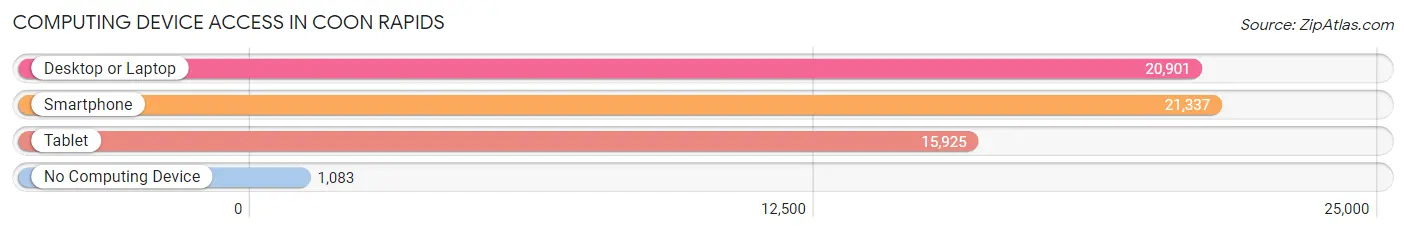
| Device Type | # Households | % Households |
| Desktop or Laptop | 20,901 | 85.1% |
| Smartphone | 21,337 | 86.8% |
| Tablet | 15,925 | 64.8% |
| No Computing Device | 1,083 | 4.4% |
| Total | 24,574 | 100.0% |
Internet Access in Coon Rapids
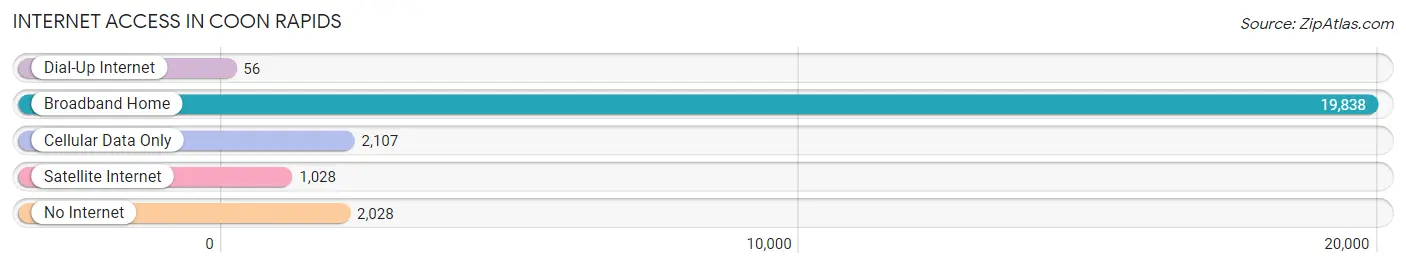
| Internet Type | # Households | % Households |
| Dial-Up Internet | 56 | 0.2% |
| Broadband Home | 19,838 | 80.7% |
| Cellular Data Only | 2,107 | 8.6% |
| Satellite Internet | 1,028 | 4.2% |
| No Internet | 2,028 | 8.3% |
| Total | 24,574 | 100.0% |
Coon Rapids Summary
Coon Rapids, Minnesota is a city located in Anoka County, Minnesota, United States. It is a northern suburb of the Twin Cities metropolitan area. The population was 61,476 at the 2010 census, making it the largest city in Anoka County.
History
Coon Rapids was first settled in 1855 by a group of settlers from Maine. The town was named after the rapids on the Mississippi River, which were named after the raccoon pelts that were found in the area. The first post office was established in 1857.
In 1872, the first railroad line was built through the town, connecting it to Minneapolis and St. Paul. This allowed for the growth of the town, as it became a popular destination for people looking to escape the city.
In the early 1900s, the town began to grow rapidly. The population increased from 1,000 in 1900 to over 10,000 by 1950. This growth was due to the influx of people from the Twin Cities, as well as the development of the area’s industrial base.
In the 1950s, the city began to expand further, with the construction of the Coon Rapids Dam. This dam was built to control flooding in the area, and it also provided a source of hydroelectric power.
In the 1960s, the city continued to grow, with the construction of the Coon Rapids Mall. This mall was the first enclosed shopping mall in the Twin Cities area, and it helped to further spur the growth of the city.
Geography
Coon Rapids is located in Anoka County, Minnesota, United States. It is a northern suburb of the Twin Cities metropolitan area. The city is situated on the banks of the Mississippi River, and it is bordered by the cities of Brooklyn Park, Blaine, and Andover.
The city has a total area of 28.2 square miles, of which 27.7 square miles is land and 0.5 square miles is water. The city is located at an elevation of 845 feet above sea level.
Economy
Coon Rapids is home to a variety of businesses and industries. The city is home to several large employers, including Anoka County, the Anoka-Hennepin School District, and the Coon Rapids-Riverdale School District.
The city is also home to several retail and commercial businesses, including the Coon Rapids Mall, which is the largest enclosed shopping mall in the Twin Cities area.
Demographics
As of the 2010 census, the population of Coon Rapids was 61,476. The racial makeup of the city was 79.2% White, 8.3% African American, 0.7% Native American, 4.2% Asian, 0.1% Pacific Islander, 4.3% from other races, and 3.2% from two or more races. Hispanic or Latino of any race were 8.7% of the population.
The median income for a household in the city was $60,945, and the median income for a family was $71,945. The per capita income for the city was $27,945. About 5.2% of families and 7.2% of the population were below the poverty line, including 9.2% of those under age 18 and 5.2% of those age 65 or over.
Common Questions
What is Per Capita Income in Coon Rapids?
Per Capita income in Coon Rapids is $38,885.
What is the Median Family Income in Coon Rapids?
Median Family Income in Coon Rapids is $96,833.
What is the Median Household income in Coon Rapids?
Median Household Income in Coon Rapids is $85,445.
What is Income or Wage Gap in Coon Rapids?
Income or Wage Gap in Coon Rapids is 23.8%.
Women in Coon Rapids earn 76.2 cents for every dollar earned by a man.
What is Family Income Deficit in Coon Rapids?
Family Income Deficit in Coon Rapids is $6,950.
Families that are below poverty line in Coon Rapids earn $6,950 less on average than the poverty threshold level.
What is Inequality or Gini Index in Coon Rapids?
Inequality or Gini Index in Coon Rapids is 0.36.
What is the Total Population of Coon Rapids?
Total Population of Coon Rapids is 63,296.
What is the Total Male Population of Coon Rapids?
Total Male Population of Coon Rapids is 31,794.
What is the Total Female Population of Coon Rapids?
Total Female Population of Coon Rapids is 31,502.
What is the Ratio of Males per 100 Females in Coon Rapids?
There are 100.93 Males per 100 Females in Coon Rapids.
What is the Ratio of Females per 100 Males in Coon Rapids?
There are 99.08 Females per 100 Males in Coon Rapids.
What is the Median Population Age in Coon Rapids?
Median Population Age in Coon Rapids is 39.2 Years.
What is the Average Family Size in Coon Rapids
Average Family Size in Coon Rapids is 3.1 People.
What is the Average Household Size in Coon Rapids
Average Household Size in Coon Rapids is 2.6 People.
How Large is the Labor Force in Coon Rapids?
There are 36,100 People in the Labor Forcein in Coon Rapids.
What is the Percentage of People in the Labor Force in Coon Rapids?
69.9% of People are in the Labor Force in Coon Rapids.
What is the Unemployment Rate in Coon Rapids?
Unemployment Rate in Coon Rapids is 4.2%.