Grand Forks, ND Map & Demographics
Grand Forks Map
Grand Forks Overview
$36,654
PER CAPITA INCOME
$92,949
AVG FAMILY INCOME
$59,079
AVG HOUSEHOLD INCOME
25.6%
WAGE / INCOME GAP [ % ]
74.4¢/ $1
WAGE / INCOME GAP [ $ ]
$9,636
FAMILY INCOME DEFICIT
0.47
INEQUALITY / GINI INDEX
58,935
TOTAL POPULATION
30,776
MALE POPULATION
28,159
FEMALE POPULATION
109.29
MALES / 100 FEMALES
91.50
FEMALES / 100 MALES
29.1
MEDIAN AGE
3.0
AVG FAMILY SIZE
2.1
AVG HOUSEHOLD SIZE
34,614
LABOR FORCE [ PEOPLE ]
71.1%
PERCENT IN LABOR FORCE
3.7%
UNEMPLOYMENT RATE
Grand Forks Area Codes
Income in Grand Forks
Income Overview in Grand Forks
Per Capita Income in Grand Forks is $36,654, while median incomes of families and households are $92,949 and $59,079 respectively.
| Characteristic | Number | Measure |
| Per Capita Income | 58,935 | $36,654 |
| Median Family Income | 11,775 | $92,949 |
| Mean Family Income | 11,775 | $113,046 |
| Median Household Income | 25,487 | $59,079 |
| Mean Household Income | 25,487 | $82,888 |
| Income Deficit | 11,775 | $9,636 |
| Wage / Income Gap (%) | 58,935 | 25.61% |
| Wage / Income Gap ($) | 58,935 | 74.39¢ per $1 |
| Gini / Inequality Index | 58,935 | 0.47 |
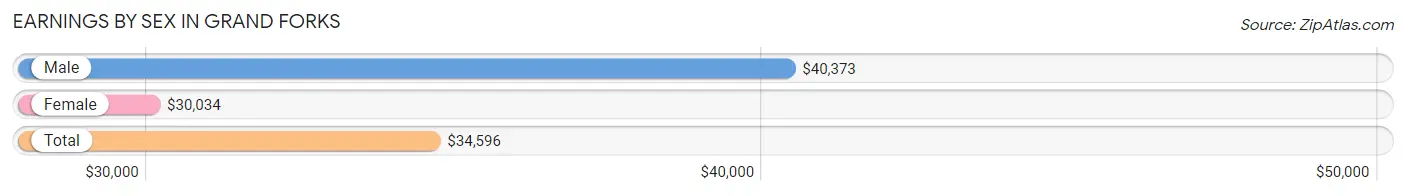
Earnings by Sex in Grand Forks
Average Earnings in Grand Forks are $34,596, $40,373 for men and $30,034 for women, a difference of 25.6%.
| Sex | Number | Average Earnings |
| Male | 20,349 (54.0%) | $40,373 |
| Female | 17,351 (46.0%) | $30,034 |
| Total | 37,700 (100.0%) | $34,596 |
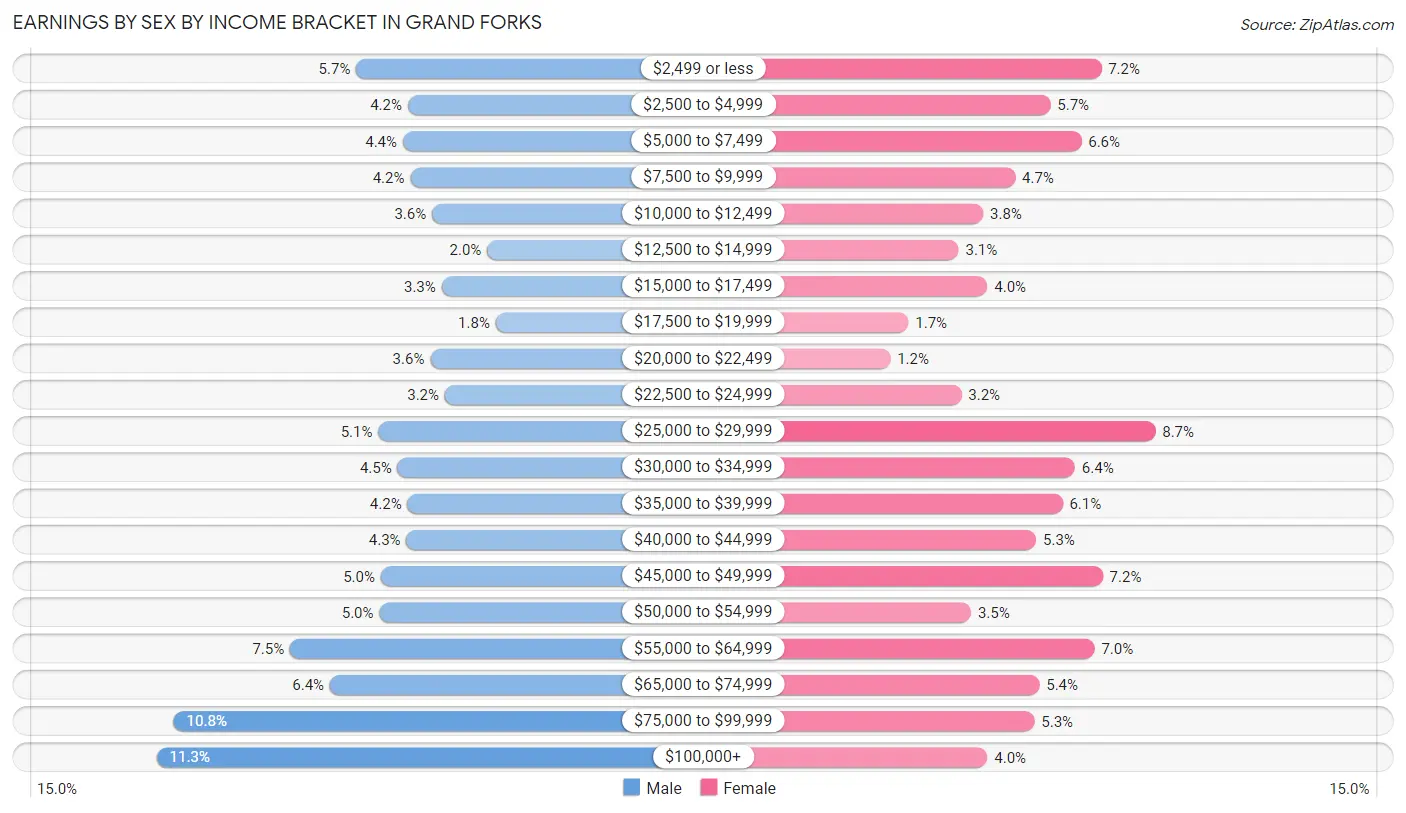
Earnings by Sex by Income Bracket in Grand Forks
The most common earnings brackets in Grand Forks are $100,000+ for men (2,297 | 11.3%) and $25,000 to $29,999 for women (1,505 | 8.7%).
| Income | Male | Female |
| $2,499 or less | 1,156 (5.7%) | 1,241 (7.1%) |
| $2,500 to $4,999 | 860 (4.2%) | 993 (5.7%) |
| $5,000 to $7,499 | 890 (4.4%) | 1,144 (6.6%) |
| $7,500 to $9,999 | 847 (4.2%) | 820 (4.7%) |
| $10,000 to $12,499 | 722 (3.5%) | 664 (3.8%) |
| $12,500 to $14,999 | 407 (2.0%) | 545 (3.1%) |
| $15,000 to $17,499 | 668 (3.3%) | 685 (4.0%) |
| $17,500 to $19,999 | 359 (1.8%) | 300 (1.7%) |
| $20,000 to $22,499 | 732 (3.6%) | 212 (1.2%) |
| $22,500 to $24,999 | 650 (3.2%) | 558 (3.2%) |
| $25,000 to $29,999 | 1,030 (5.1%) | 1,505 (8.7%) |
| $30,000 to $34,999 | 920 (4.5%) | 1,112 (6.4%) |
| $35,000 to $39,999 | 862 (4.2%) | 1,051 (6.1%) |
| $40,000 to $44,999 | 868 (4.3%) | 923 (5.3%) |
| $45,000 to $49,999 | 1,016 (5.0%) | 1,248 (7.2%) |
| $50,000 to $54,999 | 1,023 (5.0%) | 605 (3.5%) |
| $55,000 to $64,999 | 1,535 (7.5%) | 1,207 (7.0%) |
| $65,000 to $74,999 | 1,307 (6.4%) | 938 (5.4%) |
| $75,000 to $99,999 | 2,200 (10.8%) | 915 (5.3%) |
| $100,000+ | 2,297 (11.3%) | 685 (4.0%) |
| Total | 20,349 (100.0%) | 17,351 (100.0%) |
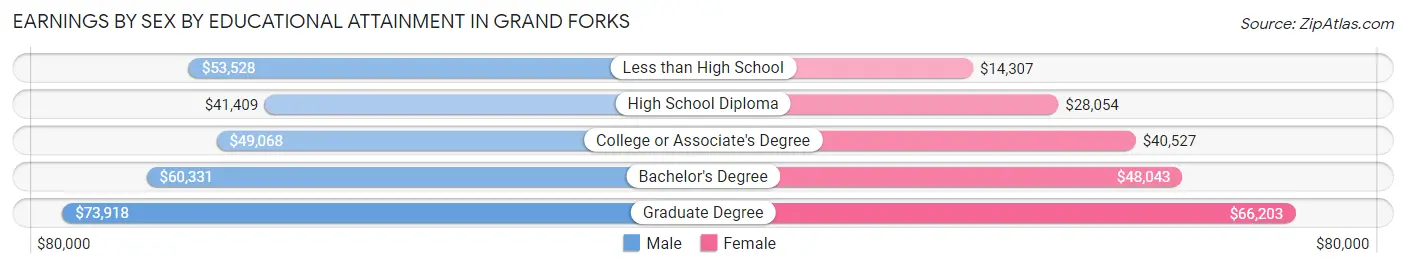
Earnings by Sex by Educational Attainment in Grand Forks
Average earnings in Grand Forks are $53,912 for men and $42,234 for women, a difference of 21.7%. Men with an educational attainment of graduate degree enjoy the highest average annual earnings of $73,918, while those with high school diploma education earn the least with $41,409. Women with an educational attainment of graduate degree earn the most with the average annual earnings of $66,203, while those with less than high school education have the smallest earnings of $14,307.
| Educational Attainment | Male Income | Female Income |
| Less than High School | $53,528 | $14,307 |
| High School Diploma | $41,409 | $28,054 |
| College or Associate's Degree | $49,068 | $40,527 |
| Bachelor's Degree | $60,331 | $48,043 |
| Graduate Degree | $73,918 | $66,203 |
| Total | $53,912 | $42,234 |
Family Income in Grand Forks
Family Income Brackets in Grand Forks
According to the Grand Forks family income data, there are 3,050 families falling into the $100,000 to $149,999 income range, which is the most common income bracket and makes up 25.9% of all families. Conversely, the $10,000 to $14,999 income bracket is the least frequent group with only 153 families (1.3%) belonging to this category.
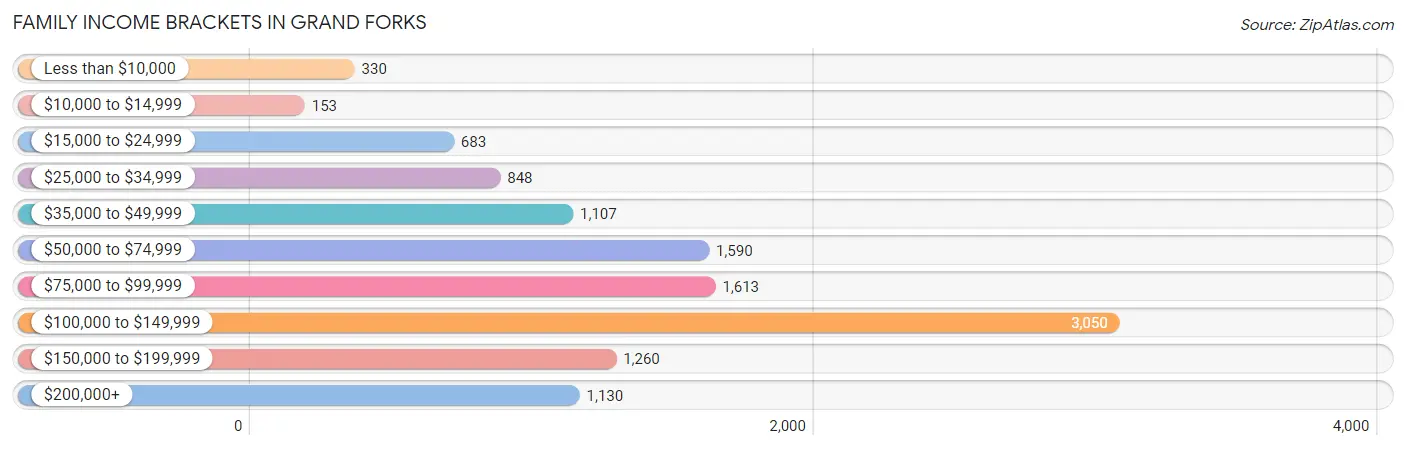
| Income Bracket | # Families | % Families |
| Less than $10,000 | 330 | 2.8% |
| $10,000 to $14,999 | 153 | 1.3% |
| $15,000 to $24,999 | 683 | 5.8% |
| $25,000 to $34,999 | 848 | 7.2% |
| $35,000 to $49,999 | 1,107 | 9.4% |
| $50,000 to $74,999 | 1,590 | 13.5% |
| $75,000 to $99,999 | 1,613 | 13.7% |
| $100,000 to $149,999 | 3,050 | 25.9% |
| $150,000 to $199,999 | 1,260 | 10.7% |
| $200,000+ | 1,130 | 9.6% |
Family Income by Famaliy Size in Grand Forks
6-person families (307 | 2.6%) account for the highest median family income in Grand Forks with $198,272 per family, while 2-person families (5,915 | 50.2%) have the highest median income of $39,013 per family member.
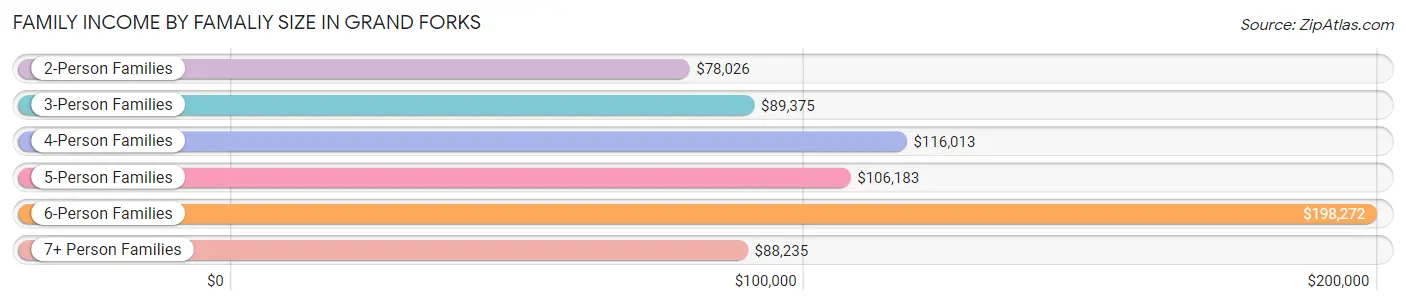
| Income Bracket | # Families | Median Income |
| 2-Person Families | 5,915 (50.2%) | $78,026 |
| 3-Person Families | 2,584 (21.9%) | $89,375 |
| 4-Person Families | 1,851 (15.7%) | $116,013 |
| 5-Person Families | 1,032 (8.8%) | $106,183 |
| 6-Person Families | 307 (2.6%) | $198,272 |
| 7+ Person Families | 86 (0.7%) | $88,235 |
| Total | 11,775 (100.0%) | $92,949 |
Family Income by Number of Earners in Grand Forks
The median family income in Grand Forks is $92,949, with families comprising 3+ earners (1,195) having the highest median family income of $126,274, while families with no earners (1,455) have the lowest median family income of $34,363, accounting for 10.2% and 12.4% of families, respectively.
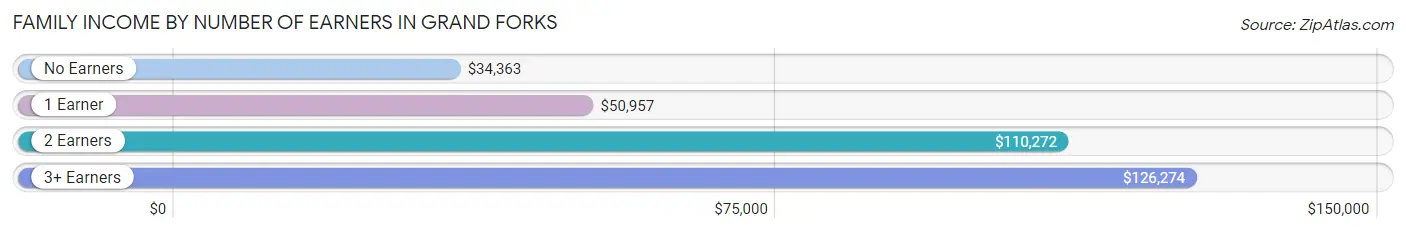
| Number of Earners | # Families | Median Income |
| No Earners | 1,455 (12.4%) | $34,363 |
| 1 Earner | 3,229 (27.4%) | $50,957 |
| 2 Earners | 5,896 (50.1%) | $110,272 |
| 3+ Earners | 1,195 (10.2%) | $126,274 |
| Total | 11,775 (100.0%) | $92,949 |
Household Income in Grand Forks
Household Income Brackets in Grand Forks
With 4,307 households falling in the category, the $50,000 to $74,999 income range is the most frequent in Grand Forks, accounting for 16.9% of all households. In contrast, only 918 households (3.6%) fall into the $10,000 to $14,999 income bracket, making it the least populous group.
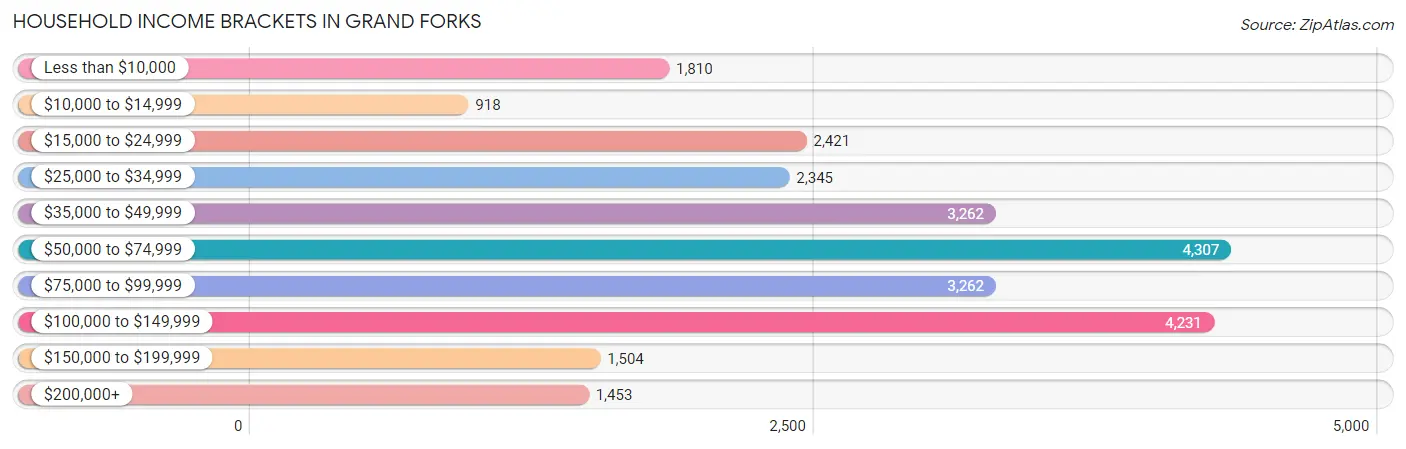
| Income Bracket | # Households | % Households |
| Less than $10,000 | 1,810 | 7.1% |
| $10,000 to $14,999 | 918 | 3.6% |
| $15,000 to $24,999 | 2,421 | 9.5% |
| $25,000 to $34,999 | 2,345 | 9.2% |
| $35,000 to $49,999 | 3,262 | 12.8% |
| $50,000 to $74,999 | 4,307 | 16.9% |
| $75,000 to $99,999 | 3,262 | 12.8% |
| $100,000 to $149,999 | 4,231 | 16.6% |
| $150,000 to $199,999 | 1,504 | 5.9% |
| $200,000+ | 1,453 | 5.7% |
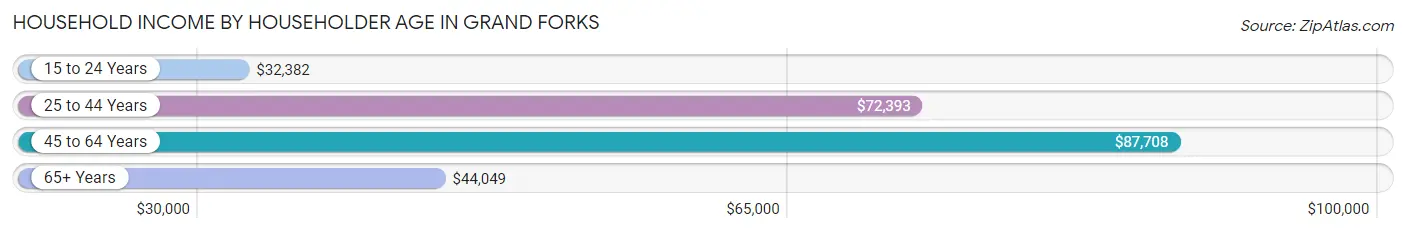
Household Income by Householder Age in Grand Forks
The median household income in Grand Forks is $59,079, with the highest median household income of $87,708 found in the 45 to 64 years age bracket for the primary householder. A total of 6,574 households (25.8%) fall into this category. Meanwhile, the 15 to 24 years age bracket for the primary householder has the lowest median household income of $32,382, with 4,171 households (16.4%) in this group.
| Income Bracket | # Households | Median Income |
| 15 to 24 Years | 4,171 (16.4%) | $32,382 |
| 25 to 44 Years | 9,549 (37.5%) | $72,393 |
| 45 to 64 Years | 6,574 (25.8%) | $87,708 |
| 65+ Years | 5,193 (20.4%) | $44,049 |
| Total | 25,487 (100.0%) | $59,079 |
Poverty in Grand Forks
Income Below Poverty by Sex and Age in Grand Forks
With 15.5% poverty level for males and 17.4% for females among the residents of Grand Forks, 18 to 24 year old males and 18 to 24 year old females are the most vulnerable to poverty, with 2,195 males (40.0%) and 1,929 females (40.6%) in their respective age groups living below the poverty level.
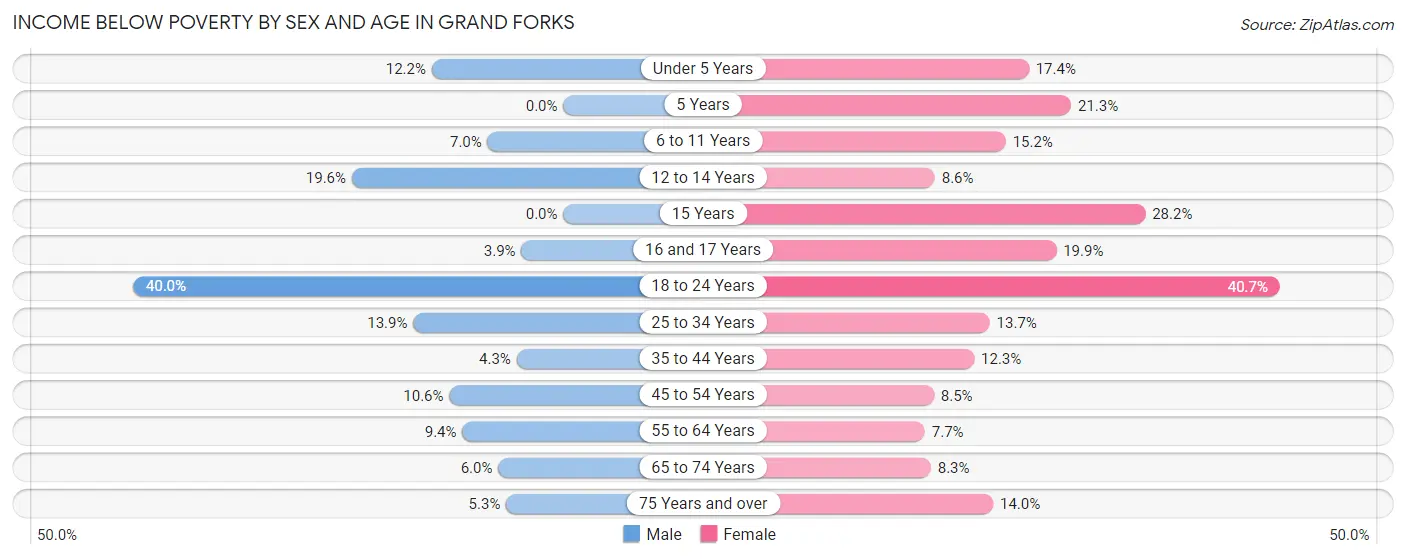
| Age Bracket | Male | Female |
| Under 5 Years | 230 (12.2%) | 288 (17.3%) |
| 5 Years | 0 (0.0%) | 40 (21.3%) |
| 6 to 11 Years | 122 (7.0%) | 256 (15.2%) |
| 12 to 14 Years | 252 (19.6%) | 83 (8.6%) |
| 15 Years | 0 (0.0%) | 89 (28.2%) |
| 16 and 17 Years | 22 (3.9%) | 116 (19.9%) |
| 18 to 24 Years | 2,195 (40.0%) | 1,929 (40.6%) |
| 25 to 34 Years | 785 (13.9%) | 579 (13.7%) |
| 35 to 44 Years | 141 (4.3%) | 363 (12.3%) |
| 45 to 54 Years | 264 (10.6%) | 197 (8.5%) |
| 55 to 64 Years | 246 (9.4%) | 201 (7.7%) |
| 65 to 74 Years | 125 (6.0%) | 188 (8.3%) |
| 75 Years and over | 62 (5.3%) | 252 (14.0%) |
| Total | 4,444 (15.5%) | 4,581 (17.4%) |
Income Above Poverty by Sex and Age in Grand Forks
According to the poverty statistics in Grand Forks, males aged 5 years and females aged 55 to 64 years are the age groups that are most secure financially, with 100.0% of males and 92.3% of females in these age groups living above the poverty line.
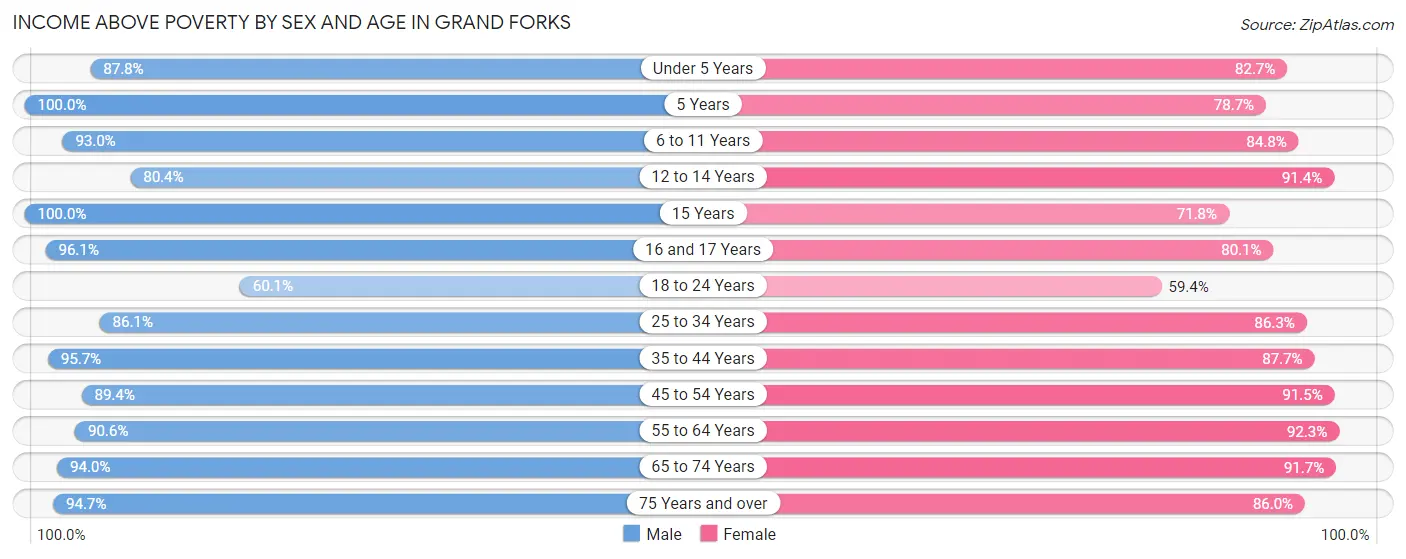
| Age Bracket | Male | Female |
| Under 5 Years | 1,653 (87.8%) | 1,372 (82.7%) |
| 5 Years | 283 (100.0%) | 148 (78.7%) |
| 6 to 11 Years | 1,614 (93.0%) | 1,427 (84.8%) |
| 12 to 14 Years | 1,032 (80.4%) | 879 (91.4%) |
| 15 Years | 177 (100.0%) | 227 (71.8%) |
| 16 and 17 Years | 544 (96.1%) | 467 (80.1%) |
| 18 to 24 Years | 3,300 (60.1%) | 2,816 (59.4%) |
| 25 to 34 Years | 4,849 (86.1%) | 3,640 (86.3%) |
| 35 to 44 Years | 3,117 (95.7%) | 2,592 (87.7%) |
| 45 to 54 Years | 2,232 (89.4%) | 2,109 (91.5%) |
| 55 to 64 Years | 2,380 (90.6%) | 2,405 (92.3%) |
| 65 to 74 Years | 1,943 (94.0%) | 2,089 (91.7%) |
| 75 Years and over | 1,108 (94.7%) | 1,543 (86.0%) |
| Total | 24,232 (84.5%) | 21,714 (82.6%) |
Income Below Poverty Among Married-Couple Families in Grand Forks
The poverty statistics for married-couple families in Grand Forks show that 4.1% or 353 of the total 8,560 families live below the poverty line. Families with 5 or more children have the highest poverty rate of 63.6%, comprising of 21 families. On the other hand, families with no children have the lowest poverty rate of 1.8%, which includes 82 families.
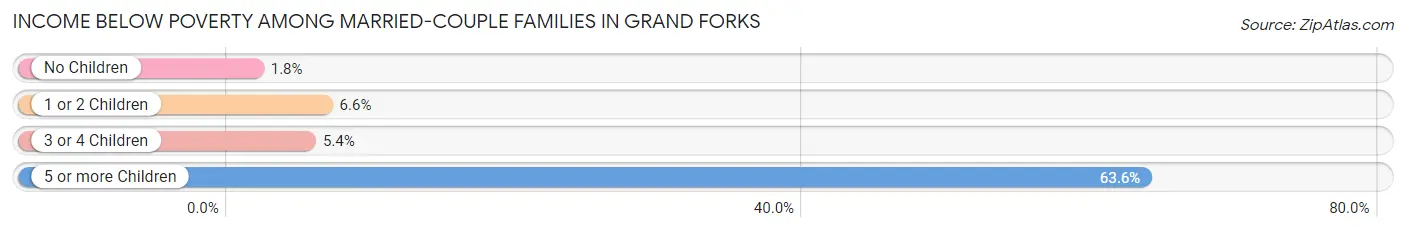
| Children | Above Poverty | Below Poverty |
| No Children | 4,506 (98.2%) | 82 (1.8%) |
| 1 or 2 Children | 2,905 (93.4%) | 205 (6.6%) |
| 3 or 4 Children | 784 (94.6%) | 45 (5.4%) |
| 5 or more Children | 12 (36.4%) | 21 (63.6%) |
| Total | 8,207 (95.9%) | 353 (4.1%) |
Income Below Poverty Among Single-Parent Households in Grand Forks
According to the poverty data in Grand Forks, 6.7% or 52 single-father households and 24.5% or 599 single-mother households are living below the poverty line. Among single-father households, those with no children have the highest poverty rate, with 27 households (10.0%) experiencing poverty. Likewise, among single-mother households, those with 1 or 2 children have the highest poverty rate, with 456 households (30.7%) falling below the poverty line.
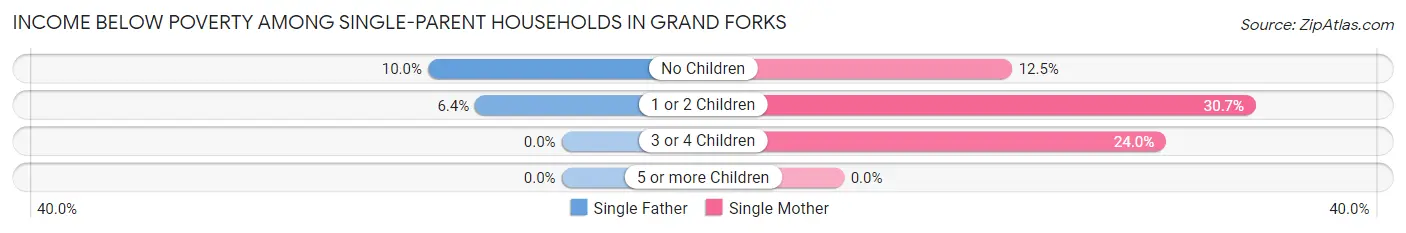
| Children | Single Father | Single Mother |
| No Children | 27 (10.0%) | 94 (12.5%) |
| 1 or 2 Children | 25 (6.4%) | 456 (30.7%) |
| 3 or 4 Children | 0 (0.0%) | 49 (24.0%) |
| 5 or more Children | 0 (0.0%) | 0 (0.0%) |
| Total | 52 (6.7%) | 599 (24.5%) |
Income Below Poverty Among Married-Couple vs Single-Parent Households in Grand Forks
The poverty data for Grand Forks shows that 353 of the married-couple family households (4.1%) and 651 of the single-parent households (20.3%) are living below the poverty level. Within the married-couple family households, those with 5 or more children have the highest poverty rate, with 21 households (63.6%) falling below the poverty line. Among the single-parent households, those with 1 or 2 children have the highest poverty rate, with 481 household (25.7%) living below poverty.
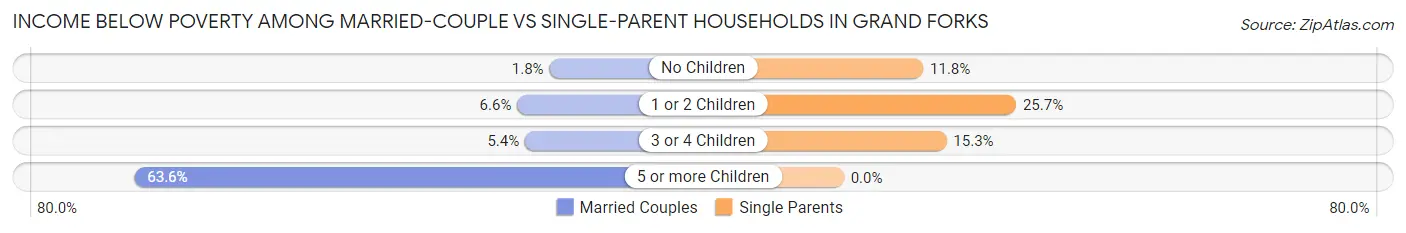
| Children | Married-Couple Families | Single-Parent Households |
| No Children | 82 (1.8%) | 121 (11.8%) |
| 1 or 2 Children | 205 (6.6%) | 481 (25.7%) |
| 3 or 4 Children | 45 (5.4%) | 49 (15.3%) |
| 5 or more Children | 21 (63.6%) | 0 (0.0%) |
| Total | 353 (4.1%) | 651 (20.3%) |
Race in Grand Forks
The most populous races in Grand Forks are White / Caucasian (48,409 | 82.1%), Two or more Races (3,333 | 5.7%), and Hispanic or Latino (2,898 | 4.9%).
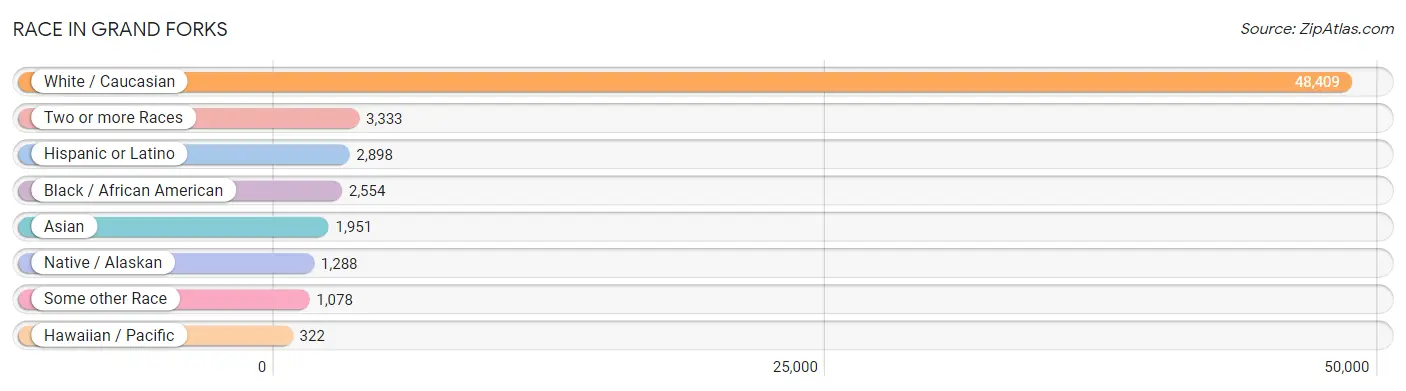
| Race | # Population | % Population |
| Asian | 1,951 | 3.3% |
| Black / African American | 2,554 | 4.3% |
| Hawaiian / Pacific | 322 | 0.5% |
| Hispanic or Latino | 2,898 | 4.9% |
| Native / Alaskan | 1,288 | 2.2% |
| White / Caucasian | 48,409 | 82.1% |
| Two or more Races | 3,333 | 5.7% |
| Some other Race | 1,078 | 1.8% |
| Total | 58,935 | 100.0% |
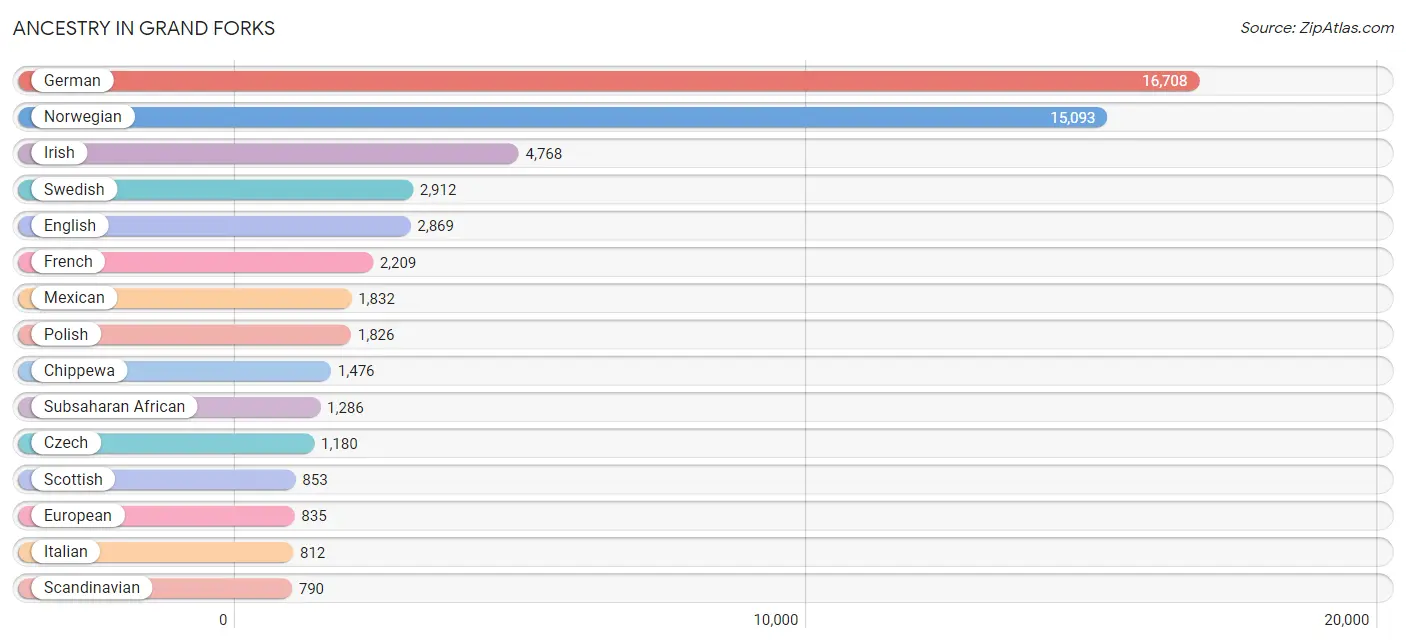
Ancestry in Grand Forks
The most populous ancestries reported in Grand Forks are German (16,708 | 28.3%), Norwegian (15,093 | 25.6%), Irish (4,768 | 8.1%), Swedish (2,912 | 4.9%), and English (2,869 | 4.9%), together accounting for 71.9% of all Grand Forks residents.
| Ancestry | # Population | % Population |
| African | 455 | 0.8% |
| Albanian | 31 | 0.1% |
| American | 780 | 1.3% |
| Apache | 65 | 0.1% |
| Arab | 496 | 0.8% |
| Armenian | 7 | 0.0% |
| Australian | 5 | 0.0% |
| Austrian | 57 | 0.1% |
| Bangladeshi | 14 | 0.0% |
| Belgian | 40 | 0.1% |
| Bhutanese | 297 | 0.5% |
| Brazilian | 15 | 0.0% |
| British | 161 | 0.3% |
| British West Indian | 66 | 0.1% |
| Burmese | 321 | 0.5% |
| Cambodian | 18 | 0.0% |
| Canadian | 133 | 0.2% |
| Celtic | 42 | 0.1% |
| Central American | 53 | 0.1% |
| Central American Indian | 29 | 0.1% |
| Cherokee | 8 | 0.0% |
| Chilean | 98 | 0.2% |
| Chippewa | 1,476 | 2.5% |
| Choctaw | 4 | 0.0% |
| Colombian | 281 | 0.5% |
| Croatian | 33 | 0.1% |
| Cuban | 76 | 0.1% |
| Czech | 1,180 | 2.0% |
| Czechoslovakian | 86 | 0.2% |
| Danish | 691 | 1.2% |
| Dominican | 16 | 0.0% |
| Dutch | 486 | 0.8% |
| Eastern European | 110 | 0.2% |
| Ecuadorian | 32 | 0.1% |
| Egyptian | 84 | 0.1% |
| English | 2,869 | 4.9% |
| Estonian | 11 | 0.0% |
| Ethiopian | 44 | 0.1% |
| European | 835 | 1.4% |
| Fijian | 8 | 0.0% |
| Finnish | 271 | 0.5% |
| French | 2,209 | 3.7% |
| French American Indian | 11 | 0.0% |
| French Canadian | 662 | 1.1% |
| German | 16,708 | 28.3% |
| German Russian | 34 | 0.1% |
| Ghanaian | 26 | 0.0% |
| Greek | 93 | 0.2% |
| Honduran | 15 | 0.0% |
| Hungarian | 24 | 0.0% |
| Icelander | 539 | 0.9% |
| Indian (Asian) | 512 | 0.9% |
| Iranian | 129 | 0.2% |
| Irish | 4,768 | 8.1% |
| Iroquois | 54 | 0.1% |
| Italian | 812 | 1.4% |
| Jamaican | 147 | 0.3% |
| Kenyan | 16 | 0.0% |
| Korean | 468 | 0.8% |
| Lebanese | 102 | 0.2% |
| Liberian | 8 | 0.0% |
| Lithuanian | 64 | 0.1% |
| Luxembourger | 18 | 0.0% |
| Mexican | 1,832 | 3.1% |
| Mexican American Indian | 55 | 0.1% |
| Mongolian | 33 | 0.1% |
| Native Hawaiian | 349 | 0.6% |
| Navajo | 109 | 0.2% |
| Nicaraguan | 10 | 0.0% |
| Nigerian | 257 | 0.4% |
| Northern European | 105 | 0.2% |
| Norwegian | 15,093 | 25.6% |
| Palestinian | 20 | 0.0% |
| Panamanian | 28 | 0.1% |
| Peruvian | 15 | 0.0% |
| Polish | 1,826 | 3.1% |
| Portuguese | 63 | 0.1% |
| Pueblo | 16 | 0.0% |
| Puerto Rican | 293 | 0.5% |
| Russian | 510 | 0.9% |
| Samoan | 14 | 0.0% |
| Scandinavian | 790 | 1.3% |
| Scotch-Irish | 314 | 0.5% |
| Scottish | 853 | 1.5% |
| Seminole | 12 | 0.0% |
| Serbian | 28 | 0.1% |
| Shoshone | 31 | 0.1% |
| Sioux | 530 | 0.9% |
| Slavic | 26 | 0.0% |
| Slovak | 86 | 0.2% |
| Somali | 383 | 0.6% |
| South American | 426 | 0.7% |
| South American Indian | 91 | 0.2% |
| Spaniard | 75 | 0.1% |
| Spanish | 83 | 0.1% |
| Sri Lankan | 123 | 0.2% |
| Subsaharan African | 1,286 | 2.2% |
| Sudanese | 42 | 0.1% |
| Swedish | 2,912 | 4.9% |
| Swiss | 54 | 0.1% |
| Thai | 284 | 0.5% |
| Trinidadian and Tobagonian | 6 | 0.0% |
| Turkish | 41 | 0.1% |
| Ukrainian | 213 | 0.4% |
| Vietnamese | 178 | 0.3% |
| Welsh | 312 | 0.5% |
| Yugoslavian | 165 | 0.3% | View All 107 Rows |
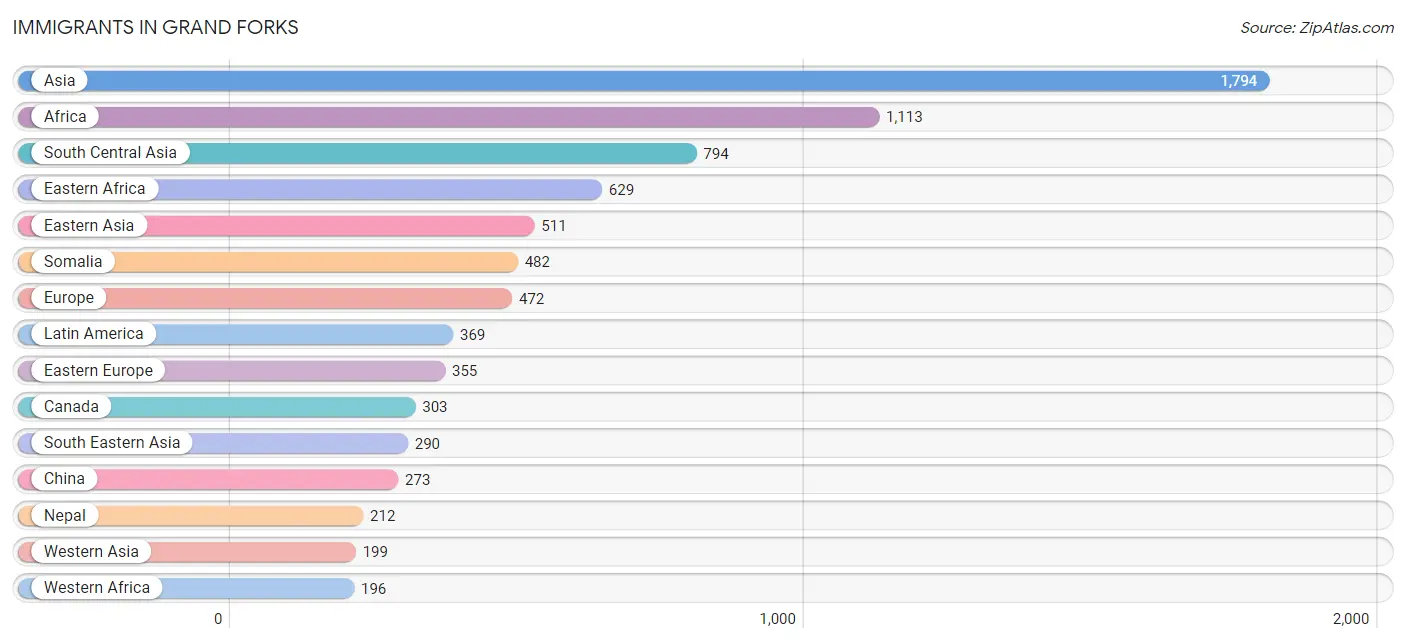
Immigrants in Grand Forks
The most numerous immigrant groups reported in Grand Forks came from Asia (1,794 | 3.0%), Africa (1,113 | 1.9%), South Central Asia (794 | 1.3%), Eastern Africa (629 | 1.1%), and Eastern Asia (511 | 0.9%), together accounting for 8.2% of all Grand Forks residents.
| Immigration Origin | # Population | % Population |
| Africa | 1,113 | 1.9% |
| Asia | 1,794 | 3.0% |
| Australia | 8 | 0.0% |
| Bangladesh | 112 | 0.2% |
| Bosnia and Herzegovina | 82 | 0.1% |
| Brazil | 14 | 0.0% |
| Bulgaria | 131 | 0.2% |
| Cameroon | 42 | 0.1% |
| Canada | 303 | 0.5% |
| Caribbean | 169 | 0.3% |
| Central America | 148 | 0.3% |
| Chile | 7 | 0.0% |
| China | 273 | 0.5% |
| Colombia | 20 | 0.0% |
| Costa Rica | 8 | 0.0% |
| Dominican Republic | 5 | 0.0% |
| Eastern Africa | 629 | 1.1% |
| Eastern Asia | 511 | 0.9% |
| Eastern Europe | 355 | 0.6% |
| Egypt | 110 | 0.2% |
| Ethiopia | 67 | 0.1% |
| Europe | 472 | 0.8% |
| France | 4 | 0.0% |
| Germany | 48 | 0.1% |
| Ghana | 7 | 0.0% |
| Grenada | 12 | 0.0% |
| Guatemala | 6 | 0.0% |
| Honduras | 10 | 0.0% |
| India | 54 | 0.1% |
| Iran | 169 | 0.3% |
| Iraq | 15 | 0.0% |
| Italy | 12 | 0.0% |
| Jamaica | 152 | 0.3% |
| Japan | 45 | 0.1% |
| Jordan | 24 | 0.0% |
| Kenya | 80 | 0.1% |
| Korea | 193 | 0.3% |
| Latin America | 369 | 0.6% |
| Lebanon | 35 | 0.1% |
| Liberia | 8 | 0.0% |
| Malaysia | 33 | 0.1% |
| Mexico | 124 | 0.2% |
| Middle Africa | 42 | 0.1% |
| Nepal | 212 | 0.4% |
| Netherlands | 13 | 0.0% |
| Nigeria | 156 | 0.3% |
| Northern Africa | 161 | 0.3% |
| Northern Europe | 14 | 0.0% |
| Oceania | 23 | 0.0% |
| Pakistan | 25 | 0.0% |
| Peru | 11 | 0.0% |
| Philippines | 176 | 0.3% |
| Poland | 21 | 0.0% |
| Russia | 121 | 0.2% |
| Saudi Arabia | 63 | 0.1% |
| Senegal | 25 | 0.0% |
| Somalia | 482 | 0.8% |
| South Africa | 30 | 0.1% |
| South America | 52 | 0.1% |
| South Central Asia | 794 | 1.3% |
| South Eastern Asia | 290 | 0.5% |
| Southern Europe | 38 | 0.1% |
| Spain | 26 | 0.0% |
| Sudan | 22 | 0.0% |
| Sweden | 4 | 0.0% |
| Taiwan | 2 | 0.0% |
| Turkey | 27 | 0.1% |
| Vietnam | 81 | 0.1% |
| Western Africa | 196 | 0.3% |
| Western Asia | 199 | 0.3% |
| Western Europe | 65 | 0.1% | View All 71 Rows |
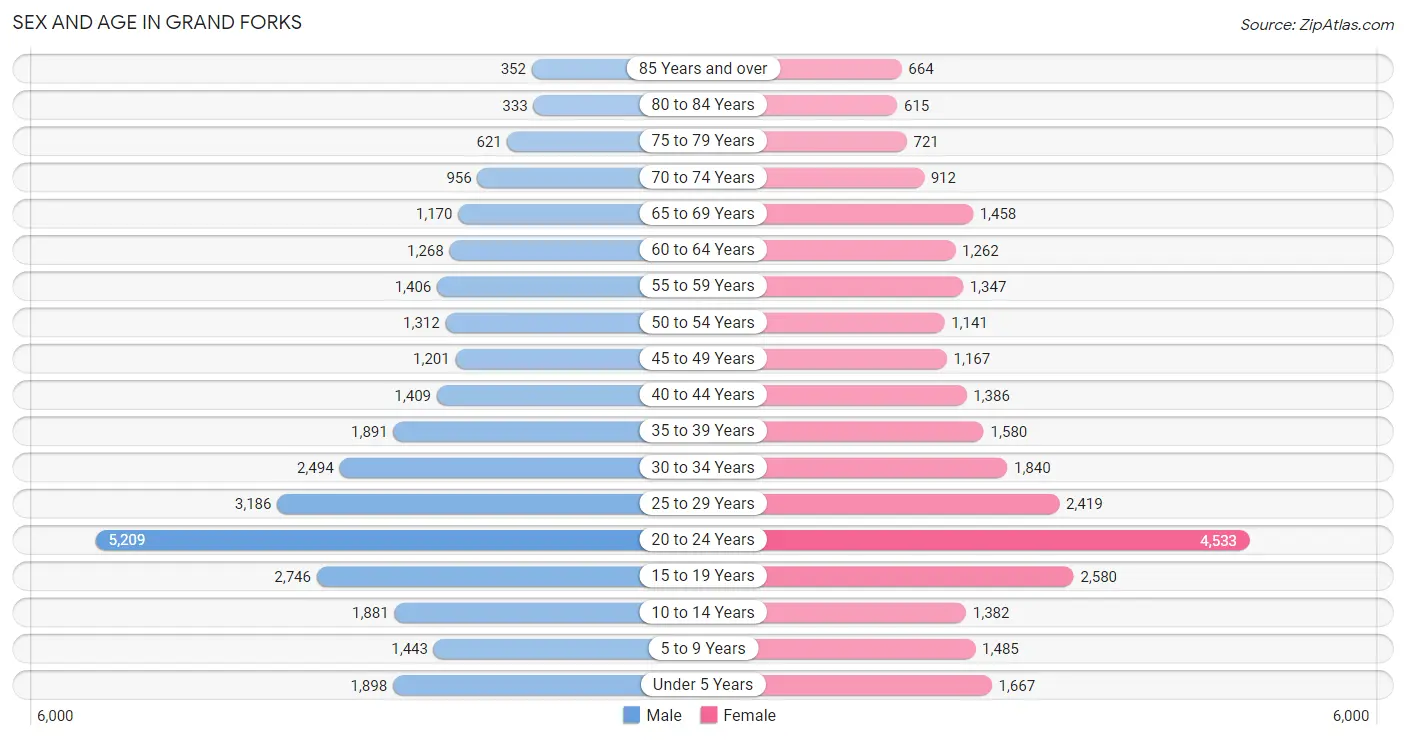
Sex and Age in Grand Forks
Sex and Age in Grand Forks
The most populous age groups in Grand Forks are 20 to 24 Years (5,209 | 16.9%) for men and 20 to 24 Years (4,533 | 16.1%) for women.
| Age Bracket | Male | Female |
| Under 5 Years | 1,898 (6.2%) | 1,667 (5.9%) |
| 5 to 9 Years | 1,443 (4.7%) | 1,485 (5.3%) |
| 10 to 14 Years | 1,881 (6.1%) | 1,382 (4.9%) |
| 15 to 19 Years | 2,746 (8.9%) | 2,580 (9.2%) |
| 20 to 24 Years | 5,209 (16.9%) | 4,533 (16.1%) |
| 25 to 29 Years | 3,186 (10.3%) | 2,419 (8.6%) |
| 30 to 34 Years | 2,494 (8.1%) | 1,840 (6.5%) |
| 35 to 39 Years | 1,891 (6.1%) | 1,580 (5.6%) |
| 40 to 44 Years | 1,409 (4.6%) | 1,386 (4.9%) |
| 45 to 49 Years | 1,201 (3.9%) | 1,167 (4.1%) |
| 50 to 54 Years | 1,312 (4.3%) | 1,141 (4.1%) |
| 55 to 59 Years | 1,406 (4.6%) | 1,347 (4.8%) |
| 60 to 64 Years | 1,268 (4.1%) | 1,262 (4.5%) |
| 65 to 69 Years | 1,170 (3.8%) | 1,458 (5.2%) |
| 70 to 74 Years | 956 (3.1%) | 912 (3.2%) |
| 75 to 79 Years | 621 (2.0%) | 721 (2.6%) |
| 80 to 84 Years | 333 (1.1%) | 615 (2.2%) |
| 85 Years and over | 352 (1.1%) | 664 (2.4%) |
| Total | 30,776 (100.0%) | 28,159 (100.0%) |
Families and Households in Grand Forks
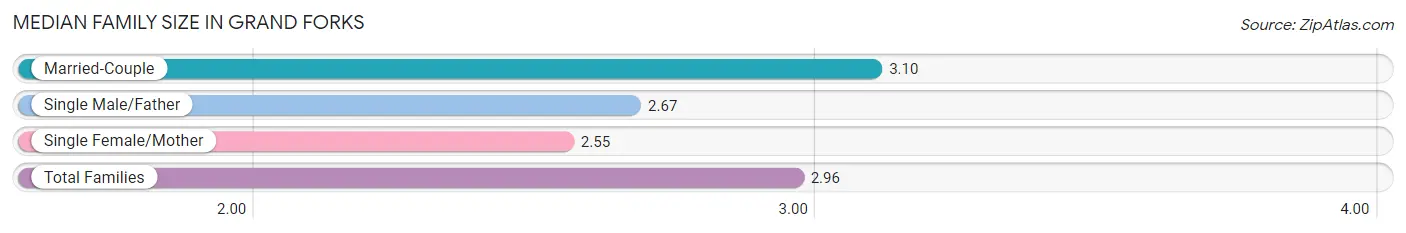
Median Family Size in Grand Forks
The median family size in Grand Forks is 2.96 persons per family, with married-couple families (8,560 | 72.7%) accounting for the largest median family size of 3.1 persons per family. On the other hand, single female/mother families (2,440 | 20.7%) represent the smallest median family size with 2.55 persons per family.
| Family Type | # Families | Family Size |
| Married-Couple | 8,560 (72.7%) | 3.10 |
| Single Male/Father | 775 (6.6%) | 2.67 |
| Single Female/Mother | 2,440 (20.7%) | 2.55 |
| Total Families | 11,775 (100.0%) | 2.96 |
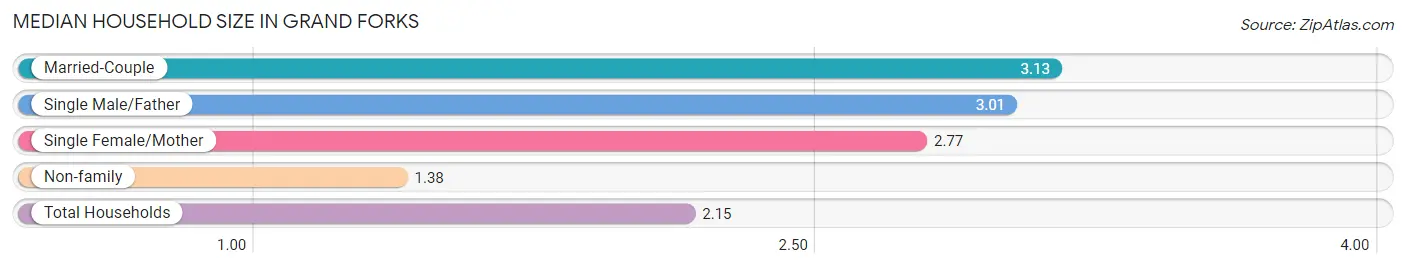
Median Household Size in Grand Forks
The median household size in Grand Forks is 2.15 persons per household, with married-couple households (8,560 | 33.6%) accounting for the largest median household size of 3.13 persons per household. non-family households (13,712 | 53.8%) represent the smallest median household size with 1.38 persons per household.
| Household Type | # Households | Household Size |
| Married-Couple | 8,560 (33.6%) | 3.13 |
| Single Male/Father | 775 (3.0%) | 3.01 |
| Single Female/Mother | 2,440 (9.6%) | 2.77 |
| Non-family | 13,712 (53.8%) | 1.38 |
| Total Households | 25,487 (100.0%) | 2.15 |
Household Size by Marriage Status in Grand Forks
Out of a total of 25,487 households in Grand Forks, 11,775 (46.2%) are family households, while 13,712 (53.8%) are nonfamily households. The most numerous type of family households are 2-person households, comprising 5,423, and the most common type of nonfamily households are 1-person households, comprising 10,106.
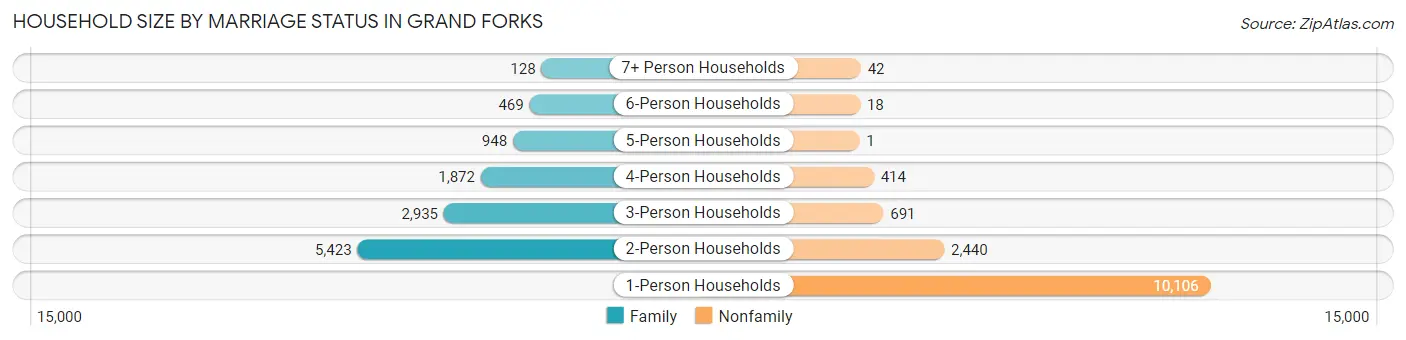
| Household Size | Family Households | Nonfamily Households |
| 1-Person Households | - | 10,106 (39.7%) |
| 2-Person Households | 5,423 (21.3%) | 2,440 (9.6%) |
| 3-Person Households | 2,935 (11.5%) | 691 (2.7%) |
| 4-Person Households | 1,872 (7.3%) | 414 (1.6%) |
| 5-Person Households | 948 (3.7%) | 1 (0.0%) |
| 6-Person Households | 469 (1.8%) | 18 (0.1%) |
| 7+ Person Households | 128 (0.5%) | 42 (0.2%) |
| Total | 11,775 (46.2%) | 13,712 (53.8%) |
Female Fertility in Grand Forks
Fertility by Age in Grand Forks
Average fertility rate in Grand Forks is 57.0 births per 1,000 women. Women in the age bracket of 20 to 34 years have the highest fertility rate with 90.0 births per 1,000 women. Women in the age bracket of 20 to 34 years acount for 88.1% of all women with births.
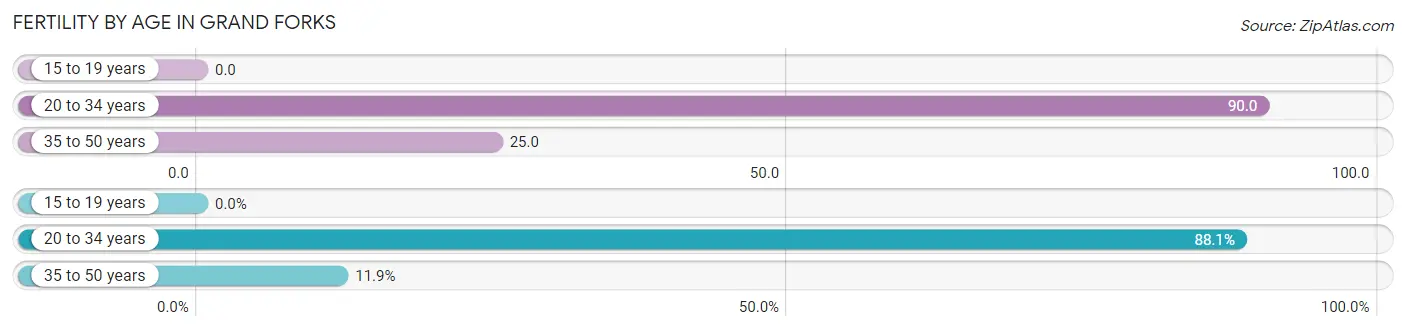
| Age Bracket | Women with Births | Births / 1,000 Women |
| 15 to 19 years | 0 (0.0%) | 0.0 |
| 20 to 34 years | 792 (88.1%) | 90.0 |
| 35 to 50 years | 107 (11.9%) | 25.0 |
| Total | 899 (100.0%) | 57.0 |
Fertility by Age by Marriage Status in Grand Forks
77.5% of women with births (899) in Grand Forks are married. The highest percentage of unmarried women with births falls into 20 to 34 years age bracket with 25.5% of them unmarried at the time of birth, while the lowest percentage of unmarried women with births belong to 35 to 50 years age bracket with 0.0% of them unmarried.
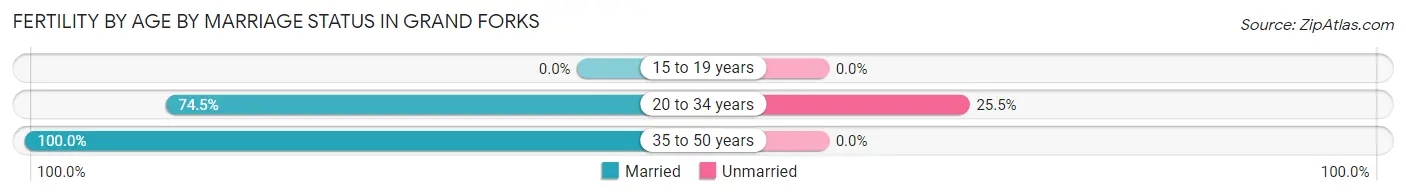
| Age Bracket | Married | Unmarried |
| 15 to 19 years | 0 (0.0%) | 0 (0.0%) |
| 20 to 34 years | 590 (74.5%) | 202 (25.5%) |
| 35 to 50 years | 107 (100.0%) | 0 (0.0%) |
| Total | 697 (77.5%) | 202 (22.5%) |
Fertility by Education in Grand Forks
Average fertility rate in Grand Forks is 57.0 births per 1,000 women. Women with the education attainment of less than high school have the highest fertility rate of 111.0 births per 1,000 women, while women with the education attainment of high school diploma have the lowest fertility at 37.0 births per 1,000 women. Women with the education attainment of college or associate's degree represent 35.9% of all women with births.
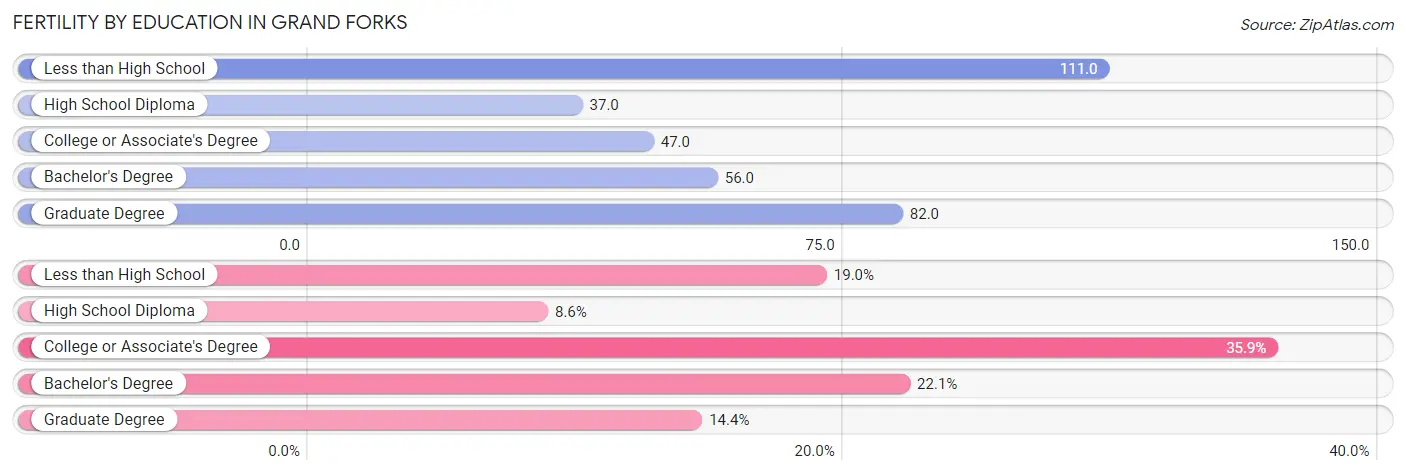
| Educational Attainment | Women with Births | Births / 1,000 Women |
| Less than High School | 171 (19.0%) | 111.0 |
| High School Diploma | 77 (8.6%) | 37.0 |
| College or Associate's Degree | 323 (35.9%) | 47.0 |
| Bachelor's Degree | 199 (22.1%) | 56.0 |
| Graduate Degree | 129 (14.3%) | 82.0 |
| Total | 899 (100.0%) | 57.0 |
Fertility by Education by Marriage Status in Grand Forks
22.5% of women with births in Grand Forks are unmarried. Women with the educational attainment of high school diploma are most likely to be married with 100.0% of them married at childbirth, while women with the educational attainment of less than high school are least likely to be married with 48.5% of them unmarried at childbirth.
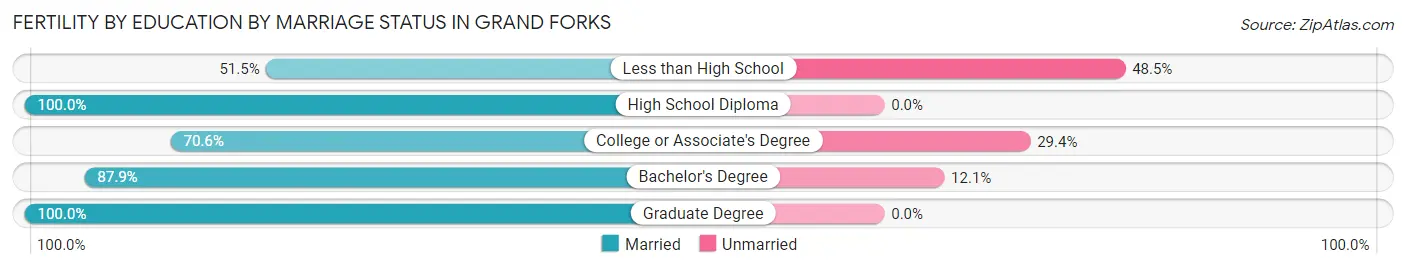
| Educational Attainment | Married | Unmarried |
| Less than High School | 88 (51.5%) | 83 (48.5%) |
| High School Diploma | 77 (100.0%) | 0 (0.0%) |
| College or Associate's Degree | 228 (70.6%) | 95 (29.4%) |
| Bachelor's Degree | 175 (87.9%) | 24 (12.1%) |
| Graduate Degree | 129 (100.0%) | 0 (0.0%) |
| Total | 697 (77.5%) | 202 (22.5%) |
Employment Characteristics in Grand Forks
Employment by Class of Employer in Grand Forks
Among the 32,384 employed individuals in Grand Forks, private company employees (18,716 | 57.8%), state government employees (4,108 | 12.7%), and not-for-profit organizations (4,020 | 12.4%) make up the most common classes of employment.
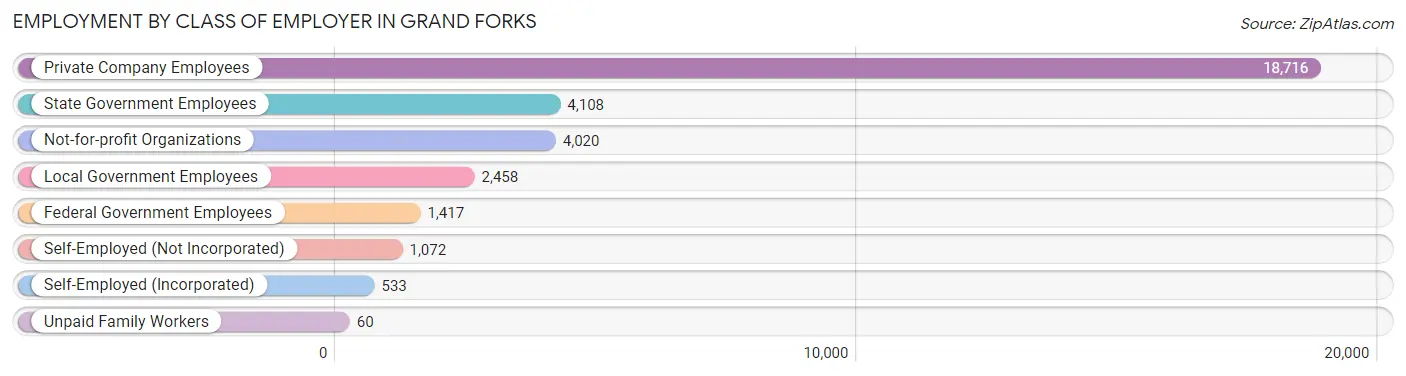
| Employer Class | # Employees | % Employees |
| Private Company Employees | 18,716 | 57.8% |
| Self-Employed (Incorporated) | 533 | 1.7% |
| Self-Employed (Not Incorporated) | 1,072 | 3.3% |
| Not-for-profit Organizations | 4,020 | 12.4% |
| Local Government Employees | 2,458 | 7.6% |
| State Government Employees | 4,108 | 12.7% |
| Federal Government Employees | 1,417 | 4.4% |
| Unpaid Family Workers | 60 | 0.2% |
| Total | 32,384 | 100.0% |
Employment Status by Age in Grand Forks
According to the labor force statistics for Grand Forks, out of the total population over 16 years of age (48,684), 71.1% or 34,614 individuals are in the labor force, with 3.7% or 1,281 of them unemployed. The age group with the highest labor force participation rate is 30 to 34 years, with 88.7% or 3,844 individuals in the labor force. Within the labor force, the 16 to 19 years age range has the highest percentage of unemployed individuals, with 15.5% or 441 of them being unemployed.
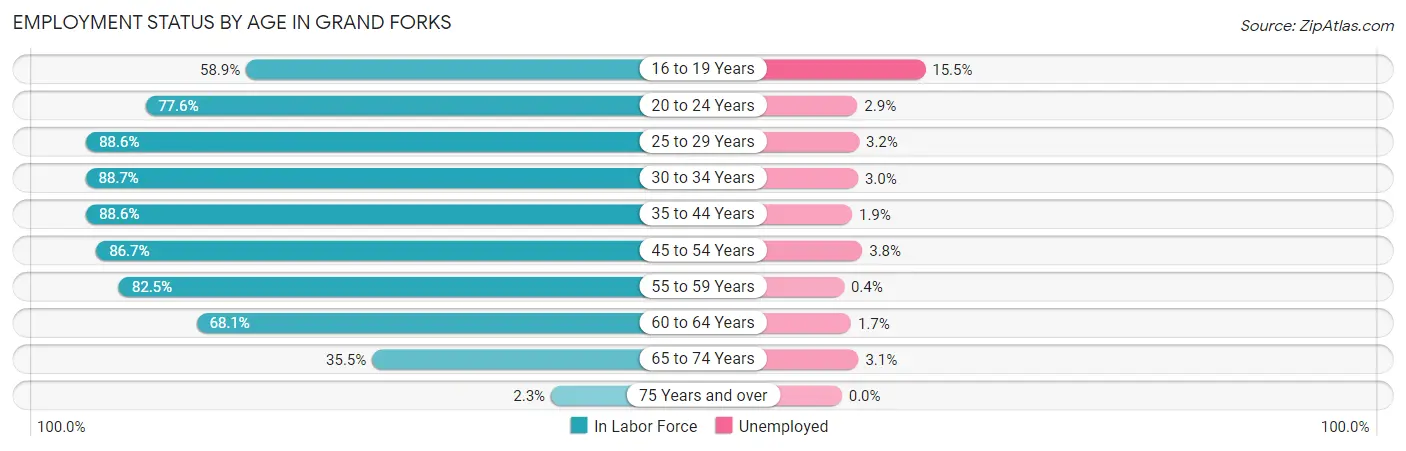
| Age Bracket | In Labor Force | Unemployed |
| 16 to 19 Years | 2,845 (58.9%) | 441 (15.5%) |
| 20 to 24 Years | 7,560 (77.6%) | 219 (2.9%) |
| 25 to 29 Years | 4,966 (88.6%) | 159 (3.2%) |
| 30 to 34 Years | 3,844 (88.7%) | 115 (3.0%) |
| 35 to 44 Years | 5,552 (88.6%) | 105 (1.9%) |
| 45 to 54 Years | 4,180 (86.7%) | 159 (3.8%) |
| 55 to 59 Years | 2,271 (82.5%) | 9 (0.4%) |
| 60 to 64 Years | 1,723 (68.1%) | 29 (1.7%) |
| 65 to 74 Years | 1,596 (35.5%) | 49 (3.1%) |
| 75 Years and over | 76 (2.3%) | 0 (0.0%) |
| Total | 34,614 (71.1%) | 1,281 (3.7%) |
Employment Status by Educational Attainment in Grand Forks
According to labor force statistics for Grand Forks, 85.7% of individuals (22,547) out of the total population between 25 and 64 years of age (26,309) are in the labor force, with 2.5% or 564 of them being unemployed. The group with the highest labor force participation rate are those with the educational attainment of bachelor's degree or higher, with 90.0% or 9,890 individuals in the labor force. Within the labor force, individuals with less than high school education have the highest percentage of unemployment, with 5.1% or 44 of them being unemployed.
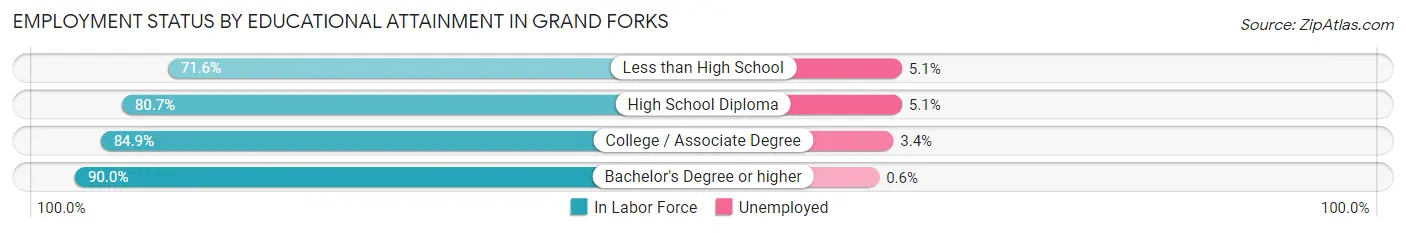
| Educational Attainment | In Labor Force | Unemployed |
| Less than High School | 856 (71.6%) | 61 (5.1%) |
| High School Diploma | 3,829 (80.7%) | 242 (5.1%) |
| College / Associate Degree | 7,963 (84.9%) | 319 (3.4%) |
| Bachelor's Degree or higher | 9,890 (90.0%) | 66 (0.6%) |
| Total | 22,547 (85.7%) | 658 (2.5%) |
Employment Occupations by Sex in Grand Forks
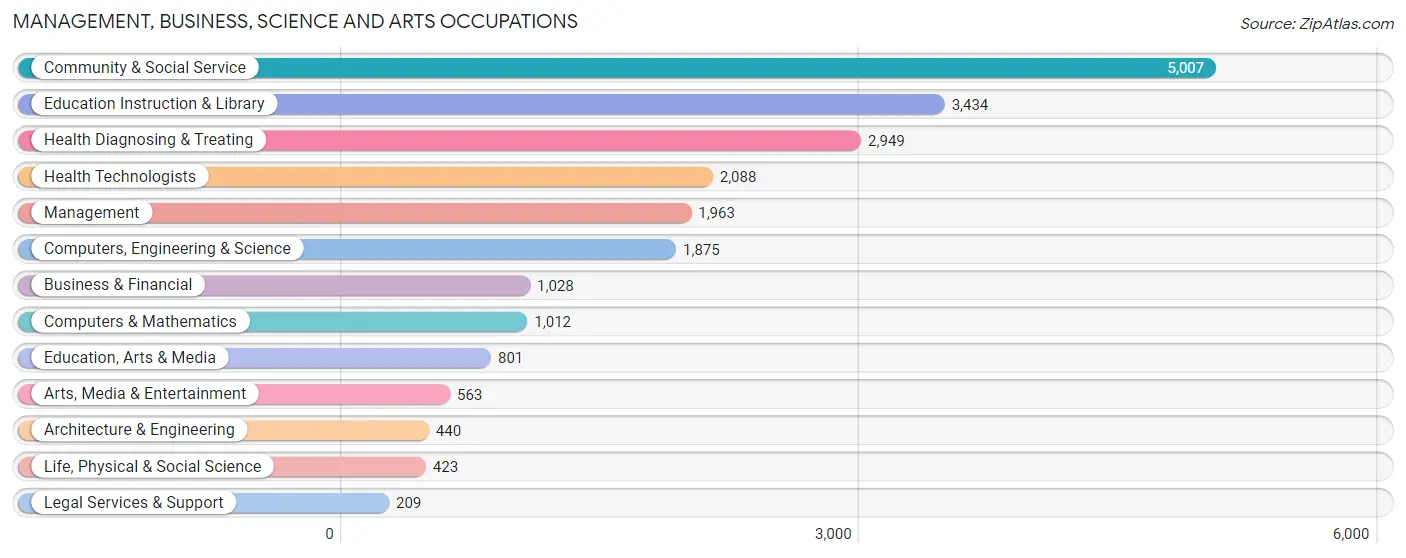
Management, Business, Science and Arts Occupations
The most common Management, Business, Science and Arts occupations in Grand Forks are Community & Social Service (5,007 | 15.2%), Education Instruction & Library (3,434 | 10.5%), Health Diagnosing & Treating (2,949 | 9.0%), Health Technologists (2,088 | 6.4%), and Management (1,963 | 6.0%).
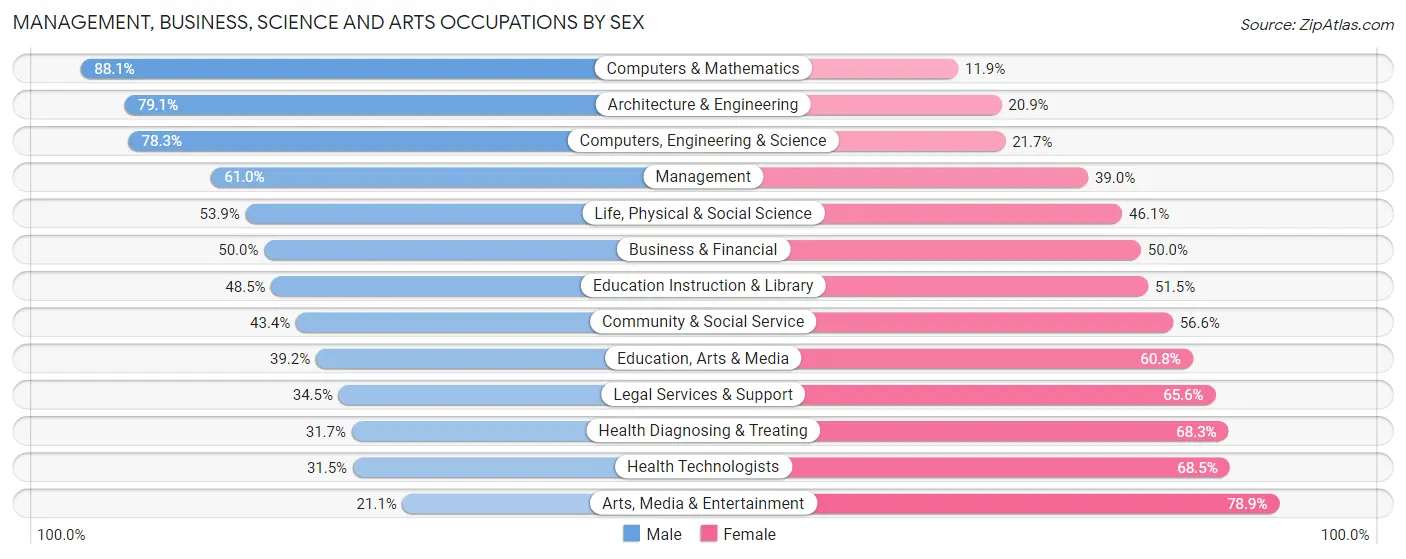
Management, Business, Science and Arts Occupations by Sex
Within the Management, Business, Science and Arts occupations in Grand Forks, the most male-oriented occupations are Computers & Mathematics (88.1%), Architecture & Engineering (79.1%), and Computers, Engineering & Science (78.3%), while the most female-oriented occupations are Arts, Media & Entertainment (78.9%), Health Technologists (68.5%), and Health Diagnosing & Treating (68.3%).
| Occupation | Male | Female |
| Management | 1,198 (61.0%) | 765 (39.0%) |
| Business & Financial | 514 (50.0%) | 514 (50.0%) |
| Computers, Engineering & Science | 1,468 (78.3%) | 407 (21.7%) |
| Computers & Mathematics | 892 (88.1%) | 120 (11.9%) |
| Architecture & Engineering | 348 (79.1%) | 92 (20.9%) |
| Life, Physical & Social Science | 228 (53.9%) | 195 (46.1%) |
| Community & Social Service | 2,171 (43.4%) | 2,836 (56.6%) |
| Education, Arts & Media | 314 (39.2%) | 487 (60.8%) |
| Legal Services & Support | 72 (34.4%) | 137 (65.5%) |
| Education Instruction & Library | 1,666 (48.5%) | 1,768 (51.5%) |
| Arts, Media & Entertainment | 119 (21.1%) | 444 (78.9%) |
| Health Diagnosing & Treating | 936 (31.7%) | 2,013 (68.3%) |
| Health Technologists | 658 (31.5%) | 1,430 (68.5%) |
| Total (Category) | 6,287 (49.0%) | 6,535 (51.0%) |
| Total (Overall) | 17,804 (54.2%) | 15,031 (45.8%) |
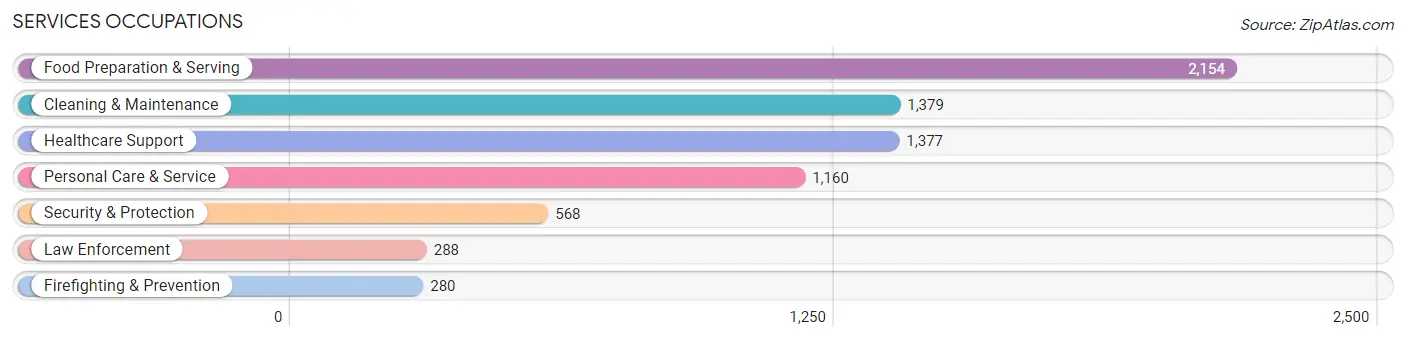
Services Occupations
The most common Services occupations in Grand Forks are Food Preparation & Serving (2,154 | 6.6%), Cleaning & Maintenance (1,379 | 4.2%), Healthcare Support (1,377 | 4.2%), Personal Care & Service (1,160 | 3.5%), and Security & Protection (568 | 1.7%).
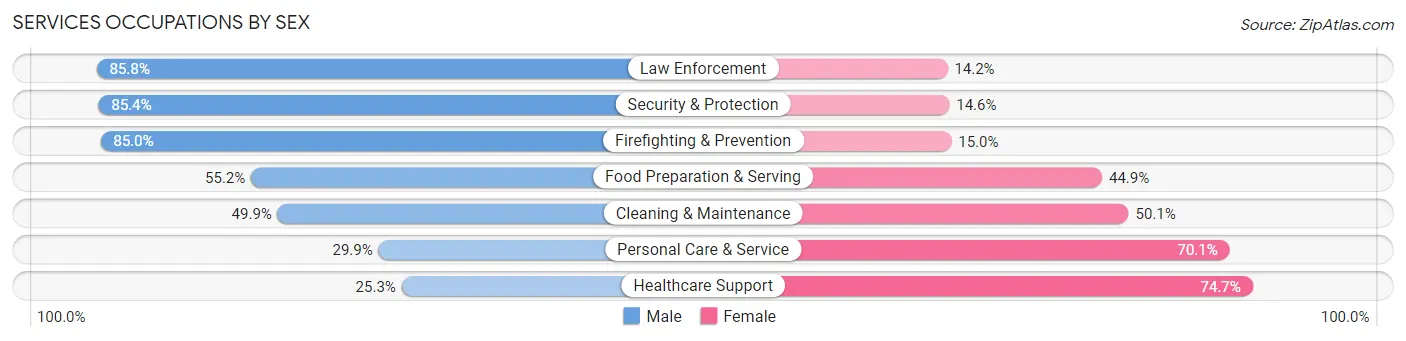
Services Occupations by Sex
Within the Services occupations in Grand Forks, the most male-oriented occupations are Law Enforcement (85.8%), Security & Protection (85.4%), and Firefighting & Prevention (85.0%), while the most female-oriented occupations are Healthcare Support (74.7%), Personal Care & Service (70.1%), and Cleaning & Maintenance (50.1%).
| Occupation | Male | Female |
| Healthcare Support | 349 (25.3%) | 1,028 (74.7%) |
| Security & Protection | 485 (85.4%) | 83 (14.6%) |
| Firefighting & Prevention | 238 (85.0%) | 42 (15.0%) |
| Law Enforcement | 247 (85.8%) | 41 (14.2%) |
| Food Preparation & Serving | 1,188 (55.1%) | 966 (44.9%) |
| Cleaning & Maintenance | 688 (49.9%) | 691 (50.1%) |
| Personal Care & Service | 347 (29.9%) | 813 (70.1%) |
| Total (Category) | 3,057 (46.1%) | 3,581 (53.9%) |
| Total (Overall) | 17,804 (54.2%) | 15,031 (45.8%) |
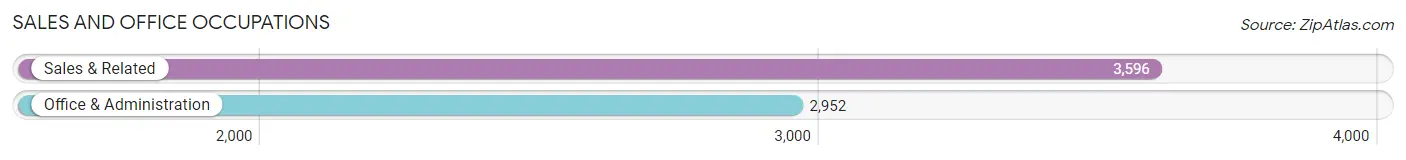
Sales and Office Occupations
The most common Sales and Office occupations in Grand Forks are Sales & Related (3,596 | 11.0%), and Office & Administration (2,952 | 9.0%).
Sales and Office Occupations by Sex
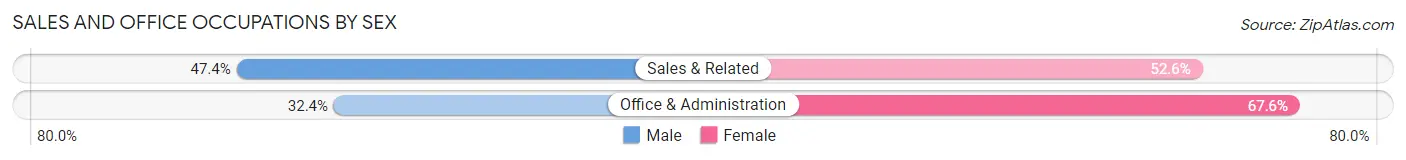
| Occupation | Male | Female |
| Sales & Related | 1,704 (47.4%) | 1,892 (52.6%) |
| Office & Administration | 957 (32.4%) | 1,995 (67.6%) |
| Total (Category) | 2,661 (40.6%) | 3,887 (59.4%) |
| Total (Overall) | 17,804 (54.2%) | 15,031 (45.8%) |
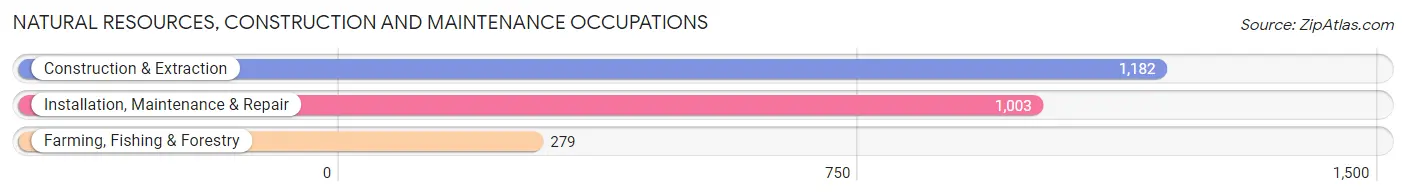
Natural Resources, Construction and Maintenance Occupations
The most common Natural Resources, Construction and Maintenance occupations in Grand Forks are Construction & Extraction (1,182 | 3.6%), Installation, Maintenance & Repair (1,003 | 3.0%), and Farming, Fishing & Forestry (279 | 0.9%).
Natural Resources, Construction and Maintenance Occupations by Sex
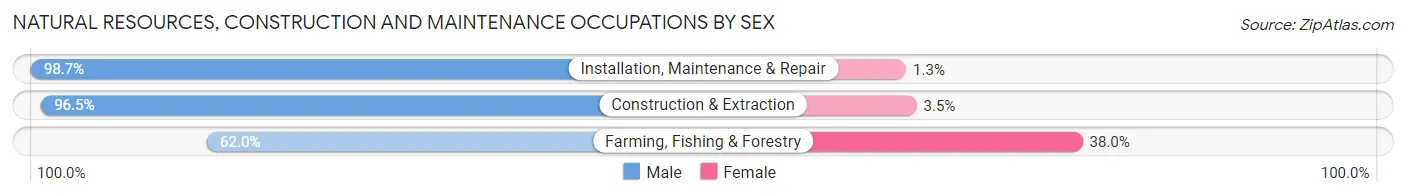
| Occupation | Male | Female |
| Farming, Fishing & Forestry | 173 (62.0%) | 106 (38.0%) |
| Construction & Extraction | 1,141 (96.5%) | 41 (3.5%) |
| Installation, Maintenance & Repair | 990 (98.7%) | 13 (1.3%) |
| Total (Category) | 2,304 (93.5%) | 160 (6.5%) |
| Total (Overall) | 17,804 (54.2%) | 15,031 (45.8%) |
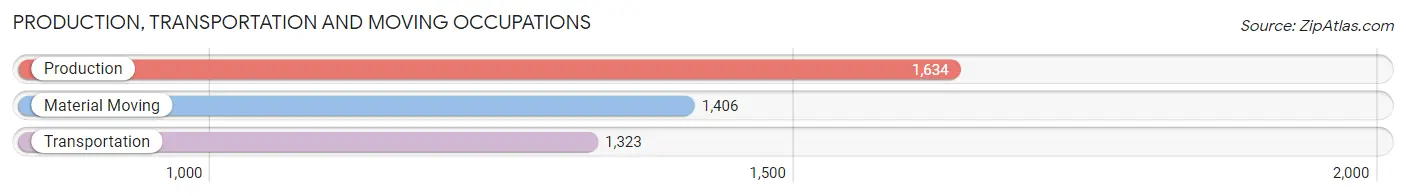
Production, Transportation and Moving Occupations
The most common Production, Transportation and Moving occupations in Grand Forks are Production (1,634 | 5.0%), Material Moving (1,406 | 4.3%), and Transportation (1,323 | 4.0%).
Production, Transportation and Moving Occupations by Sex
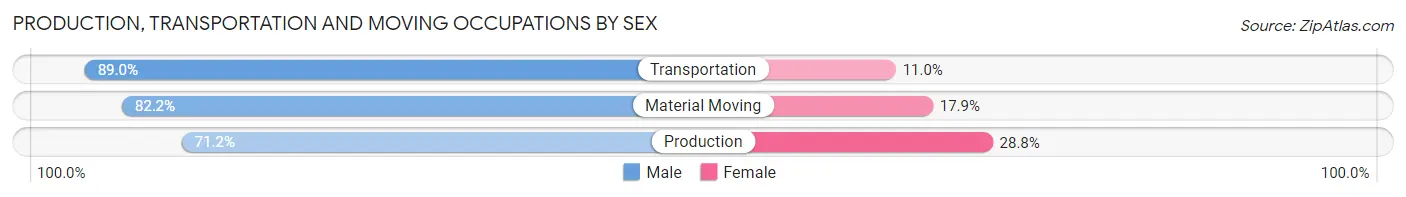
| Occupation | Male | Female |
| Production | 1,163 (71.2%) | 471 (28.8%) |
| Transportation | 1,177 (89.0%) | 146 (11.0%) |
| Material Moving | 1,155 (82.2%) | 251 (17.8%) |
| Total (Category) | 3,495 (80.1%) | 868 (19.9%) |
| Total (Overall) | 17,804 (54.2%) | 15,031 (45.8%) |
Employment Industries by Sex in Grand Forks
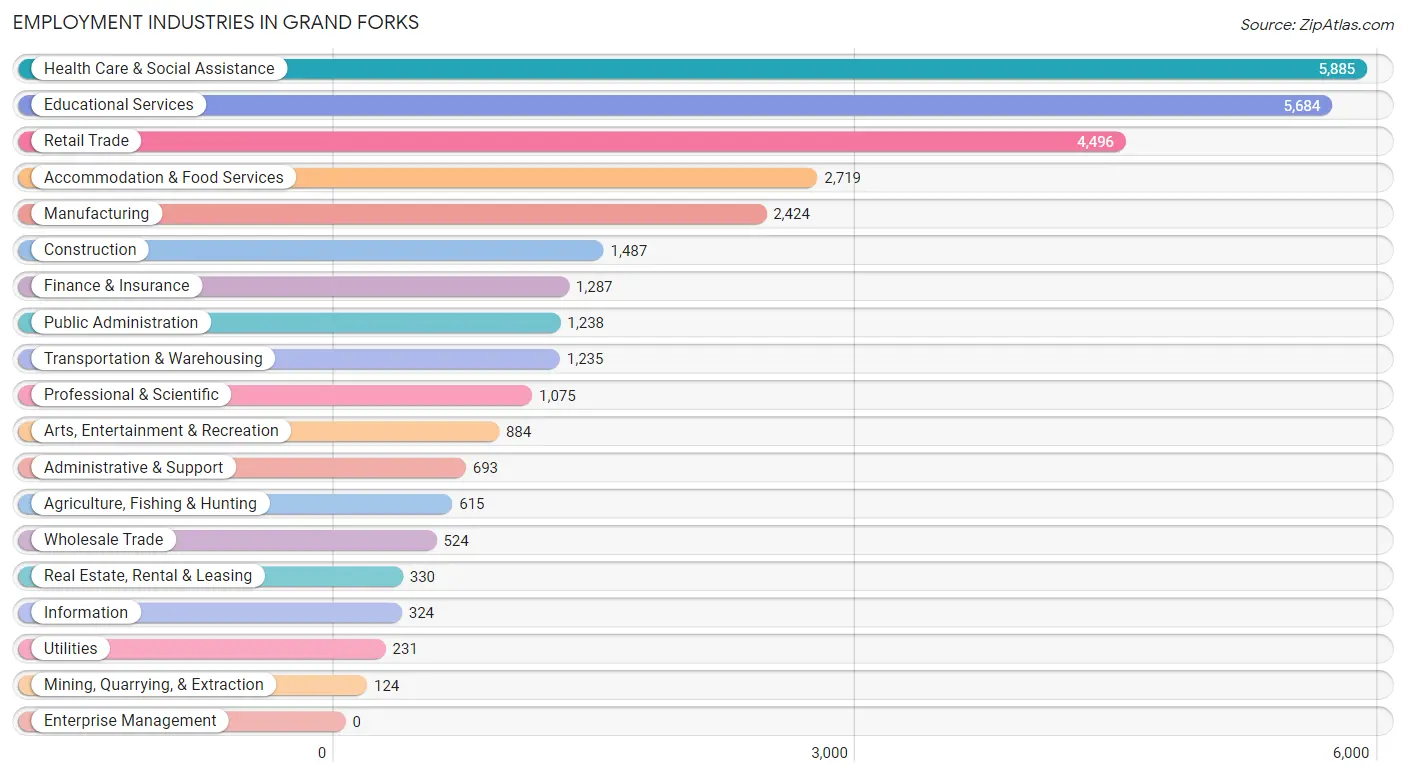
Employment Industries in Grand Forks
The major employment industries in Grand Forks include Health Care & Social Assistance (5,885 | 17.9%), Educational Services (5,684 | 17.3%), Retail Trade (4,496 | 13.7%), Accommodation & Food Services (2,719 | 8.3%), and Manufacturing (2,424 | 7.4%).
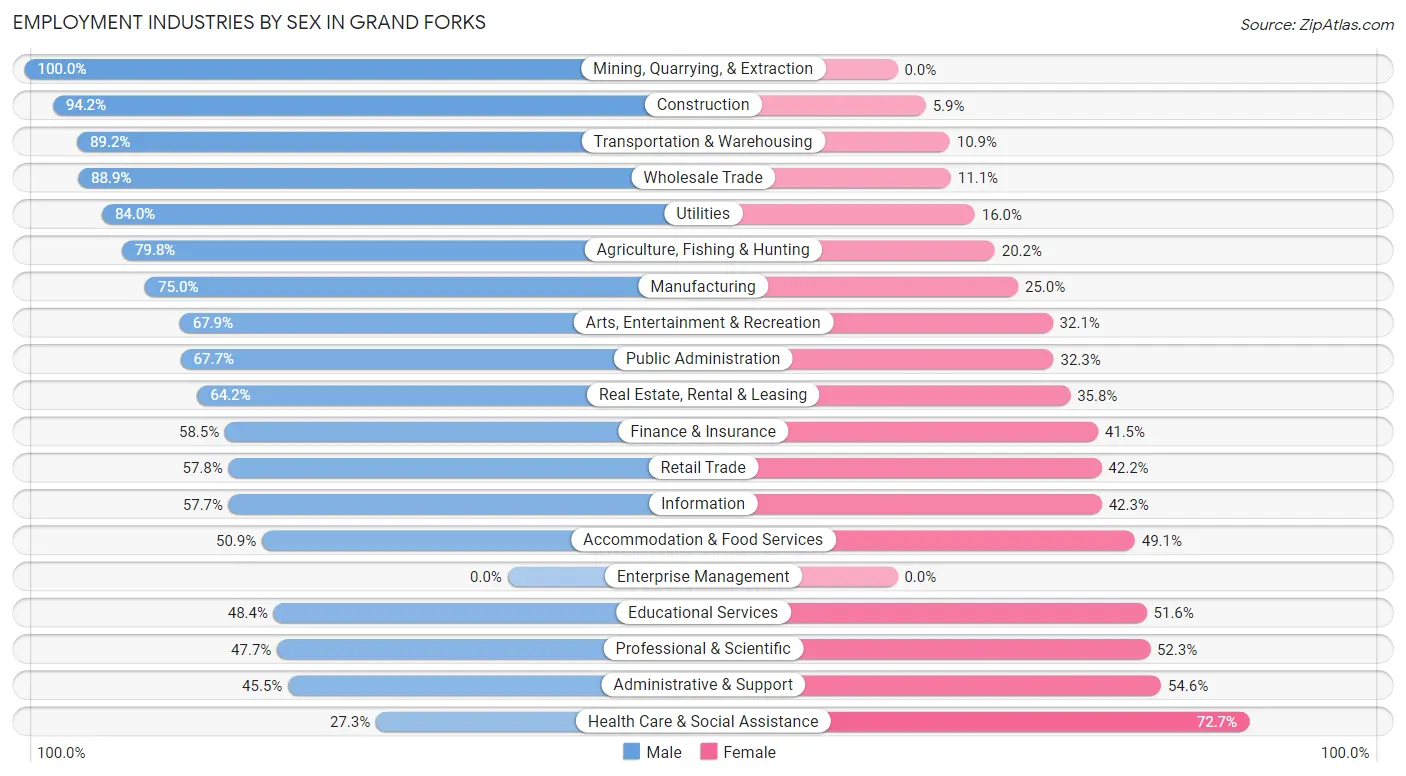
Employment Industries by Sex in Grand Forks
The Grand Forks industries that see more men than women are Mining, Quarrying, & Extraction (100.0%), Construction (94.2%), and Transportation & Warehousing (89.1%), whereas the industries that tend to have a higher number of women are Health Care & Social Assistance (72.7%), Administrative & Support (54.5%), and Professional & Scientific (52.3%).
| Industry | Male | Female |
| Agriculture, Fishing & Hunting | 491 (79.8%) | 124 (20.2%) |
| Mining, Quarrying, & Extraction | 124 (100.0%) | 0 (0.0%) |
| Construction | 1,400 (94.2%) | 87 (5.9%) |
| Manufacturing | 1,819 (75.0%) | 605 (25.0%) |
| Wholesale Trade | 466 (88.9%) | 58 (11.1%) |
| Retail Trade | 2,598 (57.8%) | 1,898 (42.2%) |
| Transportation & Warehousing | 1,101 (89.1%) | 134 (10.8%) |
| Utilities | 194 (84.0%) | 37 (16.0%) |
| Information | 187 (57.7%) | 137 (42.3%) |
| Finance & Insurance | 753 (58.5%) | 534 (41.5%) |
| Real Estate, Rental & Leasing | 212 (64.2%) | 118 (35.8%) |
| Professional & Scientific | 513 (47.7%) | 562 (52.3%) |
| Enterprise Management | 0 (0.0%) | 0 (0.0%) |
| Administrative & Support | 315 (45.5%) | 378 (54.5%) |
| Educational Services | 2,752 (48.4%) | 2,932 (51.6%) |
| Health Care & Social Assistance | 1,604 (27.3%) | 4,281 (72.7%) |
| Arts, Entertainment & Recreation | 600 (67.9%) | 284 (32.1%) |
| Accommodation & Food Services | 1,383 (50.9%) | 1,336 (49.1%) |
| Public Administration | 838 (67.7%) | 400 (32.3%) |
| Total | 17,804 (54.2%) | 15,031 (45.8%) |
Education in Grand Forks
School Enrollment in Grand Forks
The most common levels of schooling among the 19,999 students in Grand Forks are college / undergraduate (10,179 | 50.9%), middle school (2,739 | 13.7%), and elementary school (2,082 | 10.4%).
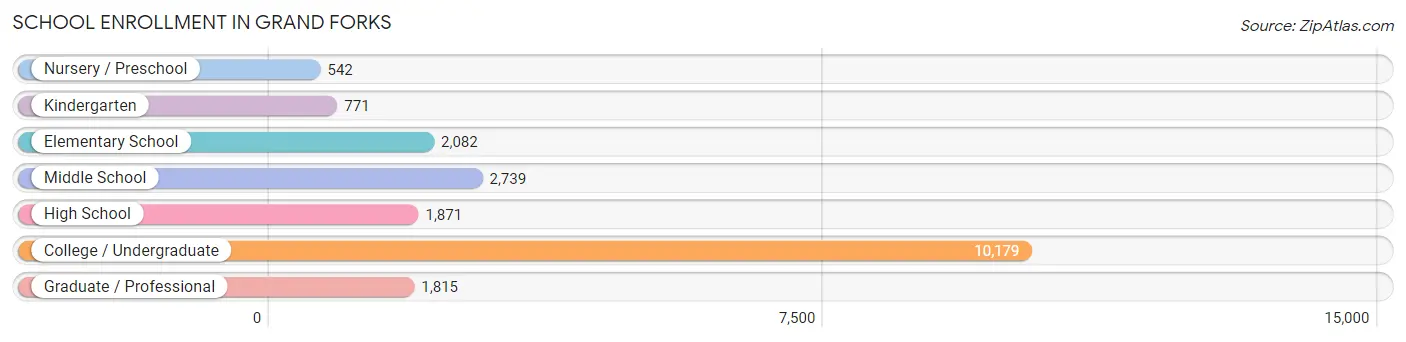
| School Level | # Students | % Students |
| Nursery / Preschool | 542 | 2.7% |
| Kindergarten | 771 | 3.9% |
| Elementary School | 2,082 | 10.4% |
| Middle School | 2,739 | 13.7% |
| High School | 1,871 | 9.4% |
| College / Undergraduate | 10,179 | 50.9% |
| Graduate / Professional | 1,815 | 9.1% |
| Total | 19,999 | 100.0% |
School Enrollment by Age by Funding Source in Grand Forks
Out of a total of 19,999 students who are enrolled in schools in Grand Forks, 1,320 (6.6%) attend a private institution, while the remaining 18,679 (93.4%) are enrolled in public schools. The age group of 3 to 4 year olds has the highest likelihood of being enrolled in private schools, with 125 (33.4% in the age bracket) enrolled. Conversely, the age group of 18 to 19 year olds has the lowest likelihood of being enrolled in a private school, with 3,300 (99.6% in the age bracket) attending a public institution.
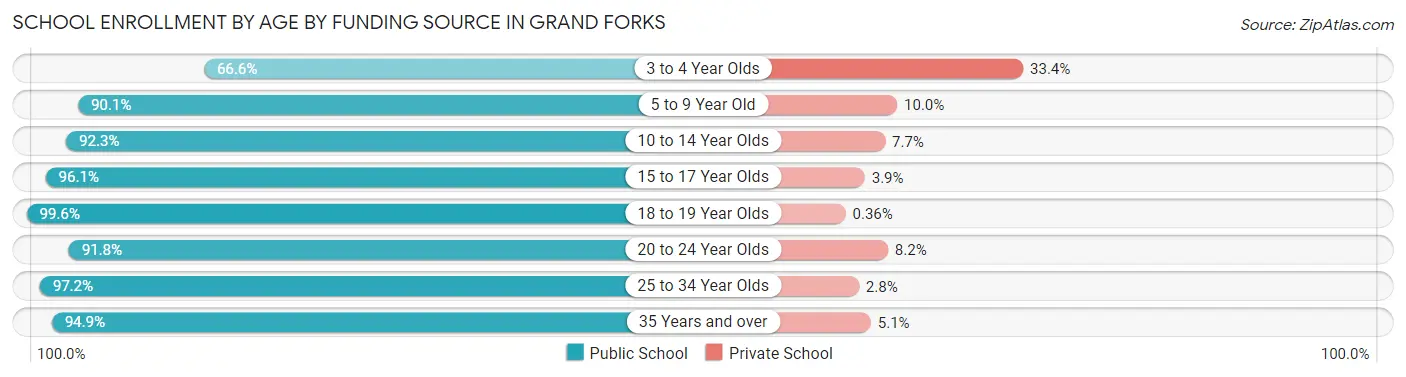
| Age Bracket | Public School | Private School |
| 3 to 4 Year Olds | 249 (66.6%) | 125 (33.4%) |
| 5 to 9 Year Old | 2,453 (90.0%) | 271 (10.0%) |
| 10 to 14 Year Olds | 3,011 (92.3%) | 252 (7.7%) |
| 15 to 17 Year Olds | 1,540 (96.1%) | 63 (3.9%) |
| 18 to 19 Year Olds | 3,300 (99.6%) | 12 (0.4%) |
| 20 to 24 Year Olds | 5,736 (91.8%) | 515 (8.2%) |
| 25 to 34 Year Olds | 1,711 (97.2%) | 50 (2.8%) |
| 35 Years and over | 675 (94.9%) | 36 (5.1%) |
| Total | 18,679 (93.4%) | 1,320 (6.6%) |
Educational Attainment by Field of Study in Grand Forks
Business (2,490 | 16.9%), science & technology (2,214 | 15.0%), arts & humanities (1,722 | 11.7%), education (1,707 | 11.6%), and bio, nature & agricultural (1,064 | 7.2%) are the most common fields of study among 14,709 individuals in Grand Forks who have obtained a bachelor's degree or higher.
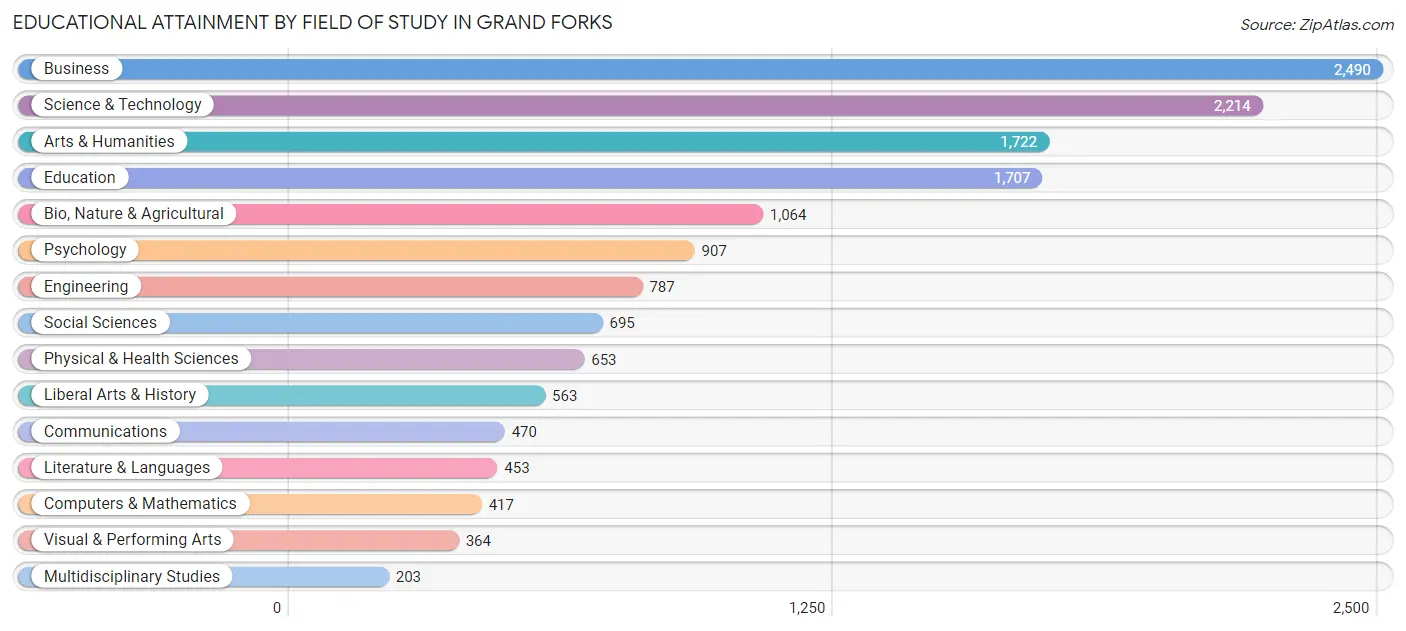
| Field of Study | # Graduates | % Graduates |
| Computers & Mathematics | 417 | 2.8% |
| Bio, Nature & Agricultural | 1,064 | 7.2% |
| Physical & Health Sciences | 653 | 4.4% |
| Psychology | 907 | 6.2% |
| Social Sciences | 695 | 4.7% |
| Engineering | 787 | 5.3% |
| Multidisciplinary Studies | 203 | 1.4% |
| Science & Technology | 2,214 | 15.0% |
| Business | 2,490 | 16.9% |
| Education | 1,707 | 11.6% |
| Literature & Languages | 453 | 3.1% |
| Liberal Arts & History | 563 | 3.8% |
| Visual & Performing Arts | 364 | 2.5% |
| Communications | 470 | 3.2% |
| Arts & Humanities | 1,722 | 11.7% |
| Total | 14,709 | 100.0% |
Transportation & Commute in Grand Forks
Vehicle Availability by Sex in Grand Forks
The most prevalent vehicle ownership categories in Grand Forks are males with 2 vehicles (7,145, accounting for 41.9%) and females with 2 vehicles (5,912, making up 50.9%).
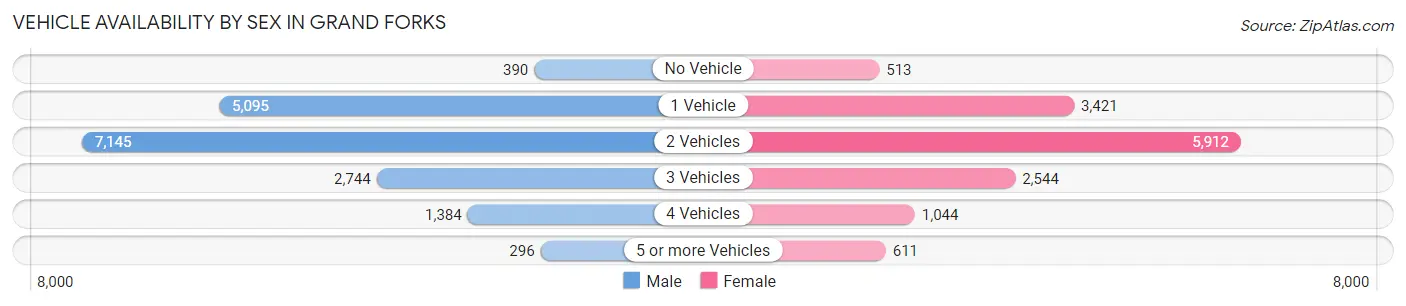
| Vehicles Available | Male | Female |
| No Vehicle | 390 (2.3%) | 513 (3.6%) |
| 1 Vehicle | 5,095 (29.9%) | 3,421 (24.4%) |
| 2 Vehicles | 7,145 (41.9%) | 5,912 (42.1%) |
| 3 Vehicles | 2,744 (16.1%) | 2,544 (18.1%) |
| 4 Vehicles | 1,384 (8.1%) | 1,044 (7.4%) |
| 5 or more Vehicles | 296 (1.7%) | 611 (4.3%) |
| Total | 17,054 (100.0%) | 14,045 (100.0%) |
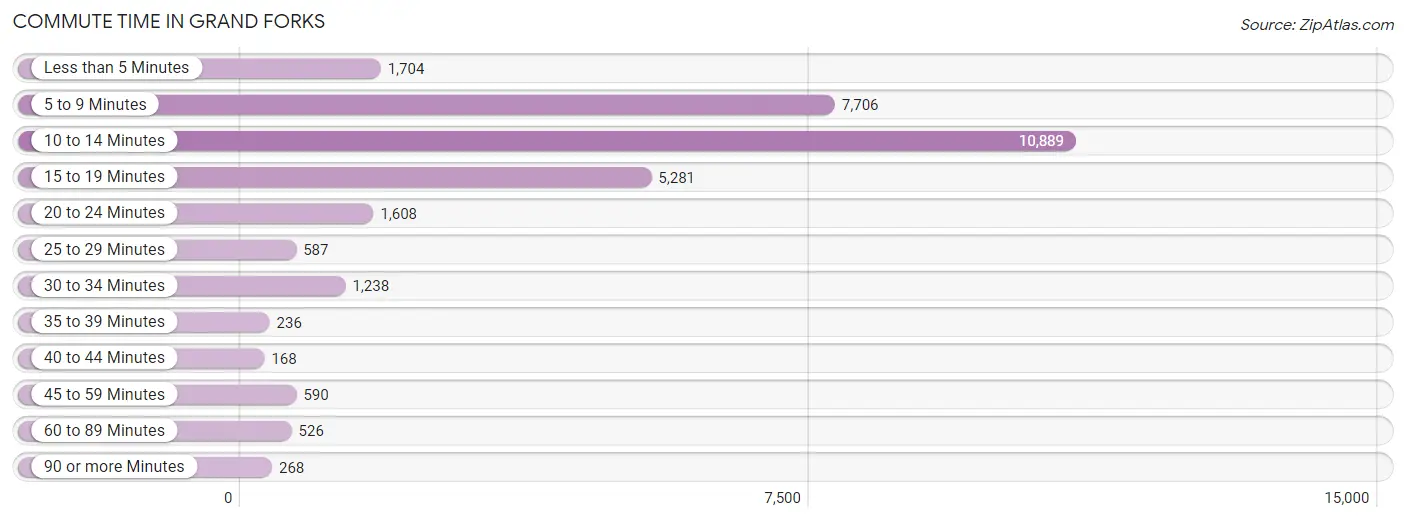
Commute Time in Grand Forks
The most frequently occuring commute durations in Grand Forks are 10 to 14 minutes (10,889 commuters, 35.3%), 5 to 9 minutes (7,706 commuters, 25.0%), and 15 to 19 minutes (5,281 commuters, 17.2%).
| Commute Time | # Commuters | % Commuters |
| Less than 5 Minutes | 1,704 | 5.5% |
| 5 to 9 Minutes | 7,706 | 25.0% |
| 10 to 14 Minutes | 10,889 | 35.3% |
| 15 to 19 Minutes | 5,281 | 17.2% |
| 20 to 24 Minutes | 1,608 | 5.2% |
| 25 to 29 Minutes | 587 | 1.9% |
| 30 to 34 Minutes | 1,238 | 4.0% |
| 35 to 39 Minutes | 236 | 0.8% |
| 40 to 44 Minutes | 168 | 0.5% |
| 45 to 59 Minutes | 590 | 1.9% |
| 60 to 89 Minutes | 526 | 1.7% |
| 90 or more Minutes | 268 | 0.9% |
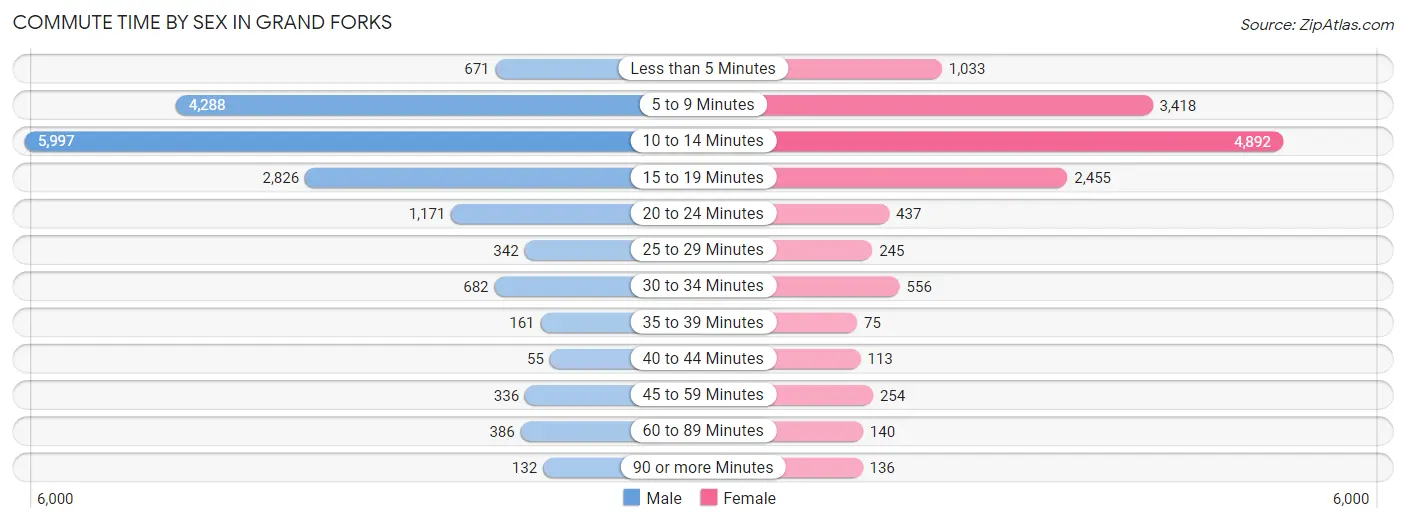
Commute Time by Sex in Grand Forks
The most common commute times in Grand Forks are 10 to 14 minutes (5,997 commuters, 35.2%) for males and 10 to 14 minutes (4,892 commuters, 35.6%) for females.
| Commute Time | Male | Female |
| Less than 5 Minutes | 671 (3.9%) | 1,033 (7.5%) |
| 5 to 9 Minutes | 4,288 (25.2%) | 3,418 (24.8%) |
| 10 to 14 Minutes | 5,997 (35.2%) | 4,892 (35.6%) |
| 15 to 19 Minutes | 2,826 (16.6%) | 2,455 (17.8%) |
| 20 to 24 Minutes | 1,171 (6.9%) | 437 (3.2%) |
| 25 to 29 Minutes | 342 (2.0%) | 245 (1.8%) |
| 30 to 34 Minutes | 682 (4.0%) | 556 (4.0%) |
| 35 to 39 Minutes | 161 (0.9%) | 75 (0.5%) |
| 40 to 44 Minutes | 55 (0.3%) | 113 (0.8%) |
| 45 to 59 Minutes | 336 (2.0%) | 254 (1.8%) |
| 60 to 89 Minutes | 386 (2.3%) | 140 (1.0%) |
| 90 or more Minutes | 132 (0.8%) | 136 (1.0%) |
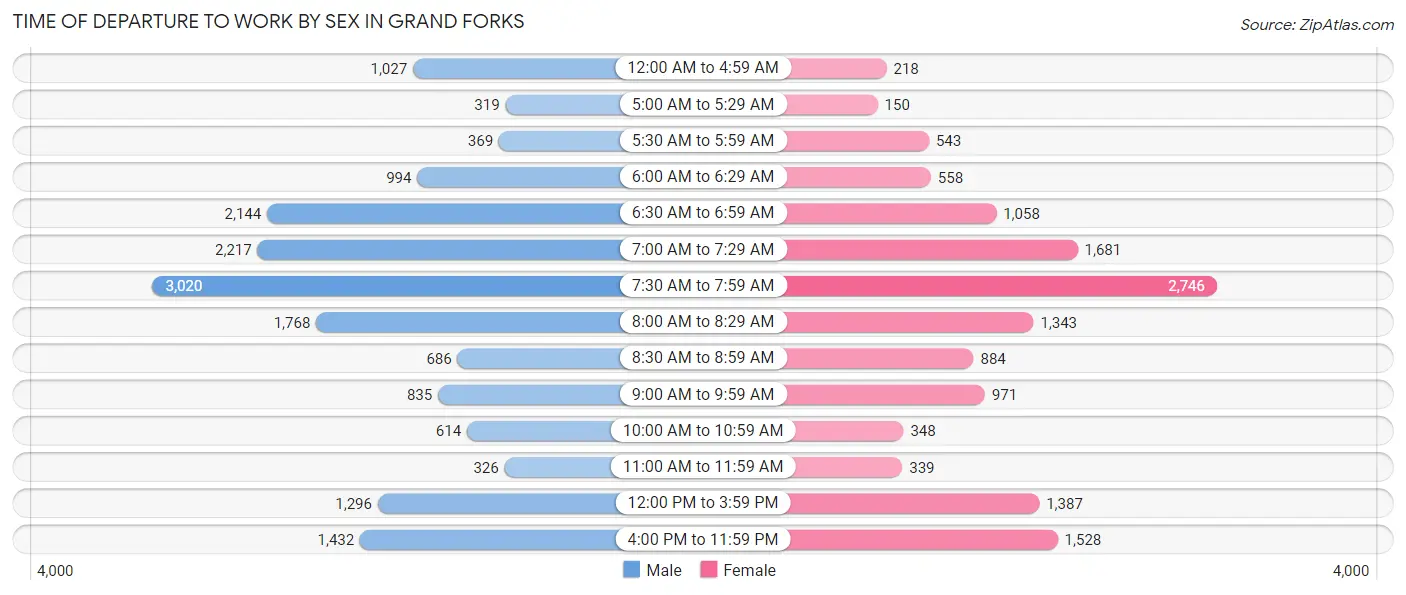
Time of Departure to Work by Sex in Grand Forks
The most frequent times of departure to work in Grand Forks are 7:30 AM to 7:59 AM (3,020, 17.7%) for males and 7:30 AM to 7:59 AM (2,746, 20.0%) for females.
| Time of Departure | Male | Female |
| 12:00 AM to 4:59 AM | 1,027 (6.0%) | 218 (1.6%) |
| 5:00 AM to 5:29 AM | 319 (1.9%) | 150 (1.1%) |
| 5:30 AM to 5:59 AM | 369 (2.2%) | 543 (4.0%) |
| 6:00 AM to 6:29 AM | 994 (5.8%) | 558 (4.1%) |
| 6:30 AM to 6:59 AM | 2,144 (12.6%) | 1,058 (7.7%) |
| 7:00 AM to 7:29 AM | 2,217 (13.0%) | 1,681 (12.2%) |
| 7:30 AM to 7:59 AM | 3,020 (17.7%) | 2,746 (20.0%) |
| 8:00 AM to 8:29 AM | 1,768 (10.4%) | 1,343 (9.8%) |
| 8:30 AM to 8:59 AM | 686 (4.0%) | 884 (6.4%) |
| 9:00 AM to 9:59 AM | 835 (4.9%) | 971 (7.1%) |
| 10:00 AM to 10:59 AM | 614 (3.6%) | 348 (2.5%) |
| 11:00 AM to 11:59 AM | 326 (1.9%) | 339 (2.5%) |
| 12:00 PM to 3:59 PM | 1,296 (7.6%) | 1,387 (10.1%) |
| 4:00 PM to 11:59 PM | 1,432 (8.4%) | 1,528 (11.1%) |
| Total | 17,047 (100.0%) | 13,754 (100.0%) |
Housing Occupancy in Grand Forks
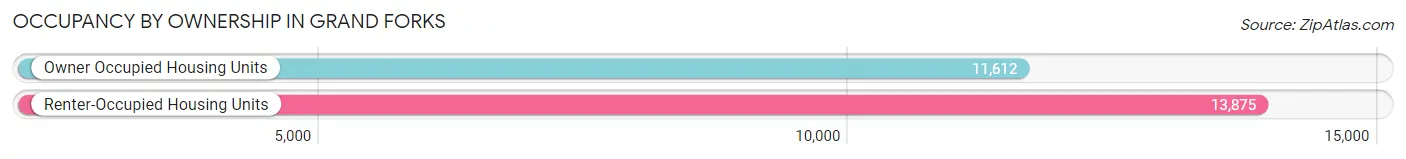
Occupancy by Ownership in Grand Forks
Of the total 25,487 dwellings in Grand Forks, owner-occupied units account for 11,612 (45.6%), while renter-occupied units make up 13,875 (54.4%).
| Occupancy | # Housing Units | % Housing Units |
| Owner Occupied Housing Units | 11,612 | 45.6% |
| Renter-Occupied Housing Units | 13,875 | 54.4% |
| Total Occupied Housing Units | 25,487 | 100.0% |
Occupancy by Household Size in Grand Forks
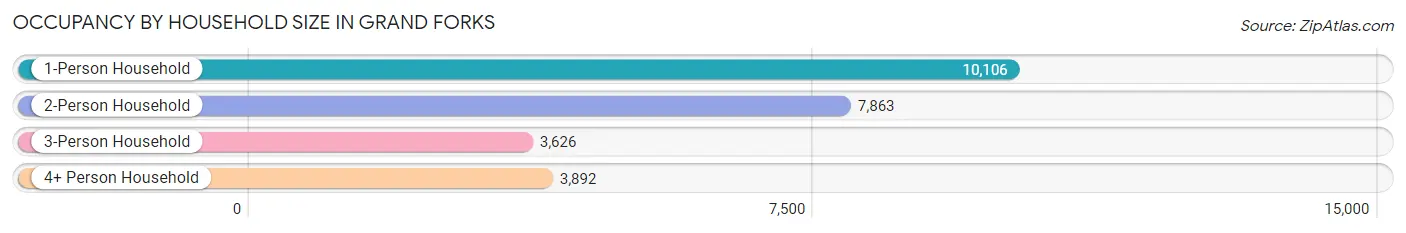
| Household Size | # Housing Units | % Housing Units |
| 1-Person Household | 10,106 | 39.7% |
| 2-Person Household | 7,863 | 30.8% |
| 3-Person Household | 3,626 | 14.2% |
| 4+ Person Household | 3,892 | 15.3% |
| Total Housing Units | 25,487 | 100.0% |
Occupancy by Ownership by Household Size in Grand Forks
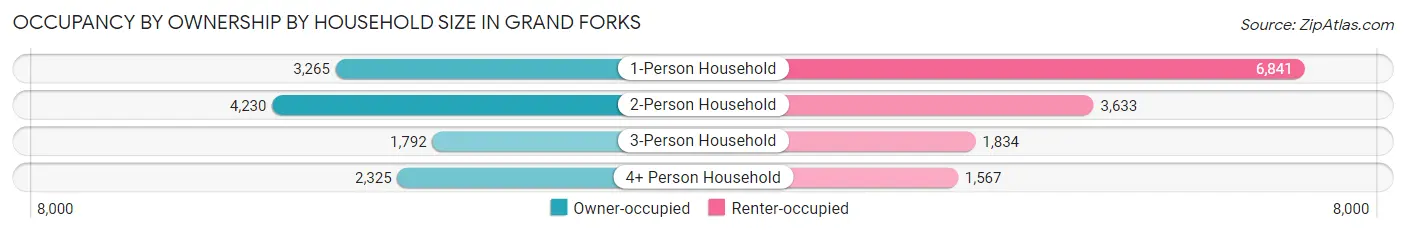
| Household Size | Owner-occupied | Renter-occupied |
| 1-Person Household | 3,265 (32.3%) | 6,841 (67.7%) |
| 2-Person Household | 4,230 (53.8%) | 3,633 (46.2%) |
| 3-Person Household | 1,792 (49.4%) | 1,834 (50.6%) |
| 4+ Person Household | 2,325 (59.7%) | 1,567 (40.3%) |
| Total Housing Units | 11,612 (45.6%) | 13,875 (54.4%) |
Occupancy by Educational Attainment in Grand Forks
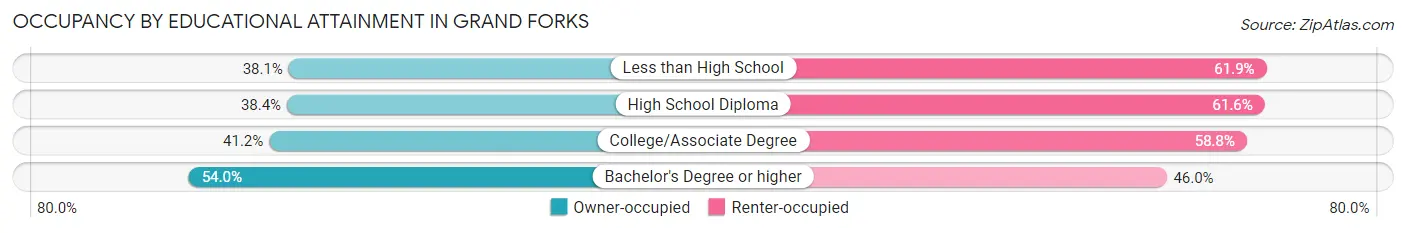
| Household Size | Owner-occupied | Renter-occupied |
| Less than High School | 282 (38.1%) | 458 (61.9%) |
| High School Diploma | 1,880 (38.4%) | 3,017 (61.6%) |
| College/Associate Degree | 4,081 (41.2%) | 5,819 (58.8%) |
| Bachelor's Degree or higher | 5,369 (54.0%) | 4,581 (46.0%) |
Occupancy by Age of Householder in Grand Forks
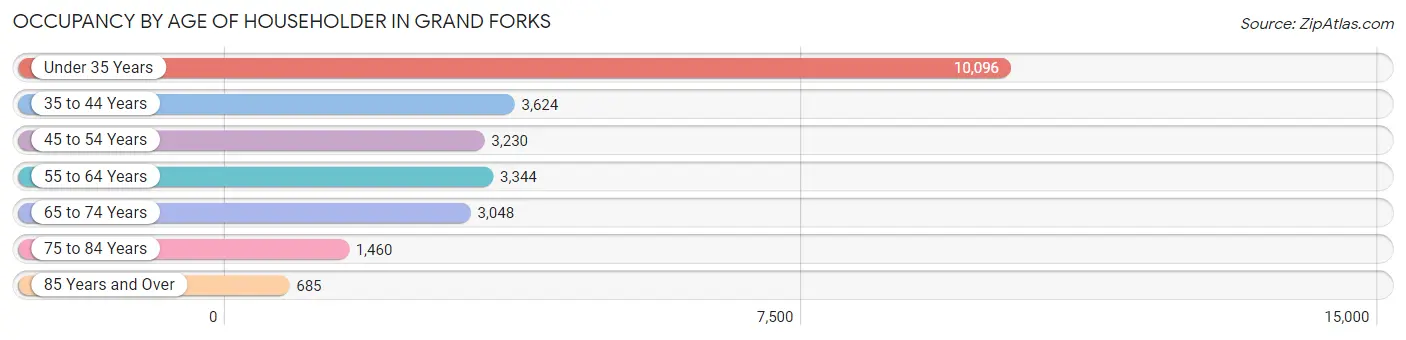
| Age Bracket | # Households | % Households |
| Under 35 Years | 10,096 | 39.6% |
| 35 to 44 Years | 3,624 | 14.2% |
| 45 to 54 Years | 3,230 | 12.7% |
| 55 to 64 Years | 3,344 | 13.1% |
| 65 to 74 Years | 3,048 | 12.0% |
| 75 to 84 Years | 1,460 | 5.7% |
| 85 Years and Over | 685 | 2.7% |
| Total | 25,487 | 100.0% |
Housing Finances in Grand Forks
Median Income by Occupancy in Grand Forks
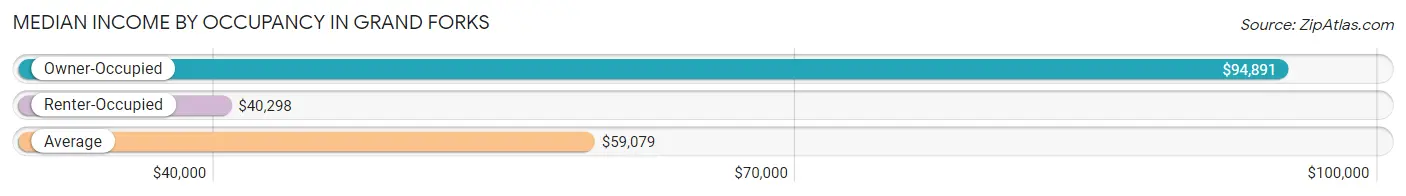
| Occupancy Type | # Households | Median Income |
| Owner-Occupied | 11,612 (45.6%) | $94,891 |
| Renter-Occupied | 13,875 (54.4%) | $40,298 |
| Average | 25,487 (100.0%) | $59,079 |
Occupancy by Householder Income Bracket in Grand Forks
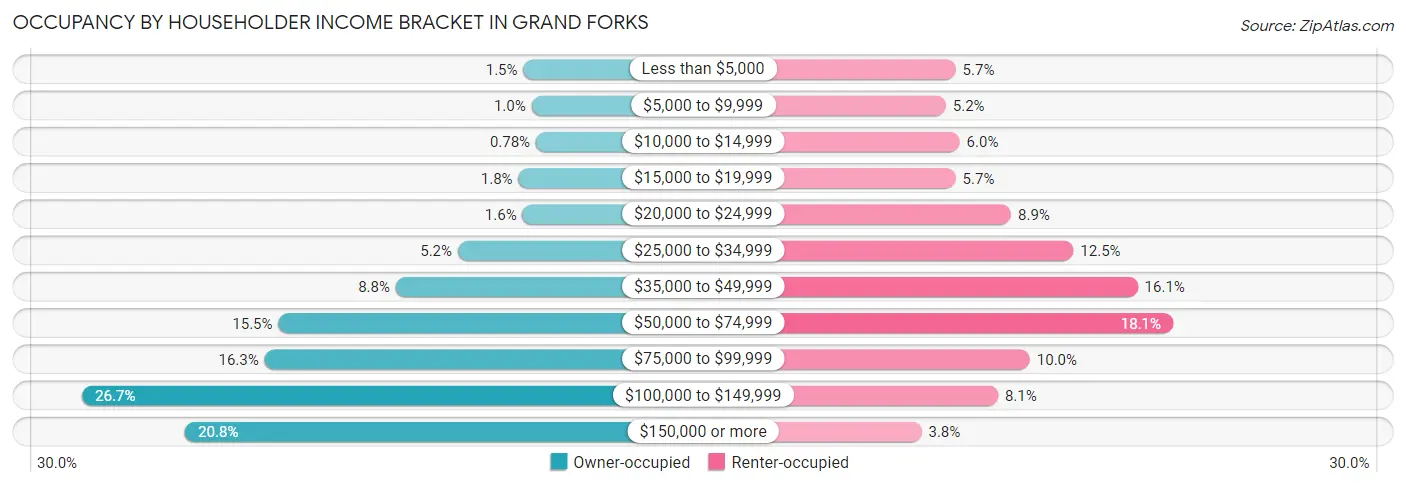
| Income Bracket | Owner-occupied | Renter-occupied |
| Less than $5,000 | 174 (1.5%) | 794 (5.7%) |
| $5,000 to $9,999 | 120 (1.0%) | 716 (5.2%) |
| $10,000 to $14,999 | 90 (0.8%) | 826 (5.9%) |
| $15,000 to $19,999 | 207 (1.8%) | 794 (5.7%) |
| $20,000 to $24,999 | 180 (1.5%) | 1,233 (8.9%) |
| $25,000 to $34,999 | 608 (5.2%) | 1,727 (12.4%) |
| $35,000 to $49,999 | 1,021 (8.8%) | 2,236 (16.1%) |
| $50,000 to $74,999 | 1,800 (15.5%) | 2,515 (18.1%) |
| $75,000 to $99,999 | 1,892 (16.3%) | 1,382 (10.0%) |
| $100,000 to $149,999 | 3,101 (26.7%) | 1,129 (8.1%) |
| $150,000 or more | 2,419 (20.8%) | 523 (3.8%) |
| Total | 11,612 (100.0%) | 13,875 (100.0%) |
Monthly Housing Cost Tiers in Grand Forks
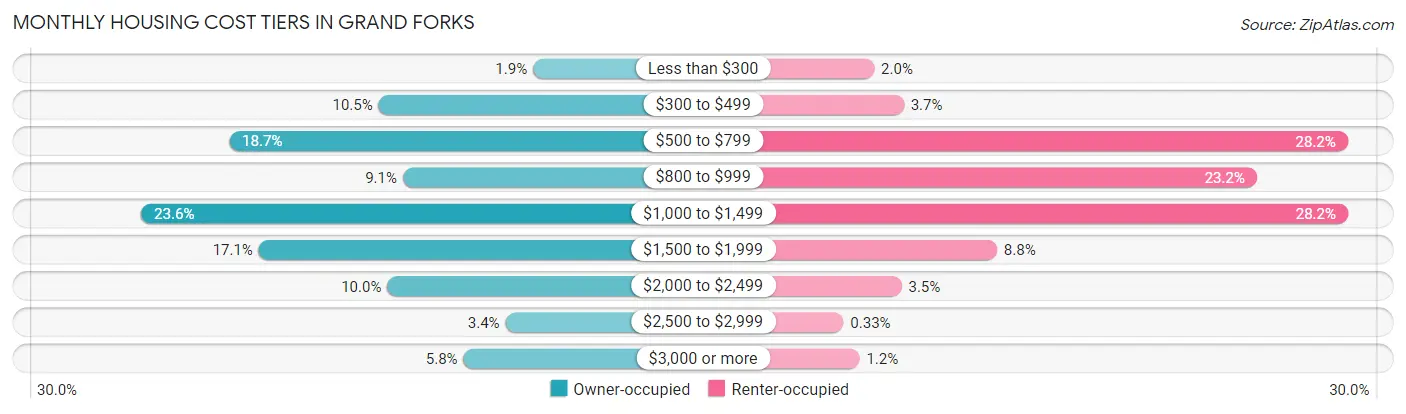
| Monthly Cost | Owner-occupied | Renter-occupied |
| Less than $300 | 223 (1.9%) | 281 (2.0%) |
| $300 to $499 | 1,214 (10.4%) | 508 (3.7%) |
| $500 to $799 | 2,172 (18.7%) | 3,910 (28.2%) |
| $800 to $999 | 1,058 (9.1%) | 3,213 (23.2%) |
| $1,000 to $1,499 | 2,736 (23.6%) | 3,912 (28.2%) |
| $1,500 to $1,999 | 1,982 (17.1%) | 1,222 (8.8%) |
| $2,000 to $2,499 | 1,158 (10.0%) | 491 (3.5%) |
| $2,500 to $2,999 | 400 (3.4%) | 46 (0.3%) |
| $3,000 or more | 669 (5.8%) | 169 (1.2%) |
| Total | 11,612 (100.0%) | 13,875 (100.0%) |
Physical Housing Characteristics in Grand Forks
Housing Structures in Grand Forks
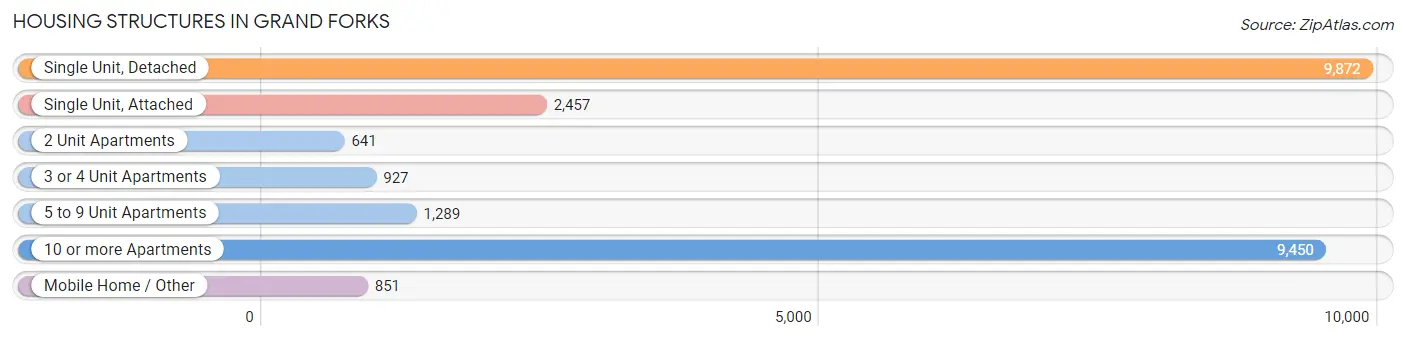
| Structure Type | # Housing Units | % Housing Units |
| Single Unit, Detached | 9,872 | 38.7% |
| Single Unit, Attached | 2,457 | 9.6% |
| 2 Unit Apartments | 641 | 2.5% |
| 3 or 4 Unit Apartments | 927 | 3.6% |
| 5 to 9 Unit Apartments | 1,289 | 5.1% |
| 10 or more Apartments | 9,450 | 37.1% |
| Mobile Home / Other | 851 | 3.3% |
| Total | 25,487 | 100.0% |
Housing Structures by Occupancy in Grand Forks
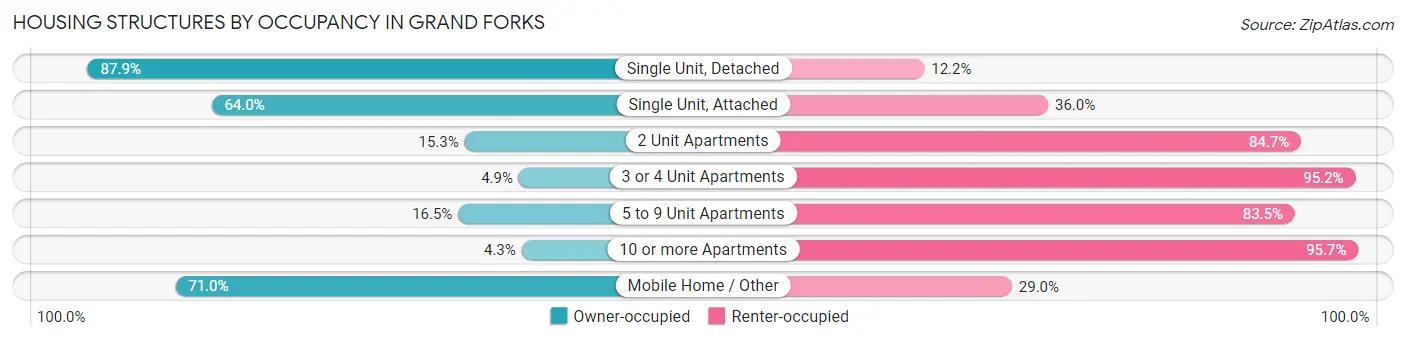
| Structure Type | Owner-occupied | Renter-occupied |
| Single Unit, Detached | 8,673 (87.8%) | 1,199 (12.1%) |
| Single Unit, Attached | 1,573 (64.0%) | 884 (36.0%) |
| 2 Unit Apartments | 98 (15.3%) | 543 (84.7%) |
| 3 or 4 Unit Apartments | 45 (4.9%) | 882 (95.2%) |
| 5 to 9 Unit Apartments | 213 (16.5%) | 1,076 (83.5%) |
| 10 or more Apartments | 406 (4.3%) | 9,044 (95.7%) |
| Mobile Home / Other | 604 (71.0%) | 247 (29.0%) |
| Total | 11,612 (45.6%) | 13,875 (54.4%) |
Housing Structures by Number of Rooms in Grand Forks
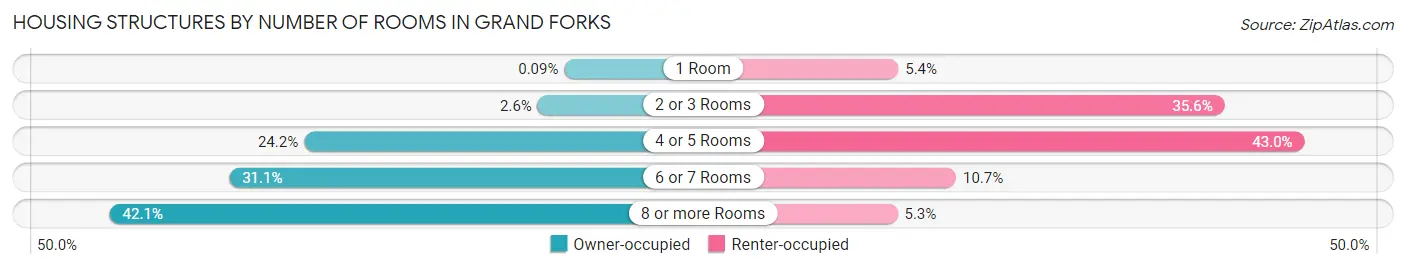
| Number of Rooms | Owner-occupied | Renter-occupied |
| 1 Room | 11 (0.1%) | 749 (5.4%) |
| 2 or 3 Rooms | 296 (2.5%) | 4,935 (35.6%) |
| 4 or 5 Rooms | 2,805 (24.2%) | 5,961 (43.0%) |
| 6 or 7 Rooms | 3,608 (31.1%) | 1,490 (10.7%) |
| 8 or more Rooms | 4,892 (42.1%) | 740 (5.3%) |
| Total | 11,612 (100.0%) | 13,875 (100.0%) |
Housing Structure by Heating Type in Grand Forks
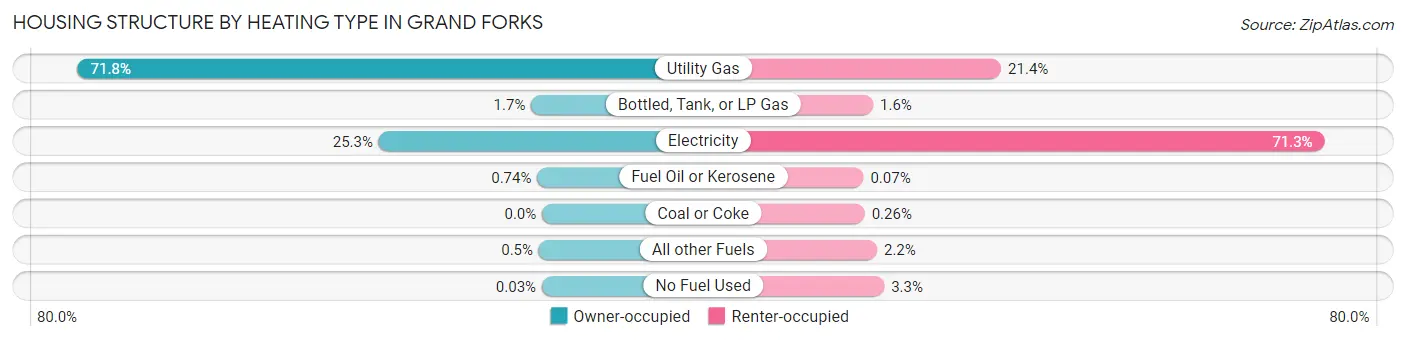
| Heating Type | Owner-occupied | Renter-occupied |
| Utility Gas | 8,337 (71.8%) | 2,963 (21.3%) |
| Bottled, Tank, or LP Gas | 195 (1.7%) | 216 (1.6%) |
| Electricity | 2,932 (25.3%) | 9,896 (71.3%) |
| Fuel Oil or Kerosene | 86 (0.7%) | 10 (0.1%) |
| Coal or Coke | 0 (0.0%) | 36 (0.3%) |
| All other Fuels | 58 (0.5%) | 300 (2.2%) |
| No Fuel Used | 4 (0.0%) | 454 (3.3%) |
| Total | 11,612 (100.0%) | 13,875 (100.0%) |
Household Vehicle Usage in Grand Forks
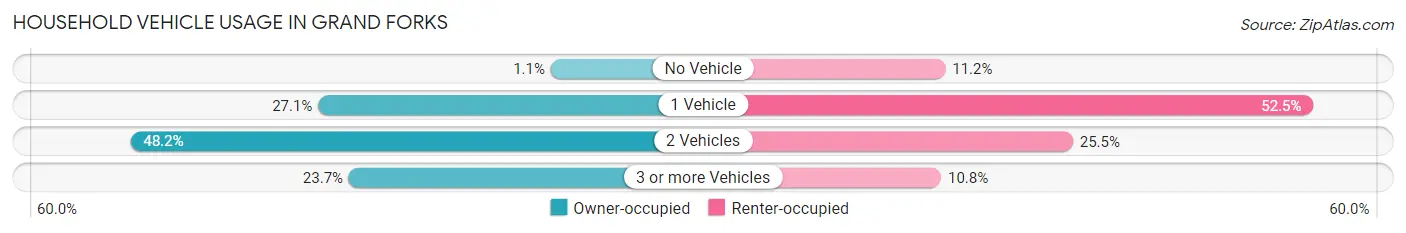
| Vehicles per Household | Owner-occupied | Renter-occupied |
| No Vehicle | 123 (1.1%) | 1,559 (11.2%) |
| 1 Vehicle | 3,148 (27.1%) | 7,280 (52.5%) |
| 2 Vehicles | 5,592 (48.2%) | 3,542 (25.5%) |
| 3 or more Vehicles | 2,749 (23.7%) | 1,494 (10.8%) |
| Total | 11,612 (100.0%) | 13,875 (100.0%) |
Real Estate & Mortgages in Grand Forks
Real Estate and Mortgage Overview in Grand Forks
| Characteristic | Without Mortgage | With Mortgage |
| Housing Units | 4,327 | 7,285 |
| Median Property Value | $222,100 | $244,400 |
| Median Household Income | $76,858 | $1,780 |
| Monthly Housing Costs | $607 | $669 |
| Real Estate Taxes | $2,732 | $78 |
Property Value by Mortgage Status in Grand Forks
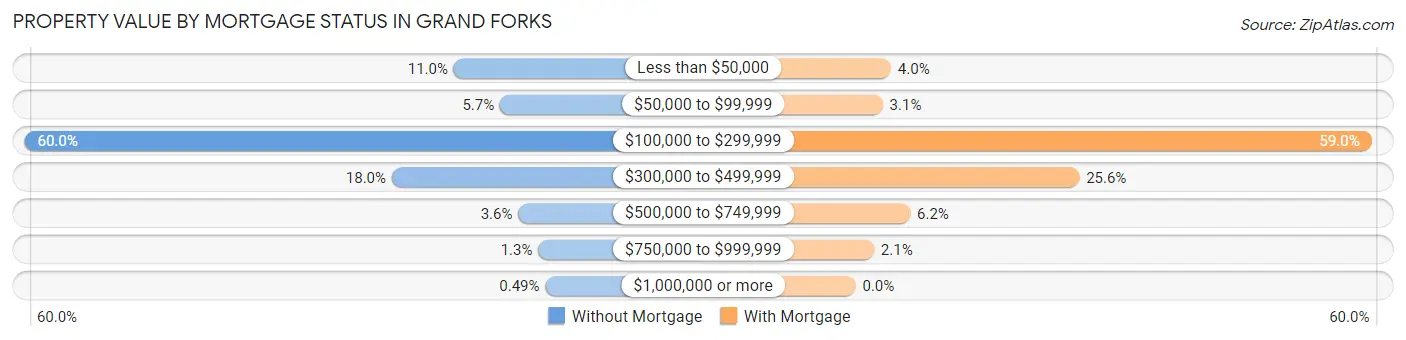
| Property Value | Without Mortgage | With Mortgage |
| Less than $50,000 | 474 (11.0%) | 294 (4.0%) |
| $50,000 to $99,999 | 245 (5.7%) | 226 (3.1%) |
| $100,000 to $299,999 | 2,596 (60.0%) | 4,296 (59.0%) |
| $300,000 to $499,999 | 780 (18.0%) | 1,862 (25.6%) |
| $500,000 to $749,999 | 155 (3.6%) | 454 (6.2%) |
| $750,000 to $999,999 | 56 (1.3%) | 153 (2.1%) |
| $1,000,000 or more | 21 (0.5%) | 0 (0.0%) |
| Total | 4,327 (100.0%) | 7,285 (100.0%) |
Household Income by Mortgage Status in Grand Forks
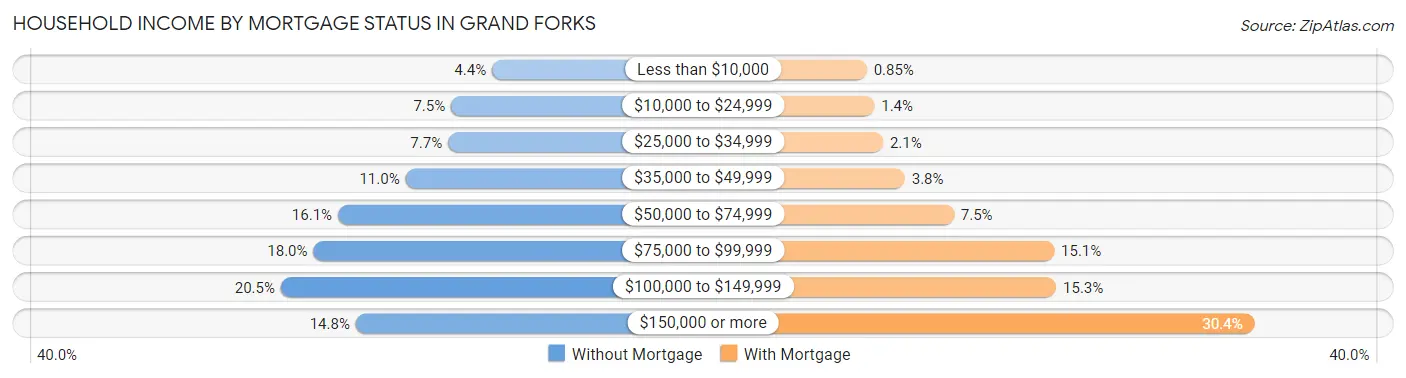
| Household Income | Without Mortgage | With Mortgage |
| Less than $10,000 | 190 (4.4%) | 62 (0.9%) |
| $10,000 to $24,999 | 325 (7.5%) | 104 (1.4%) |
| $25,000 to $34,999 | 335 (7.7%) | 152 (2.1%) |
| $35,000 to $49,999 | 475 (11.0%) | 273 (3.7%) |
| $50,000 to $74,999 | 698 (16.1%) | 546 (7.5%) |
| $75,000 to $99,999 | 779 (18.0%) | 1,102 (15.1%) |
| $100,000 to $149,999 | 886 (20.5%) | 1,113 (15.3%) |
| $150,000 or more | 639 (14.8%) | 2,215 (30.4%) |
| Total | 4,327 (100.0%) | 7,285 (100.0%) |
Property Value to Household Income Ratio in Grand Forks
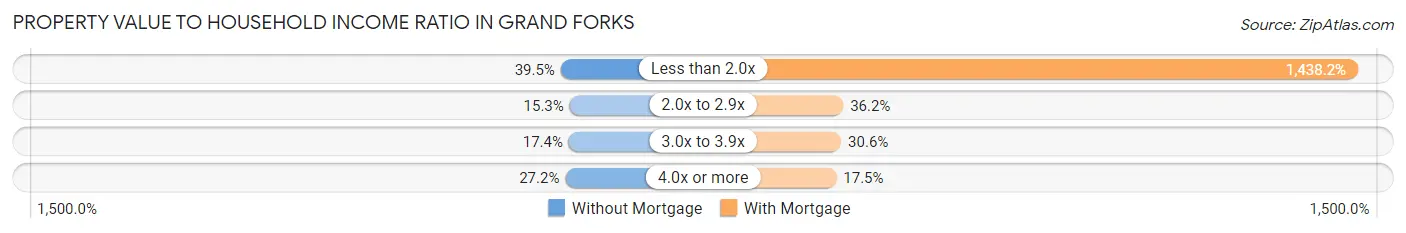
| Value-to-Income Ratio | Without Mortgage | With Mortgage |
| Less than 2.0x | 1,711 (39.5%) | 104,773 (1,438.2%) |
| 2.0x to 2.9x | 661 (15.3%) | 2,635 (36.2%) |
| 3.0x to 3.9x | 754 (17.4%) | 2,231 (30.6%) |
| 4.0x or more | 1,178 (27.2%) | 1,278 (17.5%) |
| Total | 4,327 (100.0%) | 7,285 (100.0%) |
Real Estate Taxes by Mortgage Status in Grand Forks
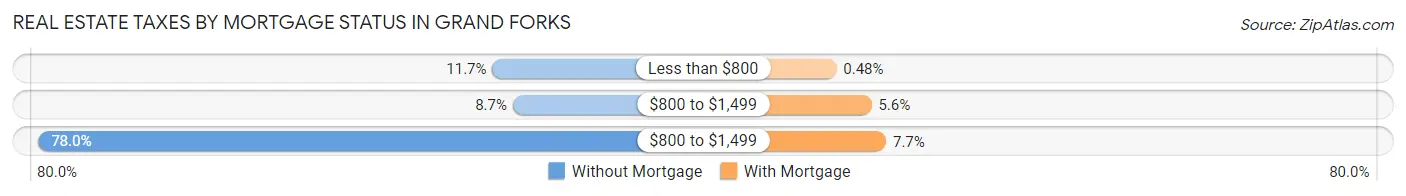
| Property Taxes | Without Mortgage | With Mortgage |
| Less than $800 | 504 (11.7%) | 35 (0.5%) |
| $800 to $1,499 | 375 (8.7%) | 409 (5.6%) |
| $800 to $1,499 | 3,375 (78.0%) | 564 (7.7%) |
| Total | 4,327 (100.0%) | 7,285 (100.0%) |
Health & Disability in Grand Forks
Health Insurance Coverage by Age in Grand Forks
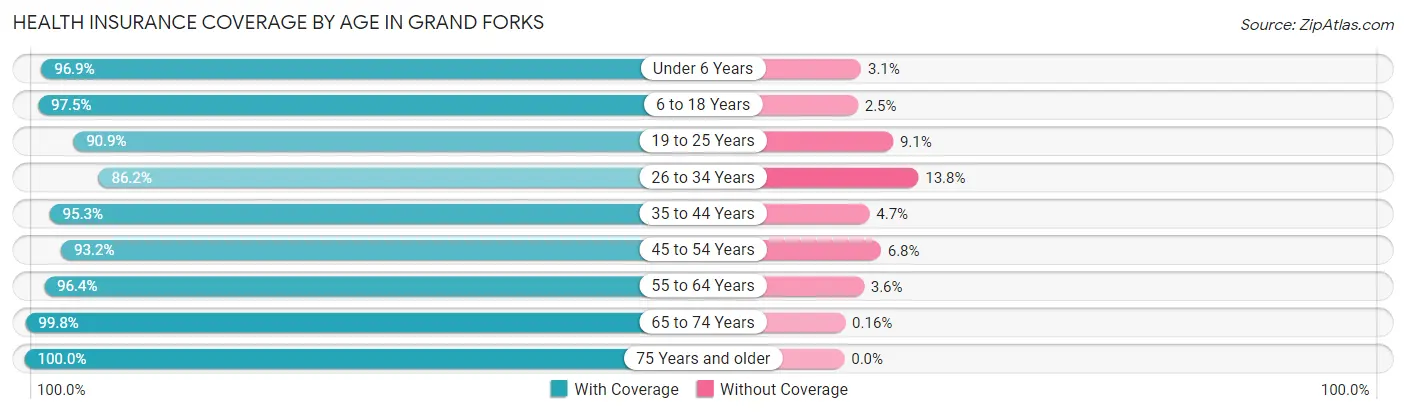
| Age Bracket | With Coverage | Without Coverage |
| Under 6 Years | 3,910 (96.9%) | 126 (3.1%) |
| 6 to 18 Years | 8,661 (97.5%) | 223 (2.5%) |
| 19 to 25 Years | 11,869 (90.9%) | 1,184 (9.1%) |
| 26 to 34 Years | 7,082 (86.2%) | 1,134 (13.8%) |
| 35 to 44 Years | 5,882 (95.3%) | 289 (4.7%) |
| 45 to 54 Years | 4,467 (93.2%) | 326 (6.8%) |
| 55 to 64 Years | 5,042 (96.4%) | 190 (3.6%) |
| 65 to 74 Years | 4,338 (99.8%) | 7 (0.2%) |
| 75 Years and older | 2,965 (100.0%) | 0 (0.0%) |
| Total | 54,216 (94.0%) | 3,479 (6.0%) |
Health Insurance Coverage by Citizenship Status in Grand Forks
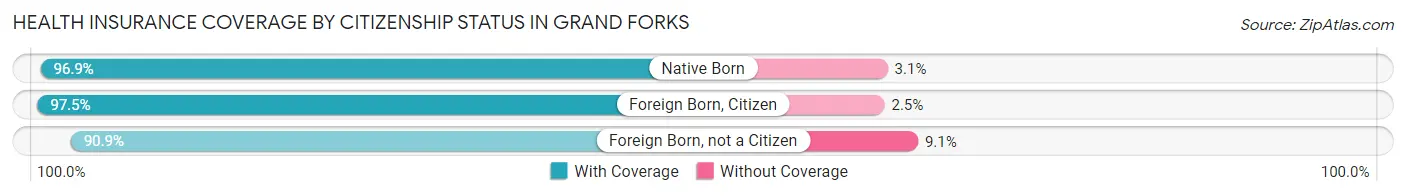
| Citizenship Status | With Coverage | Without Coverage |
| Native Born | 3,910 (96.9%) | 126 (3.1%) |
| Foreign Born, Citizen | 8,661 (97.5%) | 223 (2.5%) |
| Foreign Born, not a Citizen | 11,869 (90.9%) | 1,184 (9.1%) |
Health Insurance Coverage by Household Income in Grand Forks
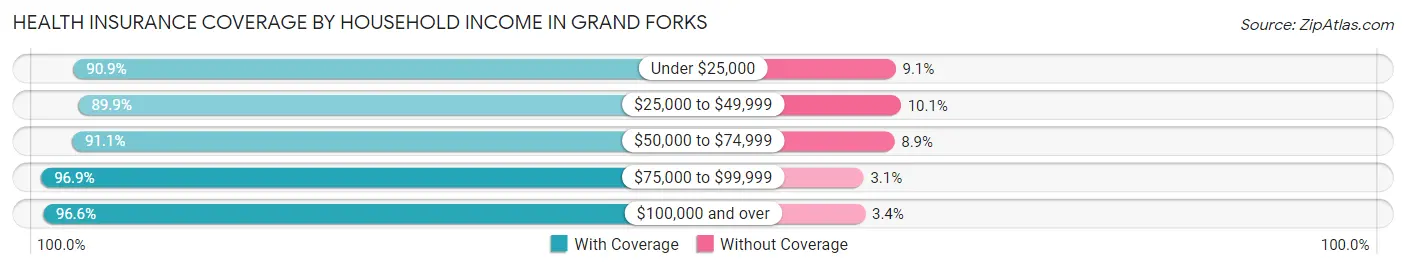
| Household Income | With Coverage | Without Coverage |
| Under $25,000 | 7,536 (90.9%) | 757 (9.1%) |
| $25,000 to $49,999 | 8,308 (89.9%) | 933 (10.1%) |
| $50,000 to $74,999 | 7,706 (91.1%) | 753 (8.9%) |
| $75,000 to $99,999 | 6,871 (96.9%) | 221 (3.1%) |
| $100,000 and over | 20,531 (96.6%) | 726 (3.4%) |
Public vs Private Health Insurance Coverage by Age in Grand Forks
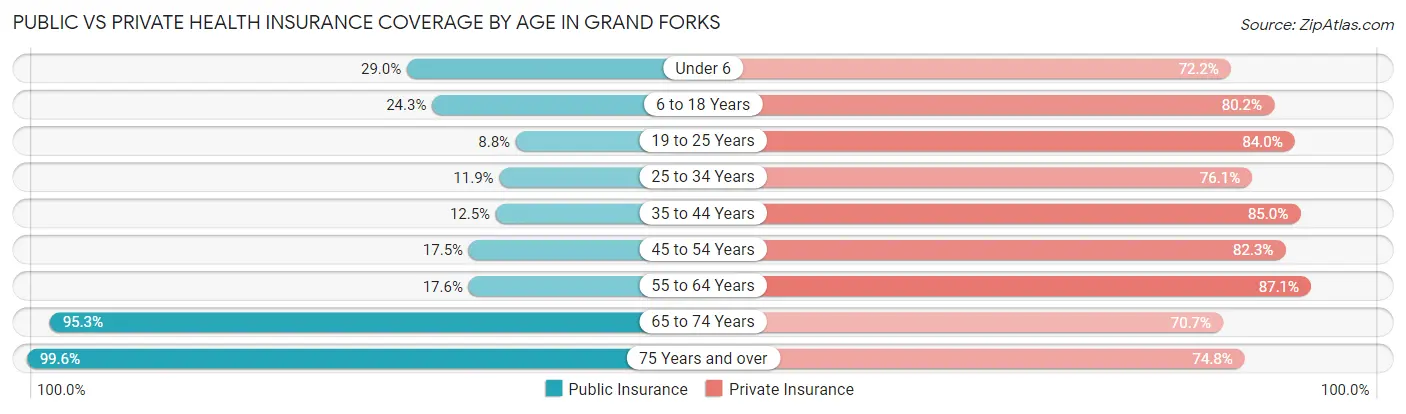
| Age Bracket | Public Insurance | Private Insurance |
| Under 6 | 1,171 (29.0%) | 2,913 (72.2%) |
| 6 to 18 Years | 2,162 (24.3%) | 7,123 (80.2%) |
| 19 to 25 Years | 1,149 (8.8%) | 10,968 (84.0%) |
| 25 to 34 Years | 975 (11.9%) | 6,255 (76.1%) |
| 35 to 44 Years | 772 (12.5%) | 5,248 (85.0%) |
| 45 to 54 Years | 840 (17.5%) | 3,944 (82.3%) |
| 55 to 64 Years | 919 (17.6%) | 4,555 (87.1%) |
| 65 to 74 Years | 4,142 (95.3%) | 3,073 (70.7%) |
| 75 Years and over | 2,953 (99.6%) | 2,217 (74.8%) |
| Total | 15,083 (26.1%) | 46,296 (80.2%) |
Disability Status by Sex by Age in Grand Forks
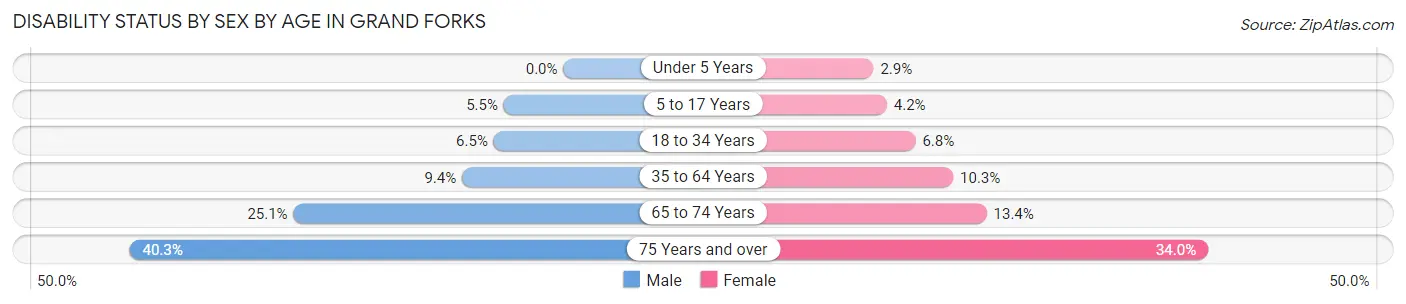
| Age Bracket | Male | Female |
| Under 5 Years | 0 (0.0%) | 49 (2.9%) |
| 5 to 17 Years | 227 (5.5%) | 158 (4.2%) |
| 18 to 34 Years | 806 (6.5%) | 701 (6.8%) |
| 35 to 64 Years | 783 (9.4%) | 813 (10.3%) |
| 65 to 74 Years | 518 (25.1%) | 306 (13.4%) |
| 75 Years and over | 471 (40.3%) | 610 (34.0%) |
Disability Class by Sex by Age in Grand Forks
Disability Class: Hearing Difficulty
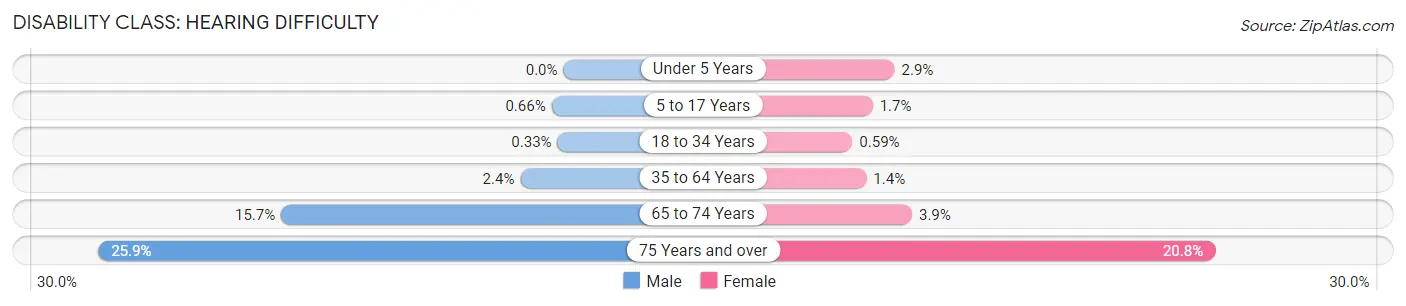
| Age Bracket | Male | Female |
| Under 5 Years | 0 (0.0%) | 49 (2.9%) |
| 5 to 17 Years | 27 (0.7%) | 65 (1.7%) |
| 18 to 34 Years | 41 (0.3%) | 61 (0.6%) |
| 35 to 64 Years | 200 (2.4%) | 108 (1.4%) |
| 65 to 74 Years | 325 (15.7%) | 89 (3.9%) |
| 75 Years and over | 303 (25.9%) | 373 (20.8%) |
Disability Class: Vision Difficulty
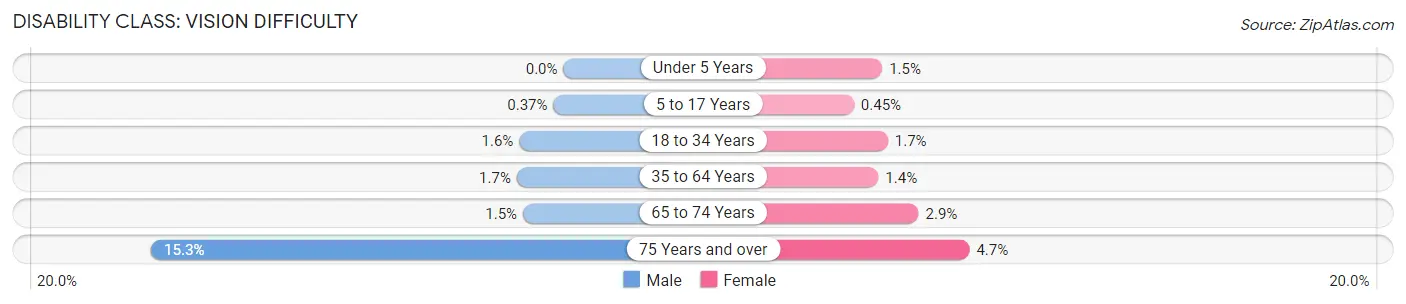
| Age Bracket | Male | Female |
| Under 5 Years | 0 (0.0%) | 25 (1.5%) |
| 5 to 17 Years | 15 (0.4%) | 17 (0.4%) |
| 18 to 34 Years | 205 (1.6%) | 175 (1.7%) |
| 35 to 64 Years | 144 (1.7%) | 107 (1.4%) |
| 65 to 74 Years | 31 (1.5%) | 65 (2.9%) |
| 75 Years and over | 179 (15.3%) | 85 (4.7%) |
Disability Class: Cognitive Difficulty
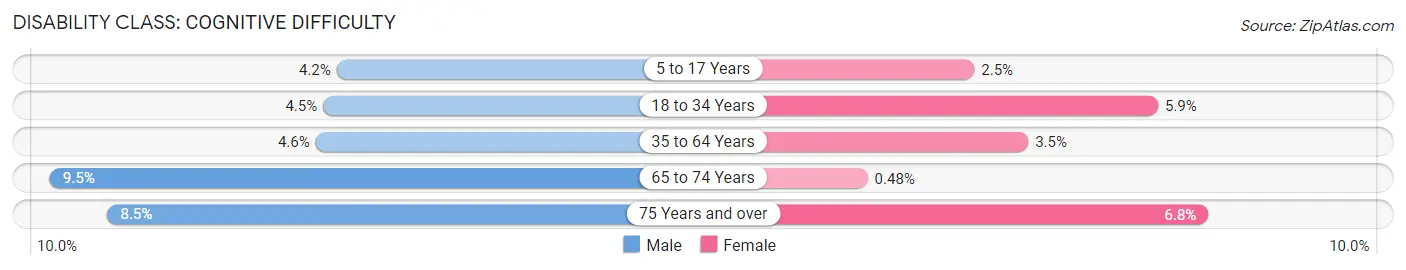
| Age Bracket | Male | Female |
| 5 to 17 Years | 173 (4.2%) | 93 (2.5%) |
| 18 to 34 Years | 557 (4.5%) | 602 (5.9%) |
| 35 to 64 Years | 383 (4.6%) | 272 (3.5%) |
| 65 to 74 Years | 197 (9.5%) | 11 (0.5%) |
| 75 Years and over | 99 (8.5%) | 122 (6.8%) |
Disability Class: Ambulatory Difficulty
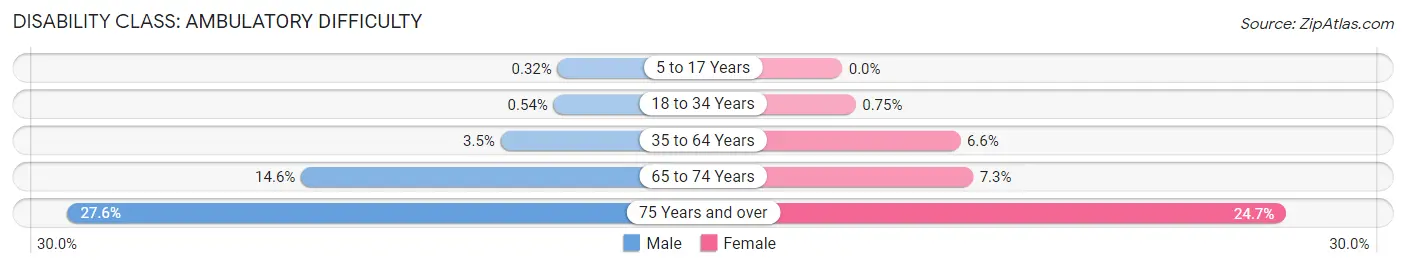
| Age Bracket | Male | Female |
| 5 to 17 Years | 13 (0.3%) | 0 (0.0%) |
| 18 to 34 Years | 68 (0.5%) | 77 (0.7%) |
| 35 to 64 Years | 291 (3.5%) | 518 (6.6%) |
| 65 to 74 Years | 302 (14.6%) | 166 (7.3%) |
| 75 Years and over | 323 (27.6%) | 444 (24.7%) |
Disability Class: Self-Care Difficulty
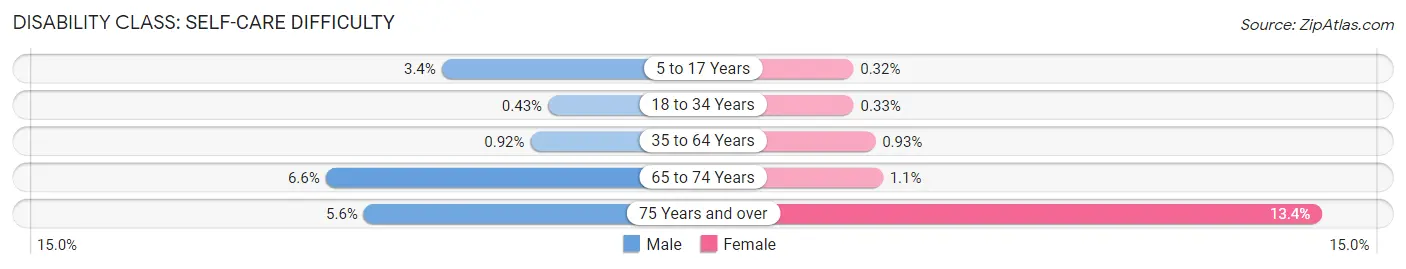
| Age Bracket | Male | Female |
| 5 to 17 Years | 139 (3.4%) | 12 (0.3%) |
| 18 to 34 Years | 54 (0.4%) | 34 (0.3%) |
| 35 to 64 Years | 77 (0.9%) | 73 (0.9%) |
| 65 to 74 Years | 137 (6.6%) | 26 (1.1%) |
| 75 Years and over | 65 (5.6%) | 240 (13.4%) |
Technology Access in Grand Forks
Computing Device Access in Grand Forks
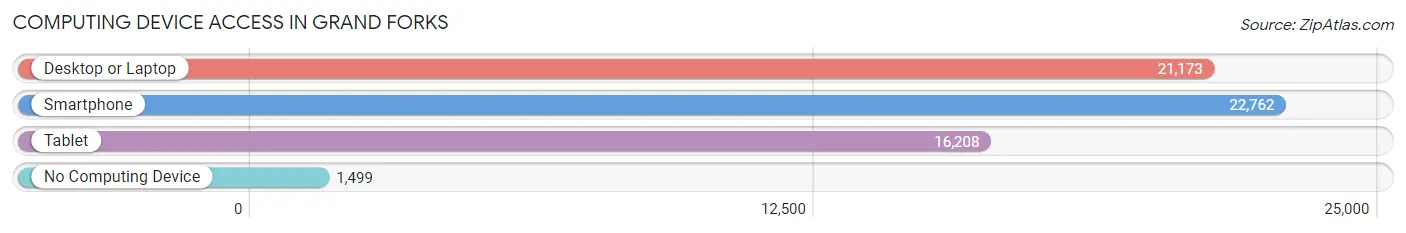
| Device Type | # Households | % Households |
| Desktop or Laptop | 21,173 | 83.1% |
| Smartphone | 22,762 | 89.3% |
| Tablet | 16,208 | 63.6% |
| No Computing Device | 1,499 | 5.9% |
| Total | 25,487 | 100.0% |
Internet Access in Grand Forks
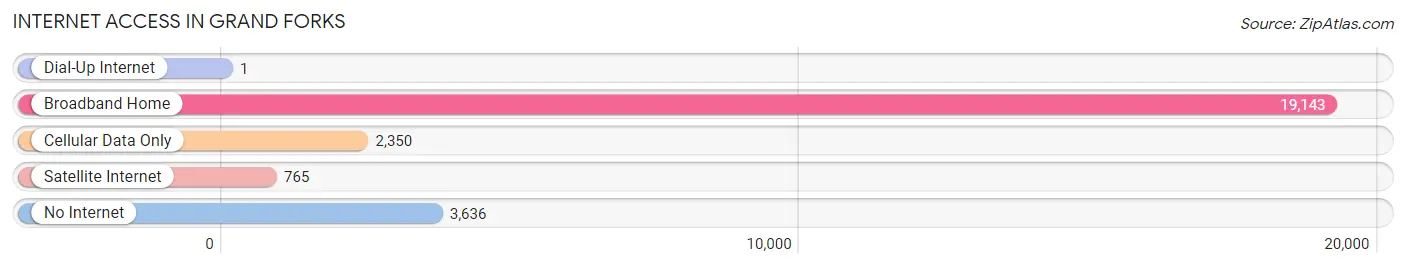
| Internet Type | # Households | % Households |
| Dial-Up Internet | 1 | 0.0% |
| Broadband Home | 19,143 | 75.1% |
| Cellular Data Only | 2,350 | 9.2% |
| Satellite Internet | 765 | 3.0% |
| No Internet | 3,636 | 14.3% |
| Total | 25,487 | 100.0% |
Grand Forks Summary
Grand Forks, North Dakota is a city located in the northeastern corner of the state, along the Red River of the North. It is the third-largest city in the state, with a population of approximately 55,000 people. The city is the county seat of Grand Forks County and is part of the Grand Forks, ND-MN Metropolitan Statistical Area.
History
Grand Forks was founded in 1870 by Alexander Griggs, a steamboat captain and land speculator. The city was named after the nearby forks of the Red River, which was a major transportation route for the area. The city quickly grew and by 1881, it had become the county seat of Grand Forks County.
In 1897, the University of North Dakota was founded in Grand Forks, making it the oldest university in the state. The university has since grown to become one of the largest universities in the region.
In 1997, Grand Forks was devastated by a major flood. The Red River of the North overflowed its banks, causing extensive damage to the city. The flood caused over $2 billion in damage and destroyed over 4,000 homes. The city was rebuilt and has since recovered from the disaster.
Geography
Grand Forks is located in the Red River Valley, a flat, fertile region of the Great Plains. The city is situated on the banks of the Red River of the North, which forms the border between North Dakota and Minnesota. The city is surrounded by agricultural land and is located near the Turtle Mountains, a small range of hills in the region.
The city has a humid continental climate, with cold winters and hot, humid summers. The average annual temperature is around 40°F (4°C).
Economy
Grand Forks is a major economic center in the region. The city is home to the University of North Dakota, which is the largest employer in the city. Other major employers include Altru Health System, Grand Forks Air Force Base, and Grand Forks Public Schools.
The city is also home to several large companies, including John Deere, 3M, and Microsoft. The city is also home to several large retail stores, including Walmart, Target, and Best Buy.
Demographics
As of the 2010 census, the population of Grand Forks was 55,532. The city is predominantly white, with a population that is 87.3% white, 5.2% Hispanic or Latino, 3.2% Native American, and 2.2% African American. The median household income is $45,845, and the median home value is $153,400.
Grand Forks is a diverse city, with a variety of cultures and religions represented. The city is home to a large Native American population, as well as a large population of immigrants from Somalia, Ethiopia, and other African countries.
Conclusion
Grand Forks, North Dakota is a vibrant city located in the northeastern corner of the state. The city is home to the University of North Dakota, as well as several large companies and retail stores. The city has a diverse population and a strong economy. Grand Forks is a great place to live, work, and visit.
Common Questions
What is Per Capita Income in Grand Forks?
Per Capita income in Grand Forks is $36,654.
What is the Median Family Income in Grand Forks?
Median Family Income in Grand Forks is $92,949.
What is the Median Household income in Grand Forks?
Median Household Income in Grand Forks is $59,079.
What is Income or Wage Gap in Grand Forks?
Income or Wage Gap in Grand Forks is 25.6%.
Women in Grand Forks earn 74.4 cents for every dollar earned by a man.
What is Family Income Deficit in Grand Forks?
Family Income Deficit in Grand Forks is $9,636.
Families that are below poverty line in Grand Forks earn $9,636 less on average than the poverty threshold level.
What is Inequality or Gini Index in Grand Forks?
Inequality or Gini Index in Grand Forks is 0.47.
What is the Total Population of Grand Forks?
Total Population of Grand Forks is 58,935.
What is the Total Male Population of Grand Forks?
Total Male Population of Grand Forks is 30,776.
What is the Total Female Population of Grand Forks?
Total Female Population of Grand Forks is 28,159.
What is the Ratio of Males per 100 Females in Grand Forks?
There are 109.29 Males per 100 Females in Grand Forks.
What is the Ratio of Females per 100 Males in Grand Forks?
There are 91.50 Females per 100 Males in Grand Forks.
What is the Median Population Age in Grand Forks?
Median Population Age in Grand Forks is 29.1 Years.
What is the Average Family Size in Grand Forks
Average Family Size in Grand Forks is 3.0 People.
What is the Average Household Size in Grand Forks
Average Household Size in Grand Forks is 2.1 People.
How Large is the Labor Force in Grand Forks?
There are 34,614 People in the Labor Forcein in Grand Forks.
What is the Percentage of People in the Labor Force in Grand Forks?
71.1% of People are in the Labor Force in Grand Forks.
What is the Unemployment Rate in Grand Forks?
Unemployment Rate in Grand Forks is 3.7%.