Faribault, MN Map & Demographics
Faribault Map
Faribault Overview
$30,255
PER CAPITA INCOME
$74,447
AVG FAMILY INCOME
$58,881
AVG HOUSEHOLD INCOME
2.8%
WAGE / INCOME GAP [ % ]
97.2¢/ $1
WAGE / INCOME GAP [ $ ]
0.45
INEQUALITY / GINI INDEX
24,418
TOTAL POPULATION
13,061
MALE POPULATION
11,357
FEMALE POPULATION
115.00
MALES / 100 FEMALES
86.95
FEMALES / 100 MALES
38.7
MEDIAN AGE
3.2
AVG FAMILY SIZE
2.5
AVG HOUSEHOLD SIZE
10,869
LABOR FORCE [ PEOPLE ]
55.8%
PERCENT IN LABOR FORCE
6.4%
UNEMPLOYMENT RATE
Faribault Zip Codes
Faribault Area Codes
Income in Faribault
Income Overview in Faribault
Per Capita Income in Faribault is $30,255, while median incomes of families and households are $74,447 and $58,881 respectively.
| Characteristic | Number | Measure |
| Per Capita Income | 24,418 | $30,255 |
| Median Family Income | 5,392 | $74,447 |
| Mean Family Income | 5,392 | $89,983 |
| Median Household Income | 8,853 | $58,881 |
| Mean Household Income | 8,853 | $78,577 |
| Income Deficit | 5,392 | $0 |
| Wage / Income Gap (%) | 24,418 | 2.77% |
| Wage / Income Gap ($) | 24,418 | 97.23¢ per $1 |
| Gini / Inequality Index | 24,418 | 0.45 |
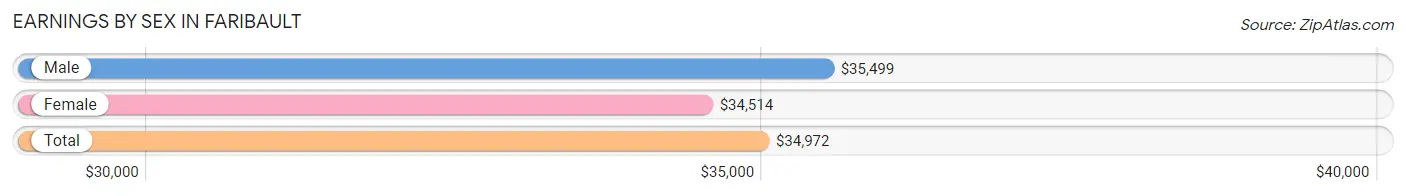
Earnings by Sex in Faribault
Average Earnings in Faribault are $34,972, $35,499 for men and $34,514 for women, a difference of 2.8%.
| Sex | Number | Average Earnings |
| Male | 6,947 (56.5%) | $35,499 |
| Female | 5,339 (43.5%) | $34,514 |
| Total | 12,286 (100.0%) | $34,972 |
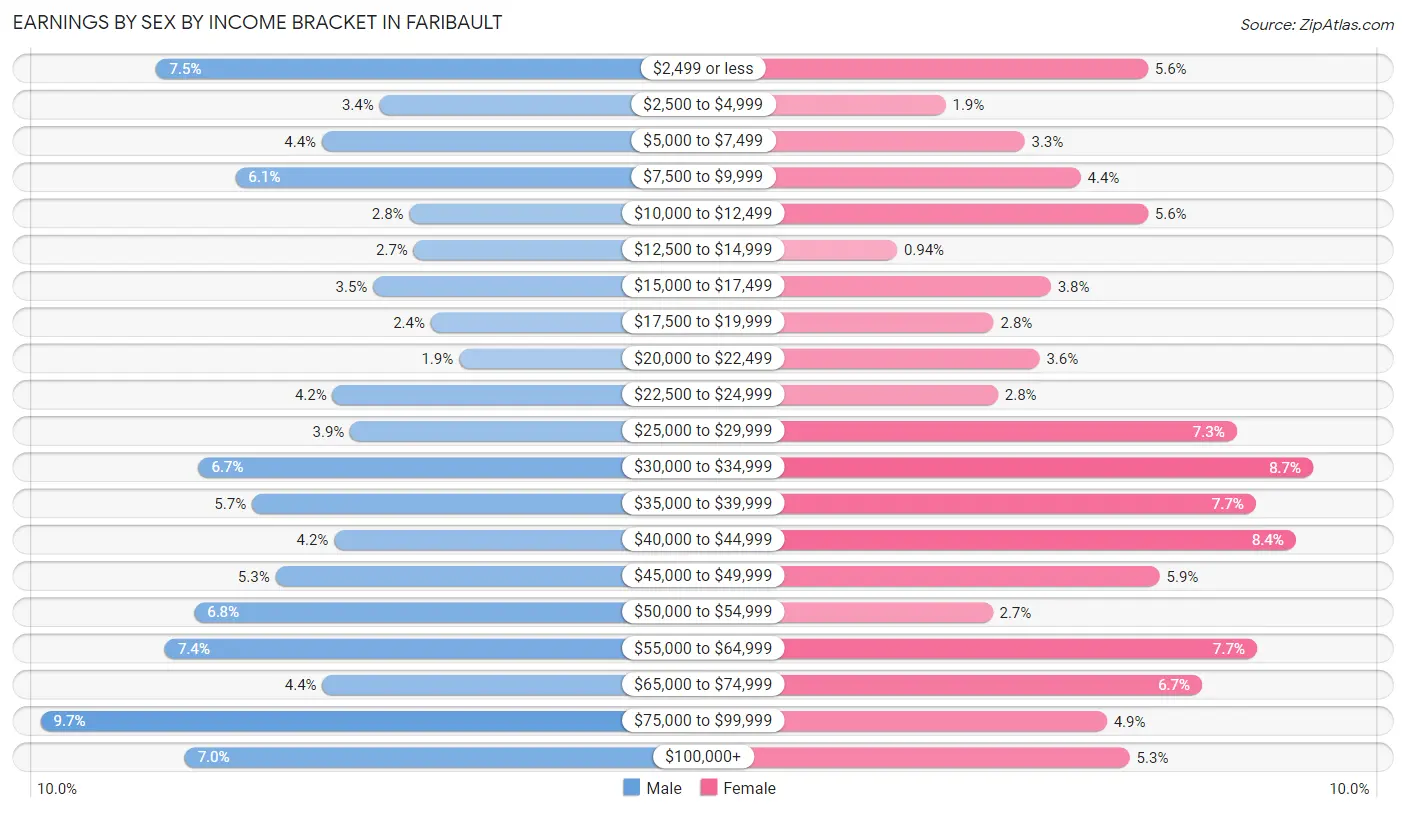
Earnings by Sex by Income Bracket in Faribault
The most common earnings brackets in Faribault are $75,000 to $99,999 for men (674 | 9.7%) and $30,000 to $34,999 for women (466 | 8.7%).
| Income | Male | Female |
| $2,499 or less | 523 (7.5%) | 301 (5.6%) |
| $2,500 to $4,999 | 233 (3.4%) | 99 (1.8%) |
| $5,000 to $7,499 | 308 (4.4%) | 178 (3.3%) |
| $7,500 to $9,999 | 420 (6.0%) | 234 (4.4%) |
| $10,000 to $12,499 | 194 (2.8%) | 301 (5.6%) |
| $12,500 to $14,999 | 188 (2.7%) | 50 (0.9%) |
| $15,000 to $17,499 | 241 (3.5%) | 204 (3.8%) |
| $17,500 to $19,999 | 166 (2.4%) | 147 (2.8%) |
| $20,000 to $22,499 | 129 (1.9%) | 193 (3.6%) |
| $22,500 to $24,999 | 294 (4.2%) | 151 (2.8%) |
| $25,000 to $29,999 | 271 (3.9%) | 390 (7.3%) |
| $30,000 to $34,999 | 468 (6.7%) | 466 (8.7%) |
| $35,000 to $39,999 | 399 (5.7%) | 409 (7.7%) |
| $40,000 to $44,999 | 292 (4.2%) | 449 (8.4%) |
| $45,000 to $49,999 | 368 (5.3%) | 313 (5.9%) |
| $50,000 to $54,999 | 474 (6.8%) | 146 (2.7%) |
| $55,000 to $64,999 | 512 (7.4%) | 410 (7.7%) |
| $65,000 to $74,999 | 307 (4.4%) | 355 (6.7%) |
| $75,000 to $99,999 | 674 (9.7%) | 260 (4.9%) |
| $100,000+ | 486 (7.0%) | 283 (5.3%) |
| Total | 6,947 (100.0%) | 5,339 (100.0%) |
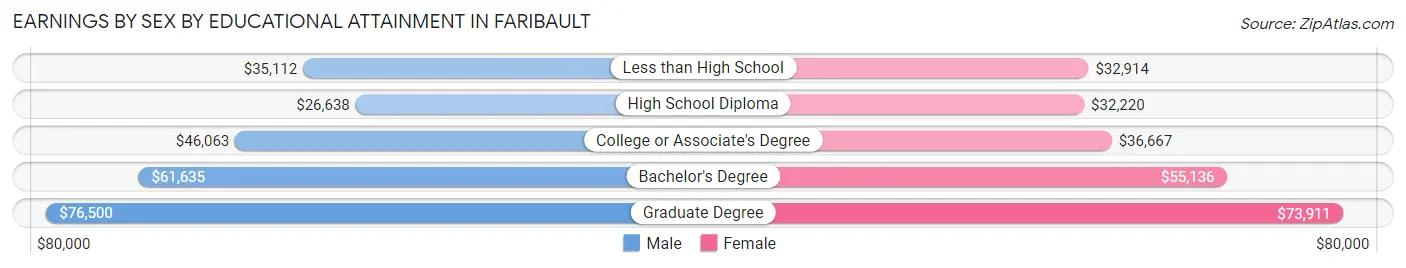
Earnings by Sex by Educational Attainment in Faribault
Average earnings in Faribault are $39,688 for men and $36,883 for women, a difference of 7.1%. Men with an educational attainment of graduate degree enjoy the highest average annual earnings of $76,500, while those with high school diploma education earn the least with $26,638. Women with an educational attainment of graduate degree earn the most with the average annual earnings of $73,911, while those with high school diploma education have the smallest earnings of $32,220.
| Educational Attainment | Male Income | Female Income |
| Less than High School | $35,112 | $32,914 |
| High School Diploma | $26,638 | $32,220 |
| College or Associate's Degree | $46,063 | $36,667 |
| Bachelor's Degree | $61,635 | $55,136 |
| Graduate Degree | $76,500 | $73,911 |
| Total | $39,688 | $36,883 |
Family Income in Faribault
Family Income Brackets in Faribault
According to the Faribault family income data, there are 981 families falling into the $100,000 to $149,999 income range, which is the most common income bracket and makes up 18.2% of all families. Conversely, the $10,000 to $14,999 income bracket is the least frequent group with only 59 families (1.1%) belonging to this category.
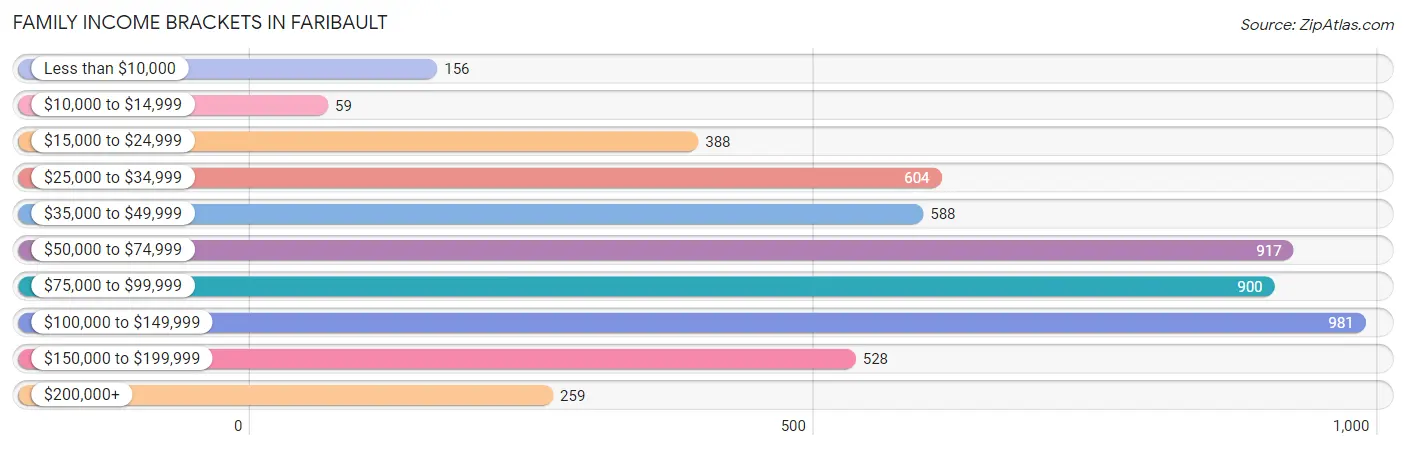
| Income Bracket | # Families | % Families |
| Less than $10,000 | 156 | 2.9% |
| $10,000 to $14,999 | 59 | 1.1% |
| $15,000 to $24,999 | 388 | 7.2% |
| $25,000 to $34,999 | 604 | 11.2% |
| $35,000 to $49,999 | 588 | 10.9% |
| $50,000 to $74,999 | 917 | 17.0% |
| $75,000 to $99,999 | 900 | 16.7% |
| $100,000 to $149,999 | 981 | 18.2% |
| $150,000 to $199,999 | 528 | 9.8% |
| $200,000+ | 259 | 4.8% |
Family Income by Famaliy Size in Faribault
5-person families (325 | 6.0%) account for the highest median family income in Faribault with $110,046 per family, while 2-person families (2,558 | 47.4%) have the highest median income of $41,472 per family member.
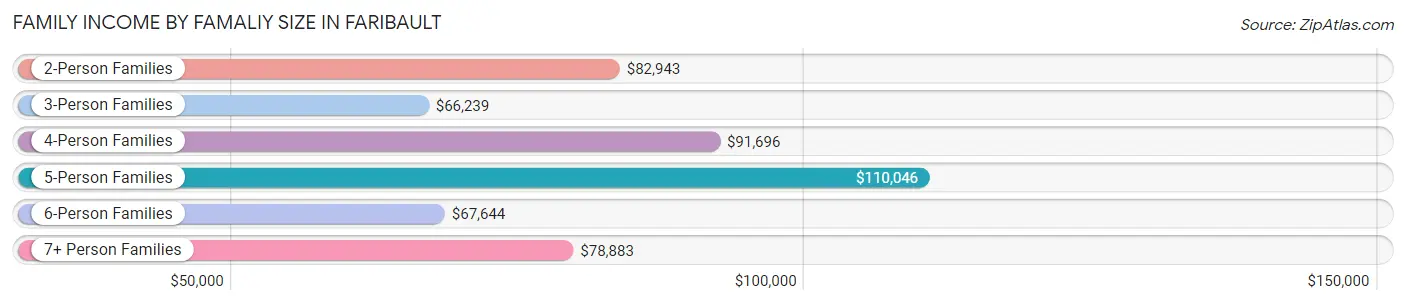
| Income Bracket | # Families | Median Income |
| 2-Person Families | 2,558 (47.4%) | $82,943 |
| 3-Person Families | 1,279 (23.7%) | $66,239 |
| 4-Person Families | 702 (13.0%) | $91,696 |
| 5-Person Families | 325 (6.0%) | $110,046 |
| 6-Person Families | 382 (7.1%) | $67,644 |
| 7+ Person Families | 146 (2.7%) | $78,883 |
| Total | 5,392 (100.0%) | $74,447 |
Family Income by Number of Earners in Faribault
The median family income in Faribault is $74,447, with families comprising 3+ earners (438) having the highest median family income of $148,558, while families with 1 earner (1,688) have the lowest median family income of $38,973, accounting for 8.1% and 31.3% of families, respectively.
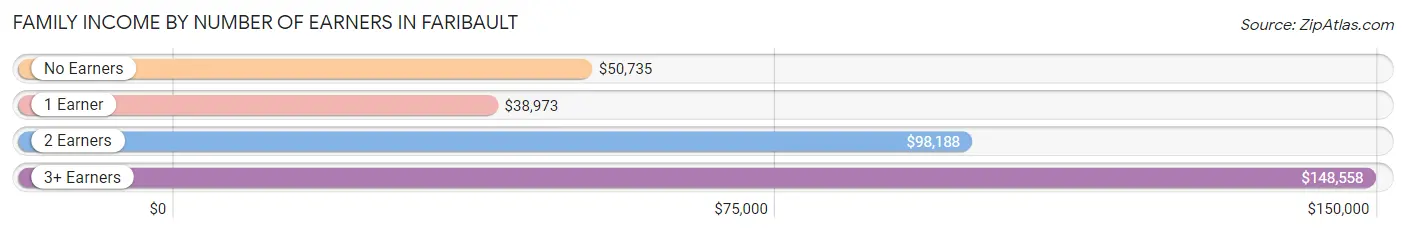
| Number of Earners | # Families | Median Income |
| No Earners | 888 (16.5%) | $50,735 |
| 1 Earner | 1,688 (31.3%) | $38,973 |
| 2 Earners | 2,378 (44.1%) | $98,188 |
| 3+ Earners | 438 (8.1%) | $148,558 |
| Total | 5,392 (100.0%) | $74,447 |
Household Income in Faribault
Household Income Brackets in Faribault
With 1,443 households falling in the category, the $50,000 to $74,999 income range is the most frequent in Faribault, accounting for 16.3% of all households. In contrast, only 292 households (3.3%) fall into the $10,000 to $14,999 income bracket, making it the least populous group.
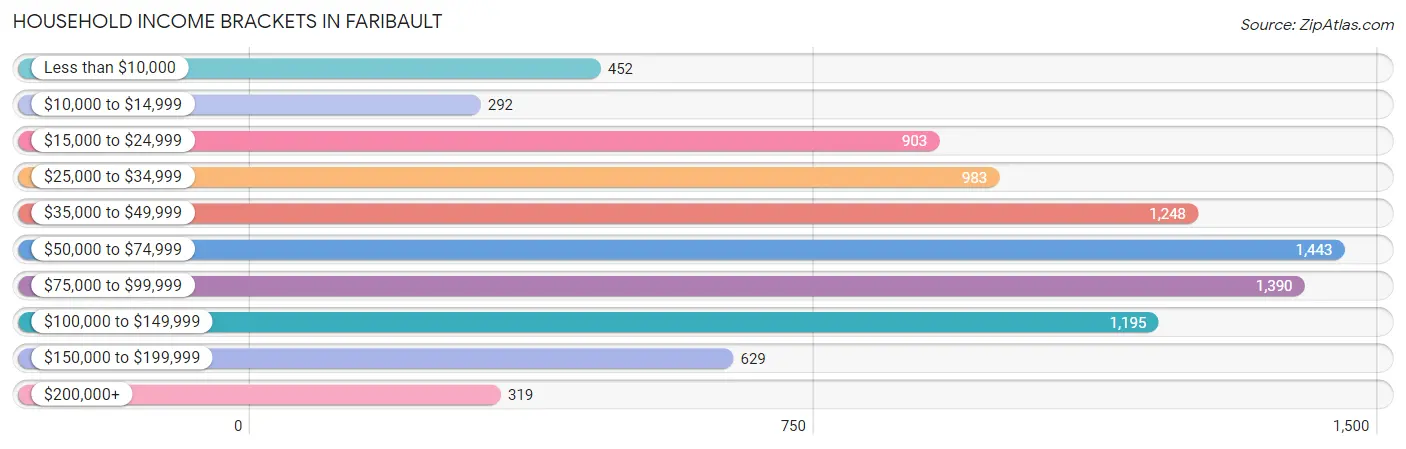
| Income Bracket | # Households | % Households |
| Less than $10,000 | 452 | 5.1% |
| $10,000 to $14,999 | 292 | 3.3% |
| $15,000 to $24,999 | 903 | 10.2% |
| $25,000 to $34,999 | 983 | 11.1% |
| $35,000 to $49,999 | 1,248 | 14.1% |
| $50,000 to $74,999 | 1,443 | 16.3% |
| $75,000 to $99,999 | 1,390 | 15.7% |
| $100,000 to $149,999 | 1,195 | 13.5% |
| $150,000 to $199,999 | 629 | 7.1% |
| $200,000+ | 319 | 3.6% |
Household Income by Householder Age in Faribault
The median household income in Faribault is $58,881, with the highest median household income of $77,848 found in the 45 to 64 years age bracket for the primary householder. A total of 2,860 households (32.3%) fall into this category. Meanwhile, the 15 to 24 years age bracket for the primary householder has the lowest median household income of $0, with 173 households (1.9%) in this group.
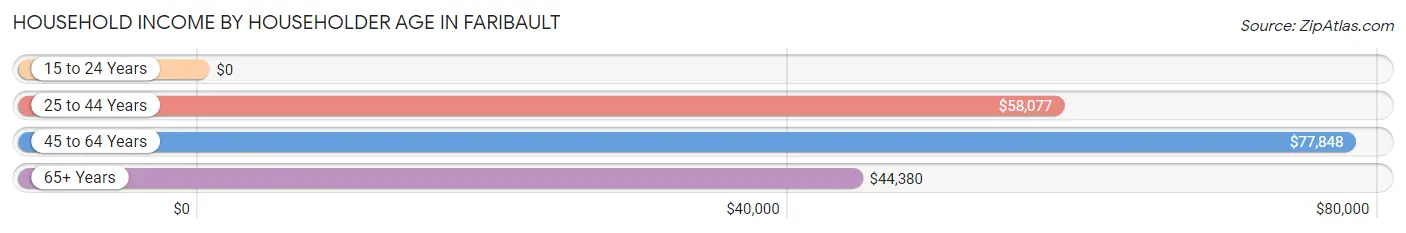
| Income Bracket | # Households | Median Income |
| 15 to 24 Years | 173 (1.9%) | $0 |
| 25 to 44 Years | 3,050 (34.4%) | $58,077 |
| 45 to 64 Years | 2,860 (32.3%) | $77,848 |
| 65+ Years | 2,770 (31.3%) | $44,380 |
| Total | 8,853 (100.0%) | $58,881 |
Poverty in Faribault
Income Below Poverty by Sex and Age in Faribault
With 12.6% poverty level for males and 19.0% for females among the residents of Faribault, under 5 year old males and 5 year old females are the most vulnerable to poverty, with 165 males (26.7%) and 98 females (62.8%) in their respective age groups living below the poverty level.
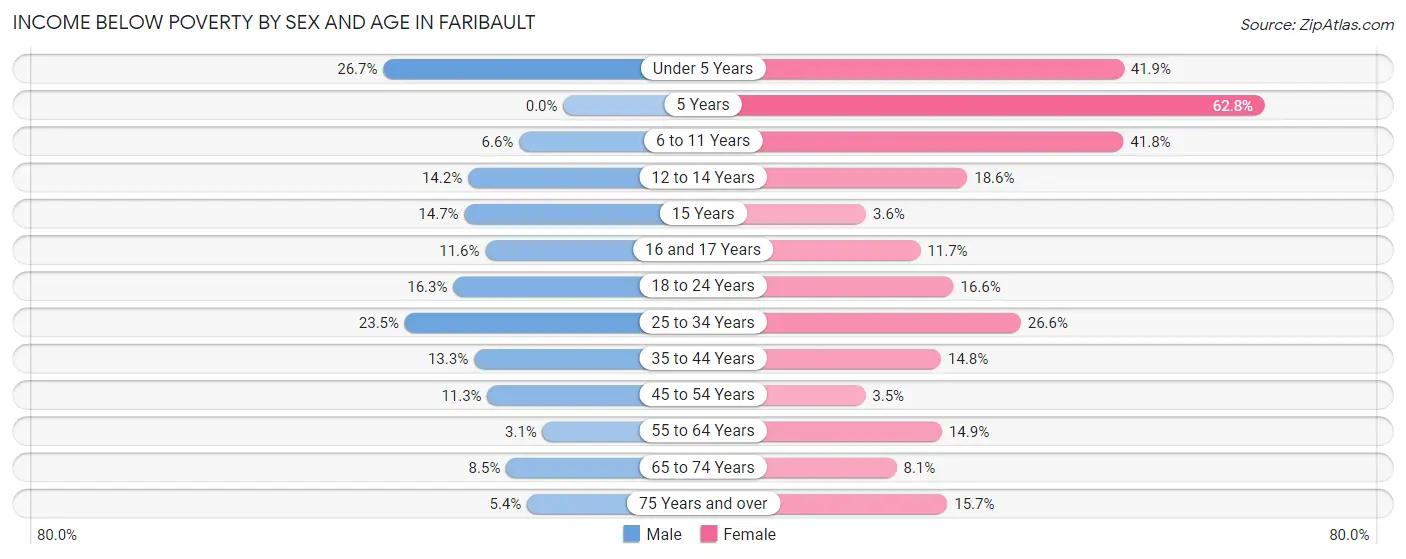
| Age Bracket | Male | Female |
| Under 5 Years | 165 (26.7%) | 309 (41.9%) |
| 5 Years | 0 (0.0%) | 98 (62.8%) |
| 6 to 11 Years | 63 (6.6%) | 340 (41.8%) |
| 12 to 14 Years | 66 (14.2%) | 110 (18.6%) |
| 15 Years | 31 (14.7%) | 6 (3.6%) |
| 16 and 17 Years | 35 (11.6%) | 39 (11.7%) |
| 18 to 24 Years | 185 (16.3%) | 120 (16.6%) |
| 25 to 34 Years | 329 (23.5%) | 404 (26.6%) |
| 35 to 44 Years | 217 (13.3%) | 169 (14.7%) |
| 45 to 54 Years | 133 (11.3%) | 41 (3.5%) |
| 55 to 64 Years | 39 (3.1%) | 237 (14.9%) |
| 65 to 74 Years | 96 (8.5%) | 100 (8.1%) |
| 75 Years and over | 33 (5.4%) | 163 (15.7%) |
| Total | 1,392 (12.6%) | 2,136 (19.0%) |
Income Above Poverty by Sex and Age in Faribault
According to the poverty statistics in Faribault, males aged 5 years and females aged 45 to 54 years are the age groups that are most secure financially, with 100.0% of males and 96.5% of females in these age groups living above the poverty line.
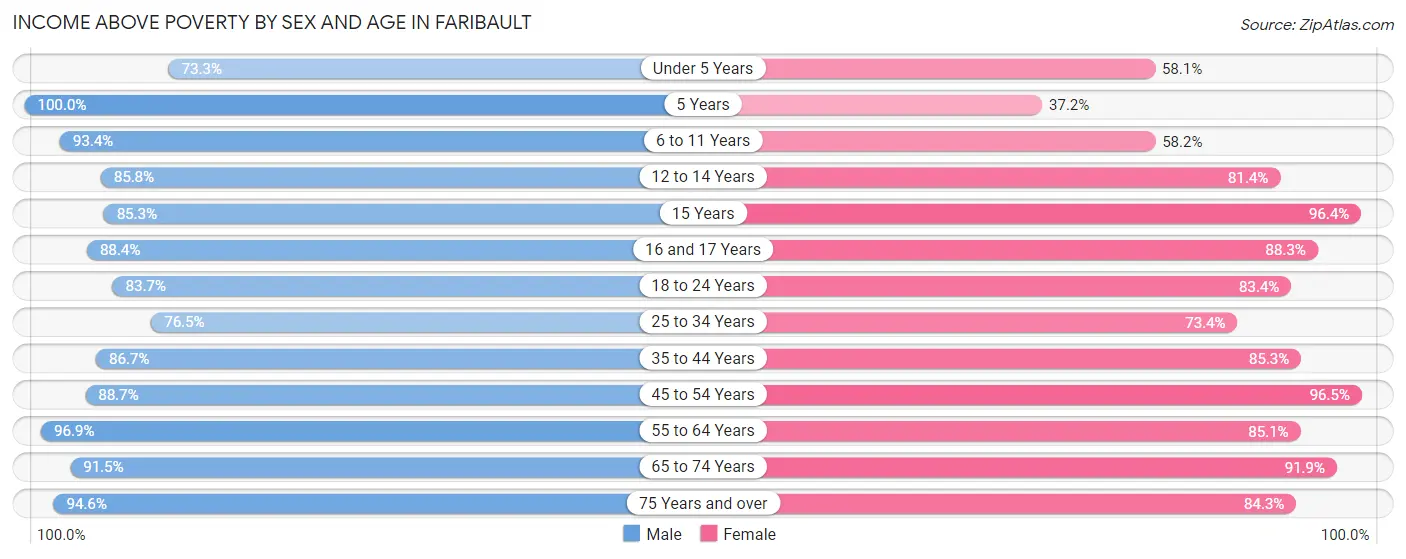
| Age Bracket | Male | Female |
| Under 5 Years | 452 (73.3%) | 429 (58.1%) |
| 5 Years | 176 (100.0%) | 58 (37.2%) |
| 6 to 11 Years | 898 (93.4%) | 473 (58.2%) |
| 12 to 14 Years | 400 (85.8%) | 480 (81.4%) |
| 15 Years | 180 (85.3%) | 160 (96.4%) |
| 16 and 17 Years | 267 (88.4%) | 295 (88.3%) |
| 18 to 24 Years | 947 (83.7%) | 603 (83.4%) |
| 25 to 34 Years | 1,069 (76.5%) | 1,116 (73.4%) |
| 35 to 44 Years | 1,418 (86.7%) | 977 (85.3%) |
| 45 to 54 Years | 1,047 (88.7%) | 1,131 (96.5%) |
| 55 to 64 Years | 1,232 (96.9%) | 1,356 (85.1%) |
| 65 to 74 Years | 1,036 (91.5%) | 1,130 (91.9%) |
| 75 Years and over | 580 (94.6%) | 877 (84.3%) |
| Total | 9,702 (87.5%) | 9,085 (81.0%) |
Income Below Poverty Among Married-Couple Families in Faribault
The poverty statistics for married-couple families in Faribault show that 6.6% or 242 of the total 3,669 families live below the poverty line. Families with 3 or 4 children have the highest poverty rate of 24.7%, comprising of 140 families. On the other hand, families with 1 or 2 children have the lowest poverty rate of 2.4%, which includes 24 families.
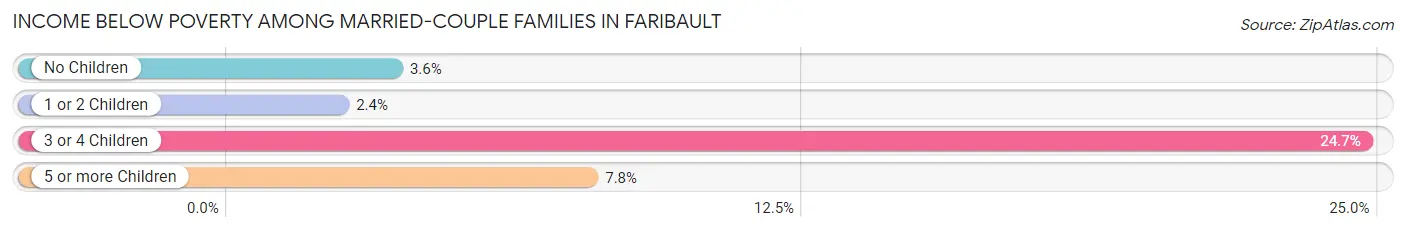
| Children | Above Poverty | Below Poverty |
| No Children | 1,985 (96.4%) | 74 (3.6%) |
| 1 or 2 Children | 968 (97.6%) | 24 (2.4%) |
| 3 or 4 Children | 427 (75.3%) | 140 (24.7%) |
| 5 or more Children | 47 (92.2%) | 4 (7.8%) |
| Total | 3,427 (93.4%) | 242 (6.6%) |
Income Below Poverty Among Single-Parent Households in Faribault
According to the poverty data in Faribault, 3.3% or 16 single-father households and 30.8% or 383 single-mother households are living below the poverty line. Among single-father households, those with 1 or 2 children have the highest poverty rate, with 16 households (8.6%) experiencing poverty. Likewise, among single-mother households, those with 5 or more children have the highest poverty rate, with 11 households (100.0%) falling below the poverty line.
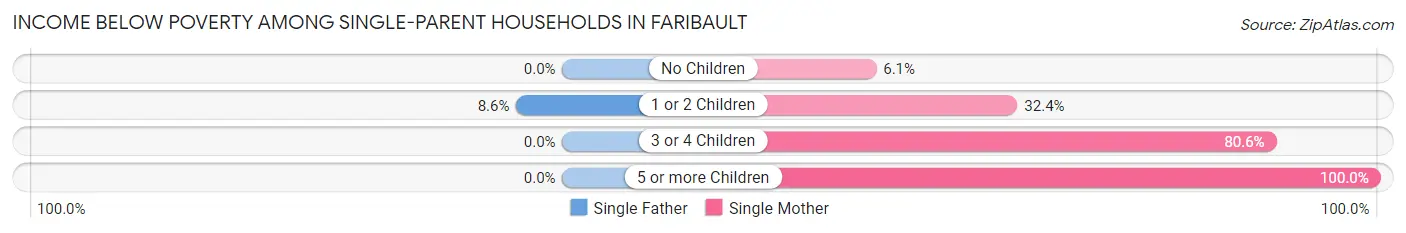
| Children | Single Father | Single Mother |
| No Children | 0 (0.0%) | 21 (6.1%) |
| 1 or 2 Children | 16 (8.6%) | 243 (32.4%) |
| 3 or 4 Children | 0 (0.0%) | 108 (80.6%) |
| 5 or more Children | 0 (0.0%) | 11 (100.0%) |
| Total | 16 (3.3%) | 383 (30.8%) |
Income Below Poverty Among Married-Couple vs Single-Parent Households in Faribault
The poverty data for Faribault shows that 242 of the married-couple family households (6.6%) and 399 of the single-parent households (23.2%) are living below the poverty level. Within the married-couple family households, those with 3 or 4 children have the highest poverty rate, with 140 households (24.7%) falling below the poverty line. Among the single-parent households, those with 3 or 4 children have the highest poverty rate, with 108 household (74.0%) living below poverty.
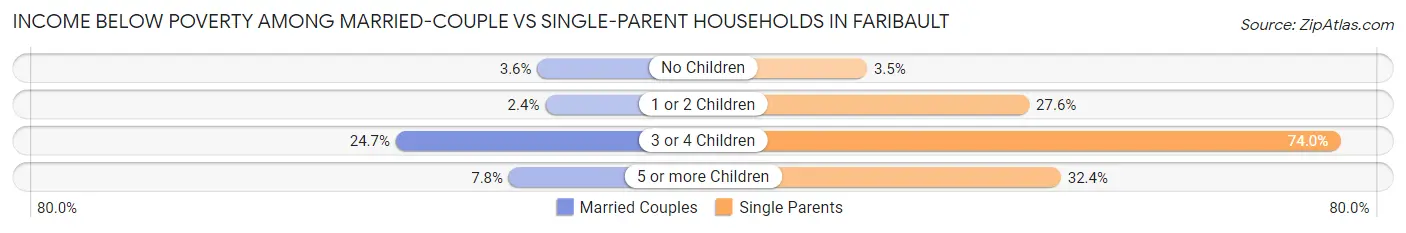
| Children | Married-Couple Families | Single-Parent Households |
| No Children | 74 (3.6%) | 21 (3.5%) |
| 1 or 2 Children | 24 (2.4%) | 259 (27.6%) |
| 3 or 4 Children | 140 (24.7%) | 108 (74.0%) |
| 5 or more Children | 4 (7.8%) | 11 (32.4%) |
| Total | 242 (6.6%) | 399 (23.2%) |
Race in Faribault
The most populous races in Faribault are White / Caucasian (17,313 | 70.9%), Black / African American (3,605 | 14.8%), and Hispanic or Latino (3,551 | 14.5%).
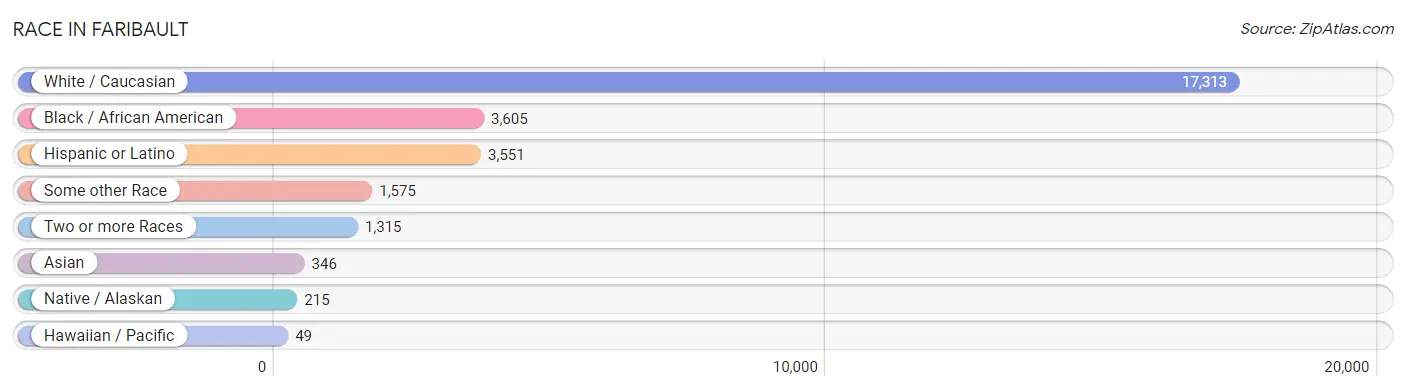
| Race | # Population | % Population |
| Asian | 346 | 1.4% |
| Black / African American | 3,605 | 14.8% |
| Hawaiian / Pacific | 49 | 0.2% |
| Hispanic or Latino | 3,551 | 14.5% |
| Native / Alaskan | 215 | 0.9% |
| White / Caucasian | 17,313 | 70.9% |
| Two or more Races | 1,315 | 5.4% |
| Some other Race | 1,575 | 6.5% |
| Total | 24,418 | 100.0% |
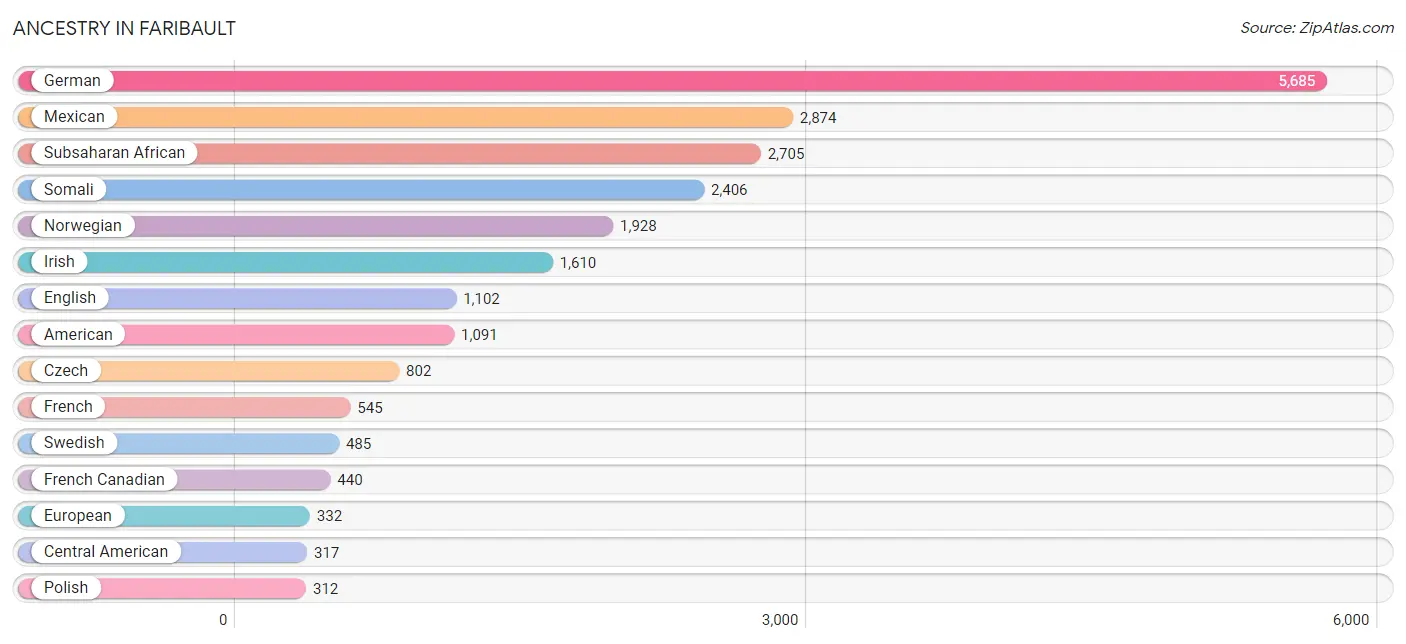
Ancestry in Faribault
The most populous ancestries reported in Faribault are German (5,685 | 23.3%), Mexican (2,874 | 11.8%), Subsaharan African (2,705 | 11.1%), Somali (2,406 | 9.9%), and Norwegian (1,928 | 7.9%), together accounting for 63.9% of all Faribault residents.
| Ancestry | # Population | % Population |
| African | 65 | 0.3% |
| American | 1,091 | 4.5% |
| Arab | 11 | 0.1% |
| Austrian | 98 | 0.4% |
| Bangladeshi | 50 | 0.2% |
| Belgian | 11 | 0.1% |
| Bolivian | 72 | 0.3% |
| British | 57 | 0.2% |
| Burmese | 118 | 0.5% |
| Central American | 317 | 1.3% |
| Central American Indian | 110 | 0.4% |
| Cherokee | 77 | 0.3% |
| Chippewa | 57 | 0.2% |
| Colombian | 35 | 0.1% |
| Cuban | 5 | 0.0% |
| Czech | 802 | 3.3% |
| Czechoslovakian | 116 | 0.5% |
| Danish | 42 | 0.2% |
| Dutch | 134 | 0.5% |
| Eastern European | 59 | 0.2% |
| Ecuadorian | 71 | 0.3% |
| Egyptian | 8 | 0.0% |
| English | 1,102 | 4.5% |
| Ethiopian | 85 | 0.4% |
| European | 332 | 1.4% |
| Finnish | 71 | 0.3% |
| French | 545 | 2.2% |
| French Canadian | 440 | 1.8% |
| German | 5,685 | 23.3% |
| Greek | 52 | 0.2% |
| Guatemalan | 133 | 0.5% |
| Honduran | 6 | 0.0% |
| Hungarian | 52 | 0.2% |
| Indian (Asian) | 13 | 0.1% |
| Irish | 1,610 | 6.6% |
| Italian | 198 | 0.8% |
| Japanese | 47 | 0.2% |
| Kenyan | 6 | 0.0% |
| Korean | 106 | 0.4% |
| Liberian | 14 | 0.1% |
| Malaysian | 20 | 0.1% |
| Mexican | 2,874 | 11.8% |
| Mexican American Indian | 16 | 0.1% |
| Moroccan | 3 | 0.0% |
| Native Hawaiian | 31 | 0.1% |
| Nicaraguan | 166 | 0.7% |
| Nigerian | 16 | 0.1% |
| Northern European | 21 | 0.1% |
| Norwegian | 1,928 | 7.9% |
| Pakistani | 22 | 0.1% |
| Peruvian | 20 | 0.1% |
| Polish | 312 | 1.3% |
| Puerto Rican | 15 | 0.1% |
| Romanian | 19 | 0.1% |
| Russian | 58 | 0.2% |
| Salvadoran | 12 | 0.1% |
| Scandinavian | 200 | 0.8% |
| Scotch-Irish | 93 | 0.4% |
| Scottish | 188 | 0.8% |
| Serbian | 10 | 0.0% |
| Sioux | 8 | 0.0% |
| Slavic | 9 | 0.0% |
| Slovak | 10 | 0.0% |
| Slovene | 48 | 0.2% |
| Somali | 2,406 | 9.9% |
| South American | 198 | 0.8% |
| Spanish | 52 | 0.2% |
| Sri Lankan | 31 | 0.1% |
| Subsaharan African | 2,705 | 11.1% |
| Sudanese | 113 | 0.5% |
| Swedish | 485 | 2.0% |
| Swiss | 207 | 0.9% |
| Thai | 30 | 0.1% |
| Ukrainian | 42 | 0.2% |
| Welsh | 80 | 0.3% | View All 75 Rows |
Immigrants in Faribault
The most numerous immigrant groups reported in Faribault came from Africa (2,169 | 8.9%), Eastern Africa (1,944 | 8.0%), Latin America (1,192 | 4.9%), Somalia (1,152 | 4.7%), and Central America (1,096 | 4.5%), together accounting for 30.9% of all Faribault residents.
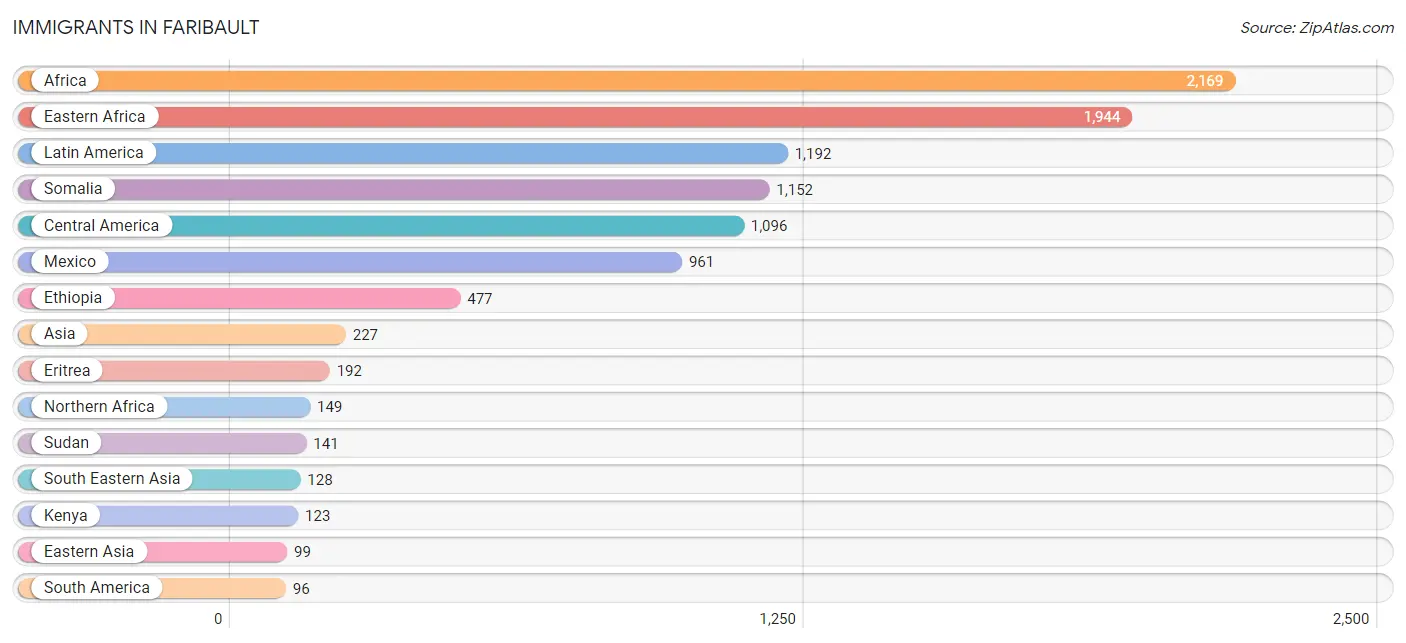
| Immigration Origin | # Population | % Population |
| Africa | 2,169 | 8.9% |
| Asia | 227 | 0.9% |
| Bolivia | 43 | 0.2% |
| Canada | 12 | 0.1% |
| Central America | 1,096 | 4.5% |
| China | 7 | 0.0% |
| Colombia | 5 | 0.0% |
| Eastern Africa | 1,944 | 8.0% |
| Eastern Asia | 99 | 0.4% |
| Eastern Europe | 24 | 0.1% |
| Ecuador | 28 | 0.1% |
| Egypt | 8 | 0.0% |
| El Salvador | 19 | 0.1% |
| Eritrea | 192 | 0.8% |
| Ethiopia | 477 | 1.9% |
| Europe | 42 | 0.2% |
| Germany | 18 | 0.1% |
| Guatemala | 68 | 0.3% |
| Honduras | 6 | 0.0% |
| Kenya | 123 | 0.5% |
| Korea | 92 | 0.4% |
| Laos | 26 | 0.1% |
| Latin America | 1,192 | 4.9% |
| Liberia | 45 | 0.2% |
| Mexico | 961 | 3.9% |
| Nicaragua | 42 | 0.2% |
| Nigeria | 22 | 0.1% |
| Northern Africa | 149 | 0.6% |
| Peru | 20 | 0.1% |
| Philippines | 57 | 0.2% |
| Russia | 3 | 0.0% |
| Somalia | 1,152 | 4.7% |
| South America | 96 | 0.4% |
| South Eastern Asia | 128 | 0.5% |
| Sudan | 141 | 0.6% |
| Thailand | 39 | 0.2% |
| Ukraine | 21 | 0.1% |
| Vietnam | 6 | 0.0% |
| Western Africa | 76 | 0.3% |
| Western Europe | 18 | 0.1% | View All 40 Rows |
Sex and Age in Faribault
Sex and Age in Faribault
The most populous age groups in Faribault are 20 to 24 Years (1,191 | 9.1%) for men and 60 to 64 Years (830 | 7.3%) for women.
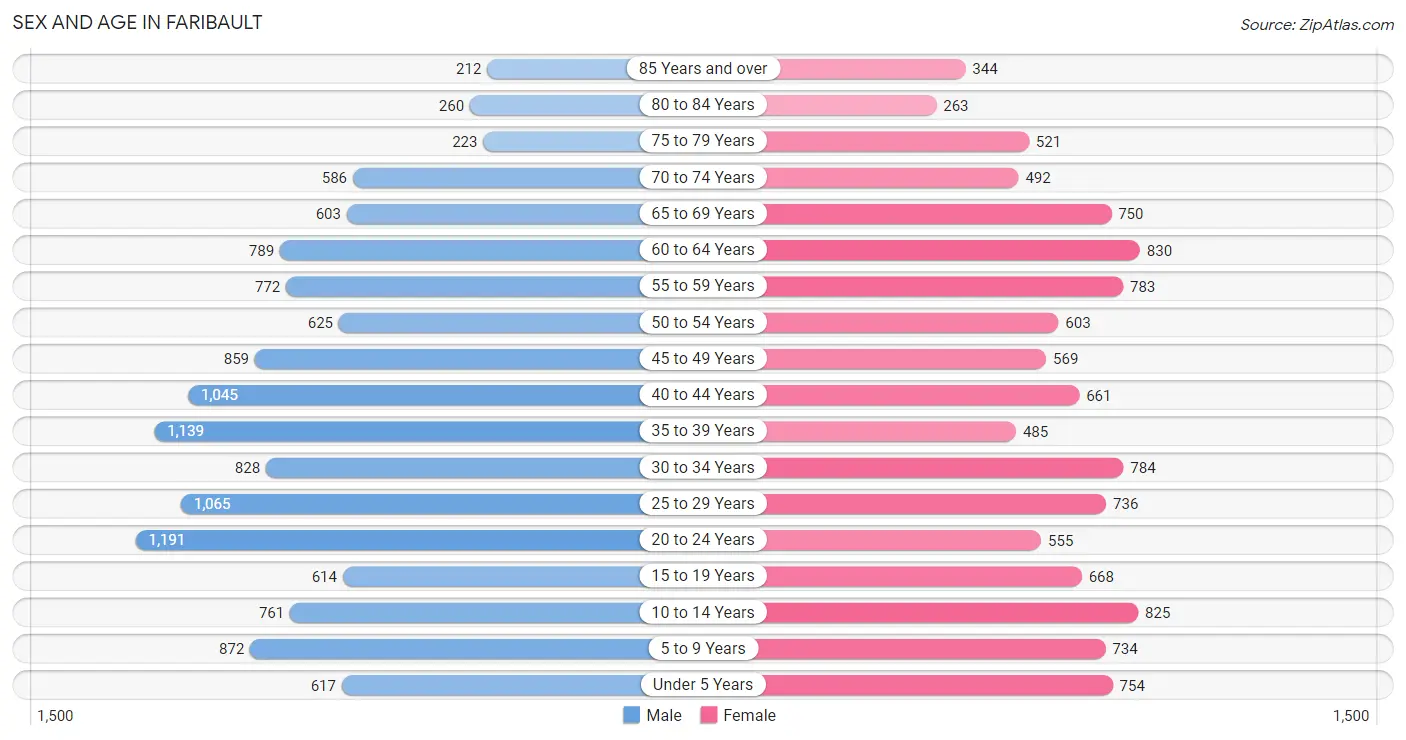
| Age Bracket | Male | Female |
| Under 5 Years | 617 (4.7%) | 754 (6.6%) |
| 5 to 9 Years | 872 (6.7%) | 734 (6.5%) |
| 10 to 14 Years | 761 (5.8%) | 825 (7.3%) |
| 15 to 19 Years | 614 (4.7%) | 668 (5.9%) |
| 20 to 24 Years | 1,191 (9.1%) | 555 (4.9%) |
| 25 to 29 Years | 1,065 (8.2%) | 736 (6.5%) |
| 30 to 34 Years | 828 (6.3%) | 784 (6.9%) |
| 35 to 39 Years | 1,139 (8.7%) | 485 (4.3%) |
| 40 to 44 Years | 1,045 (8.0%) | 661 (5.8%) |
| 45 to 49 Years | 859 (6.6%) | 569 (5.0%) |
| 50 to 54 Years | 625 (4.8%) | 603 (5.3%) |
| 55 to 59 Years | 772 (5.9%) | 783 (6.9%) |
| 60 to 64 Years | 789 (6.0%) | 830 (7.3%) |
| 65 to 69 Years | 603 (4.6%) | 750 (6.6%) |
| 70 to 74 Years | 586 (4.5%) | 492 (4.3%) |
| 75 to 79 Years | 223 (1.7%) | 521 (4.6%) |
| 80 to 84 Years | 260 (2.0%) | 263 (2.3%) |
| 85 Years and over | 212 (1.6%) | 344 (3.0%) |
| Total | 13,061 (100.0%) | 11,357 (100.0%) |
Families and Households in Faribault
Median Family Size in Faribault
The median family size in Faribault is 3.17 persons per family, with married-couple families (3,669 | 68.0%) accounting for the largest median family size of 3.21 persons per family. On the other hand, single male/father families (481 | 8.9%) represent the smallest median family size with 3.05 persons per family.
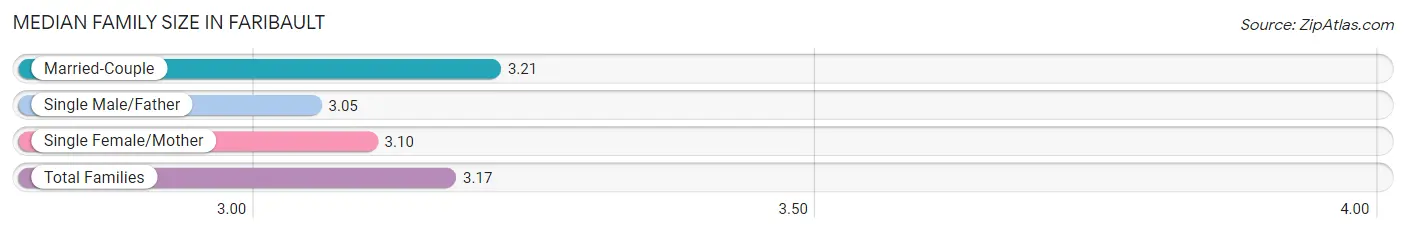
| Family Type | # Families | Family Size |
| Married-Couple | 3,669 (68.0%) | 3.21 |
| Single Male/Father | 481 (8.9%) | 3.05 |
| Single Female/Mother | 1,242 (23.0%) | 3.10 |
| Total Families | 5,392 (100.0%) | 3.17 |
Median Household Size in Faribault
The median household size in Faribault is 2.49 persons per household, with single female/mother households (1,242 | 14.0%) accounting for the largest median household size of 3.45 persons per household. non-family households (3,461 | 39.1%) represent the smallest median household size with 1.26 persons per household.
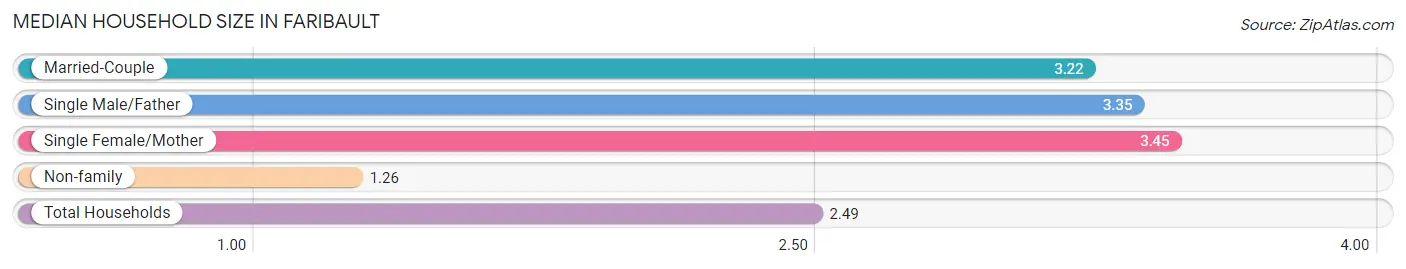
| Household Type | # Households | Household Size |
| Married-Couple | 3,669 (41.4%) | 3.22 |
| Single Male/Father | 481 (5.4%) | 3.35 |
| Single Female/Mother | 1,242 (14.0%) | 3.45 |
| Non-family | 3,461 (39.1%) | 1.26 |
| Total Households | 8,853 (100.0%) | 2.49 |
Household Size by Marriage Status in Faribault
Out of a total of 8,853 households in Faribault, 5,392 (60.9%) are family households, while 3,461 (39.1%) are nonfamily households. The most numerous type of family households are 2-person households, comprising 2,432, and the most common type of nonfamily households are 1-person households, comprising 2,933.
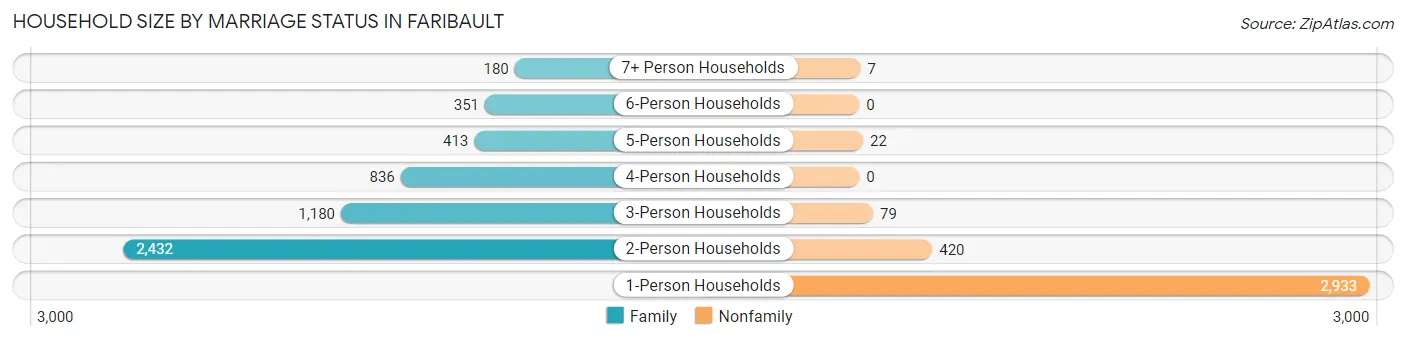
| Household Size | Family Households | Nonfamily Households |
| 1-Person Households | - | 2,933 (33.1%) |
| 2-Person Households | 2,432 (27.5%) | 420 (4.7%) |
| 3-Person Households | 1,180 (13.3%) | 79 (0.9%) |
| 4-Person Households | 836 (9.4%) | 0 (0.0%) |
| 5-Person Households | 413 (4.7%) | 22 (0.3%) |
| 6-Person Households | 351 (4.0%) | 0 (0.0%) |
| 7+ Person Households | 180 (2.0%) | 7 (0.1%) |
| Total | 5,392 (60.9%) | 3,461 (39.1%) |
Female Fertility in Faribault
Fertility by Age in Faribault
Average fertility rate in Faribault is 114.0 births per 1,000 women. Women in the age bracket of 20 to 34 years have the highest fertility rate with 213.0 births per 1,000 women. Women in the age bracket of 20 to 34 years acount for 83.3% of all women with births.
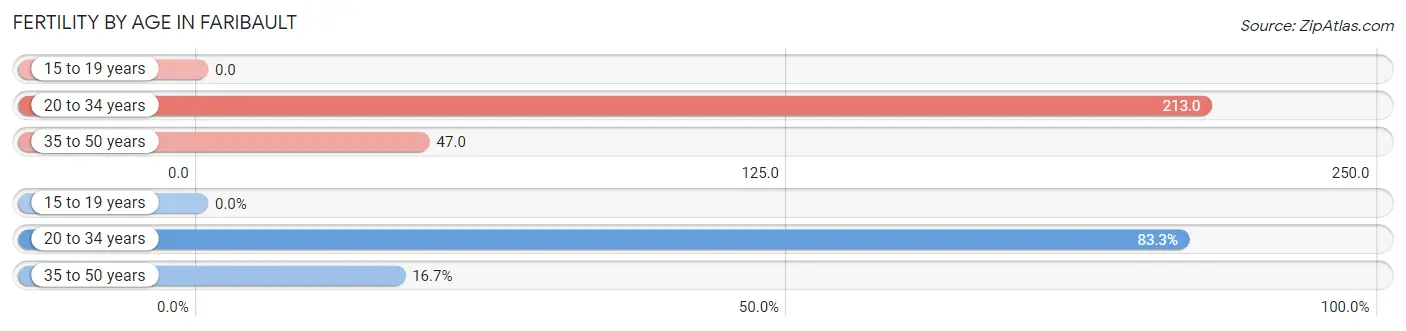
| Age Bracket | Women with Births | Births / 1,000 Women |
| 15 to 19 years | 0 (0.0%) | 0.0 |
| 20 to 34 years | 443 (83.3%) | 213.0 |
| 35 to 50 years | 89 (16.7%) | 47.0 |
| Total | 532 (100.0%) | 114.0 |
Fertility by Age by Marriage Status in Faribault
51.7% of women with births (532) in Faribault are married. The highest percentage of unmarried women with births falls into 35 to 50 years age bracket with 69.7% of them unmarried at the time of birth, while the lowest percentage of unmarried women with births belong to 20 to 34 years age bracket with 44.0% of them unmarried.
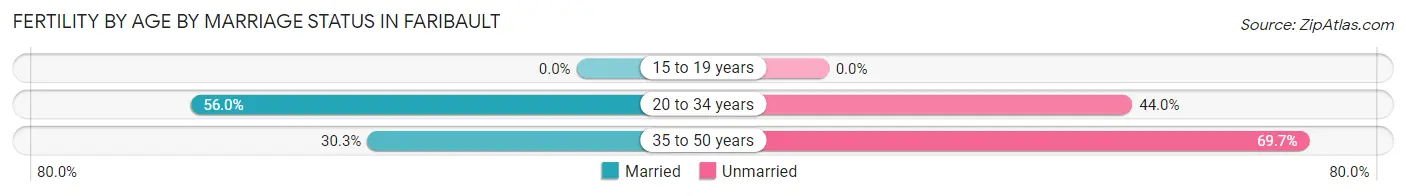
| Age Bracket | Married | Unmarried |
| 15 to 19 years | 0 (0.0%) | 0 (0.0%) |
| 20 to 34 years | 248 (56.0%) | 195 (44.0%) |
| 35 to 50 years | 27 (30.3%) | 62 (69.7%) |
| Total | 275 (51.7%) | 257 (48.3%) |
Fertility by Education in Faribault
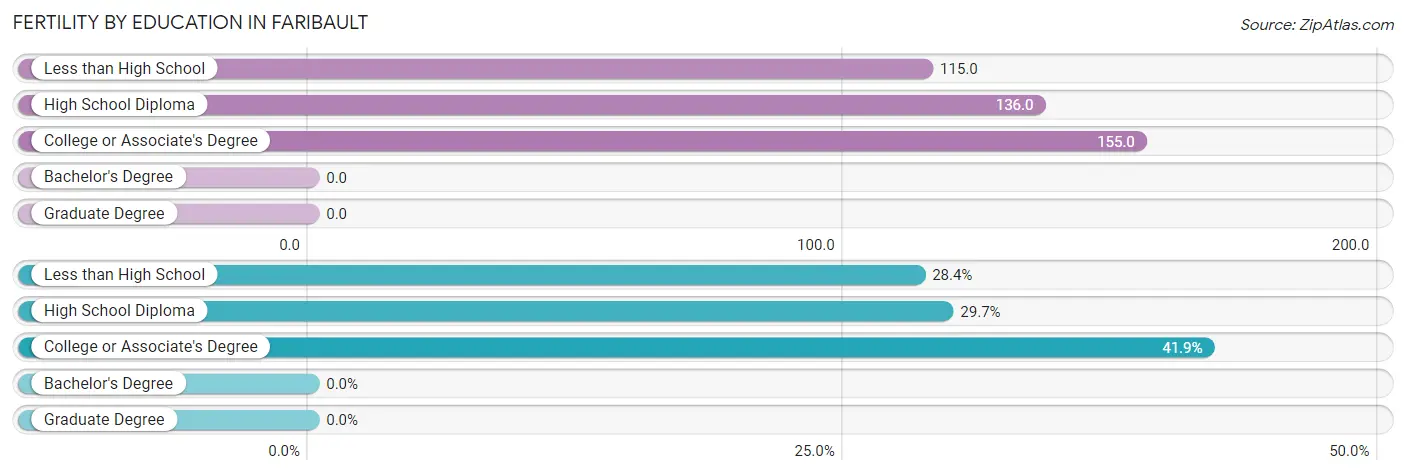
| Educational Attainment | Women with Births | Births / 1,000 Women |
| Less than High School | 151 (28.4%) | 115.0 |
| High School Diploma | 158 (29.7%) | 136.0 |
| College or Associate's Degree | 223 (41.9%) | 155.0 |
| Bachelor's Degree | 0 (0.0%) | 0.0 |
| Graduate Degree | 0 (0.0%) | 0.0 |
| Total | 532 (100.0%) | 114.0 |
Fertility by Education by Marriage Status in Faribault
48.3% of women with births in Faribault are unmarried. Women with the educational attainment of less than high school are most likely to be married with 100.0% of them married at childbirth, while women with the educational attainment of high school diploma are least likely to be married with 77.8% of them unmarried at childbirth.
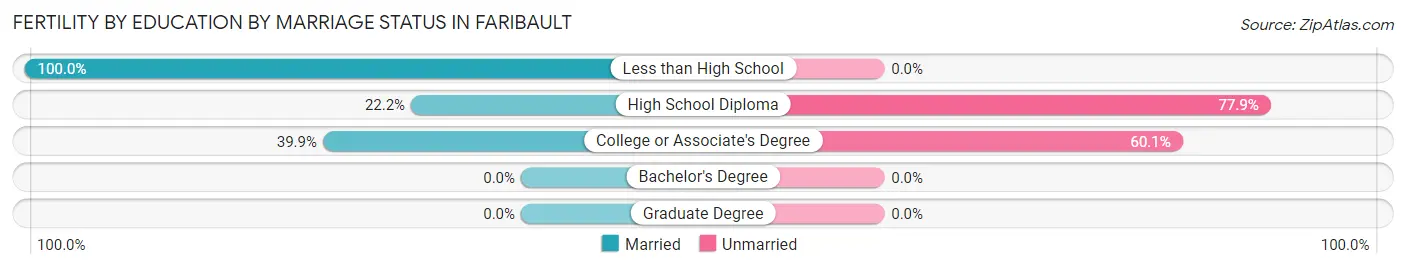
| Educational Attainment | Married | Unmarried |
| Less than High School | 151 (100.0%) | 0 (0.0%) |
| High School Diploma | 35 (22.2%) | 123 (77.8%) |
| College or Associate's Degree | 89 (39.9%) | 134 (60.1%) |
| Bachelor's Degree | 0 (0.0%) | 0 (0.0%) |
| Graduate Degree | 0 (0.0%) | 0 (0.0%) |
| Total | 275 (51.7%) | 257 (48.3%) |
Employment Characteristics in Faribault
Employment by Class of Employer in Faribault
Among the 10,047 employed individuals in Faribault, private company employees (7,094 | 70.6%), not-for-profit organizations (904 | 9.0%), and local government employees (686 | 6.8%) make up the most common classes of employment.
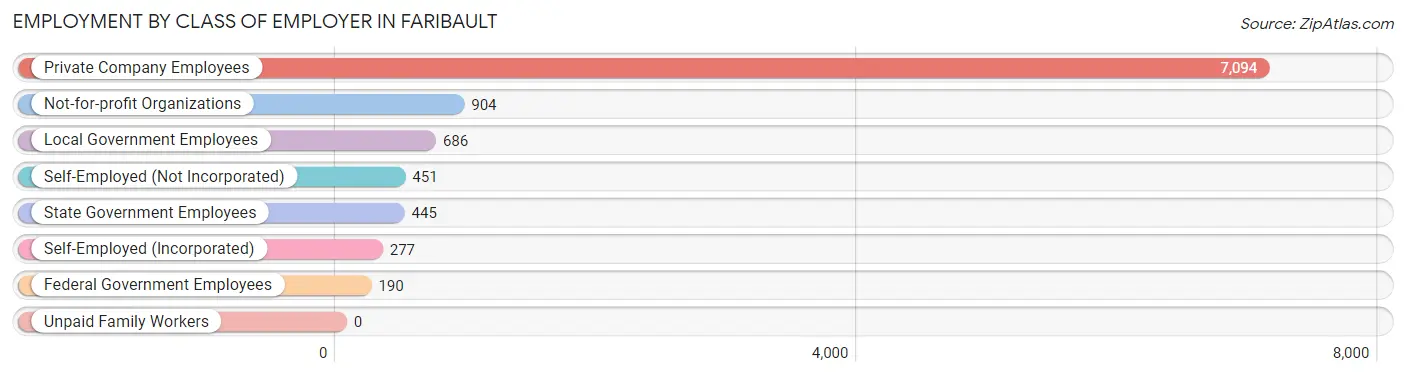
| Employer Class | # Employees | % Employees |
| Private Company Employees | 7,094 | 70.6% |
| Self-Employed (Incorporated) | 277 | 2.8% |
| Self-Employed (Not Incorporated) | 451 | 4.5% |
| Not-for-profit Organizations | 904 | 9.0% |
| Local Government Employees | 686 | 6.8% |
| State Government Employees | 445 | 4.4% |
| Federal Government Employees | 190 | 1.9% |
| Unpaid Family Workers | 0 | 0.0% |
| Total | 10,047 | 100.0% |
Employment Status by Age in Faribault
According to the labor force statistics for Faribault, out of the total population over 16 years of age (19,478), 55.8% or 10,869 individuals are in the labor force, with 6.4% or 696 of them unemployed. The age group with the highest labor force participation rate is 25 to 29 years, with 77.9% or 1,403 individuals in the labor force. Within the labor force, the 16 to 19 years age range has the highest percentage of unemployed individuals, with 20.2% or 89 of them being unemployed.
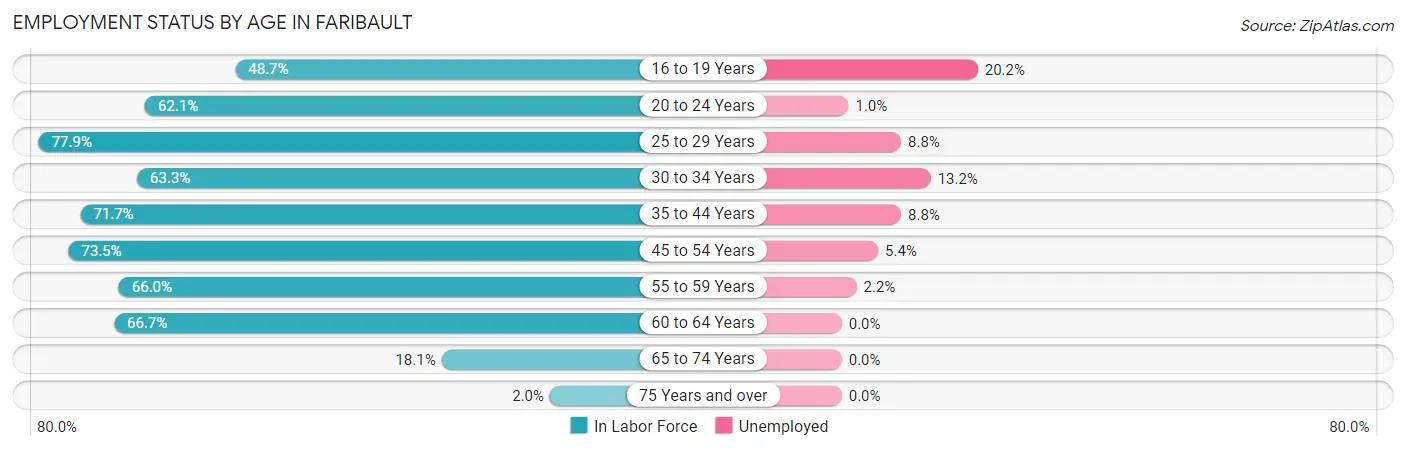
| Age Bracket | In Labor Force | Unemployed |
| 16 to 19 Years | 441 (48.7%) | 89 (20.2%) |
| 20 to 24 Years | 1,084 (62.1%) | 11 (1.0%) |
| 25 to 29 Years | 1,403 (77.9%) | 123 (8.8%) |
| 30 to 34 Years | 1,020 (63.3%) | 135 (13.2%) |
| 35 to 44 Years | 2,388 (71.7%) | 210 (8.8%) |
| 45 to 54 Years | 1,952 (73.5%) | 105 (5.4%) |
| 55 to 59 Years | 1,026 (66.0%) | 23 (2.2%) |
| 60 to 64 Years | 1,080 (66.7%) | 0 (0.0%) |
| 65 to 74 Years | 440 (18.1%) | 0 (0.0%) |
| 75 Years and over | 36 (2.0%) | 0 (0.0%) |
| Total | 10,869 (55.8%) | 696 (6.4%) |
Employment Status by Educational Attainment in Faribault
According to labor force statistics for Faribault, 70.6% of individuals (8,877) out of the total population between 25 and 64 years of age (12,573) are in the labor force, with 6.7% or 595 of them being unemployed. The group with the highest labor force participation rate are those with the educational attainment of bachelor's degree or higher, with 91.1% or 1,718 individuals in the labor force. Within the labor force, individuals with high school diploma education have the highest percentage of unemployment, with 10.9% or 324 of them being unemployed.
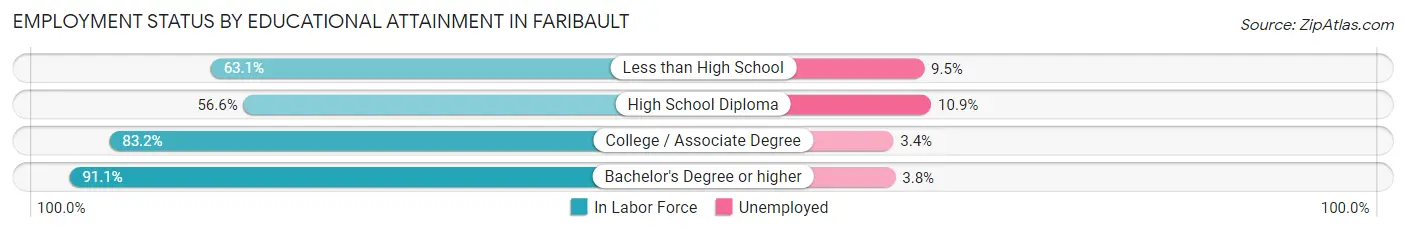
| Educational Attainment | In Labor Force | Unemployed |
| Less than High School | 1,083 (63.1%) | 163 (9.5%) |
| High School Diploma | 2,968 (56.6%) | 572 (10.9%) |
| College / Associate Degree | 3,101 (83.2%) | 127 (3.4%) |
| Bachelor's Degree or higher | 1,718 (91.1%) | 72 (3.8%) |
| Total | 8,877 (70.6%) | 842 (6.7%) |
Employment Occupations by Sex in Faribault
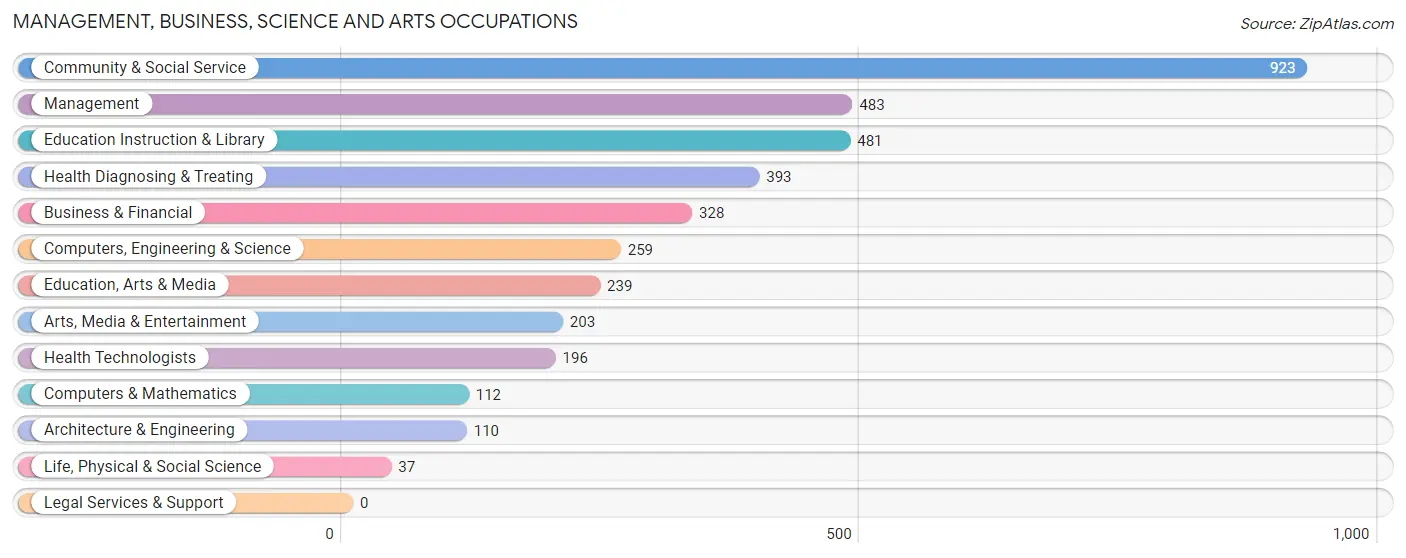
Management, Business, Science and Arts Occupations
The most common Management, Business, Science and Arts occupations in Faribault are Community & Social Service (923 | 9.1%), Management (483 | 4.8%), Education Instruction & Library (481 | 4.7%), Health Diagnosing & Treating (393 | 3.9%), and Business & Financial (328 | 3.2%).
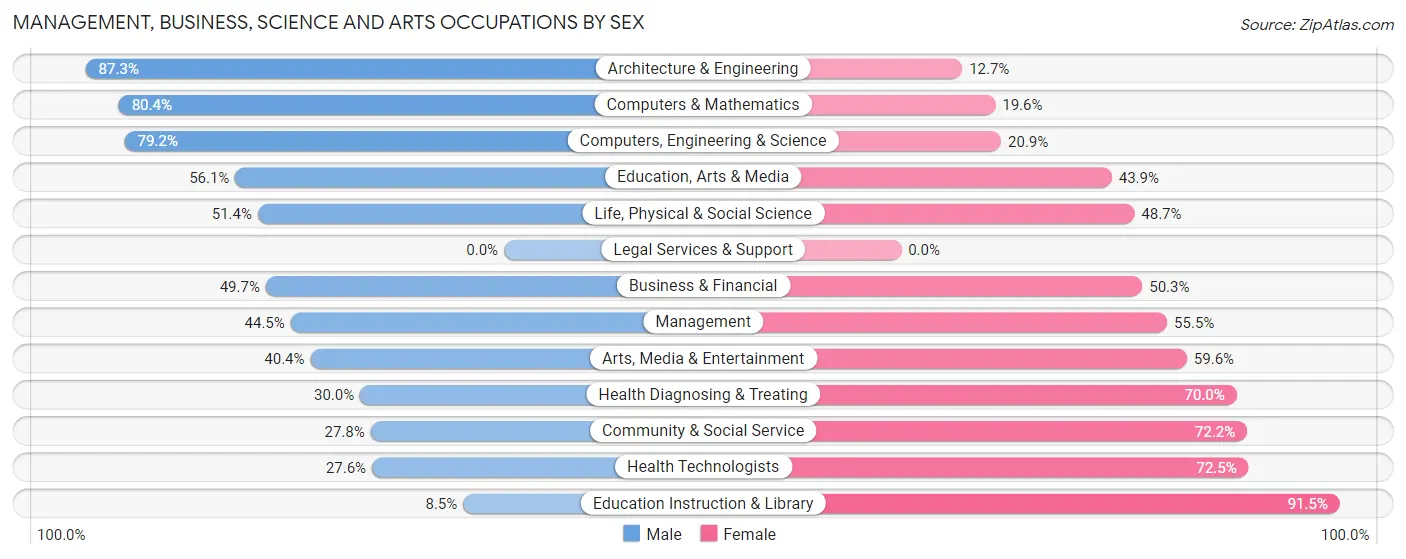
Management, Business, Science and Arts Occupations by Sex
Within the Management, Business, Science and Arts occupations in Faribault, the most male-oriented occupations are Architecture & Engineering (87.3%), Computers & Mathematics (80.4%), and Computers, Engineering & Science (79.1%), while the most female-oriented occupations are Education Instruction & Library (91.5%), Health Technologists (72.5%), and Community & Social Service (72.2%).
| Occupation | Male | Female |
| Management | 215 (44.5%) | 268 (55.5%) |
| Business & Financial | 163 (49.7%) | 165 (50.3%) |
| Computers, Engineering & Science | 205 (79.1%) | 54 (20.8%) |
| Computers & Mathematics | 90 (80.4%) | 22 (19.6%) |
| Architecture & Engineering | 96 (87.3%) | 14 (12.7%) |
| Life, Physical & Social Science | 19 (51.3%) | 18 (48.6%) |
| Community & Social Service | 257 (27.8%) | 666 (72.2%) |
| Education, Arts & Media | 134 (56.1%) | 105 (43.9%) |
| Legal Services & Support | 0 (0.0%) | 0 (0.0%) |
| Education Instruction & Library | 41 (8.5%) | 440 (91.5%) |
| Arts, Media & Entertainment | 82 (40.4%) | 121 (59.6%) |
| Health Diagnosing & Treating | 118 (30.0%) | 275 (70.0%) |
| Health Technologists | 54 (27.6%) | 142 (72.5%) |
| Total (Category) | 958 (40.2%) | 1,428 (59.9%) |
| Total (Overall) | 5,475 (53.9%) | 4,678 (46.1%) |
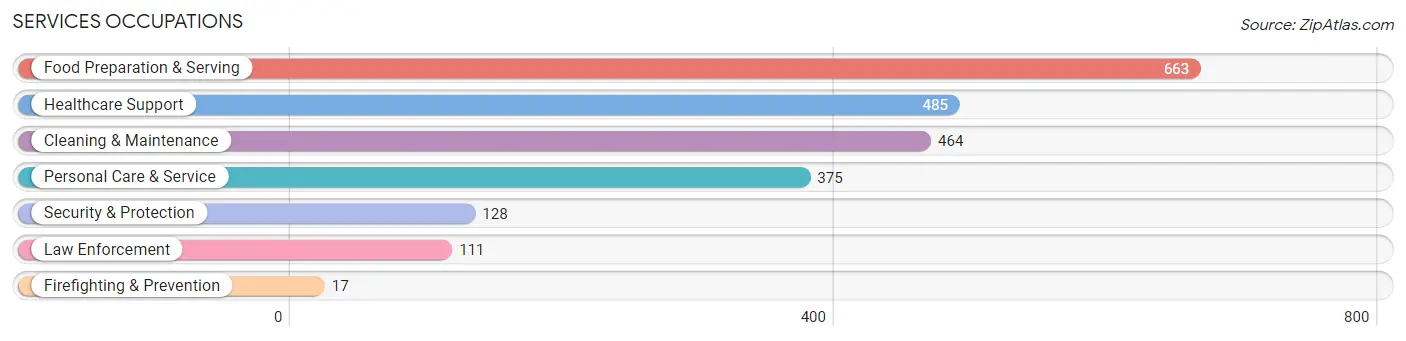
Services Occupations
The most common Services occupations in Faribault are Food Preparation & Serving (663 | 6.5%), Healthcare Support (485 | 4.8%), Cleaning & Maintenance (464 | 4.6%), Personal Care & Service (375 | 3.7%), and Security & Protection (128 | 1.3%).
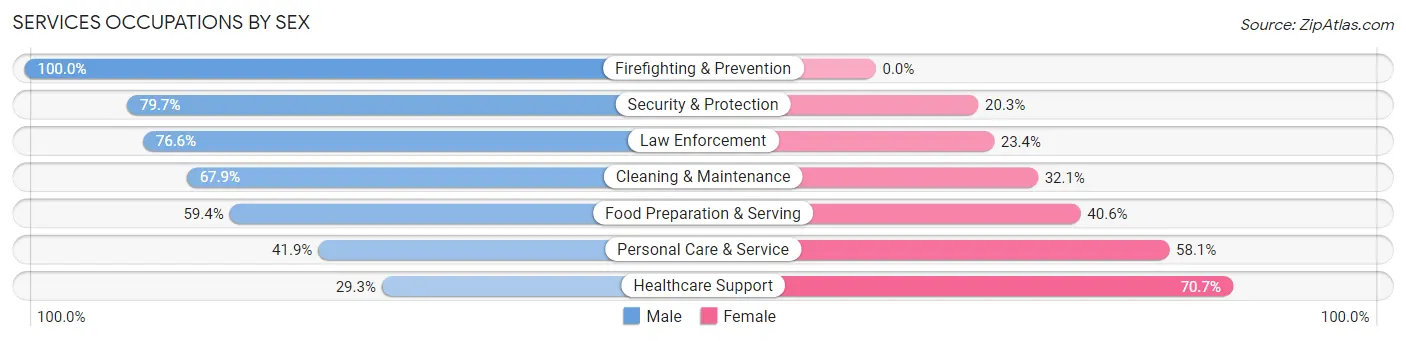
Services Occupations by Sex
Within the Services occupations in Faribault, the most male-oriented occupations are Firefighting & Prevention (100.0%), Security & Protection (79.7%), and Law Enforcement (76.6%), while the most female-oriented occupations are Healthcare Support (70.7%), Personal Care & Service (58.1%), and Food Preparation & Serving (40.6%).
| Occupation | Male | Female |
| Healthcare Support | 142 (29.3%) | 343 (70.7%) |
| Security & Protection | 102 (79.7%) | 26 (20.3%) |
| Firefighting & Prevention | 17 (100.0%) | 0 (0.0%) |
| Law Enforcement | 85 (76.6%) | 26 (23.4%) |
| Food Preparation & Serving | 394 (59.4%) | 269 (40.6%) |
| Cleaning & Maintenance | 315 (67.9%) | 149 (32.1%) |
| Personal Care & Service | 157 (41.9%) | 218 (58.1%) |
| Total (Category) | 1,110 (52.5%) | 1,005 (47.5%) |
| Total (Overall) | 5,475 (53.9%) | 4,678 (46.1%) |
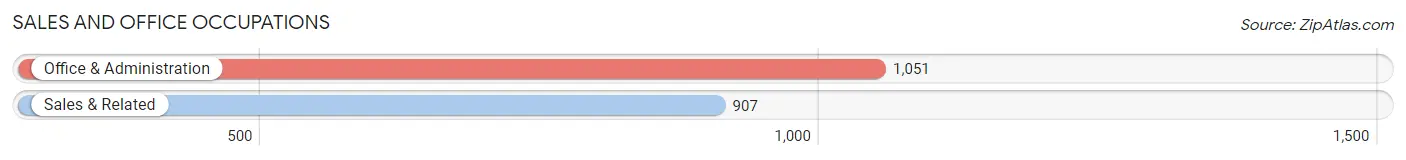
Sales and Office Occupations
The most common Sales and Office occupations in Faribault are Office & Administration (1,051 | 10.3%), and Sales & Related (907 | 8.9%).
Sales and Office Occupations by Sex
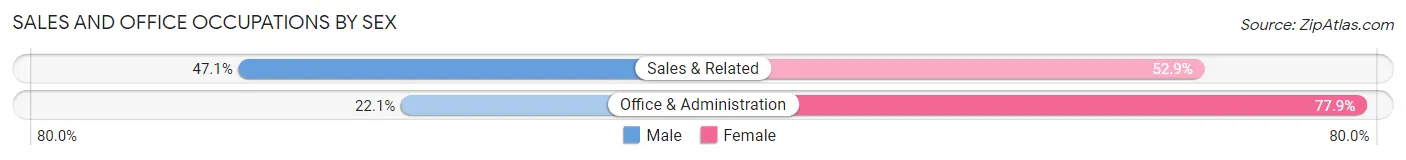
| Occupation | Male | Female |
| Sales & Related | 427 (47.1%) | 480 (52.9%) |
| Office & Administration | 232 (22.1%) | 819 (77.9%) |
| Total (Category) | 659 (33.7%) | 1,299 (66.3%) |
| Total (Overall) | 5,475 (53.9%) | 4,678 (46.1%) |
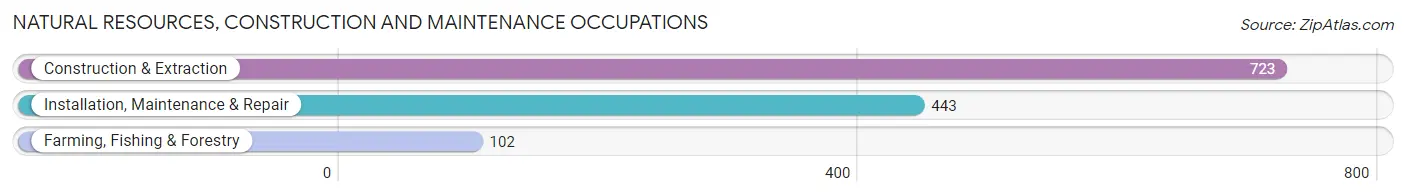
Natural Resources, Construction and Maintenance Occupations
The most common Natural Resources, Construction and Maintenance occupations in Faribault are Construction & Extraction (723 | 7.1%), Installation, Maintenance & Repair (443 | 4.4%), and Farming, Fishing & Forestry (102 | 1.0%).
Natural Resources, Construction and Maintenance Occupations by Sex
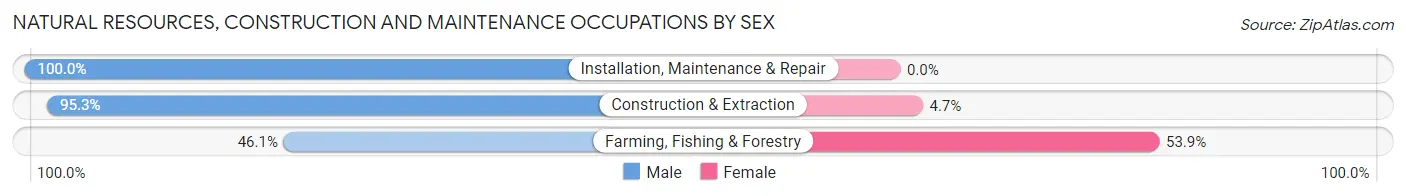
| Occupation | Male | Female |
| Farming, Fishing & Forestry | 47 (46.1%) | 55 (53.9%) |
| Construction & Extraction | 689 (95.3%) | 34 (4.7%) |
| Installation, Maintenance & Repair | 443 (100.0%) | 0 (0.0%) |
| Total (Category) | 1,179 (93.0%) | 89 (7.0%) |
| Total (Overall) | 5,475 (53.9%) | 4,678 (46.1%) |
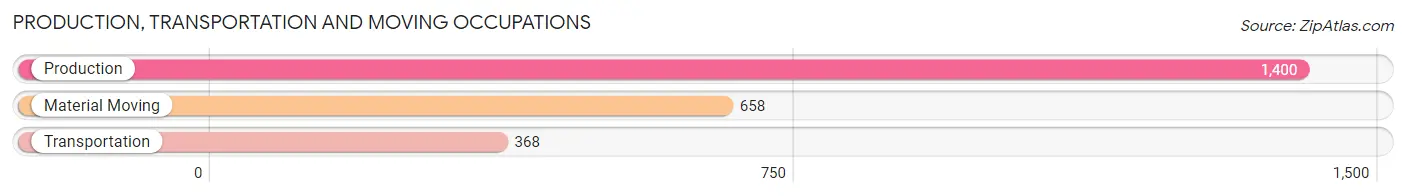
Production, Transportation and Moving Occupations
The most common Production, Transportation and Moving occupations in Faribault are Production (1,400 | 13.8%), Material Moving (658 | 6.5%), and Transportation (368 | 3.6%).
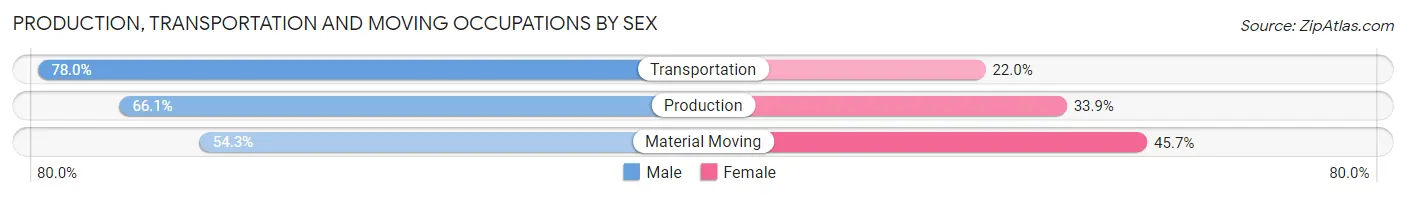
Production, Transportation and Moving Occupations by Sex
| Occupation | Male | Female |
| Production | 925 (66.1%) | 475 (33.9%) |
| Transportation | 287 (78.0%) | 81 (22.0%) |
| Material Moving | 357 (54.3%) | 301 (45.7%) |
| Total (Category) | 1,569 (64.7%) | 857 (35.3%) |
| Total (Overall) | 5,475 (53.9%) | 4,678 (46.1%) |
Employment Industries by Sex in Faribault
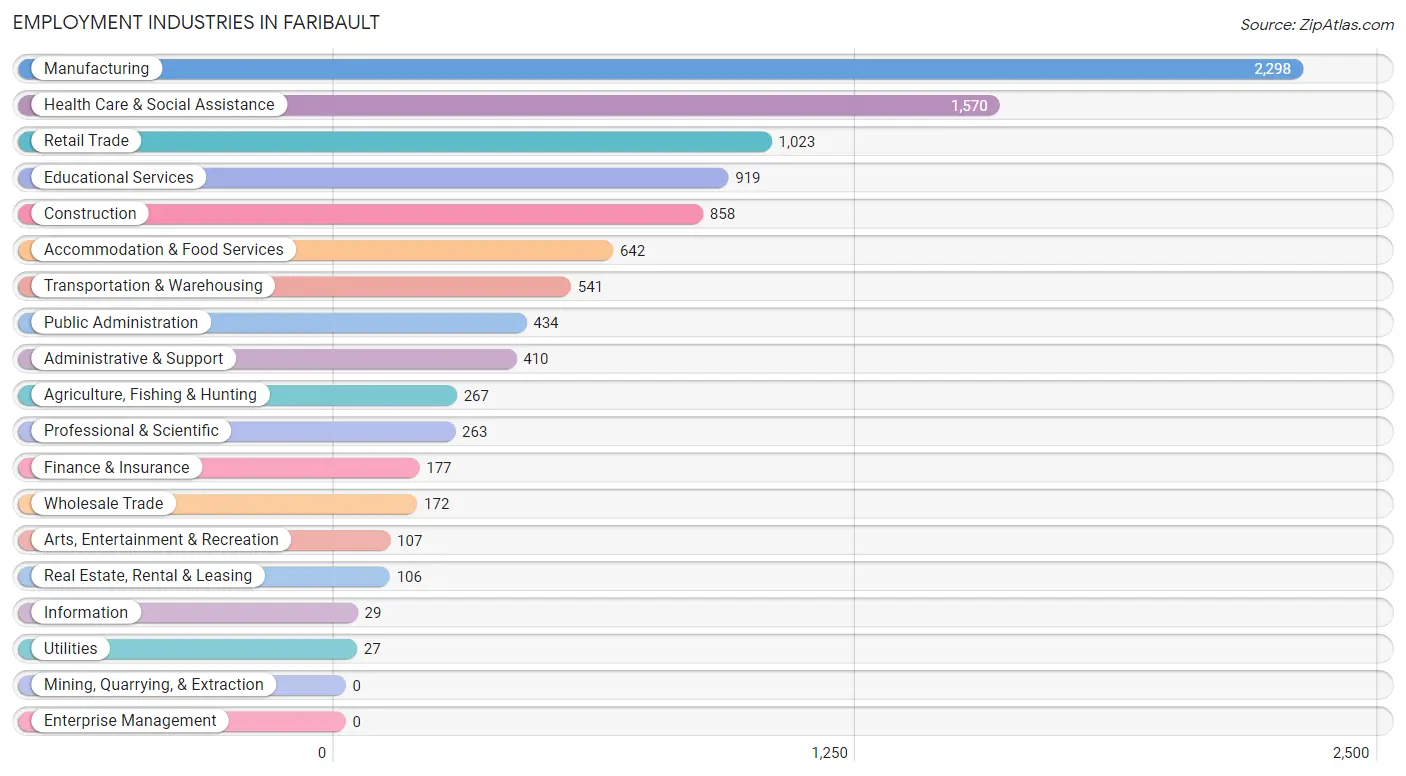
Employment Industries in Faribault
The major employment industries in Faribault include Manufacturing (2,298 | 22.6%), Health Care & Social Assistance (1,570 | 15.5%), Retail Trade (1,023 | 10.1%), Educational Services (919 | 9.0%), and Construction (858 | 8.5%).
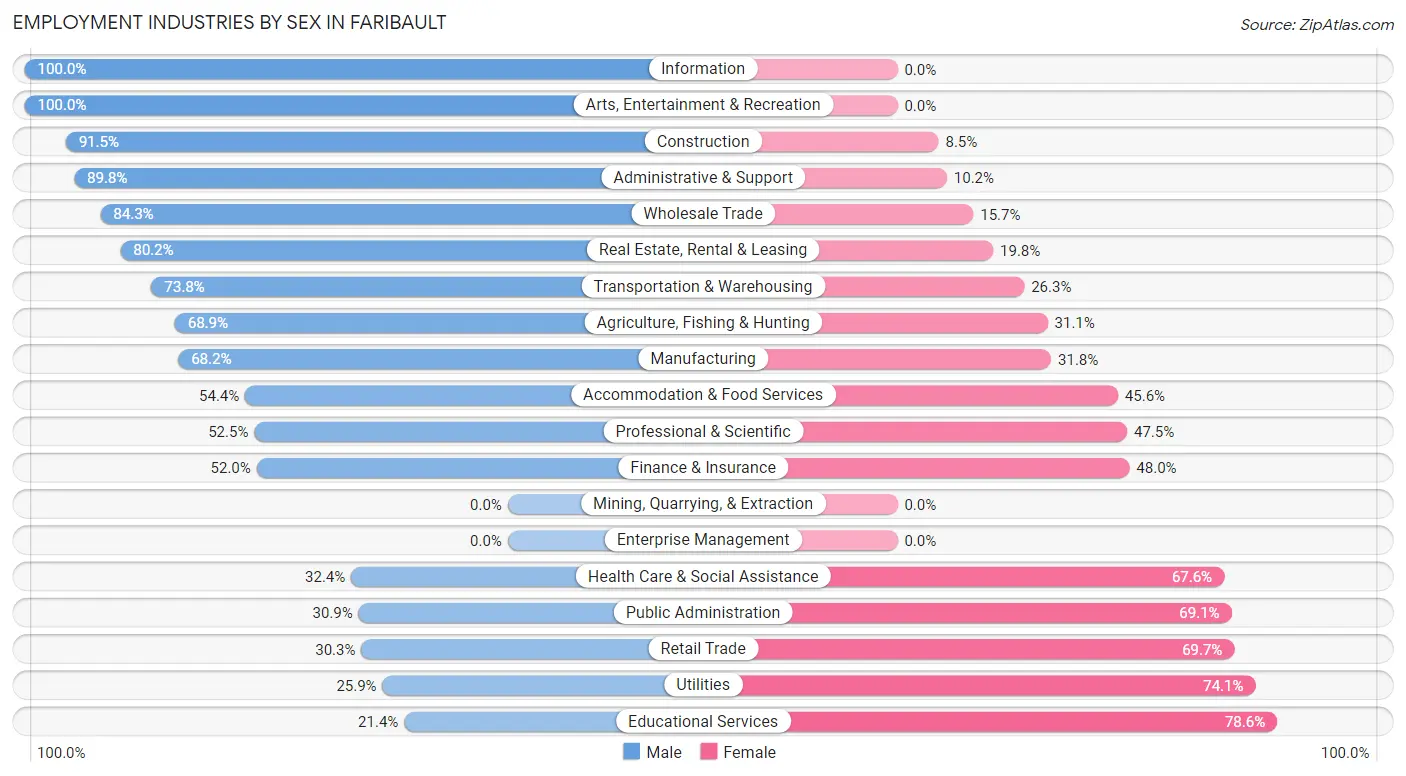
Employment Industries by Sex in Faribault
The Faribault industries that see more men than women are Information (100.0%), Arts, Entertainment & Recreation (100.0%), and Construction (91.5%), whereas the industries that tend to have a higher number of women are Educational Services (78.6%), Utilities (74.1%), and Retail Trade (69.7%).
| Industry | Male | Female |
| Agriculture, Fishing & Hunting | 184 (68.9%) | 83 (31.1%) |
| Mining, Quarrying, & Extraction | 0 (0.0%) | 0 (0.0%) |
| Construction | 785 (91.5%) | 73 (8.5%) |
| Manufacturing | 1,567 (68.2%) | 731 (31.8%) |
| Wholesale Trade | 145 (84.3%) | 27 (15.7%) |
| Retail Trade | 310 (30.3%) | 713 (69.7%) |
| Transportation & Warehousing | 399 (73.8%) | 142 (26.3%) |
| Utilities | 7 (25.9%) | 20 (74.1%) |
| Information | 29 (100.0%) | 0 (0.0%) |
| Finance & Insurance | 92 (52.0%) | 85 (48.0%) |
| Real Estate, Rental & Leasing | 85 (80.2%) | 21 (19.8%) |
| Professional & Scientific | 138 (52.5%) | 125 (47.5%) |
| Enterprise Management | 0 (0.0%) | 0 (0.0%) |
| Administrative & Support | 368 (89.8%) | 42 (10.2%) |
| Educational Services | 197 (21.4%) | 722 (78.6%) |
| Health Care & Social Assistance | 509 (32.4%) | 1,061 (67.6%) |
| Arts, Entertainment & Recreation | 107 (100.0%) | 0 (0.0%) |
| Accommodation & Food Services | 349 (54.4%) | 293 (45.6%) |
| Public Administration | 134 (30.9%) | 300 (69.1%) |
| Total | 5,475 (53.9%) | 4,678 (46.1%) |
Education in Faribault
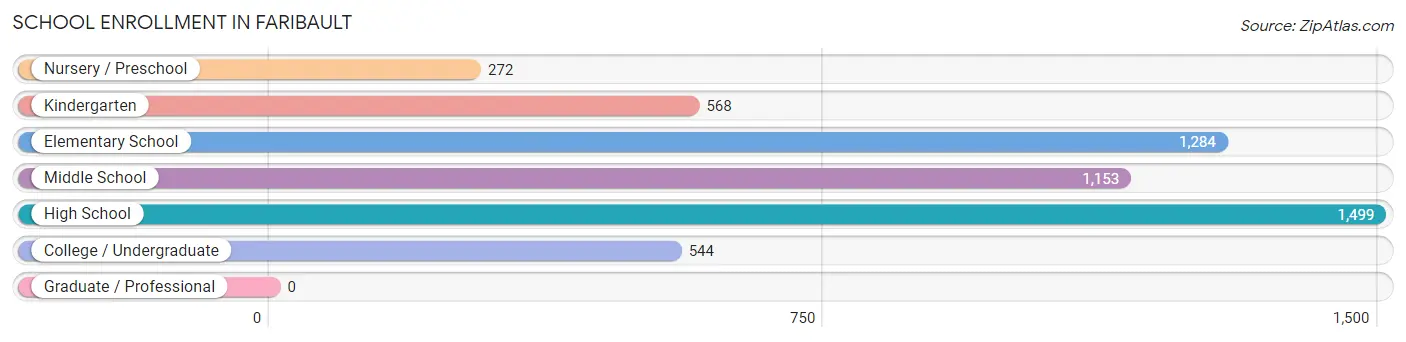
School Enrollment in Faribault
The most common levels of schooling among the 5,320 students in Faribault are high school (1,499 | 28.2%), elementary school (1,284 | 24.1%), and middle school (1,153 | 21.7%).
| School Level | # Students | % Students |
| Nursery / Preschool | 272 | 5.1% |
| Kindergarten | 568 | 10.7% |
| Elementary School | 1,284 | 24.1% |
| Middle School | 1,153 | 21.7% |
| High School | 1,499 | 28.2% |
| College / Undergraduate | 544 | 10.2% |
| Graduate / Professional | 0 | 0.0% |
| Total | 5,320 | 100.0% |
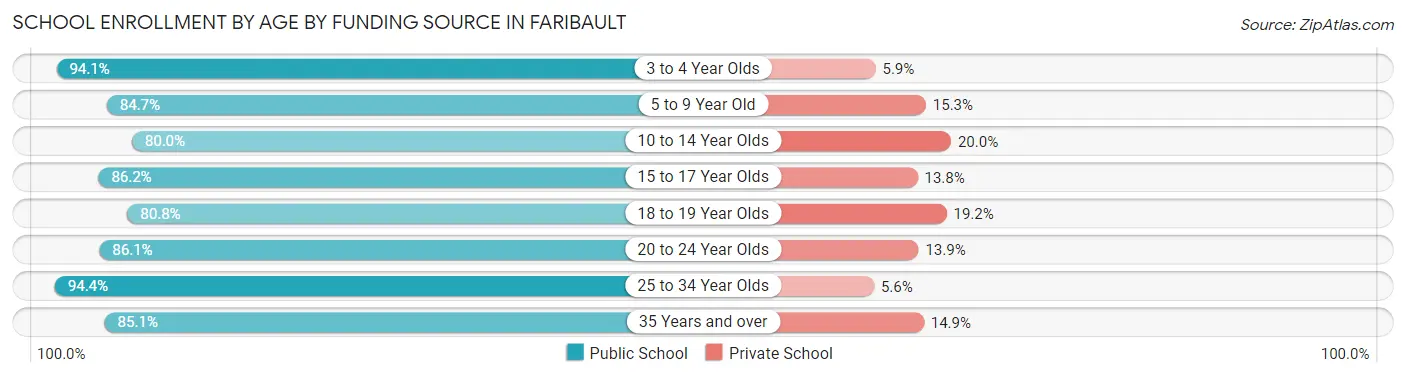
School Enrollment by Age by Funding Source in Faribault
Out of a total of 5,320 students who are enrolled in schools in Faribault, 825 (15.5%) attend a private institution, while the remaining 4,495 (84.5%) are enrolled in public schools. The age group of 10 to 14 year olds has the highest likelihood of being enrolled in private schools, with 296 (20.0% in the age bracket) enrolled. Conversely, the age group of 25 to 34 year olds has the lowest likelihood of being enrolled in a private school, with 184 (94.4% in the age bracket) attending a public institution.
| Age Bracket | Public School | Private School |
| 3 to 4 Year Olds | 269 (94.1%) | 17 (5.9%) |
| 5 to 9 Year Old | 1,344 (84.7%) | 243 (15.3%) |
| 10 to 14 Year Olds | 1,185 (80.0%) | 296 (20.0%) |
| 15 to 17 Year Olds | 865 (86.2%) | 138 (13.8%) |
| 18 to 19 Year Olds | 173 (80.8%) | 41 (19.2%) |
| 20 to 24 Year Olds | 321 (86.1%) | 52 (13.9%) |
| 25 to 34 Year Olds | 184 (94.4%) | 11 (5.6%) |
| 35 Years and over | 154 (85.1%) | 27 (14.9%) |
| Total | 4,495 (84.5%) | 825 (15.5%) |
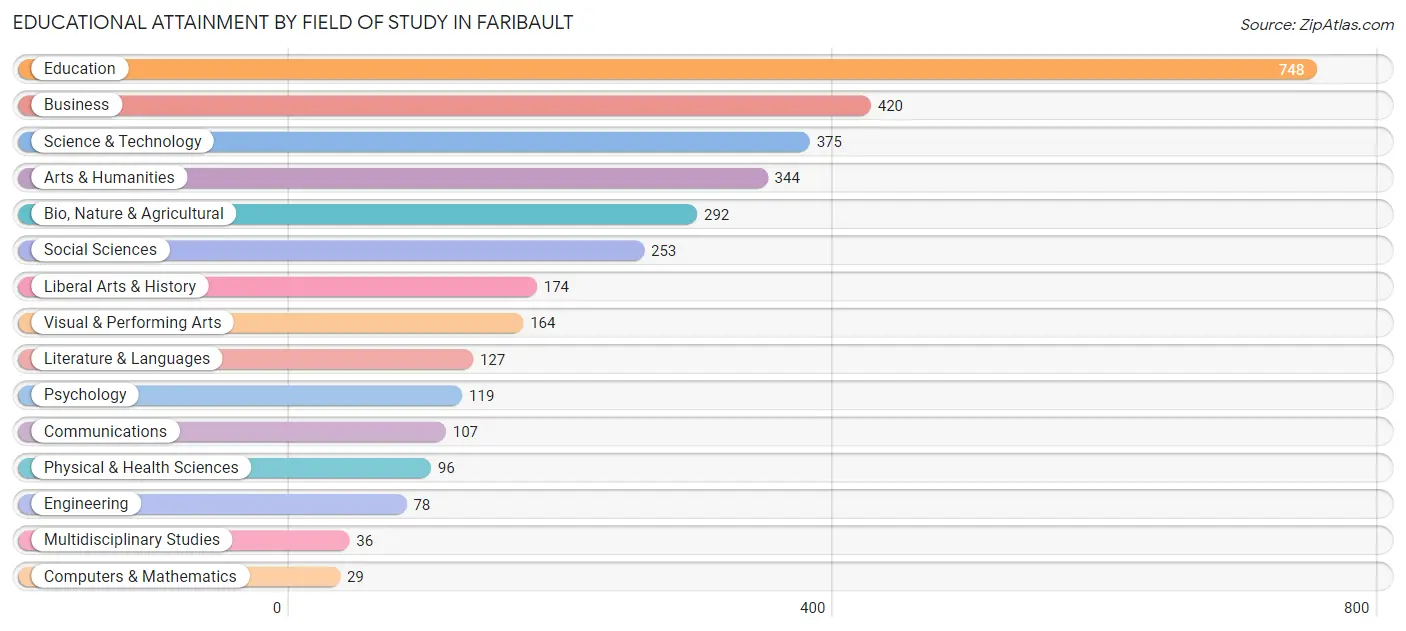
Educational Attainment by Field of Study in Faribault
Education (748 | 22.3%), business (420 | 12.5%), science & technology (375 | 11.2%), arts & humanities (344 | 10.2%), and bio, nature & agricultural (292 | 8.7%) are the most common fields of study among 3,362 individuals in Faribault who have obtained a bachelor's degree or higher.
| Field of Study | # Graduates | % Graduates |
| Computers & Mathematics | 29 | 0.9% |
| Bio, Nature & Agricultural | 292 | 8.7% |
| Physical & Health Sciences | 96 | 2.9% |
| Psychology | 119 | 3.5% |
| Social Sciences | 253 | 7.5% |
| Engineering | 78 | 2.3% |
| Multidisciplinary Studies | 36 | 1.1% |
| Science & Technology | 375 | 11.2% |
| Business | 420 | 12.5% |
| Education | 748 | 22.3% |
| Literature & Languages | 127 | 3.8% |
| Liberal Arts & History | 174 | 5.2% |
| Visual & Performing Arts | 164 | 4.9% |
| Communications | 107 | 3.2% |
| Arts & Humanities | 344 | 10.2% |
| Total | 3,362 | 100.0% |
Transportation & Commute in Faribault
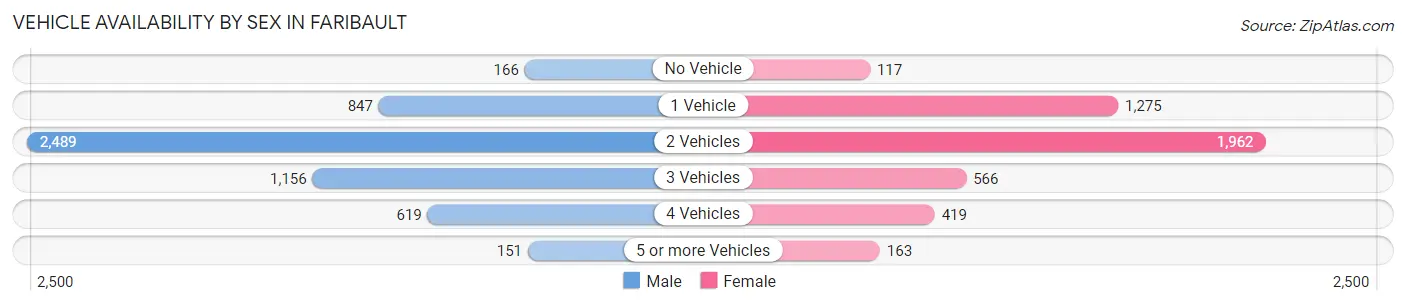
Vehicle Availability by Sex in Faribault
The most prevalent vehicle ownership categories in Faribault are males with 2 vehicles (2,489, accounting for 45.9%) and females with 2 vehicles (1,962, making up 55.3%).
| Vehicles Available | Male | Female |
| No Vehicle | 166 (3.1%) | 117 (2.6%) |
| 1 Vehicle | 847 (15.6%) | 1,275 (28.3%) |
| 2 Vehicles | 2,489 (45.9%) | 1,962 (43.6%) |
| 3 Vehicles | 1,156 (21.3%) | 566 (12.6%) |
| 4 Vehicles | 619 (11.4%) | 419 (9.3%) |
| 5 or more Vehicles | 151 (2.8%) | 163 (3.6%) |
| Total | 5,428 (100.0%) | 4,502 (100.0%) |
Commute Time in Faribault
The most frequently occuring commute durations in Faribault are 5 to 9 minutes (2,361 commuters, 24.7%), 10 to 14 minutes (2,224 commuters, 23.3%), and 20 to 24 minutes (1,200 commuters, 12.6%).
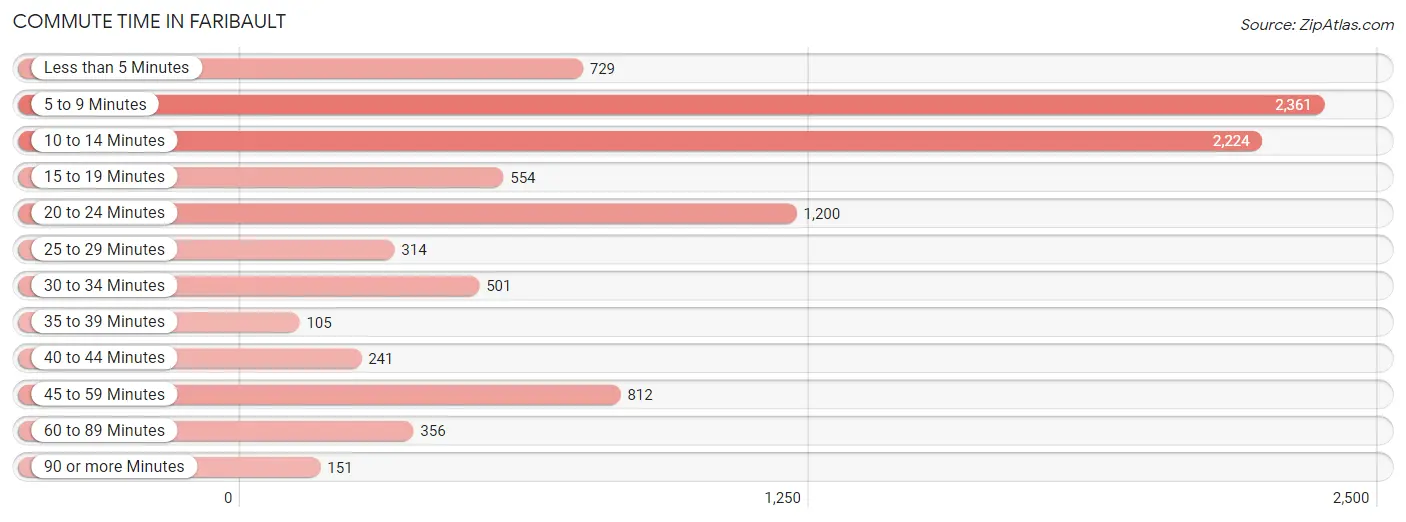
| Commute Time | # Commuters | % Commuters |
| Less than 5 Minutes | 729 | 7.6% |
| 5 to 9 Minutes | 2,361 | 24.7% |
| 10 to 14 Minutes | 2,224 | 23.3% |
| 15 to 19 Minutes | 554 | 5.8% |
| 20 to 24 Minutes | 1,200 | 12.6% |
| 25 to 29 Minutes | 314 | 3.3% |
| 30 to 34 Minutes | 501 | 5.2% |
| 35 to 39 Minutes | 105 | 1.1% |
| 40 to 44 Minutes | 241 | 2.5% |
| 45 to 59 Minutes | 812 | 8.5% |
| 60 to 89 Minutes | 356 | 3.7% |
| 90 or more Minutes | 151 | 1.6% |
Commute Time by Sex in Faribault
The most common commute times in Faribault are 10 to 14 minutes (1,331 commuters, 25.7%) for males and 5 to 9 minutes (1,454 commuters, 33.4%) for females.
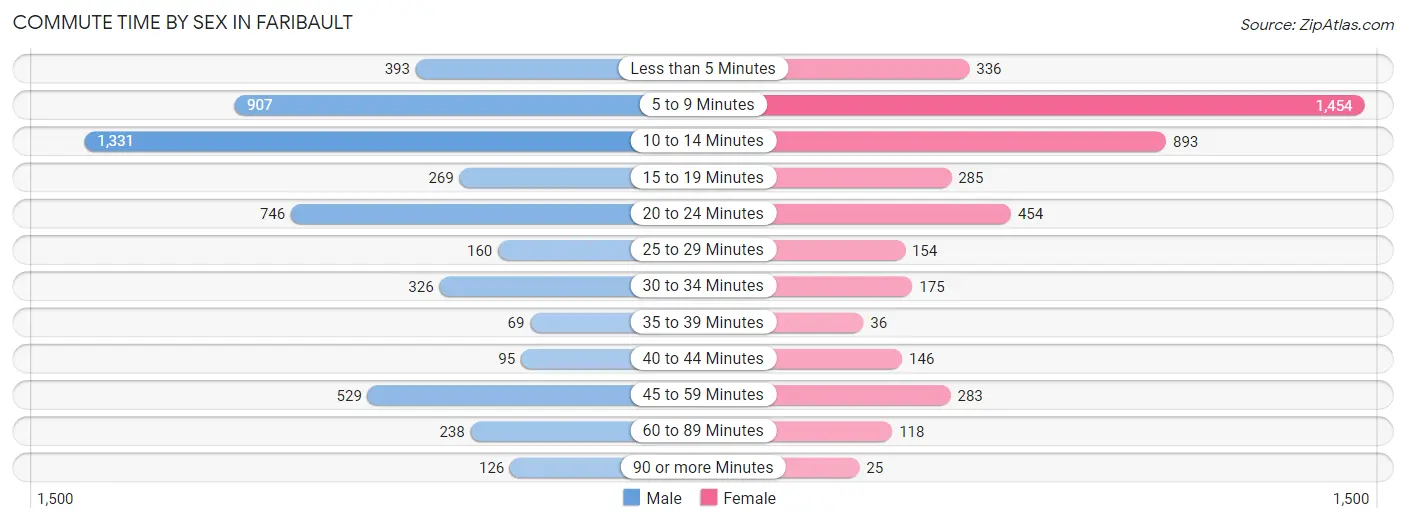
| Commute Time | Male | Female |
| Less than 5 Minutes | 393 (7.6%) | 336 (7.7%) |
| 5 to 9 Minutes | 907 (17.5%) | 1,454 (33.4%) |
| 10 to 14 Minutes | 1,331 (25.7%) | 893 (20.5%) |
| 15 to 19 Minutes | 269 (5.2%) | 285 (6.5%) |
| 20 to 24 Minutes | 746 (14.4%) | 454 (10.4%) |
| 25 to 29 Minutes | 160 (3.1%) | 154 (3.5%) |
| 30 to 34 Minutes | 326 (6.3%) | 175 (4.0%) |
| 35 to 39 Minutes | 69 (1.3%) | 36 (0.8%) |
| 40 to 44 Minutes | 95 (1.8%) | 146 (3.4%) |
| 45 to 59 Minutes | 529 (10.2%) | 283 (6.5%) |
| 60 to 89 Minutes | 238 (4.6%) | 118 (2.7%) |
| 90 or more Minutes | 126 (2.4%) | 25 (0.6%) |
Time of Departure to Work by Sex in Faribault
The most frequent times of departure to work in Faribault are 4:00 PM to 11:59 PM (850, 16.4%) for males and 7:00 AM to 7:29 AM (704, 16.2%) for females.
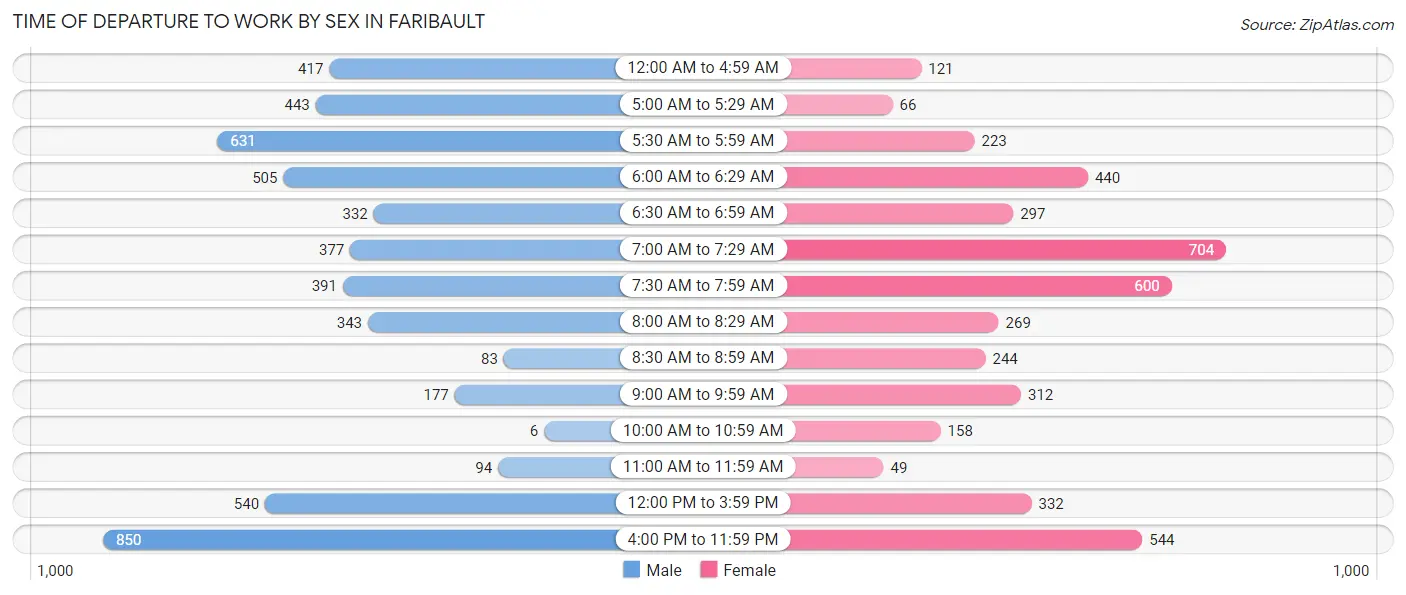
| Time of Departure | Male | Female |
| 12:00 AM to 4:59 AM | 417 (8.0%) | 121 (2.8%) |
| 5:00 AM to 5:29 AM | 443 (8.5%) | 66 (1.5%) |
| 5:30 AM to 5:59 AM | 631 (12.2%) | 223 (5.1%) |
| 6:00 AM to 6:29 AM | 505 (9.7%) | 440 (10.1%) |
| 6:30 AM to 6:59 AM | 332 (6.4%) | 297 (6.8%) |
| 7:00 AM to 7:29 AM | 377 (7.3%) | 704 (16.2%) |
| 7:30 AM to 7:59 AM | 391 (7.5%) | 600 (13.8%) |
| 8:00 AM to 8:29 AM | 343 (6.6%) | 269 (6.2%) |
| 8:30 AM to 8:59 AM | 83 (1.6%) | 244 (5.6%) |
| 9:00 AM to 9:59 AM | 177 (3.4%) | 312 (7.2%) |
| 10:00 AM to 10:59 AM | 6 (0.1%) | 158 (3.6%) |
| 11:00 AM to 11:59 AM | 94 (1.8%) | 49 (1.1%) |
| 12:00 PM to 3:59 PM | 540 (10.4%) | 332 (7.6%) |
| 4:00 PM to 11:59 PM | 850 (16.4%) | 544 (12.5%) |
| Total | 5,189 (100.0%) | 4,359 (100.0%) |
Housing Occupancy in Faribault
Occupancy by Ownership in Faribault
Of the total 8,853 dwellings in Faribault, owner-occupied units account for 5,680 (64.2%), while renter-occupied units make up 3,173 (35.8%).
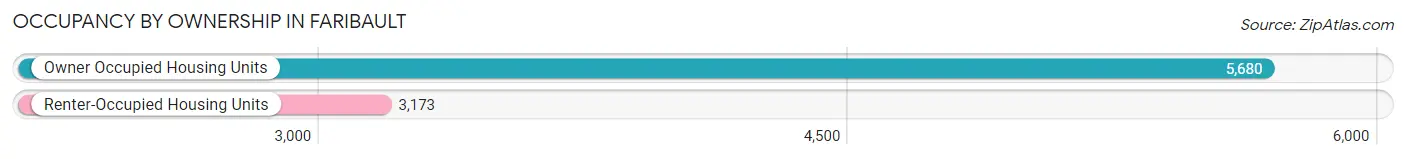
| Occupancy | # Housing Units | % Housing Units |
| Owner Occupied Housing Units | 5,680 | 64.2% |
| Renter-Occupied Housing Units | 3,173 | 35.8% |
| Total Occupied Housing Units | 8,853 | 100.0% |
Occupancy by Household Size in Faribault
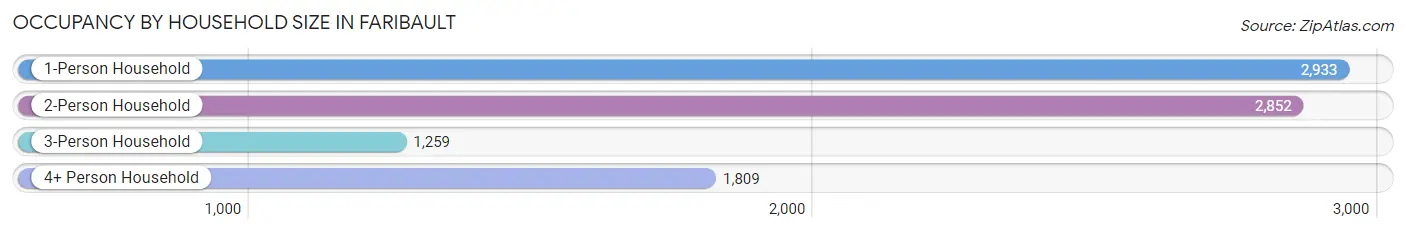
| Household Size | # Housing Units | % Housing Units |
| 1-Person Household | 2,933 | 33.1% |
| 2-Person Household | 2,852 | 32.2% |
| 3-Person Household | 1,259 | 14.2% |
| 4+ Person Household | 1,809 | 20.4% |
| Total Housing Units | 8,853 | 100.0% |
Occupancy by Ownership by Household Size in Faribault
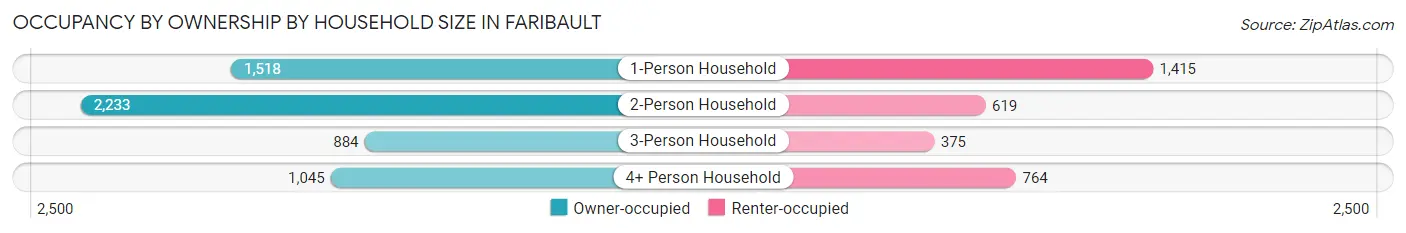
| Household Size | Owner-occupied | Renter-occupied |
| 1-Person Household | 1,518 (51.8%) | 1,415 (48.2%) |
| 2-Person Household | 2,233 (78.3%) | 619 (21.7%) |
| 3-Person Household | 884 (70.2%) | 375 (29.8%) |
| 4+ Person Household | 1,045 (57.8%) | 764 (42.2%) |
| Total Housing Units | 5,680 (64.2%) | 3,173 (35.8%) |
Occupancy by Educational Attainment in Faribault
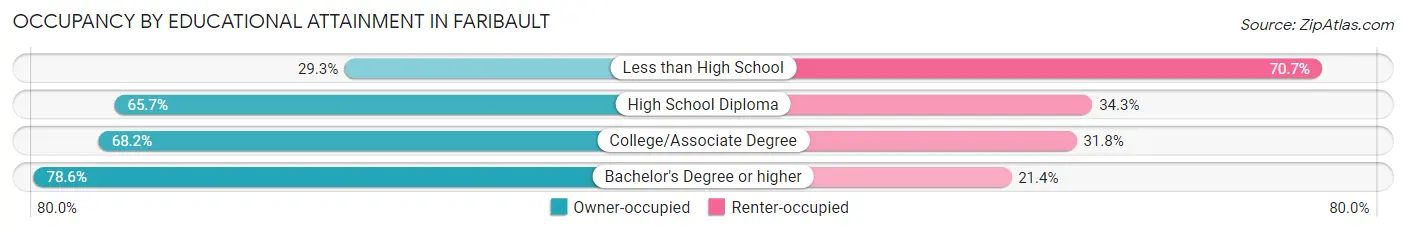
| Household Size | Owner-occupied | Renter-occupied |
| Less than High School | 360 (29.3%) | 867 (70.7%) |
| High School Diploma | 1,962 (65.7%) | 1,023 (34.3%) |
| College/Associate Degree | 1,905 (68.2%) | 887 (31.8%) |
| Bachelor's Degree or higher | 1,453 (78.6%) | 396 (21.4%) |
Occupancy by Age of Householder in Faribault
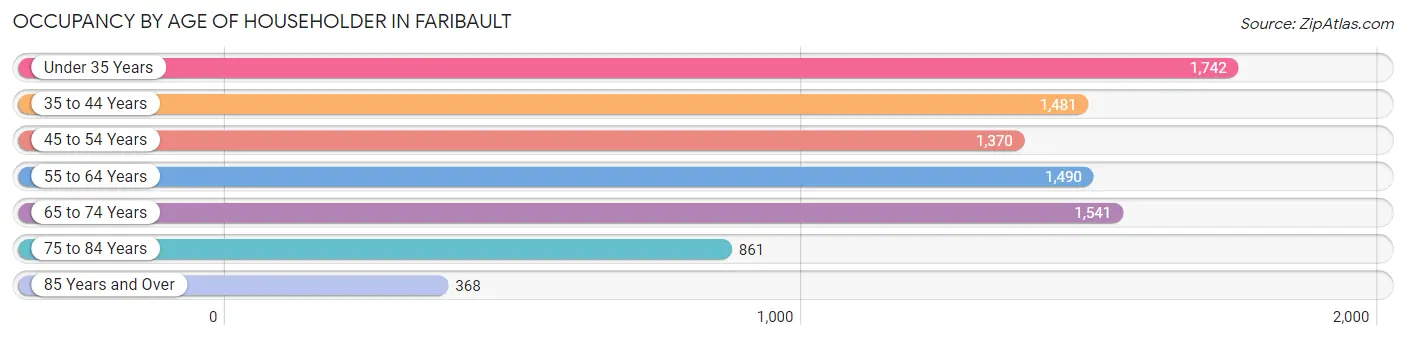
| Age Bracket | # Households | % Households |
| Under 35 Years | 1,742 | 19.7% |
| 35 to 44 Years | 1,481 | 16.7% |
| 45 to 54 Years | 1,370 | 15.5% |
| 55 to 64 Years | 1,490 | 16.8% |
| 65 to 74 Years | 1,541 | 17.4% |
| 75 to 84 Years | 861 | 9.7% |
| 85 Years and Over | 368 | 4.2% |
| Total | 8,853 | 100.0% |
Housing Finances in Faribault
Median Income by Occupancy in Faribault
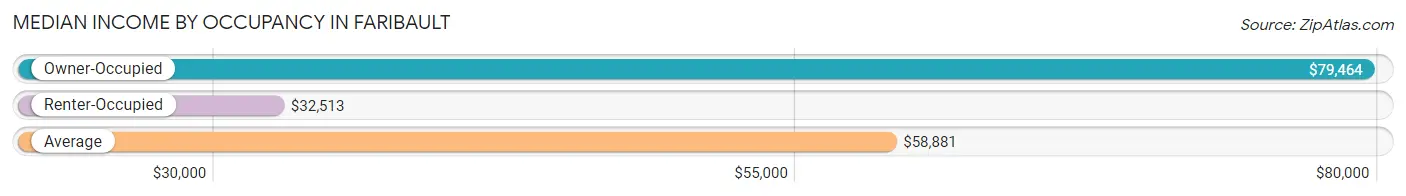
| Occupancy Type | # Households | Median Income |
| Owner-Occupied | 5,680 (64.2%) | $79,464 |
| Renter-Occupied | 3,173 (35.8%) | $32,513 |
| Average | 8,853 (100.0%) | $58,881 |
Occupancy by Householder Income Bracket in Faribault
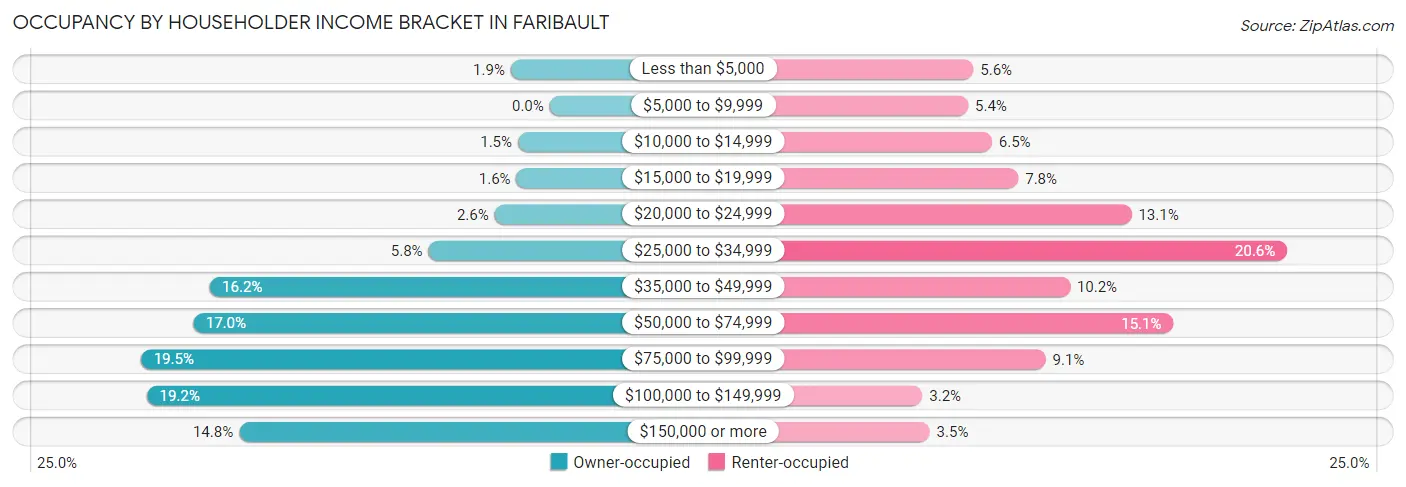
| Income Bracket | Owner-occupied | Renter-occupied |
| Less than $5,000 | 105 (1.8%) | 178 (5.6%) |
| $5,000 to $9,999 | 0 (0.0%) | 170 (5.4%) |
| $10,000 to $14,999 | 86 (1.5%) | 206 (6.5%) |
| $15,000 to $19,999 | 90 (1.6%) | 246 (7.7%) |
| $20,000 to $24,999 | 149 (2.6%) | 417 (13.1%) |
| $25,000 to $34,999 | 328 (5.8%) | 652 (20.5%) |
| $35,000 to $49,999 | 921 (16.2%) | 324 (10.2%) |
| $50,000 to $74,999 | 965 (17.0%) | 480 (15.1%) |
| $75,000 to $99,999 | 1,106 (19.5%) | 287 (9.0%) |
| $100,000 to $149,999 | 1,090 (19.2%) | 101 (3.2%) |
| $150,000 or more | 840 (14.8%) | 112 (3.5%) |
| Total | 5,680 (100.0%) | 3,173 (100.0%) |
Monthly Housing Cost Tiers in Faribault
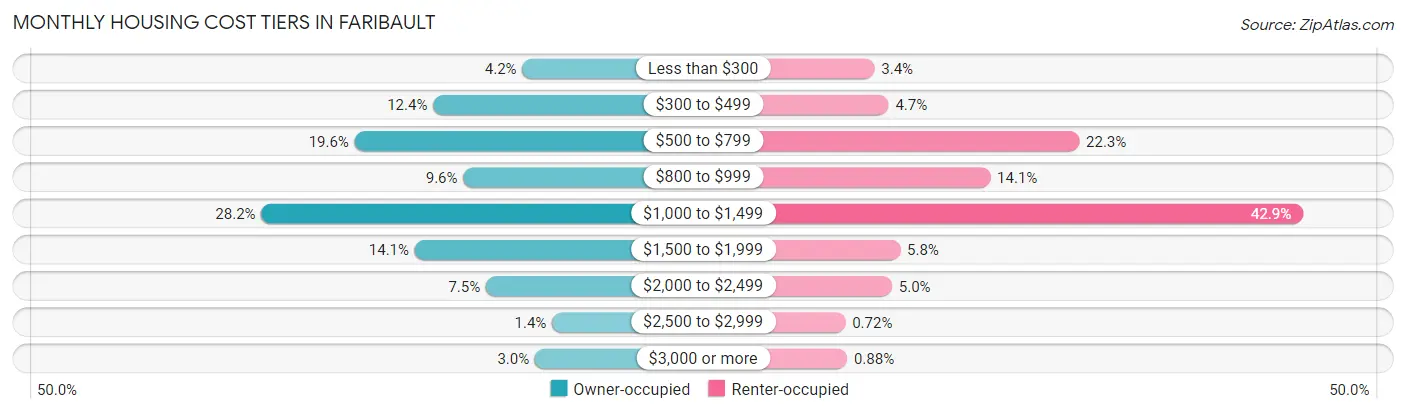
| Monthly Cost | Owner-occupied | Renter-occupied |
| Less than $300 | 237 (4.2%) | 108 (3.4%) |
| $300 to $499 | 703 (12.4%) | 149 (4.7%) |
| $500 to $799 | 1,114 (19.6%) | 706 (22.3%) |
| $800 to $999 | 546 (9.6%) | 446 (14.1%) |
| $1,000 to $1,499 | 1,602 (28.2%) | 1,360 (42.9%) |
| $1,500 to $1,999 | 799 (14.1%) | 183 (5.8%) |
| $2,000 to $2,499 | 427 (7.5%) | 159 (5.0%) |
| $2,500 to $2,999 | 81 (1.4%) | 23 (0.7%) |
| $3,000 or more | 171 (3.0%) | 28 (0.9%) |
| Total | 5,680 (100.0%) | 3,173 (100.0%) |
Physical Housing Characteristics in Faribault
Housing Structures in Faribault
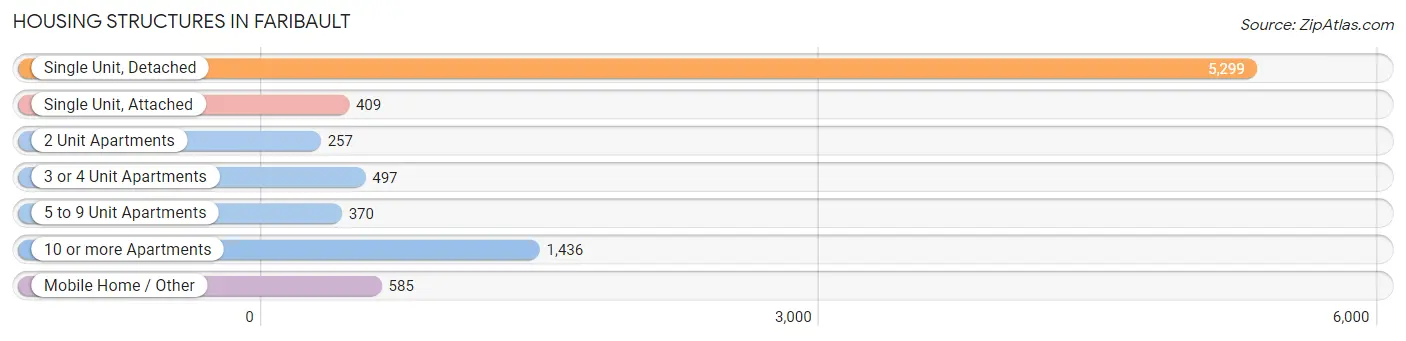
| Structure Type | # Housing Units | % Housing Units |
| Single Unit, Detached | 5,299 | 59.9% |
| Single Unit, Attached | 409 | 4.6% |
| 2 Unit Apartments | 257 | 2.9% |
| 3 or 4 Unit Apartments | 497 | 5.6% |
| 5 to 9 Unit Apartments | 370 | 4.2% |
| 10 or more Apartments | 1,436 | 16.2% |
| Mobile Home / Other | 585 | 6.6% |
| Total | 8,853 | 100.0% |
Housing Structures by Occupancy in Faribault
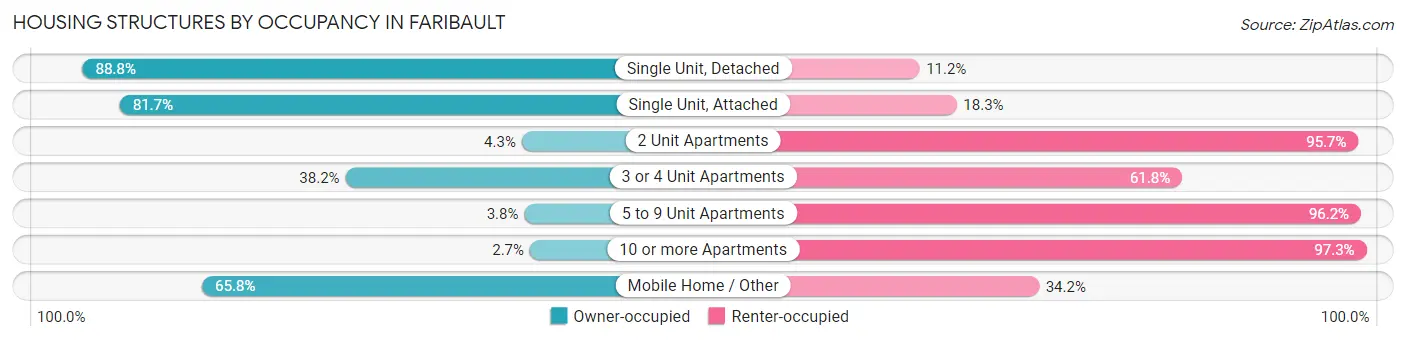
| Structure Type | Owner-occupied | Renter-occupied |
| Single Unit, Detached | 4,707 (88.8%) | 592 (11.2%) |
| Single Unit, Attached | 334 (81.7%) | 75 (18.3%) |
| 2 Unit Apartments | 11 (4.3%) | 246 (95.7%) |
| 3 or 4 Unit Apartments | 190 (38.2%) | 307 (61.8%) |
| 5 to 9 Unit Apartments | 14 (3.8%) | 356 (96.2%) |
| 10 or more Apartments | 39 (2.7%) | 1,397 (97.3%) |
| Mobile Home / Other | 385 (65.8%) | 200 (34.2%) |
| Total | 5,680 (64.2%) | 3,173 (35.8%) |
Housing Structures by Number of Rooms in Faribault
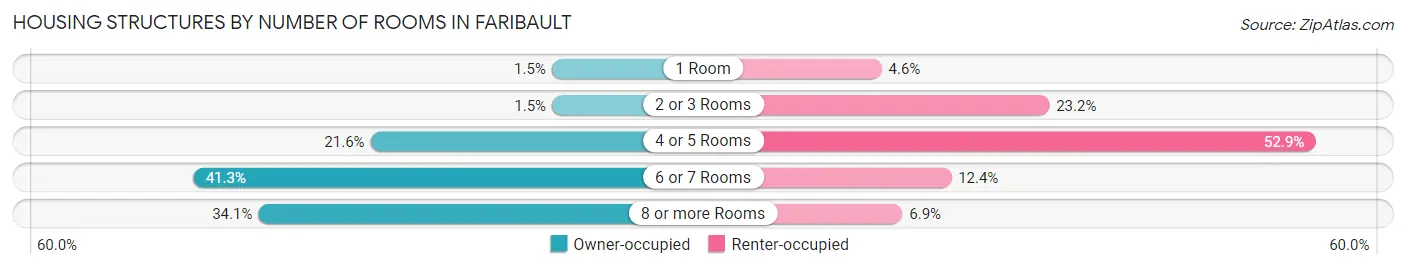
| Number of Rooms | Owner-occupied | Renter-occupied |
| 1 Room | 85 (1.5%) | 147 (4.6%) |
| 2 or 3 Rooms | 84 (1.5%) | 737 (23.2%) |
| 4 or 5 Rooms | 1,228 (21.6%) | 1,677 (52.8%) |
| 6 or 7 Rooms | 2,348 (41.3%) | 392 (12.3%) |
| 8 or more Rooms | 1,935 (34.1%) | 220 (6.9%) |
| Total | 5,680 (100.0%) | 3,173 (100.0%) |
Housing Structure by Heating Type in Faribault
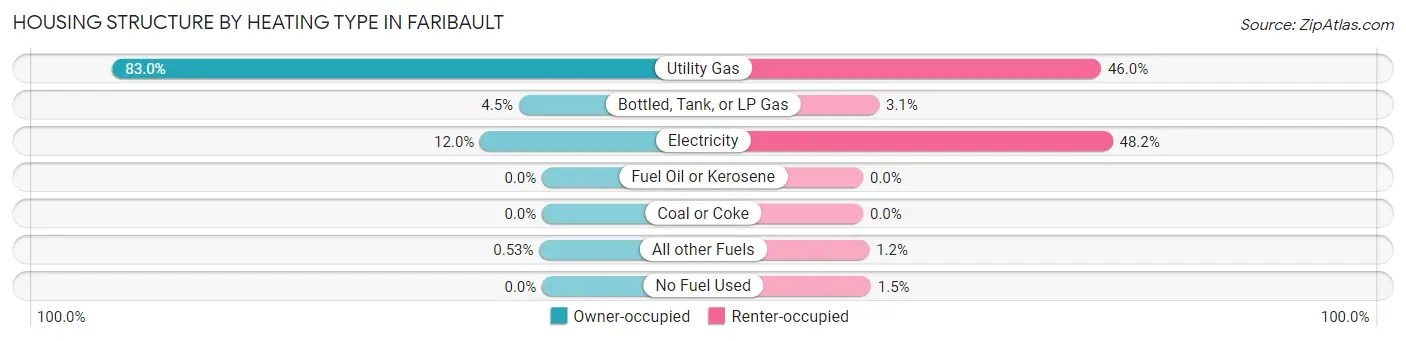
| Heating Type | Owner-occupied | Renter-occupied |
| Utility Gas | 4,716 (83.0%) | 1,459 (46.0%) |
| Bottled, Tank, or LP Gas | 254 (4.5%) | 98 (3.1%) |
| Electricity | 680 (12.0%) | 1,530 (48.2%) |
| Fuel Oil or Kerosene | 0 (0.0%) | 0 (0.0%) |
| Coal or Coke | 0 (0.0%) | 0 (0.0%) |
| All other Fuels | 30 (0.5%) | 38 (1.2%) |
| No Fuel Used | 0 (0.0%) | 48 (1.5%) |
| Total | 5,680 (100.0%) | 3,173 (100.0%) |
Household Vehicle Usage in Faribault
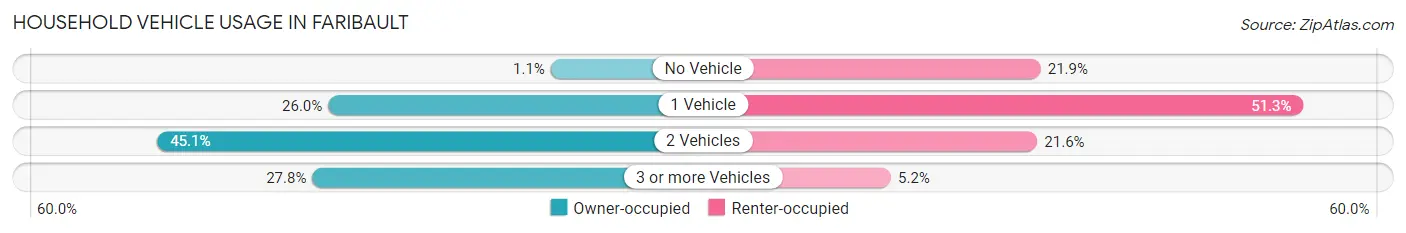
| Vehicles per Household | Owner-occupied | Renter-occupied |
| No Vehicle | 61 (1.1%) | 696 (21.9%) |
| 1 Vehicle | 1,477 (26.0%) | 1,629 (51.3%) |
| 2 Vehicles | 2,564 (45.1%) | 684 (21.6%) |
| 3 or more Vehicles | 1,578 (27.8%) | 164 (5.2%) |
| Total | 5,680 (100.0%) | 3,173 (100.0%) |
Real Estate & Mortgages in Faribault
Real Estate and Mortgage Overview in Faribault
| Characteristic | Without Mortgage | With Mortgage |
| Housing Units | 2,205 | 3,475 |
| Median Property Value | $203,400 | $211,600 |
| Median Household Income | $60,846 | $619 |
| Monthly Housing Costs | $537 | $86 |
| Real Estate Taxes | $2,147 | $39 |
Property Value by Mortgage Status in Faribault
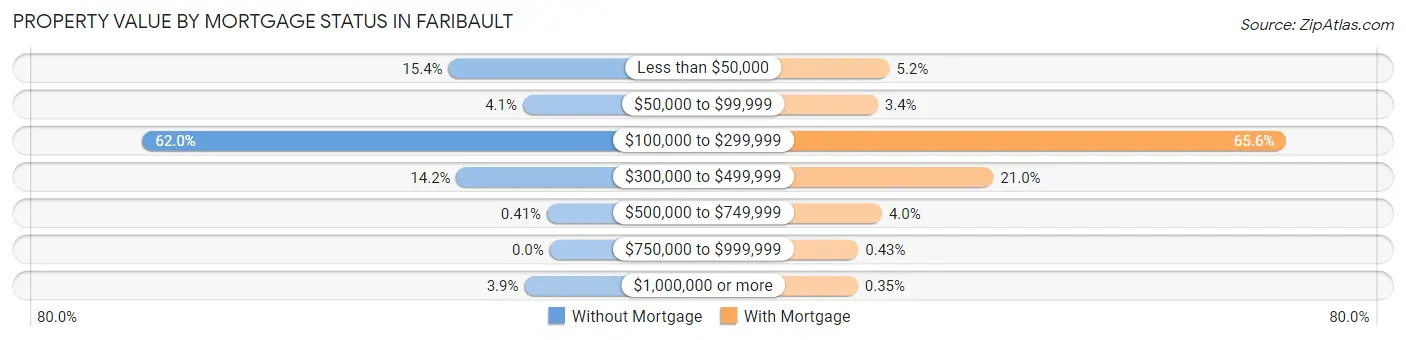
| Property Value | Without Mortgage | With Mortgage |
| Less than $50,000 | 340 (15.4%) | 180 (5.2%) |
| $50,000 to $99,999 | 90 (4.1%) | 118 (3.4%) |
| $100,000 to $299,999 | 1,368 (62.0%) | 2,280 (65.6%) |
| $300,000 to $499,999 | 313 (14.2%) | 730 (21.0%) |
| $500,000 to $749,999 | 9 (0.4%) | 140 (4.0%) |
| $750,000 to $999,999 | 0 (0.0%) | 15 (0.4%) |
| $1,000,000 or more | 85 (3.8%) | 12 (0.4%) |
| Total | 2,205 (100.0%) | 3,475 (100.0%) |
Household Income by Mortgage Status in Faribault
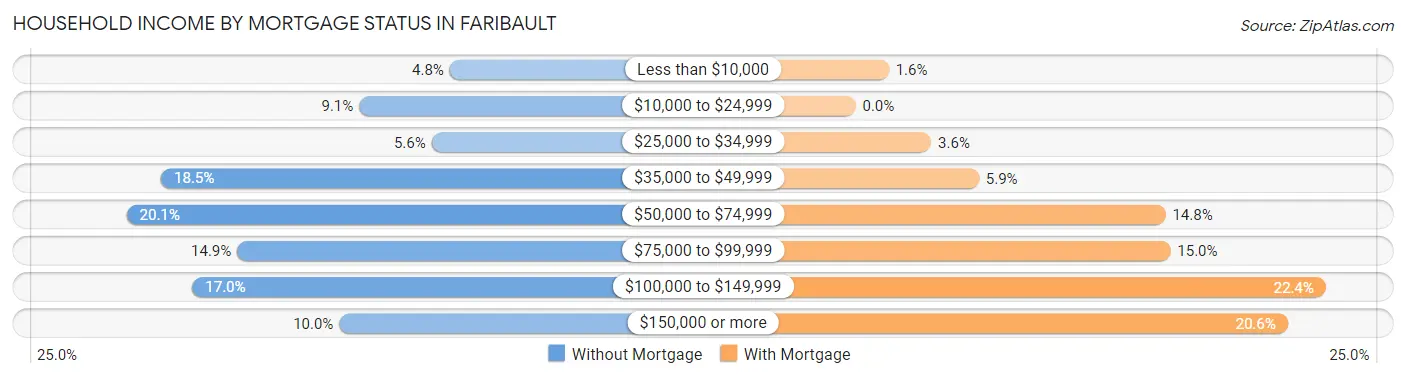
| Household Income | Without Mortgage | With Mortgage |
| Less than $10,000 | 105 (4.8%) | 55 (1.6%) |
| $10,000 to $24,999 | 200 (9.1%) | 0 (0.0%) |
| $25,000 to $34,999 | 124 (5.6%) | 125 (3.6%) |
| $35,000 to $49,999 | 408 (18.5%) | 204 (5.9%) |
| $50,000 to $74,999 | 444 (20.1%) | 513 (14.8%) |
| $75,000 to $99,999 | 328 (14.9%) | 521 (15.0%) |
| $100,000 to $149,999 | 375 (17.0%) | 778 (22.4%) |
| $150,000 or more | 221 (10.0%) | 715 (20.6%) |
| Total | 2,205 (100.0%) | 3,475 (100.0%) |
Property Value to Household Income Ratio in Faribault
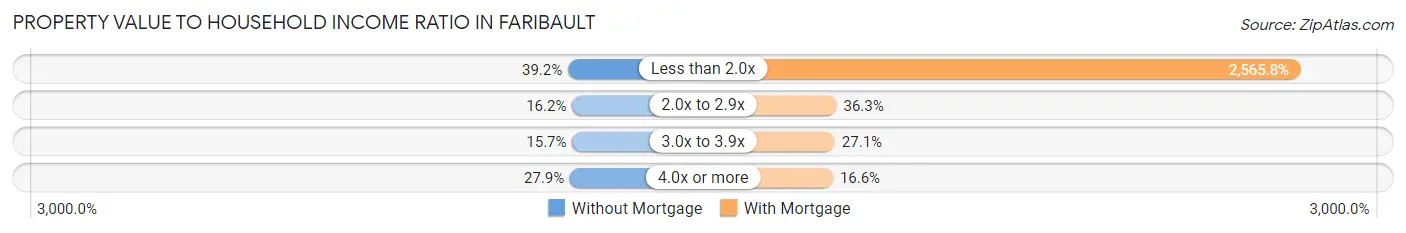
| Value-to-Income Ratio | Without Mortgage | With Mortgage |
| Less than 2.0x | 865 (39.2%) | 89,163 (2,565.8%) |
| 2.0x to 2.9x | 358 (16.2%) | 1,260 (36.3%) |
| 3.0x to 3.9x | 346 (15.7%) | 943 (27.1%) |
| 4.0x or more | 616 (27.9%) | 576 (16.6%) |
| Total | 2,205 (100.0%) | 3,475 (100.0%) |
Real Estate Taxes by Mortgage Status in Faribault
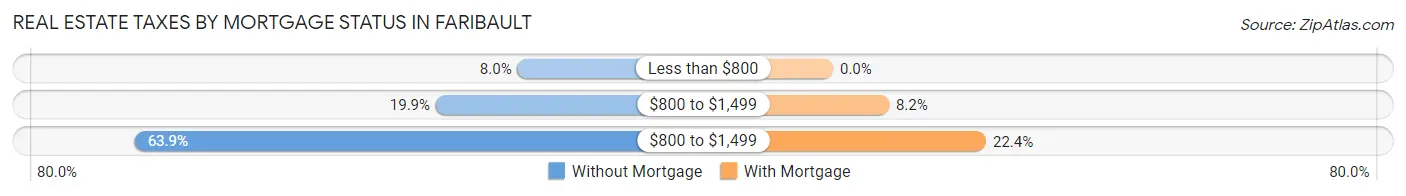
| Property Taxes | Without Mortgage | With Mortgage |
| Less than $800 | 176 (8.0%) | 0 (0.0%) |
| $800 to $1,499 | 439 (19.9%) | 284 (8.2%) |
| $800 to $1,499 | 1,409 (63.9%) | 777 (22.4%) |
| Total | 2,205 (100.0%) | 3,475 (100.0%) |
Health & Disability in Faribault
Health Insurance Coverage by Age in Faribault
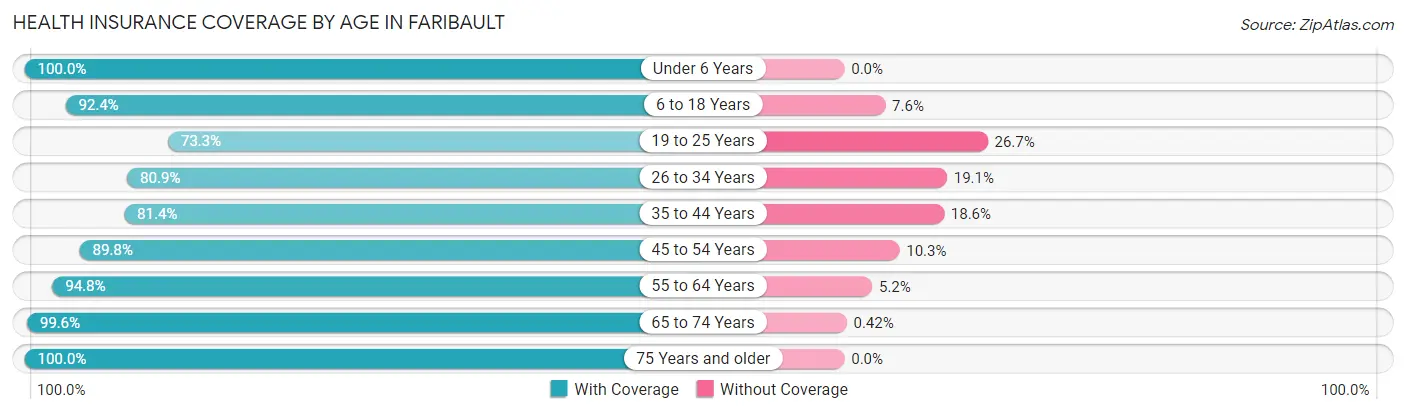
| Age Bracket | With Coverage | Without Coverage |
| Under 6 Years | 1,712 (100.0%) | 0 (0.0%) |
| 6 to 18 Years | 3,770 (92.4%) | 311 (7.6%) |
| 19 to 25 Years | 1,295 (73.3%) | 472 (26.7%) |
| 26 to 34 Years | 2,255 (80.9%) | 533 (19.1%) |
| 35 to 44 Years | 2,245 (81.4%) | 512 (18.6%) |
| 45 to 54 Years | 2,111 (89.7%) | 241 (10.2%) |
| 55 to 64 Years | 2,716 (94.8%) | 148 (5.2%) |
| 65 to 74 Years | 2,352 (99.6%) | 10 (0.4%) |
| 75 Years and older | 1,653 (100.0%) | 0 (0.0%) |
| Total | 20,109 (90.0%) | 2,227 (10.0%) |
Health Insurance Coverage by Citizenship Status in Faribault
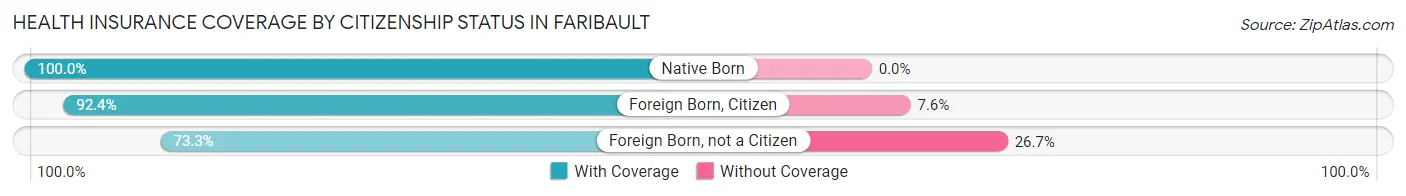
| Citizenship Status | With Coverage | Without Coverage |
| Native Born | 1,712 (100.0%) | 0 (0.0%) |
| Foreign Born, Citizen | 3,770 (92.4%) | 311 (7.6%) |
| Foreign Born, not a Citizen | 1,295 (73.3%) | 472 (26.7%) |
Health Insurance Coverage by Household Income in Faribault
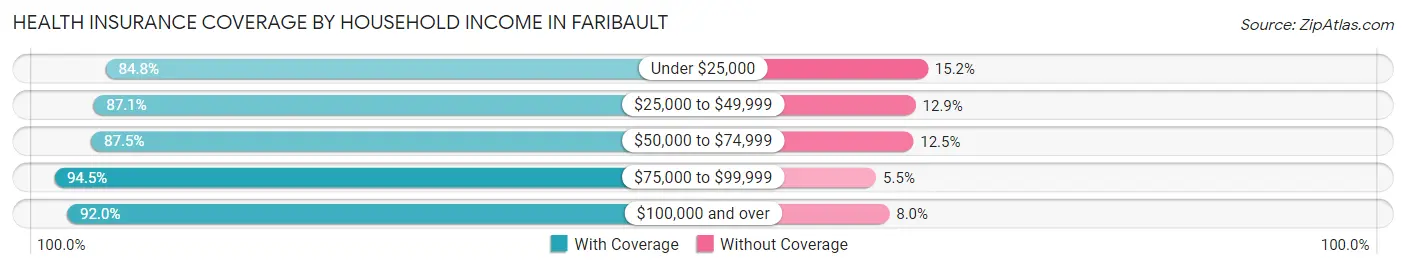
| Household Income | With Coverage | Without Coverage |
| Under $25,000 | 2,128 (84.8%) | 381 (15.2%) |
| $25,000 to $49,999 | 4,150 (87.1%) | 614 (12.9%) |
| $50,000 to $74,999 | 3,028 (87.5%) | 431 (12.5%) |
| $75,000 to $99,999 | 3,865 (94.5%) | 225 (5.5%) |
| $100,000 and over | 6,658 (92.0%) | 576 (8.0%) |
Public vs Private Health Insurance Coverage by Age in Faribault
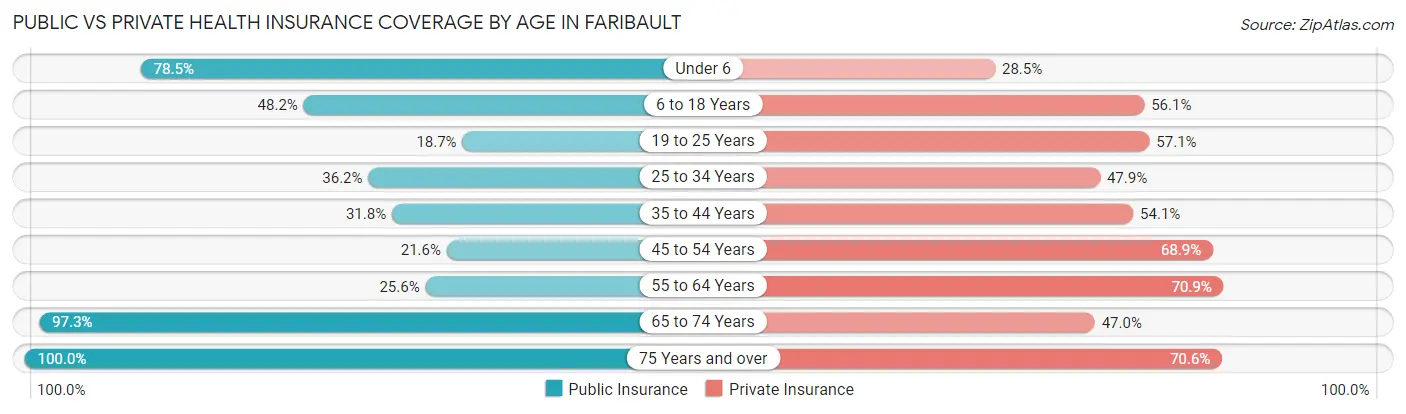
| Age Bracket | Public Insurance | Private Insurance |
| Under 6 | 1,343 (78.4%) | 487 (28.4%) |
| 6 to 18 Years | 1,967 (48.2%) | 2,291 (56.1%) |
| 19 to 25 Years | 331 (18.7%) | 1,009 (57.1%) |
| 25 to 34 Years | 1,009 (36.2%) | 1,336 (47.9%) |
| 35 to 44 Years | 877 (31.8%) | 1,491 (54.1%) |
| 45 to 54 Years | 509 (21.6%) | 1,621 (68.9%) |
| 55 to 64 Years | 733 (25.6%) | 2,030 (70.9%) |
| 65 to 74 Years | 2,298 (97.3%) | 1,109 (46.9%) |
| 75 Years and over | 1,653 (100.0%) | 1,167 (70.6%) |
| Total | 10,720 (48.0%) | 12,541 (56.1%) |
Disability Status by Sex by Age in Faribault
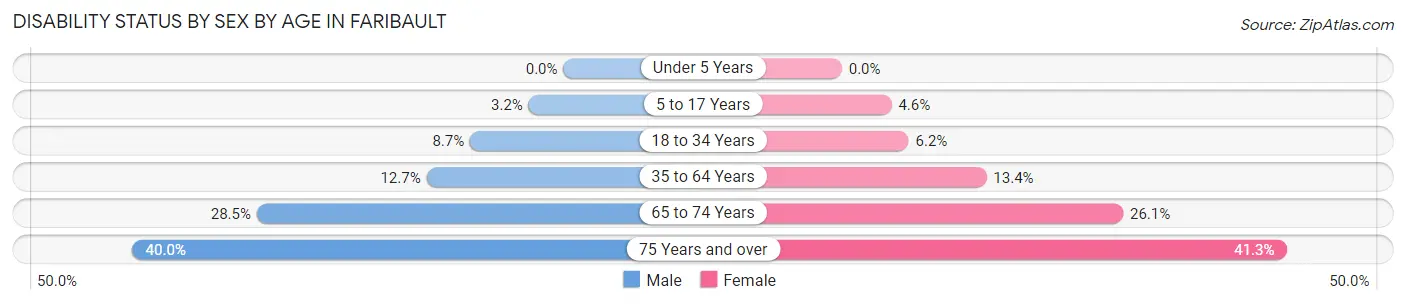
| Age Bracket | Male | Female |
| Under 5 Years | 0 (0.0%) | 0 (0.0%) |
| 5 to 17 Years | 69 (3.2%) | 95 (4.6%) |
| 18 to 34 Years | 219 (8.7%) | 139 (6.2%) |
| 35 to 64 Years | 516 (12.7%) | 525 (13.4%) |
| 65 to 74 Years | 322 (28.4%) | 321 (26.1%) |
| 75 Years and over | 245 (40.0%) | 429 (41.2%) |
Disability Class by Sex by Age in Faribault
Disability Class: Hearing Difficulty
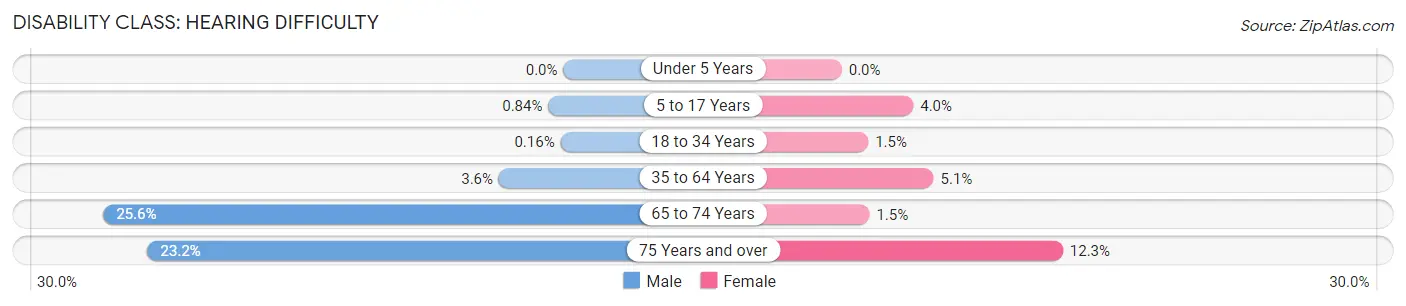
| Age Bracket | Male | Female |
| Under 5 Years | 0 (0.0%) | 0 (0.0%) |
| 5 to 17 Years | 18 (0.8%) | 82 (4.0%) |
| 18 to 34 Years | 4 (0.2%) | 33 (1.5%) |
| 35 to 64 Years | 146 (3.6%) | 200 (5.1%) |
| 65 to 74 Years | 290 (25.6%) | 19 (1.5%) |
| 75 Years and over | 142 (23.2%) | 128 (12.3%) |
Disability Class: Vision Difficulty
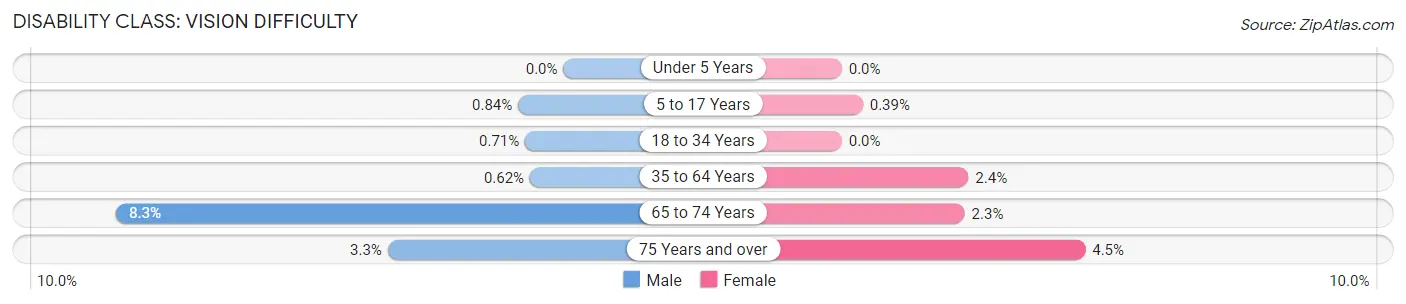
| Age Bracket | Male | Female |
| Under 5 Years | 0 (0.0%) | 0 (0.0%) |
| 5 to 17 Years | 18 (0.8%) | 8 (0.4%) |
| 18 to 34 Years | 18 (0.7%) | 0 (0.0%) |
| 35 to 64 Years | 25 (0.6%) | 92 (2.4%) |
| 65 to 74 Years | 94 (8.3%) | 28 (2.3%) |
| 75 Years and over | 20 (3.3%) | 47 (4.5%) |
Disability Class: Cognitive Difficulty
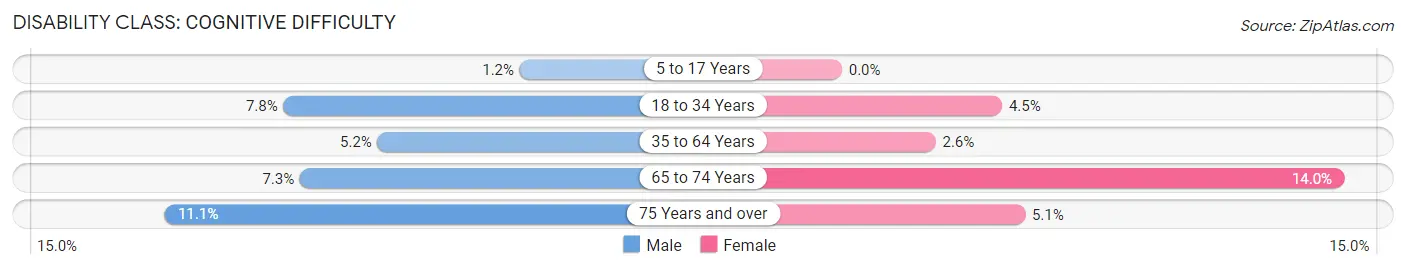
| Age Bracket | Male | Female |
| 5 to 17 Years | 26 (1.2%) | 0 (0.0%) |
| 18 to 34 Years | 197 (7.8%) | 100 (4.5%) |
| 35 to 64 Years | 210 (5.2%) | 102 (2.6%) |
| 65 to 74 Years | 83 (7.3%) | 172 (14.0%) |
| 75 Years and over | 68 (11.1%) | 53 (5.1%) |
Disability Class: Ambulatory Difficulty
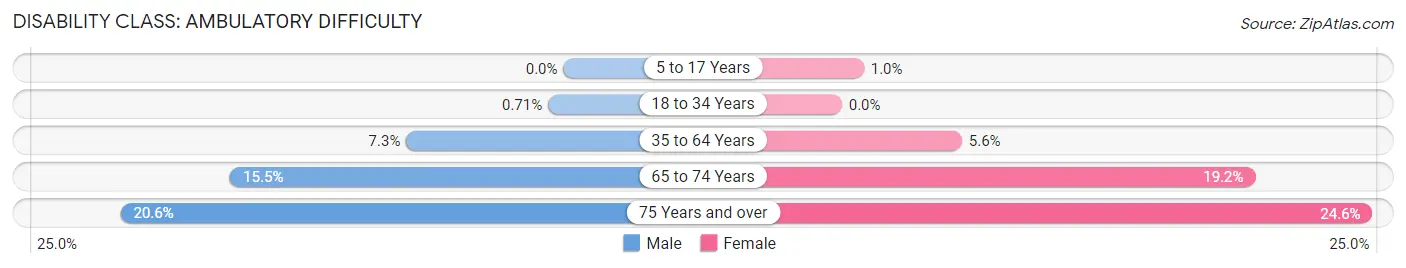
| Age Bracket | Male | Female |
| 5 to 17 Years | 0 (0.0%) | 21 (1.0%) |
| 18 to 34 Years | 18 (0.7%) | 0 (0.0%) |
| 35 to 64 Years | 296 (7.3%) | 218 (5.6%) |
| 65 to 74 Years | 175 (15.5%) | 236 (19.2%) |
| 75 Years and over | 126 (20.5%) | 256 (24.6%) |
Disability Class: Self-Care Difficulty
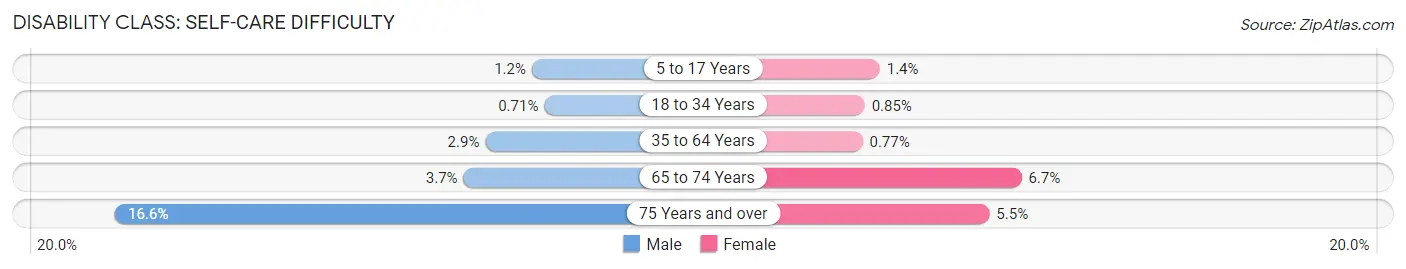
| Age Bracket | Male | Female |
| 5 to 17 Years | 25 (1.2%) | 29 (1.4%) |
| 18 to 34 Years | 18 (0.7%) | 19 (0.9%) |
| 35 to 64 Years | 118 (2.9%) | 30 (0.8%) |
| 65 to 74 Years | 42 (3.7%) | 82 (6.7%) |
| 75 Years and over | 102 (16.6%) | 57 (5.5%) |
Technology Access in Faribault
Computing Device Access in Faribault
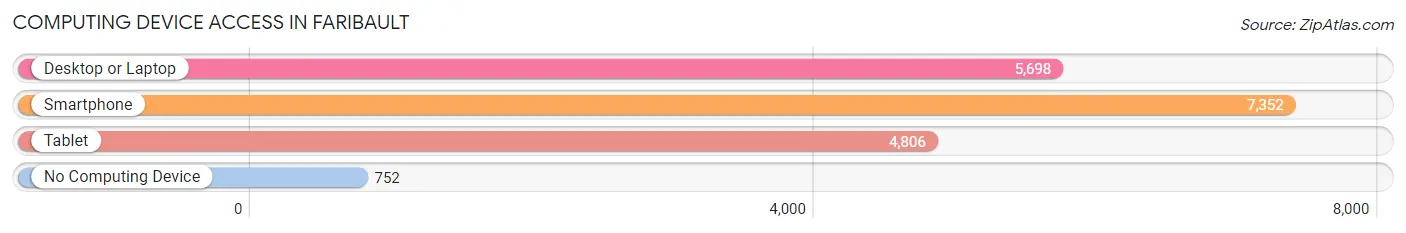
| Device Type | # Households | % Households |
| Desktop or Laptop | 5,698 | 64.4% |
| Smartphone | 7,352 | 83.1% |
| Tablet | 4,806 | 54.3% |
| No Computing Device | 752 | 8.5% |
| Total | 8,853 | 100.0% |
Internet Access in Faribault
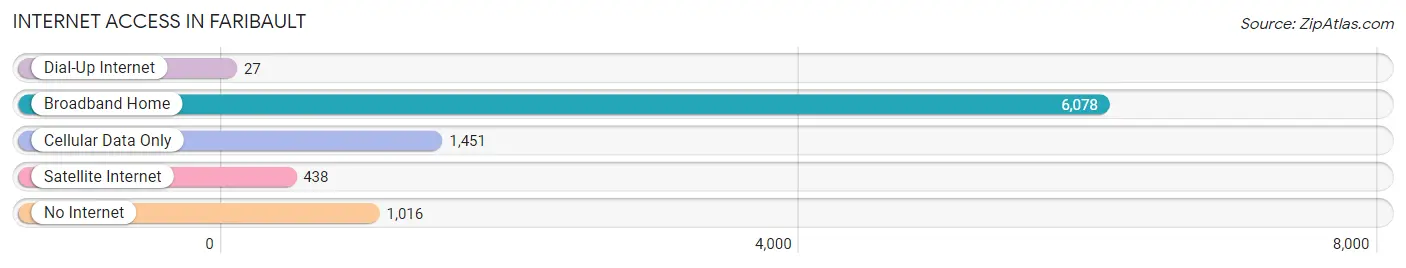
| Internet Type | # Households | % Households |
| Dial-Up Internet | 27 | 0.3% |
| Broadband Home | 6,078 | 68.6% |
| Cellular Data Only | 1,451 | 16.4% |
| Satellite Internet | 438 | 5.0% |
| No Internet | 1,016 | 11.5% |
| Total | 8,853 | 100.0% |
Faribault Summary
Faribault, Minnesota is a city located in Rice County, Minnesota, United States. The population was 23,352 at the 2010 census. Faribault is the county seat of Rice County. It is located along the Cannon River at its confluence with the Straight River. Faribault is one of the oldest cities in Minnesota, having been founded in 1855.
History
The area around Faribault was first settled by European Americans in 1853. The city was named after Alexander Faribault, a French-Canadian fur trader who had established a trading post in the area in 1826. Faribault was incorporated as a city in 1872.
The city was an important center for the agricultural industry in the late 19th and early 20th centuries. It was also a major railroad hub, with several railroads running through the city.
Faribault was the site of the first public school in Minnesota, established in 1856. The city was also home to the first public library in the state, established in 1858.
Geography
Faribault is located at 44°17′N 93°14′W (44.28, -93.23). According to the United States Census Bureau, the city has a total area of 11.2 square miles (29.0 km2), of which 11.1 square miles (28.7 km2) is land and 0.1 square miles (0.3 km2) is water.
The city is located in the southern part of Minnesota, near the confluence of the Cannon and Straight Rivers. It is about 50 miles (80 km) south of Minneapolis and St. Paul.
Economy
Faribault is a major center for the agricultural industry in Minnesota. The city is home to several large agricultural companies, including Land O’Lakes, Cargill, and CHS.
The city is also home to several manufacturing companies, including Faribault Woolen Mill, which produces woolen blankets and other products.
Demographics
As of the census of 2010, there were 23,352 people, 8,945 households, and 5,717 families residing in the city. The population density was 2,097.3 people per square mile (808.7/km2). There were 9,541 housing units at an average density of 854.7 per square mile (330.2/km2). The racial makeup of the city was 87.2% White, 5.3% African American, 0.5% Native American, 1.3% Asian, 0.1% Pacific Islander, 3.7% from other races, and 2.0% from two or more races. Hispanic or Latino of any race were 8.2% of the population.
There were 8,945 households, out of which 32.2% had children under the age of 18 living with them, 46.2% were married couples living together, 12.7% had a female householder with no husband present, and 36.3% were non-families. 29.7% of all households were made up of individuals, and 11.2% had someone living alone who was 65 years of age or older. The average household size was 2.48 and the average family size was 3.09.
In the city, the population was spread out, with 25.3% under the age of 18, 10.2% from 18 to 24, 28.2% from 25 to 44, 21.2% from 45 to 64, and 15.1% who were 65 years of age or older. The median age was 35 years. For every 100 females, there were 93.2 males. For every 100 females age 18 and over, there were 89.7 males.
The median income for a household in the city was $41,945, and the median income for a family was $51,945. Males had a median income of $36,945 versus $27,945 for females. The per capita income for the city was $20,945. About 6.2% of families and 8.7% of the population were below the poverty line, including 11.2% of those under age 18 and 8.2% of those age 65 or over.
Common Questions
What is Per Capita Income in Faribault?
Per Capita income in Faribault is $30,255.
What is the Median Family Income in Faribault?
Median Family Income in Faribault is $74,447.
What is the Median Household income in Faribault?
Median Household Income in Faribault is $58,881.
What is Income or Wage Gap in Faribault?
Income or Wage Gap in Faribault is 2.8%.
Women in Faribault earn 97.2 cents for every dollar earned by a man.
What is Inequality or Gini Index in Faribault?
Inequality or Gini Index in Faribault is 0.45.
What is the Total Population of Faribault?
Total Population of Faribault is 24,418.
What is the Total Male Population of Faribault?
Total Male Population of Faribault is 13,061.
What is the Total Female Population of Faribault?
Total Female Population of Faribault is 11,357.
What is the Ratio of Males per 100 Females in Faribault?
There are 115.00 Males per 100 Females in Faribault.
What is the Ratio of Females per 100 Males in Faribault?
There are 86.95 Females per 100 Males in Faribault.
What is the Median Population Age in Faribault?
Median Population Age in Faribault is 38.7 Years.
What is the Average Family Size in Faribault
Average Family Size in Faribault is 3.2 People.
What is the Average Household Size in Faribault
Average Household Size in Faribault is 2.5 People.
How Large is the Labor Force in Faribault?
There are 10,869 People in the Labor Forcein in Faribault.
What is the Percentage of People in the Labor Force in Faribault?
55.8% of People are in the Labor Force in Faribault.
What is the Unemployment Rate in Faribault?
Unemployment Rate in Faribault is 6.4%.