Eden Prairie, MN Map & Demographics
Eden Prairie Map
Eden Prairie Overview
$67,183
PER CAPITA INCOME
$159,625
AVG FAMILY INCOME
$129,345
AVG HOUSEHOLD INCOME
42.8%
WAGE / INCOME GAP [ % ]
57.2¢/ $1
WAGE / INCOME GAP [ $ ]
0.44
INEQUALITY / GINI INDEX
63,623
TOTAL POPULATION
31,016
MALE POPULATION
32,607
FEMALE POPULATION
95.12
MALES / 100 FEMALES
105.13
FEMALES / 100 MALES
39.5
MEDIAN AGE
3.0
AVG FAMILY SIZE
2.5
AVG HOUSEHOLD SIZE
36,135
LABOR FORCE [ PEOPLE ]
72.0%
PERCENT IN LABOR FORCE
3.8%
UNEMPLOYMENT RATE
Income in Eden Prairie
Income Overview in Eden Prairie
Per Capita Income in Eden Prairie is $67,183, while median incomes of families and households are $159,625 and $129,345 respectively.
| Characteristic | Number | Measure |
| Per Capita Income | 63,623 | $67,183 |
| Median Family Income | 17,562 | $159,625 |
| Mean Family Income | 17,562 | $198,987 |
| Median Household Income | 25,070 | $129,345 |
| Mean Household Income | 25,070 | $169,798 |
| Income Deficit | 17,562 | $0 |
| Wage / Income Gap (%) | 63,623 | 42.78% |
| Wage / Income Gap ($) | 63,623 | 57.22¢ per $1 |
| Gini / Inequality Index | 63,623 | 0.44 |
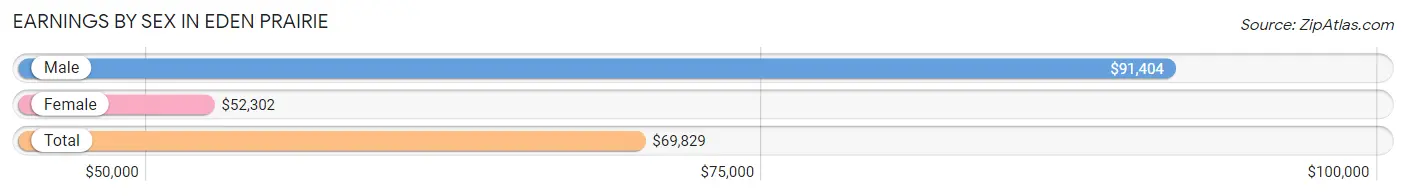
Earnings by Sex in Eden Prairie
Average Earnings in Eden Prairie are $69,829, $91,404 for men and $52,302 for women, a difference of 42.8%.
| Sex | Number | Average Earnings |
| Male | 20,130 (52.9%) | $91,404 |
| Female | 17,932 (47.1%) | $52,302 |
| Total | 38,062 (100.0%) | $69,829 |
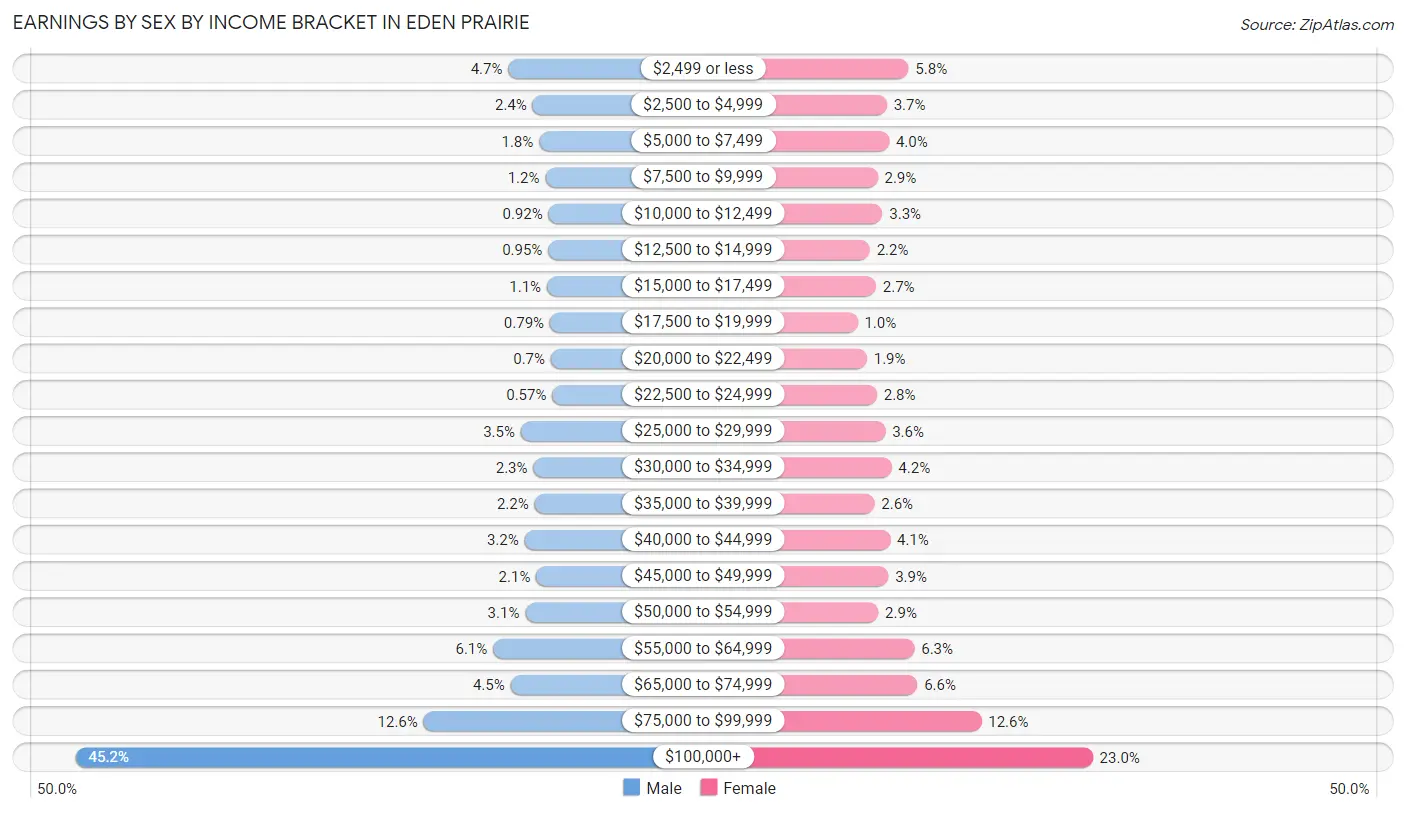
Earnings by Sex by Income Bracket in Eden Prairie
The most common earnings brackets in Eden Prairie are $100,000+ for men (9,102 | 45.2%) and $100,000+ for women (4,130 | 23.0%).
| Income | Male | Female |
| $2,499 or less | 945 (4.7%) | 1,034 (5.8%) |
| $2,500 to $4,999 | 486 (2.4%) | 670 (3.7%) |
| $5,000 to $7,499 | 362 (1.8%) | 709 (4.0%) |
| $7,500 to $9,999 | 245 (1.2%) | 516 (2.9%) |
| $10,000 to $12,499 | 186 (0.9%) | 597 (3.3%) |
| $12,500 to $14,999 | 192 (0.9%) | 386 (2.1%) |
| $15,000 to $17,499 | 216 (1.1%) | 487 (2.7%) |
| $17,500 to $19,999 | 160 (0.8%) | 180 (1.0%) |
| $20,000 to $22,499 | 140 (0.7%) | 336 (1.9%) |
| $22,500 to $24,999 | 115 (0.6%) | 504 (2.8%) |
| $25,000 to $29,999 | 709 (3.5%) | 645 (3.6%) |
| $30,000 to $34,999 | 472 (2.3%) | 749 (4.2%) |
| $35,000 to $39,999 | 449 (2.2%) | 462 (2.6%) |
| $40,000 to $44,999 | 639 (3.2%) | 727 (4.1%) |
| $45,000 to $49,999 | 417 (2.1%) | 696 (3.9%) |
| $50,000 to $54,999 | 624 (3.1%) | 527 (2.9%) |
| $55,000 to $64,999 | 1,229 (6.1%) | 1,133 (6.3%) |
| $65,000 to $74,999 | 901 (4.5%) | 1,184 (6.6%) |
| $75,000 to $99,999 | 2,541 (12.6%) | 2,260 (12.6%) |
| $100,000+ | 9,102 (45.2%) | 4,130 (23.0%) |
| Total | 20,130 (100.0%) | 17,932 (100.0%) |
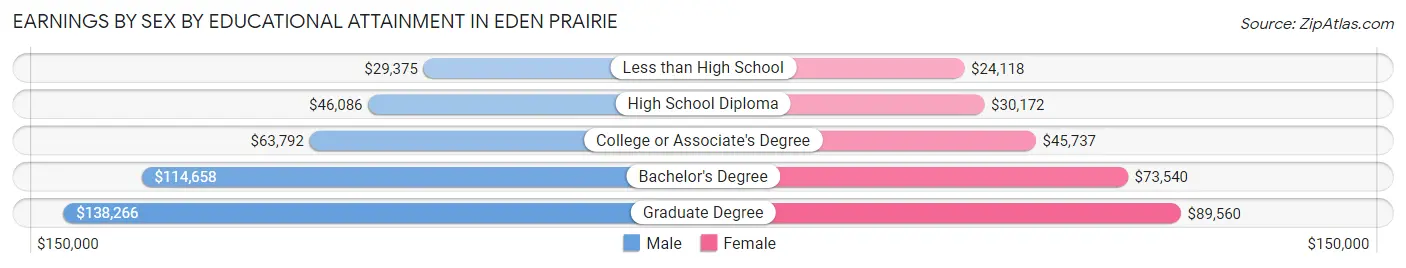
Earnings by Sex by Educational Attainment in Eden Prairie
Average earnings in Eden Prairie are $100,164 for men and $62,449 for women, a difference of 37.7%. Men with an educational attainment of graduate degree enjoy the highest average annual earnings of $138,266, while those with less than high school education earn the least with $29,375. Women with an educational attainment of graduate degree earn the most with the average annual earnings of $89,560, while those with less than high school education have the smallest earnings of $24,118.
| Educational Attainment | Male Income | Female Income |
| Less than High School | $29,375 | $24,118 |
| High School Diploma | $46,086 | $30,172 |
| College or Associate's Degree | $63,792 | $45,737 |
| Bachelor's Degree | $114,658 | $73,540 |
| Graduate Degree | $138,266 | $89,560 |
| Total | $100,164 | $62,449 |
Family Income in Eden Prairie
Family Income Brackets in Eden Prairie
According to the Eden Prairie family income data, there are 6,445 families falling into the $200,000+ income range, which is the most common income bracket and makes up 36.7% of all families. Conversely, the less than $10,000 income bracket is the least frequent group with only 105 families (0.6%) belonging to this category.
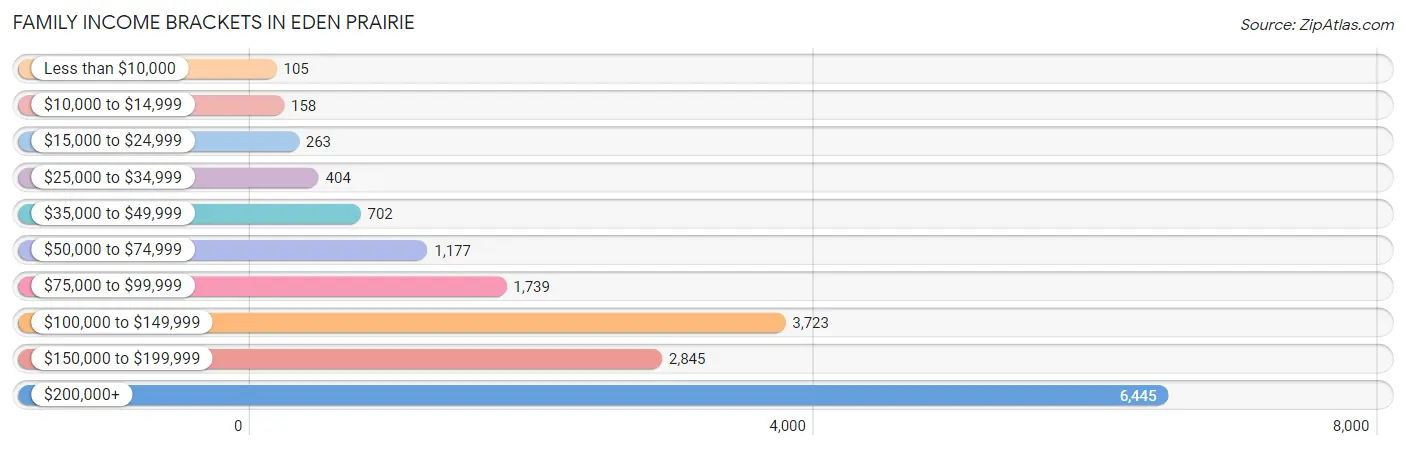
| Income Bracket | # Families | % Families |
| Less than $10,000 | 105 | 0.6% |
| $10,000 to $14,999 | 158 | 0.9% |
| $15,000 to $24,999 | 263 | 1.5% |
| $25,000 to $34,999 | 404 | 2.3% |
| $35,000 to $49,999 | 702 | 4.0% |
| $50,000 to $74,999 | 1,177 | 6.7% |
| $75,000 to $99,999 | 1,739 | 9.9% |
| $100,000 to $149,999 | 3,723 | 21.2% |
| $150,000 to $199,999 | 2,845 | 16.2% |
| $200,000+ | 6,445 | 36.7% |
Family Income by Famaliy Size in Eden Prairie
6-person families (357 | 2.0%) account for the highest median family income in Eden Prairie with $250,001 per family, while 2-person families (7,434 | 42.3%) have the highest median income of $66,339 per family member.
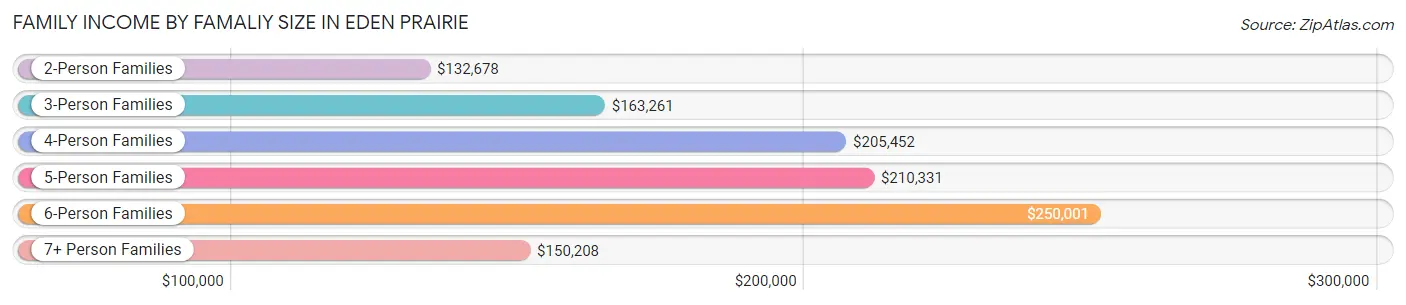
| Income Bracket | # Families | Median Income |
| 2-Person Families | 7,434 (42.3%) | $132,678 |
| 3-Person Families | 4,350 (24.8%) | $163,261 |
| 4-Person Families | 3,738 (21.3%) | $205,452 |
| 5-Person Families | 1,597 (9.1%) | $210,331 |
| 6-Person Families | 357 (2.0%) | $250,001 |
| 7+ Person Families | 86 (0.5%) | $150,208 |
| Total | 17,562 (100.0%) | $159,625 |
Family Income by Number of Earners in Eden Prairie
The median family income in Eden Prairie is $159,625, with families comprising 3+ earners (2,541) having the highest median family income of $213,384, while families with no earners (1,514) have the lowest median family income of $87,326, accounting for 14.5% and 8.6% of families, respectively.
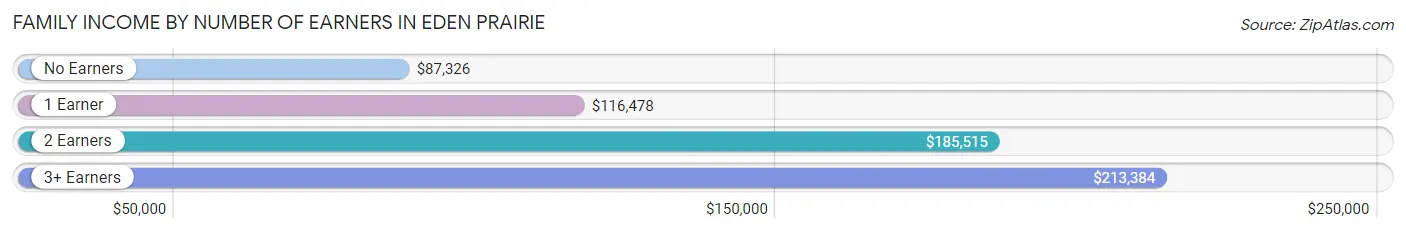
| Number of Earners | # Families | Median Income |
| No Earners | 1,514 (8.6%) | $87,326 |
| 1 Earner | 4,688 (26.7%) | $116,478 |
| 2 Earners | 8,819 (50.2%) | $185,515 |
| 3+ Earners | 2,541 (14.5%) | $213,384 |
| Total | 17,562 (100.0%) | $159,625 |
Household Income in Eden Prairie
Household Income Brackets in Eden Prairie
With 7,120 households falling in the category, the $200,000+ income range is the most frequent in Eden Prairie, accounting for 28.4% of all households. In contrast, only 326 households (1.3%) fall into the less than $10,000 income bracket, making it the least populous group.
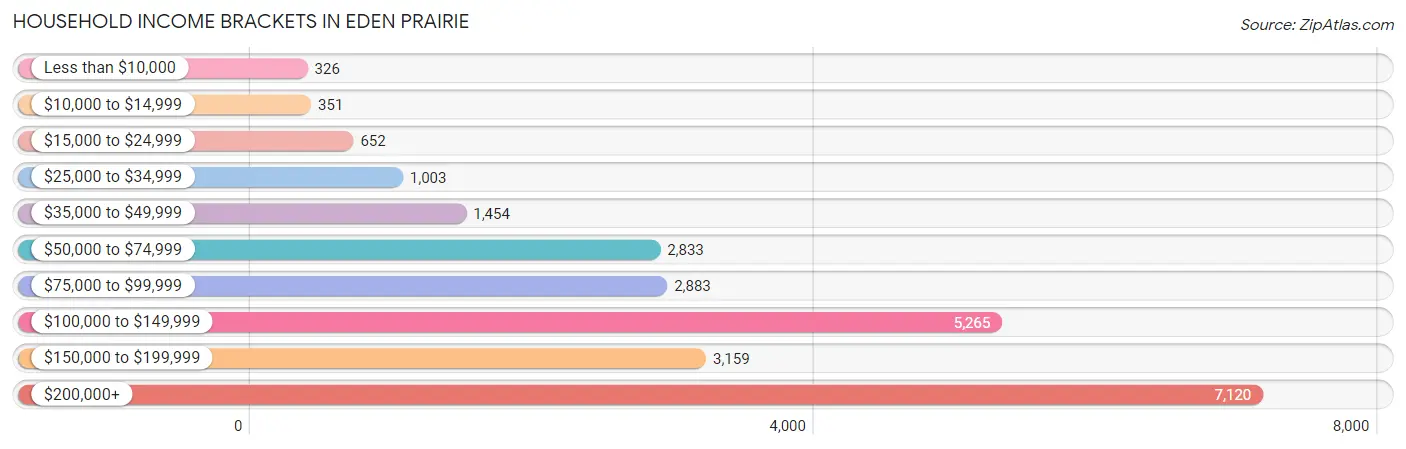
| Income Bracket | # Households | % Households |
| Less than $10,000 | 326 | 1.3% |
| $10,000 to $14,999 | 351 | 1.4% |
| $15,000 to $24,999 | 652 | 2.6% |
| $25,000 to $34,999 | 1,003 | 4.0% |
| $35,000 to $49,999 | 1,454 | 5.8% |
| $50,000 to $74,999 | 2,833 | 11.3% |
| $75,000 to $99,999 | 2,883 | 11.5% |
| $100,000 to $149,999 | 5,265 | 21.0% |
| $150,000 to $199,999 | 3,159 | 12.6% |
| $200,000+ | 7,120 | 28.4% |
Household Income by Householder Age in Eden Prairie
The median household income in Eden Prairie is $129,345, with the highest median household income of $155,156 found in the 45 to 64 years age bracket for the primary householder. A total of 10,333 households (41.2%) fall into this category. Meanwhile, the 15 to 24 years age bracket for the primary householder has the lowest median household income of $63,846, with 250 households (1.0%) in this group.
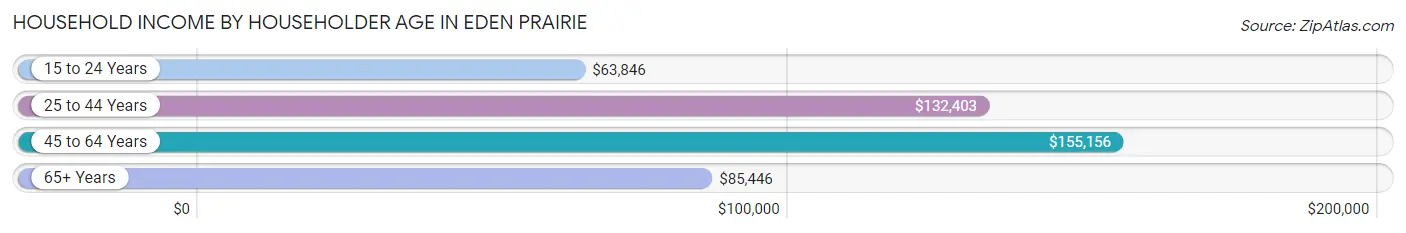
| Income Bracket | # Households | Median Income |
| 15 to 24 Years | 250 (1.0%) | $63,846 |
| 25 to 44 Years | 9,044 (36.1%) | $132,403 |
| 45 to 64 Years | 10,333 (41.2%) | $155,156 |
| 65+ Years | 5,443 (21.7%) | $85,446 |
| Total | 25,070 (100.0%) | $129,345 |
Poverty in Eden Prairie
Income Below Poverty by Sex and Age in Eden Prairie
With 4.4% poverty level for males and 5.8% for females among the residents of Eden Prairie, 6 to 11 year old males and 16 and 17 year old females are the most vulnerable to poverty, with 331 males (12.7%) and 187 females (15.4%) in their respective age groups living below the poverty level.
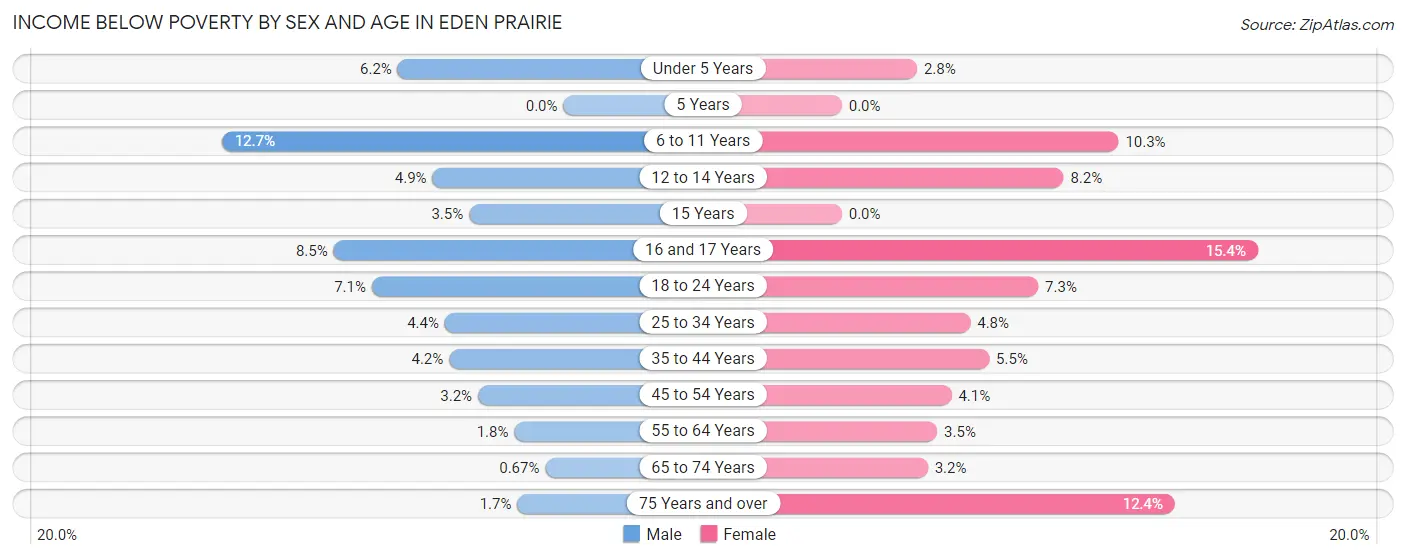
| Age Bracket | Male | Female |
| Under 5 Years | 130 (6.1%) | 47 (2.8%) |
| 5 Years | 0 (0.0%) | 0 (0.0%) |
| 6 to 11 Years | 331 (12.7%) | 267 (10.3%) |
| 12 to 14 Years | 68 (4.9%) | 112 (8.2%) |
| 15 Years | 16 (3.5%) | 0 (0.0%) |
| 16 and 17 Years | 70 (8.5%) | 187 (15.4%) |
| 18 to 24 Years | 121 (7.1%) | 140 (7.3%) |
| 25 to 34 Years | 172 (4.4%) | 186 (4.8%) |
| 35 to 44 Years | 209 (4.2%) | 259 (5.5%) |
| 45 to 54 Years | 140 (3.2%) | 177 (4.1%) |
| 55 to 64 Years | 76 (1.8%) | 177 (3.5%) |
| 65 to 74 Years | 19 (0.7%) | 103 (3.2%) |
| 75 Years and over | 20 (1.7%) | 222 (12.4%) |
| Total | 1,372 (4.4%) | 1,877 (5.8%) |
Income Above Poverty by Sex and Age in Eden Prairie
According to the poverty statistics in Eden Prairie, males aged 5 years and females aged 5 years are the age groups that are most secure financially, with 100.0% of males and 100.0% of females in these age groups living above the poverty line.
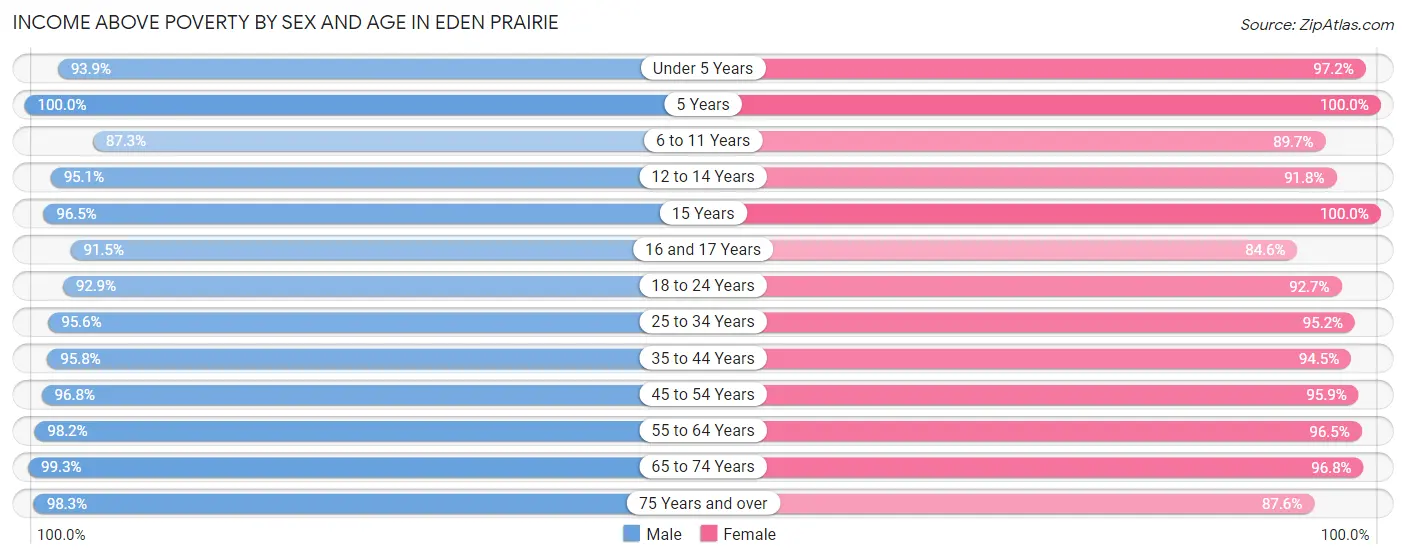
| Age Bracket | Male | Female |
| Under 5 Years | 1,984 (93.9%) | 1,635 (97.2%) |
| 5 Years | 412 (100.0%) | 234 (100.0%) |
| 6 to 11 Years | 2,279 (87.3%) | 2,334 (89.7%) |
| 12 to 14 Years | 1,330 (95.1%) | 1,249 (91.8%) |
| 15 Years | 441 (96.5%) | 467 (100.0%) |
| 16 and 17 Years | 751 (91.5%) | 1,024 (84.6%) |
| 18 to 24 Years | 1,581 (92.9%) | 1,780 (92.7%) |
| 25 to 34 Years | 3,739 (95.6%) | 3,712 (95.2%) |
| 35 to 44 Years | 4,722 (95.8%) | 4,477 (94.5%) |
| 45 to 54 Years | 4,273 (96.8%) | 4,177 (95.9%) |
| 55 to 64 Years | 4,092 (98.2%) | 4,816 (96.5%) |
| 65 to 74 Years | 2,832 (99.3%) | 3,127 (96.8%) |
| 75 Years and over | 1,153 (98.3%) | 1,574 (87.6%) |
| Total | 29,589 (95.6%) | 30,606 (94.2%) |
Income Below Poverty Among Married-Couple Families in Eden Prairie
The poverty statistics for married-couple families in Eden Prairie show that 2.4% or 362 of the total 14,913 families live below the poverty line. Families with 5 or more children have the highest poverty rate of 53.5%, comprising of 23 families. On the other hand, families with no children have the lowest poverty rate of 1.2%, which includes 89 families.
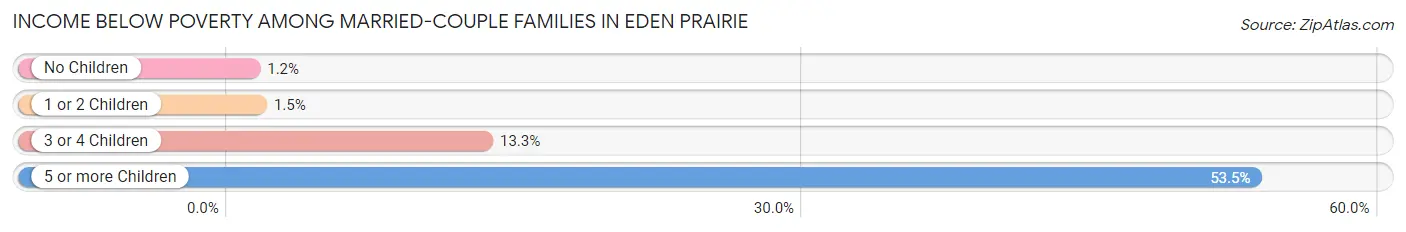
| Children | Above Poverty | Below Poverty |
| No Children | 7,571 (98.8%) | 89 (1.2%) |
| 1 or 2 Children | 5,925 (98.5%) | 91 (1.5%) |
| 3 or 4 Children | 1,035 (86.7%) | 159 (13.3%) |
| 5 or more Children | 20 (46.5%) | 23 (53.5%) |
| Total | 14,551 (97.6%) | 362 (2.4%) |
Income Below Poverty Among Single-Parent Households in Eden Prairie
According to the poverty data in Eden Prairie, 3.3% or 28 single-father households and 13.3% or 237 single-mother households are living below the poverty line. Among single-father households, those with no children have the highest poverty rate, with 19 households (9.8%) experiencing poverty. Likewise, among single-mother households, those with 1 or 2 children have the highest poverty rate, with 226 households (22.5%) falling below the poverty line.
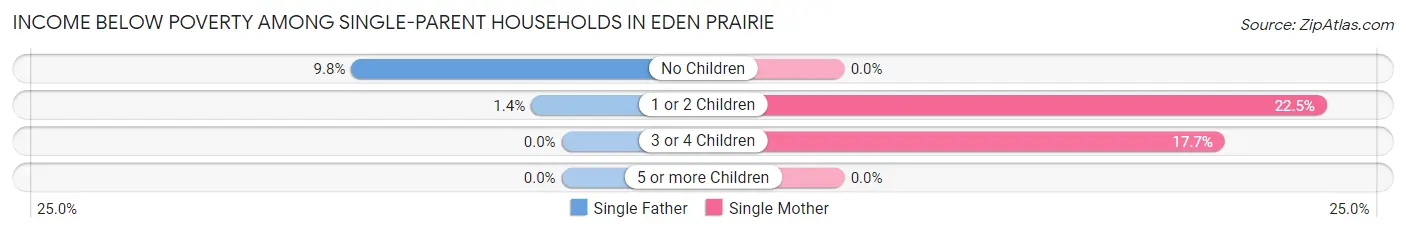
| Children | Single Father | Single Mother |
| No Children | 19 (9.8%) | 0 (0.0%) |
| 1 or 2 Children | 9 (1.4%) | 226 (22.5%) |
| 3 or 4 Children | 0 (0.0%) | 11 (17.7%) |
| 5 or more Children | 0 (0.0%) | 0 (0.0%) |
| Total | 28 (3.3%) | 237 (13.3%) |
Income Below Poverty Among Married-Couple vs Single-Parent Households in Eden Prairie
The poverty data for Eden Prairie shows that 362 of the married-couple family households (2.4%) and 265 of the single-parent households (10.0%) are living below the poverty level. Within the married-couple family households, those with 5 or more children have the highest poverty rate, with 23 households (53.5%) falling below the poverty line. Among the single-parent households, those with 1 or 2 children have the highest poverty rate, with 235 household (14.4%) living below poverty.
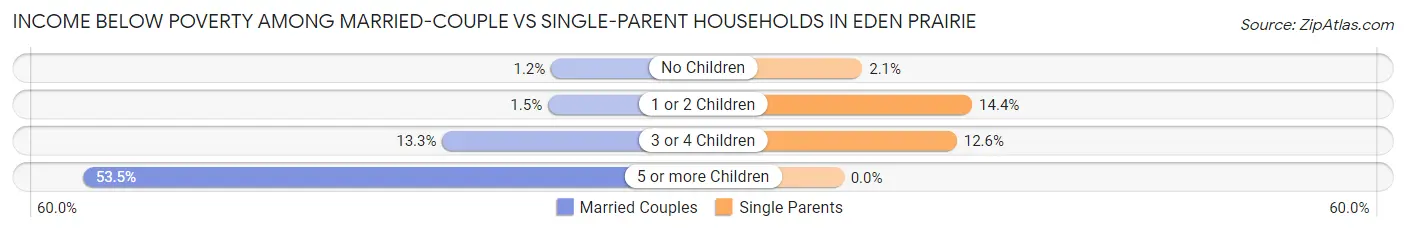
| Children | Married-Couple Families | Single-Parent Households |
| No Children | 89 (1.2%) | 19 (2.1%) |
| 1 or 2 Children | 91 (1.5%) | 235 (14.4%) |
| 3 or 4 Children | 159 (13.3%) | 11 (12.6%) |
| 5 or more Children | 23 (53.5%) | 0 (0.0%) |
| Total | 362 (2.4%) | 265 (10.0%) |
Race in Eden Prairie
The most populous races in Eden Prairie are White / Caucasian (45,651 | 71.8%), Asian (8,633 | 13.6%), and Black / African American (4,325 | 6.8%).
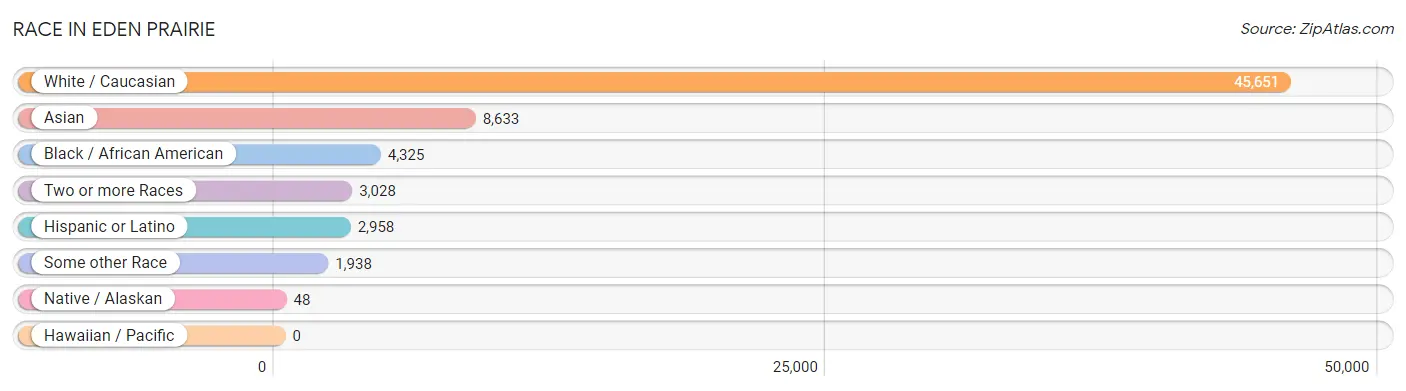
| Race | # Population | % Population |
| Asian | 8,633 | 13.6% |
| Black / African American | 4,325 | 6.8% |
| Hawaiian / Pacific | 0 | 0.0% |
| Hispanic or Latino | 2,958 | 4.6% |
| Native / Alaskan | 48 | 0.1% |
| White / Caucasian | 45,651 | 71.8% |
| Two or more Races | 3,028 | 4.8% |
| Some other Race | 1,938 | 3.0% |
| Total | 63,623 | 100.0% |
Ancestry in Eden Prairie
The most populous ancestries reported in Eden Prairie are German (15,056 | 23.7%), Irish (7,724 | 12.1%), Norwegian (7,299 | 11.5%), English (5,020 | 7.9%), and Thai (4,981 | 7.8%), together accounting for 63.0% of all Eden Prairie residents.
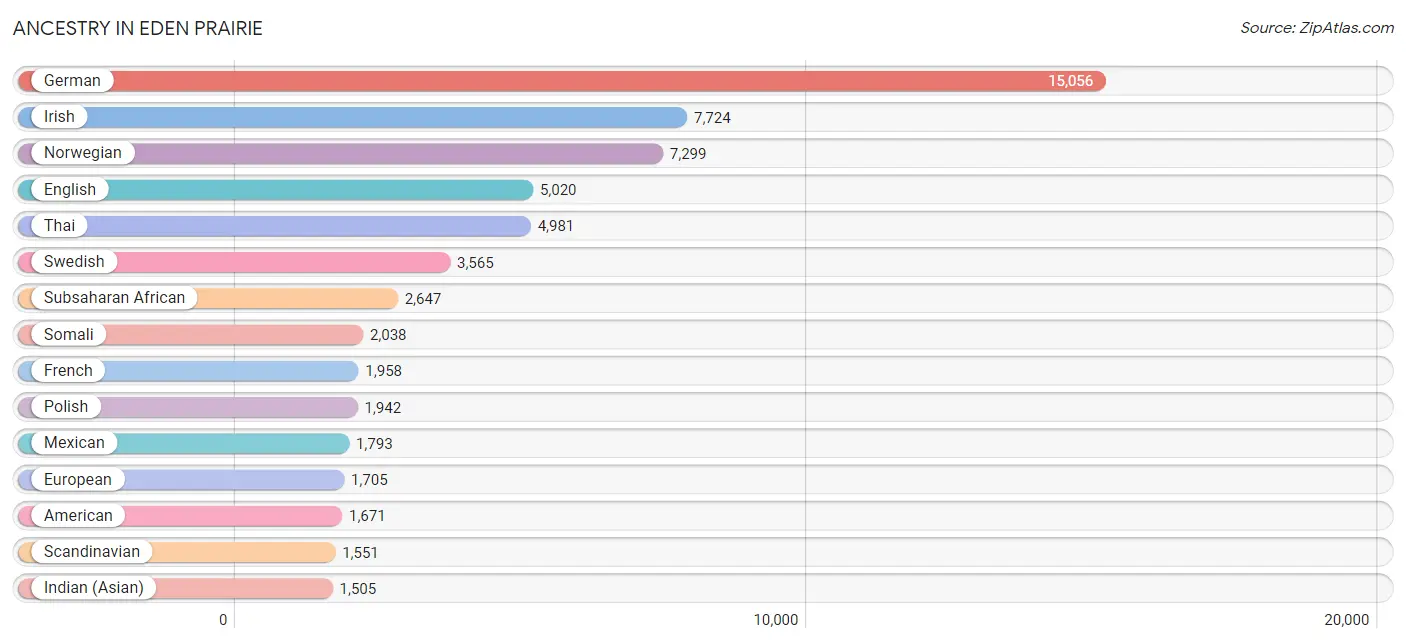
| Ancestry | # Population | % Population |
| Afghan | 60 | 0.1% |
| African | 295 | 0.5% |
| Alaska Native | 1 | 0.0% |
| Albanian | 20 | 0.0% |
| American | 1,671 | 2.6% |
| Arab | 1,209 | 1.9% |
| Argentinean | 52 | 0.1% |
| Armenian | 29 | 0.1% |
| Assyrian / Chaldean / Syriac | 7 | 0.0% |
| Austrian | 273 | 0.4% |
| Bangladeshi | 233 | 0.4% |
| Belgian | 211 | 0.3% |
| Bhutanese | 383 | 0.6% |
| Brazilian | 110 | 0.2% |
| British | 319 | 0.5% |
| Burmese | 582 | 0.9% |
| Canadian | 115 | 0.2% |
| Central American | 152 | 0.2% |
| Central American Indian | 13 | 0.0% |
| Cherokee | 22 | 0.0% |
| Chippewa | 185 | 0.3% |
| Choctaw | 62 | 0.1% |
| Colombian | 133 | 0.2% |
| Comanche | 22 | 0.0% |
| Croatian | 138 | 0.2% |
| Czech | 564 | 0.9% |
| Czechoslovakian | 156 | 0.3% |
| Danish | 773 | 1.2% |
| Dutch | 868 | 1.4% |
| Eastern European | 249 | 0.4% |
| Egyptian | 579 | 0.9% |
| English | 5,020 | 7.9% |
| Ethiopian | 258 | 0.4% |
| European | 1,705 | 2.7% |
| Filipino | 253 | 0.4% |
| Finnish | 614 | 1.0% |
| French | 1,958 | 3.1% |
| French American Indian | 13 | 0.0% |
| French Canadian | 431 | 0.7% |
| German | 15,056 | 23.7% |
| Ghanaian | 26 | 0.0% |
| Greek | 214 | 0.3% |
| Guamanian / Chamorro | 19 | 0.0% |
| Guatemalan | 26 | 0.0% |
| Guyanese | 225 | 0.4% |
| Haitian | 52 | 0.1% |
| Honduran | 52 | 0.1% |
| Hungarian | 131 | 0.2% |
| Icelander | 15 | 0.0% |
| Indian (Asian) | 1,505 | 2.4% |
| Iranian | 201 | 0.3% |
| Irish | 7,724 | 12.1% |
| Italian | 1,356 | 2.1% |
| Jamaican | 46 | 0.1% |
| Japanese | 229 | 0.4% |
| Jordanian | 17 | 0.0% |
| Kenyan | 92 | 0.1% |
| Korean | 284 | 0.4% |
| Latvian | 14 | 0.0% |
| Lebanese | 91 | 0.1% |
| Liberian | 35 | 0.1% |
| Lithuanian | 41 | 0.1% |
| Luxembourger | 45 | 0.1% |
| Malaysian | 72 | 0.1% |
| Menominee | 8 | 0.0% |
| Mexican | 1,793 | 2.8% |
| Mongolian | 68 | 0.1% |
| Native Hawaiian | 41 | 0.1% |
| Northern European | 359 | 0.6% |
| Norwegian | 7,299 | 11.5% |
| Pakistani | 150 | 0.2% |
| Palestinian | 184 | 0.3% |
| Paraguayan | 4 | 0.0% |
| Pennsylvania German | 12 | 0.0% |
| Peruvian | 134 | 0.2% |
| Polish | 1,942 | 3.0% |
| Portuguese | 48 | 0.1% |
| Puerto Rican | 236 | 0.4% |
| Romanian | 78 | 0.1% |
| Russian | 489 | 0.8% |
| Salvadoran | 74 | 0.1% |
| Scandinavian | 1,551 | 2.4% |
| Scotch-Irish | 335 | 0.5% |
| Scottish | 965 | 1.5% |
| Serbian | 50 | 0.1% |
| Sioux | 51 | 0.1% |
| Slavic | 70 | 0.1% |
| Slovak | 136 | 0.2% |
| Slovene | 94 | 0.2% |
| Somali | 2,038 | 3.2% |
| South African | 13 | 0.0% |
| South American | 551 | 0.9% |
| South American Indian | 4 | 0.0% |
| Spaniard | 20 | 0.0% |
| Sri Lankan | 494 | 0.8% |
| Subsaharan African | 2,647 | 4.2% |
| Swedish | 3,565 | 5.6% |
| Swiss | 288 | 0.4% |
| Syrian | 39 | 0.1% |
| Thai | 4,981 | 7.8% |
| Tongan | 32 | 0.1% |
| Trinidadian and Tobagonian | 18 | 0.0% |
| Turkish | 11 | 0.0% |
| Ukrainian | 519 | 0.8% |
| Uruguayan | 44 | 0.1% |
| Venezuelan | 184 | 0.3% |
| Vietnamese | 16 | 0.0% |
| Welsh | 358 | 0.6% |
| Yup'ik | 38 | 0.1% | View All 109 Rows |
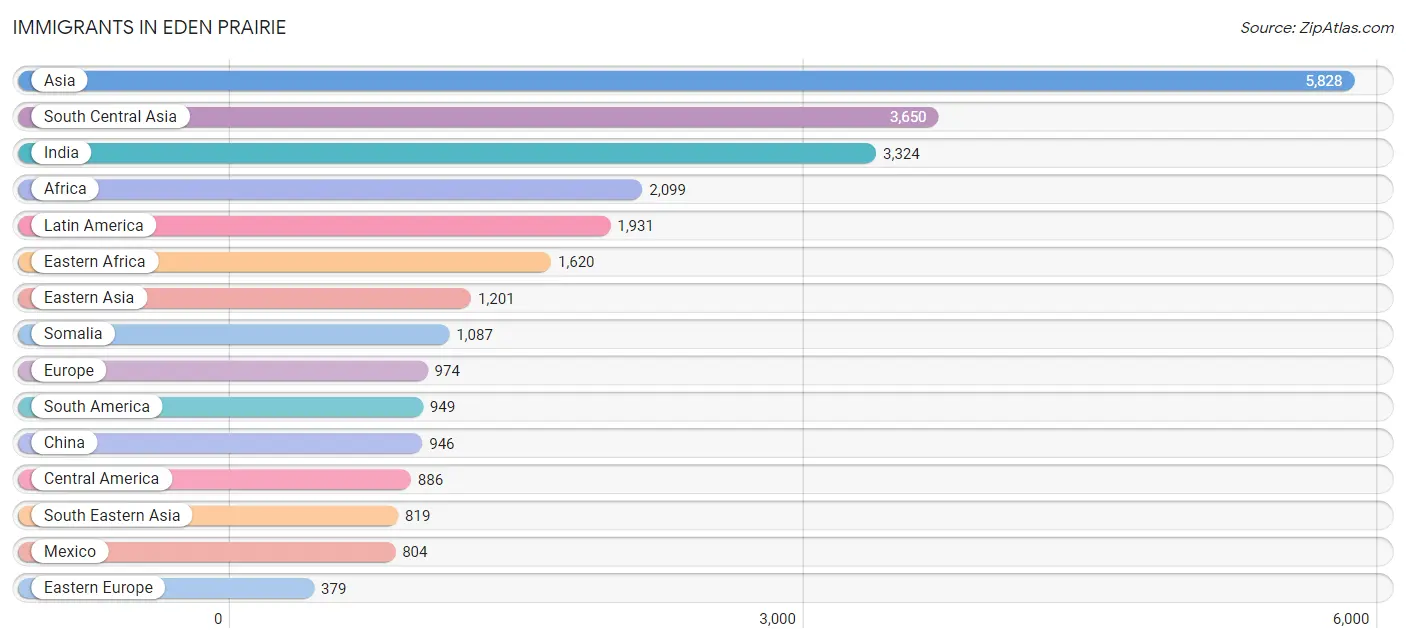
Immigrants in Eden Prairie
The most numerous immigrant groups reported in Eden Prairie came from Asia (5,828 | 9.2%), South Central Asia (3,650 | 5.7%), India (3,324 | 5.2%), Africa (2,099 | 3.3%), and Latin America (1,931 | 3.0%), together accounting for 26.5% of all Eden Prairie residents.
| Immigration Origin | # Population | % Population |
| Afghanistan | 42 | 0.1% |
| Africa | 2,099 | 3.3% |
| Argentina | 43 | 0.1% |
| Asia | 5,828 | 9.2% |
| Austria | 6 | 0.0% |
| Belarus | 96 | 0.2% |
| Brazil | 369 | 0.6% |
| Cambodia | 131 | 0.2% |
| Canada | 373 | 0.6% |
| Caribbean | 96 | 0.2% |
| Central America | 886 | 1.4% |
| China | 946 | 1.5% |
| Colombia | 133 | 0.2% |
| Denmark | 13 | 0.0% |
| Eastern Africa | 1,620 | 2.5% |
| Eastern Asia | 1,201 | 1.9% |
| Eastern Europe | 379 | 0.6% |
| Ecuador | 51 | 0.1% |
| Egypt | 216 | 0.3% |
| El Salvador | 32 | 0.1% |
| England | 225 | 0.4% |
| Ethiopia | 156 | 0.3% |
| Europe | 974 | 1.5% |
| France | 22 | 0.0% |
| Germany | 158 | 0.3% |
| Ghana | 26 | 0.0% |
| Grenada | 8 | 0.0% |
| Guatemala | 39 | 0.1% |
| Guyana | 114 | 0.2% |
| Haiti | 52 | 0.1% |
| Honduras | 11 | 0.0% |
| Hong Kong | 39 | 0.1% |
| Hungary | 29 | 0.1% |
| India | 3,324 | 5.2% |
| Indonesia | 44 | 0.1% |
| Iran | 191 | 0.3% |
| Iraq | 18 | 0.0% |
| Ireland | 20 | 0.0% |
| Israel | 7 | 0.0% |
| Jamaica | 26 | 0.0% |
| Japan | 19 | 0.0% |
| Jordan | 8 | 0.0% |
| Kazakhstan | 43 | 0.1% |
| Kenya | 282 | 0.4% |
| Korea | 236 | 0.4% |
| Laos | 25 | 0.0% |
| Latin America | 1,931 | 3.0% |
| Lebanon | 24 | 0.0% |
| Liberia | 19 | 0.0% |
| Lithuania | 16 | 0.0% |
| Malaysia | 40 | 0.1% |
| Mexico | 804 | 1.3% |
| Moldova | 71 | 0.1% |
| Netherlands | 22 | 0.0% |
| Nigeria | 23 | 0.0% |
| Northern Africa | 377 | 0.6% |
| Northern Europe | 379 | 0.6% |
| Pakistan | 20 | 0.0% |
| Peru | 84 | 0.1% |
| Philippines | 163 | 0.3% |
| Russia | 108 | 0.2% |
| Saudi Arabia | 77 | 0.1% |
| Somalia | 1,087 | 1.7% |
| South Africa | 34 | 0.1% |
| South America | 949 | 1.5% |
| South Central Asia | 3,650 | 5.7% |
| South Eastern Asia | 819 | 1.3% |
| Sri Lanka | 30 | 0.1% |
| Sweden | 7 | 0.0% |
| Switzerland | 8 | 0.0% |
| Syria | 16 | 0.0% |
| Taiwan | 118 | 0.2% |
| Thailand | 102 | 0.2% |
| Trinidad and Tobago | 10 | 0.0% |
| Turkey | 8 | 0.0% |
| Ukraine | 46 | 0.1% |
| Uruguay | 21 | 0.0% |
| Venezuela | 131 | 0.2% |
| Vietnam | 314 | 0.5% |
| Western Africa | 68 | 0.1% |
| Western Asia | 158 | 0.3% |
| Western Europe | 216 | 0.3% | View All 82 Rows |
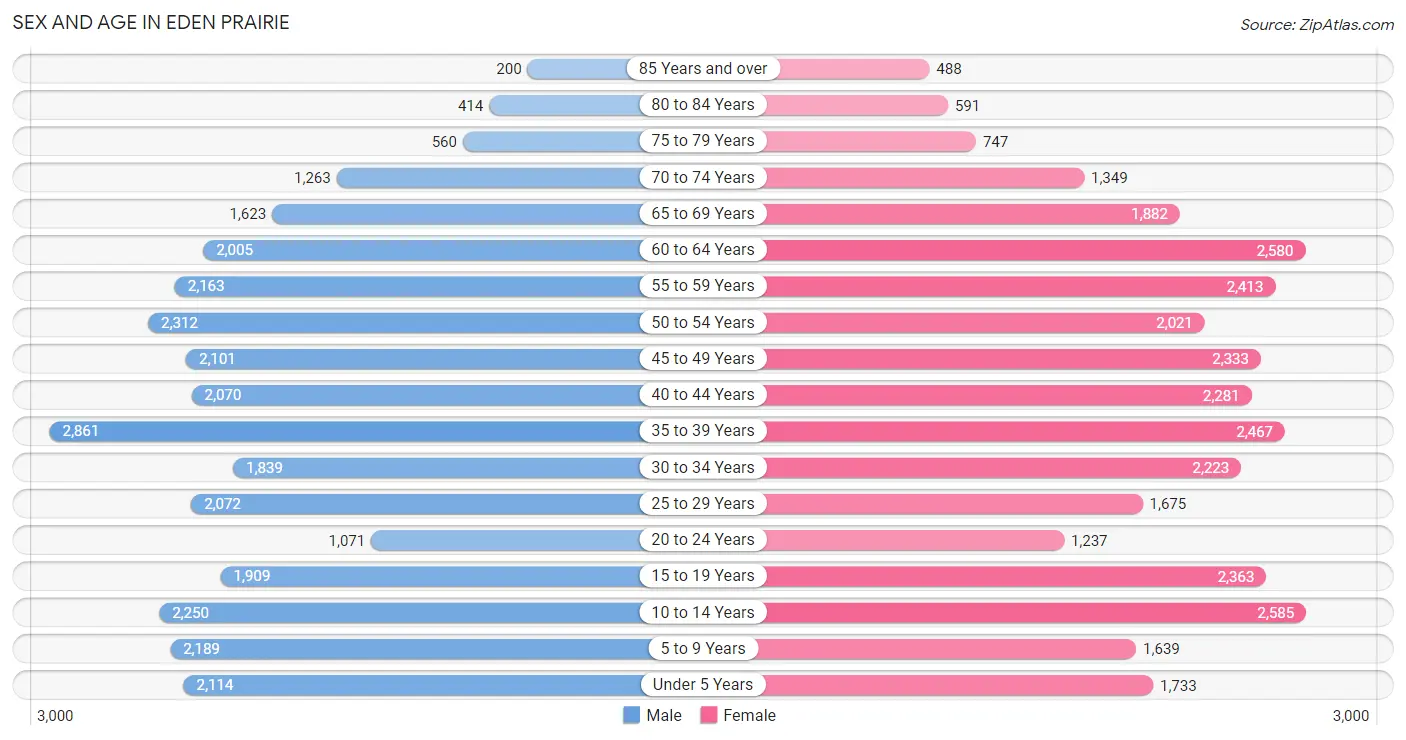
Sex and Age in Eden Prairie
Sex and Age in Eden Prairie
The most populous age groups in Eden Prairie are 35 to 39 Years (2,861 | 9.2%) for men and 10 to 14 Years (2,585 | 7.9%) for women.
| Age Bracket | Male | Female |
| Under 5 Years | 2,114 (6.8%) | 1,733 (5.3%) |
| 5 to 9 Years | 2,189 (7.1%) | 1,639 (5.0%) |
| 10 to 14 Years | 2,250 (7.2%) | 2,585 (7.9%) |
| 15 to 19 Years | 1,909 (6.1%) | 2,363 (7.2%) |
| 20 to 24 Years | 1,071 (3.5%) | 1,237 (3.8%) |
| 25 to 29 Years | 2,072 (6.7%) | 1,675 (5.1%) |
| 30 to 34 Years | 1,839 (5.9%) | 2,223 (6.8%) |
| 35 to 39 Years | 2,861 (9.2%) | 2,467 (7.6%) |
| 40 to 44 Years | 2,070 (6.7%) | 2,281 (7.0%) |
| 45 to 49 Years | 2,101 (6.8%) | 2,333 (7.1%) |
| 50 to 54 Years | 2,312 (7.4%) | 2,021 (6.2%) |
| 55 to 59 Years | 2,163 (7.0%) | 2,413 (7.4%) |
| 60 to 64 Years | 2,005 (6.5%) | 2,580 (7.9%) |
| 65 to 69 Years | 1,623 (5.2%) | 1,882 (5.8%) |
| 70 to 74 Years | 1,263 (4.1%) | 1,349 (4.1%) |
| 75 to 79 Years | 560 (1.8%) | 747 (2.3%) |
| 80 to 84 Years | 414 (1.3%) | 591 (1.8%) |
| 85 Years and over | 200 (0.6%) | 488 (1.5%) |
| Total | 31,016 (100.0%) | 32,607 (100.0%) |
Families and Households in Eden Prairie
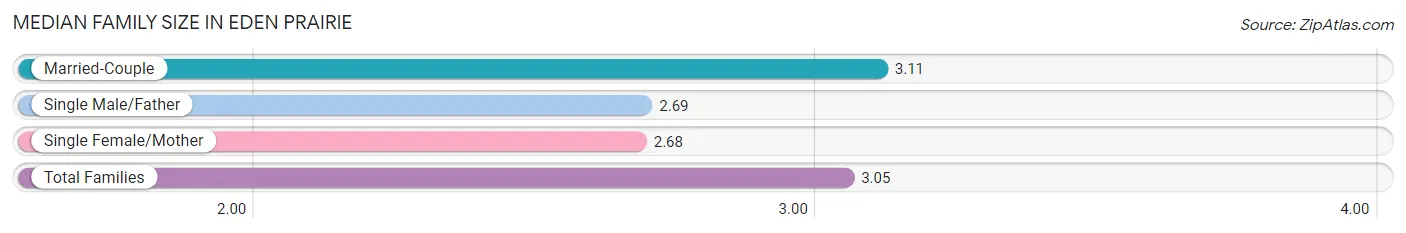
Median Family Size in Eden Prairie
The median family size in Eden Prairie is 3.05 persons per family, with married-couple families (14,913 | 84.9%) accounting for the largest median family size of 3.11 persons per family. On the other hand, single female/mother families (1,788 | 10.2%) represent the smallest median family size with 2.68 persons per family.
| Family Type | # Families | Family Size |
| Married-Couple | 14,913 (84.9%) | 3.11 |
| Single Male/Father | 861 (4.9%) | 2.69 |
| Single Female/Mother | 1,788 (10.2%) | 2.68 |
| Total Families | 17,562 (100.0%) | 3.05 |
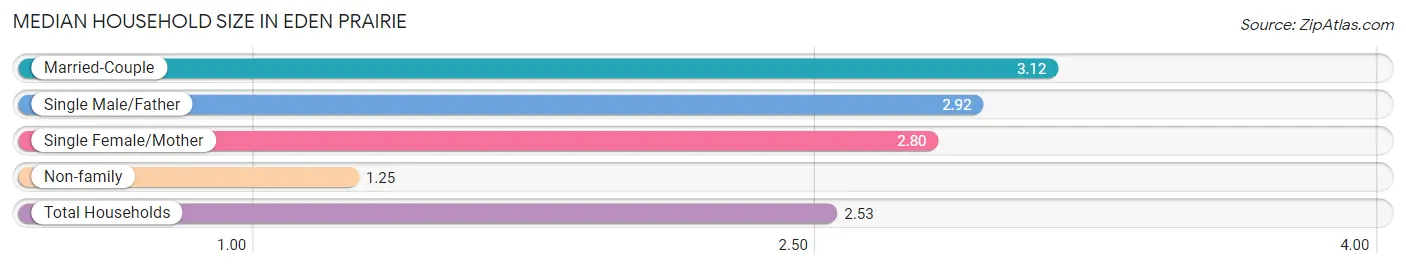
Median Household Size in Eden Prairie
The median household size in Eden Prairie is 2.53 persons per household, with married-couple households (14,913 | 59.5%) accounting for the largest median household size of 3.12 persons per household. non-family households (7,508 | 29.9%) represent the smallest median household size with 1.25 persons per household.
| Household Type | # Households | Household Size |
| Married-Couple | 14,913 (59.5%) | 3.12 |
| Single Male/Father | 861 (3.4%) | 2.92 |
| Single Female/Mother | 1,788 (7.1%) | 2.80 |
| Non-family | 7,508 (29.9%) | 1.25 |
| Total Households | 25,070 (100.0%) | 2.53 |
Household Size by Marriage Status in Eden Prairie
Out of a total of 25,070 households in Eden Prairie, 17,562 (70.1%) are family households, while 7,508 (29.9%) are nonfamily households. The most numerous type of family households are 2-person households, comprising 7,284, and the most common type of nonfamily households are 1-person households, comprising 6,102.
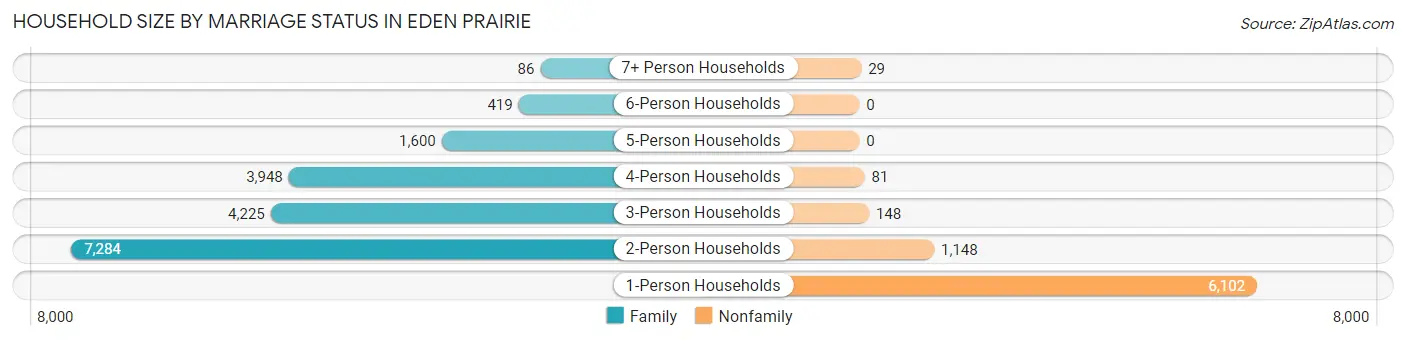
| Household Size | Family Households | Nonfamily Households |
| 1-Person Households | - | 6,102 (24.3%) |
| 2-Person Households | 7,284 (29.0%) | 1,148 (4.6%) |
| 3-Person Households | 4,225 (16.9%) | 148 (0.6%) |
| 4-Person Households | 3,948 (15.8%) | 81 (0.3%) |
| 5-Person Households | 1,600 (6.4%) | 0 (0.0%) |
| 6-Person Households | 419 (1.7%) | 0 (0.0%) |
| 7+ Person Households | 86 (0.3%) | 29 (0.1%) |
| Total | 17,562 (70.1%) | 7,508 (29.9%) |
Female Fertility in Eden Prairie
Fertility by Age in Eden Prairie
Average fertility rate in Eden Prairie is 58.0 births per 1,000 women. Women in the age bracket of 20 to 34 years have the highest fertility rate with 99.0 births per 1,000 women. Women in the age bracket of 20 to 34 years acount for 58.2% of all women with births.
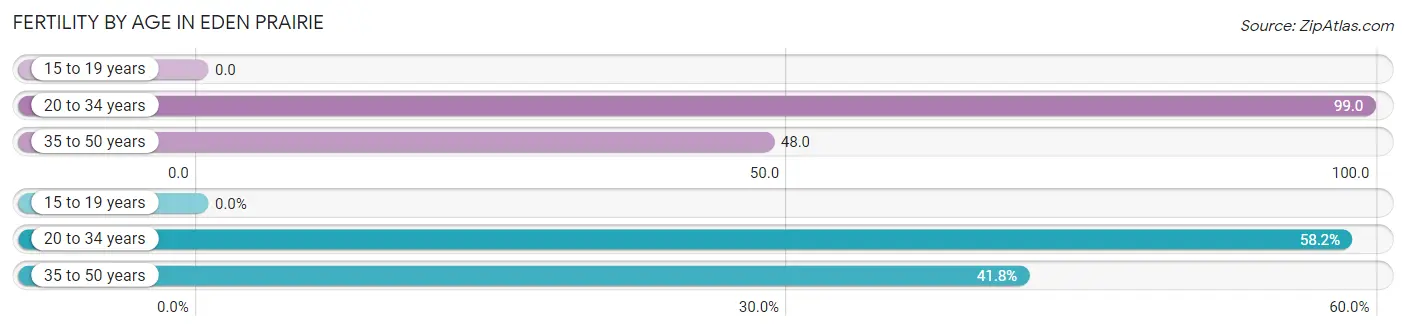
| Age Bracket | Women with Births | Births / 1,000 Women |
| 15 to 19 years | 0 (0.0%) | 0.0 |
| 20 to 34 years | 510 (58.2%) | 99.0 |
| 35 to 50 years | 366 (41.8%) | 48.0 |
| Total | 876 (100.0%) | 58.0 |
Fertility by Age by Marriage Status in Eden Prairie
90.2% of women with births (876) in Eden Prairie are married. The highest percentage of unmarried women with births falls into 20 to 34 years age bracket with 16.9% of them unmarried at the time of birth, while the lowest percentage of unmarried women with births belong to 35 to 50 years age bracket with 0.0% of them unmarried.
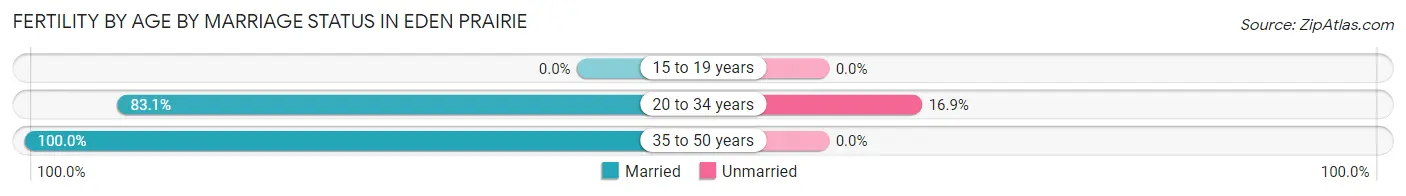
| Age Bracket | Married | Unmarried |
| 15 to 19 years | 0 (0.0%) | 0 (0.0%) |
| 20 to 34 years | 424 (83.1%) | 86 (16.9%) |
| 35 to 50 years | 366 (100.0%) | 0 (0.0%) |
| Total | 790 (90.2%) | 86 (9.8%) |
Fertility by Education in Eden Prairie
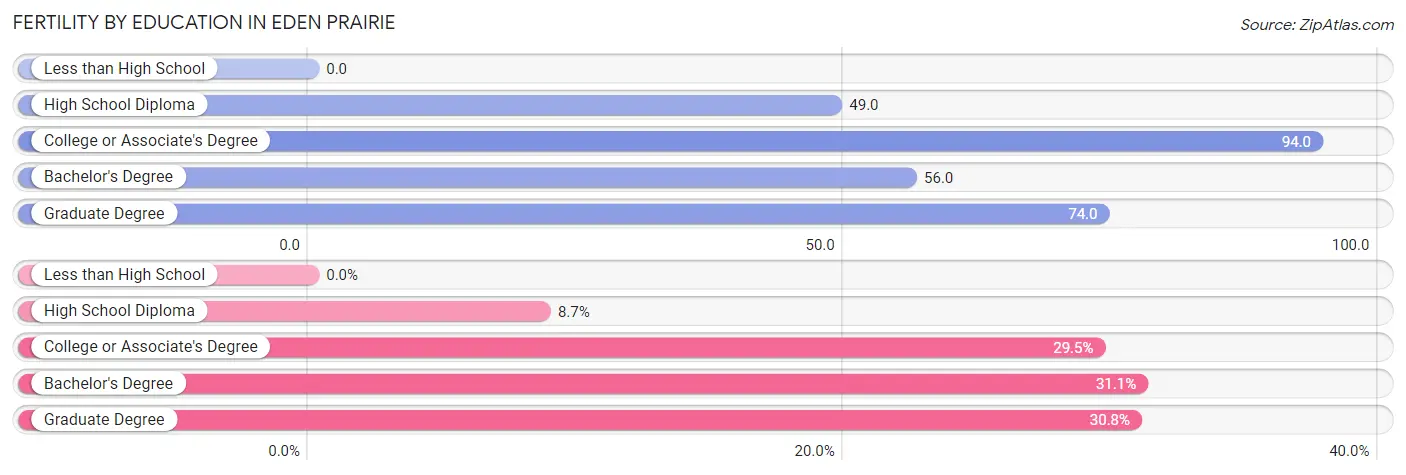
| Educational Attainment | Women with Births | Births / 1,000 Women |
| Less than High School | 0 (0.0%) | 0.0 |
| High School Diploma | 76 (8.7%) | 49.0 |
| College or Associate's Degree | 258 (29.4%) | 94.0 |
| Bachelor's Degree | 272 (31.0%) | 56.0 |
| Graduate Degree | 270 (30.8%) | 74.0 |
| Total | 876 (100.0%) | 58.0 |
Fertility by Education by Marriage Status in Eden Prairie
9.8% of women with births in Eden Prairie are unmarried. Women with the educational attainment of bachelor's degree are most likely to be married with 100.0% of them married at childbirth, while women with the educational attainment of college or associate's degree are least likely to be married with 31.0% of them unmarried at childbirth.
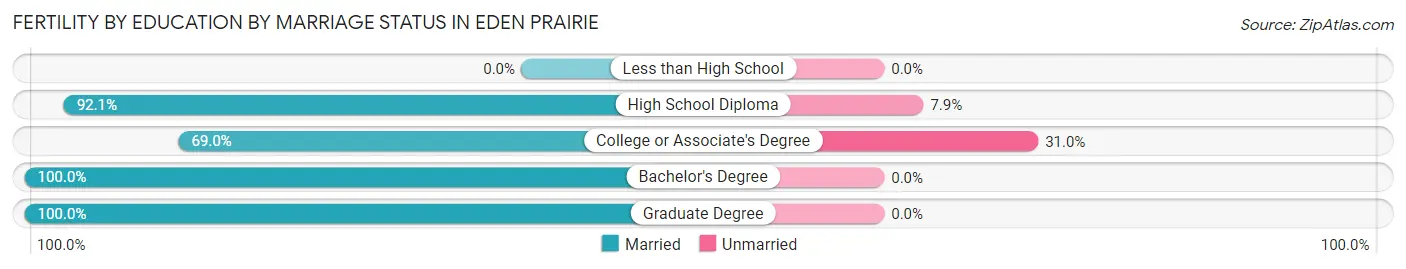
| Educational Attainment | Married | Unmarried |
| Less than High School | 0 (0.0%) | 0 (0.0%) |
| High School Diploma | 70 (92.1%) | 6 (7.9%) |
| College or Associate's Degree | 178 (69.0%) | 80 (31.0%) |
| Bachelor's Degree | 272 (100.0%) | 0 (0.0%) |
| Graduate Degree | 270 (100.0%) | 0 (0.0%) |
| Total | 790 (90.2%) | 86 (9.8%) |
Employment Characteristics in Eden Prairie
Employment by Class of Employer in Eden Prairie
Among the 34,183 employed individuals in Eden Prairie, private company employees (26,177 | 76.6%), not-for-profit organizations (2,485 | 7.3%), and self-employed (incorporated) (1,710 | 5.0%) make up the most common classes of employment.
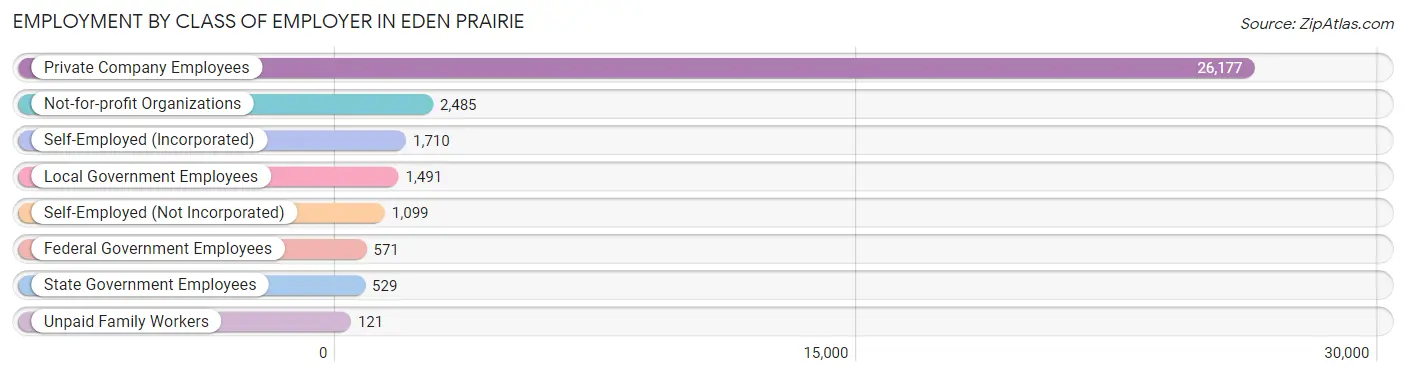
| Employer Class | # Employees | % Employees |
| Private Company Employees | 26,177 | 76.6% |
| Self-Employed (Incorporated) | 1,710 | 5.0% |
| Self-Employed (Not Incorporated) | 1,099 | 3.2% |
| Not-for-profit Organizations | 2,485 | 7.3% |
| Local Government Employees | 1,491 | 4.4% |
| State Government Employees | 529 | 1.5% |
| Federal Government Employees | 571 | 1.7% |
| Unpaid Family Workers | 121 | 0.4% |
| Total | 34,183 | 100.0% |
Employment Status by Age in Eden Prairie
According to the labor force statistics for Eden Prairie, out of the total population over 16 years of age (50,188), 72.0% or 36,135 individuals are in the labor force, with 3.8% or 1,373 of them unemployed. The age group with the highest labor force participation rate is 25 to 29 years, with 91.9% or 3,443 individuals in the labor force. Within the labor force, the 16 to 19 years age range has the highest percentage of unemployed individuals, with 10.7% or 197 of them being unemployed.
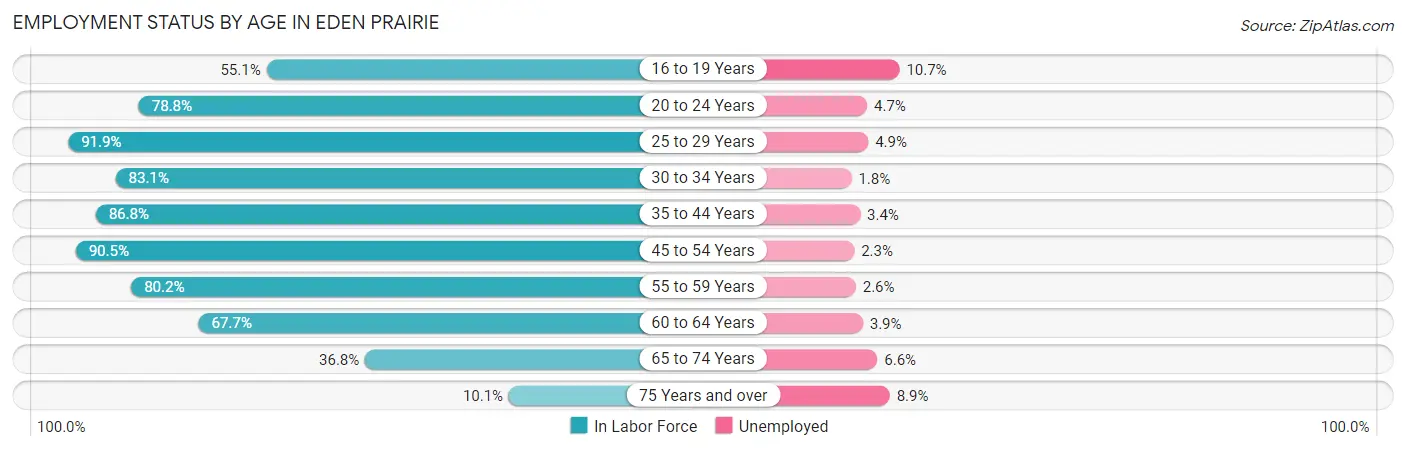
| Age Bracket | In Labor Force | Unemployed |
| 16 to 19 Years | 1,844 (55.1%) | 197 (10.7%) |
| 20 to 24 Years | 1,819 (78.8%) | 85 (4.7%) |
| 25 to 29 Years | 3,443 (91.9%) | 169 (4.9%) |
| 30 to 34 Years | 3,376 (83.1%) | 61 (1.8%) |
| 35 to 44 Years | 8,401 (86.8%) | 286 (3.4%) |
| 45 to 54 Years | 7,934 (90.5%) | 182 (2.3%) |
| 55 to 59 Years | 3,670 (80.2%) | 95 (2.6%) |
| 60 to 64 Years | 3,104 (67.7%) | 121 (3.9%) |
| 65 to 74 Years | 2,251 (36.8%) | 149 (6.6%) |
| 75 Years and over | 303 (10.1%) | 27 (8.9%) |
| Total | 36,135 (72.0%) | 1,373 (3.8%) |
Employment Status by Educational Attainment in Eden Prairie
According to labor force statistics for Eden Prairie, 84.5% of individuals (29,927) out of the total population between 25 and 64 years of age (35,416) are in the labor force, with 3.1% or 928 of them being unemployed. The group with the highest labor force participation rate are those with the educational attainment of less than high school, with 87.2% or 1,024 individuals in the labor force. Within the labor force, individuals with less than high school education have the highest percentage of unemployment, with 15.9% or 163 of them being unemployed.
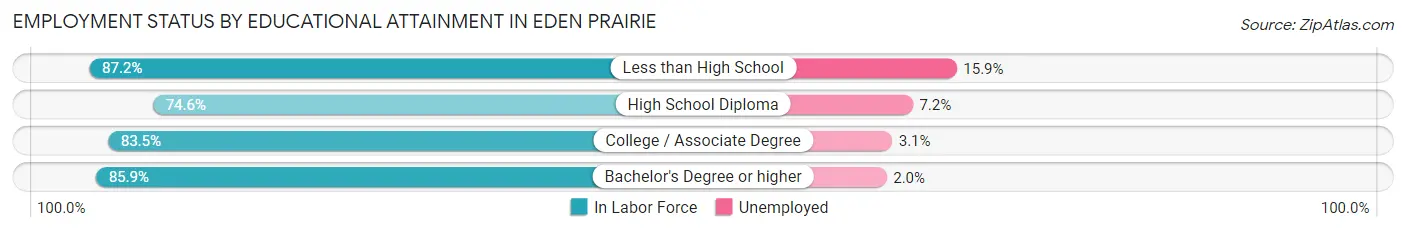
| Educational Attainment | In Labor Force | Unemployed |
| Less than High School | 1,024 (87.2%) | 187 (15.9%) |
| High School Diploma | 2,207 (74.6%) | 213 (7.2%) |
| College / Associate Degree | 6,135 (83.5%) | 228 (3.1%) |
| Bachelor's Degree or higher | 20,562 (85.9%) | 479 (2.0%) |
| Total | 29,927 (84.5%) | 1,098 (3.1%) |
Employment Occupations by Sex in Eden Prairie
Management, Business, Science and Arts Occupations
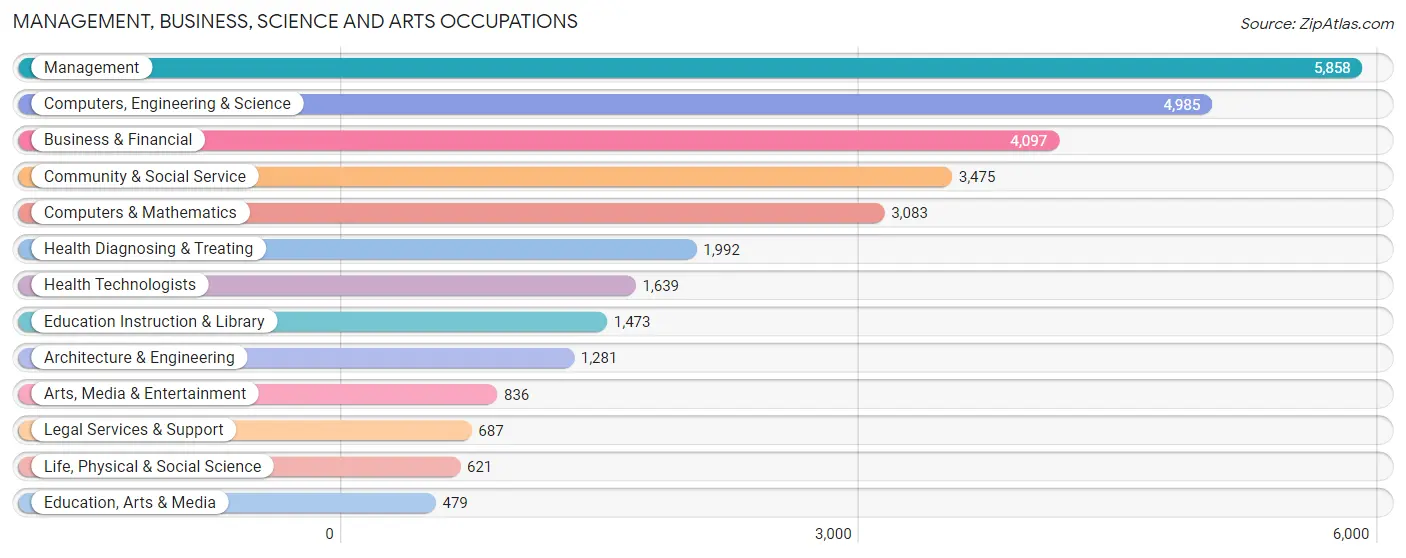
The most common Management, Business, Science and Arts occupations in Eden Prairie are Management (5,858 | 16.9%), Computers, Engineering & Science (4,985 | 14.4%), Business & Financial (4,097 | 11.8%), Community & Social Service (3,475 | 10.0%), and Computers & Mathematics (3,083 | 8.9%).
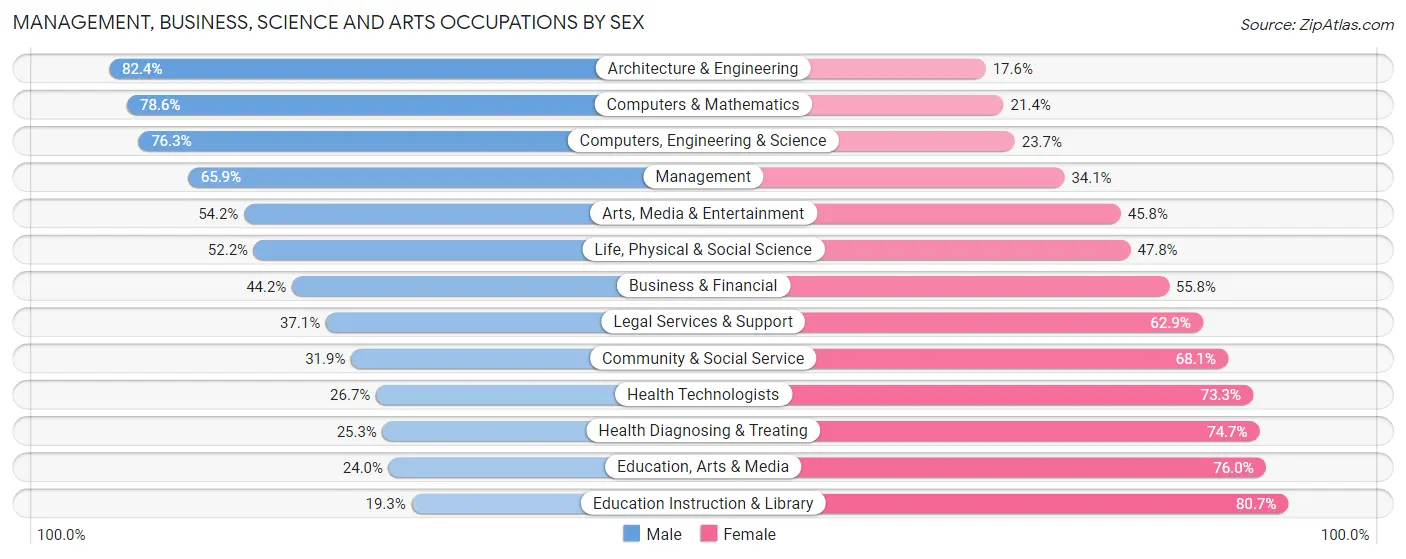
Management, Business, Science and Arts Occupations by Sex
Within the Management, Business, Science and Arts occupations in Eden Prairie, the most male-oriented occupations are Architecture & Engineering (82.4%), Computers & Mathematics (78.6%), and Computers, Engineering & Science (76.3%), while the most female-oriented occupations are Education Instruction & Library (80.7%), Education, Arts & Media (76.0%), and Health Diagnosing & Treating (74.7%).
| Occupation | Male | Female |
| Management | 3,863 (65.9%) | 1,995 (34.1%) |
| Business & Financial | 1,810 (44.2%) | 2,287 (55.8%) |
| Computers, Engineering & Science | 3,803 (76.3%) | 1,182 (23.7%) |
| Computers & Mathematics | 2,424 (78.6%) | 659 (21.4%) |
| Architecture & Engineering | 1,055 (82.4%) | 226 (17.6%) |
| Life, Physical & Social Science | 324 (52.2%) | 297 (47.8%) |
| Community & Social Service | 1,107 (31.9%) | 2,368 (68.1%) |
| Education, Arts & Media | 115 (24.0%) | 364 (76.0%) |
| Legal Services & Support | 255 (37.1%) | 432 (62.9%) |
| Education Instruction & Library | 284 (19.3%) | 1,189 (80.7%) |
| Arts, Media & Entertainment | 453 (54.2%) | 383 (45.8%) |
| Health Diagnosing & Treating | 504 (25.3%) | 1,488 (74.7%) |
| Health Technologists | 437 (26.7%) | 1,202 (73.3%) |
| Total (Category) | 11,087 (54.3%) | 9,320 (45.7%) |
| Total (Overall) | 18,692 (53.8%) | 16,026 (46.2%) |
Services Occupations
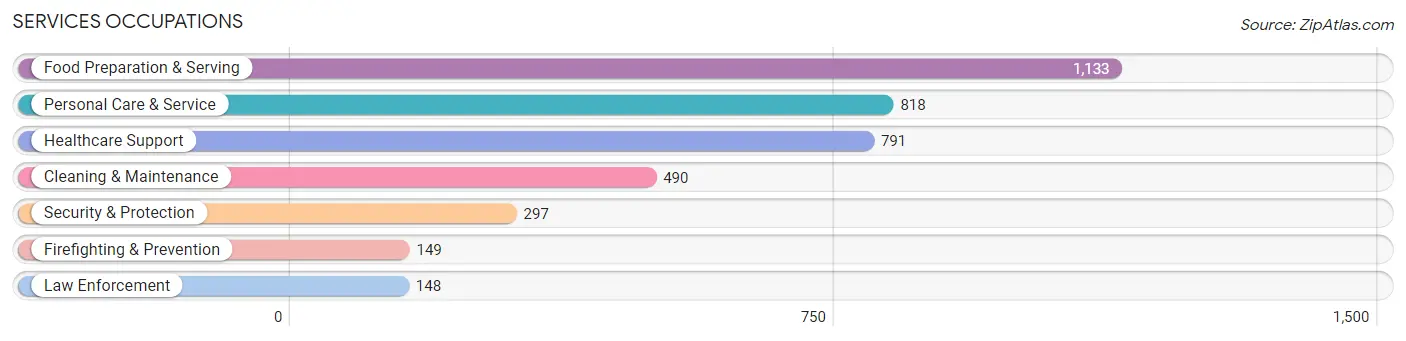
The most common Services occupations in Eden Prairie are Food Preparation & Serving (1,133 | 3.3%), Personal Care & Service (818 | 2.4%), Healthcare Support (791 | 2.3%), Cleaning & Maintenance (490 | 1.4%), and Security & Protection (297 | 0.9%).
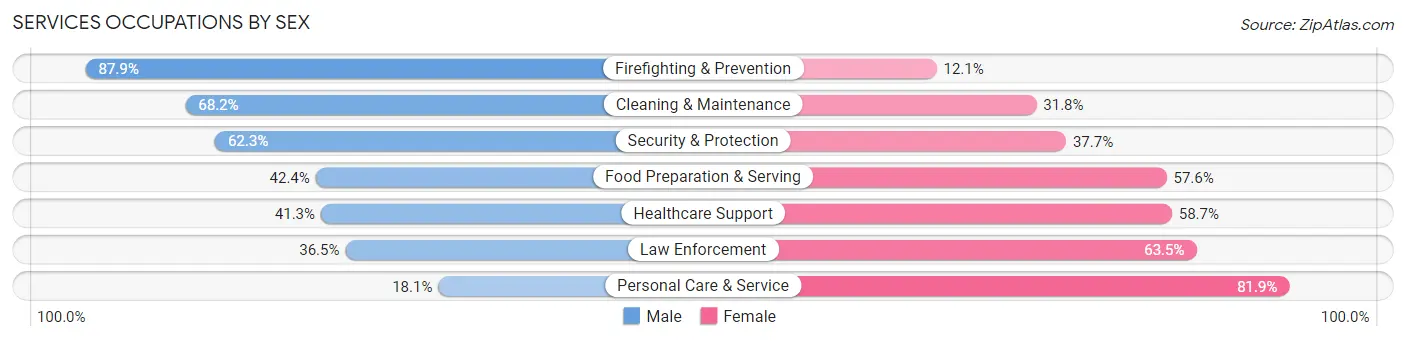
Services Occupations by Sex
Within the Services occupations in Eden Prairie, the most male-oriented occupations are Firefighting & Prevention (87.9%), Cleaning & Maintenance (68.2%), and Security & Protection (62.3%), while the most female-oriented occupations are Personal Care & Service (81.9%), Law Enforcement (63.5%), and Healthcare Support (58.7%).
| Occupation | Male | Female |
| Healthcare Support | 327 (41.3%) | 464 (58.7%) |
| Security & Protection | 185 (62.3%) | 112 (37.7%) |
| Firefighting & Prevention | 131 (87.9%) | 18 (12.1%) |
| Law Enforcement | 54 (36.5%) | 94 (63.5%) |
| Food Preparation & Serving | 480 (42.4%) | 653 (57.6%) |
| Cleaning & Maintenance | 334 (68.2%) | 156 (31.8%) |
| Personal Care & Service | 148 (18.1%) | 670 (81.9%) |
| Total (Category) | 1,474 (41.8%) | 2,055 (58.2%) |
| Total (Overall) | 18,692 (53.8%) | 16,026 (46.2%) |
Sales and Office Occupations
The most common Sales and Office occupations in Eden Prairie are Sales & Related (4,498 | 13.0%), and Office & Administration (2,816 | 8.1%).

Sales and Office Occupations by Sex
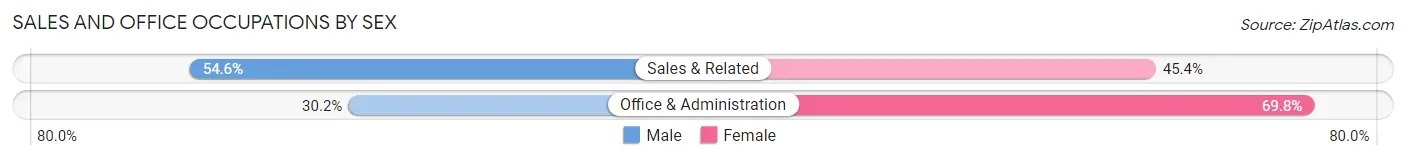
| Occupation | Male | Female |
| Sales & Related | 2,455 (54.6%) | 2,043 (45.4%) |
| Office & Administration | 851 (30.2%) | 1,965 (69.8%) |
| Total (Category) | 3,306 (45.2%) | 4,008 (54.8%) |
| Total (Overall) | 18,692 (53.8%) | 16,026 (46.2%) |
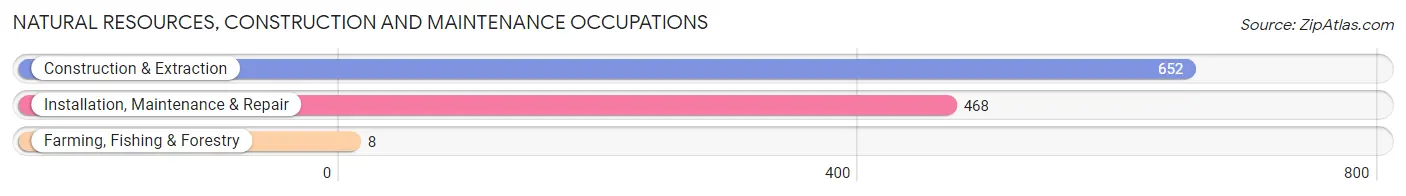
Natural Resources, Construction and Maintenance Occupations
The most common Natural Resources, Construction and Maintenance occupations in Eden Prairie are Construction & Extraction (652 | 1.9%), Installation, Maintenance & Repair (468 | 1.3%), and Farming, Fishing & Forestry (8 | 0.0%).
Natural Resources, Construction and Maintenance Occupations by Sex
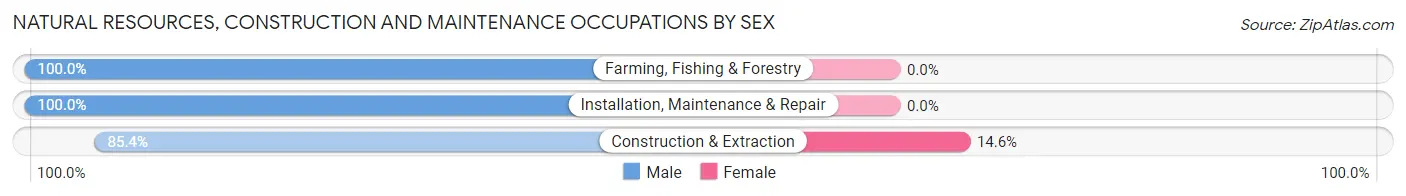
| Occupation | Male | Female |
| Farming, Fishing & Forestry | 8 (100.0%) | 0 (0.0%) |
| Construction & Extraction | 557 (85.4%) | 95 (14.6%) |
| Installation, Maintenance & Repair | 468 (100.0%) | 0 (0.0%) |
| Total (Category) | 1,033 (91.6%) | 95 (8.4%) |
| Total (Overall) | 18,692 (53.8%) | 16,026 (46.2%) |
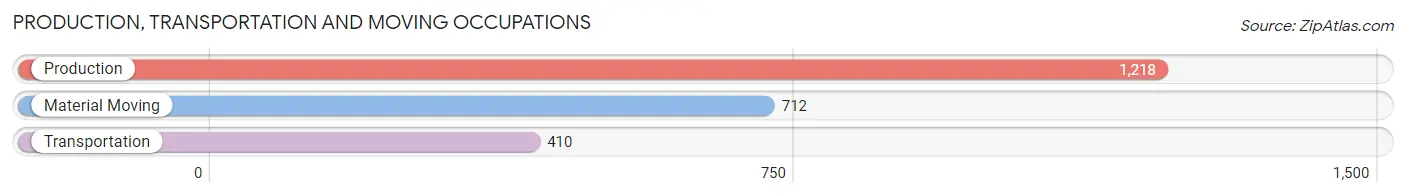
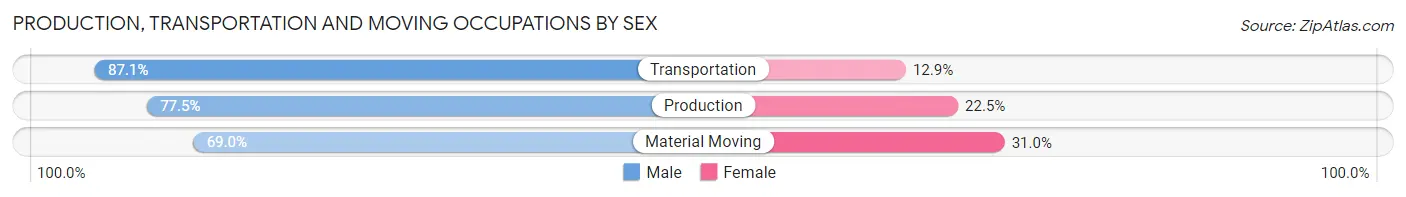
Production, Transportation and Moving Occupations
The most common Production, Transportation and Moving occupations in Eden Prairie are Production (1,218 | 3.5%), Material Moving (712 | 2.1%), and Transportation (410 | 1.2%).
Production, Transportation and Moving Occupations by Sex
| Occupation | Male | Female |
| Production | 944 (77.5%) | 274 (22.5%) |
| Transportation | 357 (87.1%) | 53 (12.9%) |
| Material Moving | 491 (69.0%) | 221 (31.0%) |
| Total (Category) | 1,792 (76.6%) | 548 (23.4%) |
| Total (Overall) | 18,692 (53.8%) | 16,026 (46.2%) |
Employment Industries by Sex in Eden Prairie
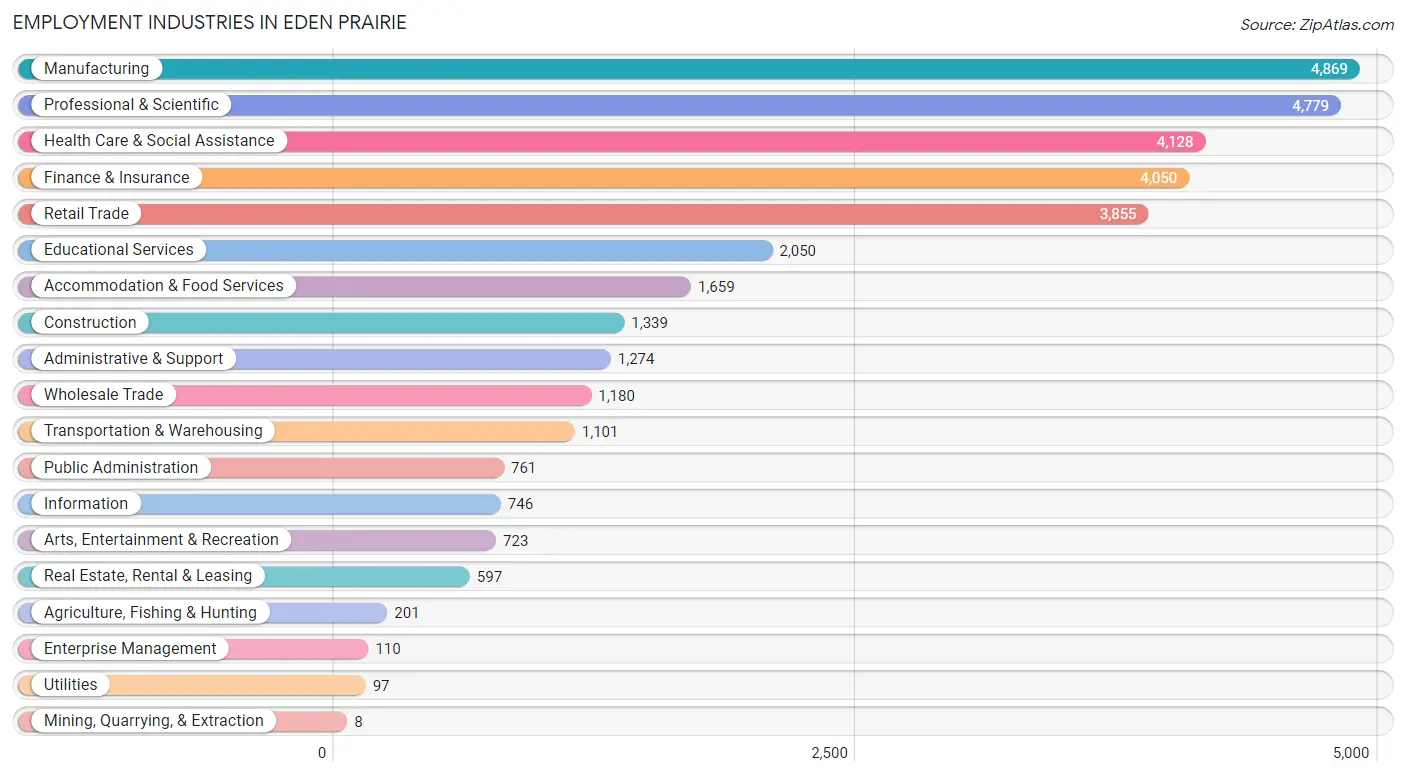
Employment Industries in Eden Prairie
The major employment industries in Eden Prairie include Manufacturing (4,869 | 14.0%), Professional & Scientific (4,779 | 13.8%), Health Care & Social Assistance (4,128 | 11.9%), Finance & Insurance (4,050 | 11.7%), and Retail Trade (3,855 | 11.1%).
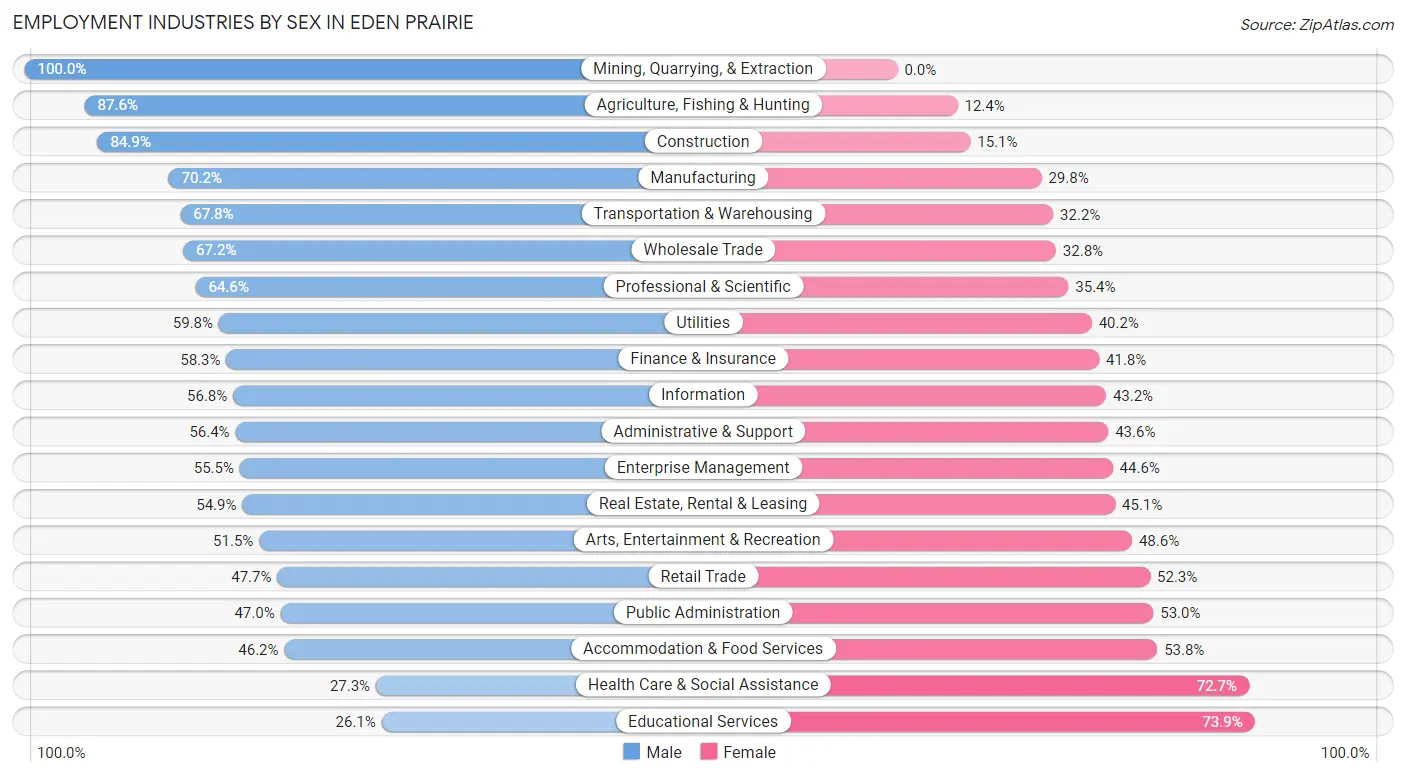
Employment Industries by Sex in Eden Prairie
The Eden Prairie industries that see more men than women are Mining, Quarrying, & Extraction (100.0%), Agriculture, Fishing & Hunting (87.6%), and Construction (84.9%), whereas the industries that tend to have a higher number of women are Educational Services (73.9%), Health Care & Social Assistance (72.7%), and Accommodation & Food Services (53.8%).
| Industry | Male | Female |
| Agriculture, Fishing & Hunting | 176 (87.6%) | 25 (12.4%) |
| Mining, Quarrying, & Extraction | 8 (100.0%) | 0 (0.0%) |
| Construction | 1,137 (84.9%) | 202 (15.1%) |
| Manufacturing | 3,417 (70.2%) | 1,452 (29.8%) |
| Wholesale Trade | 793 (67.2%) | 387 (32.8%) |
| Retail Trade | 1,839 (47.7%) | 2,016 (52.3%) |
| Transportation & Warehousing | 746 (67.8%) | 355 (32.2%) |
| Utilities | 58 (59.8%) | 39 (40.2%) |
| Information | 424 (56.8%) | 322 (43.2%) |
| Finance & Insurance | 2,359 (58.3%) | 1,691 (41.7%) |
| Real Estate, Rental & Leasing | 328 (54.9%) | 269 (45.1%) |
| Professional & Scientific | 3,088 (64.6%) | 1,691 (35.4%) |
| Enterprise Management | 61 (55.4%) | 49 (44.6%) |
| Administrative & Support | 718 (56.4%) | 556 (43.6%) |
| Educational Services | 535 (26.1%) | 1,515 (73.9%) |
| Health Care & Social Assistance | 1,126 (27.3%) | 3,002 (72.7%) |
| Arts, Entertainment & Recreation | 372 (51.4%) | 351 (48.5%) |
| Accommodation & Food Services | 767 (46.2%) | 892 (53.8%) |
| Public Administration | 358 (47.0%) | 403 (53.0%) |
| Total | 18,692 (53.8%) | 16,026 (46.2%) |
Education in Eden Prairie
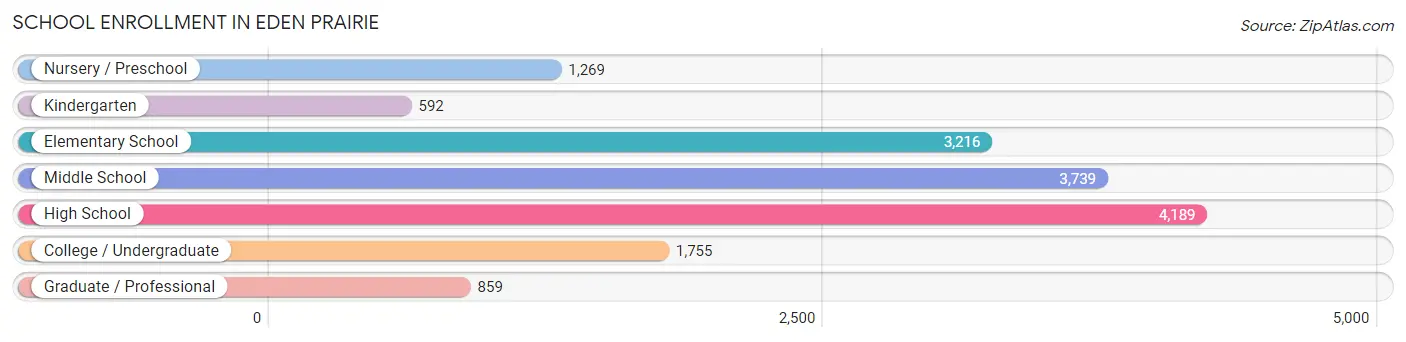
School Enrollment in Eden Prairie
The most common levels of schooling among the 15,619 students in Eden Prairie are high school (4,189 | 26.8%), middle school (3,739 | 23.9%), and elementary school (3,216 | 20.6%).
| School Level | # Students | % Students |
| Nursery / Preschool | 1,269 | 8.1% |
| Kindergarten | 592 | 3.8% |
| Elementary School | 3,216 | 20.6% |
| Middle School | 3,739 | 23.9% |
| High School | 4,189 | 26.8% |
| College / Undergraduate | 1,755 | 11.2% |
| Graduate / Professional | 859 | 5.5% |
| Total | 15,619 | 100.0% |
School Enrollment by Age by Funding Source in Eden Prairie
Out of a total of 15,619 students who are enrolled in schools in Eden Prairie, 2,562 (16.4%) attend a private institution, while the remaining 13,057 (83.6%) are enrolled in public schools. The age group of 3 to 4 year olds has the highest likelihood of being enrolled in private schools, with 475 (50.3% in the age bracket) enrolled. Conversely, the age group of 15 to 17 year olds has the lowest likelihood of being enrolled in a private school, with 2,659 (90.0% in the age bracket) attending a public institution.
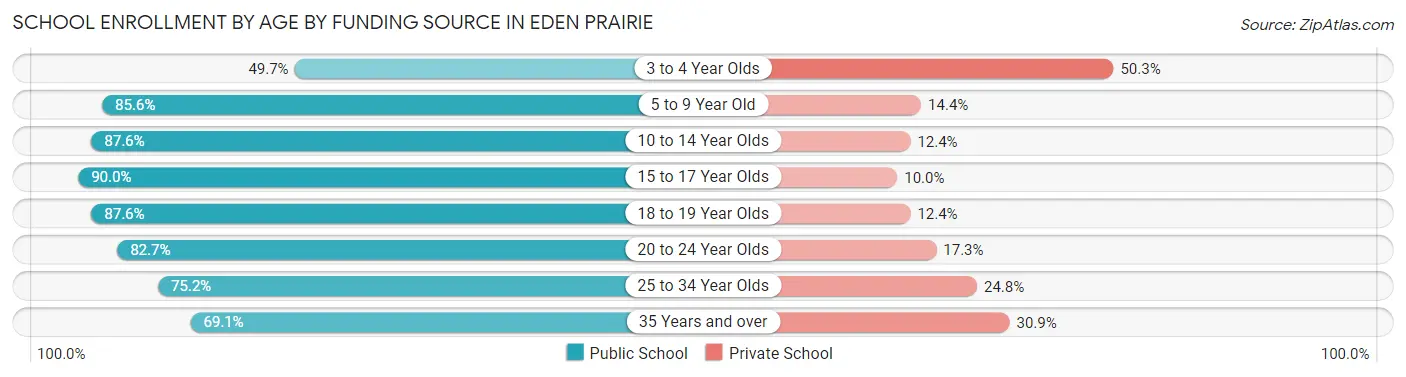
| Age Bracket | Public School | Private School |
| 3 to 4 Year Olds | 470 (49.7%) | 475 (50.3%) |
| 5 to 9 Year Old | 3,154 (85.6%) | 532 (14.4%) |
| 10 to 14 Year Olds | 4,181 (87.6%) | 594 (12.4%) |
| 15 to 17 Year Olds | 2,659 (90.0%) | 295 (10.0%) |
| 18 to 19 Year Olds | 845 (87.6%) | 120 (12.4%) |
| 20 to 24 Year Olds | 695 (82.7%) | 145 (17.3%) |
| 25 to 34 Year Olds | 599 (75.2%) | 198 (24.8%) |
| 35 Years and over | 454 (69.1%) | 203 (30.9%) |
| Total | 13,057 (83.6%) | 2,562 (16.4%) |
Educational Attainment by Field of Study in Eden Prairie
Business (8,117 | 25.2%), engineering (3,149 | 9.8%), social sciences (2,714 | 8.4%), education (2,582 | 8.0%), and computers & mathematics (2,294 | 7.1%) are the most common fields of study among 32,186 individuals in Eden Prairie who have obtained a bachelor's degree or higher.
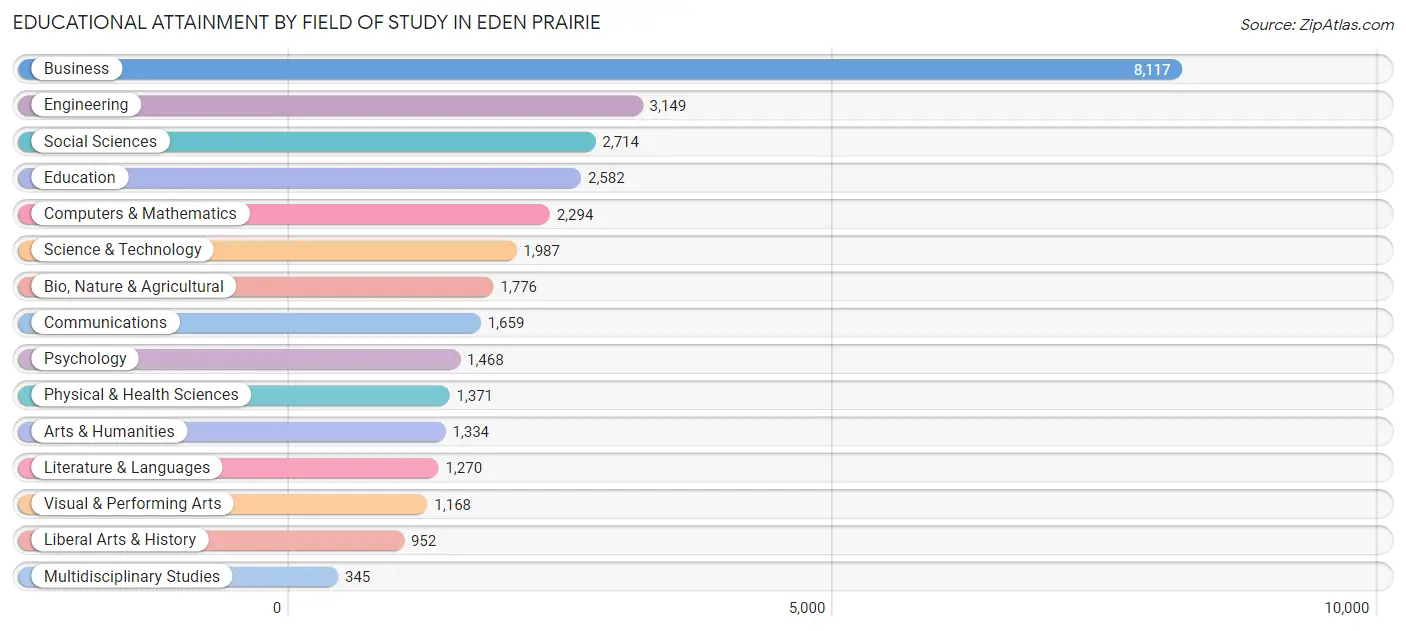
| Field of Study | # Graduates | % Graduates |
| Computers & Mathematics | 2,294 | 7.1% |
| Bio, Nature & Agricultural | 1,776 | 5.5% |
| Physical & Health Sciences | 1,371 | 4.3% |
| Psychology | 1,468 | 4.6% |
| Social Sciences | 2,714 | 8.4% |
| Engineering | 3,149 | 9.8% |
| Multidisciplinary Studies | 345 | 1.1% |
| Science & Technology | 1,987 | 6.2% |
| Business | 8,117 | 25.2% |
| Education | 2,582 | 8.0% |
| Literature & Languages | 1,270 | 4.0% |
| Liberal Arts & History | 952 | 3.0% |
| Visual & Performing Arts | 1,168 | 3.6% |
| Communications | 1,659 | 5.1% |
| Arts & Humanities | 1,334 | 4.1% |
| Total | 32,186 | 100.0% |
Transportation & Commute in Eden Prairie
Vehicle Availability by Sex in Eden Prairie
The most prevalent vehicle ownership categories in Eden Prairie are males with 2 vehicles (9,499, accounting for 51.3%) and females with 2 vehicles (7,566, making up 60.7%).
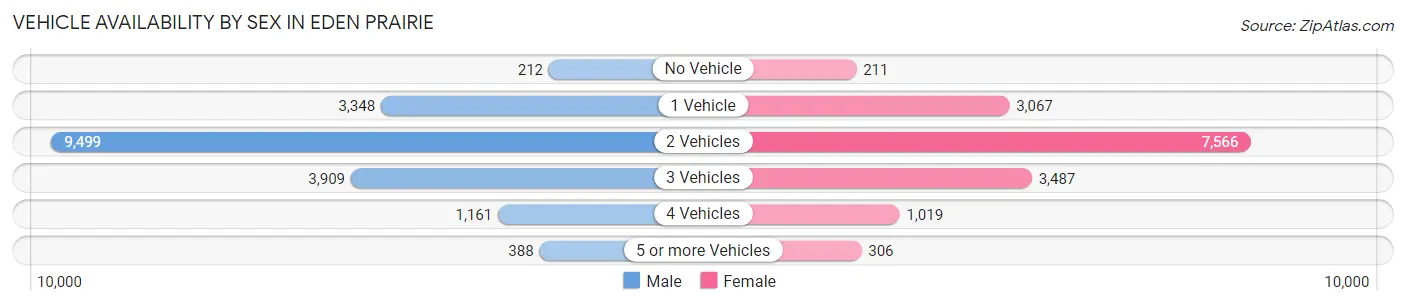
| Vehicles Available | Male | Female |
| No Vehicle | 212 (1.1%) | 211 (1.3%) |
| 1 Vehicle | 3,348 (18.1%) | 3,067 (19.6%) |
| 2 Vehicles | 9,499 (51.3%) | 7,566 (48.3%) |
| 3 Vehicles | 3,909 (21.1%) | 3,487 (22.3%) |
| 4 Vehicles | 1,161 (6.3%) | 1,019 (6.5%) |
| 5 or more Vehicles | 388 (2.1%) | 306 (1.9%) |
| Total | 18,517 (100.0%) | 15,656 (100.0%) |
Commute Time in Eden Prairie
The most frequently occuring commute durations in Eden Prairie are 15 to 19 minutes (4,716 commuters, 18.0%), 20 to 24 minutes (4,491 commuters, 17.1%), and 10 to 14 minutes (4,379 commuters, 16.7%).
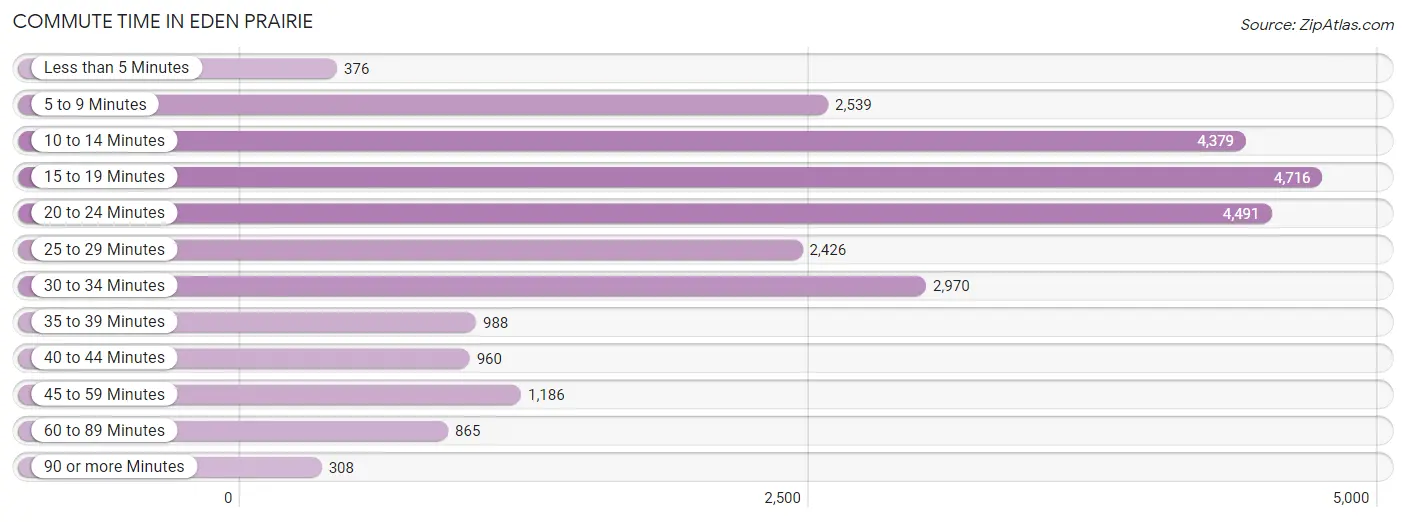
| Commute Time | # Commuters | % Commuters |
| Less than 5 Minutes | 376 | 1.4% |
| 5 to 9 Minutes | 2,539 | 9.7% |
| 10 to 14 Minutes | 4,379 | 16.7% |
| 15 to 19 Minutes | 4,716 | 18.0% |
| 20 to 24 Minutes | 4,491 | 17.1% |
| 25 to 29 Minutes | 2,426 | 9.3% |
| 30 to 34 Minutes | 2,970 | 11.3% |
| 35 to 39 Minutes | 988 | 3.8% |
| 40 to 44 Minutes | 960 | 3.7% |
| 45 to 59 Minutes | 1,186 | 4.5% |
| 60 to 89 Minutes | 865 | 3.3% |
| 90 or more Minutes | 308 | 1.2% |
Commute Time by Sex in Eden Prairie
The most common commute times in Eden Prairie are 20 to 24 minutes (2,958 commuters, 20.4%) for males and 10 to 14 minutes (2,486 commuters, 21.2%) for females.
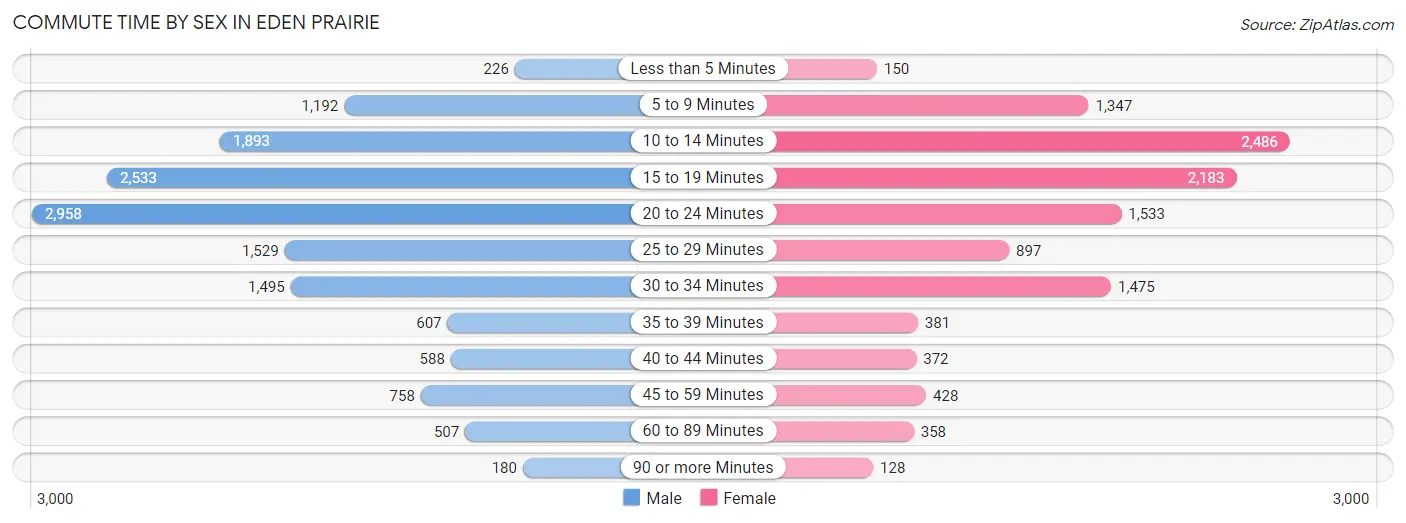
| Commute Time | Male | Female |
| Less than 5 Minutes | 226 (1.6%) | 150 (1.3%) |
| 5 to 9 Minutes | 1,192 (8.2%) | 1,347 (11.5%) |
| 10 to 14 Minutes | 1,893 (13.1%) | 2,486 (21.2%) |
| 15 to 19 Minutes | 2,533 (17.5%) | 2,183 (18.6%) |
| 20 to 24 Minutes | 2,958 (20.4%) | 1,533 (13.1%) |
| 25 to 29 Minutes | 1,529 (10.6%) | 897 (7.6%) |
| 30 to 34 Minutes | 1,495 (10.3%) | 1,475 (12.6%) |
| 35 to 39 Minutes | 607 (4.2%) | 381 (3.3%) |
| 40 to 44 Minutes | 588 (4.1%) | 372 (3.2%) |
| 45 to 59 Minutes | 758 (5.2%) | 428 (3.6%) |
| 60 to 89 Minutes | 507 (3.5%) | 358 (3.0%) |
| 90 or more Minutes | 180 (1.2%) | 128 (1.1%) |
Time of Departure to Work by Sex in Eden Prairie
The most frequent times of departure to work in Eden Prairie are 8:00 AM to 8:29 AM (2,479, 17.1%) for males and 7:00 AM to 7:29 AM (1,793, 15.3%) for females.
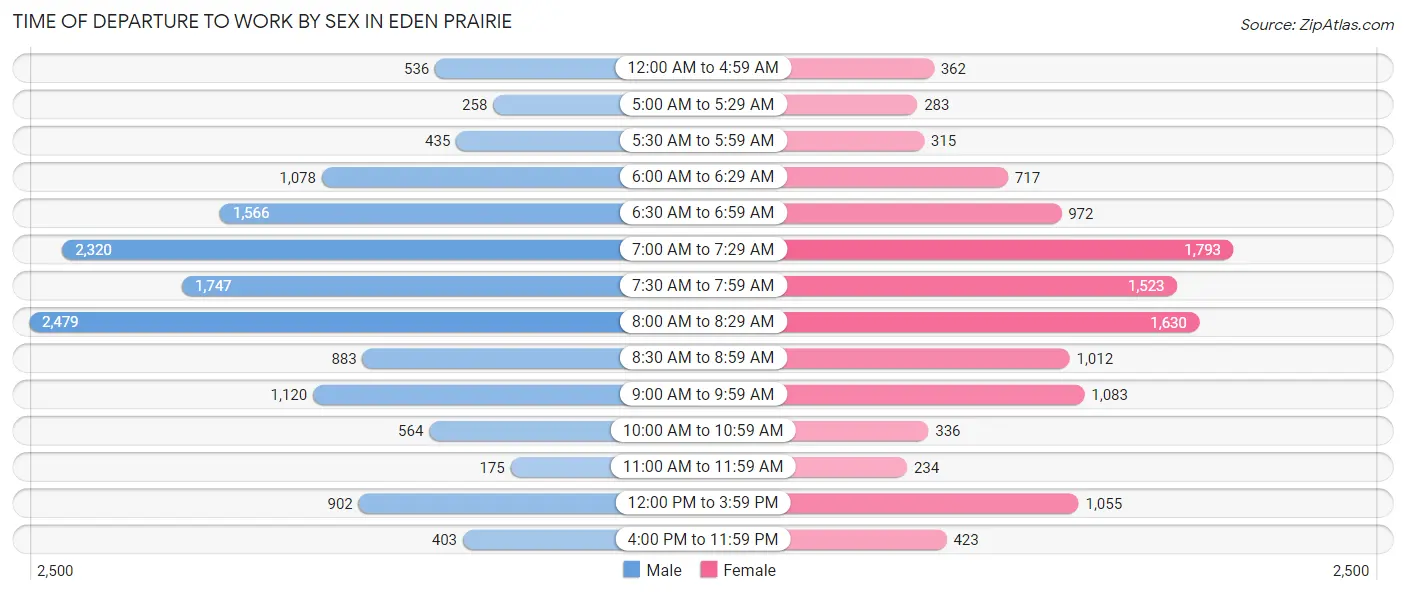
| Time of Departure | Male | Female |
| 12:00 AM to 4:59 AM | 536 (3.7%) | 362 (3.1%) |
| 5:00 AM to 5:29 AM | 258 (1.8%) | 283 (2.4%) |
| 5:30 AM to 5:59 AM | 435 (3.0%) | 315 (2.7%) |
| 6:00 AM to 6:29 AM | 1,078 (7.4%) | 717 (6.1%) |
| 6:30 AM to 6:59 AM | 1,566 (10.8%) | 972 (8.3%) |
| 7:00 AM to 7:29 AM | 2,320 (16.0%) | 1,793 (15.3%) |
| 7:30 AM to 7:59 AM | 1,747 (12.1%) | 1,523 (13.0%) |
| 8:00 AM to 8:29 AM | 2,479 (17.1%) | 1,630 (13.9%) |
| 8:30 AM to 8:59 AM | 883 (6.1%) | 1,012 (8.6%) |
| 9:00 AM to 9:59 AM | 1,120 (7.7%) | 1,083 (9.2%) |
| 10:00 AM to 10:59 AM | 564 (3.9%) | 336 (2.9%) |
| 11:00 AM to 11:59 AM | 175 (1.2%) | 234 (2.0%) |
| 12:00 PM to 3:59 PM | 902 (6.2%) | 1,055 (9.0%) |
| 4:00 PM to 11:59 PM | 403 (2.8%) | 423 (3.6%) |
| Total | 14,466 (100.0%) | 11,738 (100.0%) |
Housing Occupancy in Eden Prairie
Occupancy by Ownership in Eden Prairie
Of the total 25,070 dwellings in Eden Prairie, owner-occupied units account for 19,131 (76.3%), while renter-occupied units make up 5,939 (23.7%).
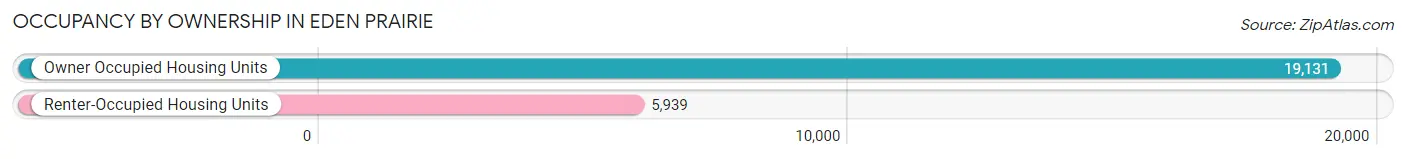
| Occupancy | # Housing Units | % Housing Units |
| Owner Occupied Housing Units | 19,131 | 76.3% |
| Renter-Occupied Housing Units | 5,939 | 23.7% |
| Total Occupied Housing Units | 25,070 | 100.0% |
Occupancy by Household Size in Eden Prairie
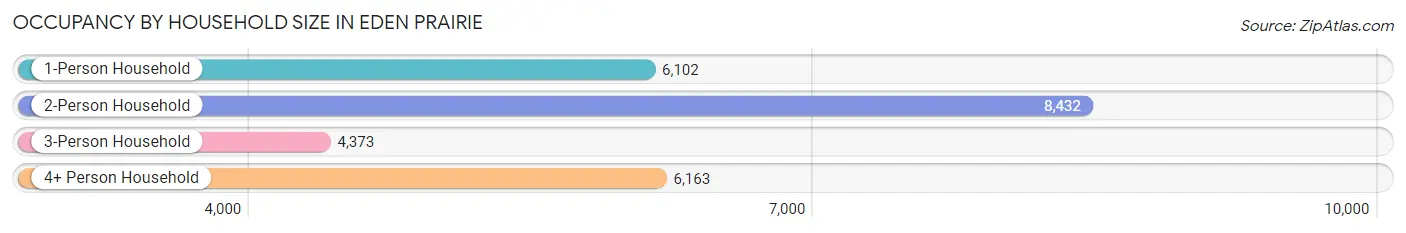
| Household Size | # Housing Units | % Housing Units |
| 1-Person Household | 6,102 | 24.3% |
| 2-Person Household | 8,432 | 33.6% |
| 3-Person Household | 4,373 | 17.4% |
| 4+ Person Household | 6,163 | 24.6% |
| Total Housing Units | 25,070 | 100.0% |
Occupancy by Ownership by Household Size in Eden Prairie
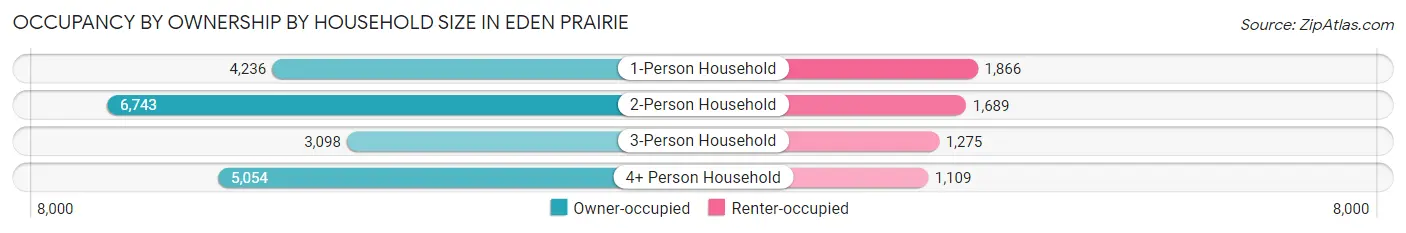
| Household Size | Owner-occupied | Renter-occupied |
| 1-Person Household | 4,236 (69.4%) | 1,866 (30.6%) |
| 2-Person Household | 6,743 (80.0%) | 1,689 (20.0%) |
| 3-Person Household | 3,098 (70.8%) | 1,275 (29.2%) |
| 4+ Person Household | 5,054 (82.0%) | 1,109 (18.0%) |
| Total Housing Units | 19,131 (76.3%) | 5,939 (23.7%) |
Occupancy by Educational Attainment in Eden Prairie
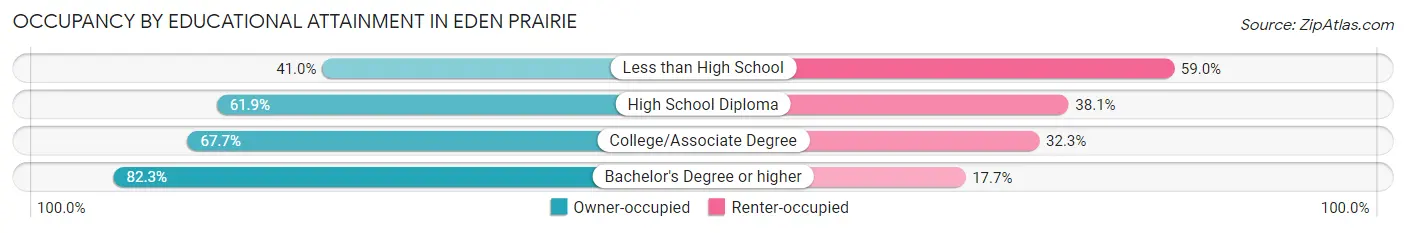
| Household Size | Owner-occupied | Renter-occupied |
| Less than High School | 261 (41.0%) | 376 (59.0%) |
| High School Diploma | 1,304 (61.9%) | 803 (38.1%) |
| College/Associate Degree | 3,780 (67.7%) | 1,804 (32.3%) |
| Bachelor's Degree or higher | 13,786 (82.3%) | 2,956 (17.7%) |
Occupancy by Age of Householder in Eden Prairie
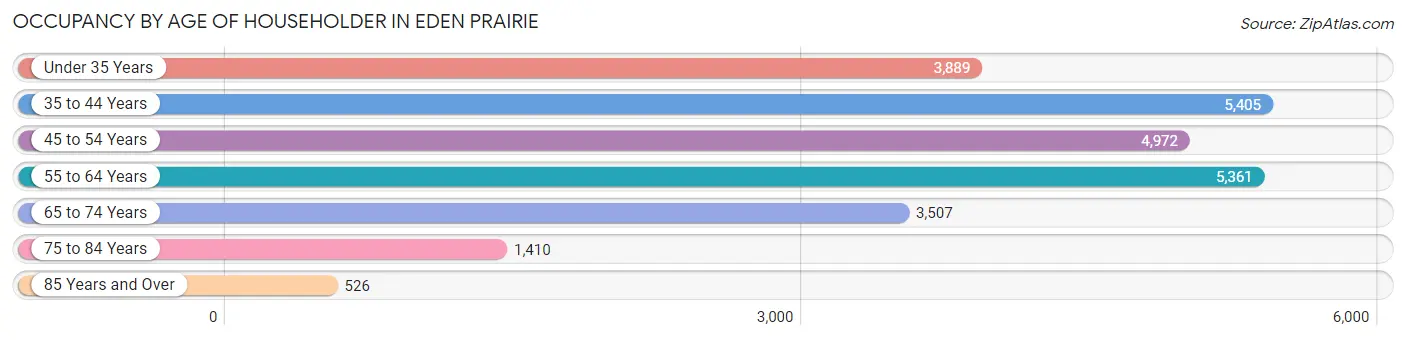
| Age Bracket | # Households | % Households |
| Under 35 Years | 3,889 | 15.5% |
| 35 to 44 Years | 5,405 | 21.6% |
| 45 to 54 Years | 4,972 | 19.8% |
| 55 to 64 Years | 5,361 | 21.4% |
| 65 to 74 Years | 3,507 | 14.0% |
| 75 to 84 Years | 1,410 | 5.6% |
| 85 Years and Over | 526 | 2.1% |
| Total | 25,070 | 100.0% |
Housing Finances in Eden Prairie
Median Income by Occupancy in Eden Prairie

| Occupancy Type | # Households | Median Income |
| Owner-Occupied | 19,131 (76.3%) | $147,632 |
| Renter-Occupied | 5,939 (23.7%) | $83,957 |
| Average | 25,070 (100.0%) | $129,345 |
Occupancy by Householder Income Bracket in Eden Prairie
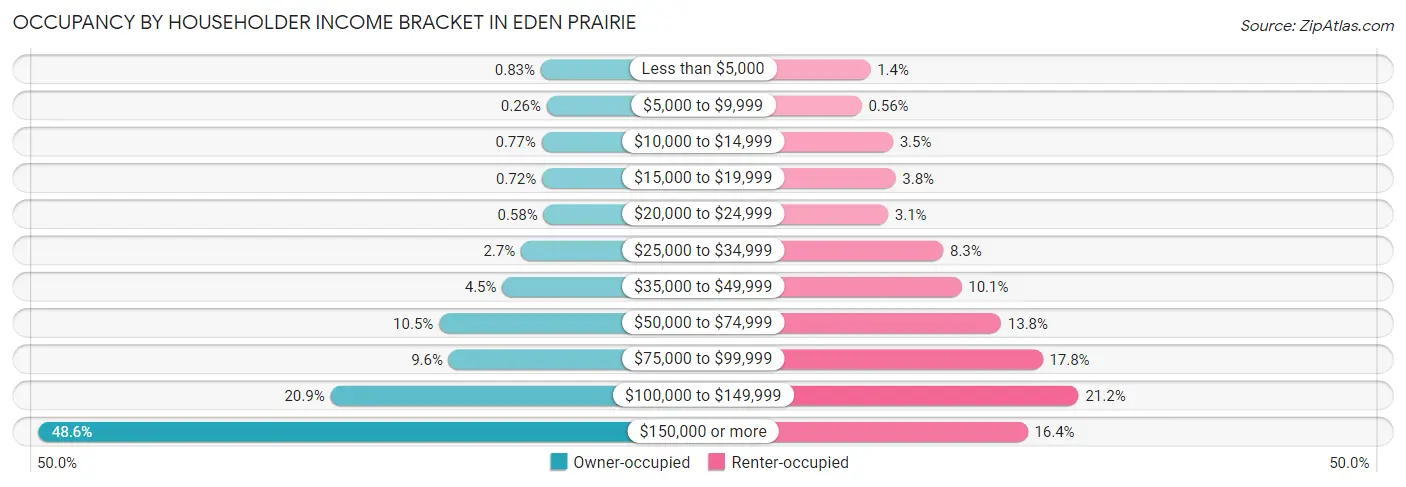
| Income Bracket | Owner-occupied | Renter-occupied |
| Less than $5,000 | 159 (0.8%) | 83 (1.4%) |
| $5,000 to $9,999 | 49 (0.3%) | 33 (0.6%) |
| $10,000 to $14,999 | 148 (0.8%) | 210 (3.5%) |
| $15,000 to $19,999 | 137 (0.7%) | 225 (3.8%) |
| $20,000 to $24,999 | 111 (0.6%) | 183 (3.1%) |
| $25,000 to $34,999 | 520 (2.7%) | 495 (8.3%) |
| $35,000 to $49,999 | 861 (4.5%) | 598 (10.1%) |
| $50,000 to $74,999 | 2,012 (10.5%) | 822 (13.8%) |
| $75,000 to $99,999 | 1,836 (9.6%) | 1,057 (17.8%) |
| $100,000 to $149,999 | 3,992 (20.9%) | 1,261 (21.2%) |
| $150,000 or more | 9,306 (48.6%) | 972 (16.4%) |
| Total | 19,131 (100.0%) | 5,939 (100.0%) |
Monthly Housing Cost Tiers in Eden Prairie
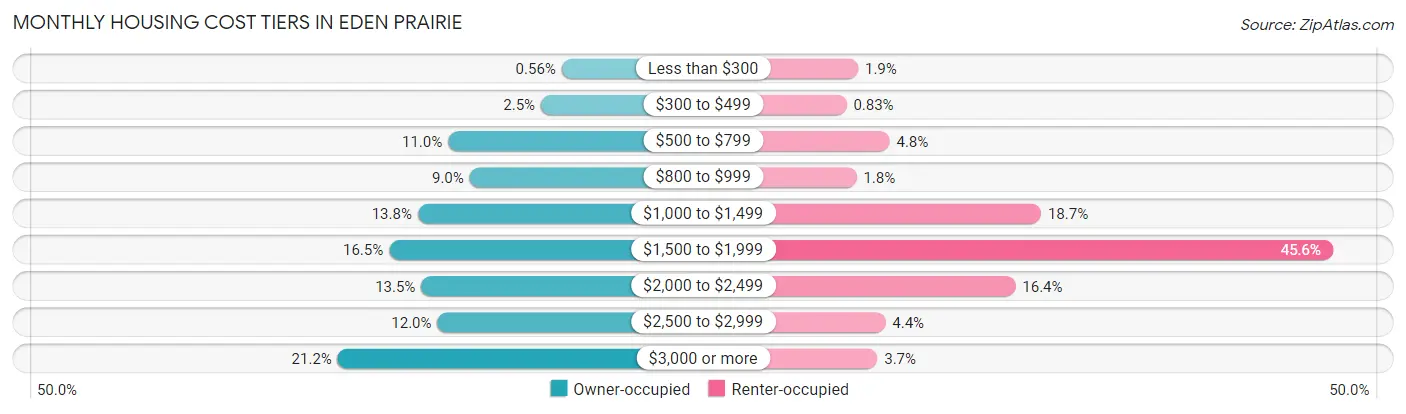
| Monthly Cost | Owner-occupied | Renter-occupied |
| Less than $300 | 108 (0.6%) | 113 (1.9%) |
| $300 to $499 | 472 (2.5%) | 49 (0.8%) |
| $500 to $799 | 2,108 (11.0%) | 285 (4.8%) |
| $800 to $999 | 1,727 (9.0%) | 104 (1.8%) |
| $1,000 to $1,499 | 2,642 (13.8%) | 1,113 (18.7%) |
| $1,500 to $1,999 | 3,147 (16.5%) | 2,708 (45.6%) |
| $2,000 to $2,499 | 2,580 (13.5%) | 973 (16.4%) |
| $2,500 to $2,999 | 2,295 (12.0%) | 262 (4.4%) |
| $3,000 or more | 4,052 (21.2%) | 218 (3.7%) |
| Total | 19,131 (100.0%) | 5,939 (100.0%) |
Physical Housing Characteristics in Eden Prairie
Housing Structures in Eden Prairie
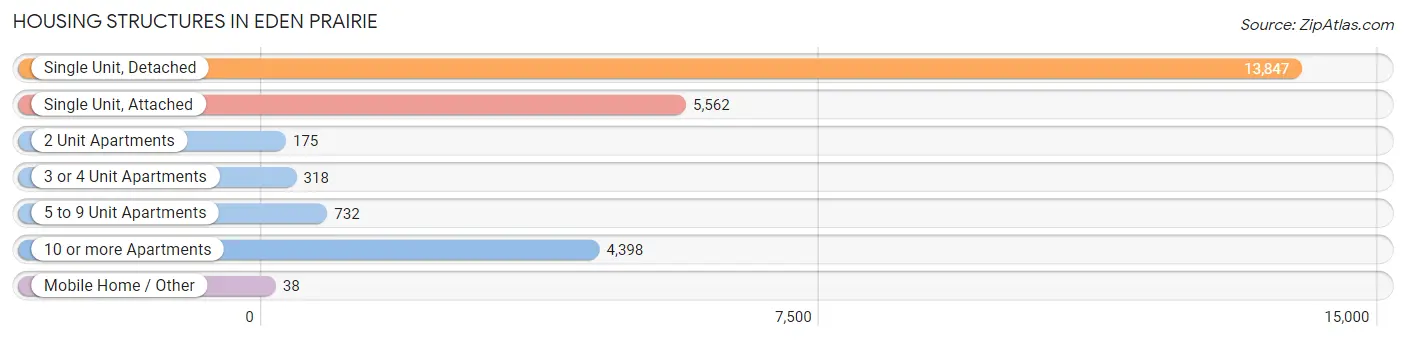
| Structure Type | # Housing Units | % Housing Units |
| Single Unit, Detached | 13,847 | 55.2% |
| Single Unit, Attached | 5,562 | 22.2% |
| 2 Unit Apartments | 175 | 0.7% |
| 3 or 4 Unit Apartments | 318 | 1.3% |
| 5 to 9 Unit Apartments | 732 | 2.9% |
| 10 or more Apartments | 4,398 | 17.5% |
| Mobile Home / Other | 38 | 0.2% |
| Total | 25,070 | 100.0% |
Housing Structures by Occupancy in Eden Prairie
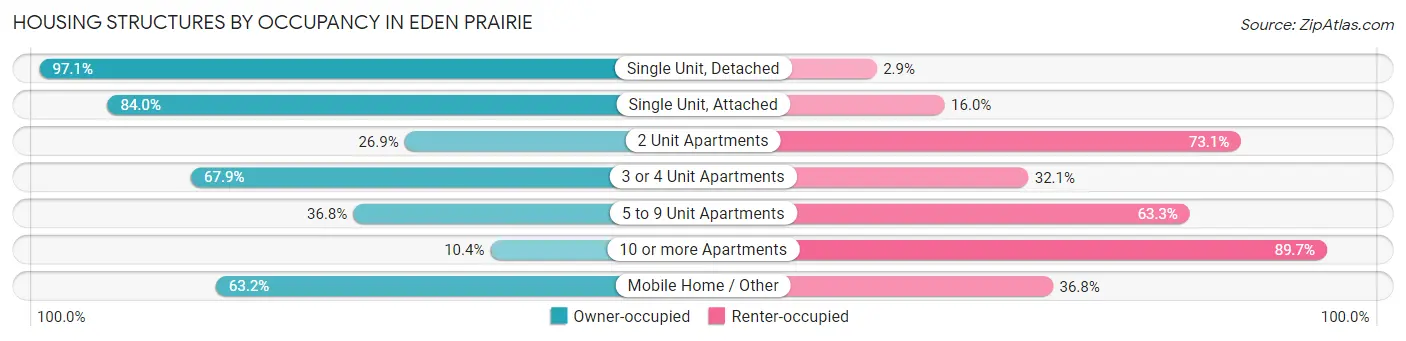
| Structure Type | Owner-occupied | Renter-occupied |
| Single Unit, Detached | 13,447 (97.1%) | 400 (2.9%) |
| Single Unit, Attached | 4,673 (84.0%) | 889 (16.0%) |
| 2 Unit Apartments | 47 (26.9%) | 128 (73.1%) |
| 3 or 4 Unit Apartments | 216 (67.9%) | 102 (32.1%) |
| 5 to 9 Unit Apartments | 269 (36.7%) | 463 (63.2%) |
| 10 or more Apartments | 455 (10.3%) | 3,943 (89.6%) |
| Mobile Home / Other | 24 (63.2%) | 14 (36.8%) |
| Total | 19,131 (76.3%) | 5,939 (23.7%) |
Housing Structures by Number of Rooms in Eden Prairie
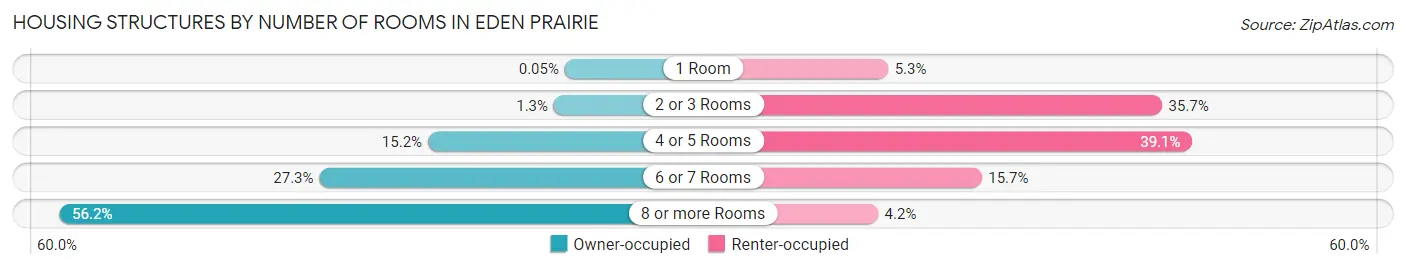
| Number of Rooms | Owner-occupied | Renter-occupied |
| 1 Room | 9 (0.1%) | 315 (5.3%) |
| 2 or 3 Rooms | 242 (1.3%) | 2,120 (35.7%) |
| 4 or 5 Rooms | 2,916 (15.2%) | 2,323 (39.1%) |
| 6 or 7 Rooms | 5,220 (27.3%) | 932 (15.7%) |
| 8 or more Rooms | 10,744 (56.2%) | 249 (4.2%) |
| Total | 19,131 (100.0%) | 5,939 (100.0%) |
Housing Structure by Heating Type in Eden Prairie
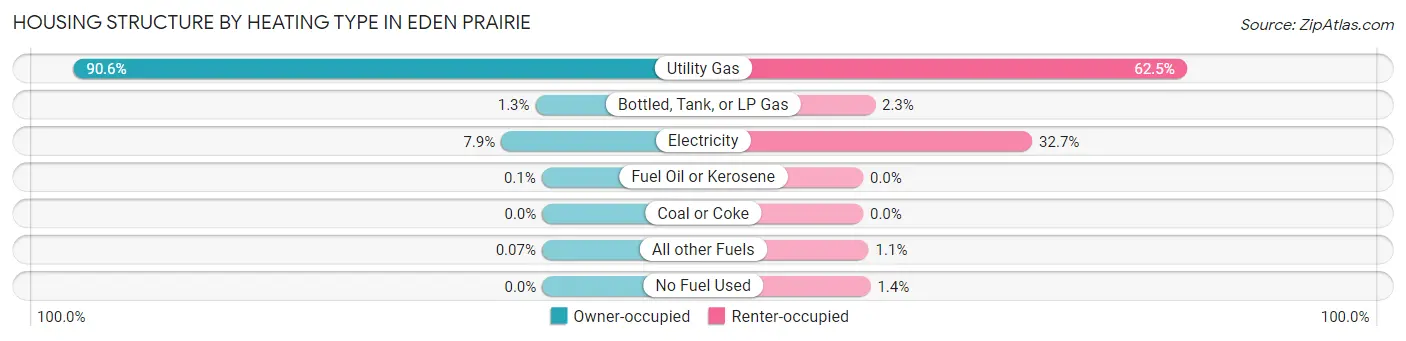
| Heating Type | Owner-occupied | Renter-occupied |
| Utility Gas | 17,330 (90.6%) | 3,712 (62.5%) |
| Bottled, Tank, or LP Gas | 249 (1.3%) | 137 (2.3%) |
| Electricity | 1,519 (7.9%) | 1,941 (32.7%) |
| Fuel Oil or Kerosene | 20 (0.1%) | 0 (0.0%) |
| Coal or Coke | 0 (0.0%) | 0 (0.0%) |
| All other Fuels | 13 (0.1%) | 64 (1.1%) |
| No Fuel Used | 0 (0.0%) | 85 (1.4%) |
| Total | 19,131 (100.0%) | 5,939 (100.0%) |
Household Vehicle Usage in Eden Prairie
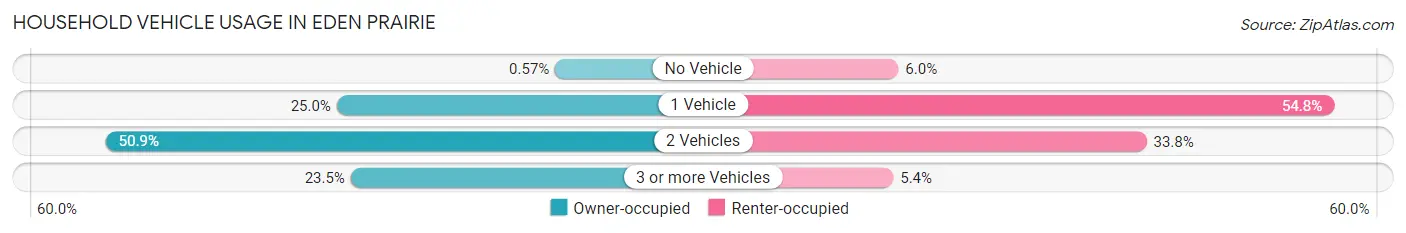
| Vehicles per Household | Owner-occupied | Renter-occupied |
| No Vehicle | 110 (0.6%) | 356 (6.0%) |
| 1 Vehicle | 4,790 (25.0%) | 3,254 (54.8%) |
| 2 Vehicles | 9,741 (50.9%) | 2,007 (33.8%) |
| 3 or more Vehicles | 4,490 (23.5%) | 322 (5.4%) |
| Total | 19,131 (100.0%) | 5,939 (100.0%) |
Real Estate & Mortgages in Eden Prairie
Real Estate and Mortgage Overview in Eden Prairie
| Characteristic | Without Mortgage | With Mortgage |
| Housing Units | 5,468 | 13,663 |
| Median Property Value | $429,900 | $448,200 |
| Median Household Income | $115,500 | $7,280 |
| Monthly Housing Costs | $834 | $3,931 |
| Real Estate Taxes | $4,745 | $161 |
Property Value by Mortgage Status in Eden Prairie
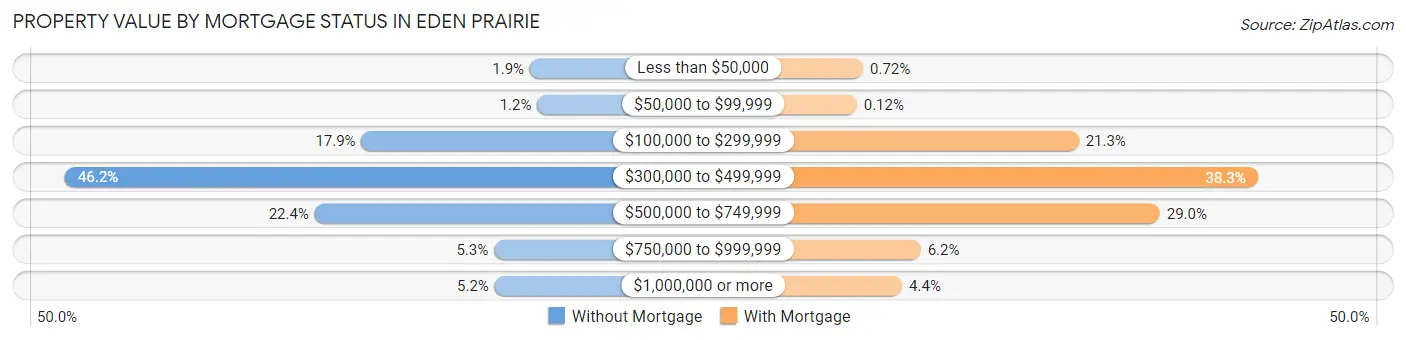
| Property Value | Without Mortgage | With Mortgage |
| Less than $50,000 | 102 (1.9%) | 98 (0.7%) |
| $50,000 to $99,999 | 64 (1.2%) | 16 (0.1%) |
| $100,000 to $299,999 | 980 (17.9%) | 2,903 (21.2%) |
| $300,000 to $499,999 | 2,524 (46.2%) | 5,232 (38.3%) |
| $500,000 to $749,999 | 1,223 (22.4%) | 3,960 (29.0%) |
| $750,000 to $999,999 | 289 (5.3%) | 848 (6.2%) |
| $1,000,000 or more | 286 (5.2%) | 606 (4.4%) |
| Total | 5,468 (100.0%) | 13,663 (100.0%) |
Household Income by Mortgage Status in Eden Prairie
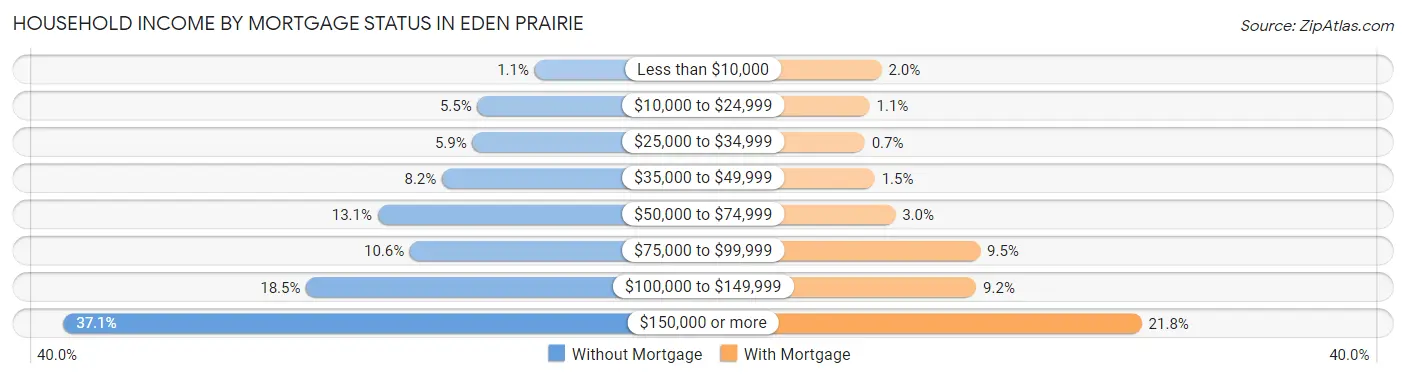
| Household Income | Without Mortgage | With Mortgage |
| Less than $10,000 | 62 (1.1%) | 271 (2.0%) |
| $10,000 to $24,999 | 300 (5.5%) | 146 (1.1%) |
| $25,000 to $34,999 | 321 (5.9%) | 96 (0.7%) |
| $35,000 to $49,999 | 448 (8.2%) | 199 (1.5%) |
| $50,000 to $74,999 | 716 (13.1%) | 413 (3.0%) |
| $75,000 to $99,999 | 581 (10.6%) | 1,296 (9.5%) |
| $100,000 to $149,999 | 1,014 (18.5%) | 1,255 (9.2%) |
| $150,000 or more | 2,026 (37.0%) | 2,978 (21.8%) |
| Total | 5,468 (100.0%) | 13,663 (100.0%) |
Property Value to Household Income Ratio in Eden Prairie
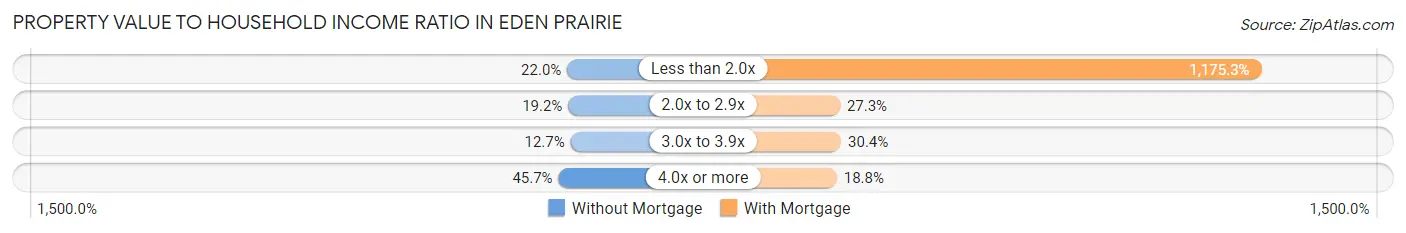
| Value-to-Income Ratio | Without Mortgage | With Mortgage |
| Less than 2.0x | 1,202 (22.0%) | 160,587 (1,175.3%) |
| 2.0x to 2.9x | 1,049 (19.2%) | 3,728 (27.3%) |
| 3.0x to 3.9x | 696 (12.7%) | 4,159 (30.4%) |
| 4.0x or more | 2,497 (45.7%) | 2,564 (18.8%) |
| Total | 5,468 (100.0%) | 13,663 (100.0%) |
Real Estate Taxes by Mortgage Status in Eden Prairie
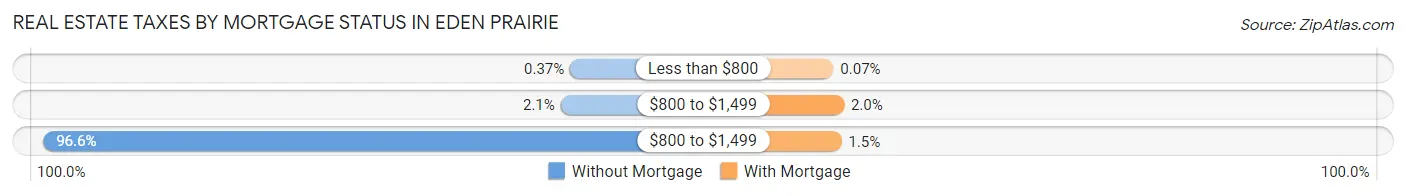
| Property Taxes | Without Mortgage | With Mortgage |
| Less than $800 | 20 (0.4%) | 9 (0.1%) |
| $800 to $1,499 | 115 (2.1%) | 272 (2.0%) |
| $800 to $1,499 | 5,282 (96.6%) | 211 (1.5%) |
| Total | 5,468 (100.0%) | 13,663 (100.0%) |
Health & Disability in Eden Prairie
Health Insurance Coverage by Age in Eden Prairie
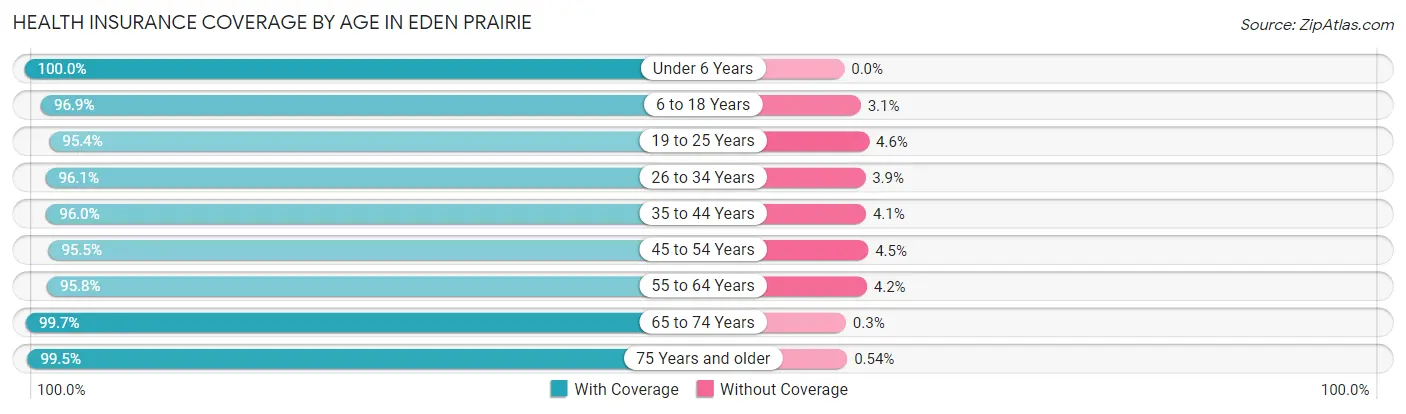
| Age Bracket | With Coverage | Without Coverage |
| Under 6 Years | 4,493 (100.0%) | 0 (0.0%) |
| 6 to 18 Years | 11,481 (96.9%) | 364 (3.1%) |
| 19 to 25 Years | 3,345 (95.4%) | 162 (4.6%) |
| 26 to 34 Years | 6,744 (96.1%) | 274 (3.9%) |
| 35 to 44 Years | 9,261 (96.0%) | 391 (4.1%) |
| 45 to 54 Years | 8,376 (95.5%) | 391 (4.5%) |
| 55 to 64 Years | 8,775 (95.8%) | 386 (4.2%) |
| 65 to 74 Years | 6,063 (99.7%) | 18 (0.3%) |
| 75 Years and older | 2,953 (99.5%) | 16 (0.5%) |
| Total | 61,491 (96.9%) | 2,002 (3.2%) |
Health Insurance Coverage by Citizenship Status in Eden Prairie
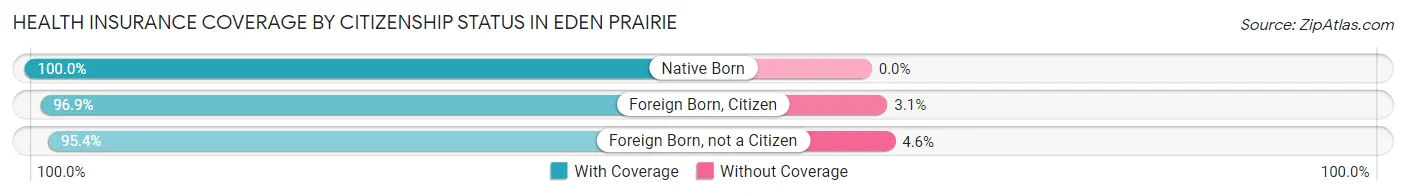
| Citizenship Status | With Coverage | Without Coverage |
| Native Born | 4,493 (100.0%) | 0 (0.0%) |
| Foreign Born, Citizen | 11,481 (96.9%) | 364 (3.1%) |
| Foreign Born, not a Citizen | 3,345 (95.4%) | 162 (4.6%) |
Health Insurance Coverage by Household Income in Eden Prairie
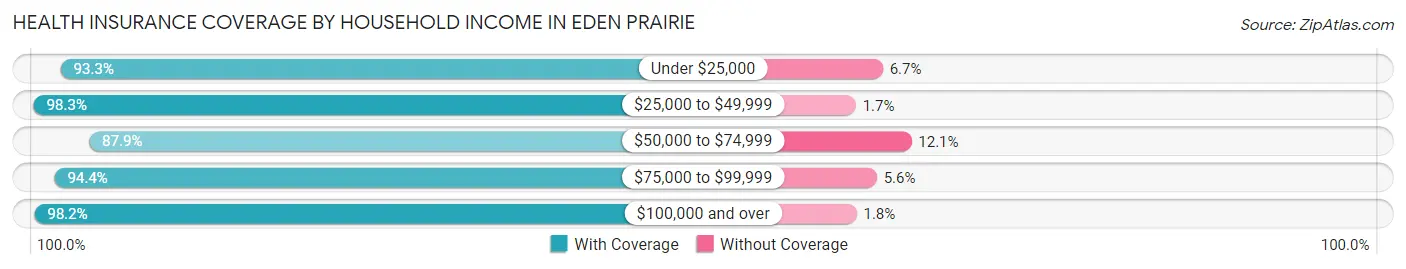
| Household Income | With Coverage | Without Coverage |
| Under $25,000 | 2,191 (93.3%) | 158 (6.7%) |
| $25,000 to $49,999 | 4,641 (98.3%) | 79 (1.7%) |
| $50,000 to $74,999 | 4,324 (87.9%) | 595 (12.1%) |
| $75,000 to $99,999 | 5,849 (94.4%) | 347 (5.6%) |
| $100,000 and over | 44,370 (98.2%) | 821 (1.8%) |
Public vs Private Health Insurance Coverage by Age in Eden Prairie
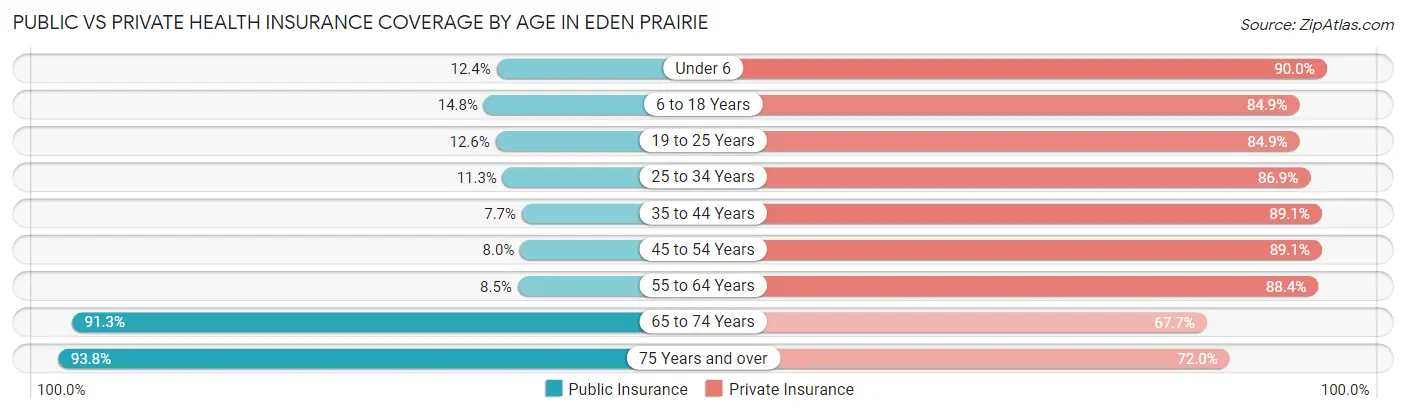
| Age Bracket | Public Insurance | Private Insurance |
| Under 6 | 557 (12.4%) | 4,042 (90.0%) |
| 6 to 18 Years | 1,750 (14.8%) | 10,054 (84.9%) |
| 19 to 25 Years | 441 (12.6%) | 2,979 (84.9%) |
| 25 to 34 Years | 790 (11.3%) | 6,100 (86.9%) |
| 35 to 44 Years | 743 (7.7%) | 8,595 (89.0%) |
| 45 to 54 Years | 702 (8.0%) | 7,809 (89.1%) |
| 55 to 64 Years | 776 (8.5%) | 8,099 (88.4%) |
| 65 to 74 Years | 5,551 (91.3%) | 4,116 (67.7%) |
| 75 Years and over | 2,786 (93.8%) | 2,137 (72.0%) |
| Total | 14,096 (22.2%) | 53,931 (84.9%) |
Disability Status by Sex by Age in Eden Prairie
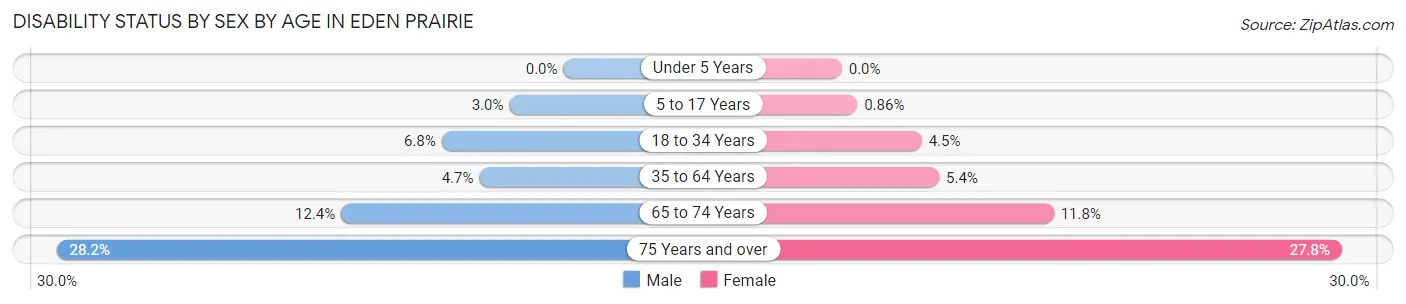
| Age Bracket | Male | Female |
| Under 5 Years | 0 (0.0%) | 0 (0.0%) |
| 5 to 17 Years | 172 (3.0%) | 51 (0.9%) |
| 18 to 34 Years | 378 (6.8%) | 259 (4.4%) |
| 35 to 64 Years | 633 (4.7%) | 763 (5.4%) |
| 65 to 74 Years | 353 (12.4%) | 381 (11.8%) |
| 75 Years and over | 331 (28.2%) | 500 (27.8%) |
Disability Class by Sex by Age in Eden Prairie
Disability Class: Hearing Difficulty
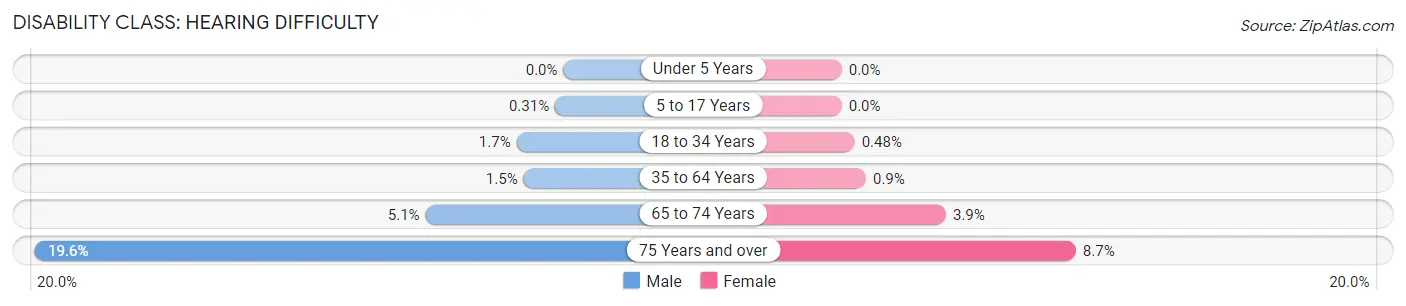
| Age Bracket | Male | Female |
| Under 5 Years | 0 (0.0%) | 0 (0.0%) |
| 5 to 17 Years | 18 (0.3%) | 0 (0.0%) |
| 18 to 34 Years | 97 (1.7%) | 28 (0.5%) |
| 35 to 64 Years | 200 (1.5%) | 127 (0.9%) |
| 65 to 74 Years | 146 (5.1%) | 125 (3.9%) |
| 75 Years and over | 230 (19.6%) | 156 (8.7%) |
Disability Class: Vision Difficulty
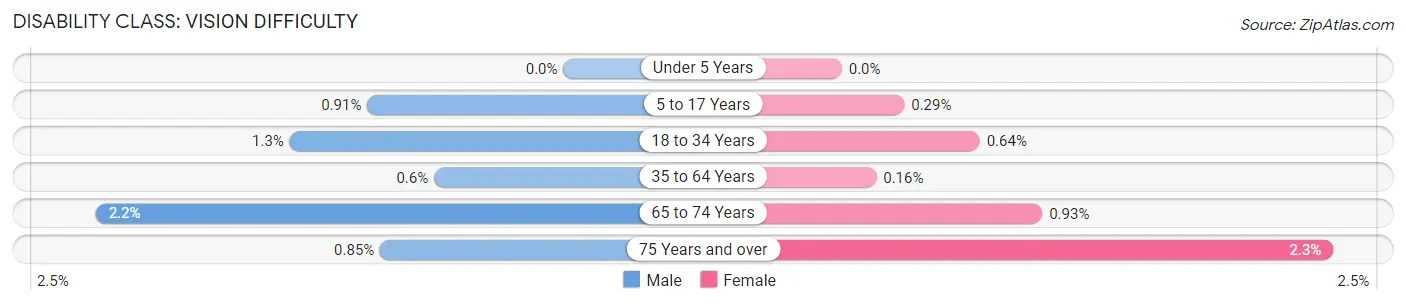
| Age Bracket | Male | Female |
| Under 5 Years | 0 (0.0%) | 0 (0.0%) |
| 5 to 17 Years | 52 (0.9%) | 17 (0.3%) |
| 18 to 34 Years | 71 (1.3%) | 37 (0.6%) |
| 35 to 64 Years | 81 (0.6%) | 22 (0.2%) |
| 65 to 74 Years | 62 (2.2%) | 30 (0.9%) |
| 75 Years and over | 10 (0.9%) | 41 (2.3%) |
Disability Class: Cognitive Difficulty
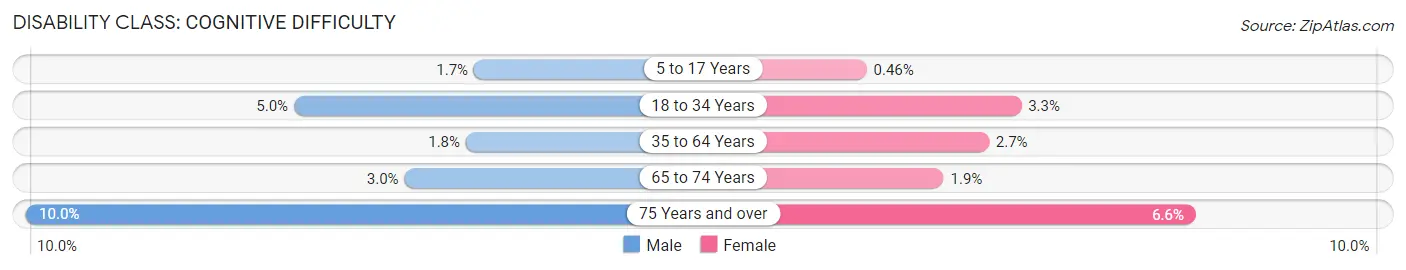
| Age Bracket | Male | Female |
| 5 to 17 Years | 95 (1.7%) | 27 (0.5%) |
| 18 to 34 Years | 279 (5.0%) | 194 (3.3%) |
| 35 to 64 Years | 244 (1.8%) | 384 (2.7%) |
| 65 to 74 Years | 84 (2.9%) | 61 (1.9%) |
| 75 Years and over | 117 (10.0%) | 118 (6.6%) |
Disability Class: Ambulatory Difficulty
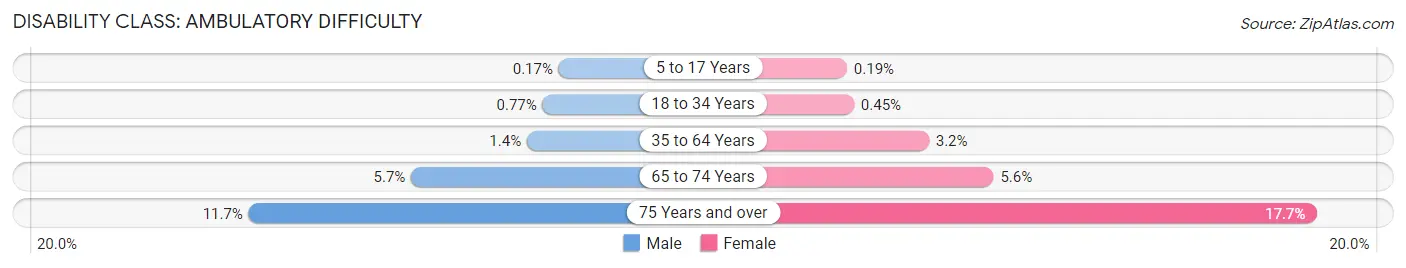
| Age Bracket | Male | Female |
| 5 to 17 Years | 10 (0.2%) | 11 (0.2%) |
| 18 to 34 Years | 43 (0.8%) | 26 (0.4%) |
| 35 to 64 Years | 182 (1.3%) | 454 (3.2%) |
| 65 to 74 Years | 161 (5.7%) | 182 (5.6%) |
| 75 Years and over | 137 (11.7%) | 317 (17.6%) |
Disability Class: Self-Care Difficulty
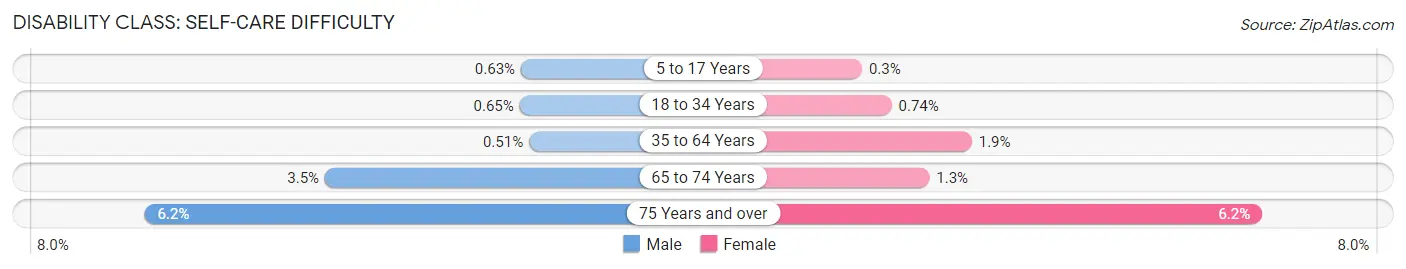
| Age Bracket | Male | Female |
| 5 to 17 Years | 36 (0.6%) | 18 (0.3%) |
| 18 to 34 Years | 36 (0.6%) | 43 (0.7%) |
| 35 to 64 Years | 69 (0.5%) | 271 (1.9%) |
| 65 to 74 Years | 101 (3.5%) | 42 (1.3%) |
| 75 Years and over | 73 (6.2%) | 112 (6.2%) |
Technology Access in Eden Prairie
Computing Device Access in Eden Prairie
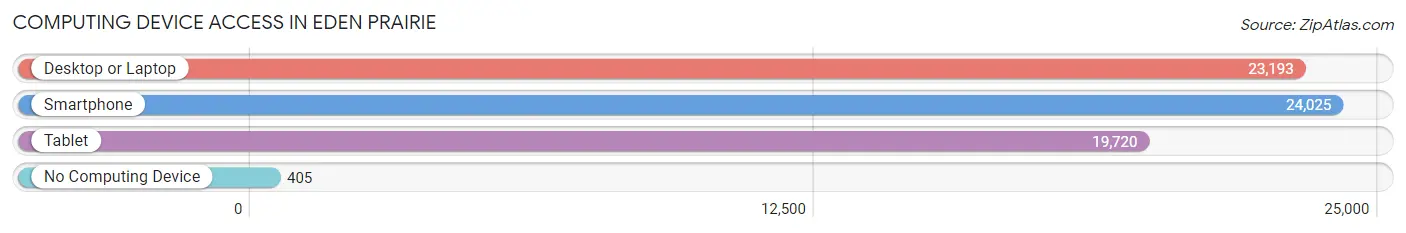
| Device Type | # Households | % Households |
| Desktop or Laptop | 23,193 | 92.5% |
| Smartphone | 24,025 | 95.8% |
| Tablet | 19,720 | 78.7% |
| No Computing Device | 405 | 1.6% |
| Total | 25,070 | 100.0% |
Internet Access in Eden Prairie
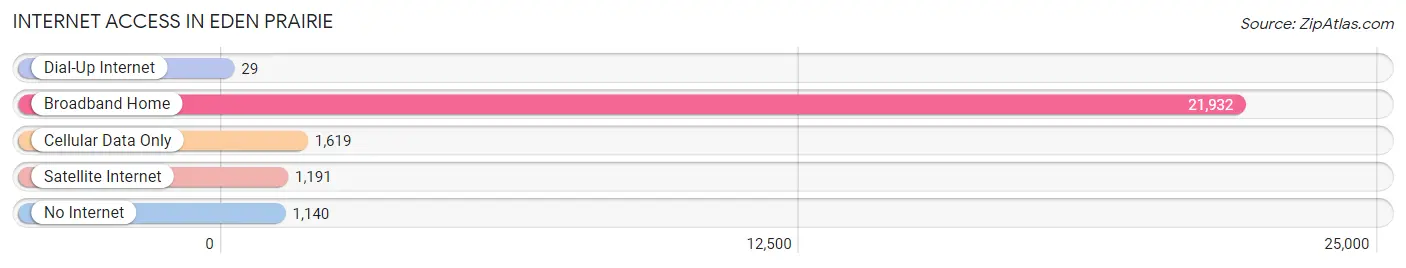
| Internet Type | # Households | % Households |
| Dial-Up Internet | 29 | 0.1% |
| Broadband Home | 21,932 | 87.5% |
| Cellular Data Only | 1,619 | 6.5% |
| Satellite Internet | 1,191 | 4.8% |
| No Internet | 1,140 | 4.5% |
| Total | 25,070 | 100.0% |
Eden Prairie Summary
Eden Prairie, Minnesota is a city located in Hennepin County, Minnesota, United States. It is a suburb of Minneapolis and is located southwest of the city. As of the 2010 census, the population of Eden Prairie was 60,797, making it the 12th largest city in Minnesota.
History
The area that is now Eden Prairie was originally inhabited by the Dakota Sioux. The first settlers arrived in the area in the 1850s, and the city was officially incorporated in 1962. The city was named after the Eden Prairie Township, which was named after the biblical Garden of Eden.
Geography
Eden Prairie is located in Hennepin County, Minnesota, and is situated on the south side of the Minnesota River. It is bordered by the cities of Bloomington to the north, Minnetonka to the west, and Edina to the east. The city covers an area of 33.2 square miles, of which 32.9 square miles is land and 0.3 square miles is water.
Economy
Eden Prairie is home to a number of large employers, including C.H. Robinson, SuperValu, and UnitedHealth Group. The city is also home to a number of technology companies, including Digital River, IntraLinks, and Starkey Hearing Technologies.
Demographics
As of the 2010 census, the population of Eden Prairie was 60,797. The racial makeup of the city was 84.2% White, 5.3% African American, 0.3% Native American, 6.2% Asian, 0.1% Pacific Islander, 1.7% from other races, and 2.4% from two or more races. The median household income was $90,966, and the median family income was $106,722.
Conclusion
Eden Prairie, Minnesota is a city located in Hennepin County, Minnesota, United States. It is a suburb of Minneapolis and is located southwest of the city. As of the 2010 census, the population of Eden Prairie was 60,797, making it the 12th largest city in Minnesota. The city is home to a number of large employers, including C.H. Robinson, SuperValu, and UnitedHealth Group. The racial makeup of the city was 84.2% White, 5.3% African American, 0.3% Native American, 6.2% Asian, 0.1% Pacific Islander, 1.7% from other races, and 2.4% from two or more races. The median household income was $90,966, and the median family income was $106,722.
Common Questions
What is Per Capita Income in Eden Prairie?
Per Capita income in Eden Prairie is $67,183.
What is the Median Family Income in Eden Prairie?
Median Family Income in Eden Prairie is $159,625.
What is the Median Household income in Eden Prairie?
Median Household Income in Eden Prairie is $129,345.
What is Income or Wage Gap in Eden Prairie?
Income or Wage Gap in Eden Prairie is 42.8%.
Women in Eden Prairie earn 57.2 cents for every dollar earned by a man.
What is Inequality or Gini Index in Eden Prairie?
Inequality or Gini Index in Eden Prairie is 0.44.
What is the Total Population of Eden Prairie?
Total Population of Eden Prairie is 63,623.
What is the Total Male Population of Eden Prairie?
Total Male Population of Eden Prairie is 31,016.
What is the Total Female Population of Eden Prairie?
Total Female Population of Eden Prairie is 32,607.
What is the Ratio of Males per 100 Females in Eden Prairie?
There are 95.12 Males per 100 Females in Eden Prairie.
What is the Ratio of Females per 100 Males in Eden Prairie?
There are 105.13 Females per 100 Males in Eden Prairie.
What is the Median Population Age in Eden Prairie?
Median Population Age in Eden Prairie is 39.5 Years.
What is the Average Family Size in Eden Prairie
Average Family Size in Eden Prairie is 3.0 People.
What is the Average Household Size in Eden Prairie
Average Household Size in Eden Prairie is 2.5 People.
How Large is the Labor Force in Eden Prairie?
There are 36,135 People in the Labor Forcein in Eden Prairie.
What is the Percentage of People in the Labor Force in Eden Prairie?
72.0% of People are in the Labor Force in Eden Prairie.
What is the Unemployment Rate in Eden Prairie?
Unemployment Rate in Eden Prairie is 3.8%.