Noel, MO Map & Demographics
Noel Map
Noel Overview
$17,110
PER CAPITA INCOME
$63,218
AVG FAMILY INCOME
$42,292
AVG HOUSEHOLD INCOME
3.1%
WAGE / INCOME GAP [ % ]
96.9¢/ $1
WAGE / INCOME GAP [ $ ]
0.38
INEQUALITY / GINI INDEX
1,930
TOTAL POPULATION
909
MALE POPULATION
1,021
FEMALE POPULATION
89.03
MALES / 100 FEMALES
112.32
FEMALES / 100 MALES
29.3
MEDIAN AGE
3.9
AVG FAMILY SIZE
2.9
AVG HOUSEHOLD SIZE
872
LABOR FORCE [ PEOPLE ]
61.3%
PERCENT IN LABOR FORCE
6.6%
UNEMPLOYMENT RATE
Noel Zip Codes
Noel Area Codes
Income in Noel
Income Overview in Noel
Per Capita Income in Noel is $17,110, while median incomes of families and households are $63,218 and $42,292 respectively.
| Characteristic | Number | Measure |
| Per Capita Income | 1,930 | $17,110 |
| Median Family Income | 408 | $63,218 |
| Mean Family Income | 408 | $56,346 |
| Median Household Income | 657 | $42,292 |
| Mean Household Income | 657 | $46,998 |
| Income Deficit | 408 | $0 |
| Wage / Income Gap (%) | 1,930 | 3.13% |
| Wage / Income Gap ($) | 1,930 | 96.87¢ per $1 |
| Gini / Inequality Index | 1,930 | 0.38 |
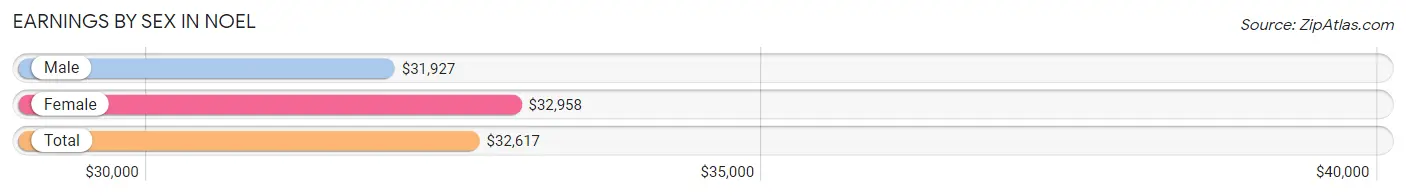
Earnings by Sex in Noel
Average Earnings in Noel are $32,617, $31,927 for men and $32,958 for women, a difference of 3.1%.
| Sex | Number | Average Earnings |
| Male | 530 (59.5%) | $31,927 |
| Female | 361 (40.5%) | $32,958 |
| Total | 891 (100.0%) | $32,617 |
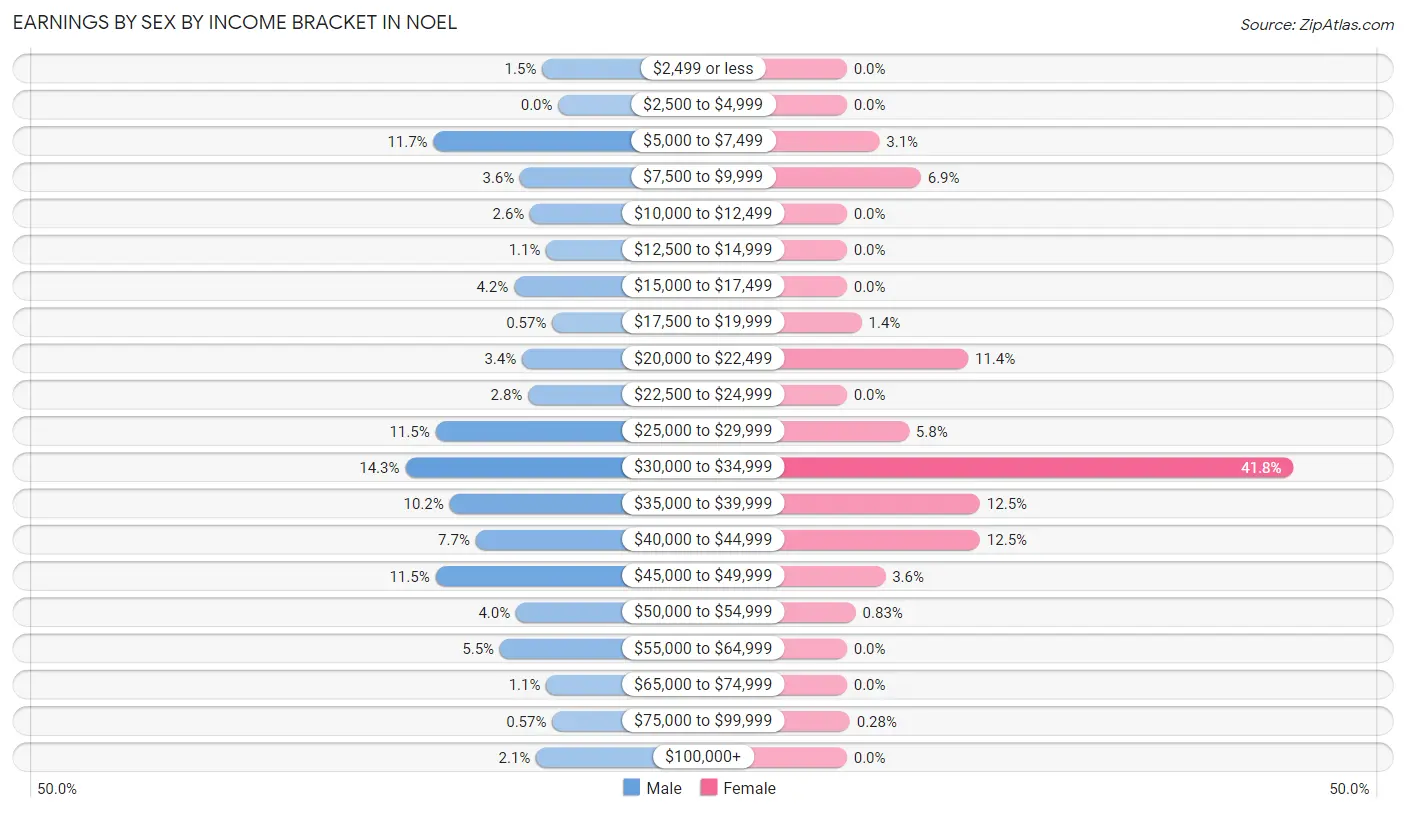
Earnings by Sex by Income Bracket in Noel
The most common earnings brackets in Noel are $30,000 to $34,999 for men (76 | 14.3%) and $30,000 to $34,999 for women (151 | 41.8%).
| Income | Male | Female |
| $2,499 or less | 8 (1.5%) | 0 (0.0%) |
| $2,500 to $4,999 | 0 (0.0%) | 0 (0.0%) |
| $5,000 to $7,499 | 62 (11.7%) | 11 (3.0%) |
| $7,500 to $9,999 | 19 (3.6%) | 25 (6.9%) |
| $10,000 to $12,499 | 14 (2.6%) | 0 (0.0%) |
| $12,500 to $14,999 | 6 (1.1%) | 0 (0.0%) |
| $15,000 to $17,499 | 22 (4.2%) | 0 (0.0%) |
| $17,500 to $19,999 | 3 (0.6%) | 5 (1.4%) |
| $20,000 to $22,499 | 18 (3.4%) | 41 (11.4%) |
| $22,500 to $24,999 | 15 (2.8%) | 0 (0.0%) |
| $25,000 to $29,999 | 61 (11.5%) | 21 (5.8%) |
| $30,000 to $34,999 | 76 (14.3%) | 151 (41.8%) |
| $35,000 to $39,999 | 54 (10.2%) | 45 (12.5%) |
| $40,000 to $44,999 | 41 (7.7%) | 45 (12.5%) |
| $45,000 to $49,999 | 61 (11.5%) | 13 (3.6%) |
| $50,000 to $54,999 | 21 (4.0%) | 3 (0.8%) |
| $55,000 to $64,999 | 29 (5.5%) | 0 (0.0%) |
| $65,000 to $74,999 | 6 (1.1%) | 0 (0.0%) |
| $75,000 to $99,999 | 3 (0.6%) | 1 (0.3%) |
| $100,000+ | 11 (2.1%) | 0 (0.0%) |
| Total | 530 (100.0%) | 361 (100.0%) |
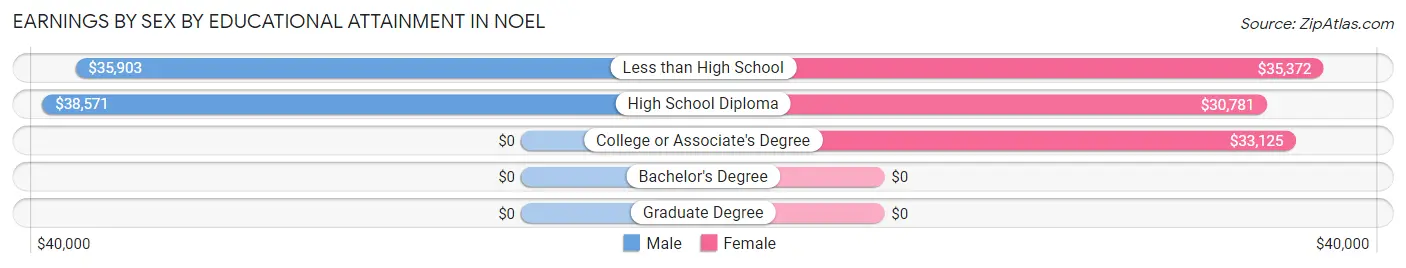
Earnings by Sex by Educational Attainment in Noel
Average earnings in Noel are $33,795 for men and $33,542 for women, a difference of 0.7%. Men with an educational attainment of high school diploma enjoy the highest average annual earnings of $38,571, while those with less than high school education earn the least with $35,903. Women with an educational attainment of less than high school earn the most with the average annual earnings of $35,372, while those with high school diploma education have the smallest earnings of $30,781.
| Educational Attainment | Male Income | Female Income |
| Less than High School | $35,903 | $35,372 |
| High School Diploma | $38,571 | $30,781 |
| College or Associate's Degree | - | - |
| Bachelor's Degree | - | - |
| Graduate Degree | - | - |
| Total | $33,795 | $33,542 |
Family Income in Noel
Family Income Brackets in Noel
According to the Noel family income data, there are 153 families falling into the $50,000 to $74,999 income range, which is the most common income bracket and makes up 37.5% of all families.
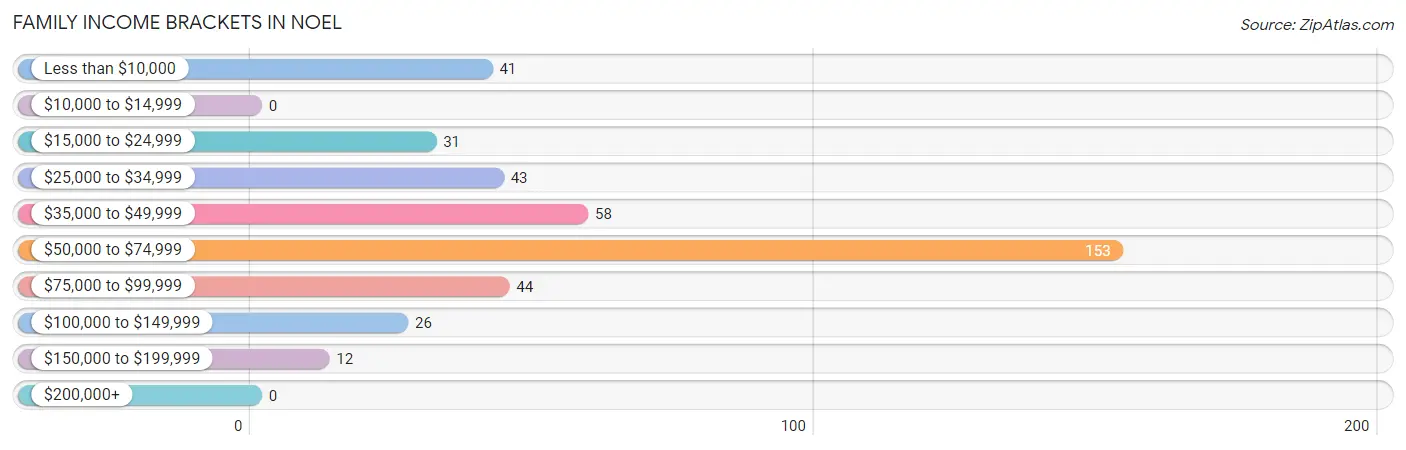
| Income Bracket | # Families | % Families |
| Less than $10,000 | 41 | 10.0% |
| $10,000 to $14,999 | 0 | 0.0% |
| $15,000 to $24,999 | 31 | 7.6% |
| $25,000 to $34,999 | 43 | 10.5% |
| $35,000 to $49,999 | 58 | 14.2% |
| $50,000 to $74,999 | 153 | 37.5% |
| $75,000 to $99,999 | 44 | 10.8% |
| $100,000 to $149,999 | 26 | 6.4% |
| $150,000 to $199,999 | 12 | 2.9% |
| $200,000+ | 0 | 0.0% |
Family Income by Famaliy Size in Noel
4-person families (67 | 16.4%) account for the highest median family income in Noel with $72,321 per family, while 2-person families (174 | 42.6%) have the highest median income of $31,451 per family member.
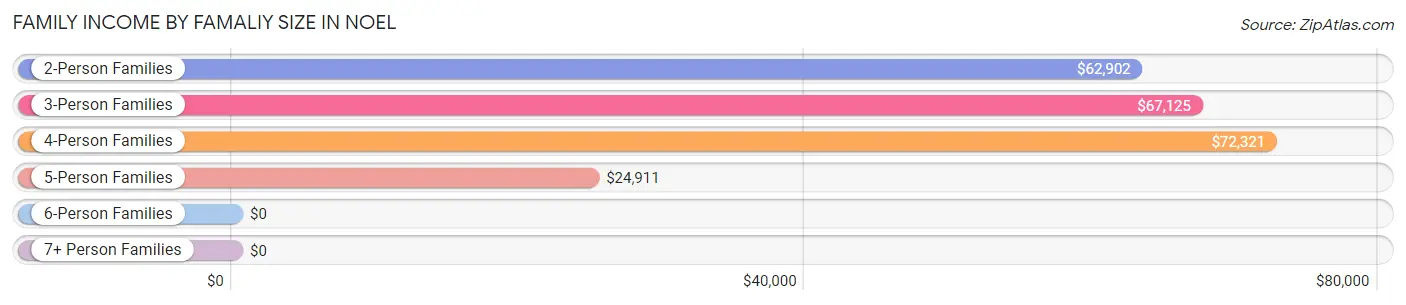
| Income Bracket | # Families | Median Income |
| 2-Person Families | 174 (42.6%) | $62,902 |
| 3-Person Families | 57 (14.0%) | $67,125 |
| 4-Person Families | 67 (16.4%) | $72,321 |
| 5-Person Families | 35 (8.6%) | $24,911 |
| 6-Person Families | 49 (12.0%) | $0 |
| 7+ Person Families | 26 (6.4%) | $0 |
| Total | 408 (100.0%) | $63,218 |
Family Income by Number of Earners in Noel
The median family income in Noel is $63,218, with families comprising 3+ earners (43) having the highest median family income of $70,536, while families with no earners (58) have the lowest median family income of $2,499, accounting for 10.5% and 14.2% of families, respectively.
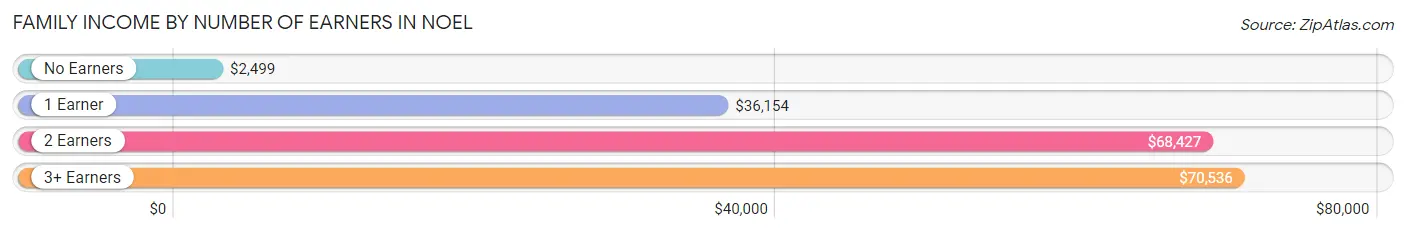
| Number of Earners | # Families | Median Income |
| No Earners | 58 (14.2%) | $2,499 |
| 1 Earner | 140 (34.3%) | $36,154 |
| 2 Earners | 167 (40.9%) | $68,427 |
| 3+ Earners | 43 (10.5%) | $70,536 |
| Total | 408 (100.0%) | $63,218 |
Household Income in Noel
Household Income Brackets in Noel
With 172 households falling in the category, the $50,000 to $74,999 income range is the most frequent in Noel, accounting for 26.2% of all households.
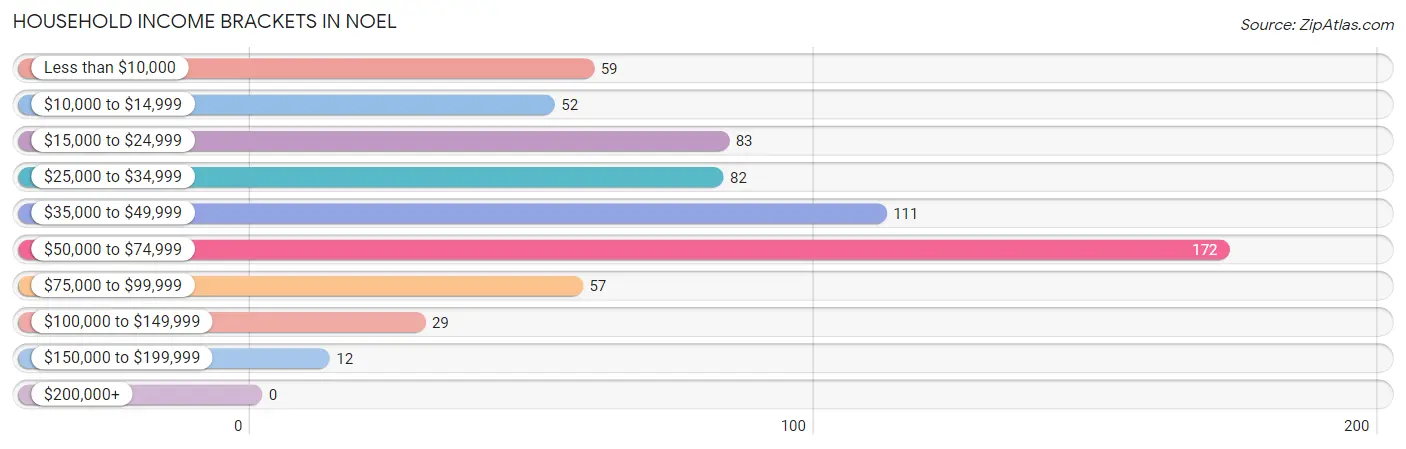
| Income Bracket | # Households | % Households |
| Less than $10,000 | 59 | 9.0% |
| $10,000 to $14,999 | 52 | 7.9% |
| $15,000 to $24,999 | 83 | 12.6% |
| $25,000 to $34,999 | 82 | 12.5% |
| $35,000 to $49,999 | 111 | 16.9% |
| $50,000 to $74,999 | 172 | 26.2% |
| $75,000 to $99,999 | 57 | 8.7% |
| $100,000 to $149,999 | 29 | 4.4% |
| $150,000 to $199,999 | 12 | 1.8% |
| $200,000+ | 0 | 0.0% |
Household Income by Householder Age in Noel
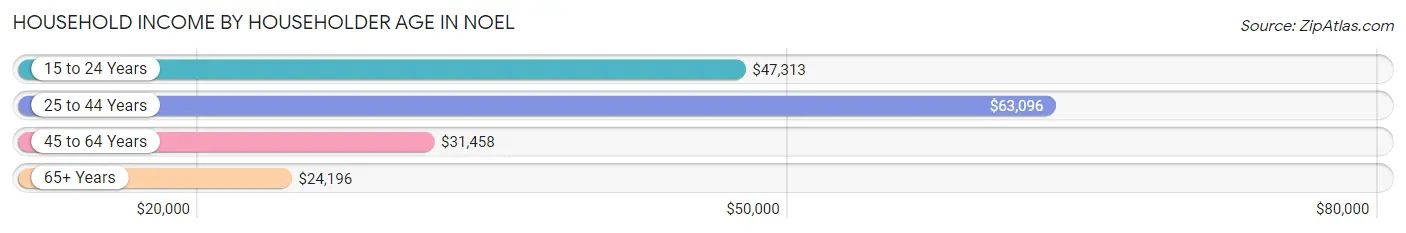
The median household income in Noel is $42,292, with the highest median household income of $63,096 found in the 25 to 44 years age bracket for the primary householder. A total of 247 households (37.6%) fall into this category. Meanwhile, the 65+ years age bracket for the primary householder has the lowest median household income of $24,196, with 101 households (15.4%) in this group.
| Income Bracket | # Households | Median Income |
| 15 to 24 Years | 65 (9.9%) | $47,313 |
| 25 to 44 Years | 247 (37.6%) | $63,096 |
| 45 to 64 Years | 244 (37.1%) | $31,458 |
| 65+ Years | 101 (15.4%) | $24,196 |
| Total | 657 (100.0%) | $42,292 |
Poverty in Noel
Income Below Poverty by Sex and Age in Noel
With 26.1% poverty level for males and 23.7% for females among the residents of Noel, under 5 year old males and 12 to 14 year old females are the most vulnerable to poverty, with 43 males (97.7%) and 26 females (65.0%) in their respective age groups living below the poverty level.
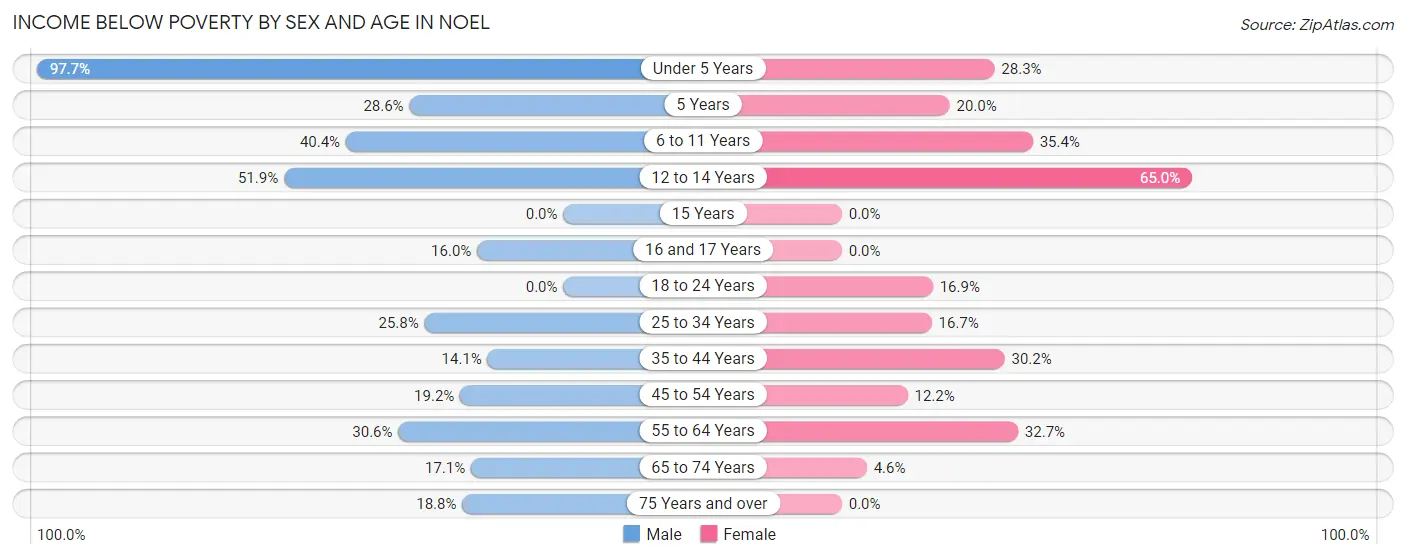
| Age Bracket | Male | Female |
| Under 5 Years | 43 (97.7%) | 17 (28.3%) |
| 5 Years | 4 (28.6%) | 5 (20.0%) |
| 6 to 11 Years | 46 (40.4%) | 45 (35.4%) |
| 12 to 14 Years | 28 (51.8%) | 26 (65.0%) |
| 15 Years | 0 (0.0%) | 0 (0.0%) |
| 16 and 17 Years | 4 (16.0%) | 0 (0.0%) |
| 18 to 24 Years | 0 (0.0%) | 26 (16.9%) |
| 25 to 34 Years | 51 (25.8%) | 27 (16.7%) |
| 35 to 44 Years | 9 (14.1%) | 29 (30.2%) |
| 45 to 54 Years | 9 (19.2%) | 10 (12.2%) |
| 55 to 64 Years | 34 (30.6%) | 51 (32.7%) |
| 65 to 74 Years | 6 (17.1%) | 3 (4.6%) |
| 75 Years and over | 3 (18.8%) | 0 (0.0%) |
| Total | 237 (26.1%) | 239 (23.7%) |
Income Above Poverty by Sex and Age in Noel
According to the poverty statistics in Noel, males aged 15 years and females aged 15 years are the age groups that are most secure financially, with 100.0% of males and 100.0% of females in these age groups living above the poverty line.
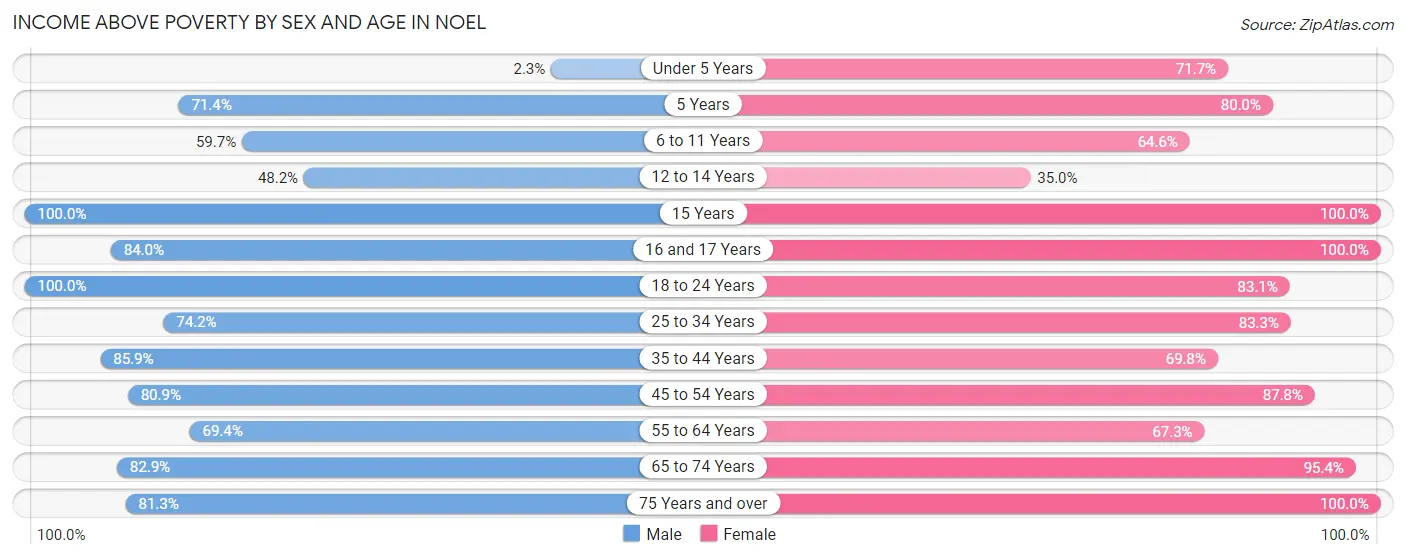
| Age Bracket | Male | Female |
| Under 5 Years | 1 (2.3%) | 43 (71.7%) |
| 5 Years | 10 (71.4%) | 20 (80.0%) |
| 6 to 11 Years | 68 (59.7%) | 82 (64.6%) |
| 12 to 14 Years | 26 (48.1%) | 14 (35.0%) |
| 15 Years | 8 (100.0%) | 8 (100.0%) |
| 16 and 17 Years | 21 (84.0%) | 9 (100.0%) |
| 18 to 24 Years | 179 (100.0%) | 128 (83.1%) |
| 25 to 34 Years | 147 (74.2%) | 135 (83.3%) |
| 35 to 44 Years | 55 (85.9%) | 67 (69.8%) |
| 45 to 54 Years | 38 (80.8%) | 72 (87.8%) |
| 55 to 64 Years | 77 (69.4%) | 105 (67.3%) |
| 65 to 74 Years | 29 (82.9%) | 62 (95.4%) |
| 75 Years and over | 13 (81.2%) | 24 (100.0%) |
| Total | 672 (73.9%) | 769 (76.3%) |
Income Below Poverty Among Married-Couple Families in Noel
The poverty statistics for married-couple families in Noel show that 14.7% or 37 of the total 252 families live below the poverty line. Families with 1 or 2 children have the highest poverty rate of 45.0%, comprising of 9 families. On the other hand, families with 5 or more children have the lowest poverty rate of 0.0%, which includes 0 families.
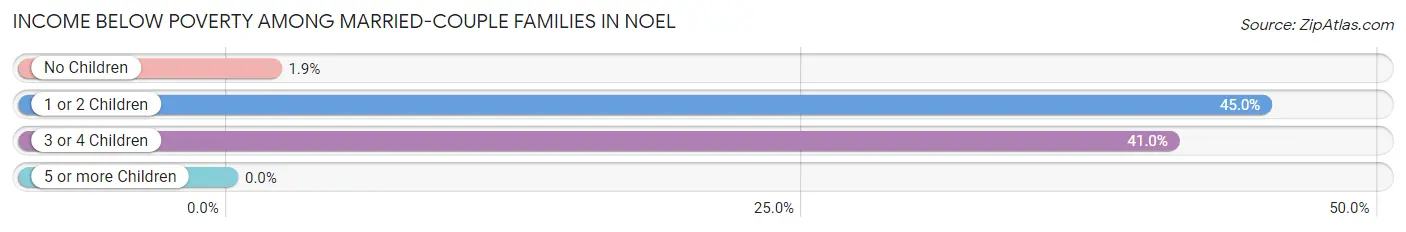
| Children | Above Poverty | Below Poverty |
| No Children | 156 (98.1%) | 3 (1.9%) |
| 1 or 2 Children | 11 (55.0%) | 9 (45.0%) |
| 3 or 4 Children | 36 (59.0%) | 25 (41.0%) |
| 5 or more Children | 12 (100.0%) | 0 (0.0%) |
| Total | 215 (85.3%) | 37 (14.7%) |
Income Below Poverty Among Single-Parent Households in Noel
According to the poverty data in Noel, 10.8% or 4 single-father households and 40.3% or 48 single-mother households are living below the poverty line. Among single-father households, those with 3 or 4 children have the highest poverty rate, with 4 households (100.0%) experiencing poverty. Likewise, among single-mother households, those with 5 or more children have the highest poverty rate, with 14 households (100.0%) falling below the poverty line.
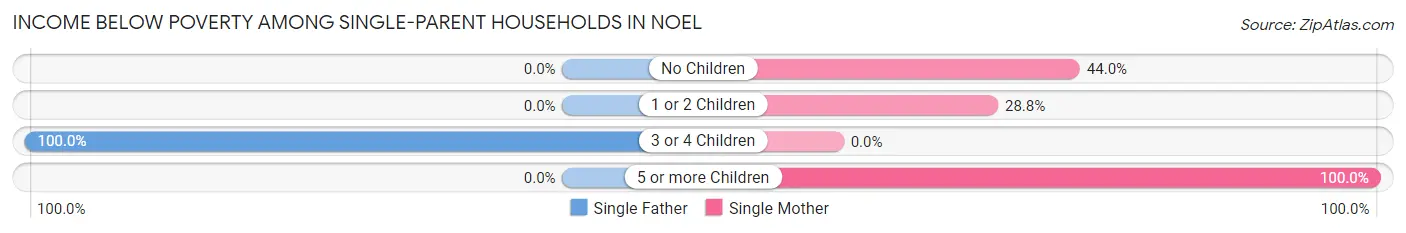
| Children | Single Father | Single Mother |
| No Children | 0 (0.0%) | 11 (44.0%) |
| 1 or 2 Children | 0 (0.0%) | 23 (28.7%) |
| 3 or 4 Children | 4 (100.0%) | 0 (0.0%) |
| 5 or more Children | 0 (0.0%) | 14 (100.0%) |
| Total | 4 (10.8%) | 48 (40.3%) |
Income Below Poverty Among Married-Couple vs Single-Parent Households in Noel
The poverty data for Noel shows that 37 of the married-couple family households (14.7%) and 52 of the single-parent households (33.3%) are living below the poverty level. Within the married-couple family households, those with 1 or 2 children have the highest poverty rate, with 9 households (45.0%) falling below the poverty line. Among the single-parent households, those with 3 or 4 children have the highest poverty rate, with 4 household (100.0%) living below poverty.
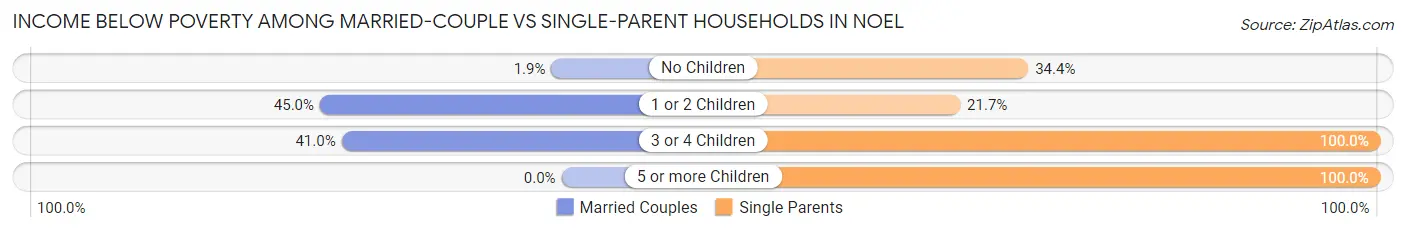
| Children | Married-Couple Families | Single-Parent Households |
| No Children | 3 (1.9%) | 11 (34.4%) |
| 1 or 2 Children | 9 (45.0%) | 23 (21.7%) |
| 3 or 4 Children | 25 (41.0%) | 4 (100.0%) |
| 5 or more Children | 0 (0.0%) | 14 (100.0%) |
| Total | 37 (14.7%) | 52 (33.3%) |
Race in Noel
The most populous races in Noel are White / Caucasian (1,060 | 54.9%), Hispanic or Latino (866 | 44.9%), and Two or more Races (346 | 17.9%).
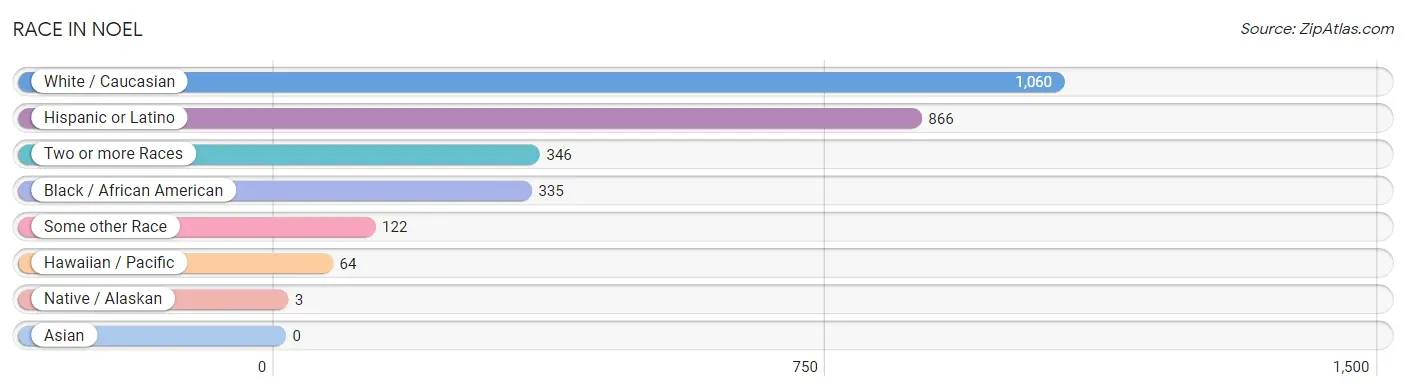
| Race | # Population | % Population |
| Asian | 0 | 0.0% |
| Black / African American | 335 | 17.4% |
| Hawaiian / Pacific | 64 | 3.3% |
| Hispanic or Latino | 866 | 44.9% |
| Native / Alaskan | 3 | 0.2% |
| White / Caucasian | 1,060 | 54.9% |
| Two or more Races | 346 | 17.9% |
| Some other Race | 122 | 6.3% |
| Total | 1,930 | 100.0% |
Ancestry in Noel
The most populous ancestries reported in Noel are Mexican (774 | 40.1%), Subsaharan African (390 | 20.2%), Somali (349 | 18.1%), Central American (92 | 4.8%), and Guatemalan (72 | 3.7%), together accounting for 86.9% of all Noel residents.
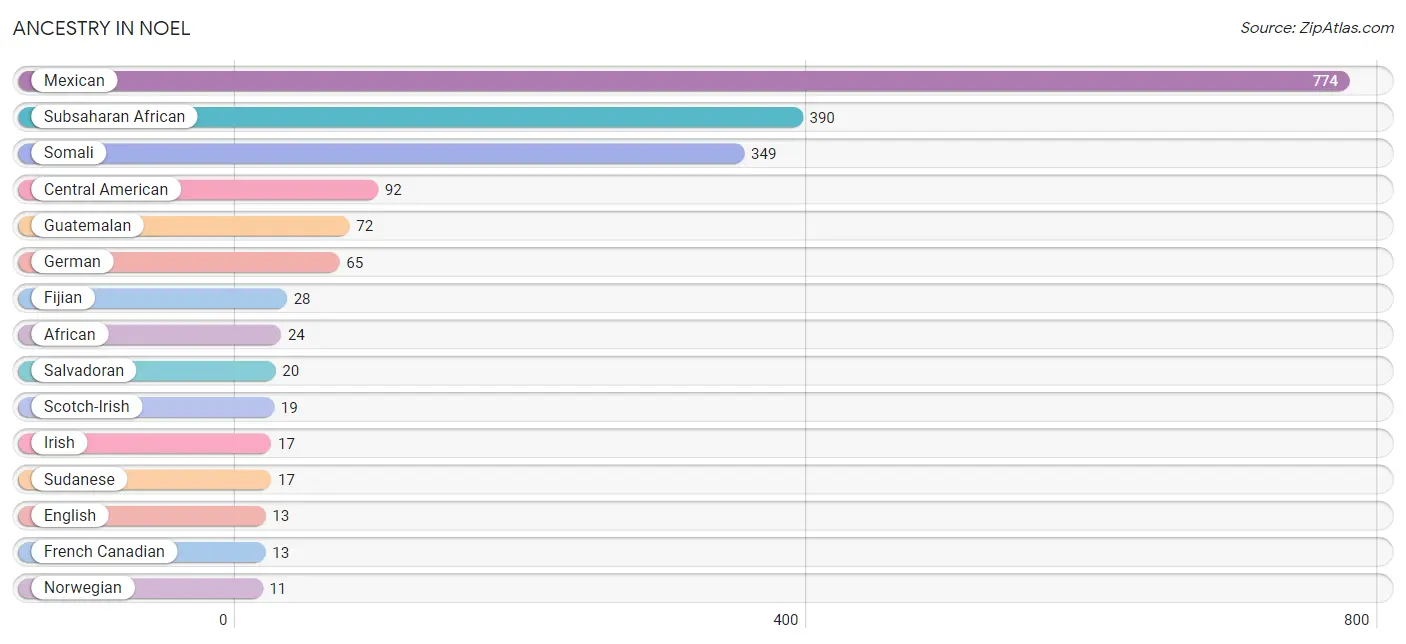
| Ancestry | # Population | % Population |
| African | 24 | 1.2% |
| American | 9 | 0.5% |
| Central American | 92 | 4.8% |
| Cherokee | 9 | 0.5% |
| Creek | 3 | 0.2% |
| Czech | 3 | 0.2% |
| English | 13 | 0.7% |
| Fijian | 28 | 1.5% |
| French | 7 | 0.4% |
| French Canadian | 13 | 0.7% |
| German | 65 | 3.4% |
| Guatemalan | 72 | 3.7% |
| Irish | 17 | 0.9% |
| Mexican | 774 | 40.1% |
| Norwegian | 11 | 0.6% |
| Polish | 4 | 0.2% |
| Russian | 3 | 0.2% |
| Salvadoran | 20 | 1.0% |
| Scotch-Irish | 19 | 1.0% |
| Scottish | 3 | 0.2% |
| Somali | 349 | 18.1% |
| Subsaharan African | 390 | 20.2% |
| Sudanese | 17 | 0.9% |
| Welsh | 3 | 0.2% | View All 24 Rows |
Immigrants in Noel
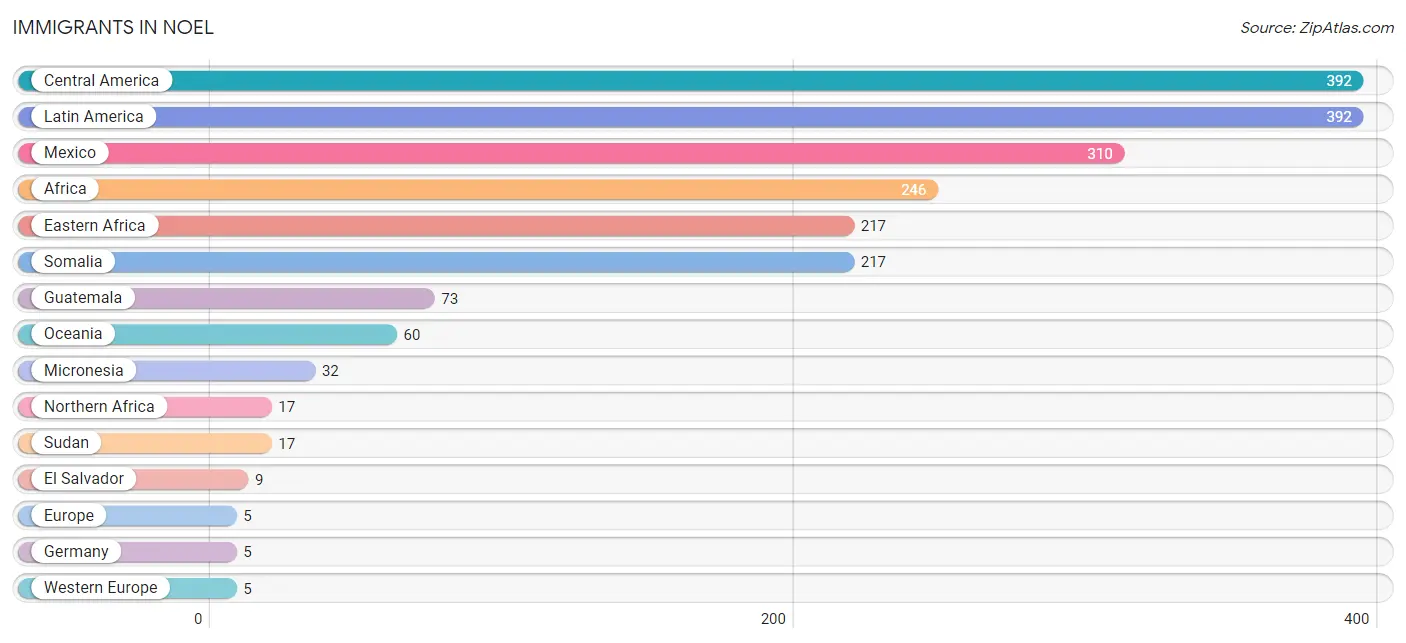
The most numerous immigrant groups reported in Noel came from Central America (392 | 20.3%), Latin America (392 | 20.3%), Mexico (310 | 16.1%), Africa (246 | 12.8%), and Eastern Africa (217 | 11.2%), together accounting for 80.7% of all Noel residents.
| Immigration Origin | # Population | % Population |
| Africa | 246 | 12.8% |
| Central America | 392 | 20.3% |
| Eastern Africa | 217 | 11.2% |
| El Salvador | 9 | 0.5% |
| Europe | 5 | 0.3% |
| Germany | 5 | 0.3% |
| Guatemala | 73 | 3.8% |
| Latin America | 392 | 20.3% |
| Mexico | 310 | 16.1% |
| Micronesia | 32 | 1.7% |
| Northern Africa | 17 | 0.9% |
| Oceania | 60 | 3.1% |
| Somalia | 217 | 11.2% |
| Sudan | 17 | 0.9% |
| Western Europe | 5 | 0.3% | View All 15 Rows |
Sex and Age in Noel
Sex and Age in Noel
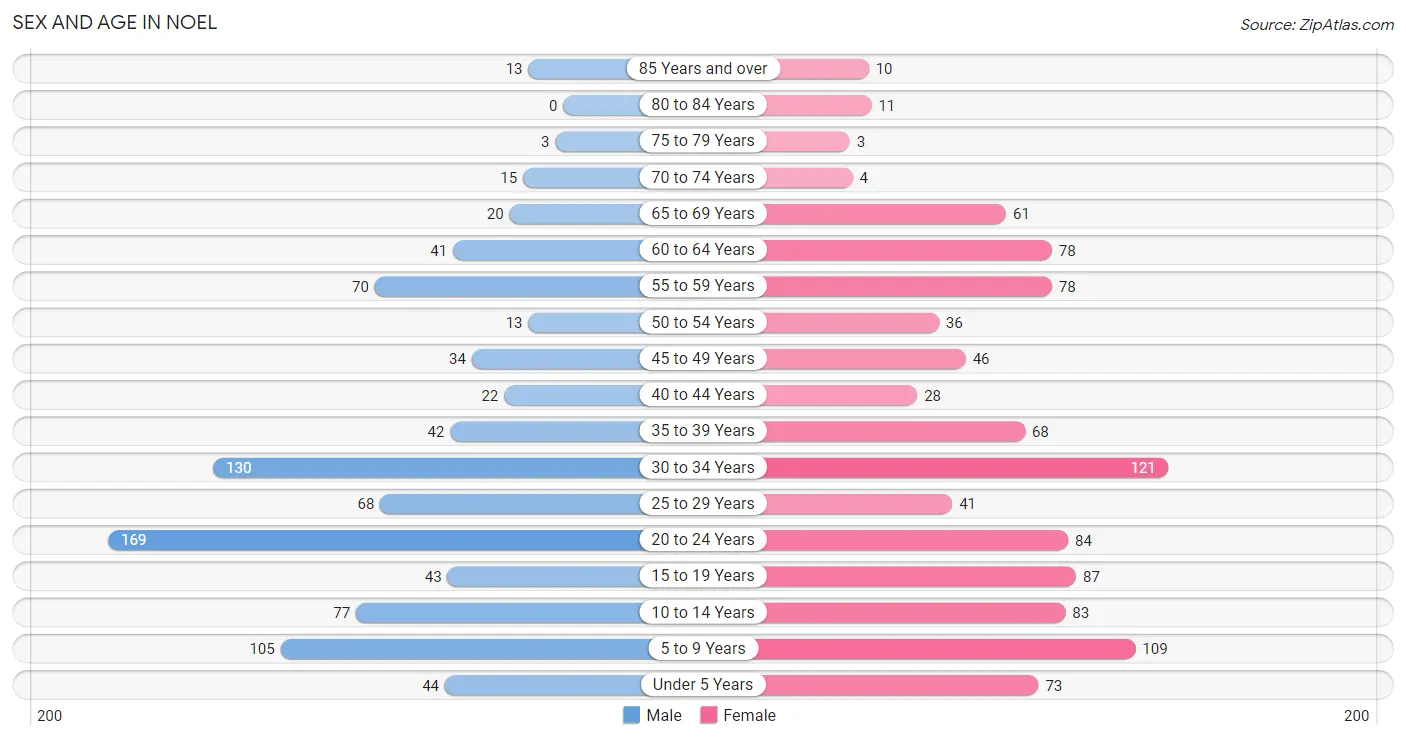
The most populous age groups in Noel are 20 to 24 Years (169 | 18.6%) for men and 30 to 34 Years (121 | 11.8%) for women.
| Age Bracket | Male | Female |
| Under 5 Years | 44 (4.8%) | 73 (7.1%) |
| 5 to 9 Years | 105 (11.6%) | 109 (10.7%) |
| 10 to 14 Years | 77 (8.5%) | 83 (8.1%) |
| 15 to 19 Years | 43 (4.7%) | 87 (8.5%) |
| 20 to 24 Years | 169 (18.6%) | 84 (8.2%) |
| 25 to 29 Years | 68 (7.5%) | 41 (4.0%) |
| 30 to 34 Years | 130 (14.3%) | 121 (11.8%) |
| 35 to 39 Years | 42 (4.6%) | 68 (6.7%) |
| 40 to 44 Years | 22 (2.4%) | 28 (2.7%) |
| 45 to 49 Years | 34 (3.7%) | 46 (4.5%) |
| 50 to 54 Years | 13 (1.4%) | 36 (3.5%) |
| 55 to 59 Years | 70 (7.7%) | 78 (7.6%) |
| 60 to 64 Years | 41 (4.5%) | 78 (7.6%) |
| 65 to 69 Years | 20 (2.2%) | 61 (6.0%) |
| 70 to 74 Years | 15 (1.7%) | 4 (0.4%) |
| 75 to 79 Years | 3 (0.3%) | 3 (0.3%) |
| 80 to 84 Years | 0 (0.0%) | 11 (1.1%) |
| 85 Years and over | 13 (1.4%) | 10 (1.0%) |
| Total | 909 (100.0%) | 1,021 (100.0%) |
Families and Households in Noel
Median Family Size in Noel
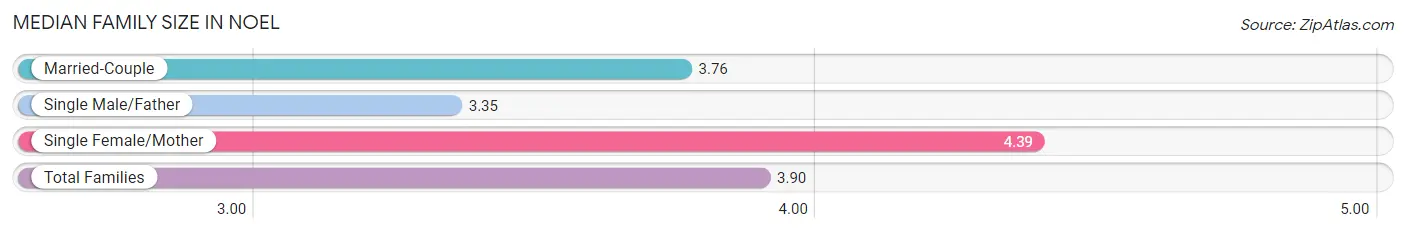
The median family size in Noel is 3.90 persons per family, with single female/mother families (119 | 29.2%) accounting for the largest median family size of 4.39 persons per family. On the other hand, single male/father families (37 | 9.1%) represent the smallest median family size with 3.35 persons per family.
| Family Type | # Families | Family Size |
| Married-Couple | 252 (61.8%) | 3.76 |
| Single Male/Father | 37 (9.1%) | 3.35 |
| Single Female/Mother | 119 (29.2%) | 4.39 |
| Total Families | 408 (100.0%) | 3.90 |
Median Household Size in Noel
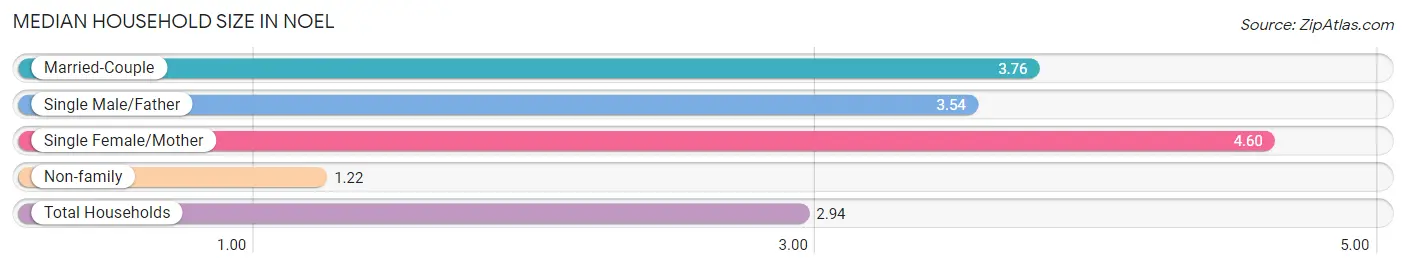
The median household size in Noel is 2.94 persons per household, with single female/mother households (119 | 18.1%) accounting for the largest median household size of 4.6 persons per household. non-family households (249 | 37.9%) represent the smallest median household size with 1.22 persons per household.
| Household Type | # Households | Household Size |
| Married-Couple | 252 (38.4%) | 3.76 |
| Single Male/Father | 37 (5.6%) | 3.54 |
| Single Female/Mother | 119 (18.1%) | 4.60 |
| Non-family | 249 (37.9%) | 1.22 |
| Total Households | 657 (100.0%) | 2.94 |
Household Size by Marriage Status in Noel
Out of a total of 657 households in Noel, 408 (62.1%) are family households, while 249 (37.9%) are nonfamily households. The most numerous type of family households are 2-person households, comprising 157, and the most common type of nonfamily households are 1-person households, comprising 195.

| Household Size | Family Households | Nonfamily Households |
| 1-Person Households | - | 195 (29.7%) |
| 2-Person Households | 157 (23.9%) | 23 (3.5%) |
| 3-Person Households | 74 (11.3%) | 31 (4.7%) |
| 4-Person Households | 64 (9.7%) | 0 (0.0%) |
| 5-Person Households | 34 (5.2%) | 0 (0.0%) |
| 6-Person Households | 53 (8.1%) | 0 (0.0%) |
| 7+ Person Households | 26 (4.0%) | 0 (0.0%) |
| Total | 408 (62.1%) | 249 (37.9%) |
Female Fertility in Noel
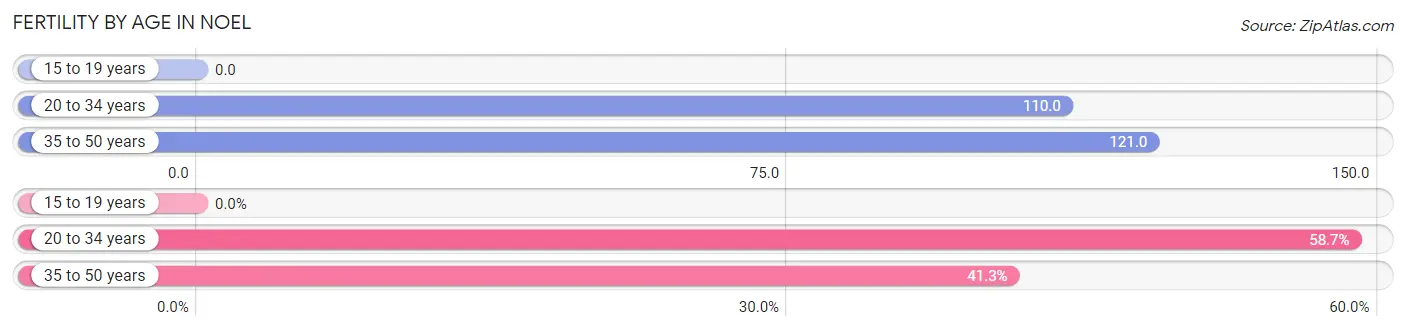
Fertility by Age in Noel
Average fertility rate in Noel is 94.0 births per 1,000 women. Women in the age bracket of 35 to 50 years have the highest fertility rate with 121.0 births per 1,000 women. Women in the age bracket of 20 to 34 years acount for 58.7% of all women with births.
| Age Bracket | Women with Births | Births / 1,000 Women |
| 15 to 19 years | 0 (0.0%) | 0.0 |
| 20 to 34 years | 27 (58.7%) | 110.0 |
| 35 to 50 years | 19 (41.3%) | 121.0 |
| Total | 46 (100.0%) | 94.0 |
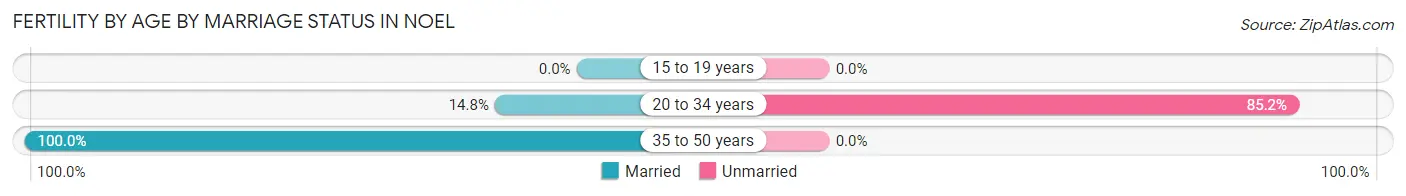
Fertility by Age by Marriage Status in Noel
50.0% of women with births (46) in Noel are married. The highest percentage of unmarried women with births falls into 20 to 34 years age bracket with 85.2% of them unmarried at the time of birth, while the lowest percentage of unmarried women with births belong to 35 to 50 years age bracket with 0.0% of them unmarried.
| Age Bracket | Married | Unmarried |
| 15 to 19 years | 0 (0.0%) | 0 (0.0%) |
| 20 to 34 years | 4 (14.8%) | 23 (85.2%) |
| 35 to 50 years | 19 (100.0%) | 0 (0.0%) |
| Total | 23 (50.0%) | 23 (50.0%) |
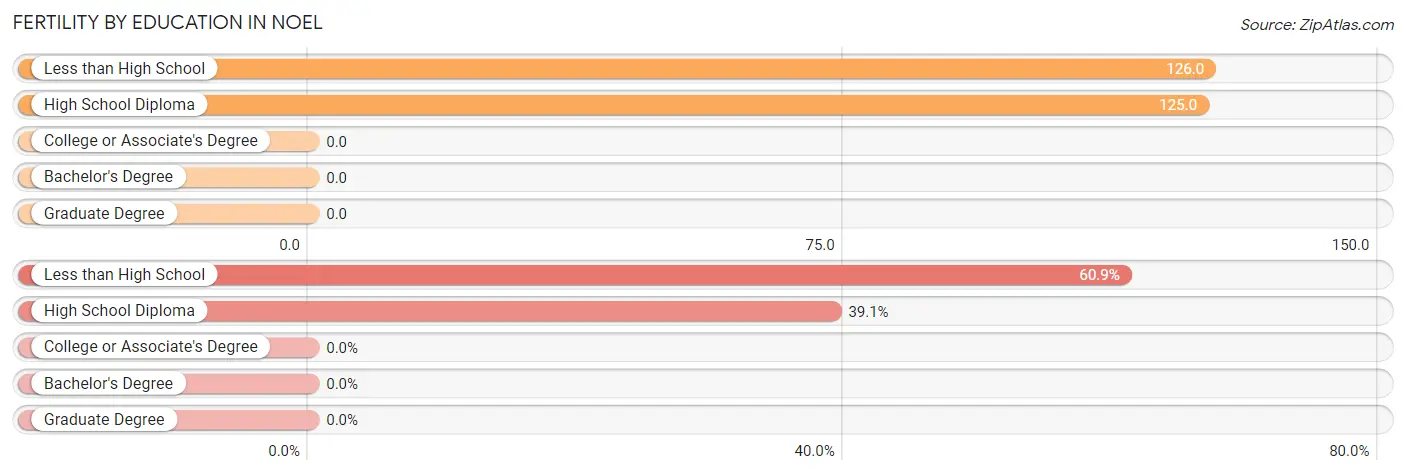
Fertility by Education in Noel
| Educational Attainment | Women with Births | Births / 1,000 Women |
| Less than High School | 28 (60.9%) | 126.0 |
| High School Diploma | 18 (39.1%) | 125.0 |
| College or Associate's Degree | 0 (0.0%) | 0.0 |
| Bachelor's Degree | 0 (0.0%) | 0.0 |
| Graduate Degree | 0 (0.0%) | 0.0 |
| Total | 46 (100.0%) | 94.0 |
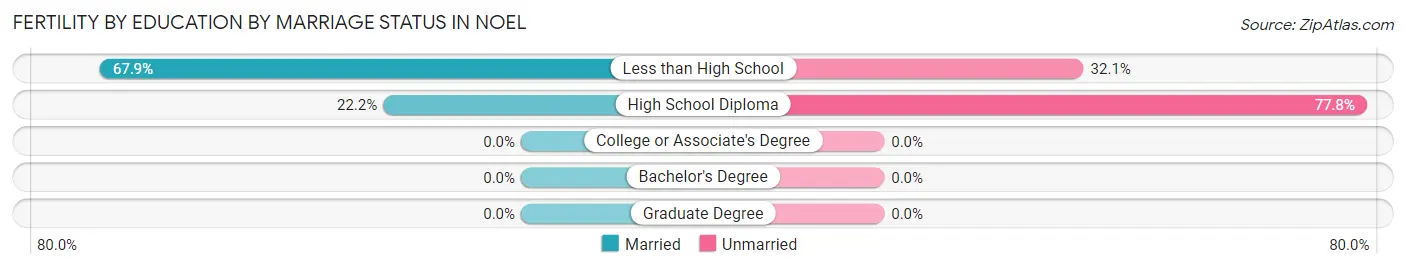
Fertility by Education by Marriage Status in Noel
50.0% of women with births in Noel are unmarried. Women with the educational attainment of less than high school are most likely to be married with 67.9% of them married at childbirth, while women with the educational attainment of high school diploma are least likely to be married with 77.8% of them unmarried at childbirth.
| Educational Attainment | Married | Unmarried |
| Less than High School | 19 (67.9%) | 9 (32.1%) |
| High School Diploma | 4 (22.2%) | 14 (77.8%) |
| College or Associate's Degree | 0 (0.0%) | 0 (0.0%) |
| Bachelor's Degree | 0 (0.0%) | 0 (0.0%) |
| Graduate Degree | 0 (0.0%) | 0 (0.0%) |
| Total | 23 (50.0%) | 23 (50.0%) |
Employment Characteristics in Noel
Employment by Class of Employer in Noel
Among the 815 employed individuals in Noel, private company employees (747 | 91.7%), not-for-profit organizations (49 | 6.0%), and self-employed (not incorporated) (11 | 1.3%) make up the most common classes of employment.
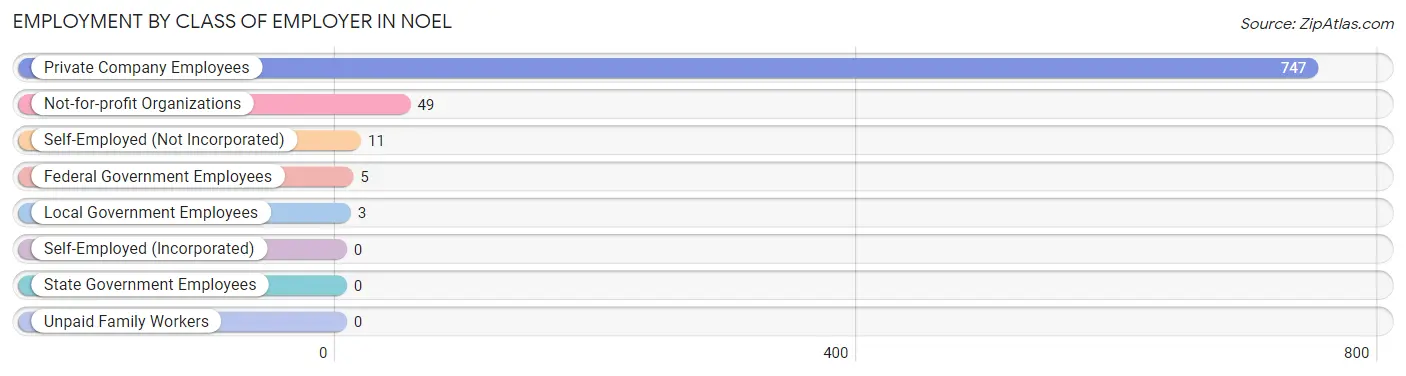
| Employer Class | # Employees | % Employees |
| Private Company Employees | 747 | 91.7% |
| Self-Employed (Incorporated) | 0 | 0.0% |
| Self-Employed (Not Incorporated) | 11 | 1.3% |
| Not-for-profit Organizations | 49 | 6.0% |
| Local Government Employees | 3 | 0.4% |
| State Government Employees | 0 | 0.0% |
| Federal Government Employees | 5 | 0.6% |
| Unpaid Family Workers | 0 | 0.0% |
| Total | 815 | 100.0% |
Employment Status by Age in Noel
According to the labor force statistics for Noel, out of the total population over 16 years of age (1,423), 61.3% or 872 individuals are in the labor force, with 6.6% or 58 of them unemployed. The age group with the highest labor force participation rate is 45 to 54 years, with 86.0% or 111 individuals in the labor force. Within the labor force, the 25 to 29 years age range has the highest percentage of unemployed individuals, with 25.4% or 15 of them being unemployed.
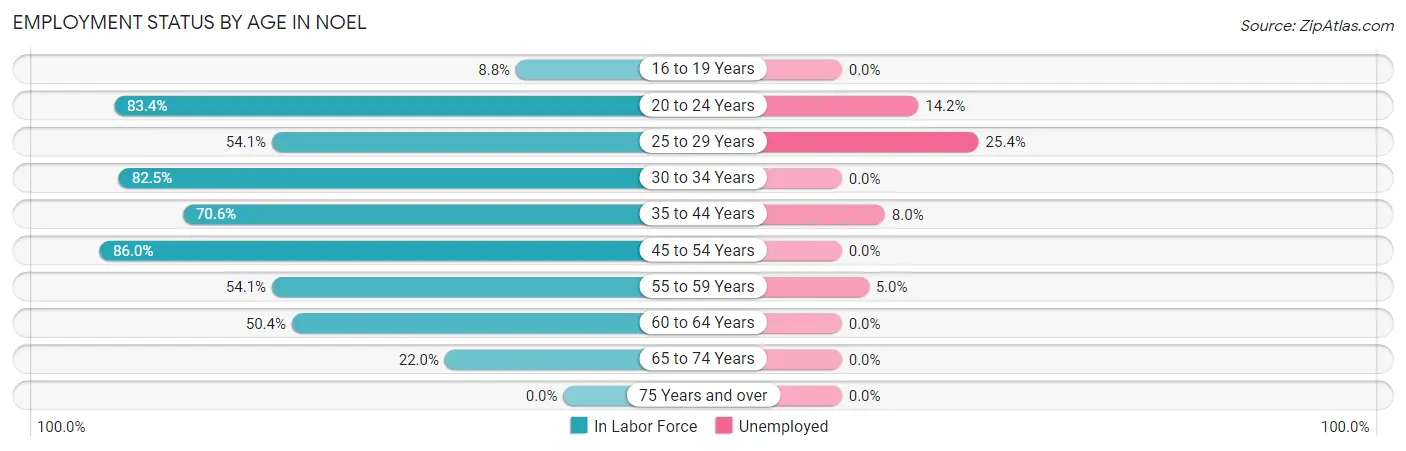
| Age Bracket | In Labor Force | Unemployed |
| 16 to 19 Years | 10 (8.8%) | 0 (0.0%) |
| 20 to 24 Years | 211 (83.4%) | 30 (14.2%) |
| 25 to 29 Years | 59 (54.1%) | 15 (25.4%) |
| 30 to 34 Years | 207 (82.5%) | 0 (0.0%) |
| 35 to 44 Years | 113 (70.6%) | 9 (8.0%) |
| 45 to 54 Years | 111 (86.0%) | 0 (0.0%) |
| 55 to 59 Years | 80 (54.1%) | 4 (5.0%) |
| 60 to 64 Years | 60 (50.4%) | 0 (0.0%) |
| 65 to 74 Years | 22 (22.0%) | 0 (0.0%) |
| 75 Years and over | 0 (0.0%) | 0 (0.0%) |
| Total | 872 (61.3%) | 58 (6.6%) |
Employment Status by Educational Attainment in Noel
According to labor force statistics for Noel, 68.8% of individuals (630) out of the total population between 25 and 64 years of age (916) are in the labor force, with 4.4% or 28 of them being unemployed. The group with the highest labor force participation rate are those with the educational attainment of bachelor's degree or higher, with 91.4% or 117 individuals in the labor force. Within the labor force, individuals with high school diploma education have the highest percentage of unemployment, with 11.6% or 21 of them being unemployed.
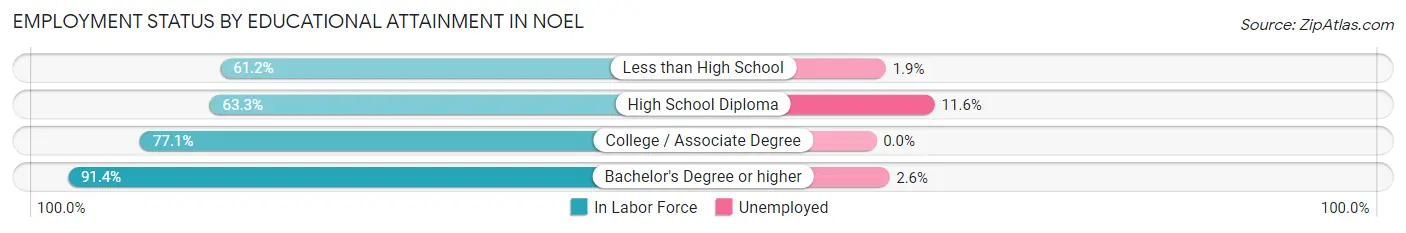
| Educational Attainment | In Labor Force | Unemployed |
| Less than High School | 211 (61.2%) | 7 (1.9%) |
| High School Diploma | 181 (63.3%) | 33 (11.6%) |
| College / Associate Degree | 121 (77.1%) | 0 (0.0%) |
| Bachelor's Degree or higher | 117 (91.4%) | 3 (2.6%) |
| Total | 630 (68.8%) | 40 (4.4%) |
Employment Occupations by Sex in Noel
Management, Business, Science and Arts Occupations
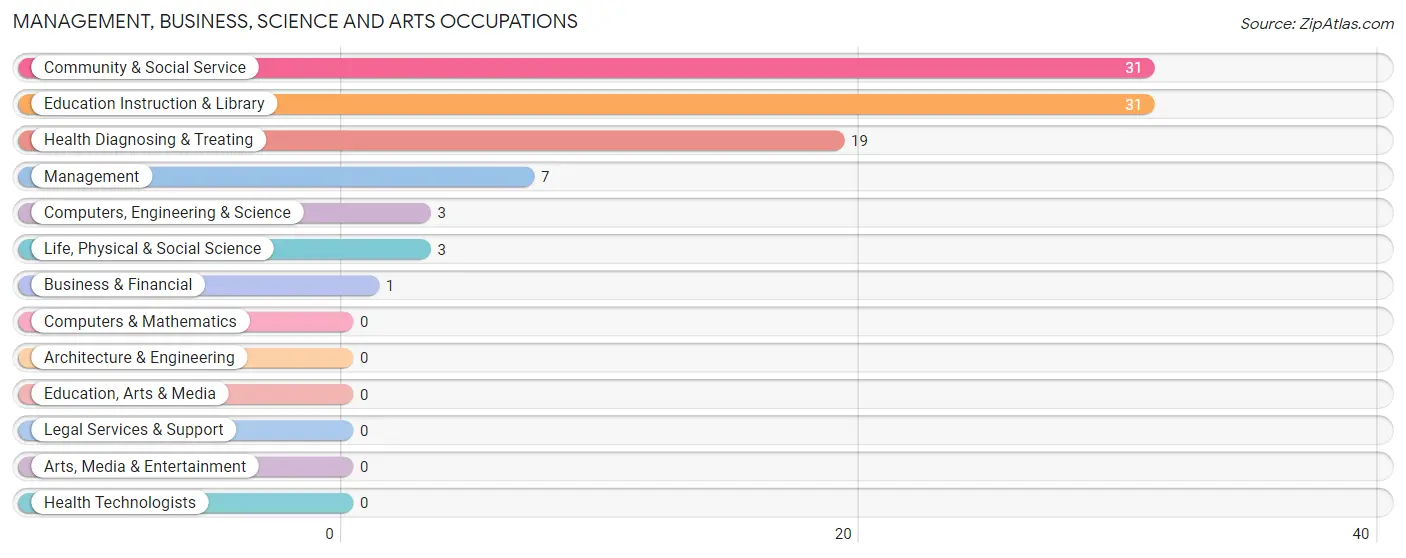
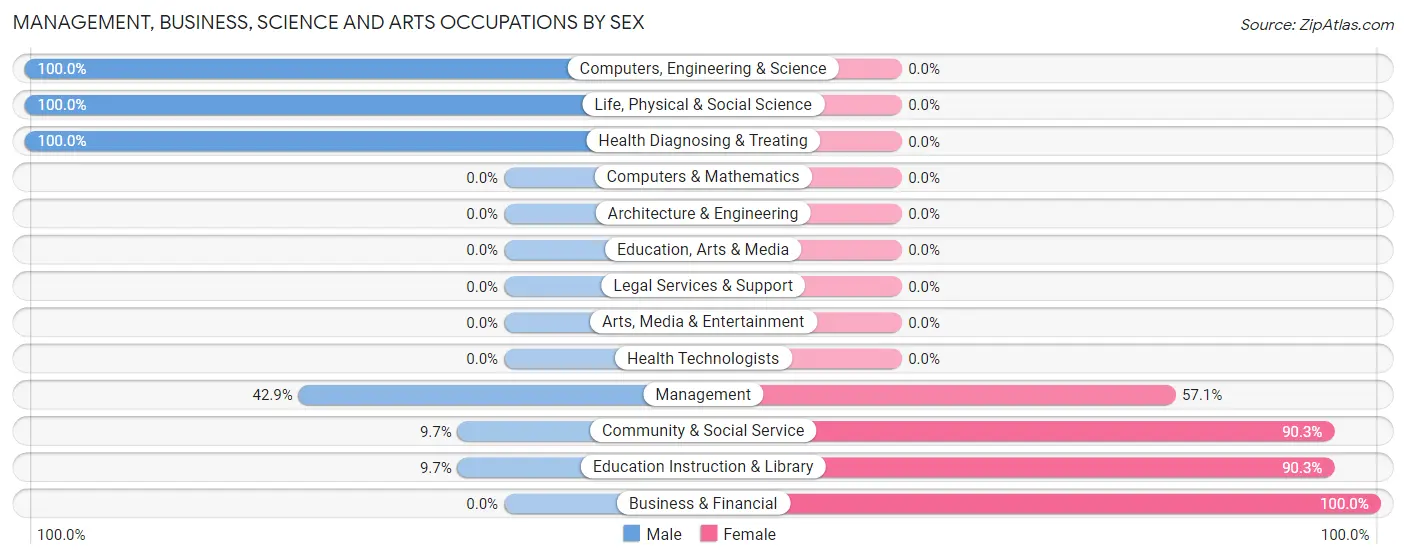
The most common Management, Business, Science and Arts occupations in Noel are Community & Social Service (31 | 3.8%), Education Instruction & Library (31 | 3.8%), Health Diagnosing & Treating (19 | 2.3%), Management (7 | 0.9%), and Computers, Engineering & Science (3 | 0.4%).
Management, Business, Science and Arts Occupations by Sex
Within the Management, Business, Science and Arts occupations in Noel, the most male-oriented occupations are Computers, Engineering & Science (100.0%), Life, Physical & Social Science (100.0%), and Health Diagnosing & Treating (100.0%), while the most female-oriented occupations are Business & Financial (100.0%), Community & Social Service (90.3%), and Education Instruction & Library (90.3%).
| Occupation | Male | Female |
| Management | 3 (42.9%) | 4 (57.1%) |
| Business & Financial | 0 (0.0%) | 1 (100.0%) |
| Computers, Engineering & Science | 3 (100.0%) | 0 (0.0%) |
| Computers & Mathematics | 0 (0.0%) | 0 (0.0%) |
| Architecture & Engineering | 0 (0.0%) | 0 (0.0%) |
| Life, Physical & Social Science | 3 (100.0%) | 0 (0.0%) |
| Community & Social Service | 3 (9.7%) | 28 (90.3%) |
| Education, Arts & Media | 0 (0.0%) | 0 (0.0%) |
| Legal Services & Support | 0 (0.0%) | 0 (0.0%) |
| Education Instruction & Library | 3 (9.7%) | 28 (90.3%) |
| Arts, Media & Entertainment | 0 (0.0%) | 0 (0.0%) |
| Health Diagnosing & Treating | 19 (100.0%) | 0 (0.0%) |
| Health Technologists | 0 (0.0%) | 0 (0.0%) |
| Total (Category) | 28 (45.9%) | 33 (54.1%) |
| Total (Overall) | 463 (56.8%) | 352 (43.2%) |
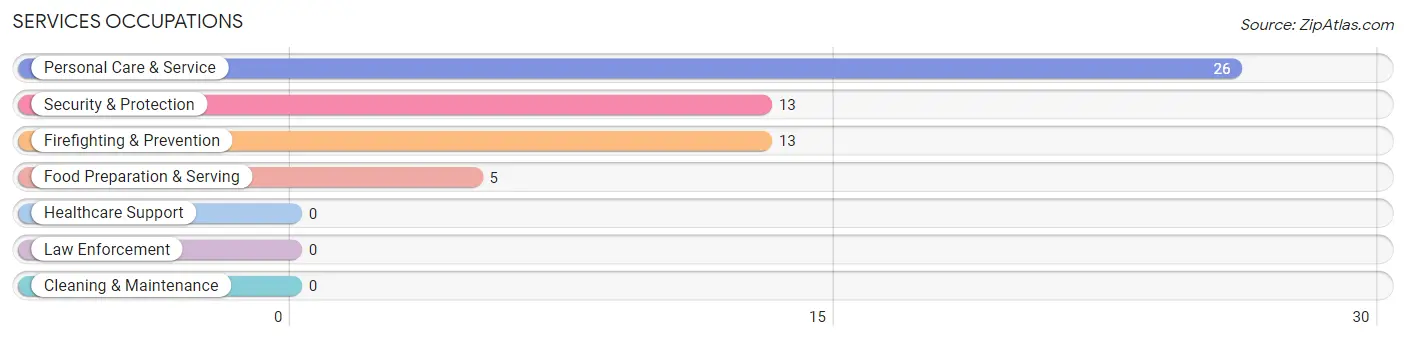
Services Occupations
The most common Services occupations in Noel are Personal Care & Service (26 | 3.2%), Security & Protection (13 | 1.6%), Firefighting & Prevention (13 | 1.6%), and Food Preparation & Serving (5 | 0.6%).
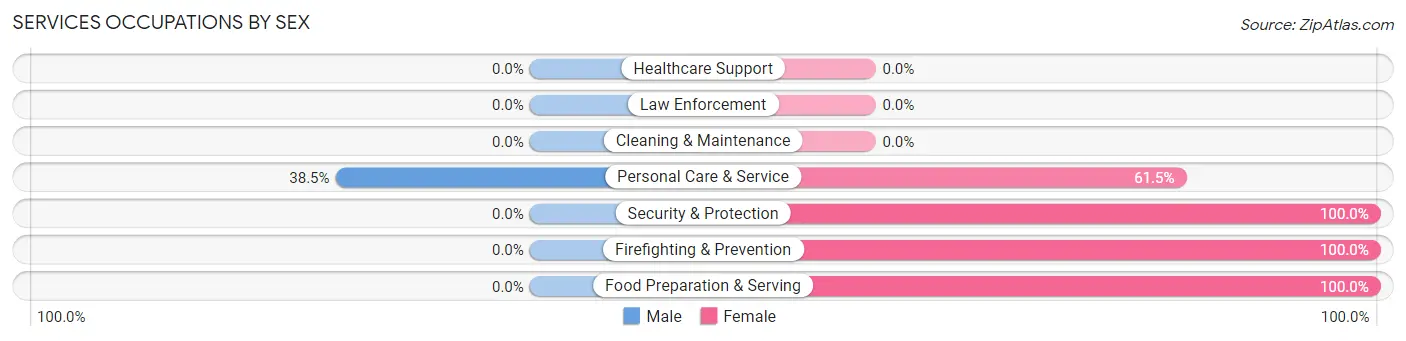
Services Occupations by Sex
| Occupation | Male | Female |
| Healthcare Support | 0 (0.0%) | 0 (0.0%) |
| Security & Protection | 0 (0.0%) | 13 (100.0%) |
| Firefighting & Prevention | 0 (0.0%) | 13 (100.0%) |
| Law Enforcement | 0 (0.0%) | 0 (0.0%) |
| Food Preparation & Serving | 0 (0.0%) | 5 (100.0%) |
| Cleaning & Maintenance | 0 (0.0%) | 0 (0.0%) |
| Personal Care & Service | 10 (38.5%) | 16 (61.5%) |
| Total (Category) | 10 (22.7%) | 34 (77.3%) |
| Total (Overall) | 463 (56.8%) | 352 (43.2%) |
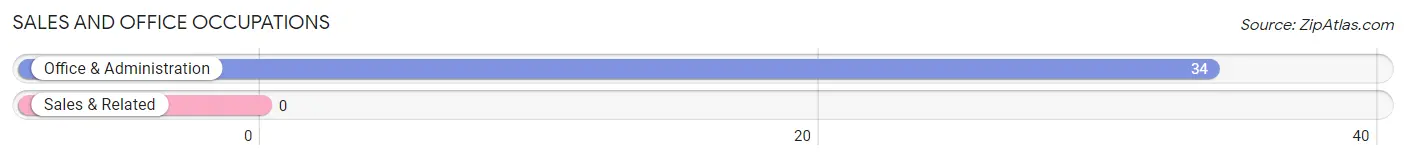
Sales and Office Occupations
The most common Sales and Office occupations in Noel are , and Office & Administration (34 | 4.2%).
Sales and Office Occupations by Sex
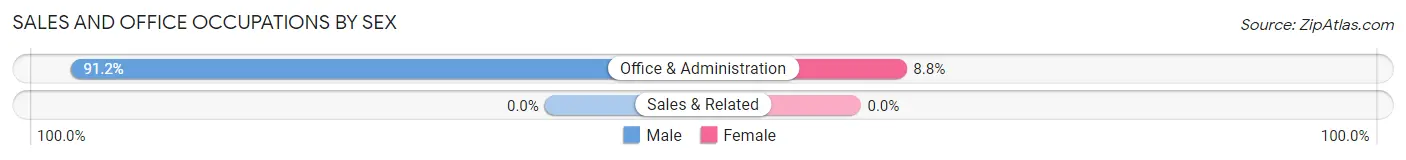
| Occupation | Male | Female |
| Sales & Related | 0 (0.0%) | 0 (0.0%) |
| Office & Administration | 31 (91.2%) | 3 (8.8%) |
| Total (Category) | 31 (91.2%) | 3 (8.8%) |
| Total (Overall) | 463 (56.8%) | 352 (43.2%) |
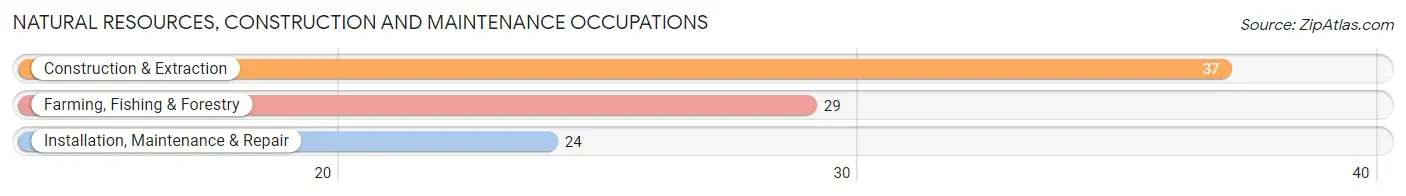
Natural Resources, Construction and Maintenance Occupations
The most common Natural Resources, Construction and Maintenance occupations in Noel are Construction & Extraction (37 | 4.5%), Farming, Fishing & Forestry (29 | 3.6%), and Installation, Maintenance & Repair (24 | 2.9%).
Natural Resources, Construction and Maintenance Occupations by Sex
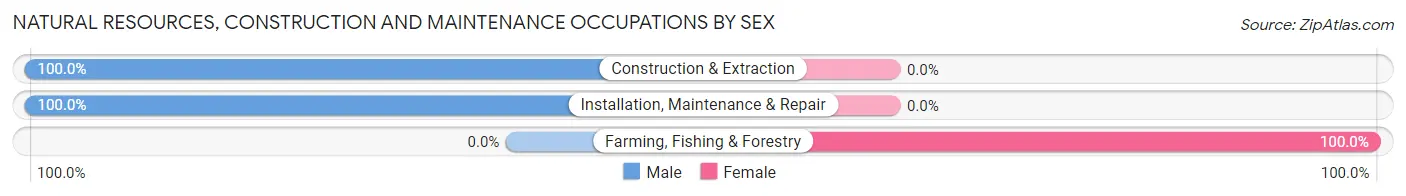
| Occupation | Male | Female |
| Farming, Fishing & Forestry | 0 (0.0%) | 29 (100.0%) |
| Construction & Extraction | 37 (100.0%) | 0 (0.0%) |
| Installation, Maintenance & Repair | 24 (100.0%) | 0 (0.0%) |
| Total (Category) | 61 (67.8%) | 29 (32.2%) |
| Total (Overall) | 463 (56.8%) | 352 (43.2%) |
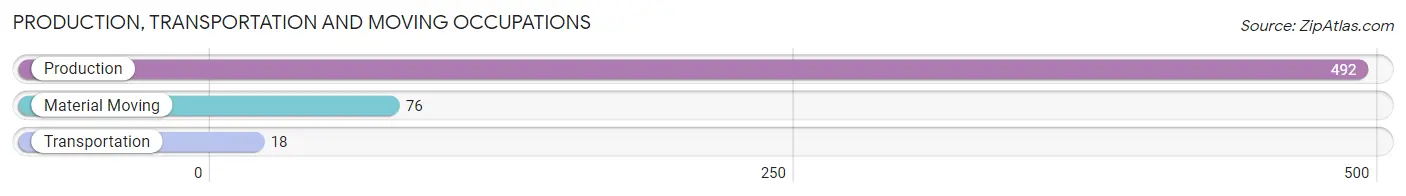
Production, Transportation and Moving Occupations
The most common Production, Transportation and Moving occupations in Noel are Production (492 | 60.4%), Material Moving (76 | 9.3%), and Transportation (18 | 2.2%).
Production, Transportation and Moving Occupations by Sex
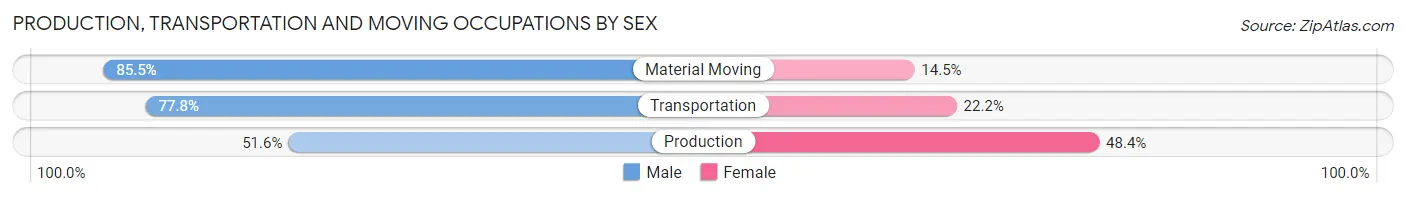
| Occupation | Male | Female |
| Production | 254 (51.6%) | 238 (48.4%) |
| Transportation | 14 (77.8%) | 4 (22.2%) |
| Material Moving | 65 (85.5%) | 11 (14.5%) |
| Total (Category) | 333 (56.8%) | 253 (43.2%) |
| Total (Overall) | 463 (56.8%) | 352 (43.2%) |
Employment Industries by Sex in Noel
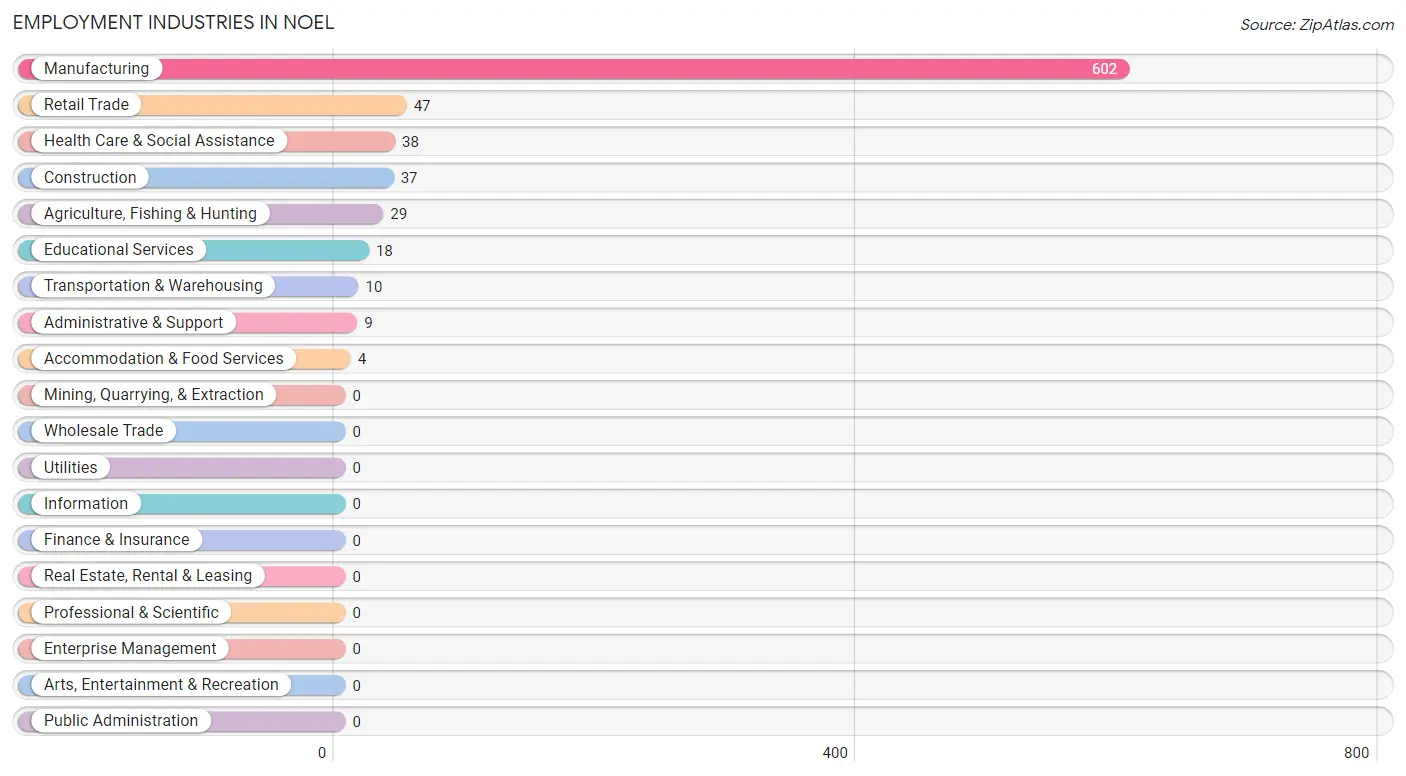
Employment Industries in Noel
The major employment industries in Noel include Manufacturing (602 | 73.9%), Retail Trade (47 | 5.8%), Health Care & Social Assistance (38 | 4.7%), Construction (37 | 4.5%), and Agriculture, Fishing & Hunting (29 | 3.6%).
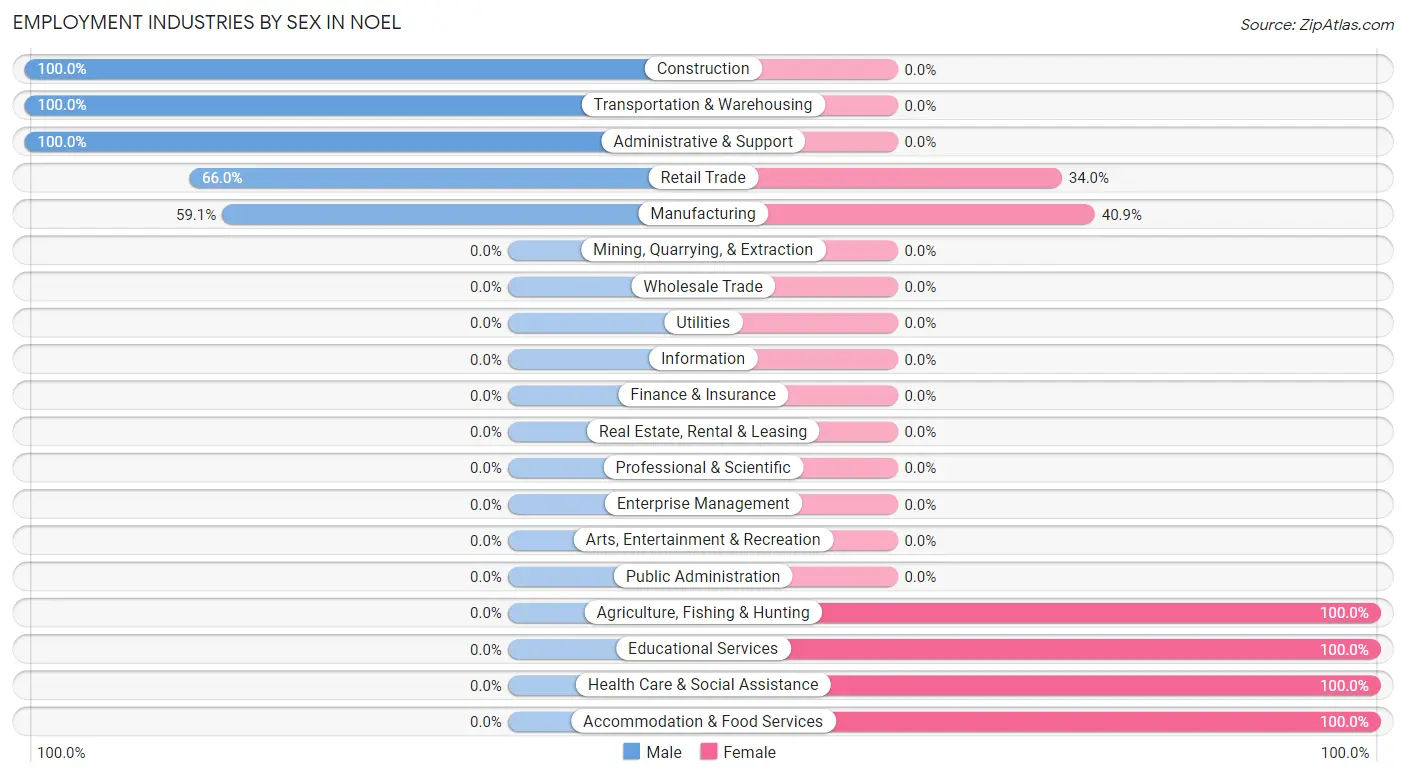
Employment Industries by Sex in Noel
The Noel industries that see more men than women are Construction (100.0%), Transportation & Warehousing (100.0%), and Administrative & Support (100.0%), whereas the industries that tend to have a higher number of women are Agriculture, Fishing & Hunting (100.0%), Educational Services (100.0%), and Health Care & Social Assistance (100.0%).
| Industry | Male | Female |
| Agriculture, Fishing & Hunting | 0 (0.0%) | 29 (100.0%) |
| Mining, Quarrying, & Extraction | 0 (0.0%) | 0 (0.0%) |
| Construction | 37 (100.0%) | 0 (0.0%) |
| Manufacturing | 356 (59.1%) | 246 (40.9%) |
| Wholesale Trade | 0 (0.0%) | 0 (0.0%) |
| Retail Trade | 31 (66.0%) | 16 (34.0%) |
| Transportation & Warehousing | 10 (100.0%) | 0 (0.0%) |
| Utilities | 0 (0.0%) | 0 (0.0%) |
| Information | 0 (0.0%) | 0 (0.0%) |
| Finance & Insurance | 0 (0.0%) | 0 (0.0%) |
| Real Estate, Rental & Leasing | 0 (0.0%) | 0 (0.0%) |
| Professional & Scientific | 0 (0.0%) | 0 (0.0%) |
| Enterprise Management | 0 (0.0%) | 0 (0.0%) |
| Administrative & Support | 9 (100.0%) | 0 (0.0%) |
| Educational Services | 0 (0.0%) | 18 (100.0%) |
| Health Care & Social Assistance | 0 (0.0%) | 38 (100.0%) |
| Arts, Entertainment & Recreation | 0 (0.0%) | 0 (0.0%) |
| Accommodation & Food Services | 0 (0.0%) | 4 (100.0%) |
| Public Administration | 0 (0.0%) | 0 (0.0%) |
| Total | 463 (56.8%) | 352 (43.2%) |
Education in Noel
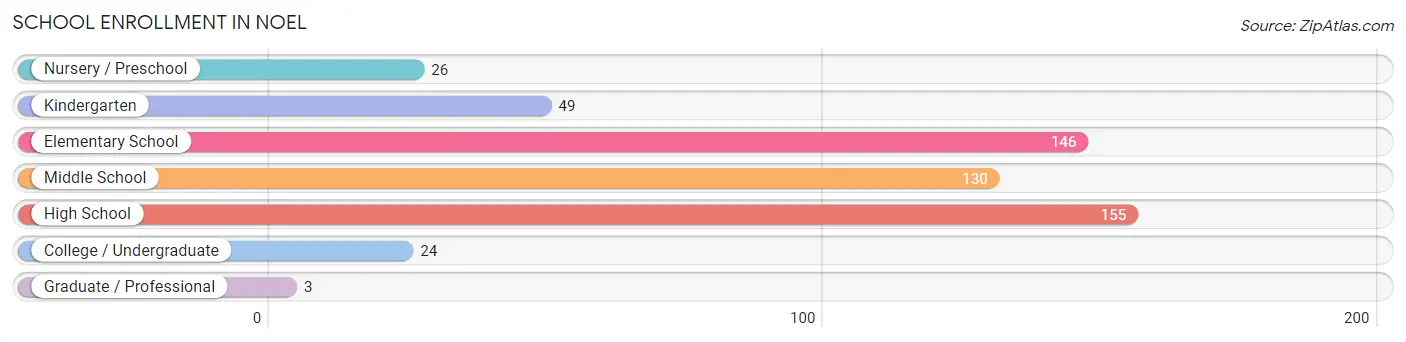
School Enrollment in Noel
The most common levels of schooling among the 533 students in Noel are high school (155 | 29.1%), elementary school (146 | 27.4%), and middle school (130 | 24.4%).
| School Level | # Students | % Students |
| Nursery / Preschool | 26 | 4.9% |
| Kindergarten | 49 | 9.2% |
| Elementary School | 146 | 27.4% |
| Middle School | 130 | 24.4% |
| High School | 155 | 29.1% |
| College / Undergraduate | 24 | 4.5% |
| Graduate / Professional | 3 | 0.6% |
| Total | 533 | 100.0% |
School Enrollment by Age by Funding Source in Noel
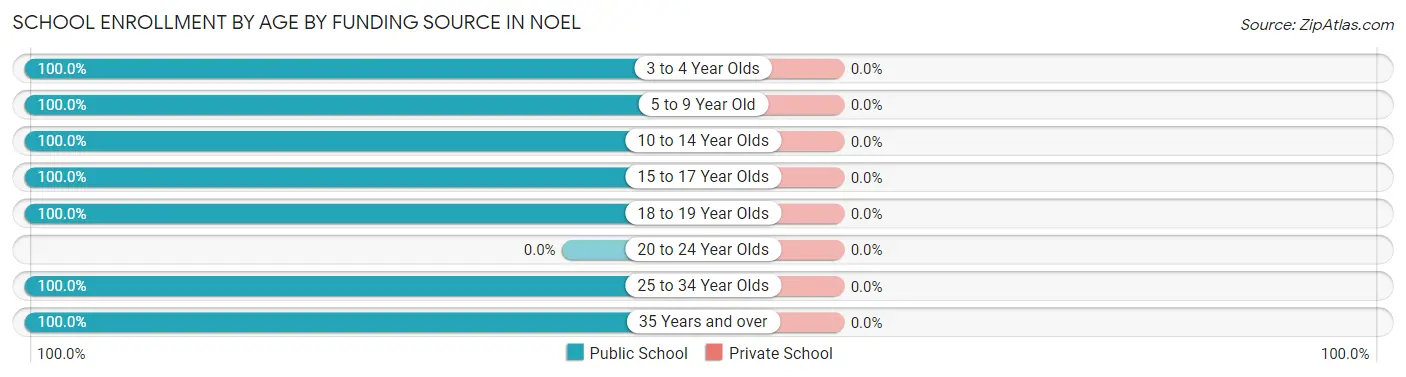
| Age Bracket | Public School | Private School |
| 3 to 4 Year Olds | 15 (100.0%) | 0 (0.0%) |
| 5 to 9 Year Old | 211 (100.0%) | 0 (0.0%) |
| 10 to 14 Year Olds | 160 (100.0%) | 0 (0.0%) |
| 15 to 17 Year Olds | 50 (100.0%) | 0 (0.0%) |
| 18 to 19 Year Olds | 70 (100.0%) | 0 (0.0%) |
| 20 to 24 Year Olds | 0 (0.0%) | 0 (0.0%) |
| 25 to 34 Year Olds | 24 (100.0%) | 0 (0.0%) |
| 35 Years and over | 3 (100.0%) | 0 (0.0%) |
| Total | 533 (100.0%) | 0 (0.0%) |
Educational Attainment by Field of Study in Noel
Social sciences (65 | 43.9%), bio, nature & agricultural (39 | 26.4%), science & technology (11 | 7.4%), education (11 | 7.4%), and engineering (10 | 6.8%) are the most common fields of study among 148 individuals in Noel who have obtained a bachelor's degree or higher.
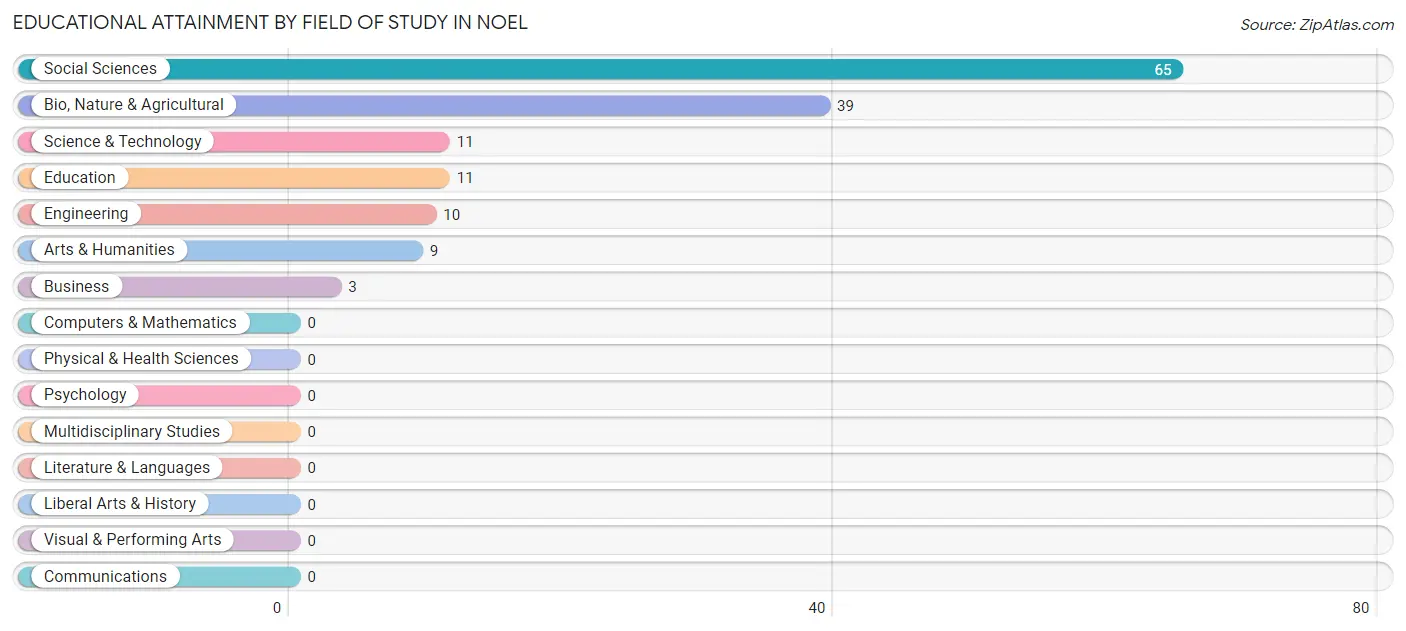
| Field of Study | # Graduates | % Graduates |
| Computers & Mathematics | 0 | 0.0% |
| Bio, Nature & Agricultural | 39 | 26.4% |
| Physical & Health Sciences | 0 | 0.0% |
| Psychology | 0 | 0.0% |
| Social Sciences | 65 | 43.9% |
| Engineering | 10 | 6.8% |
| Multidisciplinary Studies | 0 | 0.0% |
| Science & Technology | 11 | 7.4% |
| Business | 3 | 2.0% |
| Education | 11 | 7.4% |
| Literature & Languages | 0 | 0.0% |
| Liberal Arts & History | 0 | 0.0% |
| Visual & Performing Arts | 0 | 0.0% |
| Communications | 0 | 0.0% |
| Arts & Humanities | 9 | 6.1% |
| Total | 148 | 100.0% |
Transportation & Commute in Noel
Vehicle Availability by Sex in Noel
The most prevalent vehicle ownership categories in Noel are males with 1 vehicle (181, accounting for 39.1%) and females with 1 vehicle (71, making up 51.4%).
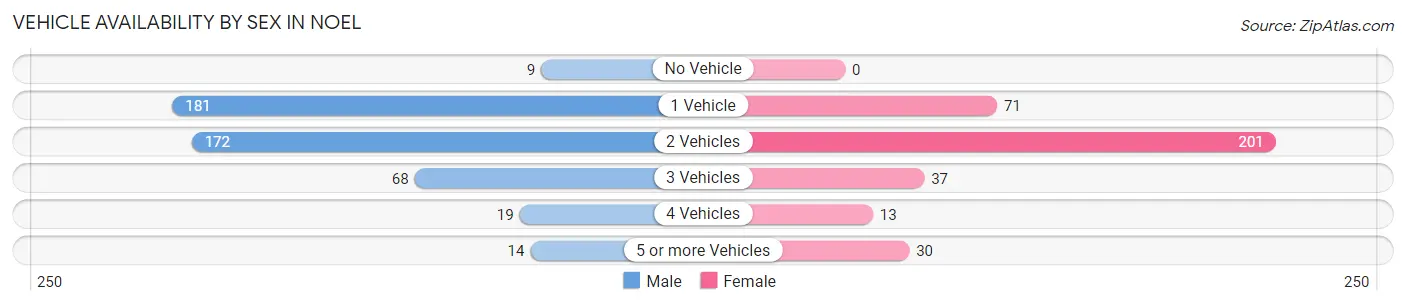
| Vehicles Available | Male | Female |
| No Vehicle | 9 (1.9%) | 0 (0.0%) |
| 1 Vehicle | 181 (39.1%) | 71 (20.2%) |
| 2 Vehicles | 172 (37.1%) | 201 (57.1%) |
| 3 Vehicles | 68 (14.7%) | 37 (10.5%) |
| 4 Vehicles | 19 (4.1%) | 13 (3.7%) |
| 5 or more Vehicles | 14 (3.0%) | 30 (8.5%) |
| Total | 463 (100.0%) | 352 (100.0%) |
Commute Time in Noel
The most frequently occuring commute durations in Noel are 5 to 9 minutes (448 commuters, 55.0%), 15 to 19 minutes (66 commuters, 8.1%), and 20 to 24 minutes (57 commuters, 7.0%).
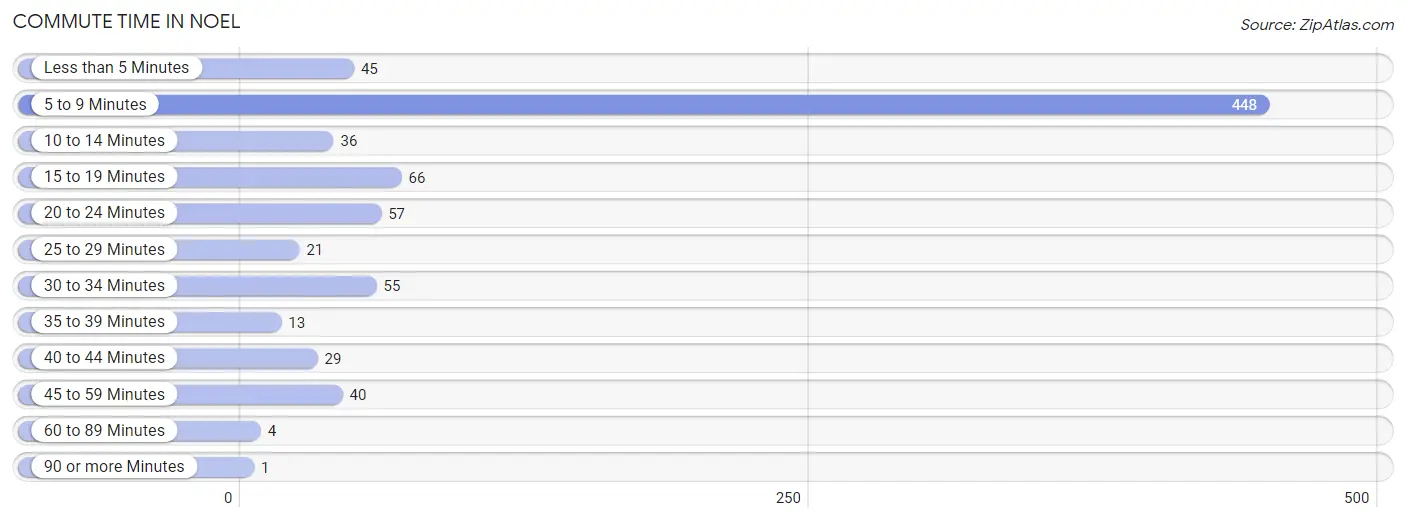
| Commute Time | # Commuters | % Commuters |
| Less than 5 Minutes | 45 | 5.5% |
| 5 to 9 Minutes | 448 | 55.0% |
| 10 to 14 Minutes | 36 | 4.4% |
| 15 to 19 Minutes | 66 | 8.1% |
| 20 to 24 Minutes | 57 | 7.0% |
| 25 to 29 Minutes | 21 | 2.6% |
| 30 to 34 Minutes | 55 | 6.8% |
| 35 to 39 Minutes | 13 | 1.6% |
| 40 to 44 Minutes | 29 | 3.6% |
| 45 to 59 Minutes | 40 | 4.9% |
| 60 to 89 Minutes | 4 | 0.5% |
| 90 or more Minutes | 1 | 0.1% |
Commute Time by Sex in Noel
The most common commute times in Noel are 5 to 9 minutes (239 commuters, 51.6%) for males and 5 to 9 minutes (209 commuters, 59.4%) for females.
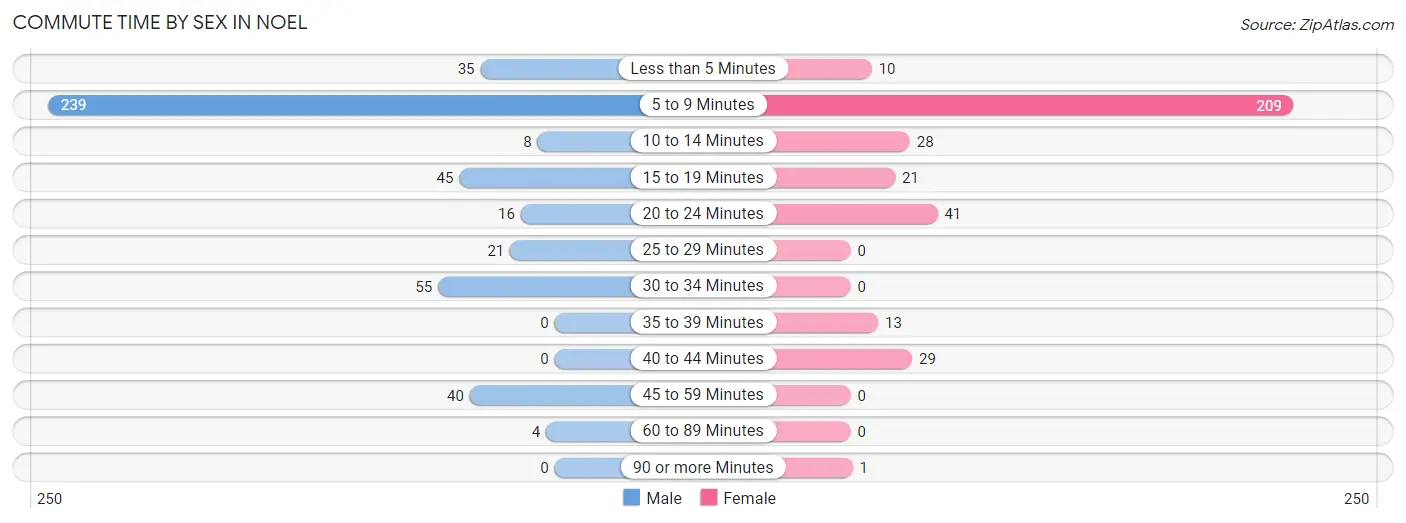
| Commute Time | Male | Female |
| Less than 5 Minutes | 35 (7.6%) | 10 (2.8%) |
| 5 to 9 Minutes | 239 (51.6%) | 209 (59.4%) |
| 10 to 14 Minutes | 8 (1.7%) | 28 (8.0%) |
| 15 to 19 Minutes | 45 (9.7%) | 21 (6.0%) |
| 20 to 24 Minutes | 16 (3.5%) | 41 (11.7%) |
| 25 to 29 Minutes | 21 (4.5%) | 0 (0.0%) |
| 30 to 34 Minutes | 55 (11.9%) | 0 (0.0%) |
| 35 to 39 Minutes | 0 (0.0%) | 13 (3.7%) |
| 40 to 44 Minutes | 0 (0.0%) | 29 (8.2%) |
| 45 to 59 Minutes | 40 (8.6%) | 0 (0.0%) |
| 60 to 89 Minutes | 4 (0.9%) | 0 (0.0%) |
| 90 or more Minutes | 0 (0.0%) | 1 (0.3%) |
Time of Departure to Work by Sex in Noel
The most frequent times of departure to work in Noel are 12:00 PM to 3:59 PM (111, 24.0%) for males and 12:00 AM to 4:59 AM (89, 25.3%) for females.
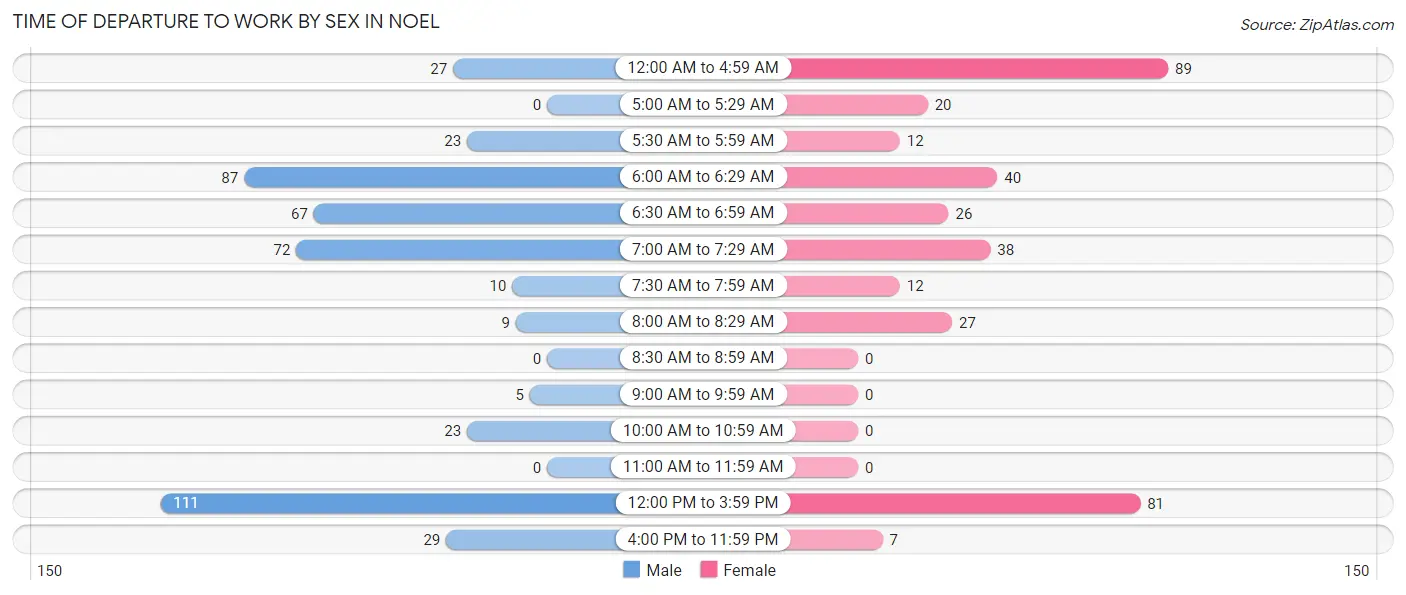
| Time of Departure | Male | Female |
| 12:00 AM to 4:59 AM | 27 (5.8%) | 89 (25.3%) |
| 5:00 AM to 5:29 AM | 0 (0.0%) | 20 (5.7%) |
| 5:30 AM to 5:59 AM | 23 (5.0%) | 12 (3.4%) |
| 6:00 AM to 6:29 AM | 87 (18.8%) | 40 (11.4%) |
| 6:30 AM to 6:59 AM | 67 (14.5%) | 26 (7.4%) |
| 7:00 AM to 7:29 AM | 72 (15.5%) | 38 (10.8%) |
| 7:30 AM to 7:59 AM | 10 (2.2%) | 12 (3.4%) |
| 8:00 AM to 8:29 AM | 9 (1.9%) | 27 (7.7%) |
| 8:30 AM to 8:59 AM | 0 (0.0%) | 0 (0.0%) |
| 9:00 AM to 9:59 AM | 5 (1.1%) | 0 (0.0%) |
| 10:00 AM to 10:59 AM | 23 (5.0%) | 0 (0.0%) |
| 11:00 AM to 11:59 AM | 0 (0.0%) | 0 (0.0%) |
| 12:00 PM to 3:59 PM | 111 (24.0%) | 81 (23.0%) |
| 4:00 PM to 11:59 PM | 29 (6.3%) | 7 (2.0%) |
| Total | 463 (100.0%) | 352 (100.0%) |
Housing Occupancy in Noel
Occupancy by Ownership in Noel
Of the total 657 dwellings in Noel, owner-occupied units account for 231 (35.2%), while renter-occupied units make up 426 (64.8%).
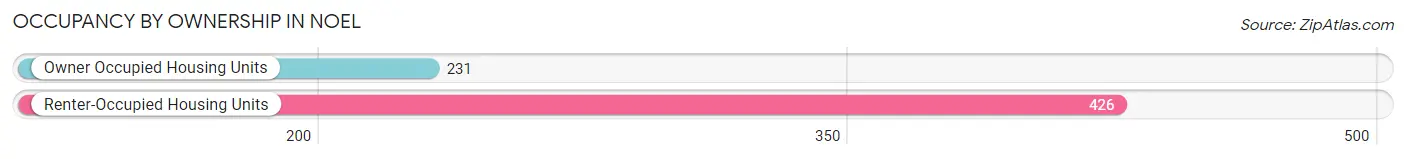
| Occupancy | # Housing Units | % Housing Units |
| Owner Occupied Housing Units | 231 | 35.2% |
| Renter-Occupied Housing Units | 426 | 64.8% |
| Total Occupied Housing Units | 657 | 100.0% |
Occupancy by Household Size in Noel
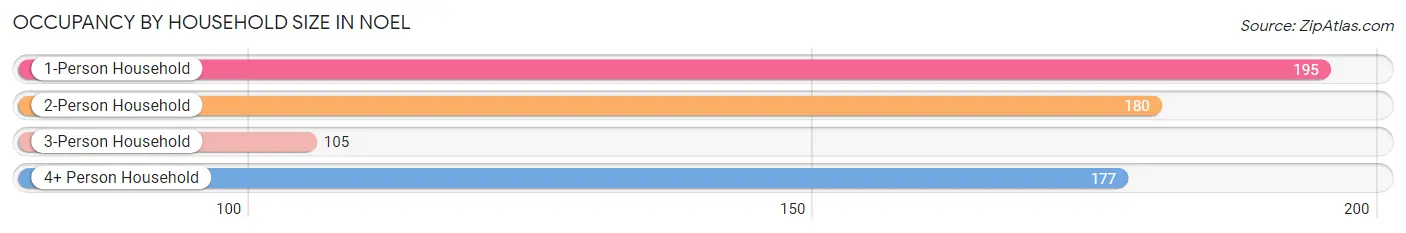
| Household Size | # Housing Units | % Housing Units |
| 1-Person Household | 195 | 29.7% |
| 2-Person Household | 180 | 27.4% |
| 3-Person Household | 105 | 16.0% |
| 4+ Person Household | 177 | 26.9% |
| Total Housing Units | 657 | 100.0% |
Occupancy by Ownership by Household Size in Noel
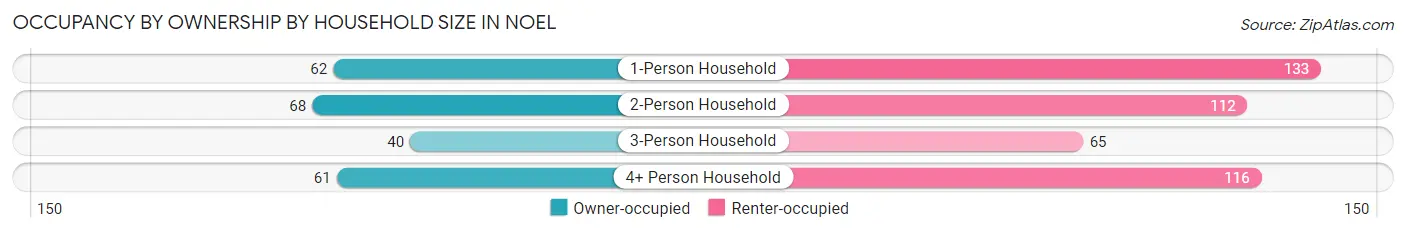
| Household Size | Owner-occupied | Renter-occupied |
| 1-Person Household | 62 (31.8%) | 133 (68.2%) |
| 2-Person Household | 68 (37.8%) | 112 (62.2%) |
| 3-Person Household | 40 (38.1%) | 65 (61.9%) |
| 4+ Person Household | 61 (34.5%) | 116 (65.5%) |
| Total Housing Units | 231 (35.2%) | 426 (64.8%) |
Occupancy by Educational Attainment in Noel
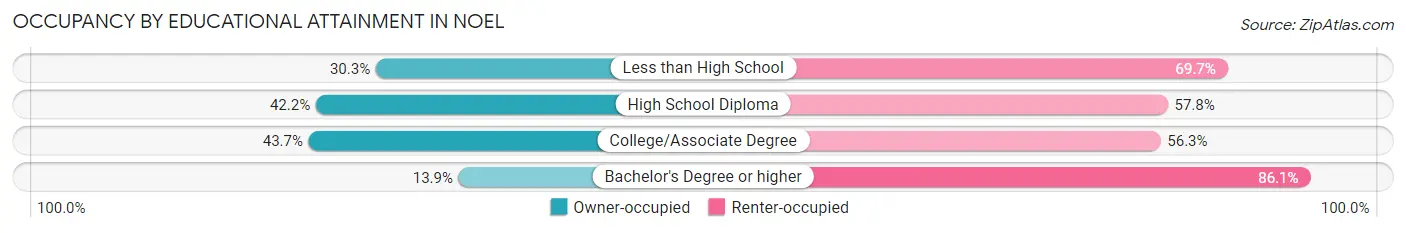
| Household Size | Owner-occupied | Renter-occupied |
| Less than High School | 64 (30.3%) | 147 (69.7%) |
| High School Diploma | 125 (42.2%) | 171 (57.8%) |
| College/Associate Degree | 31 (43.7%) | 40 (56.3%) |
| Bachelor's Degree or higher | 11 (13.9%) | 68 (86.1%) |
Occupancy by Age of Householder in Noel
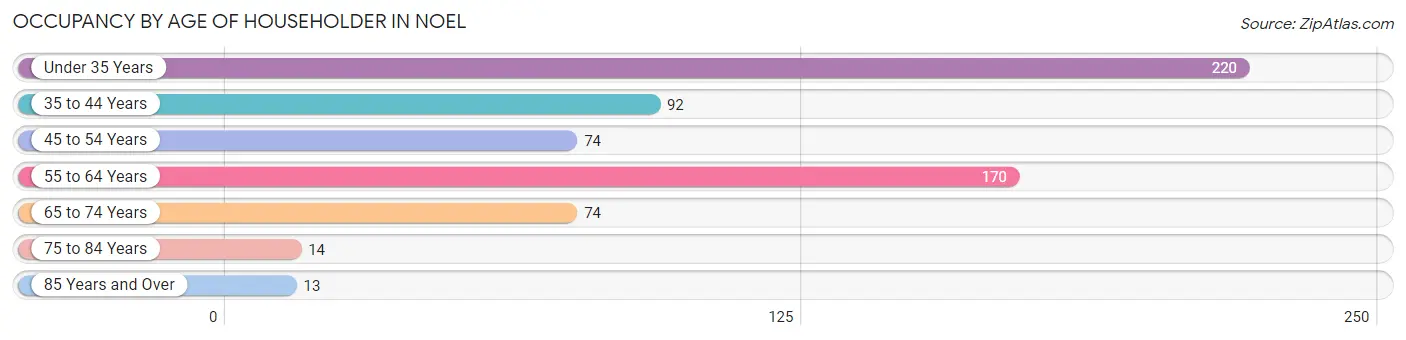
| Age Bracket | # Households | % Households |
| Under 35 Years | 220 | 33.5% |
| 35 to 44 Years | 92 | 14.0% |
| 45 to 54 Years | 74 | 11.3% |
| 55 to 64 Years | 170 | 25.9% |
| 65 to 74 Years | 74 | 11.3% |
| 75 to 84 Years | 14 | 2.1% |
| 85 Years and Over | 13 | 2.0% |
| Total | 657 | 100.0% |
Housing Finances in Noel
Median Income by Occupancy in Noel
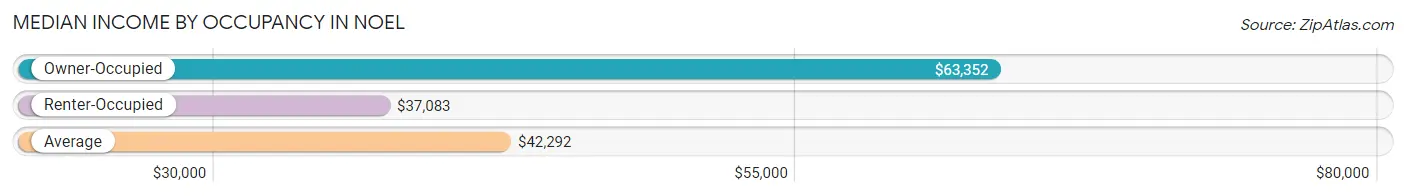
| Occupancy Type | # Households | Median Income |
| Owner-Occupied | 231 (35.2%) | $63,352 |
| Renter-Occupied | 426 (64.8%) | $37,083 |
| Average | 657 (100.0%) | $42,292 |
Occupancy by Householder Income Bracket in Noel
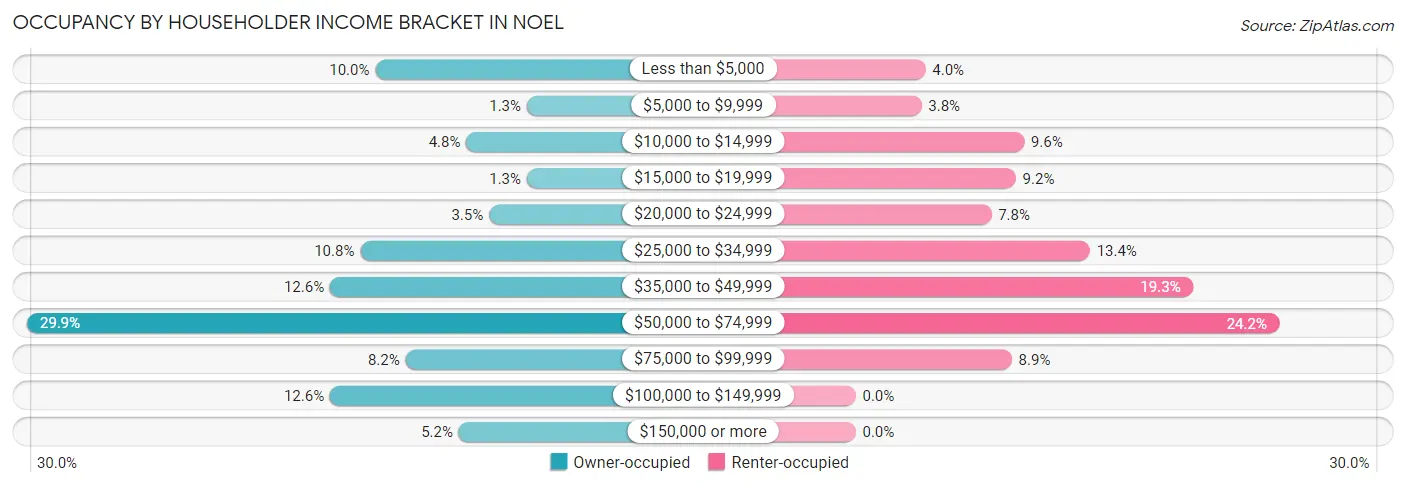
| Income Bracket | Owner-occupied | Renter-occupied |
| Less than $5,000 | 23 (10.0%) | 17 (4.0%) |
| $5,000 to $9,999 | 3 (1.3%) | 16 (3.8%) |
| $10,000 to $14,999 | 11 (4.8%) | 41 (9.6%) |
| $15,000 to $19,999 | 3 (1.3%) | 39 (9.1%) |
| $20,000 to $24,999 | 8 (3.5%) | 33 (7.7%) |
| $25,000 to $34,999 | 25 (10.8%) | 57 (13.4%) |
| $35,000 to $49,999 | 29 (12.6%) | 82 (19.3%) |
| $50,000 to $74,999 | 69 (29.9%) | 103 (24.2%) |
| $75,000 to $99,999 | 19 (8.2%) | 38 (8.9%) |
| $100,000 to $149,999 | 29 (12.6%) | 0 (0.0%) |
| $150,000 or more | 12 (5.2%) | 0 (0.0%) |
| Total | 231 (100.0%) | 426 (100.0%) |
Monthly Housing Cost Tiers in Noel
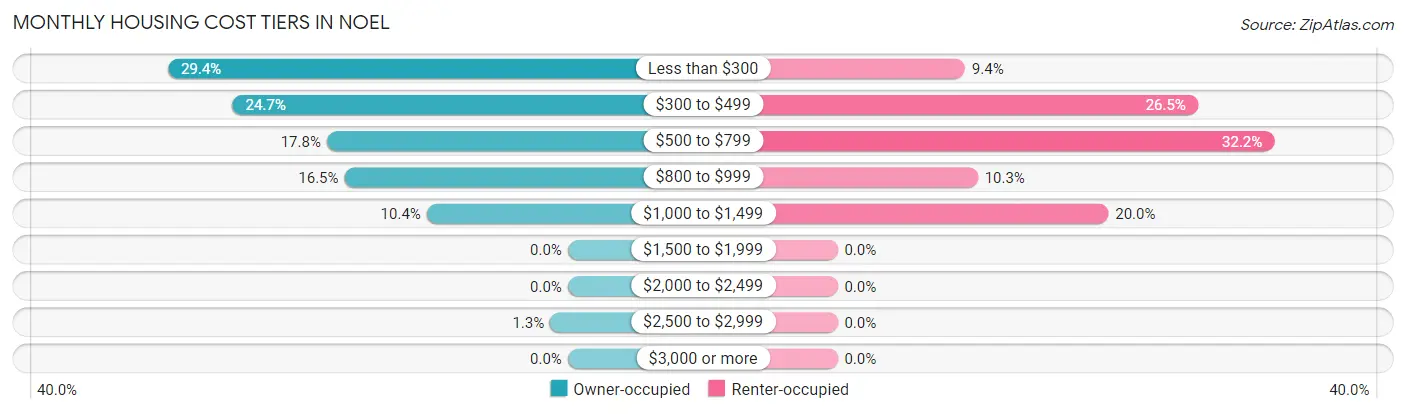
| Monthly Cost | Owner-occupied | Renter-occupied |
| Less than $300 | 68 (29.4%) | 40 (9.4%) |
| $300 to $499 | 57 (24.7%) | 113 (26.5%) |
| $500 to $799 | 41 (17.7%) | 137 (32.2%) |
| $800 to $999 | 38 (16.5%) | 44 (10.3%) |
| $1,000 to $1,499 | 24 (10.4%) | 85 (20.0%) |
| $1,500 to $1,999 | 0 (0.0%) | 0 (0.0%) |
| $2,000 to $2,499 | 0 (0.0%) | 0 (0.0%) |
| $2,500 to $2,999 | 3 (1.3%) | 0 (0.0%) |
| $3,000 or more | 0 (0.0%) | 0 (0.0%) |
| Total | 231 (100.0%) | 426 (100.0%) |
Physical Housing Characteristics in Noel
Housing Structures in Noel
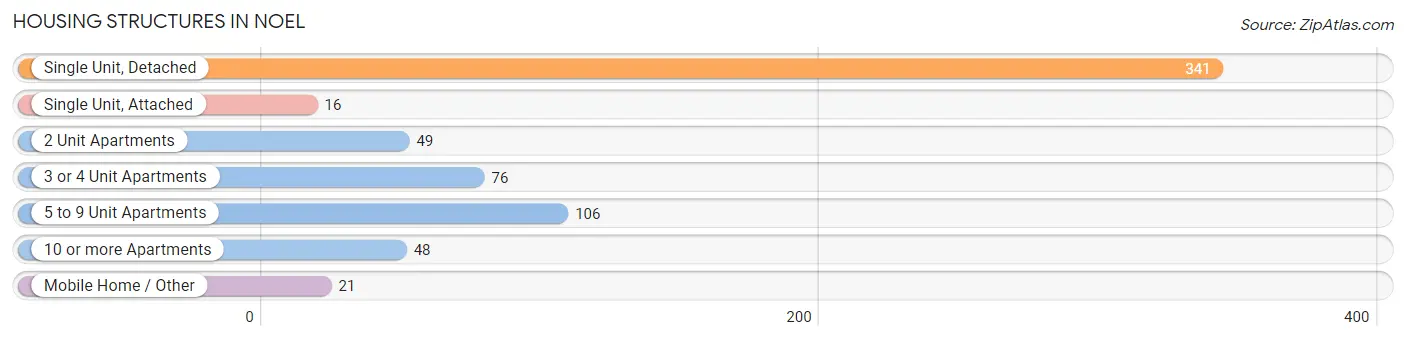
| Structure Type | # Housing Units | % Housing Units |
| Single Unit, Detached | 341 | 51.9% |
| Single Unit, Attached | 16 | 2.4% |
| 2 Unit Apartments | 49 | 7.5% |
| 3 or 4 Unit Apartments | 76 | 11.6% |
| 5 to 9 Unit Apartments | 106 | 16.1% |
| 10 or more Apartments | 48 | 7.3% |
| Mobile Home / Other | 21 | 3.2% |
| Total | 657 | 100.0% |
Housing Structures by Occupancy in Noel
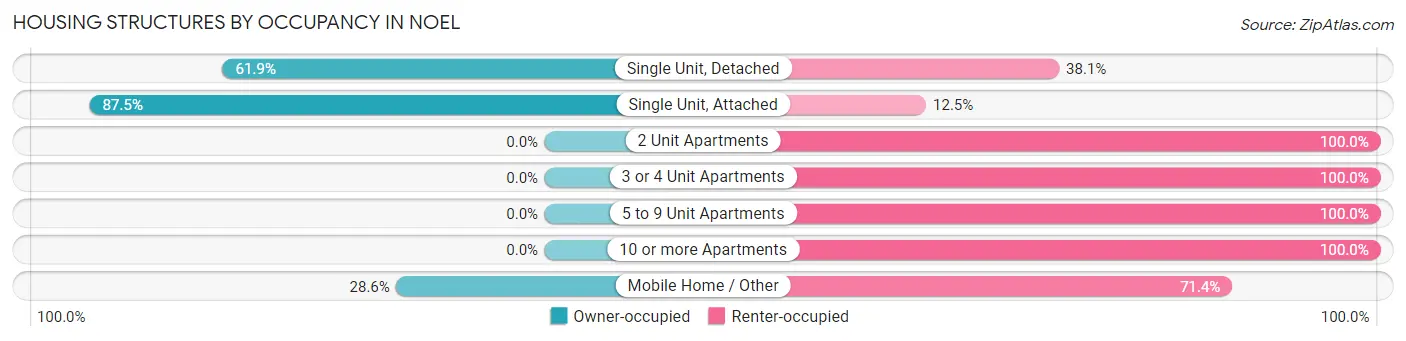
| Structure Type | Owner-occupied | Renter-occupied |
| Single Unit, Detached | 211 (61.9%) | 130 (38.1%) |
| Single Unit, Attached | 14 (87.5%) | 2 (12.5%) |
| 2 Unit Apartments | 0 (0.0%) | 49 (100.0%) |
| 3 or 4 Unit Apartments | 0 (0.0%) | 76 (100.0%) |
| 5 to 9 Unit Apartments | 0 (0.0%) | 106 (100.0%) |
| 10 or more Apartments | 0 (0.0%) | 48 (100.0%) |
| Mobile Home / Other | 6 (28.6%) | 15 (71.4%) |
| Total | 231 (35.2%) | 426 (64.8%) |
Housing Structures by Number of Rooms in Noel
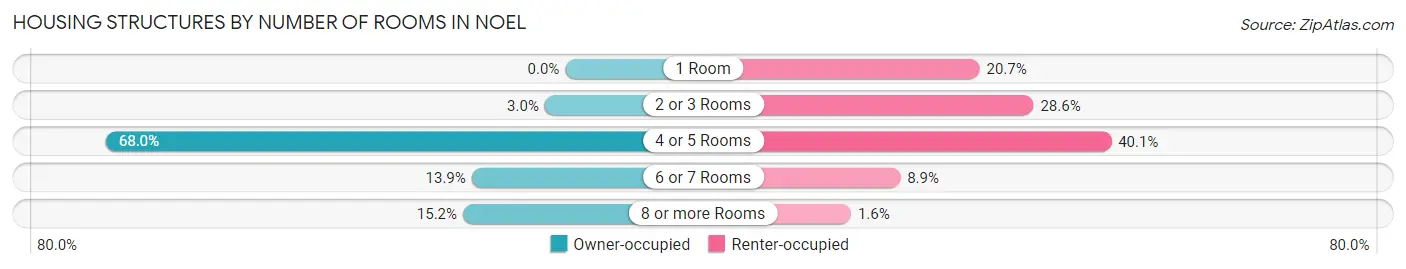
| Number of Rooms | Owner-occupied | Renter-occupied |
| 1 Room | 0 (0.0%) | 88 (20.7%) |
| 2 or 3 Rooms | 7 (3.0%) | 122 (28.6%) |
| 4 or 5 Rooms | 157 (68.0%) | 171 (40.1%) |
| 6 or 7 Rooms | 32 (13.9%) | 38 (8.9%) |
| 8 or more Rooms | 35 (15.1%) | 7 (1.6%) |
| Total | 231 (100.0%) | 426 (100.0%) |
Housing Structure by Heating Type in Noel
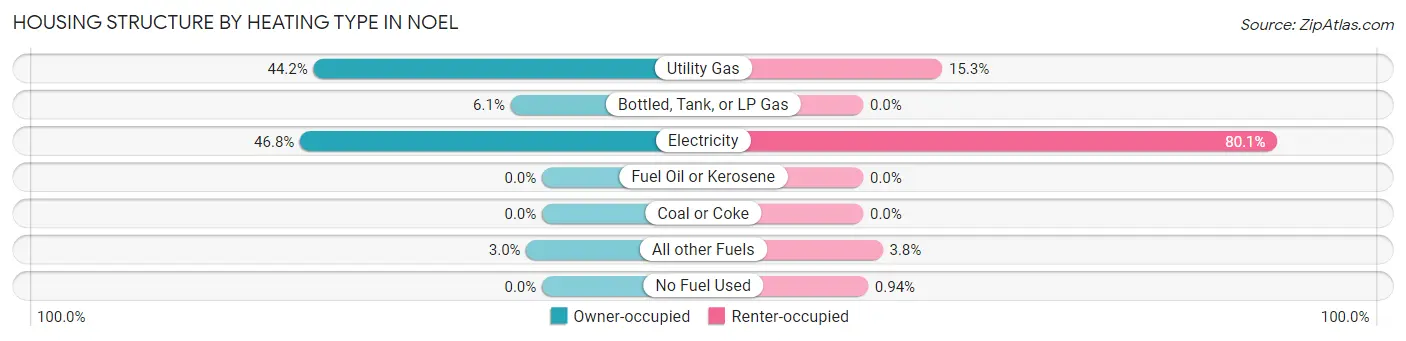
| Heating Type | Owner-occupied | Renter-occupied |
| Utility Gas | 102 (44.2%) | 65 (15.3%) |
| Bottled, Tank, or LP Gas | 14 (6.1%) | 0 (0.0%) |
| Electricity | 108 (46.8%) | 341 (80.0%) |
| Fuel Oil or Kerosene | 0 (0.0%) | 0 (0.0%) |
| Coal or Coke | 0 (0.0%) | 0 (0.0%) |
| All other Fuels | 7 (3.0%) | 16 (3.8%) |
| No Fuel Used | 0 (0.0%) | 4 (0.9%) |
| Total | 231 (100.0%) | 426 (100.0%) |
Household Vehicle Usage in Noel
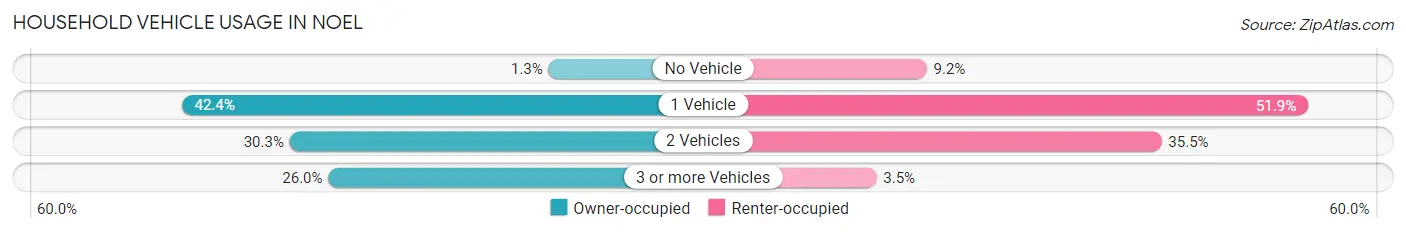
| Vehicles per Household | Owner-occupied | Renter-occupied |
| No Vehicle | 3 (1.3%) | 39 (9.1%) |
| 1 Vehicle | 98 (42.4%) | 221 (51.9%) |
| 2 Vehicles | 70 (30.3%) | 151 (35.4%) |
| 3 or more Vehicles | 60 (26.0%) | 15 (3.5%) |
| Total | 231 (100.0%) | 426 (100.0%) |
Real Estate & Mortgages in Noel
Real Estate and Mortgage Overview in Noel
| Characteristic | Without Mortgage | With Mortgage |
| Housing Units | 139 | 92 |
| Median Property Value | $93,700 | $87,900 |
| Median Household Income | $58,750 | $0 |
| Monthly Housing Costs | $303 | $0 |
| Real Estate Taxes | $496 | $0 |
Property Value by Mortgage Status in Noel
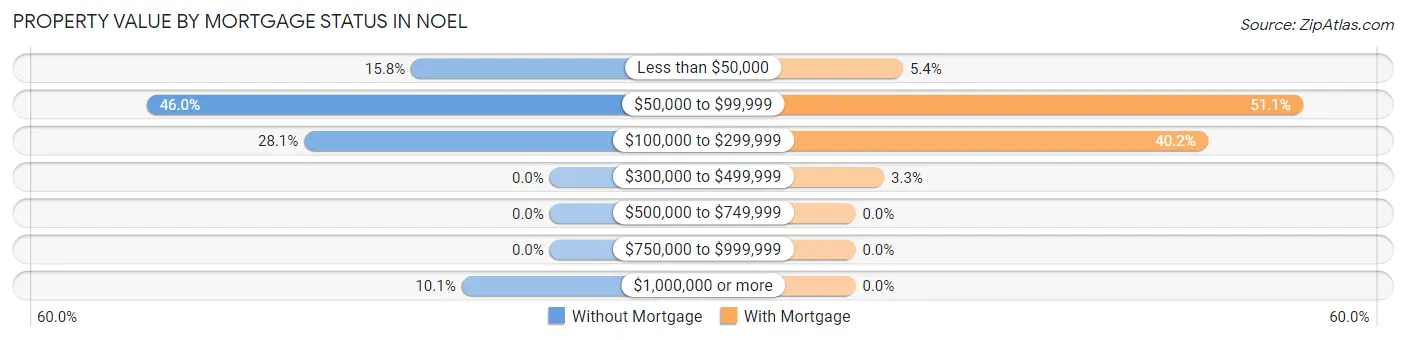
| Property Value | Without Mortgage | With Mortgage |
| Less than $50,000 | 22 (15.8%) | 5 (5.4%) |
| $50,000 to $99,999 | 64 (46.0%) | 47 (51.1%) |
| $100,000 to $299,999 | 39 (28.1%) | 37 (40.2%) |
| $300,000 to $499,999 | 0 (0.0%) | 3 (3.3%) |
| $500,000 to $749,999 | 0 (0.0%) | 0 (0.0%) |
| $750,000 to $999,999 | 0 (0.0%) | 0 (0.0%) |
| $1,000,000 or more | 14 (10.1%) | 0 (0.0%) |
| Total | 139 (100.0%) | 92 (100.0%) |
Household Income by Mortgage Status in Noel
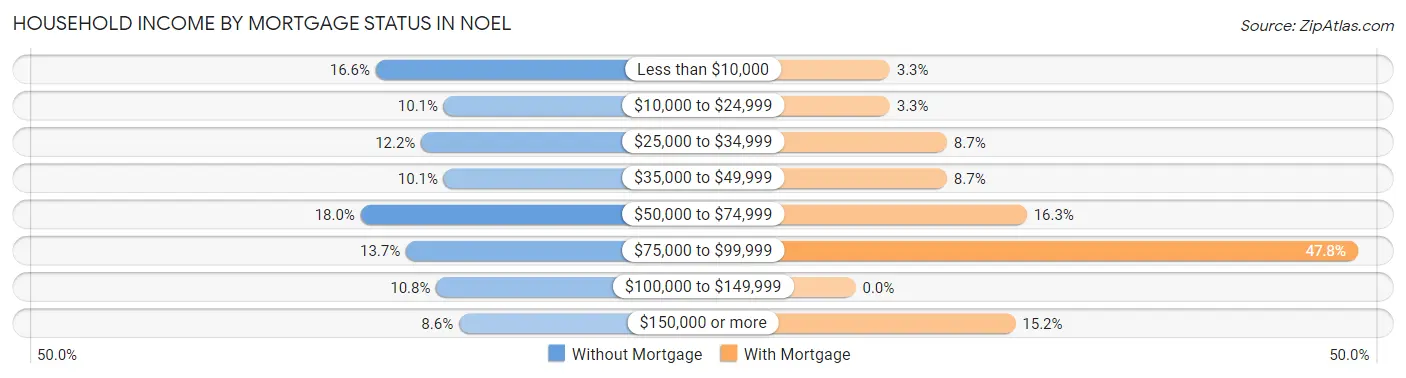
| Household Income | Without Mortgage | With Mortgage |
| Less than $10,000 | 23 (16.6%) | 3 (3.3%) |
| $10,000 to $24,999 | 14 (10.1%) | 3 (3.3%) |
| $25,000 to $34,999 | 17 (12.2%) | 8 (8.7%) |
| $35,000 to $49,999 | 14 (10.1%) | 8 (8.7%) |
| $50,000 to $74,999 | 25 (18.0%) | 15 (16.3%) |
| $75,000 to $99,999 | 19 (13.7%) | 44 (47.8%) |
| $100,000 to $149,999 | 15 (10.8%) | 0 (0.0%) |
| $150,000 or more | 12 (8.6%) | 14 (15.2%) |
| Total | 139 (100.0%) | 92 (100.0%) |
Property Value to Household Income Ratio in Noel
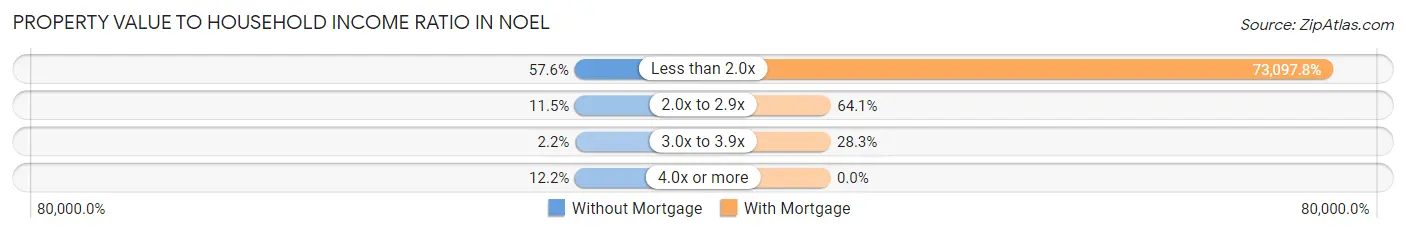
| Value-to-Income Ratio | Without Mortgage | With Mortgage |
| Less than 2.0x | 80 (57.6%) | 67,250 (73,097.8%) |
| 2.0x to 2.9x | 16 (11.5%) | 59 (64.1%) |
| 3.0x to 3.9x | 3 (2.2%) | 26 (28.3%) |
| 4.0x or more | 17 (12.2%) | 0 (0.0%) |
| Total | 139 (100.0%) | 92 (100.0%) |
Real Estate Taxes by Mortgage Status in Noel
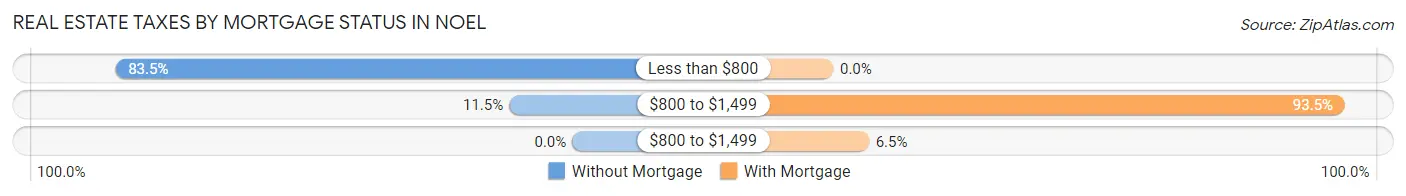
| Property Taxes | Without Mortgage | With Mortgage |
| Less than $800 | 116 (83.5%) | 0 (0.0%) |
| $800 to $1,499 | 16 (11.5%) | 86 (93.5%) |
| $800 to $1,499 | 0 (0.0%) | 6 (6.5%) |
| Total | 139 (100.0%) | 92 (100.0%) |
Health & Disability in Noel
Health Insurance Coverage by Age in Noel
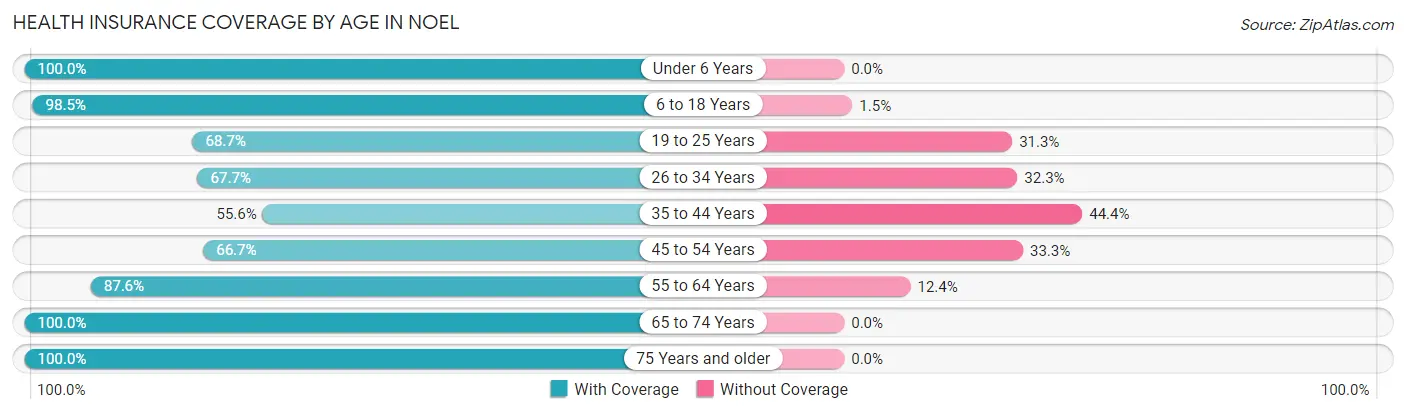
| Age Bracket | With Coverage | Without Coverage |
| Under 6 Years | 156 (100.0%) | 0 (0.0%) |
| 6 to 18 Years | 458 (98.5%) | 7 (1.5%) |
| 19 to 25 Years | 204 (68.7%) | 93 (31.3%) |
| 26 to 34 Years | 214 (67.7%) | 102 (32.3%) |
| 35 to 44 Years | 89 (55.6%) | 71 (44.4%) |
| 45 to 54 Years | 86 (66.7%) | 43 (33.3%) |
| 55 to 64 Years | 234 (87.6%) | 33 (12.4%) |
| 65 to 74 Years | 100 (100.0%) | 0 (0.0%) |
| 75 Years and older | 40 (100.0%) | 0 (0.0%) |
| Total | 1,581 (81.9%) | 349 (18.1%) |
Health Insurance Coverage by Citizenship Status in Noel
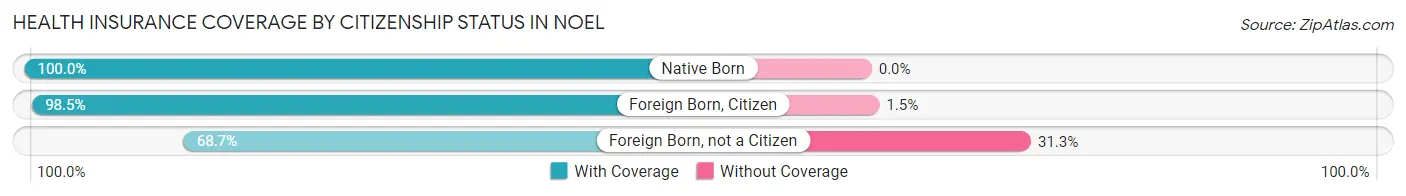
| Citizenship Status | With Coverage | Without Coverage |
| Native Born | 156 (100.0%) | 0 (0.0%) |
| Foreign Born, Citizen | 458 (98.5%) | 7 (1.5%) |
| Foreign Born, not a Citizen | 204 (68.7%) | 93 (31.3%) |
Health Insurance Coverage by Household Income in Noel
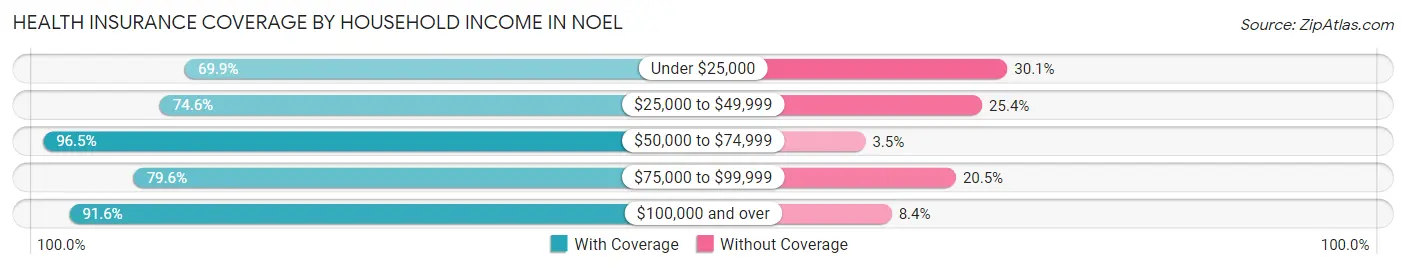
| Household Income | With Coverage | Without Coverage |
| Under $25,000 | 258 (69.9%) | 111 (30.1%) |
| $25,000 to $49,999 | 409 (74.6%) | 139 (25.4%) |
| $50,000 to $74,999 | 469 (96.5%) | 17 (3.5%) |
| $75,000 to $99,999 | 249 (79.5%) | 64 (20.4%) |
| $100,000 and over | 196 (91.6%) | 18 (8.4%) |
Public vs Private Health Insurance Coverage by Age in Noel
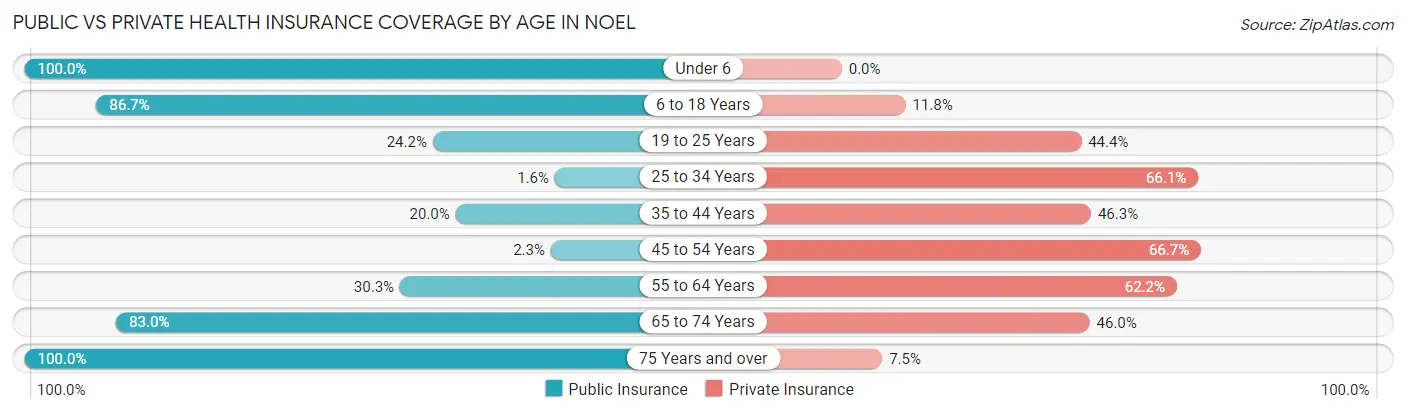
| Age Bracket | Public Insurance | Private Insurance |
| Under 6 | 156 (100.0%) | 0 (0.0%) |
| 6 to 18 Years | 403 (86.7%) | 55 (11.8%) |
| 19 to 25 Years | 72 (24.2%) | 132 (44.4%) |
| 25 to 34 Years | 5 (1.6%) | 209 (66.1%) |
| 35 to 44 Years | 32 (20.0%) | 74 (46.3%) |
| 45 to 54 Years | 3 (2.3%) | 86 (66.7%) |
| 55 to 64 Years | 81 (30.3%) | 166 (62.2%) |
| 65 to 74 Years | 83 (83.0%) | 46 (46.0%) |
| 75 Years and over | 40 (100.0%) | 3 (7.5%) |
| Total | 875 (45.3%) | 771 (40.0%) |
Disability Status by Sex by Age in Noel
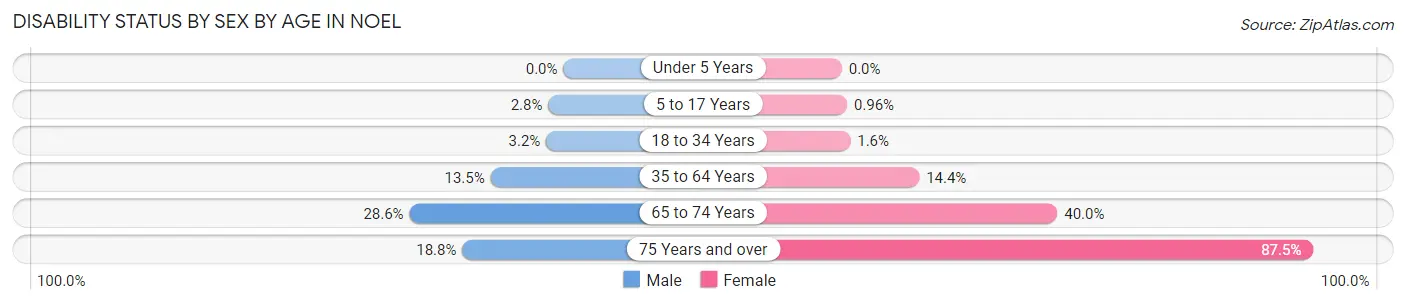
| Age Bracket | Male | Female |
| Under 5 Years | 0 (0.0%) | 0 (0.0%) |
| 5 to 17 Years | 6 (2.8%) | 2 (1.0%) |
| 18 to 34 Years | 12 (3.2%) | 5 (1.6%) |
| 35 to 64 Years | 30 (13.5%) | 48 (14.4%) |
| 65 to 74 Years | 10 (28.6%) | 26 (40.0%) |
| 75 Years and over | 3 (18.8%) | 21 (87.5%) |
Disability Class by Sex by Age in Noel
Disability Class: Hearing Difficulty
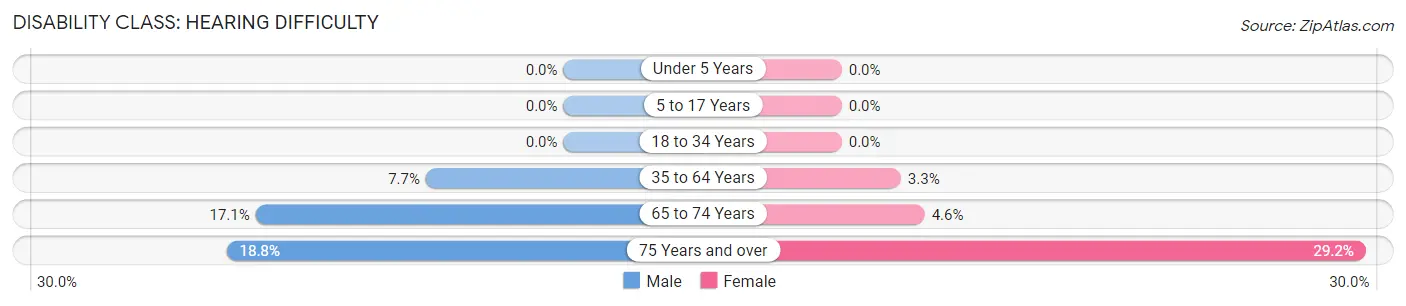
| Age Bracket | Male | Female |
| Under 5 Years | 0 (0.0%) | 0 (0.0%) |
| 5 to 17 Years | 0 (0.0%) | 0 (0.0%) |
| 18 to 34 Years | 0 (0.0%) | 0 (0.0%) |
| 35 to 64 Years | 17 (7.7%) | 11 (3.3%) |
| 65 to 74 Years | 6 (17.1%) | 3 (4.6%) |
| 75 Years and over | 3 (18.8%) | 7 (29.2%) |
Disability Class: Vision Difficulty
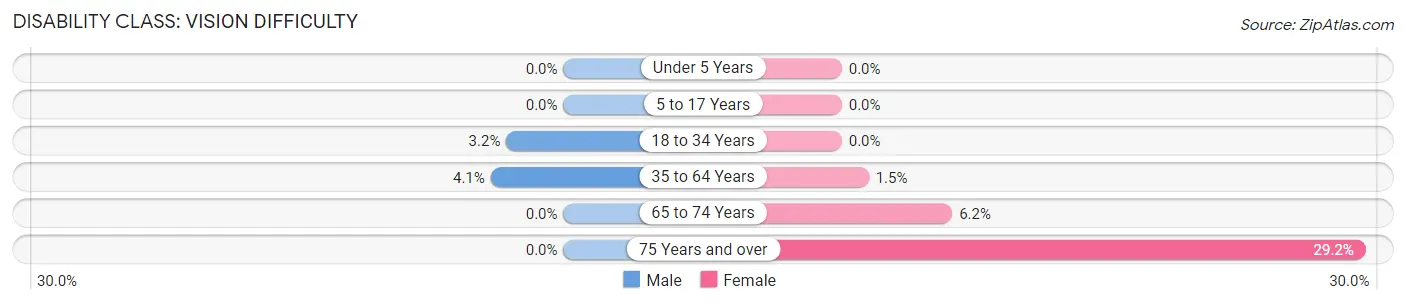
| Age Bracket | Male | Female |
| Under 5 Years | 0 (0.0%) | 0 (0.0%) |
| 5 to 17 Years | 0 (0.0%) | 0 (0.0%) |
| 18 to 34 Years | 12 (3.2%) | 0 (0.0%) |
| 35 to 64 Years | 9 (4.1%) | 5 (1.5%) |
| 65 to 74 Years | 0 (0.0%) | 4 (6.1%) |
| 75 Years and over | 0 (0.0%) | 7 (29.2%) |
Disability Class: Cognitive Difficulty
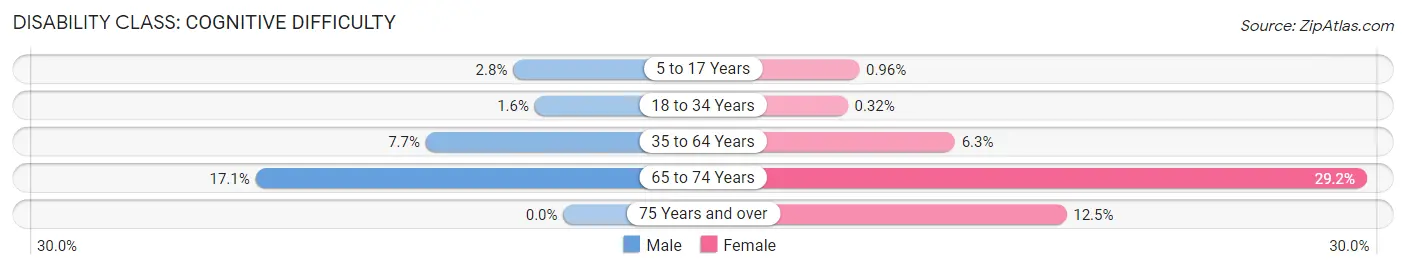
| Age Bracket | Male | Female |
| 5 to 17 Years | 6 (2.8%) | 2 (1.0%) |
| 18 to 34 Years | 6 (1.6%) | 1 (0.3%) |
| 35 to 64 Years | 17 (7.7%) | 21 (6.3%) |
| 65 to 74 Years | 6 (17.1%) | 19 (29.2%) |
| 75 Years and over | 0 (0.0%) | 3 (12.5%) |
Disability Class: Ambulatory Difficulty
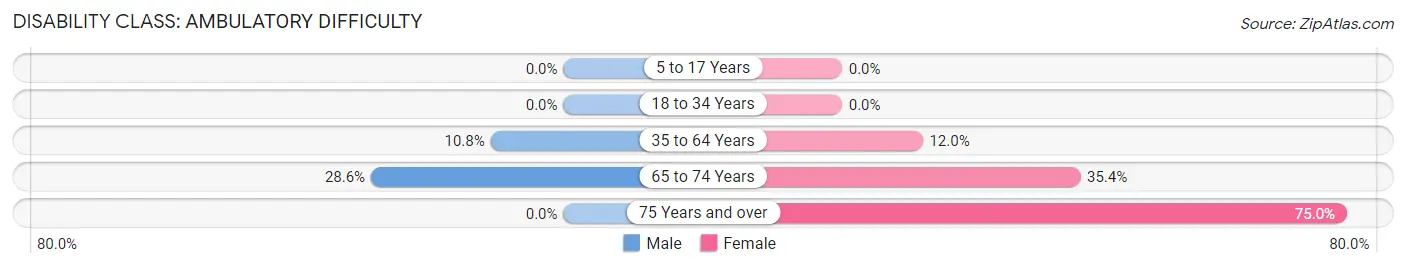
| Age Bracket | Male | Female |
| 5 to 17 Years | 0 (0.0%) | 0 (0.0%) |
| 18 to 34 Years | 0 (0.0%) | 0 (0.0%) |
| 35 to 64 Years | 24 (10.8%) | 40 (12.0%) |
| 65 to 74 Years | 10 (28.6%) | 23 (35.4%) |
| 75 Years and over | 0 (0.0%) | 18 (75.0%) |
Disability Class: Self-Care Difficulty
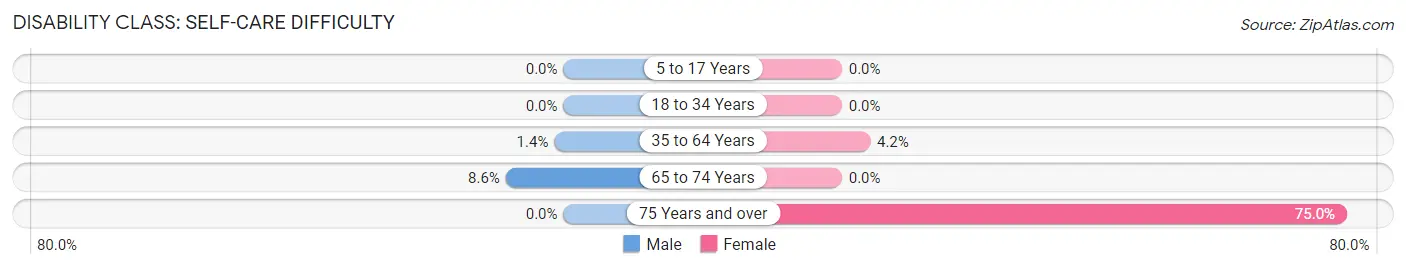
| Age Bracket | Male | Female |
| 5 to 17 Years | 0 (0.0%) | 0 (0.0%) |
| 18 to 34 Years | 0 (0.0%) | 0 (0.0%) |
| 35 to 64 Years | 3 (1.3%) | 14 (4.2%) |
| 65 to 74 Years | 3 (8.6%) | 0 (0.0%) |
| 75 Years and over | 0 (0.0%) | 18 (75.0%) |
Technology Access in Noel
Computing Device Access in Noel
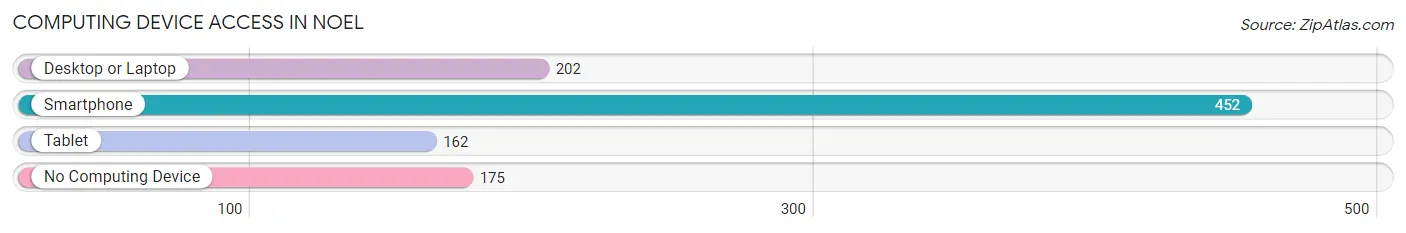
| Device Type | # Households | % Households |
| Desktop or Laptop | 202 | 30.7% |
| Smartphone | 452 | 68.8% |
| Tablet | 162 | 24.7% |
| No Computing Device | 175 | 26.6% |
| Total | 657 | 100.0% |
Internet Access in Noel
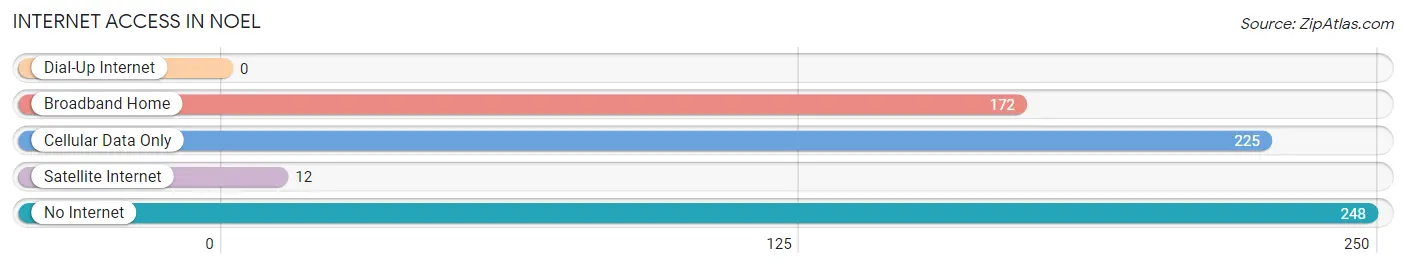
| Internet Type | # Households | % Households |
| Dial-Up Internet | 0 | 0.0% |
| Broadband Home | 172 | 26.2% |
| Cellular Data Only | 225 | 34.3% |
| Satellite Internet | 12 | 1.8% |
| No Internet | 248 | 37.8% |
| Total | 657 | 100.0% |
Noel Summary
Noel, Missouri is a small town located in McDonald County, in the southwestern corner of the state. It is situated on the banks of the Elk River, and is surrounded by rolling hills and wooded areas. The town was founded in 1883, and has a population of approximately 2,000 people.
Geography
Noel is located in the Ozark Mountains, and is situated on the banks of the Elk River. The town is surrounded by rolling hills and wooded areas, and is located in a rural area. The town is located approximately 30 miles from the Arkansas border, and is about an hour and a half drive from the larger cities of Springfield and Joplin.
The climate in Noel is temperate, with hot summers and mild winters. The average temperature in the summer is around 80 degrees Fahrenheit, and the average temperature in the winter is around 40 degrees Fahrenheit. The town receives an average of 40 inches of rain per year, and the average snowfall is around 10 inches.
Economy
Noel’s economy is largely based on agriculture and tourism. The town is home to several farms, and the surrounding area is known for its production of beef, poultry, and dairy products. The town is also home to several small businesses, including restaurants, retail stores, and service providers.
Tourism is an important part of the local economy, as the town is located near several popular attractions. The Elk River is a popular destination for fishing, boating, and swimming, and the nearby Mark Twain National Forest offers camping, hiking, and other outdoor activities. The town is also home to several historic sites, including the Noel Historic District, which is listed on the National Register of Historic Places.
Demographics
As of the 2010 census, the population of Noel was 2,039. The racial makeup of the town was 95.3% White, 0.7% African American, 0.3% Native American, 0.2% Asian, 0.1% Pacific Islander, and 3.4% from other races. The median household income was $30,938, and the median family income was $37,917.
Noel is a small, rural town with a close-knit community. The town is home to several churches, and the local school district serves the area. The town is also home to several parks and recreational facilities, including a public swimming pool, a golf course, and a skate park.
Noel is a small town with a rich history and a strong sense of community. The town is home to several farms and businesses, and the surrounding area offers a variety of outdoor activities. The town is also home to several historic sites, and the local school district serves the area. The town is a great place to live, work, and raise a family.
Common Questions
What is Per Capita Income in Noel?
Per Capita income in Noel is $17,110.
What is the Median Family Income in Noel?
Median Family Income in Noel is $63,218.
What is the Median Household income in Noel?
Median Household Income in Noel is $42,292.
What is Income or Wage Gap in Noel?
Income or Wage Gap in Noel is 3.1%.
Women in Noel earn 96.9 cents for every dollar earned by a man.
What is Inequality or Gini Index in Noel?
Inequality or Gini Index in Noel is 0.38.
What is the Total Population of Noel?
Total Population of Noel is 1,930.
What is the Total Male Population of Noel?
Total Male Population of Noel is 909.
What is the Total Female Population of Noel?
Total Female Population of Noel is 1,021.
What is the Ratio of Males per 100 Females in Noel?
There are 89.03 Males per 100 Females in Noel.
What is the Ratio of Females per 100 Males in Noel?
There are 112.32 Females per 100 Males in Noel.
What is the Median Population Age in Noel?
Median Population Age in Noel is 29.3 Years.
What is the Average Family Size in Noel
Average Family Size in Noel is 3.9 People.
What is the Average Household Size in Noel
Average Household Size in Noel is 2.9 People.
How Large is the Labor Force in Noel?
There are 872 People in the Labor Forcein in Noel.
What is the Percentage of People in the Labor Force in Noel?
61.3% of People are in the Labor Force in Noel.
What is the Unemployment Rate in Noel?
Unemployment Rate in Noel is 6.6%.