Mankato, MN Map & Demographics
Mankato Map
Mankato Overview
$31,757
PER CAPITA INCOME
$85,047
AVG FAMILY INCOME
$61,726
AVG HOUSEHOLD INCOME
33.5%
WAGE / INCOME GAP [ % ]
66.5¢/ $1
WAGE / INCOME GAP [ $ ]
$7,513
FAMILY INCOME DEFICIT
0.45
INEQUALITY / GINI INDEX
44,444
TOTAL POPULATION
22,388
MALE POPULATION
22,056
FEMALE POPULATION
101.51
MALES / 100 FEMALES
98.52
FEMALES / 100 MALES
26.5
MEDIAN AGE
2.9
AVG FAMILY SIZE
2.3
AVG HOUSEHOLD SIZE
26,894
LABOR FORCE [ PEOPLE ]
71.2%
PERCENT IN LABOR FORCE
4.2%
UNEMPLOYMENT RATE
Mankato Area Codes
Income in Mankato
Income Overview in Mankato
Per Capita Income in Mankato is $31,757, while median incomes of families and households are $85,047 and $61,726 respectively.
| Characteristic | Number | Measure |
| Per Capita Income | 44,444 | $31,757 |
| Median Family Income | 8,493 | $85,047 |
| Mean Family Income | 8,493 | $102,405 |
| Median Household Income | 17,605 | $61,726 |
| Mean Household Income | 17,605 | $78,779 |
| Income Deficit | 8,493 | $7,513 |
| Wage / Income Gap (%) | 44,444 | 33.52% |
| Wage / Income Gap ($) | 44,444 | 66.48¢ per $1 |
| Gini / Inequality Index | 44,444 | 0.45 |
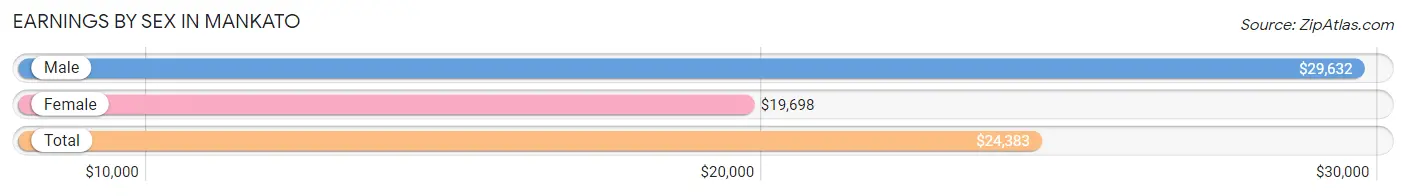
Earnings by Sex in Mankato
Average Earnings in Mankato are $24,383, $29,632 for men and $19,698 for women, a difference of 33.5%.
| Sex | Number | Average Earnings |
| Male | 14,944 (50.8%) | $29,632 |
| Female | 14,470 (49.2%) | $19,698 |
| Total | 29,414 (100.0%) | $24,383 |
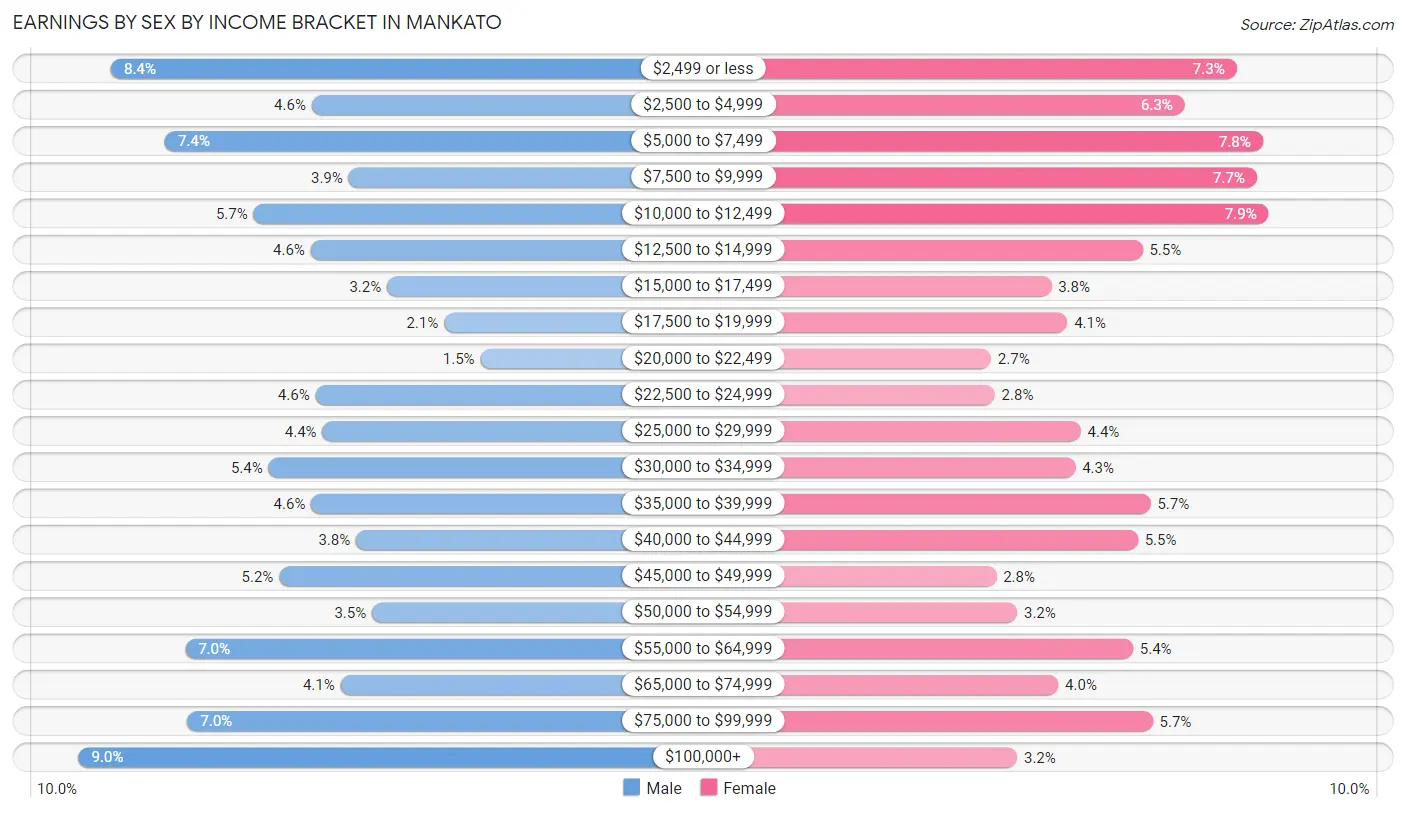
Earnings by Sex by Income Bracket in Mankato
The most common earnings brackets in Mankato are $100,000+ for men (1,343 | 9.0%) and $10,000 to $12,499 for women (1,143 | 7.9%).
| Income | Male | Female |
| $2,499 or less | 1,252 (8.4%) | 1,057 (7.3%) |
| $2,500 to $4,999 | 690 (4.6%) | 916 (6.3%) |
| $5,000 to $7,499 | 1,102 (7.4%) | 1,127 (7.8%) |
| $7,500 to $9,999 | 587 (3.9%) | 1,112 (7.7%) |
| $10,000 to $12,499 | 853 (5.7%) | 1,143 (7.9%) |
| $12,500 to $14,999 | 694 (4.6%) | 801 (5.5%) |
| $15,000 to $17,499 | 480 (3.2%) | 554 (3.8%) |
| $17,500 to $19,999 | 320 (2.1%) | 597 (4.1%) |
| $20,000 to $22,499 | 218 (1.5%) | 390 (2.7%) |
| $22,500 to $24,999 | 680 (4.5%) | 401 (2.8%) |
| $25,000 to $29,999 | 661 (4.4%) | 634 (4.4%) |
| $30,000 to $34,999 | 811 (5.4%) | 619 (4.3%) |
| $35,000 to $39,999 | 692 (4.6%) | 824 (5.7%) |
| $40,000 to $44,999 | 567 (3.8%) | 789 (5.4%) |
| $45,000 to $49,999 | 781 (5.2%) | 405 (2.8%) |
| $50,000 to $54,999 | 521 (3.5%) | 461 (3.2%) |
| $55,000 to $64,999 | 1,044 (7.0%) | 776 (5.4%) |
| $65,000 to $74,999 | 609 (4.1%) | 573 (4.0%) |
| $75,000 to $99,999 | 1,039 (7.0%) | 829 (5.7%) |
| $100,000+ | 1,343 (9.0%) | 462 (3.2%) |
| Total | 14,944 (100.0%) | 14,470 (100.0%) |
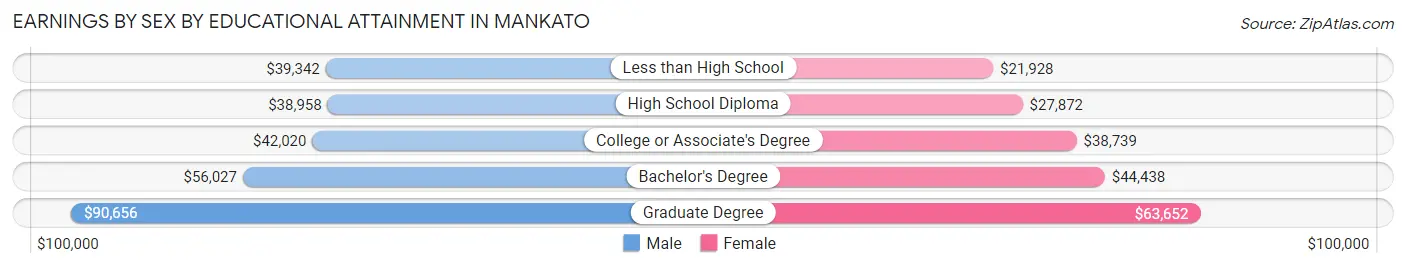
Earnings by Sex by Educational Attainment in Mankato
Average earnings in Mankato are $46,908 for men and $40,872 for women, a difference of 12.9%. Men with an educational attainment of graduate degree enjoy the highest average annual earnings of $90,656, while those with high school diploma education earn the least with $38,958. Women with an educational attainment of graduate degree earn the most with the average annual earnings of $63,652, while those with less than high school education have the smallest earnings of $21,928.
| Educational Attainment | Male Income | Female Income |
| Less than High School | $39,342 | $21,928 |
| High School Diploma | $38,958 | $27,872 |
| College or Associate's Degree | $42,020 | $38,739 |
| Bachelor's Degree | $56,027 | $44,438 |
| Graduate Degree | $90,656 | $63,652 |
| Total | $46,908 | $40,872 |
Family Income in Mankato
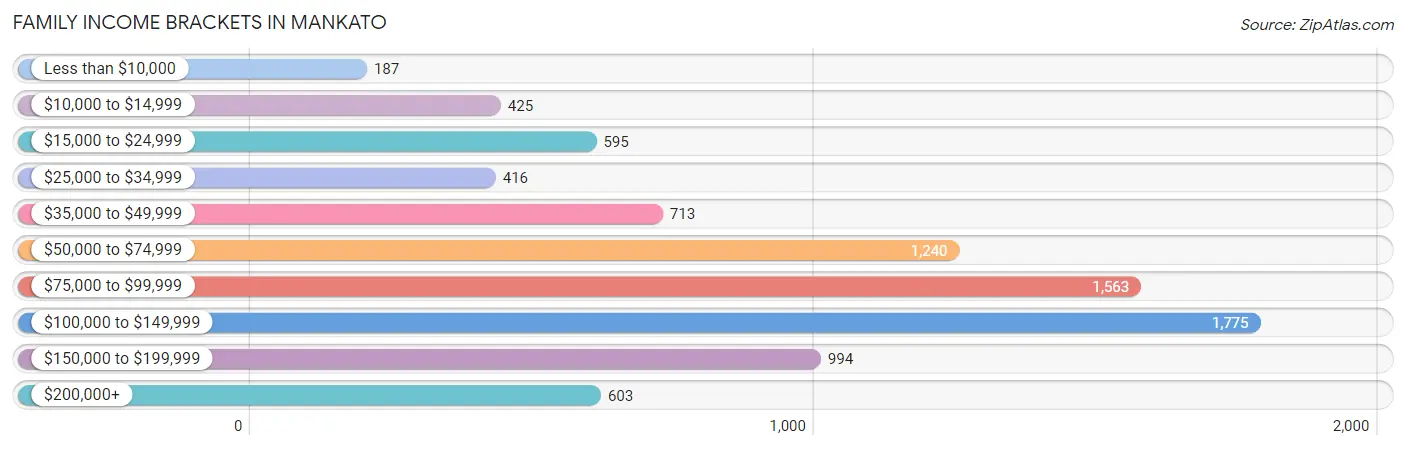
Family Income Brackets in Mankato
According to the Mankato family income data, there are 1,775 families falling into the $100,000 to $149,999 income range, which is the most common income bracket and makes up 20.9% of all families. Conversely, the less than $10,000 income bracket is the least frequent group with only 187 families (2.2%) belonging to this category.
| Income Bracket | # Families | % Families |
| Less than $10,000 | 187 | 2.2% |
| $10,000 to $14,999 | 425 | 5.0% |
| $15,000 to $24,999 | 595 | 7.0% |
| $25,000 to $34,999 | 416 | 4.9% |
| $35,000 to $49,999 | 713 | 8.4% |
| $50,000 to $74,999 | 1,240 | 14.6% |
| $75,000 to $99,999 | 1,563 | 18.4% |
| $100,000 to $149,999 | 1,775 | 20.9% |
| $150,000 to $199,999 | 994 | 11.7% |
| $200,000+ | 603 | 7.1% |
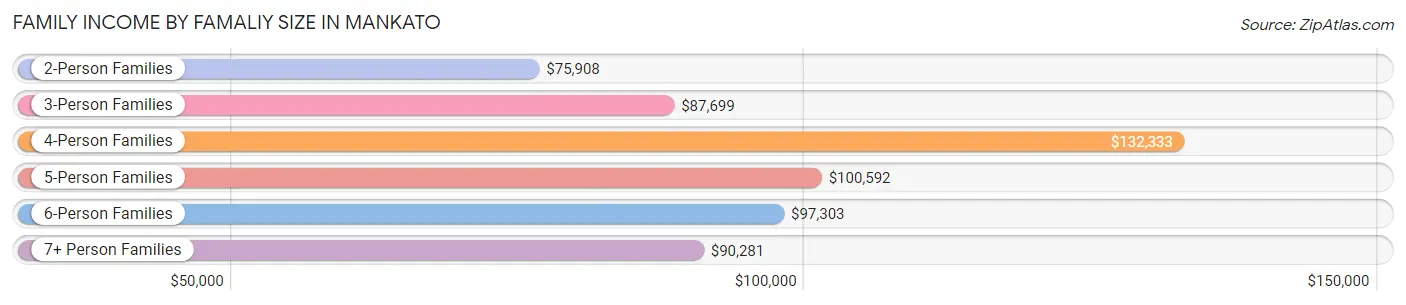
Family Income by Famaliy Size in Mankato
4-person families (1,322 | 15.6%) account for the highest median family income in Mankato with $132,333 per family, while 2-person families (4,527 | 53.3%) have the highest median income of $37,954 per family member.
| Income Bracket | # Families | Median Income |
| 2-Person Families | 4,527 (53.3%) | $75,908 |
| 3-Person Families | 1,687 (19.9%) | $87,699 |
| 4-Person Families | 1,322 (15.6%) | $132,333 |
| 5-Person Families | 623 (7.3%) | $100,592 |
| 6-Person Families | 225 (2.6%) | $97,303 |
| 7+ Person Families | 109 (1.3%) | $90,281 |
| Total | 8,493 (100.0%) | $85,047 |
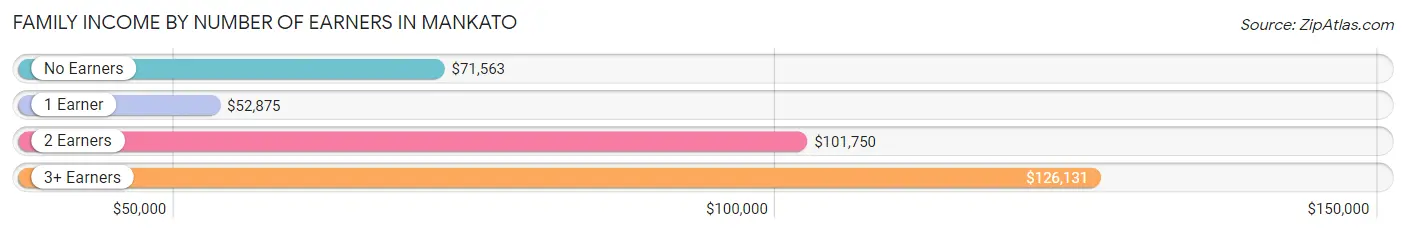
Family Income by Number of Earners in Mankato
The median family income in Mankato is $85,047, with families comprising 3+ earners (751) having the highest median family income of $126,131, while families with 1 earner (2,326) have the lowest median family income of $52,875, accounting for 8.8% and 27.4% of families, respectively.
| Number of Earners | # Families | Median Income |
| No Earners | 1,293 (15.2%) | $71,563 |
| 1 Earner | 2,326 (27.4%) | $52,875 |
| 2 Earners | 4,123 (48.5%) | $101,750 |
| 3+ Earners | 751 (8.8%) | $126,131 |
| Total | 8,493 (100.0%) | $85,047 |
Household Income in Mankato
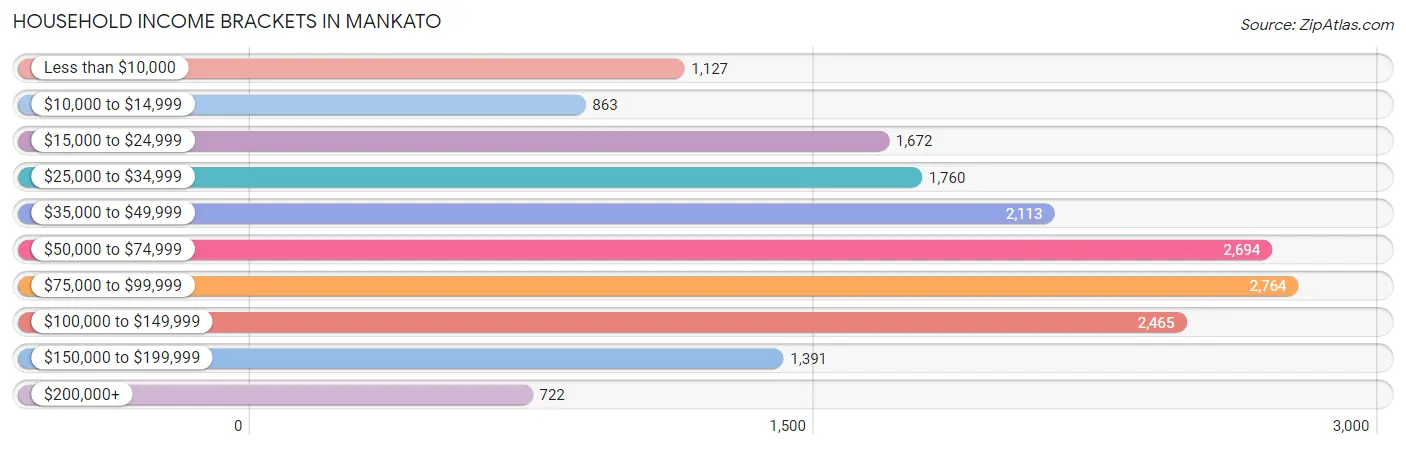
Household Income Brackets in Mankato
With 2,764 households falling in the category, the $75,000 to $99,999 income range is the most frequent in Mankato, accounting for 15.7% of all households. In contrast, only 722 households (4.1%) fall into the $200,000+ income bracket, making it the least populous group.
| Income Bracket | # Households | % Households |
| Less than $10,000 | 1,127 | 6.4% |
| $10,000 to $14,999 | 863 | 4.9% |
| $15,000 to $24,999 | 1,672 | 9.5% |
| $25,000 to $34,999 | 1,760 | 10.0% |
| $35,000 to $49,999 | 2,113 | 12.0% |
| $50,000 to $74,999 | 2,694 | 15.3% |
| $75,000 to $99,999 | 2,764 | 15.7% |
| $100,000 to $149,999 | 2,465 | 14.0% |
| $150,000 to $199,999 | 1,391 | 7.9% |
| $200,000+ | 722 | 4.1% |
Household Income by Householder Age in Mankato
The median household income in Mankato is $61,726, with the highest median household income of $78,154 found in the 25 to 44 years age bracket for the primary householder. A total of 6,027 households (34.2%) fall into this category. Meanwhile, the 15 to 24 years age bracket for the primary householder has the lowest median household income of $34,718, with 4,257 households (24.2%) in this group.
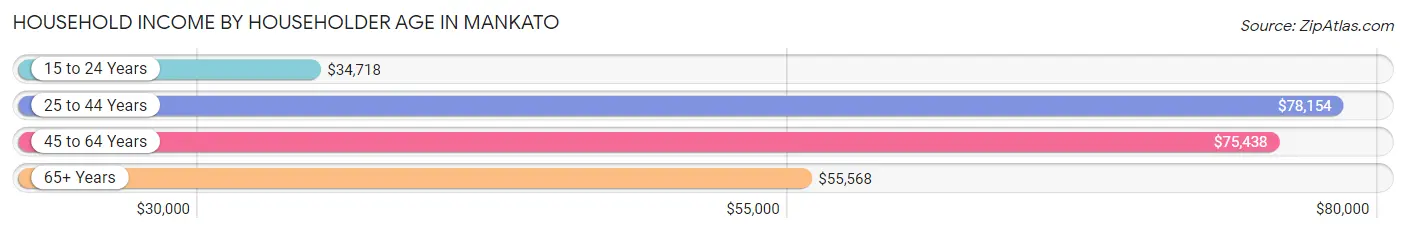
| Income Bracket | # Households | Median Income |
| 15 to 24 Years | 4,257 (24.2%) | $34,718 |
| 25 to 44 Years | 6,027 (34.2%) | $78,154 |
| 45 to 64 Years | 4,034 (22.9%) | $75,438 |
| 65+ Years | 3,287 (18.7%) | $55,568 |
| Total | 17,605 (100.0%) | $61,726 |
Poverty in Mankato
Income Below Poverty by Sex and Age in Mankato
With 20.9% poverty level for males and 24.0% for females among the residents of Mankato, 18 to 24 year old males and 18 to 24 year old females are the most vulnerable to poverty, with 2,515 males (48.2%) and 2,800 females (49.7%) in their respective age groups living below the poverty level.
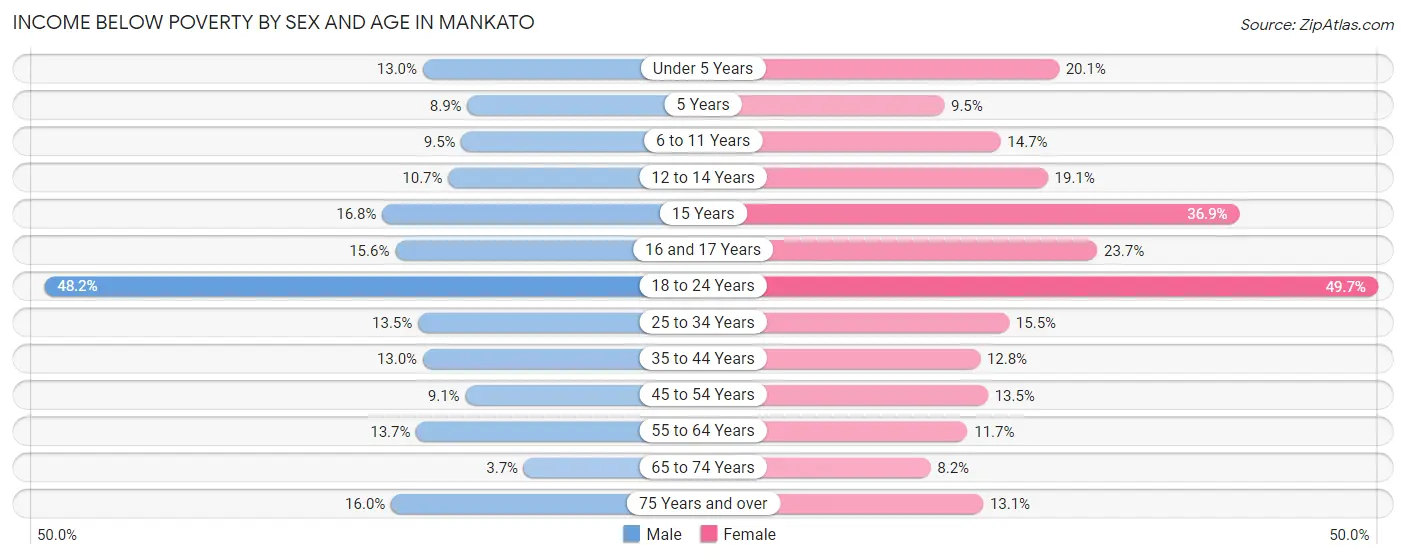
| Age Bracket | Male | Female |
| Under 5 Years | 146 (13.0%) | 218 (20.1%) |
| 5 Years | 25 (8.9%) | 13 (9.5%) |
| 6 to 11 Years | 107 (9.5%) | 161 (14.7%) |
| 12 to 14 Years | 75 (10.7%) | 106 (19.1%) |
| 15 Years | 41 (16.8%) | 69 (36.9%) |
| 16 and 17 Years | 85 (15.6%) | 68 (23.7%) |
| 18 to 24 Years | 2,515 (48.2%) | 2,800 (49.7%) |
| 25 to 34 Years | 481 (13.5%) | 449 (15.5%) |
| 35 to 44 Years | 320 (13.0%) | 272 (12.8%) |
| 45 to 54 Years | 148 (9.1%) | 223 (13.5%) |
| 55 to 64 Years | 229 (13.7%) | 218 (11.7%) |
| 65 to 74 Years | 50 (3.7%) | 123 (8.2%) |
| 75 Years and over | 151 (16.0%) | 190 (13.1%) |
| Total | 4,373 (20.9%) | 4,910 (24.0%) |
Income Above Poverty by Sex and Age in Mankato
According to the poverty statistics in Mankato, males aged 65 to 74 years and females aged 65 to 74 years are the age groups that are most secure financially, with 96.3% of males and 91.8% of females in these age groups living above the poverty line.
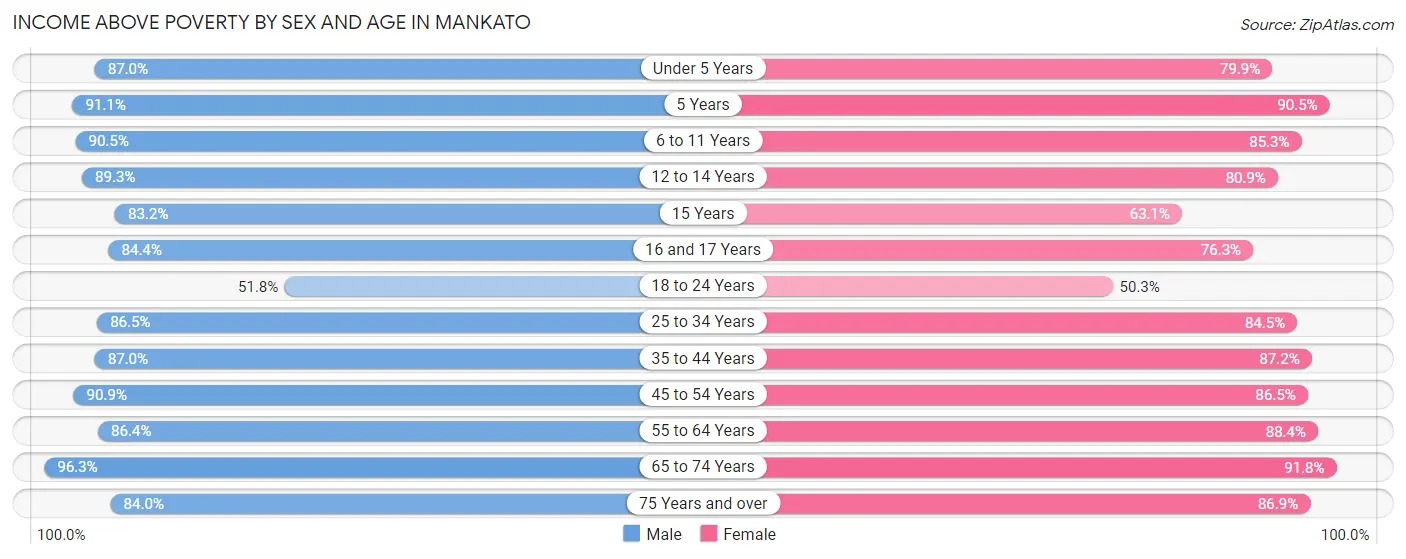
| Age Bracket | Male | Female |
| Under 5 Years | 974 (87.0%) | 865 (79.9%) |
| 5 Years | 256 (91.1%) | 124 (90.5%) |
| 6 to 11 Years | 1,024 (90.5%) | 933 (85.3%) |
| 12 to 14 Years | 628 (89.3%) | 449 (80.9%) |
| 15 Years | 203 (83.2%) | 118 (63.1%) |
| 16 and 17 Years | 460 (84.4%) | 219 (76.3%) |
| 18 to 24 Years | 2,706 (51.8%) | 2,830 (50.3%) |
| 25 to 34 Years | 3,086 (86.5%) | 2,445 (84.5%) |
| 35 to 44 Years | 2,135 (87.0%) | 1,849 (87.2%) |
| 45 to 54 Years | 1,480 (90.9%) | 1,424 (86.5%) |
| 55 to 64 Years | 1,449 (86.4%) | 1,654 (88.3%) |
| 65 to 74 Years | 1,317 (96.3%) | 1,374 (91.8%) |
| 75 Years and over | 794 (84.0%) | 1,260 (86.9%) |
| Total | 16,512 (79.1%) | 15,544 (76.0%) |
Income Below Poverty Among Married-Couple Families in Mankato
The poverty statistics for married-couple families in Mankato show that 3.4% or 205 of the total 5,951 families live below the poverty line. Families with 3 or 4 children have the highest poverty rate of 7.6%, comprising of 42 families. On the other hand, families with 5 or more children have the lowest poverty rate of 0.0%, which includes 0 families.
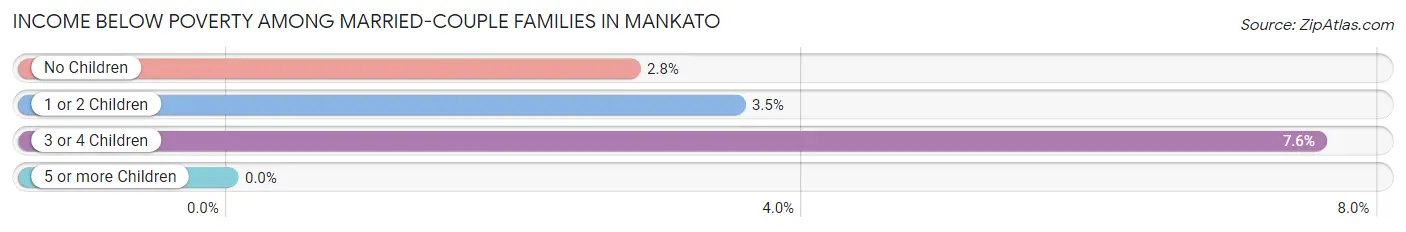
| Children | Above Poverty | Below Poverty |
| No Children | 3,371 (97.2%) | 97 (2.8%) |
| 1 or 2 Children | 1,806 (96.5%) | 66 (3.5%) |
| 3 or 4 Children | 512 (92.4%) | 42 (7.6%) |
| 5 or more Children | 57 (100.0%) | 0 (0.0%) |
| Total | 5,746 (96.6%) | 205 (3.4%) |
Income Below Poverty Among Single-Parent Households in Mankato
According to the poverty data in Mankato, 25.7% or 212 single-father households and 38.1% or 654 single-mother households are living below the poverty line. Among single-father households, those with 1 or 2 children have the highest poverty rate, with 110 households (34.4%) experiencing poverty. Likewise, among single-mother households, those with 3 or 4 children have the highest poverty rate, with 54 households (46.2%) falling below the poverty line.
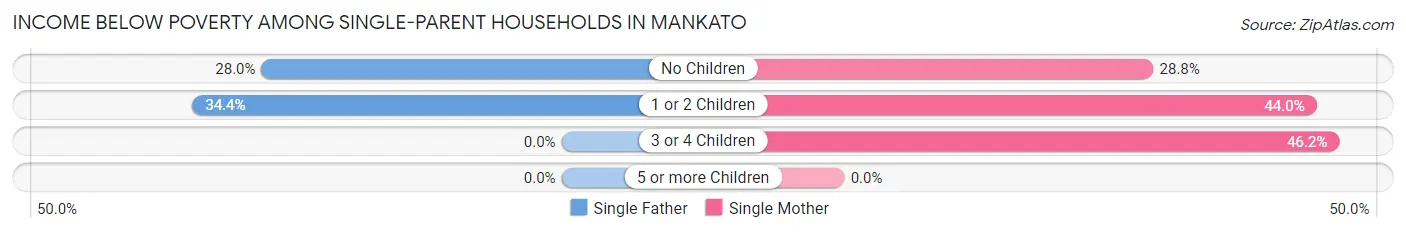
| Children | Single Father | Single Mother |
| No Children | 102 (28.0%) | 187 (28.8%) |
| 1 or 2 Children | 110 (34.4%) | 413 (44.0%) |
| 3 or 4 Children | 0 (0.0%) | 54 (46.2%) |
| 5 or more Children | 0 (0.0%) | 0 (0.0%) |
| Total | 212 (25.7%) | 654 (38.1%) |
Income Below Poverty Among Married-Couple vs Single-Parent Households in Mankato
The poverty data for Mankato shows that 205 of the married-couple family households (3.4%) and 866 of the single-parent households (34.1%) are living below the poverty level. Within the married-couple family households, those with 3 or 4 children have the highest poverty rate, with 42 households (7.6%) falling below the poverty line. Among the single-parent households, those with 1 or 2 children have the highest poverty rate, with 523 household (41.6%) living below poverty.
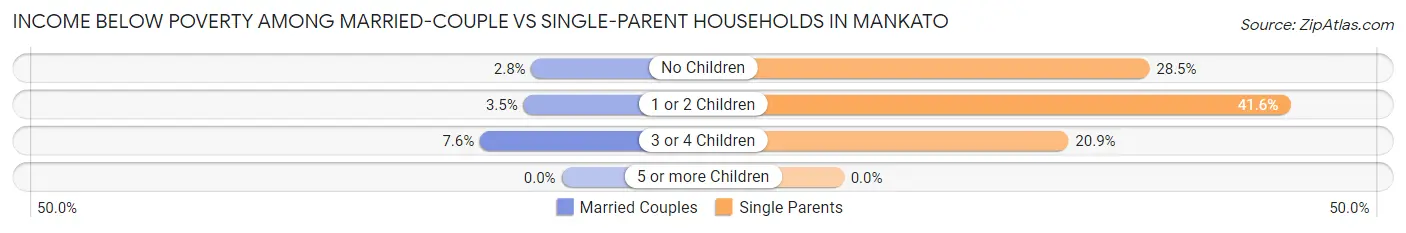
| Children | Married-Couple Families | Single-Parent Households |
| No Children | 97 (2.8%) | 289 (28.5%) |
| 1 or 2 Children | 66 (3.5%) | 523 (41.6%) |
| 3 or 4 Children | 42 (7.6%) | 54 (20.9%) |
| 5 or more Children | 0 (0.0%) | 0 (0.0%) |
| Total | 205 (3.4%) | 866 (34.1%) |
Race in Mankato
The most populous races in Mankato are White / Caucasian (37,497 | 84.4%), Black / African American (3,112 | 7.0%), and Hispanic or Latino (2,073 | 4.7%).
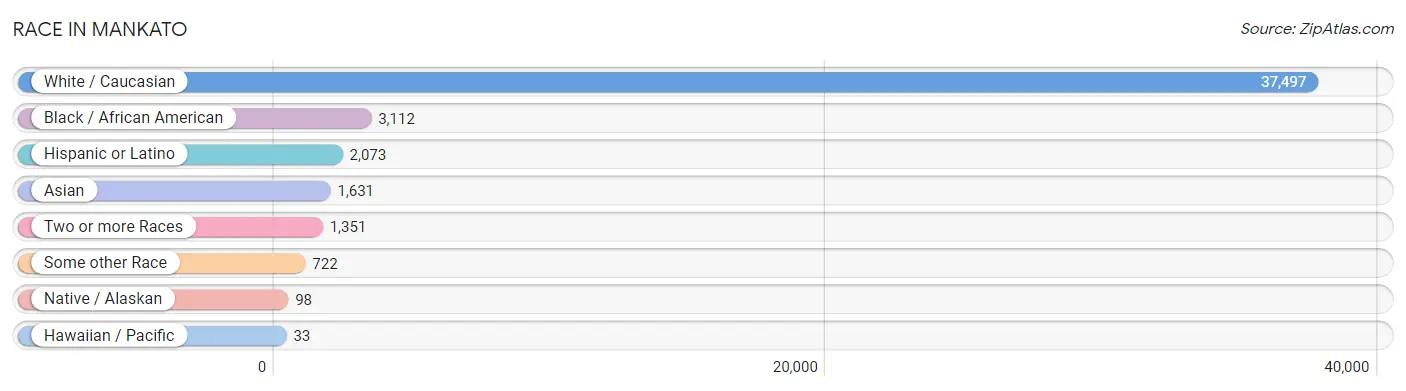
| Race | # Population | % Population |
| Asian | 1,631 | 3.7% |
| Black / African American | 3,112 | 7.0% |
| Hawaiian / Pacific | 33 | 0.1% |
| Hispanic or Latino | 2,073 | 4.7% |
| Native / Alaskan | 98 | 0.2% |
| White / Caucasian | 37,497 | 84.4% |
| Two or more Races | 1,351 | 3.0% |
| Some other Race | 722 | 1.6% |
| Total | 44,444 | 100.0% |
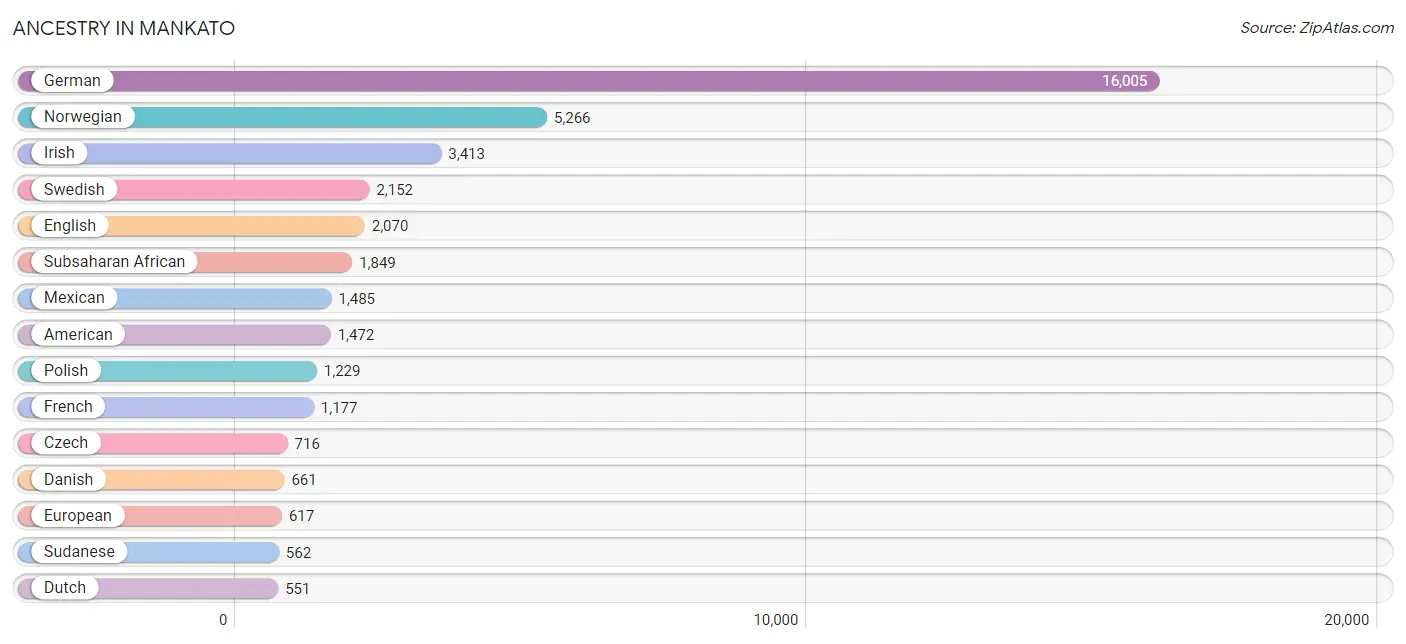
Ancestry in Mankato
The most populous ancestries reported in Mankato are German (16,005 | 36.0%), Norwegian (5,266 | 11.8%), Irish (3,413 | 7.7%), Swedish (2,152 | 4.8%), and English (2,070 | 4.7%), together accounting for 65.0% of all Mankato residents.
| Ancestry | # Population | % Population |
| African | 337 | 0.8% |
| Albanian | 10 | 0.0% |
| American | 1,472 | 3.3% |
| Arab | 479 | 1.1% |
| Argentinean | 22 | 0.1% |
| Armenian | 17 | 0.0% |
| Austrian | 81 | 0.2% |
| Bangladeshi | 87 | 0.2% |
| Belgian | 126 | 0.3% |
| Bhutanese | 72 | 0.2% |
| Blackfeet | 12 | 0.0% |
| British | 98 | 0.2% |
| Burmese | 318 | 0.7% |
| Canadian | 7 | 0.0% |
| Central American | 232 | 0.5% |
| Central American Indian | 17 | 0.0% |
| Chippewa | 68 | 0.2% |
| Comanche | 14 | 0.0% |
| Costa Rican | 49 | 0.1% |
| Creek | 11 | 0.0% |
| Croatian | 64 | 0.1% |
| Crow | 12 | 0.0% |
| Czech | 716 | 1.6% |
| Czechoslovakian | 37 | 0.1% |
| Danish | 661 | 1.5% |
| Dutch | 551 | 1.2% |
| Eastern European | 41 | 0.1% |
| English | 2,070 | 4.7% |
| Estonian | 66 | 0.2% |
| Ethiopian | 89 | 0.2% |
| European | 617 | 1.4% |
| Fijian | 33 | 0.1% |
| Filipino | 11 | 0.0% |
| Finnish | 319 | 0.7% |
| French | 1,177 | 2.6% |
| French Canadian | 275 | 0.6% |
| German | 16,005 | 36.0% |
| Ghanaian | 156 | 0.4% |
| Greek | 25 | 0.1% |
| Guatemalan | 1 | 0.0% |
| Honduran | 155 | 0.4% |
| Hungarian | 83 | 0.2% |
| Icelander | 10 | 0.0% |
| Indian (Asian) | 214 | 0.5% |
| Indonesian | 9 | 0.0% |
| Irish | 3,413 | 7.7% |
| Italian | 352 | 0.8% |
| Japanese | 8 | 0.0% |
| Korean | 199 | 0.4% |
| Lebanese | 179 | 0.4% |
| Liberian | 62 | 0.1% |
| Lithuanian | 56 | 0.1% |
| Luxembourger | 42 | 0.1% |
| Malaysian | 3 | 0.0% |
| Mexican | 1,485 | 3.3% |
| Moroccan | 46 | 0.1% |
| Native Hawaiian | 23 | 0.1% |
| Navajo | 19 | 0.0% |
| Nigerian | 175 | 0.4% |
| Northern European | 81 | 0.2% |
| Norwegian | 5,266 | 11.8% |
| Palestinian | 12 | 0.0% |
| Polish | 1,229 | 2.8% |
| Portuguese | 22 | 0.1% |
| Potawatomi | 10 | 0.0% |
| Puerto Rican | 28 | 0.1% |
| Romanian | 36 | 0.1% |
| Russian | 345 | 0.8% |
| Salvadoran | 27 | 0.1% |
| Samoan | 75 | 0.2% |
| Scandinavian | 503 | 1.1% |
| Scotch-Irish | 170 | 0.4% |
| Scottish | 508 | 1.1% |
| Senegalese | 6 | 0.0% |
| Serbian | 32 | 0.1% |
| Sioux | 51 | 0.1% |
| Slavic | 16 | 0.0% |
| Slovak | 17 | 0.0% |
| Slovene | 22 | 0.1% |
| Somali | 353 | 0.8% |
| South American | 47 | 0.1% |
| Spaniard | 150 | 0.3% |
| Spanish | 8 | 0.0% |
| Sri Lankan | 355 | 0.8% |
| Subsaharan African | 1,849 | 4.2% |
| Sudanese | 562 | 1.3% |
| Swedish | 2,152 | 4.8% |
| Swiss | 191 | 0.4% |
| Syrian | 53 | 0.1% |
| Thai | 112 | 0.3% |
| Tlingit-Haida | 11 | 0.0% |
| Turkish | 28 | 0.1% |
| Ukrainian | 30 | 0.1% |
| Venezuelan | 25 | 0.1% |
| Vietnamese | 136 | 0.3% |
| Welsh | 515 | 1.2% |
| West Indian | 21 | 0.1% |
| Yugoslavian | 35 | 0.1% | View All 98 Rows |
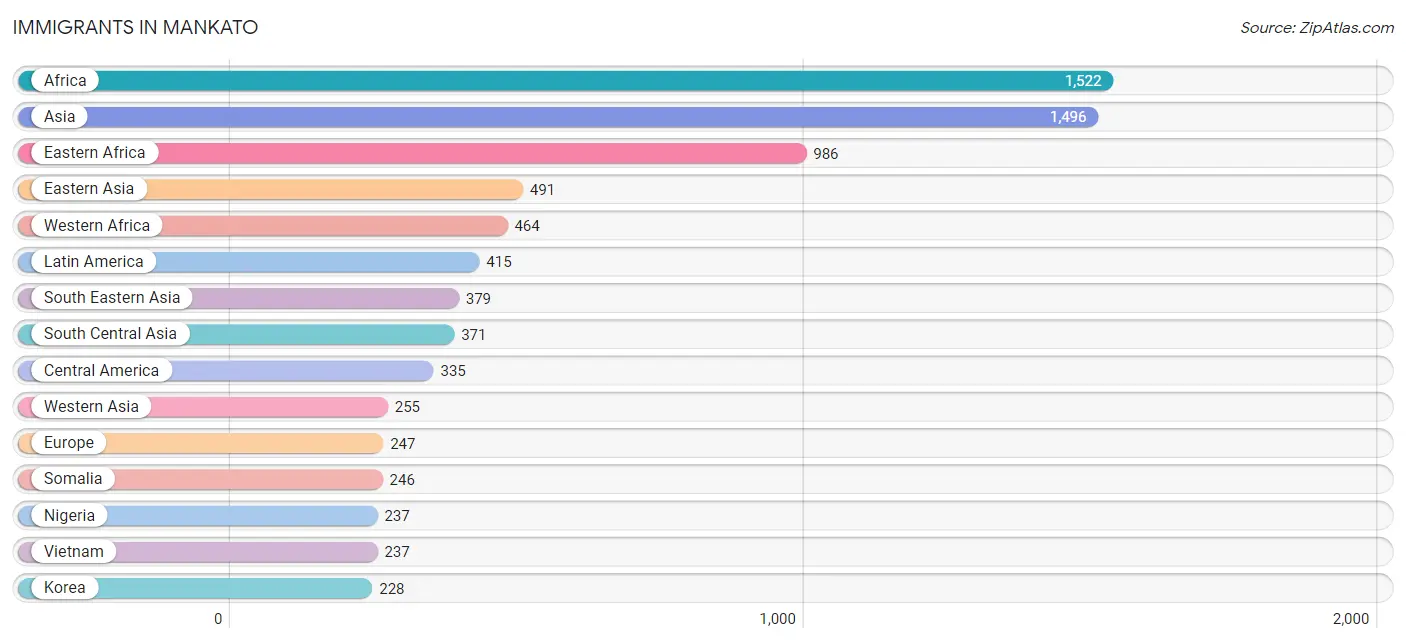
Immigrants in Mankato
The most numerous immigrant groups reported in Mankato came from Africa (1,522 | 3.4%), Asia (1,496 | 3.4%), Eastern Africa (986 | 2.2%), Eastern Asia (491 | 1.1%), and Western Africa (464 | 1.0%), together accounting for 11.1% of all Mankato residents.
| Immigration Origin | # Population | % Population |
| Africa | 1,522 | 3.4% |
| Albania | 10 | 0.0% |
| Argentina | 22 | 0.1% |
| Asia | 1,496 | 3.4% |
| Bangladesh | 136 | 0.3% |
| Cambodia | 6 | 0.0% |
| Canada | 128 | 0.3% |
| Caribbean | 33 | 0.1% |
| Central America | 335 | 0.7% |
| China | 206 | 0.5% |
| Costa Rica | 23 | 0.1% |
| Denmark | 11 | 0.0% |
| Dominica | 33 | 0.1% |
| Eastern Africa | 986 | 2.2% |
| Eastern Asia | 491 | 1.1% |
| Eastern Europe | 78 | 0.2% |
| El Salvador | 2 | 0.0% |
| Ethiopia | 223 | 0.5% |
| Europe | 247 | 0.6% |
| Germany | 79 | 0.2% |
| Ghana | 141 | 0.3% |
| Guatemala | 1 | 0.0% |
| Honduras | 130 | 0.3% |
| India | 83 | 0.2% |
| Iraq | 19 | 0.0% |
| Japan | 57 | 0.1% |
| Kenya | 192 | 0.4% |
| Korea | 228 | 0.5% |
| Latin America | 415 | 0.9% |
| Lebanon | 19 | 0.0% |
| Liberia | 48 | 0.1% |
| Mexico | 179 | 0.4% |
| Morocco | 21 | 0.1% |
| Nepal | 113 | 0.3% |
| Netherlands | 4 | 0.0% |
| Nigeria | 237 | 0.5% |
| Northern Africa | 37 | 0.1% |
| Northern Europe | 50 | 0.1% |
| Norway | 5 | 0.0% |
| Pakistan | 39 | 0.1% |
| Philippines | 127 | 0.3% |
| Russia | 45 | 0.1% |
| Saudi Arabia | 189 | 0.4% |
| Senegal | 6 | 0.0% |
| Serbia | 4 | 0.0% |
| Somalia | 246 | 0.5% |
| South America | 47 | 0.1% |
| South Central Asia | 371 | 0.8% |
| South Eastern Asia | 379 | 0.9% |
| Southern Europe | 21 | 0.1% |
| Spain | 21 | 0.1% |
| Sudan | 16 | 0.0% |
| Sweden | 17 | 0.0% |
| Taiwan | 74 | 0.2% |
| Thailand | 9 | 0.0% |
| Turkey | 28 | 0.1% |
| Ukraine | 6 | 0.0% |
| Venezuela | 25 | 0.1% |
| Vietnam | 237 | 0.5% |
| Western Africa | 464 | 1.0% |
| Western Asia | 255 | 0.6% |
| Western Europe | 83 | 0.2% | View All 62 Rows |
Sex and Age in Mankato
Sex and Age in Mankato
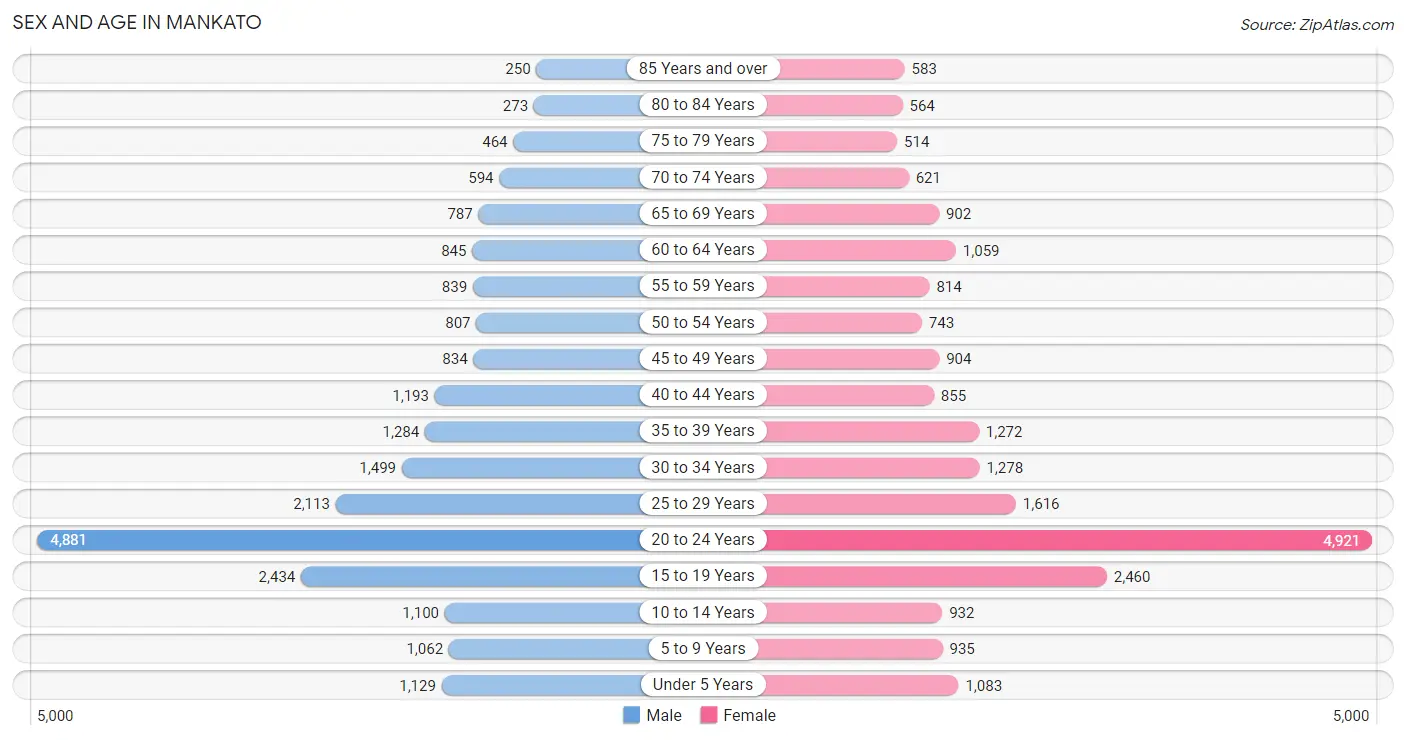
The most populous age groups in Mankato are 20 to 24 Years (4,881 | 21.8%) for men and 20 to 24 Years (4,921 | 22.3%) for women.
| Age Bracket | Male | Female |
| Under 5 Years | 1,129 (5.0%) | 1,083 (4.9%) |
| 5 to 9 Years | 1,062 (4.7%) | 935 (4.2%) |
| 10 to 14 Years | 1,100 (4.9%) | 932 (4.2%) |
| 15 to 19 Years | 2,434 (10.9%) | 2,460 (11.2%) |
| 20 to 24 Years | 4,881 (21.8%) | 4,921 (22.3%) |
| 25 to 29 Years | 2,113 (9.4%) | 1,616 (7.3%) |
| 30 to 34 Years | 1,499 (6.7%) | 1,278 (5.8%) |
| 35 to 39 Years | 1,284 (5.7%) | 1,272 (5.8%) |
| 40 to 44 Years | 1,193 (5.3%) | 855 (3.9%) |
| 45 to 49 Years | 834 (3.7%) | 904 (4.1%) |
| 50 to 54 Years | 807 (3.6%) | 743 (3.4%) |
| 55 to 59 Years | 839 (3.7%) | 814 (3.7%) |
| 60 to 64 Years | 845 (3.8%) | 1,059 (4.8%) |
| 65 to 69 Years | 787 (3.5%) | 902 (4.1%) |
| 70 to 74 Years | 594 (2.6%) | 621 (2.8%) |
| 75 to 79 Years | 464 (2.1%) | 514 (2.3%) |
| 80 to 84 Years | 273 (1.2%) | 564 (2.6%) |
| 85 Years and over | 250 (1.1%) | 583 (2.6%) |
| Total | 22,388 (100.0%) | 22,056 (100.0%) |
Families and Households in Mankato
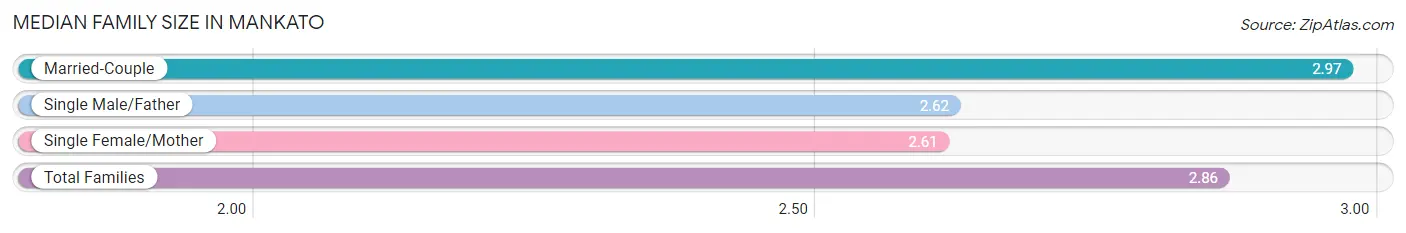
Median Family Size in Mankato
The median family size in Mankato is 2.86 persons per family, with married-couple families (5,951 | 70.1%) accounting for the largest median family size of 2.97 persons per family. On the other hand, single female/mother families (1,716 | 20.2%) represent the smallest median family size with 2.61 persons per family.
| Family Type | # Families | Family Size |
| Married-Couple | 5,951 (70.1%) | 2.97 |
| Single Male/Father | 826 (9.7%) | 2.62 |
| Single Female/Mother | 1,716 (20.2%) | 2.61 |
| Total Families | 8,493 (100.0%) | 2.86 |
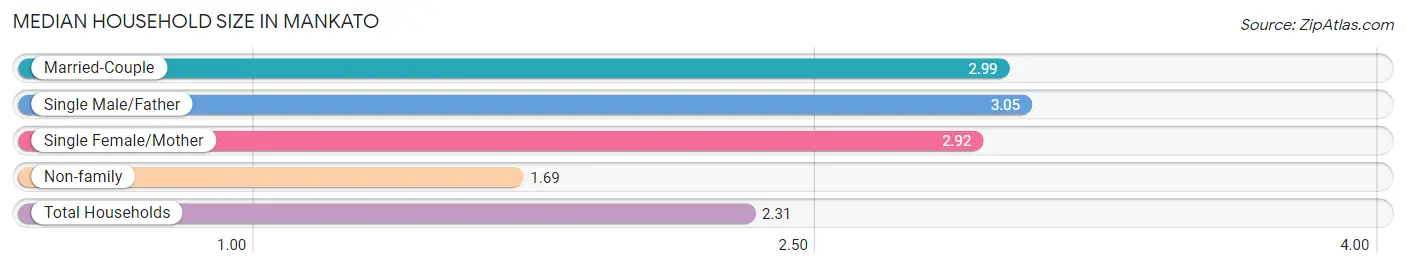
Median Household Size in Mankato
The median household size in Mankato is 2.31 persons per household, with single male/father households (826 | 4.7%) accounting for the largest median household size of 3.05 persons per household. non-family households (9,112 | 51.8%) represent the smallest median household size with 1.69 persons per household.
| Household Type | # Households | Household Size |
| Married-Couple | 5,951 (33.8%) | 2.99 |
| Single Male/Father | 826 (4.7%) | 3.05 |
| Single Female/Mother | 1,716 (9.8%) | 2.92 |
| Non-family | 9,112 (51.8%) | 1.69 |
| Total Households | 17,605 (100.0%) | 2.31 |
Household Size by Marriage Status in Mankato
Out of a total of 17,605 households in Mankato, 8,493 (48.2%) are family households, while 9,112 (51.8%) are nonfamily households. The most numerous type of family households are 2-person households, comprising 4,075, and the most common type of nonfamily households are 1-person households, comprising 5,227.
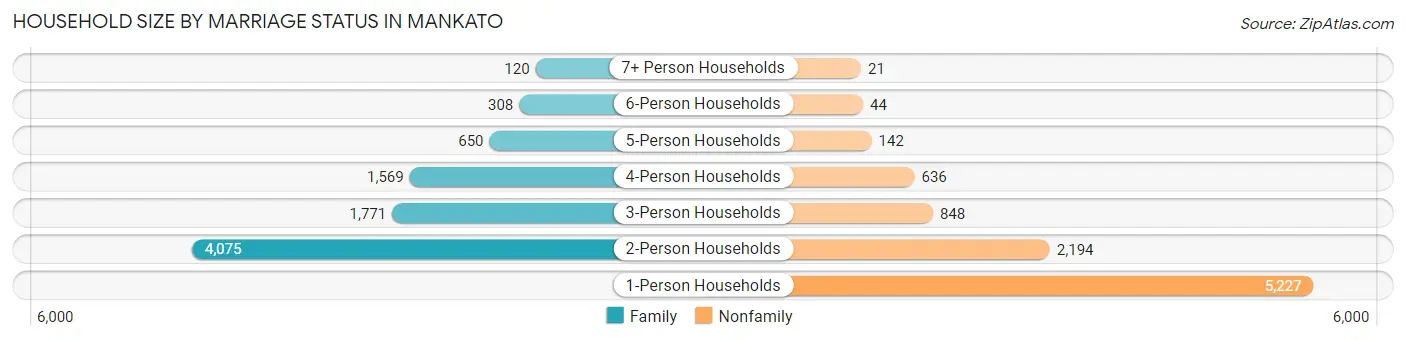
| Household Size | Family Households | Nonfamily Households |
| 1-Person Households | - | 5,227 (29.7%) |
| 2-Person Households | 4,075 (23.2%) | 2,194 (12.5%) |
| 3-Person Households | 1,771 (10.1%) | 848 (4.8%) |
| 4-Person Households | 1,569 (8.9%) | 636 (3.6%) |
| 5-Person Households | 650 (3.7%) | 142 (0.8%) |
| 6-Person Households | 308 (1.8%) | 44 (0.3%) |
| 7+ Person Households | 120 (0.7%) | 21 (0.1%) |
| Total | 8,493 (48.2%) | 9,112 (51.8%) |
Female Fertility in Mankato
Fertility by Age in Mankato
Average fertility rate in Mankato is 69.0 births per 1,000 women. Women in the age bracket of 35 to 50 years have the highest fertility rate with 85.0 births per 1,000 women. Women in the age bracket of 20 to 34 years acount for 70.7% of all women with births.
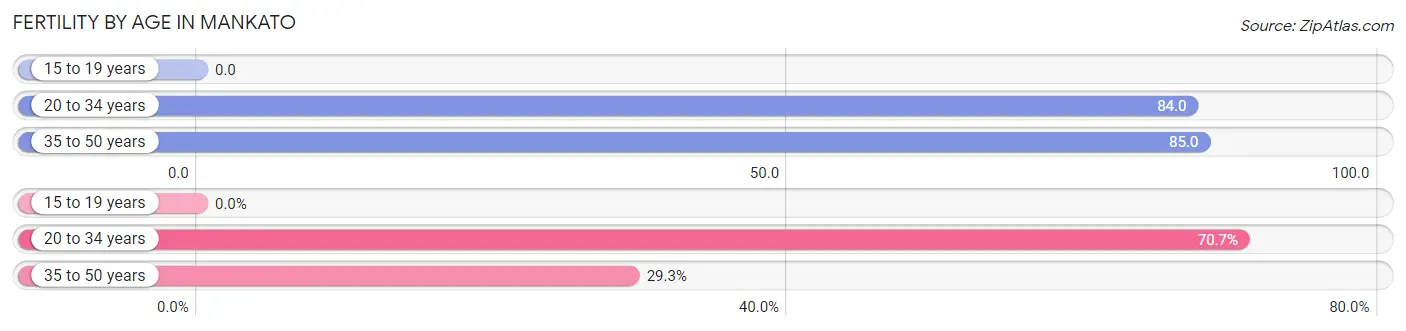
| Age Bracket | Women with Births | Births / 1,000 Women |
| 15 to 19 years | 0 (0.0%) | 0.0 |
| 20 to 34 years | 654 (70.7%) | 84.0 |
| 35 to 50 years | 271 (29.3%) | 85.0 |
| Total | 925 (100.0%) | 69.0 |
Fertility by Age by Marriage Status in Mankato
73.7% of women with births (925) in Mankato are married. The highest percentage of unmarried women with births falls into 20 to 34 years age bracket with 29.4% of them unmarried at the time of birth, while the lowest percentage of unmarried women with births belong to 35 to 50 years age bracket with 18.8% of them unmarried.
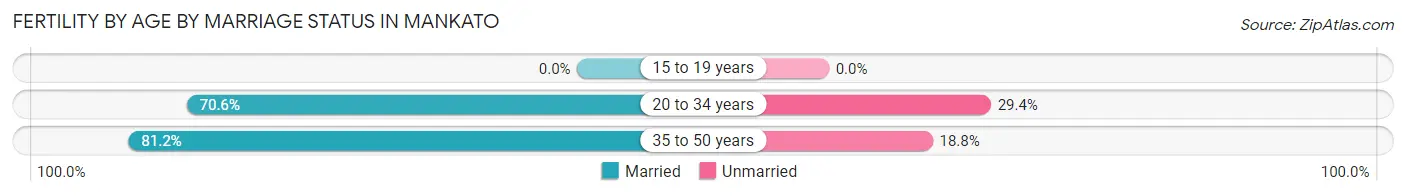
| Age Bracket | Married | Unmarried |
| 15 to 19 years | 0 (0.0%) | 0 (0.0%) |
| 20 to 34 years | 462 (70.6%) | 192 (29.4%) |
| 35 to 50 years | 220 (81.2%) | 51 (18.8%) |
| Total | 682 (73.7%) | 243 (26.3%) |
Fertility by Education in Mankato
Average fertility rate in Mankato is 69.0 births per 1,000 women. Women with the education attainment of less than high school have the highest fertility rate of 198.0 births per 1,000 women, while women with the education attainment of college or associate's degree have the lowest fertility at 24.0 births per 1,000 women. Women with the education attainment of bachelor's degree represent 25.4% of all women with births.
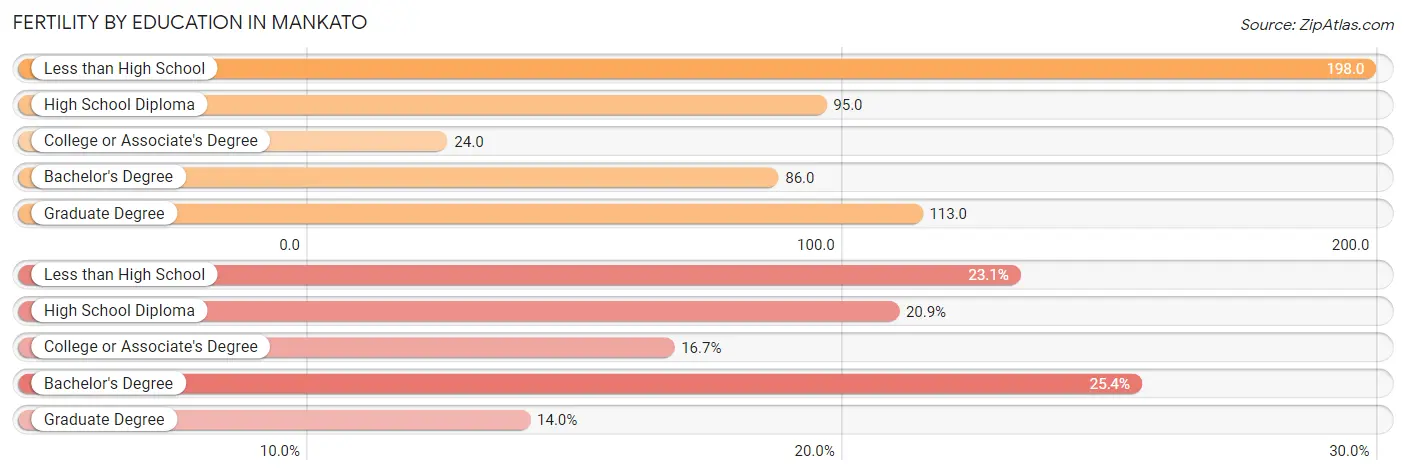
| Educational Attainment | Women with Births | Births / 1,000 Women |
| Less than High School | 214 (23.1%) | 198.0 |
| High School Diploma | 193 (20.9%) | 95.0 |
| College or Associate's Degree | 154 (16.7%) | 24.0 |
| Bachelor's Degree | 235 (25.4%) | 86.0 |
| Graduate Degree | 129 (14.0%) | 113.0 |
| Total | 925 (100.0%) | 69.0 |
Fertility by Education by Marriage Status in Mankato
26.3% of women with births in Mankato are unmarried. Women with the educational attainment of less than high school are most likely to be married with 100.0% of them married at childbirth, while women with the educational attainment of high school diploma are least likely to be married with 78.2% of them unmarried at childbirth.
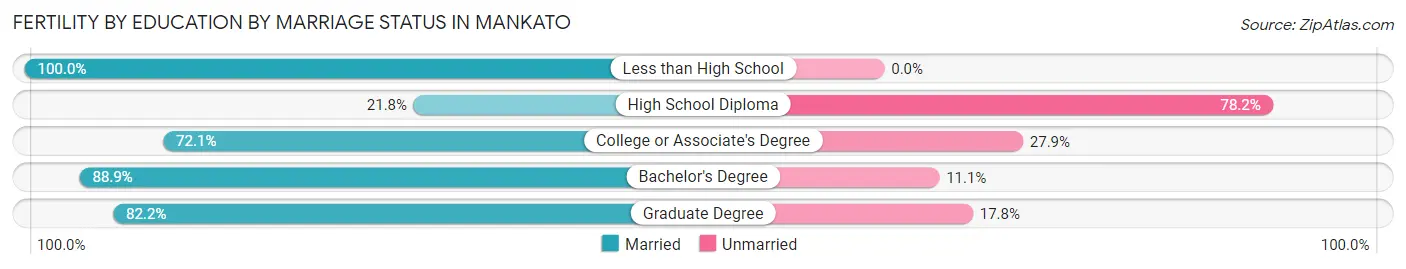
| Educational Attainment | Married | Unmarried |
| Less than High School | 214 (100.0%) | 0 (0.0%) |
| High School Diploma | 42 (21.8%) | 151 (78.2%) |
| College or Associate's Degree | 111 (72.1%) | 43 (27.9%) |
| Bachelor's Degree | 209 (88.9%) | 26 (11.1%) |
| Graduate Degree | 106 (82.2%) | 23 (17.8%) |
| Total | 682 (73.7%) | 243 (26.3%) |
Employment Characteristics in Mankato
Employment by Class of Employer in Mankato
Among the 24,473 employed individuals in Mankato, private company employees (16,521 | 67.5%), not-for-profit organizations (2,866 | 11.7%), and state government employees (2,313 | 9.5%) make up the most common classes of employment.
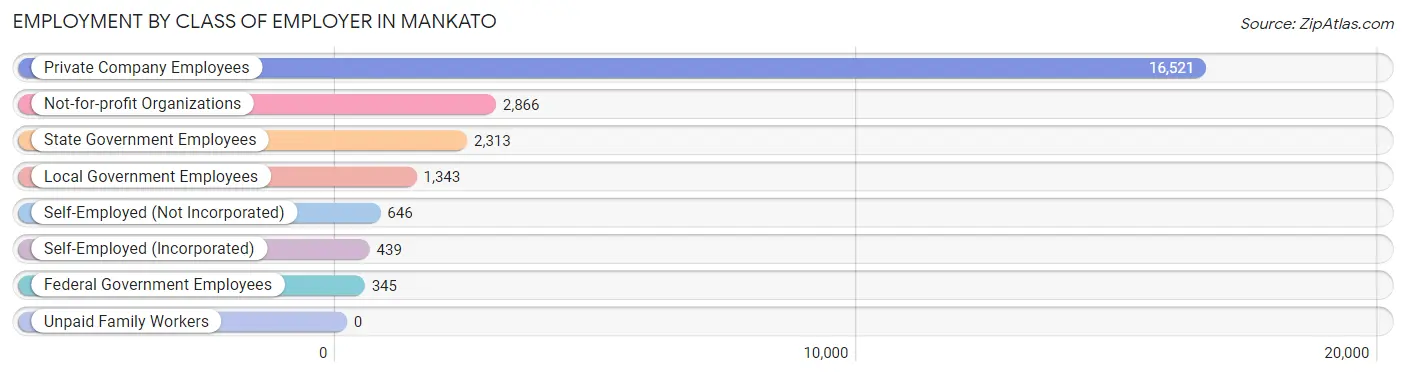
| Employer Class | # Employees | % Employees |
| Private Company Employees | 16,521 | 67.5% |
| Self-Employed (Incorporated) | 439 | 1.8% |
| Self-Employed (Not Incorporated) | 646 | 2.6% |
| Not-for-profit Organizations | 2,866 | 11.7% |
| Local Government Employees | 1,343 | 5.5% |
| State Government Employees | 2,313 | 9.5% |
| Federal Government Employees | 345 | 1.4% |
| Unpaid Family Workers | 0 | 0.0% |
| Total | 24,473 | 100.0% |
Employment Status by Age in Mankato
According to the labor force statistics for Mankato, out of the total population over 16 years of age (37,772), 71.2% or 26,894 individuals are in the labor force, with 4.2% or 1,130 of them unemployed. The age group with the highest labor force participation rate is 30 to 34 years, with 90.6% or 2,516 individuals in the labor force. Within the labor force, the 16 to 19 years age range has the highest percentage of unemployed individuals, with 8.5% or 236 of them being unemployed.
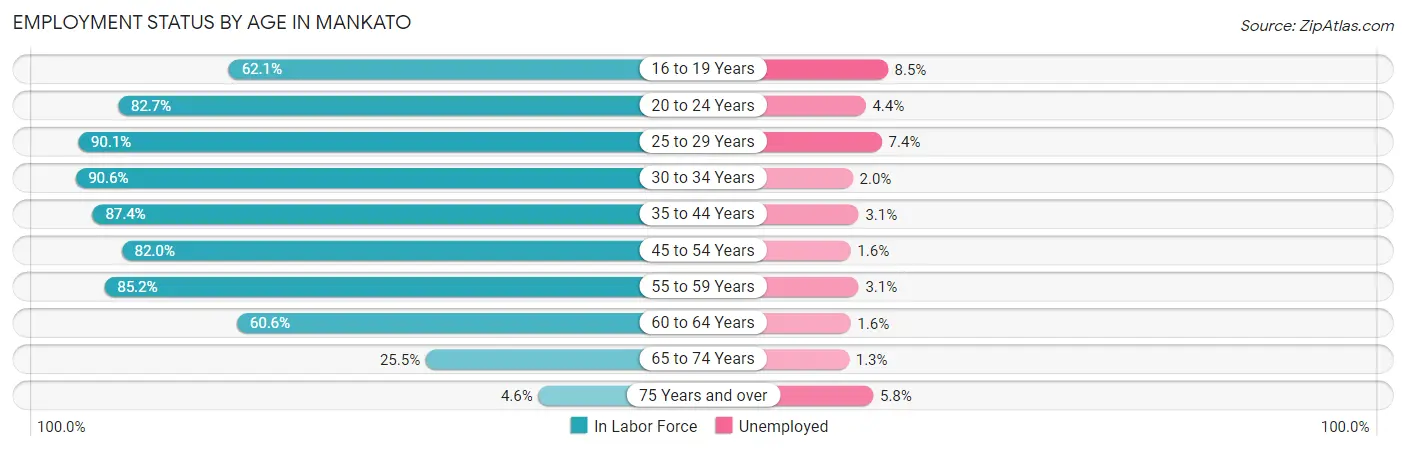
| Age Bracket | In Labor Force | Unemployed |
| 16 to 19 Years | 2,772 (62.1%) | 236 (8.5%) |
| 20 to 24 Years | 8,106 (82.7%) | 357 (4.4%) |
| 25 to 29 Years | 3,360 (90.1%) | 249 (7.4%) |
| 30 to 34 Years | 2,516 (90.6%) | 50 (2.0%) |
| 35 to 44 Years | 4,024 (87.4%) | 125 (3.1%) |
| 45 to 54 Years | 2,696 (82.0%) | 43 (1.6%) |
| 55 to 59 Years | 1,408 (85.2%) | 44 (3.1%) |
| 60 to 64 Years | 1,154 (60.6%) | 18 (1.6%) |
| 65 to 74 Years | 741 (25.5%) | 10 (1.3%) |
| 75 Years and over | 122 (4.6%) | 7 (5.8%) |
| Total | 26,894 (71.2%) | 1,130 (4.2%) |
Employment Status by Educational Attainment in Mankato
According to labor force statistics for Mankato, 84.4% of individuals (15,154) out of the total population between 25 and 64 years of age (17,955) are in the labor force, with 3.5% or 530 of them being unemployed. The group with the highest labor force participation rate are those with the educational attainment of bachelor's degree or higher, with 91.1% or 6,482 individuals in the labor force. Within the labor force, individuals with less than high school education have the highest percentage of unemployment, with 5.1% or 34 of them being unemployed.
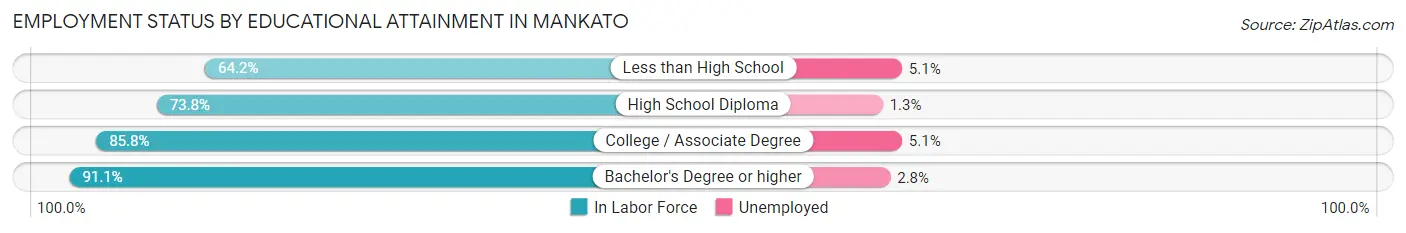
| Educational Attainment | In Labor Force | Unemployed |
| Less than High School | 664 (64.2%) | 53 (5.1%) |
| High School Diploma | 2,490 (73.8%) | 44 (1.3%) |
| College / Associate Degree | 5,519 (85.8%) | 328 (5.1%) |
| Bachelor's Degree or higher | 6,482 (91.1%) | 199 (2.8%) |
| Total | 15,154 (84.4%) | 628 (3.5%) |
Employment Occupations by Sex in Mankato
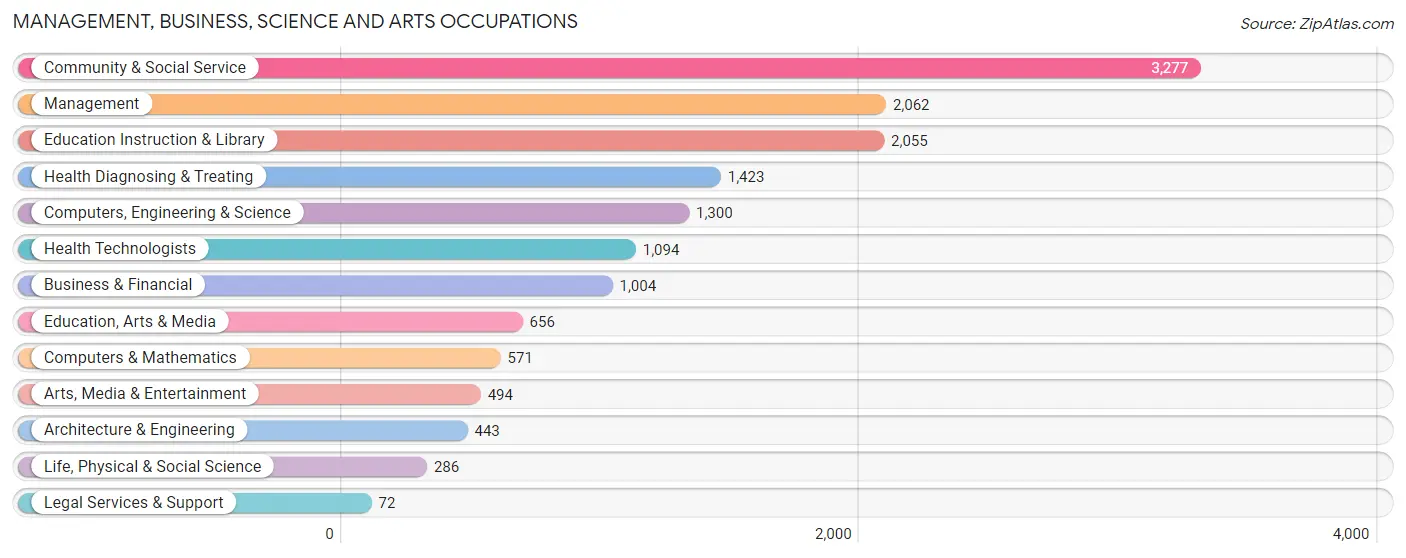
Management, Business, Science and Arts Occupations
The most common Management, Business, Science and Arts occupations in Mankato are Community & Social Service (3,277 | 12.7%), Management (2,062 | 8.0%), Education Instruction & Library (2,055 | 8.0%), Health Diagnosing & Treating (1,423 | 5.5%), and Computers, Engineering & Science (1,300 | 5.1%).
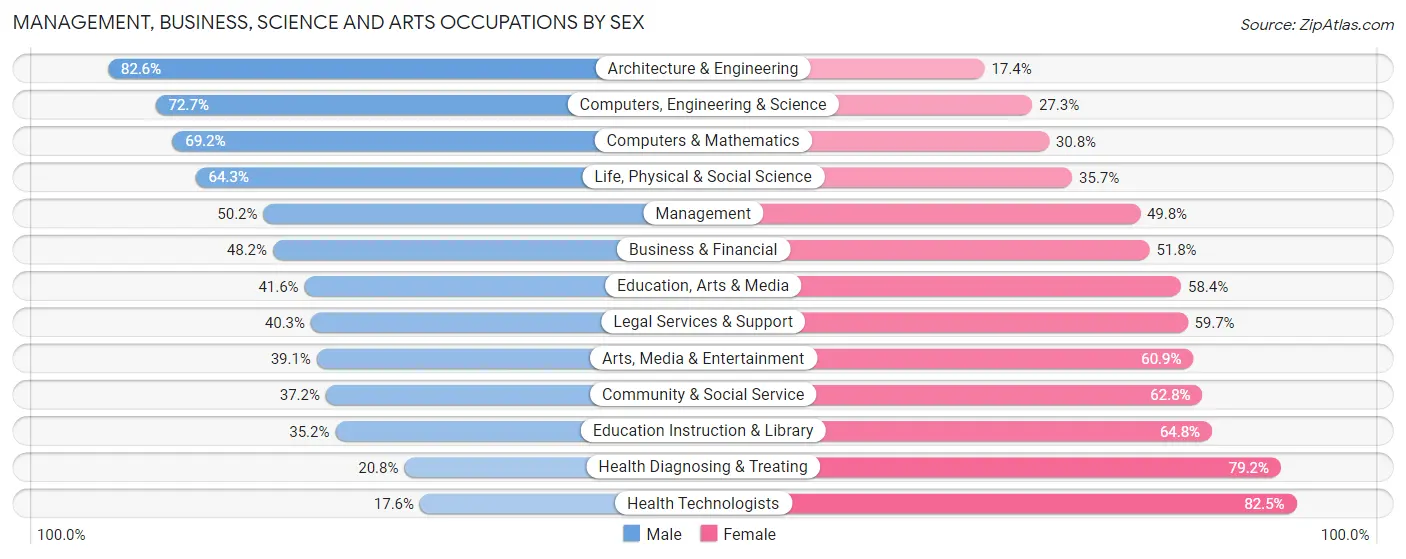
Management, Business, Science and Arts Occupations by Sex
Within the Management, Business, Science and Arts occupations in Mankato, the most male-oriented occupations are Architecture & Engineering (82.6%), Computers, Engineering & Science (72.7%), and Computers & Mathematics (69.2%), while the most female-oriented occupations are Health Technologists (82.5%), Health Diagnosing & Treating (79.2%), and Education Instruction & Library (64.8%).
| Occupation | Male | Female |
| Management | 1,035 (50.2%) | 1,027 (49.8%) |
| Business & Financial | 484 (48.2%) | 520 (51.8%) |
| Computers, Engineering & Science | 945 (72.7%) | 355 (27.3%) |
| Computers & Mathematics | 395 (69.2%) | 176 (30.8%) |
| Architecture & Engineering | 366 (82.6%) | 77 (17.4%) |
| Life, Physical & Social Science | 184 (64.3%) | 102 (35.7%) |
| Community & Social Service | 1,218 (37.2%) | 2,059 (62.8%) |
| Education, Arts & Media | 273 (41.6%) | 383 (58.4%) |
| Legal Services & Support | 29 (40.3%) | 43 (59.7%) |
| Education Instruction & Library | 723 (35.2%) | 1,332 (64.8%) |
| Arts, Media & Entertainment | 193 (39.1%) | 301 (60.9%) |
| Health Diagnosing & Treating | 296 (20.8%) | 1,127 (79.2%) |
| Health Technologists | 192 (17.5%) | 902 (82.5%) |
| Total (Category) | 3,978 (43.9%) | 5,088 (56.1%) |
| Total (Overall) | 13,159 (51.1%) | 12,579 (48.9%) |
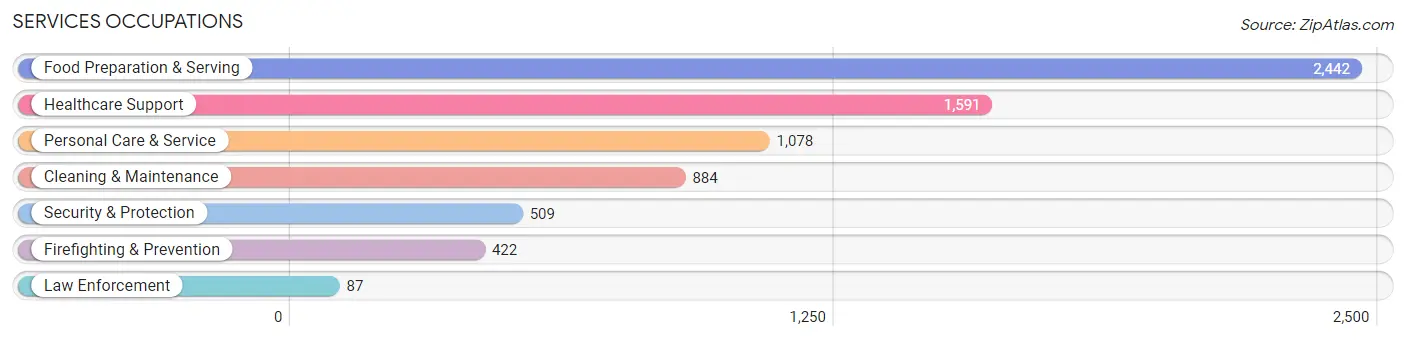
Services Occupations
The most common Services occupations in Mankato are Food Preparation & Serving (2,442 | 9.5%), Healthcare Support (1,591 | 6.2%), Personal Care & Service (1,078 | 4.2%), Cleaning & Maintenance (884 | 3.4%), and Security & Protection (509 | 2.0%).
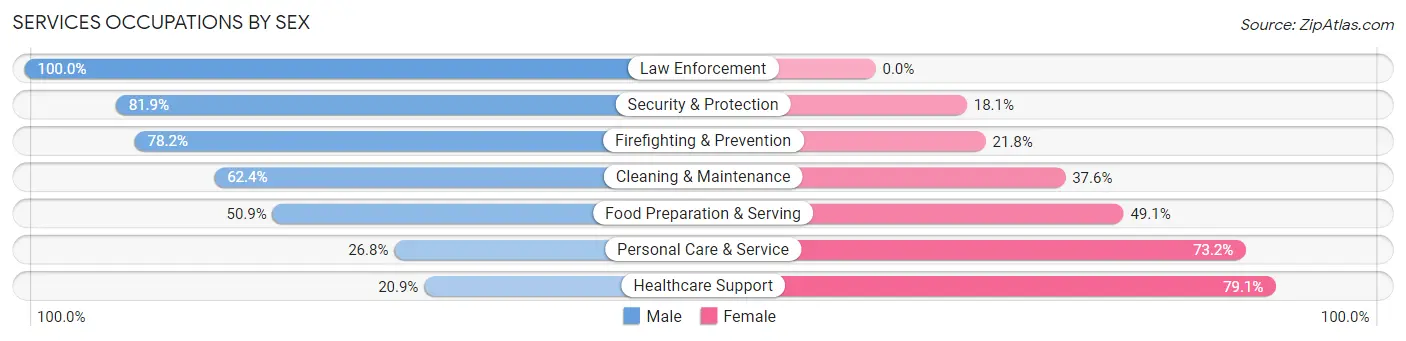
Services Occupations by Sex
Within the Services occupations in Mankato, the most male-oriented occupations are Law Enforcement (100.0%), Security & Protection (81.9%), and Firefighting & Prevention (78.2%), while the most female-oriented occupations are Healthcare Support (79.1%), Personal Care & Service (73.2%), and Food Preparation & Serving (49.1%).
| Occupation | Male | Female |
| Healthcare Support | 332 (20.9%) | 1,259 (79.1%) |
| Security & Protection | 417 (81.9%) | 92 (18.1%) |
| Firefighting & Prevention | 330 (78.2%) | 92 (21.8%) |
| Law Enforcement | 87 (100.0%) | 0 (0.0%) |
| Food Preparation & Serving | 1,243 (50.9%) | 1,199 (49.1%) |
| Cleaning & Maintenance | 552 (62.4%) | 332 (37.6%) |
| Personal Care & Service | 289 (26.8%) | 789 (73.2%) |
| Total (Category) | 2,833 (43.6%) | 3,671 (56.4%) |
| Total (Overall) | 13,159 (51.1%) | 12,579 (48.9%) |
Sales and Office Occupations
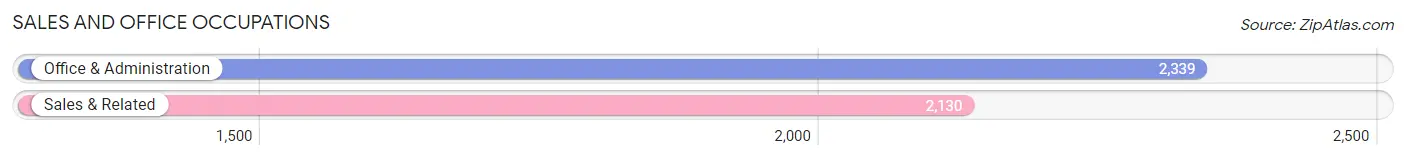
The most common Sales and Office occupations in Mankato are Office & Administration (2,339 | 9.1%), and Sales & Related (2,130 | 8.3%).
Sales and Office Occupations by Sex
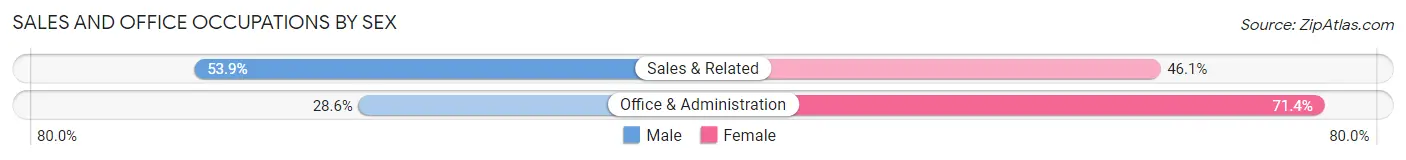
| Occupation | Male | Female |
| Sales & Related | 1,148 (53.9%) | 982 (46.1%) |
| Office & Administration | 669 (28.6%) | 1,670 (71.4%) |
| Total (Category) | 1,817 (40.7%) | 2,652 (59.3%) |
| Total (Overall) | 13,159 (51.1%) | 12,579 (48.9%) |
Natural Resources, Construction and Maintenance Occupations
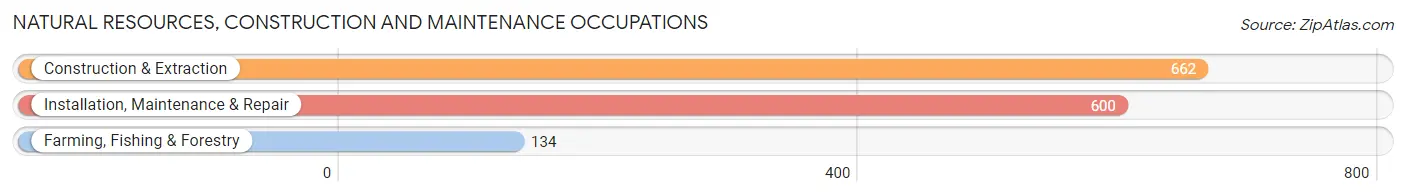
The most common Natural Resources, Construction and Maintenance occupations in Mankato are Construction & Extraction (662 | 2.6%), Installation, Maintenance & Repair (600 | 2.3%), and Farming, Fishing & Forestry (134 | 0.5%).
Natural Resources, Construction and Maintenance Occupations by Sex
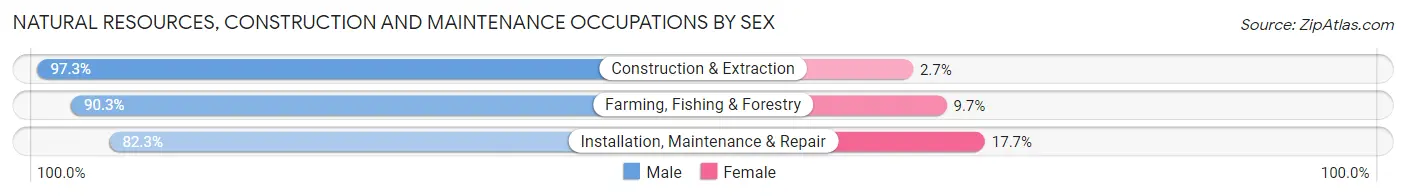
| Occupation | Male | Female |
| Farming, Fishing & Forestry | 121 (90.3%) | 13 (9.7%) |
| Construction & Extraction | 644 (97.3%) | 18 (2.7%) |
| Installation, Maintenance & Repair | 494 (82.3%) | 106 (17.7%) |
| Total (Category) | 1,259 (90.2%) | 137 (9.8%) |
| Total (Overall) | 13,159 (51.1%) | 12,579 (48.9%) |
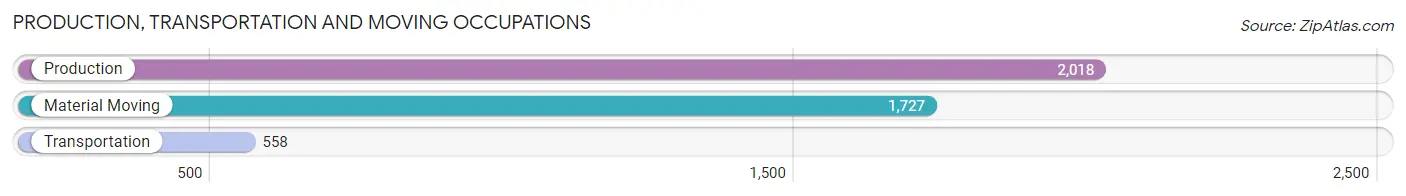
Production, Transportation and Moving Occupations
The most common Production, Transportation and Moving occupations in Mankato are Production (2,018 | 7.8%), Material Moving (1,727 | 6.7%), and Transportation (558 | 2.2%).
Production, Transportation and Moving Occupations by Sex
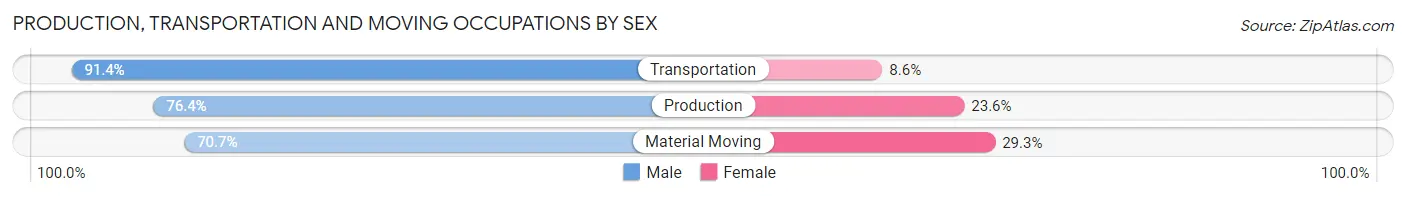
| Occupation | Male | Female |
| Production | 1,541 (76.4%) | 477 (23.6%) |
| Transportation | 510 (91.4%) | 48 (8.6%) |
| Material Moving | 1,221 (70.7%) | 506 (29.3%) |
| Total (Category) | 3,272 (76.0%) | 1,031 (24.0%) |
| Total (Overall) | 13,159 (51.1%) | 12,579 (48.9%) |
Employment Industries by Sex in Mankato
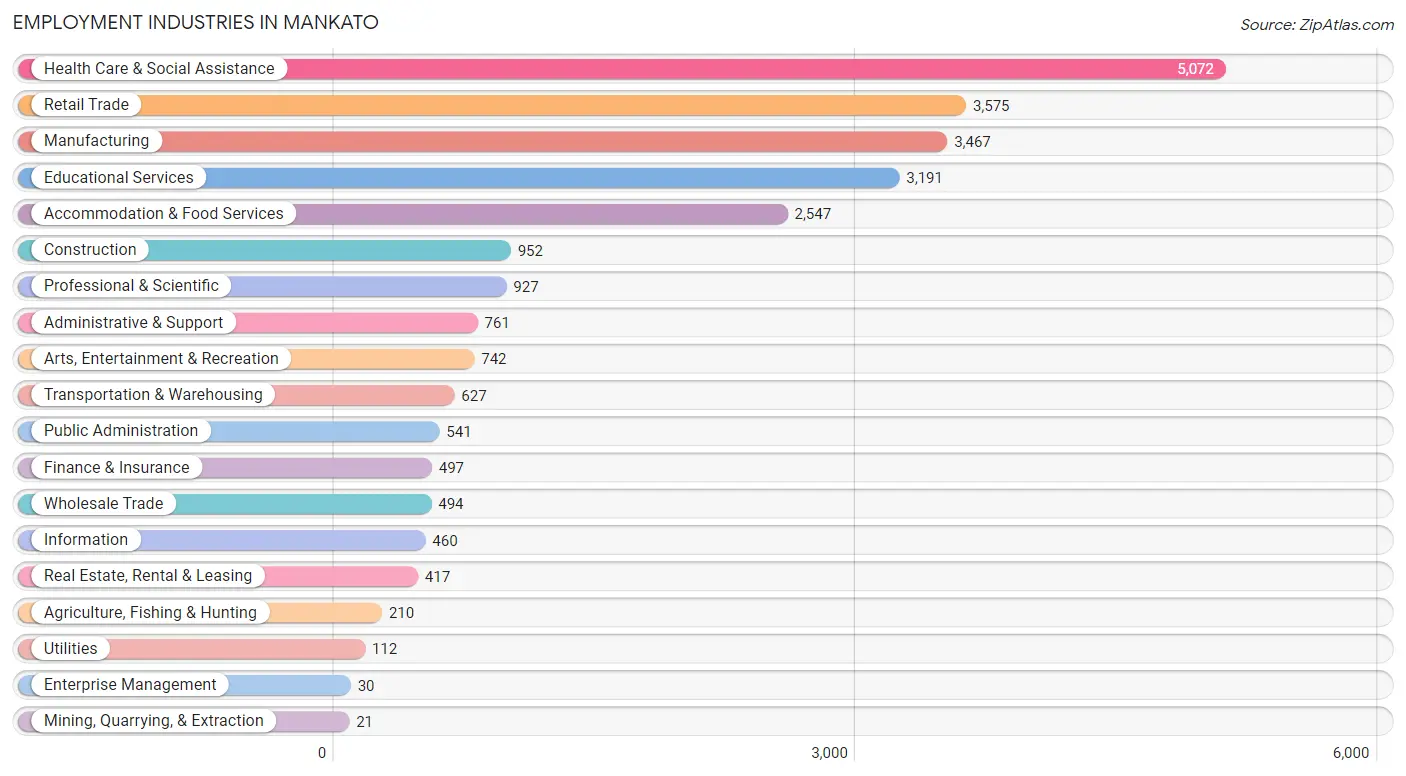
Employment Industries in Mankato
The major employment industries in Mankato include Health Care & Social Assistance (5,072 | 19.7%), Retail Trade (3,575 | 13.9%), Manufacturing (3,467 | 13.5%), Educational Services (3,191 | 12.4%), and Accommodation & Food Services (2,547 | 9.9%).
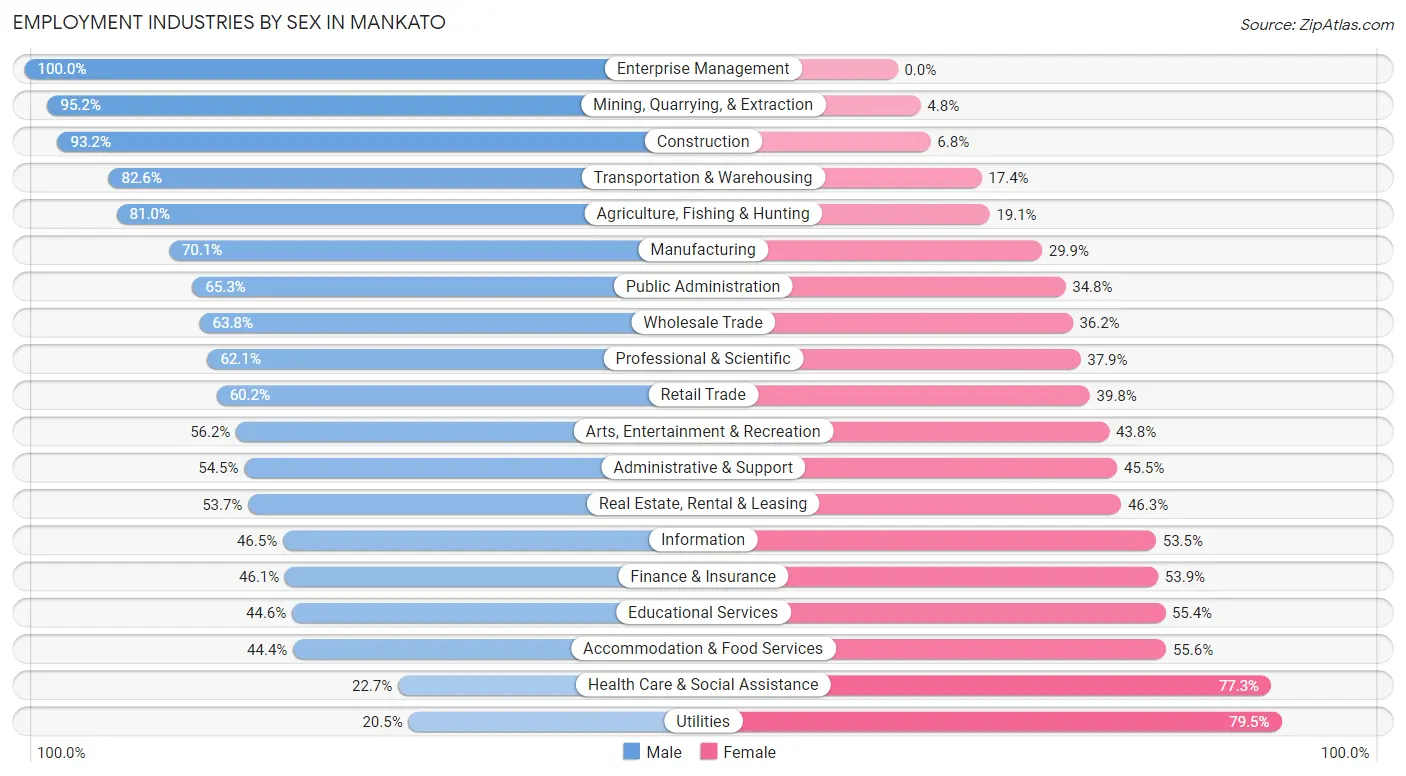
Employment Industries by Sex in Mankato
The Mankato industries that see more men than women are Enterprise Management (100.0%), Mining, Quarrying, & Extraction (95.2%), and Construction (93.2%), whereas the industries that tend to have a higher number of women are Utilities (79.5%), Health Care & Social Assistance (77.3%), and Accommodation & Food Services (55.6%).
| Industry | Male | Female |
| Agriculture, Fishing & Hunting | 170 (80.9%) | 40 (19.1%) |
| Mining, Quarrying, & Extraction | 20 (95.2%) | 1 (4.8%) |
| Construction | 887 (93.2%) | 65 (6.8%) |
| Manufacturing | 2,431 (70.1%) | 1,036 (29.9%) |
| Wholesale Trade | 315 (63.8%) | 179 (36.2%) |
| Retail Trade | 2,153 (60.2%) | 1,422 (39.8%) |
| Transportation & Warehousing | 518 (82.6%) | 109 (17.4%) |
| Utilities | 23 (20.5%) | 89 (79.5%) |
| Information | 214 (46.5%) | 246 (53.5%) |
| Finance & Insurance | 229 (46.1%) | 268 (53.9%) |
| Real Estate, Rental & Leasing | 224 (53.7%) | 193 (46.3%) |
| Professional & Scientific | 576 (62.1%) | 351 (37.9%) |
| Enterprise Management | 30 (100.0%) | 0 (0.0%) |
| Administrative & Support | 415 (54.5%) | 346 (45.5%) |
| Educational Services | 1,424 (44.6%) | 1,767 (55.4%) |
| Health Care & Social Assistance | 1,151 (22.7%) | 3,921 (77.3%) |
| Arts, Entertainment & Recreation | 417 (56.2%) | 325 (43.8%) |
| Accommodation & Food Services | 1,131 (44.4%) | 1,416 (55.6%) |
| Public Administration | 353 (65.2%) | 188 (34.7%) |
| Total | 13,159 (51.1%) | 12,579 (48.9%) |
Education in Mankato
School Enrollment in Mankato
The most common levels of schooling among the 16,168 students in Mankato are college / undergraduate (9,445 | 58.4%), high school (1,728 | 10.7%), and middle school (1,594 | 9.9%).
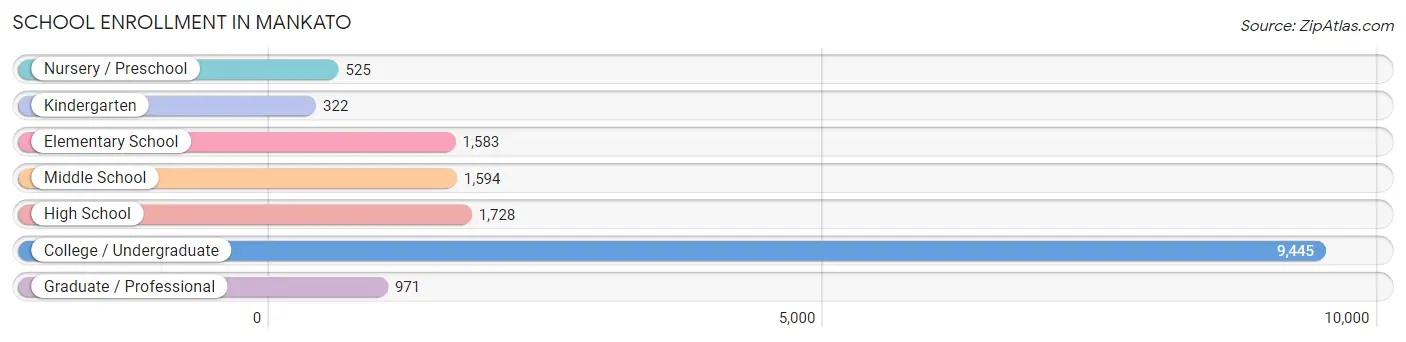
| School Level | # Students | % Students |
| Nursery / Preschool | 525 | 3.3% |
| Kindergarten | 322 | 2.0% |
| Elementary School | 1,583 | 9.8% |
| Middle School | 1,594 | 9.9% |
| High School | 1,728 | 10.7% |
| College / Undergraduate | 9,445 | 58.4% |
| Graduate / Professional | 971 | 6.0% |
| Total | 16,168 | 100.0% |
School Enrollment by Age by Funding Source in Mankato
Out of a total of 16,168 students who are enrolled in schools in Mankato, 1,795 (11.1%) attend a private institution, while the remaining 14,373 (88.9%) are enrolled in public schools. The age group of 3 to 4 year olds has the highest likelihood of being enrolled in private schools, with 107 (29.6% in the age bracket) enrolled. Conversely, the age group of 15 to 17 year olds has the lowest likelihood of being enrolled in a private school, with 1,181 (95.4% in the age bracket) attending a public institution.
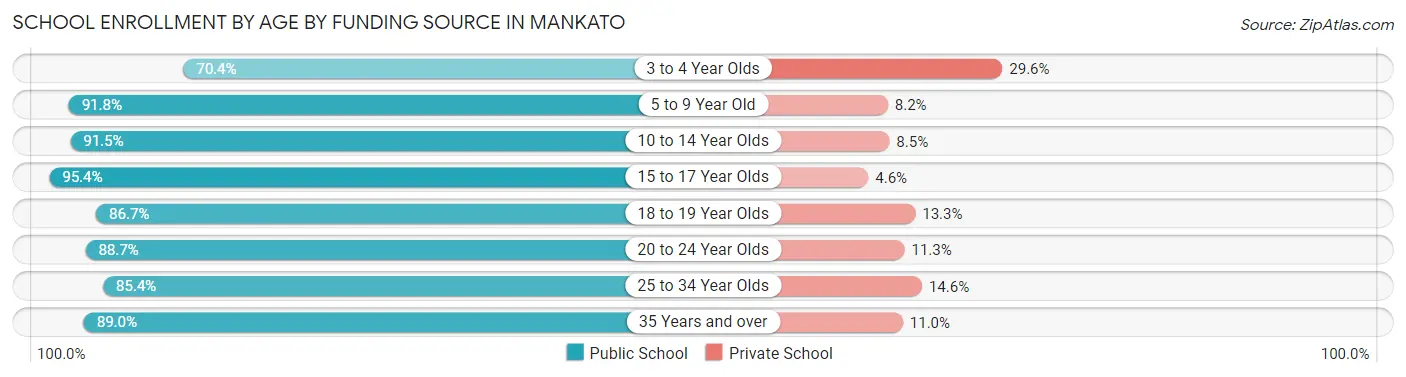
| Age Bracket | Public School | Private School |
| 3 to 4 Year Olds | 255 (70.4%) | 107 (29.6%) |
| 5 to 9 Year Old | 1,640 (91.8%) | 147 (8.2%) |
| 10 to 14 Year Olds | 1,836 (91.5%) | 171 (8.5%) |
| 15 to 17 Year Olds | 1,181 (95.4%) | 57 (4.6%) |
| 18 to 19 Year Olds | 3,015 (86.7%) | 464 (13.3%) |
| 20 to 24 Year Olds | 5,362 (88.7%) | 686 (11.3%) |
| 25 to 34 Year Olds | 732 (85.4%) | 125 (14.6%) |
| 35 Years and over | 347 (89.0%) | 43 (11.0%) |
| Total | 14,373 (88.9%) | 1,795 (11.1%) |
Educational Attainment by Field of Study in Mankato
Business (1,616 | 16.6%), education (1,238 | 12.7%), science & technology (960 | 9.8%), arts & humanities (902 | 9.2%), and social sciences (780 | 8.0%) are the most common fields of study among 9,764 individuals in Mankato who have obtained a bachelor's degree or higher.
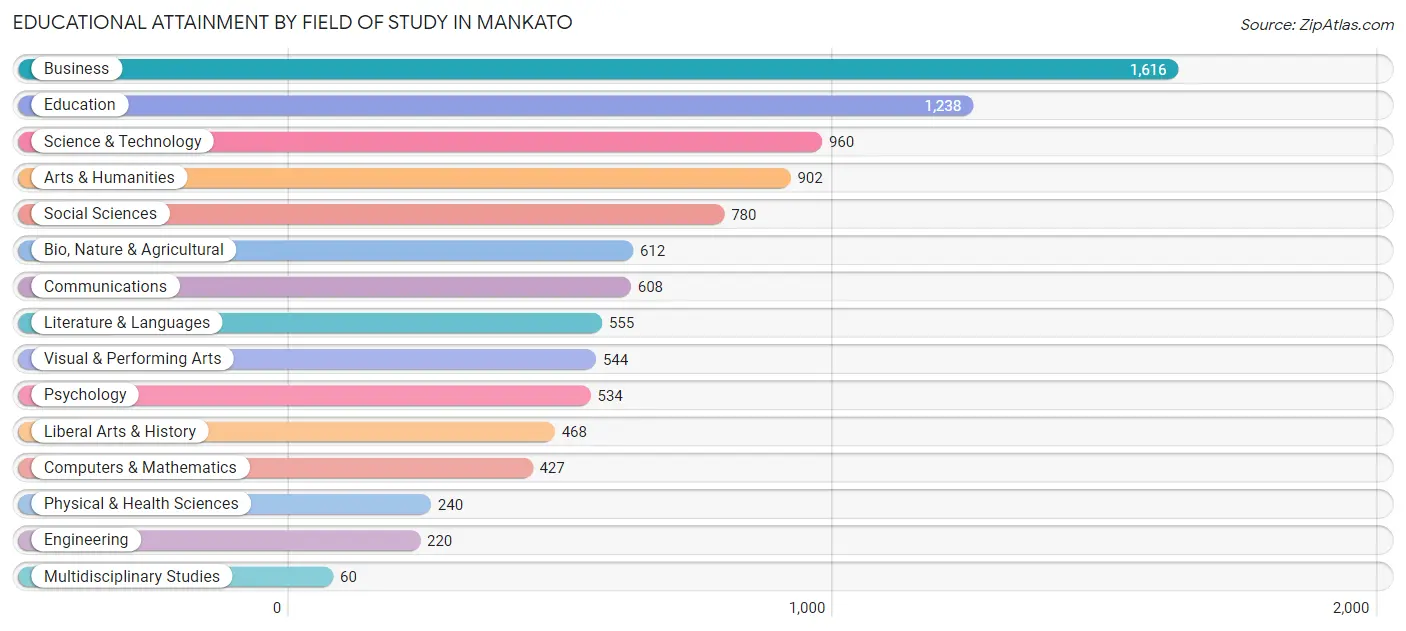
| Field of Study | # Graduates | % Graduates |
| Computers & Mathematics | 427 | 4.4% |
| Bio, Nature & Agricultural | 612 | 6.3% |
| Physical & Health Sciences | 240 | 2.5% |
| Psychology | 534 | 5.5% |
| Social Sciences | 780 | 8.0% |
| Engineering | 220 | 2.2% |
| Multidisciplinary Studies | 60 | 0.6% |
| Science & Technology | 960 | 9.8% |
| Business | 1,616 | 16.6% |
| Education | 1,238 | 12.7% |
| Literature & Languages | 555 | 5.7% |
| Liberal Arts & History | 468 | 4.8% |
| Visual & Performing Arts | 544 | 5.6% |
| Communications | 608 | 6.2% |
| Arts & Humanities | 902 | 9.2% |
| Total | 9,764 | 100.0% |
Transportation & Commute in Mankato
Vehicle Availability by Sex in Mankato
The most prevalent vehicle ownership categories in Mankato are males with 2 vehicles (5,423, accounting for 45.7%) and females with 2 vehicles (5,073, making up 47.7%).
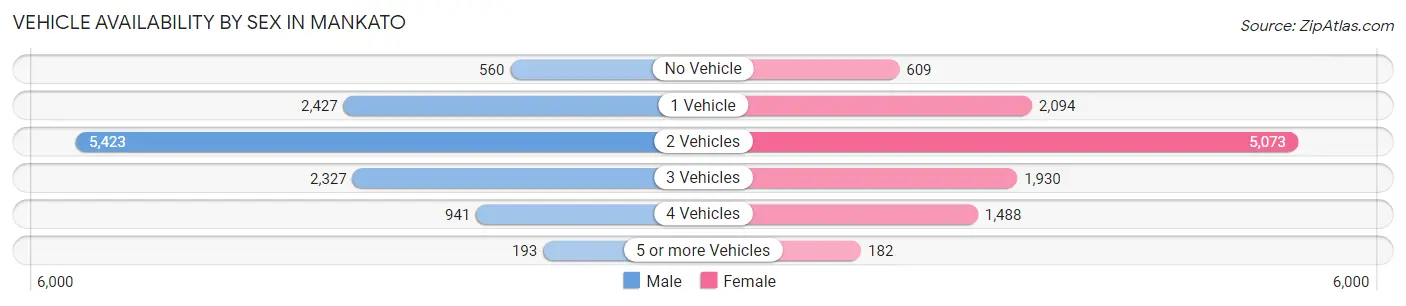
| Vehicles Available | Male | Female |
| No Vehicle | 560 (4.7%) | 609 (5.3%) |
| 1 Vehicle | 2,427 (20.4%) | 2,094 (18.4%) |
| 2 Vehicles | 5,423 (45.7%) | 5,073 (44.6%) |
| 3 Vehicles | 2,327 (19.6%) | 1,930 (17.0%) |
| 4 Vehicles | 941 (7.9%) | 1,488 (13.1%) |
| 5 or more Vehicles | 193 (1.6%) | 182 (1.6%) |
| Total | 11,871 (100.0%) | 11,376 (100.0%) |
Commute Time in Mankato
The most frequently occuring commute durations in Mankato are 10 to 14 minutes (8,036 commuters, 35.7%), 5 to 9 minutes (5,400 commuters, 24.0%), and 15 to 19 minutes (3,912 commuters, 17.4%).
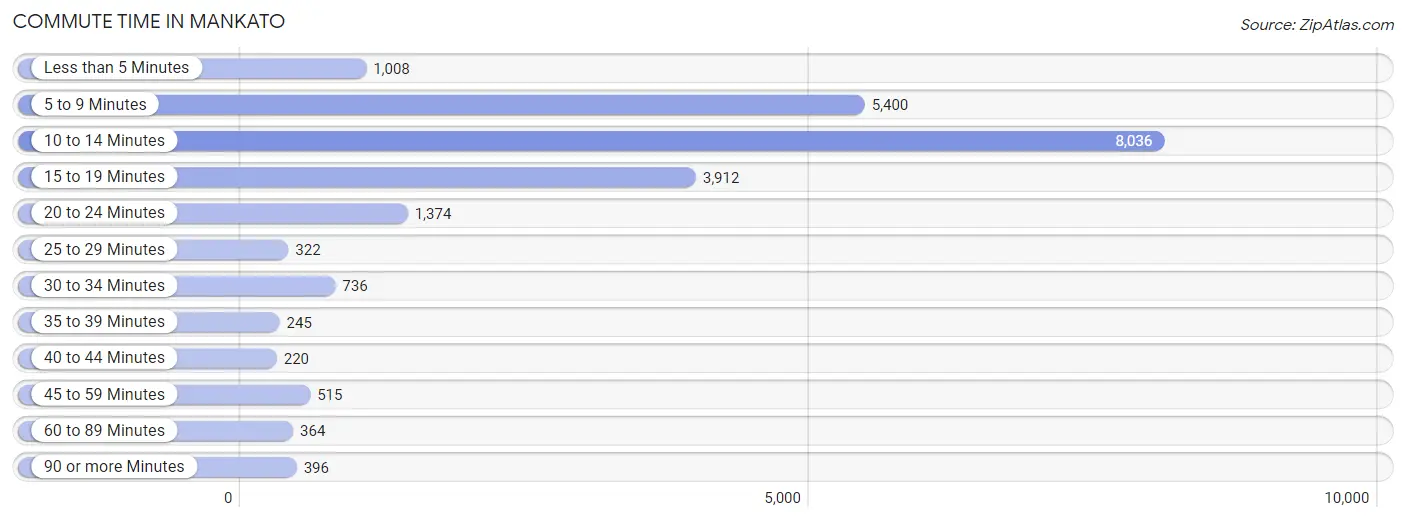
| Commute Time | # Commuters | % Commuters |
| Less than 5 Minutes | 1,008 | 4.5% |
| 5 to 9 Minutes | 5,400 | 24.0% |
| 10 to 14 Minutes | 8,036 | 35.7% |
| 15 to 19 Minutes | 3,912 | 17.4% |
| 20 to 24 Minutes | 1,374 | 6.1% |
| 25 to 29 Minutes | 322 | 1.4% |
| 30 to 34 Minutes | 736 | 3.3% |
| 35 to 39 Minutes | 245 | 1.1% |
| 40 to 44 Minutes | 220 | 1.0% |
| 45 to 59 Minutes | 515 | 2.3% |
| 60 to 89 Minutes | 364 | 1.6% |
| 90 or more Minutes | 396 | 1.8% |
Commute Time by Sex in Mankato
The most common commute times in Mankato are 10 to 14 minutes (3,871 commuters, 33.1%) for males and 10 to 14 minutes (4,165 commuters, 38.4%) for females.
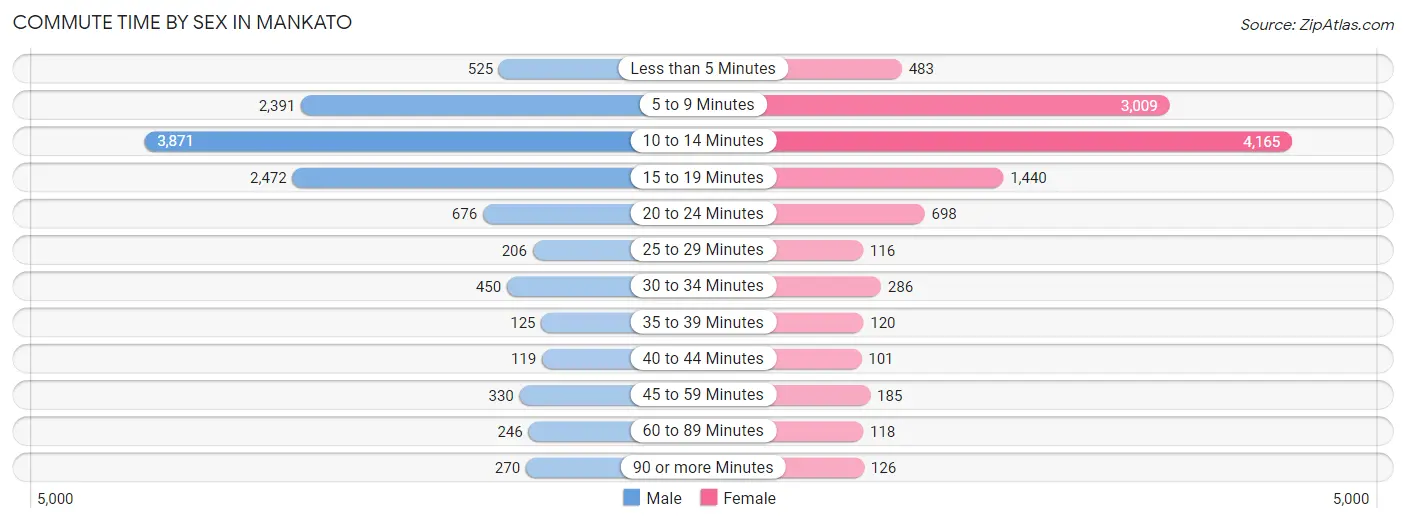
| Commute Time | Male | Female |
| Less than 5 Minutes | 525 (4.5%) | 483 (4.4%) |
| 5 to 9 Minutes | 2,391 (20.5%) | 3,009 (27.7%) |
| 10 to 14 Minutes | 3,871 (33.1%) | 4,165 (38.4%) |
| 15 to 19 Minutes | 2,472 (21.2%) | 1,440 (13.3%) |
| 20 to 24 Minutes | 676 (5.8%) | 698 (6.4%) |
| 25 to 29 Minutes | 206 (1.8%) | 116 (1.1%) |
| 30 to 34 Minutes | 450 (3.8%) | 286 (2.6%) |
| 35 to 39 Minutes | 125 (1.1%) | 120 (1.1%) |
| 40 to 44 Minutes | 119 (1.0%) | 101 (0.9%) |
| 45 to 59 Minutes | 330 (2.8%) | 185 (1.7%) |
| 60 to 89 Minutes | 246 (2.1%) | 118 (1.1%) |
| 90 or more Minutes | 270 (2.3%) | 126 (1.2%) |
Time of Departure to Work by Sex in Mankato
The most frequent times of departure to work in Mankato are 7:30 AM to 7:59 AM (1,871, 16.0%) for males and 7:30 AM to 7:59 AM (1,726, 15.9%) for females.
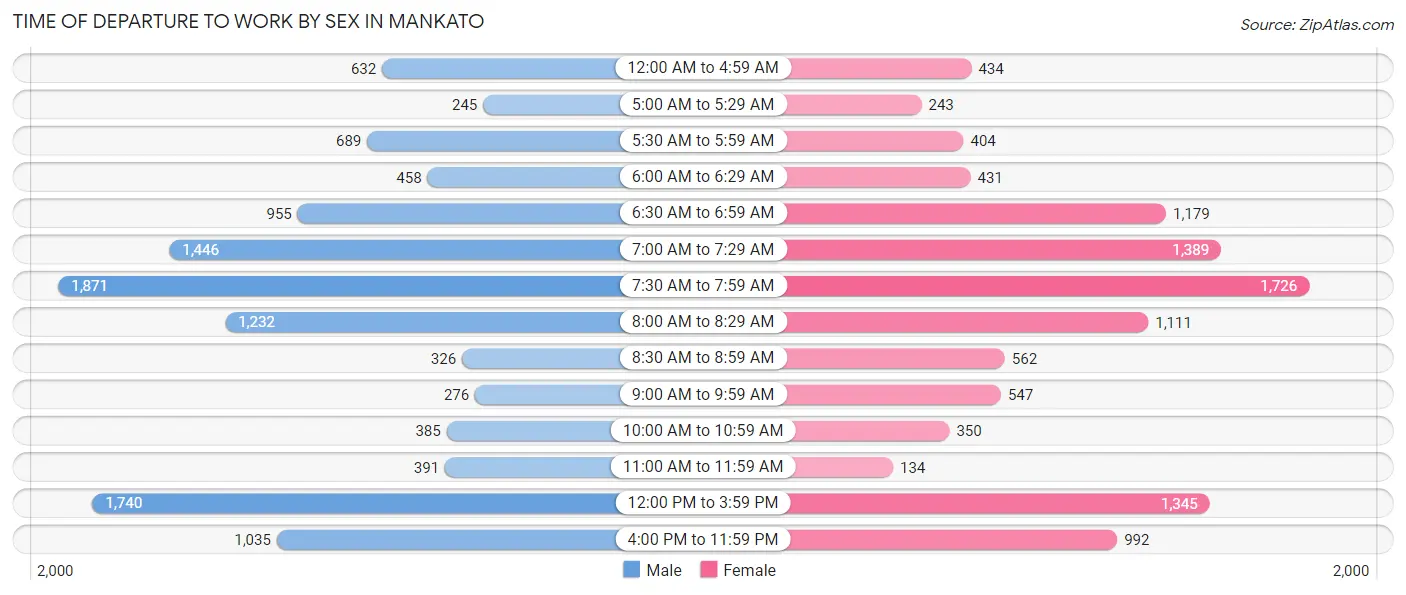
| Time of Departure | Male | Female |
| 12:00 AM to 4:59 AM | 632 (5.4%) | 434 (4.0%) |
| 5:00 AM to 5:29 AM | 245 (2.1%) | 243 (2.2%) |
| 5:30 AM to 5:59 AM | 689 (5.9%) | 404 (3.7%) |
| 6:00 AM to 6:29 AM | 458 (3.9%) | 431 (4.0%) |
| 6:30 AM to 6:59 AM | 955 (8.2%) | 1,179 (10.9%) |
| 7:00 AM to 7:29 AM | 1,446 (12.4%) | 1,389 (12.8%) |
| 7:30 AM to 7:59 AM | 1,871 (16.0%) | 1,726 (15.9%) |
| 8:00 AM to 8:29 AM | 1,232 (10.5%) | 1,111 (10.2%) |
| 8:30 AM to 8:59 AM | 326 (2.8%) | 562 (5.2%) |
| 9:00 AM to 9:59 AM | 276 (2.4%) | 547 (5.0%) |
| 10:00 AM to 10:59 AM | 385 (3.3%) | 350 (3.2%) |
| 11:00 AM to 11:59 AM | 391 (3.4%) | 134 (1.2%) |
| 12:00 PM to 3:59 PM | 1,740 (14.9%) | 1,345 (12.4%) |
| 4:00 PM to 11:59 PM | 1,035 (8.9%) | 992 (9.1%) |
| Total | 11,681 (100.0%) | 10,847 (100.0%) |
Housing Occupancy in Mankato
Occupancy by Ownership in Mankato
Of the total 17,605 dwellings in Mankato, owner-occupied units account for 8,726 (49.6%), while renter-occupied units make up 8,879 (50.4%).
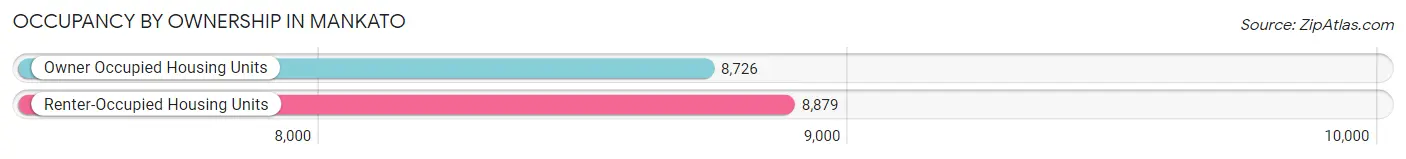
| Occupancy | # Housing Units | % Housing Units |
| Owner Occupied Housing Units | 8,726 | 49.6% |
| Renter-Occupied Housing Units | 8,879 | 50.4% |
| Total Occupied Housing Units | 17,605 | 100.0% |
Occupancy by Household Size in Mankato
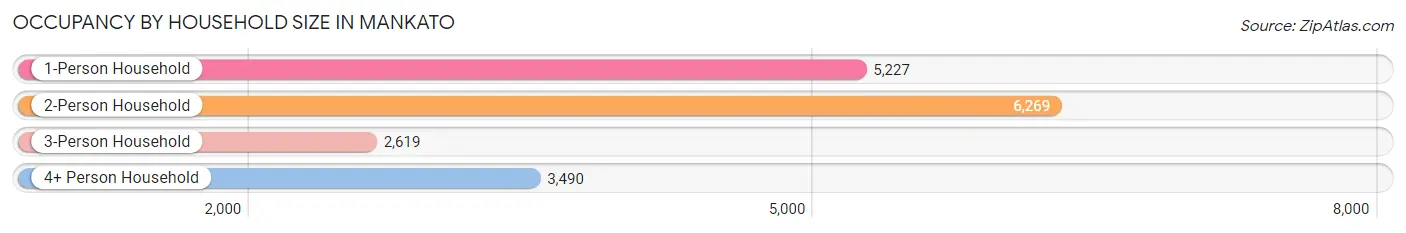
| Household Size | # Housing Units | % Housing Units |
| 1-Person Household | 5,227 | 29.7% |
| 2-Person Household | 6,269 | 35.6% |
| 3-Person Household | 2,619 | 14.9% |
| 4+ Person Household | 3,490 | 19.8% |
| Total Housing Units | 17,605 | 100.0% |
Occupancy by Ownership by Household Size in Mankato
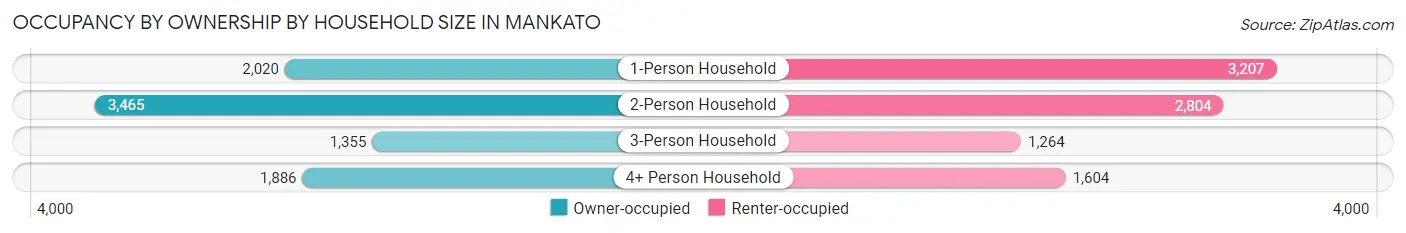
| Household Size | Owner-occupied | Renter-occupied |
| 1-Person Household | 2,020 (38.7%) | 3,207 (61.4%) |
| 2-Person Household | 3,465 (55.3%) | 2,804 (44.7%) |
| 3-Person Household | 1,355 (51.7%) | 1,264 (48.3%) |
| 4+ Person Household | 1,886 (54.0%) | 1,604 (46.0%) |
| Total Housing Units | 8,726 (49.6%) | 8,879 (50.4%) |
Occupancy by Educational Attainment in Mankato
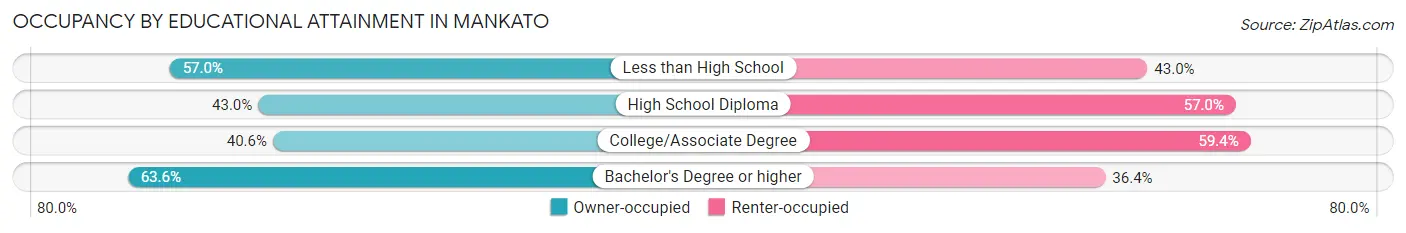
| Household Size | Owner-occupied | Renter-occupied |
| Less than High School | 359 (57.0%) | 271 (43.0%) |
| High School Diploma | 1,558 (43.0%) | 2,069 (57.0%) |
| College/Associate Degree | 2,976 (40.6%) | 4,349 (59.4%) |
| Bachelor's Degree or higher | 3,833 (63.6%) | 2,190 (36.4%) |
Occupancy by Age of Householder in Mankato
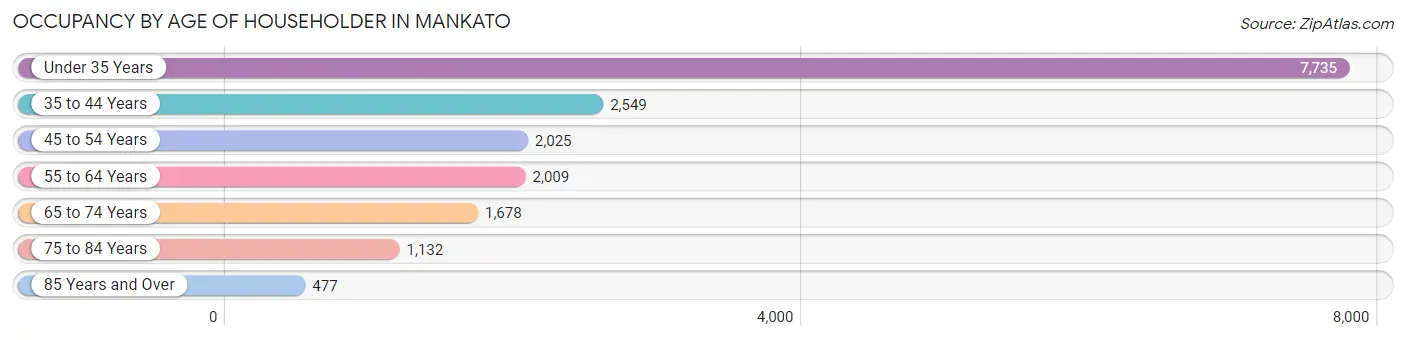
| Age Bracket | # Households | % Households |
| Under 35 Years | 7,735 | 43.9% |
| 35 to 44 Years | 2,549 | 14.5% |
| 45 to 54 Years | 2,025 | 11.5% |
| 55 to 64 Years | 2,009 | 11.4% |
| 65 to 74 Years | 1,678 | 9.5% |
| 75 to 84 Years | 1,132 | 6.4% |
| 85 Years and Over | 477 | 2.7% |
| Total | 17,605 | 100.0% |
Housing Finances in Mankato
Median Income by Occupancy in Mankato
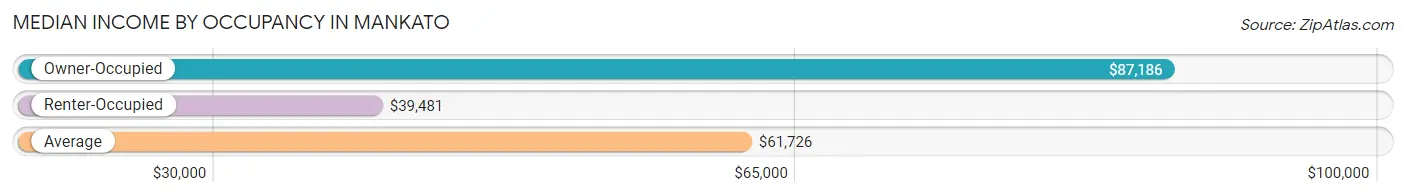
| Occupancy Type | # Households | Median Income |
| Owner-Occupied | 8,726 (49.6%) | $87,186 |
| Renter-Occupied | 8,879 (50.4%) | $39,481 |
| Average | 17,605 (100.0%) | $61,726 |
Occupancy by Householder Income Bracket in Mankato
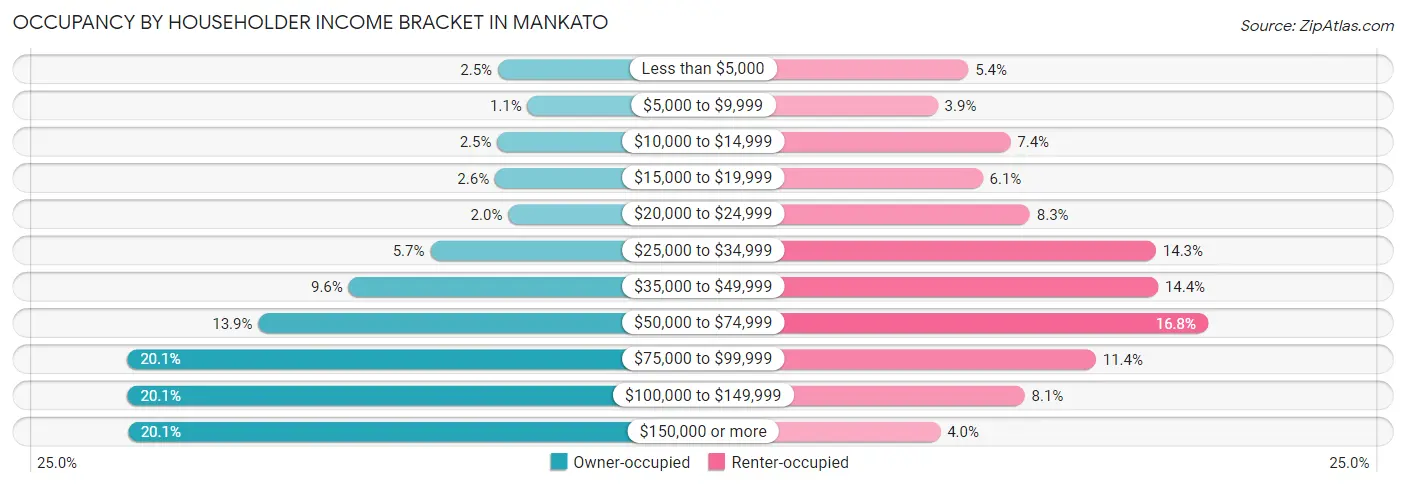
| Income Bracket | Owner-occupied | Renter-occupied |
| Less than $5,000 | 215 (2.5%) | 477 (5.4%) |
| $5,000 to $9,999 | 92 (1.1%) | 347 (3.9%) |
| $10,000 to $14,999 | 217 (2.5%) | 654 (7.4%) |
| $15,000 to $19,999 | 227 (2.6%) | 537 (6.0%) |
| $20,000 to $24,999 | 172 (2.0%) | 737 (8.3%) |
| $25,000 to $34,999 | 496 (5.7%) | 1,270 (14.3%) |
| $35,000 to $49,999 | 835 (9.6%) | 1,279 (14.4%) |
| $50,000 to $74,999 | 1,210 (13.9%) | 1,489 (16.8%) |
| $75,000 to $99,999 | 1,755 (20.1%) | 1,016 (11.4%) |
| $100,000 to $149,999 | 1,754 (20.1%) | 715 (8.1%) |
| $150,000 or more | 1,753 (20.1%) | 358 (4.0%) |
| Total | 8,726 (100.0%) | 8,879 (100.0%) |
Monthly Housing Cost Tiers in Mankato
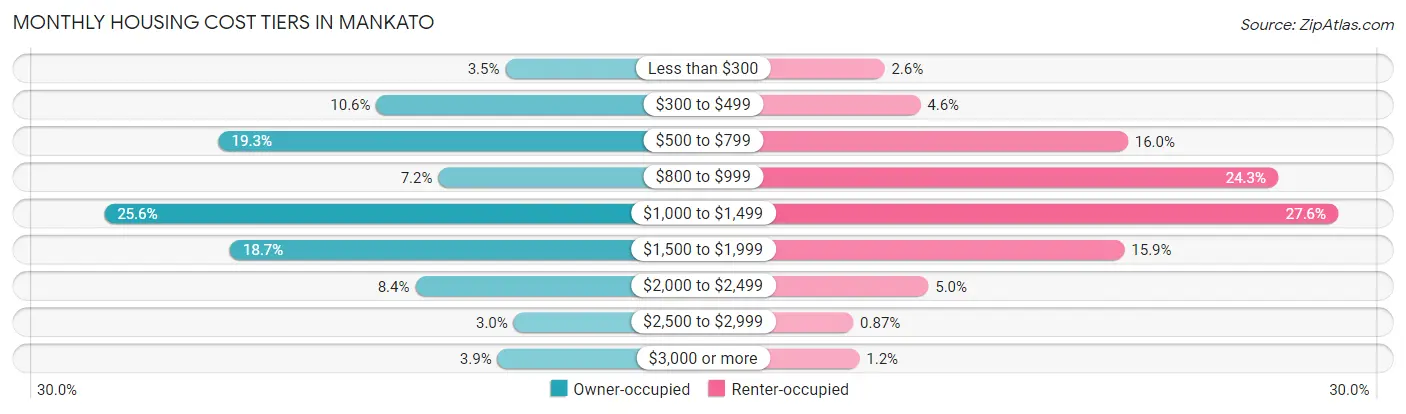
| Monthly Cost | Owner-occupied | Renter-occupied |
| Less than $300 | 301 (3.5%) | 231 (2.6%) |
| $300 to $499 | 922 (10.6%) | 407 (4.6%) |
| $500 to $799 | 1,682 (19.3%) | 1,424 (16.0%) |
| $800 to $999 | 624 (7.1%) | 2,159 (24.3%) |
| $1,000 to $1,499 | 2,234 (25.6%) | 2,454 (27.6%) |
| $1,500 to $1,999 | 1,628 (18.7%) | 1,407 (15.9%) |
| $2,000 to $2,499 | 735 (8.4%) | 446 (5.0%) |
| $2,500 to $2,999 | 261 (3.0%) | 77 (0.9%) |
| $3,000 or more | 339 (3.9%) | 107 (1.2%) |
| Total | 8,726 (100.0%) | 8,879 (100.0%) |
Physical Housing Characteristics in Mankato
Housing Structures in Mankato
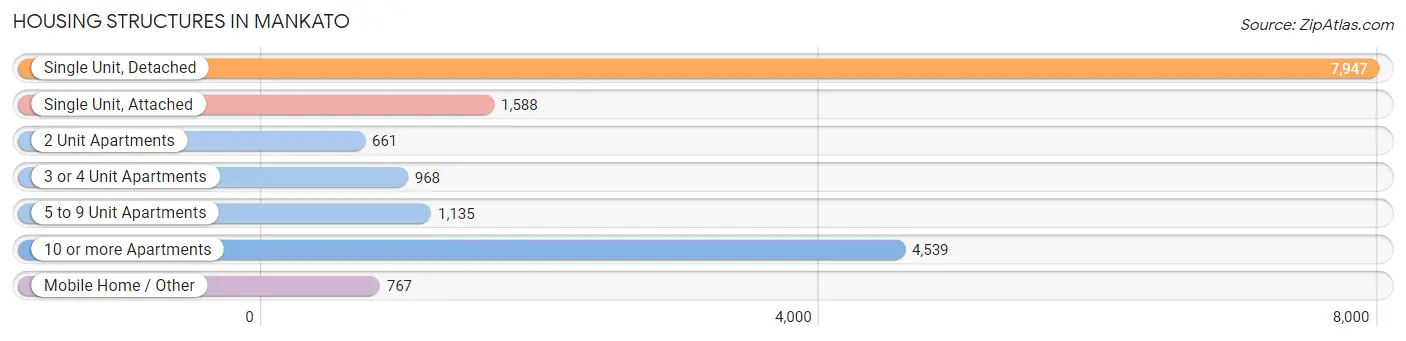
| Structure Type | # Housing Units | % Housing Units |
| Single Unit, Detached | 7,947 | 45.1% |
| Single Unit, Attached | 1,588 | 9.0% |
| 2 Unit Apartments | 661 | 3.7% |
| 3 or 4 Unit Apartments | 968 | 5.5% |
| 5 to 9 Unit Apartments | 1,135 | 6.5% |
| 10 or more Apartments | 4,539 | 25.8% |
| Mobile Home / Other | 767 | 4.4% |
| Total | 17,605 | 100.0% |
Housing Structures by Occupancy in Mankato
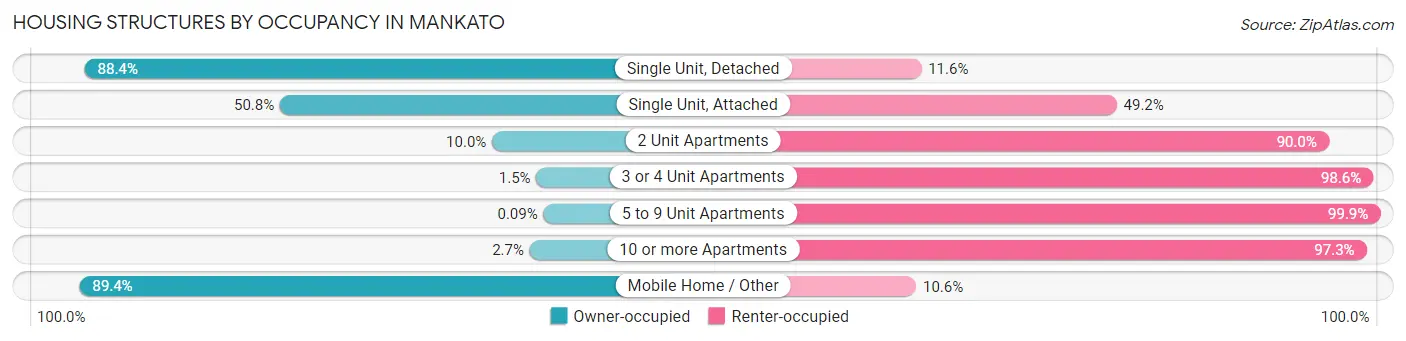
| Structure Type | Owner-occupied | Renter-occupied |
| Single Unit, Detached | 7,028 (88.4%) | 919 (11.6%) |
| Single Unit, Attached | 807 (50.8%) | 781 (49.2%) |
| 2 Unit Apartments | 66 (10.0%) | 595 (90.0%) |
| 3 or 4 Unit Apartments | 14 (1.5%) | 954 (98.6%) |
| 5 to 9 Unit Apartments | 1 (0.1%) | 1,134 (99.9%) |
| 10 or more Apartments | 124 (2.7%) | 4,415 (97.3%) |
| Mobile Home / Other | 686 (89.4%) | 81 (10.6%) |
| Total | 8,726 (49.6%) | 8,879 (50.4%) |
Housing Structures by Number of Rooms in Mankato
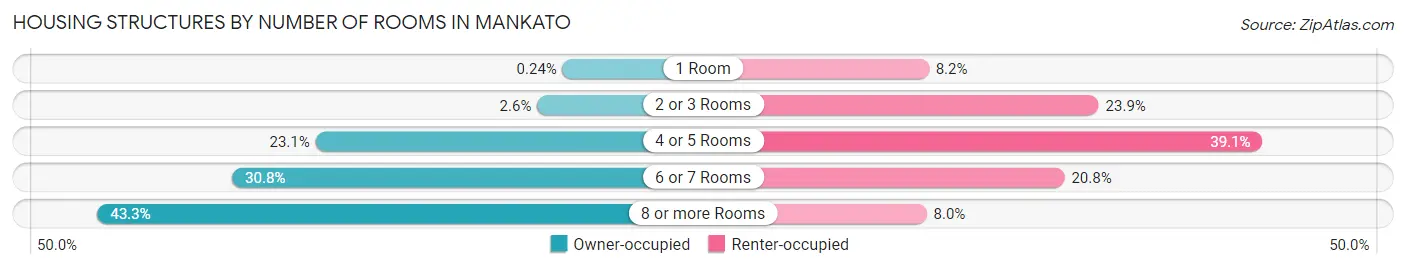
| Number of Rooms | Owner-occupied | Renter-occupied |
| 1 Room | 21 (0.2%) | 729 (8.2%) |
| 2 or 3 Rooms | 226 (2.6%) | 2,125 (23.9%) |
| 4 or 5 Rooms | 2,015 (23.1%) | 3,469 (39.1%) |
| 6 or 7 Rooms | 2,688 (30.8%) | 1,844 (20.8%) |
| 8 or more Rooms | 3,776 (43.3%) | 712 (8.0%) |
| Total | 8,726 (100.0%) | 8,879 (100.0%) |
Housing Structure by Heating Type in Mankato
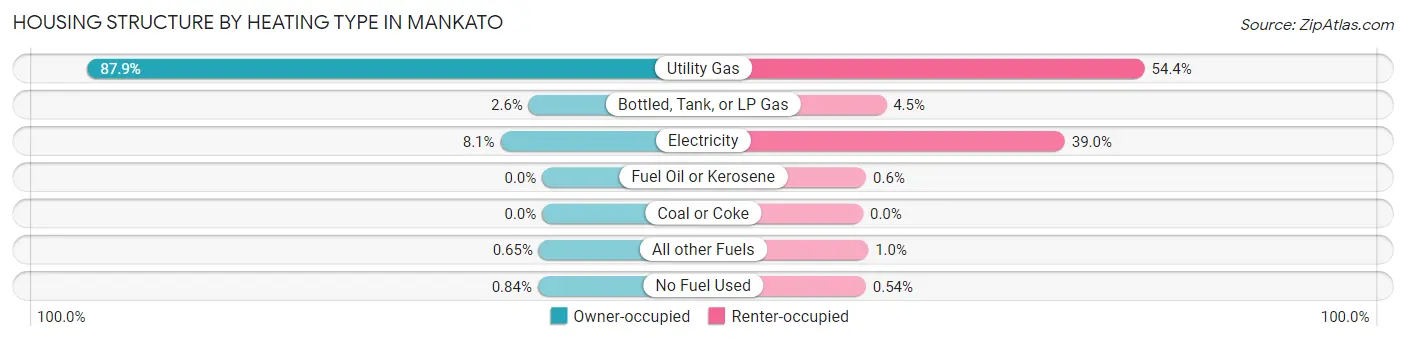
| Heating Type | Owner-occupied | Renter-occupied |
| Utility Gas | 7,667 (87.9%) | 4,831 (54.4%) |
| Bottled, Tank, or LP Gas | 226 (2.6%) | 397 (4.5%) |
| Electricity | 703 (8.1%) | 3,461 (39.0%) |
| Fuel Oil or Kerosene | 0 (0.0%) | 53 (0.6%) |
| Coal or Coke | 0 (0.0%) | 0 (0.0%) |
| All other Fuels | 57 (0.6%) | 89 (1.0%) |
| No Fuel Used | 73 (0.8%) | 48 (0.5%) |
| Total | 8,726 (100.0%) | 8,879 (100.0%) |
Household Vehicle Usage in Mankato
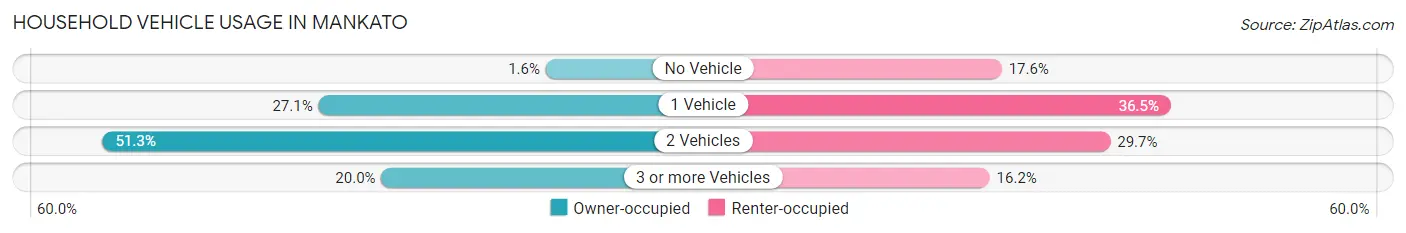
| Vehicles per Household | Owner-occupied | Renter-occupied |
| No Vehicle | 141 (1.6%) | 1,559 (17.6%) |
| 1 Vehicle | 2,363 (27.1%) | 3,241 (36.5%) |
| 2 Vehicles | 4,474 (51.3%) | 2,640 (29.7%) |
| 3 or more Vehicles | 1,748 (20.0%) | 1,439 (16.2%) |
| Total | 8,726 (100.0%) | 8,879 (100.0%) |
Real Estate & Mortgages in Mankato
Real Estate and Mortgage Overview in Mankato
| Characteristic | Without Mortgage | With Mortgage |
| Housing Units | 3,250 | 5,476 |
| Median Property Value | $217,900 | $246,000 |
| Median Household Income | $64,914 | $1,344 |
| Monthly Housing Costs | $574 | $339 |
| Real Estate Taxes | $2,246 | $85 |
Property Value by Mortgage Status in Mankato
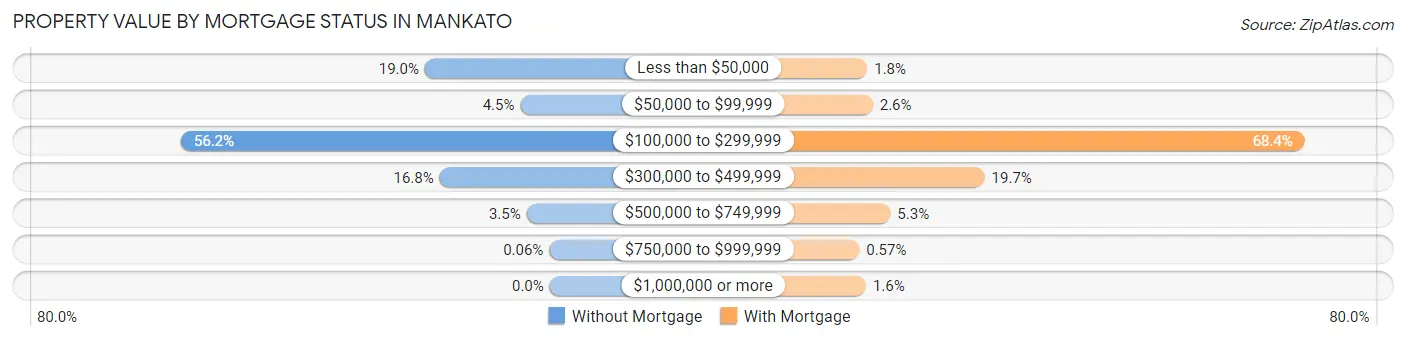
| Property Value | Without Mortgage | With Mortgage |
| Less than $50,000 | 618 (19.0%) | 98 (1.8%) |
| $50,000 to $99,999 | 145 (4.5%) | 144 (2.6%) |
| $100,000 to $299,999 | 1,826 (56.2%) | 3,748 (68.4%) |
| $300,000 to $499,999 | 545 (16.8%) | 1,077 (19.7%) |
| $500,000 to $749,999 | 114 (3.5%) | 291 (5.3%) |
| $750,000 to $999,999 | 2 (0.1%) | 31 (0.6%) |
| $1,000,000 or more | 0 (0.0%) | 87 (1.6%) |
| Total | 3,250 (100.0%) | 5,476 (100.0%) |
Household Income by Mortgage Status in Mankato
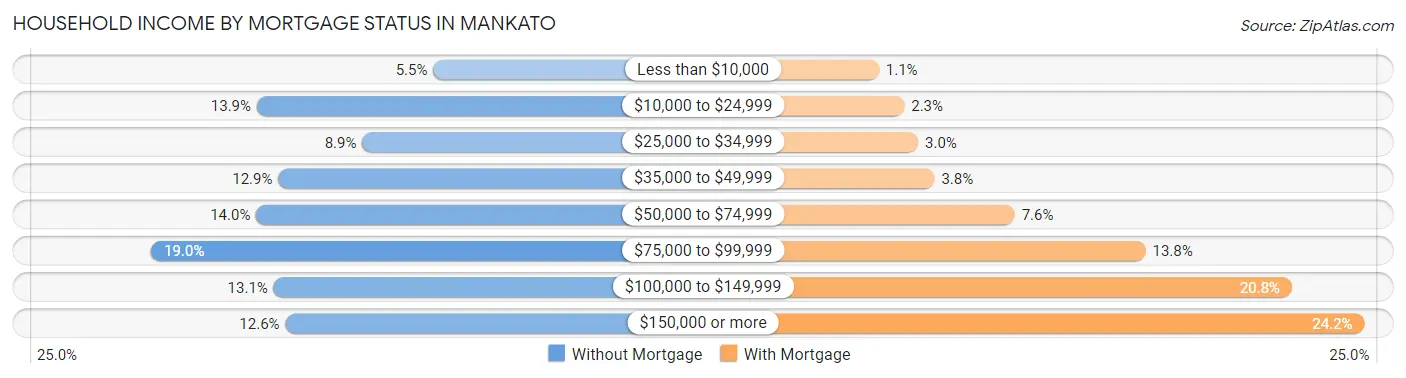
| Household Income | Without Mortgage | With Mortgage |
| Less than $10,000 | 180 (5.5%) | 61 (1.1%) |
| $10,000 to $24,999 | 453 (13.9%) | 127 (2.3%) |
| $25,000 to $34,999 | 290 (8.9%) | 163 (3.0%) |
| $35,000 to $49,999 | 420 (12.9%) | 206 (3.8%) |
| $50,000 to $74,999 | 454 (14.0%) | 415 (7.6%) |
| $75,000 to $99,999 | 617 (19.0%) | 756 (13.8%) |
| $100,000 to $149,999 | 427 (13.1%) | 1,138 (20.8%) |
| $150,000 or more | 409 (12.6%) | 1,327 (24.2%) |
| Total | 3,250 (100.0%) | 5,476 (100.0%) |
Property Value to Household Income Ratio in Mankato
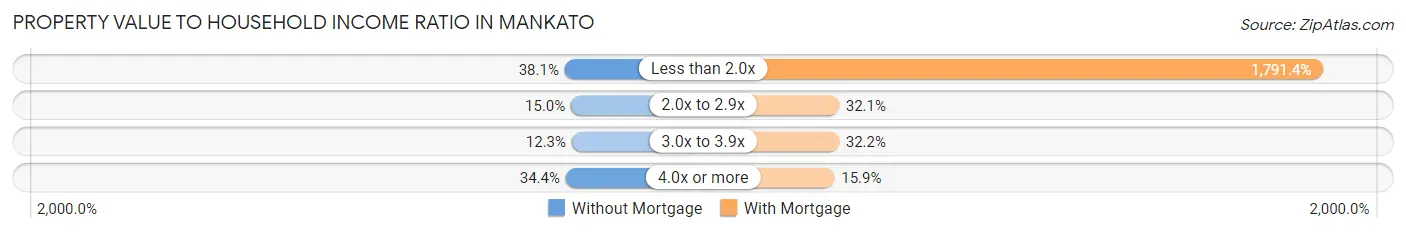
| Value-to-Income Ratio | Without Mortgage | With Mortgage |
| Less than 2.0x | 1,237 (38.1%) | 98,097 (1,791.4%) |
| 2.0x to 2.9x | 486 (14.9%) | 1,759 (32.1%) |
| 3.0x to 3.9x | 400 (12.3%) | 1,762 (32.2%) |
| 4.0x or more | 1,117 (34.4%) | 873 (15.9%) |
| Total | 3,250 (100.0%) | 5,476 (100.0%) |
Real Estate Taxes by Mortgage Status in Mankato
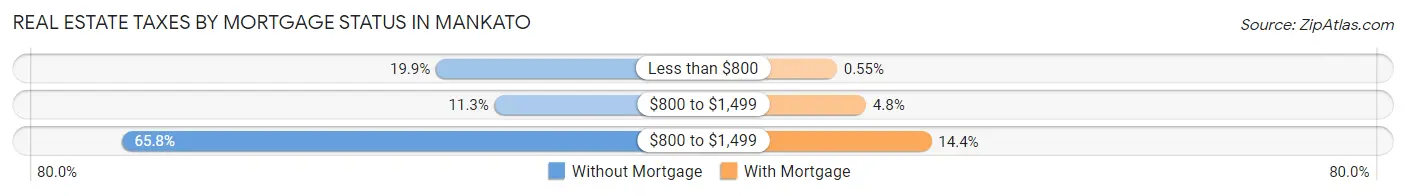
| Property Taxes | Without Mortgage | With Mortgage |
| Less than $800 | 646 (19.9%) | 30 (0.5%) |
| $800 to $1,499 | 368 (11.3%) | 263 (4.8%) |
| $800 to $1,499 | 2,139 (65.8%) | 787 (14.4%) |
| Total | 3,250 (100.0%) | 5,476 (100.0%) |
Health & Disability in Mankato
Health Insurance Coverage by Age in Mankato
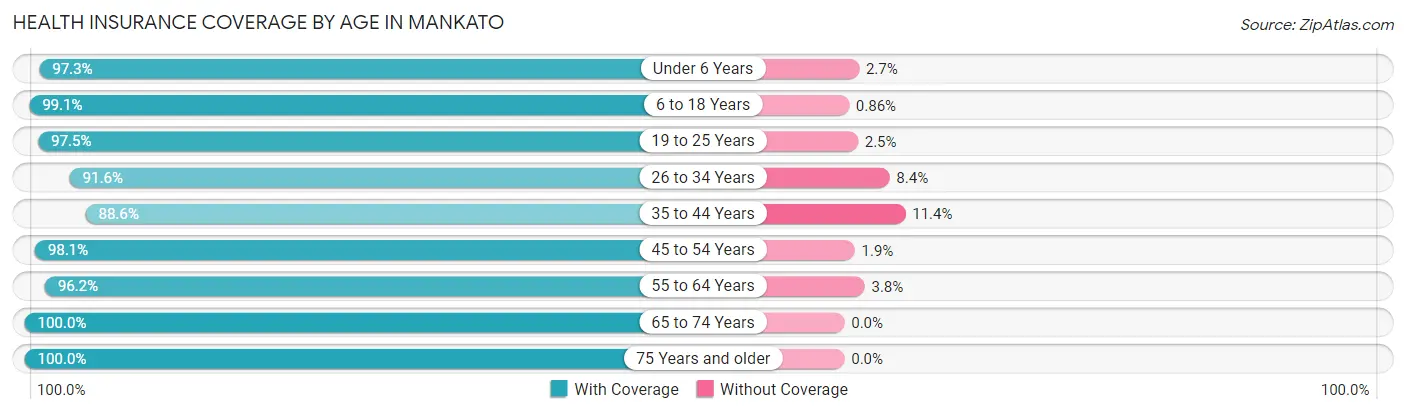
| Age Bracket | With Coverage | Without Coverage |
| Under 6 Years | 2,559 (97.3%) | 72 (2.7%) |
| 6 to 18 Years | 6,418 (99.1%) | 56 (0.9%) |
| 19 to 25 Years | 12,407 (97.5%) | 321 (2.5%) |
| 26 to 34 Years | 5,085 (91.6%) | 467 (8.4%) |
| 35 to 44 Years | 4,039 (88.6%) | 518 (11.4%) |
| 45 to 54 Years | 3,212 (98.1%) | 63 (1.9%) |
| 55 to 64 Years | 3,416 (96.2%) | 134 (3.8%) |
| 65 to 74 Years | 2,864 (100.0%) | 0 (0.0%) |
| 75 Years and older | 2,395 (100.0%) | 0 (0.0%) |
| Total | 42,395 (96.3%) | 1,631 (3.7%) |
Health Insurance Coverage by Citizenship Status in Mankato
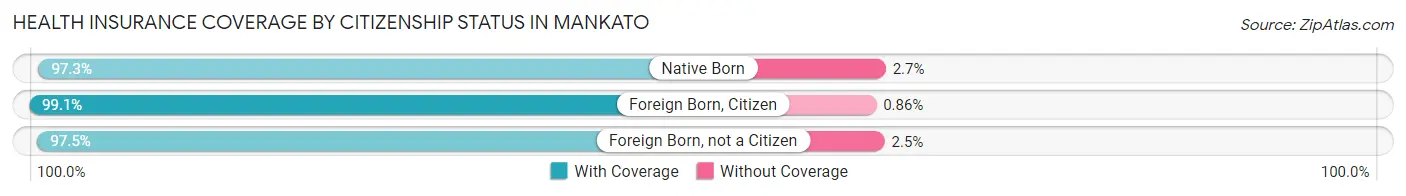
| Citizenship Status | With Coverage | Without Coverage |
| Native Born | 2,559 (97.3%) | 72 (2.7%) |
| Foreign Born, Citizen | 6,418 (99.1%) | 56 (0.9%) |
| Foreign Born, not a Citizen | 12,407 (97.5%) | 321 (2.5%) |
Health Insurance Coverage by Household Income in Mankato
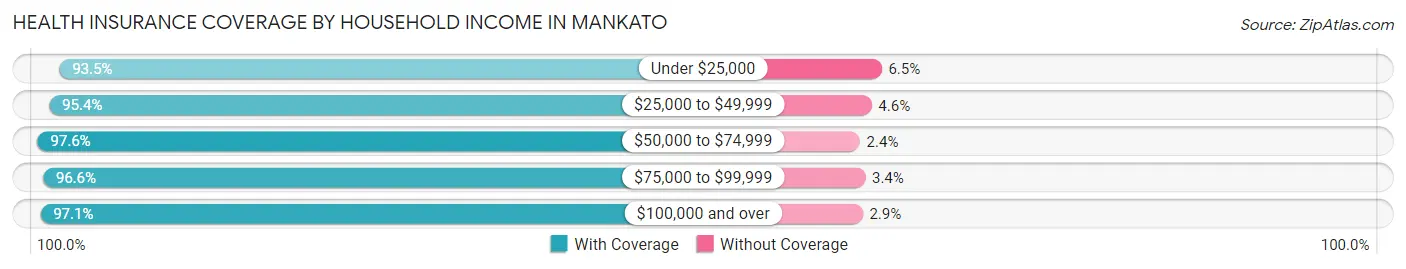
| Household Income | With Coverage | Without Coverage |
| Under $25,000 | 5,419 (93.5%) | 376 (6.5%) |
| $25,000 to $49,999 | 7,157 (95.4%) | 346 (4.6%) |
| $50,000 to $74,999 | 6,404 (97.6%) | 158 (2.4%) |
| $75,000 to $99,999 | 7,286 (96.6%) | 258 (3.4%) |
| $100,000 and over | 12,909 (97.1%) | 390 (2.9%) |
Public vs Private Health Insurance Coverage by Age in Mankato
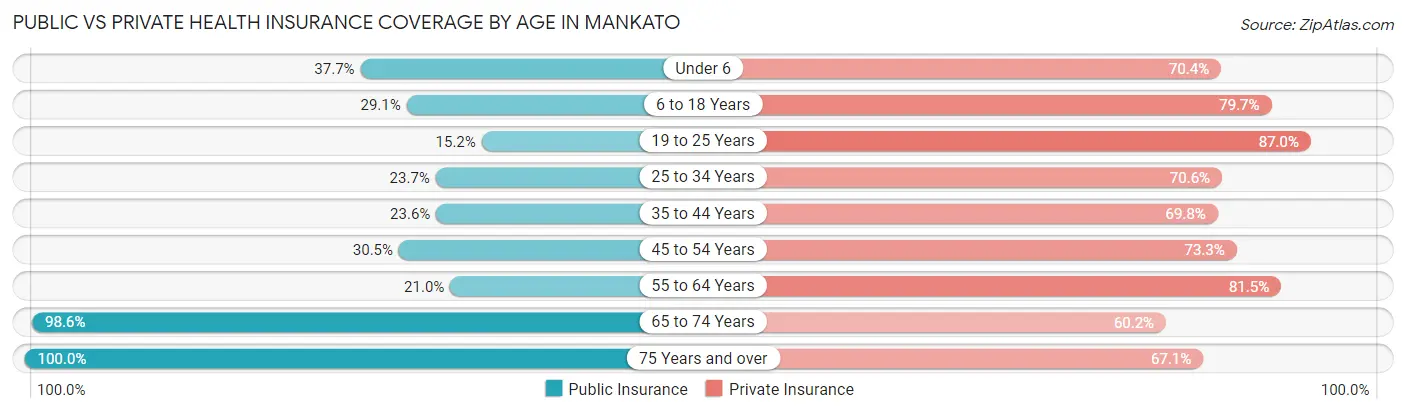
| Age Bracket | Public Insurance | Private Insurance |
| Under 6 | 991 (37.7%) | 1,852 (70.4%) |
| 6 to 18 Years | 1,884 (29.1%) | 5,162 (79.7%) |
| 19 to 25 Years | 1,931 (15.2%) | 11,079 (87.0%) |
| 25 to 34 Years | 1,316 (23.7%) | 3,917 (70.6%) |
| 35 to 44 Years | 1,076 (23.6%) | 3,179 (69.8%) |
| 45 to 54 Years | 1,000 (30.5%) | 2,400 (73.3%) |
| 55 to 64 Years | 746 (21.0%) | 2,894 (81.5%) |
| 65 to 74 Years | 2,824 (98.6%) | 1,723 (60.2%) |
| 75 Years and over | 2,395 (100.0%) | 1,606 (67.1%) |
| Total | 14,163 (32.2%) | 33,812 (76.8%) |
Disability Status by Sex by Age in Mankato
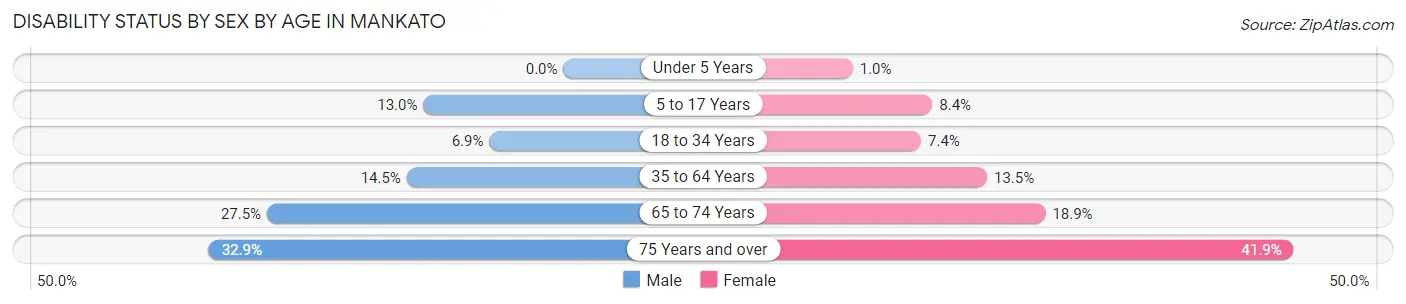
| Age Bracket | Male | Female |
| Under 5 Years | 0 (0.0%) | 11 (1.0%) |
| 5 to 17 Years | 385 (13.0%) | 197 (8.4%) |
| 18 to 34 Years | 692 (6.9%) | 721 (7.4%) |
| 35 to 64 Years | 835 (14.5%) | 760 (13.5%) |
| 65 to 74 Years | 376 (27.5%) | 283 (18.9%) |
| 75 Years and over | 311 (32.9%) | 608 (41.9%) |
Disability Class by Sex by Age in Mankato
Disability Class: Hearing Difficulty
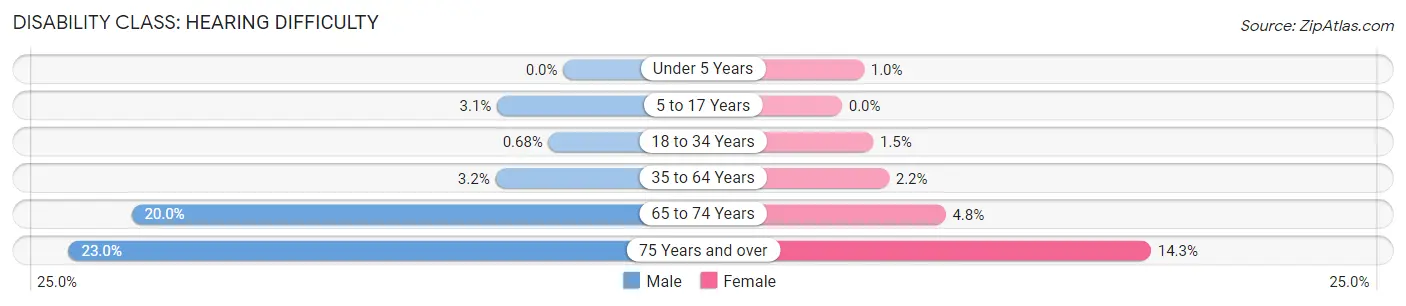
| Age Bracket | Male | Female |
| Under 5 Years | 0 (0.0%) | 11 (1.0%) |
| 5 to 17 Years | 91 (3.1%) | 0 (0.0%) |
| 18 to 34 Years | 68 (0.7%) | 142 (1.5%) |
| 35 to 64 Years | 181 (3.2%) | 123 (2.2%) |
| 65 to 74 Years | 274 (20.0%) | 72 (4.8%) |
| 75 Years and over | 217 (23.0%) | 208 (14.3%) |
Disability Class: Vision Difficulty
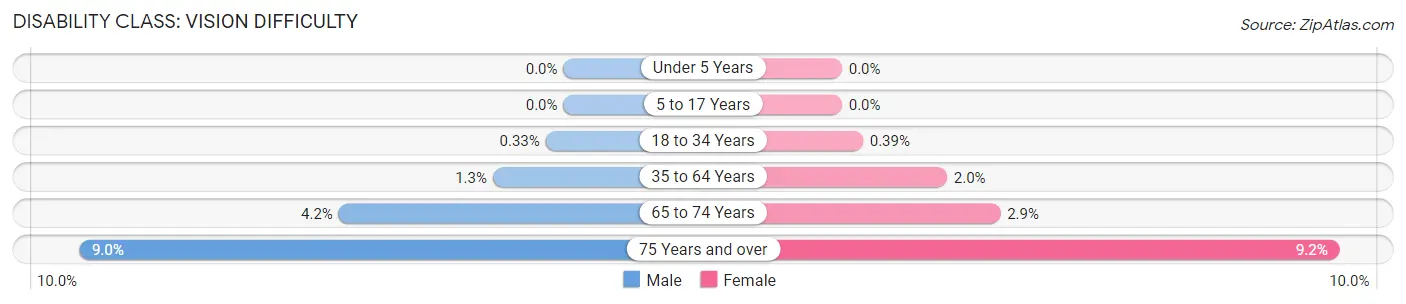
| Age Bracket | Male | Female |
| Under 5 Years | 0 (0.0%) | 0 (0.0%) |
| 5 to 17 Years | 0 (0.0%) | 0 (0.0%) |
| 18 to 34 Years | 33 (0.3%) | 38 (0.4%) |
| 35 to 64 Years | 75 (1.3%) | 110 (1.9%) |
| 65 to 74 Years | 57 (4.2%) | 44 (2.9%) |
| 75 Years and over | 85 (9.0%) | 134 (9.2%) |
Disability Class: Cognitive Difficulty
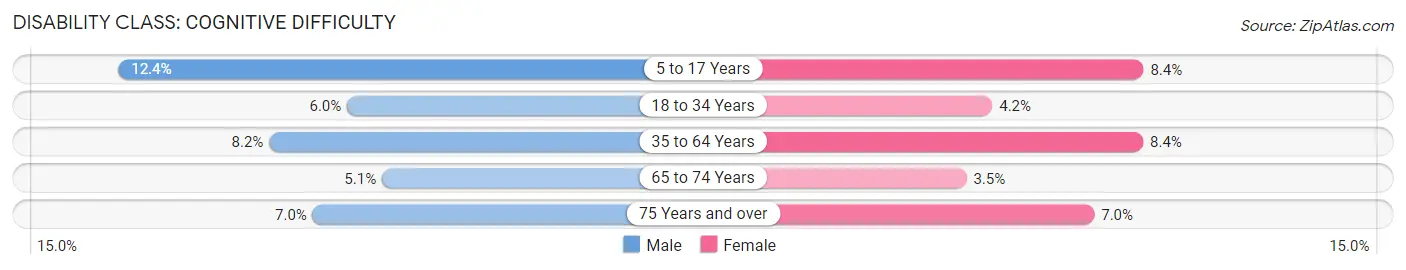
| Age Bracket | Male | Female |
| 5 to 17 Years | 367 (12.4%) | 197 (8.4%) |
| 18 to 34 Years | 606 (6.0%) | 410 (4.2%) |
| 35 to 64 Years | 470 (8.2%) | 473 (8.4%) |
| 65 to 74 Years | 69 (5.1%) | 52 (3.5%) |
| 75 Years and over | 66 (7.0%) | 102 (7.0%) |
Disability Class: Ambulatory Difficulty
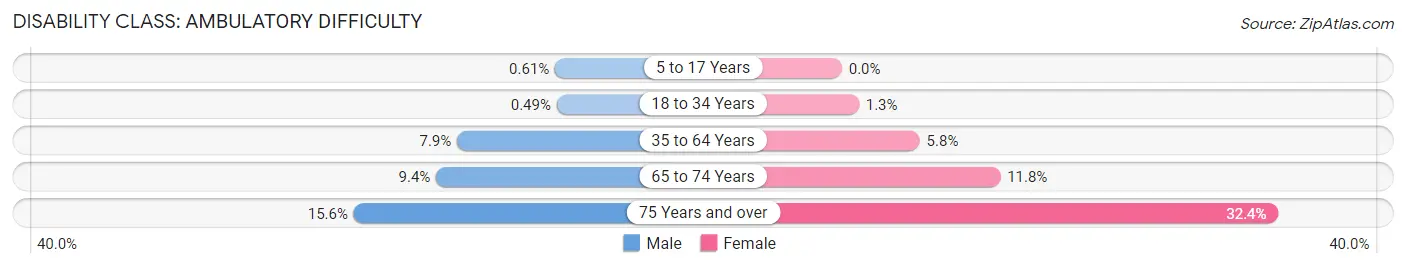
| Age Bracket | Male | Female |
| 5 to 17 Years | 18 (0.6%) | 0 (0.0%) |
| 18 to 34 Years | 49 (0.5%) | 123 (1.3%) |
| 35 to 64 Years | 453 (7.9%) | 326 (5.8%) |
| 65 to 74 Years | 129 (9.4%) | 176 (11.8%) |
| 75 Years and over | 147 (15.6%) | 470 (32.4%) |
Disability Class: Self-Care Difficulty
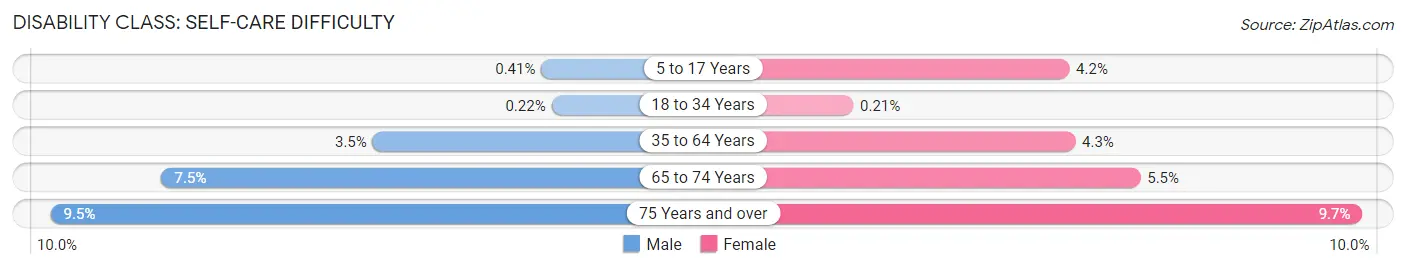
| Age Bracket | Male | Female |
| 5 to 17 Years | 12 (0.4%) | 99 (4.2%) |
| 18 to 34 Years | 22 (0.2%) | 21 (0.2%) |
| 35 to 64 Years | 203 (3.5%) | 244 (4.3%) |
| 65 to 74 Years | 102 (7.5%) | 83 (5.5%) |
| 75 Years and over | 90 (9.5%) | 140 (9.7%) |
Technology Access in Mankato
Computing Device Access in Mankato
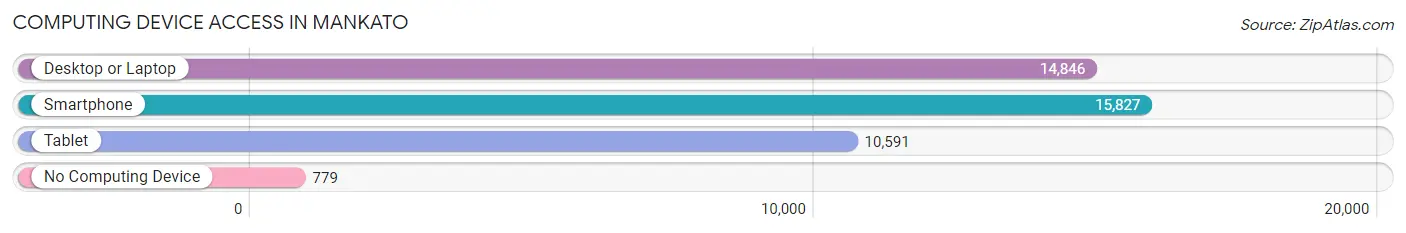
| Device Type | # Households | % Households |
| Desktop or Laptop | 14,846 | 84.3% |
| Smartphone | 15,827 | 89.9% |
| Tablet | 10,591 | 60.2% |
| No Computing Device | 779 | 4.4% |
| Total | 17,605 | 100.0% |
Internet Access in Mankato
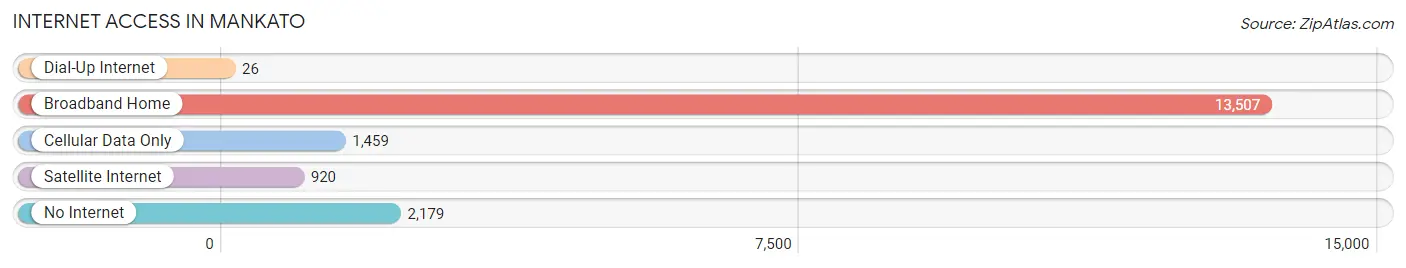
| Internet Type | # Households | % Households |
| Dial-Up Internet | 26 | 0.2% |
| Broadband Home | 13,507 | 76.7% |
| Cellular Data Only | 1,459 | 8.3% |
| Satellite Internet | 920 | 5.2% |
| No Internet | 2,179 | 12.4% |
| Total | 17,605 | 100.0% |
Mankato Summary
Mankato, Minnesota is a city located in Blue Earth County in the south-central part of the state. It is the county seat and the largest city in the county. The city is situated along the Minnesota River and is the principal city of the Mankato-North Mankato metropolitan area, which includes all of Blue Earth and Nicollet counties. As of the 2010 census, the city had a population of 41,044, making it the fifth-largest city in Minnesota outside of the Minneapolis-St. Paul metropolitan area.
History
The area around Mankato was first settled by European Americans in 1852. The city was named after the Dakota Sioux word for “blue earth”, referring to the clay-rich soil found in the area. The city was officially incorporated in 1858.
In the late 19th century, Mankato was a major center for the agricultural industry, with several grain mills and a large stockyard. The city was also a major railroad hub, with several lines running through the city.
In the early 20th century, Mankato was a major center for the manufacturing industry, with several factories producing a variety of products, including furniture, clothing, and food products. The city was also home to several large companies, including the Mankato Brewing Company, the Mankato Free Press, and the Mankato State University.
Geography
Mankato is located in south-central Minnesota, in Blue Earth County. The city is situated along the Minnesota River, and is surrounded by rolling hills and farmland. The city has a total area of 16.2 square miles, of which 15.9 square miles is land and 0.3 square miles is water.
Economy
Mankato’s economy is largely based on the service industry, with healthcare, education, and retail being the largest sectors. The city is also home to several large employers, including Mayo Clinic Health System, Mankato Clinic, and Mankato State University.
The city is also home to several large manufacturing companies, including 3M, Ecolab, and Taylor Corporation. The city is also home to several large agricultural companies, including Cargill, Land O’Lakes, and CHS.
Demographics
As of the 2010 census, the city had a population of 41,044, with a population density of 2,521.7 people per square mile. The racial makeup of the city was 87.2% White, 5.3% African American, 0.7% Native American, 2.2% Asian, 0.1% Pacific Islander, 2.3% from other races, and 2.3% from two or more races. Hispanic or Latino of any race were 5.3% of the population.
The median income for a household in the city was $45,945, and the median income for a family was $56,945. The per capita income for the city was $23,845. About 8.2% of families and 11.3% of the population were below the poverty line, including 15.2% of those under age 18 and 6.7% of those age 65 or over.
Common Questions
What is Per Capita Income in Mankato?
Per Capita income in Mankato is $31,757.
What is the Median Family Income in Mankato?
Median Family Income in Mankato is $85,047.
What is the Median Household income in Mankato?
Median Household Income in Mankato is $61,726.
What is Income or Wage Gap in Mankato?
Income or Wage Gap in Mankato is 33.5%.
Women in Mankato earn 66.5 cents for every dollar earned by a man.
What is Family Income Deficit in Mankato?
Family Income Deficit in Mankato is $7,513.
Families that are below poverty line in Mankato earn $7,513 less on average than the poverty threshold level.
What is Inequality or Gini Index in Mankato?
Inequality or Gini Index in Mankato is 0.45.
What is the Total Population of Mankato?
Total Population of Mankato is 44,444.
What is the Total Male Population of Mankato?
Total Male Population of Mankato is 22,388.
What is the Total Female Population of Mankato?
Total Female Population of Mankato is 22,056.
What is the Ratio of Males per 100 Females in Mankato?
There are 101.51 Males per 100 Females in Mankato.
What is the Ratio of Females per 100 Males in Mankato?
There are 98.52 Females per 100 Males in Mankato.
What is the Median Population Age in Mankato?
Median Population Age in Mankato is 26.5 Years.
What is the Average Family Size in Mankato
Average Family Size in Mankato is 2.9 People.
What is the Average Household Size in Mankato
Average Household Size in Mankato is 2.3 People.
How Large is the Labor Force in Mankato?
There are 26,894 People in the Labor Forcein in Mankato.
What is the Percentage of People in the Labor Force in Mankato?
71.2% of People are in the Labor Force in Mankato.
What is the Unemployment Rate in Mankato?
Unemployment Rate in Mankato is 4.2%.