Brooklyn Park, MN Map & Demographics
Brooklyn Park Map
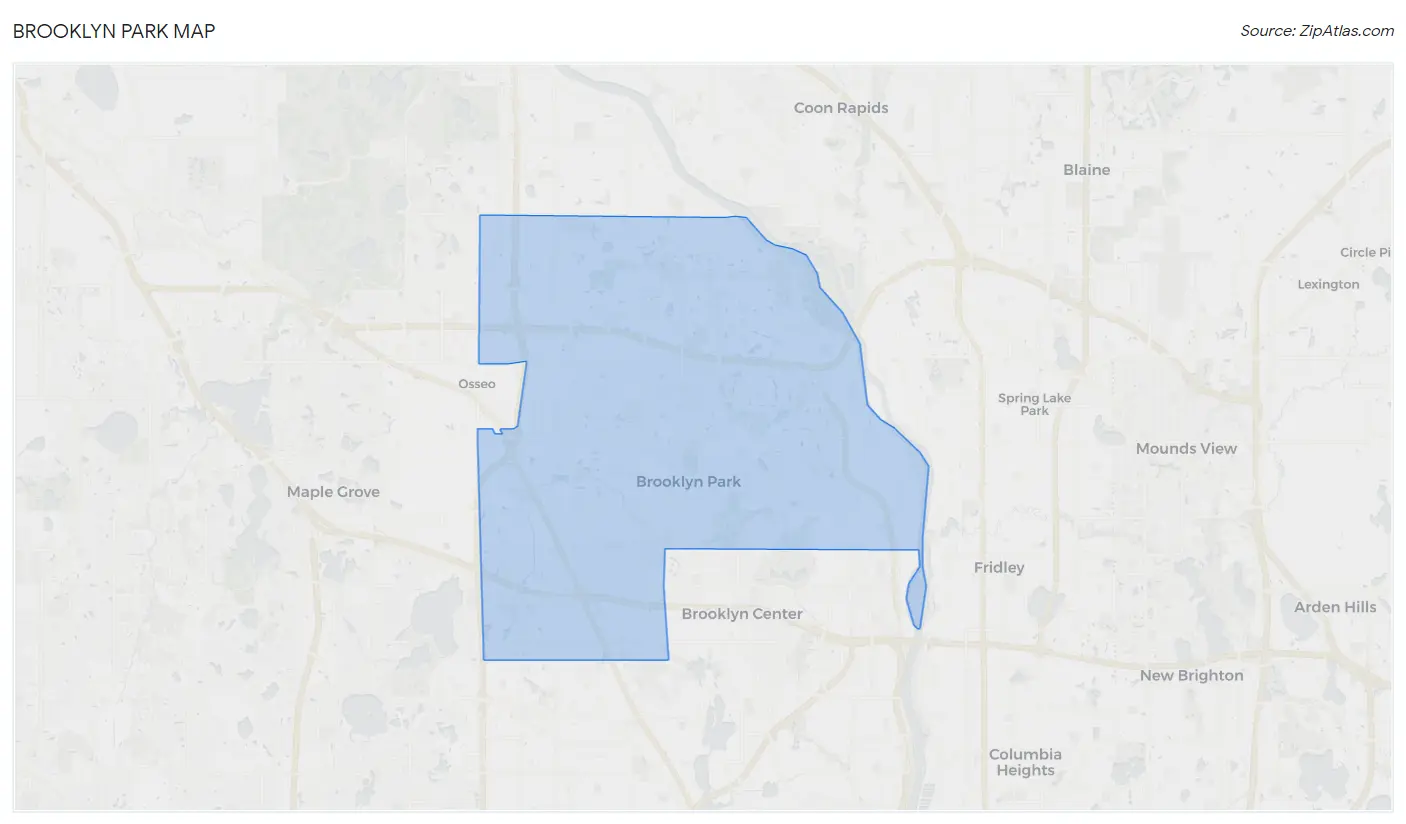
Brooklyn Park Overview
$36,531
PER CAPITA INCOME
$100,242
AVG FAMILY INCOME
$82,271
AVG HOUSEHOLD INCOME
17.2%
WAGE / INCOME GAP [ % ]
82.8¢/ $1
WAGE / INCOME GAP [ $ ]
$8,532
FAMILY INCOME DEFICIT
0.41
INEQUALITY / GINI INDEX
84,951
TOTAL POPULATION
41,780
MALE POPULATION
43,171
FEMALE POPULATION
96.78
MALES / 100 FEMALES
103.33
FEMALES / 100 MALES
35.2
MEDIAN AGE
3.4
AVG FAMILY SIZE
2.9
AVG HOUSEHOLD SIZE
47,495
LABOR FORCE [ PEOPLE ]
73.3%
PERCENT IN LABOR FORCE
3.7%
UNEMPLOYMENT RATE
Income in Brooklyn Park
Income Overview in Brooklyn Park
Per Capita Income in Brooklyn Park is $36,531, while median incomes of families and households are $100,242 and $82,271 respectively.
| Characteristic | Number | Measure |
| Per Capita Income | 84,951 | $36,531 |
| Median Family Income | 21,087 | $100,242 |
| Mean Family Income | 21,087 | $119,095 |
| Median Household Income | 29,603 | $82,271 |
| Mean Household Income | 29,603 | $103,817 |
| Income Deficit | 21,087 | $8,532 |
| Wage / Income Gap (%) | 84,951 | 17.16% |
| Wage / Income Gap ($) | 84,951 | 82.84¢ per $1 |
| Gini / Inequality Index | 84,951 | 0.41 |
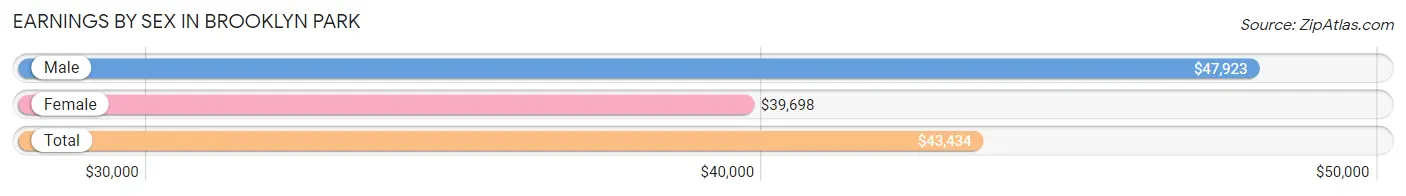
Earnings by Sex in Brooklyn Park
Average Earnings in Brooklyn Park are $43,434, $47,923 for men and $39,698 for women, a difference of 17.2%.
| Sex | Number | Average Earnings |
| Male | 24,282 (49.6%) | $47,923 |
| Female | 24,645 (50.4%) | $39,698 |
| Total | 48,927 (100.0%) | $43,434 |
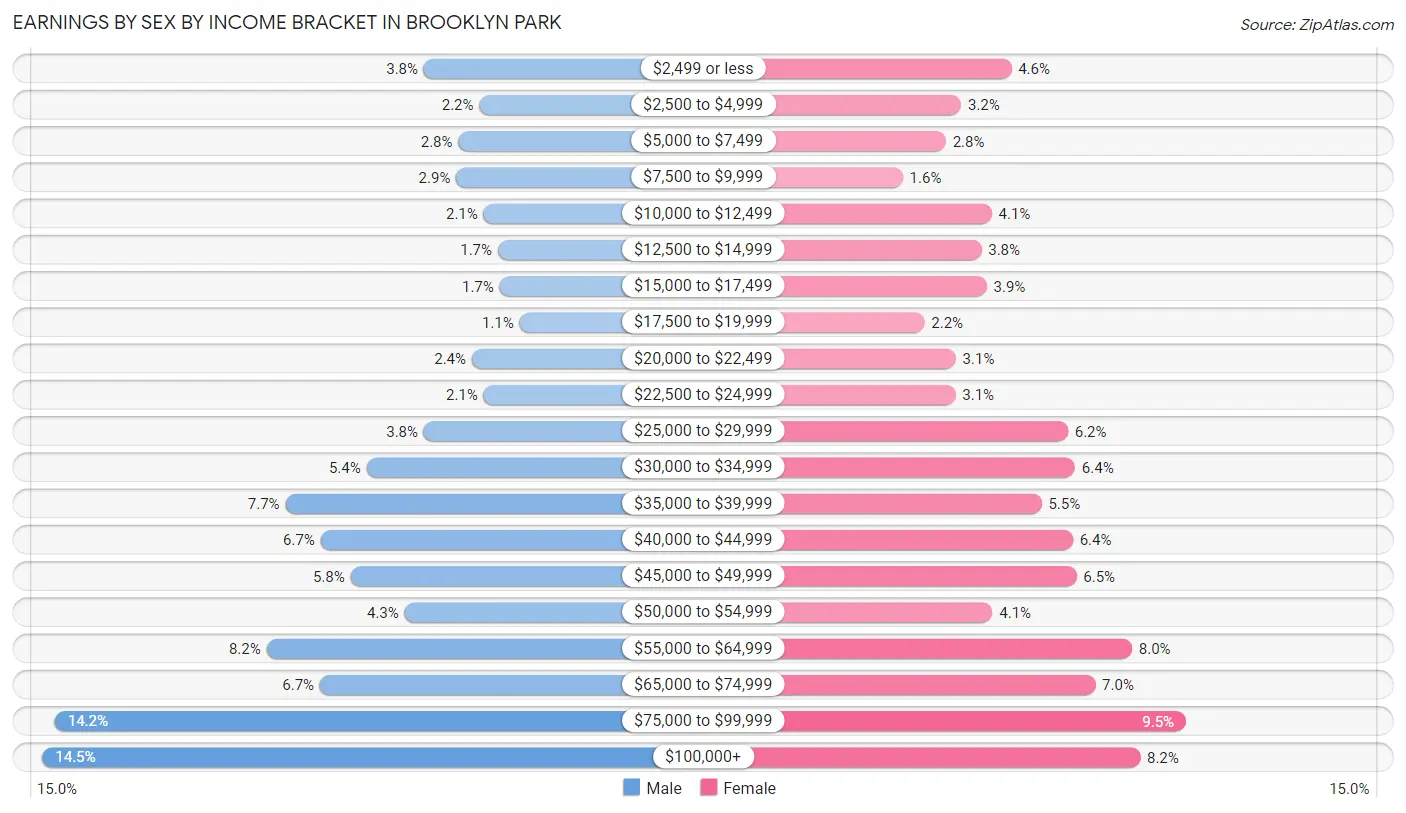
Earnings by Sex by Income Bracket in Brooklyn Park
The most common earnings brackets in Brooklyn Park are $100,000+ for men (3,521 | 14.5%) and $75,000 to $99,999 for women (2,349 | 9.5%).
| Income | Male | Female |
| $2,499 or less | 919 (3.8%) | 1,139 (4.6%) |
| $2,500 to $4,999 | 540 (2.2%) | 792 (3.2%) |
| $5,000 to $7,499 | 682 (2.8%) | 684 (2.8%) |
| $7,500 to $9,999 | 698 (2.9%) | 387 (1.6%) |
| $10,000 to $12,499 | 511 (2.1%) | 1,004 (4.1%) |
| $12,500 to $14,999 | 413 (1.7%) | 931 (3.8%) |
| $15,000 to $17,499 | 400 (1.7%) | 968 (3.9%) |
| $17,500 to $19,999 | 264 (1.1%) | 537 (2.2%) |
| $20,000 to $22,499 | 589 (2.4%) | 754 (3.1%) |
| $22,500 to $24,999 | 510 (2.1%) | 752 (3.0%) |
| $25,000 to $29,999 | 919 (3.8%) | 1,531 (6.2%) |
| $30,000 to $34,999 | 1,308 (5.4%) | 1,579 (6.4%) |
| $35,000 to $39,999 | 1,862 (7.7%) | 1,349 (5.5%) |
| $40,000 to $44,999 | 1,623 (6.7%) | 1,566 (6.4%) |
| $45,000 to $49,999 | 1,419 (5.8%) | 1,590 (6.5%) |
| $50,000 to $54,999 | 1,050 (4.3%) | 1,007 (4.1%) |
| $55,000 to $64,999 | 1,990 (8.2%) | 1,974 (8.0%) |
| $65,000 to $74,999 | 1,627 (6.7%) | 1,721 (7.0%) |
| $75,000 to $99,999 | 3,437 (14.1%) | 2,349 (9.5%) |
| $100,000+ | 3,521 (14.5%) | 2,031 (8.2%) |
| Total | 24,282 (100.0%) | 24,645 (100.0%) |
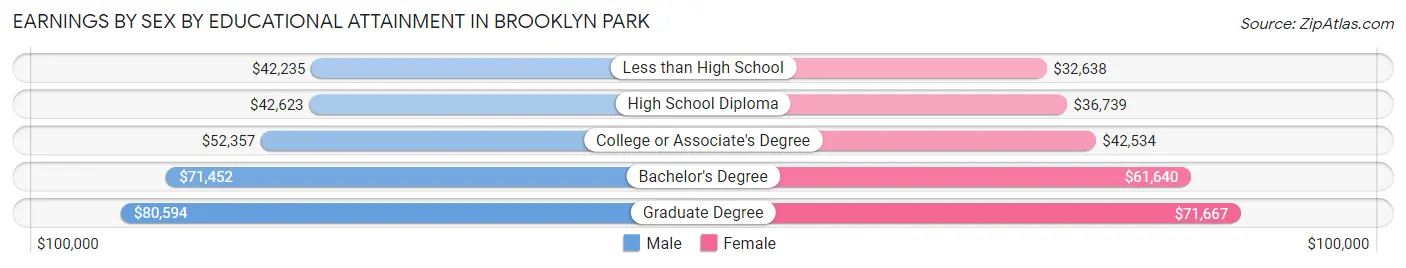
Earnings by Sex by Educational Attainment in Brooklyn Park
Average earnings in Brooklyn Park are $54,995 for men and $45,643 for women, a difference of 17.0%. Men with an educational attainment of graduate degree enjoy the highest average annual earnings of $80,594, while those with less than high school education earn the least with $42,235. Women with an educational attainment of graduate degree earn the most with the average annual earnings of $71,667, while those with less than high school education have the smallest earnings of $32,638.
| Educational Attainment | Male Income | Female Income |
| Less than High School | $42,235 | $32,638 |
| High School Diploma | $42,623 | $36,739 |
| College or Associate's Degree | $52,357 | $42,534 |
| Bachelor's Degree | $71,452 | $61,640 |
| Graduate Degree | $80,594 | $71,667 |
| Total | $54,995 | $45,643 |
Family Income in Brooklyn Park
Family Income Brackets in Brooklyn Park
According to the Brooklyn Park family income data, there are 4,892 families falling into the $100,000 to $149,999 income range, which is the most common income bracket and makes up 23.2% of all families. Conversely, the less than $10,000 income bracket is the least frequent group with only 274 families (1.3%) belonging to this category.
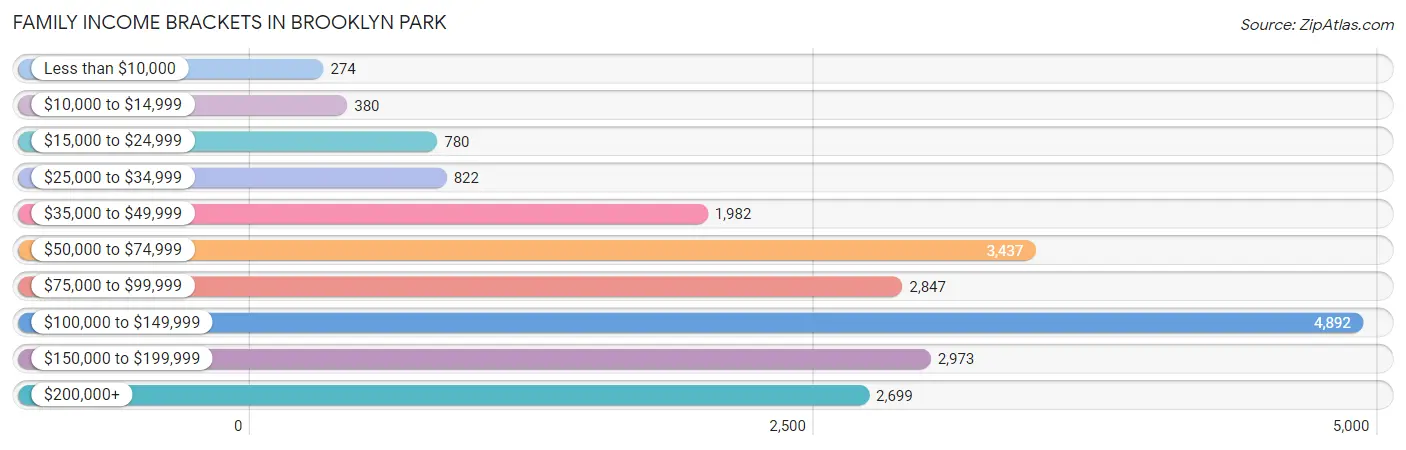
| Income Bracket | # Families | % Families |
| Less than $10,000 | 274 | 1.3% |
| $10,000 to $14,999 | 380 | 1.8% |
| $15,000 to $24,999 | 780 | 3.7% |
| $25,000 to $34,999 | 822 | 3.9% |
| $35,000 to $49,999 | 1,982 | 9.4% |
| $50,000 to $74,999 | 3,437 | 16.3% |
| $75,000 to $99,999 | 2,847 | 13.5% |
| $100,000 to $149,999 | 4,892 | 23.2% |
| $150,000 to $199,999 | 2,973 | 14.1% |
| $200,000+ | 2,699 | 12.8% |
Family Income by Famaliy Size in Brooklyn Park
7+ person families (1,021 | 4.8%) account for the highest median family income in Brooklyn Park with $127,188 per family, while 2-person families (8,453 | 40.1%) have the highest median income of $40,738 per family member.
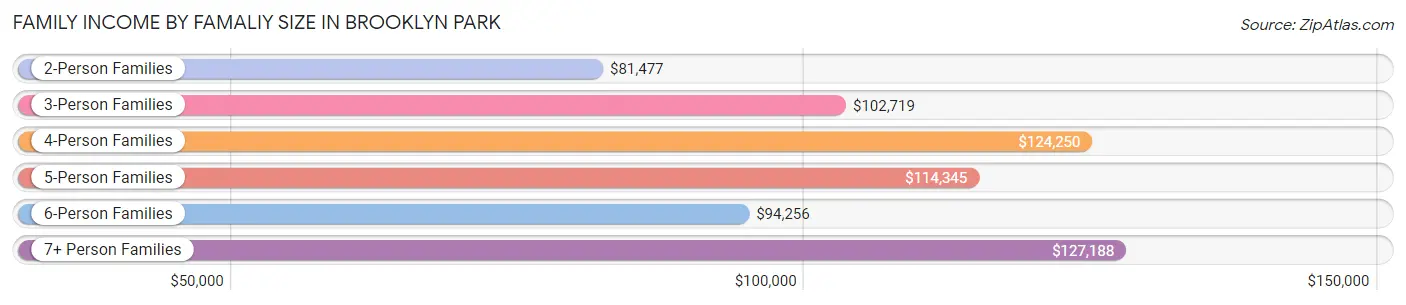
| Income Bracket | # Families | Median Income |
| 2-Person Families | 8,453 (40.1%) | $81,477 |
| 3-Person Families | 4,622 (21.9%) | $102,719 |
| 4-Person Families | 3,649 (17.3%) | $124,250 |
| 5-Person Families | 2,317 (11.0%) | $114,345 |
| 6-Person Families | 1,025 (4.9%) | $94,256 |
| 7+ Person Families | 1,021 (4.8%) | $127,188 |
| Total | 21,087 (100.0%) | $100,242 |
Family Income by Number of Earners in Brooklyn Park
The median family income in Brooklyn Park is $100,242, with families comprising 3+ earners (4,548) having the highest median family income of $140,952, while families with 1 earner (5,670) have the lowest median family income of $53,739, accounting for 21.6% and 26.9% of families, respectively.
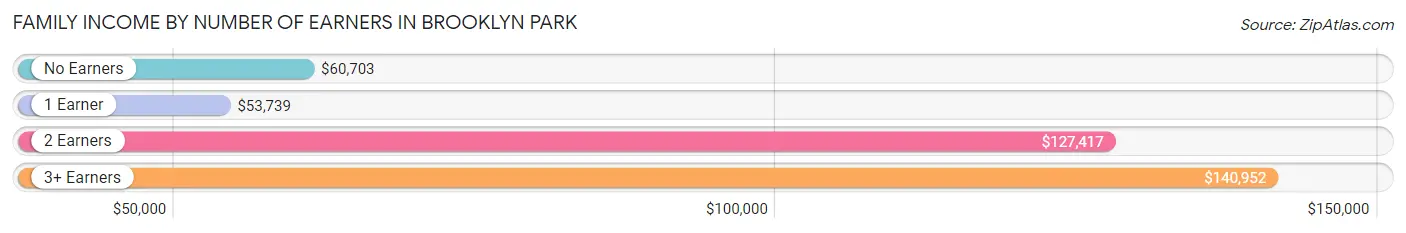
| Number of Earners | # Families | Median Income |
| No Earners | 1,970 (9.3%) | $60,703 |
| 1 Earner | 5,670 (26.9%) | $53,739 |
| 2 Earners | 8,899 (42.2%) | $127,417 |
| 3+ Earners | 4,548 (21.6%) | $140,952 |
| Total | 21,087 (100.0%) | $100,242 |
Household Income in Brooklyn Park
Household Income Brackets in Brooklyn Park
With 5,861 households falling in the category, the $100,000 to $149,999 income range is the most frequent in Brooklyn Park, accounting for 19.8% of all households. In contrast, only 770 households (2.6%) fall into the less than $10,000 income bracket, making it the least populous group.
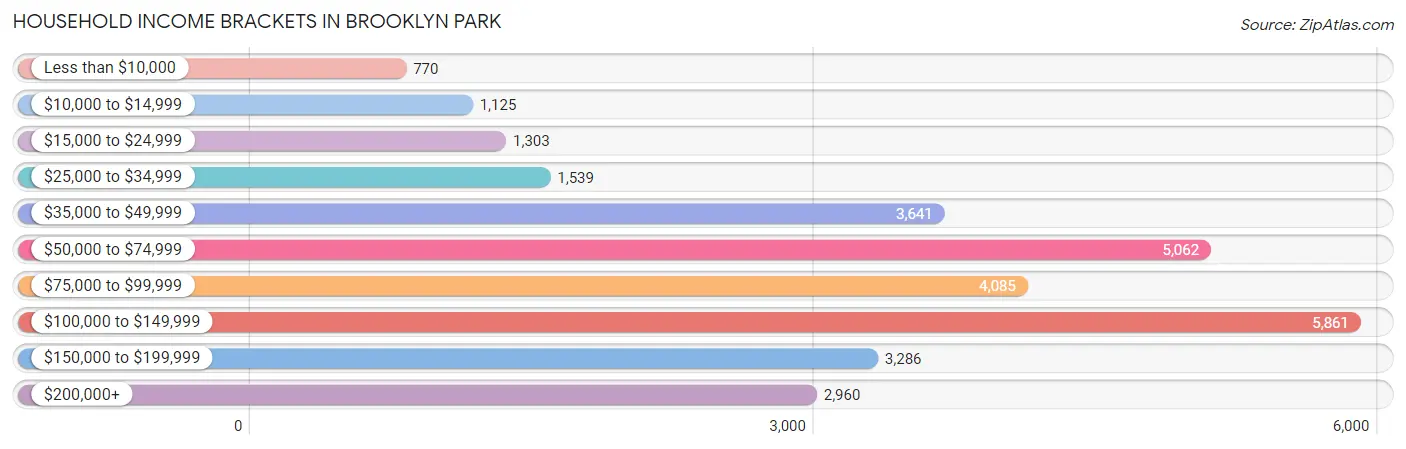
| Income Bracket | # Households | % Households |
| Less than $10,000 | 770 | 2.6% |
| $10,000 to $14,999 | 1,125 | 3.8% |
| $15,000 to $24,999 | 1,303 | 4.4% |
| $25,000 to $34,999 | 1,539 | 5.2% |
| $35,000 to $49,999 | 3,641 | 12.3% |
| $50,000 to $74,999 | 5,062 | 17.1% |
| $75,000 to $99,999 | 4,085 | 13.8% |
| $100,000 to $149,999 | 5,861 | 19.8% |
| $150,000 to $199,999 | 3,286 | 11.1% |
| $200,000+ | 2,960 | 10.0% |
Household Income by Householder Age in Brooklyn Park
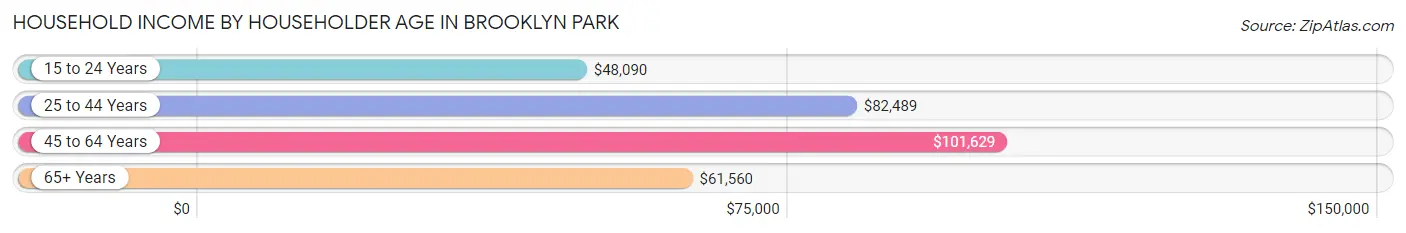
The median household income in Brooklyn Park is $82,271, with the highest median household income of $101,629 found in the 45 to 64 years age bracket for the primary householder. A total of 10,880 households (36.7%) fall into this category. Meanwhile, the 15 to 24 years age bracket for the primary householder has the lowest median household income of $48,090, with 1,052 households (3.5%) in this group.
| Income Bracket | # Households | Median Income |
| 15 to 24 Years | 1,052 (3.5%) | $48,090 |
| 25 to 44 Years | 12,082 (40.8%) | $82,489 |
| 45 to 64 Years | 10,880 (36.7%) | $101,629 |
| 65+ Years | 5,589 (18.9%) | $61,560 |
| Total | 29,603 (100.0%) | $82,271 |
Poverty in Brooklyn Park
Income Below Poverty by Sex and Age in Brooklyn Park
With 8.8% poverty level for males and 8.9% for females among the residents of Brooklyn Park, 5 year old males and 25 to 34 year old females are the most vulnerable to poverty, with 216 males (21.9%) and 872 females (14.5%) in their respective age groups living below the poverty level.
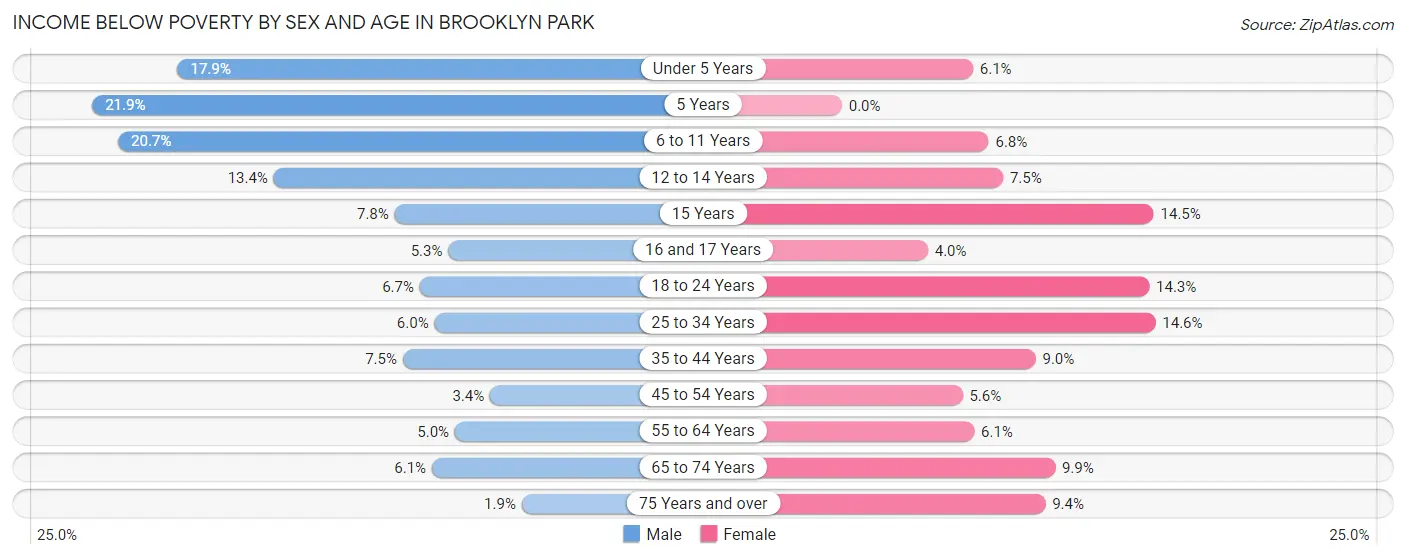
| Age Bracket | Male | Female |
| Under 5 Years | 596 (17.9%) | 177 (6.1%) |
| 5 Years | 216 (21.9%) | 0 (0.0%) |
| 6 to 11 Years | 883 (20.7%) | 233 (6.8%) |
| 12 to 14 Years | 226 (13.4%) | 152 (7.5%) |
| 15 Years | 35 (7.8%) | 78 (14.5%) |
| 16 and 17 Years | 76 (5.3%) | 59 (4.0%) |
| 18 to 24 Years | 223 (6.7%) | 517 (14.3%) |
| 25 to 34 Years | 368 (6.0%) | 872 (14.5%) |
| 35 to 44 Years | 447 (7.4%) | 581 (9.0%) |
| 45 to 54 Years | 179 (3.4%) | 304 (5.6%) |
| 55 to 64 Years | 219 (5.0%) | 314 (6.1%) |
| 65 to 74 Years | 178 (6.1%) | 333 (9.9%) |
| 75 Years and over | 28 (1.9%) | 222 (9.4%) |
| Total | 3,674 (8.8%) | 3,842 (8.9%) |
Income Above Poverty by Sex and Age in Brooklyn Park
According to the poverty statistics in Brooklyn Park, males aged 75 years and over and females aged 5 years are the age groups that are most secure financially, with 98.1% of males and 100.0% of females in these age groups living above the poverty line.
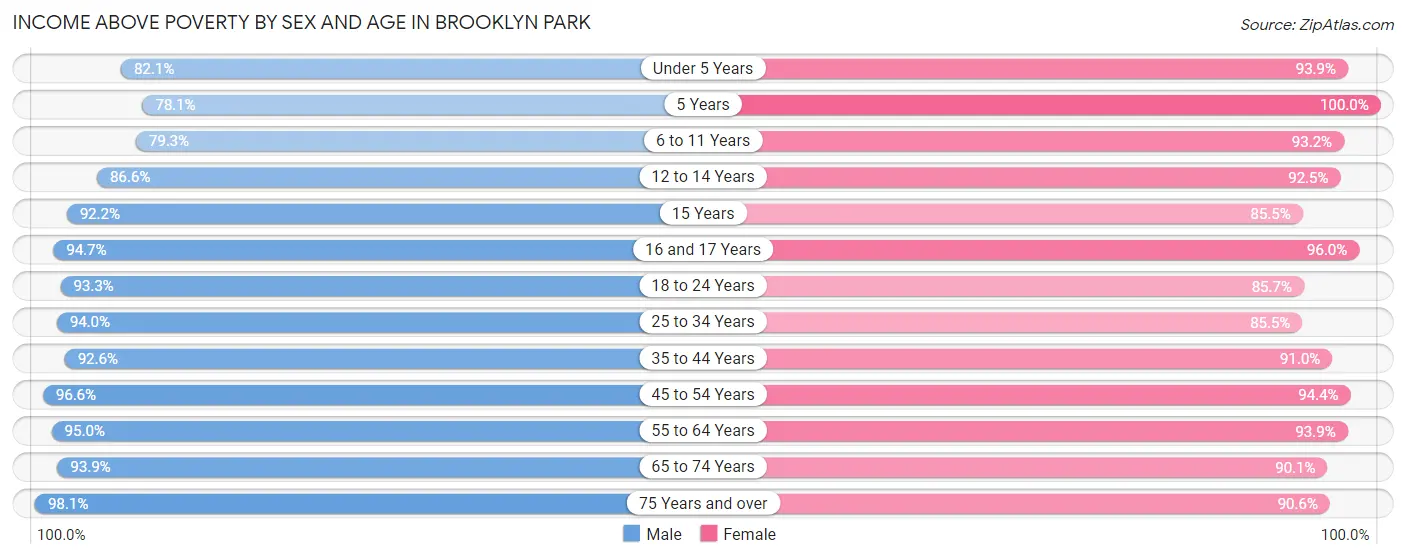
| Age Bracket | Male | Female |
| Under 5 Years | 2,733 (82.1%) | 2,736 (93.9%) |
| 5 Years | 772 (78.1%) | 340 (100.0%) |
| 6 to 11 Years | 3,390 (79.3%) | 3,187 (93.2%) |
| 12 to 14 Years | 1,455 (86.6%) | 1,879 (92.5%) |
| 15 Years | 412 (92.2%) | 461 (85.5%) |
| 16 and 17 Years | 1,347 (94.7%) | 1,420 (96.0%) |
| 18 to 24 Years | 3,123 (93.3%) | 3,108 (85.7%) |
| 25 to 34 Years | 5,786 (94.0%) | 5,122 (85.5%) |
| 35 to 44 Years | 5,551 (92.5%) | 5,885 (91.0%) |
| 45 to 54 Years | 5,087 (96.6%) | 5,121 (94.4%) |
| 55 to 64 Years | 4,134 (95.0%) | 4,796 (93.9%) |
| 65 to 74 Years | 2,741 (93.9%) | 3,033 (90.1%) |
| 75 Years and over | 1,422 (98.1%) | 2,129 (90.6%) |
| Total | 37,953 (91.2%) | 39,217 (91.1%) |
Income Below Poverty Among Married-Couple Families in Brooklyn Park
The poverty statistics for married-couple families in Brooklyn Park show that 2.2% or 301 of the total 13,401 families live below the poverty line. Families with 5 or more children have the highest poverty rate of 28.3%, comprising of 49 families. On the other hand, families with no children have the lowest poverty rate of 1.6%, which includes 115 families.
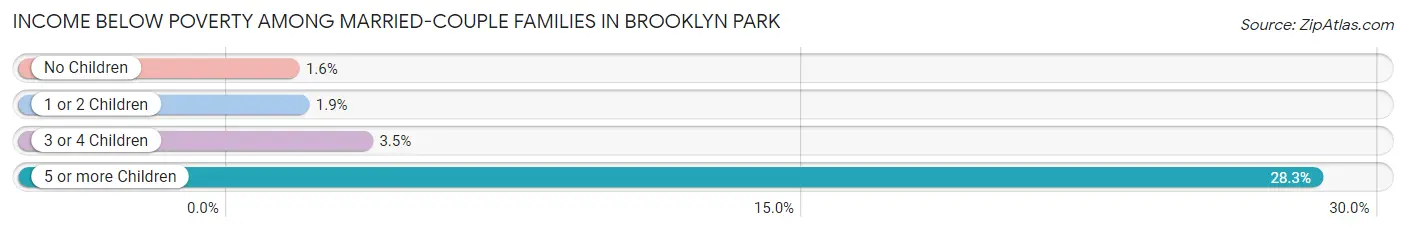
| Children | Above Poverty | Below Poverty |
| No Children | 7,122 (98.4%) | 115 (1.6%) |
| 1 or 2 Children | 4,341 (98.2%) | 82 (1.8%) |
| 3 or 4 Children | 1,513 (96.5%) | 55 (3.5%) |
| 5 or more Children | 124 (71.7%) | 49 (28.3%) |
| Total | 13,100 (97.8%) | 301 (2.2%) |
Income Below Poverty Among Single-Parent Households in Brooklyn Park
According to the poverty data in Brooklyn Park, 3.0% or 60 single-father households and 18.6% or 1,059 single-mother households are living below the poverty line. Among single-father households, those with 3 or 4 children have the highest poverty rate, with 19 households (17.0%) experiencing poverty. Likewise, among single-mother households, those with 3 or 4 children have the highest poverty rate, with 225 households (29.6%) falling below the poverty line.
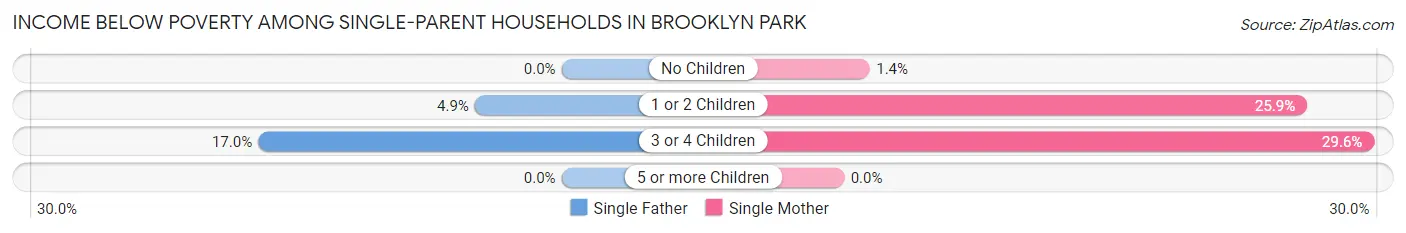
| Children | Single Father | Single Mother |
| No Children | 0 (0.0%) | 24 (1.4%) |
| 1 or 2 Children | 41 (4.9%) | 810 (25.9%) |
| 3 or 4 Children | 19 (17.0%) | 225 (29.6%) |
| 5 or more Children | 0 (0.0%) | 0 (0.0%) |
| Total | 60 (3.0%) | 1,059 (18.6%) |
Income Below Poverty Among Married-Couple vs Single-Parent Households in Brooklyn Park
The poverty data for Brooklyn Park shows that 301 of the married-couple family households (2.2%) and 1,119 of the single-parent households (14.6%) are living below the poverty level. Within the married-couple family households, those with 5 or more children have the highest poverty rate, with 49 households (28.3%) falling below the poverty line. Among the single-parent households, those with 3 or 4 children have the highest poverty rate, with 244 household (28.0%) living below poverty.
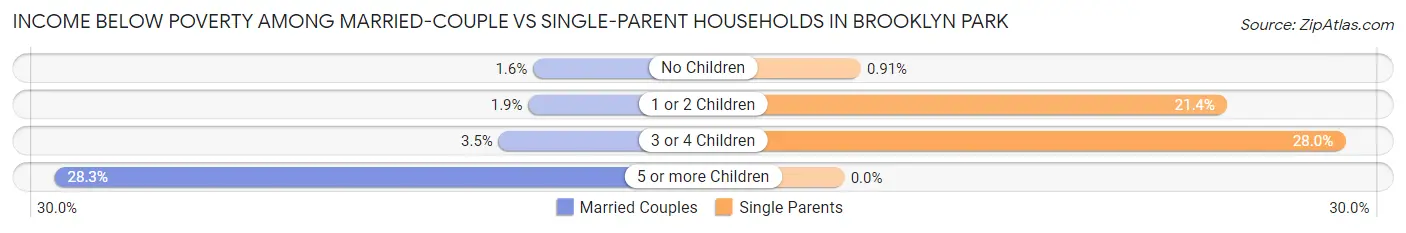
| Children | Married-Couple Families | Single-Parent Households |
| No Children | 115 (1.6%) | 24 (0.9%) |
| 1 or 2 Children | 82 (1.8%) | 851 (21.4%) |
| 3 or 4 Children | 55 (3.5%) | 244 (28.0%) |
| 5 or more Children | 49 (28.3%) | 0 (0.0%) |
| Total | 301 (2.2%) | 1,119 (14.6%) |
Race in Brooklyn Park
The most populous races in Brooklyn Park are White / Caucasian (33,691 | 39.7%), Black / African American (25,321 | 29.8%), and Asian (16,454 | 19.4%).
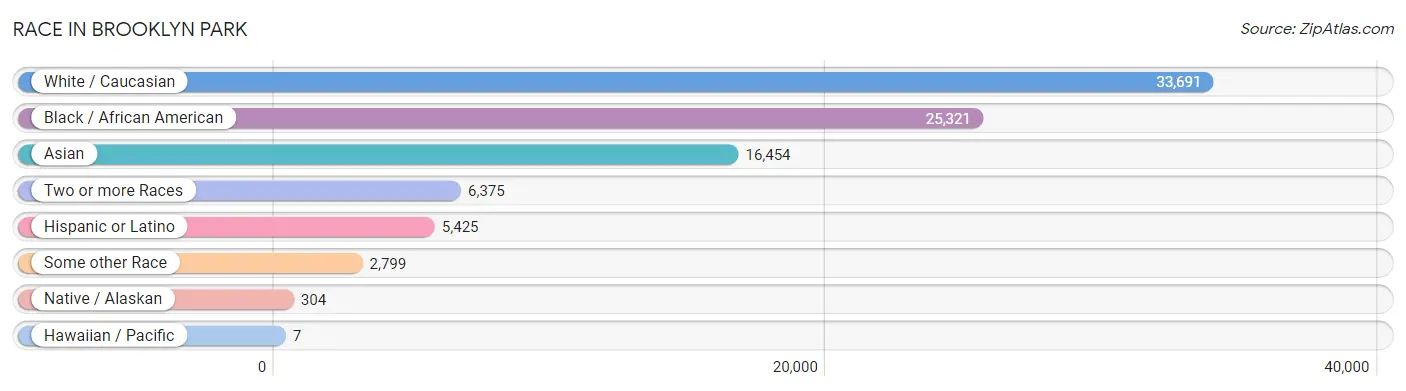
| Race | # Population | % Population |
| Asian | 16,454 | 19.4% |
| Black / African American | 25,321 | 29.8% |
| Hawaiian / Pacific | 7 | 0.0% |
| Hispanic or Latino | 5,425 | 6.4% |
| Native / Alaskan | 304 | 0.4% |
| White / Caucasian | 33,691 | 39.7% |
| Two or more Races | 6,375 | 7.5% |
| Some other Race | 2,799 | 3.3% |
| Total | 84,951 | 100.0% |
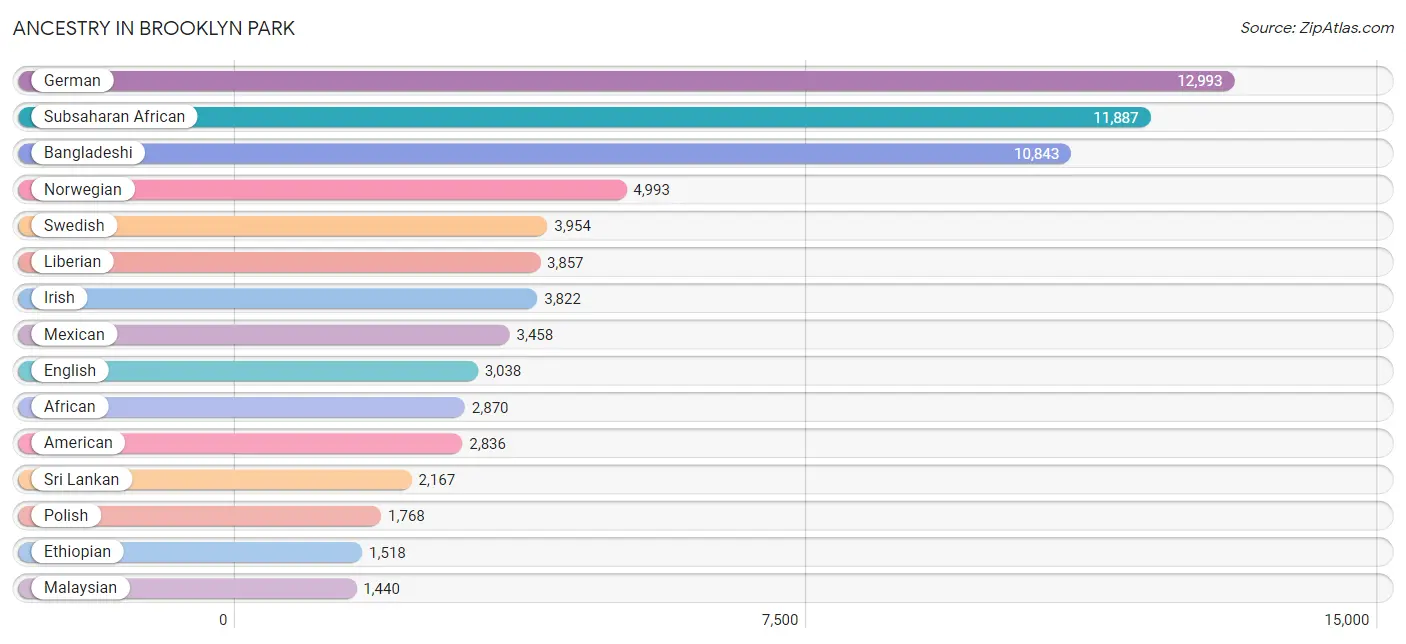
Ancestry in Brooklyn Park
The most populous ancestries reported in Brooklyn Park are German (12,993 | 15.3%), Subsaharan African (11,887 | 14.0%), Bangladeshi (10,843 | 12.8%), Norwegian (4,993 | 5.9%), and Swedish (3,954 | 4.6%), together accounting for 52.6% of all Brooklyn Park residents.
| Ancestry | # Population | % Population |
| African | 2,870 | 3.4% |
| American | 2,836 | 3.3% |
| Arab | 738 | 0.9% |
| Argentinean | 73 | 0.1% |
| Armenian | 30 | 0.0% |
| Australian | 16 | 0.0% |
| Austrian | 167 | 0.2% |
| Bahamian | 180 | 0.2% |
| Bangladeshi | 10,843 | 12.8% |
| Barbadian | 152 | 0.2% |
| Belgian | 235 | 0.3% |
| Bhutanese | 48 | 0.1% |
| British | 217 | 0.3% |
| Burmese | 268 | 0.3% |
| Canadian | 112 | 0.1% |
| Carpatho Rusyn | 10 | 0.0% |
| Central American | 375 | 0.4% |
| Central American Indian | 145 | 0.2% |
| Cherokee | 89 | 0.1% |
| Chilean | 7 | 0.0% |
| Chippewa | 273 | 0.3% |
| Colombian | 91 | 0.1% |
| Costa Rican | 19 | 0.0% |
| Cree | 18 | 0.0% |
| Croatian | 171 | 0.2% |
| Cuban | 141 | 0.2% |
| Czech | 566 | 0.7% |
| Czechoslovakian | 50 | 0.1% |
| Danish | 386 | 0.4% |
| Dominican | 29 | 0.0% |
| Dutch | 696 | 0.8% |
| Eastern European | 108 | 0.1% |
| Ecuadorian | 355 | 0.4% |
| Egyptian | 123 | 0.1% |
| English | 3,038 | 3.6% |
| Ethiopian | 1,518 | 1.8% |
| European | 1,047 | 1.2% |
| Fijian | 7 | 0.0% |
| Finnish | 849 | 1.0% |
| French | 1,205 | 1.4% |
| French Canadian | 185 | 0.2% |
| German | 12,993 | 15.3% |
| Ghanaian | 311 | 0.4% |
| Greek | 26 | 0.0% |
| Guatemalan | 34 | 0.0% |
| Guyanese | 227 | 0.3% |
| Honduran | 62 | 0.1% |
| Hungarian | 35 | 0.0% |
| Icelander | 6 | 0.0% |
| Indian (Asian) | 1,170 | 1.4% |
| Indonesian | 44 | 0.1% |
| Iranian | 18 | 0.0% |
| Iraqi | 120 | 0.1% |
| Irish | 3,822 | 4.5% |
| Italian | 776 | 0.9% |
| Jamaican | 267 | 0.3% |
| Japanese | 299 | 0.4% |
| Jordanian | 181 | 0.2% |
| Kenyan | 180 | 0.2% |
| Korean | 329 | 0.4% |
| Laotian | 78 | 0.1% |
| Latvian | 9 | 0.0% |
| Lebanese | 48 | 0.1% |
| Liberian | 3,857 | 4.5% |
| Lithuanian | 34 | 0.0% |
| Luxembourger | 48 | 0.1% |
| Malaysian | 1,440 | 1.7% |
| Mexican | 3,458 | 4.1% |
| Mexican American Indian | 150 | 0.2% |
| Nicaraguan | 123 | 0.1% |
| Nigerian | 1,181 | 1.4% |
| Northern European | 152 | 0.2% |
| Norwegian | 4,993 | 5.9% |
| Osage | 8 | 0.0% |
| Pakistani | 156 | 0.2% |
| Palestinian | 190 | 0.2% |
| Peruvian | 149 | 0.2% |
| Polish | 1,768 | 2.1% |
| Portuguese | 17 | 0.0% |
| Puerto Rican | 134 | 0.2% |
| Romanian | 335 | 0.4% |
| Russian | 367 | 0.4% |
| Salvadoran | 137 | 0.2% |
| Scandinavian | 528 | 0.6% |
| Scotch-Irish | 280 | 0.3% |
| Scottish | 465 | 0.5% |
| Sierra Leonean | 152 | 0.2% |
| Sioux | 76 | 0.1% |
| Slavic | 91 | 0.1% |
| Slovak | 20 | 0.0% |
| Slovene | 72 | 0.1% |
| Somali | 708 | 0.8% |
| South American | 675 | 0.8% |
| South American Indian | 14 | 0.0% |
| Spaniard | 65 | 0.1% |
| Spanish | 118 | 0.1% |
| Sri Lankan | 2,167 | 2.5% |
| Subsaharan African | 11,887 | 14.0% |
| Swedish | 3,954 | 4.6% |
| Swiss | 147 | 0.2% |
| Thai | 781 | 0.9% |
| Trinidadian and Tobagonian | 95 | 0.1% |
| Ugandan | 57 | 0.1% |
| Ukrainian | 287 | 0.3% |
| Welsh | 146 | 0.2% |
| West Indian | 22 | 0.0% |
| Yugoslavian | 81 | 0.1% | View All 107 Rows |
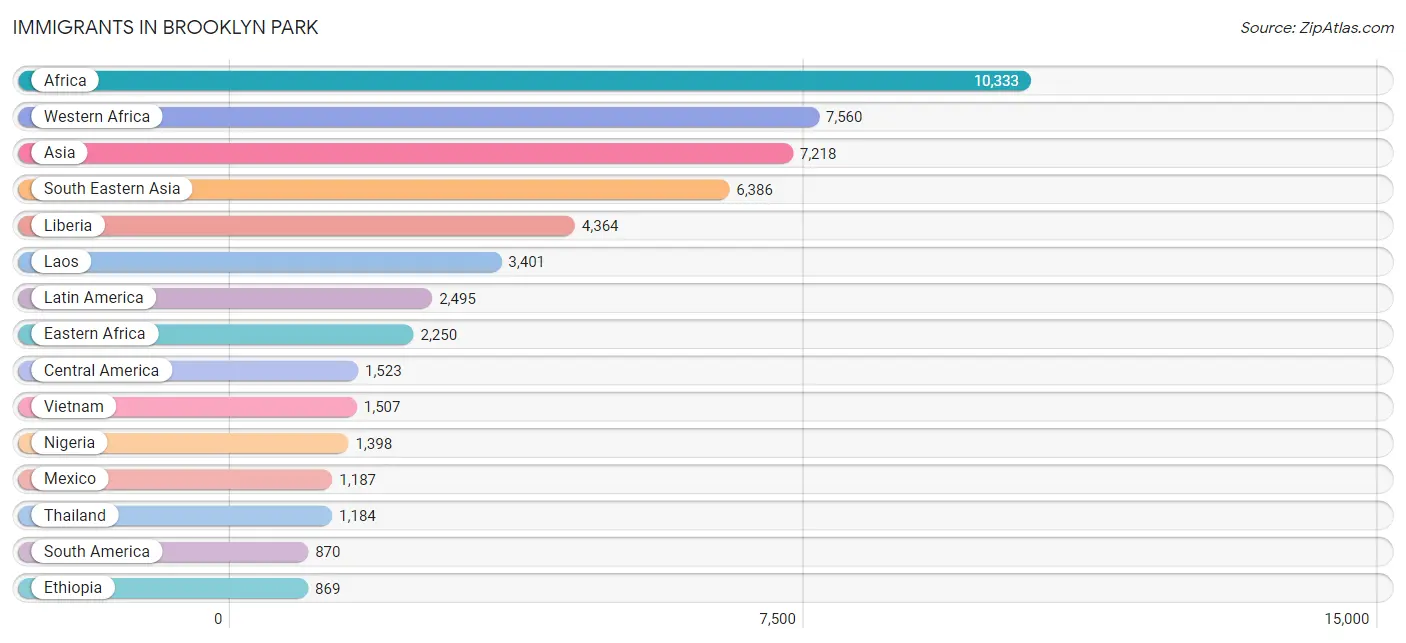
Immigrants in Brooklyn Park
The most numerous immigrant groups reported in Brooklyn Park came from Africa (10,333 | 12.2%), Western Africa (7,560 | 8.9%), Asia (7,218 | 8.5%), South Eastern Asia (6,386 | 7.5%), and Liberia (4,364 | 5.1%), together accounting for 42.2% of all Brooklyn Park residents.
| Immigration Origin | # Population | % Population |
| Afghanistan | 4 | 0.0% |
| Africa | 10,333 | 12.2% |
| Argentina | 73 | 0.1% |
| Asia | 7,218 | 8.5% |
| Barbados | 73 | 0.1% |
| Belarus | 14 | 0.0% |
| Bosnia and Herzegovina | 41 | 0.1% |
| Brazil | 10 | 0.0% |
| Cambodia | 156 | 0.2% |
| Cameroon | 280 | 0.3% |
| Canada | 222 | 0.3% |
| Caribbean | 102 | 0.1% |
| Central America | 1,523 | 1.8% |
| Chile | 7 | 0.0% |
| China | 180 | 0.2% |
| Colombia | 21 | 0.0% |
| Cuba | 17 | 0.0% |
| Czechoslovakia | 13 | 0.0% |
| Eastern Africa | 2,250 | 2.6% |
| Eastern Asia | 362 | 0.4% |
| Eastern Europe | 461 | 0.5% |
| Ecuador | 258 | 0.3% |
| Egypt | 42 | 0.1% |
| El Salvador | 289 | 0.3% |
| England | 42 | 0.1% |
| Eritrea | 29 | 0.0% |
| Ethiopia | 869 | 1.0% |
| Europe | 642 | 0.8% |
| France | 26 | 0.0% |
| Germany | 113 | 0.1% |
| Ghana | 422 | 0.5% |
| Guatemala | 21 | 0.0% |
| Guyana | 412 | 0.5% |
| Honduras | 26 | 0.0% |
| Hong Kong | 41 | 0.1% |
| Hungary | 6 | 0.0% |
| India | 299 | 0.4% |
| Iran | 39 | 0.1% |
| Israel | 39 | 0.1% |
| Japan | 55 | 0.1% |
| Jordan | 67 | 0.1% |
| Kenya | 422 | 0.5% |
| Korea | 127 | 0.2% |
| Laos | 3,401 | 4.0% |
| Latin America | 2,495 | 2.9% |
| Lebanon | 9 | 0.0% |
| Liberia | 4,364 | 5.1% |
| Lithuania | 12 | 0.0% |
| Mexico | 1,187 | 1.4% |
| Middle Africa | 296 | 0.4% |
| Moldova | 195 | 0.2% |
| Morocco | 21 | 0.0% |
| Nigeria | 1,398 | 1.7% |
| Northern Africa | 76 | 0.1% |
| Northern Europe | 42 | 0.1% |
| Oceania | 7 | 0.0% |
| Peru | 65 | 0.1% |
| Philippines | 138 | 0.2% |
| Russia | 61 | 0.1% |
| Saudi Arabia | 7 | 0.0% |
| Serbia | 19 | 0.0% |
| Sierra Leone | 326 | 0.4% |
| Somalia | 619 | 0.7% |
| South Africa | 18 | 0.0% |
| South America | 870 | 1.0% |
| South Central Asia | 342 | 0.4% |
| South Eastern Asia | 6,386 | 7.5% |
| Sudan | 13 | 0.0% |
| Taiwan | 3 | 0.0% |
| Thailand | 1,184 | 1.4% |
| Trinidad and Tobago | 12 | 0.0% |
| Uganda | 73 | 0.1% |
| Ukraine | 68 | 0.1% |
| Vietnam | 1,507 | 1.8% |
| Western Africa | 7,560 | 8.9% |
| Western Asia | 128 | 0.2% |
| Western Europe | 139 | 0.2% |
| Zaire | 16 | 0.0% | View All 78 Rows |
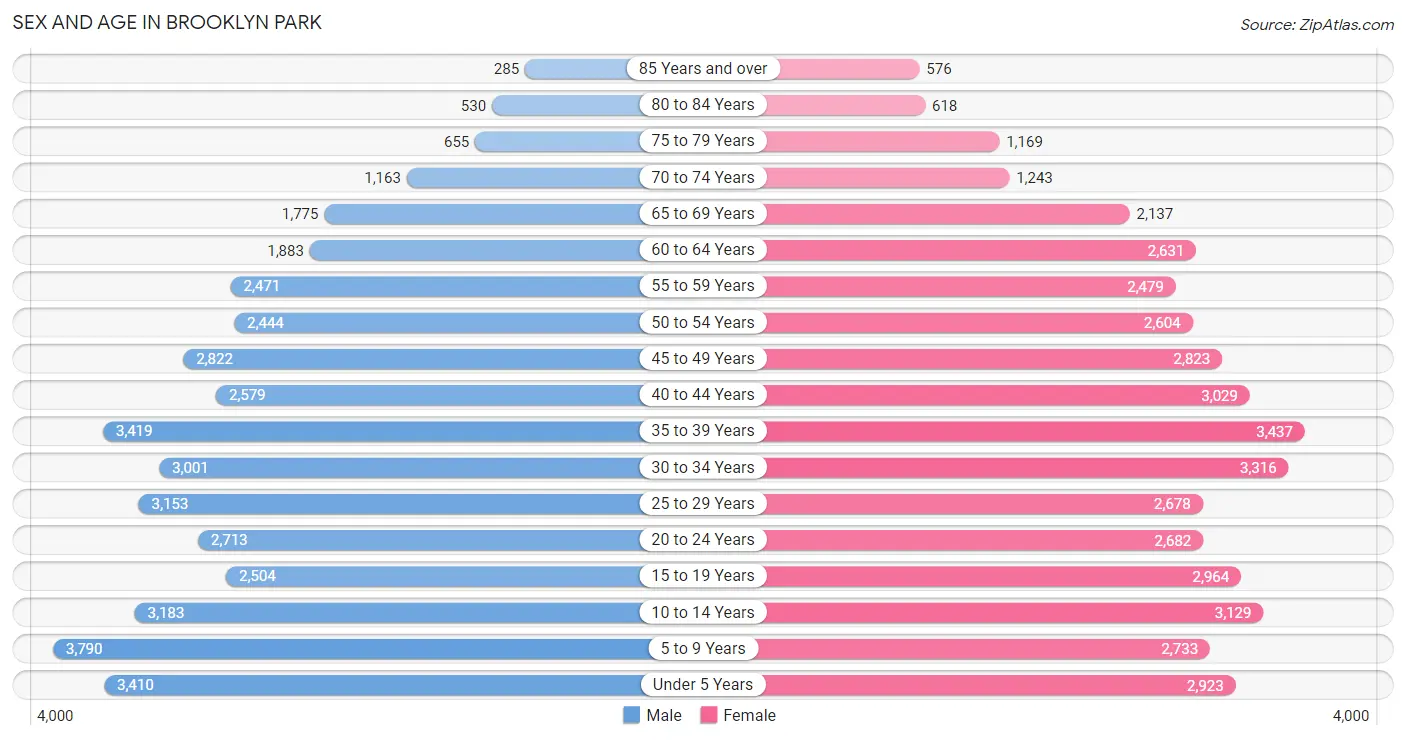
Sex and Age in Brooklyn Park
Sex and Age in Brooklyn Park
The most populous age groups in Brooklyn Park are 5 to 9 Years (3,790 | 9.1%) for men and 35 to 39 Years (3,437 | 8.0%) for women.
| Age Bracket | Male | Female |
| Under 5 Years | 3,410 (8.2%) | 2,923 (6.8%) |
| 5 to 9 Years | 3,790 (9.1%) | 2,733 (6.3%) |
| 10 to 14 Years | 3,183 (7.6%) | 3,129 (7.2%) |
| 15 to 19 Years | 2,504 (6.0%) | 2,964 (6.9%) |
| 20 to 24 Years | 2,713 (6.5%) | 2,682 (6.2%) |
| 25 to 29 Years | 3,153 (7.5%) | 2,678 (6.2%) |
| 30 to 34 Years | 3,001 (7.2%) | 3,316 (7.7%) |
| 35 to 39 Years | 3,419 (8.2%) | 3,437 (8.0%) |
| 40 to 44 Years | 2,579 (6.2%) | 3,029 (7.0%) |
| 45 to 49 Years | 2,822 (6.8%) | 2,823 (6.5%) |
| 50 to 54 Years | 2,444 (5.9%) | 2,604 (6.0%) |
| 55 to 59 Years | 2,471 (5.9%) | 2,479 (5.7%) |
| 60 to 64 Years | 1,883 (4.5%) | 2,631 (6.1%) |
| 65 to 69 Years | 1,775 (4.3%) | 2,137 (5.0%) |
| 70 to 74 Years | 1,163 (2.8%) | 1,243 (2.9%) |
| 75 to 79 Years | 655 (1.6%) | 1,169 (2.7%) |
| 80 to 84 Years | 530 (1.3%) | 618 (1.4%) |
| 85 Years and over | 285 (0.7%) | 576 (1.3%) |
| Total | 41,780 (100.0%) | 43,171 (100.0%) |
Families and Households in Brooklyn Park
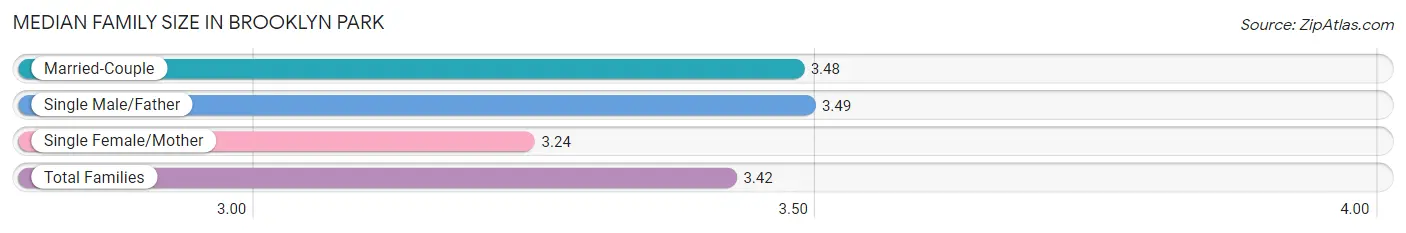
Median Family Size in Brooklyn Park
The median family size in Brooklyn Park is 3.42 persons per family, with single male/father families (1,985 | 9.4%) accounting for the largest median family size of 3.49 persons per family. On the other hand, single female/mother families (5,701 | 27.0%) represent the smallest median family size with 3.24 persons per family.
| Family Type | # Families | Family Size |
| Married-Couple | 13,401 (63.5%) | 3.48 |
| Single Male/Father | 1,985 (9.4%) | 3.49 |
| Single Female/Mother | 5,701 (27.0%) | 3.24 |
| Total Families | 21,087 (100.0%) | 3.42 |
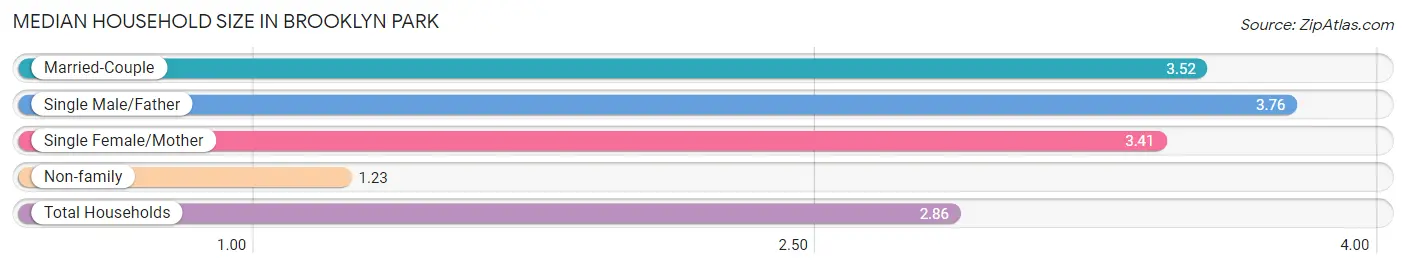
Median Household Size in Brooklyn Park
The median household size in Brooklyn Park is 2.86 persons per household, with single male/father households (1,985 | 6.7%) accounting for the largest median household size of 3.76 persons per household. non-family households (8,516 | 28.8%) represent the smallest median household size with 1.23 persons per household.
| Household Type | # Households | Household Size |
| Married-Couple | 13,401 (45.3%) | 3.52 |
| Single Male/Father | 1,985 (6.7%) | 3.76 |
| Single Female/Mother | 5,701 (19.3%) | 3.41 |
| Non-family | 8,516 (28.8%) | 1.23 |
| Total Households | 29,603 (100.0%) | 2.86 |
Household Size by Marriage Status in Brooklyn Park
Out of a total of 29,603 households in Brooklyn Park, 21,087 (71.2%) are family households, while 8,516 (28.8%) are nonfamily households. The most numerous type of family households are 2-person households, comprising 8,062, and the most common type of nonfamily households are 1-person households, comprising 7,111.
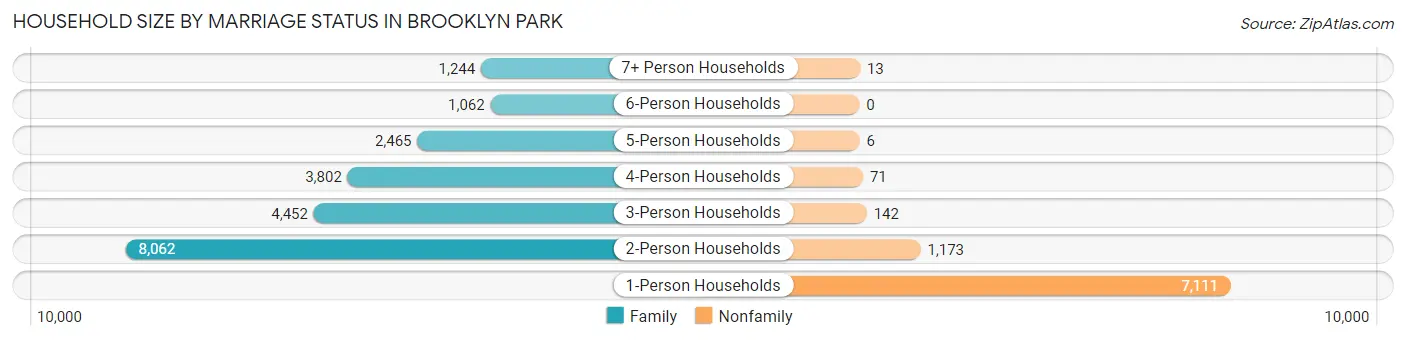
| Household Size | Family Households | Nonfamily Households |
| 1-Person Households | - | 7,111 (24.0%) |
| 2-Person Households | 8,062 (27.2%) | 1,173 (4.0%) |
| 3-Person Households | 4,452 (15.0%) | 142 (0.5%) |
| 4-Person Households | 3,802 (12.8%) | 71 (0.2%) |
| 5-Person Households | 2,465 (8.3%) | 6 (0.0%) |
| 6-Person Households | 1,062 (3.6%) | 0 (0.0%) |
| 7+ Person Households | 1,244 (4.2%) | 13 (0.0%) |
| Total | 21,087 (71.2%) | 8,516 (28.8%) |
Female Fertility in Brooklyn Park
Fertility by Age in Brooklyn Park
Average fertility rate in Brooklyn Park is 77.0 births per 1,000 women. Women in the age bracket of 20 to 34 years have the highest fertility rate with 145.0 births per 1,000 women. Women in the age bracket of 20 to 34 years acount for 75.3% of all women with births.
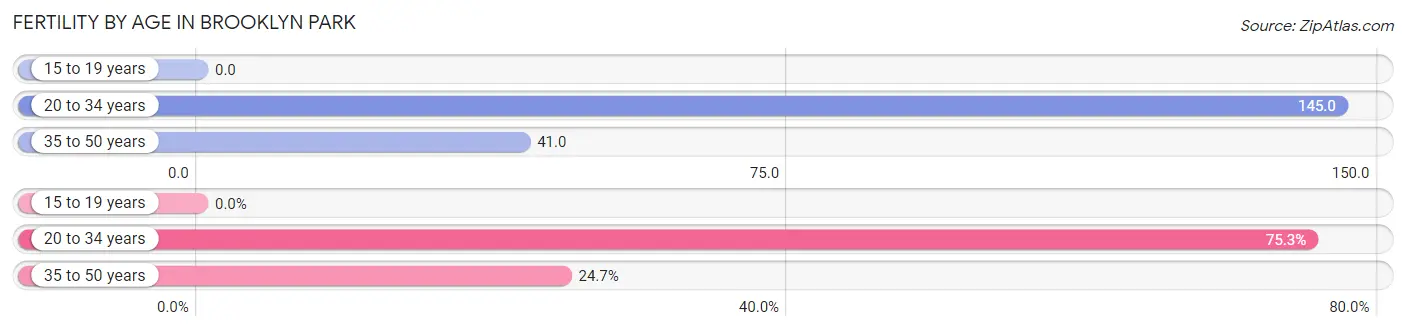
| Age Bracket | Women with Births | Births / 1,000 Women |
| 15 to 19 years | 0 (0.0%) | 0.0 |
| 20 to 34 years | 1,255 (75.3%) | 145.0 |
| 35 to 50 years | 411 (24.7%) | 41.0 |
| Total | 1,666 (100.0%) | 77.0 |
Fertility by Age by Marriage Status in Brooklyn Park
62.8% of women with births (1,666) in Brooklyn Park are married. The highest percentage of unmarried women with births falls into 20 to 34 years age bracket with 44.5% of them unmarried at the time of birth, while the lowest percentage of unmarried women with births belong to 35 to 50 years age bracket with 15.1% of them unmarried.
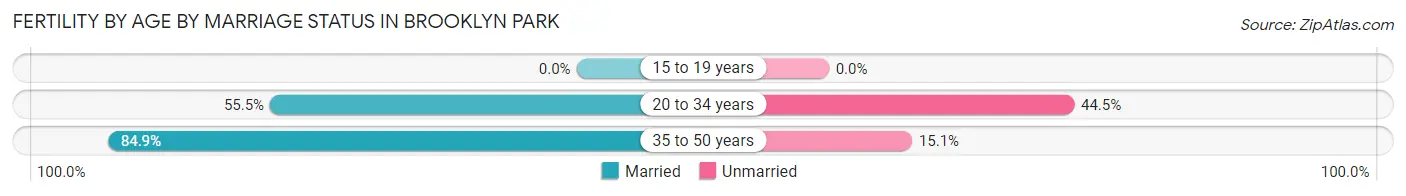
| Age Bracket | Married | Unmarried |
| 15 to 19 years | 0 (0.0%) | 0 (0.0%) |
| 20 to 34 years | 697 (55.5%) | 558 (44.5%) |
| 35 to 50 years | 349 (84.9%) | 62 (15.1%) |
| Total | 1,046 (62.8%) | 620 (37.2%) |
Fertility by Education in Brooklyn Park
Average fertility rate in Brooklyn Park is 77.0 births per 1,000 women. Women with the education attainment of high school diploma have the highest fertility rate of 108.0 births per 1,000 women, while women with the education attainment of less than high school have the lowest fertility at 25.0 births per 1,000 women. Women with the education attainment of college or associate's degree represent 36.6% of all women with births.
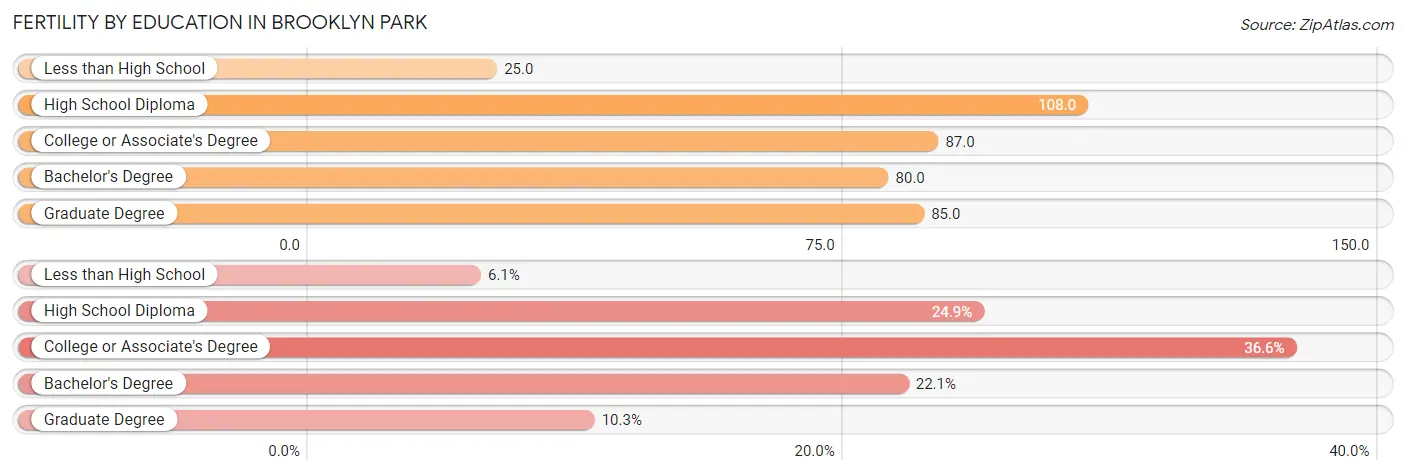
| Educational Attainment | Women with Births | Births / 1,000 Women |
| Less than High School | 101 (6.1%) | 25.0 |
| High School Diploma | 415 (24.9%) | 108.0 |
| College or Associate's Degree | 610 (36.6%) | 87.0 |
| Bachelor's Degree | 368 (22.1%) | 80.0 |
| Graduate Degree | 172 (10.3%) | 85.0 |
| Total | 1,666 (100.0%) | 77.0 |
Fertility by Education by Marriage Status in Brooklyn Park
37.2% of women with births in Brooklyn Park are unmarried. Women with the educational attainment of bachelor's degree are most likely to be married with 84.0% of them married at childbirth, while women with the educational attainment of less than high school are least likely to be married with 50.5% of them unmarried at childbirth.
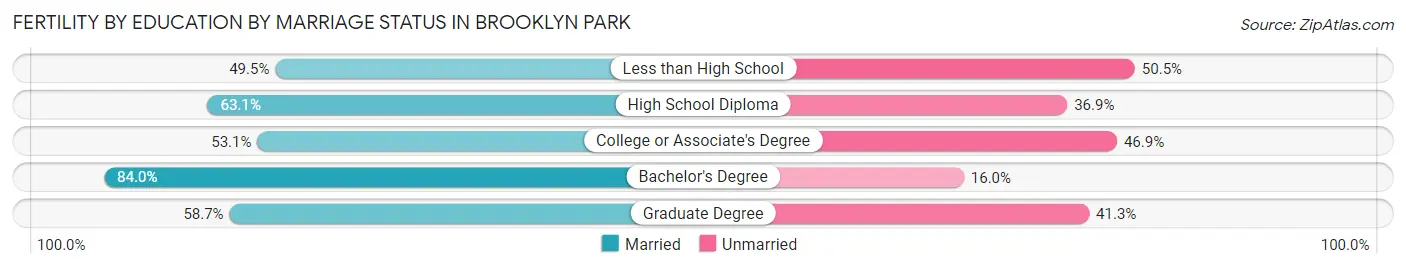
| Educational Attainment | Married | Unmarried |
| Less than High School | 50 (49.5%) | 51 (50.5%) |
| High School Diploma | 262 (63.1%) | 153 (36.9%) |
| College or Associate's Degree | 324 (53.1%) | 286 (46.9%) |
| Bachelor's Degree | 309 (84.0%) | 59 (16.0%) |
| Graduate Degree | 101 (58.7%) | 71 (41.3%) |
| Total | 1,046 (62.8%) | 620 (37.2%) |
Employment Characteristics in Brooklyn Park
Employment by Class of Employer in Brooklyn Park
Among the 45,028 employed individuals in Brooklyn Park, private company employees (32,175 | 71.5%), not-for-profit organizations (5,489 | 12.2%), and local government employees (2,615 | 5.8%) make up the most common classes of employment.
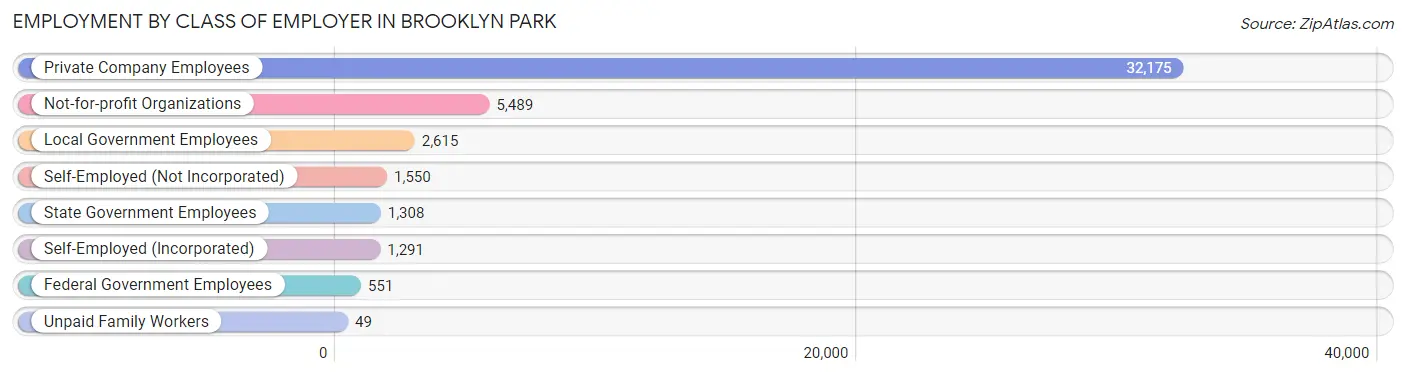
| Employer Class | # Employees | % Employees |
| Private Company Employees | 32,175 | 71.5% |
| Self-Employed (Incorporated) | 1,291 | 2.9% |
| Self-Employed (Not Incorporated) | 1,550 | 3.4% |
| Not-for-profit Organizations | 5,489 | 12.2% |
| Local Government Employees | 2,615 | 5.8% |
| State Government Employees | 1,308 | 2.9% |
| Federal Government Employees | 551 | 1.2% |
| Unpaid Family Workers | 49 | 0.1% |
| Total | 45,028 | 100.0% |
Employment Status by Age in Brooklyn Park
According to the labor force statistics for Brooklyn Park, out of the total population over 16 years of age (64,796), 73.3% or 47,495 individuals are in the labor force, with 3.7% or 1,757 of them unemployed. The age group with the highest labor force participation rate is 35 to 44 years, with 90.6% or 11,292 individuals in the labor force. Within the labor force, the 16 to 19 years age range has the highest percentage of unemployed individuals, with 11.2% or 234 of them being unemployed.
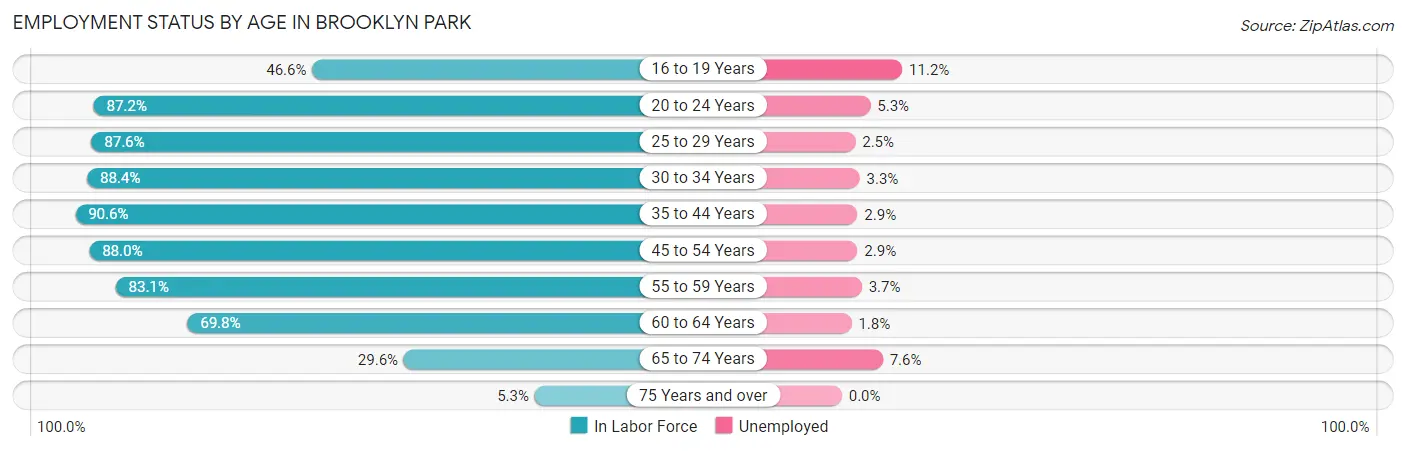
| Age Bracket | In Labor Force | Unemployed |
| 16 to 19 Years | 2,088 (46.6%) | 234 (11.2%) |
| 20 to 24 Years | 4,704 (87.2%) | 249 (5.3%) |
| 25 to 29 Years | 5,108 (87.6%) | 128 (2.5%) |
| 30 to 34 Years | 5,584 (88.4%) | 184 (3.3%) |
| 35 to 44 Years | 11,292 (90.6%) | 327 (2.9%) |
| 45 to 54 Years | 9,410 (88.0%) | 273 (2.9%) |
| 55 to 59 Years | 4,113 (83.1%) | 152 (3.7%) |
| 60 to 64 Years | 3,151 (69.8%) | 57 (1.8%) |
| 65 to 74 Years | 1,870 (29.6%) | 142 (7.6%) |
| 75 Years and over | 203 (5.3%) | 0 (0.0%) |
| Total | 47,495 (73.3%) | 1,757 (3.7%) |
Employment Status by Educational Attainment in Brooklyn Park
According to labor force statistics for Brooklyn Park, 86.3% of individuals (38,636) out of the total population between 25 and 64 years of age (44,769) are in the labor force, with 2.9% or 1,120 of them being unemployed. The group with the highest labor force participation rate are those with the educational attainment of bachelor's degree or higher, with 92.6% or 13,764 individuals in the labor force. Within the labor force, individuals with less than high school education have the highest percentage of unemployment, with 5.8% or 178 of them being unemployed.
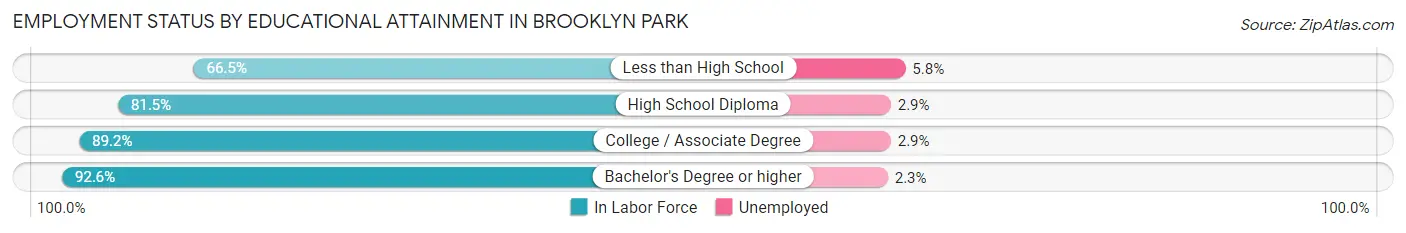
| Educational Attainment | In Labor Force | Unemployed |
| Less than High School | 3,071 (66.5%) | 268 (5.8%) |
| High School Diploma | 7,889 (81.5%) | 281 (2.9%) |
| College / Associate Degree | 13,921 (89.2%) | 453 (2.9%) |
| Bachelor's Degree or higher | 13,764 (92.6%) | 342 (2.3%) |
| Total | 38,636 (86.3%) | 1,298 (2.9%) |
Employment Occupations by Sex in Brooklyn Park
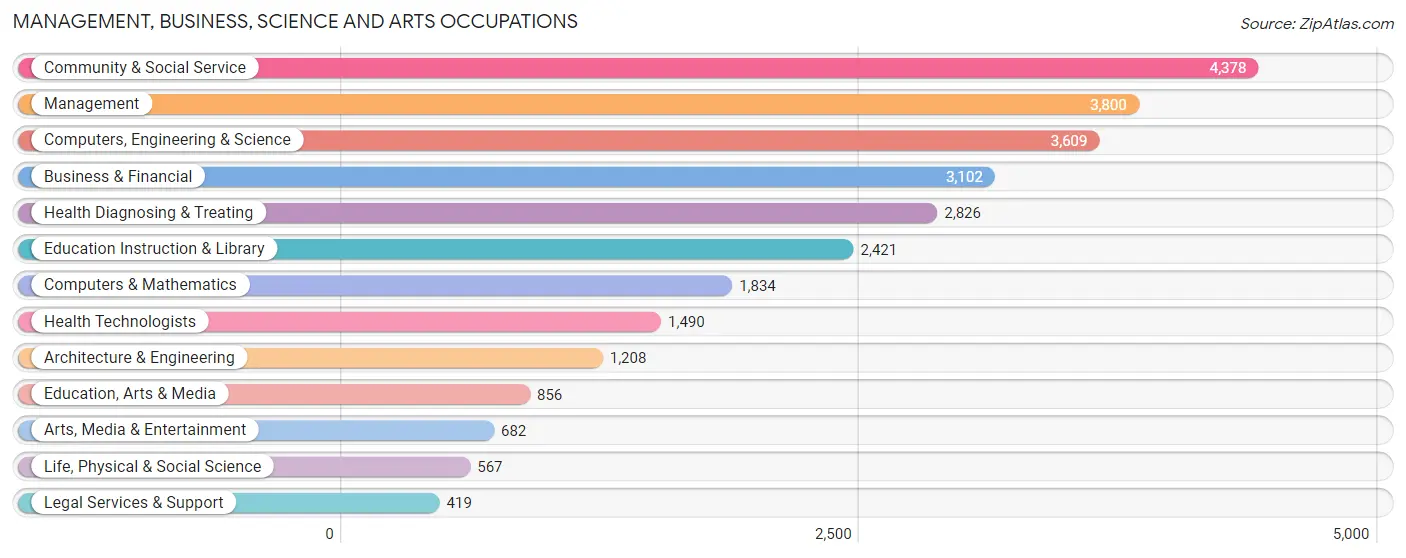
Management, Business, Science and Arts Occupations
The most common Management, Business, Science and Arts occupations in Brooklyn Park are Community & Social Service (4,378 | 9.6%), Management (3,800 | 8.3%), Computers, Engineering & Science (3,609 | 7.9%), Business & Financial (3,102 | 6.8%), and Health Diagnosing & Treating (2,826 | 6.2%).
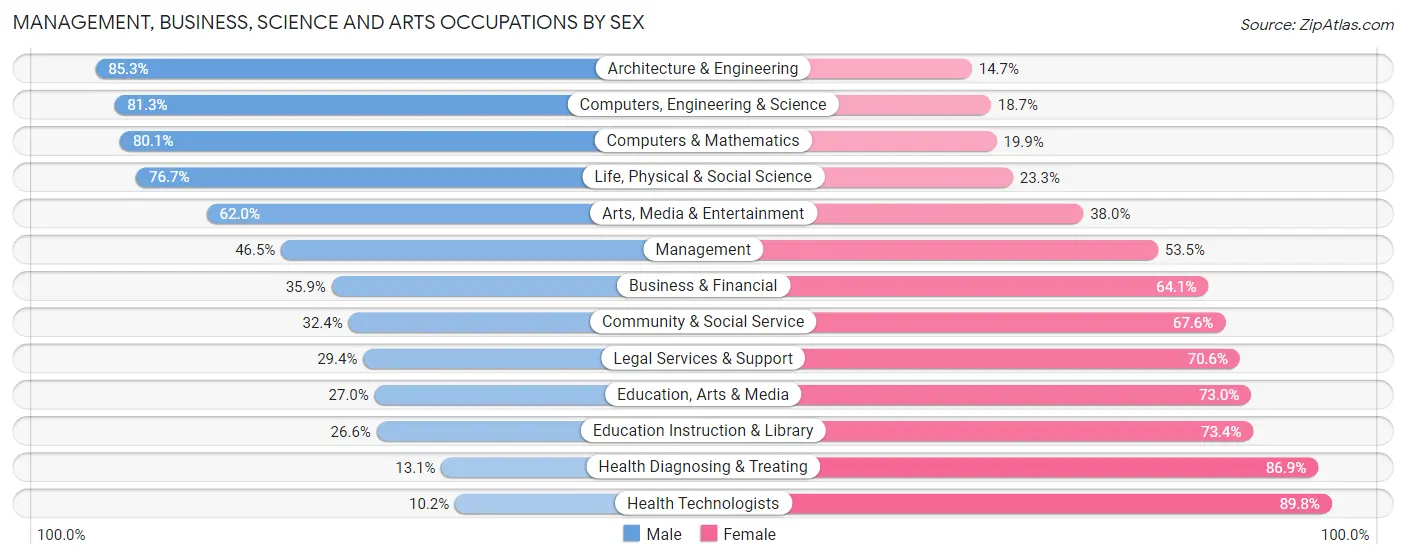
Management, Business, Science and Arts Occupations by Sex
Within the Management, Business, Science and Arts occupations in Brooklyn Park, the most male-oriented occupations are Architecture & Engineering (85.3%), Computers, Engineering & Science (81.3%), and Computers & Mathematics (80.1%), while the most female-oriented occupations are Health Technologists (89.8%), Health Diagnosing & Treating (86.9%), and Education Instruction & Library (73.4%).
| Occupation | Male | Female |
| Management | 1,766 (46.5%) | 2,034 (53.5%) |
| Business & Financial | 1,115 (35.9%) | 1,987 (64.1%) |
| Computers, Engineering & Science | 2,934 (81.3%) | 675 (18.7%) |
| Computers & Mathematics | 1,469 (80.1%) | 365 (19.9%) |
| Architecture & Engineering | 1,030 (85.3%) | 178 (14.7%) |
| Life, Physical & Social Science | 435 (76.7%) | 132 (23.3%) |
| Community & Social Service | 1,420 (32.4%) | 2,958 (67.6%) |
| Education, Arts & Media | 231 (27.0%) | 625 (73.0%) |
| Legal Services & Support | 123 (29.4%) | 296 (70.6%) |
| Education Instruction & Library | 643 (26.6%) | 1,778 (73.4%) |
| Arts, Media & Entertainment | 423 (62.0%) | 259 (38.0%) |
| Health Diagnosing & Treating | 369 (13.1%) | 2,457 (86.9%) |
| Health Technologists | 152 (10.2%) | 1,338 (89.8%) |
| Total (Category) | 7,604 (42.9%) | 10,111 (57.1%) |
| Total (Overall) | 22,729 (49.7%) | 23,039 (50.3%) |
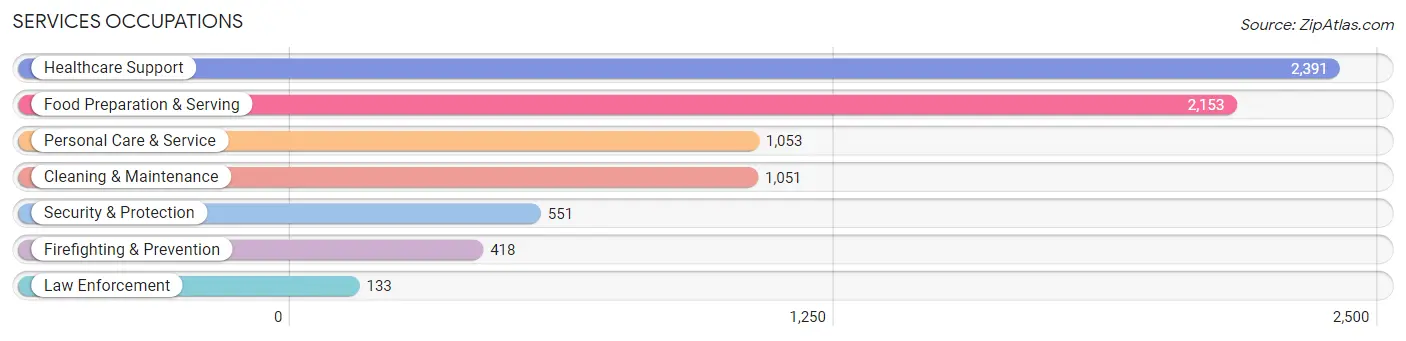
Services Occupations
The most common Services occupations in Brooklyn Park are Healthcare Support (2,391 | 5.2%), Food Preparation & Serving (2,153 | 4.7%), Personal Care & Service (1,053 | 2.3%), Cleaning & Maintenance (1,051 | 2.3%), and Security & Protection (551 | 1.2%).
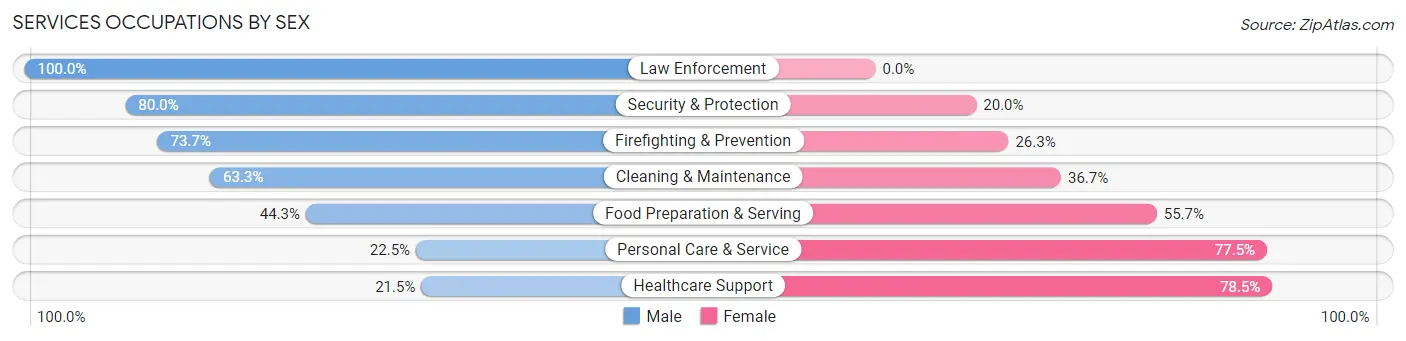
Services Occupations by Sex
Within the Services occupations in Brooklyn Park, the most male-oriented occupations are Law Enforcement (100.0%), Security & Protection (80.0%), and Firefighting & Prevention (73.7%), while the most female-oriented occupations are Healthcare Support (78.5%), Personal Care & Service (77.5%), and Food Preparation & Serving (55.7%).
| Occupation | Male | Female |
| Healthcare Support | 513 (21.5%) | 1,878 (78.5%) |
| Security & Protection | 441 (80.0%) | 110 (20.0%) |
| Firefighting & Prevention | 308 (73.7%) | 110 (26.3%) |
| Law Enforcement | 133 (100.0%) | 0 (0.0%) |
| Food Preparation & Serving | 954 (44.3%) | 1,199 (55.7%) |
| Cleaning & Maintenance | 665 (63.3%) | 386 (36.7%) |
| Personal Care & Service | 237 (22.5%) | 816 (77.5%) |
| Total (Category) | 2,810 (39.0%) | 4,389 (61.0%) |
| Total (Overall) | 22,729 (49.7%) | 23,039 (50.3%) |
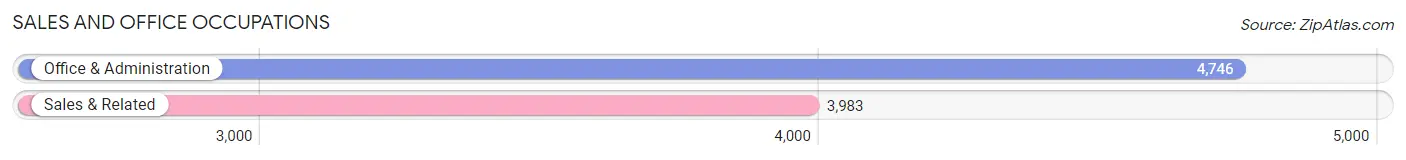
Sales and Office Occupations
The most common Sales and Office occupations in Brooklyn Park are Office & Administration (4,746 | 10.4%), and Sales & Related (3,983 | 8.7%).
Sales and Office Occupations by Sex
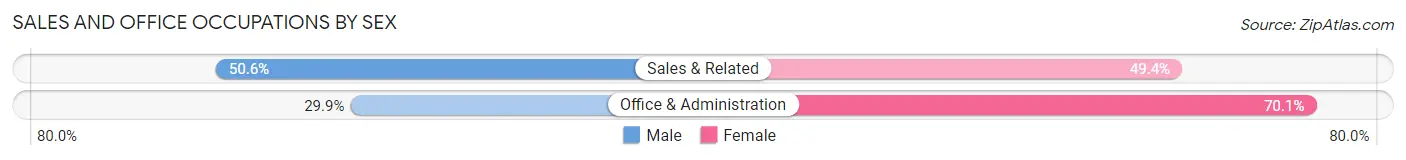
| Occupation | Male | Female |
| Sales & Related | 2,014 (50.6%) | 1,969 (49.4%) |
| Office & Administration | 1,419 (29.9%) | 3,327 (70.1%) |
| Total (Category) | 3,433 (39.3%) | 5,296 (60.7%) |
| Total (Overall) | 22,729 (49.7%) | 23,039 (50.3%) |
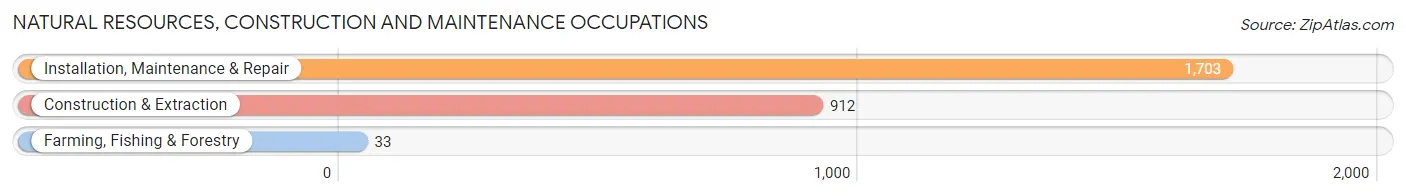
Natural Resources, Construction and Maintenance Occupations
The most common Natural Resources, Construction and Maintenance occupations in Brooklyn Park are Installation, Maintenance & Repair (1,703 | 3.7%), Construction & Extraction (912 | 2.0%), and Farming, Fishing & Forestry (33 | 0.1%).
Natural Resources, Construction and Maintenance Occupations by Sex
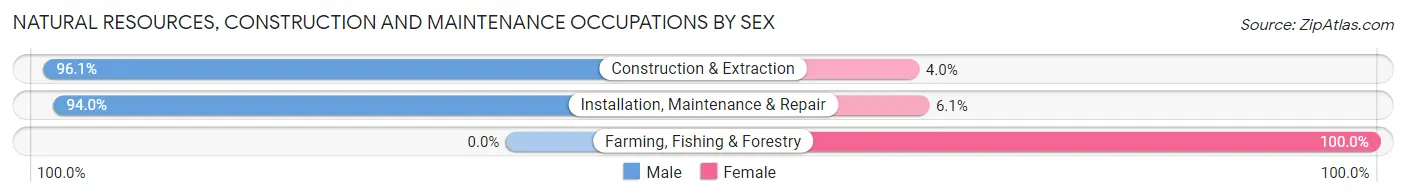
| Occupation | Male | Female |
| Farming, Fishing & Forestry | 0 (0.0%) | 33 (100.0%) |
| Construction & Extraction | 876 (96.1%) | 36 (4.0%) |
| Installation, Maintenance & Repair | 1,600 (94.0%) | 103 (6.0%) |
| Total (Category) | 2,476 (93.5%) | 172 (6.5%) |
| Total (Overall) | 22,729 (49.7%) | 23,039 (50.3%) |
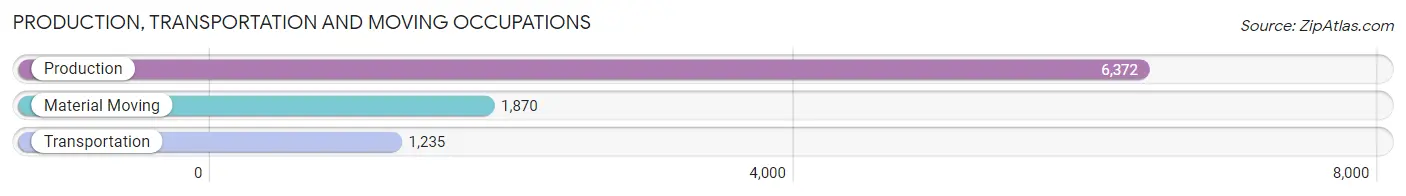
Production, Transportation and Moving Occupations
The most common Production, Transportation and Moving occupations in Brooklyn Park are Production (6,372 | 13.9%), Material Moving (1,870 | 4.1%), and Transportation (1,235 | 2.7%).
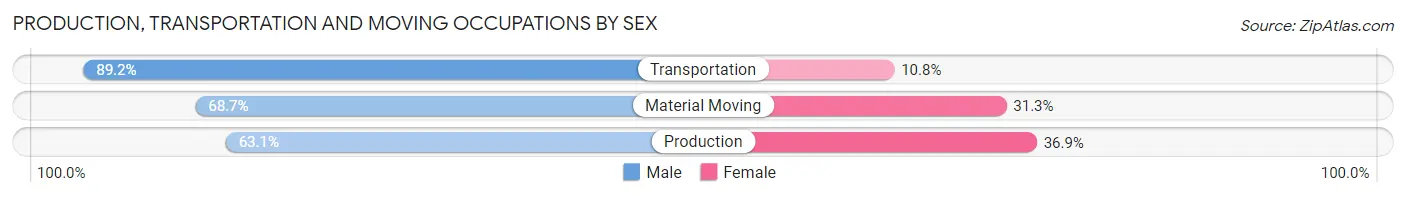
Production, Transportation and Moving Occupations by Sex
| Occupation | Male | Female |
| Production | 4,020 (63.1%) | 2,352 (36.9%) |
| Transportation | 1,102 (89.2%) | 133 (10.8%) |
| Material Moving | 1,284 (68.7%) | 586 (31.3%) |
| Total (Category) | 6,406 (67.6%) | 3,071 (32.4%) |
| Total (Overall) | 22,729 (49.7%) | 23,039 (50.3%) |
Employment Industries by Sex in Brooklyn Park
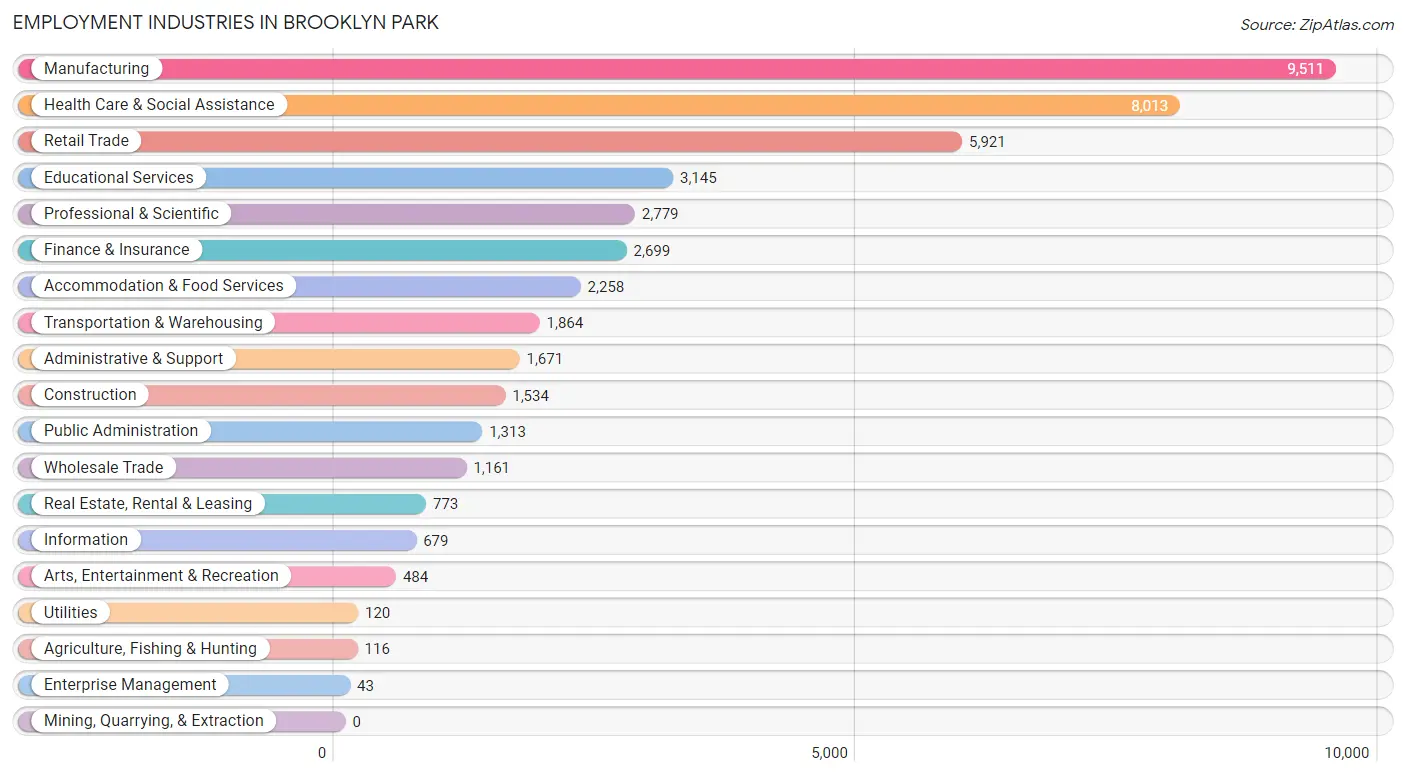
Employment Industries in Brooklyn Park
The major employment industries in Brooklyn Park include Manufacturing (9,511 | 20.8%), Health Care & Social Assistance (8,013 | 17.5%), Retail Trade (5,921 | 12.9%), Educational Services (3,145 | 6.9%), and Professional & Scientific (2,779 | 6.1%).
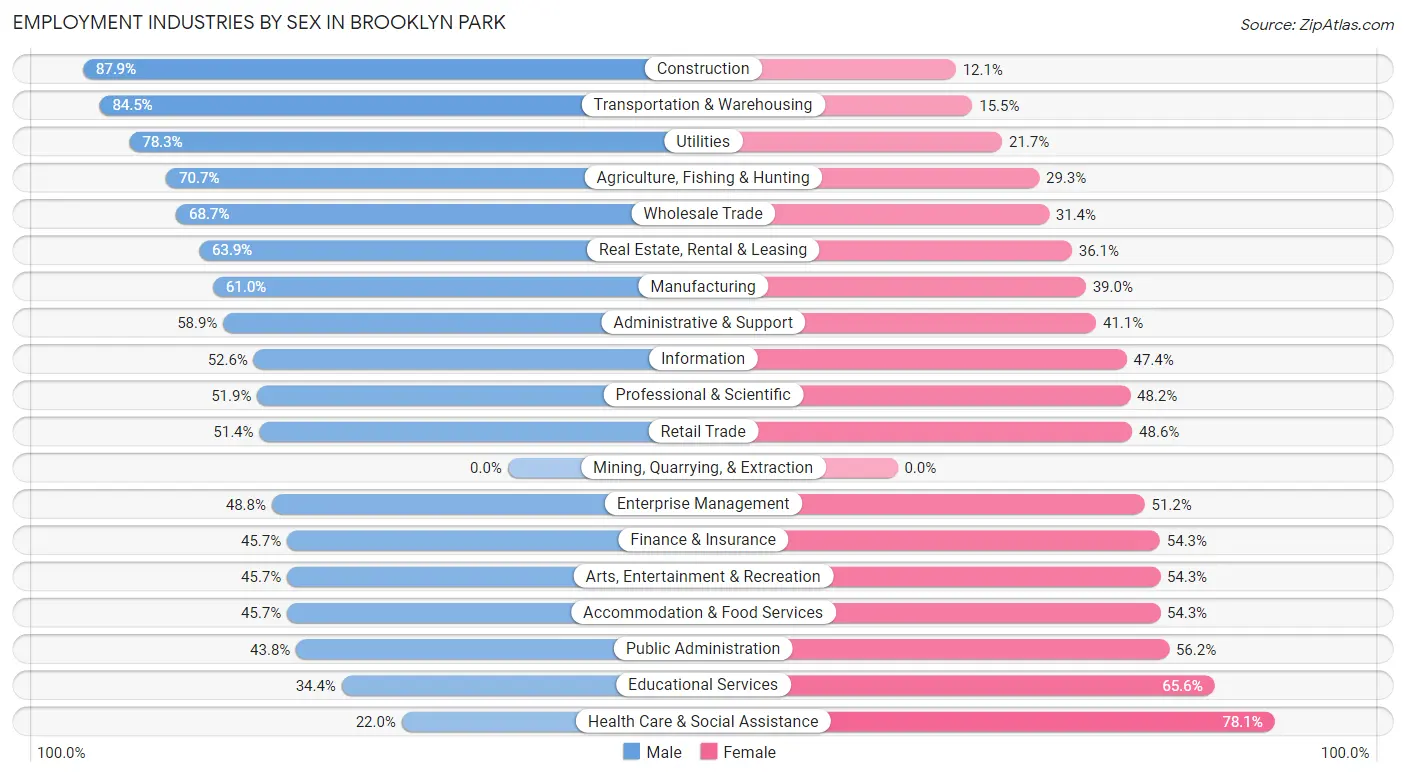
Employment Industries by Sex in Brooklyn Park
The Brooklyn Park industries that see more men than women are Construction (87.9%), Transportation & Warehousing (84.5%), and Utilities (78.3%), whereas the industries that tend to have a higher number of women are Health Care & Social Assistance (78.0%), Educational Services (65.6%), and Public Administration (56.2%).
| Industry | Male | Female |
| Agriculture, Fishing & Hunting | 82 (70.7%) | 34 (29.3%) |
| Mining, Quarrying, & Extraction | 0 (0.0%) | 0 (0.0%) |
| Construction | 1,349 (87.9%) | 185 (12.1%) |
| Manufacturing | 5,804 (61.0%) | 3,707 (39.0%) |
| Wholesale Trade | 797 (68.6%) | 364 (31.4%) |
| Retail Trade | 3,044 (51.4%) | 2,877 (48.6%) |
| Transportation & Warehousing | 1,575 (84.5%) | 289 (15.5%) |
| Utilities | 94 (78.3%) | 26 (21.7%) |
| Information | 357 (52.6%) | 322 (47.4%) |
| Finance & Insurance | 1,233 (45.7%) | 1,466 (54.3%) |
| Real Estate, Rental & Leasing | 494 (63.9%) | 279 (36.1%) |
| Professional & Scientific | 1,441 (51.8%) | 1,338 (48.1%) |
| Enterprise Management | 21 (48.8%) | 22 (51.2%) |
| Administrative & Support | 984 (58.9%) | 687 (41.1%) |
| Educational Services | 1,081 (34.4%) | 2,064 (65.6%) |
| Health Care & Social Assistance | 1,759 (22.0%) | 6,254 (78.0%) |
| Arts, Entertainment & Recreation | 221 (45.7%) | 263 (54.3%) |
| Accommodation & Food Services | 1,031 (45.7%) | 1,227 (54.3%) |
| Public Administration | 575 (43.8%) | 738 (56.2%) |
| Total | 22,729 (49.7%) | 23,039 (50.3%) |
Education in Brooklyn Park
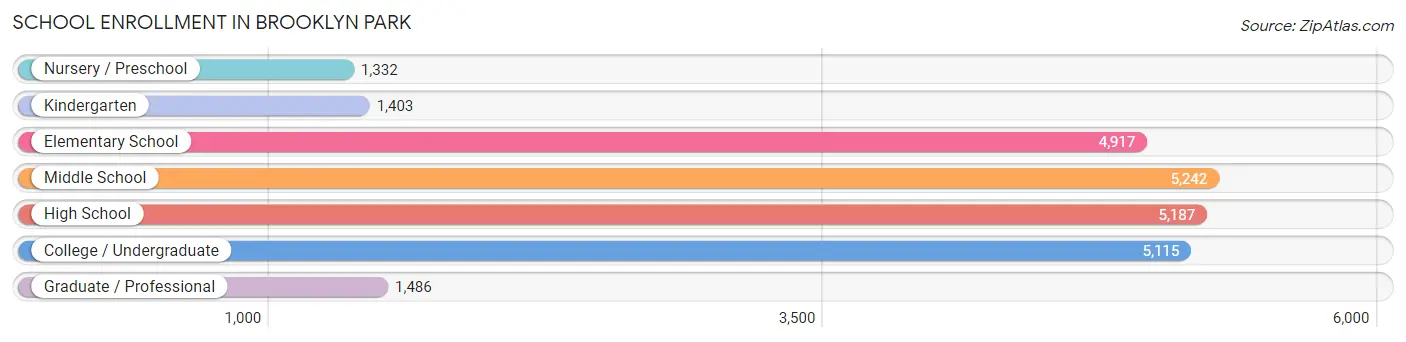
School Enrollment in Brooklyn Park
The most common levels of schooling among the 24,682 students in Brooklyn Park are middle school (5,242 | 21.2%), high school (5,187 | 21.0%), and college / undergraduate (5,115 | 20.7%).
| School Level | # Students | % Students |
| Nursery / Preschool | 1,332 | 5.4% |
| Kindergarten | 1,403 | 5.7% |
| Elementary School | 4,917 | 19.9% |
| Middle School | 5,242 | 21.2% |
| High School | 5,187 | 21.0% |
| College / Undergraduate | 5,115 | 20.7% |
| Graduate / Professional | 1,486 | 6.0% |
| Total | 24,682 | 100.0% |
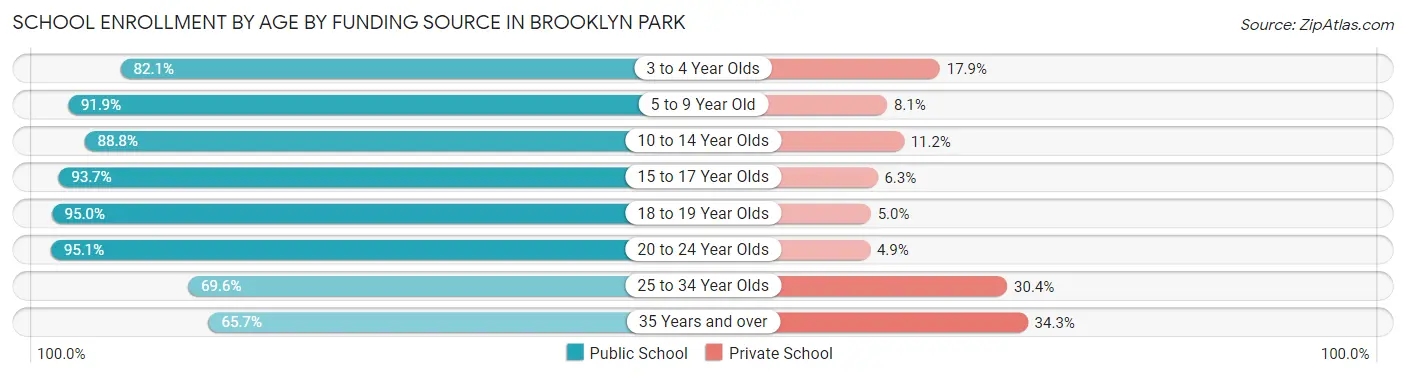
School Enrollment by Age by Funding Source in Brooklyn Park
Out of a total of 24,682 students who are enrolled in schools in Brooklyn Park, 3,036 (12.3%) attend a private institution, while the remaining 21,646 (87.7%) are enrolled in public schools. The age group of 35 years and over has the highest likelihood of being enrolled in private schools, with 648 (34.3% in the age bracket) enrolled. Conversely, the age group of 20 to 24 year olds has the lowest likelihood of being enrolled in a private school, with 2,096 (95.1% in the age bracket) attending a public institution.
| Age Bracket | Public School | Private School |
| 3 to 4 Year Olds | 734 (82.1%) | 160 (17.9%) |
| 5 to 9 Year Old | 5,873 (91.9%) | 515 (8.1%) |
| 10 to 14 Year Olds | 5,520 (88.8%) | 695 (11.2%) |
| 15 to 17 Year Olds | 3,569 (93.7%) | 240 (6.3%) |
| 18 to 19 Year Olds | 1,188 (95.0%) | 63 (5.0%) |
| 20 to 24 Year Olds | 2,096 (95.1%) | 108 (4.9%) |
| 25 to 34 Year Olds | 1,412 (69.6%) | 618 (30.4%) |
| 35 Years and over | 1,243 (65.7%) | 648 (34.3%) |
| Total | 21,646 (87.7%) | 3,036 (12.3%) |
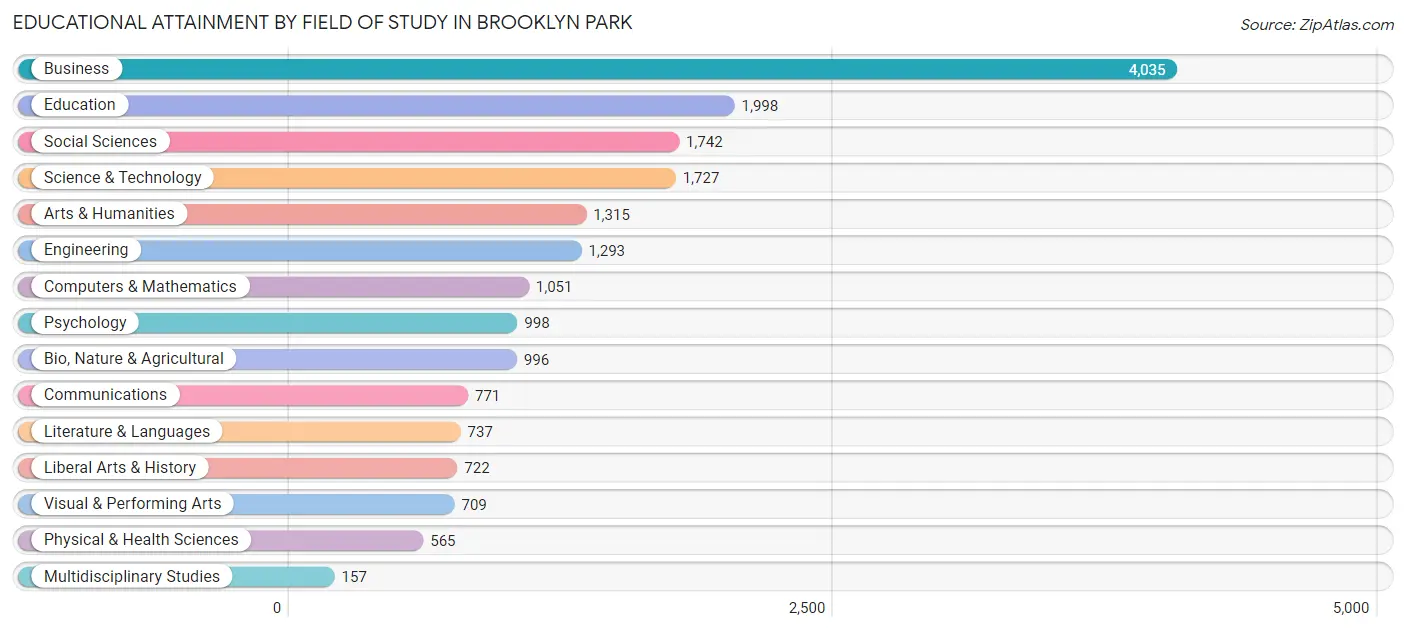
Educational Attainment by Field of Study in Brooklyn Park
Business (4,035 | 21.4%), education (1,998 | 10.6%), social sciences (1,742 | 9.3%), science & technology (1,727 | 9.2%), and arts & humanities (1,315 | 7.0%) are the most common fields of study among 18,816 individuals in Brooklyn Park who have obtained a bachelor's degree or higher.
| Field of Study | # Graduates | % Graduates |
| Computers & Mathematics | 1,051 | 5.6% |
| Bio, Nature & Agricultural | 996 | 5.3% |
| Physical & Health Sciences | 565 | 3.0% |
| Psychology | 998 | 5.3% |
| Social Sciences | 1,742 | 9.3% |
| Engineering | 1,293 | 6.9% |
| Multidisciplinary Studies | 157 | 0.8% |
| Science & Technology | 1,727 | 9.2% |
| Business | 4,035 | 21.4% |
| Education | 1,998 | 10.6% |
| Literature & Languages | 737 | 3.9% |
| Liberal Arts & History | 722 | 3.8% |
| Visual & Performing Arts | 709 | 3.8% |
| Communications | 771 | 4.1% |
| Arts & Humanities | 1,315 | 7.0% |
| Total | 18,816 | 100.0% |
Transportation & Commute in Brooklyn Park
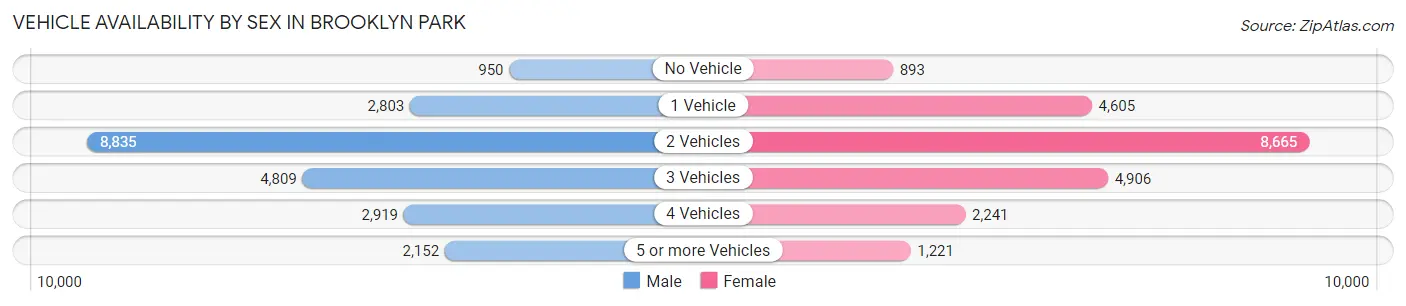
Vehicle Availability by Sex in Brooklyn Park
The most prevalent vehicle ownership categories in Brooklyn Park are males with 2 vehicles (8,835, accounting for 39.3%) and females with 2 vehicles (8,665, making up 39.2%).
| Vehicles Available | Male | Female |
| No Vehicle | 950 (4.2%) | 893 (4.0%) |
| 1 Vehicle | 2,803 (12.5%) | 4,605 (20.4%) |
| 2 Vehicles | 8,835 (39.3%) | 8,665 (38.5%) |
| 3 Vehicles | 4,809 (21.4%) | 4,906 (21.8%) |
| 4 Vehicles | 2,919 (13.0%) | 2,241 (10.0%) |
| 5 or more Vehicles | 2,152 (9.6%) | 1,221 (5.4%) |
| Total | 22,468 (100.0%) | 22,531 (100.0%) |
Commute Time in Brooklyn Park
The most frequently occuring commute durations in Brooklyn Park are 15 to 19 minutes (8,133 commuters, 20.2%), 30 to 34 minutes (7,631 commuters, 18.9%), and 20 to 24 minutes (6,835 commuters, 17.0%).
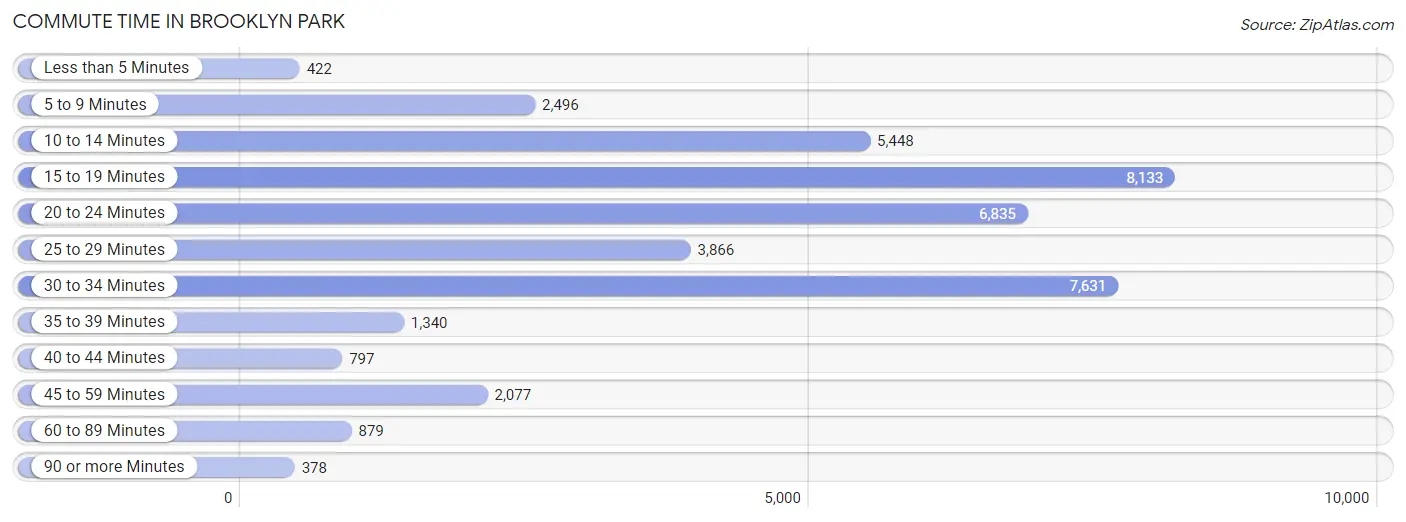
| Commute Time | # Commuters | % Commuters |
| Less than 5 Minutes | 422 | 1.1% |
| 5 to 9 Minutes | 2,496 | 6.2% |
| 10 to 14 Minutes | 5,448 | 13.5% |
| 15 to 19 Minutes | 8,133 | 20.2% |
| 20 to 24 Minutes | 6,835 | 17.0% |
| 25 to 29 Minutes | 3,866 | 9.6% |
| 30 to 34 Minutes | 7,631 | 18.9% |
| 35 to 39 Minutes | 1,340 | 3.3% |
| 40 to 44 Minutes | 797 | 2.0% |
| 45 to 59 Minutes | 2,077 | 5.1% |
| 60 to 89 Minutes | 879 | 2.2% |
| 90 or more Minutes | 378 | 0.9% |
Commute Time by Sex in Brooklyn Park
The most common commute times in Brooklyn Park are 15 to 19 minutes (4,428 commuters, 21.6%) for males and 30 to 34 minutes (3,818 commuters, 19.3%) for females.
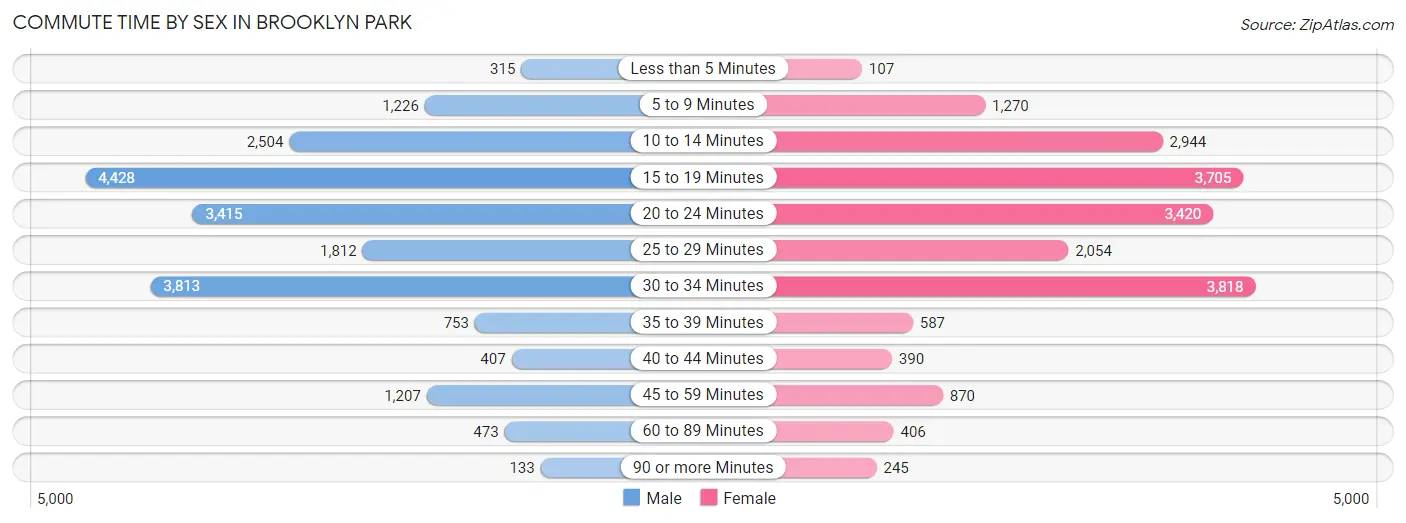
| Commute Time | Male | Female |
| Less than 5 Minutes | 315 (1.5%) | 107 (0.5%) |
| 5 to 9 Minutes | 1,226 (6.0%) | 1,270 (6.4%) |
| 10 to 14 Minutes | 2,504 (12.2%) | 2,944 (14.9%) |
| 15 to 19 Minutes | 4,428 (21.6%) | 3,705 (18.7%) |
| 20 to 24 Minutes | 3,415 (16.7%) | 3,420 (17.3%) |
| 25 to 29 Minutes | 1,812 (8.8%) | 2,054 (10.4%) |
| 30 to 34 Minutes | 3,813 (18.6%) | 3,818 (19.3%) |
| 35 to 39 Minutes | 753 (3.7%) | 587 (3.0%) |
| 40 to 44 Minutes | 407 (2.0%) | 390 (2.0%) |
| 45 to 59 Minutes | 1,207 (5.9%) | 870 (4.4%) |
| 60 to 89 Minutes | 473 (2.3%) | 406 (2.1%) |
| 90 or more Minutes | 133 (0.6%) | 245 (1.2%) |
Time of Departure to Work by Sex in Brooklyn Park
The most frequent times of departure to work in Brooklyn Park are 12:00 PM to 3:59 PM (2,552, 12.5%) for males and 7:00 AM to 7:29 AM (2,803, 14.1%) for females.
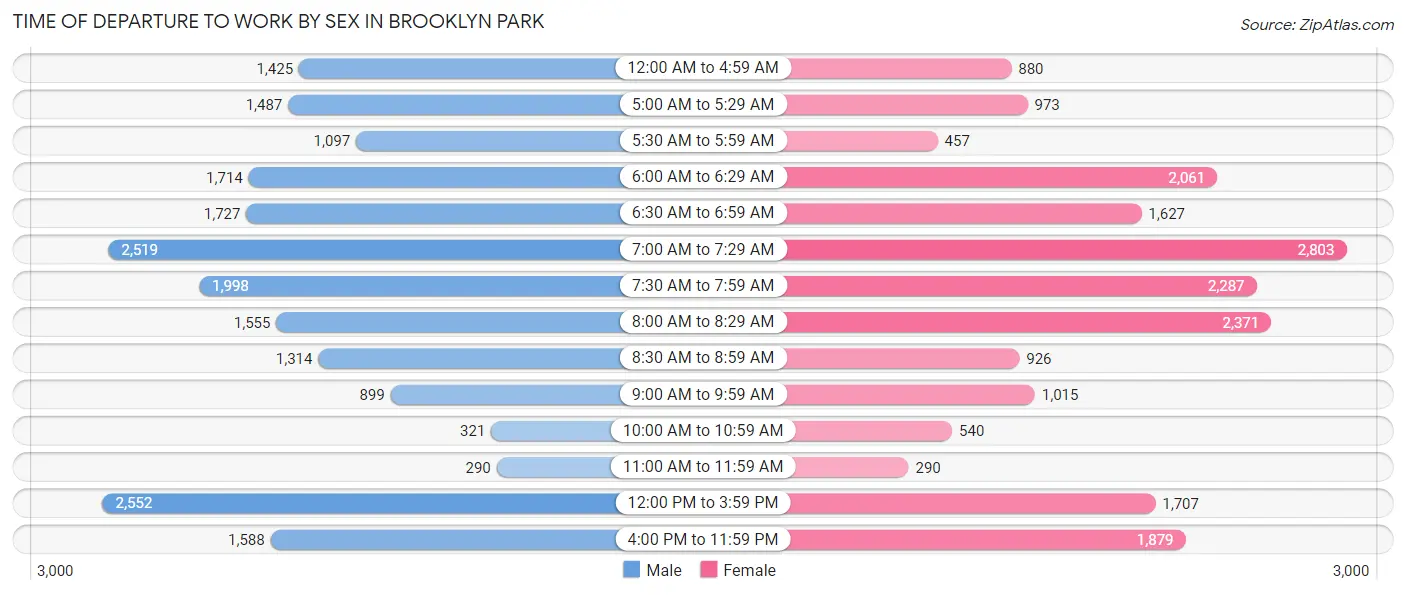
| Time of Departure | Male | Female |
| 12:00 AM to 4:59 AM | 1,425 (7.0%) | 880 (4.4%) |
| 5:00 AM to 5:29 AM | 1,487 (7.3%) | 973 (4.9%) |
| 5:30 AM to 5:59 AM | 1,097 (5.3%) | 457 (2.3%) |
| 6:00 AM to 6:29 AM | 1,714 (8.4%) | 2,061 (10.4%) |
| 6:30 AM to 6:59 AM | 1,727 (8.4%) | 1,627 (8.2%) |
| 7:00 AM to 7:29 AM | 2,519 (12.3%) | 2,803 (14.1%) |
| 7:30 AM to 7:59 AM | 1,998 (9.8%) | 2,287 (11.5%) |
| 8:00 AM to 8:29 AM | 1,555 (7.6%) | 2,371 (12.0%) |
| 8:30 AM to 8:59 AM | 1,314 (6.4%) | 926 (4.7%) |
| 9:00 AM to 9:59 AM | 899 (4.4%) | 1,015 (5.1%) |
| 10:00 AM to 10:59 AM | 321 (1.6%) | 540 (2.7%) |
| 11:00 AM to 11:59 AM | 290 (1.4%) | 290 (1.5%) |
| 12:00 PM to 3:59 PM | 2,552 (12.5%) | 1,707 (8.6%) |
| 4:00 PM to 11:59 PM | 1,588 (7.7%) | 1,879 (9.5%) |
| Total | 20,486 (100.0%) | 19,816 (100.0%) |
Housing Occupancy in Brooklyn Park
Occupancy by Ownership in Brooklyn Park
Of the total 29,603 dwellings in Brooklyn Park, owner-occupied units account for 20,494 (69.2%), while renter-occupied units make up 9,109 (30.8%).
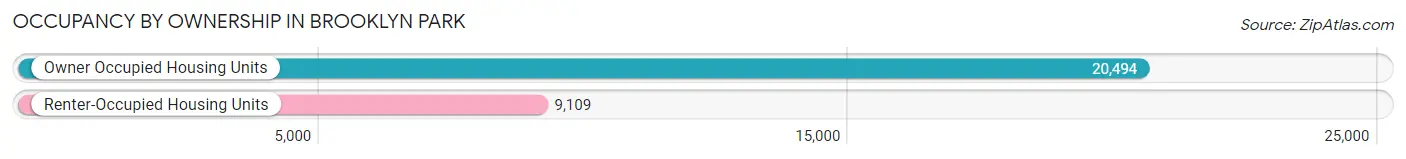
| Occupancy | # Housing Units | % Housing Units |
| Owner Occupied Housing Units | 20,494 | 69.2% |
| Renter-Occupied Housing Units | 9,109 | 30.8% |
| Total Occupied Housing Units | 29,603 | 100.0% |
Occupancy by Household Size in Brooklyn Park
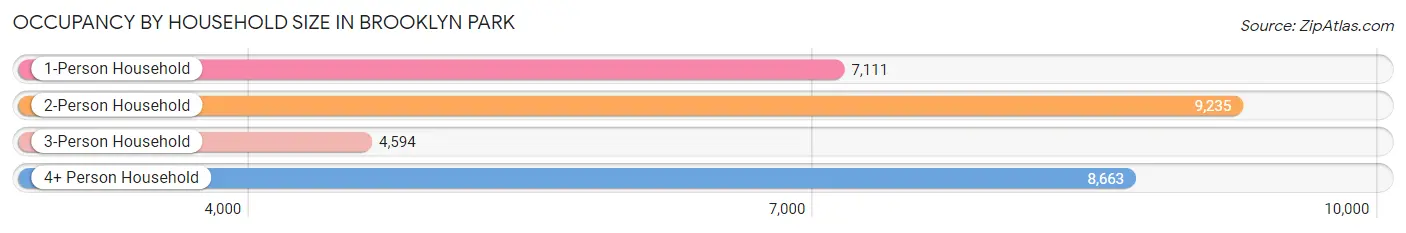
| Household Size | # Housing Units | % Housing Units |
| 1-Person Household | 7,111 | 24.0% |
| 2-Person Household | 9,235 | 31.2% |
| 3-Person Household | 4,594 | 15.5% |
| 4+ Person Household | 8,663 | 29.3% |
| Total Housing Units | 29,603 | 100.0% |
Occupancy by Ownership by Household Size in Brooklyn Park
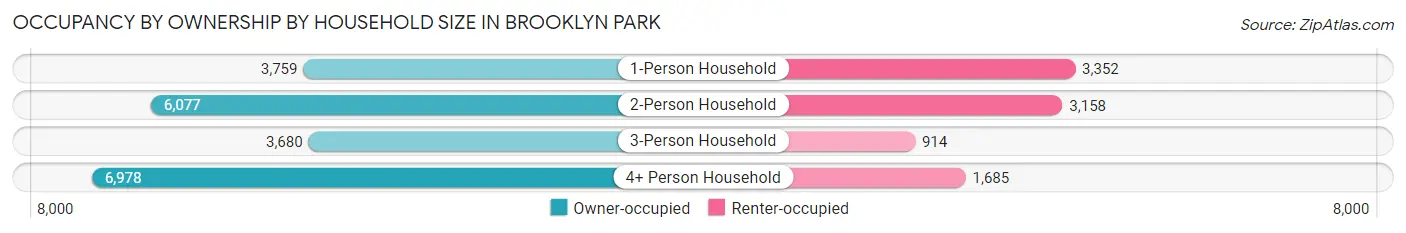
| Household Size | Owner-occupied | Renter-occupied |
| 1-Person Household | 3,759 (52.9%) | 3,352 (47.1%) |
| 2-Person Household | 6,077 (65.8%) | 3,158 (34.2%) |
| 3-Person Household | 3,680 (80.1%) | 914 (19.9%) |
| 4+ Person Household | 6,978 (80.5%) | 1,685 (19.5%) |
| Total Housing Units | 20,494 (69.2%) | 9,109 (30.8%) |
Occupancy by Educational Attainment in Brooklyn Park
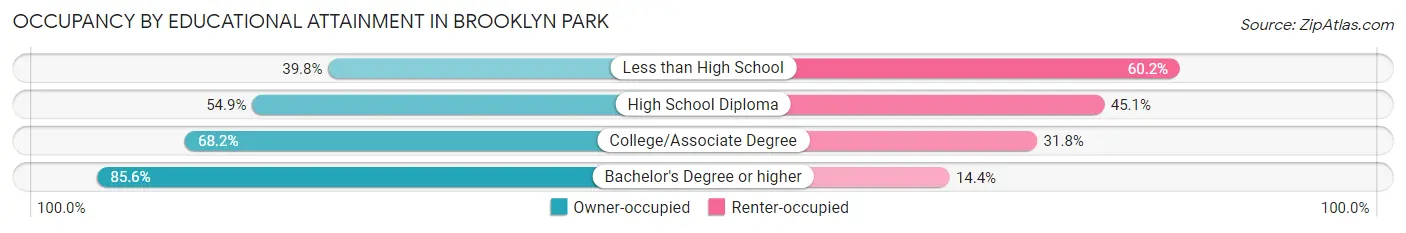
| Household Size | Owner-occupied | Renter-occupied |
| Less than High School | 931 (39.8%) | 1,409 (60.2%) |
| High School Diploma | 3,205 (54.9%) | 2,636 (45.1%) |
| College/Associate Degree | 7,735 (68.2%) | 3,610 (31.8%) |
| Bachelor's Degree or higher | 8,623 (85.6%) | 1,454 (14.4%) |
Occupancy by Age of Householder in Brooklyn Park
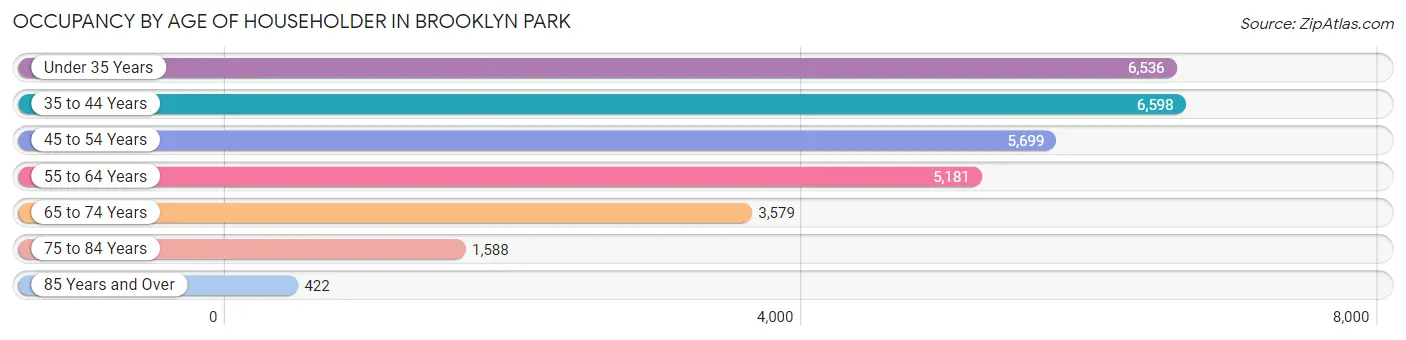
| Age Bracket | # Households | % Households |
| Under 35 Years | 6,536 | 22.1% |
| 35 to 44 Years | 6,598 | 22.3% |
| 45 to 54 Years | 5,699 | 19.3% |
| 55 to 64 Years | 5,181 | 17.5% |
| 65 to 74 Years | 3,579 | 12.1% |
| 75 to 84 Years | 1,588 | 5.4% |
| 85 Years and Over | 422 | 1.4% |
| Total | 29,603 | 100.0% |
Housing Finances in Brooklyn Park
Median Income by Occupancy in Brooklyn Park
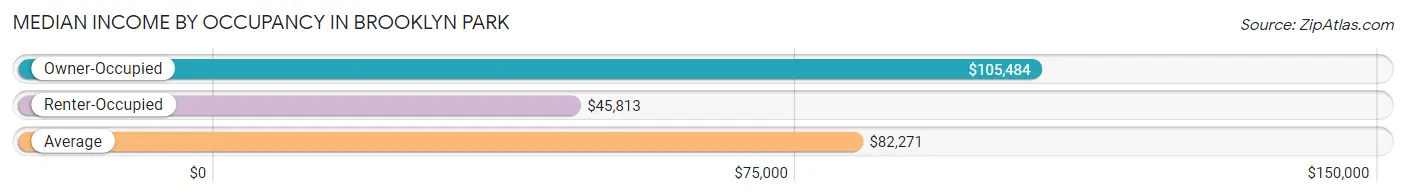
| Occupancy Type | # Households | Median Income |
| Owner-Occupied | 20,494 (69.2%) | $105,484 |
| Renter-Occupied | 9,109 (30.8%) | $45,813 |
| Average | 29,603 (100.0%) | $82,271 |
Occupancy by Householder Income Bracket in Brooklyn Park
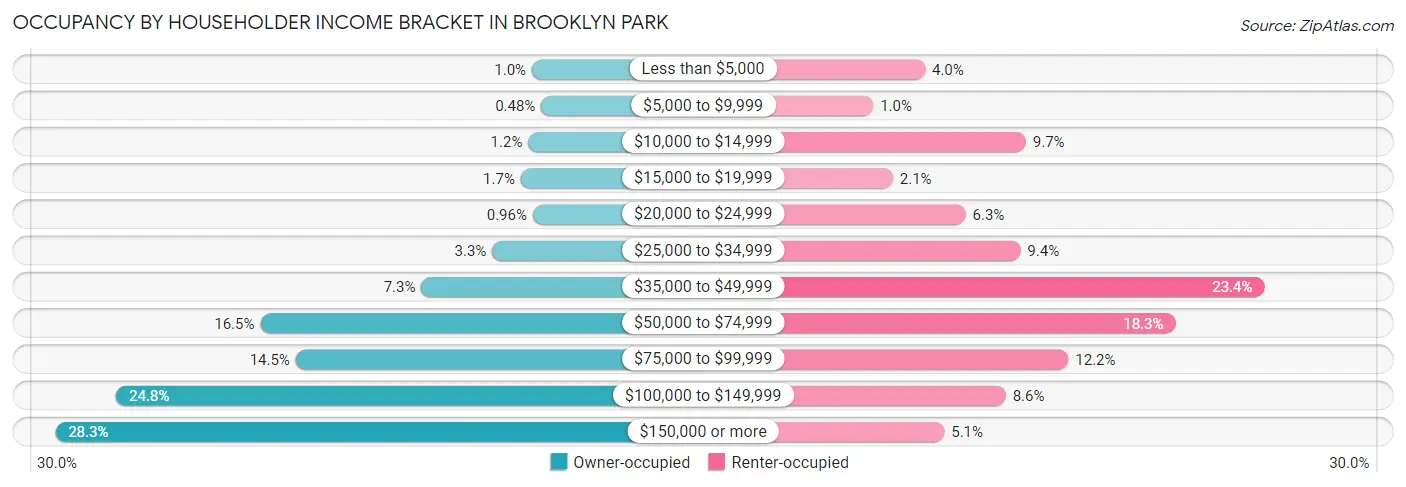
| Income Bracket | Owner-occupied | Renter-occupied |
| Less than $5,000 | 208 (1.0%) | 362 (4.0%) |
| $5,000 to $9,999 | 99 (0.5%) | 92 (1.0%) |
| $10,000 to $14,999 | 251 (1.2%) | 886 (9.7%) |
| $15,000 to $19,999 | 338 (1.7%) | 194 (2.1%) |
| $20,000 to $24,999 | 196 (1.0%) | 573 (6.3%) |
| $25,000 to $34,999 | 673 (3.3%) | 858 (9.4%) |
| $35,000 to $49,999 | 1,503 (7.3%) | 2,128 (23.4%) |
| $50,000 to $74,999 | 3,388 (16.5%) | 1,664 (18.3%) |
| $75,000 to $99,999 | 2,973 (14.5%) | 1,108 (12.2%) |
| $100,000 to $149,999 | 5,076 (24.8%) | 782 (8.6%) |
| $150,000 or more | 5,789 (28.2%) | 462 (5.1%) |
| Total | 20,494 (100.0%) | 9,109 (100.0%) |
Monthly Housing Cost Tiers in Brooklyn Park
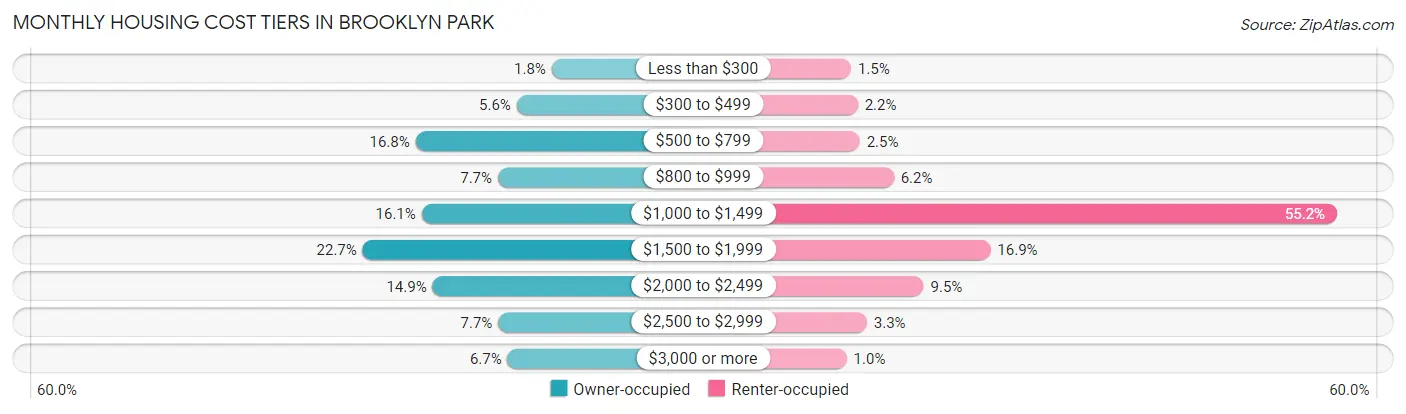
| Monthly Cost | Owner-occupied | Renter-occupied |
| Less than $300 | 363 (1.8%) | 137 (1.5%) |
| $300 to $499 | 1,155 (5.6%) | 204 (2.2%) |
| $500 to $799 | 3,446 (16.8%) | 224 (2.5%) |
| $800 to $999 | 1,582 (7.7%) | 567 (6.2%) |
| $1,000 to $1,499 | 3,307 (16.1%) | 5,026 (55.2%) |
| $1,500 to $1,999 | 4,643 (22.7%) | 1,539 (16.9%) |
| $2,000 to $2,499 | 3,061 (14.9%) | 867 (9.5%) |
| $2,500 to $2,999 | 1,574 (7.7%) | 296 (3.3%) |
| $3,000 or more | 1,363 (6.7%) | 93 (1.0%) |
| Total | 20,494 (100.0%) | 9,109 (100.0%) |
Physical Housing Characteristics in Brooklyn Park
Housing Structures in Brooklyn Park
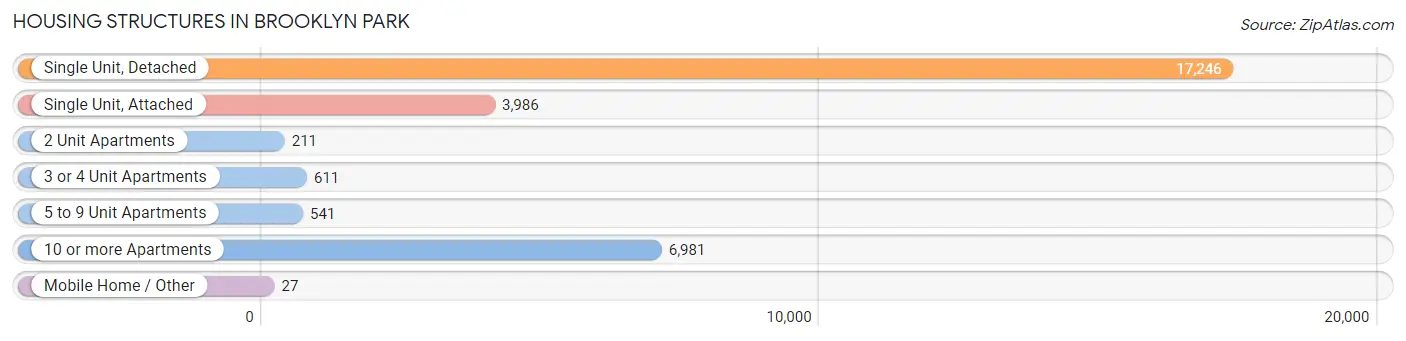
| Structure Type | # Housing Units | % Housing Units |
| Single Unit, Detached | 17,246 | 58.3% |
| Single Unit, Attached | 3,986 | 13.5% |
| 2 Unit Apartments | 211 | 0.7% |
| 3 or 4 Unit Apartments | 611 | 2.1% |
| 5 to 9 Unit Apartments | 541 | 1.8% |
| 10 or more Apartments | 6,981 | 23.6% |
| Mobile Home / Other | 27 | 0.1% |
| Total | 29,603 | 100.0% |
Housing Structures by Occupancy in Brooklyn Park
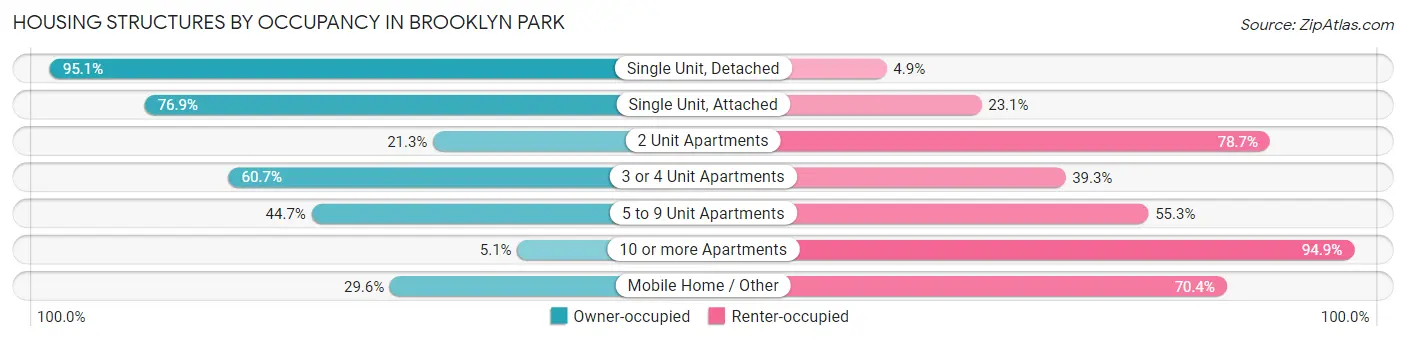
| Structure Type | Owner-occupied | Renter-occupied |
| Single Unit, Detached | 16,407 (95.1%) | 839 (4.9%) |
| Single Unit, Attached | 3,064 (76.9%) | 922 (23.1%) |
| 2 Unit Apartments | 45 (21.3%) | 166 (78.7%) |
| 3 or 4 Unit Apartments | 371 (60.7%) | 240 (39.3%) |
| 5 to 9 Unit Apartments | 242 (44.7%) | 299 (55.3%) |
| 10 or more Apartments | 357 (5.1%) | 6,624 (94.9%) |
| Mobile Home / Other | 8 (29.6%) | 19 (70.4%) |
| Total | 20,494 (69.2%) | 9,109 (30.8%) |
Housing Structures by Number of Rooms in Brooklyn Park
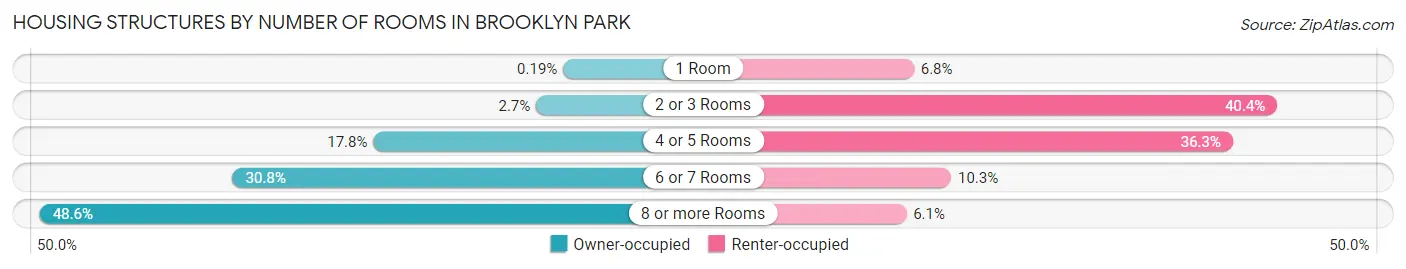
| Number of Rooms | Owner-occupied | Renter-occupied |
| 1 Room | 39 (0.2%) | 622 (6.8%) |
| 2 or 3 Rooms | 552 (2.7%) | 3,684 (40.4%) |
| 4 or 5 Rooms | 3,638 (17.7%) | 3,309 (36.3%) |
| 6 or 7 Rooms | 6,305 (30.8%) | 936 (10.3%) |
| 8 or more Rooms | 9,960 (48.6%) | 558 (6.1%) |
| Total | 20,494 (100.0%) | 9,109 (100.0%) |
Housing Structure by Heating Type in Brooklyn Park
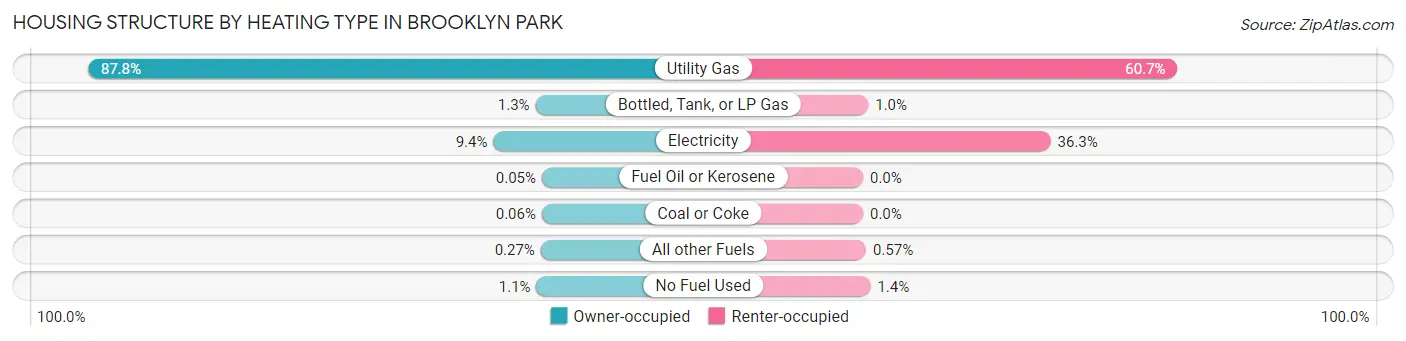
| Heating Type | Owner-occupied | Renter-occupied |
| Utility Gas | 17,992 (87.8%) | 5,533 (60.7%) |
| Bottled, Tank, or LP Gas | 264 (1.3%) | 92 (1.0%) |
| Electricity | 1,933 (9.4%) | 3,302 (36.2%) |
| Fuel Oil or Kerosene | 10 (0.1%) | 0 (0.0%) |
| Coal or Coke | 13 (0.1%) | 0 (0.0%) |
| All other Fuels | 56 (0.3%) | 52 (0.6%) |
| No Fuel Used | 226 (1.1%) | 130 (1.4%) |
| Total | 20,494 (100.0%) | 9,109 (100.0%) |
Household Vehicle Usage in Brooklyn Park
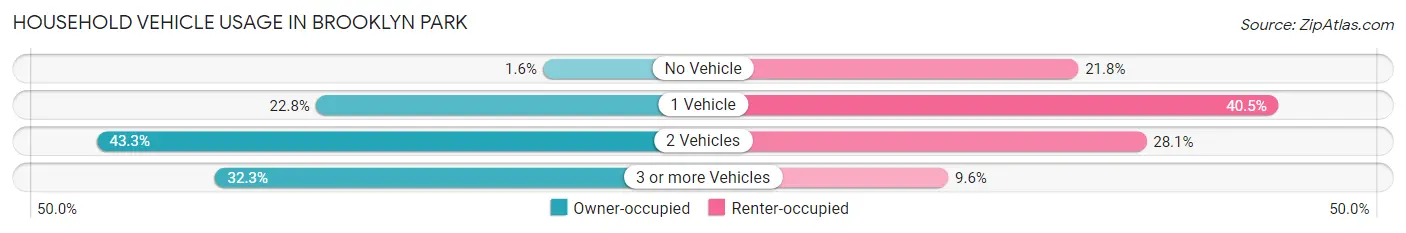
| Vehicles per Household | Owner-occupied | Renter-occupied |
| No Vehicle | 335 (1.6%) | 1,984 (21.8%) |
| 1 Vehicle | 4,678 (22.8%) | 3,686 (40.5%) |
| 2 Vehicles | 8,869 (43.3%) | 2,562 (28.1%) |
| 3 or more Vehicles | 6,612 (32.3%) | 877 (9.6%) |
| Total | 20,494 (100.0%) | 9,109 (100.0%) |
Real Estate & Mortgages in Brooklyn Park
Real Estate and Mortgage Overview in Brooklyn Park
| Characteristic | Without Mortgage | With Mortgage |
| Housing Units | 6,227 | 14,267 |
| Median Property Value | $276,200 | $296,000 |
| Median Household Income | $90,625 | $4,304 |
| Monthly Housing Costs | $676 | $1,327 |
| Real Estate Taxes | $3,417 | $410 |
Property Value by Mortgage Status in Brooklyn Park
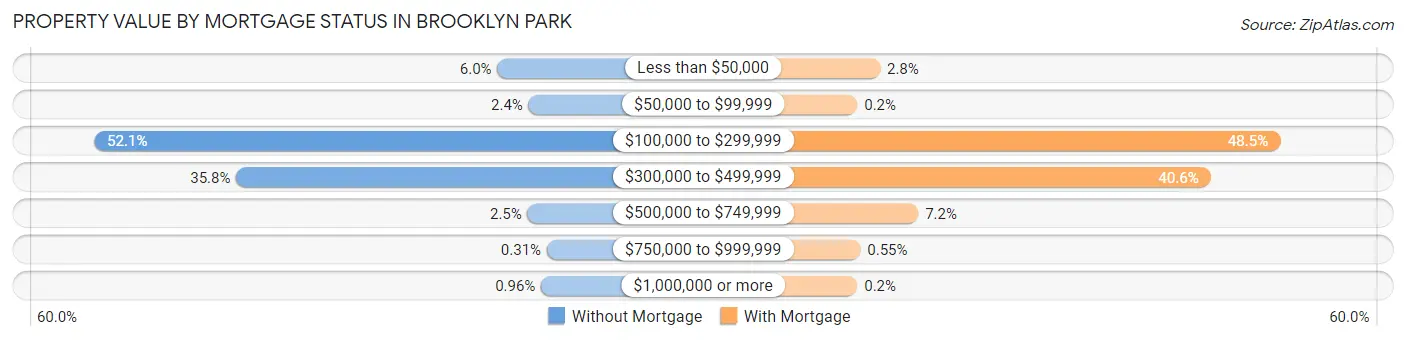
| Property Value | Without Mortgage | With Mortgage |
| Less than $50,000 | 371 (6.0%) | 400 (2.8%) |
| $50,000 to $99,999 | 149 (2.4%) | 29 (0.2%) |
| $100,000 to $299,999 | 3,242 (52.1%) | 6,920 (48.5%) |
| $300,000 to $499,999 | 2,230 (35.8%) | 5,789 (40.6%) |
| $500,000 to $749,999 | 156 (2.5%) | 1,022 (7.2%) |
| $750,000 to $999,999 | 19 (0.3%) | 78 (0.5%) |
| $1,000,000 or more | 60 (1.0%) | 29 (0.2%) |
| Total | 6,227 (100.0%) | 14,267 (100.0%) |
Household Income by Mortgage Status in Brooklyn Park

| Household Income | Without Mortgage | With Mortgage |
| Less than $10,000 | 137 (2.2%) | 100 (0.7%) |
| $10,000 to $24,999 | 246 (4.0%) | 170 (1.2%) |
| $25,000 to $34,999 | 372 (6.0%) | 539 (3.8%) |
| $35,000 to $49,999 | 534 (8.6%) | 301 (2.1%) |
| $50,000 to $74,999 | 1,311 (21.0%) | 969 (6.8%) |
| $75,000 to $99,999 | 885 (14.2%) | 2,077 (14.6%) |
| $100,000 to $149,999 | 1,257 (20.2%) | 2,088 (14.6%) |
| $150,000 or more | 1,485 (23.8%) | 3,819 (26.8%) |
| Total | 6,227 (100.0%) | 14,267 (100.0%) |
Property Value to Household Income Ratio in Brooklyn Park
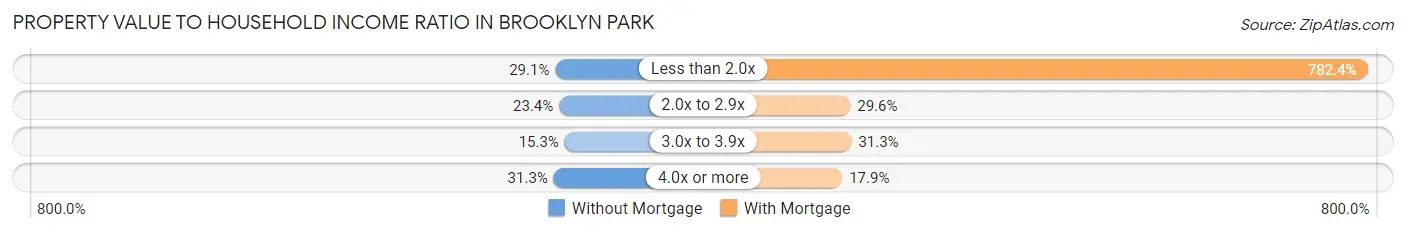
| Value-to-Income Ratio | Without Mortgage | With Mortgage |
| Less than 2.0x | 1,811 (29.1%) | 111,619 (782.4%) |
| 2.0x to 2.9x | 1,457 (23.4%) | 4,226 (29.6%) |
| 3.0x to 3.9x | 951 (15.3%) | 4,464 (31.3%) |
| 4.0x or more | 1,950 (31.3%) | 2,558 (17.9%) |
| Total | 6,227 (100.0%) | 14,267 (100.0%) |
Real Estate Taxes by Mortgage Status in Brooklyn Park
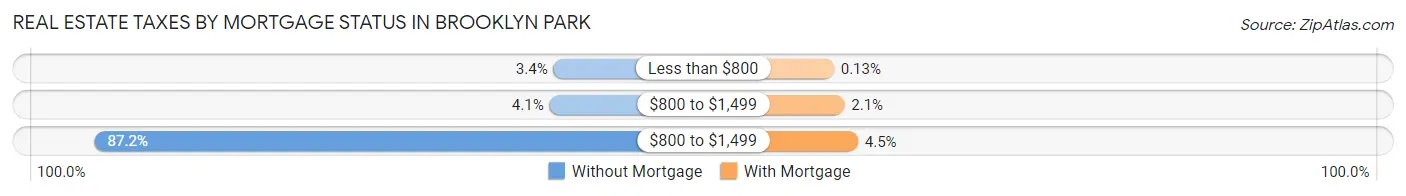
| Property Taxes | Without Mortgage | With Mortgage |
| Less than $800 | 212 (3.4%) | 18 (0.1%) |
| $800 to $1,499 | 257 (4.1%) | 294 (2.1%) |
| $800 to $1,499 | 5,430 (87.2%) | 647 (4.5%) |
| Total | 6,227 (100.0%) | 14,267 (100.0%) |
Health & Disability in Brooklyn Park
Health Insurance Coverage by Age in Brooklyn Park
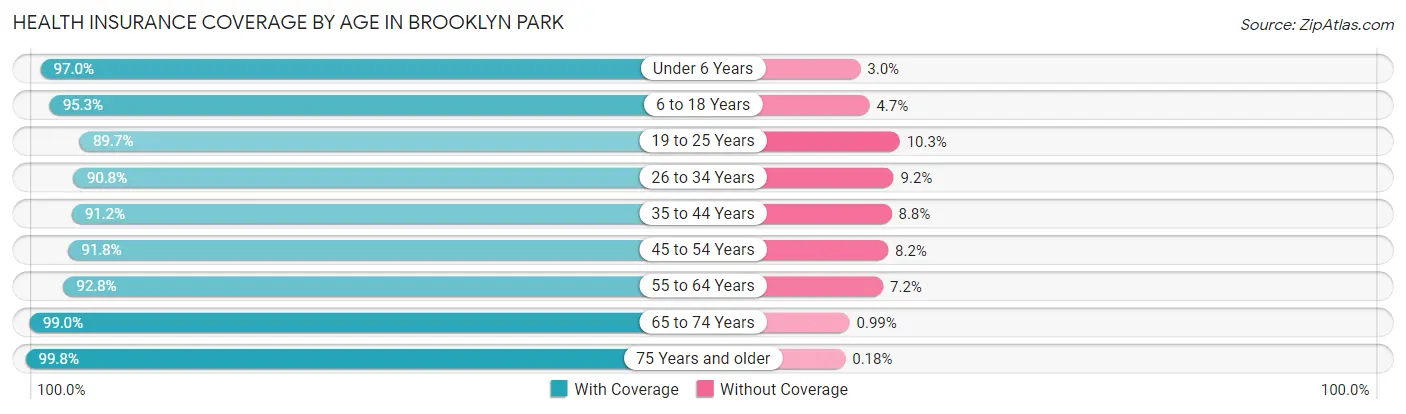
| Age Bracket | With Coverage | Without Coverage |
| Under 6 Years | 7,443 (97.0%) | 230 (3.0%) |
| 6 to 18 Years | 15,545 (95.3%) | 765 (4.7%) |
| 19 to 25 Years | 6,668 (89.7%) | 768 (10.3%) |
| 26 to 34 Years | 9,767 (90.8%) | 988 (9.2%) |
| 35 to 44 Years | 11,366 (91.2%) | 1,098 (8.8%) |
| 45 to 54 Years | 9,818 (91.8%) | 873 (8.2%) |
| 55 to 64 Years | 8,779 (92.8%) | 684 (7.2%) |
| 65 to 74 Years | 6,223 (99.0%) | 62 (1.0%) |
| 75 Years and older | 3,794 (99.8%) | 7 (0.2%) |
| Total | 79,403 (93.5%) | 5,475 (6.5%) |
Health Insurance Coverage by Citizenship Status in Brooklyn Park
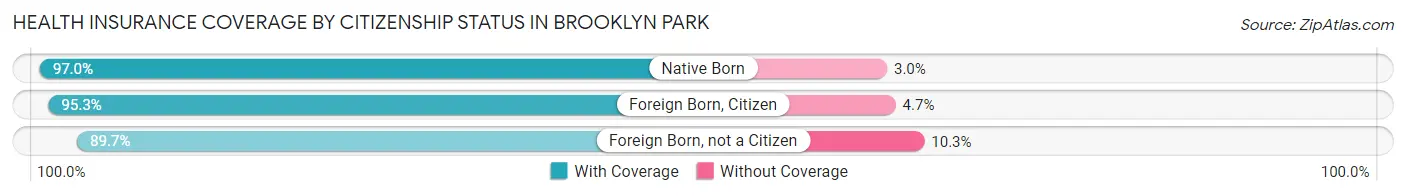
| Citizenship Status | With Coverage | Without Coverage |
| Native Born | 7,443 (97.0%) | 230 (3.0%) |
| Foreign Born, Citizen | 15,545 (95.3%) | 765 (4.7%) |
| Foreign Born, not a Citizen | 6,668 (89.7%) | 768 (10.3%) |
Health Insurance Coverage by Household Income in Brooklyn Park
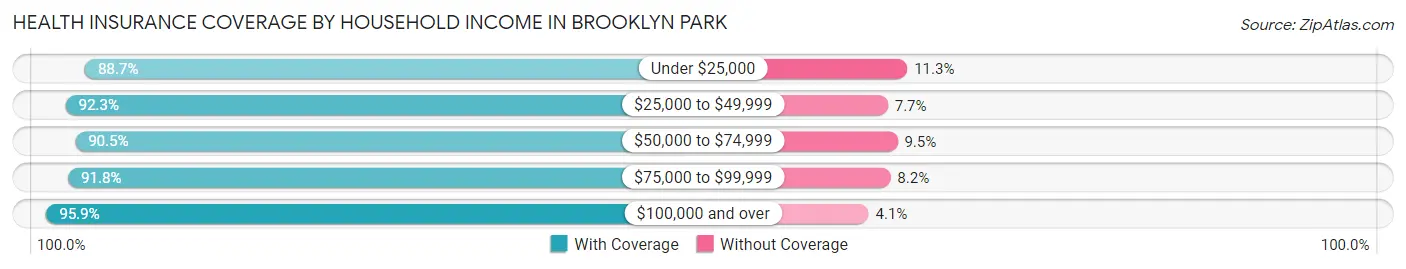
| Household Income | With Coverage | Without Coverage |
| Under $25,000 | 4,685 (88.7%) | 598 (11.3%) |
| $25,000 to $49,999 | 10,464 (92.3%) | 870 (7.7%) |
| $50,000 to $74,999 | 11,662 (90.5%) | 1,223 (9.5%) |
| $75,000 to $99,999 | 11,880 (91.8%) | 1,057 (8.2%) |
| $100,000 and over | 40,413 (95.9%) | 1,720 (4.1%) |
Public vs Private Health Insurance Coverage by Age in Brooklyn Park
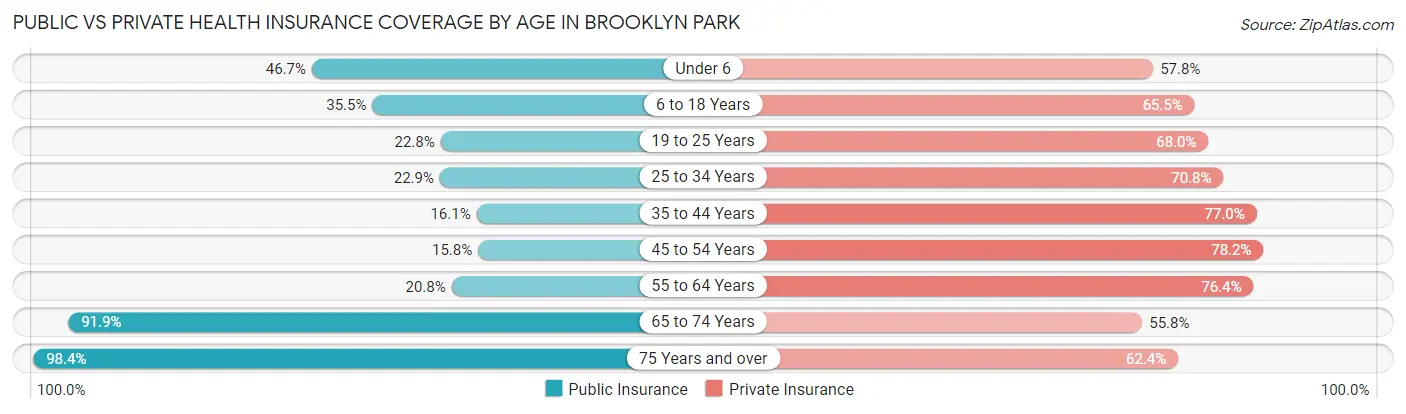
| Age Bracket | Public Insurance | Private Insurance |
| Under 6 | 3,582 (46.7%) | 4,435 (57.8%) |
| 6 to 18 Years | 5,784 (35.5%) | 10,683 (65.5%) |
| 19 to 25 Years | 1,695 (22.8%) | 5,059 (68.0%) |
| 25 to 34 Years | 2,466 (22.9%) | 7,617 (70.8%) |
| 35 to 44 Years | 2,009 (16.1%) | 9,596 (77.0%) |
| 45 to 54 Years | 1,693 (15.8%) | 8,364 (78.2%) |
| 55 to 64 Years | 1,964 (20.7%) | 7,231 (76.4%) |
| 65 to 74 Years | 5,776 (91.9%) | 3,506 (55.8%) |
| 75 Years and over | 3,740 (98.4%) | 2,372 (62.4%) |
| Total | 28,709 (33.8%) | 58,863 (69.4%) |
Disability Status by Sex by Age in Brooklyn Park
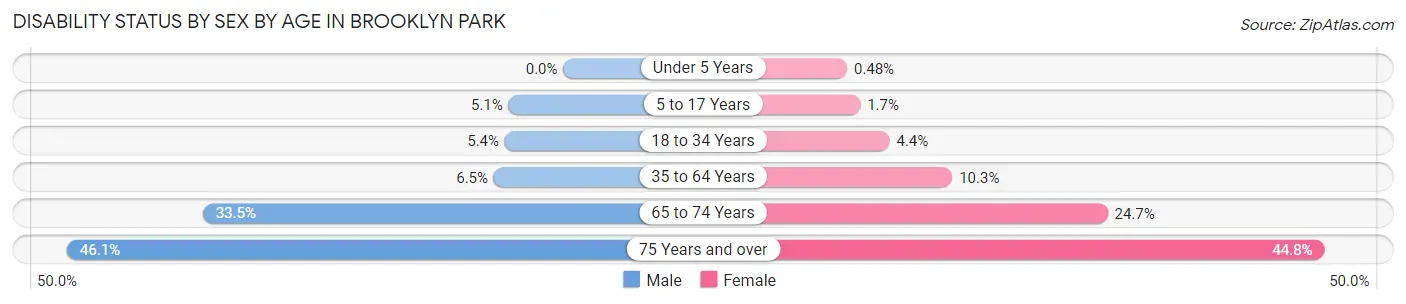
| Age Bracket | Male | Female |
| Under 5 Years | 0 (0.0%) | 14 (0.5%) |
| 5 to 17 Years | 449 (5.1%) | 135 (1.7%) |
| 18 to 34 Years | 516 (5.4%) | 426 (4.4%) |
| 35 to 64 Years | 1,008 (6.5%) | 1,742 (10.2%) |
| 65 to 74 Years | 977 (33.5%) | 830 (24.7%) |
| 75 Years and over | 668 (46.1%) | 1,053 (44.8%) |
Disability Class by Sex by Age in Brooklyn Park
Disability Class: Hearing Difficulty
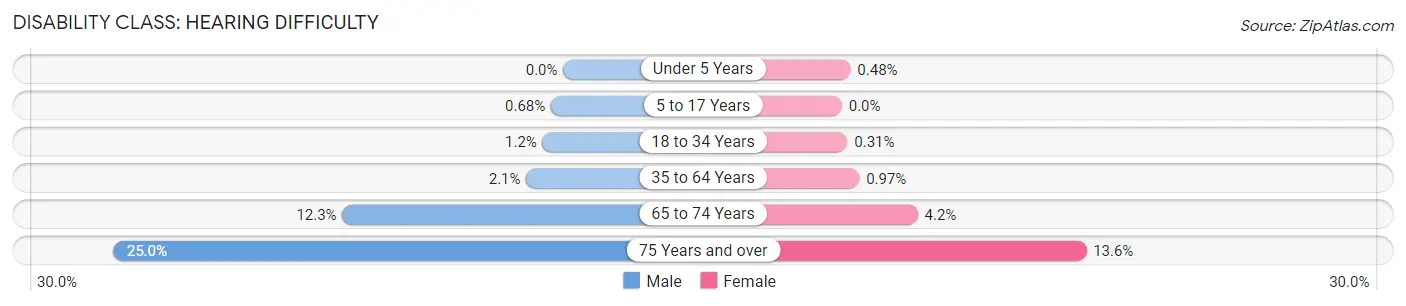
| Age Bracket | Male | Female |
| Under 5 Years | 0 (0.0%) | 14 (0.5%) |
| 5 to 17 Years | 60 (0.7%) | 0 (0.0%) |
| 18 to 34 Years | 109 (1.1%) | 30 (0.3%) |
| 35 to 64 Years | 322 (2.1%) | 165 (1.0%) |
| 65 to 74 Years | 359 (12.3%) | 142 (4.2%) |
| 75 Years and over | 363 (25.0%) | 320 (13.6%) |
Disability Class: Vision Difficulty
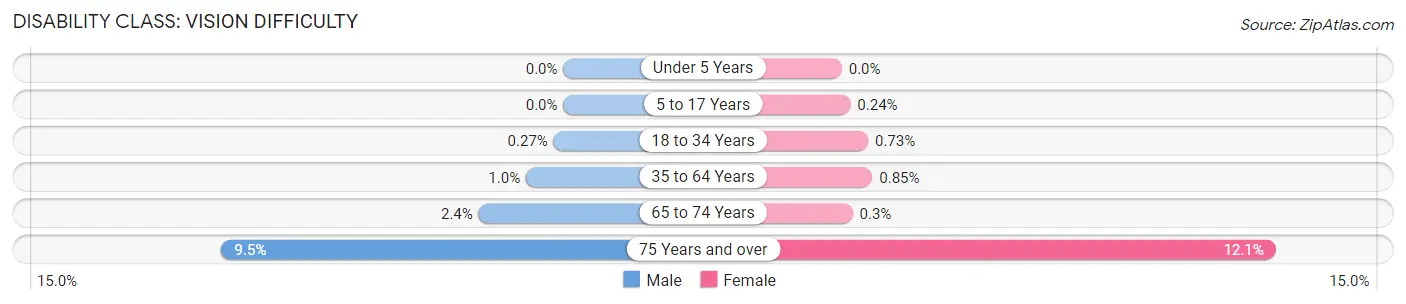
| Age Bracket | Male | Female |
| Under 5 Years | 0 (0.0%) | 0 (0.0%) |
| 5 to 17 Years | 0 (0.0%) | 19 (0.2%) |
| 18 to 34 Years | 26 (0.3%) | 70 (0.7%) |
| 35 to 64 Years | 162 (1.0%) | 144 (0.9%) |
| 65 to 74 Years | 69 (2.4%) | 10 (0.3%) |
| 75 Years and over | 138 (9.5%) | 284 (12.1%) |
Disability Class: Cognitive Difficulty
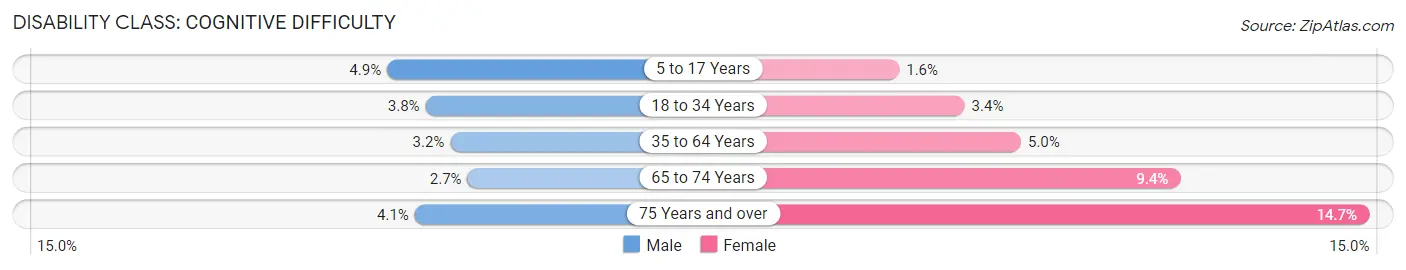
| Age Bracket | Male | Female |
| 5 to 17 Years | 434 (4.9%) | 126 (1.6%) |
| 18 to 34 Years | 365 (3.8%) | 329 (3.4%) |
| 35 to 64 Years | 492 (3.2%) | 849 (5.0%) |
| 65 to 74 Years | 78 (2.7%) | 317 (9.4%) |
| 75 Years and over | 60 (4.1%) | 345 (14.7%) |
Disability Class: Ambulatory Difficulty
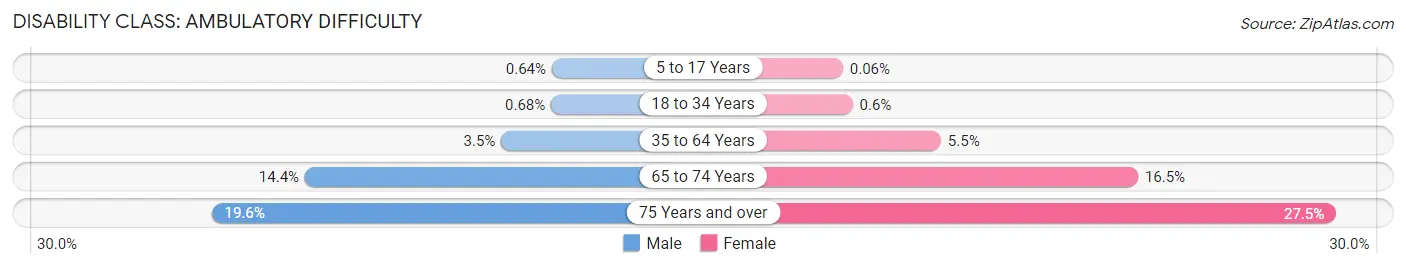
| Age Bracket | Male | Female |
| 5 to 17 Years | 57 (0.6%) | 5 (0.1%) |
| 18 to 34 Years | 65 (0.7%) | 58 (0.6%) |
| 35 to 64 Years | 541 (3.5%) | 939 (5.5%) |
| 65 to 74 Years | 420 (14.4%) | 555 (16.5%) |
| 75 Years and over | 284 (19.6%) | 647 (27.5%) |
Disability Class: Self-Care Difficulty
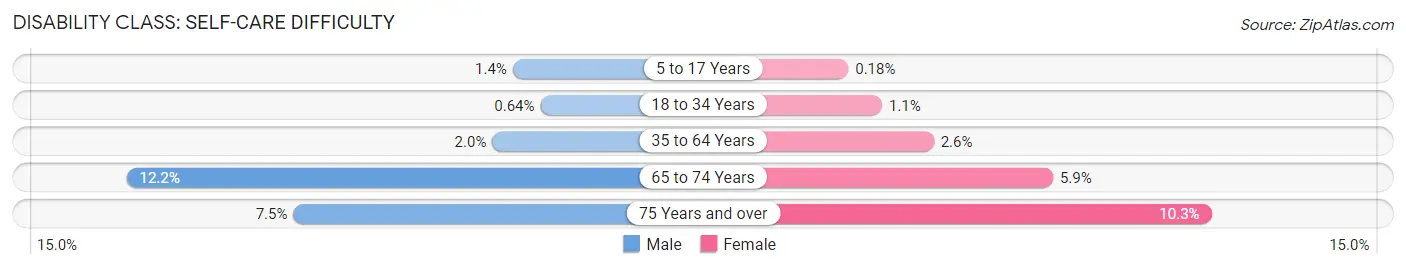
| Age Bracket | Male | Female |
| 5 to 17 Years | 125 (1.4%) | 14 (0.2%) |
| 18 to 34 Years | 61 (0.6%) | 108 (1.1%) |
| 35 to 64 Years | 309 (2.0%) | 435 (2.6%) |
| 65 to 74 Years | 355 (12.2%) | 198 (5.9%) |
| 75 Years and over | 109 (7.5%) | 242 (10.3%) |
Technology Access in Brooklyn Park
Computing Device Access in Brooklyn Park
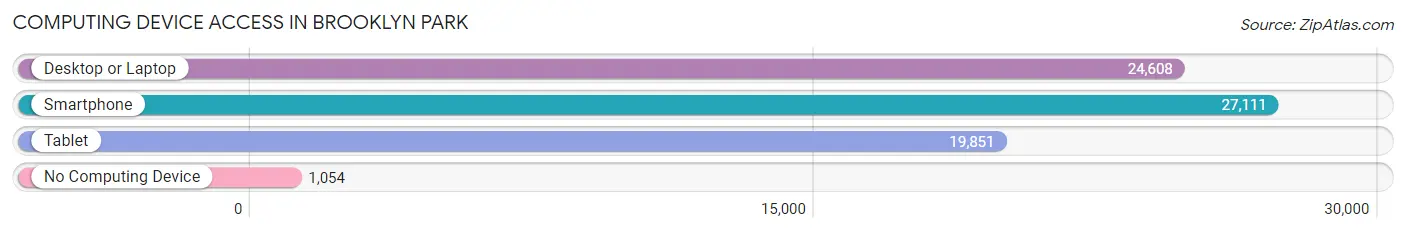
| Device Type | # Households | % Households |
| Desktop or Laptop | 24,608 | 83.1% |
| Smartphone | 27,111 | 91.6% |
| Tablet | 19,851 | 67.1% |
| No Computing Device | 1,054 | 3.6% |
| Total | 29,603 | 100.0% |
Internet Access in Brooklyn Park
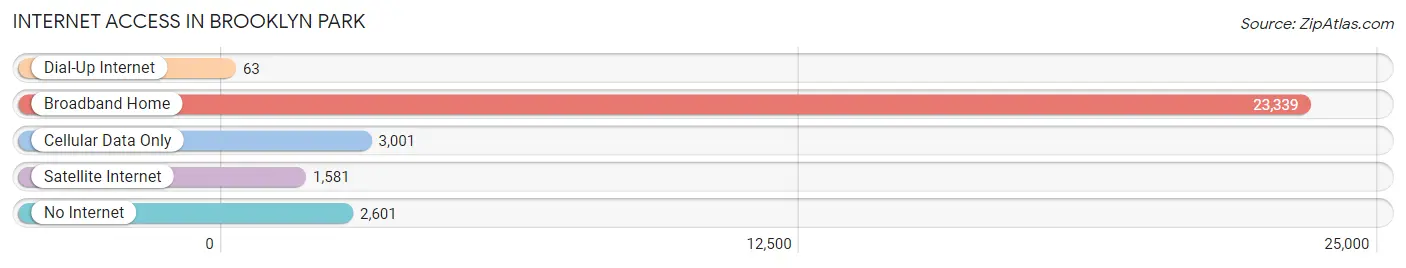
| Internet Type | # Households | % Households |
| Dial-Up Internet | 63 | 0.2% |
| Broadband Home | 23,339 | 78.8% |
| Cellular Data Only | 3,001 | 10.1% |
| Satellite Internet | 1,581 | 5.3% |
| No Internet | 2,601 | 8.8% |
| Total | 29,603 | 100.0% |
Brooklyn Park Summary
Brooklyn Park, Minnesota is a city located in Hennepin County, Minnesota, United States. It is the sixth-largest city in the state and the largest suburb of Minneapolis. As of the 2010 census, the population was 79,149. Brooklyn Park is a northern suburb of the Twin Cities metropolitan area of Minneapolis-St. Paul.
History
The area that is now Brooklyn Park was first settled by Europeans in 1851. The first settlers were mostly of German and Swedish descent. The area was originally known as Brooklyn Township, and was incorporated as a village in 1954. The village was later incorporated as a city in 1969.
Geography
Brooklyn Park is located at the confluence of the Mississippi and Minnesota Rivers. It is bordered by the cities of Minneapolis and St. Paul to the east and west, respectively, and the cities of Maple Grove and Osseo to the north and south, respectively. The city has a total area of 28.2 square miles, of which 27.7 square miles is land and 0.5 square miles is water.
Economy
Brooklyn Park is home to a variety of businesses and industries. The city is home to several large employers, including Target Corporation, Best Buy, and the University of Minnesota. The city also has a number of smaller businesses, including restaurants, retail stores, and professional services.
Demographics
As of the 2010 census, there were 79,149 people, 28,945 households, and 19,945 families residing in the city. The population density was 2,845.3 people per square mile. The racial makeup of the city was 68.2% White, 16.2% African American, 0.7% Native American, 8.2% Asian, 2.2% from other races, and 4.5% from two or more races. Hispanic or Latino of any race were 5.3% of the population.
The median income for a household in the city was $54,945, and the median income for a family was $64,945. The per capita income for the city was $25,945. About 6.2% of families and 8.7% of the population were below the poverty line, including 11.2% of those under age 18 and 6.2% of those age 65 or over.
Conclusion
Brooklyn Park, Minnesota is a city located in Hennepin County, Minnesota, United States. It is the sixth-largest city in the state and the largest suburb of Minneapolis. As of the 2010 census, the population was 79,149. Brooklyn Park is a northern suburb of the Twin Cities metropolitan area of Minneapolis-St. Paul. The city has a diverse economy, with large employers such as Target Corporation, Best Buy, and the University of Minnesota, as well as smaller businesses, restaurants, retail stores, and professional services. The population of Brooklyn Park is diverse, with a median household income of $54,945 and a median family income of $64,945. The city also has a poverty rate of 6.2%, with 11.2% of those under age 18 and 6.2% of those age 65 or over living below the poverty line.
Common Questions
What is Per Capita Income in Brooklyn Park?
Per Capita income in Brooklyn Park is $36,531.
What is the Median Family Income in Brooklyn Park?
Median Family Income in Brooklyn Park is $100,242.
What is the Median Household income in Brooklyn Park?
Median Household Income in Brooklyn Park is $82,271.
What is Income or Wage Gap in Brooklyn Park?
Income or Wage Gap in Brooklyn Park is 17.2%.
Women in Brooklyn Park earn 82.8 cents for every dollar earned by a man.
What is Family Income Deficit in Brooklyn Park?
Family Income Deficit in Brooklyn Park is $8,532.
Families that are below poverty line in Brooklyn Park earn $8,532 less on average than the poverty threshold level.
What is Inequality or Gini Index in Brooklyn Park?
Inequality or Gini Index in Brooklyn Park is 0.41.
What is the Total Population of Brooklyn Park?
Total Population of Brooklyn Park is 84,951.
What is the Total Male Population of Brooklyn Park?
Total Male Population of Brooklyn Park is 41,780.
What is the Total Female Population of Brooklyn Park?
Total Female Population of Brooklyn Park is 43,171.
What is the Ratio of Males per 100 Females in Brooklyn Park?
There are 96.78 Males per 100 Females in Brooklyn Park.
What is the Ratio of Females per 100 Males in Brooklyn Park?
There are 103.33 Females per 100 Males in Brooklyn Park.
What is the Median Population Age in Brooklyn Park?
Median Population Age in Brooklyn Park is 35.2 Years.
What is the Average Family Size in Brooklyn Park
Average Family Size in Brooklyn Park is 3.4 People.
What is the Average Household Size in Brooklyn Park
Average Household Size in Brooklyn Park is 2.9 People.
How Large is the Labor Force in Brooklyn Park?
There are 47,495 People in the Labor Forcein in Brooklyn Park.
What is the Percentage of People in the Labor Force in Brooklyn Park?
73.3% of People are in the Labor Force in Brooklyn Park.
What is the Unemployment Rate in Brooklyn Park?
Unemployment Rate in Brooklyn Park is 3.7%.