Apple Valley, MN Map & Demographics
Apple Valley Map
Apple Valley Overview
$47,738
PER CAPITA INCOME
$122,078
AVG FAMILY INCOME
$97,588
AVG HOUSEHOLD INCOME
28.8%
WAGE / INCOME GAP [ % ]
71.2¢/ $1
WAGE / INCOME GAP [ $ ]
0.41
INEQUALITY / GINI INDEX
55,594
TOTAL POPULATION
26,854
MALE POPULATION
28,740
FEMALE POPULATION
93.44
MALES / 100 FEMALES
107.02
FEMALES / 100 MALES
37.6
MEDIAN AGE
3.1
AVG FAMILY SIZE
2.6
AVG HOUSEHOLD SIZE
30,311
LABOR FORCE [ PEOPLE ]
71.0%
PERCENT IN LABOR FORCE
4.2%
UNEMPLOYMENT RATE
Income in Apple Valley
Income Overview in Apple Valley
Per Capita Income in Apple Valley is $47,738, while median incomes of families and households are $122,078 and $97,588 respectively.
| Characteristic | Number | Measure |
| Per Capita Income | 55,594 | $47,738 |
| Median Family Income | 14,502 | $122,078 |
| Mean Family Income | 14,502 | $146,136 |
| Median Household Income | 21,311 | $97,588 |
| Mean Household Income | 21,311 | $123,508 |
| Income Deficit | 14,502 | $0 |
| Wage / Income Gap (%) | 55,594 | 28.81% |
| Wage / Income Gap ($) | 55,594 | 71.19¢ per $1 |
| Gini / Inequality Index | 55,594 | 0.41 |
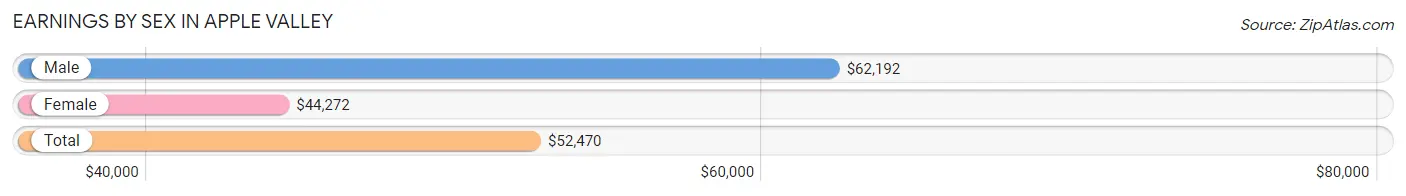
Earnings by Sex in Apple Valley
Average Earnings in Apple Valley are $52,470, $62,192 for men and $44,272 for women, a difference of 28.8%.
| Sex | Number | Average Earnings |
| Male | 15,934 (50.8%) | $62,192 |
| Female | 15,431 (49.2%) | $44,272 |
| Total | 31,365 (100.0%) | $52,470 |
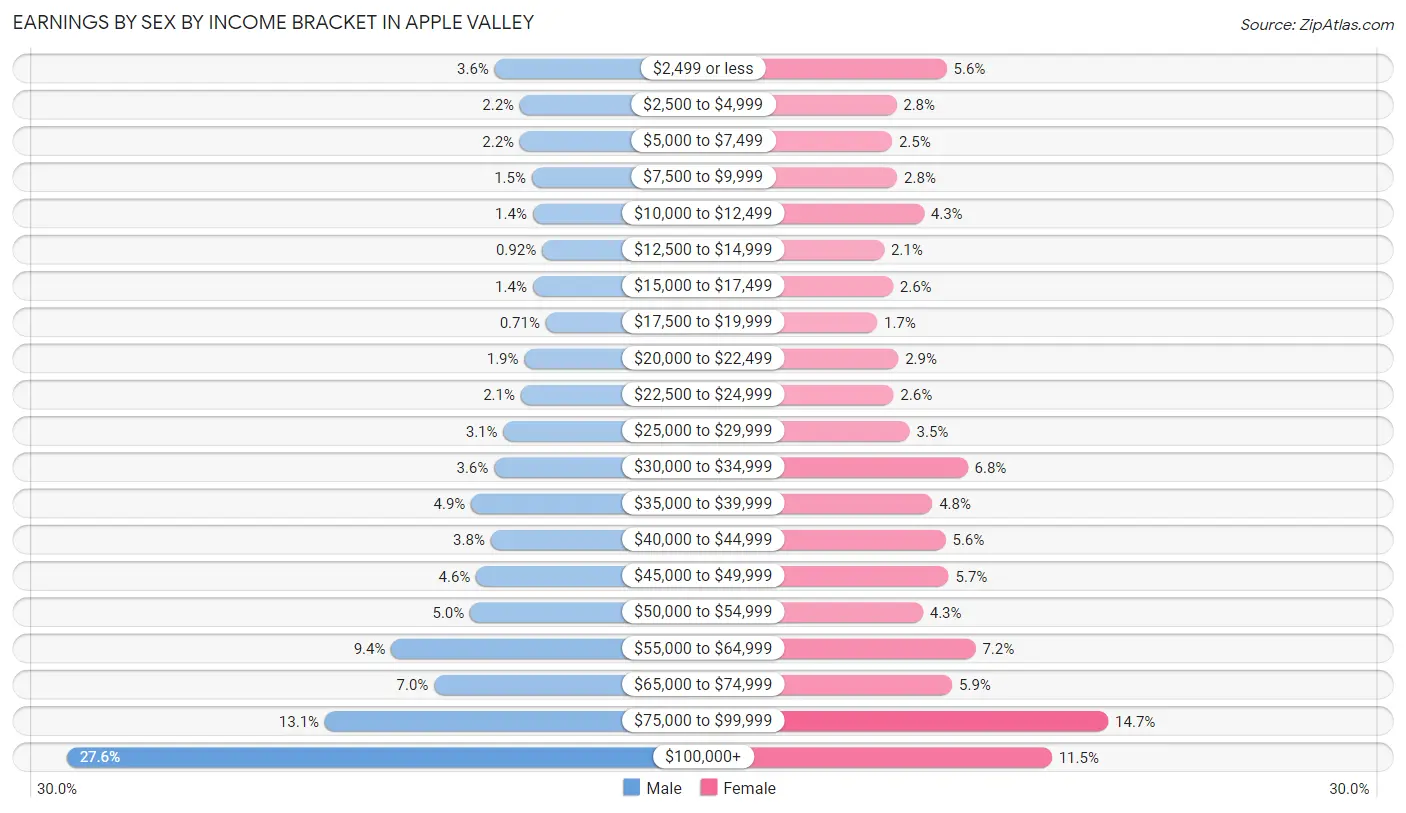
Earnings by Sex by Income Bracket in Apple Valley
The most common earnings brackets in Apple Valley are $100,000+ for men (4,402 | 27.6%) and $75,000 to $99,999 for women (2,267 | 14.7%).
| Income | Male | Female |
| $2,499 or less | 570 (3.6%) | 866 (5.6%) |
| $2,500 to $4,999 | 344 (2.2%) | 429 (2.8%) |
| $5,000 to $7,499 | 344 (2.2%) | 392 (2.5%) |
| $7,500 to $9,999 | 237 (1.5%) | 436 (2.8%) |
| $10,000 to $12,499 | 229 (1.4%) | 668 (4.3%) |
| $12,500 to $14,999 | 146 (0.9%) | 322 (2.1%) |
| $15,000 to $17,499 | 230 (1.4%) | 400 (2.6%) |
| $17,500 to $19,999 | 113 (0.7%) | 263 (1.7%) |
| $20,000 to $22,499 | 305 (1.9%) | 446 (2.9%) |
| $22,500 to $24,999 | 336 (2.1%) | 405 (2.6%) |
| $25,000 to $29,999 | 493 (3.1%) | 544 (3.5%) |
| $30,000 to $34,999 | 575 (3.6%) | 1,048 (6.8%) |
| $35,000 to $39,999 | 780 (4.9%) | 740 (4.8%) |
| $40,000 to $44,999 | 605 (3.8%) | 857 (5.6%) |
| $45,000 to $49,999 | 736 (4.6%) | 882 (5.7%) |
| $50,000 to $54,999 | 790 (5.0%) | 659 (4.3%) |
| $55,000 to $64,999 | 1,496 (9.4%) | 1,115 (7.2%) |
| $65,000 to $74,999 | 1,112 (7.0%) | 914 (5.9%) |
| $75,000 to $99,999 | 2,091 (13.1%) | 2,267 (14.7%) |
| $100,000+ | 4,402 (27.6%) | 1,778 (11.5%) |
| Total | 15,934 (100.0%) | 15,431 (100.0%) |
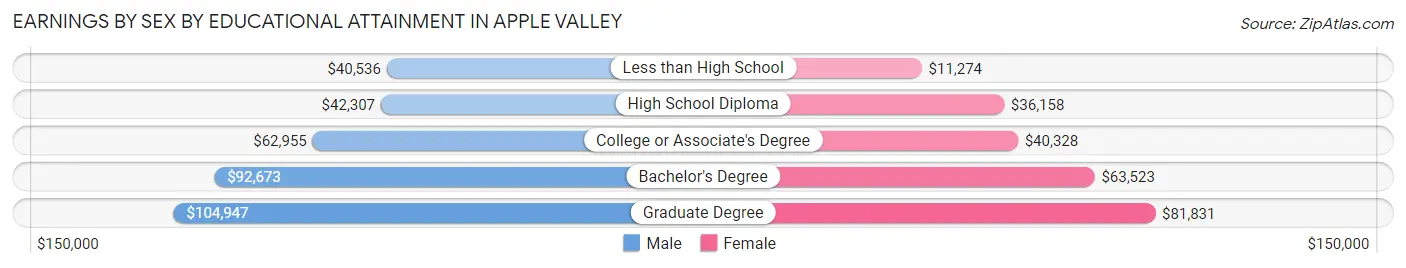
Earnings by Sex by Educational Attainment in Apple Valley
Average earnings in Apple Valley are $68,996 for men and $49,402 for women, a difference of 28.4%. Men with an educational attainment of graduate degree enjoy the highest average annual earnings of $104,947, while those with less than high school education earn the least with $40,536. Women with an educational attainment of graduate degree earn the most with the average annual earnings of $81,831, while those with less than high school education have the smallest earnings of $11,274.
| Educational Attainment | Male Income | Female Income |
| Less than High School | $40,536 | $11,274 |
| High School Diploma | $42,307 | $36,158 |
| College or Associate's Degree | $62,955 | $40,328 |
| Bachelor's Degree | $92,673 | $63,523 |
| Graduate Degree | $104,947 | $81,831 |
| Total | $68,996 | $49,402 |
Family Income in Apple Valley
Family Income Brackets in Apple Valley
According to the Apple Valley family income data, there are 3,553 families falling into the $100,000 to $149,999 income range, which is the most common income bracket and makes up 24.5% of all families. Conversely, the $10,000 to $14,999 income bracket is the least frequent group with only 44 families (0.3%) belonging to this category.
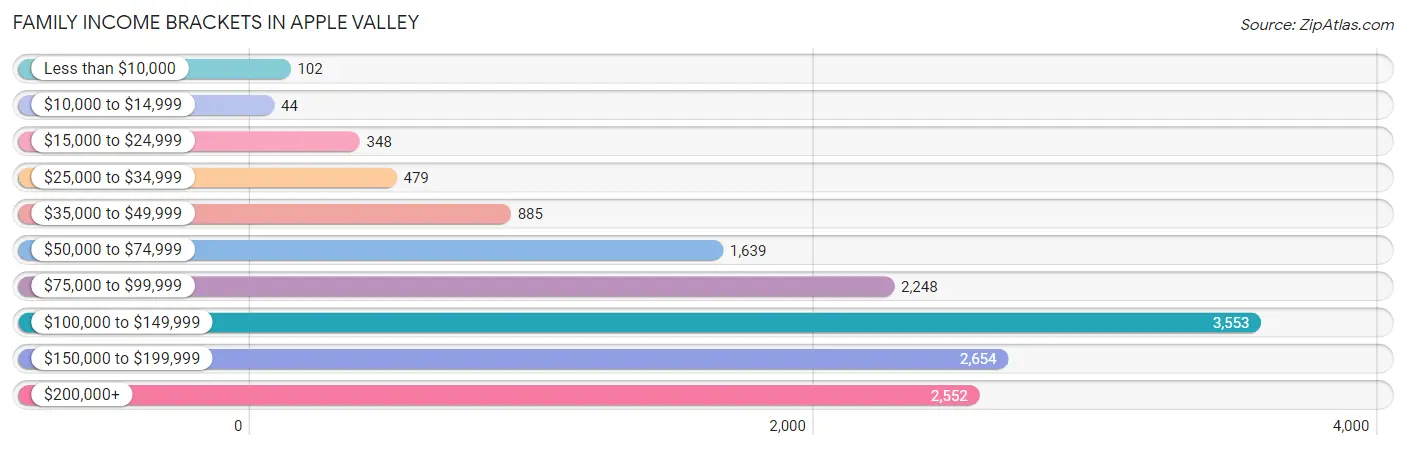
| Income Bracket | # Families | % Families |
| Less than $10,000 | 102 | 0.7% |
| $10,000 to $14,999 | 44 | 0.3% |
| $15,000 to $24,999 | 348 | 2.4% |
| $25,000 to $34,999 | 479 | 3.3% |
| $35,000 to $49,999 | 885 | 6.1% |
| $50,000 to $74,999 | 1,639 | 11.3% |
| $75,000 to $99,999 | 2,248 | 15.5% |
| $100,000 to $149,999 | 3,553 | 24.5% |
| $150,000 to $199,999 | 2,654 | 18.3% |
| $200,000+ | 2,552 | 17.6% |
Family Income by Famaliy Size in Apple Valley
4-person families (2,751 | 19.0%) account for the highest median family income in Apple Valley with $151,358 per family, while 2-person families (6,883 | 47.5%) have the highest median income of $53,267 per family member.
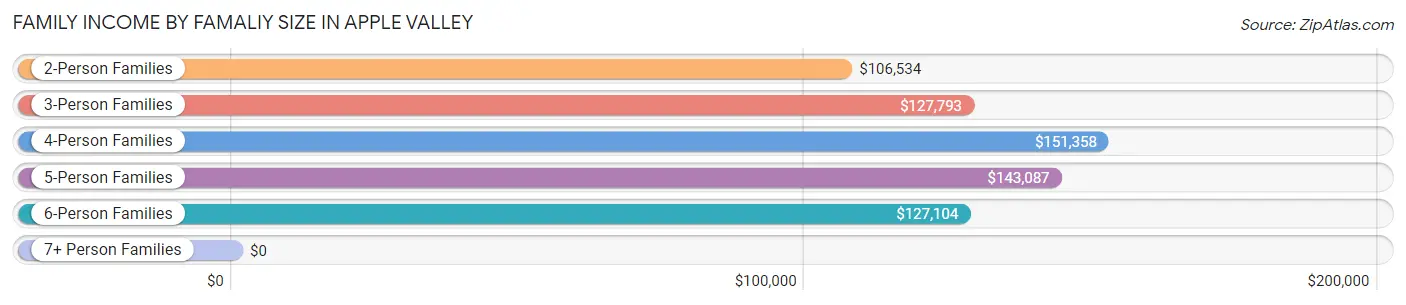
| Income Bracket | # Families | Median Income |
| 2-Person Families | 6,883 (47.5%) | $106,534 |
| 3-Person Families | 2,865 (19.8%) | $127,793 |
| 4-Person Families | 2,751 (19.0%) | $151,358 |
| 5-Person Families | 1,275 (8.8%) | $143,087 |
| 6-Person Families | 337 (2.3%) | $127,104 |
| 7+ Person Families | 391 (2.7%) | $0 |
| Total | 14,502 (100.0%) | $122,078 |
Family Income by Number of Earners in Apple Valley
The median family income in Apple Valley is $122,078, with families comprising 3+ earners (1,675) having the highest median family income of $178,779, while families with no earners (1,577) have the lowest median family income of $79,063, accounting for 11.6% and 10.9% of families, respectively.
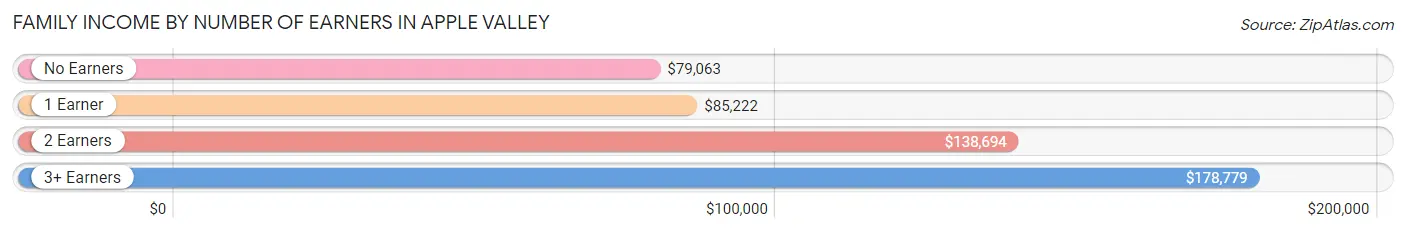
| Number of Earners | # Families | Median Income |
| No Earners | 1,577 (10.9%) | $79,063 |
| 1 Earner | 4,002 (27.6%) | $85,222 |
| 2 Earners | 7,248 (50.0%) | $138,694 |
| 3+ Earners | 1,675 (11.6%) | $178,779 |
| Total | 14,502 (100.0%) | $122,078 |
Household Income in Apple Valley
Household Income Brackets in Apple Valley
With 4,347 households falling in the category, the $100,000 to $149,999 income range is the most frequent in Apple Valley, accounting for 20.4% of all households. In contrast, only 149 households (0.7%) fall into the $10,000 to $14,999 income bracket, making it the least populous group.
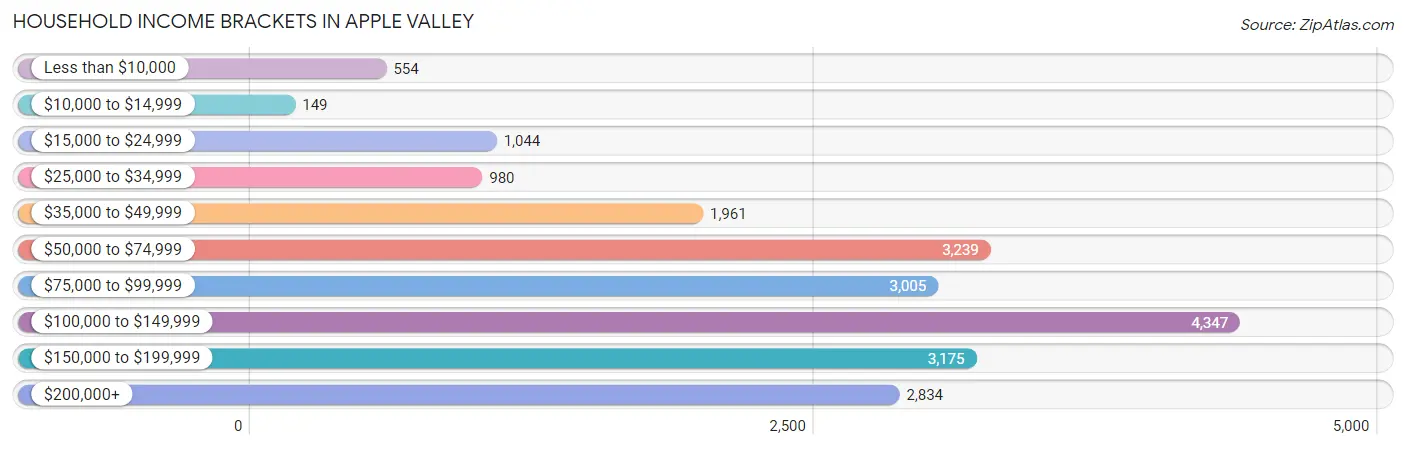
| Income Bracket | # Households | % Households |
| Less than $10,000 | 554 | 2.6% |
| $10,000 to $14,999 | 149 | 0.7% |
| $15,000 to $24,999 | 1,044 | 4.9% |
| $25,000 to $34,999 | 980 | 4.6% |
| $35,000 to $49,999 | 1,961 | 9.2% |
| $50,000 to $74,999 | 3,239 | 15.2% |
| $75,000 to $99,999 | 3,005 | 14.1% |
| $100,000 to $149,999 | 4,347 | 20.4% |
| $150,000 to $199,999 | 3,175 | 14.9% |
| $200,000+ | 2,834 | 13.3% |
Household Income by Householder Age in Apple Valley
The median household income in Apple Valley is $97,588, with the highest median household income of $124,525 found in the 45 to 64 years age bracket for the primary householder. A total of 7,813 households (36.7%) fall into this category. Meanwhile, the 65+ years age bracket for the primary householder has the lowest median household income of $64,897, with 5,583 households (26.2%) in this group.
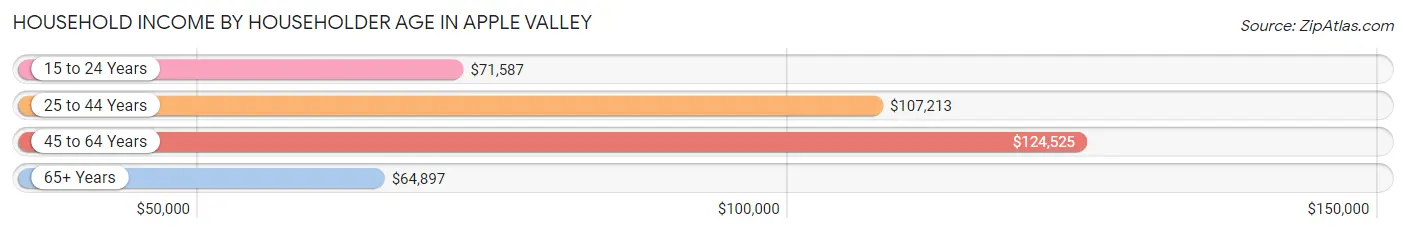
| Income Bracket | # Households | Median Income |
| 15 to 24 Years | 761 (3.6%) | $71,587 |
| 25 to 44 Years | 7,154 (33.6%) | $107,213 |
| 45 to 64 Years | 7,813 (36.7%) | $124,525 |
| 65+ Years | 5,583 (26.2%) | $64,897 |
| Total | 21,311 (100.0%) | $97,588 |
Poverty in Apple Valley
Income Below Poverty by Sex and Age in Apple Valley
With 4.7% poverty level for males and 7.0% for females among the residents of Apple Valley, 15 year old males and 5 year old females are the most vulnerable to poverty, with 97 males (27.4%) and 81 females (19.0%) in their respective age groups living below the poverty level.
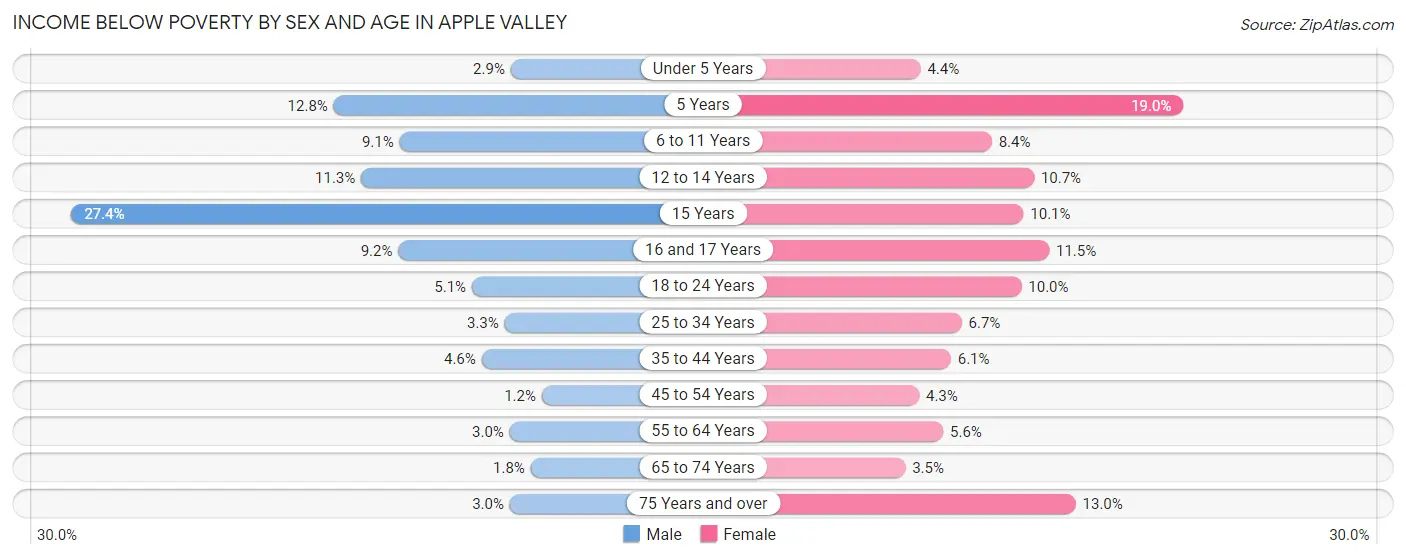
| Age Bracket | Male | Female |
| Under 5 Years | 47 (2.9%) | 77 (4.4%) |
| 5 Years | 60 (12.8%) | 81 (19.0%) |
| 6 to 11 Years | 221 (9.1%) | 228 (8.4%) |
| 12 to 14 Years | 144 (11.3%) | 135 (10.7%) |
| 15 Years | 97 (27.4%) | 46 (10.1%) |
| 16 and 17 Years | 73 (9.2%) | 74 (11.5%) |
| 18 to 24 Years | 116 (5.1%) | 194 (10.0%) |
| 25 to 34 Years | 117 (3.3%) | 230 (6.7%) |
| 35 to 44 Years | 167 (4.5%) | 225 (6.1%) |
| 45 to 54 Years | 38 (1.2%) | 154 (4.3%) |
| 55 to 64 Years | 101 (3.0%) | 213 (5.6%) |
| 65 to 74 Years | 44 (1.8%) | 106 (3.5%) |
| 75 Years and over | 37 (3.0%) | 236 (13.0%) |
| Total | 1,262 (4.7%) | 1,999 (7.0%) |
Income Above Poverty by Sex and Age in Apple Valley
According to the poverty statistics in Apple Valley, males aged 45 to 54 years and females aged 65 to 74 years are the age groups that are most secure financially, with 98.8% of males and 96.5% of females in these age groups living above the poverty line.
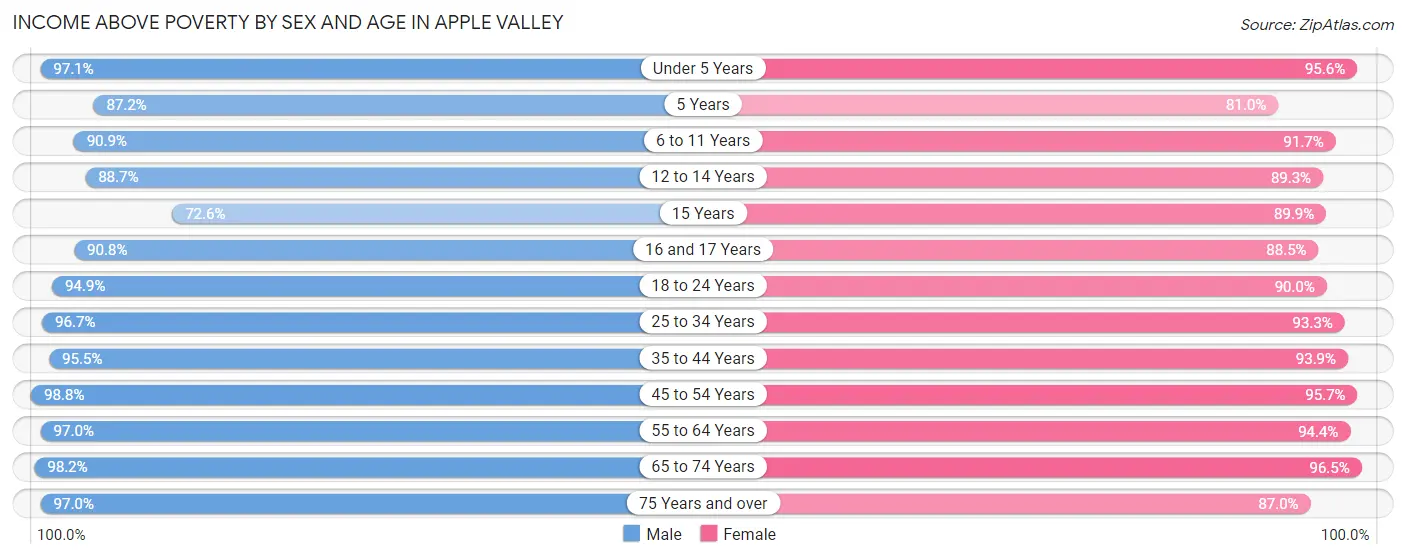
| Age Bracket | Male | Female |
| Under 5 Years | 1,555 (97.1%) | 1,680 (95.6%) |
| 5 Years | 409 (87.2%) | 345 (81.0%) |
| 6 to 11 Years | 2,202 (90.9%) | 2,502 (91.6%) |
| 12 to 14 Years | 1,135 (88.7%) | 1,127 (89.3%) |
| 15 Years | 257 (72.6%) | 409 (89.9%) |
| 16 and 17 Years | 721 (90.8%) | 567 (88.5%) |
| 18 to 24 Years | 2,163 (94.9%) | 1,746 (90.0%) |
| 25 to 34 Years | 3,466 (96.7%) | 3,219 (93.3%) |
| 35 to 44 Years | 3,505 (95.5%) | 3,482 (93.9%) |
| 45 to 54 Years | 3,118 (98.8%) | 3,431 (95.7%) |
| 55 to 64 Years | 3,276 (97.0%) | 3,563 (94.4%) |
| 65 to 74 Years | 2,369 (98.2%) | 2,899 (96.5%) |
| 75 Years and over | 1,206 (97.0%) | 1,577 (87.0%) |
| Total | 25,382 (95.3%) | 26,547 (93.0%) |
Income Below Poverty Among Married-Couple Families in Apple Valley
The poverty statistics for married-couple families in Apple Valley show that 1.8% or 209 of the total 11,306 families live below the poverty line. Families with 5 or more children have the highest poverty rate of 18.8%, comprising of 50 families. On the other hand, families with 1 or 2 children have the lowest poverty rate of 0.0%, which includes 0 families.
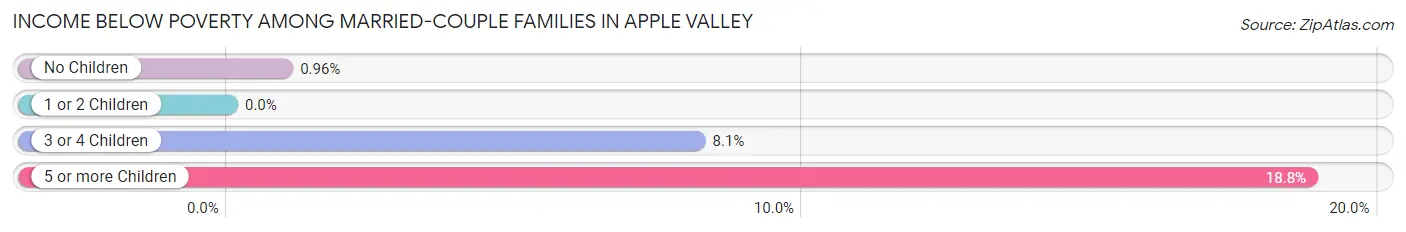
| Children | Above Poverty | Below Poverty |
| No Children | 6,384 (99.0%) | 62 (1.0%) |
| 1 or 2 Children | 3,402 (100.0%) | 0 (0.0%) |
| 3 or 4 Children | 1,095 (91.9%) | 97 (8.1%) |
| 5 or more Children | 216 (81.2%) | 50 (18.8%) |
| Total | 11,097 (98.2%) | 209 (1.8%) |
Income Below Poverty Among Single-Parent Households in Apple Valley
According to the poverty data in Apple Valley, 3.3% or 38 single-father households and 12.9% or 262 single-mother households are living below the poverty line. Among single-father households, those with no children have the highest poverty rate, with 38 households (13.0%) experiencing poverty. Likewise, among single-mother households, those with 3 or 4 children have the highest poverty rate, with 52 households (19.9%) falling below the poverty line.
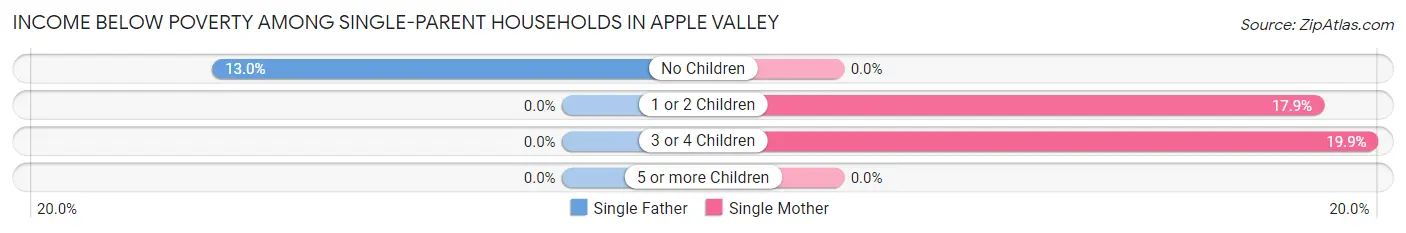
| Children | Single Father | Single Mother |
| No Children | 38 (13.0%) | 0 (0.0%) |
| 1 or 2 Children | 0 (0.0%) | 210 (17.9%) |
| 3 or 4 Children | 0 (0.0%) | 52 (19.9%) |
| 5 or more Children | 0 (0.0%) | 0 (0.0%) |
| Total | 38 (3.3%) | 262 (12.9%) |
Income Below Poverty Among Married-Couple vs Single-Parent Households in Apple Valley
The poverty data for Apple Valley shows that 209 of the married-couple family households (1.8%) and 300 of the single-parent households (9.4%) are living below the poverty level. Within the married-couple family households, those with 5 or more children have the highest poverty rate, with 50 households (18.8%) falling below the poverty line. Among the single-parent households, those with 3 or 4 children have the highest poverty rate, with 52 household (14.4%) living below poverty.
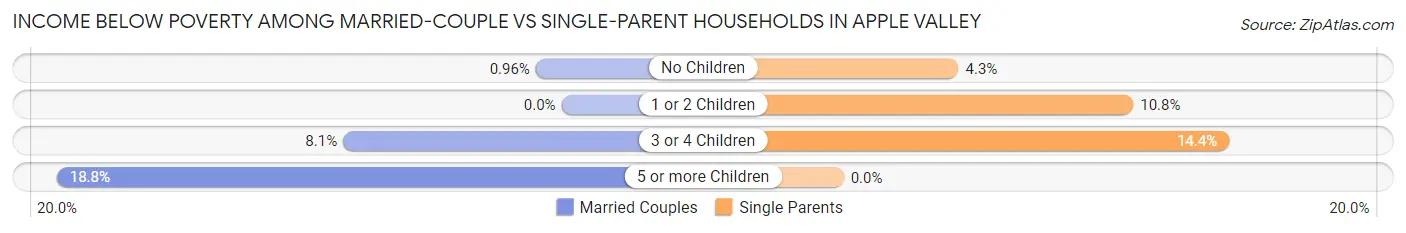
| Children | Married-Couple Families | Single-Parent Households |
| No Children | 62 (1.0%) | 38 (4.3%) |
| 1 or 2 Children | 0 (0.0%) | 210 (10.8%) |
| 3 or 4 Children | 97 (8.1%) | 52 (14.4%) |
| 5 or more Children | 50 (18.8%) | 0 (0.0%) |
| Total | 209 (1.8%) | 300 (9.4%) |
Race in Apple Valley
The most populous races in Apple Valley are White / Caucasian (40,307 | 72.5%), Black / African American (5,716 | 10.3%), and Two or more Races (4,450 | 8.0%).
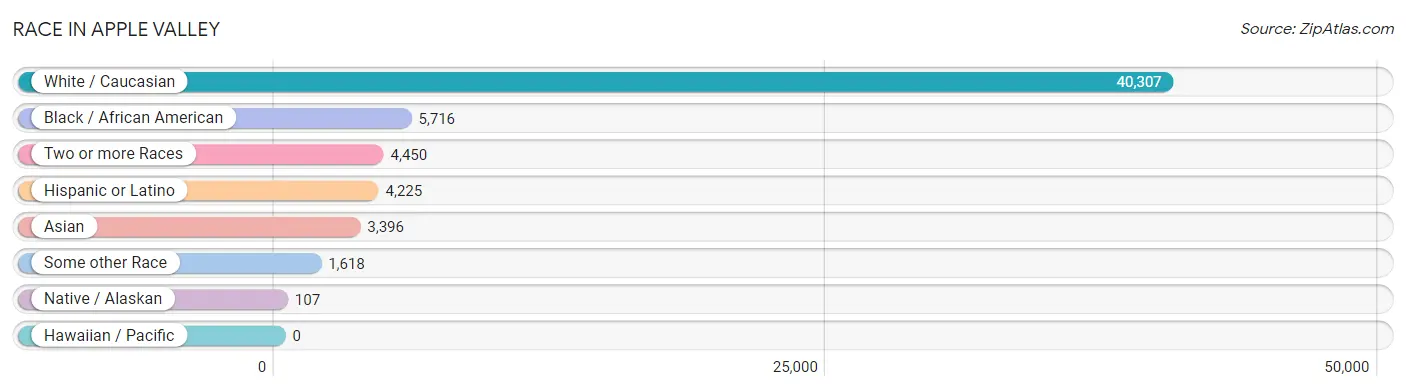
| Race | # Population | % Population |
| Asian | 3,396 | 6.1% |
| Black / African American | 5,716 | 10.3% |
| Hawaiian / Pacific | 0 | 0.0% |
| Hispanic or Latino | 4,225 | 7.6% |
| Native / Alaskan | 107 | 0.2% |
| White / Caucasian | 40,307 | 72.5% |
| Two or more Races | 4,450 | 8.0% |
| Some other Race | 1,618 | 2.9% |
| Total | 55,594 | 100.0% |
Ancestry in Apple Valley
The most populous ancestries reported in Apple Valley are German (15,842 | 28.5%), Irish (6,153 | 11.1%), Norwegian (5,982 | 10.8%), English (5,922 | 10.6%), and Swedish (3,516 | 6.3%), together accounting for 67.3% of all Apple Valley residents.
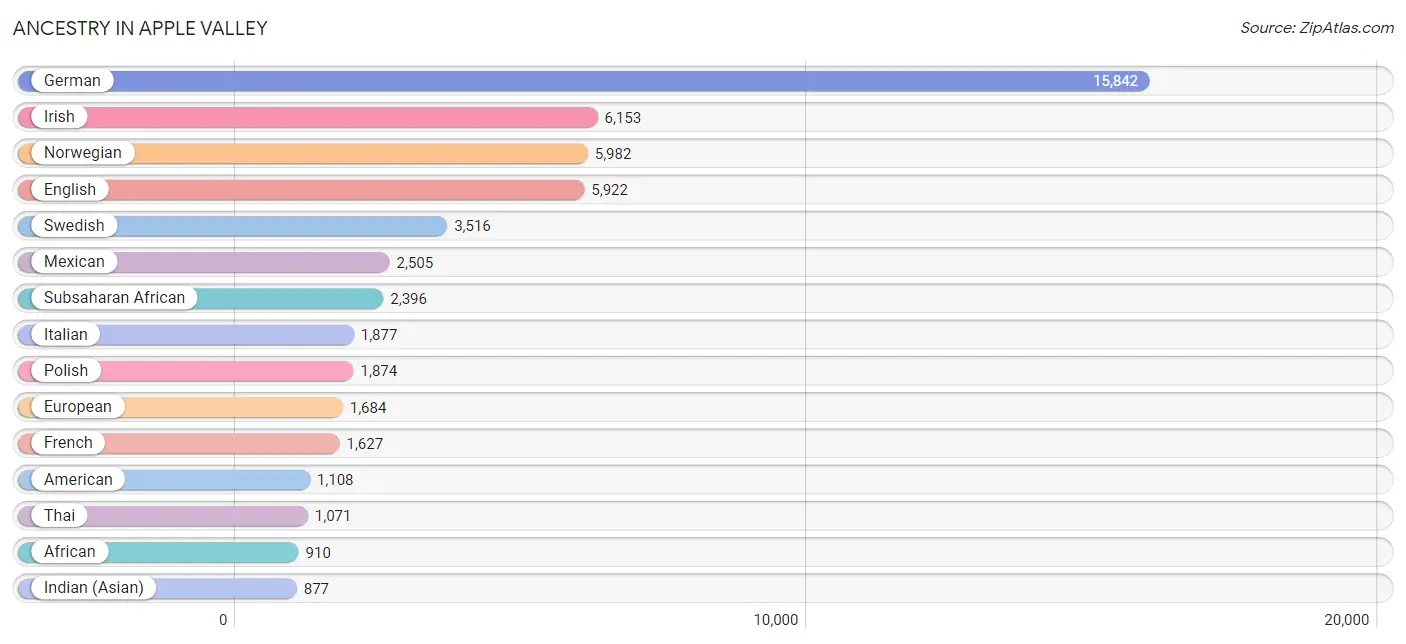
| Ancestry | # Population | % Population |
| Afghan | 354 | 0.6% |
| African | 910 | 1.6% |
| American | 1,108 | 2.0% |
| Arab | 244 | 0.4% |
| Armenian | 18 | 0.0% |
| Austrian | 206 | 0.4% |
| Bahamian | 36 | 0.1% |
| Bangladeshi | 233 | 0.4% |
| Belgian | 44 | 0.1% |
| Bhutanese | 305 | 0.5% |
| Brazilian | 51 | 0.1% |
| British | 438 | 0.8% |
| Bulgarian | 19 | 0.0% |
| Burmese | 313 | 0.6% |
| Central American | 233 | 0.4% |
| Central American Indian | 97 | 0.2% |
| Cherokee | 35 | 0.1% |
| Chippewa | 196 | 0.4% |
| Colombian | 155 | 0.3% |
| Cree | 6 | 0.0% |
| Croatian | 38 | 0.1% |
| Cuban | 222 | 0.4% |
| Czech | 760 | 1.4% |
| Czechoslovakian | 76 | 0.1% |
| Danish | 632 | 1.1% |
| Dominican | 651 | 1.2% |
| Dutch | 712 | 1.3% |
| Eastern European | 61 | 0.1% |
| Ecuadorian | 89 | 0.2% |
| English | 5,922 | 10.6% |
| Estonian | 21 | 0.0% |
| Ethiopian | 421 | 0.8% |
| European | 1,684 | 3.0% |
| Filipino | 7 | 0.0% |
| Finnish | 844 | 1.5% |
| French | 1,627 | 2.9% |
| French American Indian | 19 | 0.0% |
| French Canadian | 339 | 0.6% |
| German | 15,842 | 28.5% |
| Ghanaian | 21 | 0.0% |
| Greek | 67 | 0.1% |
| Guatemalan | 71 | 0.1% |
| Guyanese | 278 | 0.5% |
| Honduran | 105 | 0.2% |
| Hungarian | 64 | 0.1% |
| Icelander | 26 | 0.1% |
| Indian (Asian) | 877 | 1.6% |
| Indonesian | 54 | 0.1% |
| Irish | 6,153 | 11.1% |
| Italian | 1,877 | 3.4% |
| Jamaican | 38 | 0.1% |
| Japanese | 111 | 0.2% |
| Kenyan | 25 | 0.0% |
| Korean | 566 | 1.0% |
| Lebanese | 43 | 0.1% |
| Liberian | 130 | 0.2% |
| Lithuanian | 109 | 0.2% |
| Luxembourger | 123 | 0.2% |
| Malaysian | 44 | 0.1% |
| Mexican | 2,505 | 4.5% |
| Moroccan | 30 | 0.1% |
| Native Hawaiian | 45 | 0.1% |
| Navajo | 2 | 0.0% |
| New Zealander | 67 | 0.1% |
| Nicaraguan | 21 | 0.0% |
| Nigerian | 71 | 0.1% |
| Northern European | 214 | 0.4% |
| Norwegian | 5,982 | 10.8% |
| Pakistani | 35 | 0.1% |
| Pennsylvania German | 21 | 0.0% |
| Peruvian | 40 | 0.1% |
| Polish | 1,874 | 3.4% |
| Portuguese | 44 | 0.1% |
| Puerto Rican | 69 | 0.1% |
| Romanian | 24 | 0.0% |
| Russian | 431 | 0.8% |
| Salvadoran | 36 | 0.1% |
| Scandinavian | 507 | 0.9% |
| Scotch-Irish | 227 | 0.4% |
| Scottish | 595 | 1.1% |
| Serbian | 105 | 0.2% |
| Sioux | 4 | 0.0% |
| Slavic | 7 | 0.0% |
| Slovak | 89 | 0.2% |
| Slovene | 50 | 0.1% |
| Somali | 795 | 1.4% |
| South American | 284 | 0.5% |
| Spaniard | 101 | 0.2% |
| Spanish | 95 | 0.2% |
| Sri Lankan | 598 | 1.1% |
| Subsaharan African | 2,396 | 4.3% |
| Swedish | 3,516 | 6.3% |
| Swiss | 178 | 0.3% |
| Syrian | 77 | 0.1% |
| Thai | 1,071 | 1.9% |
| Turkish | 26 | 0.1% |
| Ukrainian | 65 | 0.1% |
| Vietnamese | 62 | 0.1% |
| Welsh | 346 | 0.6% |
| West Indian | 28 | 0.1% | View All 100 Rows |
Immigrants in Apple Valley
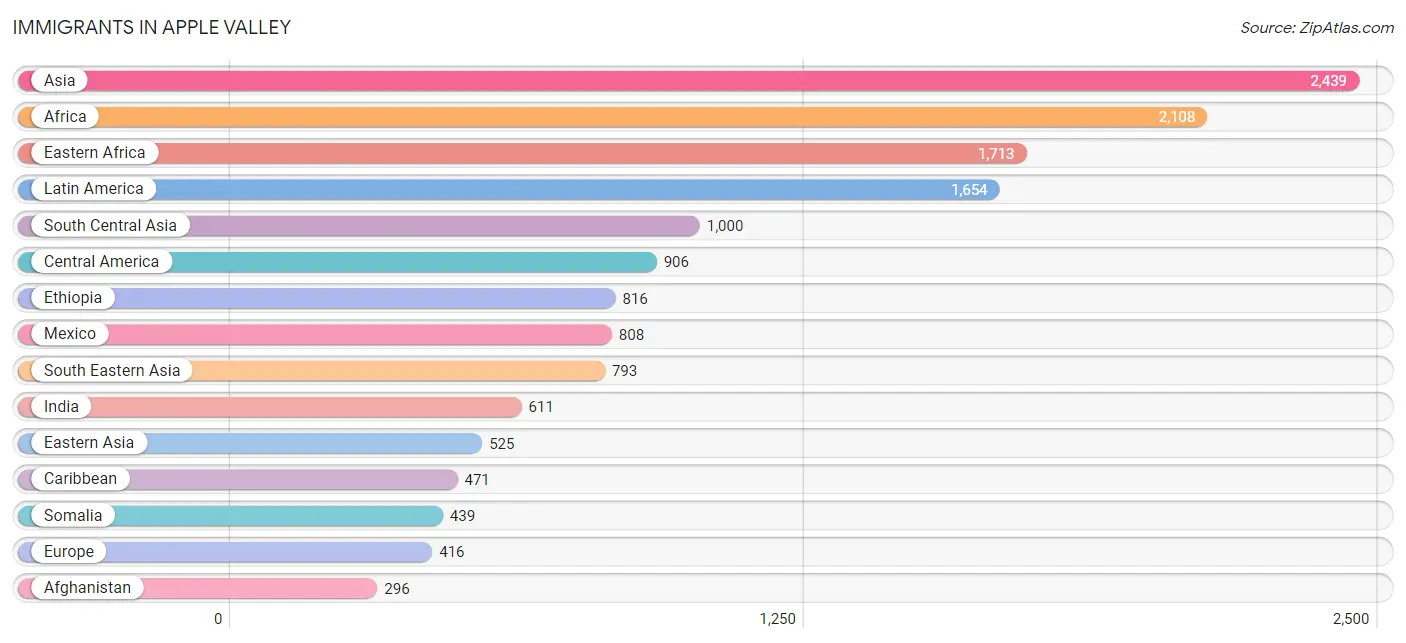
The most numerous immigrant groups reported in Apple Valley came from Asia (2,439 | 4.4%), Africa (2,108 | 3.8%), Eastern Africa (1,713 | 3.1%), Latin America (1,654 | 3.0%), and South Central Asia (1,000 | 1.8%), together accounting for 16.0% of all Apple Valley residents.
| Immigration Origin | # Population | % Population |
| Afghanistan | 296 | 0.5% |
| Africa | 2,108 | 3.8% |
| Asia | 2,439 | 4.4% |
| Austria | 26 | 0.1% |
| Bangladesh | 18 | 0.0% |
| Belarus | 30 | 0.1% |
| Brazil | 77 | 0.1% |
| Bulgaria | 19 | 0.0% |
| Cambodia | 42 | 0.1% |
| Cameroon | 55 | 0.1% |
| Canada | 114 | 0.2% |
| Caribbean | 471 | 0.9% |
| Central America | 906 | 1.6% |
| China | 294 | 0.5% |
| Colombia | 52 | 0.1% |
| Cuba | 55 | 0.1% |
| Czechoslovakia | 37 | 0.1% |
| Dominican Republic | 285 | 0.5% |
| Eastern Africa | 1,713 | 3.1% |
| Eastern Asia | 525 | 0.9% |
| Eastern Europe | 214 | 0.4% |
| Ecuador | 49 | 0.1% |
| El Salvador | 27 | 0.1% |
| England | 21 | 0.0% |
| Eritrea | 110 | 0.2% |
| Ethiopia | 816 | 1.5% |
| Europe | 416 | 0.7% |
| France | 28 | 0.1% |
| Germany | 27 | 0.1% |
| Ghana | 60 | 0.1% |
| Guatemala | 68 | 0.1% |
| Guyana | 80 | 0.1% |
| Honduras | 3 | 0.0% |
| Hong Kong | 67 | 0.1% |
| Hungary | 12 | 0.0% |
| India | 611 | 1.1% |
| Israel | 5 | 0.0% |
| Jamaica | 25 | 0.0% |
| Japan | 137 | 0.3% |
| Kazakhstan | 28 | 0.1% |
| Kenya | 186 | 0.3% |
| Korea | 94 | 0.2% |
| Kuwait | 28 | 0.1% |
| Laos | 44 | 0.1% |
| Latin America | 1,654 | 3.0% |
| Liberia | 18 | 0.0% |
| Malaysia | 24 | 0.0% |
| Mexico | 808 | 1.5% |
| Middle Africa | 76 | 0.1% |
| Morocco | 28 | 0.1% |
| Nepal | 38 | 0.1% |
| Netherlands | 10 | 0.0% |
| Nigeria | 121 | 0.2% |
| Northern Africa | 28 | 0.1% |
| Northern Europe | 111 | 0.2% |
| Oceania | 66 | 0.1% |
| Peru | 19 | 0.0% |
| Philippines | 287 | 0.5% |
| Russia | 91 | 0.2% |
| Somalia | 439 | 0.8% |
| South Africa | 29 | 0.1% |
| South America | 277 | 0.5% |
| South Central Asia | 1,000 | 1.8% |
| South Eastern Asia | 793 | 1.4% |
| Syria | 62 | 0.1% |
| Taiwan | 32 | 0.1% |
| Thailand | 64 | 0.1% |
| Trinidad and Tobago | 106 | 0.2% |
| Turkey | 26 | 0.1% |
| Uganda | 67 | 0.1% |
| Ukraine | 4 | 0.0% |
| Uzbekistan | 9 | 0.0% |
| Vietnam | 292 | 0.5% |
| Western Africa | 227 | 0.4% |
| Western Asia | 121 | 0.2% |
| Western Europe | 91 | 0.2% |
| Zaire | 21 | 0.0% |
| Zimbabwe | 33 | 0.1% | View All 78 Rows |
Sex and Age in Apple Valley
Sex and Age in Apple Valley
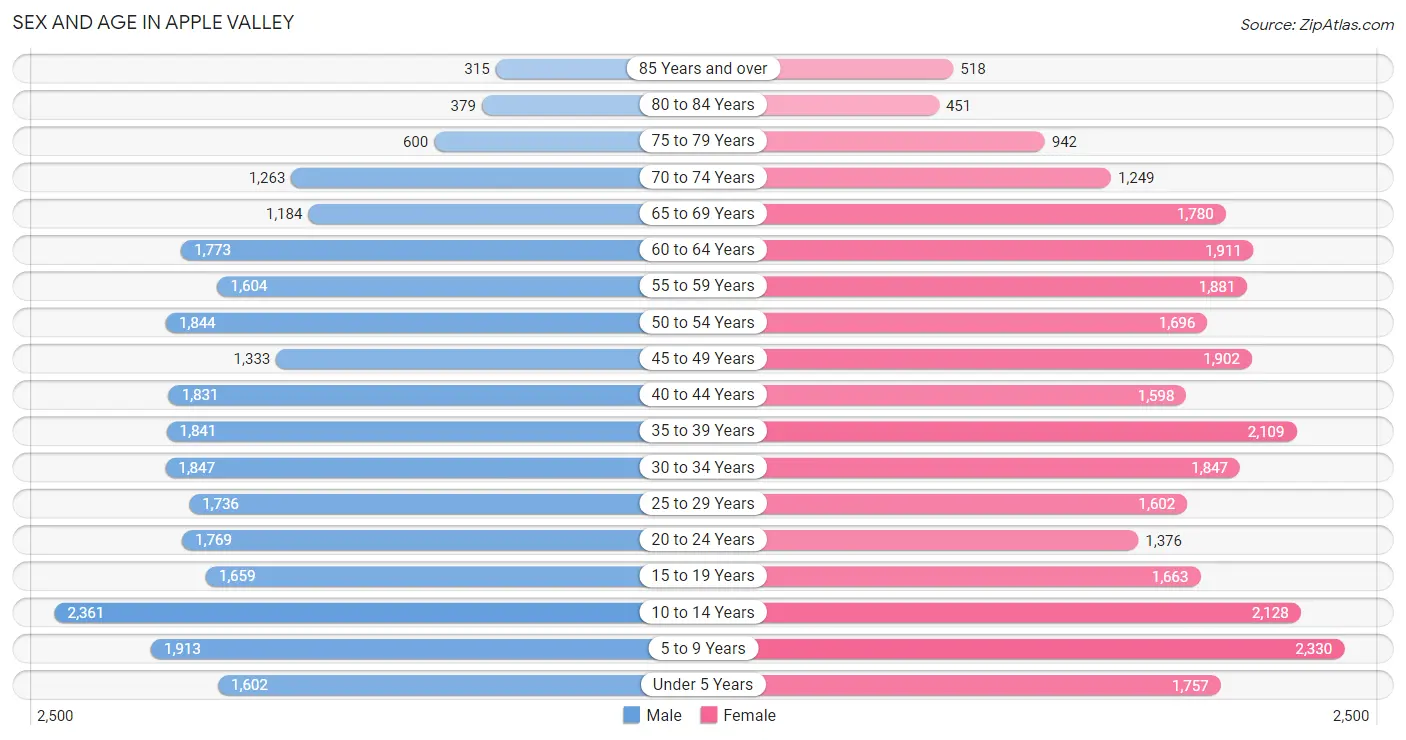
The most populous age groups in Apple Valley are 10 to 14 Years (2,361 | 8.8%) for men and 5 to 9 Years (2,330 | 8.1%) for women.
| Age Bracket | Male | Female |
| Under 5 Years | 1,602 (6.0%) | 1,757 (6.1%) |
| 5 to 9 Years | 1,913 (7.1%) | 2,330 (8.1%) |
| 10 to 14 Years | 2,361 (8.8%) | 2,128 (7.4%) |
| 15 to 19 Years | 1,659 (6.2%) | 1,663 (5.8%) |
| 20 to 24 Years | 1,769 (6.6%) | 1,376 (4.8%) |
| 25 to 29 Years | 1,736 (6.5%) | 1,602 (5.6%) |
| 30 to 34 Years | 1,847 (6.9%) | 1,847 (6.4%) |
| 35 to 39 Years | 1,841 (6.9%) | 2,109 (7.3%) |
| 40 to 44 Years | 1,831 (6.8%) | 1,598 (5.6%) |
| 45 to 49 Years | 1,333 (5.0%) | 1,902 (6.6%) |
| 50 to 54 Years | 1,844 (6.9%) | 1,696 (5.9%) |
| 55 to 59 Years | 1,604 (6.0%) | 1,881 (6.5%) |
| 60 to 64 Years | 1,773 (6.6%) | 1,911 (6.7%) |
| 65 to 69 Years | 1,184 (4.4%) | 1,780 (6.2%) |
| 70 to 74 Years | 1,263 (4.7%) | 1,249 (4.3%) |
| 75 to 79 Years | 600 (2.2%) | 942 (3.3%) |
| 80 to 84 Years | 379 (1.4%) | 451 (1.6%) |
| 85 Years and over | 315 (1.2%) | 518 (1.8%) |
| Total | 26,854 (100.0%) | 28,740 (100.0%) |
Families and Households in Apple Valley
Median Family Size in Apple Valley
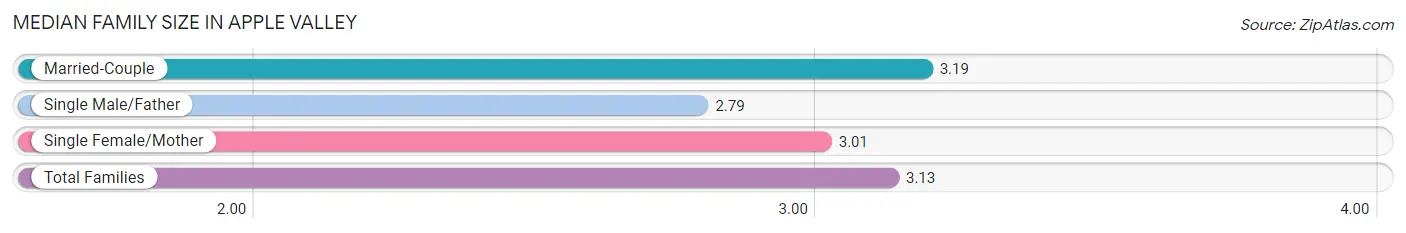
The median family size in Apple Valley is 3.13 persons per family, with married-couple families (11,306 | 78.0%) accounting for the largest median family size of 3.19 persons per family. On the other hand, single male/father families (1,165 | 8.0%) represent the smallest median family size with 2.79 persons per family.
| Family Type | # Families | Family Size |
| Married-Couple | 11,306 (78.0%) | 3.19 |
| Single Male/Father | 1,165 (8.0%) | 2.79 |
| Single Female/Mother | 2,031 (14.0%) | 3.01 |
| Total Families | 14,502 (100.0%) | 3.13 |
Median Household Size in Apple Valley
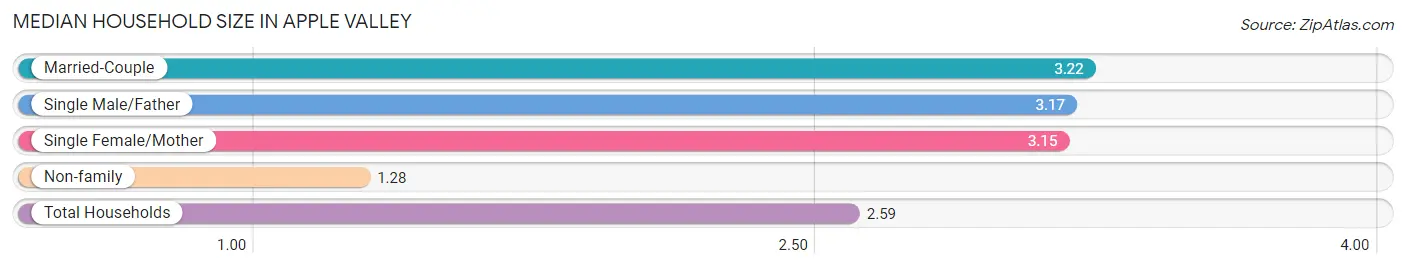
The median household size in Apple Valley is 2.59 persons per household, with married-couple households (11,306 | 53.0%) accounting for the largest median household size of 3.22 persons per household. non-family households (6,809 | 32.0%) represent the smallest median household size with 1.28 persons per household.
| Household Type | # Households | Household Size |
| Married-Couple | 11,306 (53.0%) | 3.22 |
| Single Male/Father | 1,165 (5.5%) | 3.17 |
| Single Female/Mother | 2,031 (9.5%) | 3.15 |
| Non-family | 6,809 (32.0%) | 1.28 |
| Total Households | 21,311 (100.0%) | 2.59 |
Household Size by Marriage Status in Apple Valley
Out of a total of 21,311 households in Apple Valley, 14,502 (68.0%) are family households, while 6,809 (32.0%) are nonfamily households. The most numerous type of family households are 2-person households, comprising 6,452, and the most common type of nonfamily households are 1-person households, comprising 5,250.
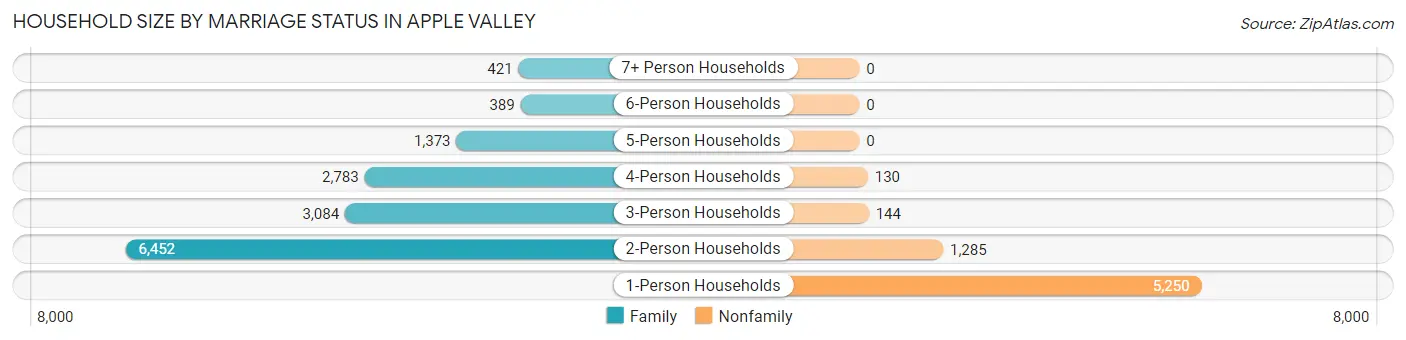
| Household Size | Family Households | Nonfamily Households |
| 1-Person Households | - | 5,250 (24.6%) |
| 2-Person Households | 6,452 (30.3%) | 1,285 (6.0%) |
| 3-Person Households | 3,084 (14.5%) | 144 (0.7%) |
| 4-Person Households | 2,783 (13.1%) | 130 (0.6%) |
| 5-Person Households | 1,373 (6.4%) | 0 (0.0%) |
| 6-Person Households | 389 (1.8%) | 0 (0.0%) |
| 7+ Person Households | 421 (2.0%) | 0 (0.0%) |
| Total | 14,502 (68.0%) | 6,809 (32.0%) |
Female Fertility in Apple Valley
Fertility by Age in Apple Valley
Average fertility rate in Apple Valley is 68.0 births per 1,000 women. Women in the age bracket of 20 to 34 years have the highest fertility rate with 105.0 births per 1,000 women. Women in the age bracket of 20 to 34 years acount for 60.6% of all women with births.
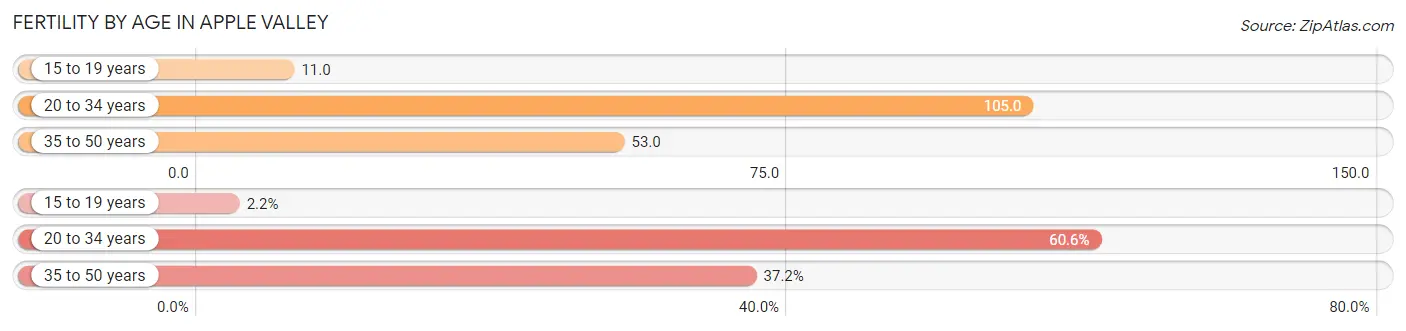
| Age Bracket | Women with Births | Births / 1,000 Women |
| 15 to 19 years | 18 (2.1%) | 11.0 |
| 20 to 34 years | 508 (60.6%) | 105.0 |
| 35 to 50 years | 312 (37.2%) | 53.0 |
| Total | 838 (100.0%) | 68.0 |
Fertility by Age by Marriage Status in Apple Valley
69.1% of women with births (838) in Apple Valley are married. The highest percentage of unmarried women with births falls into 15 to 19 years age bracket with 100.0% of them unmarried at the time of birth, while the lowest percentage of unmarried women with births belong to 35 to 50 years age bracket with 25.6% of them unmarried.
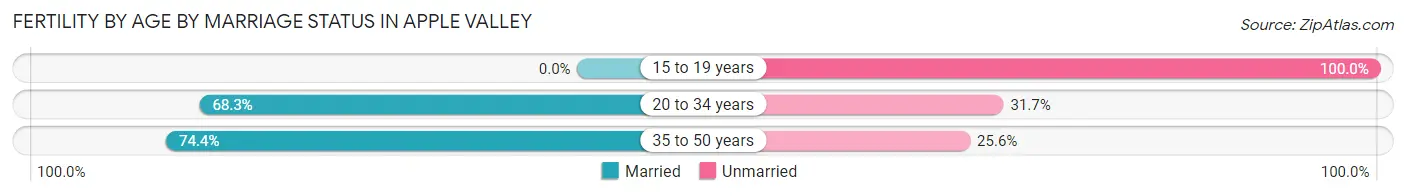
| Age Bracket | Married | Unmarried |
| 15 to 19 years | 0 (0.0%) | 18 (100.0%) |
| 20 to 34 years | 347 (68.3%) | 161 (31.7%) |
| 35 to 50 years | 232 (74.4%) | 80 (25.6%) |
| Total | 579 (69.1%) | 259 (30.9%) |
Fertility by Education in Apple Valley
Average fertility rate in Apple Valley is 68.0 births per 1,000 women. Women with the education attainment of graduate degree have the highest fertility rate of 114.0 births per 1,000 women, while women with the education attainment of less than high school have the lowest fertility at 28.0 births per 1,000 women. Women with the education attainment of bachelor's degree represent 30.3% of all women with births.
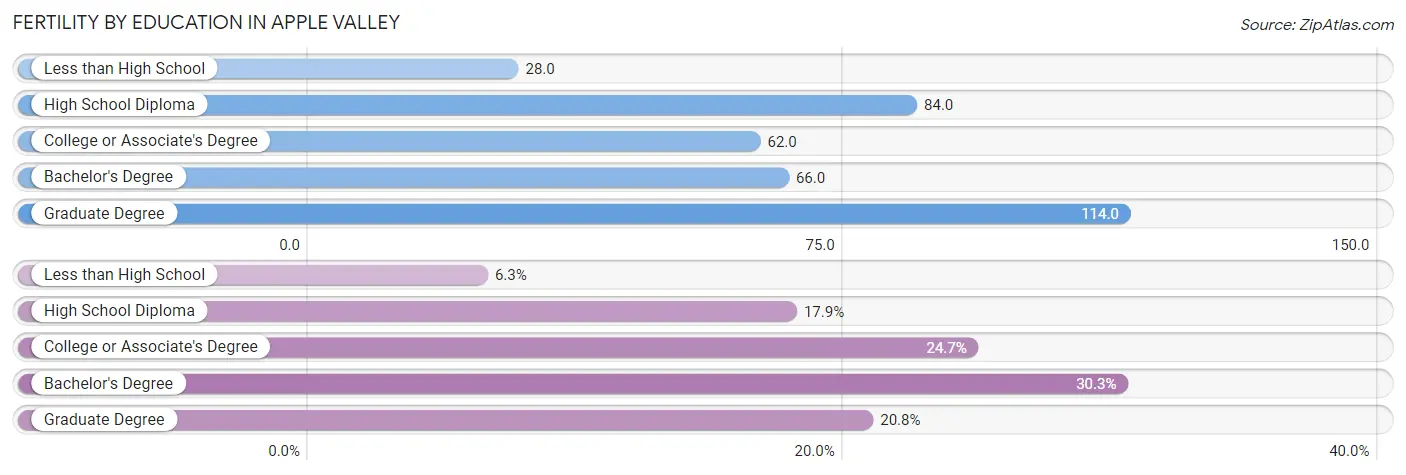
| Educational Attainment | Women with Births | Births / 1,000 Women |
| Less than High School | 53 (6.3%) | 28.0 |
| High School Diploma | 150 (17.9%) | 84.0 |
| College or Associate's Degree | 207 (24.7%) | 62.0 |
| Bachelor's Degree | 254 (30.3%) | 66.0 |
| Graduate Degree | 174 (20.8%) | 114.0 |
| Total | 838 (100.0%) | 68.0 |
Fertility by Education by Marriage Status in Apple Valley
30.9% of women with births in Apple Valley are unmarried. Women with the educational attainment of less than high school are most likely to be married with 100.0% of them married at childbirth, while women with the educational attainment of college or associate's degree are least likely to be married with 78.3% of them unmarried at childbirth.
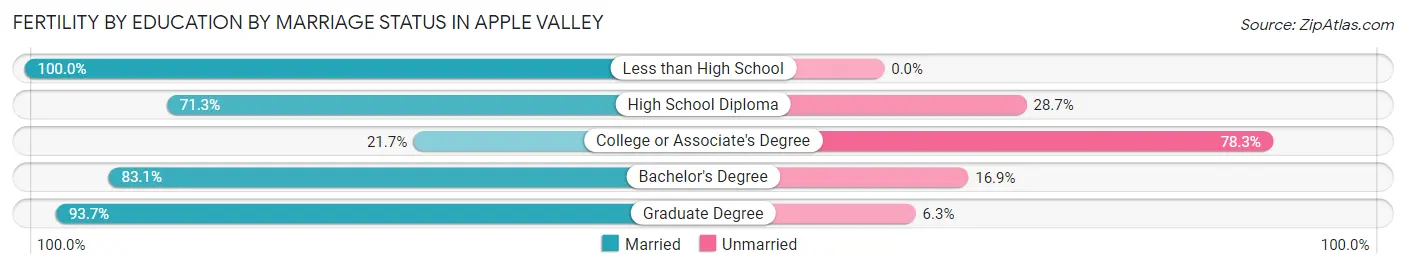
| Educational Attainment | Married | Unmarried |
| Less than High School | 53 (100.0%) | 0 (0.0%) |
| High School Diploma | 107 (71.3%) | 43 (28.7%) |
| College or Associate's Degree | 45 (21.7%) | 162 (78.3%) |
| Bachelor's Degree | 211 (83.1%) | 43 (16.9%) |
| Graduate Degree | 163 (93.7%) | 11 (6.3%) |
| Total | 579 (69.1%) | 259 (30.9%) |
Employment Characteristics in Apple Valley
Employment by Class of Employer in Apple Valley
Among the 28,755 employed individuals in Apple Valley, private company employees (20,216 | 70.3%), not-for-profit organizations (2,686 | 9.3%), and local government employees (2,286 | 8.0%) make up the most common classes of employment.
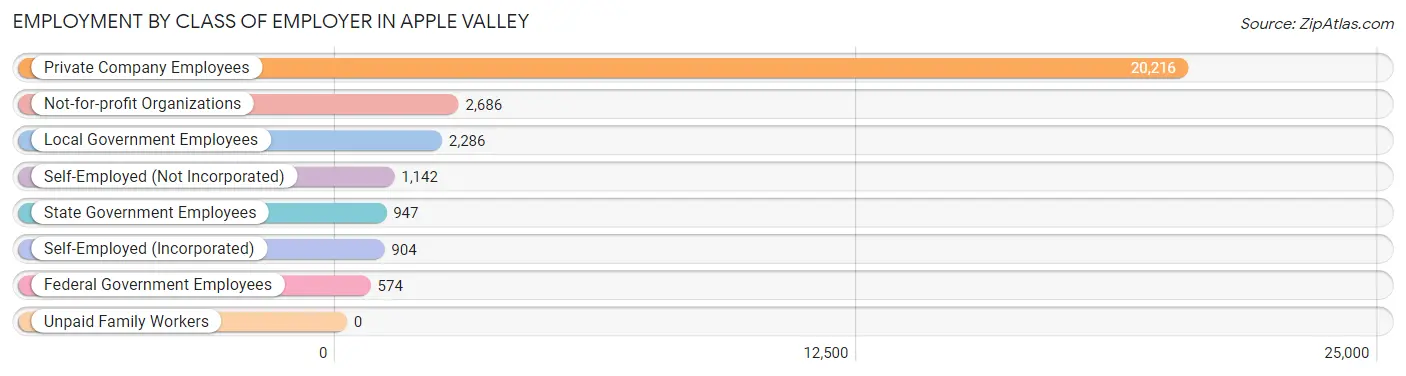
| Employer Class | # Employees | % Employees |
| Private Company Employees | 20,216 | 70.3% |
| Self-Employed (Incorporated) | 904 | 3.1% |
| Self-Employed (Not Incorporated) | 1,142 | 4.0% |
| Not-for-profit Organizations | 2,686 | 9.3% |
| Local Government Employees | 2,286 | 8.0% |
| State Government Employees | 947 | 3.3% |
| Federal Government Employees | 574 | 2.0% |
| Unpaid Family Workers | 0 | 0.0% |
| Total | 28,755 | 100.0% |
Employment Status by Age in Apple Valley
According to the labor force statistics for Apple Valley, out of the total population over 16 years of age (42,692), 71.0% or 30,311 individuals are in the labor force, with 4.2% or 1,273 of them unemployed. The age group with the highest labor force participation rate is 45 to 54 years, with 90.8% or 6,152 individuals in the labor force. Within the labor force, the 16 to 19 years age range has the highest percentage of unemployed individuals, with 14.0% or 158 of them being unemployed.
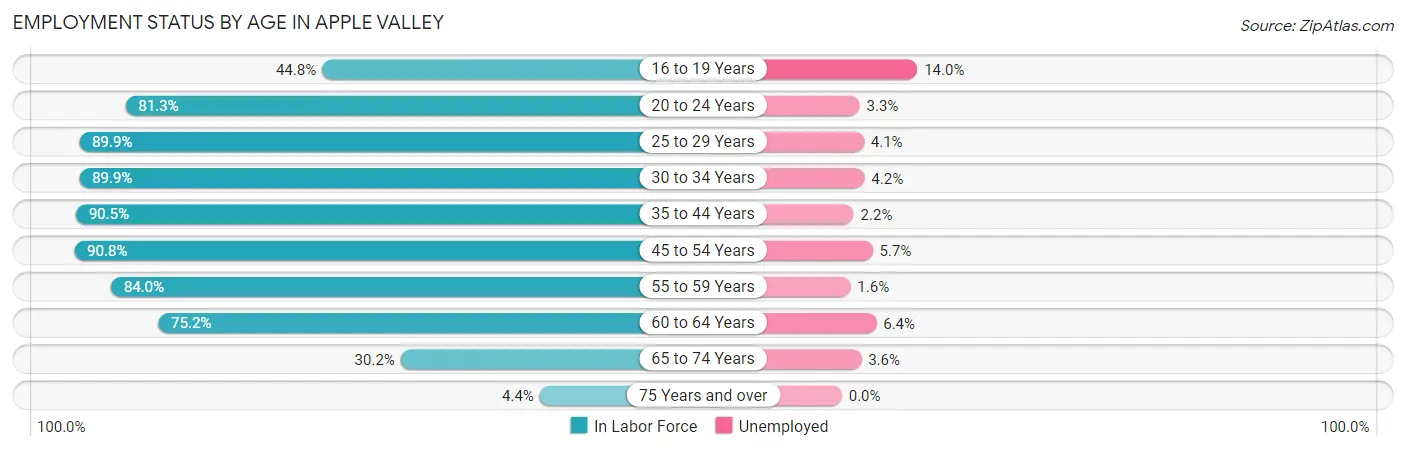
| Age Bracket | In Labor Force | Unemployed |
| 16 to 19 Years | 1,125 (44.8%) | 158 (14.0%) |
| 20 to 24 Years | 2,557 (81.3%) | 84 (3.3%) |
| 25 to 29 Years | 3,001 (89.9%) | 123 (4.1%) |
| 30 to 34 Years | 3,321 (89.9%) | 139 (4.2%) |
| 35 to 44 Years | 6,678 (90.5%) | 147 (2.2%) |
| 45 to 54 Years | 6,152 (90.8%) | 351 (5.7%) |
| 55 to 59 Years | 2,927 (84.0%) | 47 (1.6%) |
| 60 to 64 Years | 2,770 (75.2%) | 177 (6.4%) |
| 65 to 74 Years | 1,654 (30.2%) | 60 (3.6%) |
| 75 Years and over | 141 (4.4%) | 0 (0.0%) |
| Total | 30,311 (71.0%) | 1,273 (4.2%) |
Employment Status by Educational Attainment in Apple Valley
According to labor force statistics for Apple Valley, 87.6% of individuals (24,839) out of the total population between 25 and 64 years of age (28,355) are in the labor force, with 4.0% or 994 of them being unemployed. The group with the highest labor force participation rate are those with the educational attainment of college / associate degree, with 90.0% or 7,857 individuals in the labor force. Within the labor force, individuals with less than high school education have the highest percentage of unemployment, with 22.1% or 198 of them being unemployed.
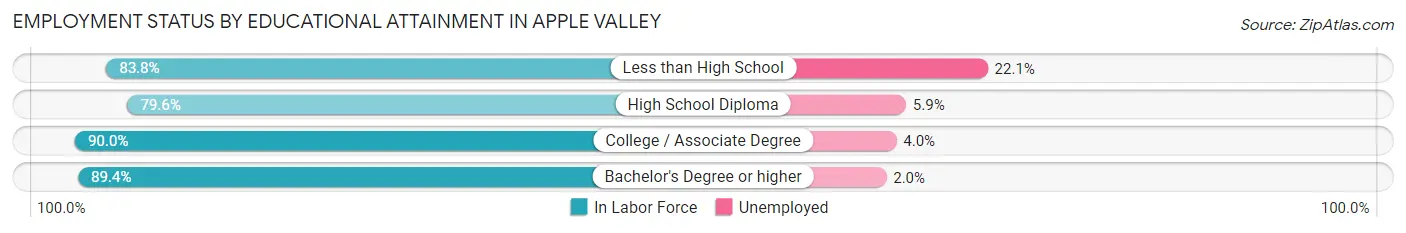
| Educational Attainment | In Labor Force | Unemployed |
| Less than High School | 897 (83.8%) | 237 (22.1%) |
| High School Diploma | 3,935 (79.6%) | 292 (5.9%) |
| College / Associate Degree | 7,857 (90.0%) | 349 (4.0%) |
| Bachelor's Degree or higher | 12,167 (89.4%) | 272 (2.0%) |
| Total | 24,839 (87.6%) | 1,134 (4.0%) |
Employment Occupations by Sex in Apple Valley
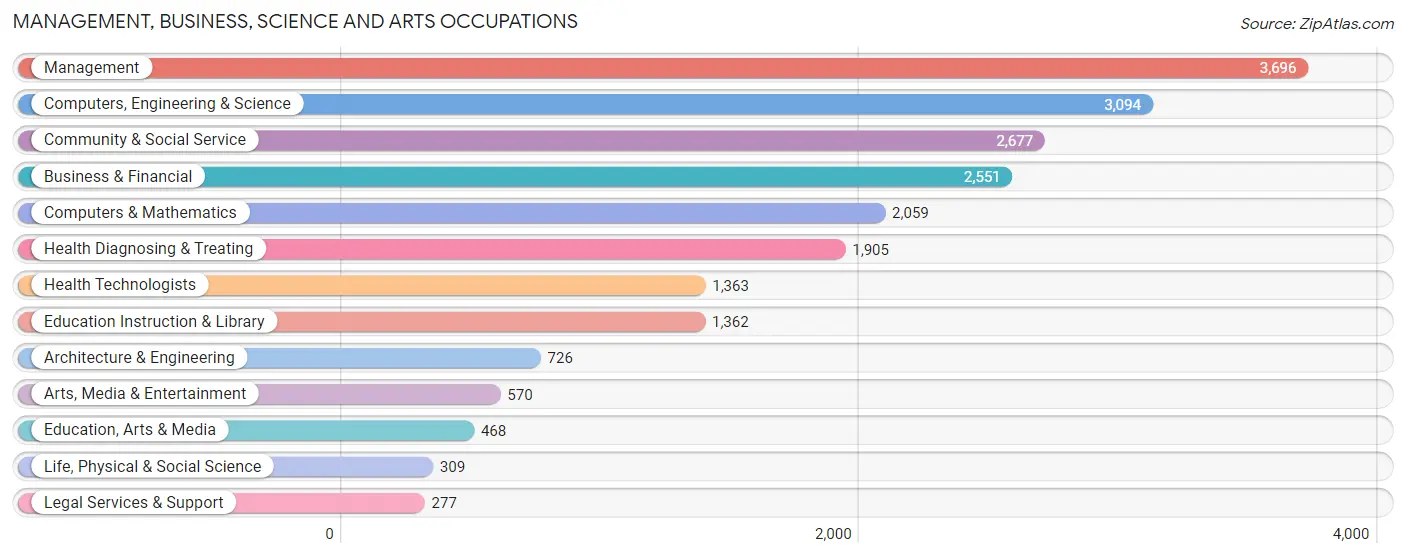
Management, Business, Science and Arts Occupations
The most common Management, Business, Science and Arts occupations in Apple Valley are Management (3,696 | 12.8%), Computers, Engineering & Science (3,094 | 10.7%), Community & Social Service (2,677 | 9.2%), Business & Financial (2,551 | 8.8%), and Computers & Mathematics (2,059 | 7.1%).
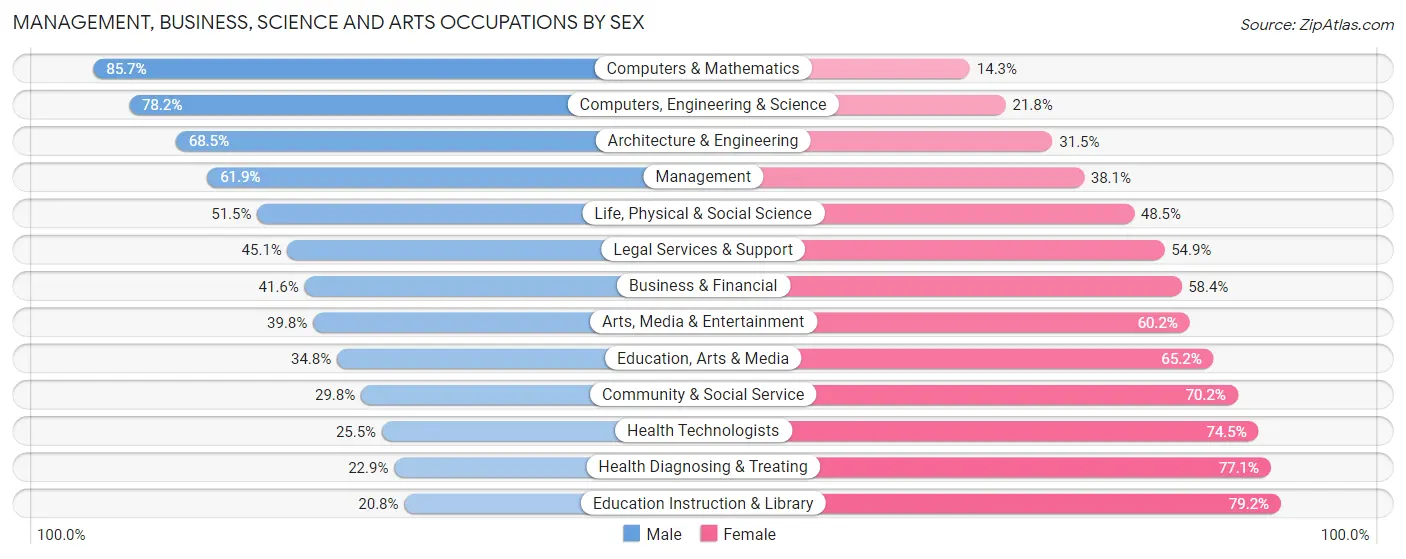
Management, Business, Science and Arts Occupations by Sex
Within the Management, Business, Science and Arts occupations in Apple Valley, the most male-oriented occupations are Computers & Mathematics (85.7%), Computers, Engineering & Science (78.2%), and Architecture & Engineering (68.5%), while the most female-oriented occupations are Education Instruction & Library (79.2%), Health Diagnosing & Treating (77.1%), and Health Technologists (74.5%).
| Occupation | Male | Female |
| Management | 2,288 (61.9%) | 1,408 (38.1%) |
| Business & Financial | 1,061 (41.6%) | 1,490 (58.4%) |
| Computers, Engineering & Science | 2,420 (78.2%) | 674 (21.8%) |
| Computers & Mathematics | 1,764 (85.7%) | 295 (14.3%) |
| Architecture & Engineering | 497 (68.5%) | 229 (31.5%) |
| Life, Physical & Social Science | 159 (51.5%) | 150 (48.5%) |
| Community & Social Service | 798 (29.8%) | 1,879 (70.2%) |
| Education, Arts & Media | 163 (34.8%) | 305 (65.2%) |
| Legal Services & Support | 125 (45.1%) | 152 (54.9%) |
| Education Instruction & Library | 283 (20.8%) | 1,079 (79.2%) |
| Arts, Media & Entertainment | 227 (39.8%) | 343 (60.2%) |
| Health Diagnosing & Treating | 436 (22.9%) | 1,469 (77.1%) |
| Health Technologists | 347 (25.5%) | 1,016 (74.5%) |
| Total (Category) | 7,003 (50.3%) | 6,920 (49.7%) |
| Total (Overall) | 14,744 (50.9%) | 14,246 (49.1%) |
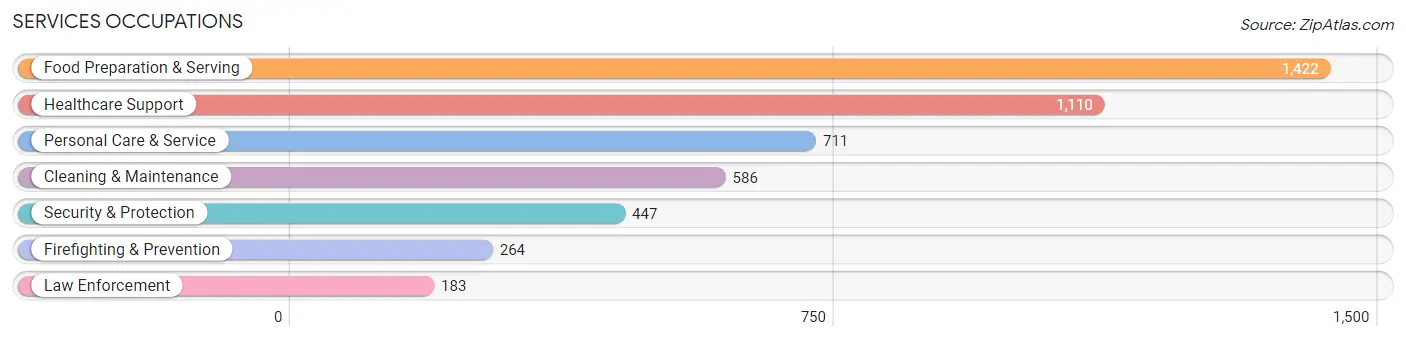
Services Occupations
The most common Services occupations in Apple Valley are Food Preparation & Serving (1,422 | 4.9%), Healthcare Support (1,110 | 3.8%), Personal Care & Service (711 | 2.5%), Cleaning & Maintenance (586 | 2.0%), and Security & Protection (447 | 1.5%).
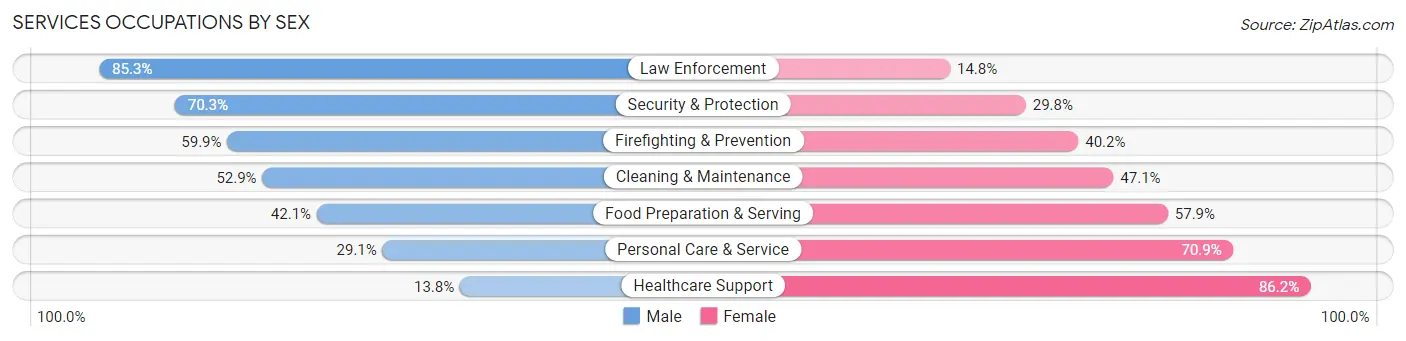
Services Occupations by Sex
Within the Services occupations in Apple Valley, the most male-oriented occupations are Law Enforcement (85.3%), Security & Protection (70.3%), and Firefighting & Prevention (59.9%), while the most female-oriented occupations are Healthcare Support (86.2%), Personal Care & Service (70.9%), and Food Preparation & Serving (57.9%).
| Occupation | Male | Female |
| Healthcare Support | 153 (13.8%) | 957 (86.2%) |
| Security & Protection | 314 (70.3%) | 133 (29.7%) |
| Firefighting & Prevention | 158 (59.9%) | 106 (40.2%) |
| Law Enforcement | 156 (85.3%) | 27 (14.7%) |
| Food Preparation & Serving | 599 (42.1%) | 823 (57.9%) |
| Cleaning & Maintenance | 310 (52.9%) | 276 (47.1%) |
| Personal Care & Service | 207 (29.1%) | 504 (70.9%) |
| Total (Category) | 1,583 (37.0%) | 2,693 (63.0%) |
| Total (Overall) | 14,744 (50.9%) | 14,246 (49.1%) |
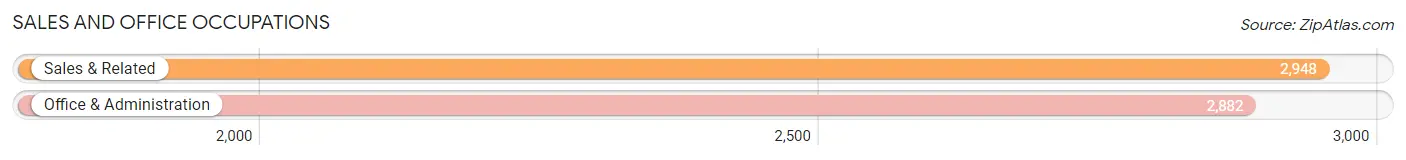
Sales and Office Occupations
The most common Sales and Office occupations in Apple Valley are Sales & Related (2,948 | 10.2%), and Office & Administration (2,882 | 9.9%).
Sales and Office Occupations by Sex
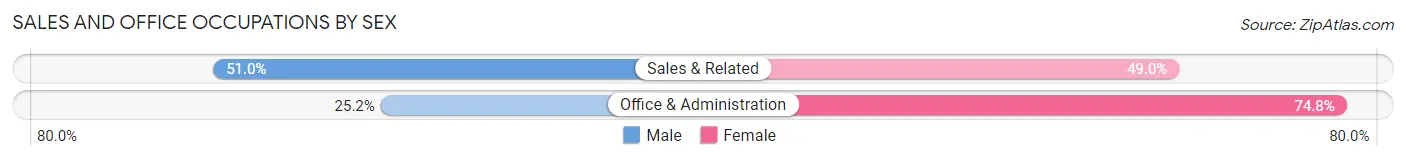
| Occupation | Male | Female |
| Sales & Related | 1,503 (51.0%) | 1,445 (49.0%) |
| Office & Administration | 727 (25.2%) | 2,155 (74.8%) |
| Total (Category) | 2,230 (38.3%) | 3,600 (61.8%) |
| Total (Overall) | 14,744 (50.9%) | 14,246 (49.1%) |
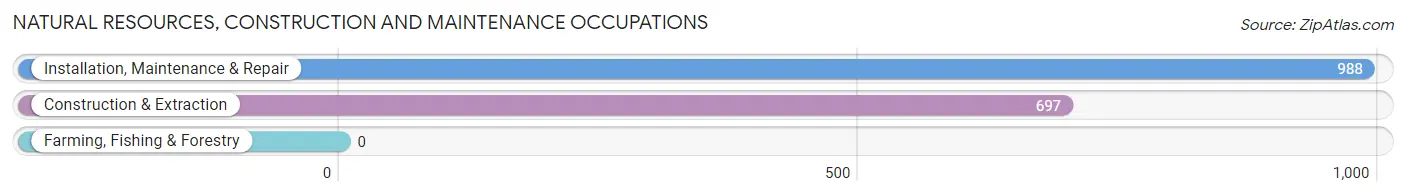
Natural Resources, Construction and Maintenance Occupations
The most common Natural Resources, Construction and Maintenance occupations in Apple Valley are Installation, Maintenance & Repair (988 | 3.4%), and Construction & Extraction (697 | 2.4%).
Natural Resources, Construction and Maintenance Occupations by Sex
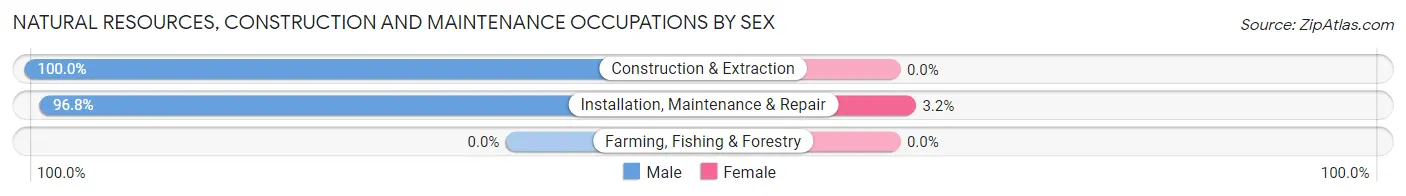
| Occupation | Male | Female |
| Farming, Fishing & Forestry | 0 (0.0%) | 0 (0.0%) |
| Construction & Extraction | 697 (100.0%) | 0 (0.0%) |
| Installation, Maintenance & Repair | 956 (96.8%) | 32 (3.2%) |
| Total (Category) | 1,653 (98.1%) | 32 (1.9%) |
| Total (Overall) | 14,744 (50.9%) | 14,246 (49.1%) |
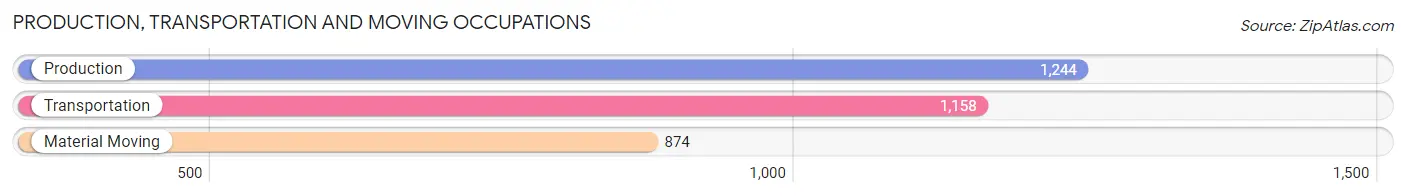
Production, Transportation and Moving Occupations
The most common Production, Transportation and Moving occupations in Apple Valley are Production (1,244 | 4.3%), Transportation (1,158 | 4.0%), and Material Moving (874 | 3.0%).
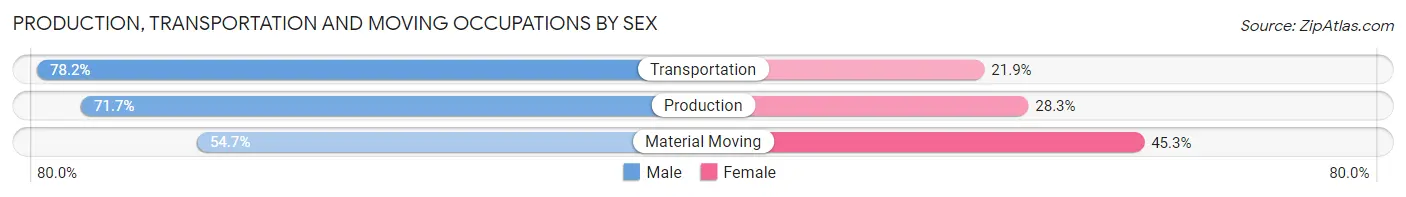
Production, Transportation and Moving Occupations by Sex
| Occupation | Male | Female |
| Production | 892 (71.7%) | 352 (28.3%) |
| Transportation | 905 (78.1%) | 253 (21.8%) |
| Material Moving | 478 (54.7%) | 396 (45.3%) |
| Total (Category) | 2,275 (69.4%) | 1,001 (30.6%) |
| Total (Overall) | 14,744 (50.9%) | 14,246 (49.1%) |
Employment Industries by Sex in Apple Valley
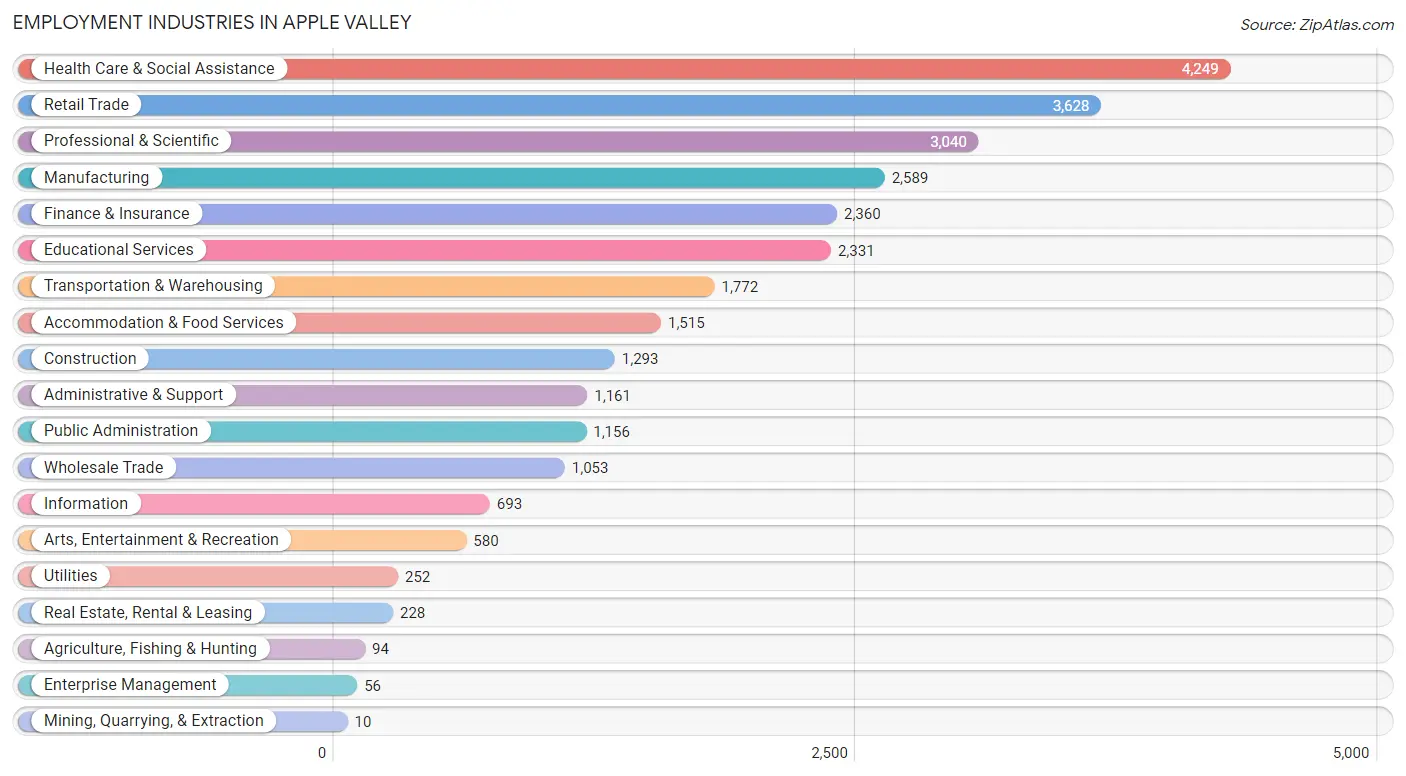
Employment Industries in Apple Valley
The major employment industries in Apple Valley include Health Care & Social Assistance (4,249 | 14.7%), Retail Trade (3,628 | 12.5%), Professional & Scientific (3,040 | 10.5%), Manufacturing (2,589 | 8.9%), and Finance & Insurance (2,360 | 8.1%).
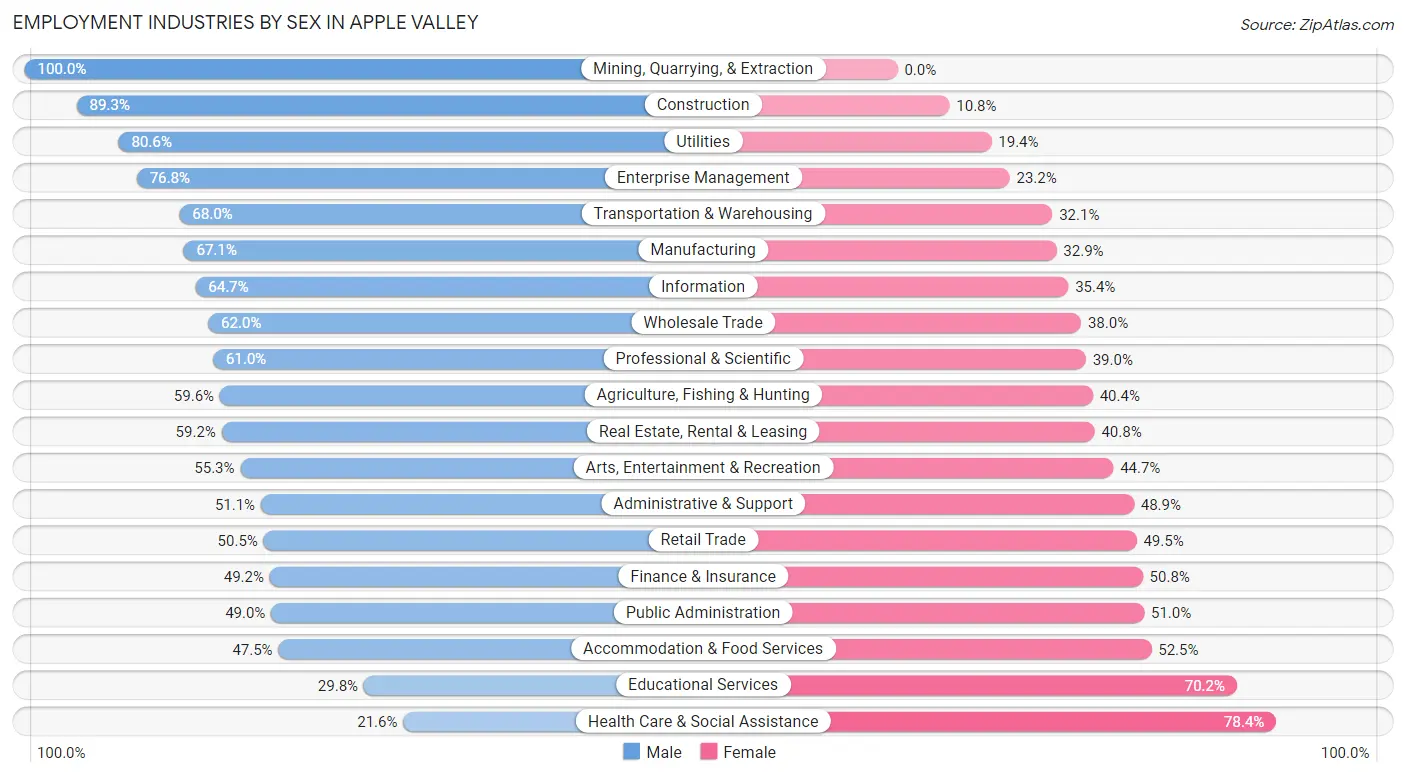
Employment Industries by Sex in Apple Valley
The Apple Valley industries that see more men than women are Mining, Quarrying, & Extraction (100.0%), Construction (89.2%), and Utilities (80.6%), whereas the industries that tend to have a higher number of women are Health Care & Social Assistance (78.4%), Educational Services (70.2%), and Accommodation & Food Services (52.5%).
| Industry | Male | Female |
| Agriculture, Fishing & Hunting | 56 (59.6%) | 38 (40.4%) |
| Mining, Quarrying, & Extraction | 10 (100.0%) | 0 (0.0%) |
| Construction | 1,154 (89.2%) | 139 (10.7%) |
| Manufacturing | 1,737 (67.1%) | 852 (32.9%) |
| Wholesale Trade | 653 (62.0%) | 400 (38.0%) |
| Retail Trade | 1,833 (50.5%) | 1,795 (49.5%) |
| Transportation & Warehousing | 1,204 (67.9%) | 568 (32.1%) |
| Utilities | 203 (80.6%) | 49 (19.4%) |
| Information | 448 (64.6%) | 245 (35.3%) |
| Finance & Insurance | 1,162 (49.2%) | 1,198 (50.8%) |
| Real Estate, Rental & Leasing | 135 (59.2%) | 93 (40.8%) |
| Professional & Scientific | 1,855 (61.0%) | 1,185 (39.0%) |
| Enterprise Management | 43 (76.8%) | 13 (23.2%) |
| Administrative & Support | 593 (51.1%) | 568 (48.9%) |
| Educational Services | 694 (29.8%) | 1,637 (70.2%) |
| Health Care & Social Assistance | 918 (21.6%) | 3,331 (78.4%) |
| Arts, Entertainment & Recreation | 321 (55.3%) | 259 (44.7%) |
| Accommodation & Food Services | 719 (47.5%) | 796 (52.5%) |
| Public Administration | 566 (49.0%) | 590 (51.0%) |
| Total | 14,744 (50.9%) | 14,246 (49.1%) |
Education in Apple Valley
School Enrollment in Apple Valley
The most common levels of schooling among the 14,255 students in Apple Valley are middle school (3,700 | 26.0%), elementary school (3,239 | 22.7%), and high school (2,954 | 20.7%).
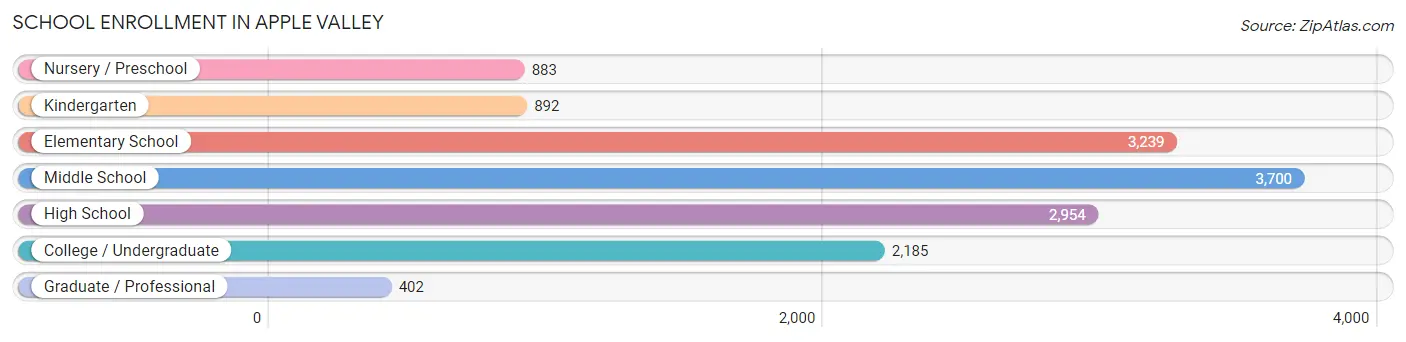
| School Level | # Students | % Students |
| Nursery / Preschool | 883 | 6.2% |
| Kindergarten | 892 | 6.3% |
| Elementary School | 3,239 | 22.7% |
| Middle School | 3,700 | 26.0% |
| High School | 2,954 | 20.7% |
| College / Undergraduate | 2,185 | 15.3% |
| Graduate / Professional | 402 | 2.8% |
| Total | 14,255 | 100.0% |
School Enrollment by Age by Funding Source in Apple Valley
Out of a total of 14,255 students who are enrolled in schools in Apple Valley, 1,939 (13.6%) attend a private institution, while the remaining 12,316 (86.4%) are enrolled in public schools. The age group of 3 to 4 year olds has the highest likelihood of being enrolled in private schools, with 317 (49.8% in the age bracket) enrolled. Conversely, the age group of 18 to 19 year olds has the lowest likelihood of being enrolled in a private school, with 776 (95.2% in the age bracket) attending a public institution.
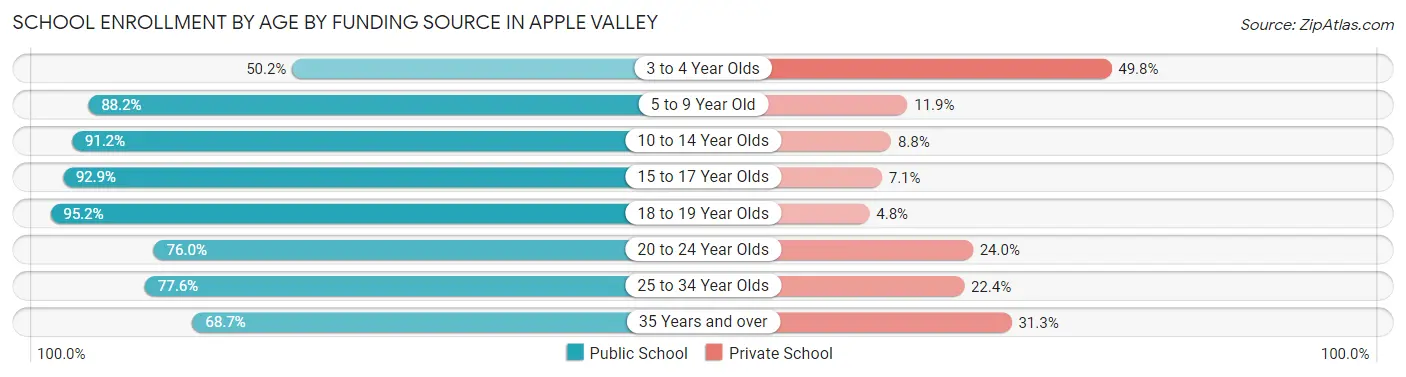
| Age Bracket | Public School | Private School |
| 3 to 4 Year Olds | 319 (50.2%) | 317 (49.8%) |
| 5 to 9 Year Old | 3,475 (88.1%) | 467 (11.8%) |
| 10 to 14 Year Olds | 4,007 (91.2%) | 387 (8.8%) |
| 15 to 17 Year Olds | 2,082 (92.9%) | 159 (7.1%) |
| 18 to 19 Year Olds | 776 (95.2%) | 39 (4.8%) |
| 20 to 24 Year Olds | 730 (76.0%) | 231 (24.0%) |
| 25 to 34 Year Olds | 471 (77.6%) | 136 (22.4%) |
| 35 Years and over | 453 (68.7%) | 206 (31.3%) |
| Total | 12,316 (86.4%) | 1,939 (13.6%) |
Educational Attainment by Field of Study in Apple Valley
Business (4,195 | 22.7%), education (2,013 | 10.9%), science & technology (1,715 | 9.3%), social sciences (1,431 | 7.7%), and computers & mathematics (1,376 | 7.4%) are the most common fields of study among 18,473 individuals in Apple Valley who have obtained a bachelor's degree or higher.
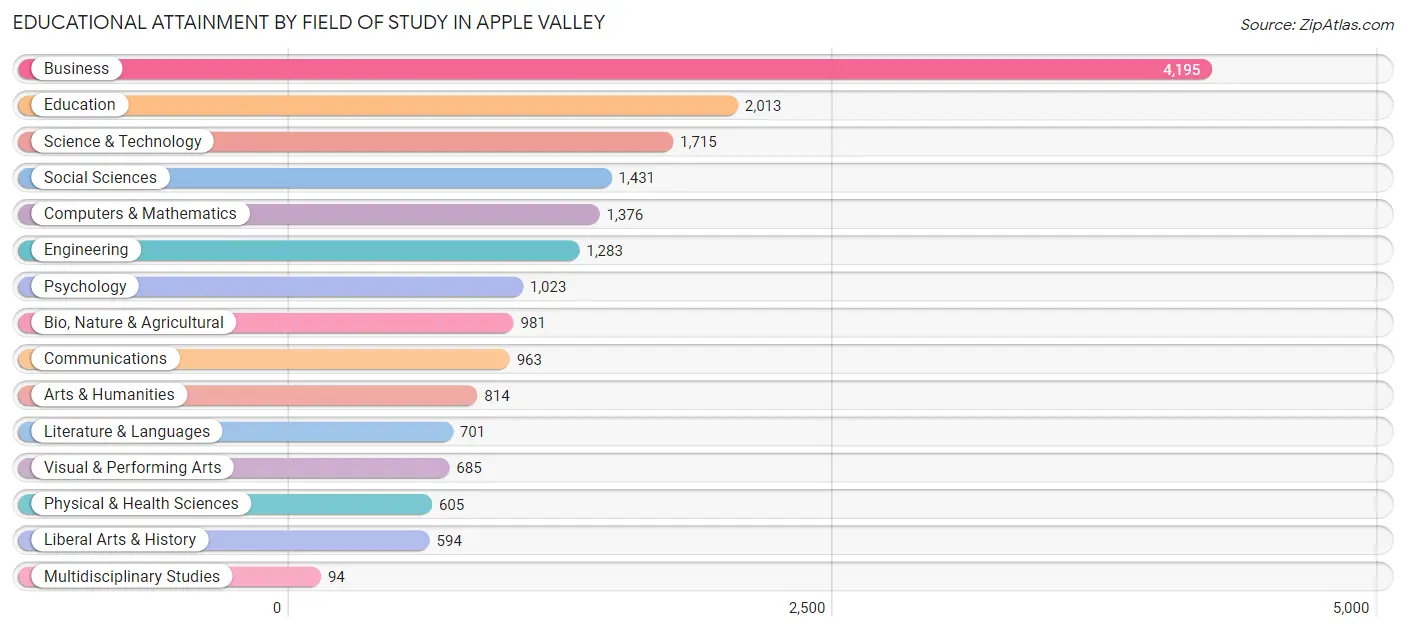
| Field of Study | # Graduates | % Graduates |
| Computers & Mathematics | 1,376 | 7.4% |
| Bio, Nature & Agricultural | 981 | 5.3% |
| Physical & Health Sciences | 605 | 3.3% |
| Psychology | 1,023 | 5.5% |
| Social Sciences | 1,431 | 7.7% |
| Engineering | 1,283 | 7.0% |
| Multidisciplinary Studies | 94 | 0.5% |
| Science & Technology | 1,715 | 9.3% |
| Business | 4,195 | 22.7% |
| Education | 2,013 | 10.9% |
| Literature & Languages | 701 | 3.8% |
| Liberal Arts & History | 594 | 3.2% |
| Visual & Performing Arts | 685 | 3.7% |
| Communications | 963 | 5.2% |
| Arts & Humanities | 814 | 4.4% |
| Total | 18,473 | 100.0% |
Transportation & Commute in Apple Valley
Vehicle Availability by Sex in Apple Valley
The most prevalent vehicle ownership categories in Apple Valley are males with 2 vehicles (7,725, accounting for 52.6%) and females with 2 vehicles (6,331, making up 55.1%).
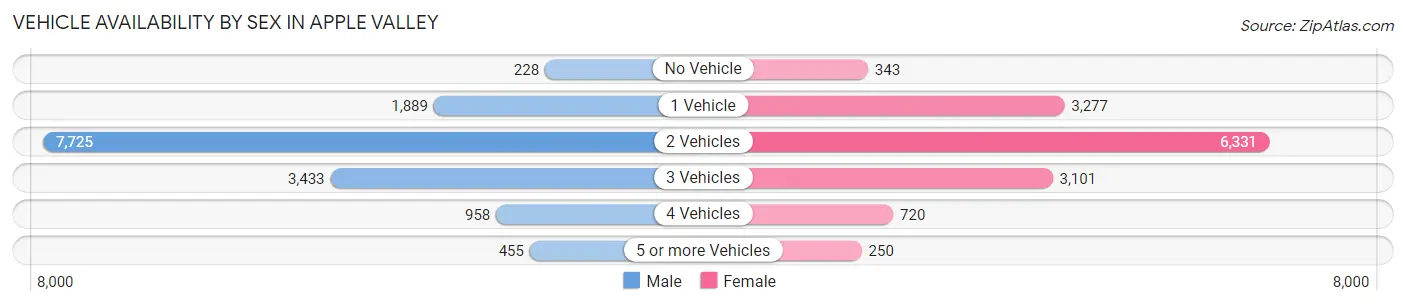
| Vehicles Available | Male | Female |
| No Vehicle | 228 (1.5%) | 343 (2.5%) |
| 1 Vehicle | 1,889 (12.9%) | 3,277 (23.4%) |
| 2 Vehicles | 7,725 (52.6%) | 6,331 (45.2%) |
| 3 Vehicles | 3,433 (23.4%) | 3,101 (22.1%) |
| 4 Vehicles | 958 (6.5%) | 720 (5.1%) |
| 5 or more Vehicles | 455 (3.1%) | 250 (1.8%) |
| Total | 14,688 (100.0%) | 14,022 (100.0%) |
Commute Time in Apple Valley
The most frequently occuring commute durations in Apple Valley are 20 to 24 minutes (3,997 commuters, 16.7%), 15 to 19 minutes (3,593 commuters, 15.0%), and 30 to 34 minutes (3,489 commuters, 14.5%).
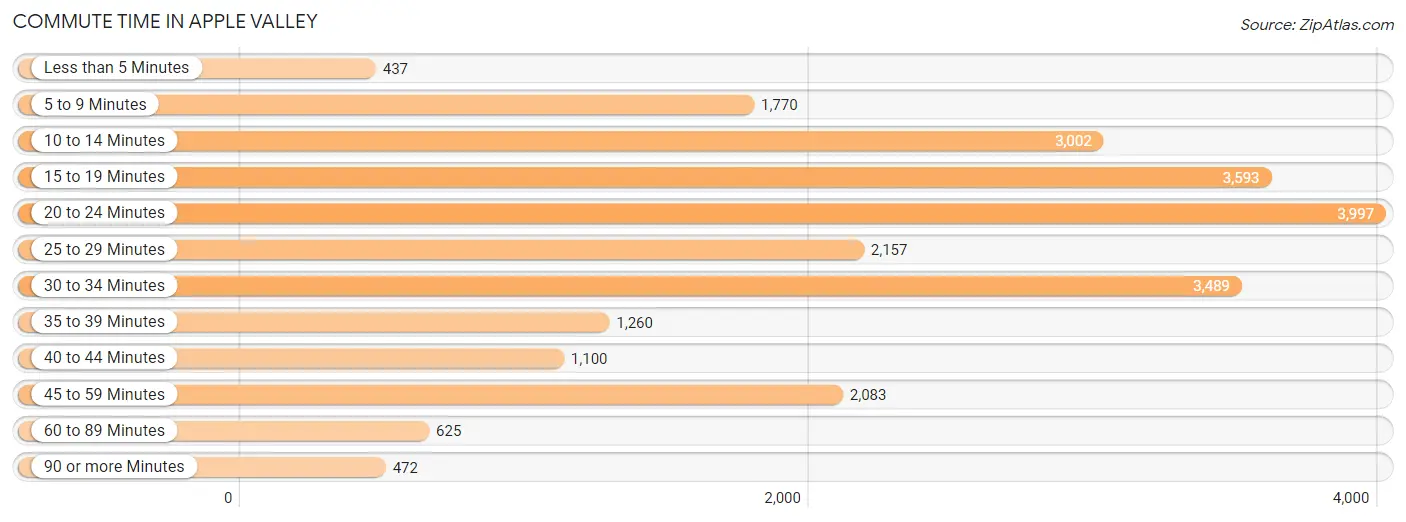
| Commute Time | # Commuters | % Commuters |
| Less than 5 Minutes | 437 | 1.8% |
| 5 to 9 Minutes | 1,770 | 7.4% |
| 10 to 14 Minutes | 3,002 | 12.5% |
| 15 to 19 Minutes | 3,593 | 15.0% |
| 20 to 24 Minutes | 3,997 | 16.7% |
| 25 to 29 Minutes | 2,157 | 9.0% |
| 30 to 34 Minutes | 3,489 | 14.5% |
| 35 to 39 Minutes | 1,260 | 5.2% |
| 40 to 44 Minutes | 1,100 | 4.6% |
| 45 to 59 Minutes | 2,083 | 8.7% |
| 60 to 89 Minutes | 625 | 2.6% |
| 90 or more Minutes | 472 | 2.0% |
Commute Time by Sex in Apple Valley
The most common commute times in Apple Valley are 20 to 24 minutes (2,038 commuters, 16.6%) for males and 20 to 24 minutes (1,959 commuters, 16.7%) for females.
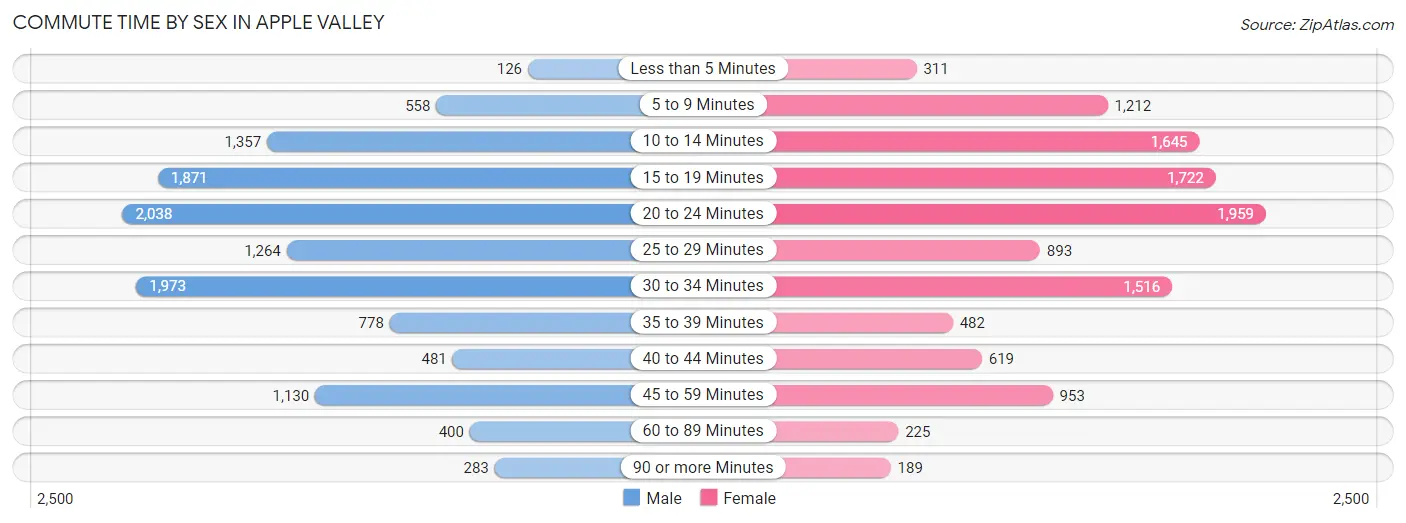
| Commute Time | Male | Female |
| Less than 5 Minutes | 126 (1.0%) | 311 (2.6%) |
| 5 to 9 Minutes | 558 (4.5%) | 1,212 (10.3%) |
| 10 to 14 Minutes | 1,357 (11.1%) | 1,645 (14.0%) |
| 15 to 19 Minutes | 1,871 (15.3%) | 1,722 (14.7%) |
| 20 to 24 Minutes | 2,038 (16.6%) | 1,959 (16.7%) |
| 25 to 29 Minutes | 1,264 (10.3%) | 893 (7.6%) |
| 30 to 34 Minutes | 1,973 (16.1%) | 1,516 (12.9%) |
| 35 to 39 Minutes | 778 (6.4%) | 482 (4.1%) |
| 40 to 44 Minutes | 481 (3.9%) | 619 (5.3%) |
| 45 to 59 Minutes | 1,130 (9.2%) | 953 (8.1%) |
| 60 to 89 Minutes | 400 (3.3%) | 225 (1.9%) |
| 90 or more Minutes | 283 (2.3%) | 189 (1.6%) |
Time of Departure to Work by Sex in Apple Valley
The most frequent times of departure to work in Apple Valley are 6:30 AM to 6:59 AM (1,675, 13.7%) for males and 7:00 AM to 7:29 AM (1,810, 15.4%) for females.
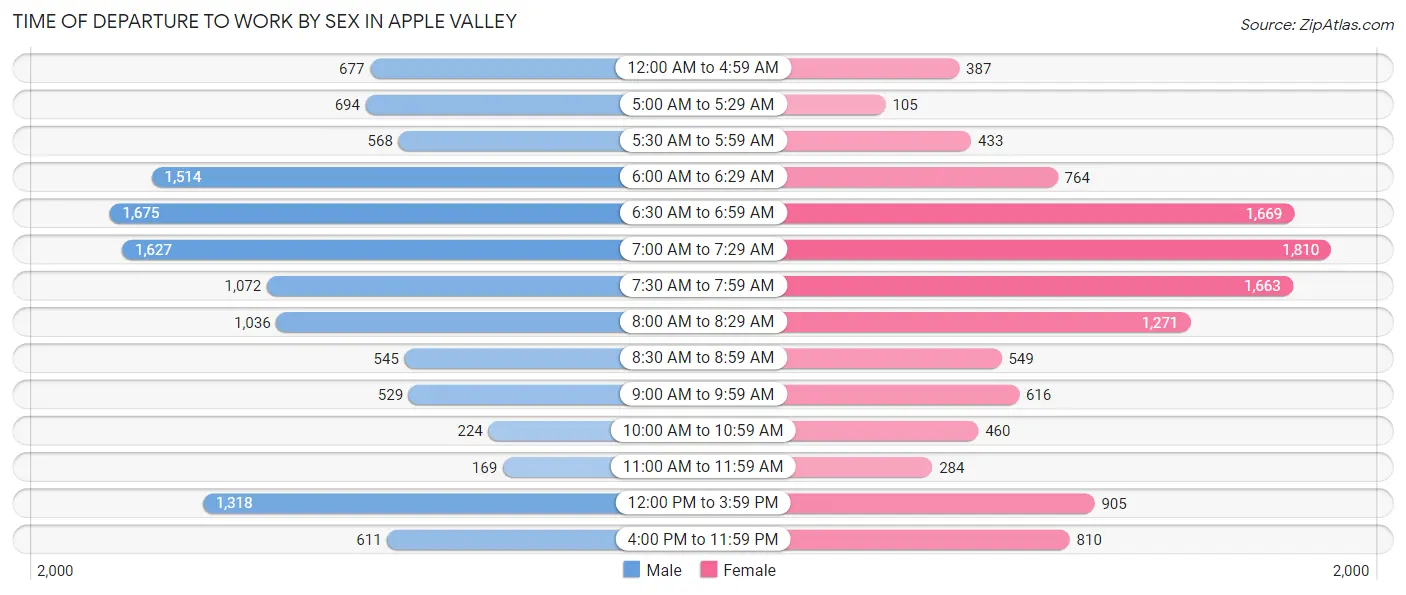
| Time of Departure | Male | Female |
| 12:00 AM to 4:59 AM | 677 (5.5%) | 387 (3.3%) |
| 5:00 AM to 5:29 AM | 694 (5.7%) | 105 (0.9%) |
| 5:30 AM to 5:59 AM | 568 (4.6%) | 433 (3.7%) |
| 6:00 AM to 6:29 AM | 1,514 (12.3%) | 764 (6.5%) |
| 6:30 AM to 6:59 AM | 1,675 (13.7%) | 1,669 (14.2%) |
| 7:00 AM to 7:29 AM | 1,627 (13.3%) | 1,810 (15.4%) |
| 7:30 AM to 7:59 AM | 1,072 (8.7%) | 1,663 (14.2%) |
| 8:00 AM to 8:29 AM | 1,036 (8.5%) | 1,271 (10.8%) |
| 8:30 AM to 8:59 AM | 545 (4.4%) | 549 (4.7%) |
| 9:00 AM to 9:59 AM | 529 (4.3%) | 616 (5.2%) |
| 10:00 AM to 10:59 AM | 224 (1.8%) | 460 (3.9%) |
| 11:00 AM to 11:59 AM | 169 (1.4%) | 284 (2.4%) |
| 12:00 PM to 3:59 PM | 1,318 (10.7%) | 905 (7.7%) |
| 4:00 PM to 11:59 PM | 611 (5.0%) | 810 (6.9%) |
| Total | 12,259 (100.0%) | 11,726 (100.0%) |
Housing Occupancy in Apple Valley
Occupancy by Ownership in Apple Valley
Of the total 21,311 dwellings in Apple Valley, owner-occupied units account for 16,101 (75.5%), while renter-occupied units make up 5,210 (24.4%).
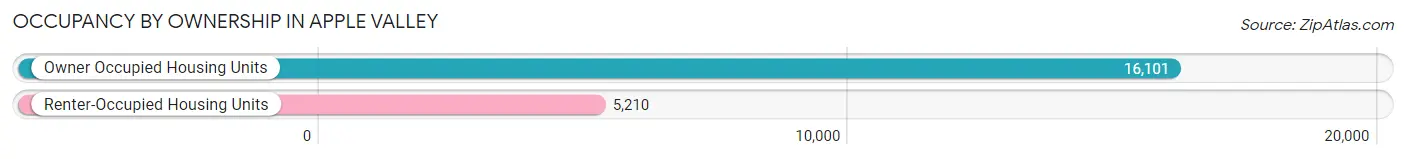
| Occupancy | # Housing Units | % Housing Units |
| Owner Occupied Housing Units | 16,101 | 75.5% |
| Renter-Occupied Housing Units | 5,210 | 24.4% |
| Total Occupied Housing Units | 21,311 | 100.0% |
Occupancy by Household Size in Apple Valley
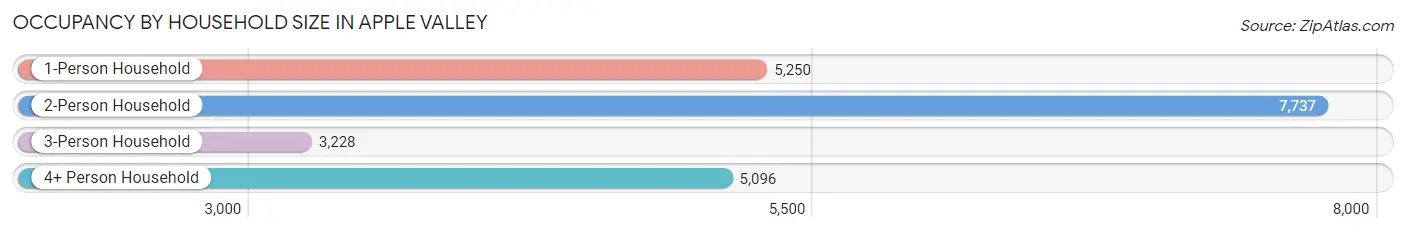
| Household Size | # Housing Units | % Housing Units |
| 1-Person Household | 5,250 | 24.6% |
| 2-Person Household | 7,737 | 36.3% |
| 3-Person Household | 3,228 | 15.1% |
| 4+ Person Household | 5,096 | 23.9% |
| Total Housing Units | 21,311 | 100.0% |
Occupancy by Ownership by Household Size in Apple Valley
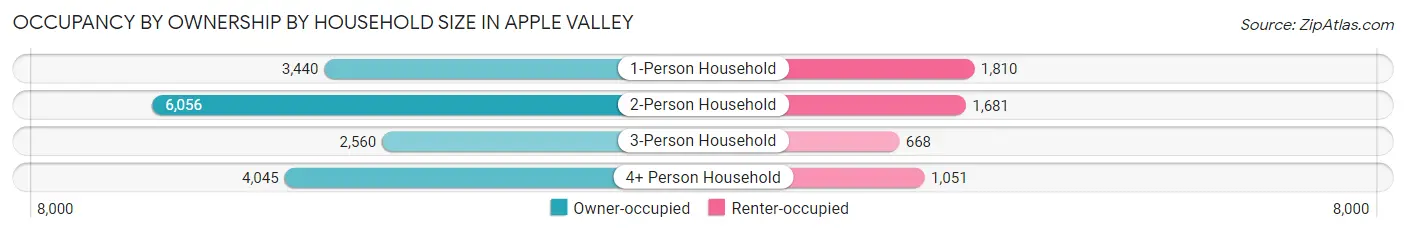
| Household Size | Owner-occupied | Renter-occupied |
| 1-Person Household | 3,440 (65.5%) | 1,810 (34.5%) |
| 2-Person Household | 6,056 (78.3%) | 1,681 (21.7%) |
| 3-Person Household | 2,560 (79.3%) | 668 (20.7%) |
| 4+ Person Household | 4,045 (79.4%) | 1,051 (20.6%) |
| Total Housing Units | 16,101 (75.5%) | 5,210 (24.4%) |
Occupancy by Educational Attainment in Apple Valley
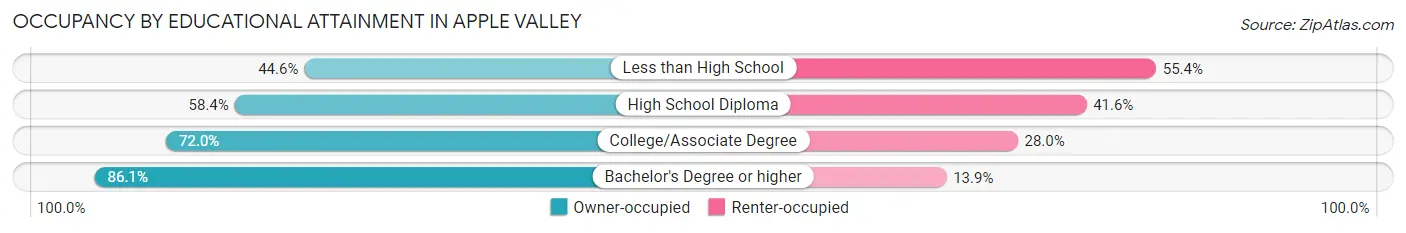
| Household Size | Owner-occupied | Renter-occupied |
| Less than High School | 303 (44.6%) | 377 (55.4%) |
| High School Diploma | 2,081 (58.4%) | 1,485 (41.6%) |
| College/Associate Degree | 4,976 (72.0%) | 1,938 (28.0%) |
| Bachelor's Degree or higher | 8,741 (86.1%) | 1,410 (13.9%) |
Occupancy by Age of Householder in Apple Valley
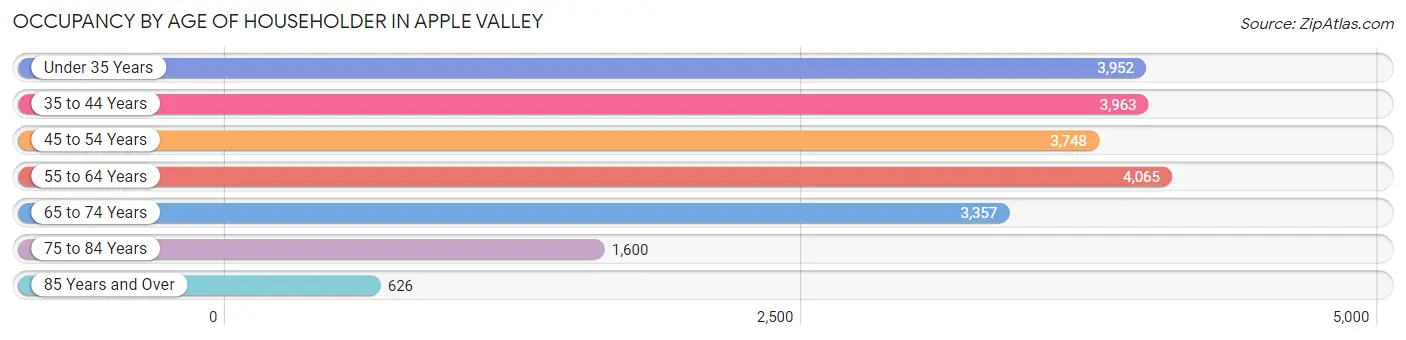
| Age Bracket | # Households | % Households |
| Under 35 Years | 3,952 | 18.5% |
| 35 to 44 Years | 3,963 | 18.6% |
| 45 to 54 Years | 3,748 | 17.6% |
| 55 to 64 Years | 4,065 | 19.1% |
| 65 to 74 Years | 3,357 | 15.8% |
| 75 to 84 Years | 1,600 | 7.5% |
| 85 Years and Over | 626 | 2.9% |
| Total | 21,311 | 100.0% |
Housing Finances in Apple Valley
Median Income by Occupancy in Apple Valley
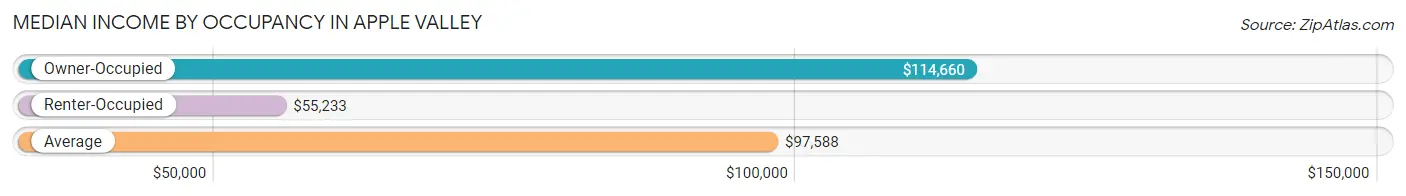
| Occupancy Type | # Households | Median Income |
| Owner-Occupied | 16,101 (75.5%) | $114,660 |
| Renter-Occupied | 5,210 (24.4%) | $55,233 |
| Average | 21,311 (100.0%) | $97,588 |
Occupancy by Householder Income Bracket in Apple Valley
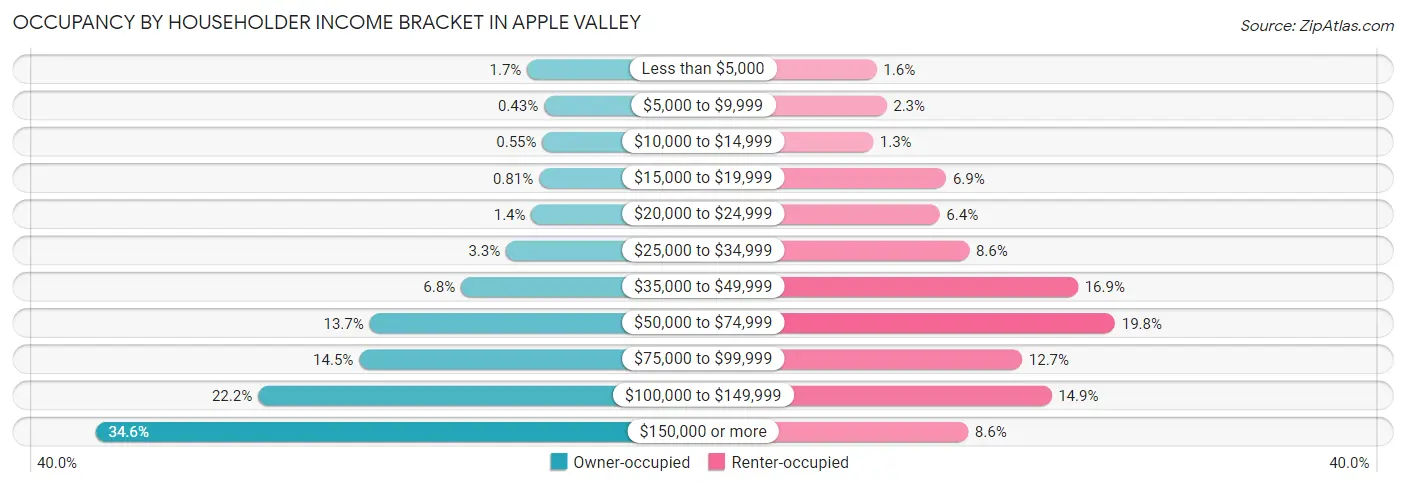
| Income Bracket | Owner-occupied | Renter-occupied |
| Less than $5,000 | 276 (1.7%) | 83 (1.6%) |
| $5,000 to $9,999 | 69 (0.4%) | 122 (2.3%) |
| $10,000 to $14,999 | 89 (0.5%) | 69 (1.3%) |
| $15,000 to $19,999 | 130 (0.8%) | 359 (6.9%) |
| $20,000 to $24,999 | 224 (1.4%) | 333 (6.4%) |
| $25,000 to $34,999 | 534 (3.3%) | 450 (8.6%) |
| $35,000 to $49,999 | 1,087 (6.8%) | 882 (16.9%) |
| $50,000 to $74,999 | 2,209 (13.7%) | 1,029 (19.8%) |
| $75,000 to $99,999 | 2,337 (14.5%) | 660 (12.7%) |
| $100,000 to $149,999 | 3,577 (22.2%) | 777 (14.9%) |
| $150,000 or more | 5,569 (34.6%) | 446 (8.6%) |
| Total | 16,101 (100.0%) | 5,210 (100.0%) |
Monthly Housing Cost Tiers in Apple Valley
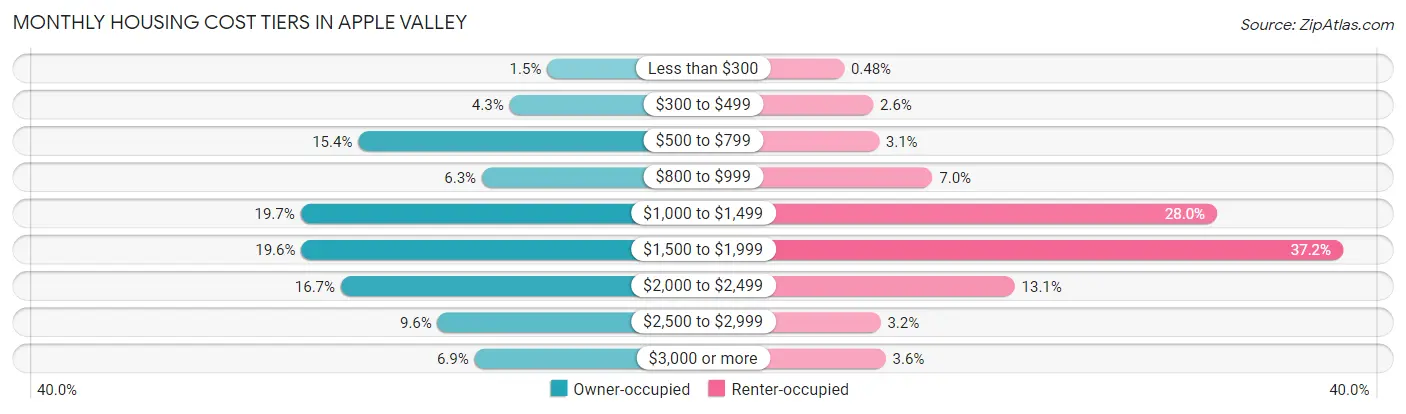
| Monthly Cost | Owner-occupied | Renter-occupied |
| Less than $300 | 243 (1.5%) | 25 (0.5%) |
| $300 to $499 | 691 (4.3%) | 137 (2.6%) |
| $500 to $799 | 2,484 (15.4%) | 159 (3.0%) |
| $800 to $999 | 1,018 (6.3%) | 364 (7.0%) |
| $1,000 to $1,499 | 3,169 (19.7%) | 1,456 (28.0%) |
| $1,500 to $1,999 | 3,159 (19.6%) | 1,939 (37.2%) |
| $2,000 to $2,499 | 2,690 (16.7%) | 680 (13.1%) |
| $2,500 to $2,999 | 1,543 (9.6%) | 165 (3.2%) |
| $3,000 or more | 1,104 (6.9%) | 185 (3.5%) |
| Total | 16,101 (100.0%) | 5,210 (100.0%) |
Physical Housing Characteristics in Apple Valley
Housing Structures in Apple Valley
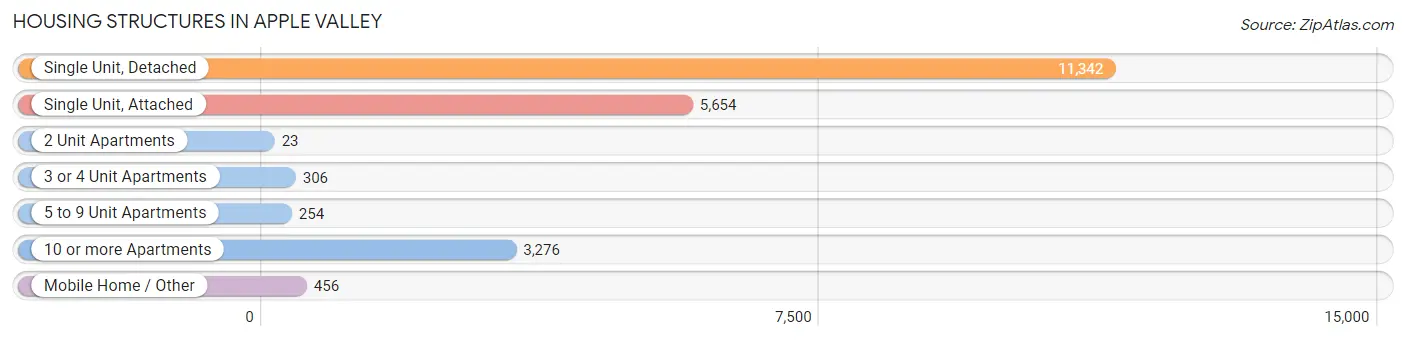
| Structure Type | # Housing Units | % Housing Units |
| Single Unit, Detached | 11,342 | 53.2% |
| Single Unit, Attached | 5,654 | 26.5% |
| 2 Unit Apartments | 23 | 0.1% |
| 3 or 4 Unit Apartments | 306 | 1.4% |
| 5 to 9 Unit Apartments | 254 | 1.2% |
| 10 or more Apartments | 3,276 | 15.4% |
| Mobile Home / Other | 456 | 2.1% |
| Total | 21,311 | 100.0% |
Housing Structures by Occupancy in Apple Valley
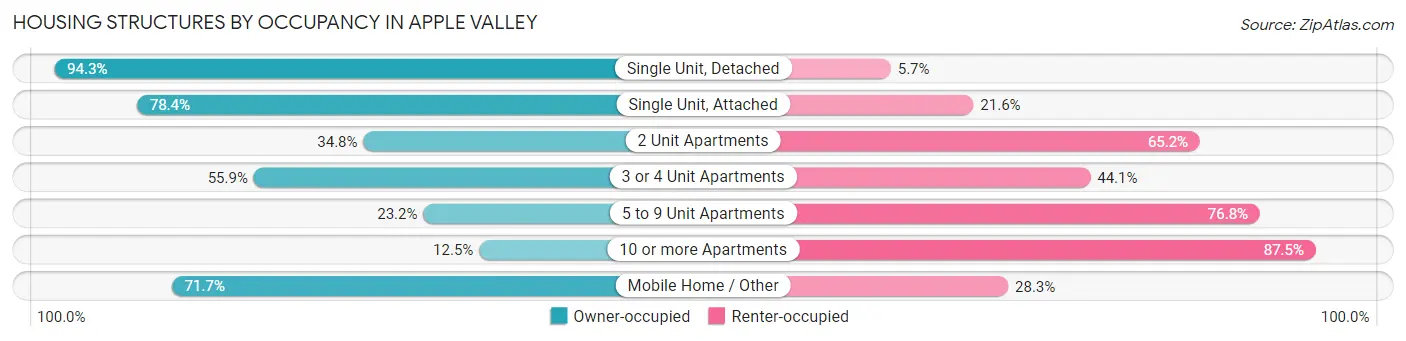
| Structure Type | Owner-occupied | Renter-occupied |
| Single Unit, Detached | 10,695 (94.3%) | 647 (5.7%) |
| Single Unit, Attached | 4,432 (78.4%) | 1,222 (21.6%) |
| 2 Unit Apartments | 8 (34.8%) | 15 (65.2%) |
| 3 or 4 Unit Apartments | 171 (55.9%) | 135 (44.1%) |
| 5 to 9 Unit Apartments | 59 (23.2%) | 195 (76.8%) |
| 10 or more Apartments | 409 (12.5%) | 2,867 (87.5%) |
| Mobile Home / Other | 327 (71.7%) | 129 (28.3%) |
| Total | 16,101 (75.5%) | 5,210 (24.4%) |
Housing Structures by Number of Rooms in Apple Valley
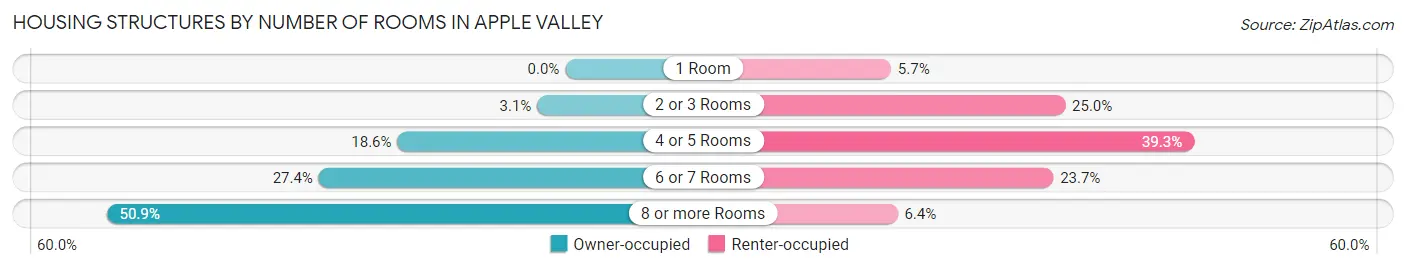
| Number of Rooms | Owner-occupied | Renter-occupied |
| 1 Room | 0 (0.0%) | 295 (5.7%) |
| 2 or 3 Rooms | 501 (3.1%) | 1,302 (25.0%) |
| 4 or 5 Rooms | 3,000 (18.6%) | 2,047 (39.3%) |
| 6 or 7 Rooms | 4,405 (27.4%) | 1,233 (23.7%) |
| 8 or more Rooms | 8,195 (50.9%) | 333 (6.4%) |
| Total | 16,101 (100.0%) | 5,210 (100.0%) |
Housing Structure by Heating Type in Apple Valley
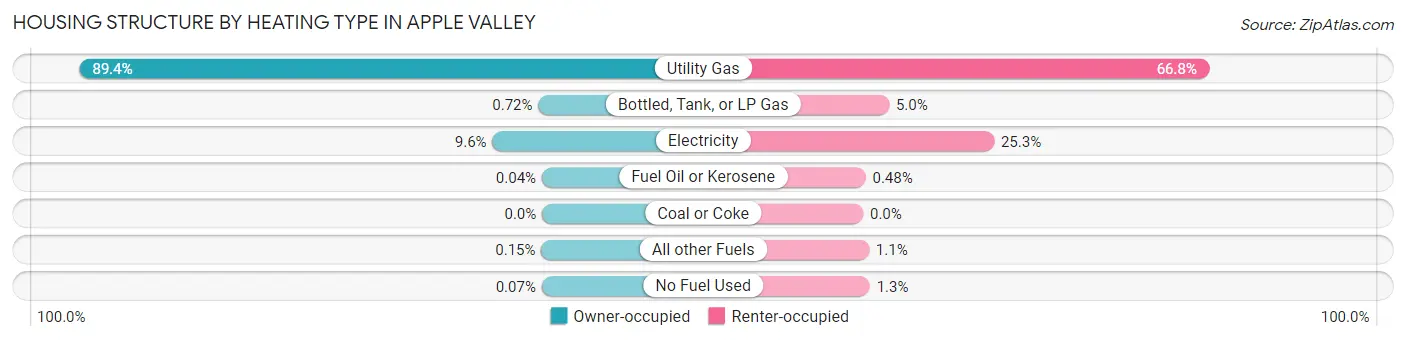
| Heating Type | Owner-occupied | Renter-occupied |
| Utility Gas | 14,397 (89.4%) | 3,480 (66.8%) |
| Bottled, Tank, or LP Gas | 116 (0.7%) | 261 (5.0%) |
| Electricity | 1,546 (9.6%) | 1,318 (25.3%) |
| Fuel Oil or Kerosene | 7 (0.0%) | 25 (0.5%) |
| Coal or Coke | 0 (0.0%) | 0 (0.0%) |
| All other Fuels | 24 (0.2%) | 59 (1.1%) |
| No Fuel Used | 11 (0.1%) | 67 (1.3%) |
| Total | 16,101 (100.0%) | 5,210 (100.0%) |
Household Vehicle Usage in Apple Valley
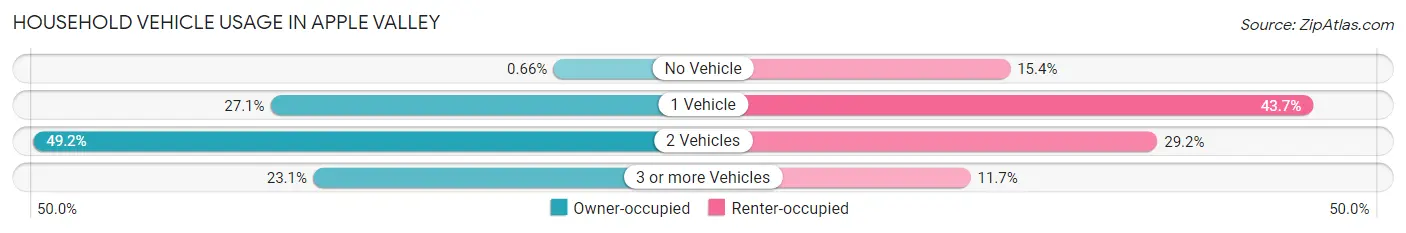
| Vehicles per Household | Owner-occupied | Renter-occupied |
| No Vehicle | 106 (0.7%) | 804 (15.4%) |
| 1 Vehicle | 4,357 (27.1%) | 2,276 (43.7%) |
| 2 Vehicles | 7,918 (49.2%) | 1,519 (29.2%) |
| 3 or more Vehicles | 3,720 (23.1%) | 611 (11.7%) |
| Total | 16,101 (100.0%) | 5,210 (100.0%) |
Real Estate & Mortgages in Apple Valley
Real Estate and Mortgage Overview in Apple Valley
| Characteristic | Without Mortgage | With Mortgage |
| Housing Units | 4,617 | 11,484 |
| Median Property Value | $340,400 | $330,400 |
| Median Household Income | $88,608 | $4,377 |
| Monthly Housing Costs | $681 | $1,104 |
| Real Estate Taxes | $3,216 | $189 |
Property Value by Mortgage Status in Apple Valley
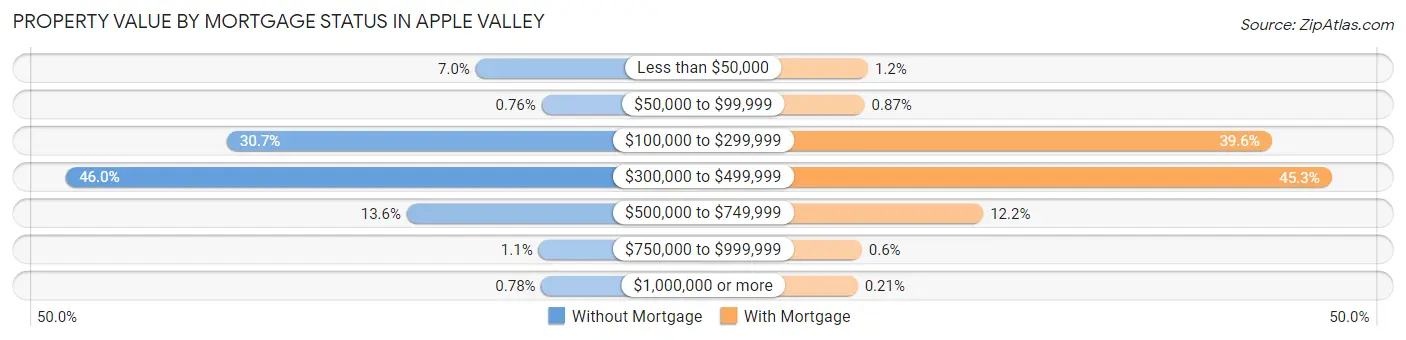
| Property Value | Without Mortgage | With Mortgage |
| Less than $50,000 | 325 (7.0%) | 137 (1.2%) |
| $50,000 to $99,999 | 35 (0.8%) | 100 (0.9%) |
| $100,000 to $299,999 | 1,419 (30.7%) | 4,551 (39.6%) |
| $300,000 to $499,999 | 2,125 (46.0%) | 5,206 (45.3%) |
| $500,000 to $749,999 | 628 (13.6%) | 1,397 (12.2%) |
| $750,000 to $999,999 | 49 (1.1%) | 69 (0.6%) |
| $1,000,000 or more | 36 (0.8%) | 24 (0.2%) |
| Total | 4,617 (100.0%) | 11,484 (100.0%) |
Household Income by Mortgage Status in Apple Valley
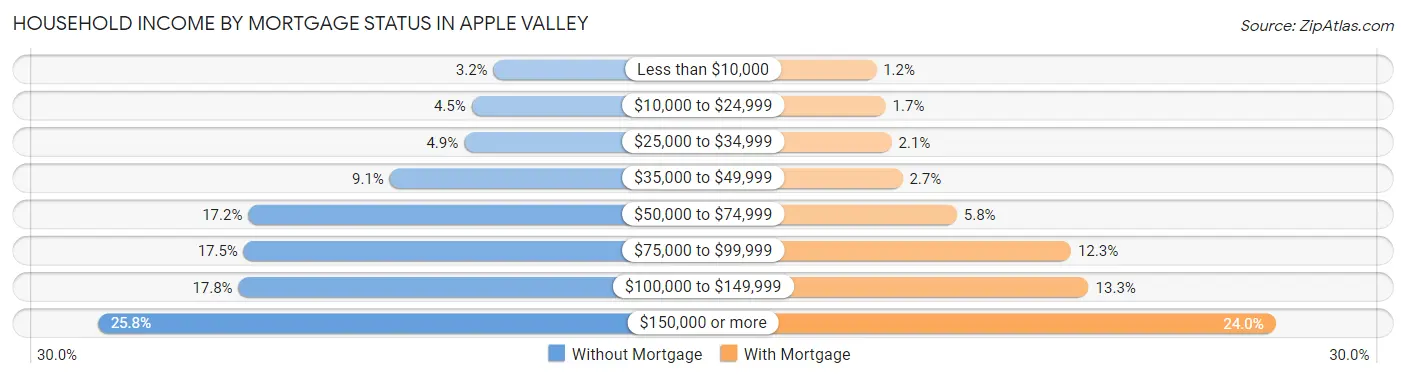
| Household Income | Without Mortgage | With Mortgage |
| Less than $10,000 | 148 (3.2%) | 136 (1.2%) |
| $10,000 to $24,999 | 206 (4.5%) | 197 (1.7%) |
| $25,000 to $34,999 | 226 (4.9%) | 237 (2.1%) |
| $35,000 to $49,999 | 422 (9.1%) | 308 (2.7%) |
| $50,000 to $74,999 | 795 (17.2%) | 665 (5.8%) |
| $75,000 to $99,999 | 807 (17.5%) | 1,414 (12.3%) |
| $100,000 to $149,999 | 821 (17.8%) | 1,530 (13.3%) |
| $150,000 or more | 1,192 (25.8%) | 2,756 (24.0%) |
| Total | 4,617 (100.0%) | 11,484 (100.0%) |
Property Value to Household Income Ratio in Apple Valley
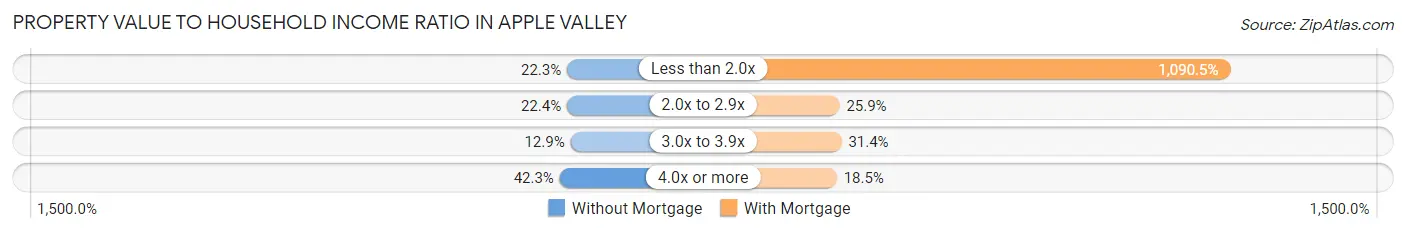
| Value-to-Income Ratio | Without Mortgage | With Mortgage |
| Less than 2.0x | 1,031 (22.3%) | 125,236 (1,090.5%) |
| 2.0x to 2.9x | 1,035 (22.4%) | 2,977 (25.9%) |
| 3.0x to 3.9x | 596 (12.9%) | 3,609 (31.4%) |
| 4.0x or more | 1,951 (42.3%) | 2,120 (18.5%) |
| Total | 4,617 (100.0%) | 11,484 (100.0%) |
Real Estate Taxes by Mortgage Status in Apple Valley
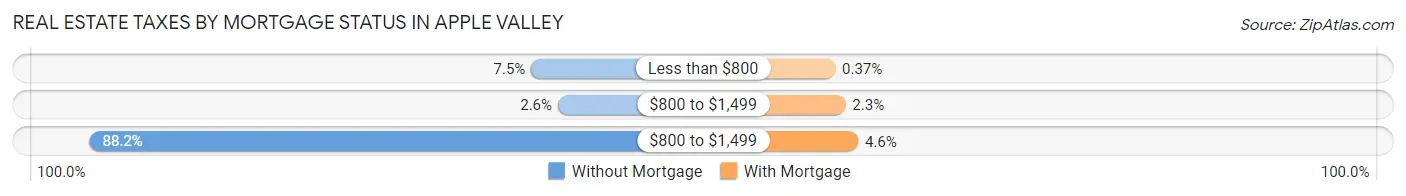
| Property Taxes | Without Mortgage | With Mortgage |
| Less than $800 | 345 (7.5%) | 43 (0.4%) |
| $800 to $1,499 | 120 (2.6%) | 259 (2.3%) |
| $800 to $1,499 | 4,070 (88.1%) | 524 (4.6%) |
| Total | 4,617 (100.0%) | 11,484 (100.0%) |
Health & Disability in Apple Valley
Health Insurance Coverage by Age in Apple Valley
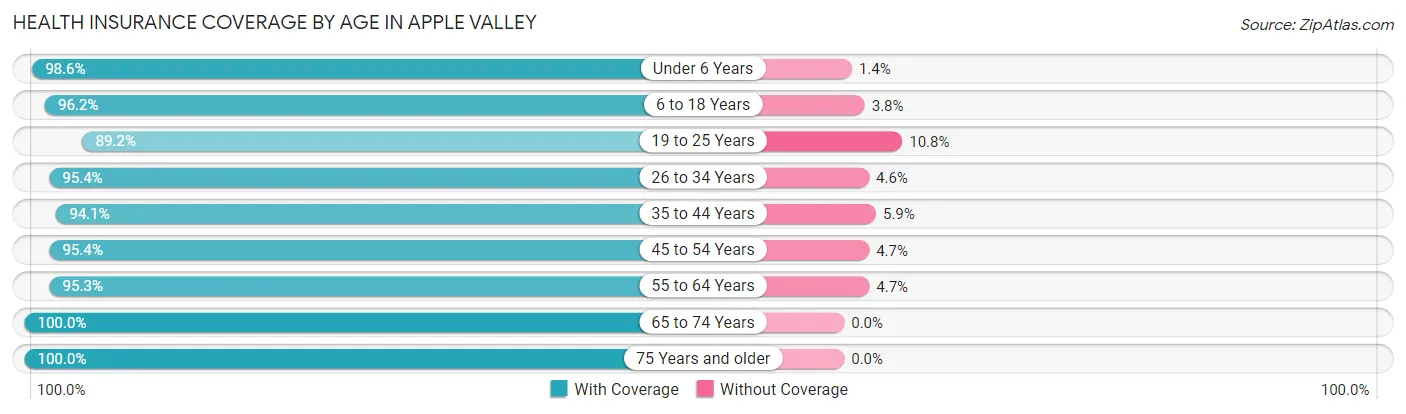
| Age Bracket | With Coverage | Without Coverage |
| Under 6 Years | 4,193 (98.6%) | 61 (1.4%) |
| 6 to 18 Years | 10,274 (96.2%) | 408 (3.8%) |
| 19 to 25 Years | 3,785 (89.2%) | 459 (10.8%) |
| 26 to 34 Years | 6,080 (95.4%) | 295 (4.6%) |
| 35 to 44 Years | 6,942 (94.1%) | 437 (5.9%) |
| 45 to 54 Years | 6,404 (95.4%) | 312 (4.6%) |
| 55 to 64 Years | 6,819 (95.3%) | 334 (4.7%) |
| 65 to 74 Years | 5,418 (100.0%) | 0 (0.0%) |
| 75 Years and older | 3,056 (100.0%) | 0 (0.0%) |
| Total | 52,971 (95.8%) | 2,306 (4.2%) |
Health Insurance Coverage by Citizenship Status in Apple Valley
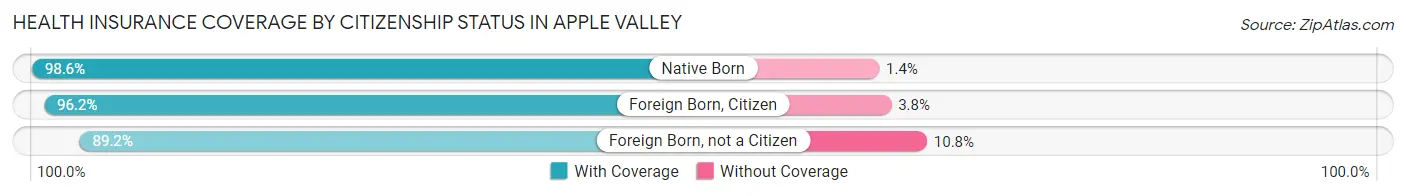
| Citizenship Status | With Coverage | Without Coverage |
| Native Born | 4,193 (98.6%) | 61 (1.4%) |
| Foreign Born, Citizen | 10,274 (96.2%) | 408 (3.8%) |
| Foreign Born, not a Citizen | 3,785 (89.2%) | 459 (10.8%) |
Health Insurance Coverage by Household Income in Apple Valley
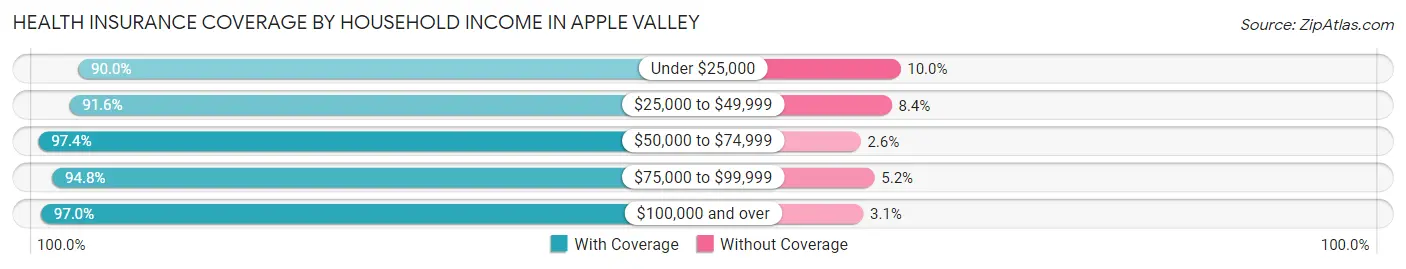
| Household Income | With Coverage | Without Coverage |
| Under $25,000 | 2,225 (90.0%) | 248 (10.0%) |
| $25,000 to $49,999 | 5,828 (91.6%) | 533 (8.4%) |
| $50,000 to $74,999 | 6,916 (97.4%) | 182 (2.6%) |
| $75,000 to $99,999 | 6,639 (94.8%) | 362 (5.2%) |
| $100,000 and over | 31,217 (97.0%) | 981 (3.0%) |
Public vs Private Health Insurance Coverage by Age in Apple Valley
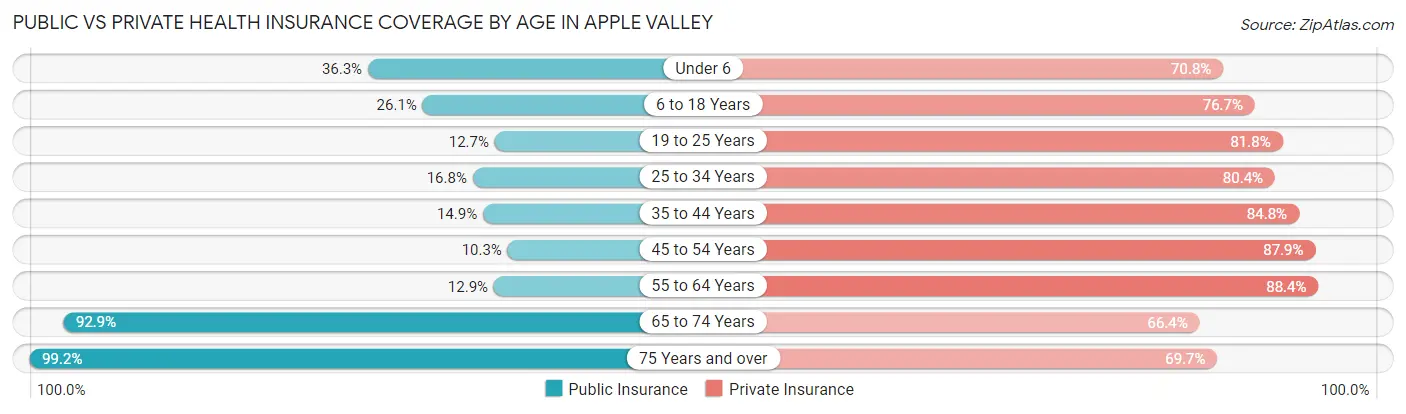
| Age Bracket | Public Insurance | Private Insurance |
| Under 6 | 1,543 (36.3%) | 3,011 (70.8%) |
| 6 to 18 Years | 2,789 (26.1%) | 8,188 (76.6%) |
| 19 to 25 Years | 540 (12.7%) | 3,471 (81.8%) |
| 25 to 34 Years | 1,072 (16.8%) | 5,125 (80.4%) |
| 35 to 44 Years | 1,101 (14.9%) | 6,260 (84.8%) |
| 45 to 54 Years | 694 (10.3%) | 5,903 (87.9%) |
| 55 to 64 Years | 922 (12.9%) | 6,326 (88.4%) |
| 65 to 74 Years | 5,034 (92.9%) | 3,598 (66.4%) |
| 75 Years and over | 3,031 (99.2%) | 2,130 (69.7%) |
| Total | 16,726 (30.3%) | 44,012 (79.6%) |
Disability Status by Sex by Age in Apple Valley
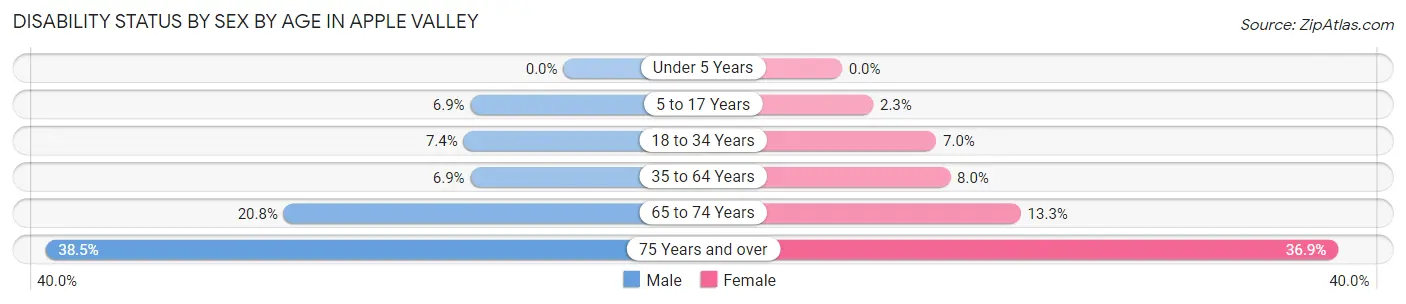
| Age Bracket | Male | Female |
| Under 5 Years | 0 (0.0%) | 0 (0.0%) |
| 5 to 17 Years | 374 (6.9%) | 129 (2.3%) |
| 18 to 34 Years | 432 (7.4%) | 377 (7.0%) |
| 35 to 64 Years | 704 (6.9%) | 888 (8.0%) |
| 65 to 74 Years | 501 (20.8%) | 399 (13.3%) |
| 75 Years and over | 478 (38.5%) | 668 (36.8%) |
Disability Class by Sex by Age in Apple Valley
Disability Class: Hearing Difficulty
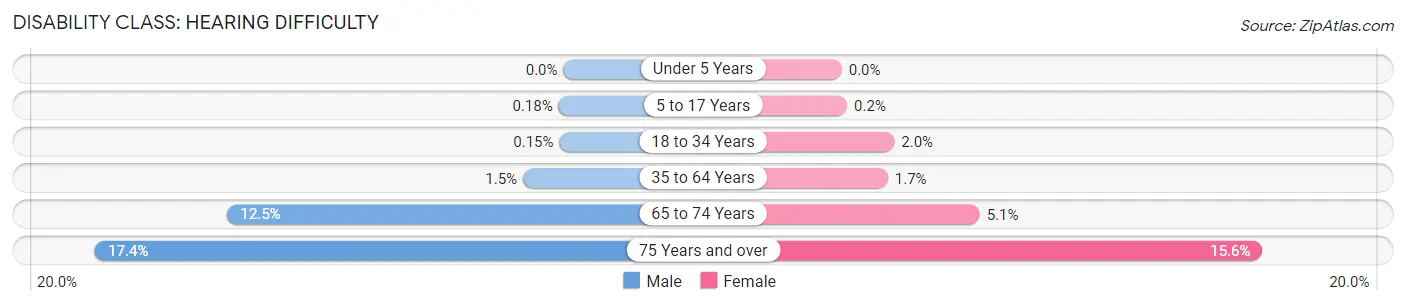
| Age Bracket | Male | Female |
| Under 5 Years | 0 (0.0%) | 0 (0.0%) |
| 5 to 17 Years | 10 (0.2%) | 11 (0.2%) |
| 18 to 34 Years | 9 (0.2%) | 105 (1.9%) |
| 35 to 64 Years | 153 (1.5%) | 189 (1.7%) |
| 65 to 74 Years | 301 (12.5%) | 154 (5.1%) |
| 75 Years and over | 216 (17.4%) | 283 (15.6%) |
Disability Class: Vision Difficulty
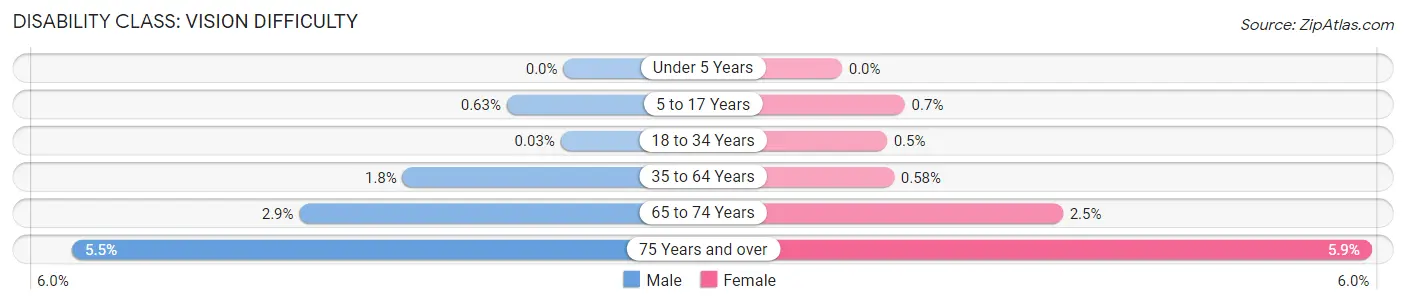
| Age Bracket | Male | Female |
| Under 5 Years | 0 (0.0%) | 0 (0.0%) |
| 5 to 17 Years | 34 (0.6%) | 39 (0.7%) |
| 18 to 34 Years | 2 (0.0%) | 27 (0.5%) |
| 35 to 64 Years | 183 (1.8%) | 64 (0.6%) |
| 65 to 74 Years | 71 (2.9%) | 74 (2.5%) |
| 75 Years and over | 68 (5.5%) | 107 (5.9%) |
Disability Class: Cognitive Difficulty
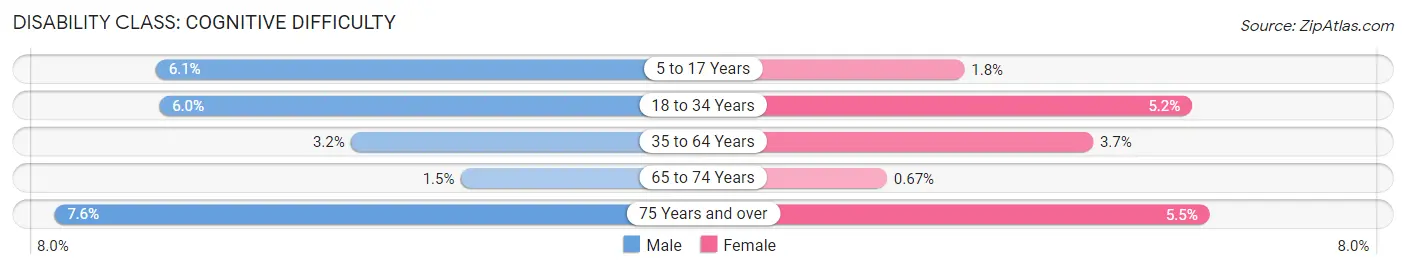
| Age Bracket | Male | Female |
| 5 to 17 Years | 328 (6.0%) | 101 (1.8%) |
| 18 to 34 Years | 350 (6.0%) | 280 (5.2%) |
| 35 to 64 Years | 322 (3.2%) | 412 (3.7%) |
| 65 to 74 Years | 37 (1.5%) | 20 (0.7%) |
| 75 Years and over | 94 (7.6%) | 99 (5.5%) |
Disability Class: Ambulatory Difficulty
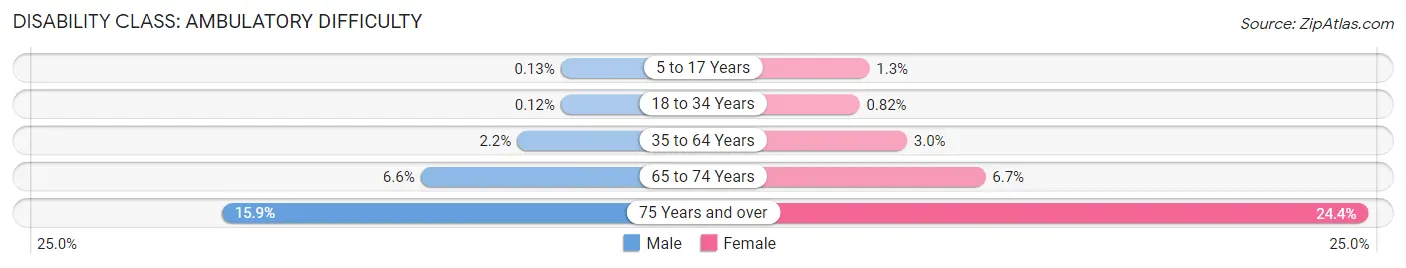
| Age Bracket | Male | Female |
| 5 to 17 Years | 7 (0.1%) | 71 (1.3%) |
| 18 to 34 Years | 7 (0.1%) | 44 (0.8%) |
| 35 to 64 Years | 219 (2.1%) | 333 (3.0%) |
| 65 to 74 Years | 160 (6.6%) | 200 (6.7%) |
| 75 Years and over | 197 (15.9%) | 443 (24.4%) |
Disability Class: Self-Care Difficulty
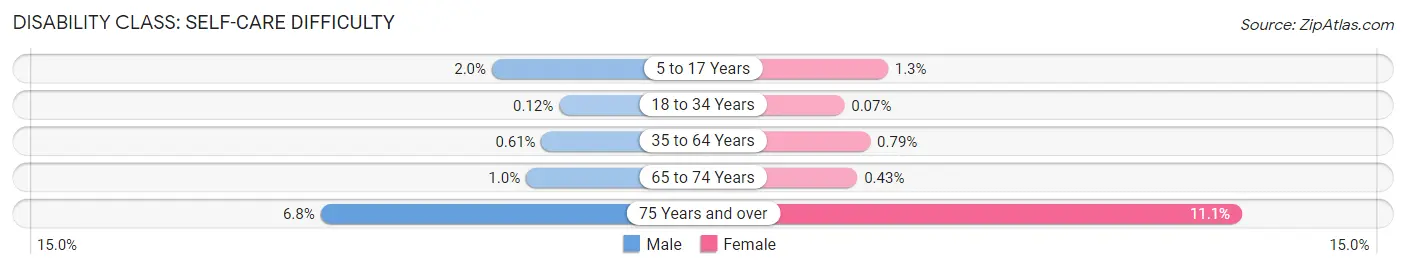
| Age Bracket | Male | Female |
| 5 to 17 Years | 108 (2.0%) | 71 (1.3%) |
| 18 to 34 Years | 7 (0.1%) | 4 (0.1%) |
| 35 to 64 Years | 62 (0.6%) | 87 (0.8%) |
| 65 to 74 Years | 25 (1.0%) | 13 (0.4%) |
| 75 Years and over | 84 (6.8%) | 202 (11.1%) |
Technology Access in Apple Valley
Computing Device Access in Apple Valley
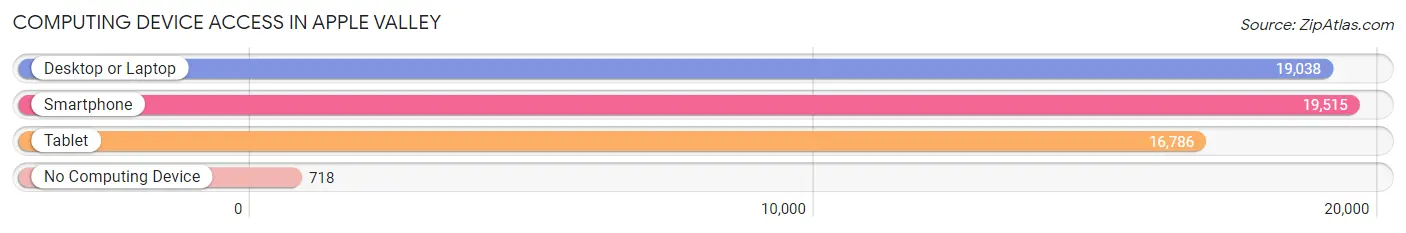
| Device Type | # Households | % Households |
| Desktop or Laptop | 19,038 | 89.3% |
| Smartphone | 19,515 | 91.6% |
| Tablet | 16,786 | 78.8% |
| No Computing Device | 718 | 3.4% |
| Total | 21,311 | 100.0% |
Internet Access in Apple Valley
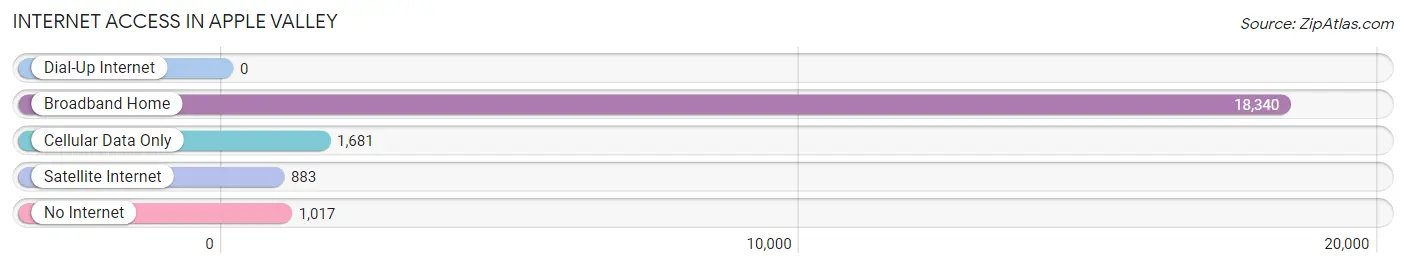
| Internet Type | # Households | % Households |
| Dial-Up Internet | 0 | 0.0% |
| Broadband Home | 18,340 | 86.1% |
| Cellular Data Only | 1,681 | 7.9% |
| Satellite Internet | 883 | 4.1% |
| No Internet | 1,017 | 4.8% |
| Total | 21,311 | 100.0% |
Apple Valley Summary
Apple Valley, Minnesota is a city located in the Twin Cities metropolitan area of Minnesota. It is located in Dakota County and is a suburb of the Twin Cities. The city was incorporated in 1969 and has a population of about 50,000 people.
History
The area that is now Apple Valley was originally inhabited by the Dakota Sioux. The first settlers arrived in the area in the late 1800s and the area was known as Lebanon Township. The area was mostly rural and was used for farming. In the 1950s, the area began to experience rapid growth due to the development of the Twin Cities metropolitan area. The city of Apple Valley was incorporated in 1969 and was named after the apple orchards that were located in the area.
Geography
Apple Valley is located in the southeastern part of Minnesota in Dakota County. It is located about 15 miles south of Minneapolis and St. Paul. The city is situated on the south bank of the Minnesota River and is bordered by the cities of Burnsville, Eagan, and Lakeville. The city covers an area of about 33 square miles and has a population density of about 1,500 people per square mile.
The city has a humid continental climate with hot summers and cold winters. The average temperature in the summer is around 75 degrees Fahrenheit and the average temperature in the winter is around 20 degrees Fahrenheit. The city receives an average of about 30 inches of precipitation per year.
Economy
Apple Valley has a strong and diverse economy. The city is home to several large employers, including the Minnesota Zoo, the Minnesota Department of Transportation, and the Minnesota Valley Transit Authority. The city also has a large retail sector, with several large shopping centers and malls. The city is also home to several manufacturing companies, including 3M, Medtronic, and Andersen Windows.
The city has a median household income of about $70,000 and the unemployment rate is about 3.5%. The city has a strong housing market, with the median home value being about $250,000.
Demographics
Apple Valley has a population of about 50,000 people. The city is predominantly white, with about 75% of the population being white. The city also has a large Hispanic population, with about 15% of the population being Hispanic. The city also has a large Asian population, with about 5% of the population being Asian. The city also has a small African American population, with about 2% of the population being African American. The city also has a small Native American population, with about 1% of the population being Native American. The city also has a small Pacific Islander population, with about 0.5% of the population being Pacific Islander.
Common Questions
What is Per Capita Income in Apple Valley?
Per Capita income in Apple Valley is $47,738.
What is the Median Family Income in Apple Valley?
Median Family Income in Apple Valley is $122,078.
What is the Median Household income in Apple Valley?
Median Household Income in Apple Valley is $97,588.
What is Income or Wage Gap in Apple Valley?
Income or Wage Gap in Apple Valley is 28.8%.
Women in Apple Valley earn 71.2 cents for every dollar earned by a man.
What is Inequality or Gini Index in Apple Valley?
Inequality or Gini Index in Apple Valley is 0.41.
What is the Total Population of Apple Valley?
Total Population of Apple Valley is 55,594.
What is the Total Male Population of Apple Valley?
Total Male Population of Apple Valley is 26,854.
What is the Total Female Population of Apple Valley?
Total Female Population of Apple Valley is 28,740.
What is the Ratio of Males per 100 Females in Apple Valley?
There are 93.44 Males per 100 Females in Apple Valley.
What is the Ratio of Females per 100 Males in Apple Valley?
There are 107.02 Females per 100 Males in Apple Valley.
What is the Median Population Age in Apple Valley?
Median Population Age in Apple Valley is 37.6 Years.
What is the Average Family Size in Apple Valley
Average Family Size in Apple Valley is 3.1 People.
What is the Average Household Size in Apple Valley
Average Household Size in Apple Valley is 2.6 People.
How Large is the Labor Force in Apple Valley?
There are 30,311 People in the Labor Forcein in Apple Valley.
What is the Percentage of People in the Labor Force in Apple Valley?
71.0% of People are in the Labor Force in Apple Valley.
What is the Unemployment Rate in Apple Valley?
Unemployment Rate in Apple Valley is 4.2%.