Roseville, MN Map & Demographics
Roseville Map
Roseville Overview
$52,629
PER CAPITA INCOME
$121,667
AVG FAMILY INCOME
$87,702
AVG HOUSEHOLD INCOME
29.7%
WAGE / INCOME GAP [ % ]
70.3¢/ $1
WAGE / INCOME GAP [ $ ]
0.46
INEQUALITY / GINI INDEX
36,066
TOTAL POPULATION
17,412
MALE POPULATION
18,654
FEMALE POPULATION
93.34
MALES / 100 FEMALES
107.13
FEMALES / 100 MALES
41.2
MEDIAN AGE
3.0
AVG FAMILY SIZE
2.2
AVG HOUSEHOLD SIZE
19,090
LABOR FORCE [ PEOPLE ]
63.4%
PERCENT IN LABOR FORCE
5.3%
UNEMPLOYMENT RATE
Income in Roseville
Income Overview in Roseville
Per Capita Income in Roseville is $52,629, while median incomes of families and households are $121,667 and $87,702 respectively.
| Characteristic | Number | Measure |
| Per Capita Income | 36,066 | $52,629 |
| Median Family Income | 8,876 | $121,667 |
| Mean Family Income | 8,876 | $151,986 |
| Median Household Income | 15,528 | $87,702 |
| Mean Household Income | 15,528 | $120,953 |
| Income Deficit | 8,876 | $0 |
| Wage / Income Gap (%) | 36,066 | 29.71% |
| Wage / Income Gap ($) | 36,066 | 70.29¢ per $1 |
| Gini / Inequality Index | 36,066 | 0.46 |
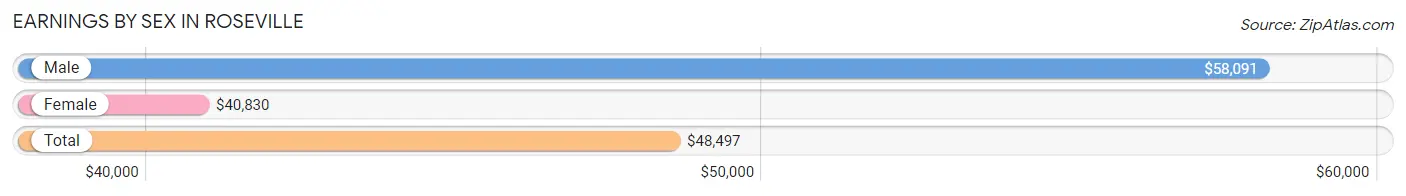
Earnings by Sex in Roseville
Average Earnings in Roseville are $48,497, $58,091 for men and $40,830 for women, a difference of 29.7%.
| Sex | Number | Average Earnings |
| Male | 10,176 (49.8%) | $58,091 |
| Female | 10,248 (50.2%) | $40,830 |
| Total | 20,424 (100.0%) | $48,497 |
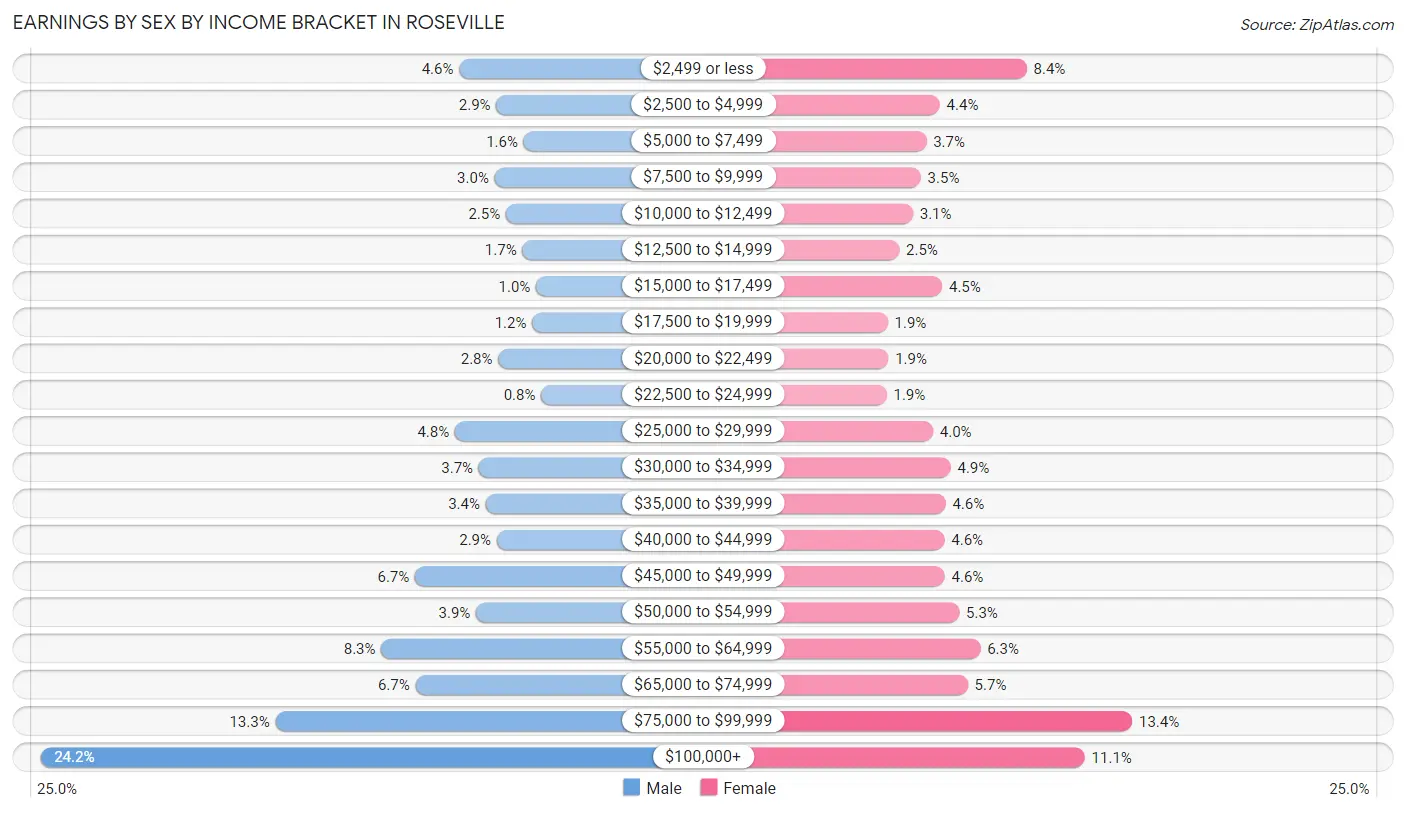
Earnings by Sex by Income Bracket in Roseville
The most common earnings brackets in Roseville are $100,000+ for men (2,465 | 24.2%) and $75,000 to $99,999 for women (1,369 | 13.4%).
| Income | Male | Female |
| $2,499 or less | 472 (4.6%) | 863 (8.4%) |
| $2,500 to $4,999 | 295 (2.9%) | 446 (4.3%) |
| $5,000 to $7,499 | 165 (1.6%) | 381 (3.7%) |
| $7,500 to $9,999 | 303 (3.0%) | 355 (3.5%) |
| $10,000 to $12,499 | 249 (2.5%) | 317 (3.1%) |
| $12,500 to $14,999 | 171 (1.7%) | 251 (2.5%) |
| $15,000 to $17,499 | 106 (1.0%) | 457 (4.5%) |
| $17,500 to $19,999 | 124 (1.2%) | 196 (1.9%) |
| $20,000 to $22,499 | 286 (2.8%) | 199 (1.9%) |
| $22,500 to $24,999 | 81 (0.8%) | 191 (1.9%) |
| $25,000 to $29,999 | 493 (4.8%) | 413 (4.0%) |
| $30,000 to $34,999 | 379 (3.7%) | 498 (4.9%) |
| $35,000 to $39,999 | 346 (3.4%) | 473 (4.6%) |
| $40,000 to $44,999 | 293 (2.9%) | 468 (4.6%) |
| $45,000 to $49,999 | 683 (6.7%) | 469 (4.6%) |
| $50,000 to $54,999 | 392 (3.8%) | 539 (5.3%) |
| $55,000 to $64,999 | 844 (8.3%) | 641 (6.2%) |
| $65,000 to $74,999 | 681 (6.7%) | 580 (5.7%) |
| $75,000 to $99,999 | 1,348 (13.3%) | 1,369 (13.4%) |
| $100,000+ | 2,465 (24.2%) | 1,142 (11.1%) |
| Total | 10,176 (100.0%) | 10,248 (100.0%) |
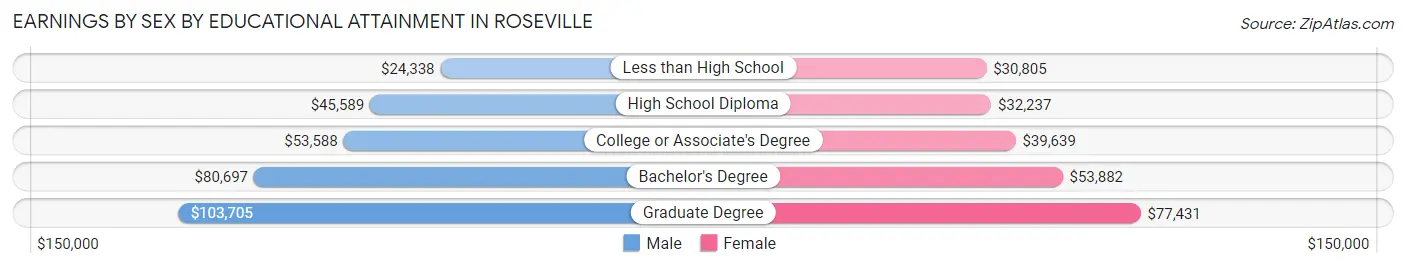
Earnings by Sex by Educational Attainment in Roseville
Average earnings in Roseville are $67,530 for men and $50,673 for women, a difference of 25.0%. Men with an educational attainment of graduate degree enjoy the highest average annual earnings of $103,705, while those with less than high school education earn the least with $24,338. Women with an educational attainment of graduate degree earn the most with the average annual earnings of $77,431, while those with less than high school education have the smallest earnings of $30,805.
| Educational Attainment | Male Income | Female Income |
| Less than High School | $24,338 | $30,805 |
| High School Diploma | $45,589 | $32,237 |
| College or Associate's Degree | $53,588 | $39,639 |
| Bachelor's Degree | $80,697 | $53,882 |
| Graduate Degree | $103,705 | $77,431 |
| Total | $67,530 | $50,673 |
Family Income in Roseville
Family Income Brackets in Roseville
According to the Roseville family income data, there are 2,281 families falling into the $100,000 to $149,999 income range, which is the most common income bracket and makes up 25.7% of all families. Conversely, the $10,000 to $14,999 income bracket is the least frequent group with only 27 families (0.3%) belonging to this category.
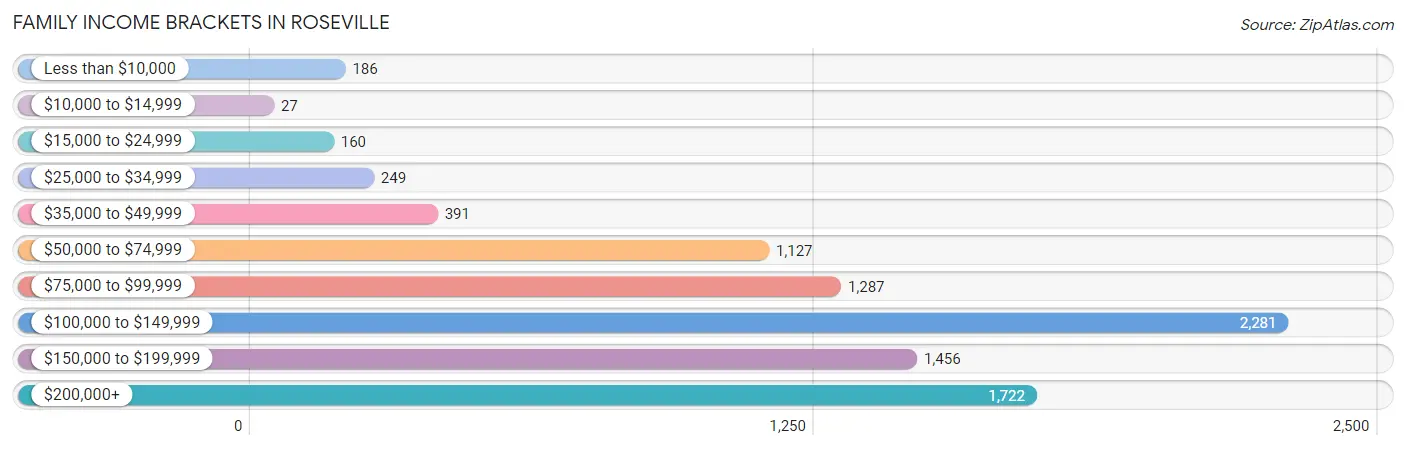
| Income Bracket | # Families | % Families |
| Less than $10,000 | 186 | 2.1% |
| $10,000 to $14,999 | 27 | 0.3% |
| $15,000 to $24,999 | 160 | 1.8% |
| $25,000 to $34,999 | 249 | 2.8% |
| $35,000 to $49,999 | 391 | 4.4% |
| $50,000 to $74,999 | 1,127 | 12.7% |
| $75,000 to $99,999 | 1,287 | 14.5% |
| $100,000 to $149,999 | 2,281 | 25.7% |
| $150,000 to $199,999 | 1,456 | 16.4% |
| $200,000+ | 1,722 | 19.4% |
Family Income by Famaliy Size in Roseville
6-person families (109 | 1.2%) account for the highest median family income in Roseville with $186,033 per family, while 2-person families (4,599 | 51.8%) have the highest median income of $51,118 per family member.
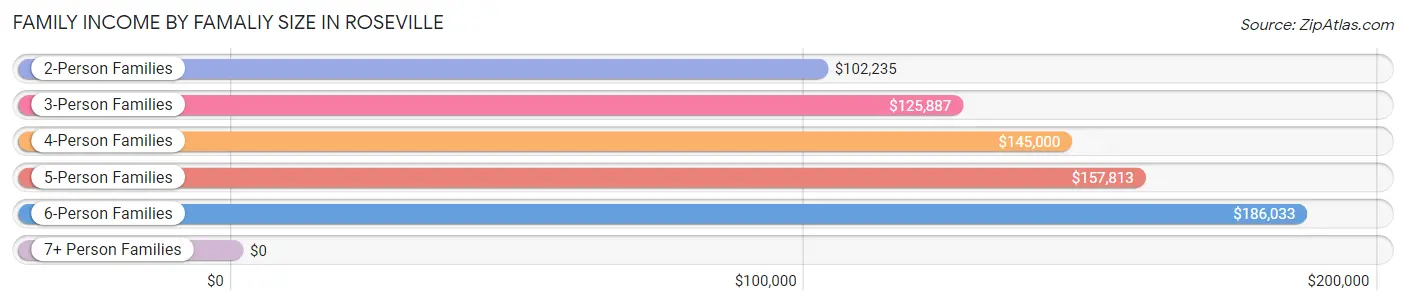
| Income Bracket | # Families | Median Income |
| 2-Person Families | 4,599 (51.8%) | $102,235 |
| 3-Person Families | 1,724 (19.4%) | $125,887 |
| 4-Person Families | 1,754 (19.8%) | $145,000 |
| 5-Person Families | 570 (6.4%) | $157,813 |
| 6-Person Families | 109 (1.2%) | $186,033 |
| 7+ Person Families | 120 (1.3%) | $0 |
| Total | 8,876 (100.0%) | $121,667 |
Family Income by Number of Earners in Roseville
The median family income in Roseville is $121,667, with families comprising 3+ earners (1,208) having the highest median family income of $146,429, while families with no earners (1,460) have the lowest median family income of $72,273, accounting for 13.6% and 16.5% of families, respectively.
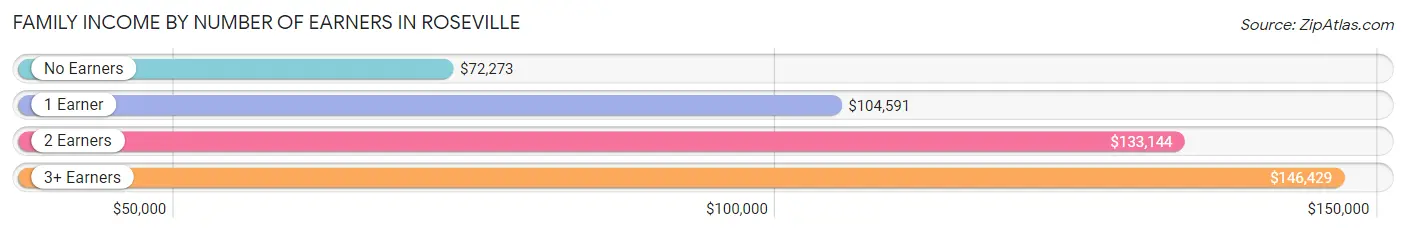
| Number of Earners | # Families | Median Income |
| No Earners | 1,460 (16.5%) | $72,273 |
| 1 Earner | 1,992 (22.4%) | $104,591 |
| 2 Earners | 4,216 (47.5%) | $133,144 |
| 3+ Earners | 1,208 (13.6%) | $146,429 |
| Total | 8,876 (100.0%) | $121,667 |
Household Income in Roseville
Household Income Brackets in Roseville
With 3,090 households falling in the category, the $100,000 to $149,999 income range is the most frequent in Roseville, accounting for 19.9% of all households. In contrast, only 435 households (2.8%) fall into the $10,000 to $14,999 income bracket, making it the least populous group.
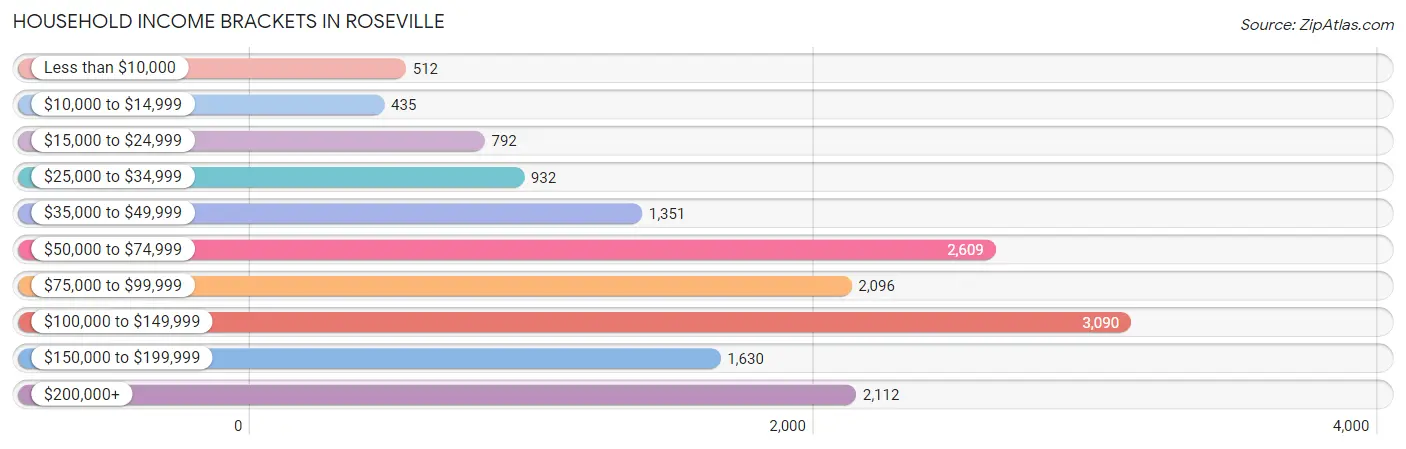
| Income Bracket | # Households | % Households |
| Less than $10,000 | 512 | 3.3% |
| $10,000 to $14,999 | 435 | 2.8% |
| $15,000 to $24,999 | 792 | 5.1% |
| $25,000 to $34,999 | 932 | 6.0% |
| $35,000 to $49,999 | 1,351 | 8.7% |
| $50,000 to $74,999 | 2,609 | 16.8% |
| $75,000 to $99,999 | 2,096 | 13.5% |
| $100,000 to $149,999 | 3,090 | 19.9% |
| $150,000 to $199,999 | 1,630 | 10.5% |
| $200,000+ | 2,112 | 13.6% |
Household Income by Householder Age in Roseville
The median household income in Roseville is $87,702, with the highest median household income of $111,300 found in the 45 to 64 years age bracket for the primary householder. A total of 4,742 households (30.5%) fall into this category. Meanwhile, the 15 to 24 years age bracket for the primary householder has the lowest median household income of $60,461, with 535 households (3.5%) in this group.
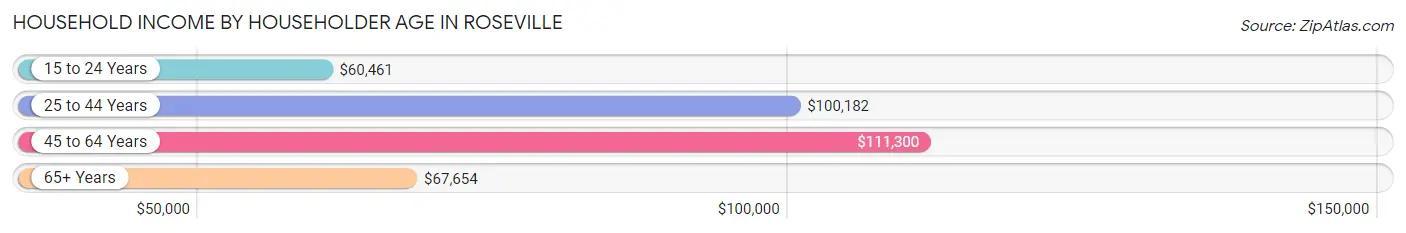
| Income Bracket | # Households | Median Income |
| 15 to 24 Years | 535 (3.5%) | $60,461 |
| 25 to 44 Years | 4,890 (31.5%) | $100,182 |
| 45 to 64 Years | 4,742 (30.5%) | $111,300 |
| 65+ Years | 5,361 (34.5%) | $67,654 |
| Total | 15,528 (100.0%) | $87,702 |
Poverty in Roseville
Income Below Poverty by Sex and Age in Roseville
With 6.6% poverty level for males and 7.7% for females among the residents of Roseville, 6 to 11 year old males and 18 to 24 year old females are the most vulnerable to poverty, with 212 males (17.7%) and 163 females (10.9%) in their respective age groups living below the poverty level.
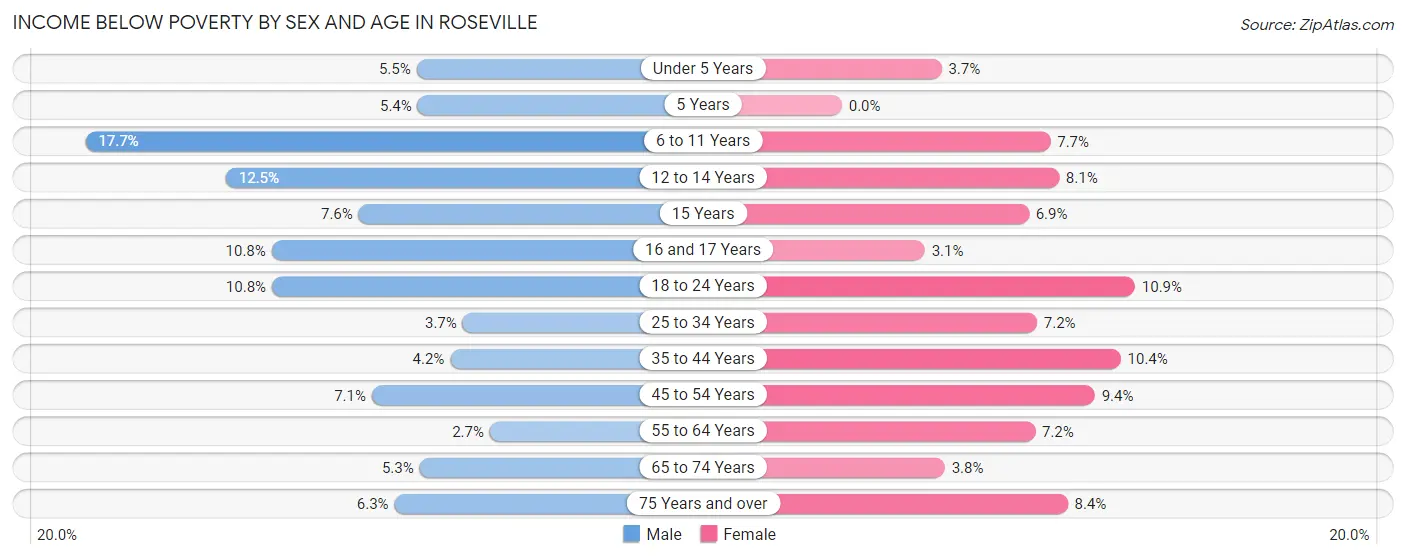
| Age Bracket | Male | Female |
| Under 5 Years | 58 (5.4%) | 34 (3.7%) |
| 5 Years | 6 (5.4%) | 0 (0.0%) |
| 6 to 11 Years | 212 (17.7%) | 85 (7.7%) |
| 12 to 14 Years | 59 (12.5%) | 37 (8.1%) |
| 15 Years | 19 (7.6%) | 12 (6.9%) |
| 16 and 17 Years | 30 (10.8%) | 9 (3.1%) |
| 18 to 24 Years | 151 (10.8%) | 163 (10.9%) |
| 25 to 34 Years | 95 (3.7%) | 174 (7.2%) |
| 35 to 44 Years | 94 (4.2%) | 223 (10.3%) |
| 45 to 54 Years | 127 (7.1%) | 175 (9.4%) |
| 55 to 64 Years | 58 (2.7%) | 178 (7.2%) |
| 65 to 74 Years | 94 (5.3%) | 72 (3.8%) |
| 75 Years and over | 102 (6.3%) | 208 (8.4%) |
| Total | 1,105 (6.6%) | 1,370 (7.7%) |
Income Above Poverty by Sex and Age in Roseville
According to the poverty statistics in Roseville, males aged 55 to 64 years and females aged 5 years are the age groups that are most secure financially, with 97.3% of males and 100.0% of females in these age groups living above the poverty line.
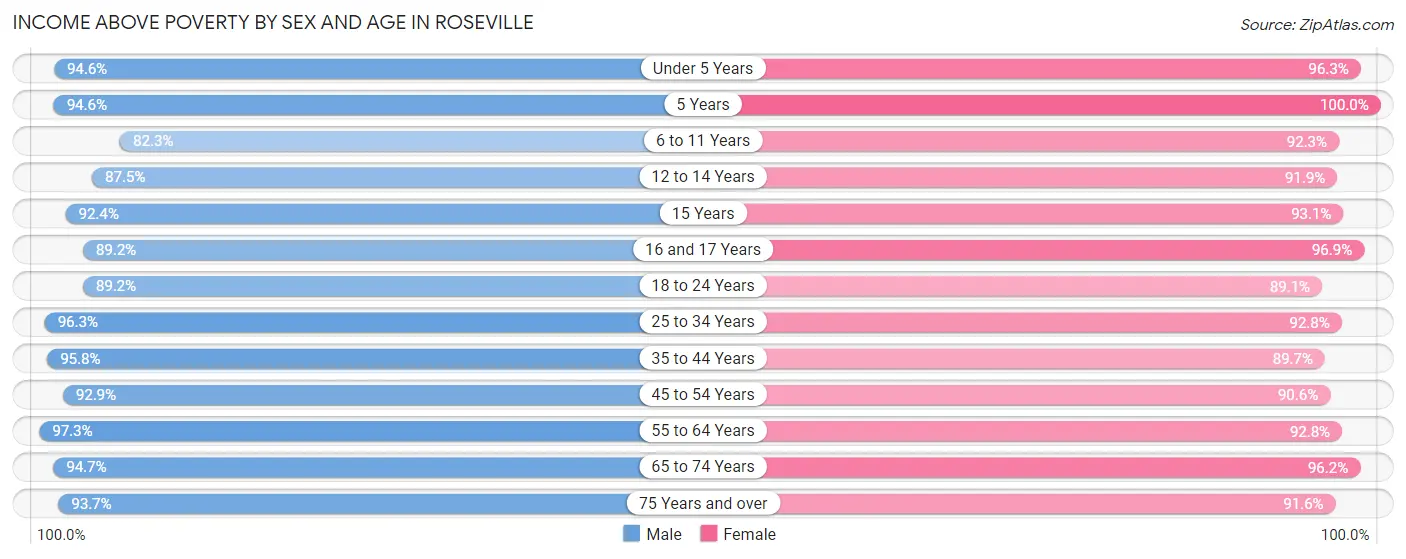
| Age Bracket | Male | Female |
| Under 5 Years | 1,007 (94.6%) | 886 (96.3%) |
| 5 Years | 105 (94.6%) | 122 (100.0%) |
| 6 to 11 Years | 983 (82.3%) | 1,013 (92.3%) |
| 12 to 14 Years | 412 (87.5%) | 422 (91.9%) |
| 15 Years | 231 (92.4%) | 161 (93.1%) |
| 16 and 17 Years | 247 (89.2%) | 283 (96.9%) |
| 18 to 24 Years | 1,245 (89.2%) | 1,335 (89.1%) |
| 25 to 34 Years | 2,447 (96.3%) | 2,228 (92.8%) |
| 35 to 44 Years | 2,144 (95.8%) | 1,932 (89.6%) |
| 45 to 54 Years | 1,658 (92.9%) | 1,688 (90.6%) |
| 55 to 64 Years | 2,069 (97.3%) | 2,303 (92.8%) |
| 65 to 74 Years | 1,667 (94.7%) | 1,815 (96.2%) |
| 75 Years and over | 1,524 (93.7%) | 2,275 (91.6%) |
| Total | 15,739 (93.4%) | 16,463 (92.3%) |
Income Below Poverty Among Married-Couple Families in Roseville
The poverty statistics for married-couple families in Roseville show that 1.5% or 113 of the total 7,518 families live below the poverty line. Families with 1 or 2 children have the highest poverty rate of 2.2%, comprising of 48 families. On the other hand, families with 5 or more children have the lowest poverty rate of 0.0%, which includes 0 families.
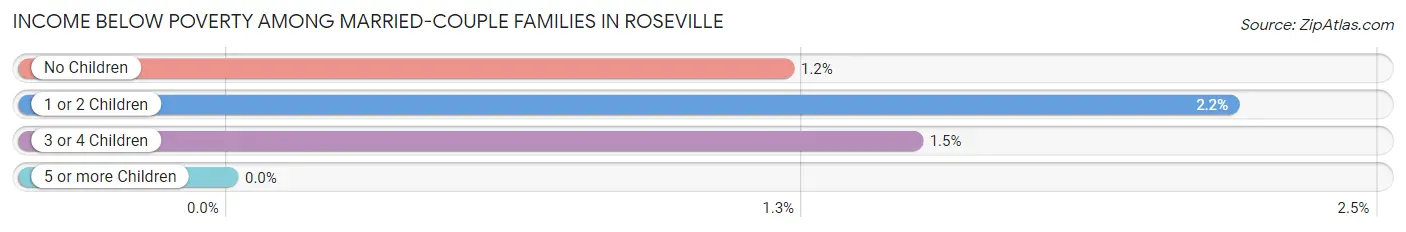
| Children | Above Poverty | Below Poverty |
| No Children | 4,827 (98.8%) | 59 (1.2%) |
| 1 or 2 Children | 2,149 (97.8%) | 48 (2.2%) |
| 3 or 4 Children | 396 (98.5%) | 6 (1.5%) |
| 5 or more Children | 33 (100.0%) | 0 (0.0%) |
| Total | 7,405 (98.5%) | 113 (1.5%) |
Income Below Poverty Among Single-Parent Households in Roseville
According to the poverty data in Roseville, 3.8% or 15 single-father households and 19.6% or 188 single-mother households are living below the poverty line. Among single-father households, those with no children have the highest poverty rate, with 15 households (8.2%) experiencing poverty. Likewise, among single-mother households, those with 5 or more children have the highest poverty rate, with 8 households (100.0%) falling below the poverty line.
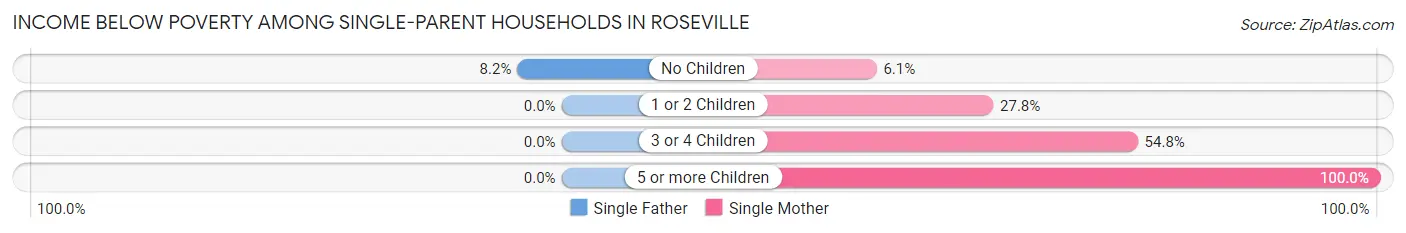
| Children | Single Father | Single Mother |
| No Children | 15 (8.2%) | 27 (6.1%) |
| 1 or 2 Children | 0 (0.0%) | 130 (27.8%) |
| 3 or 4 Children | 0 (0.0%) | 23 (54.8%) |
| 5 or more Children | 0 (0.0%) | 8 (100.0%) |
| Total | 15 (3.8%) | 188 (19.6%) |
Income Below Poverty Among Married-Couple vs Single-Parent Households in Roseville
The poverty data for Roseville shows that 113 of the married-couple family households (1.5%) and 203 of the single-parent households (14.9%) are living below the poverty level. Within the married-couple family households, those with 1 or 2 children have the highest poverty rate, with 48 households (2.2%) falling below the poverty line. Among the single-parent households, those with 5 or more children have the highest poverty rate, with 8 household (100.0%) living below poverty.
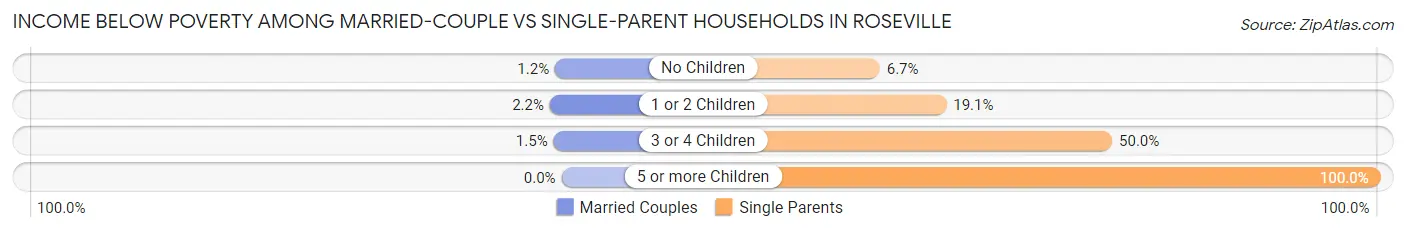
| Children | Married-Couple Families | Single-Parent Households |
| No Children | 59 (1.2%) | 42 (6.7%) |
| 1 or 2 Children | 48 (2.2%) | 130 (19.1%) |
| 3 or 4 Children | 6 (1.5%) | 23 (50.0%) |
| 5 or more Children | 0 (0.0%) | 8 (100.0%) |
| Total | 113 (1.5%) | 203 (14.9%) |
Race in Roseville
The most populous races in Roseville are White / Caucasian (26,574 | 73.7%), Black / African American (2,955 | 8.2%), and Asian (2,942 | 8.2%).
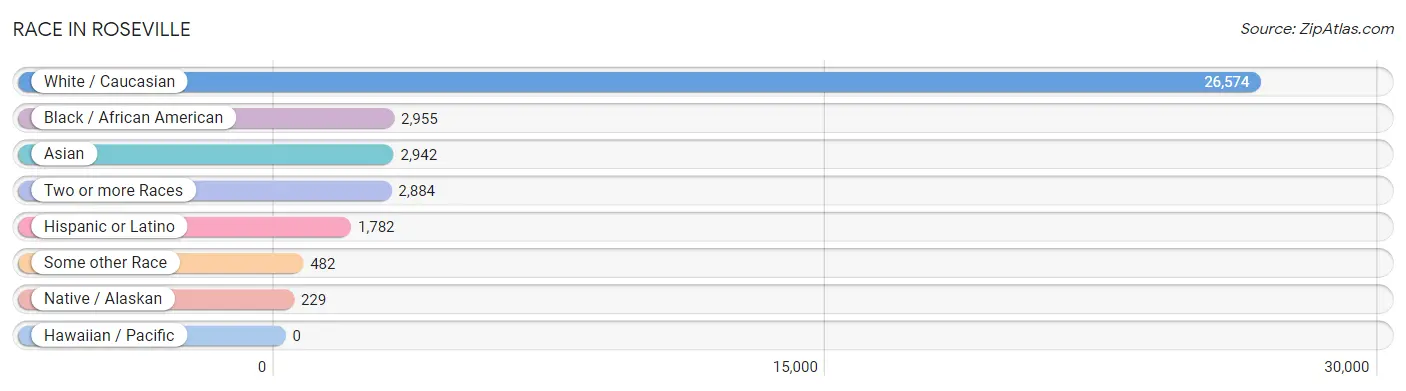
| Race | # Population | % Population |
| Asian | 2,942 | 8.2% |
| Black / African American | 2,955 | 8.2% |
| Hawaiian / Pacific | 0 | 0.0% |
| Hispanic or Latino | 1,782 | 4.9% |
| Native / Alaskan | 229 | 0.6% |
| White / Caucasian | 26,574 | 73.7% |
| Two or more Races | 2,884 | 8.0% |
| Some other Race | 482 | 1.3% |
| Total | 36,066 | 100.0% |
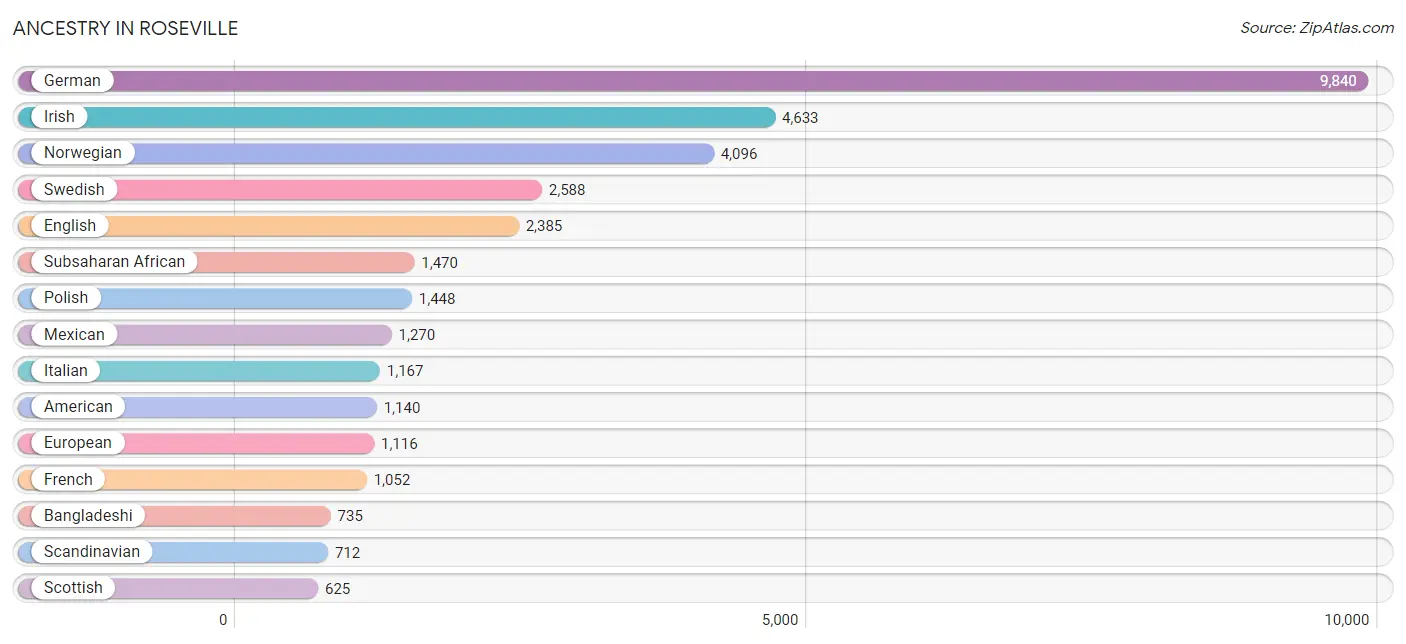
Ancestry in Roseville
The most populous ancestries reported in Roseville are German (9,840 | 27.3%), Irish (4,633 | 12.9%), Norwegian (4,096 | 11.4%), Swedish (2,588 | 7.2%), and English (2,385 | 6.6%), together accounting for 65.3% of all Roseville residents.
| Ancestry | # Population | % Population |
| African | 257 | 0.7% |
| American | 1,140 | 3.2% |
| Arab | 105 | 0.3% |
| Austrian | 237 | 0.7% |
| Bangladeshi | 735 | 2.0% |
| Belgian | 49 | 0.1% |
| Bhutanese | 251 | 0.7% |
| Brazilian | 56 | 0.2% |
| British | 326 | 0.9% |
| Burmese | 181 | 0.5% |
| Cambodian | 37 | 0.1% |
| Canadian | 7 | 0.0% |
| Central American | 101 | 0.3% |
| Central American Indian | 5 | 0.0% |
| Cherokee | 33 | 0.1% |
| Chippewa | 129 | 0.4% |
| Colombian | 18 | 0.1% |
| Costa Rican | 5 | 0.0% |
| Croatian | 78 | 0.2% |
| Cuban | 14 | 0.0% |
| Czech | 449 | 1.2% |
| Czechoslovakian | 74 | 0.2% |
| Danish | 475 | 1.3% |
| Dutch | 512 | 1.4% |
| Eastern European | 87 | 0.2% |
| Ecuadorian | 56 | 0.2% |
| English | 2,385 | 6.6% |
| Ethiopian | 521 | 1.4% |
| European | 1,116 | 3.1% |
| Filipino | 21 | 0.1% |
| Finnish | 436 | 1.2% |
| French | 1,052 | 2.9% |
| French American Indian | 17 | 0.1% |
| French Canadian | 326 | 0.9% |
| German | 9,840 | 27.3% |
| Ghanaian | 46 | 0.1% |
| Greek | 73 | 0.2% |
| Guatemalan | 68 | 0.2% |
| Honduran | 5 | 0.0% |
| Hungarian | 205 | 0.6% |
| Indian (Asian) | 559 | 1.5% |
| Indonesian | 351 | 1.0% |
| Iranian | 98 | 0.3% |
| Iraqi | 9 | 0.0% |
| Irish | 4,633 | 12.9% |
| Israeli | 7 | 0.0% |
| Italian | 1,167 | 3.2% |
| Jamaican | 11 | 0.0% |
| Japanese | 38 | 0.1% |
| Kenyan | 152 | 0.4% |
| Korean | 54 | 0.2% |
| Lebanese | 55 | 0.2% |
| Lithuanian | 13 | 0.0% |
| Luxembourger | 46 | 0.1% |
| Maltese | 62 | 0.2% |
| Mexican | 1,270 | 3.5% |
| Mexican American Indian | 171 | 0.5% |
| Mongolian | 49 | 0.1% |
| Native Hawaiian | 15 | 0.0% |
| Navajo | 34 | 0.1% |
| Nigerian | 40 | 0.1% |
| Northern European | 125 | 0.4% |
| Norwegian | 4,096 | 11.4% |
| Pakistani | 3 | 0.0% |
| Palestinian | 27 | 0.1% |
| Pennsylvania German | 10 | 0.0% |
| Peruvian | 95 | 0.3% |
| Polish | 1,448 | 4.0% |
| Portuguese | 52 | 0.1% |
| Puerto Rican | 72 | 0.2% |
| Romanian | 86 | 0.2% |
| Russian | 85 | 0.2% |
| Salvadoran | 4 | 0.0% |
| Scandinavian | 712 | 2.0% |
| Scotch-Irish | 177 | 0.5% |
| Scottish | 625 | 1.7% |
| Serbian | 60 | 0.2% |
| Sioux | 58 | 0.2% |
| Slavic | 28 | 0.1% |
| Slovak | 99 | 0.3% |
| Slovene | 62 | 0.2% |
| Somali | 478 | 1.3% |
| South American | 242 | 0.7% |
| Spaniard | 24 | 0.1% |
| Spanish | 18 | 0.1% |
| Sri Lankan | 590 | 1.6% |
| Subsaharan African | 1,470 | 4.1% |
| Swedish | 2,588 | 7.2% |
| Swiss | 174 | 0.5% |
| Thai | 475 | 1.3% |
| Turkish | 45 | 0.1% |
| Ugandan | 34 | 0.1% |
| Ukrainian | 71 | 0.2% |
| Venezuelan | 45 | 0.1% |
| Welsh | 217 | 0.6% |
| Yugoslavian | 9 | 0.0% | View All 96 Rows |
Immigrants in Roseville
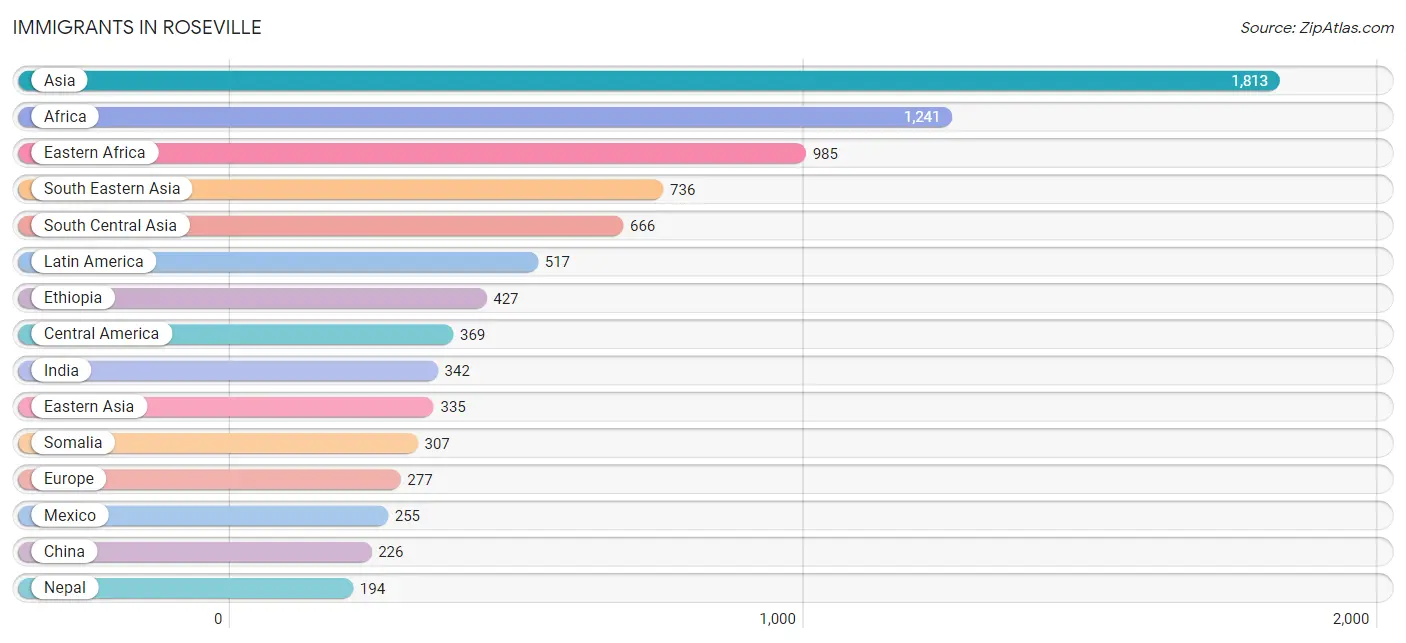
The most numerous immigrant groups reported in Roseville came from Asia (1,813 | 5.0%), Africa (1,241 | 3.4%), Eastern Africa (985 | 2.7%), South Eastern Asia (736 | 2.0%), and South Central Asia (666 | 1.8%), together accounting for 15.1% of all Roseville residents.
| Immigration Origin | # Population | % Population |
| Africa | 1,241 | 3.4% |
| Asia | 1,813 | 5.0% |
| Australia | 11 | 0.0% |
| Brazil | 43 | 0.1% |
| Cambodia | 12 | 0.0% |
| Canada | 50 | 0.1% |
| Caribbean | 19 | 0.1% |
| Central America | 369 | 1.0% |
| China | 226 | 0.6% |
| Colombia | 8 | 0.0% |
| Cuba | 8 | 0.0% |
| Eastern Africa | 985 | 2.7% |
| Eastern Asia | 335 | 0.9% |
| Eastern Europe | 88 | 0.2% |
| Ecuador | 38 | 0.1% |
| El Salvador | 6 | 0.0% |
| England | 10 | 0.0% |
| Eritrea | 29 | 0.1% |
| Ethiopia | 427 | 1.2% |
| Europe | 277 | 0.8% |
| France | 23 | 0.1% |
| Germany | 66 | 0.2% |
| Ghana | 113 | 0.3% |
| Guatemala | 63 | 0.2% |
| Hong Kong | 32 | 0.1% |
| India | 342 | 0.9% |
| Indonesia | 8 | 0.0% |
| Iran | 74 | 0.2% |
| Iraq | 9 | 0.0% |
| Ireland | 42 | 0.1% |
| Israel | 33 | 0.1% |
| Jamaica | 11 | 0.0% |
| Japan | 47 | 0.1% |
| Kenya | 149 | 0.4% |
| Korea | 62 | 0.2% |
| Laos | 91 | 0.3% |
| Latin America | 517 | 1.4% |
| Lithuania | 8 | 0.0% |
| Malaysia | 34 | 0.1% |
| Mexico | 255 | 0.7% |
| Middle Africa | 64 | 0.2% |
| Nepal | 194 | 0.5% |
| Nicaragua | 8 | 0.0% |
| Nigeria | 61 | 0.2% |
| Northern Europe | 100 | 0.3% |
| Oceania | 11 | 0.0% |
| Panama | 18 | 0.1% |
| Peru | 12 | 0.0% |
| Philippines | 24 | 0.1% |
| Romania | 23 | 0.1% |
| Russia | 48 | 0.1% |
| Serbia | 9 | 0.0% |
| Somalia | 307 | 0.9% |
| South America | 129 | 0.4% |
| South Central Asia | 666 | 1.8% |
| South Eastern Asia | 736 | 2.0% |
| Sri Lanka | 27 | 0.1% |
| Sweden | 48 | 0.1% |
| Taiwan | 83 | 0.2% |
| Thailand | 194 | 0.5% |
| Turkey | 34 | 0.1% |
| Uganda | 34 | 0.1% |
| Vietnam | 145 | 0.4% |
| Western Africa | 174 | 0.5% |
| Western Asia | 76 | 0.2% |
| Western Europe | 89 | 0.3% |
| Zaire | 64 | 0.2% | View All 67 Rows |
Sex and Age in Roseville
Sex and Age in Roseville
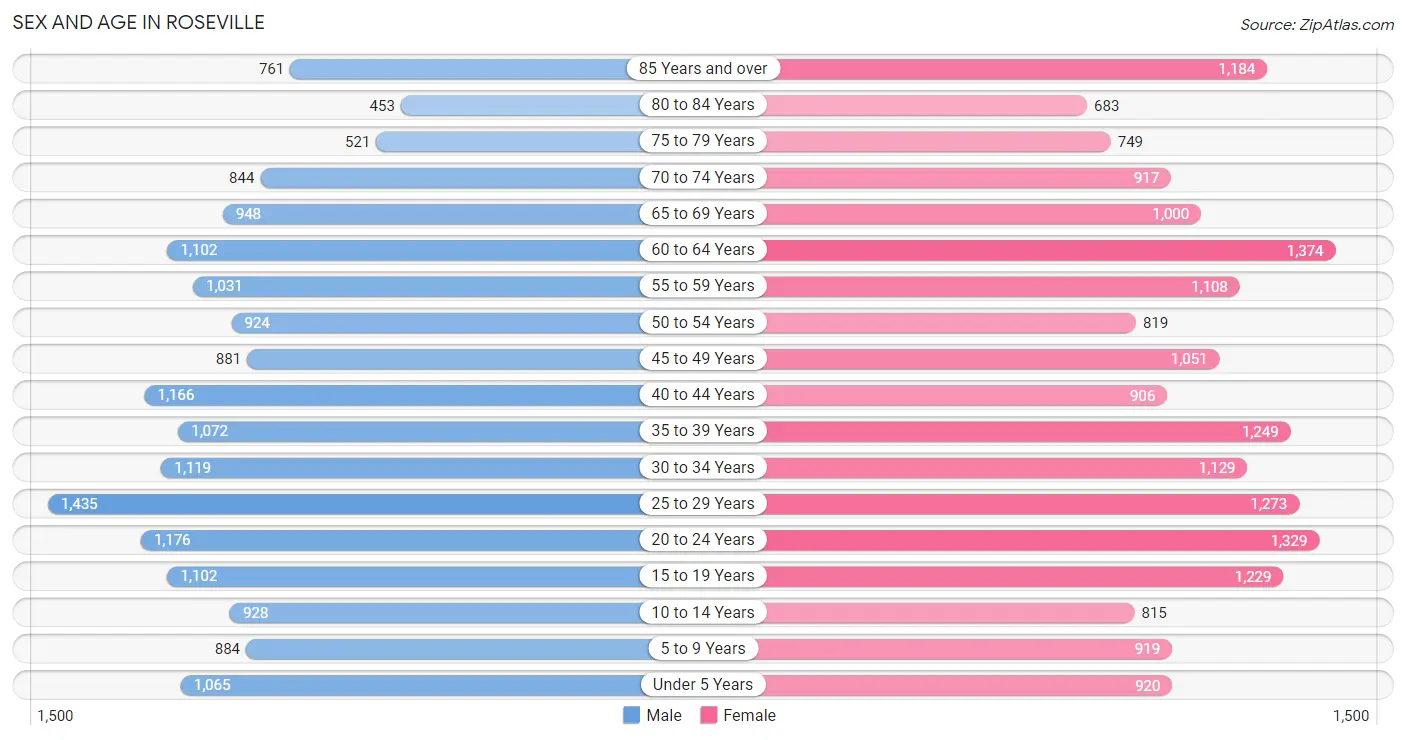
The most populous age groups in Roseville are 25 to 29 Years (1,435 | 8.2%) for men and 60 to 64 Years (1,374 | 7.4%) for women.
| Age Bracket | Male | Female |
| Under 5 Years | 1,065 (6.1%) | 920 (4.9%) |
| 5 to 9 Years | 884 (5.1%) | 919 (4.9%) |
| 10 to 14 Years | 928 (5.3%) | 815 (4.4%) |
| 15 to 19 Years | 1,102 (6.3%) | 1,229 (6.6%) |
| 20 to 24 Years | 1,176 (6.8%) | 1,329 (7.1%) |
| 25 to 29 Years | 1,435 (8.2%) | 1,273 (6.8%) |
| 30 to 34 Years | 1,119 (6.4%) | 1,129 (6.0%) |
| 35 to 39 Years | 1,072 (6.2%) | 1,249 (6.7%) |
| 40 to 44 Years | 1,166 (6.7%) | 906 (4.9%) |
| 45 to 49 Years | 881 (5.1%) | 1,051 (5.6%) |
| 50 to 54 Years | 924 (5.3%) | 819 (4.4%) |
| 55 to 59 Years | 1,031 (5.9%) | 1,108 (5.9%) |
| 60 to 64 Years | 1,102 (6.3%) | 1,374 (7.4%) |
| 65 to 69 Years | 948 (5.4%) | 1,000 (5.4%) |
| 70 to 74 Years | 844 (4.9%) | 917 (4.9%) |
| 75 to 79 Years | 521 (3.0%) | 749 (4.0%) |
| 80 to 84 Years | 453 (2.6%) | 683 (3.7%) |
| 85 Years and over | 761 (4.4%) | 1,184 (6.4%) |
| Total | 17,412 (100.0%) | 18,654 (100.0%) |
Families and Households in Roseville
Median Family Size in Roseville
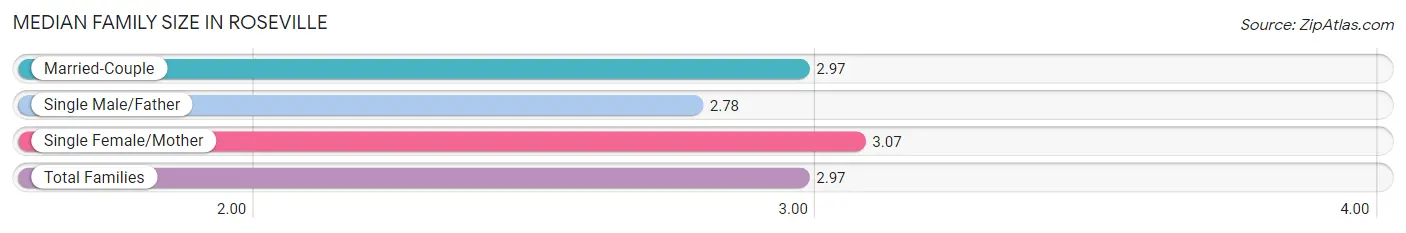
The median family size in Roseville is 2.97 persons per family, with single female/mother families (959 | 10.8%) accounting for the largest median family size of 3.07 persons per family. On the other hand, single male/father families (399 | 4.5%) represent the smallest median family size with 2.78 persons per family.
| Family Type | # Families | Family Size |
| Married-Couple | 7,518 (84.7%) | 2.97 |
| Single Male/Father | 399 (4.5%) | 2.78 |
| Single Female/Mother | 959 (10.8%) | 3.07 |
| Total Families | 8,876 (100.0%) | 2.97 |
Median Household Size in Roseville
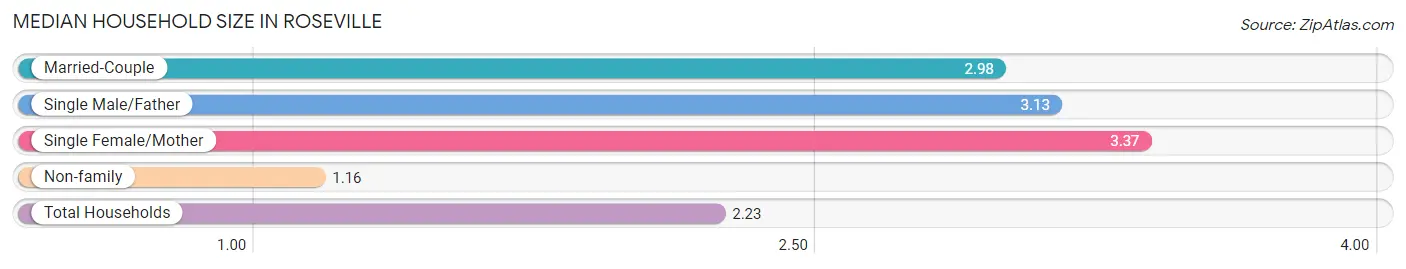
The median household size in Roseville is 2.23 persons per household, with single female/mother households (959 | 6.2%) accounting for the largest median household size of 3.37 persons per household. non-family households (6,652 | 42.8%) represent the smallest median household size with 1.16 persons per household.
| Household Type | # Households | Household Size |
| Married-Couple | 7,518 (48.4%) | 2.98 |
| Single Male/Father | 399 (2.6%) | 3.13 |
| Single Female/Mother | 959 (6.2%) | 3.37 |
| Non-family | 6,652 (42.8%) | 1.16 |
| Total Households | 15,528 (100.0%) | 2.23 |
Household Size by Marriage Status in Roseville
Out of a total of 15,528 households in Roseville, 8,876 (57.2%) are family households, while 6,652 (42.8%) are nonfamily households. The most numerous type of family households are 2-person households, comprising 4,393, and the most common type of nonfamily households are 1-person households, comprising 5,819.
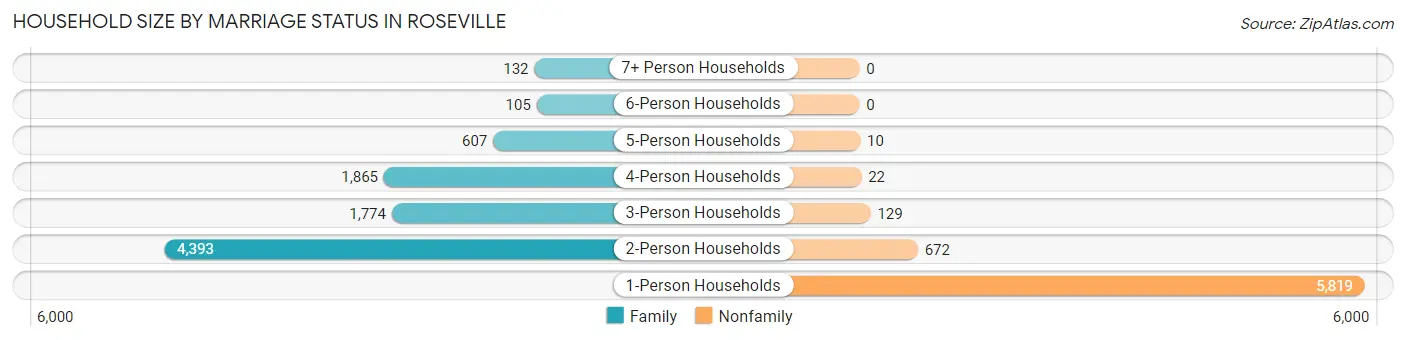
| Household Size | Family Households | Nonfamily Households |
| 1-Person Households | - | 5,819 (37.5%) |
| 2-Person Households | 4,393 (28.3%) | 672 (4.3%) |
| 3-Person Households | 1,774 (11.4%) | 129 (0.8%) |
| 4-Person Households | 1,865 (12.0%) | 22 (0.1%) |
| 5-Person Households | 607 (3.9%) | 10 (0.1%) |
| 6-Person Households | 105 (0.7%) | 0 (0.0%) |
| 7+ Person Households | 132 (0.9%) | 0 (0.0%) |
| Total | 8,876 (57.2%) | 6,652 (42.8%) |
Female Fertility in Roseville
Fertility by Age in Roseville
Average fertility rate in Roseville is 55.0 births per 1,000 women. Women in the age bracket of 20 to 34 years have the highest fertility rate with 74.0 births per 1,000 women. Women in the age bracket of 20 to 34 years acount for 60.1% of all women with births.
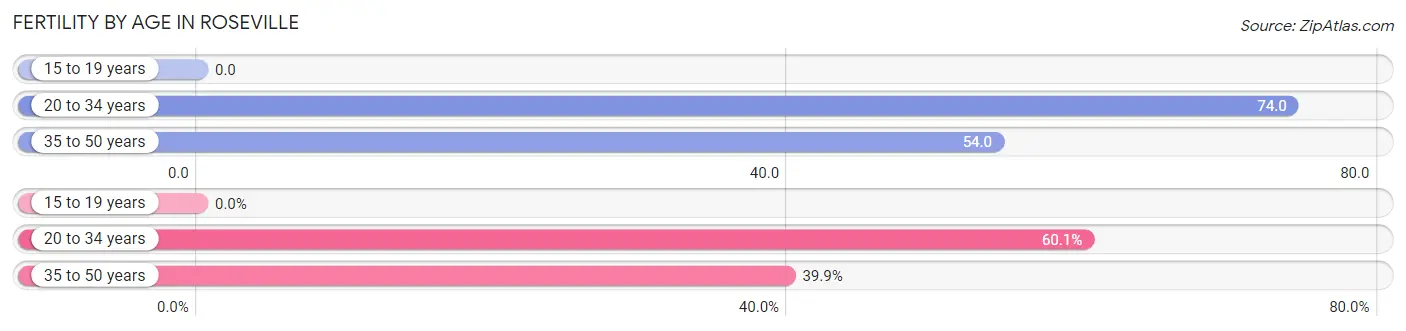
| Age Bracket | Women with Births | Births / 1,000 Women |
| 15 to 19 years | 0 (0.0%) | 0.0 |
| 20 to 34 years | 276 (60.1%) | 74.0 |
| 35 to 50 years | 183 (39.9%) | 54.0 |
| Total | 459 (100.0%) | 55.0 |
Fertility by Age by Marriage Status in Roseville
95.2% of women with births (459) in Roseville are married. The highest percentage of unmarried women with births falls into 35 to 50 years age bracket with 5.5% of them unmarried at the time of birth, while the lowest percentage of unmarried women with births belong to 20 to 34 years age bracket with 4.3% of them unmarried.
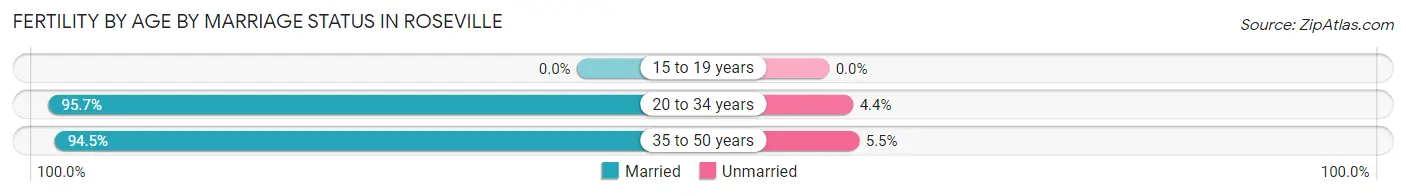
| Age Bracket | Married | Unmarried |
| 15 to 19 years | 0 (0.0%) | 0 (0.0%) |
| 20 to 34 years | 264 (95.7%) | 12 (4.3%) |
| 35 to 50 years | 173 (94.5%) | 10 (5.5%) |
| Total | 437 (95.2%) | 22 (4.8%) |
Fertility by Education in Roseville
Average fertility rate in Roseville is 55.0 births per 1,000 women. Women with the education attainment of graduate degree have the highest fertility rate of 95.0 births per 1,000 women, while women with the education attainment of college or associate's degree have the lowest fertility at 11.0 births per 1,000 women. Women with the education attainment of bachelor's degree represent 41.6% of all women with births.
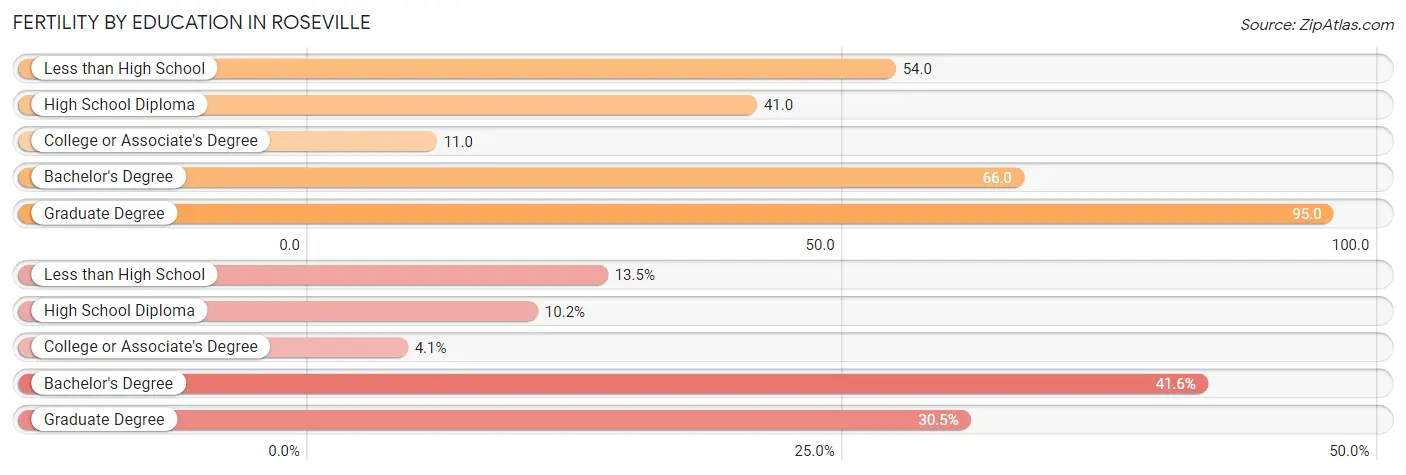
| Educational Attainment | Women with Births | Births / 1,000 Women |
| Less than High School | 62 (13.5%) | 54.0 |
| High School Diploma | 47 (10.2%) | 41.0 |
| College or Associate's Degree | 19 (4.1%) | 11.0 |
| Bachelor's Degree | 191 (41.6%) | 66.0 |
| Graduate Degree | 140 (30.5%) | 95.0 |
| Total | 459 (100.0%) | 55.0 |
Fertility by Education by Marriage Status in Roseville
4.8% of women with births in Roseville are unmarried. Women with the educational attainment of less than high school are most likely to be married with 100.0% of them married at childbirth, while women with the educational attainment of high school diploma are least likely to be married with 21.3% of them unmarried at childbirth.
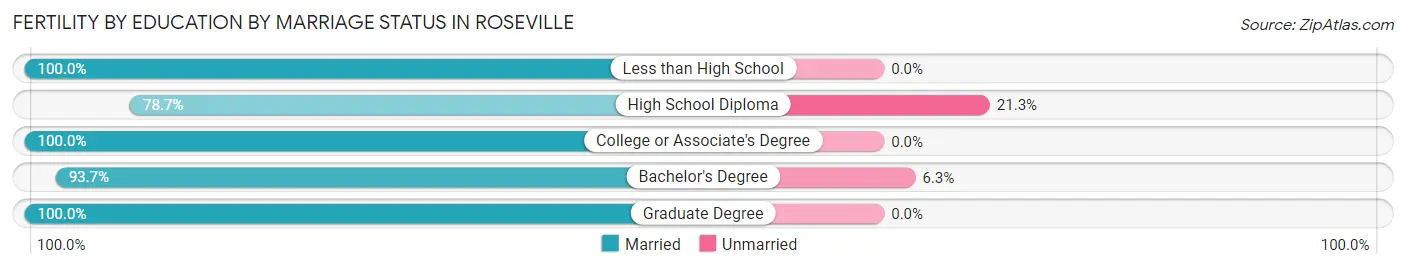
| Educational Attainment | Married | Unmarried |
| Less than High School | 62 (100.0%) | 0 (0.0%) |
| High School Diploma | 37 (78.7%) | 10 (21.3%) |
| College or Associate's Degree | 19 (100.0%) | 0 (0.0%) |
| Bachelor's Degree | 179 (93.7%) | 12 (6.3%) |
| Graduate Degree | 140 (100.0%) | 0 (0.0%) |
| Total | 437 (95.2%) | 22 (4.8%) |
Employment Characteristics in Roseville
Employment by Class of Employer in Roseville
Among the 17,721 employed individuals in Roseville, private company employees (11,074 | 62.5%), not-for-profit organizations (2,912 | 16.4%), and local government employees (1,199 | 6.8%) make up the most common classes of employment.
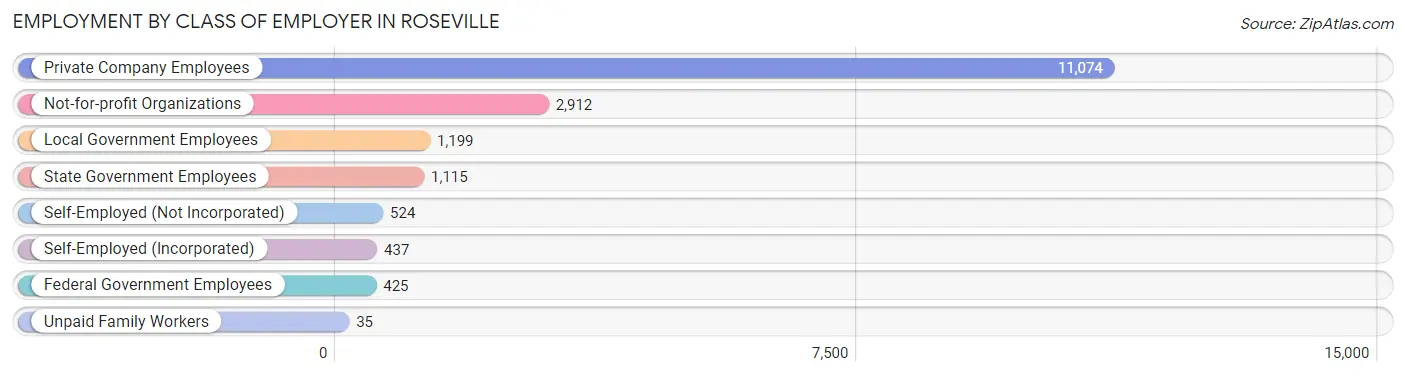
| Employer Class | # Employees | % Employees |
| Private Company Employees | 11,074 | 62.5% |
| Self-Employed (Incorporated) | 437 | 2.5% |
| Self-Employed (Not Incorporated) | 524 | 3.0% |
| Not-for-profit Organizations | 2,912 | 16.4% |
| Local Government Employees | 1,199 | 6.8% |
| State Government Employees | 1,115 | 6.3% |
| Federal Government Employees | 425 | 2.4% |
| Unpaid Family Workers | 35 | 0.2% |
| Total | 17,721 | 100.0% |
Employment Status by Age in Roseville
According to the labor force statistics for Roseville, out of the total population over 16 years of age (30,110), 63.4% or 19,090 individuals are in the labor force, with 5.3% or 1,012 of them unemployed. The age group with the highest labor force participation rate is 25 to 29 years, with 91.7% or 2,483 individuals in the labor force. Within the labor force, the 65 to 74 years age range has the highest percentage of unemployed individuals, with 8.7% or 87 of them being unemployed.
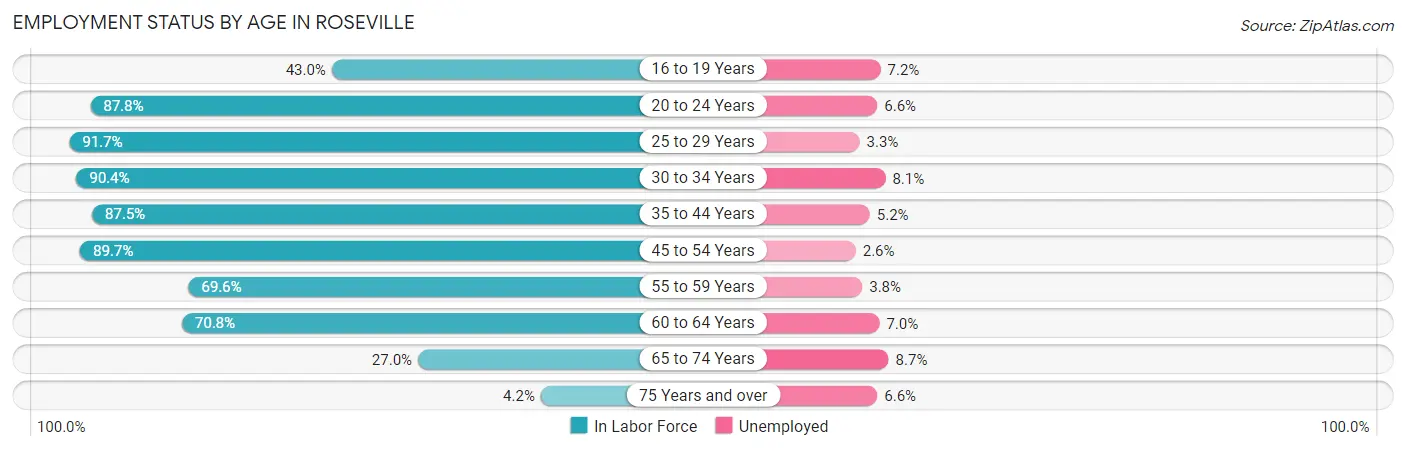
| Age Bracket | In Labor Force | Unemployed |
| 16 to 19 Years | 820 (43.0%) | 59 (7.2%) |
| 20 to 24 Years | 2,199 (87.8%) | 145 (6.6%) |
| 25 to 29 Years | 2,483 (91.7%) | 82 (3.3%) |
| 30 to 34 Years | 2,032 (90.4%) | 165 (8.1%) |
| 35 to 44 Years | 3,844 (87.5%) | 200 (5.2%) |
| 45 to 54 Years | 3,296 (89.7%) | 86 (2.6%) |
| 55 to 59 Years | 1,489 (69.6%) | 57 (3.8%) |
| 60 to 64 Years | 1,753 (70.8%) | 123 (7.0%) |
| 65 to 74 Years | 1,001 (27.0%) | 87 (8.7%) |
| 75 Years and over | 183 (4.2%) | 12 (6.6%) |
| Total | 19,090 (63.4%) | 1,012 (5.3%) |
Employment Status by Educational Attainment in Roseville
According to labor force statistics for Roseville, 84.5% of individuals (14,905) out of the total population between 25 and 64 years of age (17,639) are in the labor force, with 4.8% or 715 of them being unemployed. The group with the highest labor force participation rate are those with the educational attainment of bachelor's degree or higher, with 88.9% or 8,958 individuals in the labor force. Within the labor force, individuals with less than high school education have the highest percentage of unemployment, with 13.5% or 71 of them being unemployed.
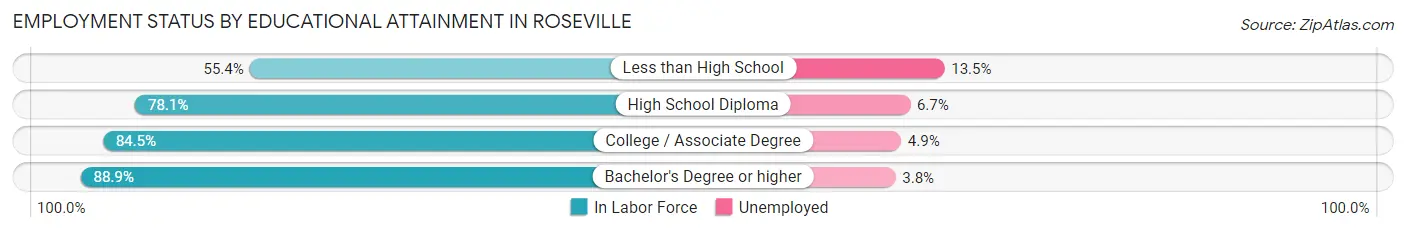
| Educational Attainment | In Labor Force | Unemployed |
| Less than High School | 527 (55.4%) | 129 (13.5%) |
| High School Diploma | 2,114 (78.1%) | 181 (6.7%) |
| College / Associate Degree | 3,298 (84.5%) | 191 (4.9%) |
| Bachelor's Degree or higher | 8,958 (88.9%) | 383 (3.8%) |
| Total | 14,905 (84.5%) | 847 (4.8%) |
Employment Occupations by Sex in Roseville
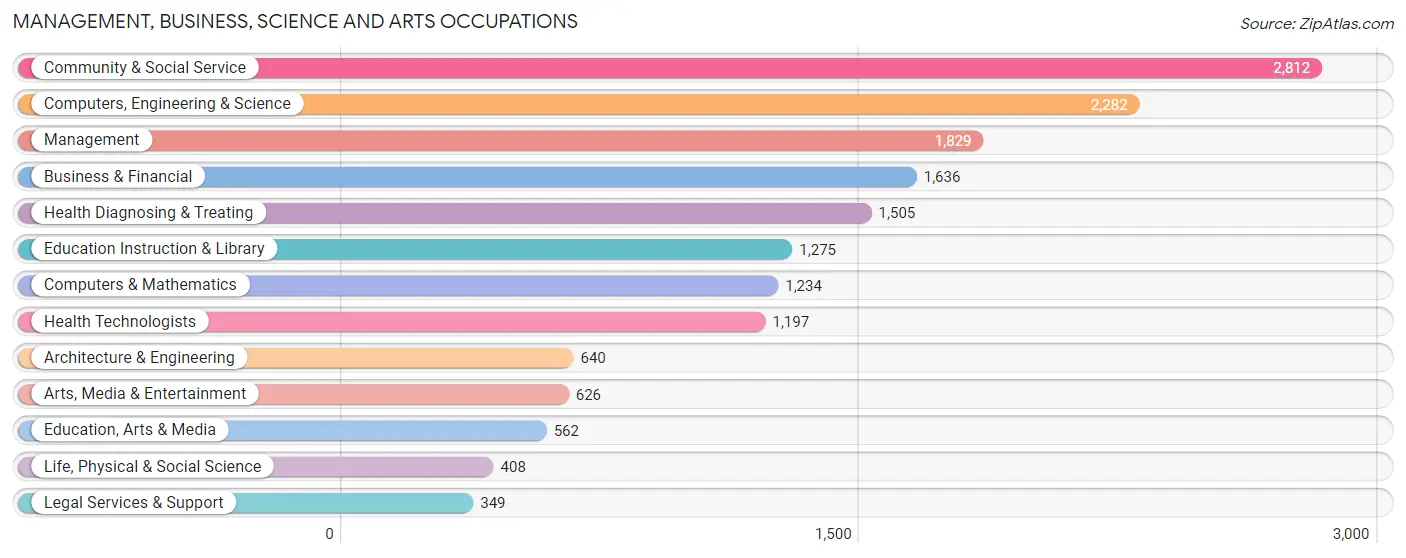
Management, Business, Science and Arts Occupations
The most common Management, Business, Science and Arts occupations in Roseville are Community & Social Service (2,812 | 15.6%), Computers, Engineering & Science (2,282 | 12.6%), Management (1,829 | 10.1%), Business & Financial (1,636 | 9.0%), and Health Diagnosing & Treating (1,505 | 8.3%).
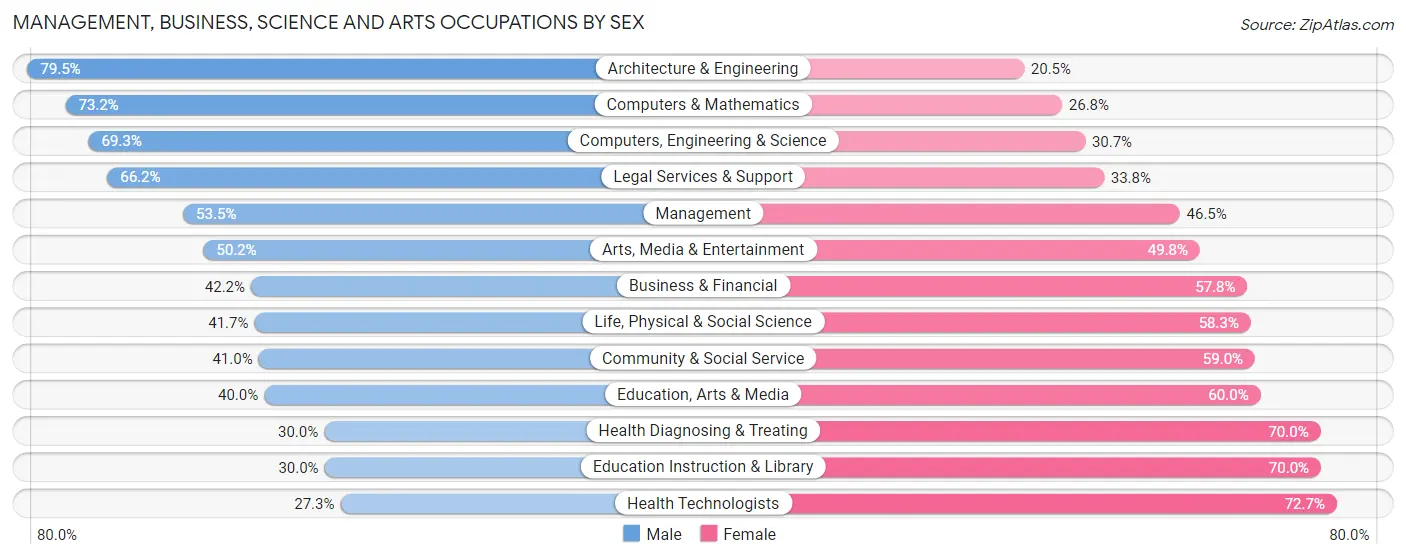
Management, Business, Science and Arts Occupations by Sex
Within the Management, Business, Science and Arts occupations in Roseville, the most male-oriented occupations are Architecture & Engineering (79.5%), Computers & Mathematics (73.2%), and Computers, Engineering & Science (69.3%), while the most female-oriented occupations are Health Technologists (72.7%), Education Instruction & Library (70.0%), and Health Diagnosing & Treating (70.0%).
| Occupation | Male | Female |
| Management | 979 (53.5%) | 850 (46.5%) |
| Business & Financial | 691 (42.2%) | 945 (57.8%) |
| Computers, Engineering & Science | 1,582 (69.3%) | 700 (30.7%) |
| Computers & Mathematics | 903 (73.2%) | 331 (26.8%) |
| Architecture & Engineering | 509 (79.5%) | 131 (20.5%) |
| Life, Physical & Social Science | 170 (41.7%) | 238 (58.3%) |
| Community & Social Service | 1,152 (41.0%) | 1,660 (59.0%) |
| Education, Arts & Media | 225 (40.0%) | 337 (60.0%) |
| Legal Services & Support | 231 (66.2%) | 118 (33.8%) |
| Education Instruction & Library | 382 (30.0%) | 893 (70.0%) |
| Arts, Media & Entertainment | 314 (50.2%) | 312 (49.8%) |
| Health Diagnosing & Treating | 452 (30.0%) | 1,053 (70.0%) |
| Health Technologists | 327 (27.3%) | 870 (72.7%) |
| Total (Category) | 4,856 (48.2%) | 5,208 (51.7%) |
| Total (Overall) | 9,037 (50.0%) | 9,038 (50.0%) |
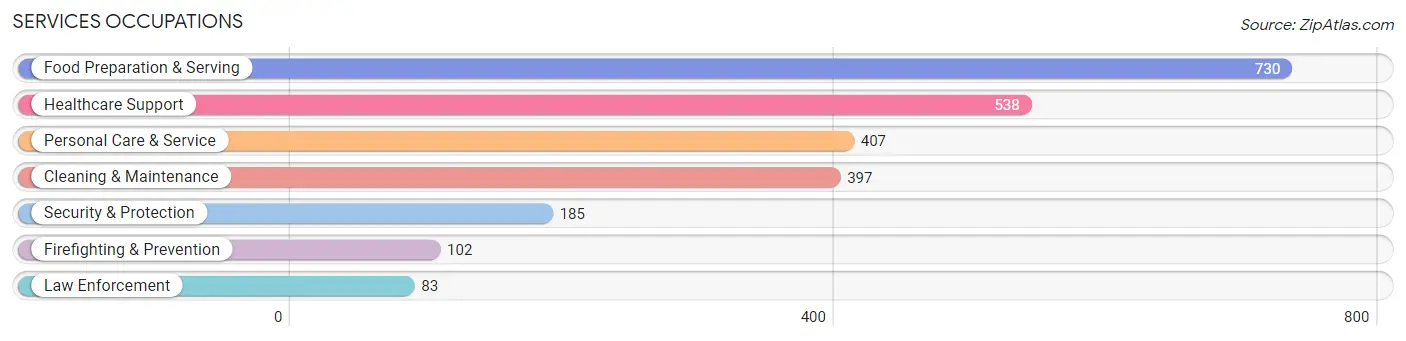
Services Occupations
The most common Services occupations in Roseville are Food Preparation & Serving (730 | 4.0%), Healthcare Support (538 | 3.0%), Personal Care & Service (407 | 2.2%), Cleaning & Maintenance (397 | 2.2%), and Security & Protection (185 | 1.0%).
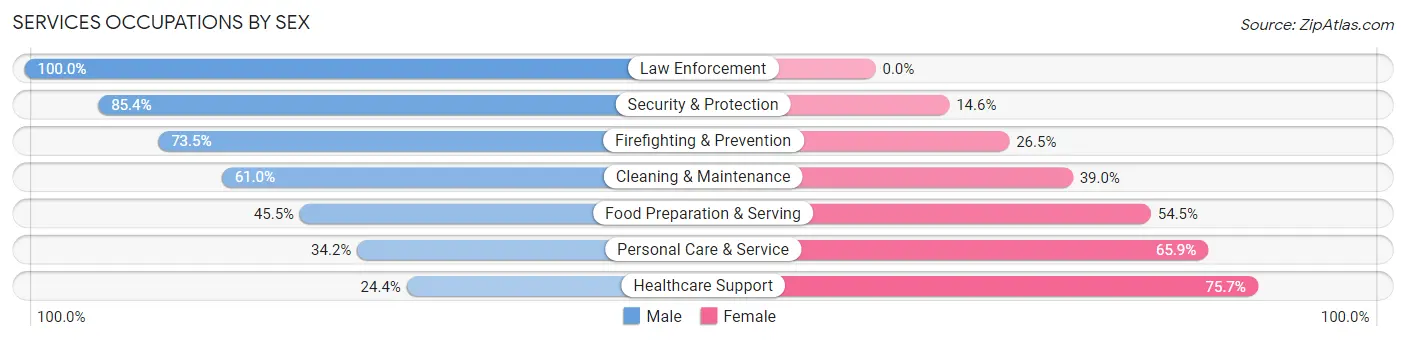
Services Occupations by Sex
Within the Services occupations in Roseville, the most male-oriented occupations are Law Enforcement (100.0%), Security & Protection (85.4%), and Firefighting & Prevention (73.5%), while the most female-oriented occupations are Healthcare Support (75.6%), Personal Care & Service (65.8%), and Food Preparation & Serving (54.5%).
| Occupation | Male | Female |
| Healthcare Support | 131 (24.3%) | 407 (75.6%) |
| Security & Protection | 158 (85.4%) | 27 (14.6%) |
| Firefighting & Prevention | 75 (73.5%) | 27 (26.5%) |
| Law Enforcement | 83 (100.0%) | 0 (0.0%) |
| Food Preparation & Serving | 332 (45.5%) | 398 (54.5%) |
| Cleaning & Maintenance | 242 (61.0%) | 155 (39.0%) |
| Personal Care & Service | 139 (34.2%) | 268 (65.8%) |
| Total (Category) | 1,002 (44.4%) | 1,255 (55.6%) |
| Total (Overall) | 9,037 (50.0%) | 9,038 (50.0%) |
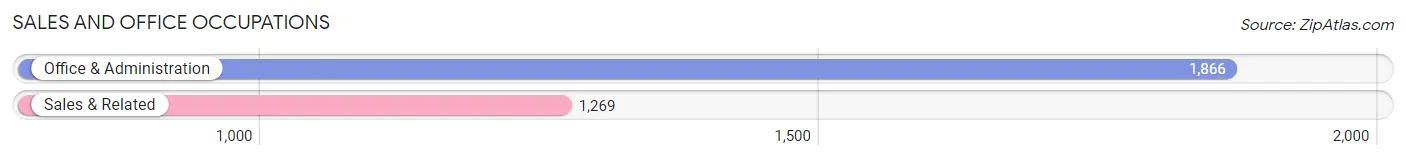
Sales and Office Occupations
The most common Sales and Office occupations in Roseville are Office & Administration (1,866 | 10.3%), and Sales & Related (1,269 | 7.0%).
Sales and Office Occupations by Sex
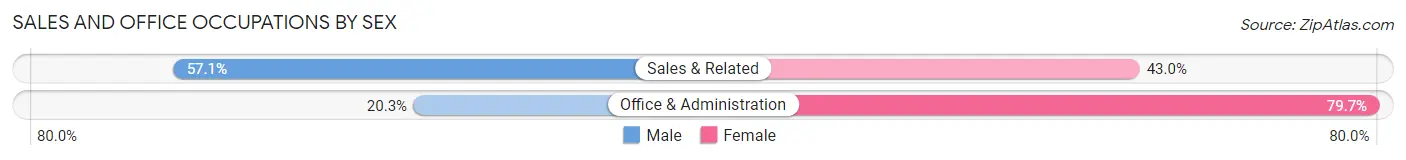
| Occupation | Male | Female |
| Sales & Related | 724 (57.1%) | 545 (42.9%) |
| Office & Administration | 378 (20.3%) | 1,488 (79.7%) |
| Total (Category) | 1,102 (35.1%) | 2,033 (64.8%) |
| Total (Overall) | 9,037 (50.0%) | 9,038 (50.0%) |
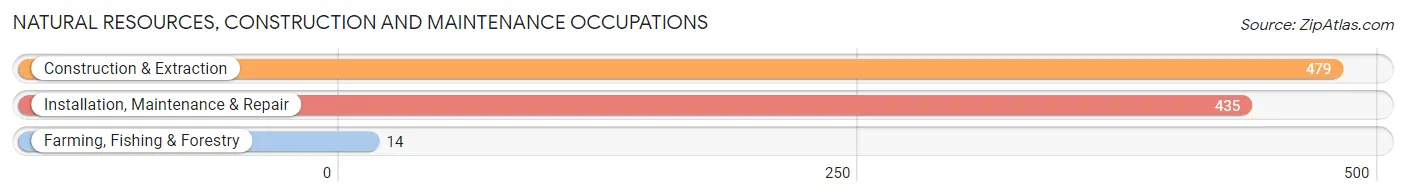
Natural Resources, Construction and Maintenance Occupations
The most common Natural Resources, Construction and Maintenance occupations in Roseville are Construction & Extraction (479 | 2.6%), Installation, Maintenance & Repair (435 | 2.4%), and Farming, Fishing & Forestry (14 | 0.1%).
Natural Resources, Construction and Maintenance Occupations by Sex
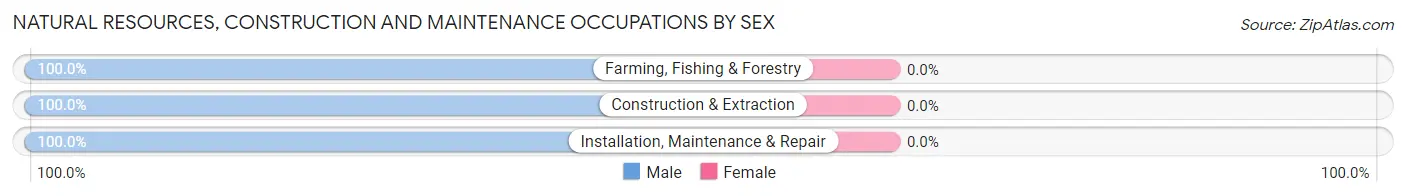
| Occupation | Male | Female |
| Farming, Fishing & Forestry | 14 (100.0%) | 0 (0.0%) |
| Construction & Extraction | 479 (100.0%) | 0 (0.0%) |
| Installation, Maintenance & Repair | 435 (100.0%) | 0 (0.0%) |
| Total (Category) | 928 (100.0%) | 0 (0.0%) |
| Total (Overall) | 9,037 (50.0%) | 9,038 (50.0%) |
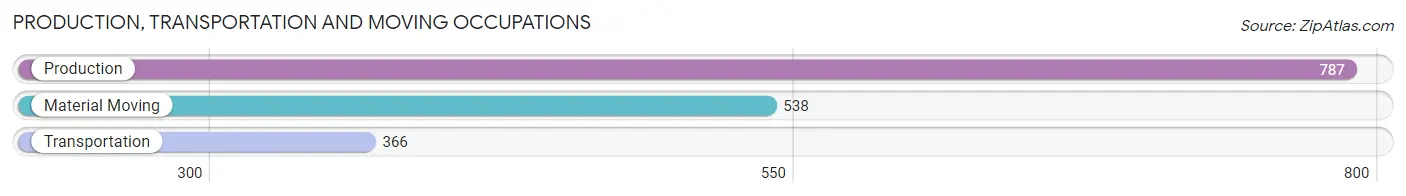
Production, Transportation and Moving Occupations
The most common Production, Transportation and Moving occupations in Roseville are Production (787 | 4.3%), Material Moving (538 | 3.0%), and Transportation (366 | 2.0%).
Production, Transportation and Moving Occupations by Sex
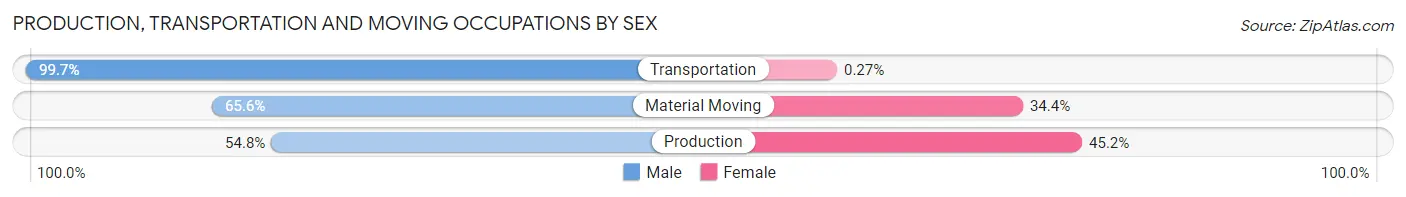
| Occupation | Male | Female |
| Production | 431 (54.8%) | 356 (45.2%) |
| Transportation | 365 (99.7%) | 1 (0.3%) |
| Material Moving | 353 (65.6%) | 185 (34.4%) |
| Total (Category) | 1,149 (67.9%) | 542 (32.1%) |
| Total (Overall) | 9,037 (50.0%) | 9,038 (50.0%) |
Employment Industries by Sex in Roseville
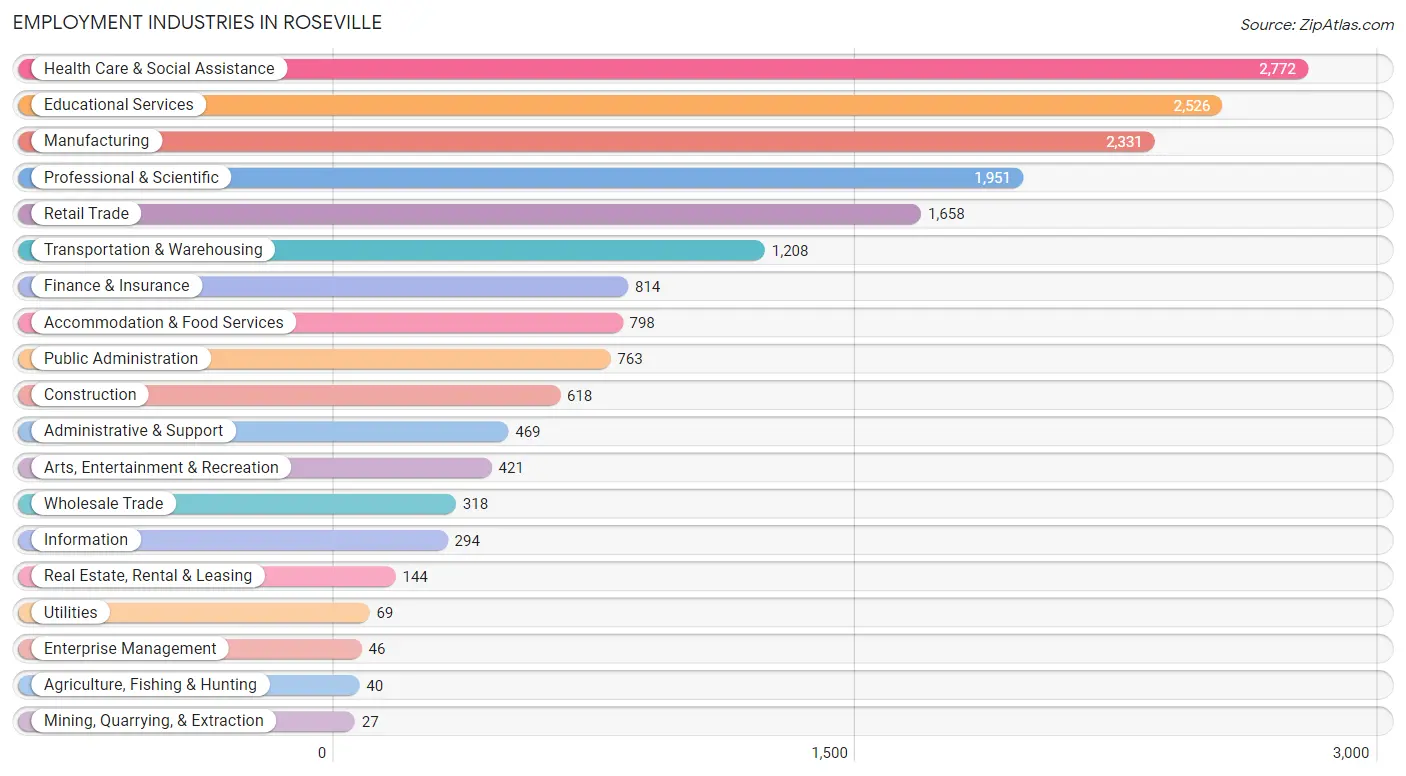
Employment Industries in Roseville
The major employment industries in Roseville include Health Care & Social Assistance (2,772 | 15.3%), Educational Services (2,526 | 14.0%), Manufacturing (2,331 | 12.9%), Professional & Scientific (1,951 | 10.8%), and Retail Trade (1,658 | 9.2%).
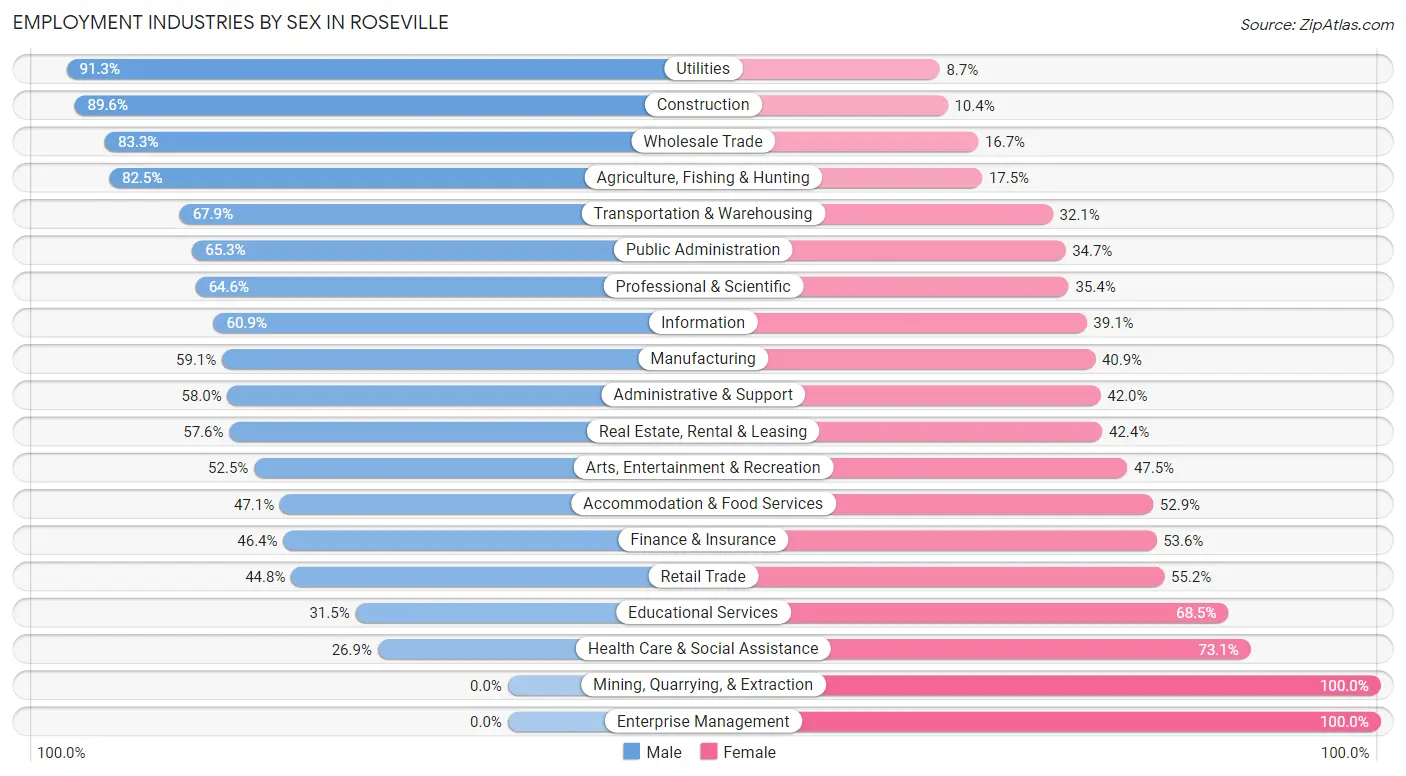
Employment Industries by Sex in Roseville
The Roseville industries that see more men than women are Utilities (91.3%), Construction (89.6%), and Wholesale Trade (83.3%), whereas the industries that tend to have a higher number of women are Mining, Quarrying, & Extraction (100.0%), Enterprise Management (100.0%), and Health Care & Social Assistance (73.1%).
| Industry | Male | Female |
| Agriculture, Fishing & Hunting | 33 (82.5%) | 7 (17.5%) |
| Mining, Quarrying, & Extraction | 0 (0.0%) | 27 (100.0%) |
| Construction | 554 (89.6%) | 64 (10.4%) |
| Manufacturing | 1,378 (59.1%) | 953 (40.9%) |
| Wholesale Trade | 265 (83.3%) | 53 (16.7%) |
| Retail Trade | 743 (44.8%) | 915 (55.2%) |
| Transportation & Warehousing | 820 (67.9%) | 388 (32.1%) |
| Utilities | 63 (91.3%) | 6 (8.7%) |
| Information | 179 (60.9%) | 115 (39.1%) |
| Finance & Insurance | 378 (46.4%) | 436 (53.6%) |
| Real Estate, Rental & Leasing | 83 (57.6%) | 61 (42.4%) |
| Professional & Scientific | 1,260 (64.6%) | 691 (35.4%) |
| Enterprise Management | 0 (0.0%) | 46 (100.0%) |
| Administrative & Support | 272 (58.0%) | 197 (42.0%) |
| Educational Services | 796 (31.5%) | 1,730 (68.5%) |
| Health Care & Social Assistance | 746 (26.9%) | 2,026 (73.1%) |
| Arts, Entertainment & Recreation | 221 (52.5%) | 200 (47.5%) |
| Accommodation & Food Services | 376 (47.1%) | 422 (52.9%) |
| Public Administration | 498 (65.3%) | 265 (34.7%) |
| Total | 9,037 (50.0%) | 9,038 (50.0%) |
Education in Roseville
School Enrollment in Roseville
The most common levels of schooling among the 8,148 students in Roseville are college / undergraduate (2,023 | 24.8%), high school (1,713 | 21.0%), and elementary school (1,511 | 18.5%).
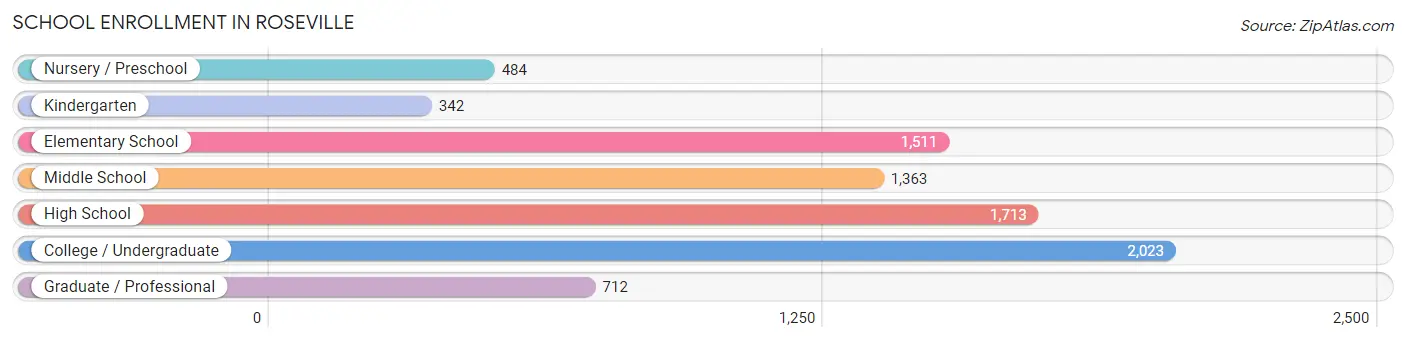
| School Level | # Students | % Students |
| Nursery / Preschool | 484 | 5.9% |
| Kindergarten | 342 | 4.2% |
| Elementary School | 1,511 | 18.5% |
| Middle School | 1,363 | 16.7% |
| High School | 1,713 | 21.0% |
| College / Undergraduate | 2,023 | 24.8% |
| Graduate / Professional | 712 | 8.7% |
| Total | 8,148 | 100.0% |
School Enrollment by Age by Funding Source in Roseville
Out of a total of 8,148 students who are enrolled in schools in Roseville, 2,265 (27.8%) attend a private institution, while the remaining 5,883 (72.2%) are enrolled in public schools. The age group of 20 to 24 year olds has the highest likelihood of being enrolled in private schools, with 647 (65.5% in the age bracket) enrolled. Conversely, the age group of 10 to 14 year olds has the lowest likelihood of being enrolled in a private school, with 1,534 (90.2% in the age bracket) attending a public institution.
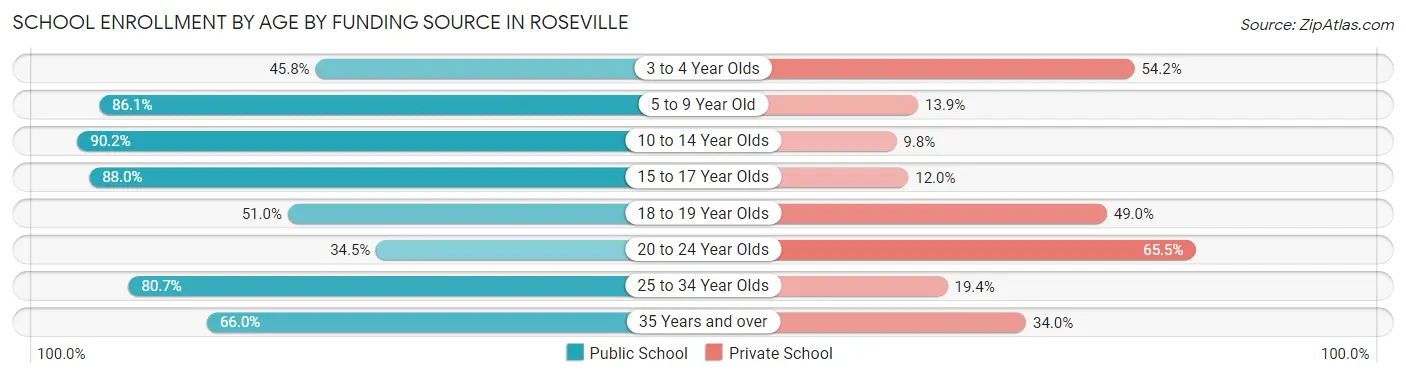
| Age Bracket | Public School | Private School |
| 3 to 4 Year Olds | 176 (45.8%) | 208 (54.2%) |
| 5 to 9 Year Old | 1,490 (86.1%) | 240 (13.9%) |
| 10 to 14 Year Olds | 1,534 (90.2%) | 167 (9.8%) |
| 15 to 17 Year Olds | 884 (88.0%) | 121 (12.0%) |
| 18 to 19 Year Olds | 621 (51.0%) | 597 (49.0%) |
| 20 to 24 Year Olds | 341 (34.5%) | 647 (65.5%) |
| 25 to 34 Year Olds | 525 (80.6%) | 126 (19.4%) |
| 35 Years and over | 311 (66.0%) | 160 (34.0%) |
| Total | 5,883 (72.2%) | 2,265 (27.8%) |
Educational Attainment by Field of Study in Roseville
Business (2,020 | 12.8%), education (1,782 | 11.3%), social sciences (1,446 | 9.2%), bio, nature & agricultural (1,373 | 8.7%), and science & technology (1,366 | 8.7%) are the most common fields of study among 15,756 individuals in Roseville who have obtained a bachelor's degree or higher.
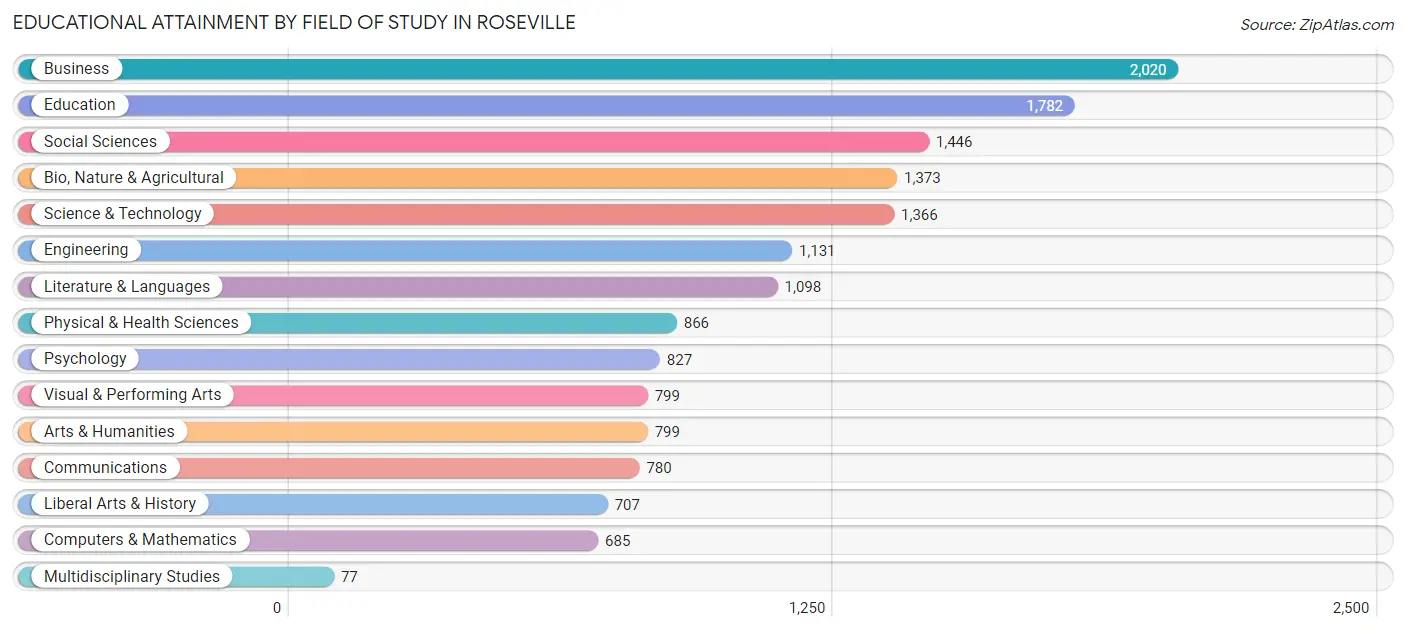
| Field of Study | # Graduates | % Graduates |
| Computers & Mathematics | 685 | 4.3% |
| Bio, Nature & Agricultural | 1,373 | 8.7% |
| Physical & Health Sciences | 866 | 5.5% |
| Psychology | 827 | 5.2% |
| Social Sciences | 1,446 | 9.2% |
| Engineering | 1,131 | 7.2% |
| Multidisciplinary Studies | 77 | 0.5% |
| Science & Technology | 1,366 | 8.7% |
| Business | 2,020 | 12.8% |
| Education | 1,782 | 11.3% |
| Literature & Languages | 1,098 | 7.0% |
| Liberal Arts & History | 707 | 4.5% |
| Visual & Performing Arts | 799 | 5.1% |
| Communications | 780 | 5.0% |
| Arts & Humanities | 799 | 5.1% |
| Total | 15,756 | 100.0% |
Transportation & Commute in Roseville
Vehicle Availability by Sex in Roseville
The most prevalent vehicle ownership categories in Roseville are males with 2 vehicles (4,453, accounting for 50.7%) and females with 2 vehicles (4,456, making up 52.5%).
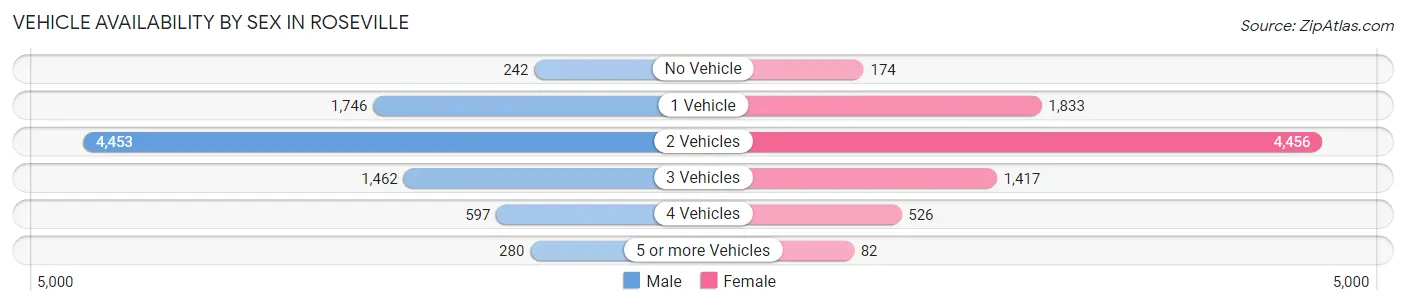
| Vehicles Available | Male | Female |
| No Vehicle | 242 (2.8%) | 174 (2.1%) |
| 1 Vehicle | 1,746 (19.9%) | 1,833 (21.6%) |
| 2 Vehicles | 4,453 (50.7%) | 4,456 (52.5%) |
| 3 Vehicles | 1,462 (16.7%) | 1,417 (16.7%) |
| 4 Vehicles | 597 (6.8%) | 526 (6.2%) |
| 5 or more Vehicles | 280 (3.2%) | 82 (1.0%) |
| Total | 8,780 (100.0%) | 8,488 (100.0%) |
Commute Time in Roseville
The most frequently occuring commute durations in Roseville are 20 to 24 minutes (2,828 commuters, 19.1%), 15 to 19 minutes (2,705 commuters, 18.3%), and 10 to 14 minutes (2,470 commuters, 16.7%).
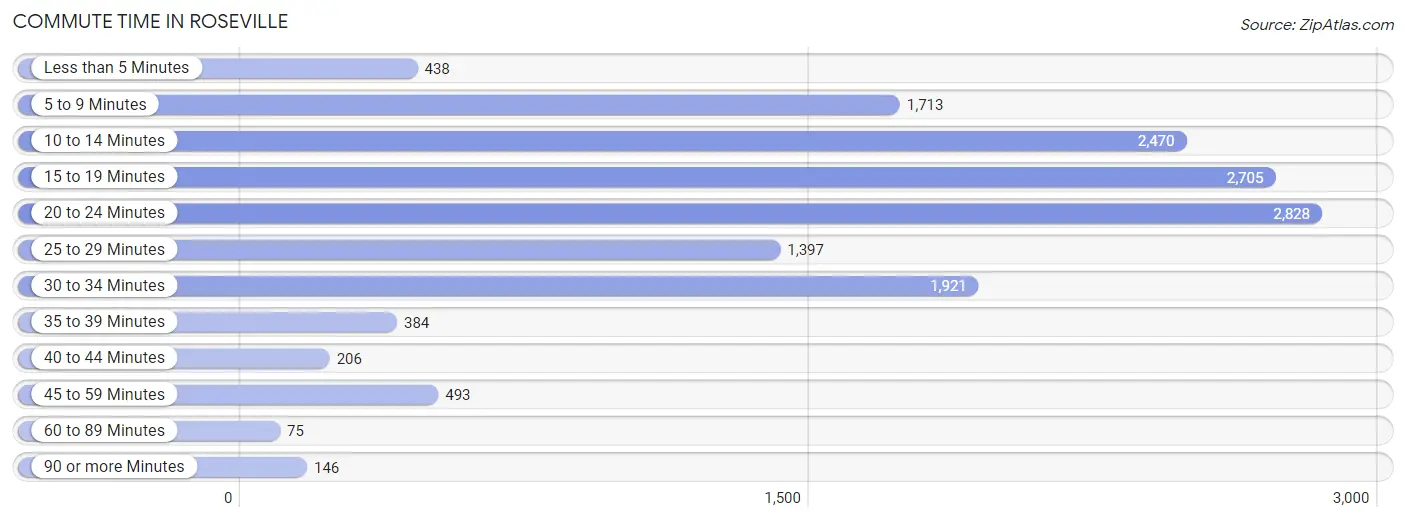
| Commute Time | # Commuters | % Commuters |
| Less than 5 Minutes | 438 | 3.0% |
| 5 to 9 Minutes | 1,713 | 11.6% |
| 10 to 14 Minutes | 2,470 | 16.7% |
| 15 to 19 Minutes | 2,705 | 18.3% |
| 20 to 24 Minutes | 2,828 | 19.1% |
| 25 to 29 Minutes | 1,397 | 9.5% |
| 30 to 34 Minutes | 1,921 | 13.0% |
| 35 to 39 Minutes | 384 | 2.6% |
| 40 to 44 Minutes | 206 | 1.4% |
| 45 to 59 Minutes | 493 | 3.3% |
| 60 to 89 Minutes | 75 | 0.5% |
| 90 or more Minutes | 146 | 1.0% |
Commute Time by Sex in Roseville
The most common commute times in Roseville are 20 to 24 minutes (1,511 commuters, 20.0%) for males and 15 to 19 minutes (1,445 commuters, 20.0%) for females.
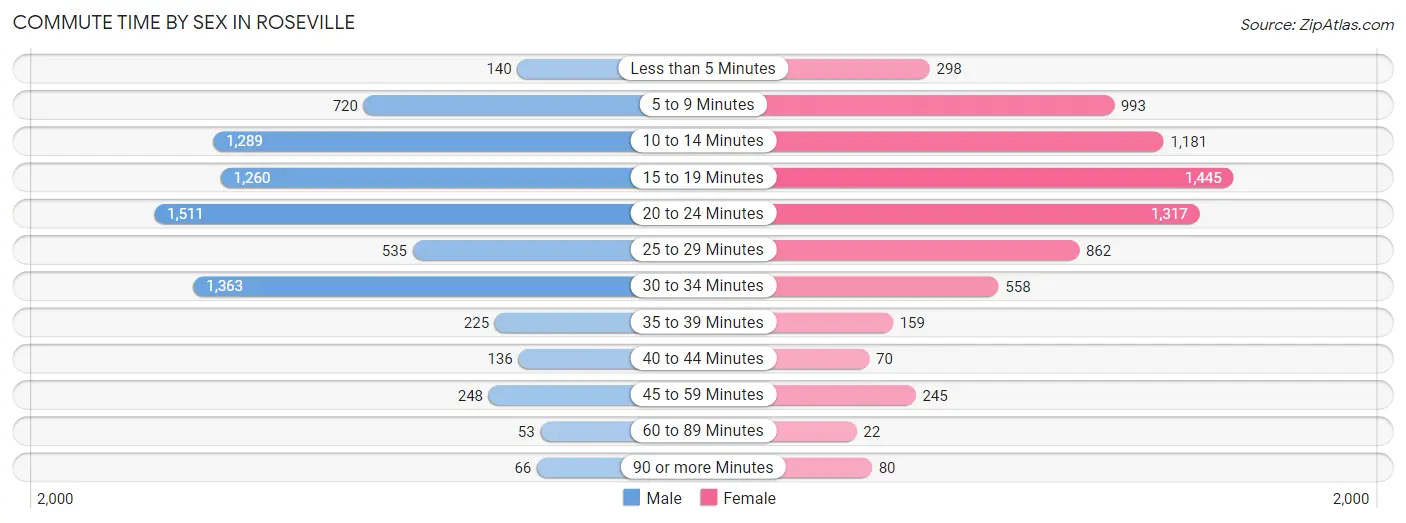
| Commute Time | Male | Female |
| Less than 5 Minutes | 140 (1.9%) | 298 (4.1%) |
| 5 to 9 Minutes | 720 (9.5%) | 993 (13.7%) |
| 10 to 14 Minutes | 1,289 (17.1%) | 1,181 (16.3%) |
| 15 to 19 Minutes | 1,260 (16.7%) | 1,445 (20.0%) |
| 20 to 24 Minutes | 1,511 (20.0%) | 1,317 (18.2%) |
| 25 to 29 Minutes | 535 (7.1%) | 862 (11.9%) |
| 30 to 34 Minutes | 1,363 (18.1%) | 558 (7.7%) |
| 35 to 39 Minutes | 225 (3.0%) | 159 (2.2%) |
| 40 to 44 Minutes | 136 (1.8%) | 70 (1.0%) |
| 45 to 59 Minutes | 248 (3.3%) | 245 (3.4%) |
| 60 to 89 Minutes | 53 (0.7%) | 22 (0.3%) |
| 90 or more Minutes | 66 (0.9%) | 80 (1.1%) |
Time of Departure to Work by Sex in Roseville
The most frequent times of departure to work in Roseville are 7:00 AM to 7:29 AM (1,311, 17.4%) for males and 7:30 AM to 7:59 AM (1,480, 20.5%) for females.
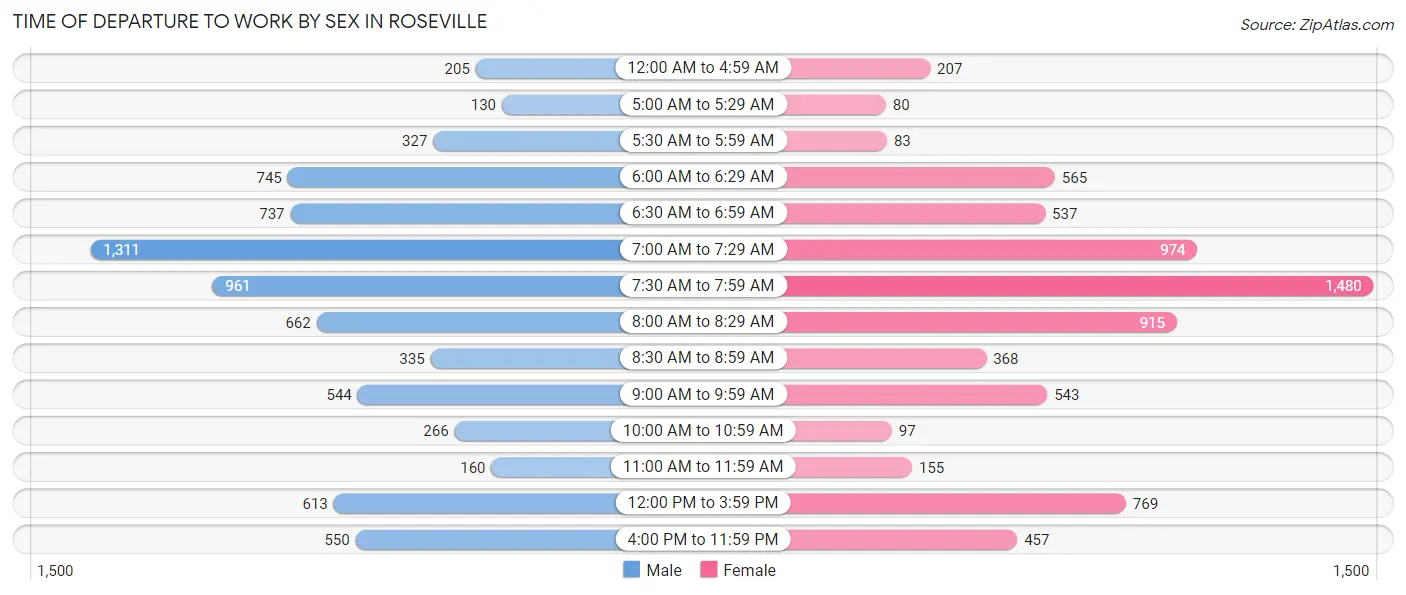
| Time of Departure | Male | Female |
| 12:00 AM to 4:59 AM | 205 (2.7%) | 207 (2.9%) |
| 5:00 AM to 5:29 AM | 130 (1.7%) | 80 (1.1%) |
| 5:30 AM to 5:59 AM | 327 (4.3%) | 83 (1.1%) |
| 6:00 AM to 6:29 AM | 745 (9.9%) | 565 (7.8%) |
| 6:30 AM to 6:59 AM | 737 (9.8%) | 537 (7.4%) |
| 7:00 AM to 7:29 AM | 1,311 (17.4%) | 974 (13.5%) |
| 7:30 AM to 7:59 AM | 961 (12.7%) | 1,480 (20.5%) |
| 8:00 AM to 8:29 AM | 662 (8.8%) | 915 (12.7%) |
| 8:30 AM to 8:59 AM | 335 (4.4%) | 368 (5.1%) |
| 9:00 AM to 9:59 AM | 544 (7.2%) | 543 (7.5%) |
| 10:00 AM to 10:59 AM | 266 (3.5%) | 97 (1.3%) |
| 11:00 AM to 11:59 AM | 160 (2.1%) | 155 (2.1%) |
| 12:00 PM to 3:59 PM | 613 (8.1%) | 769 (10.6%) |
| 4:00 PM to 11:59 PM | 550 (7.3%) | 457 (6.3%) |
| Total | 7,546 (100.0%) | 7,230 (100.0%) |
Housing Occupancy in Roseville
Occupancy by Ownership in Roseville
Of the total 15,528 dwellings in Roseville, owner-occupied units account for 10,727 (69.1%), while renter-occupied units make up 4,801 (30.9%).
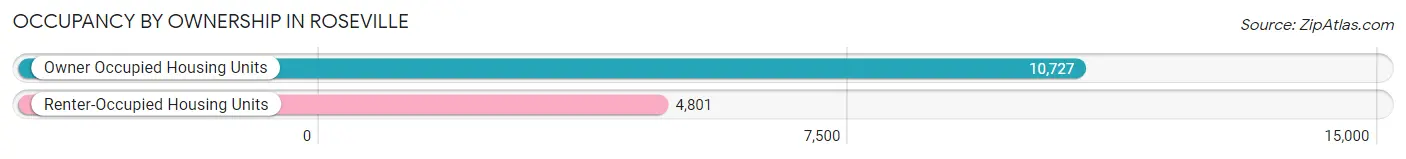
| Occupancy | # Housing Units | % Housing Units |
| Owner Occupied Housing Units | 10,727 | 69.1% |
| Renter-Occupied Housing Units | 4,801 | 30.9% |
| Total Occupied Housing Units | 15,528 | 100.0% |
Occupancy by Household Size in Roseville
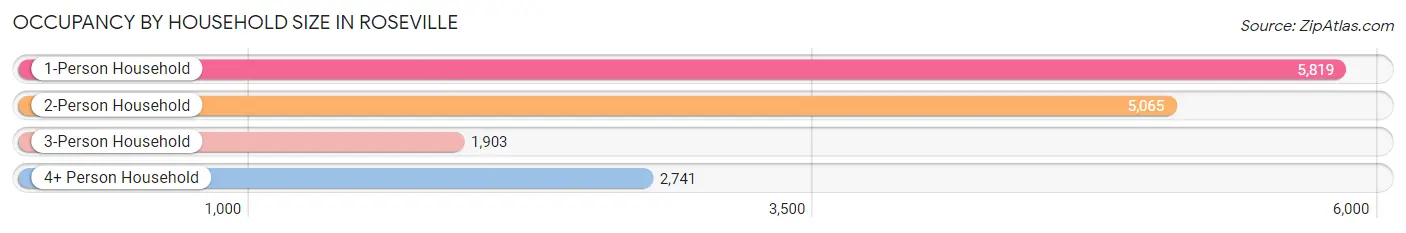
| Household Size | # Housing Units | % Housing Units |
| 1-Person Household | 5,819 | 37.5% |
| 2-Person Household | 5,065 | 32.6% |
| 3-Person Household | 1,903 | 12.3% |
| 4+ Person Household | 2,741 | 17.6% |
| Total Housing Units | 15,528 | 100.0% |
Occupancy by Ownership by Household Size in Roseville
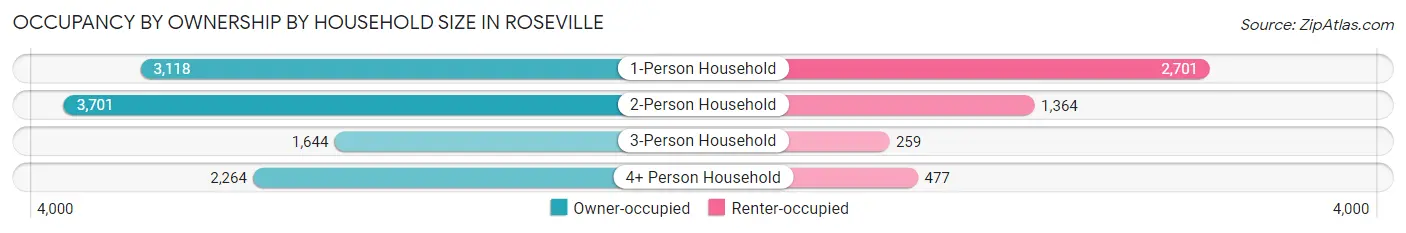
| Household Size | Owner-occupied | Renter-occupied |
| 1-Person Household | 3,118 (53.6%) | 2,701 (46.4%) |
| 2-Person Household | 3,701 (73.1%) | 1,364 (26.9%) |
| 3-Person Household | 1,644 (86.4%) | 259 (13.6%) |
| 4+ Person Household | 2,264 (82.6%) | 477 (17.4%) |
| Total Housing Units | 10,727 (69.1%) | 4,801 (30.9%) |
Occupancy by Educational Attainment in Roseville
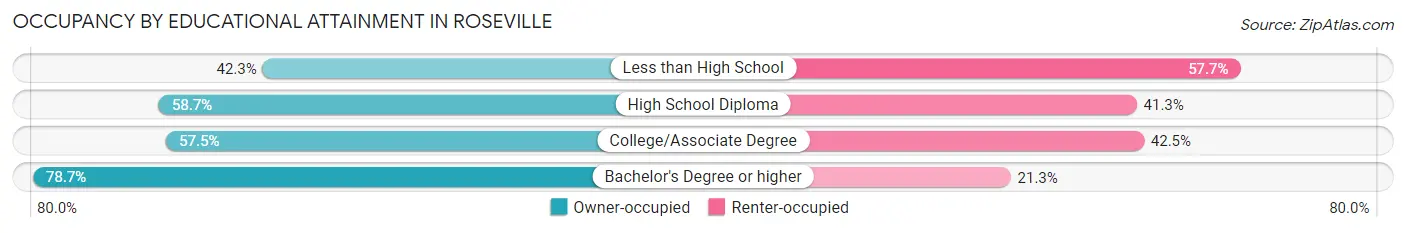
| Household Size | Owner-occupied | Renter-occupied |
| Less than High School | 224 (42.3%) | 306 (57.7%) |
| High School Diploma | 1,546 (58.7%) | 1,088 (41.3%) |
| College/Associate Degree | 2,098 (57.5%) | 1,548 (42.5%) |
| Bachelor's Degree or higher | 6,859 (78.7%) | 1,859 (21.3%) |
Occupancy by Age of Householder in Roseville
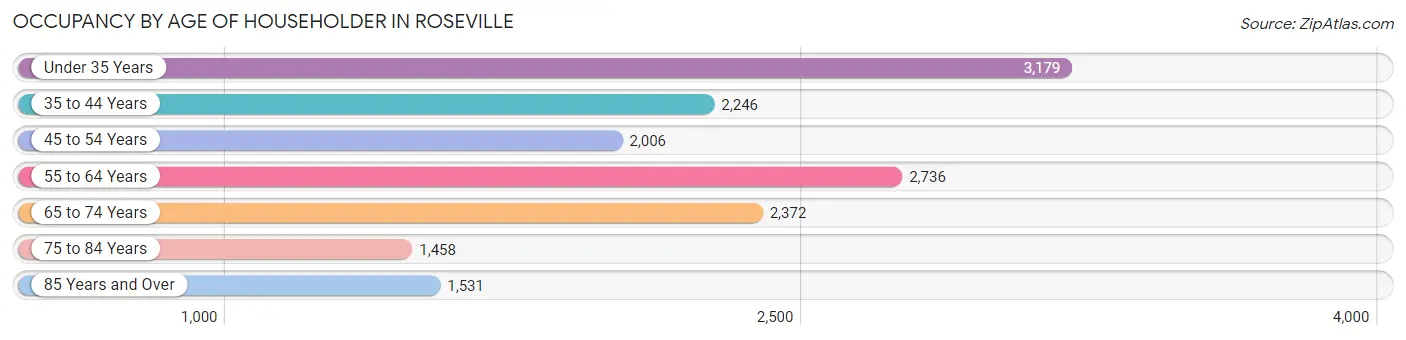
| Age Bracket | # Households | % Households |
| Under 35 Years | 3,179 | 20.5% |
| 35 to 44 Years | 2,246 | 14.5% |
| 45 to 54 Years | 2,006 | 12.9% |
| 55 to 64 Years | 2,736 | 17.6% |
| 65 to 74 Years | 2,372 | 15.3% |
| 75 to 84 Years | 1,458 | 9.4% |
| 85 Years and Over | 1,531 | 9.9% |
| Total | 15,528 | 100.0% |
Housing Finances in Roseville
Median Income by Occupancy in Roseville
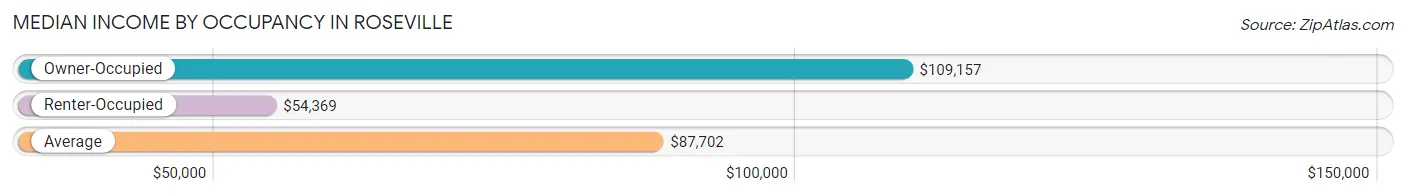
| Occupancy Type | # Households | Median Income |
| Owner-Occupied | 10,727 (69.1%) | $109,157 |
| Renter-Occupied | 4,801 (30.9%) | $54,369 |
| Average | 15,528 (100.0%) | $87,702 |
Occupancy by Householder Income Bracket in Roseville
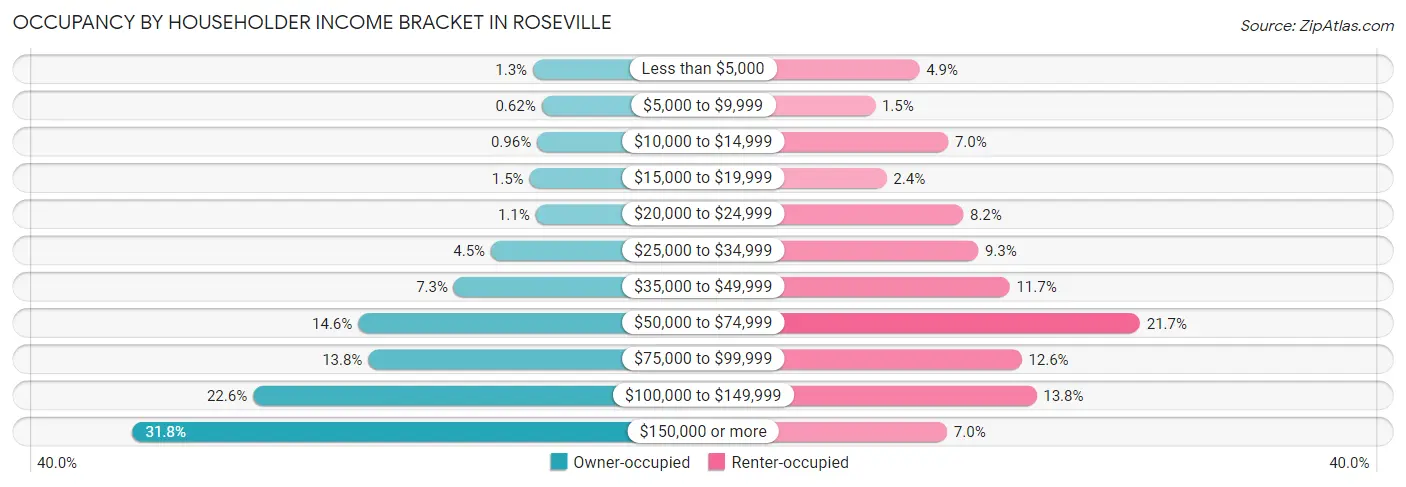
| Income Bracket | Owner-occupied | Renter-occupied |
| Less than $5,000 | 136 (1.3%) | 233 (4.9%) |
| $5,000 to $9,999 | 67 (0.6%) | 71 (1.5%) |
| $10,000 to $14,999 | 103 (1.0%) | 338 (7.0%) |
| $15,000 to $19,999 | 165 (1.5%) | 113 (2.4%) |
| $20,000 to $24,999 | 115 (1.1%) | 393 (8.2%) |
| $25,000 to $34,999 | 479 (4.5%) | 448 (9.3%) |
| $35,000 to $49,999 | 783 (7.3%) | 563 (11.7%) |
| $50,000 to $74,999 | 1,565 (14.6%) | 1,040 (21.7%) |
| $75,000 to $99,999 | 1,482 (13.8%) | 607 (12.6%) |
| $100,000 to $149,999 | 2,424 (22.6%) | 661 (13.8%) |
| $150,000 or more | 3,408 (31.8%) | 334 (7.0%) |
| Total | 10,727 (100.0%) | 4,801 (100.0%) |
Monthly Housing Cost Tiers in Roseville
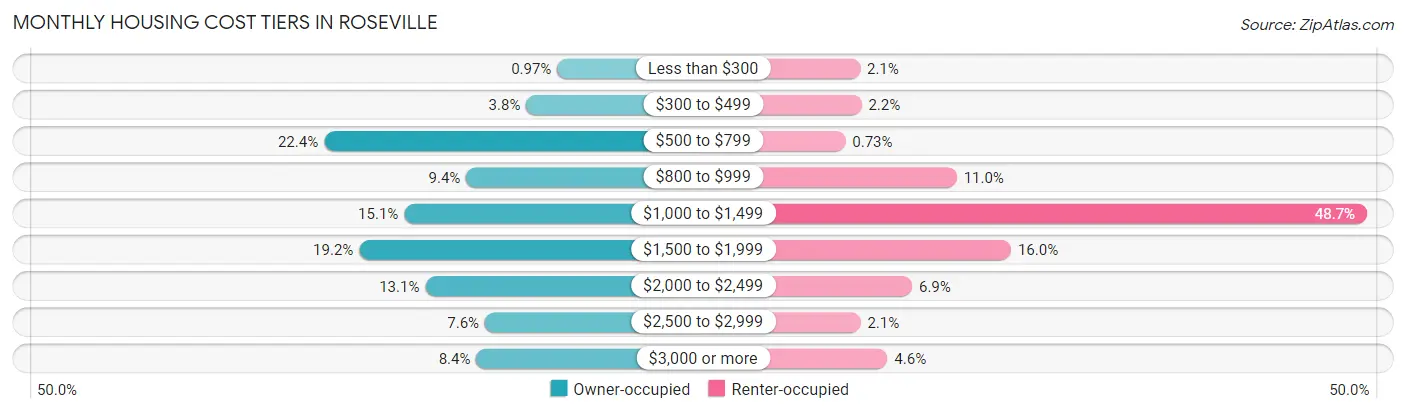
| Monthly Cost | Owner-occupied | Renter-occupied |
| Less than $300 | 104 (1.0%) | 100 (2.1%) |
| $300 to $499 | 410 (3.8%) | 106 (2.2%) |
| $500 to $799 | 2,407 (22.4%) | 35 (0.7%) |
| $800 to $999 | 1,003 (9.3%) | 527 (11.0%) |
| $1,000 to $1,499 | 1,616 (15.1%) | 2,340 (48.7%) |
| $1,500 to $1,999 | 2,060 (19.2%) | 767 (16.0%) |
| $2,000 to $2,499 | 1,407 (13.1%) | 330 (6.9%) |
| $2,500 to $2,999 | 817 (7.6%) | 102 (2.1%) |
| $3,000 or more | 903 (8.4%) | 221 (4.6%) |
| Total | 10,727 (100.0%) | 4,801 (100.0%) |
Physical Housing Characteristics in Roseville
Housing Structures in Roseville
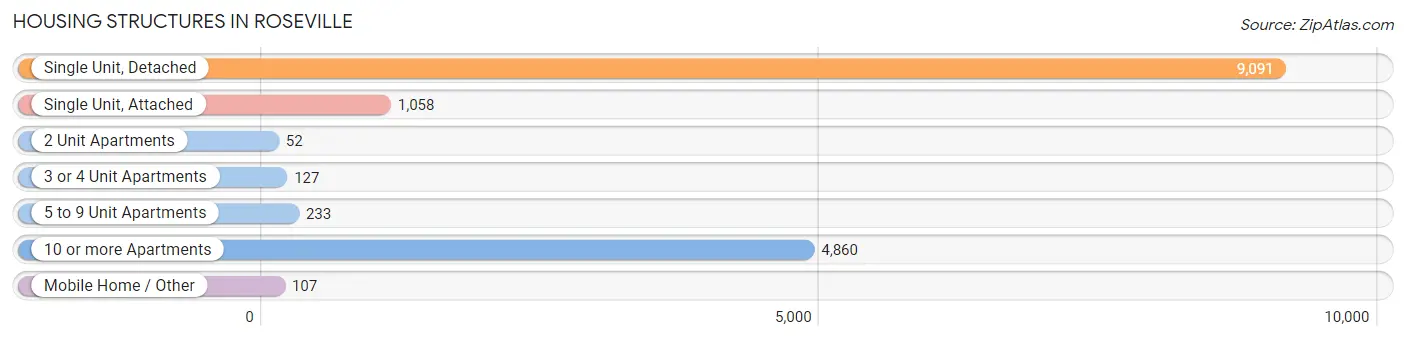
| Structure Type | # Housing Units | % Housing Units |
| Single Unit, Detached | 9,091 | 58.6% |
| Single Unit, Attached | 1,058 | 6.8% |
| 2 Unit Apartments | 52 | 0.3% |
| 3 or 4 Unit Apartments | 127 | 0.8% |
| 5 to 9 Unit Apartments | 233 | 1.5% |
| 10 or more Apartments | 4,860 | 31.3% |
| Mobile Home / Other | 107 | 0.7% |
| Total | 15,528 | 100.0% |
Housing Structures by Occupancy in Roseville
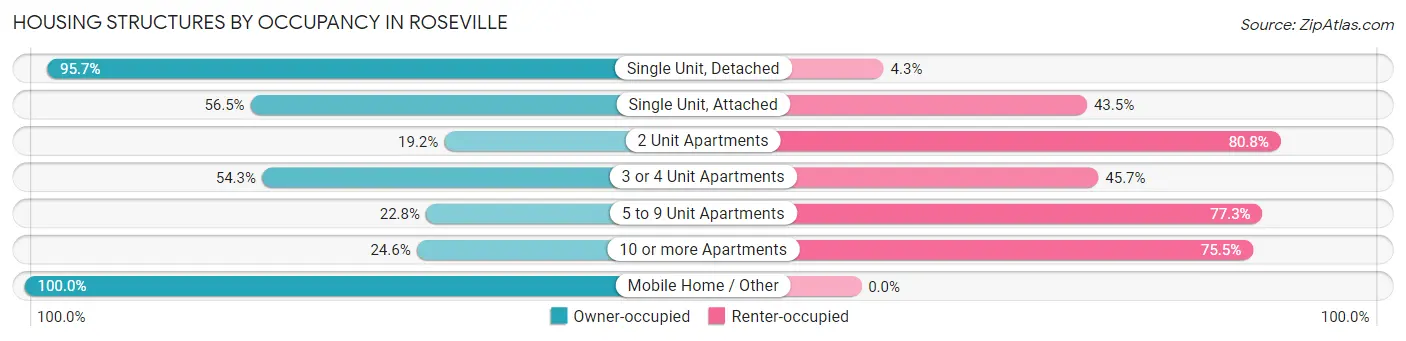
| Structure Type | Owner-occupied | Renter-occupied |
| Single Unit, Detached | 8,697 (95.7%) | 394 (4.3%) |
| Single Unit, Attached | 598 (56.5%) | 460 (43.5%) |
| 2 Unit Apartments | 10 (19.2%) | 42 (80.8%) |
| 3 or 4 Unit Apartments | 69 (54.3%) | 58 (45.7%) |
| 5 to 9 Unit Apartments | 53 (22.8%) | 180 (77.2%) |
| 10 or more Apartments | 1,193 (24.5%) | 3,667 (75.4%) |
| Mobile Home / Other | 107 (100.0%) | 0 (0.0%) |
| Total | 10,727 (69.1%) | 4,801 (30.9%) |
Housing Structures by Number of Rooms in Roseville
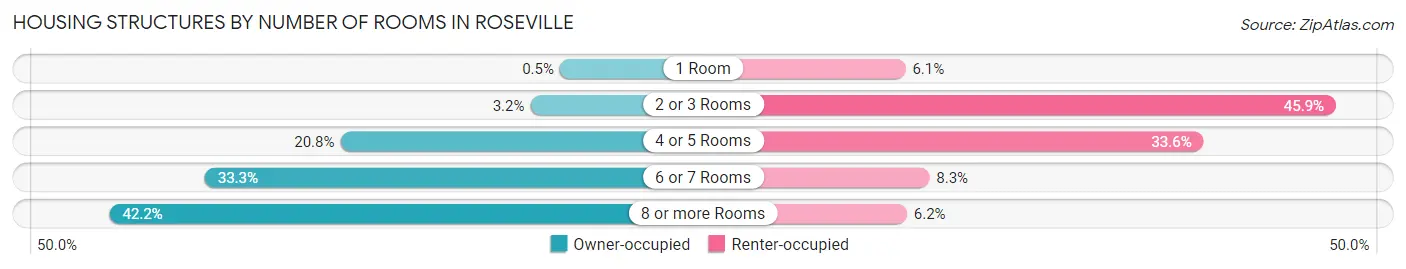
| Number of Rooms | Owner-occupied | Renter-occupied |
| 1 Room | 54 (0.5%) | 291 (6.1%) |
| 2 or 3 Rooms | 346 (3.2%) | 2,202 (45.9%) |
| 4 or 5 Rooms | 2,231 (20.8%) | 1,614 (33.6%) |
| 6 or 7 Rooms | 3,575 (33.3%) | 397 (8.3%) |
| 8 or more Rooms | 4,521 (42.1%) | 297 (6.2%) |
| Total | 10,727 (100.0%) | 4,801 (100.0%) |
Housing Structure by Heating Type in Roseville
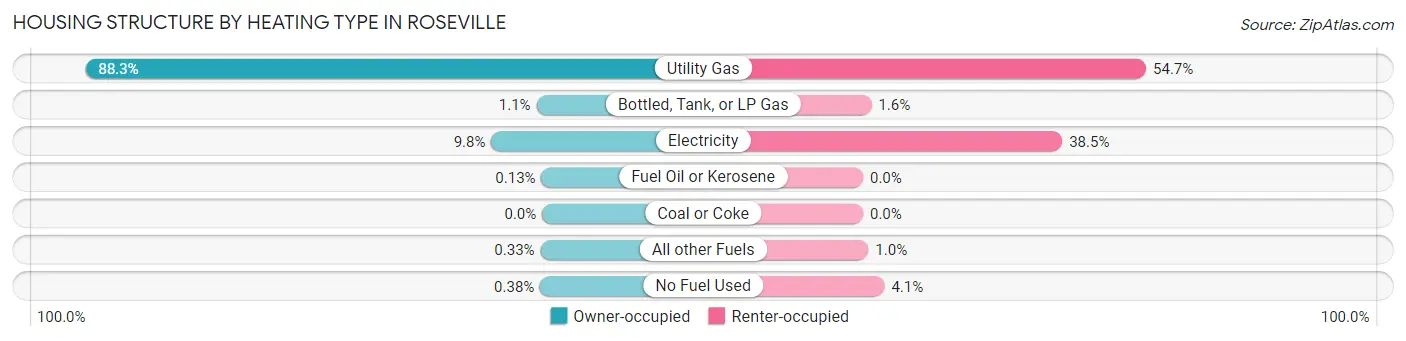
| Heating Type | Owner-occupied | Renter-occupied |
| Utility Gas | 9,468 (88.3%) | 2,626 (54.7%) |
| Bottled, Tank, or LP Gas | 117 (1.1%) | 78 (1.6%) |
| Electricity | 1,052 (9.8%) | 1,848 (38.5%) |
| Fuel Oil or Kerosene | 14 (0.1%) | 0 (0.0%) |
| Coal or Coke | 0 (0.0%) | 0 (0.0%) |
| All other Fuels | 35 (0.3%) | 50 (1.0%) |
| No Fuel Used | 41 (0.4%) | 199 (4.1%) |
| Total | 10,727 (100.0%) | 4,801 (100.0%) |
Household Vehicle Usage in Roseville
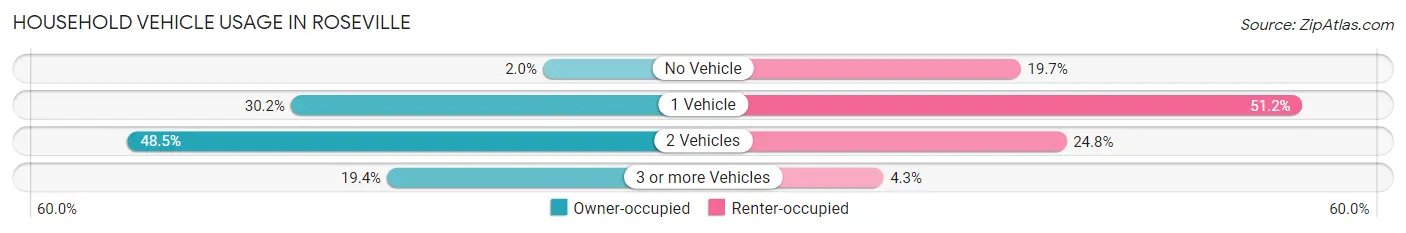
| Vehicles per Household | Owner-occupied | Renter-occupied |
| No Vehicle | 209 (1.9%) | 945 (19.7%) |
| 1 Vehicle | 3,237 (30.2%) | 2,460 (51.2%) |
| 2 Vehicles | 5,199 (48.5%) | 1,190 (24.8%) |
| 3 or more Vehicles | 2,082 (19.4%) | 206 (4.3%) |
| Total | 10,727 (100.0%) | 4,801 (100.0%) |
Real Estate & Mortgages in Roseville
Real Estate and Mortgage Overview in Roseville
| Characteristic | Without Mortgage | With Mortgage |
| Housing Units | 4,280 | 6,447 |
| Median Property Value | $289,600 | $337,700 |
| Median Household Income | $82,560 | $2,393 |
| Monthly Housing Costs | $719 | $841 |
| Real Estate Taxes | $3,830 | $5 |
Property Value by Mortgage Status in Roseville
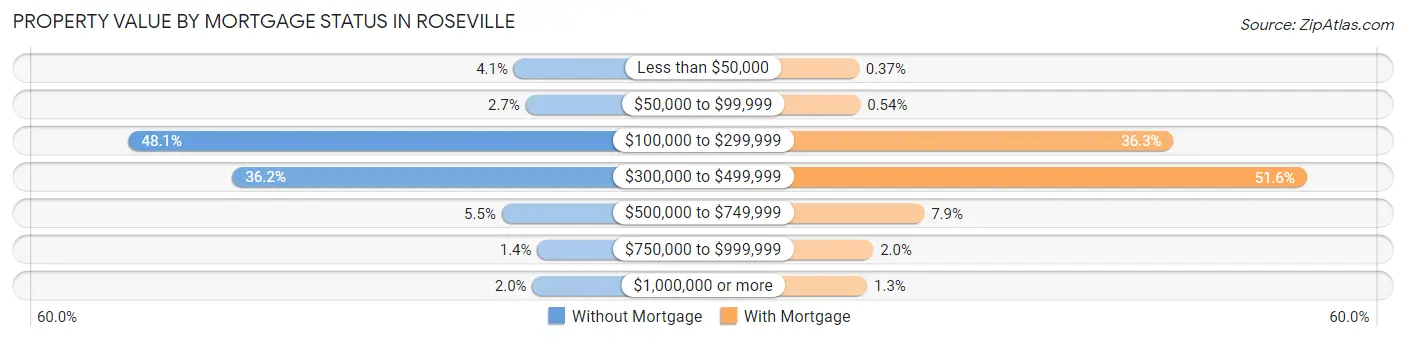
| Property Value | Without Mortgage | With Mortgage |
| Less than $50,000 | 175 (4.1%) | 24 (0.4%) |
| $50,000 to $99,999 | 117 (2.7%) | 35 (0.5%) |
| $100,000 to $299,999 | 2,059 (48.1%) | 2,342 (36.3%) |
| $300,000 to $499,999 | 1,551 (36.2%) | 3,325 (51.6%) |
| $500,000 to $749,999 | 234 (5.5%) | 506 (7.9%) |
| $750,000 to $999,999 | 60 (1.4%) | 130 (2.0%) |
| $1,000,000 or more | 84 (2.0%) | 85 (1.3%) |
| Total | 4,280 (100.0%) | 6,447 (100.0%) |
Household Income by Mortgage Status in Roseville
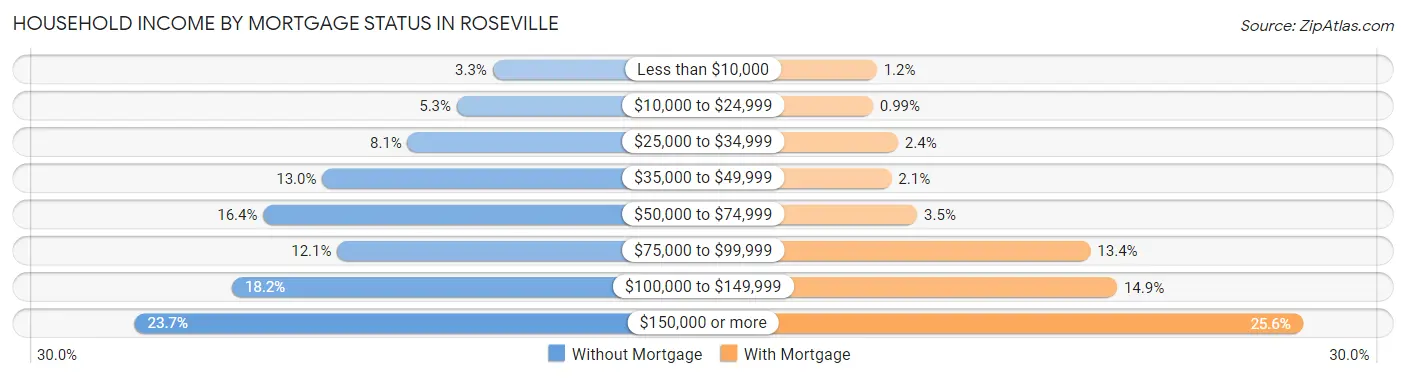
| Household Income | Without Mortgage | With Mortgage |
| Less than $10,000 | 139 (3.3%) | 78 (1.2%) |
| $10,000 to $24,999 | 227 (5.3%) | 64 (1.0%) |
| $25,000 to $34,999 | 347 (8.1%) | 156 (2.4%) |
| $35,000 to $49,999 | 556 (13.0%) | 132 (2.1%) |
| $50,000 to $74,999 | 700 (16.4%) | 227 (3.5%) |
| $75,000 to $99,999 | 519 (12.1%) | 865 (13.4%) |
| $100,000 to $149,999 | 777 (18.1%) | 963 (14.9%) |
| $150,000 or more | 1,015 (23.7%) | 1,647 (25.6%) |
| Total | 4,280 (100.0%) | 6,447 (100.0%) |
Property Value to Household Income Ratio in Roseville
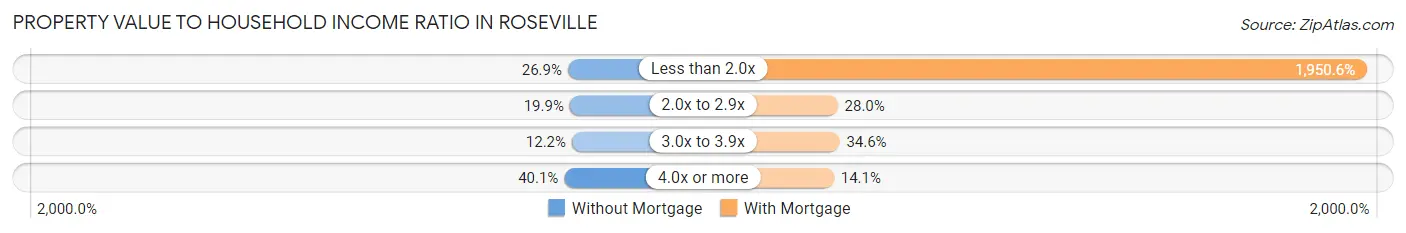
| Value-to-Income Ratio | Without Mortgage | With Mortgage |
| Less than 2.0x | 1,151 (26.9%) | 125,757 (1,950.6%) |
| 2.0x to 2.9x | 851 (19.9%) | 1,806 (28.0%) |
| 3.0x to 3.9x | 520 (12.1%) | 2,229 (34.6%) |
| 4.0x or more | 1,714 (40.1%) | 911 (14.1%) |
| Total | 4,280 (100.0%) | 6,447 (100.0%) |
Real Estate Taxes by Mortgage Status in Roseville
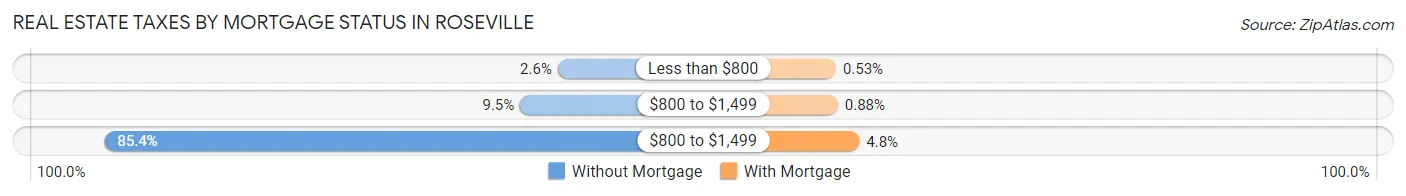
| Property Taxes | Without Mortgage | With Mortgage |
| Less than $800 | 112 (2.6%) | 34 (0.5%) |
| $800 to $1,499 | 406 (9.5%) | 57 (0.9%) |
| $800 to $1,499 | 3,656 (85.4%) | 310 (4.8%) |
| Total | 4,280 (100.0%) | 6,447 (100.0%) |
Health & Disability in Roseville
Health Insurance Coverage by Age in Roseville
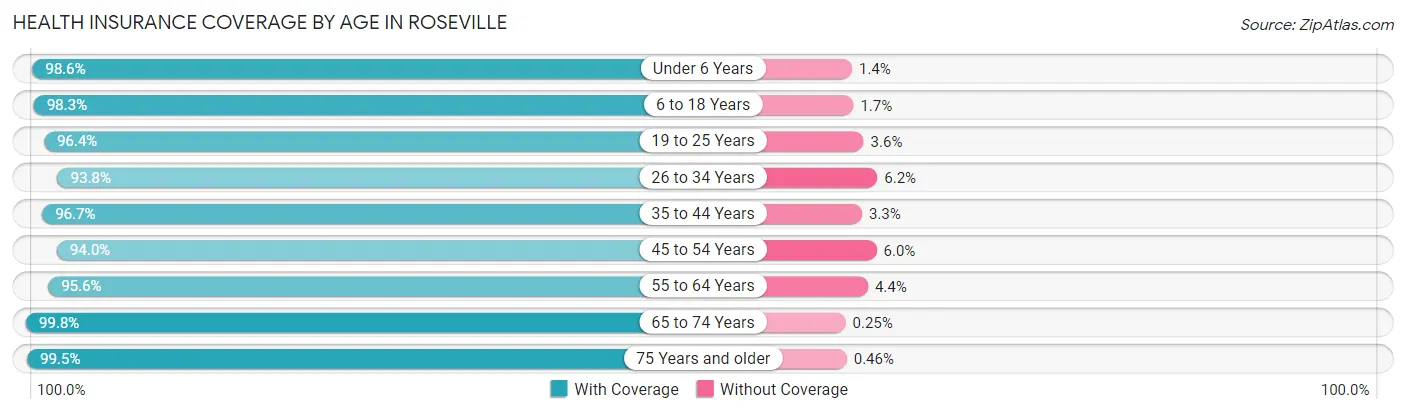
| Age Bracket | With Coverage | Without Coverage |
| Under 6 Years | 2,186 (98.6%) | 32 (1.4%) |
| 6 to 18 Years | 4,894 (98.3%) | 85 (1.7%) |
| 19 to 25 Years | 3,523 (96.4%) | 132 (3.6%) |
| 26 to 34 Years | 4,176 (93.8%) | 274 (6.2%) |
| 35 to 44 Years | 4,239 (96.7%) | 144 (3.3%) |
| 45 to 54 Years | 3,428 (94.0%) | 220 (6.0%) |
| 55 to 64 Years | 4,405 (95.6%) | 203 (4.4%) |
| 65 to 74 Years | 3,639 (99.8%) | 9 (0.3%) |
| 75 Years and older | 4,090 (99.5%) | 19 (0.5%) |
| Total | 34,580 (96.9%) | 1,118 (3.1%) |
Health Insurance Coverage by Citizenship Status in Roseville
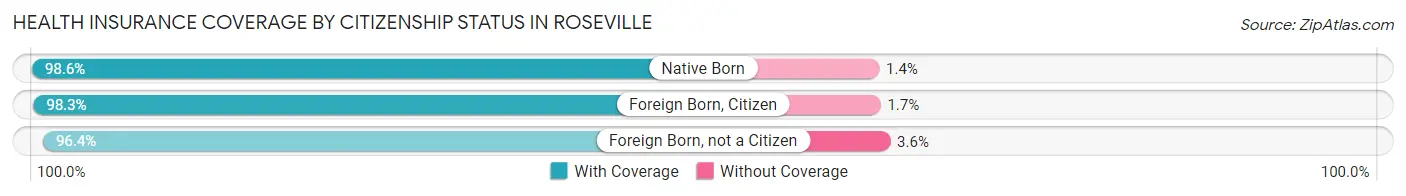
| Citizenship Status | With Coverage | Without Coverage |
| Native Born | 2,186 (98.6%) | 32 (1.4%) |
| Foreign Born, Citizen | 4,894 (98.3%) | 85 (1.7%) |
| Foreign Born, not a Citizen | 3,523 (96.4%) | 132 (3.6%) |
Health Insurance Coverage by Household Income in Roseville
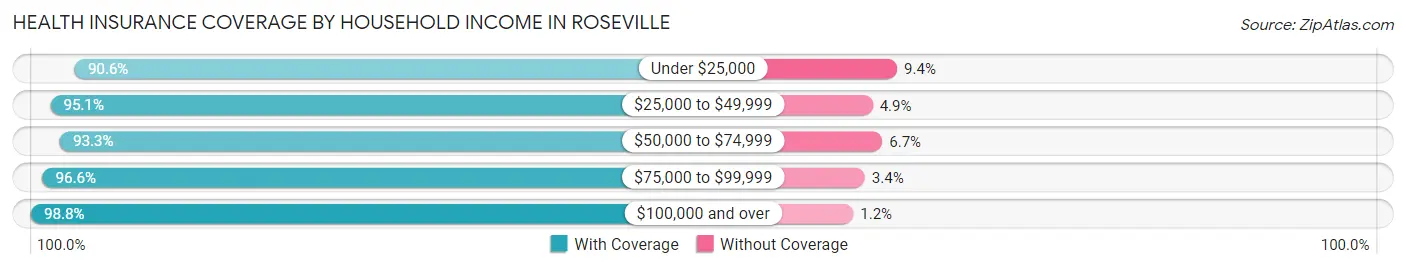
| Household Income | With Coverage | Without Coverage |
| Under $25,000 | 2,043 (90.6%) | 213 (9.4%) |
| $25,000 to $49,999 | 3,521 (95.1%) | 180 (4.9%) |
| $50,000 to $74,999 | 4,233 (93.3%) | 302 (6.7%) |
| $75,000 to $99,999 | 4,620 (96.6%) | 162 (3.4%) |
| $100,000 and over | 19,078 (98.8%) | 237 (1.2%) |
Public vs Private Health Insurance Coverage by Age in Roseville
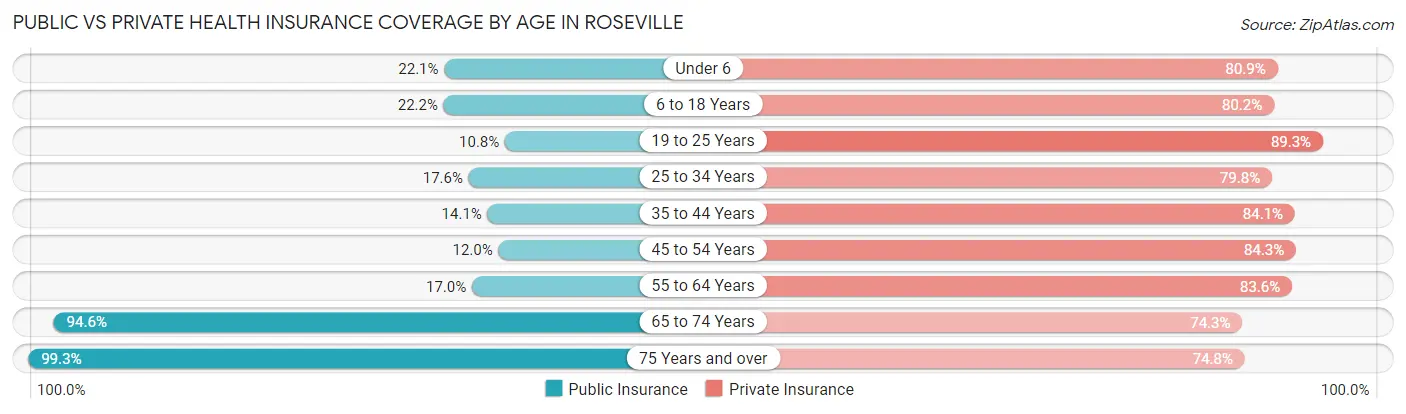
| Age Bracket | Public Insurance | Private Insurance |
| Under 6 | 490 (22.1%) | 1,794 (80.9%) |
| 6 to 18 Years | 1,105 (22.2%) | 3,994 (80.2%) |
| 19 to 25 Years | 395 (10.8%) | 3,264 (89.3%) |
| 25 to 34 Years | 781 (17.5%) | 3,553 (79.8%) |
| 35 to 44 Years | 616 (14.1%) | 3,686 (84.1%) |
| 45 to 54 Years | 439 (12.0%) | 3,076 (84.3%) |
| 55 to 64 Years | 781 (17.0%) | 3,851 (83.6%) |
| 65 to 74 Years | 3,451 (94.6%) | 2,712 (74.3%) |
| 75 Years and over | 4,081 (99.3%) | 3,073 (74.8%) |
| Total | 12,139 (34.0%) | 29,003 (81.2%) |
Disability Status by Sex by Age in Roseville
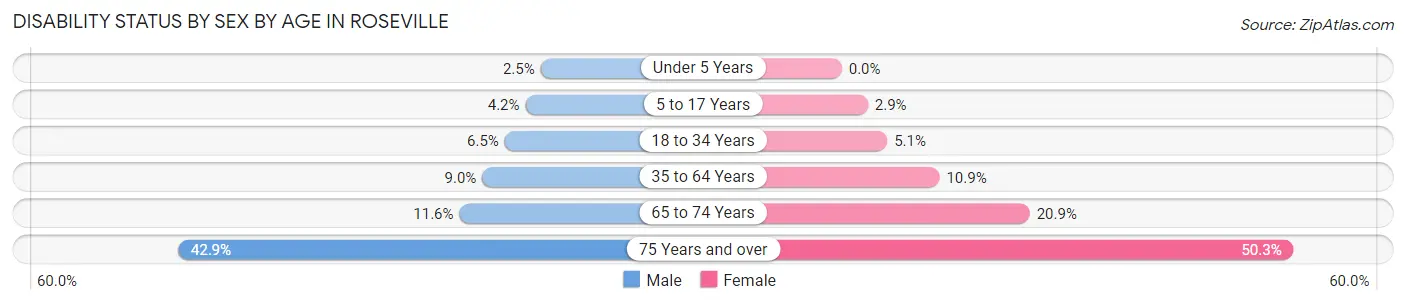
| Age Bracket | Male | Female |
| Under 5 Years | 27 (2.5%) | 0 (0.0%) |
| 5 to 17 Years | 99 (4.2%) | 64 (2.9%) |
| 18 to 34 Years | 280 (6.5%) | 227 (5.1%) |
| 35 to 64 Years | 555 (9.0%) | 707 (10.9%) |
| 65 to 74 Years | 204 (11.6%) | 395 (20.9%) |
| 75 Years and over | 698 (42.9%) | 1,249 (50.3%) |
Disability Class by Sex by Age in Roseville
Disability Class: Hearing Difficulty
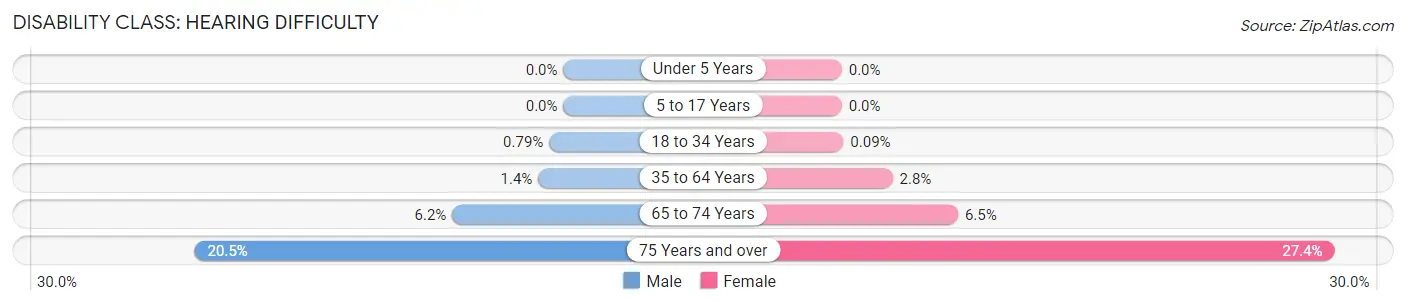
| Age Bracket | Male | Female |
| Under 5 Years | 0 (0.0%) | 0 (0.0%) |
| 5 to 17 Years | 0 (0.0%) | 0 (0.0%) |
| 18 to 34 Years | 34 (0.8%) | 4 (0.1%) |
| 35 to 64 Years | 86 (1.4%) | 184 (2.8%) |
| 65 to 74 Years | 109 (6.2%) | 122 (6.5%) |
| 75 Years and over | 334 (20.5%) | 681 (27.4%) |
Disability Class: Vision Difficulty
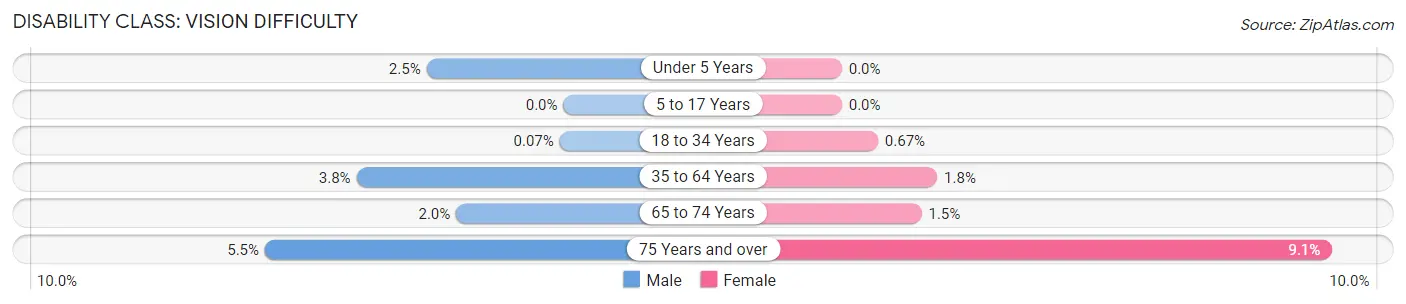
| Age Bracket | Male | Female |
| Under 5 Years | 27 (2.5%) | 0 (0.0%) |
| 5 to 17 Years | 0 (0.0%) | 0 (0.0%) |
| 18 to 34 Years | 3 (0.1%) | 30 (0.7%) |
| 35 to 64 Years | 236 (3.8%) | 115 (1.8%) |
| 65 to 74 Years | 35 (2.0%) | 28 (1.5%) |
| 75 Years and over | 90 (5.5%) | 226 (9.1%) |
Disability Class: Cognitive Difficulty
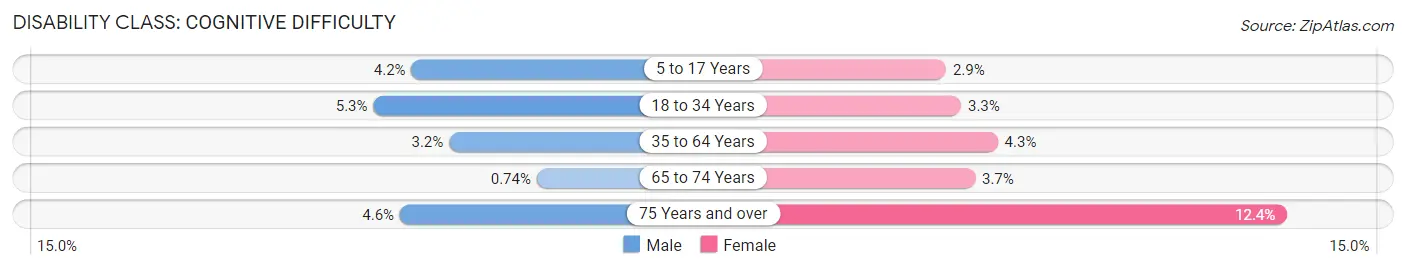
| Age Bracket | Male | Female |
| 5 to 17 Years | 99 (4.2%) | 64 (2.9%) |
| 18 to 34 Years | 227 (5.3%) | 149 (3.3%) |
| 35 to 64 Years | 195 (3.2%) | 282 (4.3%) |
| 65 to 74 Years | 13 (0.7%) | 70 (3.7%) |
| 75 Years and over | 74 (4.5%) | 308 (12.4%) |
Disability Class: Ambulatory Difficulty
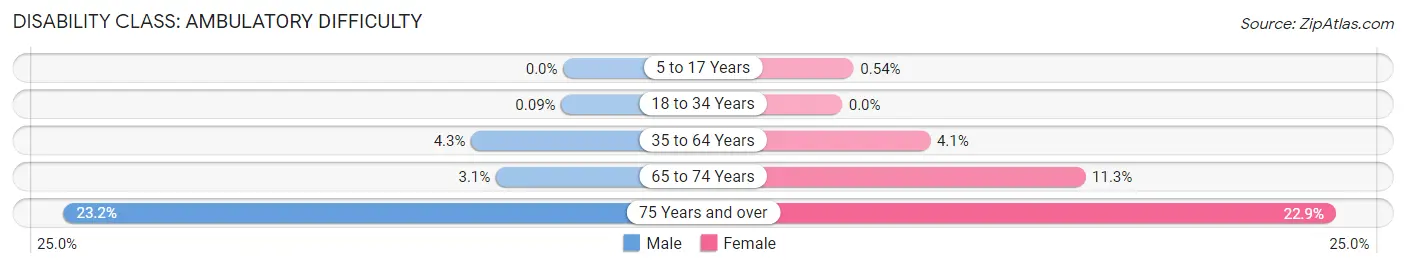
| Age Bracket | Male | Female |
| 5 to 17 Years | 0 (0.0%) | 12 (0.5%) |
| 18 to 34 Years | 4 (0.1%) | 0 (0.0%) |
| 35 to 64 Years | 262 (4.3%) | 266 (4.1%) |
| 65 to 74 Years | 55 (3.1%) | 213 (11.3%) |
| 75 Years and over | 377 (23.2%) | 569 (22.9%) |
Disability Class: Self-Care Difficulty
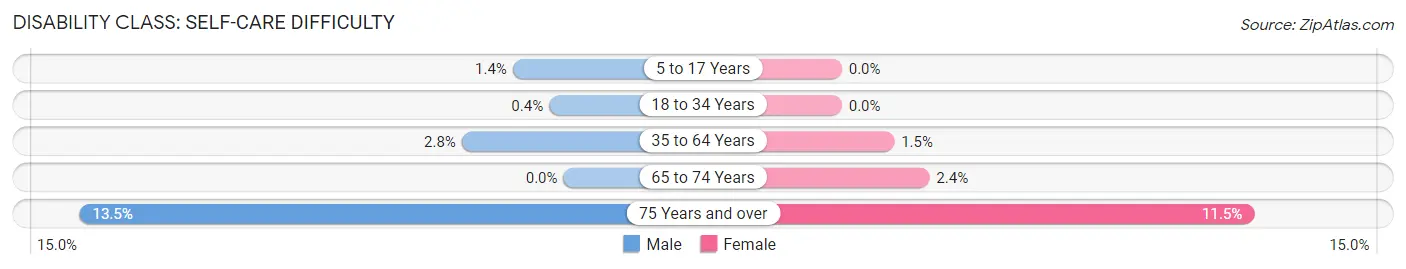
| Age Bracket | Male | Female |
| 5 to 17 Years | 33 (1.4%) | 0 (0.0%) |
| 18 to 34 Years | 17 (0.4%) | 0 (0.0%) |
| 35 to 64 Years | 174 (2.8%) | 95 (1.5%) |
| 65 to 74 Years | 0 (0.0%) | 46 (2.4%) |
| 75 Years and over | 219 (13.5%) | 285 (11.5%) |
Technology Access in Roseville
Computing Device Access in Roseville
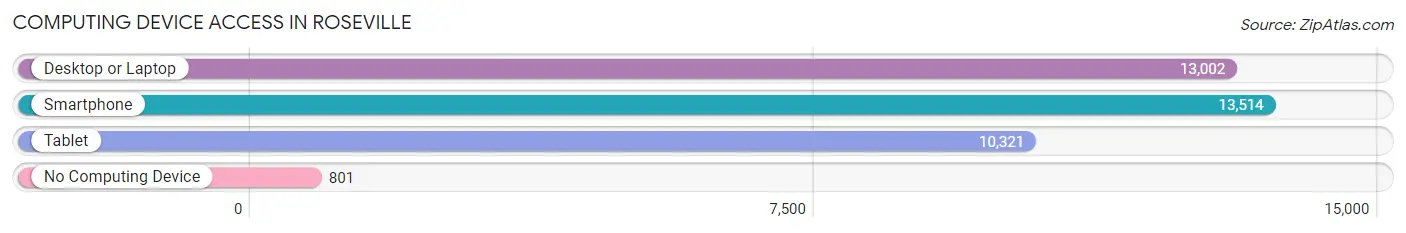
| Device Type | # Households | % Households |
| Desktop or Laptop | 13,002 | 83.7% |
| Smartphone | 13,514 | 87.0% |
| Tablet | 10,321 | 66.5% |
| No Computing Device | 801 | 5.2% |
| Total | 15,528 | 100.0% |
Internet Access in Roseville
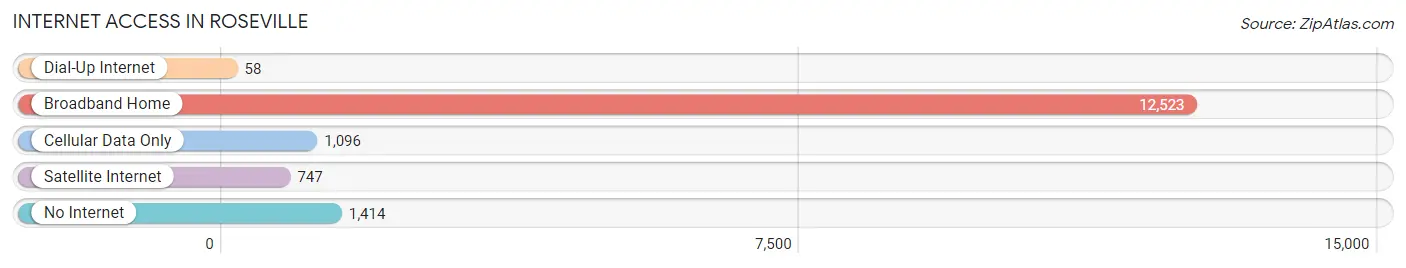
| Internet Type | # Households | % Households |
| Dial-Up Internet | 58 | 0.4% |
| Broadband Home | 12,523 | 80.6% |
| Cellular Data Only | 1,096 | 7.1% |
| Satellite Internet | 747 | 4.8% |
| No Internet | 1,414 | 9.1% |
| Total | 15,528 | 100.0% |
Roseville Summary
Roseville, Minnesota is a city located in Ramsey County, just north of the Twin Cities of Minneapolis and St. Paul. It is the second largest city in Ramsey County, with a population of 35,695 as of the 2010 census. Roseville is a vibrant and diverse community, with a rich history, diverse geography, and a strong economy.
History
The area that is now Roseville was first settled in 1843 by William and Sarah Snelling, who built a log cabin on the east bank of the Mississippi River. The Snellings named the area “Little Canada”, and it quickly became a popular destination for settlers. In 1849, the area was officially incorporated as the village of Roseville. The name was chosen to honor the Snellings’ daughter, Rose, who had died at a young age.
The village of Roseville grew steadily over the next several decades, and in 1887, it was officially incorporated as a city. The city’s population grew rapidly in the early 20th century, and by the 1950s, it had become a major suburb of the Twin Cities. In the 1960s and 1970s, the city experienced a period of rapid growth, as new housing developments and businesses were built.
Geography
Roseville is located in the northern part of Ramsey County, just north of the Twin Cities of Minneapolis and St. Paul. It is bordered by the cities of Little Canada to the north, Falcon Heights to the east, Lauderdale to the south, and Maplewood to the west. The city covers an area of 8.7 square miles, and is situated on the east bank of the Mississippi River.
The city is divided into several distinct neighborhoods, including the Central Business District, the North End, the South End, and the West End. The Central Business District is the city’s commercial center, and is home to many of the city’s businesses, restaurants, and shops. The North End is a residential area, while the South End is home to many of the city’s parks and recreational facilities. The West End is a mix of residential and commercial areas.
Economy
Roseville’s economy is largely based on retail and services. The city is home to the Rosedale Center, one of the largest shopping malls in the Twin Cities. The mall is home to over 150 stores and restaurants, and is a major economic driver for the city. Other major employers in the city include the Roseville Area Schools, the City of Roseville, and the Roseville Medical Center.
The city is also home to several corporate headquarters, including the headquarters of the Gander Mountain outdoor retail chain, the headquarters of the SuperValu grocery store chain, and the headquarters of the Deluxe Corporation.
Demographics
As of the 2010 census, Roseville had a population of 35,695. The racial makeup of the city was 79.2% White, 8.3% African American, 5.2% Asian, and 4.3% Hispanic or Latino. The median household income was $60,945, and the median family income was $76,945.
Roseville is a diverse and vibrant community, with a rich history, diverse geography, and a strong economy. It is a great place to live, work, and play, and is a great example of the Twin Cities’ vibrant and diverse culture.
Common Questions
What is Per Capita Income in Roseville?
Per Capita income in Roseville is $52,629.
What is the Median Family Income in Roseville?
Median Family Income in Roseville is $121,667.
What is the Median Household income in Roseville?
Median Household Income in Roseville is $87,702.
What is Income or Wage Gap in Roseville?
Income or Wage Gap in Roseville is 29.7%.
Women in Roseville earn 70.3 cents for every dollar earned by a man.
What is Inequality or Gini Index in Roseville?
Inequality or Gini Index in Roseville is 0.46.
What is the Total Population of Roseville?
Total Population of Roseville is 36,066.
What is the Total Male Population of Roseville?
Total Male Population of Roseville is 17,412.
What is the Total Female Population of Roseville?
Total Female Population of Roseville is 18,654.
What is the Ratio of Males per 100 Females in Roseville?
There are 93.34 Males per 100 Females in Roseville.
What is the Ratio of Females per 100 Males in Roseville?
There are 107.13 Females per 100 Males in Roseville.
What is the Median Population Age in Roseville?
Median Population Age in Roseville is 41.2 Years.
What is the Average Family Size in Roseville
Average Family Size in Roseville is 3.0 People.
What is the Average Household Size in Roseville
Average Household Size in Roseville is 2.2 People.
How Large is the Labor Force in Roseville?
There are 19,090 People in the Labor Forcein in Roseville.
What is the Percentage of People in the Labor Force in Roseville?
63.4% of People are in the Labor Force in Roseville.
What is the Unemployment Rate in Roseville?
Unemployment Rate in Roseville is 5.3%.