Arlington, TX Map & Demographics
Arlington Map
Arlington Overview
$33,477
PER CAPITA INCOME
$84,996
AVG FAMILY INCOME
$71,736
AVG HOUSEHOLD INCOME
24.1%
WAGE / INCOME GAP [ % ]
75.9¢/ $1
WAGE / INCOME GAP [ $ ]
$10,863
FAMILY INCOME DEFICIT
0.43
INEQUALITY / GINI INDEX
393,469
TOTAL POPULATION
192,765
MALE POPULATION
200,704
FEMALE POPULATION
96.04
MALES / 100 FEMALES
104.12
FEMALES / 100 MALES
33.1
MEDIAN AGE
3.5
AVG FAMILY SIZE
2.8
AVG HOUSEHOLD SIZE
214,152
LABOR FORCE [ PEOPLE ]
70.0%
PERCENT IN LABOR FORCE
5.6%
UNEMPLOYMENT RATE
Arlington Zip Codes
Income in Arlington
Income Overview in Arlington
Per Capita Income in Arlington is $33,477, while median incomes of families and households are $84,996 and $71,736 respectively.
| Characteristic | Number | Measure |
| Per Capita Income | 393,469 | $33,477 |
| Median Family Income | 92,731 | $84,996 |
| Mean Family Income | 92,731 | $106,748 |
| Median Household Income | 137,519 | $71,736 |
| Mean Household Income | 137,519 | $92,583 |
| Income Deficit | 92,731 | $10,863 |
| Wage / Income Gap (%) | 393,469 | 24.07% |
| Wage / Income Gap ($) | 393,469 | 75.93¢ per $1 |
| Gini / Inequality Index | 393,469 | 0.43 |
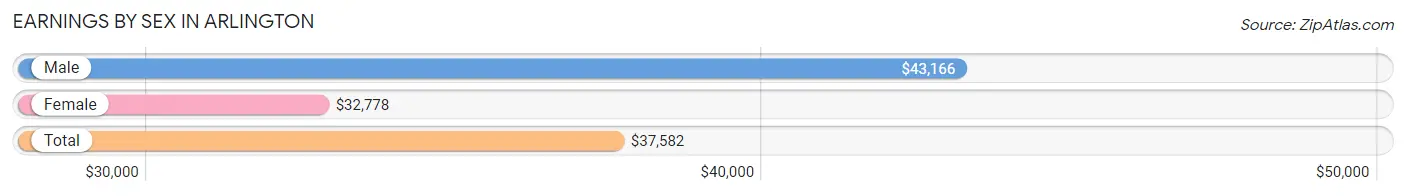
Earnings by Sex in Arlington
Average Earnings in Arlington are $37,582, $43,166 for men and $32,778 for women, a difference of 24.1%.
| Sex | Number | Average Earnings |
| Male | 115,287 (52.6%) | $43,166 |
| Female | 103,671 (47.3%) | $32,778 |
| Total | 218,958 (100.0%) | $37,582 |
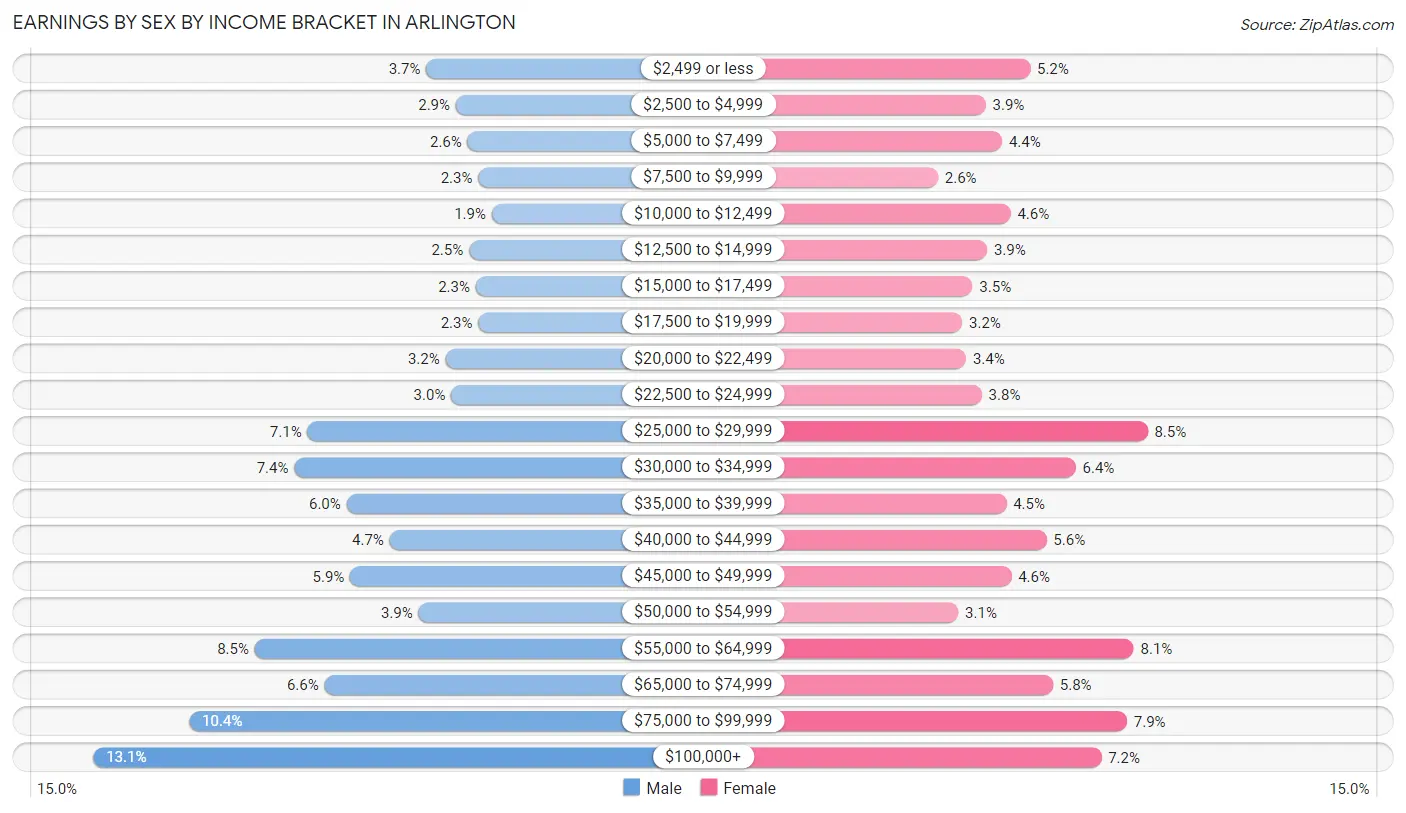
Earnings by Sex by Income Bracket in Arlington
The most common earnings brackets in Arlington are $100,000+ for men (15,066 | 13.1%) and $25,000 to $29,999 for women (8,762 | 8.5%).
| Income | Male | Female |
| $2,499 or less | 4,277 (3.7%) | 5,340 (5.1%) |
| $2,500 to $4,999 | 3,321 (2.9%) | 4,038 (3.9%) |
| $5,000 to $7,499 | 2,942 (2.5%) | 4,519 (4.4%) |
| $7,500 to $9,999 | 2,593 (2.2%) | 2,659 (2.6%) |
| $10,000 to $12,499 | 2,157 (1.9%) | 4,767 (4.6%) |
| $12,500 to $14,999 | 2,895 (2.5%) | 4,083 (3.9%) |
| $15,000 to $17,499 | 2,674 (2.3%) | 3,660 (3.5%) |
| $17,500 to $19,999 | 2,590 (2.2%) | 3,361 (3.2%) |
| $20,000 to $22,499 | 3,653 (3.2%) | 3,471 (3.4%) |
| $22,500 to $24,999 | 3,465 (3.0%) | 3,931 (3.8%) |
| $25,000 to $29,999 | 8,131 (7.0%) | 8,762 (8.5%) |
| $30,000 to $34,999 | 8,551 (7.4%) | 6,663 (6.4%) |
| $35,000 to $39,999 | 6,863 (5.9%) | 4,643 (4.5%) |
| $40,000 to $44,999 | 5,460 (4.7%) | 5,811 (5.6%) |
| $45,000 to $49,999 | 6,745 (5.9%) | 4,791 (4.6%) |
| $50,000 to $54,999 | 4,531 (3.9%) | 3,250 (3.1%) |
| $55,000 to $64,999 | 9,830 (8.5%) | 8,354 (8.1%) |
| $65,000 to $74,999 | 7,576 (6.6%) | 5,999 (5.8%) |
| $75,000 to $99,999 | 11,967 (10.4%) | 8,161 (7.9%) |
| $100,000+ | 15,066 (13.1%) | 7,408 (7.1%) |
| Total | 115,287 (100.0%) | 103,671 (100.0%) |
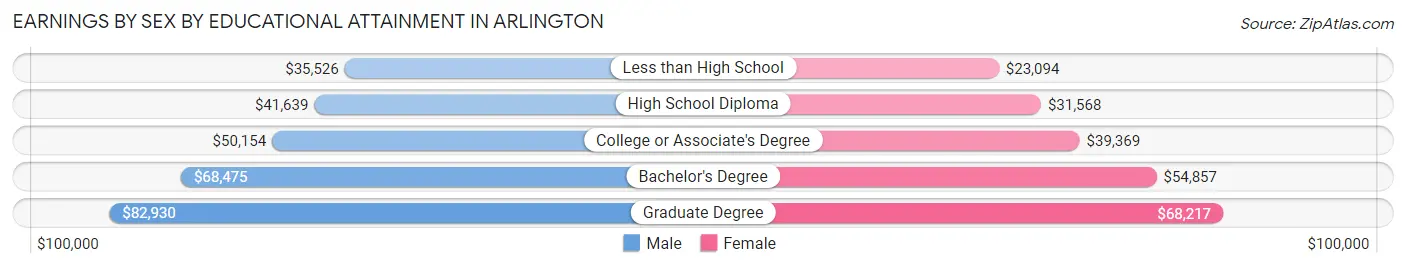
Earnings by Sex by Educational Attainment in Arlington
Average earnings in Arlington are $49,504 for men and $40,115 for women, a difference of 19.0%. Men with an educational attainment of graduate degree enjoy the highest average annual earnings of $82,930, while those with less than high school education earn the least with $35,526. Women with an educational attainment of graduate degree earn the most with the average annual earnings of $68,217, while those with less than high school education have the smallest earnings of $23,094.
| Educational Attainment | Male Income | Female Income |
| Less than High School | $35,526 | $23,094 |
| High School Diploma | $41,639 | $31,568 |
| College or Associate's Degree | $50,154 | $39,369 |
| Bachelor's Degree | $68,475 | $54,857 |
| Graduate Degree | $82,930 | $68,217 |
| Total | $49,504 | $40,115 |
Family Income in Arlington
Family Income Brackets in Arlington
According to the Arlington family income data, there are 19,752 families falling into the $100,000 to $149,999 income range, which is the most common income bracket and makes up 21.3% of all families. Conversely, the $10,000 to $14,999 income bracket is the least frequent group with only 1,669 families (1.8%) belonging to this category.
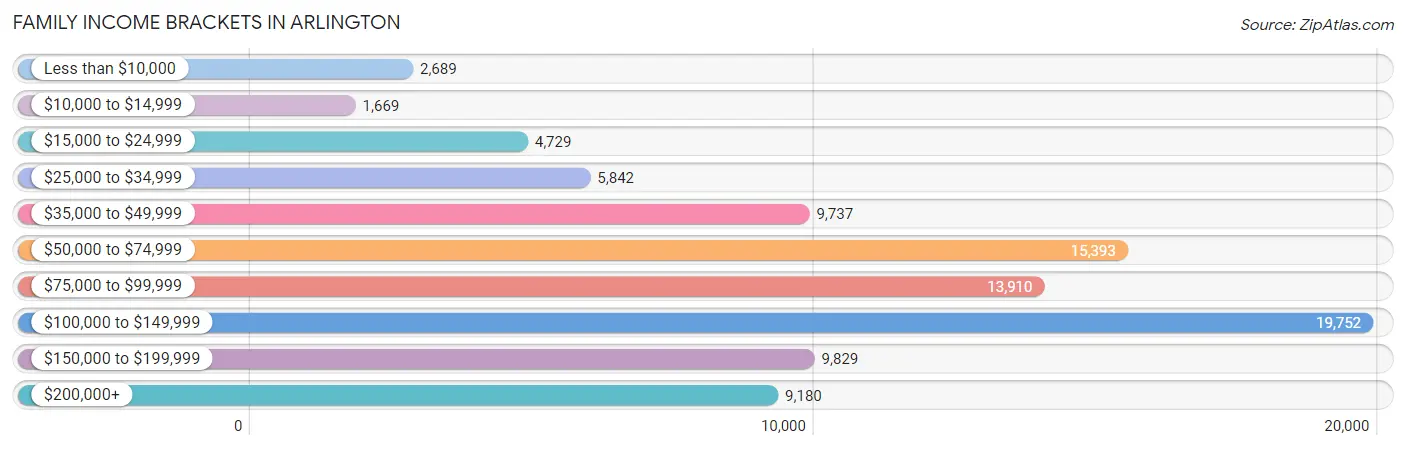
| Income Bracket | # Families | % Families |
| Less than $10,000 | 2,689 | 2.9% |
| $10,000 to $14,999 | 1,669 | 1.8% |
| $15,000 to $24,999 | 4,729 | 5.1% |
| $25,000 to $34,999 | 5,842 | 6.3% |
| $35,000 to $49,999 | 9,737 | 10.5% |
| $50,000 to $74,999 | 15,393 | 16.6% |
| $75,000 to $99,999 | 13,910 | 15.0% |
| $100,000 to $149,999 | 19,752 | 21.3% |
| $150,000 to $199,999 | 9,829 | 10.6% |
| $200,000+ | 9,180 | 9.9% |
Family Income by Famaliy Size in Arlington
7+ person families (2,630 | 2.8%) account for the highest median family income in Arlington with $100,726 per family, while 2-person families (37,611 | 40.6%) have the highest median income of $40,378 per family member.
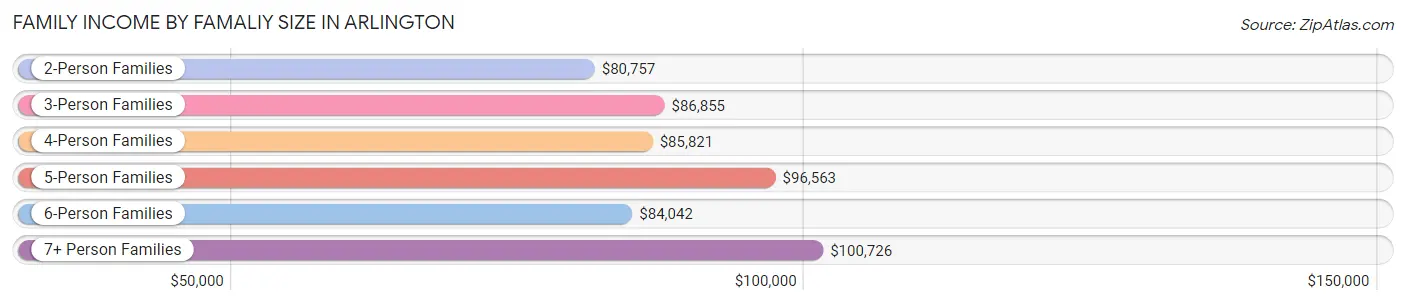
| Income Bracket | # Families | Median Income |
| 2-Person Families | 37,611 (40.6%) | $80,757 |
| 3-Person Families | 21,801 (23.5%) | $86,855 |
| 4-Person Families | 17,441 (18.8%) | $85,821 |
| 5-Person Families | 9,617 (10.4%) | $96,563 |
| 6-Person Families | 3,631 (3.9%) | $84,042 |
| 7+ Person Families | 2,630 (2.8%) | $100,726 |
| Total | 92,731 (100.0%) | $84,996 |
Family Income by Number of Earners in Arlington
The median family income in Arlington is $84,996, with families comprising 3+ earners (14,309) having the highest median family income of $132,904, while families with no earners (8,532) have the lowest median family income of $42,820, accounting for 15.4% and 9.2% of families, respectively.
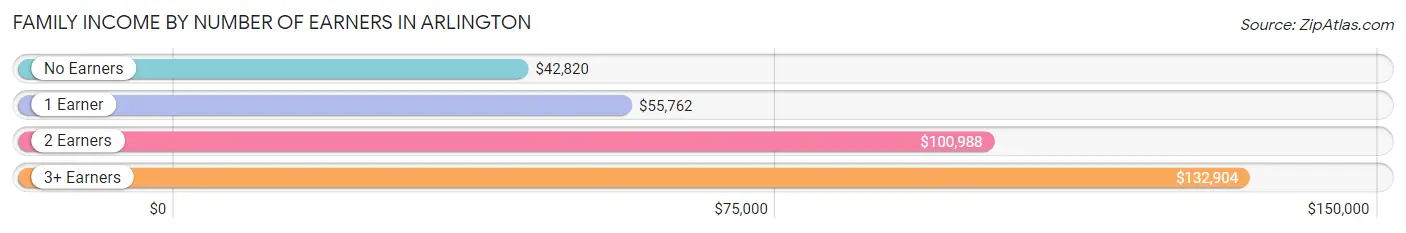
| Number of Earners | # Families | Median Income |
| No Earners | 8,532 (9.2%) | $42,820 |
| 1 Earner | 31,462 (33.9%) | $55,762 |
| 2 Earners | 38,428 (41.4%) | $100,988 |
| 3+ Earners | 14,309 (15.4%) | $132,904 |
| Total | 92,731 (100.0%) | $84,996 |
Household Income in Arlington
Household Income Brackets in Arlington
With 24,891 households falling in the category, the $100,000 to $149,999 income range is the most frequent in Arlington, accounting for 18.1% of all households. In contrast, only 3,575 households (2.6%) fall into the $10,000 to $14,999 income bracket, making it the least populous group.
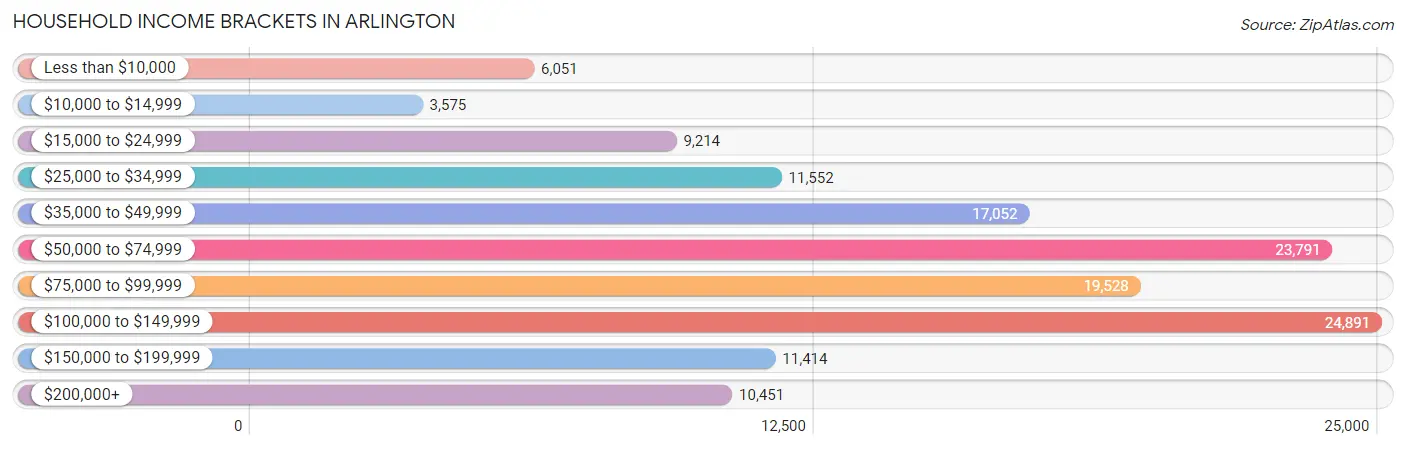
| Income Bracket | # Households | % Households |
| Less than $10,000 | 6,051 | 4.4% |
| $10,000 to $14,999 | 3,575 | 2.6% |
| $15,000 to $24,999 | 9,214 | 6.7% |
| $25,000 to $34,999 | 11,552 | 8.4% |
| $35,000 to $49,999 | 17,052 | 12.4% |
| $50,000 to $74,999 | 23,791 | 17.3% |
| $75,000 to $99,999 | 19,528 | 14.2% |
| $100,000 to $149,999 | 24,891 | 18.1% |
| $150,000 to $199,999 | 11,414 | 8.3% |
| $200,000+ | 10,451 | 7.6% |
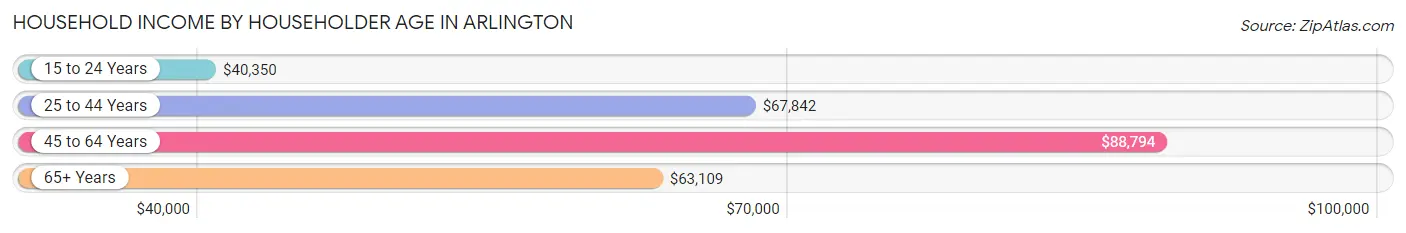
Household Income by Householder Age in Arlington
The median household income in Arlington is $71,736, with the highest median household income of $88,794 found in the 45 to 64 years age bracket for the primary householder. A total of 50,640 households (36.8%) fall into this category. Meanwhile, the 15 to 24 years age bracket for the primary householder has the lowest median household income of $40,350, with 7,291 households (5.3%) in this group.
| Income Bracket | # Households | Median Income |
| 15 to 24 Years | 7,291 (5.3%) | $40,350 |
| 25 to 44 Years | 53,732 (39.1%) | $67,842 |
| 45 to 64 Years | 50,640 (36.8%) | $88,794 |
| 65+ Years | 25,856 (18.8%) | $63,109 |
| Total | 137,519 (100.0%) | $71,736 |
Poverty in Arlington
Income Below Poverty by Sex and Age in Arlington
With 12.0% poverty level for males and 14.0% for females among the residents of Arlington, under 5 year old males and under 5 year old females are the most vulnerable to poverty, with 2,792 males (22.8%) and 2,983 females (23.7%) in their respective age groups living below the poverty level.
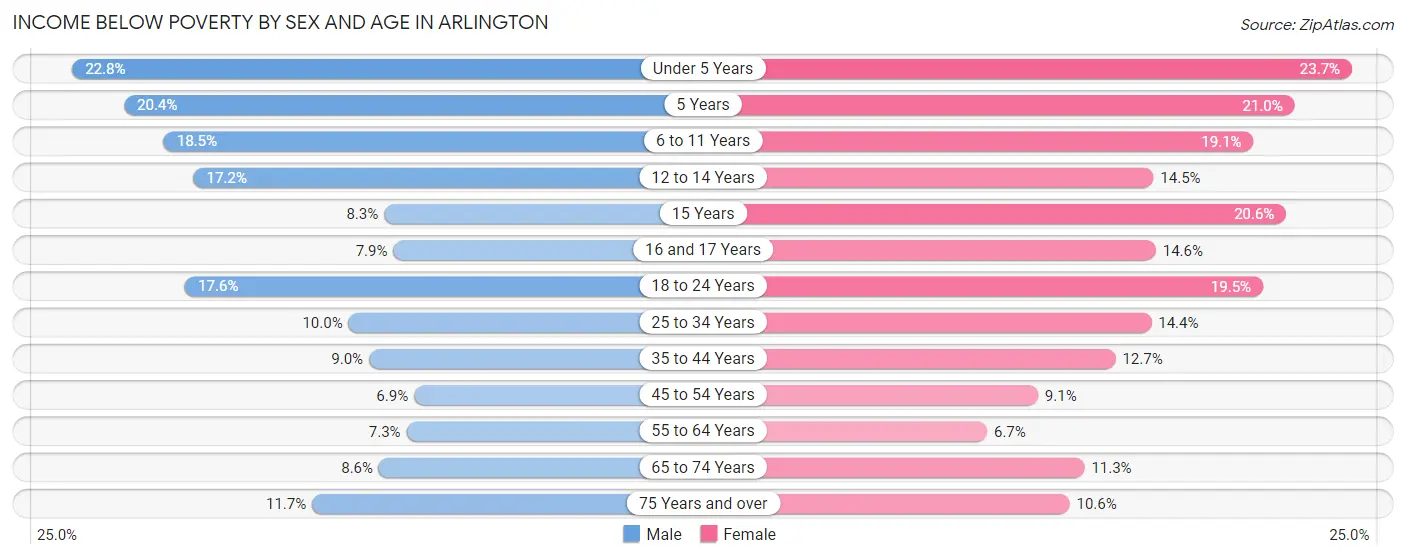
| Age Bracket | Male | Female |
| Under 5 Years | 2,792 (22.8%) | 2,983 (23.7%) |
| 5 Years | 659 (20.4%) | 466 (21.0%) |
| 6 to 11 Years | 3,329 (18.5%) | 3,008 (19.1%) |
| 12 to 14 Years | 1,391 (17.2%) | 1,214 (14.5%) |
| 15 Years | 233 (8.3%) | 542 (20.6%) |
| 16 and 17 Years | 462 (7.9%) | 900 (14.6%) |
| 18 to 24 Years | 3,673 (17.5%) | 4,280 (19.5%) |
| 25 to 34 Years | 3,172 (10.0%) | 4,277 (14.4%) |
| 35 to 44 Years | 2,206 (9.0%) | 3,481 (12.7%) |
| 45 to 54 Years | 1,618 (6.9%) | 2,226 (9.1%) |
| 55 to 64 Years | 1,472 (7.3%) | 1,471 (6.7%) |
| 65 to 74 Years | 1,125 (8.6%) | 1,659 (11.3%) |
| 75 Years and over | 734 (11.7%) | 938 (10.6%) |
| Total | 22,866 (12.0%) | 27,445 (14.0%) |
Income Above Poverty by Sex and Age in Arlington
According to the poverty statistics in Arlington, males aged 45 to 54 years and females aged 55 to 64 years are the age groups that are most secure financially, with 93.1% of males and 93.3% of females in these age groups living above the poverty line.
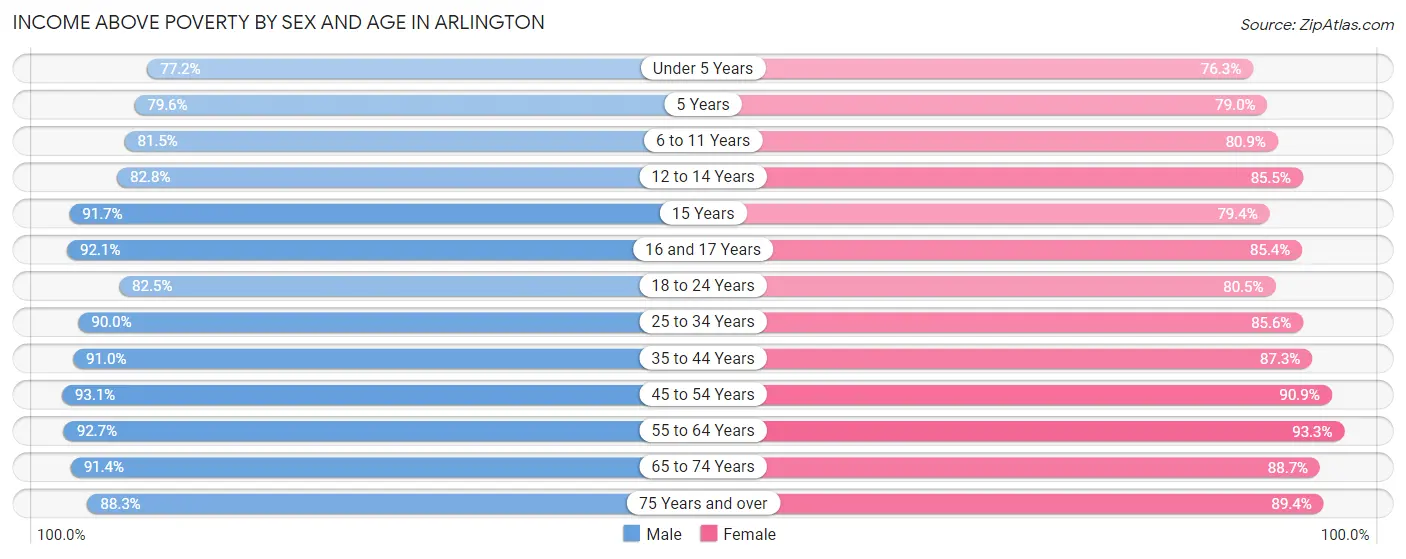
| Age Bracket | Male | Female |
| Under 5 Years | 9,459 (77.2%) | 9,620 (76.3%) |
| 5 Years | 2,575 (79.6%) | 1,752 (79.0%) |
| 6 to 11 Years | 14,626 (81.5%) | 12,744 (80.9%) |
| 12 to 14 Years | 6,713 (82.8%) | 7,181 (85.5%) |
| 15 Years | 2,566 (91.7%) | 2,086 (79.4%) |
| 16 and 17 Years | 5,394 (92.1%) | 5,275 (85.4%) |
| 18 to 24 Years | 17,255 (82.5%) | 17,623 (80.5%) |
| 25 to 34 Years | 28,639 (90.0%) | 25,511 (85.6%) |
| 35 to 44 Years | 22,260 (91.0%) | 23,933 (87.3%) |
| 45 to 54 Years | 21,734 (93.1%) | 22,234 (90.9%) |
| 55 to 64 Years | 18,737 (92.7%) | 20,348 (93.3%) |
| 65 to 74 Years | 12,015 (91.4%) | 13,074 (88.7%) |
| 75 Years and over | 5,559 (88.3%) | 7,935 (89.4%) |
| Total | 167,532 (88.0%) | 169,316 (86.1%) |
Income Below Poverty Among Married-Couple Families in Arlington
The poverty statistics for married-couple families in Arlington show that 6.0% or 3,876 of the total 64,056 families live below the poverty line. Families with 5 or more children have the highest poverty rate of 37.2%, comprising of 309 families. On the other hand, families with no children have the lowest poverty rate of 4.2%, which includes 1,420 families.
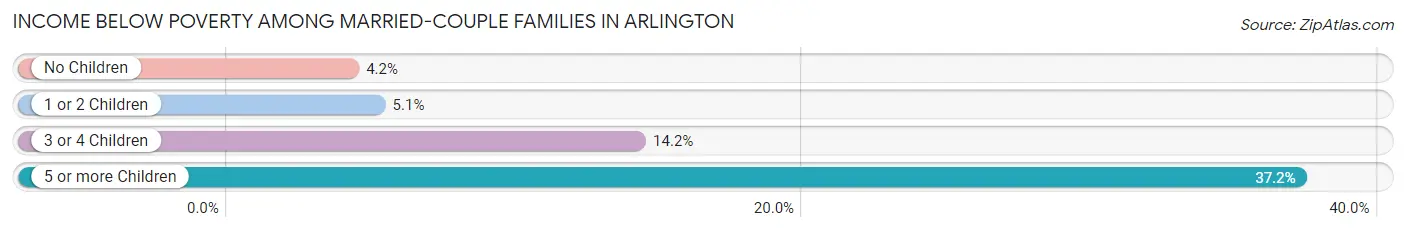
| Children | Above Poverty | Below Poverty |
| No Children | 32,212 (95.8%) | 1,420 (4.2%) |
| 1 or 2 Children | 21,526 (94.9%) | 1,166 (5.1%) |
| 3 or 4 Children | 5,921 (85.8%) | 981 (14.2%) |
| 5 or more Children | 521 (62.8%) | 309 (37.2%) |
| Total | 60,180 (94.0%) | 3,876 (6.0%) |
Income Below Poverty Among Single-Parent Households in Arlington
According to the poverty data in Arlington, 15.1% or 1,154 single-father households and 19.6% or 4,129 single-mother households are living below the poverty line. Among single-father households, those with 5 or more children have the highest poverty rate, with 16 households (34.0%) experiencing poverty. Likewise, among single-mother households, those with 5 or more children have the highest poverty rate, with 172 households (67.7%) falling below the poverty line.
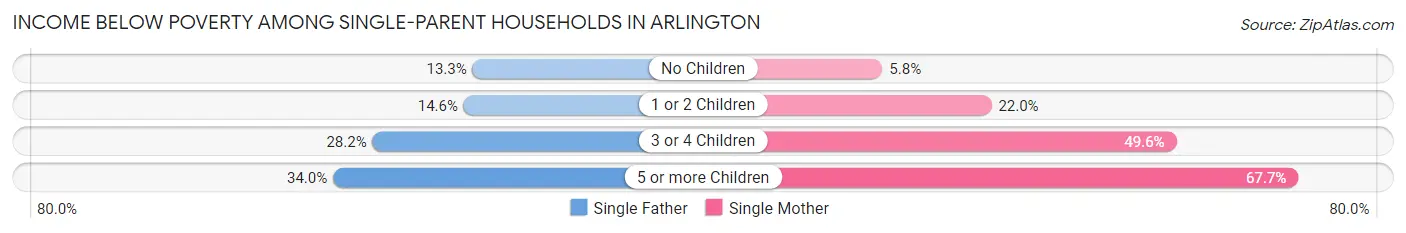
| Children | Single Father | Single Mother |
| No Children | 464 (13.3%) | 454 (5.8%) |
| 1 or 2 Children | 509 (14.5%) | 2,318 (22.0%) |
| 3 or 4 Children | 165 (28.2%) | 1,185 (49.6%) |
| 5 or more Children | 16 (34.0%) | 172 (67.7%) |
| Total | 1,154 (15.1%) | 4,129 (19.6%) |
Income Below Poverty Among Married-Couple vs Single-Parent Households in Arlington
The poverty data for Arlington shows that 3,876 of the married-couple family households (6.0%) and 5,283 of the single-parent households (18.4%) are living below the poverty level. Within the married-couple family households, those with 5 or more children have the highest poverty rate, with 309 households (37.2%) falling below the poverty line. Among the single-parent households, those with 5 or more children have the highest poverty rate, with 188 household (62.5%) living below poverty.
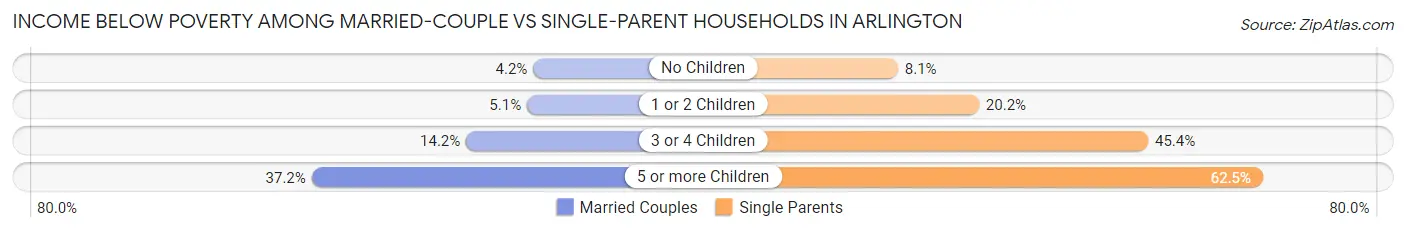
| Children | Married-Couple Families | Single-Parent Households |
| No Children | 1,420 (4.2%) | 918 (8.1%) |
| 1 or 2 Children | 1,166 (5.1%) | 2,827 (20.2%) |
| 3 or 4 Children | 981 (14.2%) | 1,350 (45.4%) |
| 5 or more Children | 309 (37.2%) | 188 (62.5%) |
| Total | 3,876 (6.0%) | 5,283 (18.4%) |
Race in Arlington
The most populous races in Arlington are White / Caucasian (184,657 | 46.9%), Hispanic or Latino (117,877 | 30.0%), and Black / African American (89,659 | 22.8%).
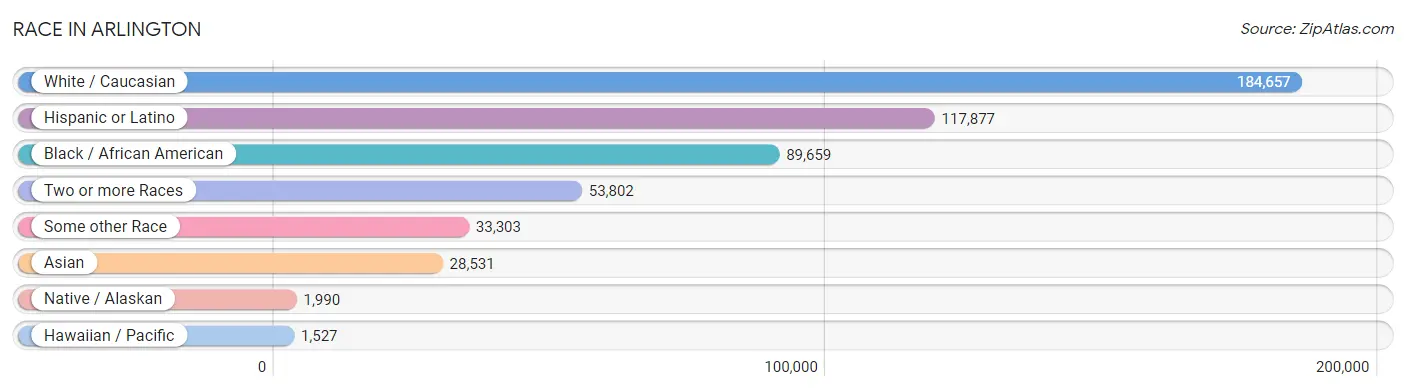
| Race | # Population | % Population |
| Asian | 28,531 | 7.2% |
| Black / African American | 89,659 | 22.8% |
| Hawaiian / Pacific | 1,527 | 0.4% |
| Hispanic or Latino | 117,877 | 30.0% |
| Native / Alaskan | 1,990 | 0.5% |
| White / Caucasian | 184,657 | 46.9% |
| Two or more Races | 53,802 | 13.7% |
| Some other Race | 33,303 | 8.5% |
| Total | 393,469 | 100.0% |
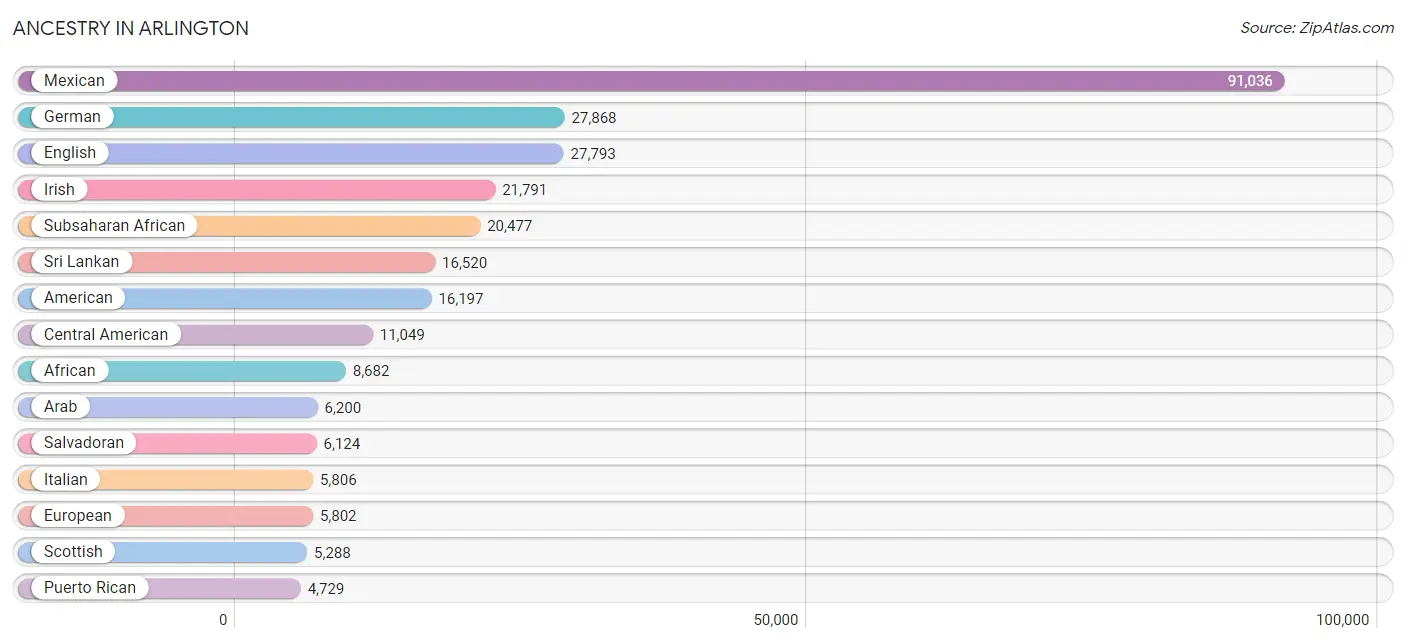
Ancestry in Arlington
The most populous ancestries reported in Arlington are Mexican (91,036 | 23.1%), German (27,868 | 7.1%), English (27,793 | 7.1%), Irish (21,791 | 5.5%), and Subsaharan African (20,477 | 5.2%), together accounting for 48.0% of all Arlington residents.
| Ancestry | # Population | % Population |
| Afghan | 71 | 0.0% |
| African | 8,682 | 2.2% |
| Alaska Native | 46 | 0.0% |
| Albanian | 97 | 0.0% |
| American | 16,197 | 4.1% |
| Apache | 108 | 0.0% |
| Arab | 6,200 | 1.6% |
| Arapaho | 103 | 0.0% |
| Argentinean | 101 | 0.0% |
| Armenian | 34 | 0.0% |
| Assyrian / Chaldean / Syriac | 10 | 0.0% |
| Australian | 23 | 0.0% |
| Austrian | 221 | 0.1% |
| Barbadian | 37 | 0.0% |
| Basque | 332 | 0.1% |
| Belgian | 98 | 0.0% |
| Belizean | 188 | 0.1% |
| Bhutanese | 648 | 0.2% |
| Blackfeet | 110 | 0.0% |
| Bolivian | 19 | 0.0% |
| Brazilian | 240 | 0.1% |
| British | 2,413 | 0.6% |
| British West Indian | 118 | 0.0% |
| Bulgarian | 72 | 0.0% |
| Burmese | 1,253 | 0.3% |
| Cajun | 201 | 0.1% |
| Canadian | 306 | 0.1% |
| Carpatho Rusyn | 21 | 0.0% |
| Celtic | 20 | 0.0% |
| Central American | 11,049 | 2.8% |
| Central American Indian | 659 | 0.2% |
| Cherokee | 945 | 0.2% |
| Chickasaw | 54 | 0.0% |
| Chilean | 25 | 0.0% |
| Chippewa | 8 | 0.0% |
| Choctaw | 836 | 0.2% |
| Colombian | 1,406 | 0.4% |
| Comanche | 71 | 0.0% |
| Costa Rican | 116 | 0.0% |
| Creek | 53 | 0.0% |
| Croatian | 199 | 0.1% |
| Crow | 29 | 0.0% |
| Cuban | 1,859 | 0.5% |
| Cypriot | 19 | 0.0% |
| Czech | 1,526 | 0.4% |
| Czechoslovakian | 181 | 0.1% |
| Danish | 643 | 0.2% |
| Dominican | 457 | 0.1% |
| Dutch | 1,599 | 0.4% |
| Dutch West Indian | 12 | 0.0% |
| Eastern European | 245 | 0.1% |
| Ecuadorian | 585 | 0.2% |
| Egyptian | 158 | 0.0% |
| English | 27,793 | 7.1% |
| Estonian | 34 | 0.0% |
| Ethiopian | 131 | 0.0% |
| European | 5,802 | 1.5% |
| Filipino | 307 | 0.1% |
| Finnish | 264 | 0.1% |
| French | 4,328 | 1.1% |
| French Canadian | 437 | 0.1% |
| German | 27,868 | 7.1% |
| Ghanaian | 1,599 | 0.4% |
| Greek | 431 | 0.1% |
| Guamanian / Chamorro | 742 | 0.2% |
| Guatemalan | 1,630 | 0.4% |
| Guyanese | 55 | 0.0% |
| Haitian | 495 | 0.1% |
| Honduran | 2,376 | 0.6% |
| Hungarian | 409 | 0.1% |
| Icelander | 8 | 0.0% |
| Indian (Asian) | 2,231 | 0.6% |
| Indonesian | 97 | 0.0% |
| Iranian | 1,075 | 0.3% |
| Iraqi | 1,090 | 0.3% |
| Irish | 21,791 | 5.5% |
| Iroquois | 16 | 0.0% |
| Israeli | 38 | 0.0% |
| Italian | 5,806 | 1.5% |
| Jamaican | 429 | 0.1% |
| Japanese | 140 | 0.0% |
| Jordanian | 1,945 | 0.5% |
| Kenyan | 1,226 | 0.3% |
| Kiowa | 8 | 0.0% |
| Korean | 2,859 | 0.7% |
| Laotian | 197 | 0.1% |
| Latvian | 33 | 0.0% |
| Lebanese | 558 | 0.1% |
| Liberian | 725 | 0.2% |
| Lithuanian | 160 | 0.0% |
| Lumbee | 10 | 0.0% |
| Luxembourger | 9 | 0.0% |
| Macedonian | 59 | 0.0% |
| Malaysian | 409 | 0.1% |
| Mexican | 91,036 | 23.1% |
| Mexican American Indian | 610 | 0.2% |
| Mongolian | 242 | 0.1% |
| Moroccan | 258 | 0.1% |
| Native Hawaiian | 229 | 0.1% |
| Navajo | 152 | 0.0% |
| Nicaraguan | 362 | 0.1% |
| Nigerian | 4,521 | 1.1% |
| Northern European | 484 | 0.1% |
| Norwegian | 1,869 | 0.5% |
| Osage | 24 | 0.0% |
| Ottawa | 31 | 0.0% |
| Pakistani | 131 | 0.0% |
| Palestinian | 405 | 0.1% |
| Panamanian | 441 | 0.1% |
| Peruvian | 474 | 0.1% |
| Polish | 2,731 | 0.7% |
| Portuguese | 445 | 0.1% |
| Potawatomi | 23 | 0.0% |
| Pueblo | 23 | 0.0% |
| Puerto Rican | 4,729 | 1.2% |
| Romanian | 150 | 0.0% |
| Russian | 629 | 0.2% |
| Salvadoran | 6,124 | 1.6% |
| Samoan | 148 | 0.0% |
| Scandinavian | 535 | 0.1% |
| Scotch-Irish | 2,554 | 0.6% |
| Scottish | 5,288 | 1.3% |
| Seminole | 31 | 0.0% |
| Senegalese | 43 | 0.0% |
| Serbian | 26 | 0.0% |
| Sioux | 84 | 0.0% |
| Slavic | 163 | 0.0% |
| Slovak | 176 | 0.0% |
| Slovene | 64 | 0.0% |
| Somali | 711 | 0.2% |
| South American | 3,041 | 0.8% |
| South American Indian | 9 | 0.0% |
| Spaniard | 1,121 | 0.3% |
| Spanish | 1,268 | 0.3% |
| Spanish American | 12 | 0.0% |
| Sri Lankan | 16,520 | 4.2% |
| Subsaharan African | 20,477 | 5.2% |
| Sudanese | 503 | 0.1% |
| Swedish | 1,929 | 0.5% |
| Swiss | 343 | 0.1% |
| Syrian | 91 | 0.0% |
| Thai | 4,205 | 1.1% |
| Tongan | 653 | 0.2% |
| Trinidadian and Tobagonian | 175 | 0.0% |
| Turkish | 328 | 0.1% |
| U.S. Virgin Islander | 72 | 0.0% |
| Ugandan | 161 | 0.0% |
| Ukrainian | 408 | 0.1% |
| Uruguayan | 127 | 0.0% |
| Venezuelan | 262 | 0.1% |
| Vietnamese | 351 | 0.1% |
| Welsh | 1,070 | 0.3% |
| West Indian | 181 | 0.1% |
| Yaqui | 77 | 0.0% |
| Yugoslavian | 8 | 0.0% |
| Zimbabwean | 14 | 0.0% | View All 156 Rows |
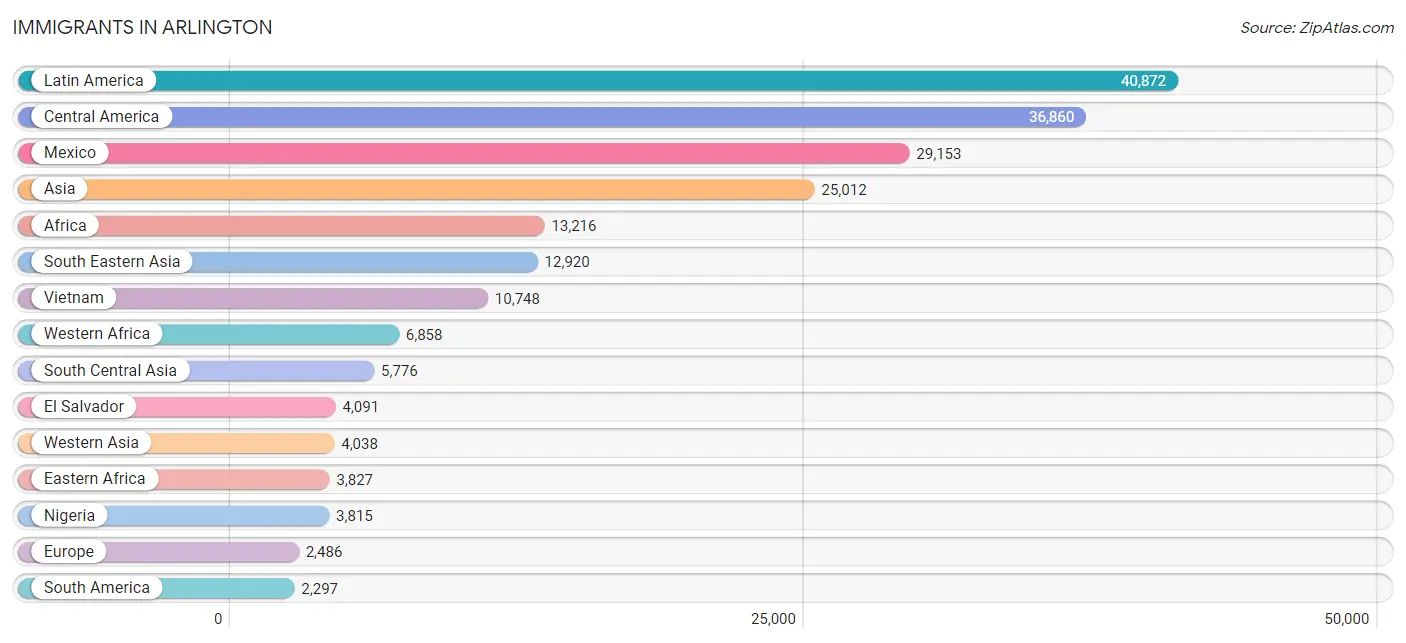
Immigrants in Arlington
The most numerous immigrant groups reported in Arlington came from Latin America (40,872 | 10.4%), Central America (36,860 | 9.4%), Mexico (29,153 | 7.4%), Asia (25,012 | 6.4%), and Africa (13,216 | 3.4%), together accounting for 36.9% of all Arlington residents.
| Immigration Origin | # Population | % Population |
| Afghanistan | 229 | 0.1% |
| Africa | 13,216 | 3.4% |
| Argentina | 16 | 0.0% |
| Armenia | 1 | 0.0% |
| Asia | 25,012 | 6.4% |
| Austria | 6 | 0.0% |
| Bahamas | 24 | 0.0% |
| Bangladesh | 491 | 0.1% |
| Barbados | 5 | 0.0% |
| Belgium | 80 | 0.0% |
| Belize | 93 | 0.0% |
| Bolivia | 19 | 0.0% |
| Bosnia and Herzegovina | 20 | 0.0% |
| Brazil | 255 | 0.1% |
| Bulgaria | 16 | 0.0% |
| Cambodia | 72 | 0.0% |
| Cameroon | 1,139 | 0.3% |
| Canada | 395 | 0.1% |
| Caribbean | 1,715 | 0.4% |
| Central America | 36,860 | 9.4% |
| Chile | 14 | 0.0% |
| China | 1,337 | 0.3% |
| Colombia | 938 | 0.2% |
| Congo | 203 | 0.1% |
| Cuba | 1,191 | 0.3% |
| Czechoslovakia | 20 | 0.0% |
| Denmark | 15 | 0.0% |
| Dominica | 10 | 0.0% |
| Dominican Republic | 77 | 0.0% |
| Eastern Africa | 3,827 | 1.0% |
| Eastern Asia | 1,977 | 0.5% |
| Eastern Europe | 591 | 0.2% |
| Ecuador | 330 | 0.1% |
| Egypt | 61 | 0.0% |
| El Salvador | 4,091 | 1.0% |
| England | 261 | 0.1% |
| Ethiopia | 412 | 0.1% |
| Europe | 2,486 | 0.6% |
| France | 194 | 0.1% |
| Germany | 536 | 0.1% |
| Ghana | 1,613 | 0.4% |
| Greece | 51 | 0.0% |
| Guatemala | 1,167 | 0.3% |
| Guyana | 19 | 0.0% |
| Haiti | 144 | 0.0% |
| Honduras | 1,951 | 0.5% |
| Hong Kong | 175 | 0.0% |
| Hungary | 32 | 0.0% |
| India | 2,244 | 0.6% |
| Indonesia | 243 | 0.1% |
| Iran | 770 | 0.2% |
| Iraq | 1,777 | 0.4% |
| Ireland | 75 | 0.0% |
| Israel | 22 | 0.0% |
| Italy | 176 | 0.0% |
| Jamaica | 87 | 0.0% |
| Japan | 231 | 0.1% |
| Jordan | 535 | 0.1% |
| Kazakhstan | 7 | 0.0% |
| Kenya | 1,906 | 0.5% |
| Korea | 409 | 0.1% |
| Kuwait | 446 | 0.1% |
| Laos | 32 | 0.0% |
| Latin America | 40,872 | 10.4% |
| Latvia | 27 | 0.0% |
| Lebanon | 303 | 0.1% |
| Liberia | 727 | 0.2% |
| Malaysia | 197 | 0.1% |
| Mexico | 29,153 | 7.4% |
| Micronesia | 9 | 0.0% |
| Middle Africa | 1,484 | 0.4% |
| Morocco | 107 | 0.0% |
| Nepal | 768 | 0.2% |
| Netherlands | 51 | 0.0% |
| Nicaragua | 271 | 0.1% |
| Nigeria | 3,815 | 1.0% |
| North Macedonia | 13 | 0.0% |
| Northern Africa | 553 | 0.1% |
| Northern Europe | 692 | 0.2% |
| Norway | 7 | 0.0% |
| Oceania | 14 | 0.0% |
| Pakistan | 1,088 | 0.3% |
| Panama | 134 | 0.0% |
| Peru | 315 | 0.1% |
| Philippines | 1,420 | 0.4% |
| Poland | 141 | 0.0% |
| Romania | 45 | 0.0% |
| Russia | 152 | 0.0% |
| Saudi Arabia | 612 | 0.2% |
| Senegal | 79 | 0.0% |
| Somalia | 827 | 0.2% |
| South Africa | 62 | 0.0% |
| South America | 2,297 | 0.6% |
| South Central Asia | 5,776 | 1.5% |
| South Eastern Asia | 12,920 | 3.3% |
| Southern Europe | 328 | 0.1% |
| Spain | 101 | 0.0% |
| Sri Lanka | 170 | 0.0% |
| Sudan | 227 | 0.1% |
| Sweden | 20 | 0.0% |
| Switzerland | 8 | 0.0% |
| Syria | 75 | 0.0% |
| Taiwan | 585 | 0.2% |
| Thailand | 111 | 0.0% |
| Trinidad and Tobago | 167 | 0.0% |
| Turkey | 241 | 0.1% |
| Uganda | 104 | 0.0% |
| Ukraine | 37 | 0.0% |
| Uruguay | 97 | 0.0% |
| Venezuela | 294 | 0.1% |
| Vietnam | 10,748 | 2.7% |
| Western Africa | 6,858 | 1.7% |
| Western Asia | 4,038 | 1.0% |
| Western Europe | 875 | 0.2% |
| Zaire | 116 | 0.0% |
| Zimbabwe | 34 | 0.0% | View All 116 Rows |
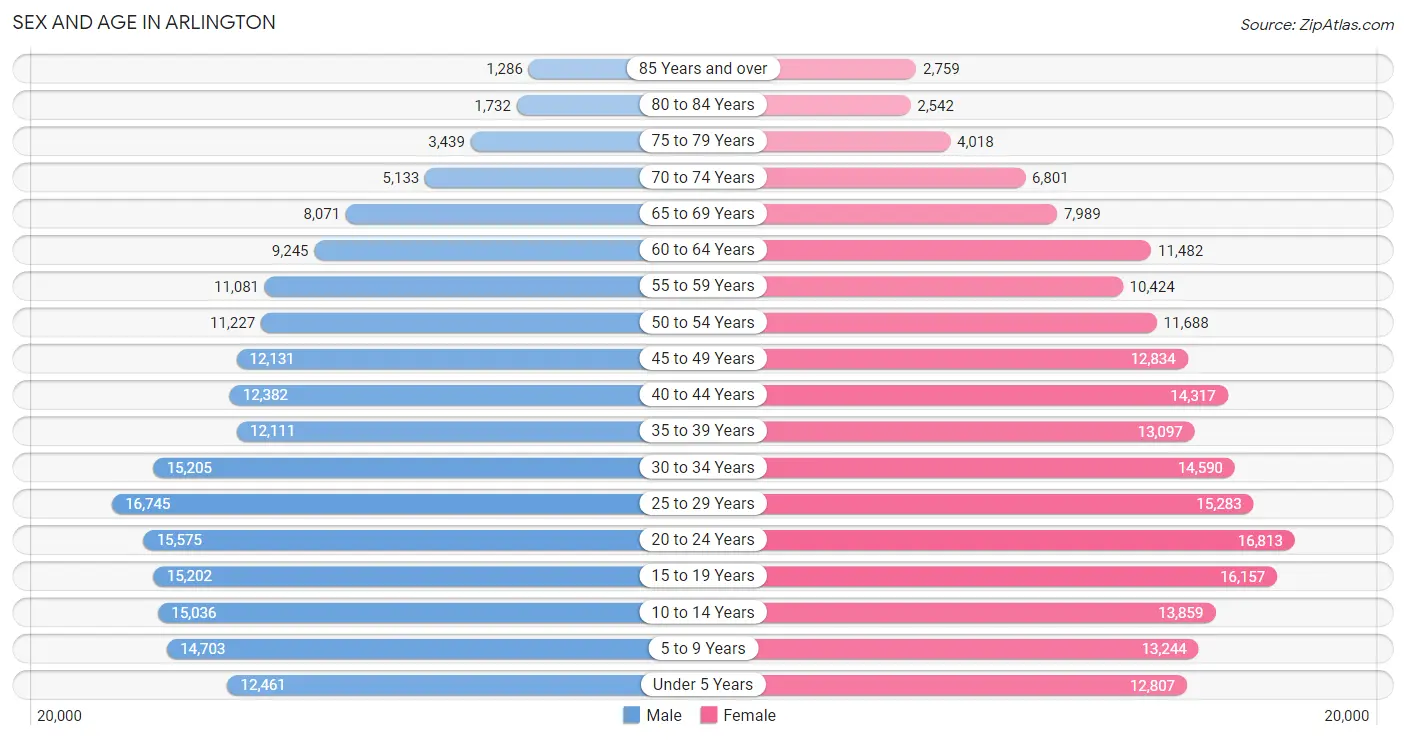
Sex and Age in Arlington
Sex and Age in Arlington
The most populous age groups in Arlington are 25 to 29 Years (16,745 | 8.7%) for men and 20 to 24 Years (16,813 | 8.4%) for women.
| Age Bracket | Male | Female |
| Under 5 Years | 12,461 (6.5%) | 12,807 (6.4%) |
| 5 to 9 Years | 14,703 (7.6%) | 13,244 (6.6%) |
| 10 to 14 Years | 15,036 (7.8%) | 13,859 (6.9%) |
| 15 to 19 Years | 15,202 (7.9%) | 16,157 (8.1%) |
| 20 to 24 Years | 15,575 (8.1%) | 16,813 (8.4%) |
| 25 to 29 Years | 16,745 (8.7%) | 15,283 (7.6%) |
| 30 to 34 Years | 15,205 (7.9%) | 14,590 (7.3%) |
| 35 to 39 Years | 12,111 (6.3%) | 13,097 (6.5%) |
| 40 to 44 Years | 12,382 (6.4%) | 14,317 (7.1%) |
| 45 to 49 Years | 12,131 (6.3%) | 12,834 (6.4%) |
| 50 to 54 Years | 11,227 (5.8%) | 11,688 (5.8%) |
| 55 to 59 Years | 11,081 (5.8%) | 10,424 (5.2%) |
| 60 to 64 Years | 9,245 (4.8%) | 11,482 (5.7%) |
| 65 to 69 Years | 8,071 (4.2%) | 7,989 (4.0%) |
| 70 to 74 Years | 5,133 (2.7%) | 6,801 (3.4%) |
| 75 to 79 Years | 3,439 (1.8%) | 4,018 (2.0%) |
| 80 to 84 Years | 1,732 (0.9%) | 2,542 (1.3%) |
| 85 Years and over | 1,286 (0.7%) | 2,759 (1.4%) |
| Total | 192,765 (100.0%) | 200,704 (100.0%) |
Families and Households in Arlington
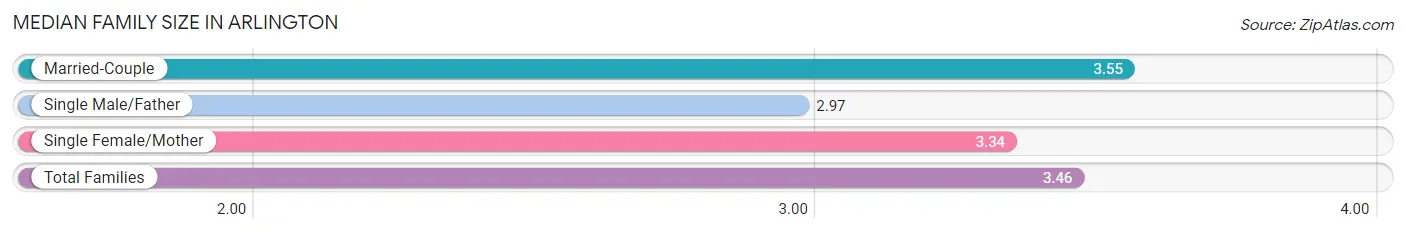
Median Family Size in Arlington
The median family size in Arlington is 3.46 persons per family, with married-couple families (64,056 | 69.1%) accounting for the largest median family size of 3.55 persons per family. On the other hand, single male/father families (7,634 | 8.2%) represent the smallest median family size with 2.97 persons per family.
| Family Type | # Families | Family Size |
| Married-Couple | 64,056 (69.1%) | 3.55 |
| Single Male/Father | 7,634 (8.2%) | 2.97 |
| Single Female/Mother | 21,041 (22.7%) | 3.34 |
| Total Families | 92,731 (100.0%) | 3.46 |
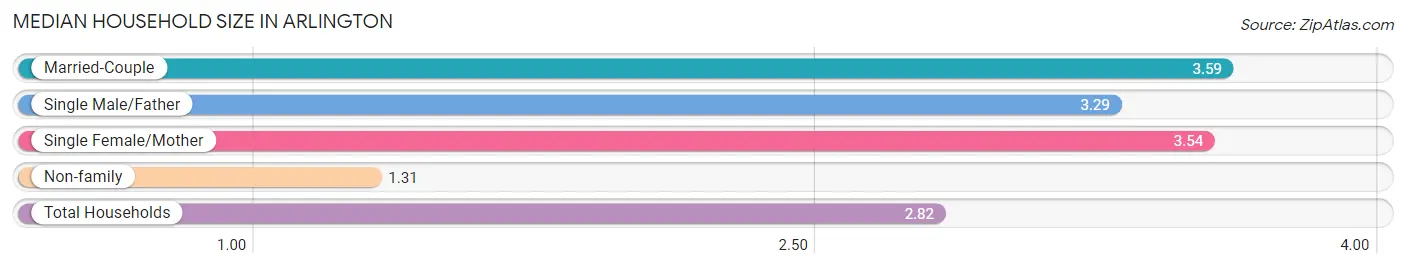
Median Household Size in Arlington
The median household size in Arlington is 2.82 persons per household, with married-couple households (64,056 | 46.6%) accounting for the largest median household size of 3.59 persons per household. non-family households (44,788 | 32.6%) represent the smallest median household size with 1.31 persons per household.
| Household Type | # Households | Household Size |
| Married-Couple | 64,056 (46.6%) | 3.59 |
| Single Male/Father | 7,634 (5.6%) | 3.29 |
| Single Female/Mother | 21,041 (15.3%) | 3.54 |
| Non-family | 44,788 (32.6%) | 1.31 |
| Total Households | 137,519 (100.0%) | 2.82 |
Household Size by Marriage Status in Arlington
Out of a total of 137,519 households in Arlington, 92,731 (67.4%) are family households, while 44,788 (32.6%) are nonfamily households. The most numerous type of family households are 2-person households, comprising 34,448, and the most common type of nonfamily households are 1-person households, comprising 36,067.
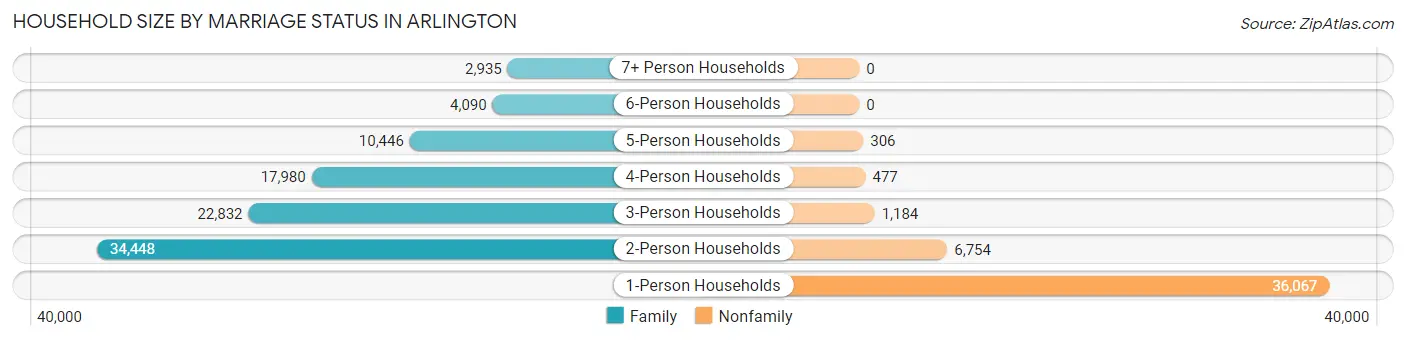
| Household Size | Family Households | Nonfamily Households |
| 1-Person Households | - | 36,067 (26.2%) |
| 2-Person Households | 34,448 (25.1%) | 6,754 (4.9%) |
| 3-Person Households | 22,832 (16.6%) | 1,184 (0.9%) |
| 4-Person Households | 17,980 (13.1%) | 477 (0.4%) |
| 5-Person Households | 10,446 (7.6%) | 306 (0.2%) |
| 6-Person Households | 4,090 (3.0%) | 0 (0.0%) |
| 7+ Person Households | 2,935 (2.1%) | 0 (0.0%) |
| Total | 92,731 (67.4%) | 44,788 (32.6%) |
Female Fertility in Arlington
Fertility by Age in Arlington
Average fertility rate in Arlington is 68.0 births per 1,000 women. Women in the age bracket of 20 to 34 years have the highest fertility rate with 108.0 births per 1,000 women. Women in the age bracket of 20 to 34 years acount for 69.9% of all women with births.
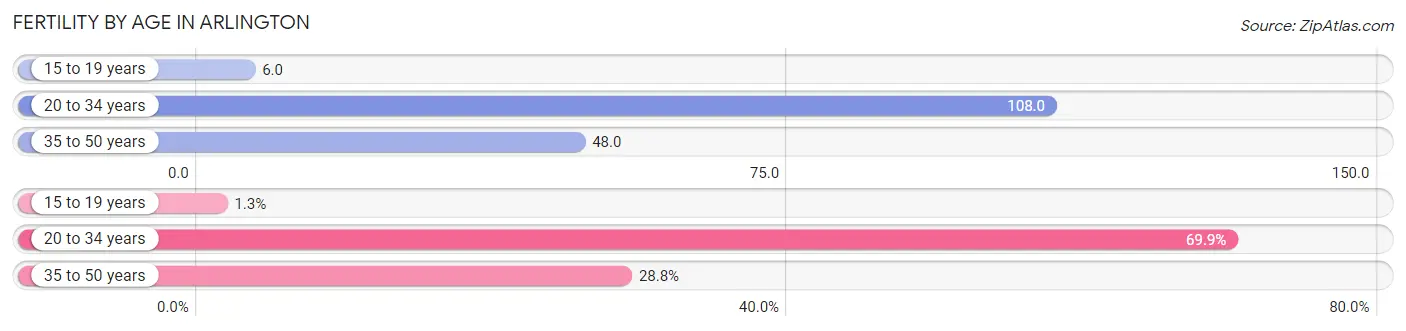
| Age Bracket | Women with Births | Births / 1,000 Women |
| 15 to 19 years | 95 (1.3%) | 6.0 |
| 20 to 34 years | 5,028 (69.9%) | 108.0 |
| 35 to 50 years | 2,069 (28.8%) | 48.0 |
| Total | 7,192 (100.0%) | 68.0 |
Fertility by Age by Marriage Status in Arlington
57.6% of women with births (7,192) in Arlington are married. The highest percentage of unmarried women with births falls into 15 to 19 years age bracket with 75.8% of them unmarried at the time of birth, while the lowest percentage of unmarried women with births belong to 35 to 50 years age bracket with 26.9% of them unmarried.
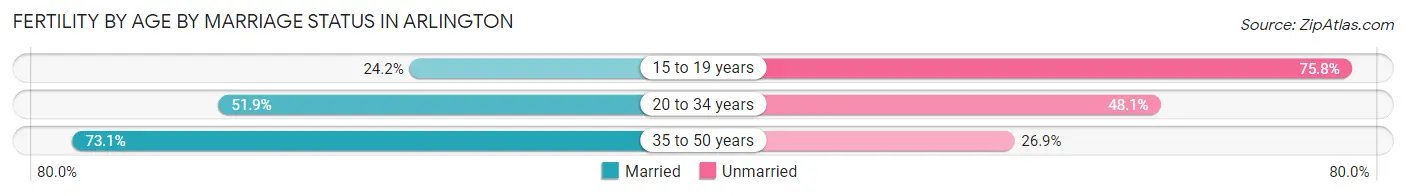
| Age Bracket | Married | Unmarried |
| 15 to 19 years | 23 (24.2%) | 72 (75.8%) |
| 20 to 34 years | 2,610 (51.9%) | 2,418 (48.1%) |
| 35 to 50 years | 1,512 (73.1%) | 557 (26.9%) |
| Total | 4,143 (57.6%) | 3,049 (42.4%) |
Fertility by Education in Arlington
Average fertility rate in Arlington is 68.0 births per 1,000 women. Women with the education attainment of college or associate's degree have the highest fertility rate of 78.0 births per 1,000 women, while women with the education attainment of less than high school have the lowest fertility at 61.0 births per 1,000 women. Women with the education attainment of college or associate's degree represent 37.3% of all women with births.
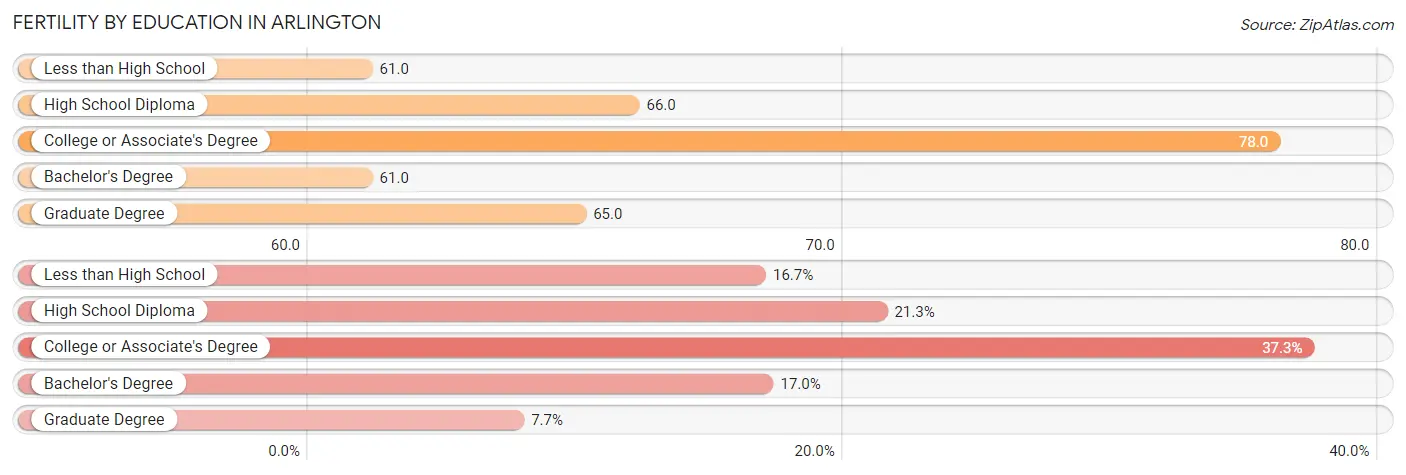
| Educational Attainment | Women with Births | Births / 1,000 Women |
| Less than High School | 1,204 (16.7%) | 61.0 |
| High School Diploma | 1,531 (21.3%) | 66.0 |
| College or Associate's Degree | 2,681 (37.3%) | 78.0 |
| Bachelor's Degree | 1,224 (17.0%) | 61.0 |
| Graduate Degree | 552 (7.7%) | 65.0 |
| Total | 7,192 (100.0%) | 68.0 |
Fertility by Education by Marriage Status in Arlington
42.4% of women with births in Arlington are unmarried. Women with the educational attainment of less than high school are most likely to be married with 81.0% of them married at childbirth, while women with the educational attainment of high school diploma are least likely to be married with 62.2% of them unmarried at childbirth.
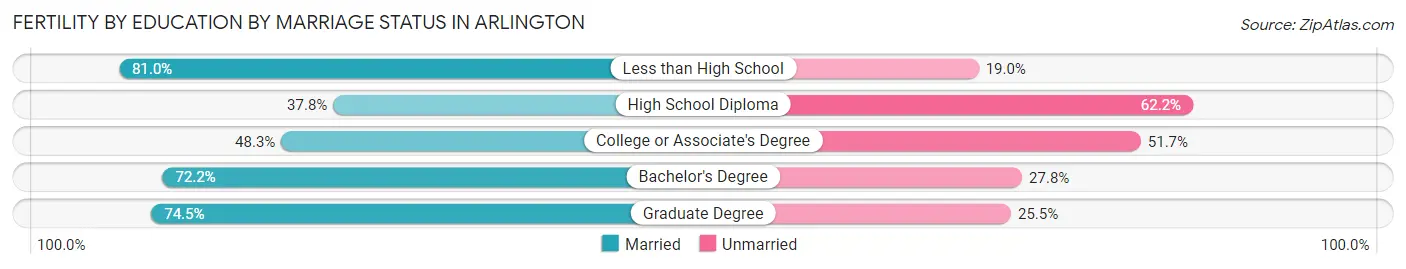
| Educational Attainment | Married | Unmarried |
| Less than High School | 975 (81.0%) | 229 (19.0%) |
| High School Diploma | 579 (37.8%) | 952 (62.2%) |
| College or Associate's Degree | 1,295 (48.3%) | 1,386 (51.7%) |
| Bachelor's Degree | 884 (72.2%) | 340 (27.8%) |
| Graduate Degree | 411 (74.5%) | 141 (25.5%) |
| Total | 4,143 (57.6%) | 3,049 (42.4%) |
Employment Characteristics in Arlington
Employment by Class of Employer in Arlington
Among the 199,096 employed individuals in Arlington, private company employees (146,948 | 73.8%), local government employees (13,920 | 7.0%), and not-for-profit organizations (11,142 | 5.6%) make up the most common classes of employment.
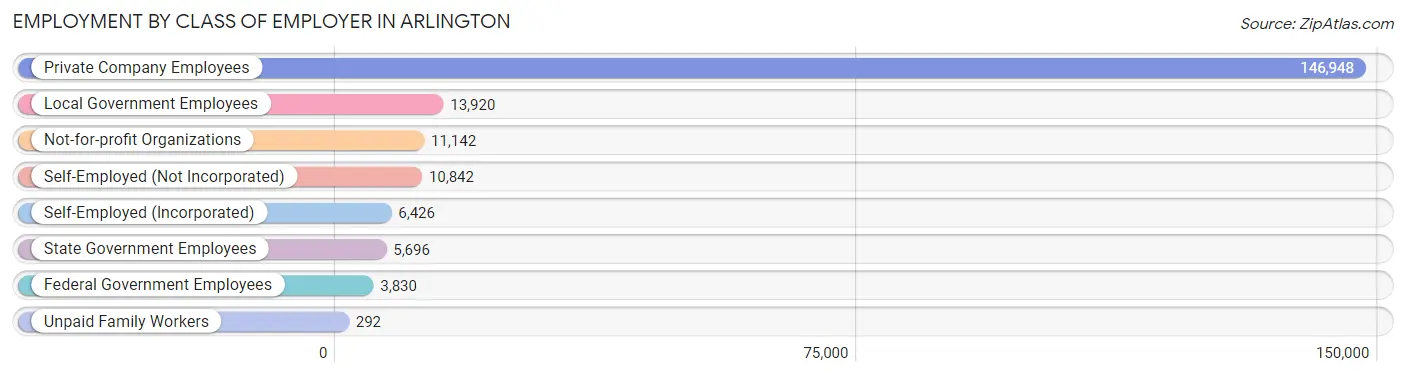
| Employer Class | # Employees | % Employees |
| Private Company Employees | 146,948 | 73.8% |
| Self-Employed (Incorporated) | 6,426 | 3.2% |
| Self-Employed (Not Incorporated) | 10,842 | 5.4% |
| Not-for-profit Organizations | 11,142 | 5.6% |
| Local Government Employees | 13,920 | 7.0% |
| State Government Employees | 5,696 | 2.9% |
| Federal Government Employees | 3,830 | 1.9% |
| Unpaid Family Workers | 292 | 0.2% |
| Total | 199,096 | 100.0% |
Employment Status by Age in Arlington
According to the labor force statistics for Arlington, out of the total population over 16 years of age (305,931), 70.0% or 214,152 individuals are in the labor force, with 5.6% or 11,993 of them unemployed. The age group with the highest labor force participation rate is 30 to 34 years, with 85.7% or 25,534 individuals in the labor force. Within the labor force, the 16 to 19 years age range has the highest percentage of unemployed individuals, with 13.0% or 1,342 of them being unemployed.
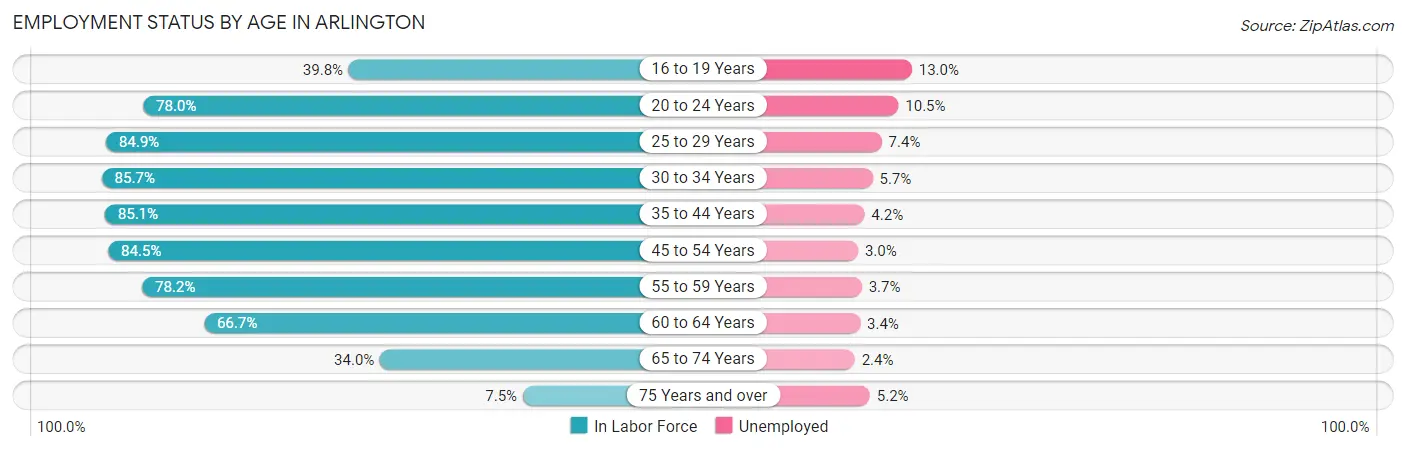
| Age Bracket | In Labor Force | Unemployed |
| 16 to 19 Years | 10,321 (39.8%) | 1,342 (13.0%) |
| 20 to 24 Years | 25,263 (78.0%) | 2,653 (10.5%) |
| 25 to 29 Years | 27,192 (84.9%) | 2,012 (7.4%) |
| 30 to 34 Years | 25,534 (85.7%) | 1,455 (5.7%) |
| 35 to 44 Years | 44,173 (85.1%) | 1,855 (4.2%) |
| 45 to 54 Years | 40,459 (84.5%) | 1,214 (3.0%) |
| 55 to 59 Years | 16,817 (78.2%) | 622 (3.7%) |
| 60 to 64 Years | 13,825 (66.7%) | 470 (3.4%) |
| 65 to 74 Years | 9,518 (34.0%) | 228 (2.4%) |
| 75 Years and over | 1,183 (7.5%) | 62 (5.2%) |
| Total | 214,152 (70.0%) | 11,993 (5.6%) |
Employment Status by Educational Attainment in Arlington
According to labor force statistics for Arlington, 82.4% of individuals (167,966) out of the total population between 25 and 64 years of age (203,842) are in the labor force, with 4.5% or 7,558 of them being unemployed. The group with the highest labor force participation rate are those with the educational attainment of bachelor's degree or higher, with 86.8% or 56,483 individuals in the labor force. Within the labor force, individuals with college / associate degree education have the highest percentage of unemployment, with 5.6% or 2,950 of them being unemployed.
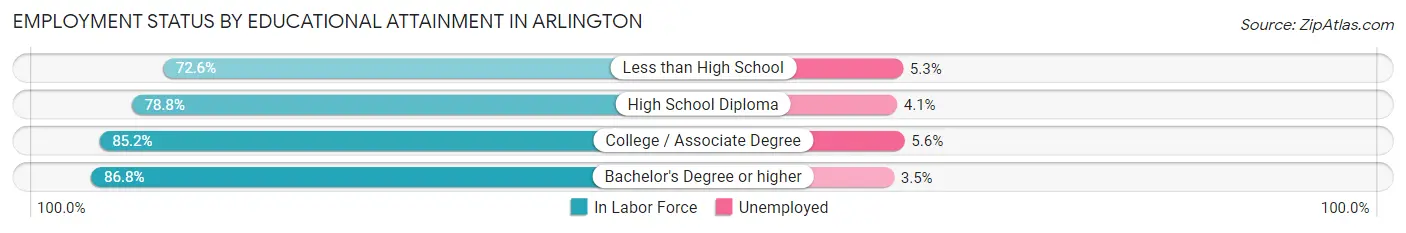
| Educational Attainment | In Labor Force | Unemployed |
| Less than High School | 21,272 (72.6%) | 1,553 (5.3%) |
| High School Diploma | 37,545 (78.8%) | 1,953 (4.1%) |
| College / Associate Degree | 52,673 (85.2%) | 3,462 (5.6%) |
| Bachelor's Degree or higher | 56,483 (86.8%) | 2,278 (3.5%) |
| Total | 167,966 (82.4%) | 9,173 (4.5%) |
Employment Occupations by Sex in Arlington
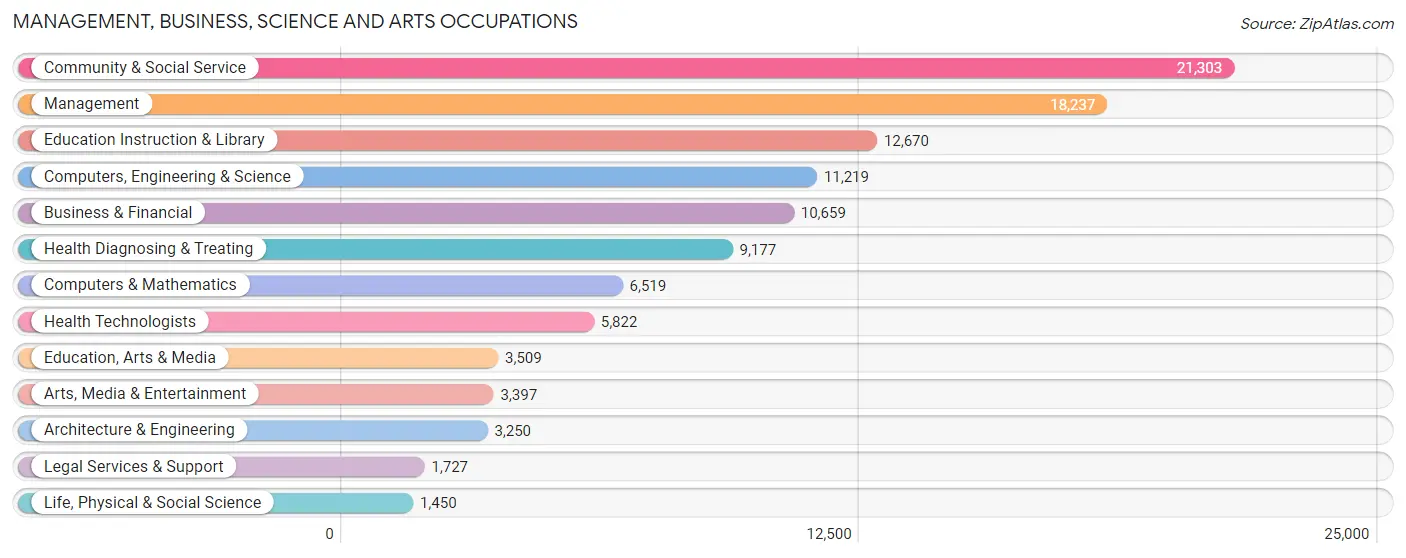
Management, Business, Science and Arts Occupations
The most common Management, Business, Science and Arts occupations in Arlington are Community & Social Service (21,303 | 10.5%), Management (18,237 | 9.0%), Education Instruction & Library (12,670 | 6.3%), Computers, Engineering & Science (11,219 | 5.6%), and Business & Financial (10,659 | 5.3%).
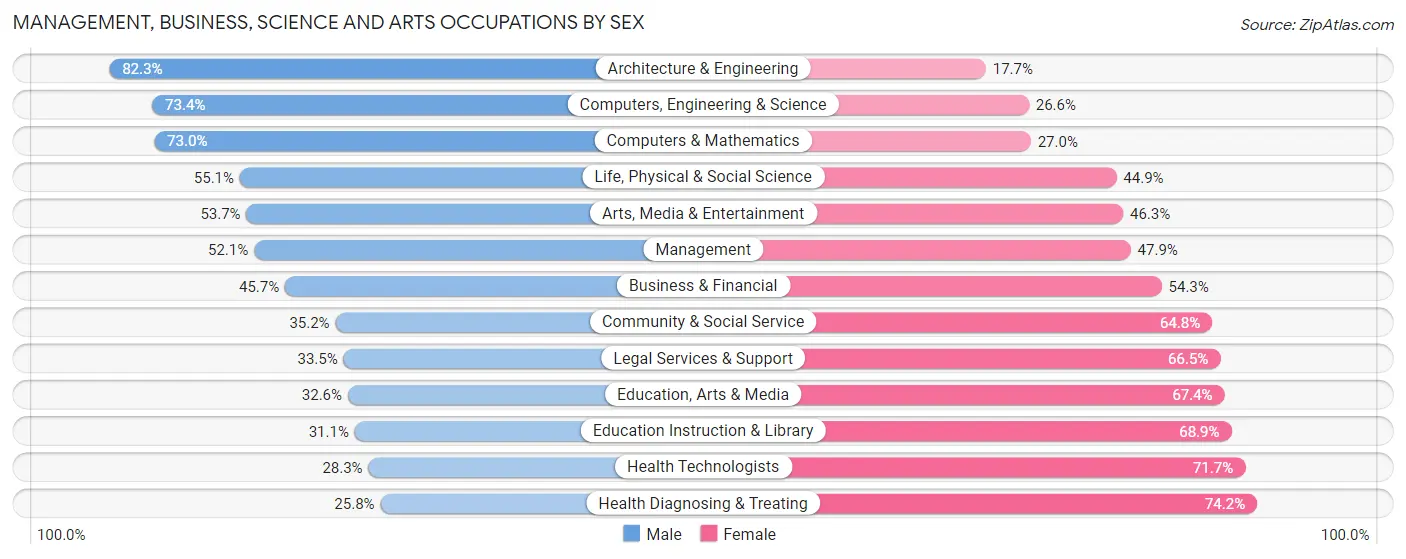
Management, Business, Science and Arts Occupations by Sex
Within the Management, Business, Science and Arts occupations in Arlington, the most male-oriented occupations are Architecture & Engineering (82.3%), Computers, Engineering & Science (73.4%), and Computers & Mathematics (73.0%), while the most female-oriented occupations are Health Diagnosing & Treating (74.2%), Health Technologists (71.7%), and Education Instruction & Library (68.9%).
| Occupation | Male | Female |
| Management | 9,507 (52.1%) | 8,730 (47.9%) |
| Business & Financial | 4,868 (45.7%) | 5,791 (54.3%) |
| Computers, Engineering & Science | 8,232 (73.4%) | 2,987 (26.6%) |
| Computers & Mathematics | 4,757 (73.0%) | 1,762 (27.0%) |
| Architecture & Engineering | 2,676 (82.3%) | 574 (17.7%) |
| Life, Physical & Social Science | 799 (55.1%) | 651 (44.9%) |
| Community & Social Service | 7,490 (35.2%) | 13,813 (64.8%) |
| Education, Arts & Media | 1,143 (32.6%) | 2,366 (67.4%) |
| Legal Services & Support | 578 (33.5%) | 1,149 (66.5%) |
| Education Instruction & Library | 3,944 (31.1%) | 8,726 (68.9%) |
| Arts, Media & Entertainment | 1,825 (53.7%) | 1,572 (46.3%) |
| Health Diagnosing & Treating | 2,366 (25.8%) | 6,811 (74.2%) |
| Health Technologists | 1,646 (28.3%) | 4,176 (71.7%) |
| Total (Category) | 32,463 (46.0%) | 38,132 (54.0%) |
| Total (Overall) | 107,594 (53.3%) | 94,347 (46.7%) |
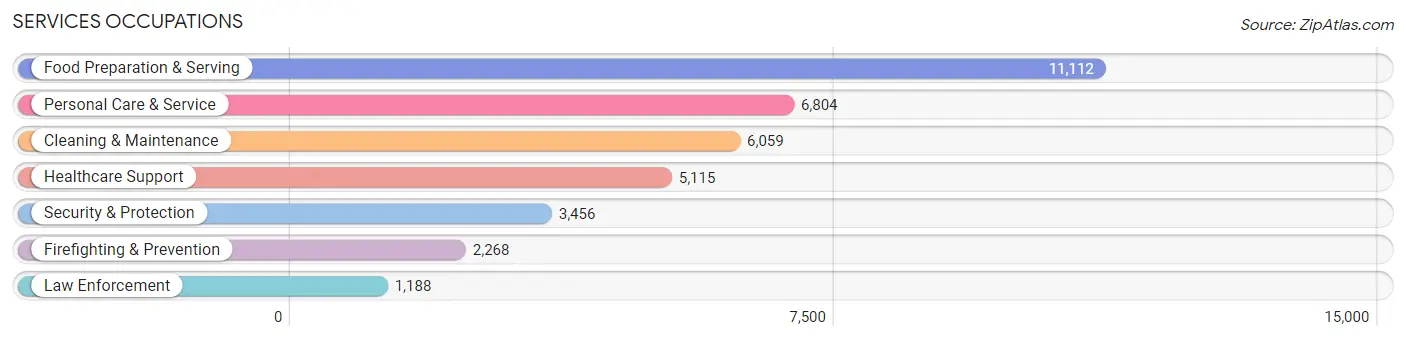
Services Occupations
The most common Services occupations in Arlington are Food Preparation & Serving (11,112 | 5.5%), Personal Care & Service (6,804 | 3.4%), Cleaning & Maintenance (6,059 | 3.0%), Healthcare Support (5,115 | 2.5%), and Security & Protection (3,456 | 1.7%).
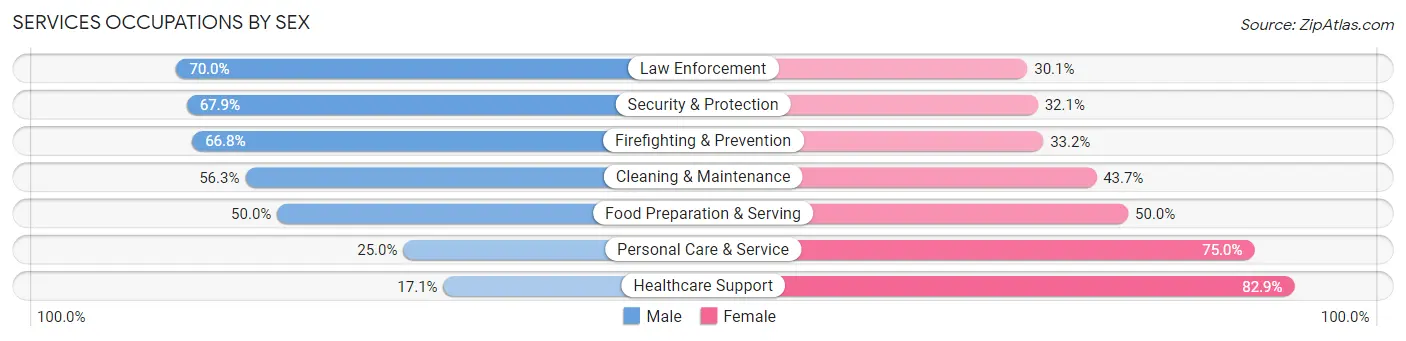
Services Occupations by Sex
Within the Services occupations in Arlington, the most male-oriented occupations are Law Enforcement (70.0%), Security & Protection (67.9%), and Firefighting & Prevention (66.8%), while the most female-oriented occupations are Healthcare Support (82.9%), Personal Care & Service (75.0%), and Food Preparation & Serving (50.0%).
| Occupation | Male | Female |
| Healthcare Support | 873 (17.1%) | 4,242 (82.9%) |
| Security & Protection | 2,346 (67.9%) | 1,110 (32.1%) |
| Firefighting & Prevention | 1,515 (66.8%) | 753 (33.2%) |
| Law Enforcement | 831 (70.0%) | 357 (30.0%) |
| Food Preparation & Serving | 5,555 (50.0%) | 5,557 (50.0%) |
| Cleaning & Maintenance | 3,412 (56.3%) | 2,647 (43.7%) |
| Personal Care & Service | 1,702 (25.0%) | 5,102 (75.0%) |
| Total (Category) | 13,888 (42.7%) | 18,658 (57.3%) |
| Total (Overall) | 107,594 (53.3%) | 94,347 (46.7%) |
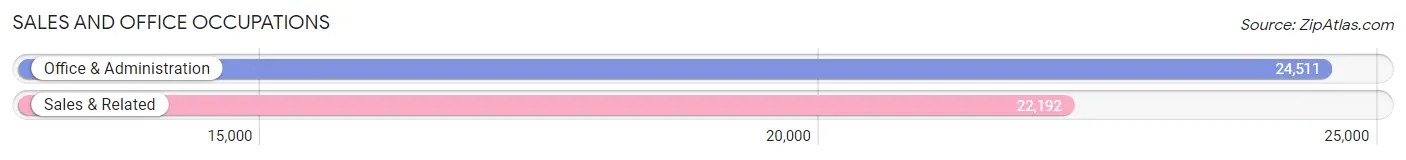
Sales and Office Occupations
The most common Sales and Office occupations in Arlington are Office & Administration (24,511 | 12.1%), and Sales & Related (22,192 | 11.0%).
Sales and Office Occupations by Sex
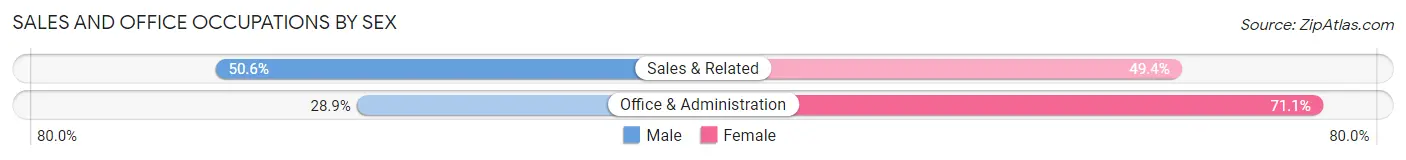
| Occupation | Male | Female |
| Sales & Related | 11,234 (50.6%) | 10,958 (49.4%) |
| Office & Administration | 7,092 (28.9%) | 17,419 (71.1%) |
| Total (Category) | 18,326 (39.2%) | 28,377 (60.8%) |
| Total (Overall) | 107,594 (53.3%) | 94,347 (46.7%) |
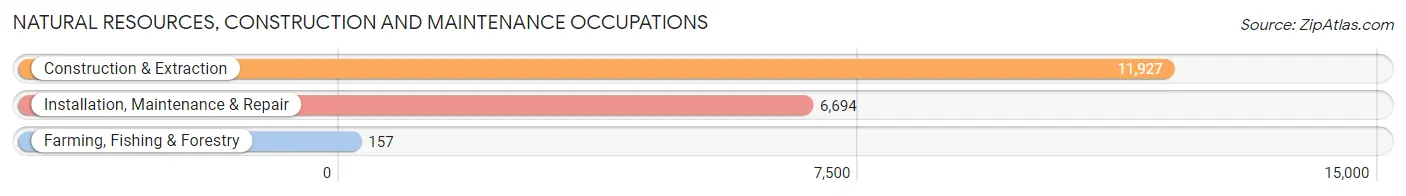
Natural Resources, Construction and Maintenance Occupations
The most common Natural Resources, Construction and Maintenance occupations in Arlington are Construction & Extraction (11,927 | 5.9%), Installation, Maintenance & Repair (6,694 | 3.3%), and Farming, Fishing & Forestry (157 | 0.1%).
Natural Resources, Construction and Maintenance Occupations by Sex
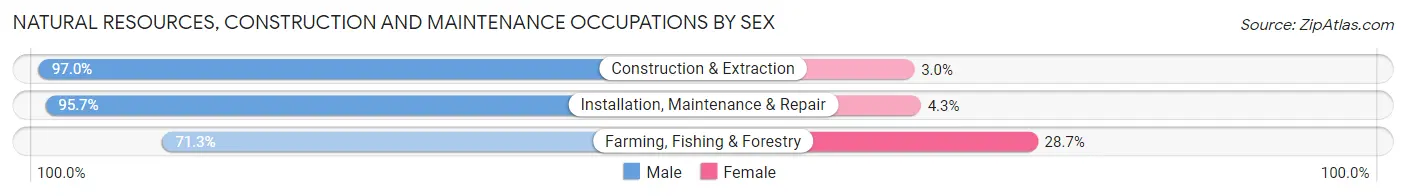
| Occupation | Male | Female |
| Farming, Fishing & Forestry | 112 (71.3%) | 45 (28.7%) |
| Construction & Extraction | 11,571 (97.0%) | 356 (3.0%) |
| Installation, Maintenance & Repair | 6,404 (95.7%) | 290 (4.3%) |
| Total (Category) | 18,087 (96.3%) | 691 (3.7%) |
| Total (Overall) | 107,594 (53.3%) | 94,347 (46.7%) |
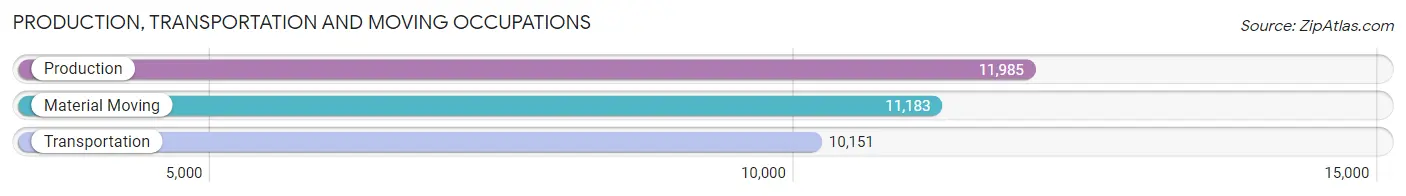
Production, Transportation and Moving Occupations
The most common Production, Transportation and Moving occupations in Arlington are Production (11,985 | 5.9%), Material Moving (11,183 | 5.5%), and Transportation (10,151 | 5.0%).
Production, Transportation and Moving Occupations by Sex
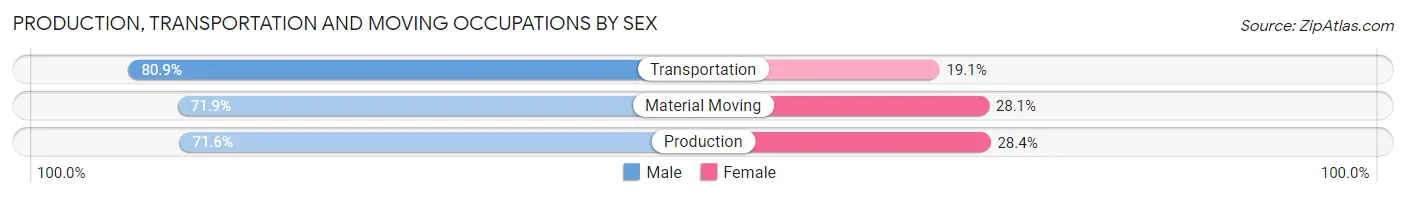
| Occupation | Male | Female |
| Production | 8,578 (71.6%) | 3,407 (28.4%) |
| Transportation | 8,215 (80.9%) | 1,936 (19.1%) |
| Material Moving | 8,037 (71.9%) | 3,146 (28.1%) |
| Total (Category) | 24,830 (74.5%) | 8,489 (25.5%) |
| Total (Overall) | 107,594 (53.3%) | 94,347 (46.7%) |
Employment Industries by Sex in Arlington
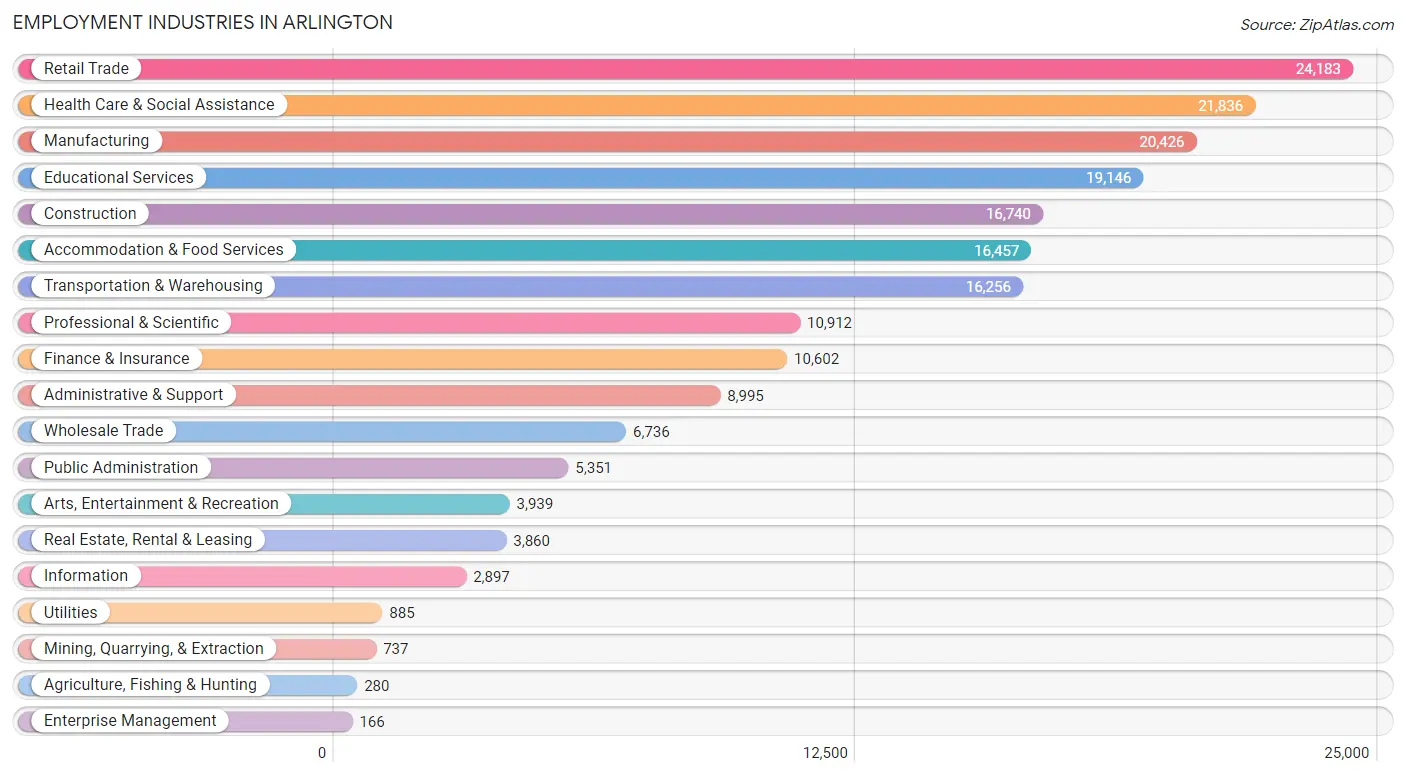
Employment Industries in Arlington
The major employment industries in Arlington include Retail Trade (24,183 | 12.0%), Health Care & Social Assistance (21,836 | 10.8%), Manufacturing (20,426 | 10.1%), Educational Services (19,146 | 9.5%), and Construction (16,740 | 8.3%).
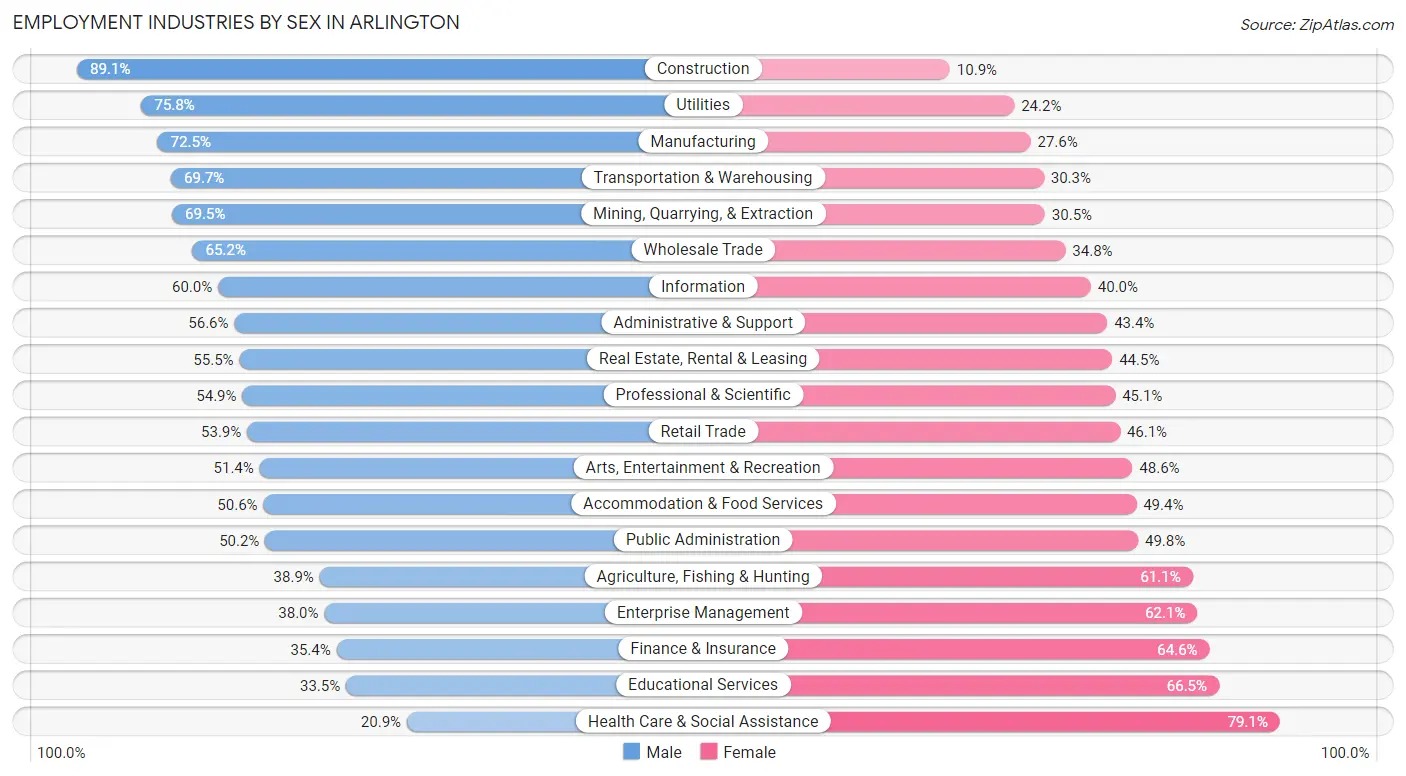
Employment Industries by Sex in Arlington
The Arlington industries that see more men than women are Construction (89.1%), Utilities (75.8%), and Manufacturing (72.5%), whereas the industries that tend to have a higher number of women are Health Care & Social Assistance (79.1%), Educational Services (66.5%), and Finance & Insurance (64.6%).
| Industry | Male | Female |
| Agriculture, Fishing & Hunting | 109 (38.9%) | 171 (61.1%) |
| Mining, Quarrying, & Extraction | 512 (69.5%) | 225 (30.5%) |
| Construction | 14,922 (89.1%) | 1,818 (10.9%) |
| Manufacturing | 14,798 (72.5%) | 5,628 (27.6%) |
| Wholesale Trade | 4,394 (65.2%) | 2,342 (34.8%) |
| Retail Trade | 13,044 (53.9%) | 11,139 (46.1%) |
| Transportation & Warehousing | 11,330 (69.7%) | 4,926 (30.3%) |
| Utilities | 671 (75.8%) | 214 (24.2%) |
| Information | 1,737 (60.0%) | 1,160 (40.0%) |
| Finance & Insurance | 3,756 (35.4%) | 6,846 (64.6%) |
| Real Estate, Rental & Leasing | 2,144 (55.5%) | 1,716 (44.5%) |
| Professional & Scientific | 5,993 (54.9%) | 4,919 (45.1%) |
| Enterprise Management | 63 (38.0%) | 103 (62.1%) |
| Administrative & Support | 5,089 (56.6%) | 3,906 (43.4%) |
| Educational Services | 6,409 (33.5%) | 12,737 (66.5%) |
| Health Care & Social Assistance | 4,557 (20.9%) | 17,279 (79.1%) |
| Arts, Entertainment & Recreation | 2,023 (51.4%) | 1,916 (48.6%) |
| Accommodation & Food Services | 8,323 (50.6%) | 8,134 (49.4%) |
| Public Administration | 2,686 (50.2%) | 2,665 (49.8%) |
| Total | 107,594 (53.3%) | 94,347 (46.7%) |
Education in Arlington
School Enrollment in Arlington
The most common levels of schooling among the 111,856 students in Arlington are college / undergraduate (26,620 | 23.8%), high school (23,066 | 20.6%), and middle school (22,648 | 20.3%).
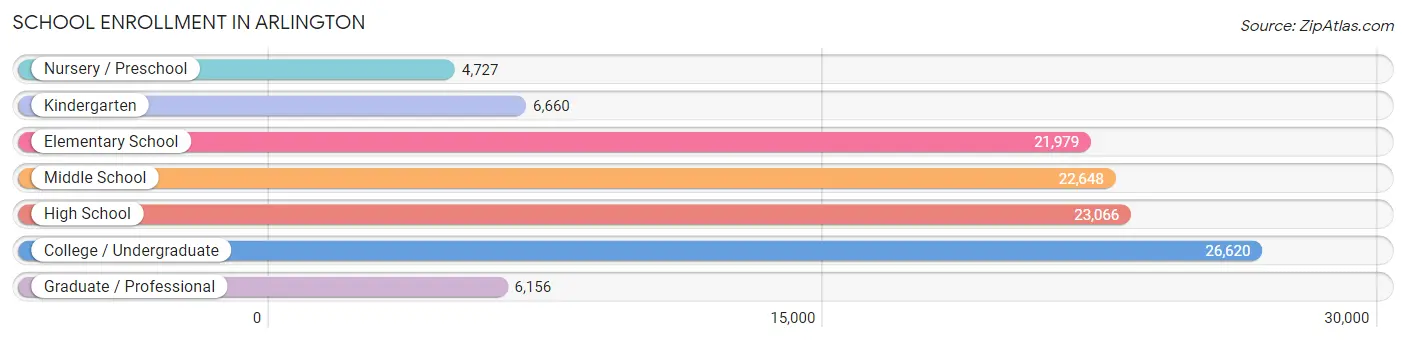
| School Level | # Students | % Students |
| Nursery / Preschool | 4,727 | 4.2% |
| Kindergarten | 6,660 | 5.9% |
| Elementary School | 21,979 | 19.7% |
| Middle School | 22,648 | 20.3% |
| High School | 23,066 | 20.6% |
| College / Undergraduate | 26,620 | 23.8% |
| Graduate / Professional | 6,156 | 5.5% |
| Total | 111,856 | 100.0% |
School Enrollment by Age by Funding Source in Arlington
Out of a total of 111,856 students who are enrolled in schools in Arlington, 12,080 (10.8%) attend a private institution, while the remaining 99,776 (89.2%) are enrolled in public schools. The age group of 3 to 4 year olds has the highest likelihood of being enrolled in private schools, with 1,176 (30.2% in the age bracket) enrolled. Conversely, the age group of 15 to 17 year olds has the lowest likelihood of being enrolled in a private school, with 16,020 (94.8% in the age bracket) attending a public institution.
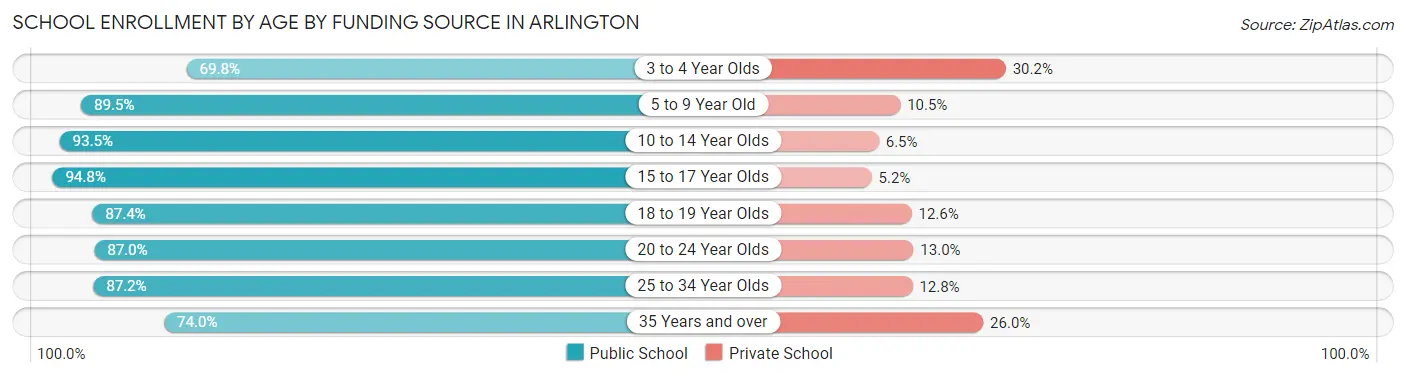
| Age Bracket | Public School | Private School |
| 3 to 4 Year Olds | 2,719 (69.8%) | 1,176 (30.2%) |
| 5 to 9 Year Old | 23,406 (89.5%) | 2,754 (10.5%) |
| 10 to 14 Year Olds | 26,252 (93.5%) | 1,836 (6.5%) |
| 15 to 17 Year Olds | 16,020 (94.8%) | 878 (5.2%) |
| 18 to 19 Year Olds | 8,535 (87.4%) | 1,235 (12.6%) |
| 20 to 24 Year Olds | 11,626 (87.0%) | 1,736 (13.0%) |
| 25 to 34 Year Olds | 7,051 (87.2%) | 1,036 (12.8%) |
| 35 Years and over | 4,142 (74.0%) | 1,454 (26.0%) |
| Total | 99,776 (89.2%) | 12,080 (10.8%) |
Educational Attainment by Field of Study in Arlington
Business (21,487 | 25.3%), education (8,940 | 10.5%), science & technology (8,332 | 9.8%), arts & humanities (6,744 | 7.9%), and engineering (6,596 | 7.8%) are the most common fields of study among 85,008 individuals in Arlington who have obtained a bachelor's degree or higher.
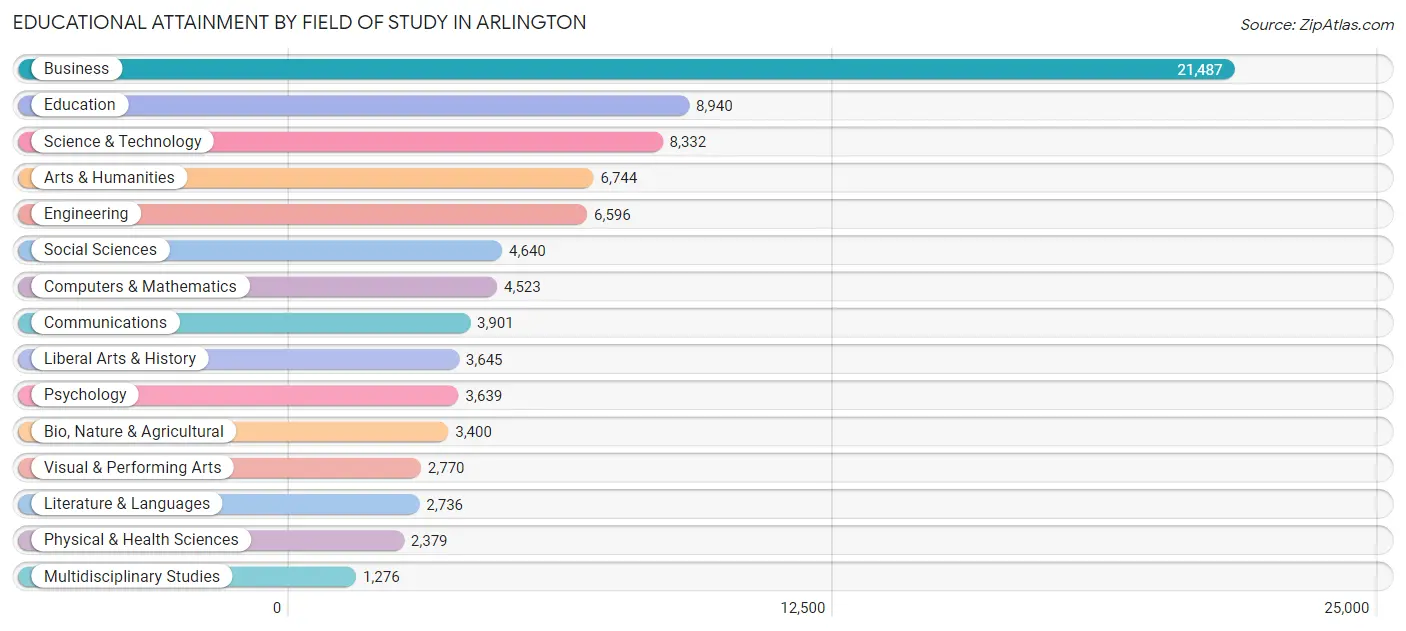
| Field of Study | # Graduates | % Graduates |
| Computers & Mathematics | 4,523 | 5.3% |
| Bio, Nature & Agricultural | 3,400 | 4.0% |
| Physical & Health Sciences | 2,379 | 2.8% |
| Psychology | 3,639 | 4.3% |
| Social Sciences | 4,640 | 5.5% |
| Engineering | 6,596 | 7.8% |
| Multidisciplinary Studies | 1,276 | 1.5% |
| Science & Technology | 8,332 | 9.8% |
| Business | 21,487 | 25.3% |
| Education | 8,940 | 10.5% |
| Literature & Languages | 2,736 | 3.2% |
| Liberal Arts & History | 3,645 | 4.3% |
| Visual & Performing Arts | 2,770 | 3.3% |
| Communications | 3,901 | 4.6% |
| Arts & Humanities | 6,744 | 7.9% |
| Total | 85,008 | 100.0% |
Transportation & Commute in Arlington
Vehicle Availability by Sex in Arlington
The most prevalent vehicle ownership categories in Arlington are males with 2 vehicles (43,946, accounting for 41.5%) and females with 2 vehicles (35,763, making up 47.9%).
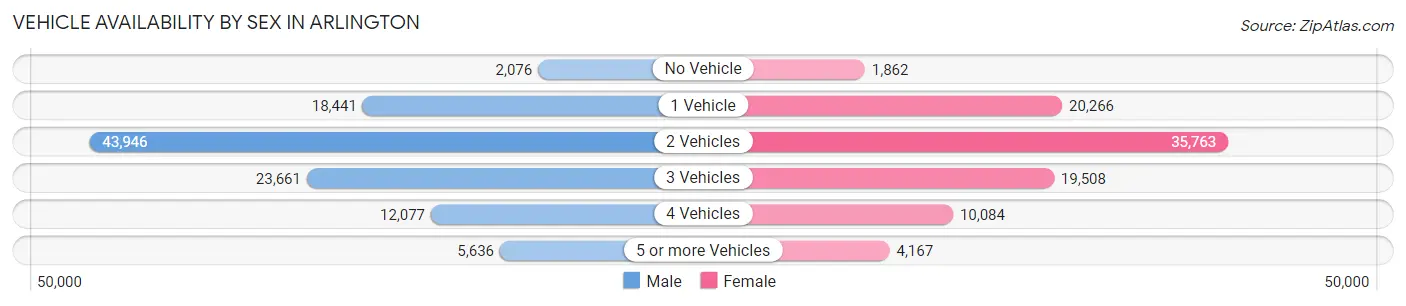
| Vehicles Available | Male | Female |
| No Vehicle | 2,076 (2.0%) | 1,862 (2.0%) |
| 1 Vehicle | 18,441 (17.4%) | 20,266 (22.1%) |
| 2 Vehicles | 43,946 (41.5%) | 35,763 (39.0%) |
| 3 Vehicles | 23,661 (22.4%) | 19,508 (21.3%) |
| 4 Vehicles | 12,077 (11.4%) | 10,084 (11.0%) |
| 5 or more Vehicles | 5,636 (5.3%) | 4,167 (4.5%) |
| Total | 105,837 (100.0%) | 91,650 (100.0%) |
Commute Time in Arlington
The most frequently occuring commute durations in Arlington are 30 to 34 minutes (30,471 commuters, 17.0%), 20 to 24 minutes (26,829 commuters, 14.9%), and 15 to 19 minutes (25,464 commuters, 14.2%).
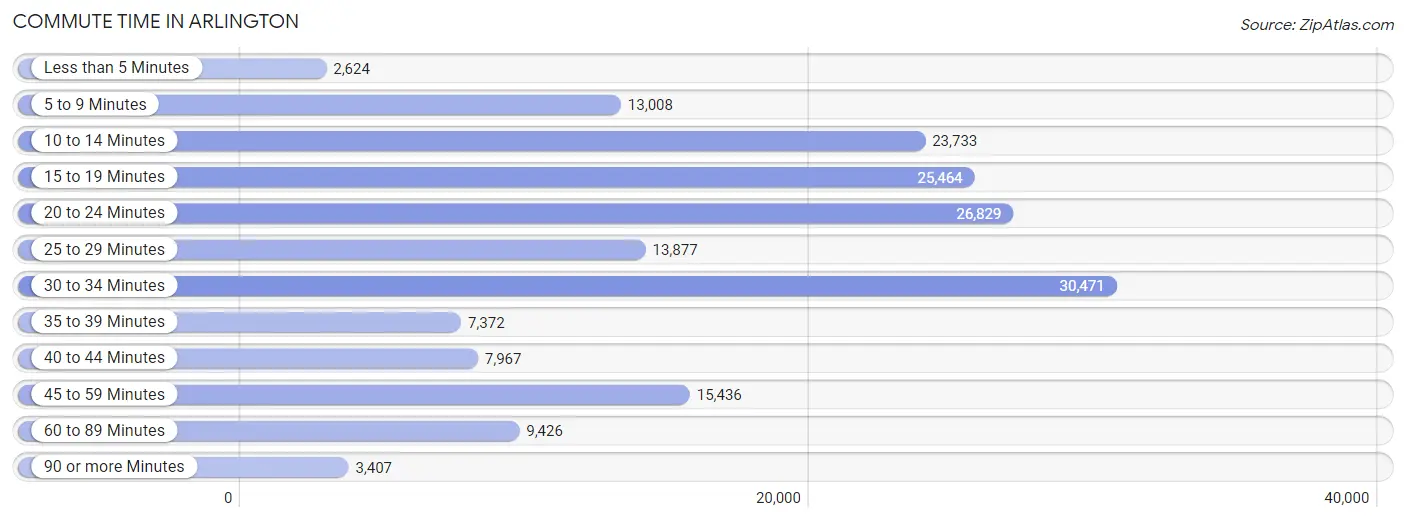
| Commute Time | # Commuters | % Commuters |
| Less than 5 Minutes | 2,624 | 1.5% |
| 5 to 9 Minutes | 13,008 | 7.2% |
| 10 to 14 Minutes | 23,733 | 13.2% |
| 15 to 19 Minutes | 25,464 | 14.2% |
| 20 to 24 Minutes | 26,829 | 14.9% |
| 25 to 29 Minutes | 13,877 | 7.7% |
| 30 to 34 Minutes | 30,471 | 17.0% |
| 35 to 39 Minutes | 7,372 | 4.1% |
| 40 to 44 Minutes | 7,967 | 4.4% |
| 45 to 59 Minutes | 15,436 | 8.6% |
| 60 to 89 Minutes | 9,426 | 5.2% |
| 90 or more Minutes | 3,407 | 1.9% |
Commute Time by Sex in Arlington
The most common commute times in Arlington are 30 to 34 minutes (19,676 commuters, 20.1%) for males and 20 to 24 minutes (12,814 commuters, 15.6%) for females.
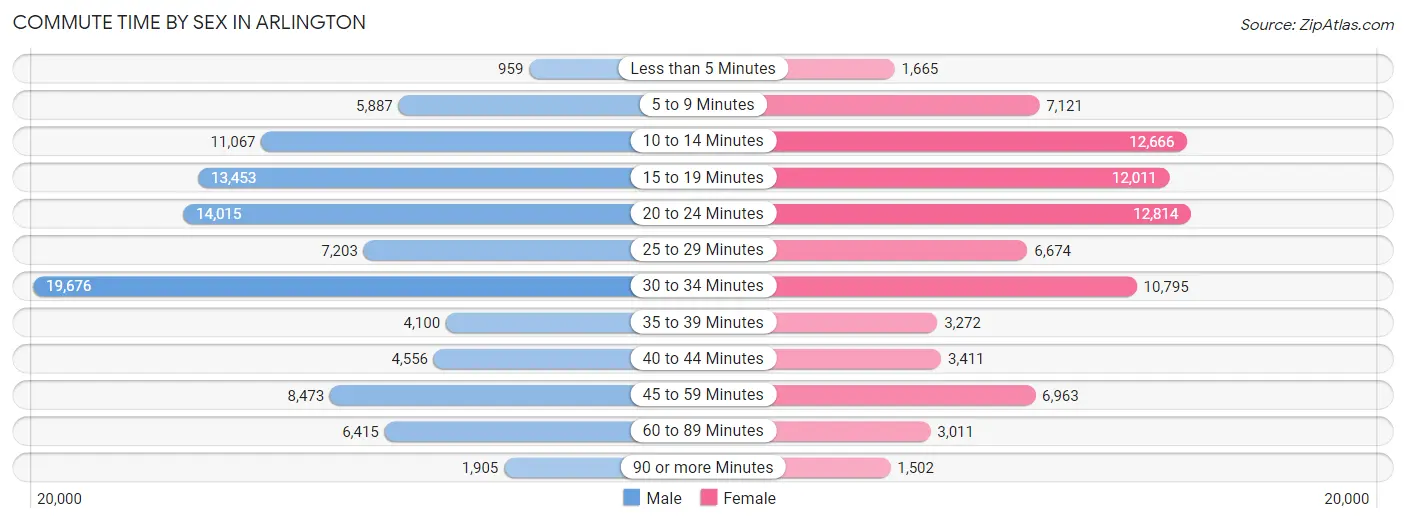
| Commute Time | Male | Female |
| Less than 5 Minutes | 959 (1.0%) | 1,665 (2.0%) |
| 5 to 9 Minutes | 5,887 (6.0%) | 7,121 (8.7%) |
| 10 to 14 Minutes | 11,067 (11.3%) | 12,666 (15.5%) |
| 15 to 19 Minutes | 13,453 (13.8%) | 12,011 (14.7%) |
| 20 to 24 Minutes | 14,015 (14.3%) | 12,814 (15.6%) |
| 25 to 29 Minutes | 7,203 (7.4%) | 6,674 (8.2%) |
| 30 to 34 Minutes | 19,676 (20.1%) | 10,795 (13.2%) |
| 35 to 39 Minutes | 4,100 (4.2%) | 3,272 (4.0%) |
| 40 to 44 Minutes | 4,556 (4.7%) | 3,411 (4.2%) |
| 45 to 59 Minutes | 8,473 (8.7%) | 6,963 (8.5%) |
| 60 to 89 Minutes | 6,415 (6.6%) | 3,011 (3.7%) |
| 90 or more Minutes | 1,905 (1.9%) | 1,502 (1.8%) |
Time of Departure to Work by Sex in Arlington
The most frequent times of departure to work in Arlington are 7:00 AM to 7:29 AM (13,071, 13.4%) for males and 7:00 AM to 7:29 AM (11,790, 14.4%) for females.
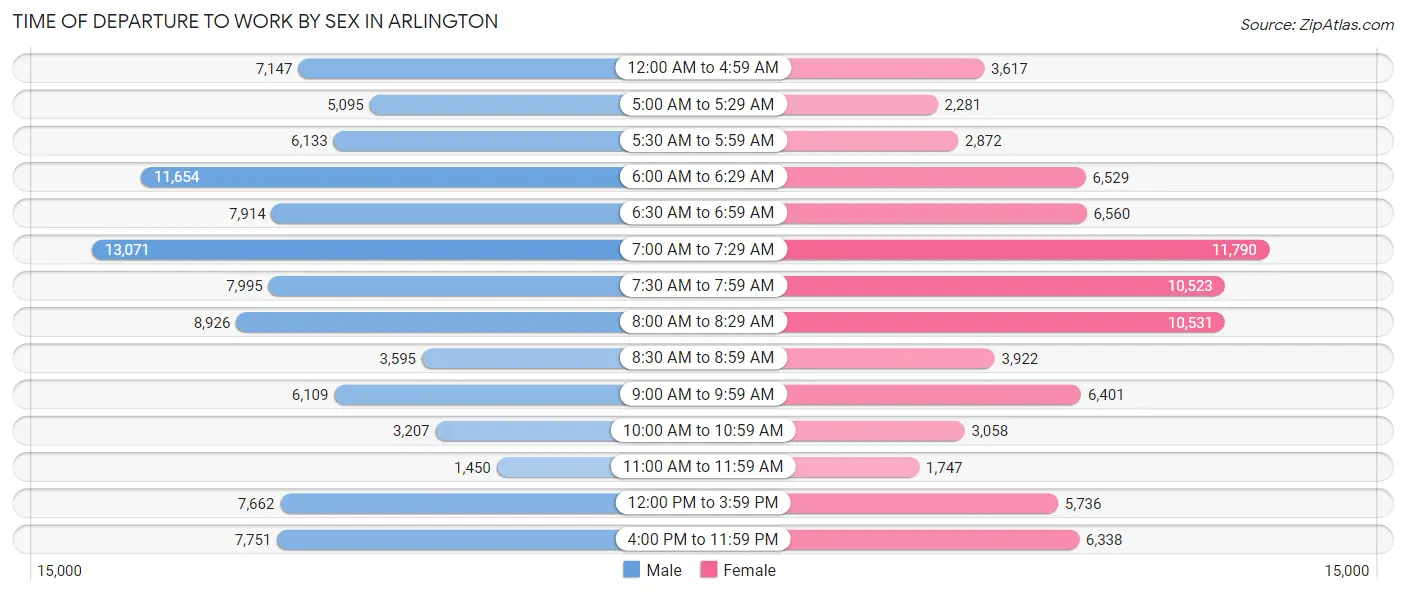
| Time of Departure | Male | Female |
| 12:00 AM to 4:59 AM | 7,147 (7.3%) | 3,617 (4.4%) |
| 5:00 AM to 5:29 AM | 5,095 (5.2%) | 2,281 (2.8%) |
| 5:30 AM to 5:59 AM | 6,133 (6.3%) | 2,872 (3.5%) |
| 6:00 AM to 6:29 AM | 11,654 (11.9%) | 6,529 (8.0%) |
| 6:30 AM to 6:59 AM | 7,914 (8.1%) | 6,560 (8.0%) |
| 7:00 AM to 7:29 AM | 13,071 (13.4%) | 11,790 (14.4%) |
| 7:30 AM to 7:59 AM | 7,995 (8.2%) | 10,523 (12.9%) |
| 8:00 AM to 8:29 AM | 8,926 (9.1%) | 10,531 (12.9%) |
| 8:30 AM to 8:59 AM | 3,595 (3.7%) | 3,922 (4.8%) |
| 9:00 AM to 9:59 AM | 6,109 (6.2%) | 6,401 (7.8%) |
| 10:00 AM to 10:59 AM | 3,207 (3.3%) | 3,058 (3.7%) |
| 11:00 AM to 11:59 AM | 1,450 (1.5%) | 1,747 (2.1%) |
| 12:00 PM to 3:59 PM | 7,662 (7.8%) | 5,736 (7.0%) |
| 4:00 PM to 11:59 PM | 7,751 (7.9%) | 6,338 (7.7%) |
| Total | 97,709 (100.0%) | 81,905 (100.0%) |
Housing Occupancy in Arlington
Occupancy by Ownership in Arlington
Of the total 137,519 dwellings in Arlington, owner-occupied units account for 75,484 (54.9%), while renter-occupied units make up 62,035 (45.1%).
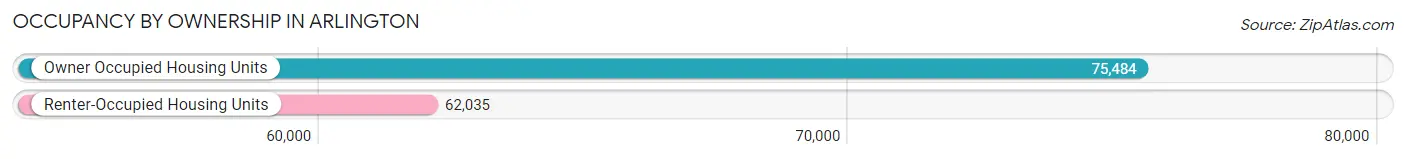
| Occupancy | # Housing Units | % Housing Units |
| Owner Occupied Housing Units | 75,484 | 54.9% |
| Renter-Occupied Housing Units | 62,035 | 45.1% |
| Total Occupied Housing Units | 137,519 | 100.0% |
Occupancy by Household Size in Arlington
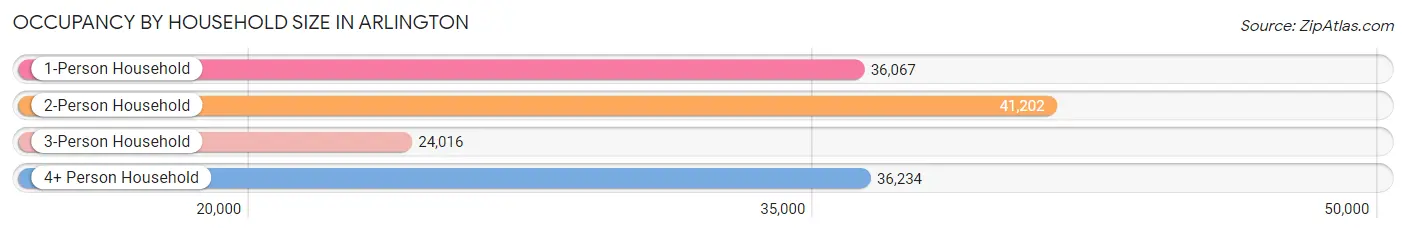
| Household Size | # Housing Units | % Housing Units |
| 1-Person Household | 36,067 | 26.2% |
| 2-Person Household | 41,202 | 30.0% |
| 3-Person Household | 24,016 | 17.5% |
| 4+ Person Household | 36,234 | 26.4% |
| Total Housing Units | 137,519 | 100.0% |
Occupancy by Ownership by Household Size in Arlington
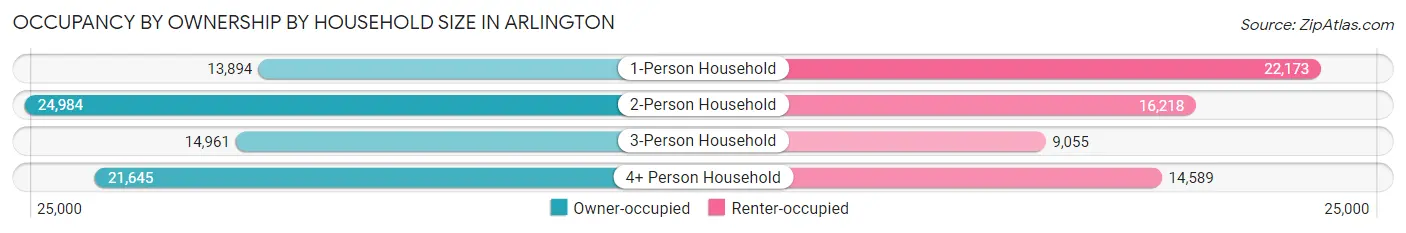
| Household Size | Owner-occupied | Renter-occupied |
| 1-Person Household | 13,894 (38.5%) | 22,173 (61.5%) |
| 2-Person Household | 24,984 (60.6%) | 16,218 (39.4%) |
| 3-Person Household | 14,961 (62.3%) | 9,055 (37.7%) |
| 4+ Person Household | 21,645 (59.7%) | 14,589 (40.3%) |
| Total Housing Units | 75,484 (54.9%) | 62,035 (45.1%) |
Occupancy by Educational Attainment in Arlington
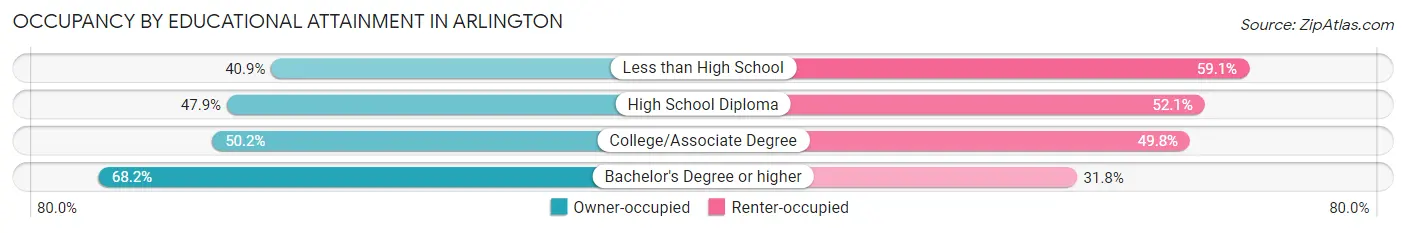
| Household Size | Owner-occupied | Renter-occupied |
| Less than High School | 6,635 (40.9%) | 9,594 (59.1%) |
| High School Diploma | 13,935 (47.9%) | 15,150 (52.1%) |
| College/Associate Degree | 22,307 (50.2%) | 22,091 (49.8%) |
| Bachelor's Degree or higher | 32,607 (68.2%) | 15,200 (31.8%) |
Occupancy by Age of Householder in Arlington
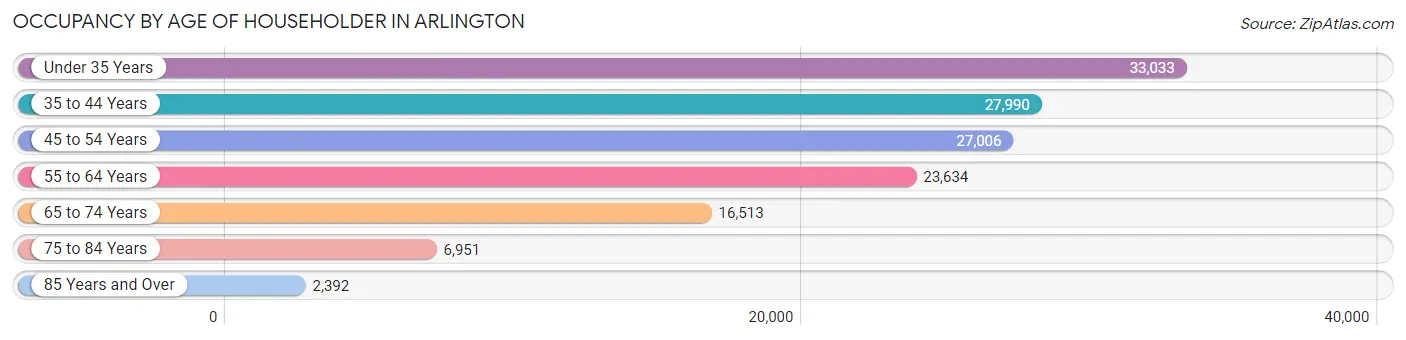
| Age Bracket | # Households | % Households |
| Under 35 Years | 33,033 | 24.0% |
| 35 to 44 Years | 27,990 | 20.3% |
| 45 to 54 Years | 27,006 | 19.6% |
| 55 to 64 Years | 23,634 | 17.2% |
| 65 to 74 Years | 16,513 | 12.0% |
| 75 to 84 Years | 6,951 | 5.1% |
| 85 Years and Over | 2,392 | 1.7% |
| Total | 137,519 | 100.0% |
Housing Finances in Arlington
Median Income by Occupancy in Arlington
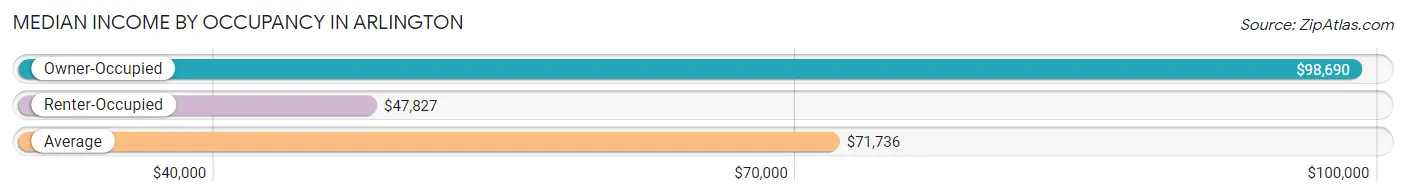
| Occupancy Type | # Households | Median Income |
| Owner-Occupied | 75,484 (54.9%) | $98,690 |
| Renter-Occupied | 62,035 (45.1%) | $47,827 |
| Average | 137,519 (100.0%) | $71,736 |
Occupancy by Householder Income Bracket in Arlington
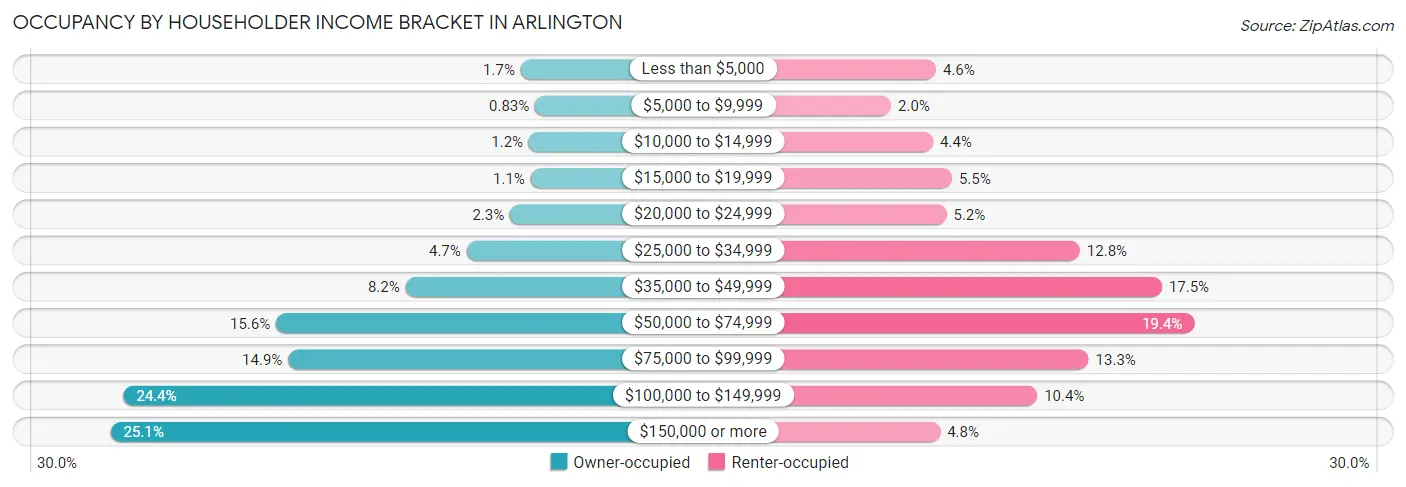
| Income Bracket | Owner-occupied | Renter-occupied |
| Less than $5,000 | 1,244 (1.7%) | 2,856 (4.6%) |
| $5,000 to $9,999 | 625 (0.8%) | 1,258 (2.0%) |
| $10,000 to $14,999 | 892 (1.2%) | 2,749 (4.4%) |
| $15,000 to $19,999 | 819 (1.1%) | 3,416 (5.5%) |
| $20,000 to $24,999 | 1,709 (2.3%) | 3,224 (5.2%) |
| $25,000 to $34,999 | 3,577 (4.7%) | 7,955 (12.8%) |
| $35,000 to $49,999 | 6,214 (8.2%) | 10,865 (17.5%) |
| $50,000 to $74,999 | 11,799 (15.6%) | 12,006 (19.4%) |
| $75,000 to $99,999 | 11,281 (14.9%) | 8,264 (13.3%) |
| $100,000 to $149,999 | 18,387 (24.4%) | 6,442 (10.4%) |
| $150,000 or more | 18,937 (25.1%) | 3,000 (4.8%) |
| Total | 75,484 (100.0%) | 62,035 (100.0%) |
Monthly Housing Cost Tiers in Arlington
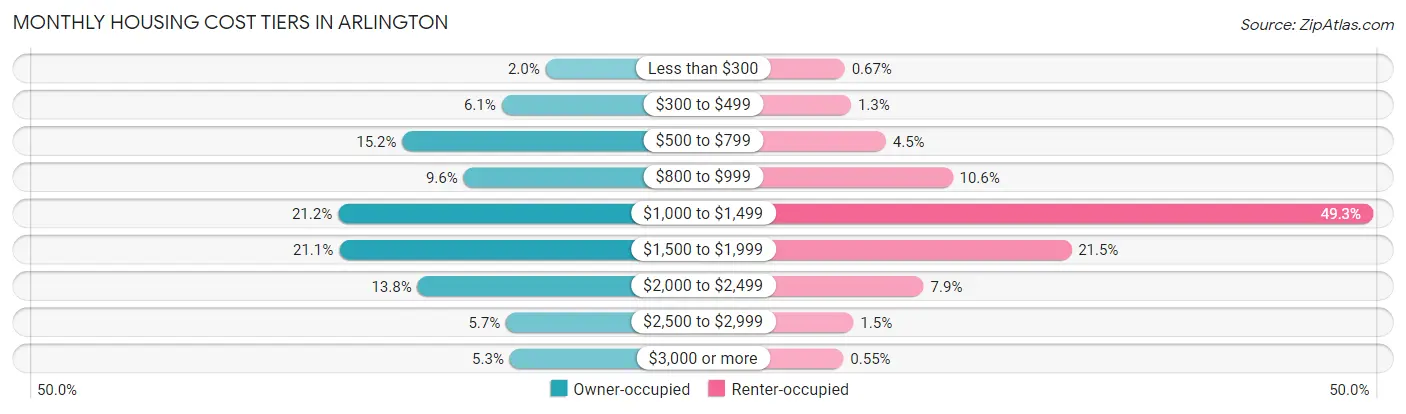
| Monthly Cost | Owner-occupied | Renter-occupied |
| Less than $300 | 1,539 (2.0%) | 416 (0.7%) |
| $300 to $499 | 4,598 (6.1%) | 773 (1.3%) |
| $500 to $799 | 11,499 (15.2%) | 2,764 (4.5%) |
| $800 to $999 | 7,242 (9.6%) | 6,573 (10.6%) |
| $1,000 to $1,499 | 15,967 (21.1%) | 30,575 (49.3%) |
| $1,500 to $1,999 | 15,886 (21.0%) | 13,351 (21.5%) |
| $2,000 to $2,499 | 10,437 (13.8%) | 4,928 (7.9%) |
| $2,500 to $2,999 | 4,288 (5.7%) | 913 (1.5%) |
| $3,000 or more | 4,028 (5.3%) | 339 (0.5%) |
| Total | 75,484 (100.0%) | 62,035 (100.0%) |
Physical Housing Characteristics in Arlington
Housing Structures in Arlington
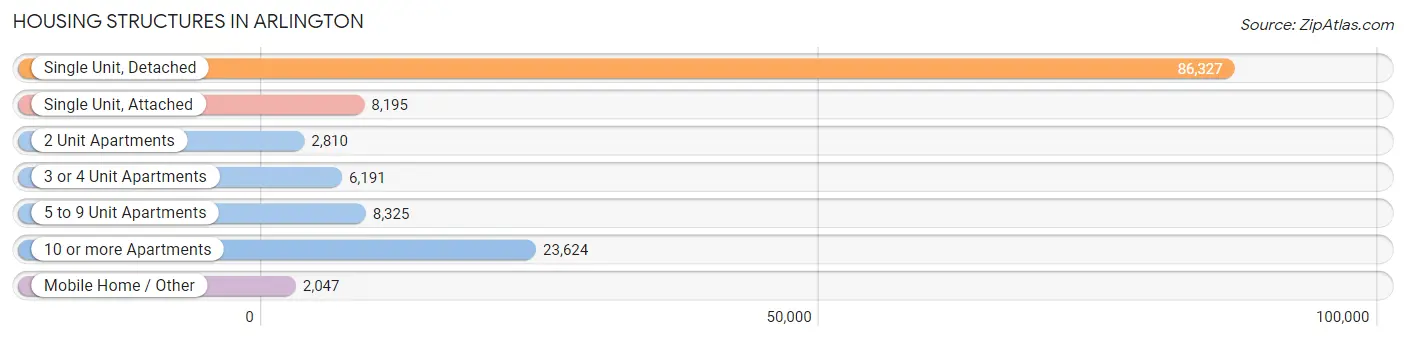
| Structure Type | # Housing Units | % Housing Units |
| Single Unit, Detached | 86,327 | 62.8% |
| Single Unit, Attached | 8,195 | 6.0% |
| 2 Unit Apartments | 2,810 | 2.0% |
| 3 or 4 Unit Apartments | 6,191 | 4.5% |
| 5 to 9 Unit Apartments | 8,325 | 6.0% |
| 10 or more Apartments | 23,624 | 17.2% |
| Mobile Home / Other | 2,047 | 1.5% |
| Total | 137,519 | 100.0% |
Housing Structures by Occupancy in Arlington
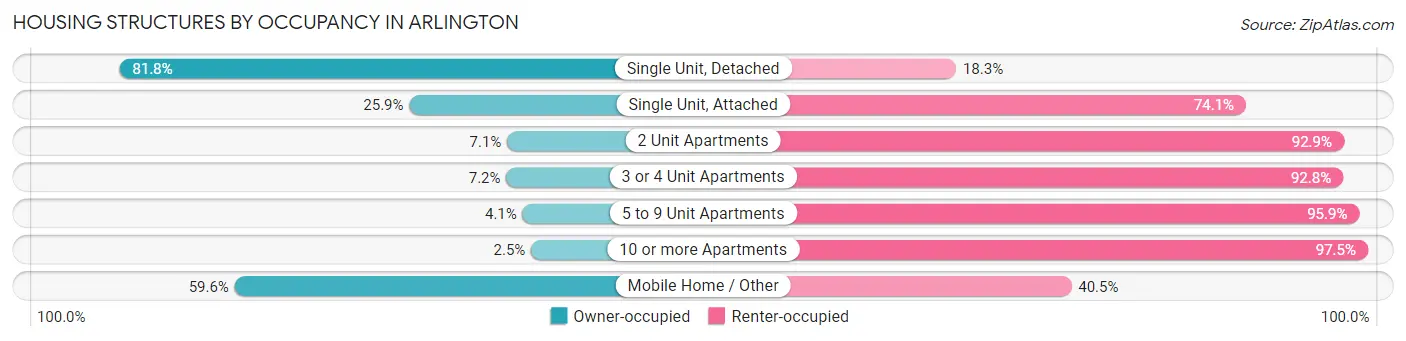
| Structure Type | Owner-occupied | Renter-occupied |
| Single Unit, Detached | 70,572 (81.8%) | 15,755 (18.2%) |
| Single Unit, Attached | 2,124 (25.9%) | 6,071 (74.1%) |
| 2 Unit Apartments | 199 (7.1%) | 2,611 (92.9%) |
| 3 or 4 Unit Apartments | 448 (7.2%) | 5,743 (92.8%) |
| 5 to 9 Unit Apartments | 342 (4.1%) | 7,983 (95.9%) |
| 10 or more Apartments | 580 (2.5%) | 23,044 (97.5%) |
| Mobile Home / Other | 1,219 (59.6%) | 828 (40.5%) |
| Total | 75,484 (54.9%) | 62,035 (45.1%) |
Housing Structures by Number of Rooms in Arlington
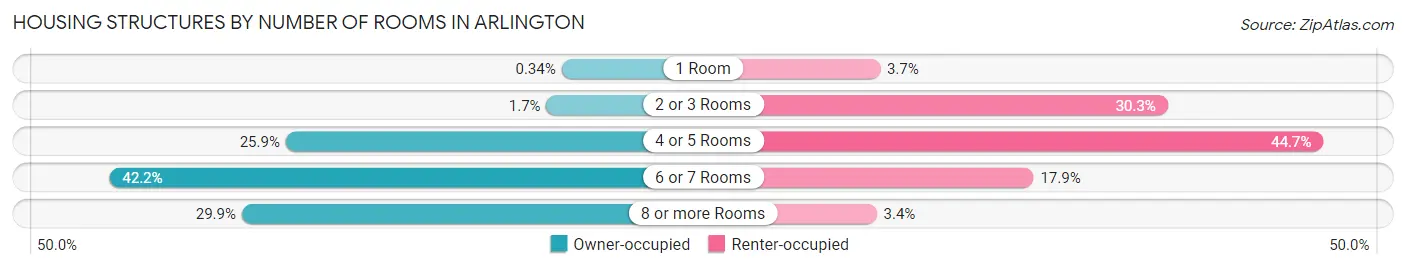
| Number of Rooms | Owner-occupied | Renter-occupied |
| 1 Room | 256 (0.3%) | 2,296 (3.7%) |
| 2 or 3 Rooms | 1,316 (1.7%) | 18,804 (30.3%) |
| 4 or 5 Rooms | 19,513 (25.9%) | 27,731 (44.7%) |
| 6 or 7 Rooms | 31,821 (42.2%) | 11,103 (17.9%) |
| 8 or more Rooms | 22,578 (29.9%) | 2,101 (3.4%) |
| Total | 75,484 (100.0%) | 62,035 (100.0%) |
Housing Structure by Heating Type in Arlington
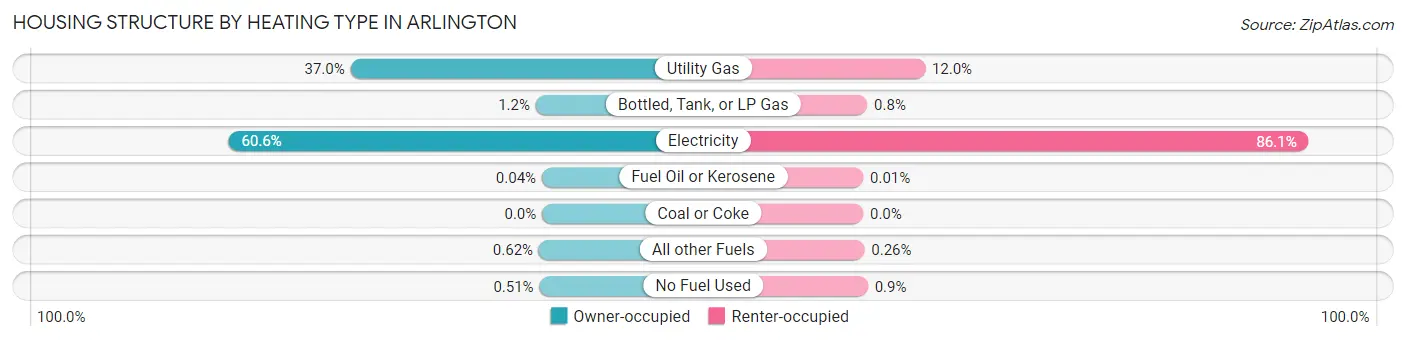
| Heating Type | Owner-occupied | Renter-occupied |
| Utility Gas | 27,944 (37.0%) | 7,418 (12.0%) |
| Bottled, Tank, or LP Gas | 920 (1.2%) | 495 (0.8%) |
| Electricity | 45,741 (60.6%) | 53,395 (86.1%) |
| Fuel Oil or Kerosene | 27 (0.0%) | 8 (0.0%) |
| Coal or Coke | 0 (0.0%) | 0 (0.0%) |
| All other Fuels | 466 (0.6%) | 161 (0.3%) |
| No Fuel Used | 386 (0.5%) | 558 (0.9%) |
| Total | 75,484 (100.0%) | 62,035 (100.0%) |
Household Vehicle Usage in Arlington
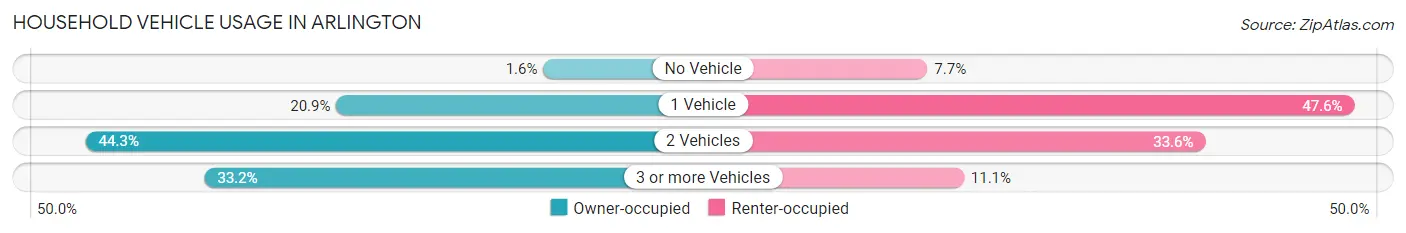
| Vehicles per Household | Owner-occupied | Renter-occupied |
| No Vehicle | 1,194 (1.6%) | 4,774 (7.7%) |
| 1 Vehicle | 15,773 (20.9%) | 29,506 (47.6%) |
| 2 Vehicles | 33,444 (44.3%) | 20,868 (33.6%) |
| 3 or more Vehicles | 25,073 (33.2%) | 6,887 (11.1%) |
| Total | 75,484 (100.0%) | 62,035 (100.0%) |
Real Estate & Mortgages in Arlington
Real Estate and Mortgage Overview in Arlington
| Characteristic | Without Mortgage | With Mortgage |
| Housing Units | 29,350 | 46,134 |
| Median Property Value | $235,600 | $261,200 |
| Median Household Income | $79,221 | $13,233 |
| Monthly Housing Costs | $749 | $3,928 |
| Real Estate Taxes | $3,721 | $2,266 |
Property Value by Mortgage Status in Arlington
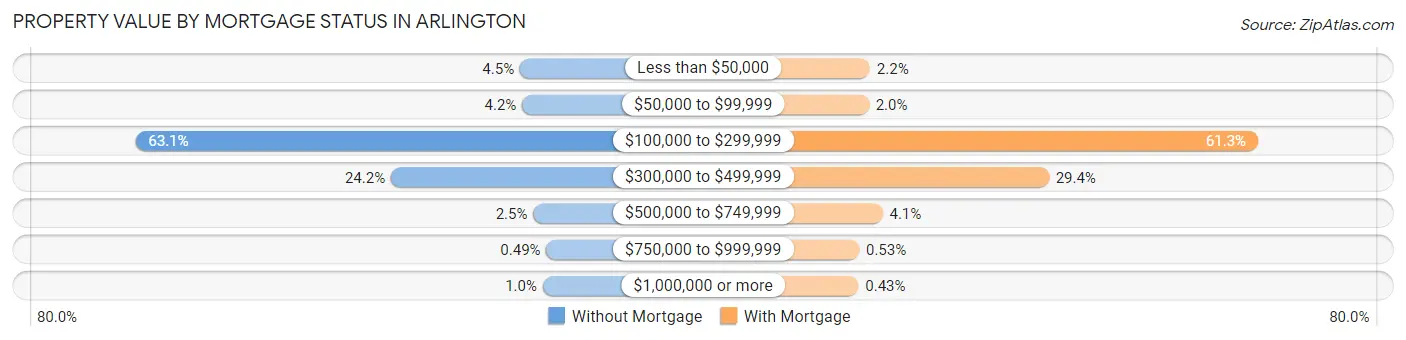
| Property Value | Without Mortgage | With Mortgage |
| Less than $50,000 | 1,325 (4.5%) | 1,012 (2.2%) |
| $50,000 to $99,999 | 1,226 (4.2%) | 921 (2.0%) |
| $100,000 to $299,999 | 18,527 (63.1%) | 28,285 (61.3%) |
| $300,000 to $499,999 | 7,094 (24.2%) | 13,576 (29.4%) |
| $500,000 to $749,999 | 732 (2.5%) | 1,898 (4.1%) |
| $750,000 to $999,999 | 144 (0.5%) | 243 (0.5%) |
| $1,000,000 or more | 302 (1.0%) | 199 (0.4%) |
| Total | 29,350 (100.0%) | 46,134 (100.0%) |
Household Income by Mortgage Status in Arlington
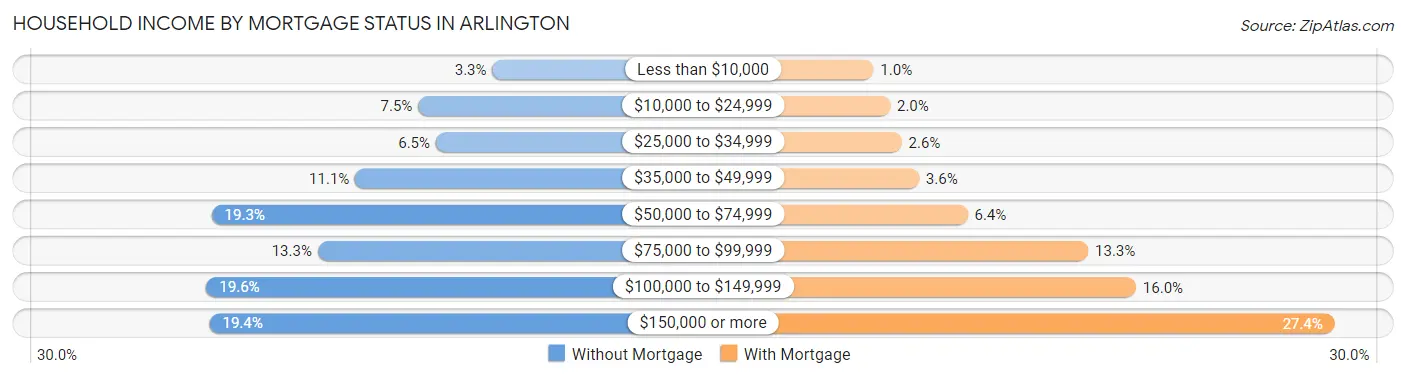
| Household Income | Without Mortgage | With Mortgage |
| Less than $10,000 | 960 (3.3%) | 469 (1.0%) |
| $10,000 to $24,999 | 2,205 (7.5%) | 909 (2.0%) |
| $25,000 to $34,999 | 1,909 (6.5%) | 1,215 (2.6%) |
| $35,000 to $49,999 | 3,260 (11.1%) | 1,668 (3.6%) |
| $50,000 to $74,999 | 5,667 (19.3%) | 2,954 (6.4%) |
| $75,000 to $99,999 | 3,890 (13.3%) | 6,132 (13.3%) |
| $100,000 to $149,999 | 5,755 (19.6%) | 7,391 (16.0%) |
| $150,000 or more | 5,704 (19.4%) | 12,632 (27.4%) |
| Total | 29,350 (100.0%) | 46,134 (100.0%) |
Property Value to Household Income Ratio in Arlington
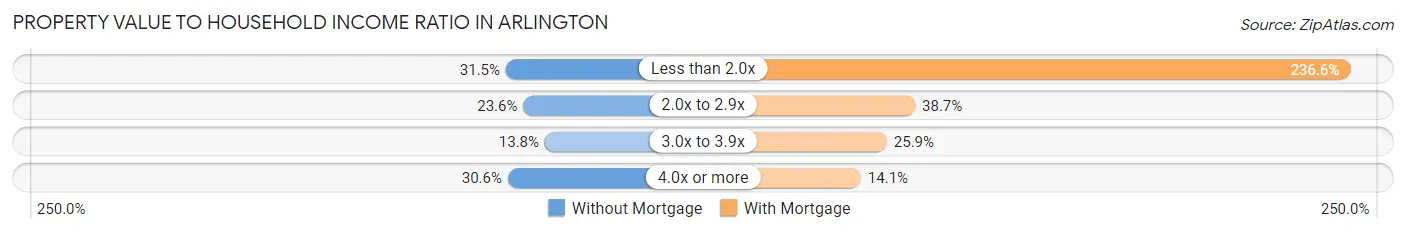
| Value-to-Income Ratio | Without Mortgage | With Mortgage |
| Less than 2.0x | 9,243 (31.5%) | 109,171 (236.6%) |
| 2.0x to 2.9x | 6,925 (23.6%) | 17,851 (38.7%) |
| 3.0x to 3.9x | 4,044 (13.8%) | 11,927 (25.9%) |
| 4.0x or more | 8,988 (30.6%) | 6,488 (14.1%) |
| Total | 29,350 (100.0%) | 46,134 (100.0%) |
Real Estate Taxes by Mortgage Status in Arlington
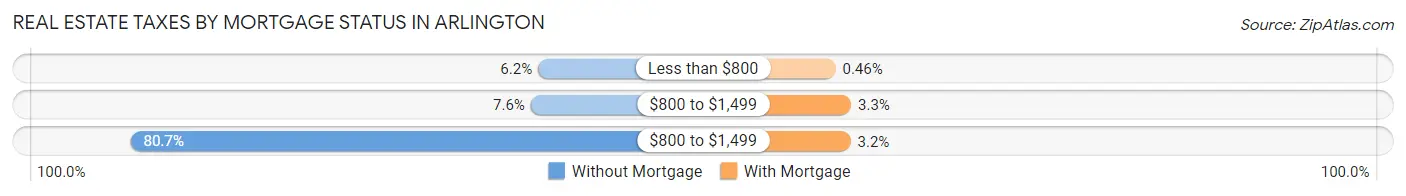
| Property Taxes | Without Mortgage | With Mortgage |
| Less than $800 | 1,829 (6.2%) | 214 (0.5%) |
| $800 to $1,499 | 2,222 (7.6%) | 1,522 (3.3%) |
| $800 to $1,499 | 23,670 (80.6%) | 1,475 (3.2%) |
| Total | 29,350 (100.0%) | 46,134 (100.0%) |
Health & Disability in Arlington
Health Insurance Coverage by Age in Arlington
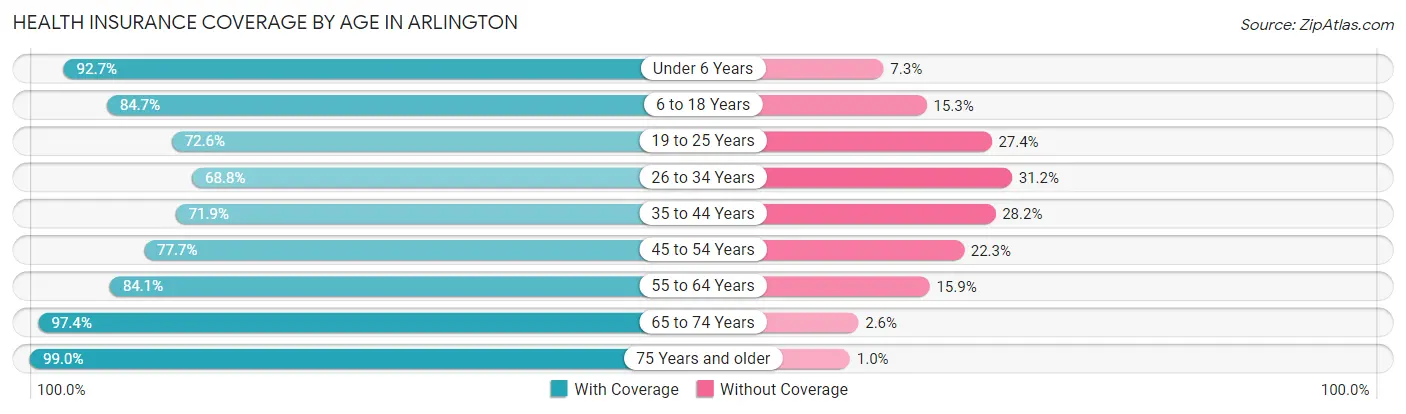
| Age Bracket | With Coverage | Without Coverage |
| Under 6 Years | 28,489 (92.7%) | 2,241 (7.3%) |
| 6 to 18 Years | 63,974 (84.7%) | 11,593 (15.3%) |
| 19 to 25 Years | 34,046 (72.6%) | 12,876 (27.4%) |
| 26 to 34 Years | 37,235 (68.8%) | 16,911 (31.2%) |
| 35 to 44 Years | 37,182 (71.9%) | 14,567 (28.1%) |
| 45 to 54 Years | 37,160 (77.7%) | 10,652 (22.3%) |
| 55 to 64 Years | 35,345 (84.1%) | 6,675 (15.9%) |
| 65 to 74 Years | 27,145 (97.4%) | 728 (2.6%) |
| 75 Years and older | 15,010 (99.0%) | 156 (1.0%) |
| Total | 315,586 (80.5%) | 76,399 (19.5%) |
Health Insurance Coverage by Citizenship Status in Arlington
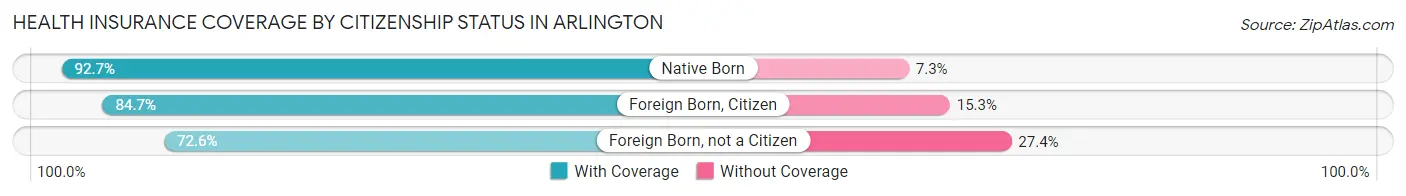
| Citizenship Status | With Coverage | Without Coverage |
| Native Born | 28,489 (92.7%) | 2,241 (7.3%) |
| Foreign Born, Citizen | 63,974 (84.7%) | 11,593 (15.3%) |
| Foreign Born, not a Citizen | 34,046 (72.6%) | 12,876 (27.4%) |
Health Insurance Coverage by Household Income in Arlington
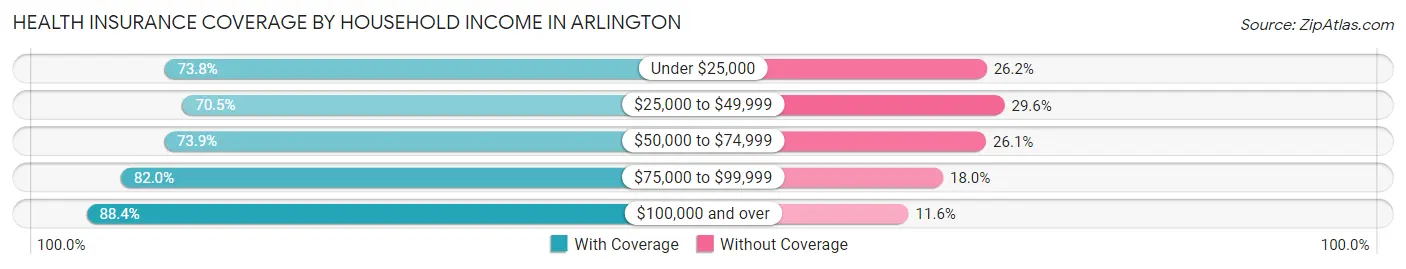
| Household Income | With Coverage | Without Coverage |
| Under $25,000 | 29,007 (73.8%) | 10,303 (26.2%) |
| $25,000 to $49,999 | 46,968 (70.5%) | 19,702 (29.5%) |
| $50,000 to $74,999 | 47,495 (73.9%) | 16,783 (26.1%) |
| $75,000 to $99,999 | 48,370 (82.0%) | 10,650 (18.0%) |
| $100,000 and over | 140,013 (88.4%) | 18,360 (11.6%) |
Public vs Private Health Insurance Coverage by Age in Arlington

| Age Bracket | Public Insurance | Private Insurance |
| Under 6 | 15,846 (51.6%) | 14,339 (46.7%) |
| 6 to 18 Years | 28,016 (37.1%) | 38,229 (50.6%) |
| 19 to 25 Years | 4,347 (9.3%) | 30,976 (66.0%) |
| 25 to 34 Years | 5,519 (10.2%) | 32,864 (60.7%) |
| 35 to 44 Years | 3,905 (7.5%) | 34,345 (66.4%) |
| 45 to 54 Years | 3,994 (8.4%) | 34,350 (71.8%) |
| 55 to 64 Years | 4,747 (11.3%) | 32,014 (76.2%) |
| 65 to 74 Years | 24,939 (89.5%) | 14,191 (50.9%) |
| 75 Years and over | 14,749 (97.3%) | 7,674 (50.6%) |
| Total | 106,062 (27.1%) | 238,982 (61.0%) |
Disability Status by Sex by Age in Arlington
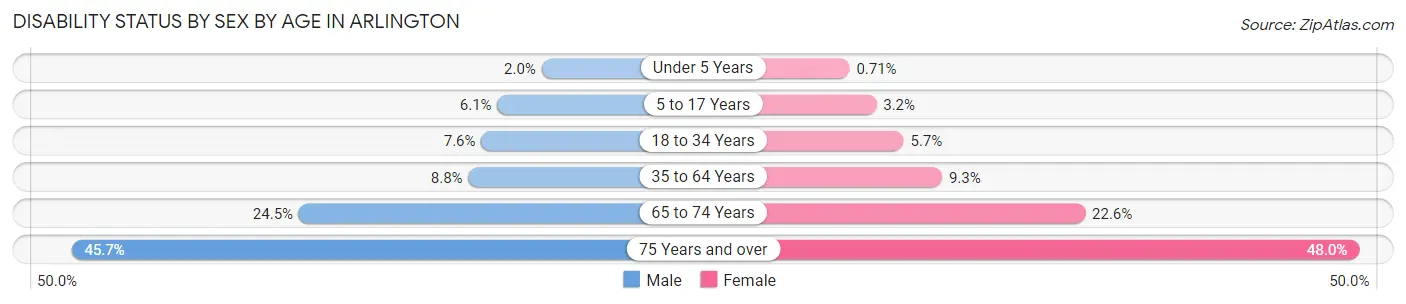
| Age Bracket | Male | Female |
| Under 5 Years | 250 (2.0%) | 91 (0.7%) |
| 5 to 17 Years | 2,348 (6.1%) | 1,149 (3.2%) |
| 18 to 34 Years | 4,106 (7.6%) | 3,087 (5.7%) |
| 35 to 64 Years | 5,982 (8.8%) | 6,853 (9.3%) |
| 65 to 74 Years | 3,225 (24.5%) | 3,326 (22.6%) |
| 75 Years and over | 2,873 (45.7%) | 4,260 (48.0%) |
Disability Class by Sex by Age in Arlington
Disability Class: Hearing Difficulty
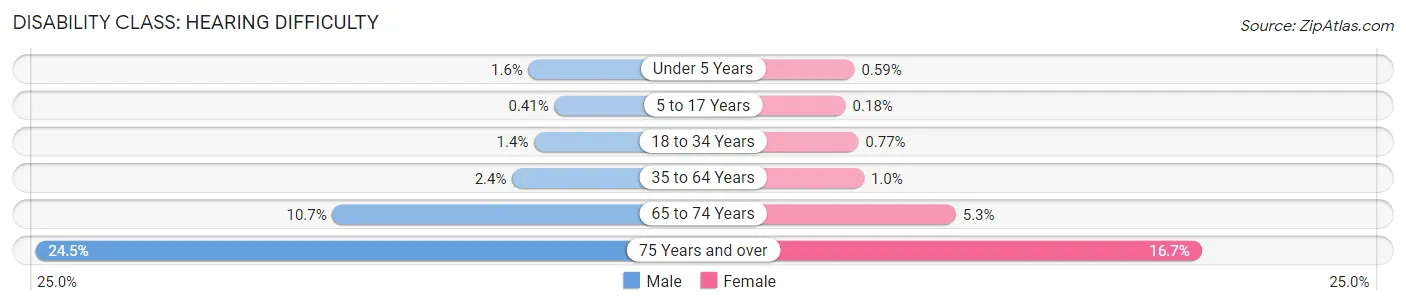
| Age Bracket | Male | Female |
| Under 5 Years | 200 (1.6%) | 75 (0.6%) |
| 5 to 17 Years | 158 (0.4%) | 64 (0.2%) |
| 18 to 34 Years | 726 (1.3%) | 413 (0.8%) |
| 35 to 64 Years | 1,606 (2.4%) | 758 (1.0%) |
| 65 to 74 Years | 1,407 (10.7%) | 779 (5.3%) |
| 75 Years and over | 1,542 (24.5%) | 1,481 (16.7%) |
Disability Class: Vision Difficulty
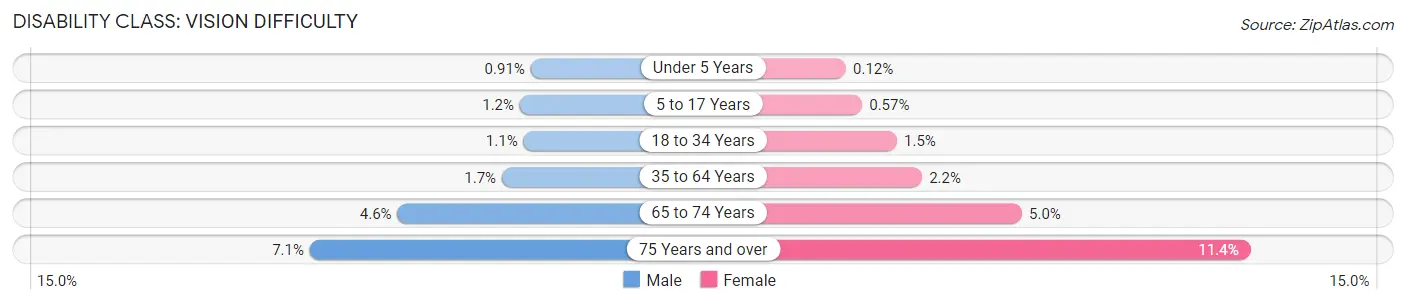
| Age Bracket | Male | Female |
| Under 5 Years | 113 (0.9%) | 16 (0.1%) |
| 5 to 17 Years | 464 (1.2%) | 205 (0.6%) |
| 18 to 34 Years | 600 (1.1%) | 832 (1.5%) |
| 35 to 64 Years | 1,160 (1.7%) | 1,651 (2.2%) |
| 65 to 74 Years | 607 (4.6%) | 739 (5.0%) |
| 75 Years and over | 444 (7.1%) | 1,010 (11.4%) |
Disability Class: Cognitive Difficulty
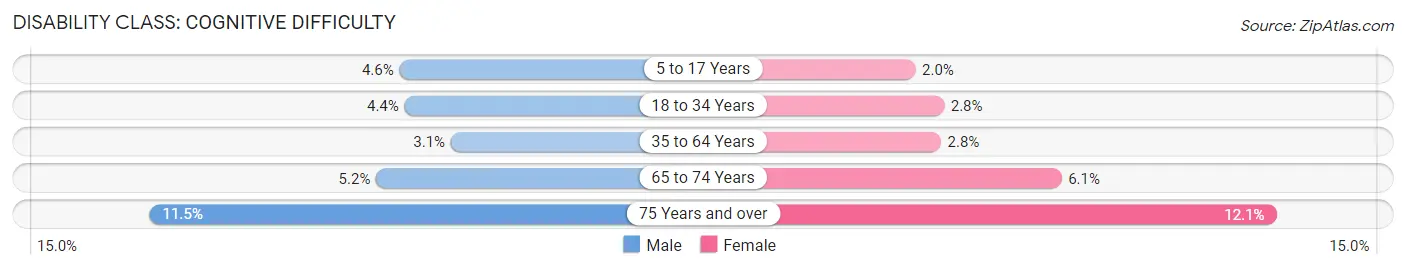
| Age Bracket | Male | Female |
| 5 to 17 Years | 1,749 (4.6%) | 734 (2.0%) |
| 18 to 34 Years | 2,385 (4.4%) | 1,528 (2.8%) |
| 35 to 64 Years | 2,125 (3.1%) | 2,023 (2.8%) |
| 65 to 74 Years | 685 (5.2%) | 900 (6.1%) |
| 75 Years and over | 725 (11.5%) | 1,074 (12.1%) |
Disability Class: Ambulatory Difficulty
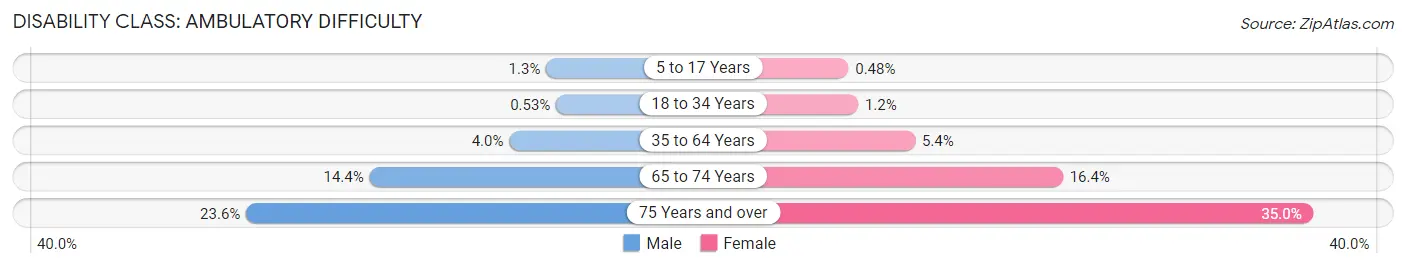
| Age Bracket | Male | Female |
| 5 to 17 Years | 488 (1.3%) | 171 (0.5%) |
| 18 to 34 Years | 288 (0.5%) | 645 (1.2%) |
| 35 to 64 Years | 2,723 (4.0%) | 3,998 (5.4%) |
| 65 to 74 Years | 1,891 (14.4%) | 2,416 (16.4%) |
| 75 Years and over | 1,482 (23.5%) | 3,107 (35.0%) |
Disability Class: Self-Care Difficulty
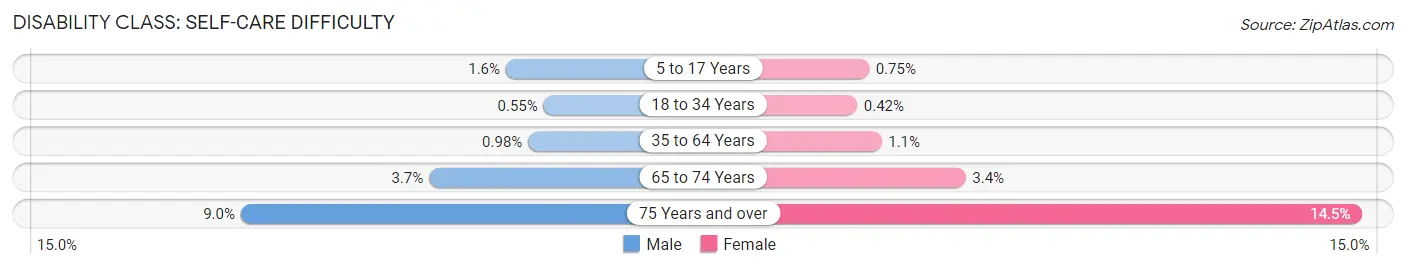
| Age Bracket | Male | Female |
| 5 to 17 Years | 615 (1.6%) | 270 (0.7%) |
| 18 to 34 Years | 297 (0.5%) | 226 (0.4%) |
| 35 to 64 Years | 663 (1.0%) | 807 (1.1%) |
| 65 to 74 Years | 492 (3.7%) | 507 (3.4%) |
| 75 Years and over | 565 (9.0%) | 1,286 (14.5%) |
Technology Access in Arlington
Computing Device Access in Arlington
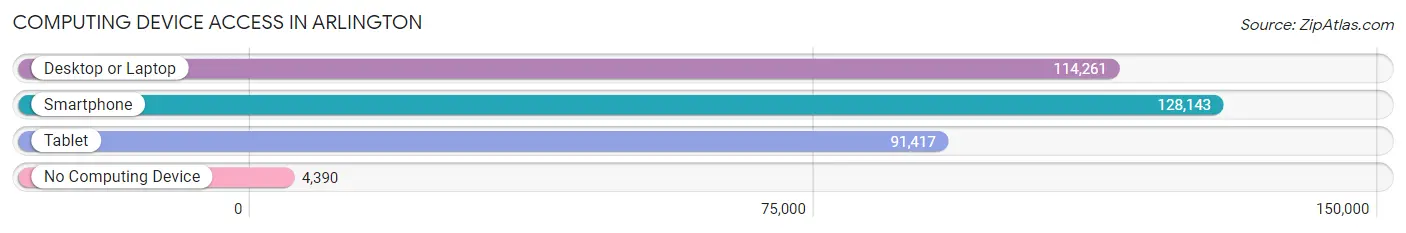
| Device Type | # Households | % Households |
| Desktop or Laptop | 114,261 | 83.1% |
| Smartphone | 128,143 | 93.2% |
| Tablet | 91,417 | 66.5% |
| No Computing Device | 4,390 | 3.2% |
| Total | 137,519 | 100.0% |
Internet Access in Arlington
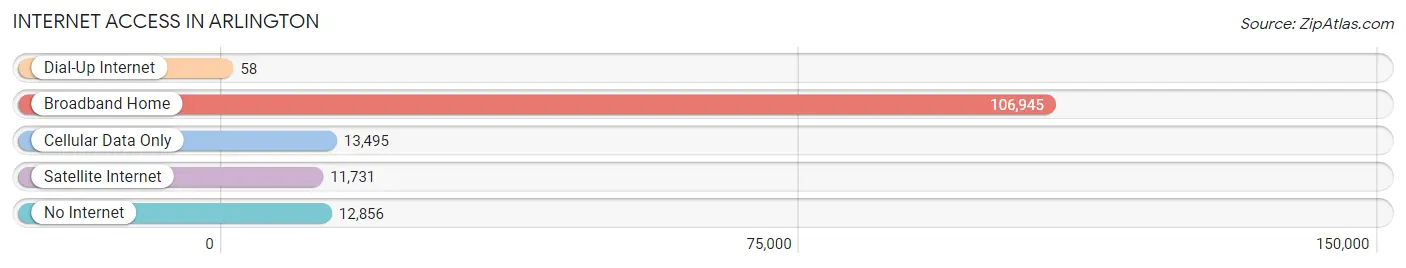
| Internet Type | # Households | % Households |
| Dial-Up Internet | 58 | 0.0% |
| Broadband Home | 106,945 | 77.8% |
| Cellular Data Only | 13,495 | 9.8% |
| Satellite Internet | 11,731 | 8.5% |
| No Internet | 12,856 | 9.3% |
| Total | 137,519 | 100.0% |
Arlington Summary
Arlington, Texas is a city located in Tarrant County, Texas, United States. It is part of the Dallas-Fort Worth-Arlington metropolitan area, and is the seventh-largest city in the state of Texas. The city is situated between Dallas and Fort Worth, and is the third-largest city in the Metroplex. Arlington is home to the University of Texas at Arlington, the Texas Rangers baseball team, and the Dallas Cowboys football team.
History
Arlington was founded in 1876 by settlers from the nearby town of Birdville. The city was named after General Robert E. Lee's Arlington House in Arlington, Virginia. The city was incorporated in 1884, and by the early 1900s, it had become a thriving agricultural and industrial center.
In the 1950s, the city began to experience rapid growth due to the expansion of the Dallas-Fort Worth metropolitan area. The city was home to the Texas Rangers baseball team from 1972 to 1993, and the Dallas Cowboys football team from 1971 to 2009.
Geography
Arlington is located in the central part of Tarrant County, Texas, and is situated between Dallas and Fort Worth. The city covers an area of 99.7 square miles, and has an elevation of 645 feet. The city is bordered by the cities of Grand Prairie, Mansfield, and Kennedale.
The city is divided into four distinct regions: North Arlington, South Arlington, East Arlington, and West Arlington. The city is home to several parks, including River Legacy Park, Lake Arlington, and the Arlington Sports Park.
Economy
Arlington is home to a diverse economy, with a variety of industries represented. The city is home to several major employers, including the University of Texas at Arlington, the Texas Rangers baseball team, and the Dallas Cowboys football team. The city is also home to several major corporations, including General Motors, Lockheed Martin, and AT&T.
The city's economy is also supported by a strong tourism industry. The city is home to several attractions, including Six Flags Over Texas, the International Bowling Museum and Hall of Fame, and the Arlington Museum of Art.
Demographics
As of the 2010 census, the population of Arlington was 365,438, making it the seventh-largest city in the state of Texas. The city has a population density of 3,717 people per square mile. The racial makeup of the city is 63.3% White, 18.3% African American, 0.7% Native American, 5.2% Asian, and 11.5% from other races.
The median household income in Arlington is $50,945, and the median family income is $60,945. The city has a poverty rate of 15.3%, and the unemployment rate is 4.2%. The city has a large Hispanic population, with 33.3% of the population identifying as Hispanic or Latino.
Arlington is a diverse and vibrant city, with a strong economy and a variety of attractions. The city is home to several major employers, and is a popular destination for tourists. The city is also home to a diverse population, with a variety of racial and ethnic backgrounds represented.
Common Questions
What is Per Capita Income in Arlington?
Per Capita income in Arlington is $33,477.
What is the Median Family Income in Arlington?
Median Family Income in Arlington is $84,996.
What is the Median Household income in Arlington?
Median Household Income in Arlington is $71,736.
What is Income or Wage Gap in Arlington?
Income or Wage Gap in Arlington is 24.1%.
Women in Arlington earn 75.9 cents for every dollar earned by a man.
What is Family Income Deficit in Arlington?
Family Income Deficit in Arlington is $10,863.
Families that are below poverty line in Arlington earn $10,863 less on average than the poverty threshold level.
What is Inequality or Gini Index in Arlington?
Inequality or Gini Index in Arlington is 0.43.
What is the Total Population of Arlington?
Total Population of Arlington is 393,469.
What is the Total Male Population of Arlington?
Total Male Population of Arlington is 192,765.
What is the Total Female Population of Arlington?
Total Female Population of Arlington is 200,704.
What is the Ratio of Males per 100 Females in Arlington?
There are 96.04 Males per 100 Females in Arlington.
What is the Ratio of Females per 100 Males in Arlington?
There are 104.12 Females per 100 Males in Arlington.
What is the Median Population Age in Arlington?
Median Population Age in Arlington is 33.1 Years.
What is the Average Family Size in Arlington
Average Family Size in Arlington is 3.5 People.
What is the Average Household Size in Arlington
Average Household Size in Arlington is 2.8 People.
How Large is the Labor Force in Arlington?
There are 214,152 People in the Labor Forcein in Arlington.
What is the Percentage of People in the Labor Force in Arlington?
70.0% of People are in the Labor Force in Arlington.
What is the Unemployment Rate in Arlington?
Unemployment Rate in Arlington is 5.6%.