Willmar, MN Map & Demographics
Willmar Map
Willmar Overview
$29,074
PER CAPITA INCOME
$72,667
AVG FAMILY INCOME
$59,132
AVG HOUSEHOLD INCOME
30.1%
WAGE / INCOME GAP [ % ]
69.9¢/ $1
WAGE / INCOME GAP [ $ ]
$11,553
FAMILY INCOME DEFICIT
0.43
INEQUALITY / GINI INDEX
21,006
TOTAL POPULATION
10,111
MALE POPULATION
10,895
FEMALE POPULATION
92.80
MALES / 100 FEMALES
107.75
FEMALES / 100 MALES
36.4
MEDIAN AGE
3.0
AVG FAMILY SIZE
2.5
AVG HOUSEHOLD SIZE
10,875
LABOR FORCE [ PEOPLE ]
67.0%
PERCENT IN LABOR FORCE
5.4%
UNEMPLOYMENT RATE
Willmar Zip Codes
Willmar Area Codes
Income in Willmar
Income Overview in Willmar
Per Capita Income in Willmar is $29,074, while median incomes of families and households are $72,667 and $59,132 respectively.
| Characteristic | Number | Measure |
| Per Capita Income | 21,006 | $29,074 |
| Median Family Income | 5,075 | $72,667 |
| Mean Family Income | 5,075 | $83,648 |
| Median Household Income | 8,065 | $59,132 |
| Mean Household Income | 8,065 | $72,237 |
| Income Deficit | 5,075 | $11,553 |
| Wage / Income Gap (%) | 21,006 | 30.15% |
| Wage / Income Gap ($) | 21,006 | 69.85¢ per $1 |
| Gini / Inequality Index | 21,006 | 0.43 |
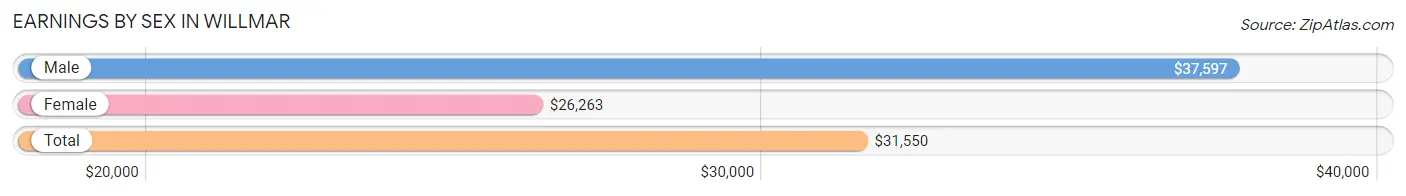
Earnings by Sex in Willmar
Average Earnings in Willmar are $31,550, $37,597 for men and $26,263 for women, a difference of 30.1%.
| Sex | Number | Average Earnings |
| Male | 5,911 (51.0%) | $37,597 |
| Female | 5,680 (49.0%) | $26,263 |
| Total | 11,591 (100.0%) | $31,550 |
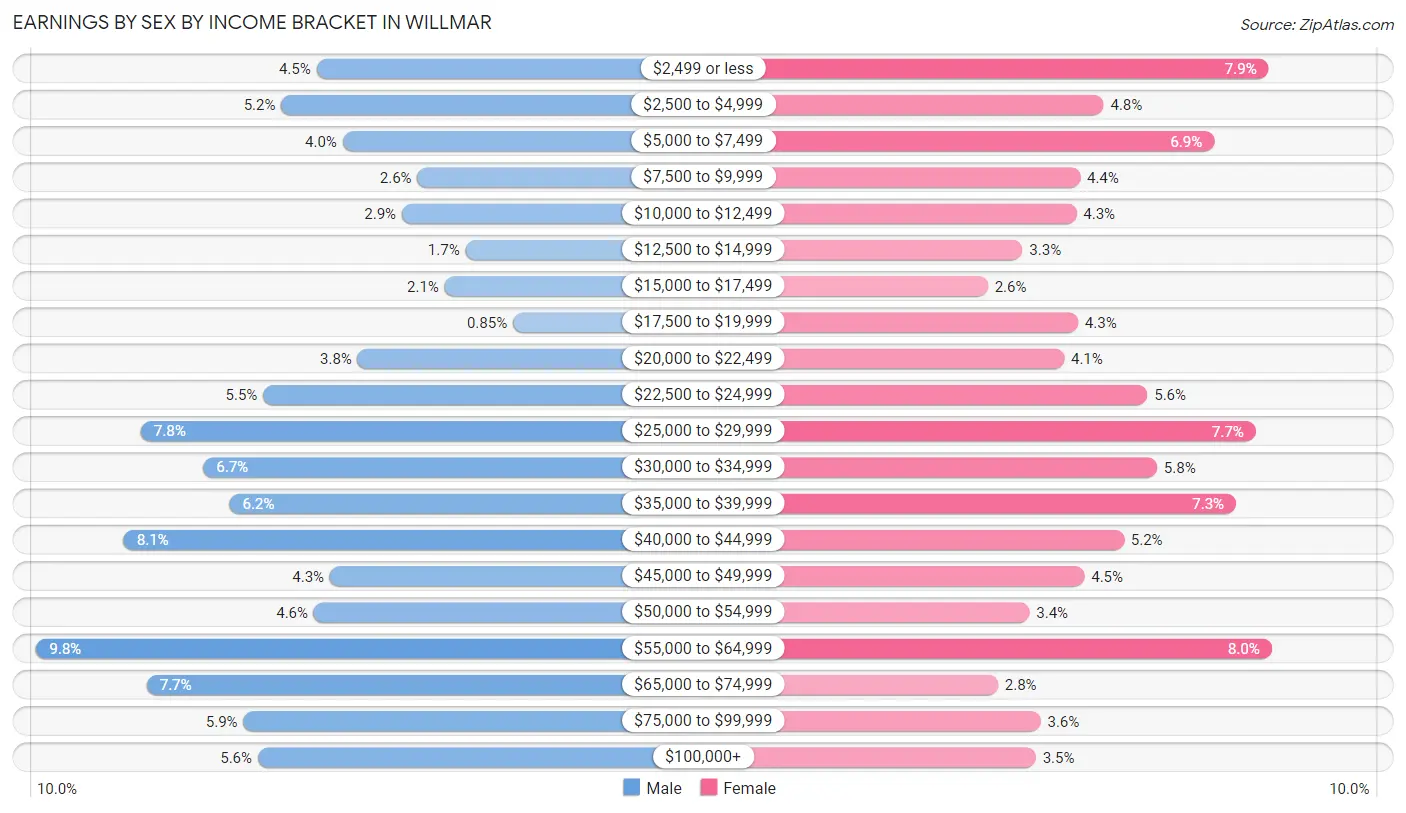
Earnings by Sex by Income Bracket in Willmar
The most common earnings brackets in Willmar are $55,000 to $64,999 for men (578 | 9.8%) and $55,000 to $64,999 for women (452 | 8.0%).
| Income | Male | Female |
| $2,499 or less | 268 (4.5%) | 449 (7.9%) |
| $2,500 to $4,999 | 307 (5.2%) | 273 (4.8%) |
| $5,000 to $7,499 | 239 (4.0%) | 391 (6.9%) |
| $7,500 to $9,999 | 156 (2.6%) | 248 (4.4%) |
| $10,000 to $12,499 | 173 (2.9%) | 244 (4.3%) |
| $12,500 to $14,999 | 103 (1.7%) | 187 (3.3%) |
| $15,000 to $17,499 | 126 (2.1%) | 150 (2.6%) |
| $17,500 to $19,999 | 50 (0.9%) | 246 (4.3%) |
| $20,000 to $22,499 | 222 (3.8%) | 231 (4.1%) |
| $22,500 to $24,999 | 327 (5.5%) | 320 (5.6%) |
| $25,000 to $29,999 | 462 (7.8%) | 435 (7.7%) |
| $30,000 to $34,999 | 393 (6.7%) | 330 (5.8%) |
| $35,000 to $39,999 | 364 (6.2%) | 414 (7.3%) |
| $40,000 to $44,999 | 481 (8.1%) | 295 (5.2%) |
| $45,000 to $49,999 | 253 (4.3%) | 253 (4.4%) |
| $50,000 to $54,999 | 271 (4.6%) | 194 (3.4%) |
| $55,000 to $64,999 | 578 (9.8%) | 452 (8.0%) |
| $65,000 to $74,999 | 456 (7.7%) | 161 (2.8%) |
| $75,000 to $99,999 | 349 (5.9%) | 206 (3.6%) |
| $100,000+ | 333 (5.6%) | 201 (3.5%) |
| Total | 5,911 (100.0%) | 5,680 (100.0%) |
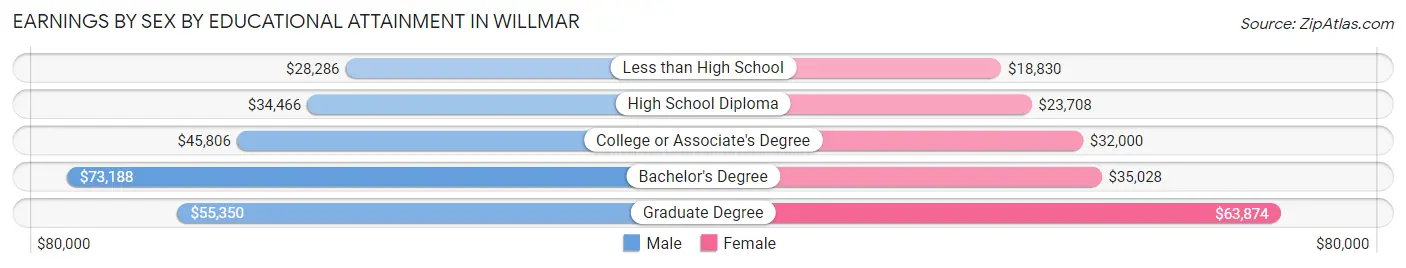
Earnings by Sex by Educational Attainment in Willmar
Average earnings in Willmar are $41,202 for men and $29,662 for women, a difference of 28.0%. Men with an educational attainment of bachelor's degree enjoy the highest average annual earnings of $73,188, while those with less than high school education earn the least with $28,286. Women with an educational attainment of graduate degree earn the most with the average annual earnings of $63,874, while those with less than high school education have the smallest earnings of $18,830.
| Educational Attainment | Male Income | Female Income |
| Less than High School | $28,286 | $18,830 |
| High School Diploma | $34,466 | $23,708 |
| College or Associate's Degree | $45,806 | $32,000 |
| Bachelor's Degree | $73,188 | $35,028 |
| Graduate Degree | $55,350 | $63,874 |
| Total | $41,202 | $29,662 |
Family Income in Willmar
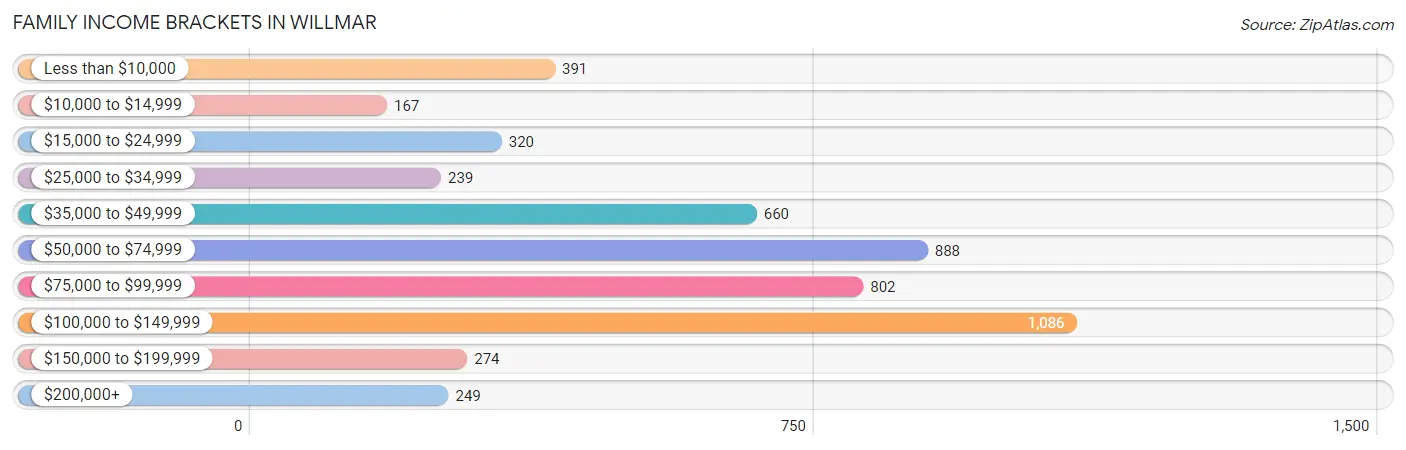
Family Income Brackets in Willmar
According to the Willmar family income data, there are 1,086 families falling into the $100,000 to $149,999 income range, which is the most common income bracket and makes up 21.4% of all families. Conversely, the $10,000 to $14,999 income bracket is the least frequent group with only 167 families (3.3%) belonging to this category.
| Income Bracket | # Families | % Families |
| Less than $10,000 | 391 | 7.7% |
| $10,000 to $14,999 | 167 | 3.3% |
| $15,000 to $24,999 | 320 | 6.3% |
| $25,000 to $34,999 | 239 | 4.7% |
| $35,000 to $49,999 | 660 | 13.0% |
| $50,000 to $74,999 | 888 | 17.5% |
| $75,000 to $99,999 | 802 | 15.8% |
| $100,000 to $149,999 | 1,086 | 21.4% |
| $150,000 to $199,999 | 274 | 5.4% |
| $200,000+ | 249 | 4.9% |
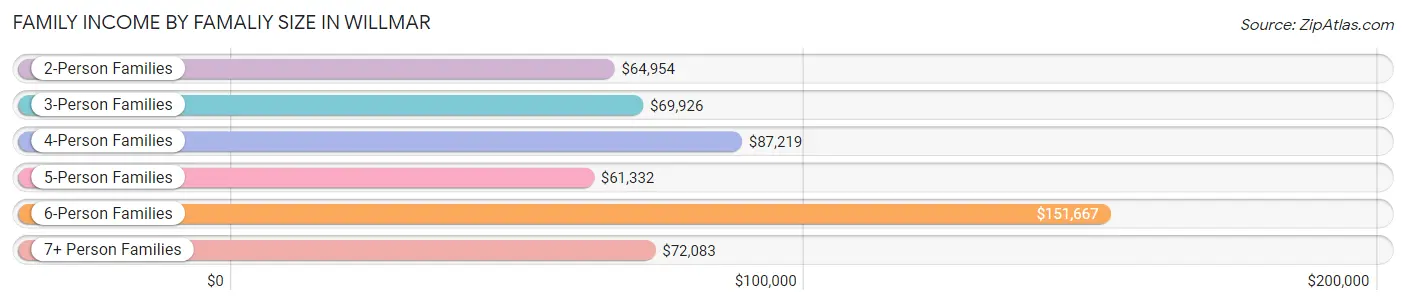
Family Income by Famaliy Size in Willmar
6-person families (218 | 4.3%) account for the highest median family income in Willmar with $151,667 per family, while 2-person families (2,920 | 57.5%) have the highest median income of $32,477 per family member.
| Income Bracket | # Families | Median Income |
| 2-Person Families | 2,920 (57.5%) | $64,954 |
| 3-Person Families | 645 (12.7%) | $69,926 |
| 4-Person Families | 733 (14.4%) | $87,219 |
| 5-Person Families | 429 (8.5%) | $61,332 |
| 6-Person Families | 218 (4.3%) | $151,667 |
| 7+ Person Families | 130 (2.6%) | $72,083 |
| Total | 5,075 (100.0%) | $72,667 |
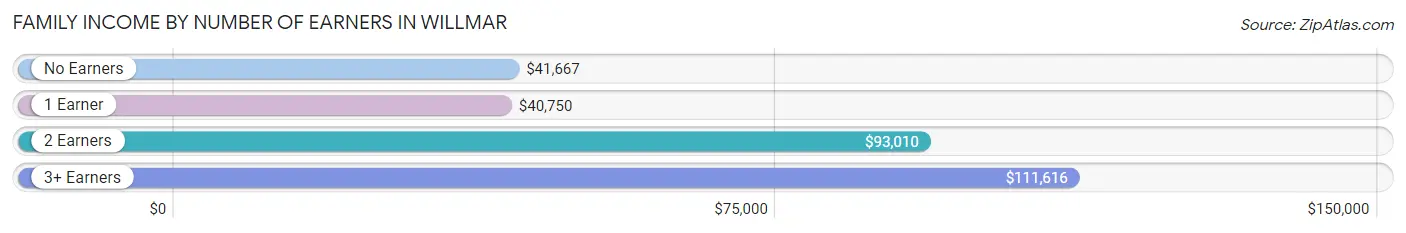
Family Income by Number of Earners in Willmar
The median family income in Willmar is $72,667, with families comprising 3+ earners (611) having the highest median family income of $111,616, while families with 1 earner (1,824) have the lowest median family income of $40,750, accounting for 12.0% and 35.9% of families, respectively.
| Number of Earners | # Families | Median Income |
| No Earners | 624 (12.3%) | $41,667 |
| 1 Earner | 1,824 (35.9%) | $40,750 |
| 2 Earners | 2,016 (39.7%) | $93,010 |
| 3+ Earners | 611 (12.0%) | $111,616 |
| Total | 5,075 (100.0%) | $72,667 |
Household Income in Willmar
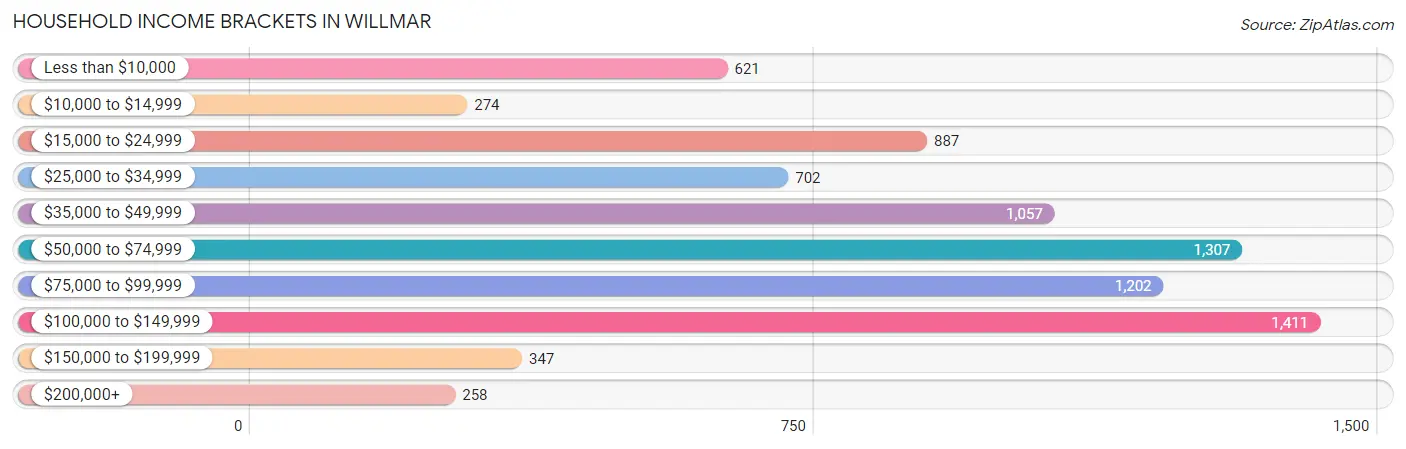
Household Income Brackets in Willmar
With 1,411 households falling in the category, the $100,000 to $149,999 income range is the most frequent in Willmar, accounting for 17.5% of all households. In contrast, only 258 households (3.2%) fall into the $200,000+ income bracket, making it the least populous group.
| Income Bracket | # Households | % Households |
| Less than $10,000 | 621 | 7.7% |
| $10,000 to $14,999 | 274 | 3.4% |
| $15,000 to $24,999 | 887 | 11.0% |
| $25,000 to $34,999 | 702 | 8.7% |
| $35,000 to $49,999 | 1,057 | 13.1% |
| $50,000 to $74,999 | 1,307 | 16.2% |
| $75,000 to $99,999 | 1,202 | 14.9% |
| $100,000 to $149,999 | 1,411 | 17.5% |
| $150,000 to $199,999 | 347 | 4.3% |
| $200,000+ | 258 | 3.2% |
Household Income by Householder Age in Willmar
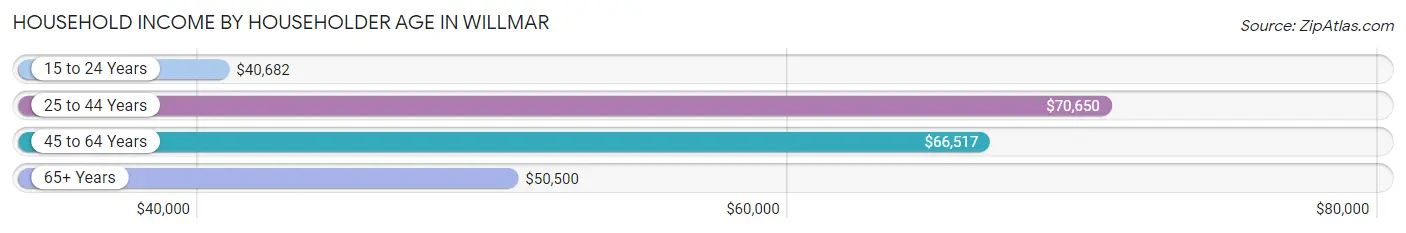
The median household income in Willmar is $59,132, with the highest median household income of $70,650 found in the 25 to 44 years age bracket for the primary householder. A total of 2,364 households (29.3%) fall into this category. Meanwhile, the 15 to 24 years age bracket for the primary householder has the lowest median household income of $40,682, with 676 households (8.4%) in this group.
| Income Bracket | # Households | Median Income |
| 15 to 24 Years | 676 (8.4%) | $40,682 |
| 25 to 44 Years | 2,364 (29.3%) | $70,650 |
| 45 to 64 Years | 2,699 (33.5%) | $66,517 |
| 65+ Years | 2,326 (28.8%) | $50,500 |
| Total | 8,065 (100.0%) | $59,132 |
Poverty in Willmar
Income Below Poverty by Sex and Age in Willmar
With 14.1% poverty level for males and 20.9% for females among the residents of Willmar, 5 year old males and 15 year old females are the most vulnerable to poverty, with 76 males (63.9%) and 49 females (53.3%) in their respective age groups living below the poverty level.
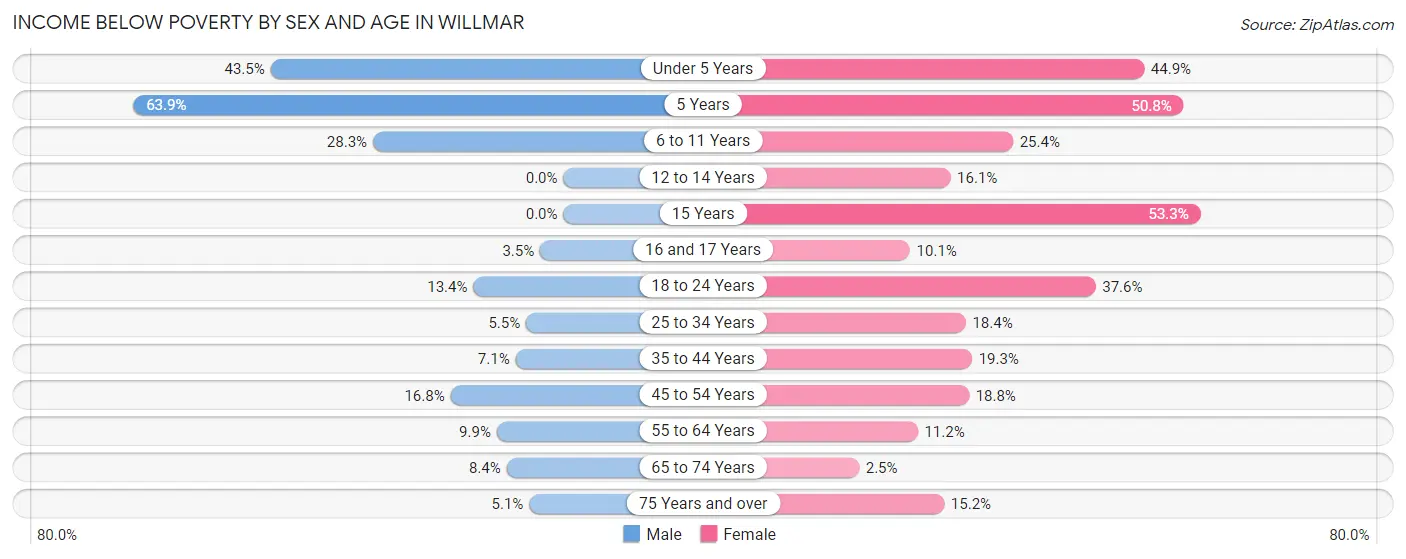
| Age Bracket | Male | Female |
| Under 5 Years | 307 (43.5%) | 297 (44.9%) |
| 5 Years | 76 (63.9%) | 100 (50.8%) |
| 6 to 11 Years | 267 (28.3%) | 253 (25.4%) |
| 12 to 14 Years | 0 (0.0%) | 51 (16.1%) |
| 15 Years | 0 (0.0%) | 49 (53.3%) |
| 16 and 17 Years | 10 (3.5%) | 26 (10.1%) |
| 18 to 24 Years | 138 (13.4%) | 422 (37.6%) |
| 25 to 34 Years | 68 (5.5%) | 270 (18.4%) |
| 35 to 44 Years | 80 (7.1%) | 238 (19.3%) |
| 45 to 54 Years | 187 (16.8%) | 189 (18.8%) |
| 55 to 64 Years | 107 (9.9%) | 149 (11.2%) |
| 65 to 74 Years | 91 (8.4%) | 26 (2.5%) |
| 75 Years and over | 27 (5.1%) | 116 (15.2%) |
| Total | 1,358 (14.1%) | 2,186 (20.9%) |
Income Above Poverty by Sex and Age in Willmar
According to the poverty statistics in Willmar, males aged 12 to 14 years and females aged 65 to 74 years are the age groups that are most secure financially, with 100.0% of males and 97.5% of females in these age groups living above the poverty line.
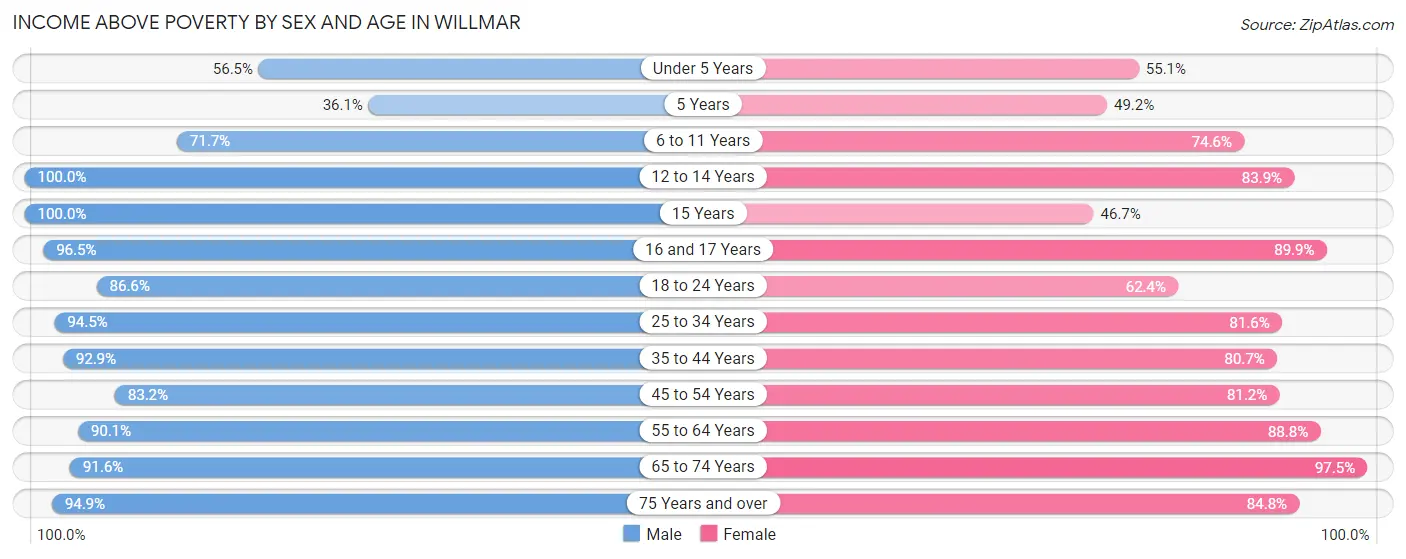
| Age Bracket | Male | Female |
| Under 5 Years | 399 (56.5%) | 365 (55.1%) |
| 5 Years | 43 (36.1%) | 97 (49.2%) |
| 6 to 11 Years | 677 (71.7%) | 744 (74.6%) |
| 12 to 14 Years | 253 (100.0%) | 266 (83.9%) |
| 15 Years | 135 (100.0%) | 43 (46.7%) |
| 16 and 17 Years | 279 (96.5%) | 232 (89.9%) |
| 18 to 24 Years | 894 (86.6%) | 699 (62.4%) |
| 25 to 34 Years | 1,159 (94.5%) | 1,200 (81.6%) |
| 35 to 44 Years | 1,045 (92.9%) | 996 (80.7%) |
| 45 to 54 Years | 929 (83.2%) | 814 (81.2%) |
| 55 to 64 Years | 975 (90.1%) | 1,177 (88.8%) |
| 65 to 74 Years | 990 (91.6%) | 1,004 (97.5%) |
| 75 Years and over | 506 (94.9%) | 649 (84.8%) |
| Total | 8,284 (85.9%) | 8,286 (79.1%) |
Income Below Poverty Among Married-Couple Families in Willmar
The poverty statistics for married-couple families in Willmar show that 5.6% or 197 of the total 3,532 families live below the poverty line. Families with 5 or more children have the highest poverty rate of 30.7%, comprising of 23 families. On the other hand, families with 3 or 4 children have the lowest poverty rate of 2.8%, which includes 11 families.
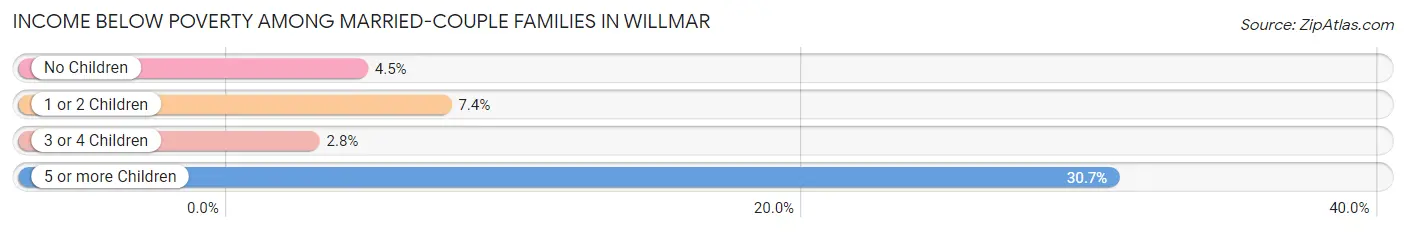
| Children | Above Poverty | Below Poverty |
| No Children | 2,135 (95.5%) | 101 (4.5%) |
| 1 or 2 Children | 772 (92.6%) | 62 (7.4%) |
| 3 or 4 Children | 376 (97.2%) | 11 (2.8%) |
| 5 or more Children | 52 (69.3%) | 23 (30.7%) |
| Total | 3,335 (94.4%) | 197 (5.6%) |
Income Below Poverty Among Single-Parent Households in Willmar
According to the poverty data in Willmar, 22.7% or 102 single-father households and 46.0% or 503 single-mother households are living below the poverty line. Among single-father households, those with 1 or 2 children have the highest poverty rate, with 66 households (31.0%) experiencing poverty. Likewise, among single-mother households, those with 3 or 4 children have the highest poverty rate, with 73 households (81.1%) falling below the poverty line.
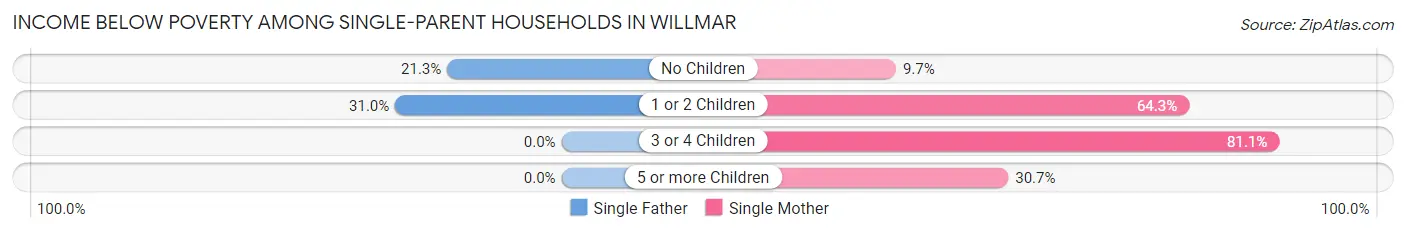
| Children | Single Father | Single Mother |
| No Children | 36 (21.3%) | 34 (9.7%) |
| 1 or 2 Children | 66 (31.0%) | 373 (64.3%) |
| 3 or 4 Children | 0 (0.0%) | 73 (81.1%) |
| 5 or more Children | 0 (0.0%) | 23 (30.7%) |
| Total | 102 (22.7%) | 503 (46.0%) |
Income Below Poverty Among Married-Couple vs Single-Parent Households in Willmar
The poverty data for Willmar shows that 197 of the married-couple family households (5.6%) and 605 of the single-parent households (39.2%) are living below the poverty level. Within the married-couple family households, those with 5 or more children have the highest poverty rate, with 23 households (30.7%) falling below the poverty line. Among the single-parent households, those with 1 or 2 children have the highest poverty rate, with 439 household (55.4%) living below poverty.
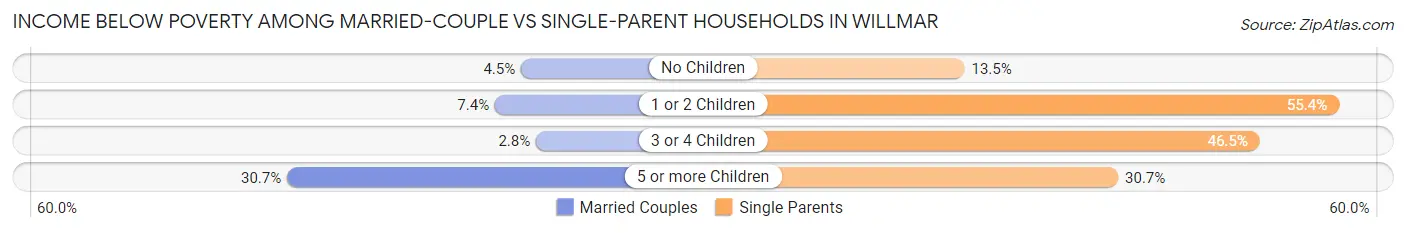
| Children | Married-Couple Families | Single-Parent Households |
| No Children | 101 (4.5%) | 70 (13.5%) |
| 1 or 2 Children | 62 (7.4%) | 439 (55.4%) |
| 3 or 4 Children | 11 (2.8%) | 73 (46.5%) |
| 5 or more Children | 23 (30.7%) | 23 (30.7%) |
| Total | 197 (5.6%) | 605 (39.2%) |
Race in Willmar
The most populous races in Willmar are White / Caucasian (15,195 | 72.3%), Hispanic or Latino (5,014 | 23.9%), and Black / African American (2,415 | 11.5%).
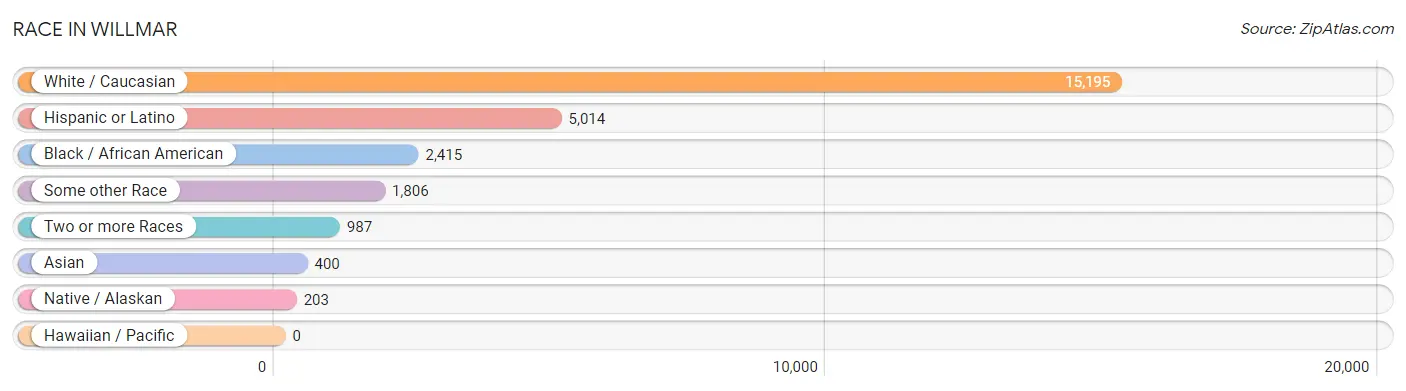
| Race | # Population | % Population |
| Asian | 400 | 1.9% |
| Black / African American | 2,415 | 11.5% |
| Hawaiian / Pacific | 0 | 0.0% |
| Hispanic or Latino | 5,014 | 23.9% |
| Native / Alaskan | 203 | 1.0% |
| White / Caucasian | 15,195 | 72.3% |
| Two or more Races | 987 | 4.7% |
| Some other Race | 1,806 | 8.6% |
| Total | 21,006 | 100.0% |
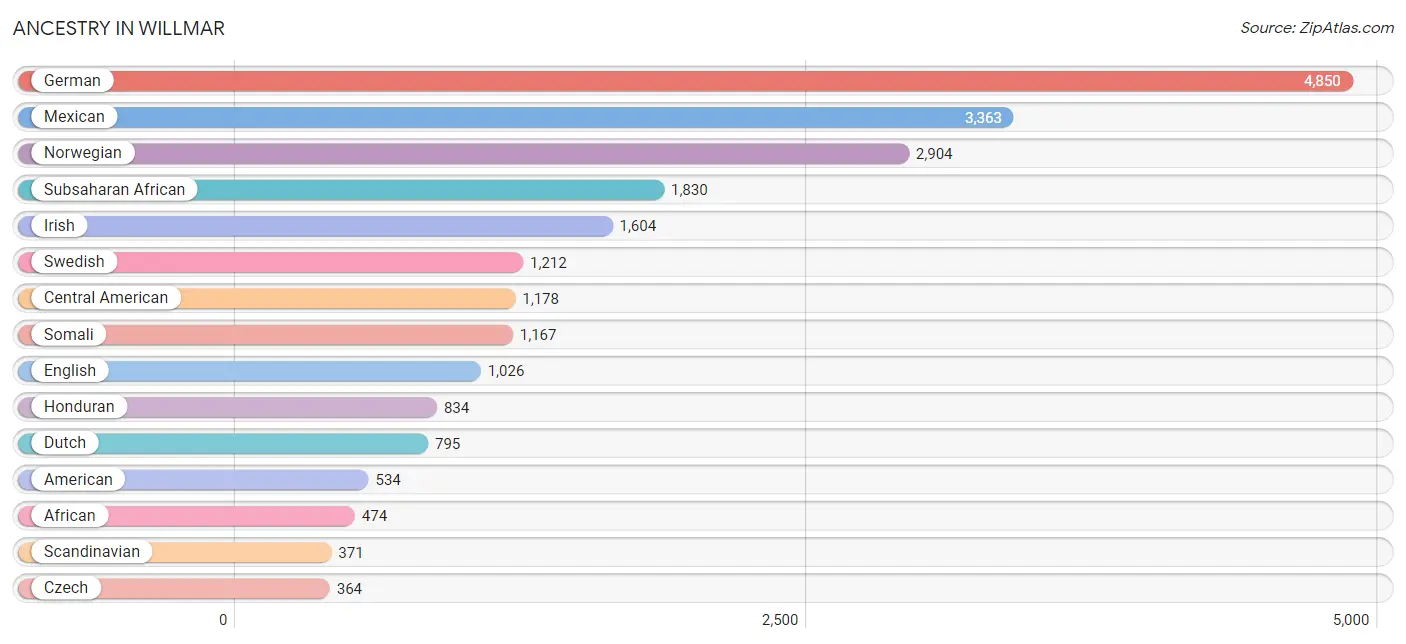
Ancestry in Willmar
The most populous ancestries reported in Willmar are German (4,850 | 23.1%), Mexican (3,363 | 16.0%), Norwegian (2,904 | 13.8%), Subsaharan African (1,830 | 8.7%), and Irish (1,604 | 7.6%), together accounting for 69.3% of all Willmar residents.
| Ancestry | # Population | % Population |
| African | 474 | 2.3% |
| American | 534 | 2.5% |
| Apache | 11 | 0.1% |
| Austrian | 30 | 0.1% |
| Belgian | 22 | 0.1% |
| British | 17 | 0.1% |
| Burmese | 80 | 0.4% |
| Central American | 1,178 | 5.6% |
| Central American Indian | 88 | 0.4% |
| Cherokee | 15 | 0.1% |
| Chickasaw | 15 | 0.1% |
| Chippewa | 140 | 0.7% |
| Colombian | 7 | 0.0% |
| Creek | 15 | 0.1% |
| Czech | 364 | 1.7% |
| Czechoslovakian | 19 | 0.1% |
| Danish | 99 | 0.5% |
| Dominican | 15 | 0.1% |
| Dutch | 795 | 3.8% |
| Eastern European | 9 | 0.0% |
| Ecuadorian | 248 | 1.2% |
| English | 1,026 | 4.9% |
| Ethiopian | 13 | 0.1% |
| European | 200 | 0.9% |
| Filipino | 42 | 0.2% |
| Finnish | 110 | 0.5% |
| French | 230 | 1.1% |
| French Canadian | 25 | 0.1% |
| German | 4,850 | 23.1% |
| Greek | 1 | 0.0% |
| Guatemalan | 316 | 1.5% |
| Honduran | 834 | 4.0% |
| Hungarian | 41 | 0.2% |
| Icelander | 24 | 0.1% |
| Indian (Asian) | 7 | 0.0% |
| Indonesian | 316 | 1.5% |
| Inupiat | 6 | 0.0% |
| Irish | 1,604 | 7.6% |
| Italian | 157 | 0.7% |
| Kenyan | 247 | 1.2% |
| Korean | 9 | 0.0% |
| Laotian | 50 | 0.2% |
| Liberian | 1 | 0.0% |
| Luxembourger | 2 | 0.0% |
| Mexican | 3,363 | 16.0% |
| Mexican American Indian | 6 | 0.0% |
| Northern European | 103 | 0.5% |
| Norwegian | 2,904 | 13.8% |
| Pakistani | 4 | 0.0% |
| Peruvian | 19 | 0.1% |
| Polish | 268 | 1.3% |
| Puerto Rican | 38 | 0.2% |
| Russian | 26 | 0.1% |
| Salvadoran | 28 | 0.1% |
| Scandinavian | 371 | 1.8% |
| Scotch-Irish | 43 | 0.2% |
| Scottish | 142 | 0.7% |
| Sioux | 1 | 0.0% |
| Slovak | 8 | 0.0% |
| Somali | 1,167 | 5.6% |
| South American | 274 | 1.3% |
| South American Indian | 32 | 0.2% |
| Spaniard | 13 | 0.1% |
| Spanish | 18 | 0.1% |
| Subsaharan African | 1,830 | 8.7% |
| Swedish | 1,212 | 5.8% |
| Swiss | 16 | 0.1% |
| Ukrainian | 103 | 0.5% |
| Welsh | 147 | 0.7% | View All 69 Rows |
Immigrants in Willmar
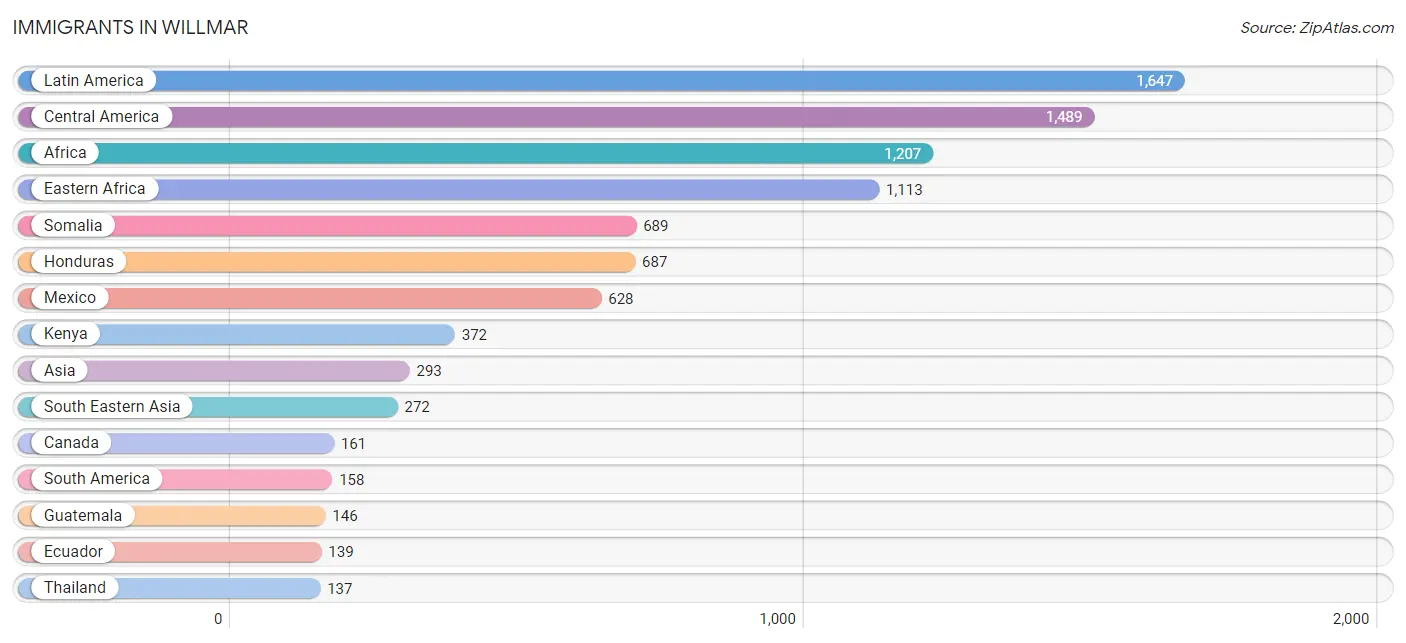
The most numerous immigrant groups reported in Willmar came from Latin America (1,647 | 7.8%), Central America (1,489 | 7.1%), Africa (1,207 | 5.8%), Eastern Africa (1,113 | 5.3%), and Somalia (689 | 3.3%), together accounting for 29.3% of all Willmar residents.
| Immigration Origin | # Population | % Population |
| Africa | 1,207 | 5.8% |
| Asia | 293 | 1.4% |
| Canada | 161 | 0.8% |
| Central America | 1,489 | 7.1% |
| Eastern Africa | 1,113 | 5.3% |
| Eastern Asia | 21 | 0.1% |
| Eastern Europe | 81 | 0.4% |
| Ecuador | 139 | 0.7% |
| El Salvador | 28 | 0.1% |
| Ethiopia | 24 | 0.1% |
| Europe | 94 | 0.4% |
| Guatemala | 146 | 0.7% |
| Honduras | 687 | 3.3% |
| Kenya | 372 | 1.8% |
| Korea | 21 | 0.1% |
| Latin America | 1,647 | 7.8% |
| Liberia | 1 | 0.0% |
| Mexico | 628 | 3.0% |
| Middle Africa | 3 | 0.0% |
| Netherlands | 13 | 0.1% |
| Nigeria | 13 | 0.1% |
| Peru | 19 | 0.1% |
| Poland | 9 | 0.0% |
| Sierra Leone | 27 | 0.1% |
| Somalia | 689 | 3.3% |
| South Africa | 50 | 0.2% |
| South America | 158 | 0.7% |
| South Eastern Asia | 272 | 1.3% |
| Thailand | 137 | 0.6% |
| Ukraine | 72 | 0.3% |
| Western Africa | 41 | 0.2% |
| Western Europe | 13 | 0.1% | View All 32 Rows |
Sex and Age in Willmar
Sex and Age in Willmar
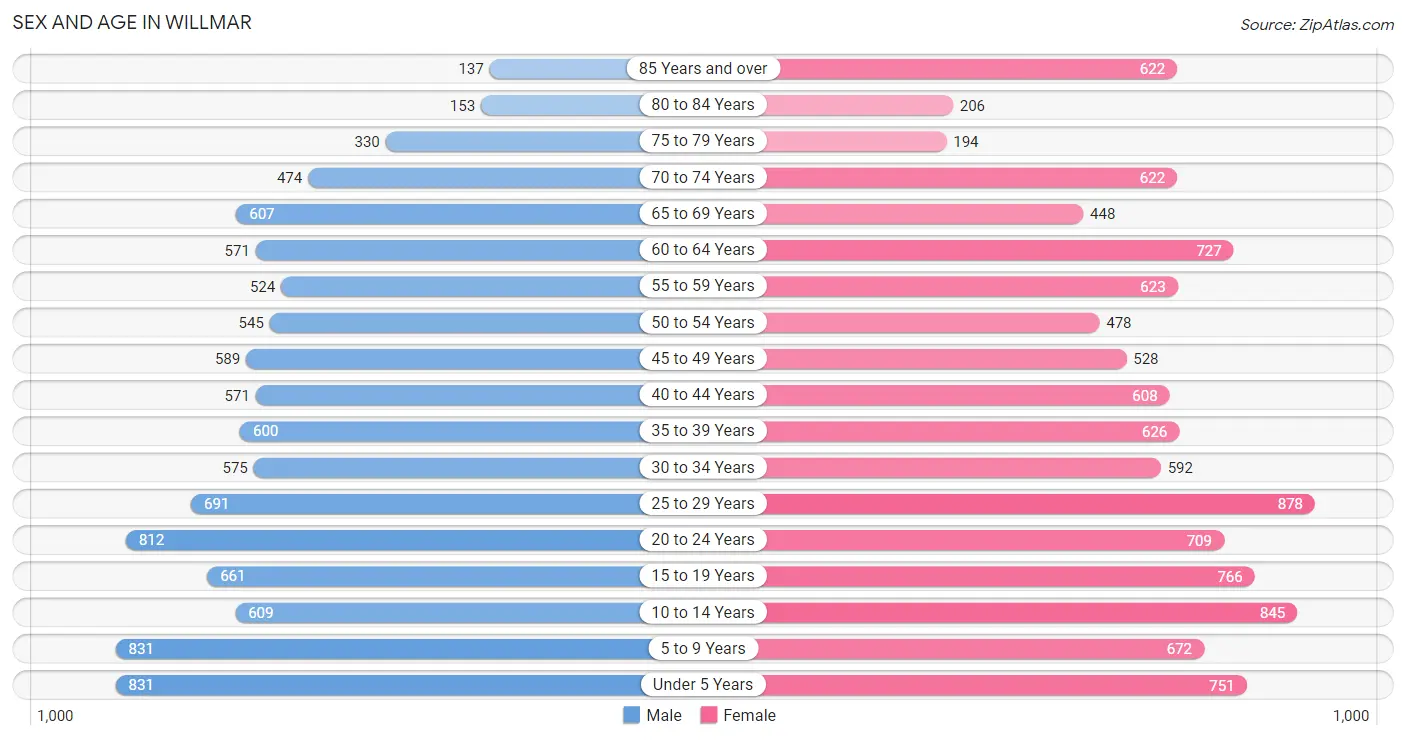
The most populous age groups in Willmar are Under 5 Years (831 | 8.2%) for men and 25 to 29 Years (878 | 8.1%) for women.
| Age Bracket | Male | Female |
| Under 5 Years | 831 (8.2%) | 751 (6.9%) |
| 5 to 9 Years | 831 (8.2%) | 672 (6.2%) |
| 10 to 14 Years | 609 (6.0%) | 845 (7.8%) |
| 15 to 19 Years | 661 (6.5%) | 766 (7.0%) |
| 20 to 24 Years | 812 (8.0%) | 709 (6.5%) |
| 25 to 29 Years | 691 (6.8%) | 878 (8.1%) |
| 30 to 34 Years | 575 (5.7%) | 592 (5.4%) |
| 35 to 39 Years | 600 (5.9%) | 626 (5.8%) |
| 40 to 44 Years | 571 (5.7%) | 608 (5.6%) |
| 45 to 49 Years | 589 (5.8%) | 528 (4.9%) |
| 50 to 54 Years | 545 (5.4%) | 478 (4.4%) |
| 55 to 59 Years | 524 (5.2%) | 623 (5.7%) |
| 60 to 64 Years | 571 (5.7%) | 727 (6.7%) |
| 65 to 69 Years | 607 (6.0%) | 448 (4.1%) |
| 70 to 74 Years | 474 (4.7%) | 622 (5.7%) |
| 75 to 79 Years | 330 (3.3%) | 194 (1.8%) |
| 80 to 84 Years | 153 (1.5%) | 206 (1.9%) |
| 85 Years and over | 137 (1.3%) | 622 (5.7%) |
| Total | 10,111 (100.0%) | 10,895 (100.0%) |
Families and Households in Willmar
Median Family Size in Willmar
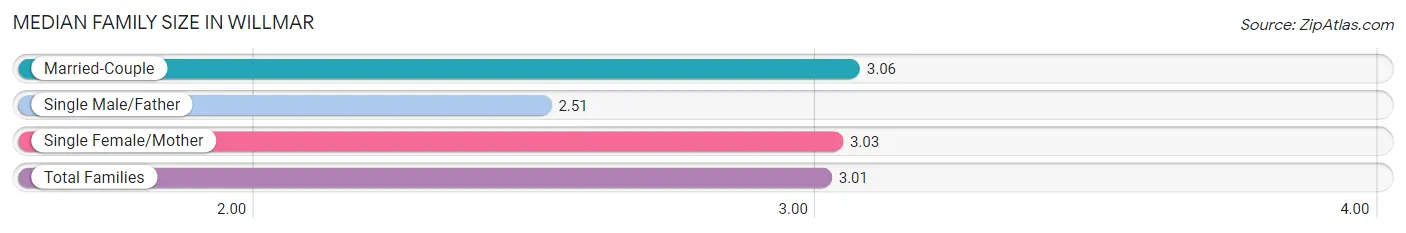
The median family size in Willmar is 3.01 persons per family, with married-couple families (3,532 | 69.6%) accounting for the largest median family size of 3.06 persons per family. On the other hand, single male/father families (449 | 8.8%) represent the smallest median family size with 2.51 persons per family.
| Family Type | # Families | Family Size |
| Married-Couple | 3,532 (69.6%) | 3.06 |
| Single Male/Father | 449 (8.8%) | 2.51 |
| Single Female/Mother | 1,094 (21.6%) | 3.03 |
| Total Families | 5,075 (100.0%) | 3.01 |
Median Household Size in Willmar
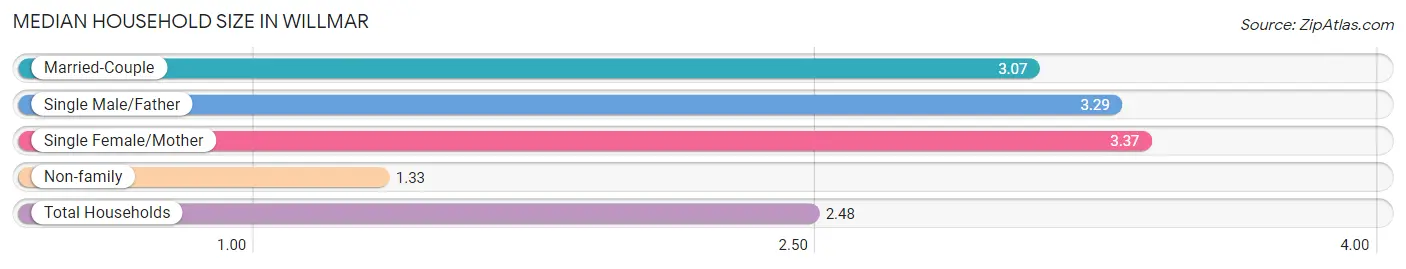
The median household size in Willmar is 2.48 persons per household, with single female/mother households (1,094 | 13.6%) accounting for the largest median household size of 3.37 persons per household. non-family households (2,990 | 37.1%) represent the smallest median household size with 1.33 persons per household.
| Household Type | # Households | Household Size |
| Married-Couple | 3,532 (43.8%) | 3.07 |
| Single Male/Father | 449 (5.6%) | 3.29 |
| Single Female/Mother | 1,094 (13.6%) | 3.37 |
| Non-family | 2,990 (37.1%) | 1.33 |
| Total Households | 8,065 (100.0%) | 2.48 |
Household Size by Marriage Status in Willmar
Out of a total of 8,065 households in Willmar, 5,075 (62.9%) are family households, while 2,990 (37.1%) are nonfamily households. The most numerous type of family households are 2-person households, comprising 2,671, and the most common type of nonfamily households are 1-person households, comprising 2,213.
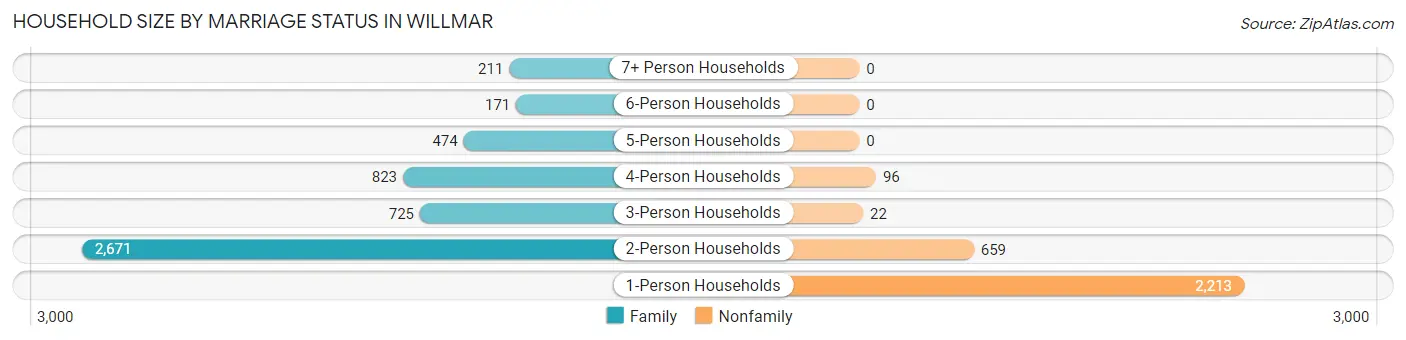
| Household Size | Family Households | Nonfamily Households |
| 1-Person Households | - | 2,213 (27.4%) |
| 2-Person Households | 2,671 (33.1%) | 659 (8.2%) |
| 3-Person Households | 725 (9.0%) | 22 (0.3%) |
| 4-Person Households | 823 (10.2%) | 96 (1.2%) |
| 5-Person Households | 474 (5.9%) | 0 (0.0%) |
| 6-Person Households | 171 (2.1%) | 0 (0.0%) |
| 7+ Person Households | 211 (2.6%) | 0 (0.0%) |
| Total | 5,075 (62.9%) | 2,990 (37.1%) |
Female Fertility in Willmar
Fertility by Age in Willmar
Average fertility rate in Willmar is 84.0 births per 1,000 women. Women in the age bracket of 20 to 34 years have the highest fertility rate with 156.0 births per 1,000 women. Women in the age bracket of 20 to 34 years acount for 84.8% of all women with births.
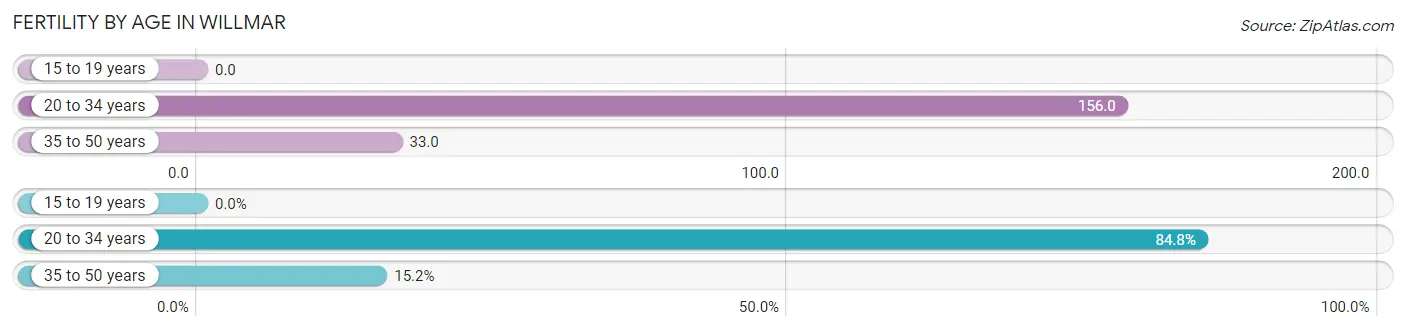
| Age Bracket | Women with Births | Births / 1,000 Women |
| 15 to 19 years | 0 (0.0%) | 0.0 |
| 20 to 34 years | 340 (84.8%) | 156.0 |
| 35 to 50 years | 61 (15.2%) | 33.0 |
| Total | 401 (100.0%) | 84.0 |
Fertility by Age by Marriage Status in Willmar
32.7% of women with births (401) in Willmar are married. The highest percentage of unmarried women with births falls into 35 to 50 years age bracket with 85.3% of them unmarried at the time of birth, while the lowest percentage of unmarried women with births belong to 20 to 34 years age bracket with 64.1% of them unmarried.
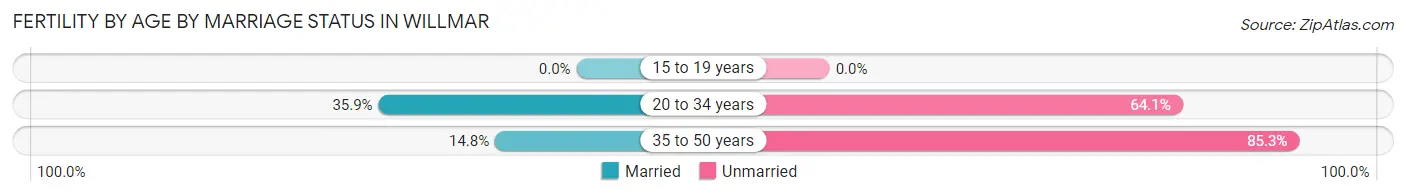
| Age Bracket | Married | Unmarried |
| 15 to 19 years | 0 (0.0%) | 0 (0.0%) |
| 20 to 34 years | 122 (35.9%) | 218 (64.1%) |
| 35 to 50 years | 9 (14.7%) | 52 (85.3%) |
| Total | 131 (32.7%) | 270 (67.3%) |
Fertility by Education in Willmar
Average fertility rate in Willmar is 84.0 births per 1,000 women. Women with the education attainment of less than high school have the highest fertility rate of 152.0 births per 1,000 women, while women with the education attainment of graduate degree have the lowest fertility at 40.0 births per 1,000 women. Women with the education attainment of less than high school represent 47.9% of all women with births.
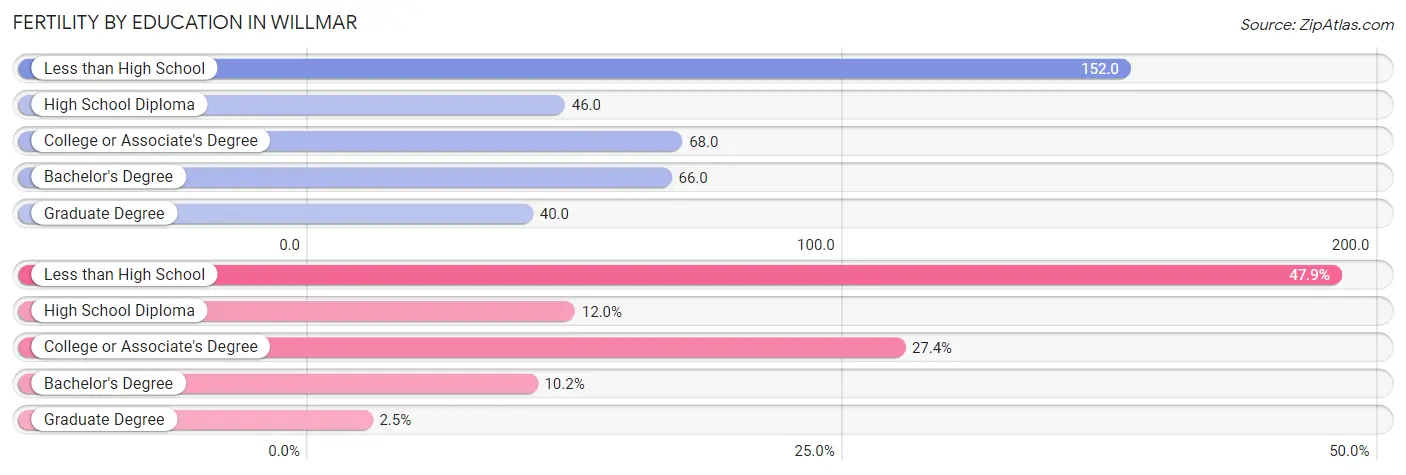
| Educational Attainment | Women with Births | Births / 1,000 Women |
| Less than High School | 192 (47.9%) | 152.0 |
| High School Diploma | 48 (12.0%) | 46.0 |
| College or Associate's Degree | 110 (27.4%) | 68.0 |
| Bachelor's Degree | 41 (10.2%) | 66.0 |
| Graduate Degree | 10 (2.5%) | 40.0 |
| Total | 401 (100.0%) | 84.0 |
Fertility by Education by Marriage Status in Willmar
67.3% of women with births in Willmar are unmarried. Women with the educational attainment of bachelor's degree are most likely to be married with 100.0% of them married at childbirth, while women with the educational attainment of high school diploma are least likely to be married with 100.0% of them unmarried at childbirth.
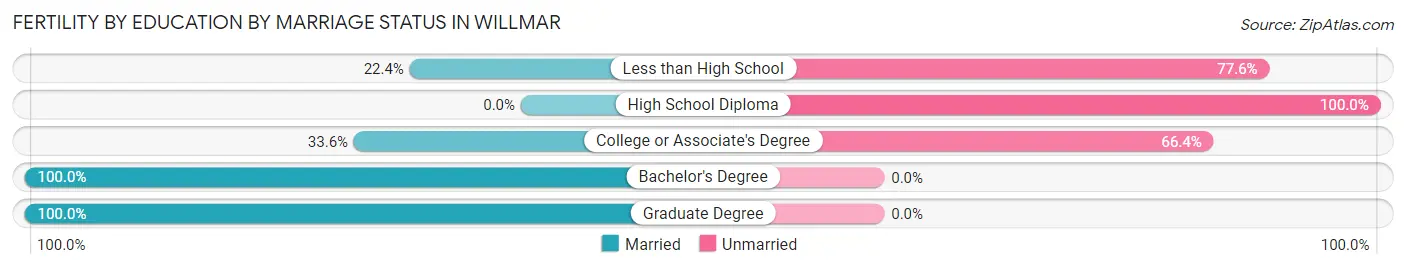
| Educational Attainment | Married | Unmarried |
| Less than High School | 43 (22.4%) | 149 (77.6%) |
| High School Diploma | 0 (0.0%) | 48 (100.0%) |
| College or Associate's Degree | 37 (33.6%) | 73 (66.4%) |
| Bachelor's Degree | 41 (100.0%) | 0 (0.0%) |
| Graduate Degree | 10 (100.0%) | 0 (0.0%) |
| Total | 131 (32.7%) | 270 (67.3%) |
Employment Characteristics in Willmar
Employment by Class of Employer in Willmar
Among the 10,029 employed individuals in Willmar, private company employees (7,254 | 72.3%), not-for-profit organizations (951 | 9.5%), and local government employees (740 | 7.4%) make up the most common classes of employment.
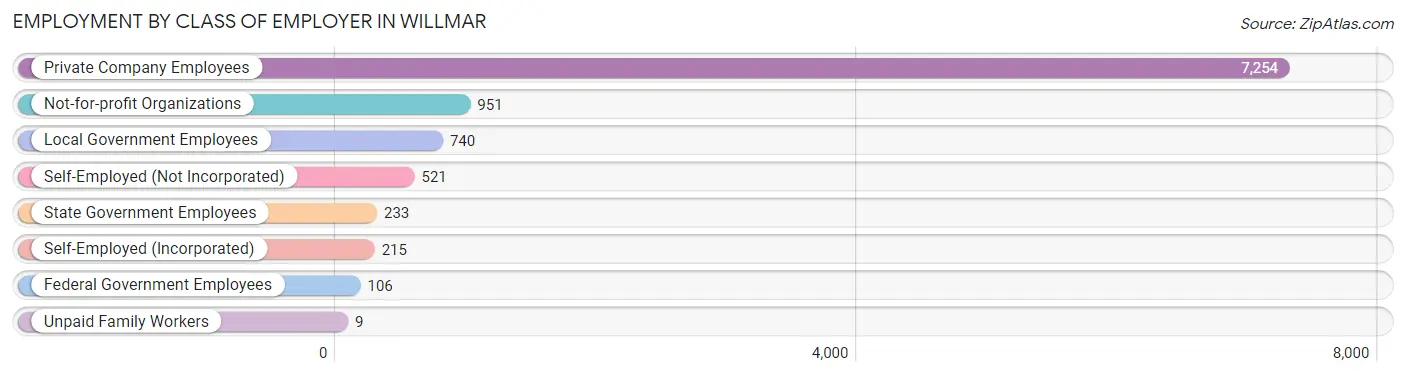
| Employer Class | # Employees | % Employees |
| Private Company Employees | 7,254 | 72.3% |
| Self-Employed (Incorporated) | 215 | 2.1% |
| Self-Employed (Not Incorporated) | 521 | 5.2% |
| Not-for-profit Organizations | 951 | 9.5% |
| Local Government Employees | 740 | 7.4% |
| State Government Employees | 233 | 2.3% |
| Federal Government Employees | 106 | 1.1% |
| Unpaid Family Workers | 9 | 0.1% |
| Total | 10,029 | 100.0% |
Employment Status by Age in Willmar
According to the labor force statistics for Willmar, out of the total population over 16 years of age (16,232), 67.0% or 10,875 individuals are in the labor force, with 5.4% or 587 of them unemployed. The age group with the highest labor force participation rate is 20 to 24 years, with 90.7% or 1,380 individuals in the labor force. Within the labor force, the 30 to 34 years age range has the highest percentage of unemployed individuals, with 11.3% or 118 of them being unemployed.
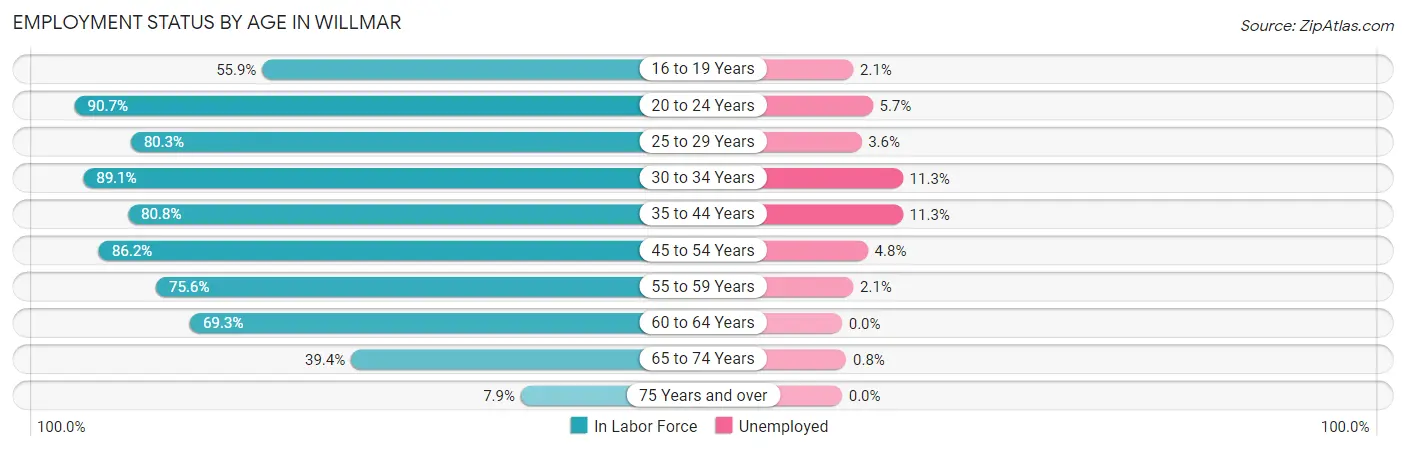
| Age Bracket | In Labor Force | Unemployed |
| 16 to 19 Years | 666 (55.9%) | 14 (2.1%) |
| 20 to 24 Years | 1,380 (90.7%) | 79 (5.7%) |
| 25 to 29 Years | 1,260 (80.3%) | 45 (3.6%) |
| 30 to 34 Years | 1,040 (89.1%) | 118 (11.3%) |
| 35 to 44 Years | 1,943 (80.8%) | 220 (11.3%) |
| 45 to 54 Years | 1,845 (86.2%) | 89 (4.8%) |
| 55 to 59 Years | 867 (75.6%) | 18 (2.1%) |
| 60 to 64 Years | 900 (69.3%) | 0 (0.0%) |
| 65 to 74 Years | 847 (39.4%) | 7 (0.8%) |
| 75 Years and over | 130 (7.9%) | 0 (0.0%) |
| Total | 10,875 (67.0%) | 587 (5.4%) |
Employment Status by Educational Attainment in Willmar
According to labor force statistics for Willmar, 80.8% of individuals (7,859) out of the total population between 25 and 64 years of age (9,726) are in the labor force, with 6.2% or 487 of them being unemployed. The group with the highest labor force participation rate are those with the educational attainment of bachelor's degree or higher, with 90.8% or 1,742 individuals in the labor force. Within the labor force, individuals with less than high school education have the highest percentage of unemployment, with 15.8% or 214 of them being unemployed.
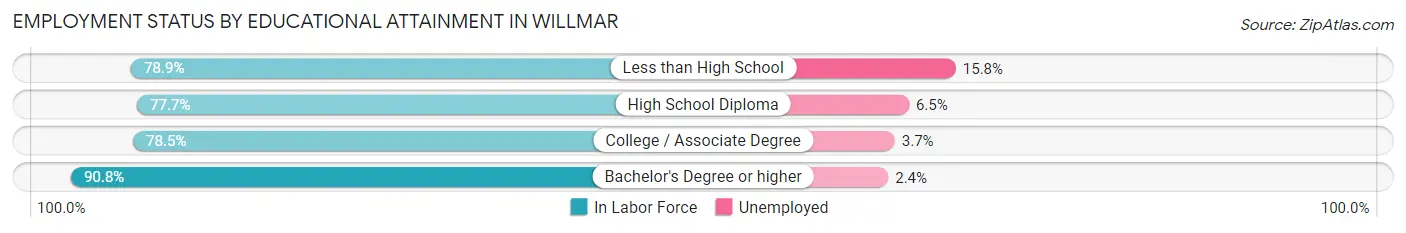
| Educational Attainment | In Labor Force | Unemployed |
| Less than High School | 1,352 (78.9%) | 271 (15.8%) |
| High School Diploma | 2,004 (77.7%) | 168 (6.5%) |
| College / Associate Degree | 2,760 (78.5%) | 130 (3.7%) |
| Bachelor's Degree or higher | 1,742 (90.8%) | 46 (2.4%) |
| Total | 7,859 (80.8%) | 603 (6.2%) |
Employment Occupations by Sex in Willmar
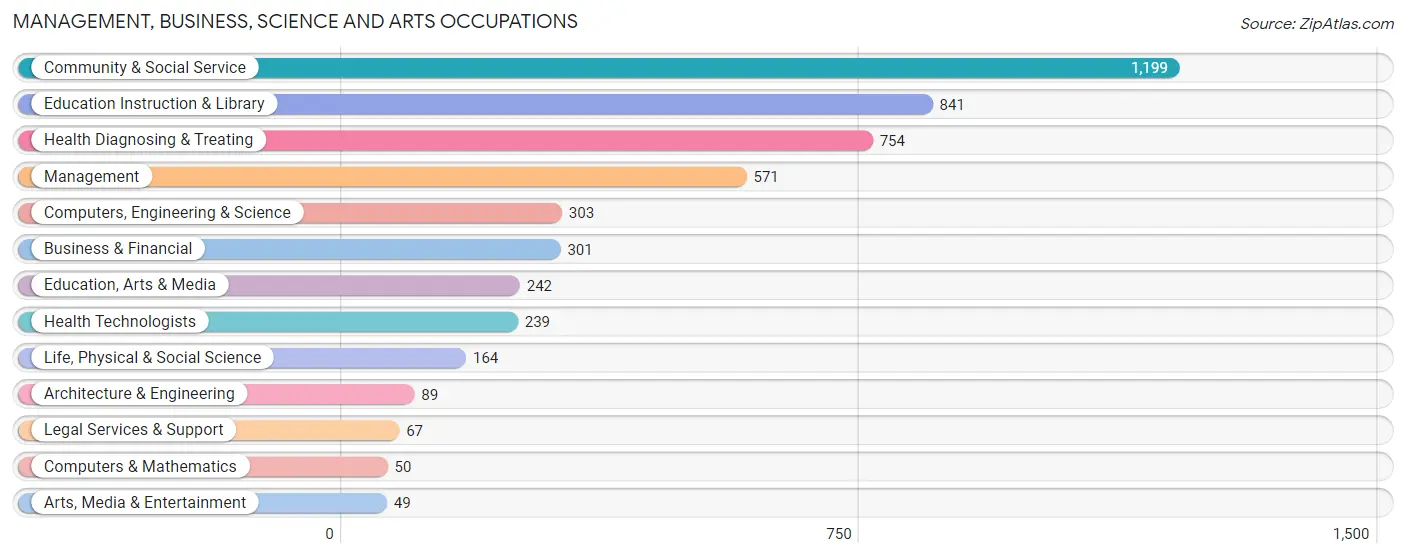
Management, Business, Science and Arts Occupations
The most common Management, Business, Science and Arts occupations in Willmar are Community & Social Service (1,199 | 11.7%), Education Instruction & Library (841 | 8.2%), Health Diagnosing & Treating (754 | 7.3%), Management (571 | 5.6%), and Computers, Engineering & Science (303 | 2.9%).
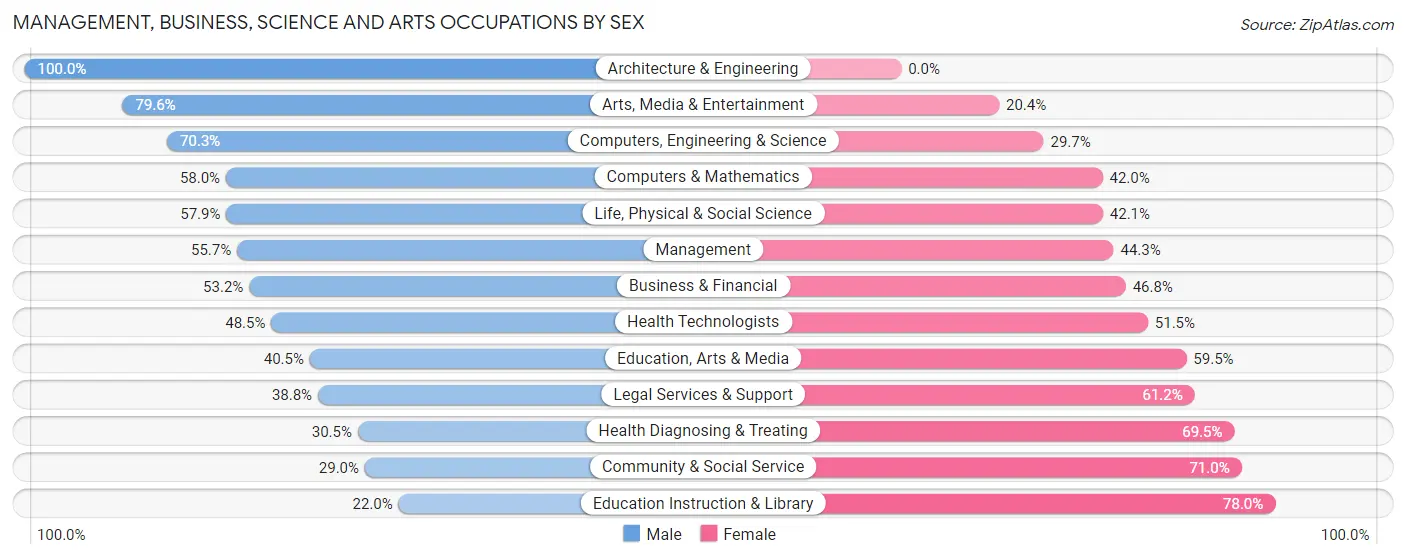
Management, Business, Science and Arts Occupations by Sex
Within the Management, Business, Science and Arts occupations in Willmar, the most male-oriented occupations are Architecture & Engineering (100.0%), Arts, Media & Entertainment (79.6%), and Computers, Engineering & Science (70.3%), while the most female-oriented occupations are Education Instruction & Library (78.0%), Community & Social Service (71.0%), and Health Diagnosing & Treating (69.5%).
| Occupation | Male | Female |
| Management | 318 (55.7%) | 253 (44.3%) |
| Business & Financial | 160 (53.2%) | 141 (46.8%) |
| Computers, Engineering & Science | 213 (70.3%) | 90 (29.7%) |
| Computers & Mathematics | 29 (58.0%) | 21 (42.0%) |
| Architecture & Engineering | 89 (100.0%) | 0 (0.0%) |
| Life, Physical & Social Science | 95 (57.9%) | 69 (42.1%) |
| Community & Social Service | 348 (29.0%) | 851 (71.0%) |
| Education, Arts & Media | 98 (40.5%) | 144 (59.5%) |
| Legal Services & Support | 26 (38.8%) | 41 (61.2%) |
| Education Instruction & Library | 185 (22.0%) | 656 (78.0%) |
| Arts, Media & Entertainment | 39 (79.6%) | 10 (20.4%) |
| Health Diagnosing & Treating | 230 (30.5%) | 524 (69.5%) |
| Health Technologists | 116 (48.5%) | 123 (51.5%) |
| Total (Category) | 1,269 (40.6%) | 1,859 (59.4%) |
| Total (Overall) | 5,255 (51.1%) | 5,036 (48.9%) |
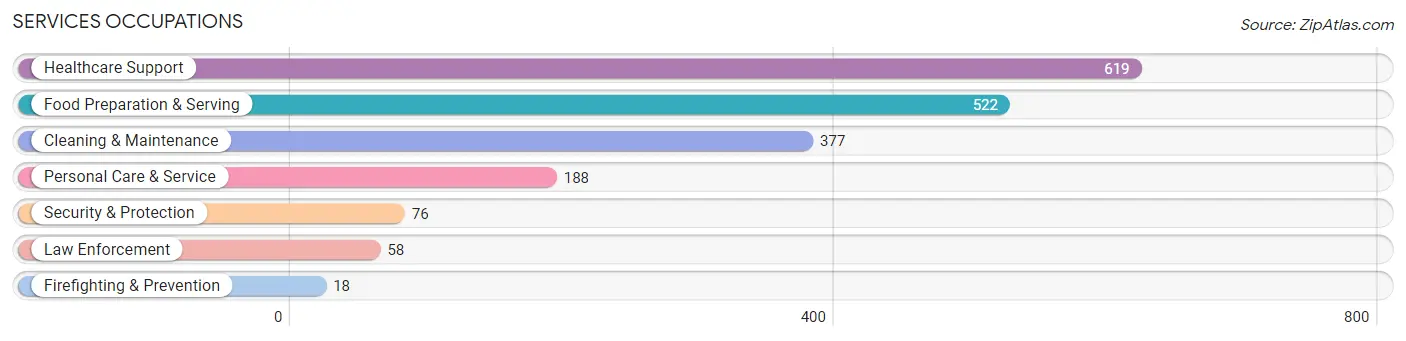
Services Occupations
The most common Services occupations in Willmar are Healthcare Support (619 | 6.0%), Food Preparation & Serving (522 | 5.1%), Cleaning & Maintenance (377 | 3.7%), Personal Care & Service (188 | 1.8%), and Security & Protection (76 | 0.7%).
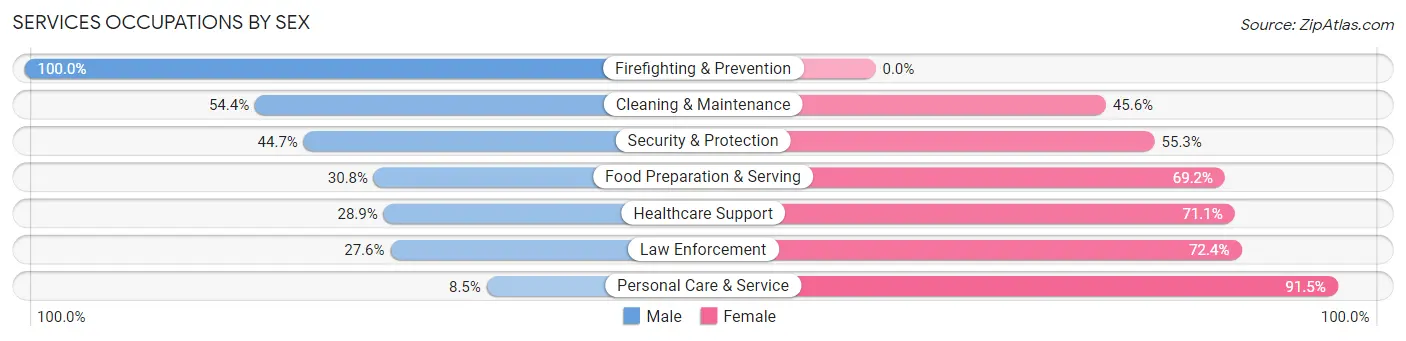
Services Occupations by Sex
Within the Services occupations in Willmar, the most male-oriented occupations are Firefighting & Prevention (100.0%), Cleaning & Maintenance (54.4%), and Security & Protection (44.7%), while the most female-oriented occupations are Personal Care & Service (91.5%), Law Enforcement (72.4%), and Healthcare Support (71.1%).
| Occupation | Male | Female |
| Healthcare Support | 179 (28.9%) | 440 (71.1%) |
| Security & Protection | 34 (44.7%) | 42 (55.3%) |
| Firefighting & Prevention | 18 (100.0%) | 0 (0.0%) |
| Law Enforcement | 16 (27.6%) | 42 (72.4%) |
| Food Preparation & Serving | 161 (30.8%) | 361 (69.2%) |
| Cleaning & Maintenance | 205 (54.4%) | 172 (45.6%) |
| Personal Care & Service | 16 (8.5%) | 172 (91.5%) |
| Total (Category) | 595 (33.4%) | 1,187 (66.6%) |
| Total (Overall) | 5,255 (51.1%) | 5,036 (48.9%) |
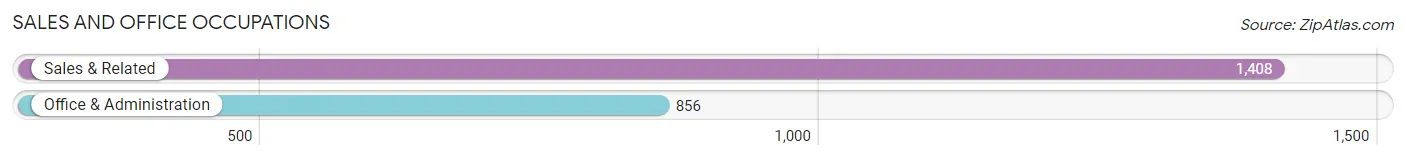
Sales and Office Occupations
The most common Sales and Office occupations in Willmar are Sales & Related (1,408 | 13.7%), and Office & Administration (856 | 8.3%).
Sales and Office Occupations by Sex
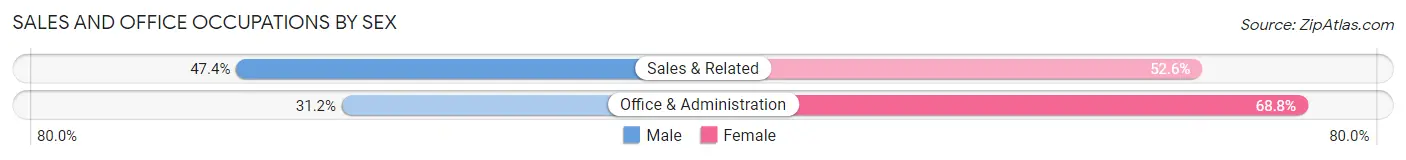
| Occupation | Male | Female |
| Sales & Related | 668 (47.4%) | 740 (52.6%) |
| Office & Administration | 267 (31.2%) | 589 (68.8%) |
| Total (Category) | 935 (41.3%) | 1,329 (58.7%) |
| Total (Overall) | 5,255 (51.1%) | 5,036 (48.9%) |
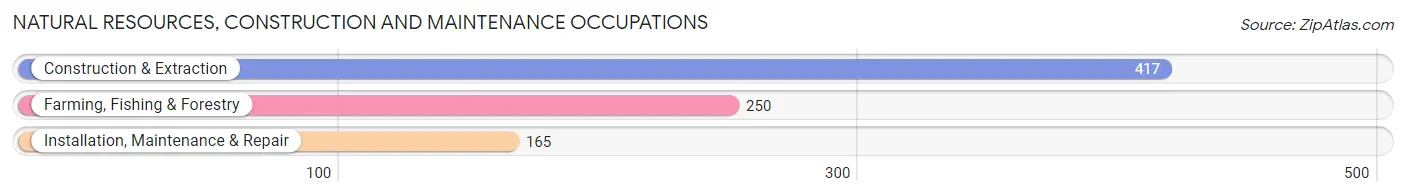
Natural Resources, Construction and Maintenance Occupations
The most common Natural Resources, Construction and Maintenance occupations in Willmar are Construction & Extraction (417 | 4.1%), Farming, Fishing & Forestry (250 | 2.4%), and Installation, Maintenance & Repair (165 | 1.6%).
Natural Resources, Construction and Maintenance Occupations by Sex
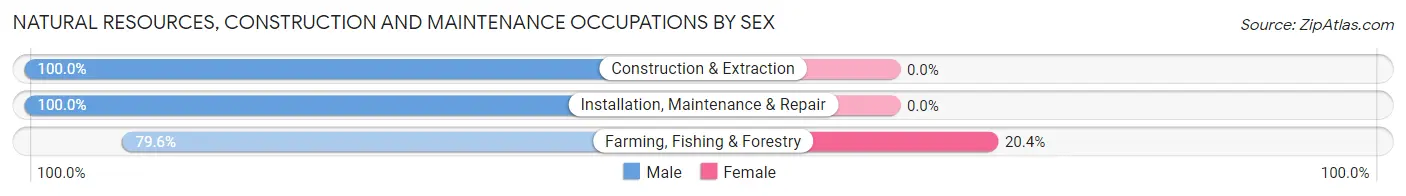
| Occupation | Male | Female |
| Farming, Fishing & Forestry | 199 (79.6%) | 51 (20.4%) |
| Construction & Extraction | 417 (100.0%) | 0 (0.0%) |
| Installation, Maintenance & Repair | 165 (100.0%) | 0 (0.0%) |
| Total (Category) | 781 (93.9%) | 51 (6.1%) |
| Total (Overall) | 5,255 (51.1%) | 5,036 (48.9%) |
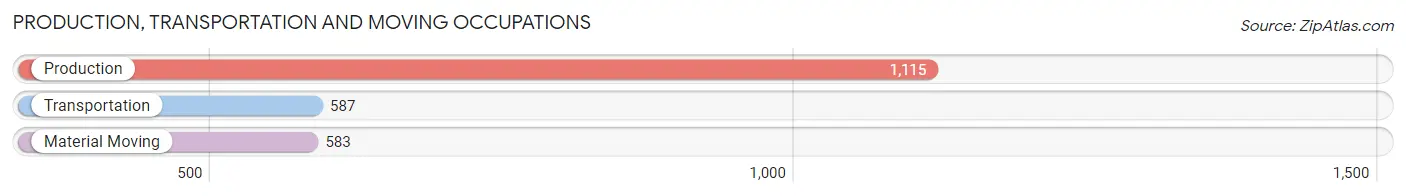
Production, Transportation and Moving Occupations
The most common Production, Transportation and Moving occupations in Willmar are Production (1,115 | 10.8%), Transportation (587 | 5.7%), and Material Moving (583 | 5.7%).
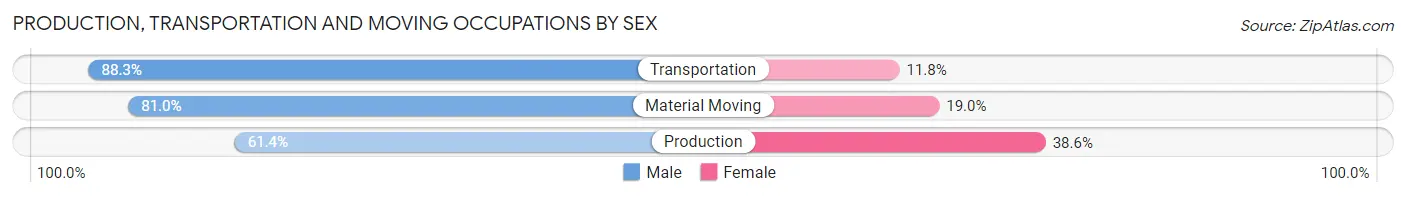
Production, Transportation and Moving Occupations by Sex
| Occupation | Male | Female |
| Production | 685 (61.4%) | 430 (38.6%) |
| Transportation | 518 (88.2%) | 69 (11.7%) |
| Material Moving | 472 (81.0%) | 111 (19.0%) |
| Total (Category) | 1,675 (73.3%) | 610 (26.7%) |
| Total (Overall) | 5,255 (51.1%) | 5,036 (48.9%) |
Employment Industries by Sex in Willmar
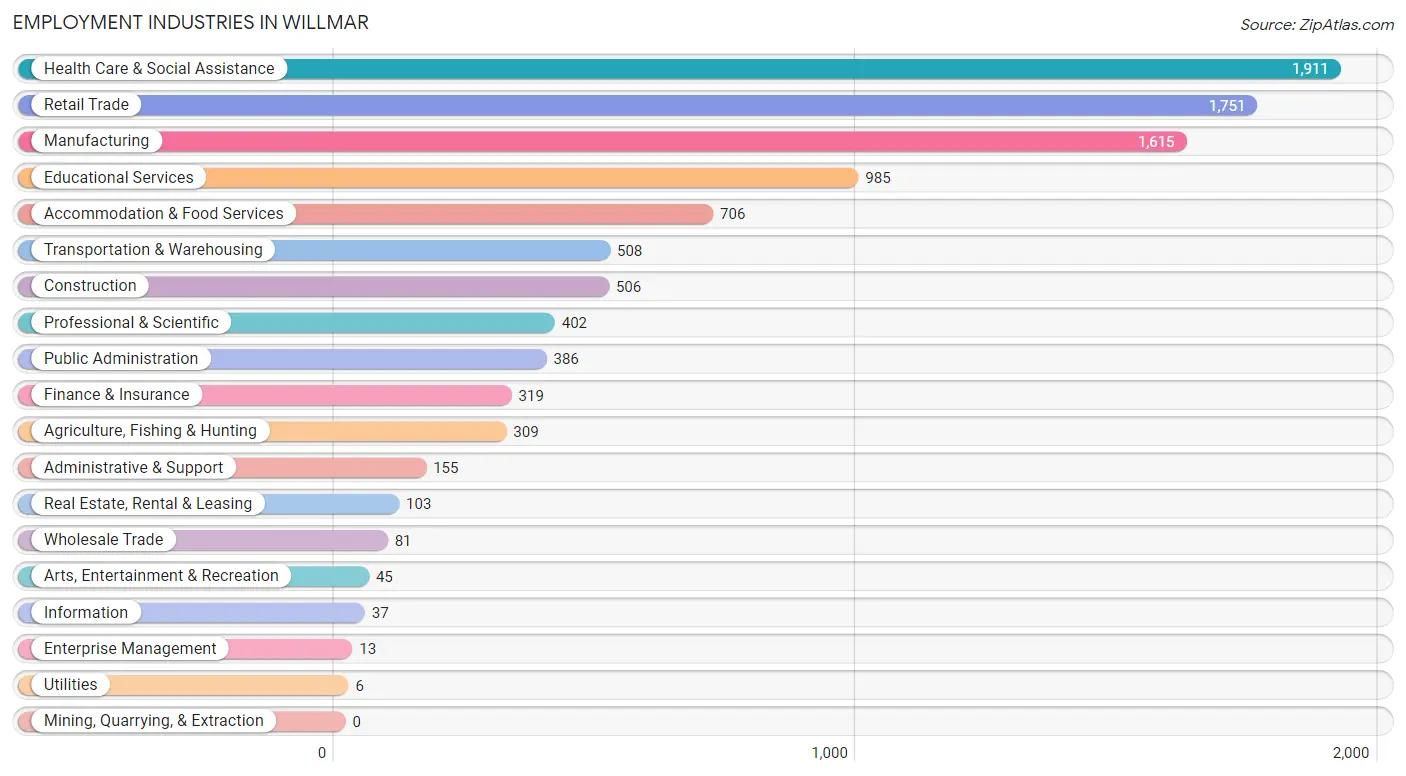
Employment Industries in Willmar
The major employment industries in Willmar include Health Care & Social Assistance (1,911 | 18.6%), Retail Trade (1,751 | 17.0%), Manufacturing (1,615 | 15.7%), Educational Services (985 | 9.6%), and Accommodation & Food Services (706 | 6.9%).
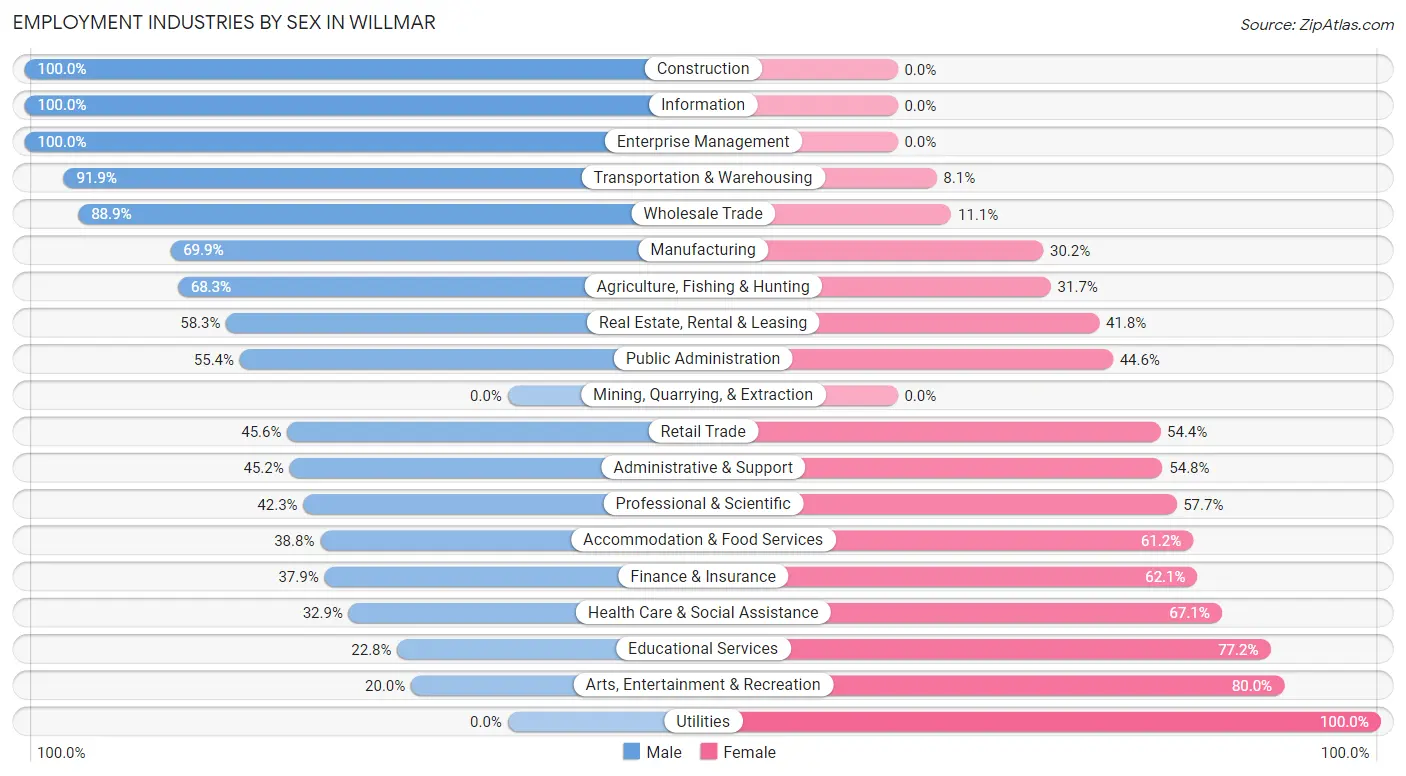
Employment Industries by Sex in Willmar
The Willmar industries that see more men than women are Construction (100.0%), Information (100.0%), and Enterprise Management (100.0%), whereas the industries that tend to have a higher number of women are Utilities (100.0%), Arts, Entertainment & Recreation (80.0%), and Educational Services (77.2%).
| Industry | Male | Female |
| Agriculture, Fishing & Hunting | 211 (68.3%) | 98 (31.7%) |
| Mining, Quarrying, & Extraction | 0 (0.0%) | 0 (0.0%) |
| Construction | 506 (100.0%) | 0 (0.0%) |
| Manufacturing | 1,128 (69.9%) | 487 (30.1%) |
| Wholesale Trade | 72 (88.9%) | 9 (11.1%) |
| Retail Trade | 799 (45.6%) | 952 (54.4%) |
| Transportation & Warehousing | 467 (91.9%) | 41 (8.1%) |
| Utilities | 0 (0.0%) | 6 (100.0%) |
| Information | 37 (100.0%) | 0 (0.0%) |
| Finance & Insurance | 121 (37.9%) | 198 (62.1%) |
| Real Estate, Rental & Leasing | 60 (58.3%) | 43 (41.7%) |
| Professional & Scientific | 170 (42.3%) | 232 (57.7%) |
| Enterprise Management | 13 (100.0%) | 0 (0.0%) |
| Administrative & Support | 70 (45.2%) | 85 (54.8%) |
| Educational Services | 225 (22.8%) | 760 (77.2%) |
| Health Care & Social Assistance | 629 (32.9%) | 1,282 (67.1%) |
| Arts, Entertainment & Recreation | 9 (20.0%) | 36 (80.0%) |
| Accommodation & Food Services | 274 (38.8%) | 432 (61.2%) |
| Public Administration | 214 (55.4%) | 172 (44.6%) |
| Total | 5,255 (51.1%) | 5,036 (48.9%) |
Education in Willmar
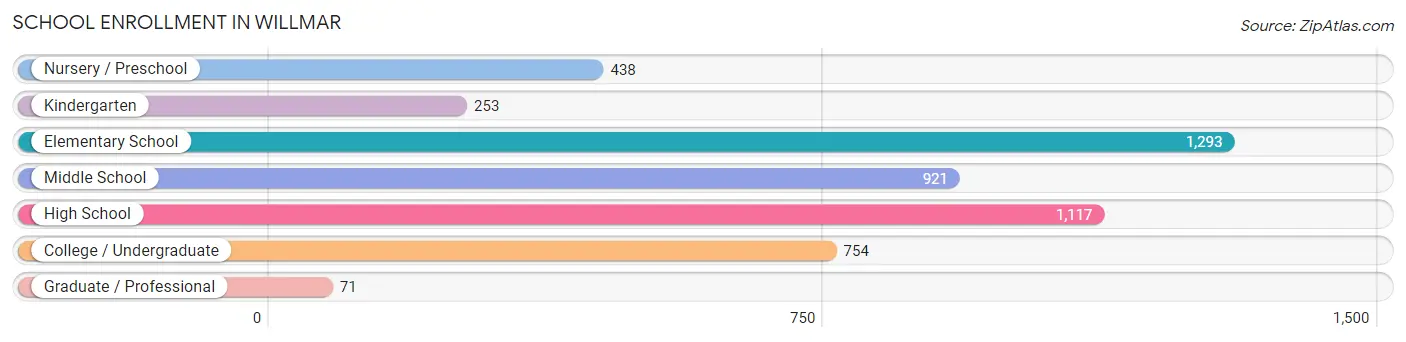
School Enrollment in Willmar
The most common levels of schooling among the 4,847 students in Willmar are elementary school (1,293 | 26.7%), high school (1,117 | 23.1%), and middle school (921 | 19.0%).
| School Level | # Students | % Students |
| Nursery / Preschool | 438 | 9.0% |
| Kindergarten | 253 | 5.2% |
| Elementary School | 1,293 | 26.7% |
| Middle School | 921 | 19.0% |
| High School | 1,117 | 23.1% |
| College / Undergraduate | 754 | 15.6% |
| Graduate / Professional | 71 | 1.5% |
| Total | 4,847 | 100.0% |
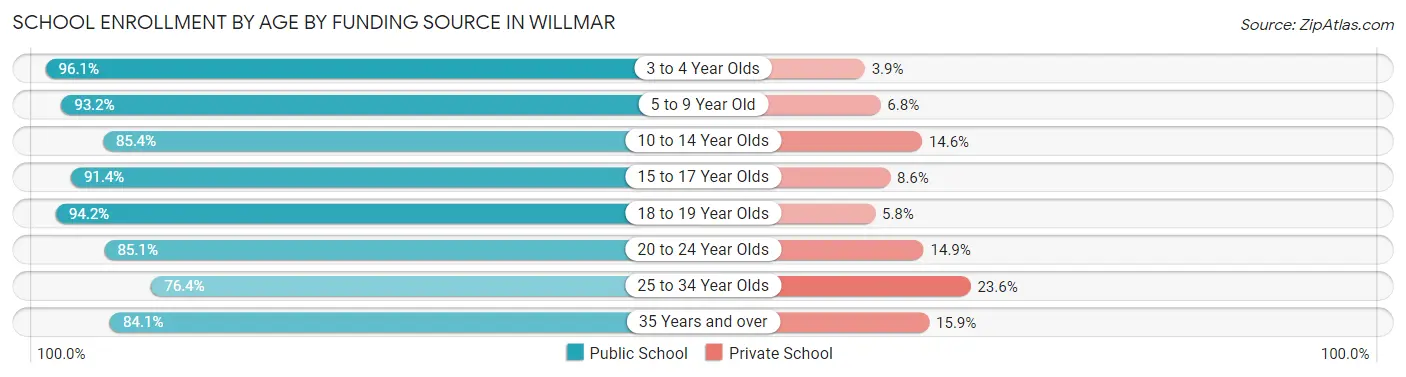
School Enrollment by Age by Funding Source in Willmar
Out of a total of 4,847 students who are enrolled in schools in Willmar, 528 (10.9%) attend a private institution, while the remaining 4,319 (89.1%) are enrolled in public schools. The age group of 25 to 34 year olds has the highest likelihood of being enrolled in private schools, with 60 (23.6% in the age bracket) enrolled. Conversely, the age group of 3 to 4 year olds has the lowest likelihood of being enrolled in a private school, with 245 (96.1% in the age bracket) attending a public institution.
| Age Bracket | Public School | Private School |
| 3 to 4 Year Olds | 245 (96.1%) | 10 (3.9%) |
| 5 to 9 Year Old | 1,307 (93.2%) | 96 (6.8%) |
| 10 to 14 Year Olds | 1,201 (85.4%) | 205 (14.6%) |
| 15 to 17 Year Olds | 698 (91.4%) | 66 (8.6%) |
| 18 to 19 Year Olds | 258 (94.2%) | 16 (5.8%) |
| 20 to 24 Year Olds | 343 (85.1%) | 60 (14.9%) |
| 25 to 34 Year Olds | 194 (76.4%) | 60 (23.6%) |
| 35 Years and over | 74 (84.1%) | 14 (15.9%) |
| Total | 4,319 (89.1%) | 528 (10.9%) |
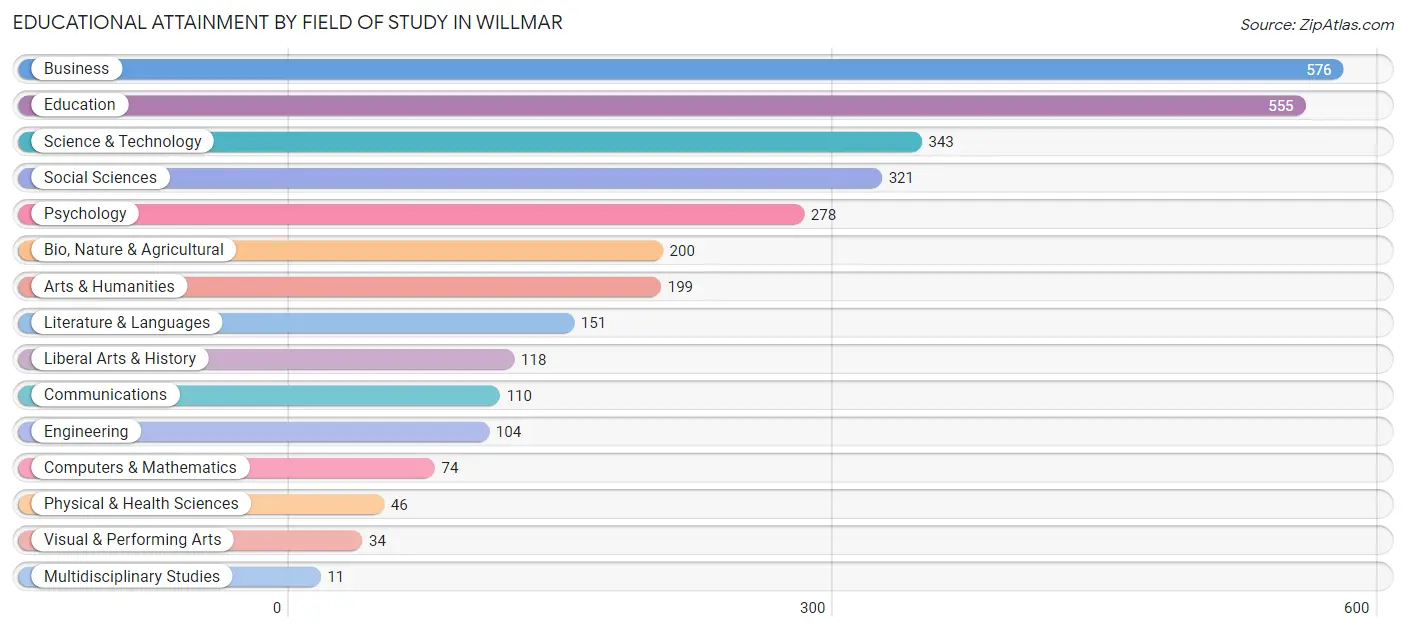
Educational Attainment by Field of Study in Willmar
Business (576 | 18.5%), education (555 | 17.8%), science & technology (343 | 11.0%), social sciences (321 | 10.3%), and psychology (278 | 8.9%) are the most common fields of study among 3,120 individuals in Willmar who have obtained a bachelor's degree or higher.
| Field of Study | # Graduates | % Graduates |
| Computers & Mathematics | 74 | 2.4% |
| Bio, Nature & Agricultural | 200 | 6.4% |
| Physical & Health Sciences | 46 | 1.5% |
| Psychology | 278 | 8.9% |
| Social Sciences | 321 | 10.3% |
| Engineering | 104 | 3.3% |
| Multidisciplinary Studies | 11 | 0.4% |
| Science & Technology | 343 | 11.0% |
| Business | 576 | 18.5% |
| Education | 555 | 17.8% |
| Literature & Languages | 151 | 4.8% |
| Liberal Arts & History | 118 | 3.8% |
| Visual & Performing Arts | 34 | 1.1% |
| Communications | 110 | 3.5% |
| Arts & Humanities | 199 | 6.4% |
| Total | 3,120 | 100.0% |
Transportation & Commute in Willmar
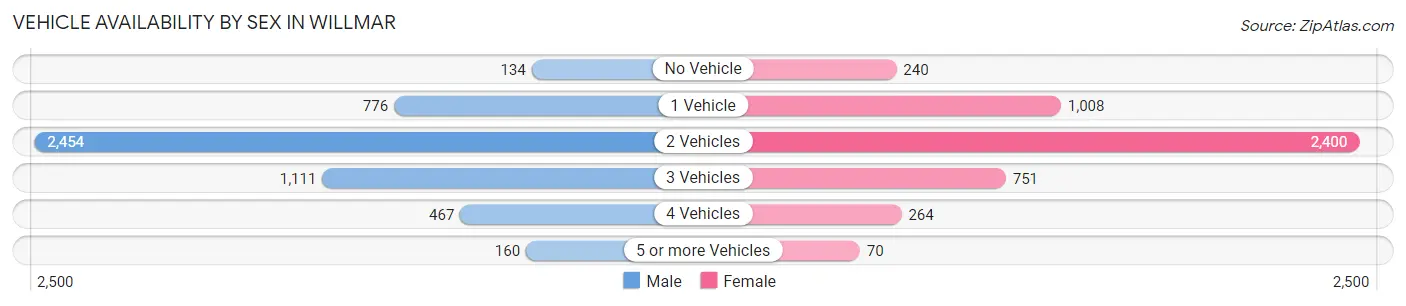
Vehicle Availability by Sex in Willmar
The most prevalent vehicle ownership categories in Willmar are males with 2 vehicles (2,454, accounting for 48.1%) and females with 2 vehicles (2,400, making up 51.8%).
| Vehicles Available | Male | Female |
| No Vehicle | 134 (2.6%) | 240 (5.1%) |
| 1 Vehicle | 776 (15.2%) | 1,008 (21.3%) |
| 2 Vehicles | 2,454 (48.1%) | 2,400 (50.7%) |
| 3 Vehicles | 1,111 (21.8%) | 751 (15.9%) |
| 4 Vehicles | 467 (9.1%) | 264 (5.6%) |
| 5 or more Vehicles | 160 (3.1%) | 70 (1.5%) |
| Total | 5,102 (100.0%) | 4,733 (100.0%) |
Commute Time in Willmar
The most frequently occuring commute durations in Willmar are 5 to 9 minutes (3,805 commuters, 40.7%), 10 to 14 minutes (2,728 commuters, 29.2%), and 15 to 19 minutes (910 commuters, 9.7%).
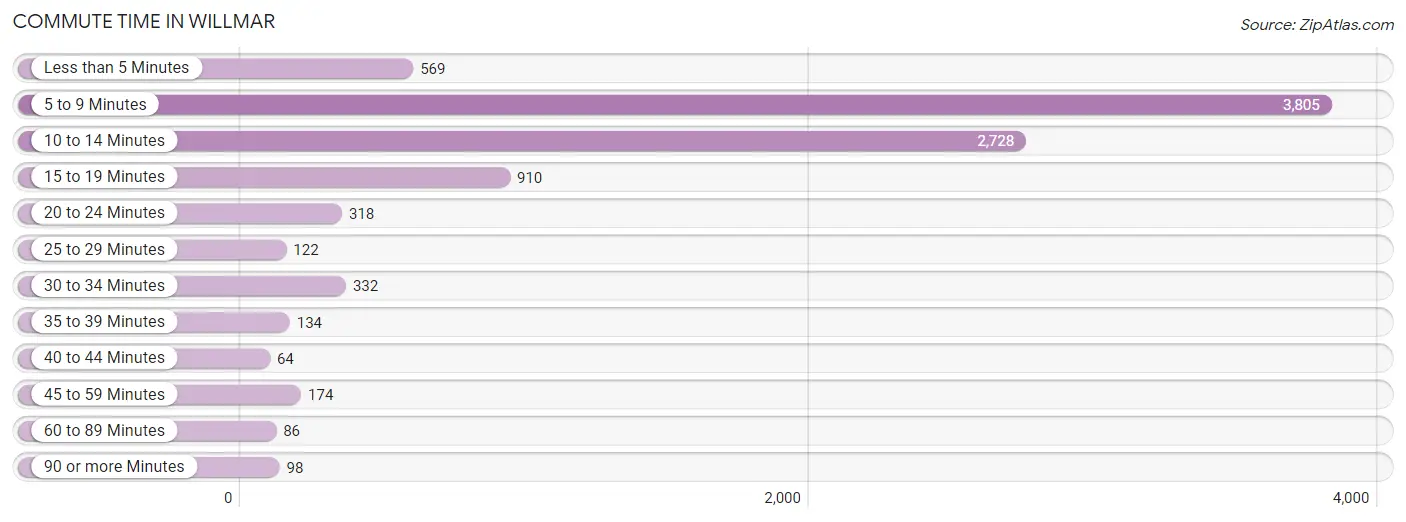
| Commute Time | # Commuters | % Commuters |
| Less than 5 Minutes | 569 | 6.1% |
| 5 to 9 Minutes | 3,805 | 40.7% |
| 10 to 14 Minutes | 2,728 | 29.2% |
| 15 to 19 Minutes | 910 | 9.7% |
| 20 to 24 Minutes | 318 | 3.4% |
| 25 to 29 Minutes | 122 | 1.3% |
| 30 to 34 Minutes | 332 | 3.5% |
| 35 to 39 Minutes | 134 | 1.4% |
| 40 to 44 Minutes | 64 | 0.7% |
| 45 to 59 Minutes | 174 | 1.9% |
| 60 to 89 Minutes | 86 | 0.9% |
| 90 or more Minutes | 98 | 1.1% |
Commute Time by Sex in Willmar
The most common commute times in Willmar are 5 to 9 minutes (2,347 commuters, 48.1%) for males and 10 to 14 minutes (1,478 commuters, 33.1%) for females.
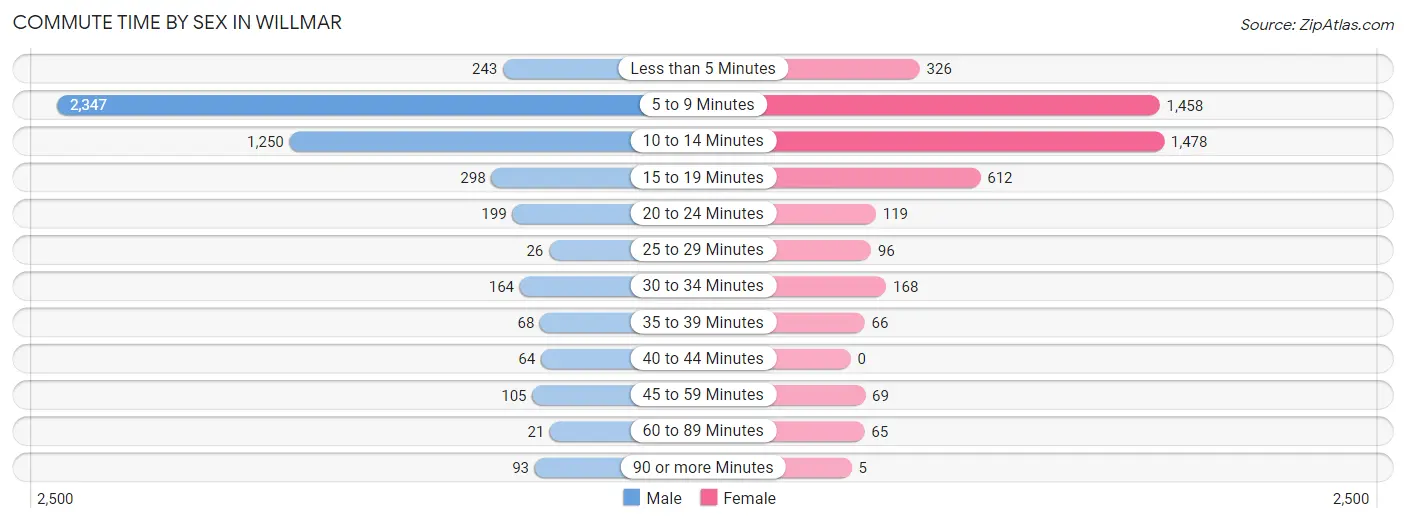
| Commute Time | Male | Female |
| Less than 5 Minutes | 243 (5.0%) | 326 (7.3%) |
| 5 to 9 Minutes | 2,347 (48.1%) | 1,458 (32.7%) |
| 10 to 14 Minutes | 1,250 (25.6%) | 1,478 (33.1%) |
| 15 to 19 Minutes | 298 (6.1%) | 612 (13.7%) |
| 20 to 24 Minutes | 199 (4.1%) | 119 (2.7%) |
| 25 to 29 Minutes | 26 (0.5%) | 96 (2.1%) |
| 30 to 34 Minutes | 164 (3.4%) | 168 (3.8%) |
| 35 to 39 Minutes | 68 (1.4%) | 66 (1.5%) |
| 40 to 44 Minutes | 64 (1.3%) | 0 (0.0%) |
| 45 to 59 Minutes | 105 (2.1%) | 69 (1.5%) |
| 60 to 89 Minutes | 21 (0.4%) | 65 (1.5%) |
| 90 or more Minutes | 93 (1.9%) | 5 (0.1%) |
Time of Departure to Work by Sex in Willmar
The most frequent times of departure to work in Willmar are 8:00 AM to 8:29 AM (620, 12.7%) for males and 7:30 AM to 7:59 AM (876, 19.6%) for females.
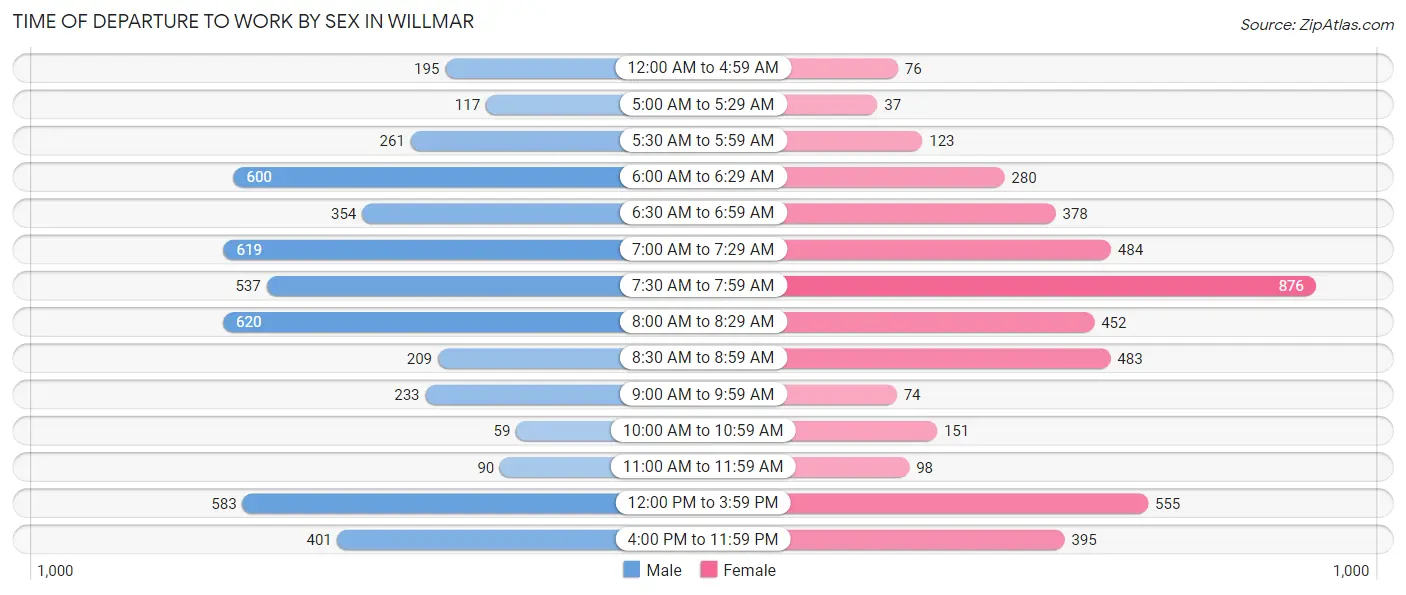
| Time of Departure | Male | Female |
| 12:00 AM to 4:59 AM | 195 (4.0%) | 76 (1.7%) |
| 5:00 AM to 5:29 AM | 117 (2.4%) | 37 (0.8%) |
| 5:30 AM to 5:59 AM | 261 (5.3%) | 123 (2.8%) |
| 6:00 AM to 6:29 AM | 600 (12.3%) | 280 (6.3%) |
| 6:30 AM to 6:59 AM | 354 (7.3%) | 378 (8.5%) |
| 7:00 AM to 7:29 AM | 619 (12.7%) | 484 (10.8%) |
| 7:30 AM to 7:59 AM | 537 (11.0%) | 876 (19.6%) |
| 8:00 AM to 8:29 AM | 620 (12.7%) | 452 (10.1%) |
| 8:30 AM to 8:59 AM | 209 (4.3%) | 483 (10.8%) |
| 9:00 AM to 9:59 AM | 233 (4.8%) | 74 (1.7%) |
| 10:00 AM to 10:59 AM | 59 (1.2%) | 151 (3.4%) |
| 11:00 AM to 11:59 AM | 90 (1.8%) | 98 (2.2%) |
| 12:00 PM to 3:59 PM | 583 (11.9%) | 555 (12.4%) |
| 4:00 PM to 11:59 PM | 401 (8.2%) | 395 (8.8%) |
| Total | 4,878 (100.0%) | 4,462 (100.0%) |
Housing Occupancy in Willmar
Occupancy by Ownership in Willmar
Of the total 8,065 dwellings in Willmar, owner-occupied units account for 4,851 (60.2%), while renter-occupied units make up 3,214 (39.9%).
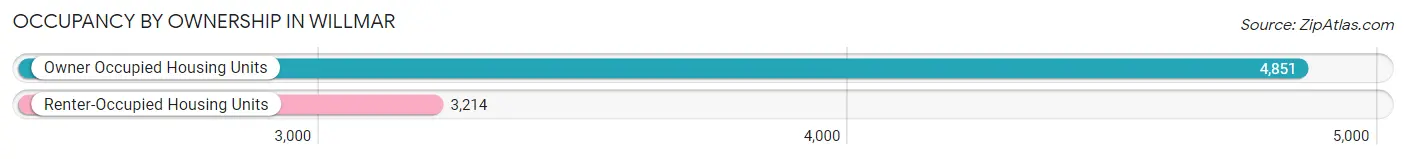
| Occupancy | # Housing Units | % Housing Units |
| Owner Occupied Housing Units | 4,851 | 60.2% |
| Renter-Occupied Housing Units | 3,214 | 39.9% |
| Total Occupied Housing Units | 8,065 | 100.0% |
Occupancy by Household Size in Willmar
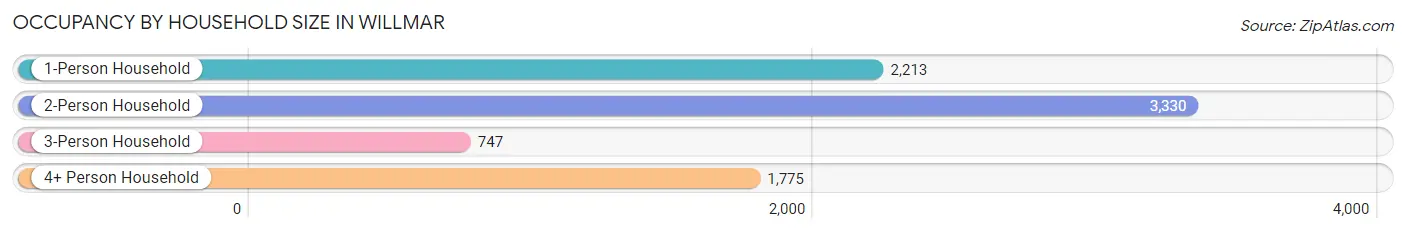
| Household Size | # Housing Units | % Housing Units |
| 1-Person Household | 2,213 | 27.4% |
| 2-Person Household | 3,330 | 41.3% |
| 3-Person Household | 747 | 9.3% |
| 4+ Person Household | 1,775 | 22.0% |
| Total Housing Units | 8,065 | 100.0% |
Occupancy by Ownership by Household Size in Willmar
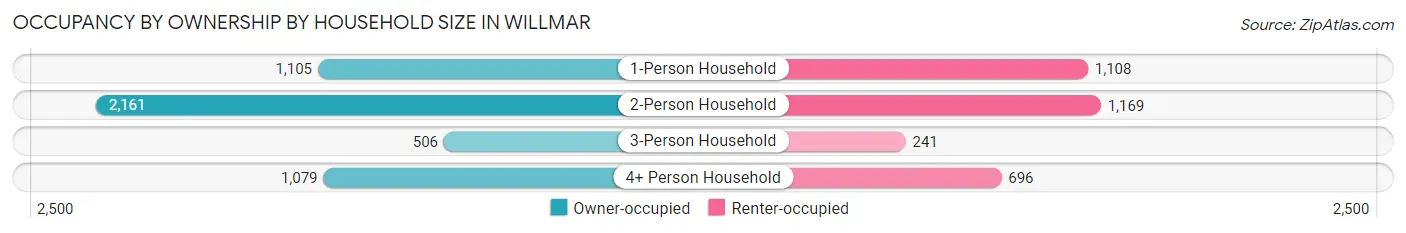
| Household Size | Owner-occupied | Renter-occupied |
| 1-Person Household | 1,105 (49.9%) | 1,108 (50.1%) |
| 2-Person Household | 2,161 (64.9%) | 1,169 (35.1%) |
| 3-Person Household | 506 (67.7%) | 241 (32.3%) |
| 4+ Person Household | 1,079 (60.8%) | 696 (39.2%) |
| Total Housing Units | 4,851 (60.2%) | 3,214 (39.9%) |
Occupancy by Educational Attainment in Willmar
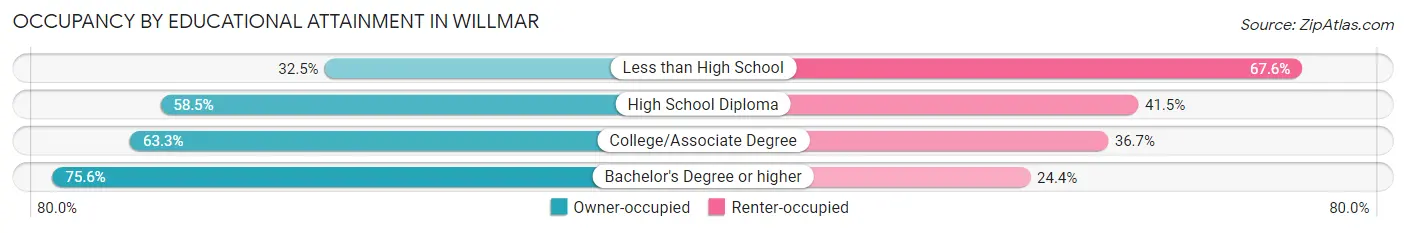
| Household Size | Owner-occupied | Renter-occupied |
| Less than High School | 393 (32.5%) | 818 (67.5%) |
| High School Diploma | 1,216 (58.5%) | 864 (41.5%) |
| College/Associate Degree | 1,880 (63.3%) | 1,092 (36.7%) |
| Bachelor's Degree or higher | 1,362 (75.6%) | 440 (24.4%) |
Occupancy by Age of Householder in Willmar
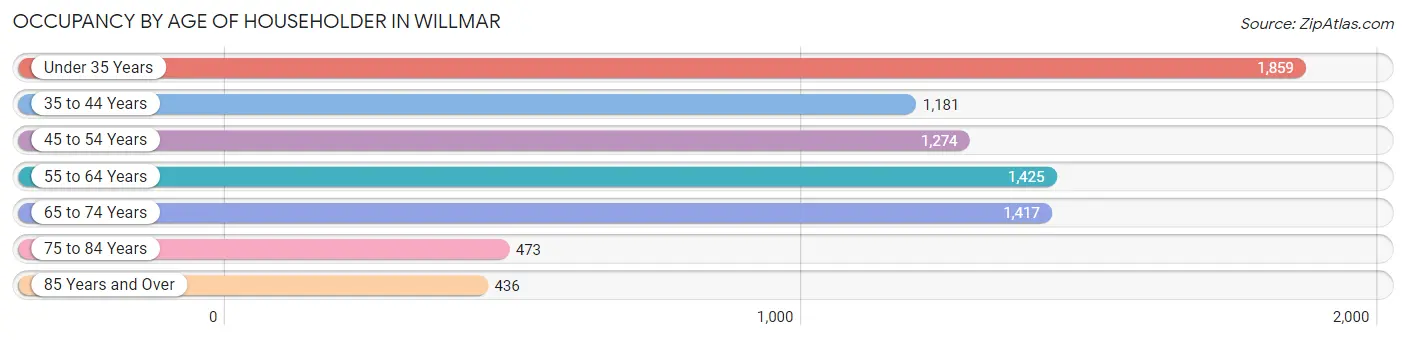
| Age Bracket | # Households | % Households |
| Under 35 Years | 1,859 | 23.1% |
| 35 to 44 Years | 1,181 | 14.6% |
| 45 to 54 Years | 1,274 | 15.8% |
| 55 to 64 Years | 1,425 | 17.7% |
| 65 to 74 Years | 1,417 | 17.6% |
| 75 to 84 Years | 473 | 5.9% |
| 85 Years and Over | 436 | 5.4% |
| Total | 8,065 | 100.0% |
Housing Finances in Willmar
Median Income by Occupancy in Willmar
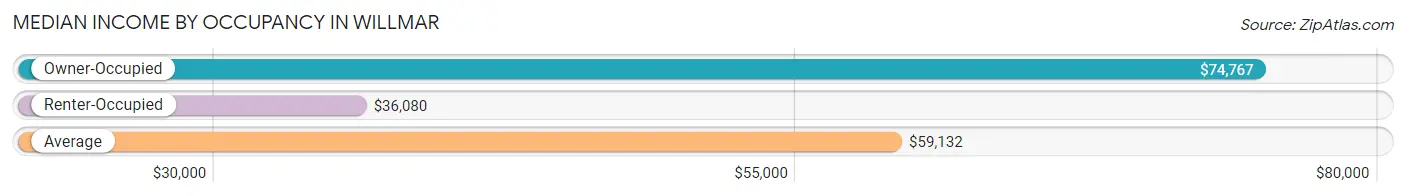
| Occupancy Type | # Households | Median Income |
| Owner-Occupied | 4,851 (60.2%) | $74,767 |
| Renter-Occupied | 3,214 (39.9%) | $36,080 |
| Average | 8,065 (100.0%) | $59,132 |
Occupancy by Householder Income Bracket in Willmar
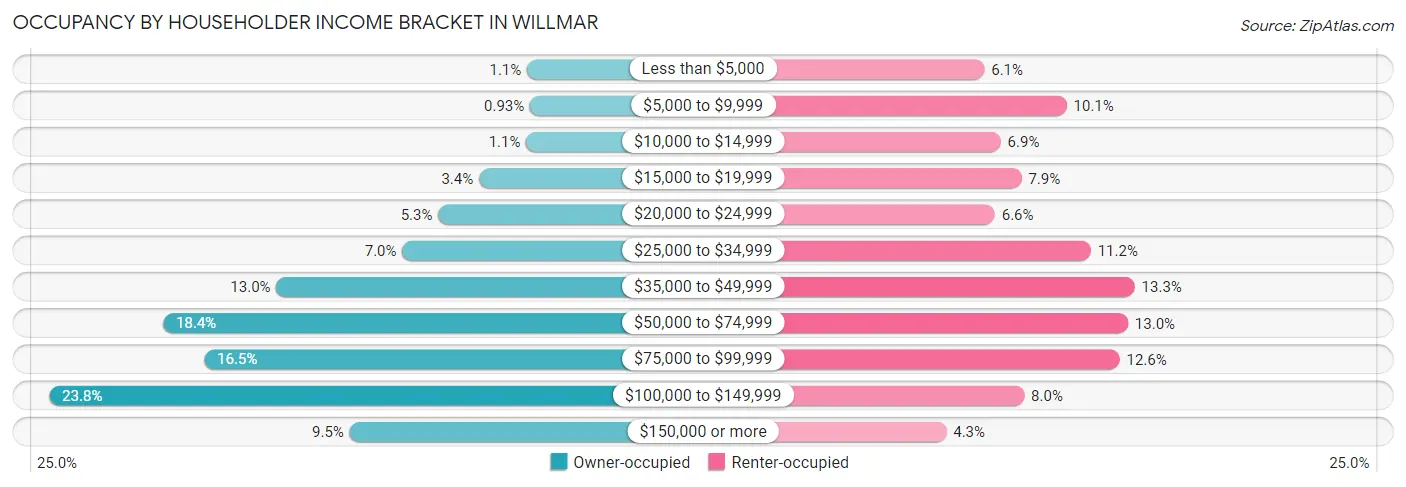
| Income Bracket | Owner-occupied | Renter-occupied |
| Less than $5,000 | 52 (1.1%) | 197 (6.1%) |
| $5,000 to $9,999 | 45 (0.9%) | 323 (10.1%) |
| $10,000 to $14,999 | 54 (1.1%) | 222 (6.9%) |
| $15,000 to $19,999 | 163 (3.4%) | 254 (7.9%) |
| $20,000 to $24,999 | 257 (5.3%) | 213 (6.6%) |
| $25,000 to $34,999 | 340 (7.0%) | 360 (11.2%) |
| $35,000 to $49,999 | 631 (13.0%) | 427 (13.3%) |
| $50,000 to $74,999 | 893 (18.4%) | 417 (13.0%) |
| $75,000 to $99,999 | 798 (16.5%) | 404 (12.6%) |
| $100,000 to $149,999 | 1,156 (23.8%) | 258 (8.0%) |
| $150,000 or more | 462 (9.5%) | 139 (4.3%) |
| Total | 4,851 (100.0%) | 3,214 (100.0%) |
Monthly Housing Cost Tiers in Willmar
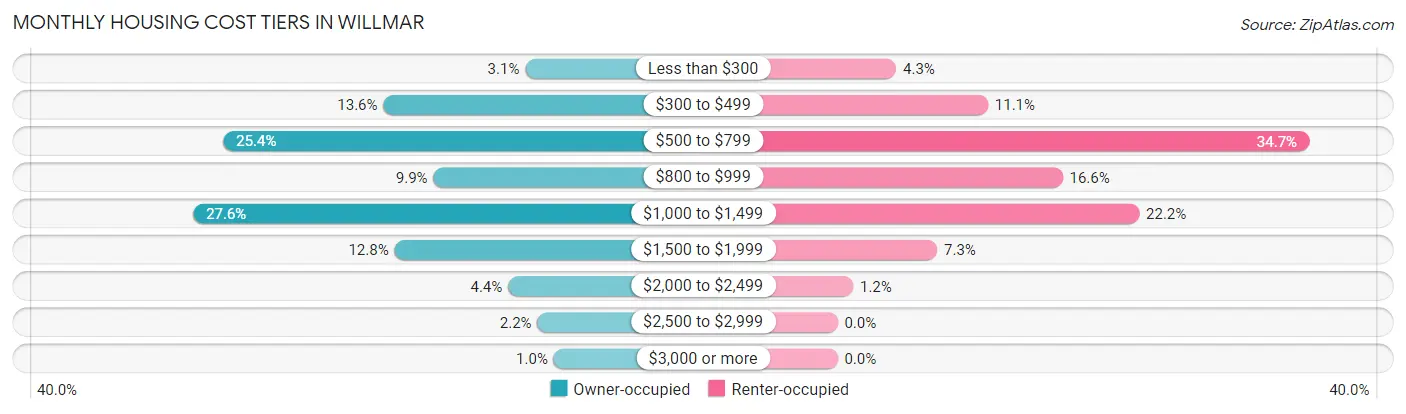
| Monthly Cost | Owner-occupied | Renter-occupied |
| Less than $300 | 152 (3.1%) | 139 (4.3%) |
| $300 to $499 | 659 (13.6%) | 356 (11.1%) |
| $500 to $799 | 1,231 (25.4%) | 1,116 (34.7%) |
| $800 to $999 | 480 (9.9%) | 533 (16.6%) |
| $1,000 to $1,499 | 1,339 (27.6%) | 714 (22.2%) |
| $1,500 to $1,999 | 619 (12.8%) | 236 (7.3%) |
| $2,000 to $2,499 | 213 (4.4%) | 37 (1.1%) |
| $2,500 to $2,999 | 108 (2.2%) | 0 (0.0%) |
| $3,000 or more | 50 (1.0%) | 0 (0.0%) |
| Total | 4,851 (100.0%) | 3,214 (100.0%) |
Physical Housing Characteristics in Willmar
Housing Structures in Willmar
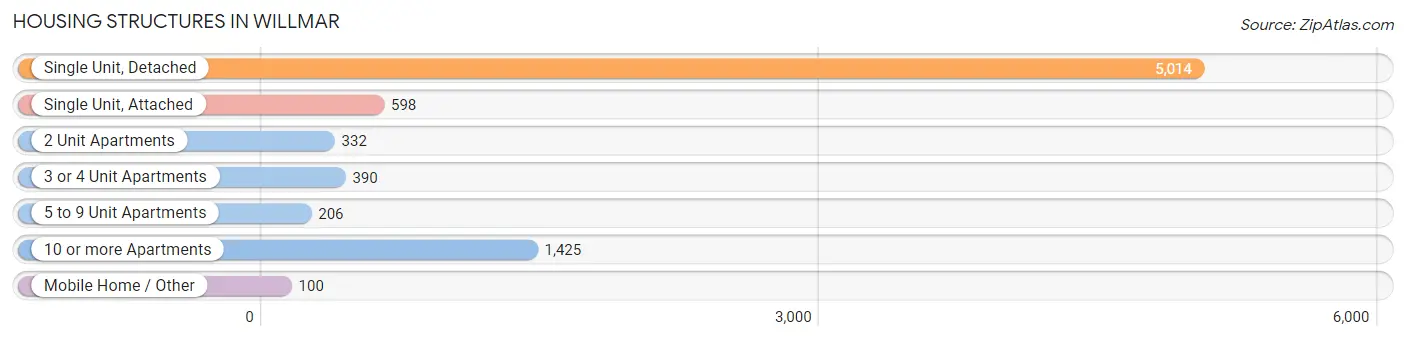
| Structure Type | # Housing Units | % Housing Units |
| Single Unit, Detached | 5,014 | 62.2% |
| Single Unit, Attached | 598 | 7.4% |
| 2 Unit Apartments | 332 | 4.1% |
| 3 or 4 Unit Apartments | 390 | 4.8% |
| 5 to 9 Unit Apartments | 206 | 2.5% |
| 10 or more Apartments | 1,425 | 17.7% |
| Mobile Home / Other | 100 | 1.2% |
| Total | 8,065 | 100.0% |
Housing Structures by Occupancy in Willmar
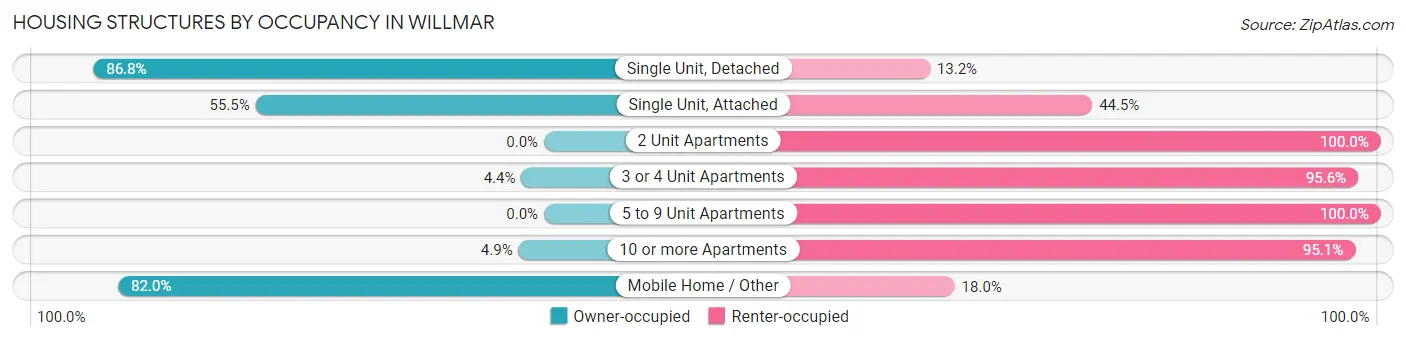
| Structure Type | Owner-occupied | Renter-occupied |
| Single Unit, Detached | 4,350 (86.8%) | 664 (13.2%) |
| Single Unit, Attached | 332 (55.5%) | 266 (44.5%) |
| 2 Unit Apartments | 0 (0.0%) | 332 (100.0%) |
| 3 or 4 Unit Apartments | 17 (4.4%) | 373 (95.6%) |
| 5 to 9 Unit Apartments | 0 (0.0%) | 206 (100.0%) |
| 10 or more Apartments | 70 (4.9%) | 1,355 (95.1%) |
| Mobile Home / Other | 82 (82.0%) | 18 (18.0%) |
| Total | 4,851 (60.2%) | 3,214 (39.9%) |
Housing Structures by Number of Rooms in Willmar
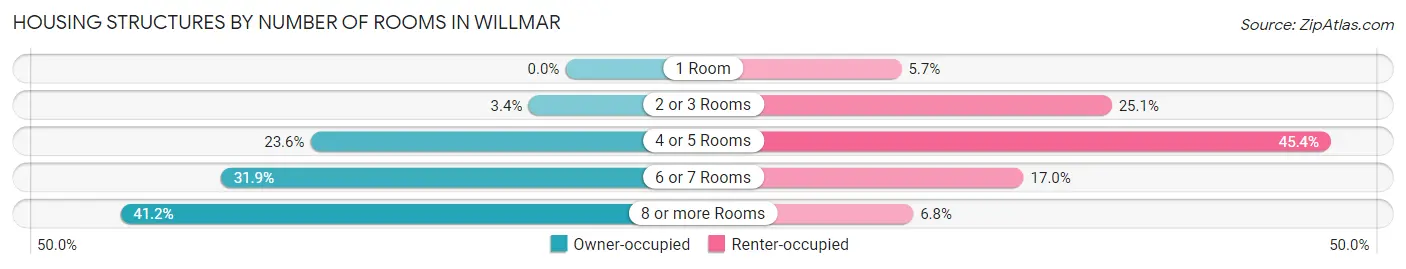
| Number of Rooms | Owner-occupied | Renter-occupied |
| 1 Room | 0 (0.0%) | 183 (5.7%) |
| 2 or 3 Rooms | 166 (3.4%) | 808 (25.1%) |
| 4 or 5 Rooms | 1,144 (23.6%) | 1,459 (45.4%) |
| 6 or 7 Rooms | 1,545 (31.9%) | 546 (17.0%) |
| 8 or more Rooms | 1,996 (41.1%) | 218 (6.8%) |
| Total | 4,851 (100.0%) | 3,214 (100.0%) |
Housing Structure by Heating Type in Willmar
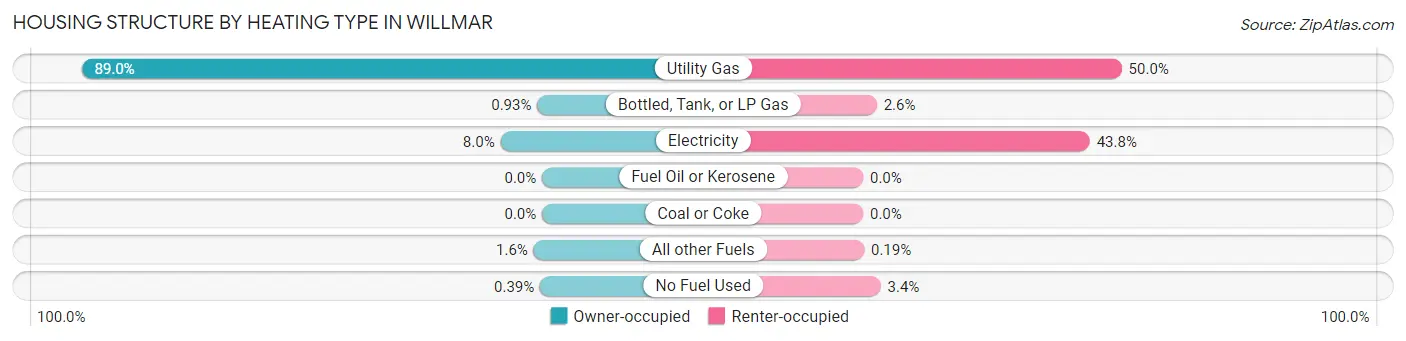
| Heating Type | Owner-occupied | Renter-occupied |
| Utility Gas | 4,318 (89.0%) | 1,606 (50.0%) |
| Bottled, Tank, or LP Gas | 45 (0.9%) | 85 (2.6%) |
| Electricity | 390 (8.0%) | 1,408 (43.8%) |
| Fuel Oil or Kerosene | 0 (0.0%) | 0 (0.0%) |
| Coal or Coke | 0 (0.0%) | 0 (0.0%) |
| All other Fuels | 79 (1.6%) | 6 (0.2%) |
| No Fuel Used | 19 (0.4%) | 109 (3.4%) |
| Total | 4,851 (100.0%) | 3,214 (100.0%) |
Household Vehicle Usage in Willmar
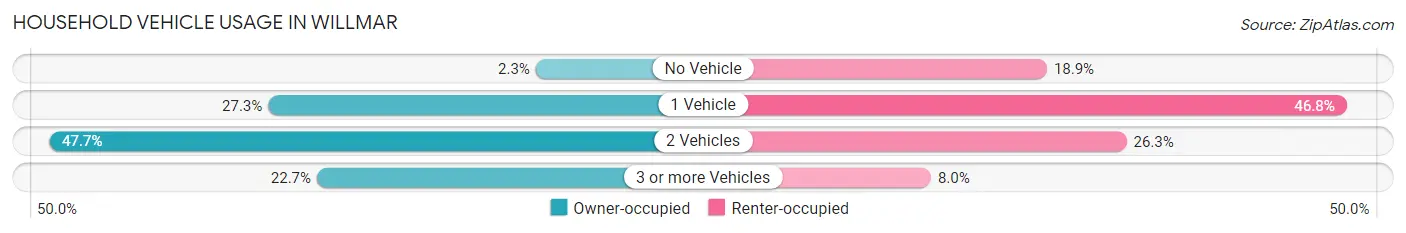
| Vehicles per Household | Owner-occupied | Renter-occupied |
| No Vehicle | 111 (2.3%) | 606 (18.9%) |
| 1 Vehicle | 1,323 (27.3%) | 1,505 (46.8%) |
| 2 Vehicles | 2,315 (47.7%) | 845 (26.3%) |
| 3 or more Vehicles | 1,102 (22.7%) | 258 (8.0%) |
| Total | 4,851 (100.0%) | 3,214 (100.0%) |
Real Estate & Mortgages in Willmar
Real Estate and Mortgage Overview in Willmar
| Characteristic | Without Mortgage | With Mortgage |
| Housing Units | 1,915 | 2,936 |
| Median Property Value | $176,700 | $173,800 |
| Median Household Income | $53,942 | $264 |
| Monthly Housing Costs | $539 | $34 |
| Real Estate Taxes | $1,752 | $38 |
Property Value by Mortgage Status in Willmar
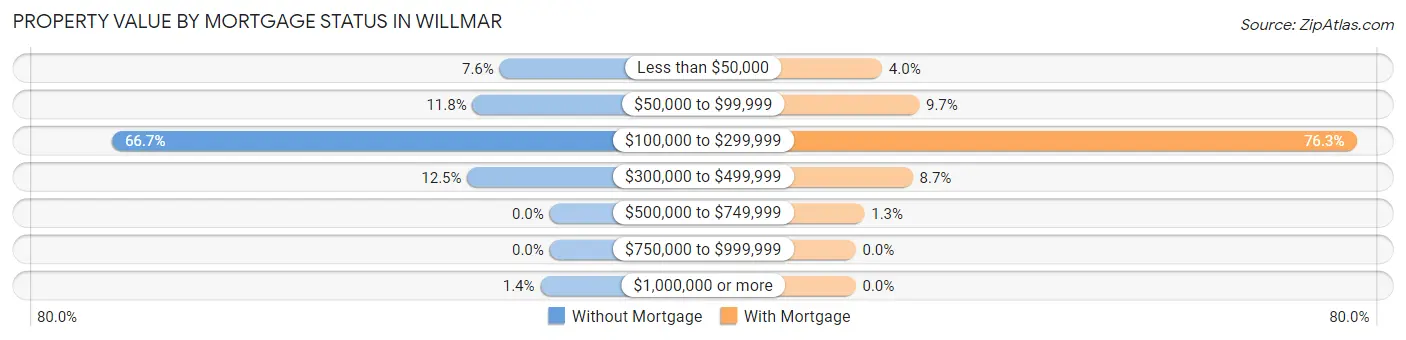
| Property Value | Without Mortgage | With Mortgage |
| Less than $50,000 | 146 (7.6%) | 118 (4.0%) |
| $50,000 to $99,999 | 225 (11.7%) | 284 (9.7%) |
| $100,000 to $299,999 | 1,277 (66.7%) | 2,240 (76.3%) |
| $300,000 to $499,999 | 240 (12.5%) | 255 (8.7%) |
| $500,000 to $749,999 | 0 (0.0%) | 39 (1.3%) |
| $750,000 to $999,999 | 0 (0.0%) | 0 (0.0%) |
| $1,000,000 or more | 27 (1.4%) | 0 (0.0%) |
| Total | 1,915 (100.0%) | 2,936 (100.0%) |
Household Income by Mortgage Status in Willmar
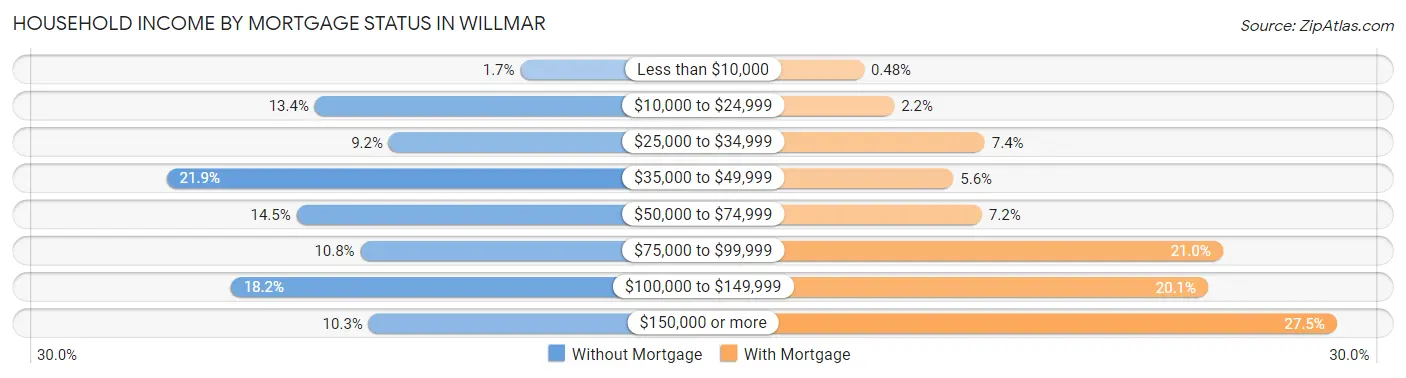
| Household Income | Without Mortgage | With Mortgage |
| Less than $10,000 | 32 (1.7%) | 14 (0.5%) |
| $10,000 to $24,999 | 257 (13.4%) | 65 (2.2%) |
| $25,000 to $34,999 | 176 (9.2%) | 217 (7.4%) |
| $35,000 to $49,999 | 419 (21.9%) | 164 (5.6%) |
| $50,000 to $74,999 | 277 (14.5%) | 212 (7.2%) |
| $75,000 to $99,999 | 207 (10.8%) | 616 (21.0%) |
| $100,000 to $149,999 | 349 (18.2%) | 591 (20.1%) |
| $150,000 or more | 198 (10.3%) | 807 (27.5%) |
| Total | 1,915 (100.0%) | 2,936 (100.0%) |
Property Value to Household Income Ratio in Willmar
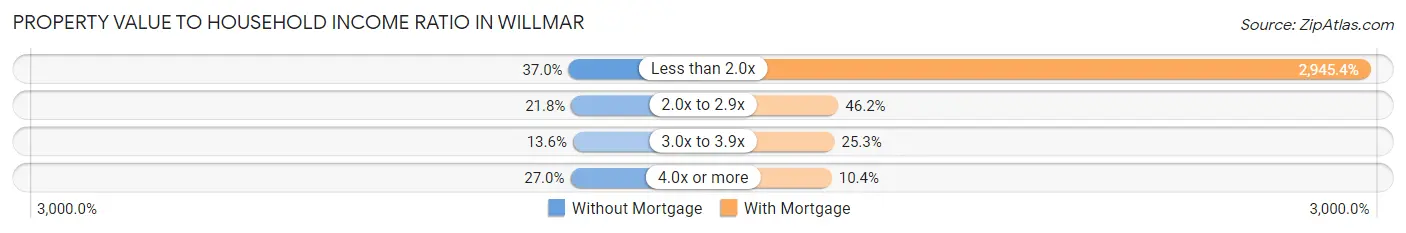
| Value-to-Income Ratio | Without Mortgage | With Mortgage |
| Less than 2.0x | 709 (37.0%) | 86,478 (2,945.4%) |
| 2.0x to 2.9x | 418 (21.8%) | 1,356 (46.2%) |
| 3.0x to 3.9x | 260 (13.6%) | 744 (25.3%) |
| 4.0x or more | 516 (27.0%) | 305 (10.4%) |
| Total | 1,915 (100.0%) | 2,936 (100.0%) |
Real Estate Taxes by Mortgage Status in Willmar
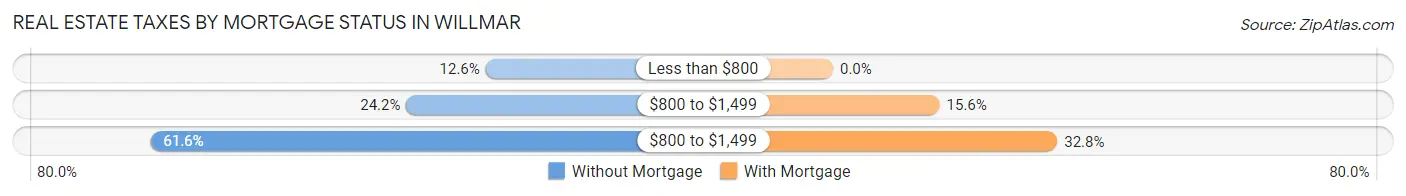
| Property Taxes | Without Mortgage | With Mortgage |
| Less than $800 | 242 (12.6%) | 0 (0.0%) |
| $800 to $1,499 | 464 (24.2%) | 457 (15.6%) |
| $800 to $1,499 | 1,180 (61.6%) | 962 (32.8%) |
| Total | 1,915 (100.0%) | 2,936 (100.0%) |
Health & Disability in Willmar
Health Insurance Coverage by Age in Willmar
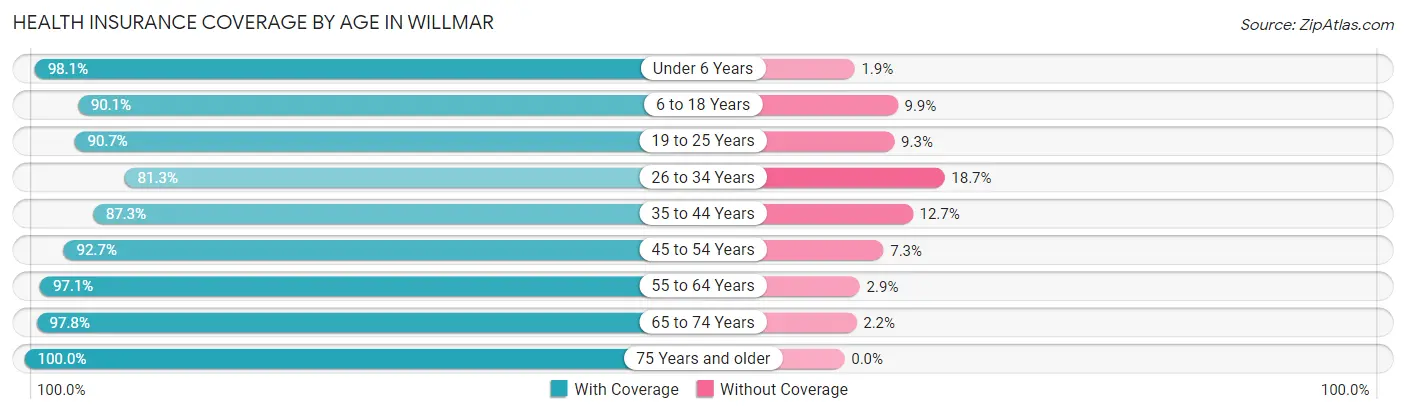
| Age Bracket | With Coverage | Without Coverage |
| Under 6 Years | 1,862 (98.1%) | 36 (1.9%) |
| 6 to 18 Years | 3,230 (90.1%) | 356 (9.9%) |
| 19 to 25 Years | 1,979 (90.7%) | 203 (9.3%) |
| 26 to 34 Years | 1,997 (81.3%) | 458 (18.7%) |
| 35 to 44 Years | 2,059 (87.3%) | 300 (12.7%) |
| 45 to 54 Years | 1,965 (92.7%) | 154 (7.3%) |
| 55 to 64 Years | 2,339 (97.1%) | 69 (2.9%) |
| 65 to 74 Years | 2,064 (97.8%) | 47 (2.2%) |
| 75 Years and older | 1,298 (100.0%) | 0 (0.0%) |
| Total | 18,793 (92.0%) | 1,623 (8.0%) |
Health Insurance Coverage by Citizenship Status in Willmar
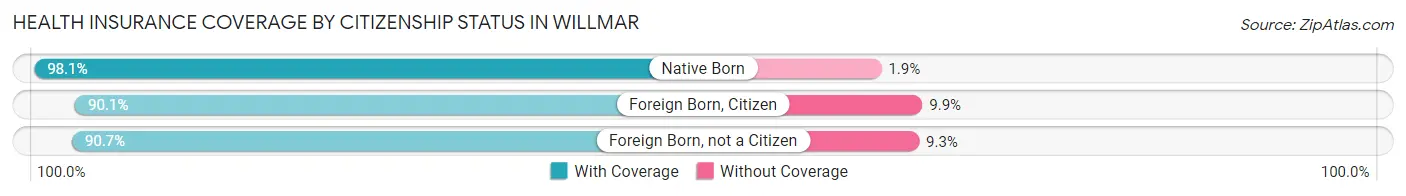
| Citizenship Status | With Coverage | Without Coverage |
| Native Born | 1,862 (98.1%) | 36 (1.9%) |
| Foreign Born, Citizen | 3,230 (90.1%) | 356 (9.9%) |
| Foreign Born, not a Citizen | 1,979 (90.7%) | 203 (9.3%) |
Health Insurance Coverage by Household Income in Willmar
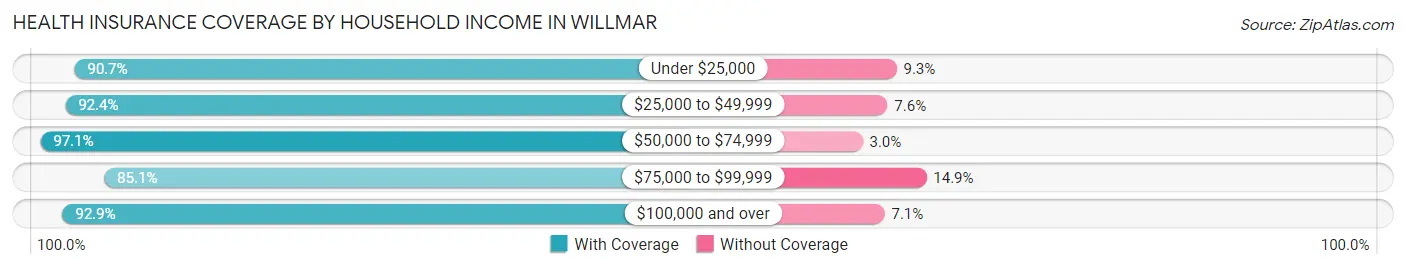
| Household Income | With Coverage | Without Coverage |
| Under $25,000 | 2,901 (90.7%) | 298 (9.3%) |
| $25,000 to $49,999 | 3,496 (92.4%) | 288 (7.6%) |
| $50,000 to $74,999 | 3,353 (97.1%) | 102 (2.9%) |
| $75,000 to $99,999 | 2,831 (85.1%) | 496 (14.9%) |
| $100,000 and over | 5,772 (92.9%) | 439 (7.1%) |
Public vs Private Health Insurance Coverage by Age in Willmar
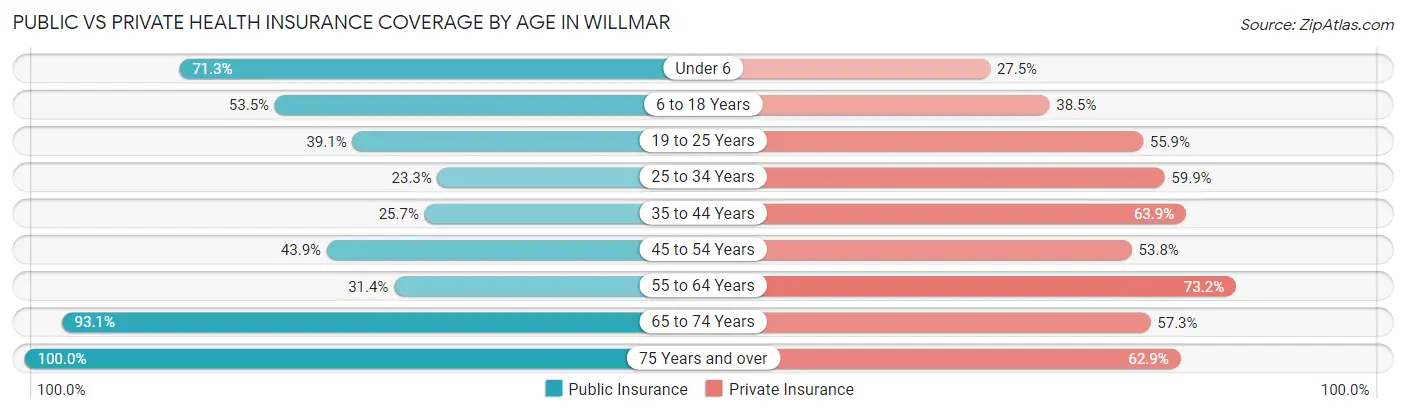
| Age Bracket | Public Insurance | Private Insurance |
| Under 6 | 1,353 (71.3%) | 522 (27.5%) |
| 6 to 18 Years | 1,920 (53.5%) | 1,381 (38.5%) |
| 19 to 25 Years | 854 (39.1%) | 1,219 (55.9%) |
| 25 to 34 Years | 573 (23.3%) | 1,470 (59.9%) |
| 35 to 44 Years | 607 (25.7%) | 1,507 (63.9%) |
| 45 to 54 Years | 930 (43.9%) | 1,140 (53.8%) |
| 55 to 64 Years | 756 (31.4%) | 1,762 (73.2%) |
| 65 to 74 Years | 1,966 (93.1%) | 1,209 (57.3%) |
| 75 Years and over | 1,298 (100.0%) | 816 (62.9%) |
| Total | 10,257 (50.2%) | 11,026 (54.0%) |
Disability Status by Sex by Age in Willmar
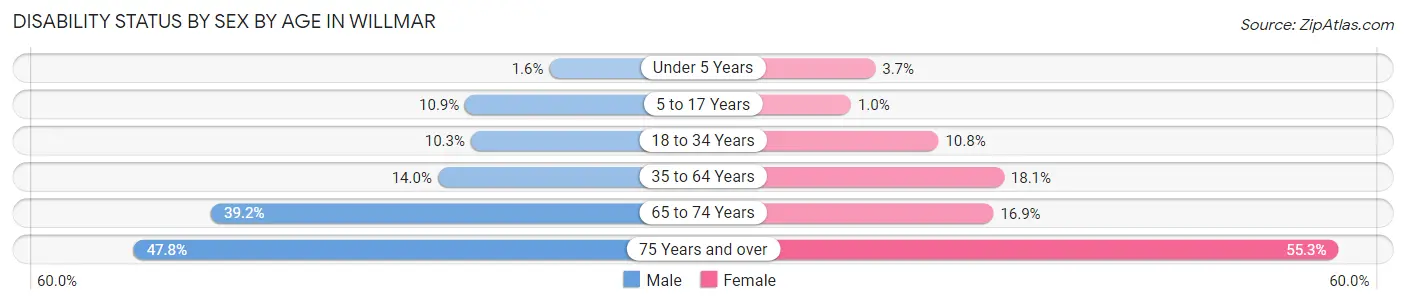
| Age Bracket | Male | Female |
| Under 5 Years | 13 (1.6%) | 28 (3.7%) |
| 5 to 17 Years | 200 (10.9%) | 19 (1.0%) |
| 18 to 34 Years | 233 (10.3%) | 279 (10.8%) |
| 35 to 64 Years | 465 (14.0%) | 643 (18.0%) |
| 65 to 74 Years | 424 (39.2%) | 174 (16.9%) |
| 75 Years and over | 255 (47.8%) | 423 (55.3%) |
Disability Class by Sex by Age in Willmar
Disability Class: Hearing Difficulty
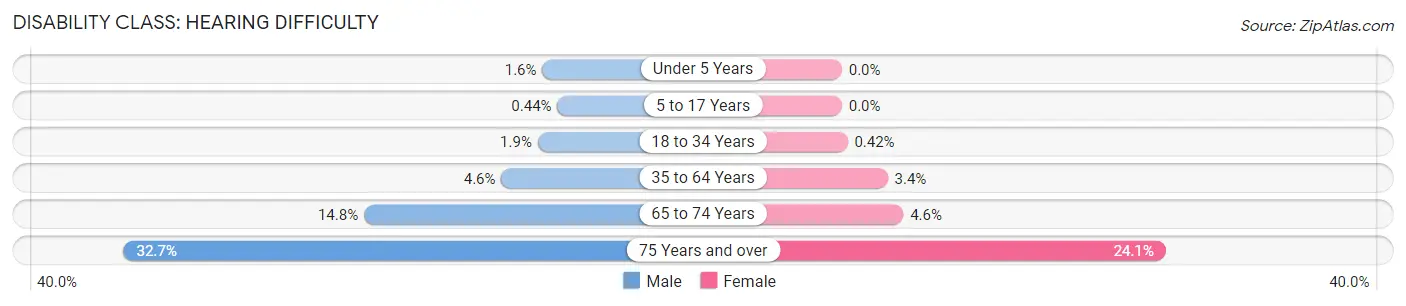
| Age Bracket | Male | Female |
| Under 5 Years | 13 (1.6%) | 0 (0.0%) |
| 5 to 17 Years | 8 (0.4%) | 0 (0.0%) |
| 18 to 34 Years | 43 (1.9%) | 11 (0.4%) |
| 35 to 64 Years | 153 (4.6%) | 121 (3.4%) |
| 65 to 74 Years | 160 (14.8%) | 47 (4.6%) |
| 75 Years and over | 174 (32.7%) | 184 (24.0%) |
Disability Class: Vision Difficulty
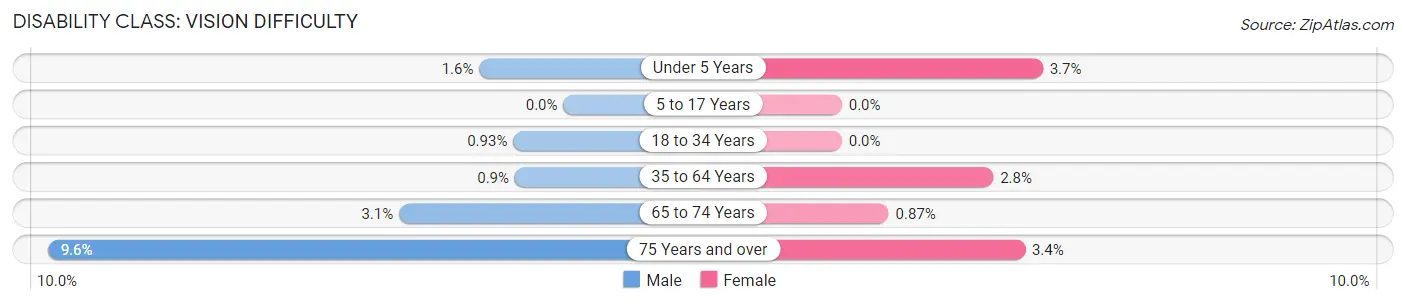
| Age Bracket | Male | Female |
| Under 5 Years | 13 (1.6%) | 28 (3.7%) |
| 5 to 17 Years | 0 (0.0%) | 0 (0.0%) |
| 18 to 34 Years | 21 (0.9%) | 0 (0.0%) |
| 35 to 64 Years | 30 (0.9%) | 100 (2.8%) |
| 65 to 74 Years | 33 (3.0%) | 9 (0.9%) |
| 75 Years and over | 51 (9.6%) | 26 (3.4%) |
Disability Class: Cognitive Difficulty
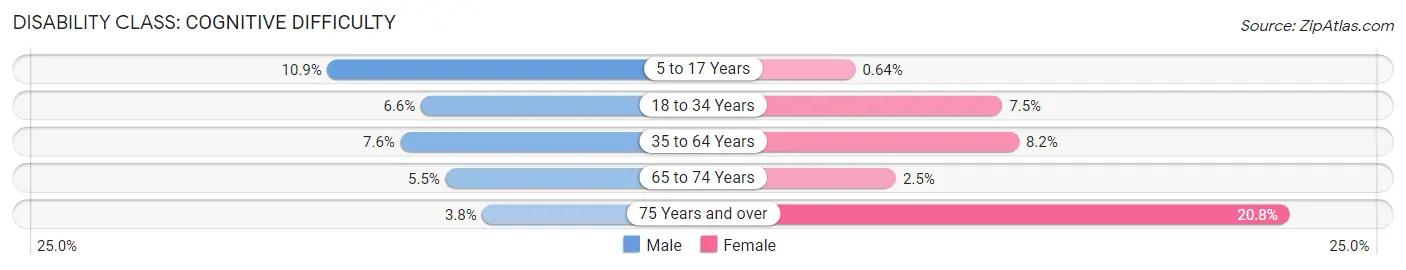
| Age Bracket | Male | Female |
| 5 to 17 Years | 200 (10.9%) | 12 (0.6%) |
| 18 to 34 Years | 149 (6.6%) | 193 (7.4%) |
| 35 to 64 Years | 251 (7.5%) | 293 (8.2%) |
| 65 to 74 Years | 59 (5.5%) | 26 (2.5%) |
| 75 Years and over | 20 (3.7%) | 159 (20.8%) |
Disability Class: Ambulatory Difficulty
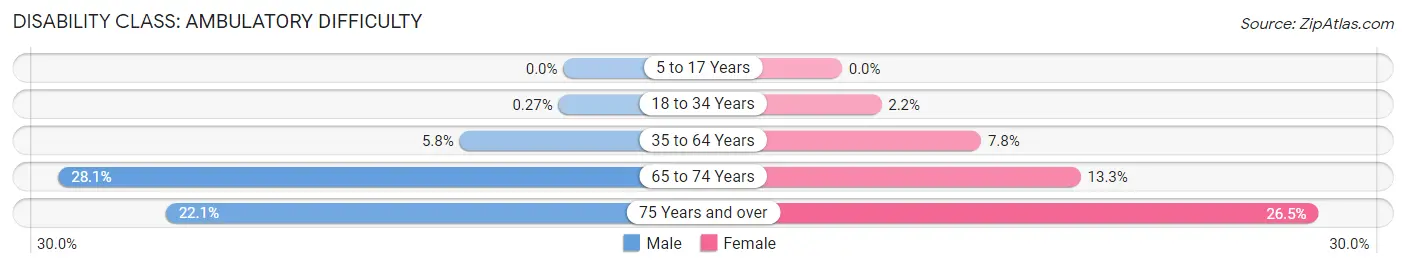
| Age Bracket | Male | Female |
| 5 to 17 Years | 0 (0.0%) | 0 (0.0%) |
| 18 to 34 Years | 6 (0.3%) | 57 (2.2%) |
| 35 to 64 Years | 192 (5.8%) | 276 (7.7%) |
| 65 to 74 Years | 304 (28.1%) | 137 (13.3%) |
| 75 Years and over | 118 (22.1%) | 203 (26.5%) |
Disability Class: Self-Care Difficulty
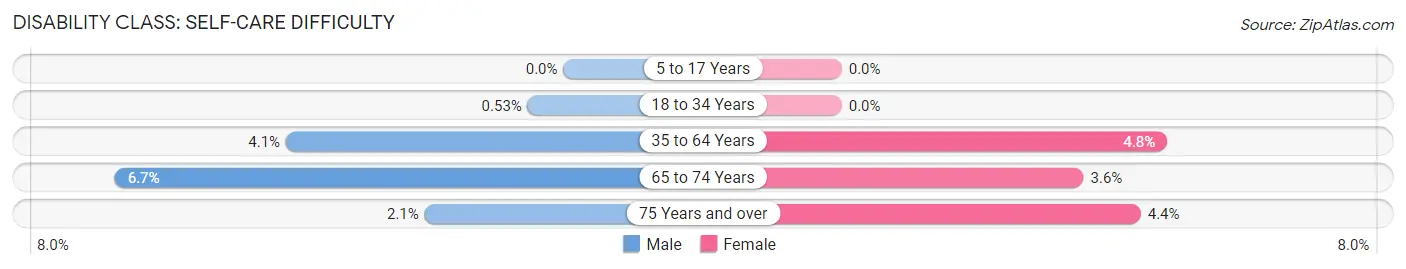
| Age Bracket | Male | Female |
| 5 to 17 Years | 0 (0.0%) | 0 (0.0%) |
| 18 to 34 Years | 12 (0.5%) | 0 (0.0%) |
| 35 to 64 Years | 137 (4.1%) | 172 (4.8%) |
| 65 to 74 Years | 72 (6.7%) | 37 (3.6%) |
| 75 Years and over | 11 (2.1%) | 34 (4.4%) |
Technology Access in Willmar
Computing Device Access in Willmar
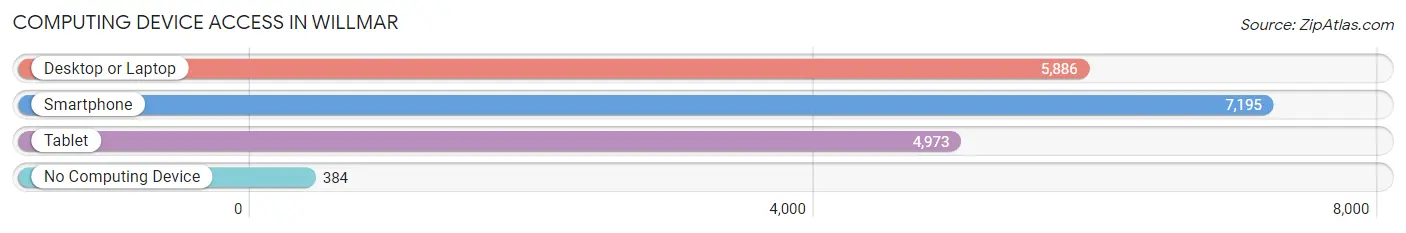
| Device Type | # Households | % Households |
| Desktop or Laptop | 5,886 | 73.0% |
| Smartphone | 7,195 | 89.2% |
| Tablet | 4,973 | 61.7% |
| No Computing Device | 384 | 4.8% |
| Total | 8,065 | 100.0% |
Internet Access in Willmar
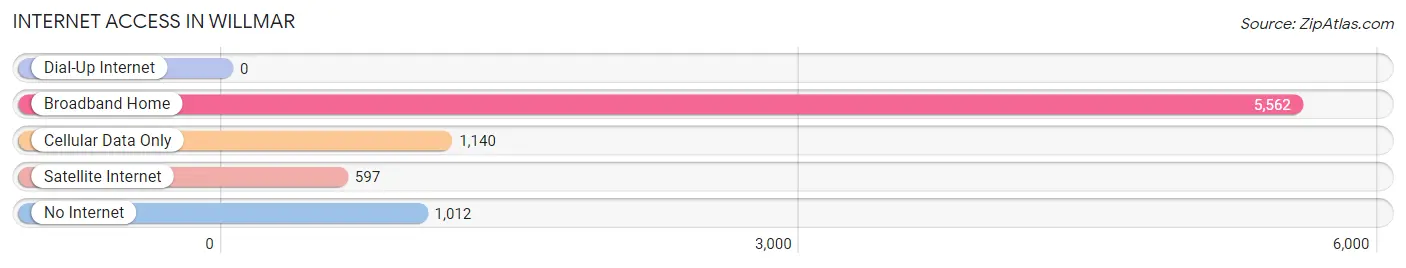
| Internet Type | # Households | % Households |
| Dial-Up Internet | 0 | 0.0% |
| Broadband Home | 5,562 | 69.0% |
| Cellular Data Only | 1,140 | 14.1% |
| Satellite Internet | 597 | 7.4% |
| No Internet | 1,012 | 12.6% |
| Total | 8,065 | 100.0% |
Willmar Summary
Willmar, Minnesota is a city located in the central part of the state, in Kandiyohi County. It is the county seat and the largest city in the county. The city is situated on the banks of the Willmar Lakes, a chain of five lakes that are connected by the Middle Fork of the Crow River. The city is located about 90 miles west of Minneapolis and St. Paul, and about 40 miles east of St. Cloud.
History
The area that is now Willmar was first settled in the late 1850s by Swedish immigrants. The city was officially incorporated in 1869, and was named after the Swedish immigrant, John Willmar. The city was initially a farming community, but it soon developed into a commercial center for the surrounding area.
In the early 1900s, the city began to grow rapidly, and by the 1920s, it had become a major regional center for trade and commerce. The city was also home to a number of manufacturing companies, including a flour mill, a creamery, and a canning factory.
Geography
Willmar is located in the central part of Minnesota, in Kandiyohi County. The city is situated on the banks of the Willmar Lakes, a chain of five lakes that are connected by the Middle Fork of the Crow River. The city is located about 90 miles west of Minneapolis and St. Paul, and about 40 miles east of St. Cloud.
The city has a total area of 8.7 square miles, of which 8.3 square miles is land and 0.4 square miles is water. The city is located in a flat, low-lying area, with an elevation of 1,072 feet above sea level.
Economy
Willmar is a major regional center for trade and commerce. The city is home to a number of manufacturing companies, including a flour mill, a creamery, and a canning factory. The city is also home to a number of retail stores, restaurants, and other businesses.
The city is also home to a number of healthcare facilities, including the Rice Memorial Hospital, the Willmar Regional Treatment Center, and the Willmar Medical Center. The city is also home to a number of educational institutions, including the Willmar Public Schools, Ridgewater College, and the University of Minnesota-Morris.
Demographics
As of the 2010 census, the city had a population of 19,610. The racial makeup of the city was 87.3% White, 4.2% African American, 0.7% Native American, 1.7% Asian, 0.1% Pacific Islander, 4.2% from other races, and 2.0% from two or more races. Hispanic or Latino of any race were 8.3% of the population.
The median income for a household in the city was $41,945, and the median income for a family was $51,945. The per capita income for the city was $20,945. About 11.2% of families and 14.3% of the population were below the poverty line, including 19.2% of those under age 18 and 8.2% of those age 65 or over.
Common Questions
What is Per Capita Income in Willmar?
Per Capita income in Willmar is $29,074.
What is the Median Family Income in Willmar?
Median Family Income in Willmar is $72,667.
What is the Median Household income in Willmar?
Median Household Income in Willmar is $59,132.
What is Income or Wage Gap in Willmar?
Income or Wage Gap in Willmar is 30.1%.
Women in Willmar earn 69.9 cents for every dollar earned by a man.
What is Family Income Deficit in Willmar?
Family Income Deficit in Willmar is $11,553.
Families that are below poverty line in Willmar earn $11,553 less on average than the poverty threshold level.
What is Inequality or Gini Index in Willmar?
Inequality or Gini Index in Willmar is 0.43.
What is the Total Population of Willmar?
Total Population of Willmar is 21,006.
What is the Total Male Population of Willmar?
Total Male Population of Willmar is 10,111.
What is the Total Female Population of Willmar?
Total Female Population of Willmar is 10,895.
What is the Ratio of Males per 100 Females in Willmar?
There are 92.80 Males per 100 Females in Willmar.
What is the Ratio of Females per 100 Males in Willmar?
There are 107.75 Females per 100 Males in Willmar.
What is the Median Population Age in Willmar?
Median Population Age in Willmar is 36.4 Years.
What is the Average Family Size in Willmar
Average Family Size in Willmar is 3.0 People.
What is the Average Household Size in Willmar
Average Household Size in Willmar is 2.5 People.
How Large is the Labor Force in Willmar?
There are 10,875 People in the Labor Forcein in Willmar.
What is the Percentage of People in the Labor Force in Willmar?
67.0% of People are in the Labor Force in Willmar.
What is the Unemployment Rate in Willmar?
Unemployment Rate in Willmar is 5.4%.