Owatonna, MN Map & Demographics
Owatonna Map
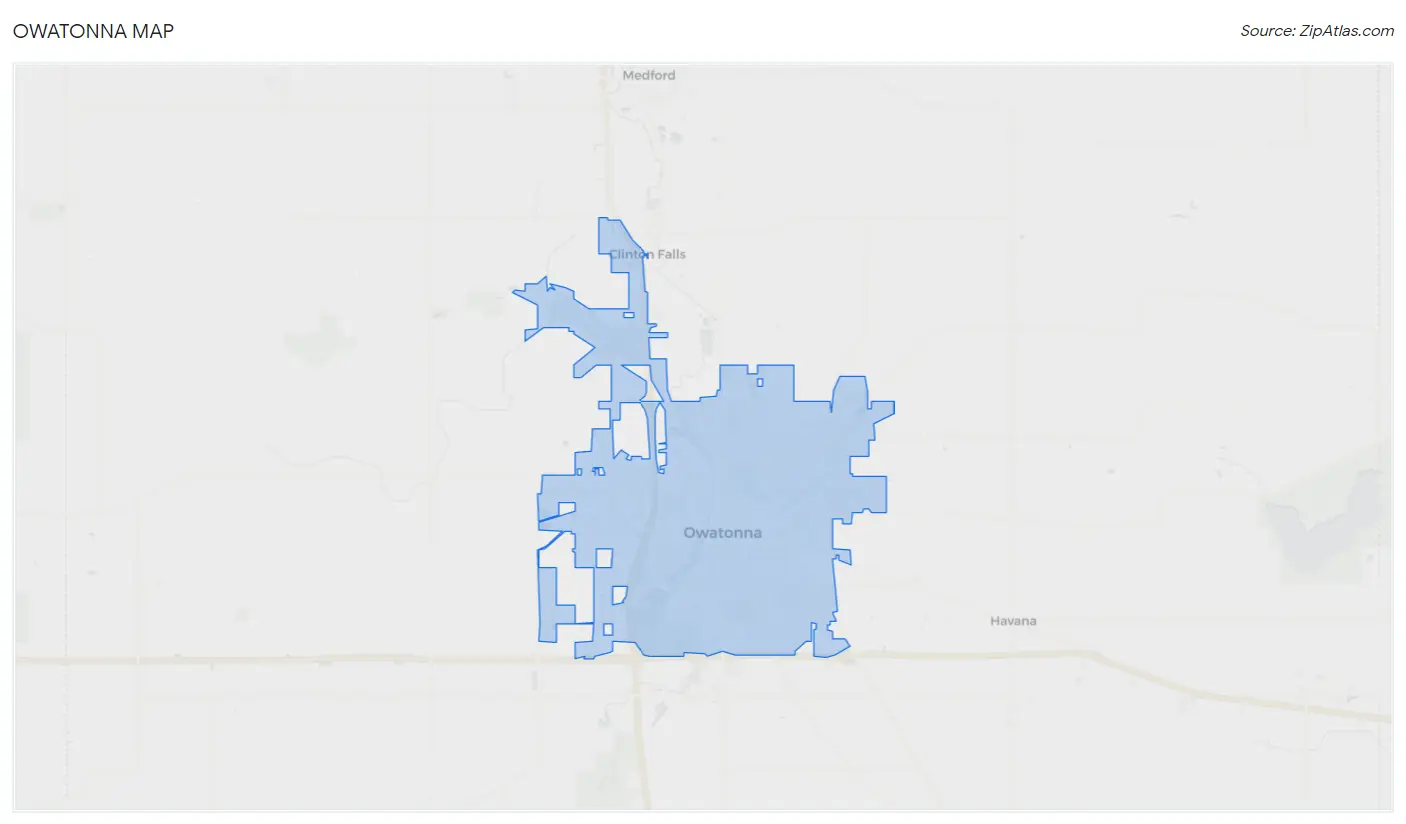
Owatonna Overview
$40,889
PER CAPITA INCOME
$103,829
AVG FAMILY INCOME
$78,295
AVG HOUSEHOLD INCOME
32.7%
WAGE / INCOME GAP [ % ]
67.3¢/ $1
WAGE / INCOME GAP [ $ ]
$11,219
FAMILY INCOME DEFICIT
0.44
INEQUALITY / GINI INDEX
26,400
TOTAL POPULATION
13,170
MALE POPULATION
13,230
FEMALE POPULATION
99.55
MALES / 100 FEMALES
100.46
FEMALES / 100 MALES
40.0
MEDIAN AGE
3.0
AVG FAMILY SIZE
2.4
AVG HOUSEHOLD SIZE
13,939
LABOR FORCE [ PEOPLE ]
67.3%
PERCENT IN LABOR FORCE
3.6%
UNEMPLOYMENT RATE
Owatonna Zip Codes
Owatonna Area Codes
Income in Owatonna
Income Overview in Owatonna
Per Capita Income in Owatonna is $40,889, while median incomes of families and households are $103,829 and $78,295 respectively.
| Characteristic | Number | Measure |
| Per Capita Income | 26,400 | $40,889 |
| Median Family Income | 6,814 | $103,829 |
| Mean Family Income | 6,814 | $118,268 |
| Median Household Income | 10,958 | $78,295 |
| Mean Household Income | 10,958 | $96,813 |
| Income Deficit | 6,814 | $11,219 |
| Wage / Income Gap (%) | 26,400 | 32.72% |
| Wage / Income Gap ($) | 26,400 | 67.28¢ per $1 |
| Gini / Inequality Index | 26,400 | 0.44 |
Earnings by Sex in Owatonna
Average Earnings in Owatonna are $46,637, $54,688 for men and $36,792 for women, a difference of 32.7%.
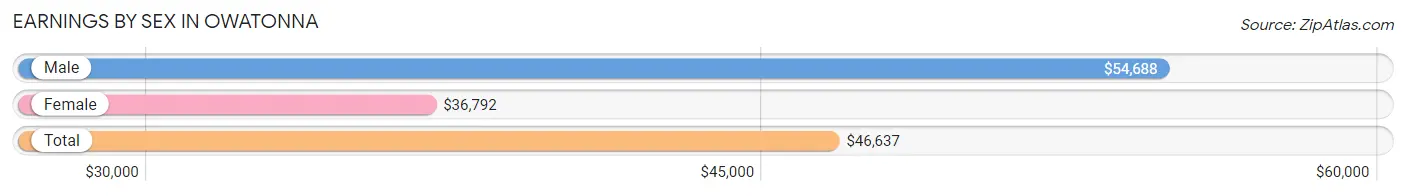
| Sex | Number | Average Earnings |
| Male | 8,147 (55.0%) | $54,688 |
| Female | 6,652 (45.0%) | $36,792 |
| Total | 14,799 (100.0%) | $46,637 |
Earnings by Sex by Income Bracket in Owatonna
The most common earnings brackets in Owatonna are $75,000 to $99,999 for men (1,391 | 17.1%) and $75,000 to $99,999 for women (626 | 9.4%).
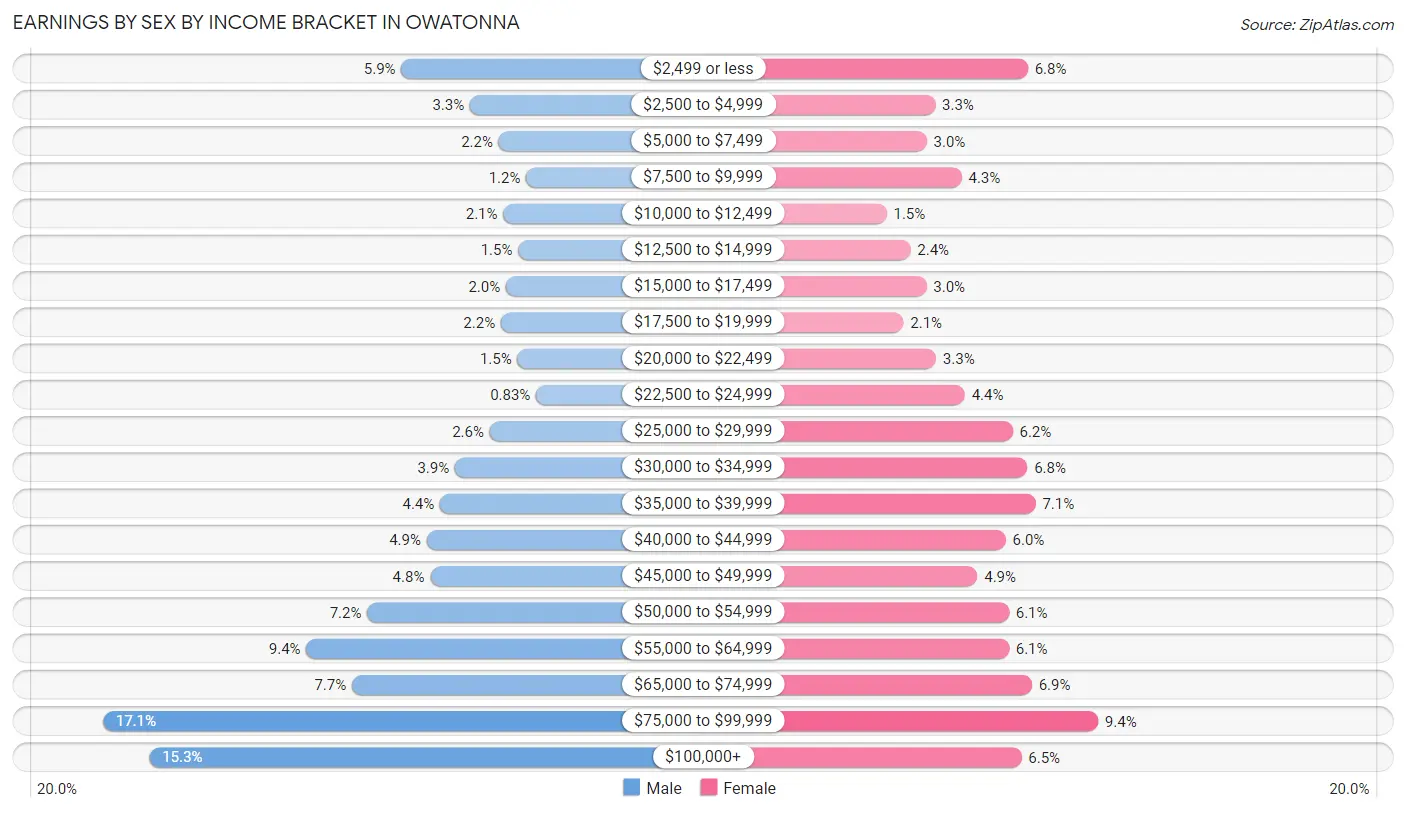
| Income | Male | Female |
| $2,499 or less | 479 (5.9%) | 451 (6.8%) |
| $2,500 to $4,999 | 270 (3.3%) | 220 (3.3%) |
| $5,000 to $7,499 | 182 (2.2%) | 199 (3.0%) |
| $7,500 to $9,999 | 98 (1.2%) | 286 (4.3%) |
| $10,000 to $12,499 | 168 (2.1%) | 99 (1.5%) |
| $12,500 to $14,999 | 122 (1.5%) | 158 (2.4%) |
| $15,000 to $17,499 | 160 (2.0%) | 198 (3.0%) |
| $17,500 to $19,999 | 175 (2.1%) | 141 (2.1%) |
| $20,000 to $22,499 | 125 (1.5%) | 222 (3.3%) |
| $22,500 to $24,999 | 68 (0.8%) | 294 (4.4%) |
| $25,000 to $29,999 | 209 (2.6%) | 413 (6.2%) |
| $30,000 to $34,999 | 315 (3.9%) | 450 (6.8%) |
| $35,000 to $39,999 | 361 (4.4%) | 470 (7.1%) |
| $40,000 to $44,999 | 402 (4.9%) | 396 (5.9%) |
| $45,000 to $49,999 | 391 (4.8%) | 325 (4.9%) |
| $50,000 to $54,999 | 583 (7.2%) | 404 (6.1%) |
| $55,000 to $64,999 | 769 (9.4%) | 404 (6.1%) |
| $65,000 to $74,999 | 630 (7.7%) | 461 (6.9%) |
| $75,000 to $99,999 | 1,391 (17.1%) | 626 (9.4%) |
| $100,000+ | 1,249 (15.3%) | 435 (6.5%) |
| Total | 8,147 (100.0%) | 6,652 (100.0%) |
Earnings by Sex by Educational Attainment in Owatonna
Average earnings in Owatonna are $62,754 for men and $43,300 for women, a difference of 31.0%. Men with an educational attainment of graduate degree enjoy the highest average annual earnings of $82,417, while those with high school diploma education earn the least with $45,542. Women with an educational attainment of graduate degree earn the most with the average annual earnings of $77,147, while those with less than high school education have the smallest earnings of $31,477.
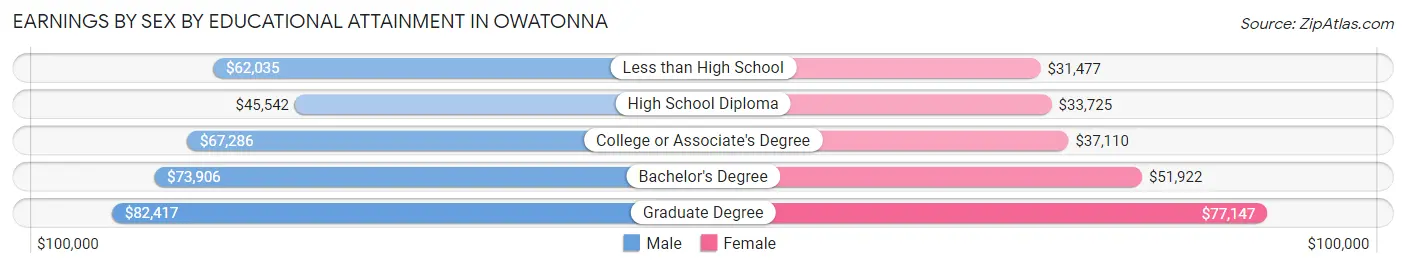
| Educational Attainment | Male Income | Female Income |
| Less than High School | $62,035 | $31,477 |
| High School Diploma | $45,542 | $33,725 |
| College or Associate's Degree | $67,286 | $37,110 |
| Bachelor's Degree | $73,906 | $51,922 |
| Graduate Degree | $82,417 | $77,147 |
| Total | $62,754 | $43,300 |
Family Income in Owatonna
Family Income Brackets in Owatonna
According to the Owatonna family income data, there are 1,860 families falling into the $100,000 to $149,999 income range, which is the most common income bracket and makes up 27.3% of all families. Conversely, the $10,000 to $14,999 income bracket is the least frequent group with only 61 families (0.9%) belonging to this category.
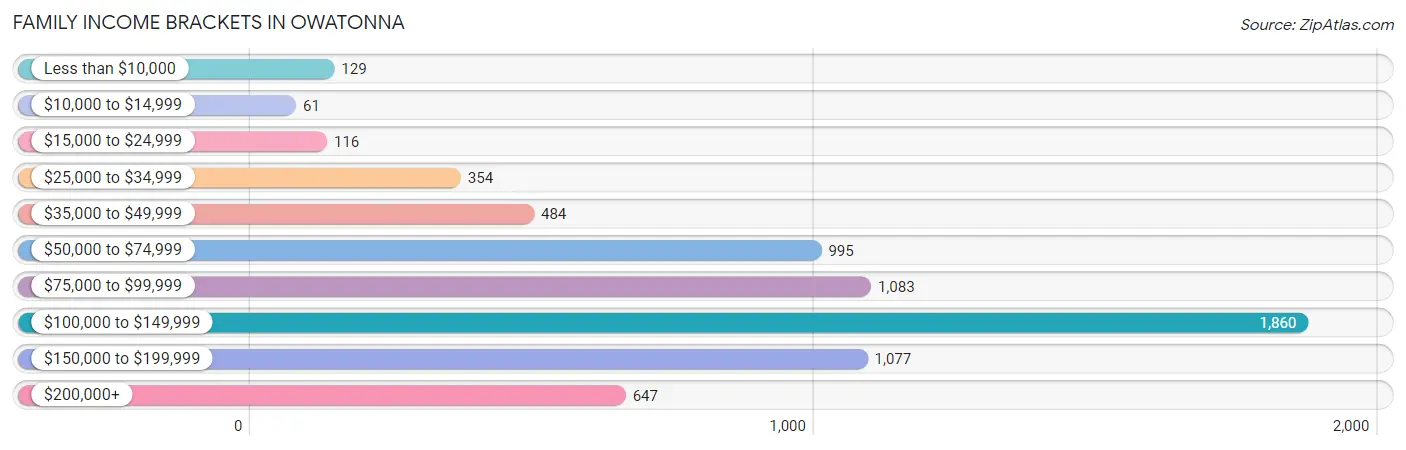
| Income Bracket | # Families | % Families |
| Less than $10,000 | 129 | 1.9% |
| $10,000 to $14,999 | 61 | 0.9% |
| $15,000 to $24,999 | 116 | 1.7% |
| $25,000 to $34,999 | 354 | 5.2% |
| $35,000 to $49,999 | 484 | 7.1% |
| $50,000 to $74,999 | 995 | 14.6% |
| $75,000 to $99,999 | 1,083 | 15.9% |
| $100,000 to $149,999 | 1,860 | 27.3% |
| $150,000 to $199,999 | 1,077 | 15.8% |
| $200,000+ | 647 | 9.5% |
Family Income by Famaliy Size in Owatonna
6-person families (114 | 1.7%) account for the highest median family income in Owatonna with $135,673 per family, while 2-person families (3,567 | 52.3%) have the highest median income of $45,648 per family member.
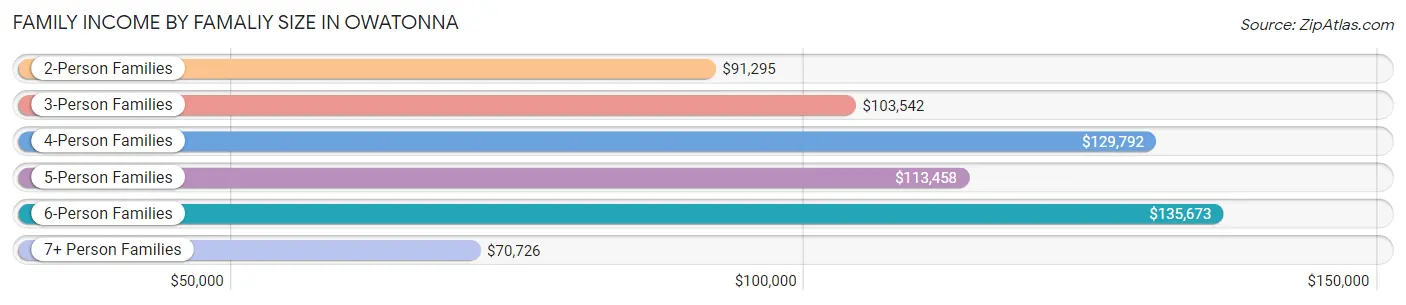
| Income Bracket | # Families | Median Income |
| 2-Person Families | 3,567 (52.3%) | $91,295 |
| 3-Person Families | 1,023 (15.0%) | $103,542 |
| 4-Person Families | 1,240 (18.2%) | $129,792 |
| 5-Person Families | 784 (11.5%) | $113,458 |
| 6-Person Families | 114 (1.7%) | $135,673 |
| 7+ Person Families | 86 (1.3%) | $70,726 |
| Total | 6,814 (100.0%) | $103,829 |
Family Income by Number of Earners in Owatonna
The median family income in Owatonna is $103,829, with families comprising 3+ earners (824) having the highest median family income of $135,083, while families with 1 earner (1,546) have the lowest median family income of $55,169, accounting for 12.1% and 22.7% of families, respectively.
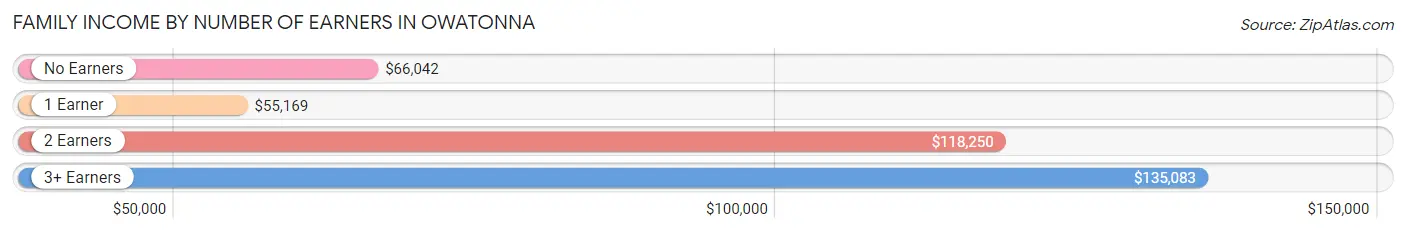
| Number of Earners | # Families | Median Income |
| No Earners | 1,033 (15.2%) | $66,042 |
| 1 Earner | 1,546 (22.7%) | $55,169 |
| 2 Earners | 3,411 (50.1%) | $118,250 |
| 3+ Earners | 824 (12.1%) | $135,083 |
| Total | 6,814 (100.0%) | $103,829 |
Household Income in Owatonna
Household Income Brackets in Owatonna
With 2,093 households falling in the category, the $100,000 to $149,999 income range is the most frequent in Owatonna, accounting for 19.1% of all households. In contrast, only 405 households (3.7%) fall into the $10,000 to $14,999 income bracket, making it the least populous group.
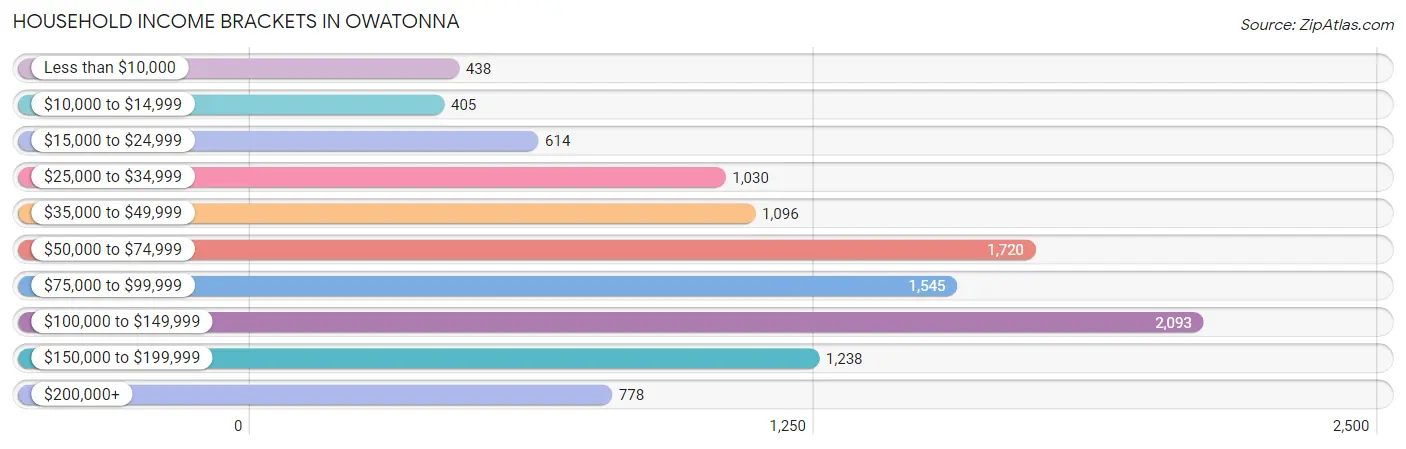
| Income Bracket | # Households | % Households |
| Less than $10,000 | 438 | 4.0% |
| $10,000 to $14,999 | 405 | 3.7% |
| $15,000 to $24,999 | 614 | 5.6% |
| $25,000 to $34,999 | 1,030 | 9.4% |
| $35,000 to $49,999 | 1,096 | 10.0% |
| $50,000 to $74,999 | 1,720 | 15.7% |
| $75,000 to $99,999 | 1,545 | 14.1% |
| $100,000 to $149,999 | 2,093 | 19.1% |
| $150,000 to $199,999 | 1,238 | 11.3% |
| $200,000+ | 778 | 7.1% |
Household Income by Householder Age in Owatonna
The median household income in Owatonna is $78,295, with the highest median household income of $97,723 found in the 45 to 64 years age bracket for the primary householder. A total of 3,951 households (36.1%) fall into this category. Meanwhile, the 15 to 24 years age bracket for the primary householder has the lowest median household income of $45,114, with 467 households (4.3%) in this group.
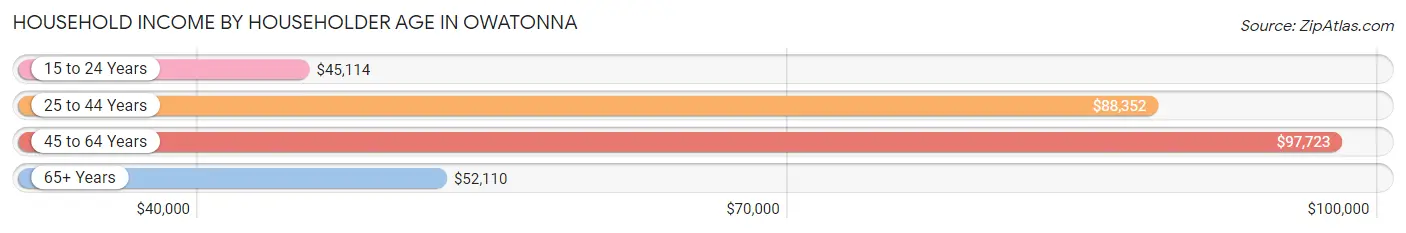
| Income Bracket | # Households | Median Income |
| 15 to 24 Years | 467 (4.3%) | $45,114 |
| 25 to 44 Years | 3,425 (31.3%) | $88,352 |
| 45 to 64 Years | 3,951 (36.1%) | $97,723 |
| 65+ Years | 3,115 (28.4%) | $52,110 |
| Total | 10,958 (100.0%) | $78,295 |
Poverty in Owatonna
Income Below Poverty by Sex and Age in Owatonna
With 9.4% poverty level for males and 8.3% for females among the residents of Owatonna, 18 to 24 year old males and 15 year old females are the most vulnerable to poverty, with 276 males (21.2%) and 54 females (17.6%) in their respective age groups living below the poverty level.
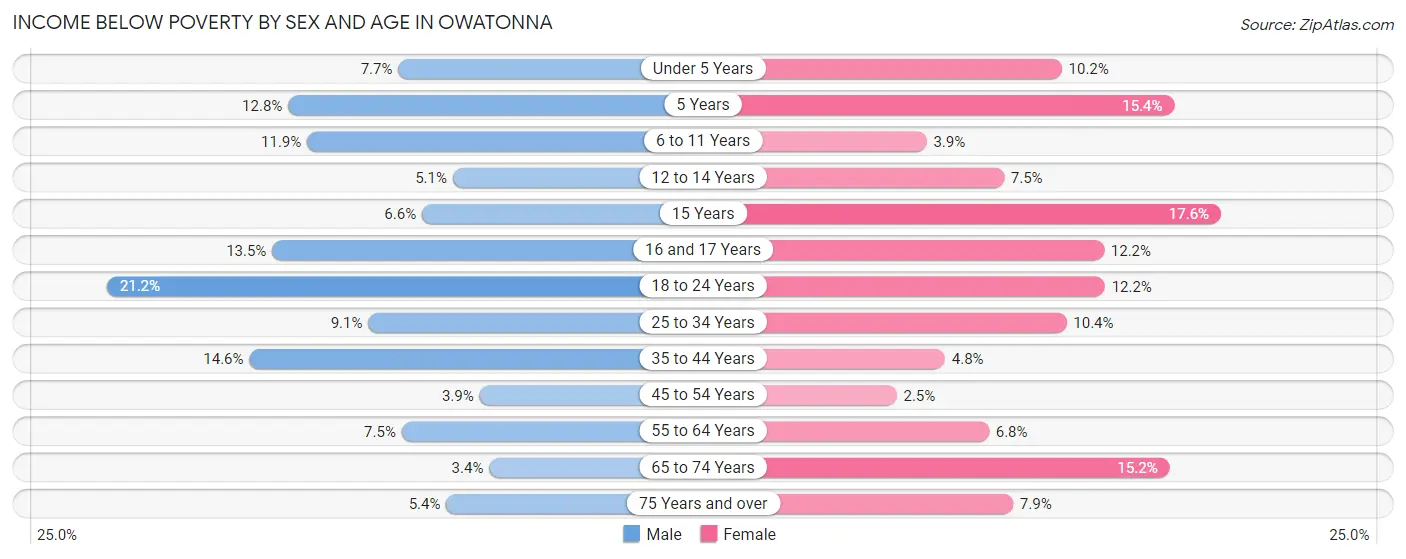
| Age Bracket | Male | Female |
| Under 5 Years | 43 (7.7%) | 83 (10.2%) |
| 5 Years | 18 (12.8%) | 27 (15.4%) |
| 6 to 11 Years | 100 (11.9%) | 44 (3.9%) |
| 12 to 14 Years | 40 (5.1%) | 47 (7.5%) |
| 15 Years | 17 (6.6%) | 54 (17.6%) |
| 16 and 17 Years | 52 (13.5%) | 40 (12.2%) |
| 18 to 24 Years | 276 (21.2%) | 111 (12.2%) |
| 25 to 34 Years | 145 (9.0%) | 124 (10.4%) |
| 35 to 44 Years | 253 (14.6%) | 81 (4.8%) |
| 45 to 54 Years | 64 (3.9%) | 41 (2.5%) |
| 55 to 64 Years | 127 (7.5%) | 110 (6.8%) |
| 65 to 74 Years | 43 (3.4%) | 223 (15.2%) |
| 75 Years and over | 40 (5.4%) | 95 (7.9%) |
| Total | 1,218 (9.4%) | 1,080 (8.3%) |
Income Above Poverty by Sex and Age in Owatonna
According to the poverty statistics in Owatonna, males aged 65 to 74 years and females aged 45 to 54 years are the age groups that are most secure financially, with 96.6% of males and 97.5% of females in these age groups living above the poverty line.
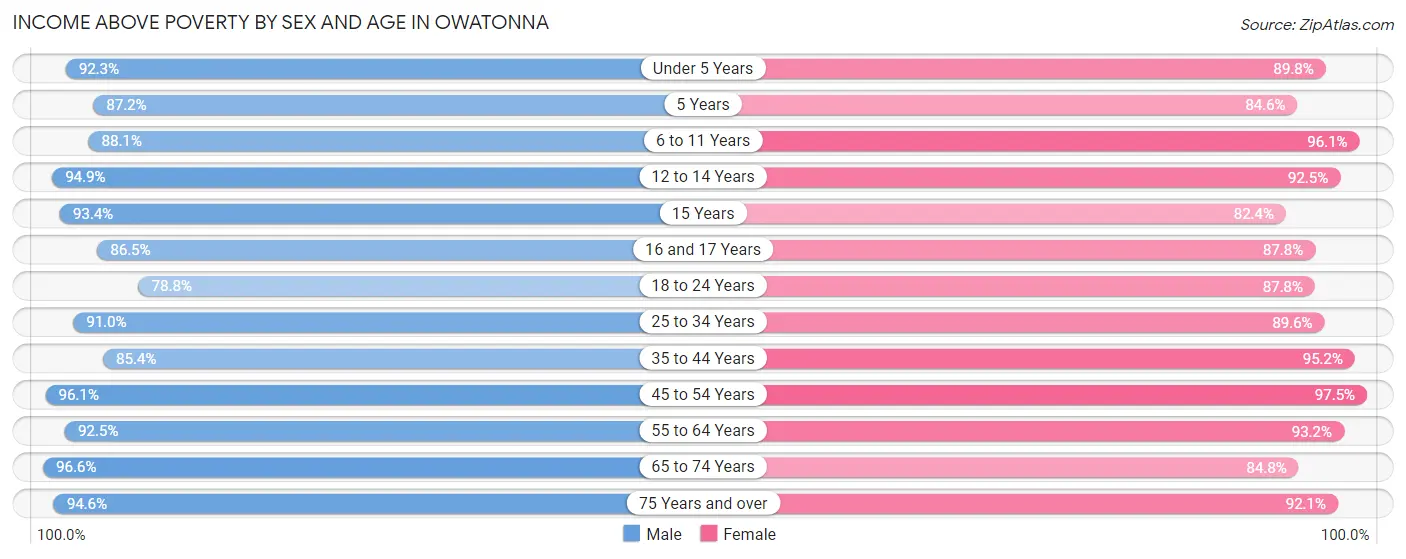
| Age Bracket | Male | Female |
| Under 5 Years | 518 (92.3%) | 731 (89.8%) |
| 5 Years | 123 (87.2%) | 148 (84.6%) |
| 6 to 11 Years | 741 (88.1%) | 1,075 (96.1%) |
| 12 to 14 Years | 740 (94.9%) | 578 (92.5%) |
| 15 Years | 242 (93.4%) | 253 (82.4%) |
| 16 and 17 Years | 333 (86.5%) | 289 (87.8%) |
| 18 to 24 Years | 1,027 (78.8%) | 799 (87.8%) |
| 25 to 34 Years | 1,457 (90.9%) | 1,066 (89.6%) |
| 35 to 44 Years | 1,484 (85.4%) | 1,614 (95.2%) |
| 45 to 54 Years | 1,583 (96.1%) | 1,576 (97.5%) |
| 55 to 64 Years | 1,567 (92.5%) | 1,502 (93.2%) |
| 65 to 74 Years | 1,207 (96.6%) | 1,243 (84.8%) |
| 75 Years and over | 696 (94.6%) | 1,101 (92.1%) |
| Total | 11,718 (90.6%) | 11,975 (91.7%) |
Income Below Poverty Among Married-Couple Families in Owatonna
The poverty statistics for married-couple families in Owatonna show that 2.0% or 114 of the total 5,627 families live below the poverty line. Families with 3 or 4 children have the highest poverty rate of 4.9%, comprising of 29 families. On the other hand, families with 5 or more children have the lowest poverty rate of 0.0%, which includes 0 families.
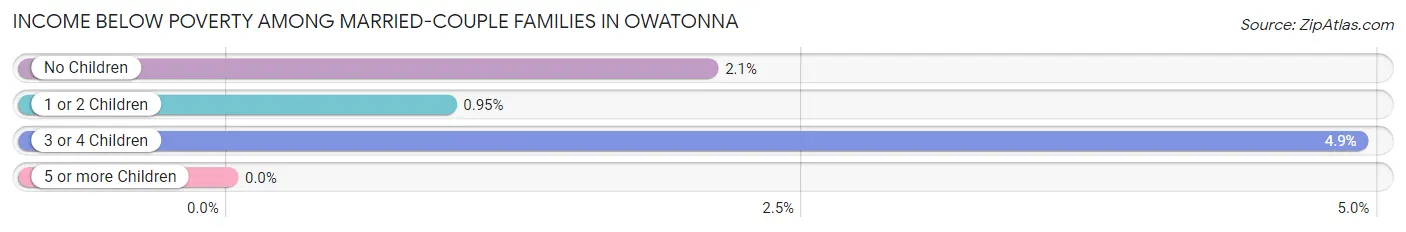
| Children | Above Poverty | Below Poverty |
| No Children | 3,239 (97.9%) | 69 (2.1%) |
| 1 or 2 Children | 1,663 (99.1%) | 16 (0.9%) |
| 3 or 4 Children | 560 (95.1%) | 29 (4.9%) |
| 5 or more Children | 51 (100.0%) | 0 (0.0%) |
| Total | 5,513 (98.0%) | 114 (2.0%) |
Income Below Poverty Among Single-Parent Households in Owatonna
According to the poverty data in Owatonna, 21.9% or 50 single-father households and 13.1% or 126 single-mother households are living below the poverty line. Among single-father households, those with 1 or 2 children have the highest poverty rate, with 50 households (31.1%) experiencing poverty. Likewise, among single-mother households, those with 3 or 4 children have the highest poverty rate, with 74 households (30.4%) falling below the poverty line.
| Children | Single Father | Single Mother |
| No Children | 0 (0.0%) | 15 (5.2%) |
| 1 or 2 Children | 50 (31.1%) | 37 (8.9%) |
| 3 or 4 Children | 0 (0.0%) | 74 (30.4%) |
| 5 or more Children | 0 (0.0%) | 0 (0.0%) |
| Total | 50 (21.9%) | 126 (13.1%) |
Income Below Poverty Among Married-Couple vs Single-Parent Households in Owatonna
The poverty data for Owatonna shows that 114 of the married-couple family households (2.0%) and 176 of the single-parent households (14.8%) are living below the poverty level. Within the married-couple family households, those with 3 or 4 children have the highest poverty rate, with 29 households (4.9%) falling below the poverty line. Among the single-parent households, those with 3 or 4 children have the highest poverty rate, with 74 household (30.4%) living below poverty.
| Children | Married-Couple Families | Single-Parent Households |
| No Children | 69 (2.1%) | 15 (4.2%) |
| 1 or 2 Children | 16 (0.9%) | 87 (15.1%) |
| 3 or 4 Children | 29 (4.9%) | 74 (30.4%) |
| 5 or more Children | 0 (0.0%) | 0 (0.0%) |
| Total | 114 (2.0%) | 176 (14.8%) |
Race in Owatonna
The most populous races in Owatonna are White / Caucasian (23,016 | 87.2%), Hispanic or Latino (1,929 | 7.3%), and Two or more Races (1,469 | 5.6%).
| Race | # Population | % Population |
| Asian | 81 | 0.3% |
| Black / African American | 1,171 | 4.4% |
| Hawaiian / Pacific | 0 | 0.0% |
| Hispanic or Latino | 1,929 | 7.3% |
| Native / Alaskan | 43 | 0.2% |
| White / Caucasian | 23,016 | 87.2% |
| Two or more Races | 1,469 | 5.6% |
| Some other Race | 620 | 2.4% |
| Total | 26,400 | 100.0% |
Ancestry in Owatonna
The most populous ancestries reported in Owatonna are German (8,424 | 31.9%), Norwegian (4,172 | 15.8%), Irish (2,007 | 7.6%), English (1,961 | 7.4%), and Mexican (1,693 | 6.4%), together accounting for 69.2% of all Owatonna residents.
| Ancestry | # Population | % Population |
| African | 33 | 0.1% |
| American | 992 | 3.8% |
| Arab | 148 | 0.6% |
| Austrian | 18 | 0.1% |
| Belgian | 6 | 0.0% |
| Bhutanese | 39 | 0.2% |
| British | 106 | 0.4% |
| Burmese | 70 | 0.3% |
| Canadian | 32 | 0.1% |
| Central American | 42 | 0.2% |
| Chippewa | 46 | 0.2% |
| Croatian | 162 | 0.6% |
| Czech | 1,297 | 4.9% |
| Czechoslovakian | 211 | 0.8% |
| Danish | 501 | 1.9% |
| Dutch | 610 | 2.3% |
| Egyptian | 37 | 0.1% |
| English | 1,961 | 7.4% |
| Ethiopian | 194 | 0.7% |
| European | 479 | 1.8% |
| Finnish | 214 | 0.8% |
| French | 588 | 2.2% |
| French Canadian | 124 | 0.5% |
| German | 8,424 | 31.9% |
| Greek | 98 | 0.4% |
| Haitian | 25 | 0.1% |
| Honduran | 9 | 0.0% |
| Indian (Asian) | 5 | 0.0% |
| Irish | 2,007 | 7.6% |
| Italian | 559 | 2.1% |
| Jamaican | 28 | 0.1% |
| Kenyan | 22 | 0.1% |
| Korean | 133 | 0.5% |
| Lebanese | 29 | 0.1% |
| Liberian | 7 | 0.0% |
| Lithuanian | 8 | 0.0% |
| Luxembourger | 39 | 0.2% |
| Malaysian | 89 | 0.3% |
| Mexican | 1,693 | 6.4% |
| Nicaraguan | 33 | 0.1% |
| Nigerian | 2 | 0.0% |
| Northern European | 141 | 0.5% |
| Norwegian | 4,172 | 15.8% |
| Pakistani | 11 | 0.0% |
| Peruvian | 19 | 0.1% |
| Polish | 787 | 3.0% |
| Portuguese | 15 | 0.1% |
| Puerto Rican | 75 | 0.3% |
| Russian | 20 | 0.1% |
| Scandinavian | 338 | 1.3% |
| Scotch-Irish | 105 | 0.4% |
| Scottish | 460 | 1.7% |
| Sioux | 12 | 0.1% |
| Slavic | 9 | 0.0% |
| Slovak | 32 | 0.1% |
| Somali | 328 | 1.2% |
| South American | 19 | 0.1% |
| Spaniard | 37 | 0.1% |
| Spanish | 20 | 0.1% |
| Subsaharan African | 643 | 2.4% |
| Sudanese | 235 | 0.9% |
| Swedish | 1,052 | 4.0% |
| Swiss | 91 | 0.3% |
| Syrian | 18 | 0.1% |
| Ukrainian | 11 | 0.0% |
| Welsh | 197 | 0.7% |
| Yugoslavian | 11 | 0.0% | View All 67 Rows |
Immigrants in Owatonna
The most numerous immigrant groups reported in Owatonna came from Latin America (547 | 2.1%), Central America (475 | 1.8%), Mexico (473 | 1.8%), Africa (450 | 1.7%), and Eastern Africa (382 | 1.5%), together accounting for 8.8% of all Owatonna residents.
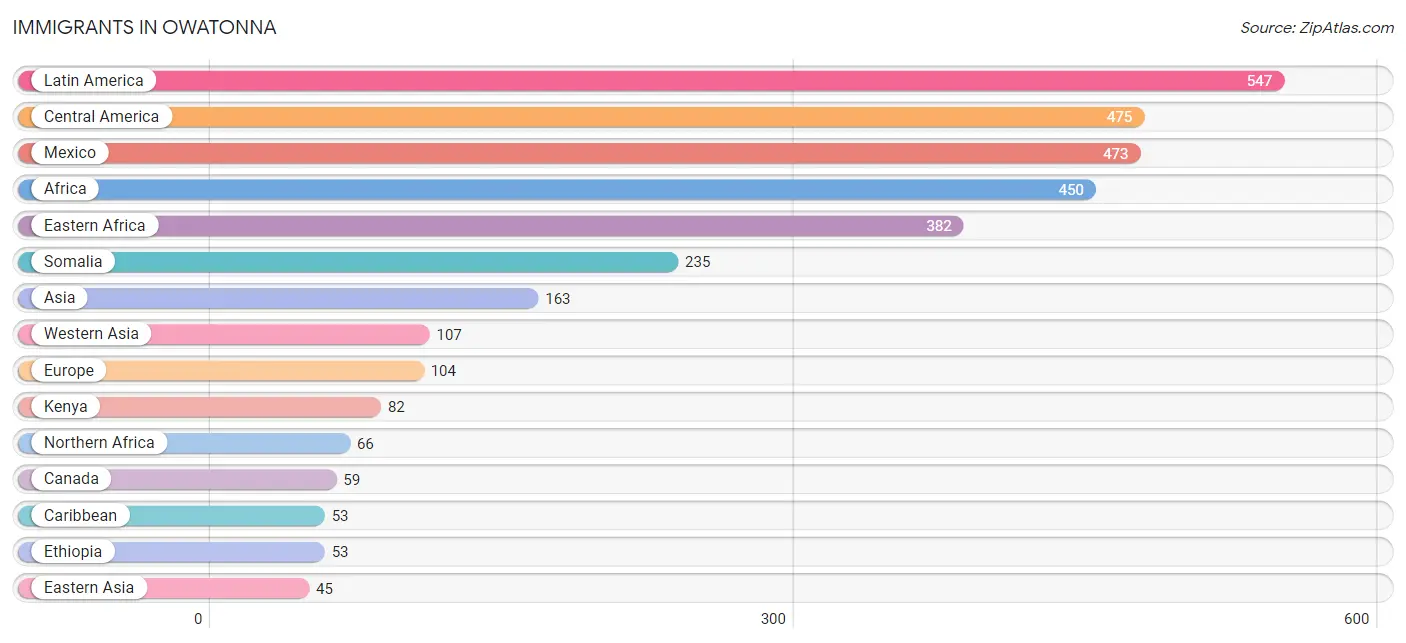
| Immigration Origin | # Population | % Population |
| Africa | 450 | 1.7% |
| Asia | 163 | 0.6% |
| Australia | 14 | 0.1% |
| Canada | 59 | 0.2% |
| Caribbean | 53 | 0.2% |
| Central America | 475 | 1.8% |
| Croatia | 18 | 0.1% |
| Eastern Africa | 382 | 1.5% |
| Eastern Asia | 45 | 0.2% |
| Eastern Europe | 18 | 0.1% |
| Egypt | 21 | 0.1% |
| Ethiopia | 53 | 0.2% |
| Europe | 104 | 0.4% |
| Haiti | 25 | 0.1% |
| Honduras | 2 | 0.0% |
| Jamaica | 28 | 0.1% |
| Kenya | 82 | 0.3% |
| Korea | 45 | 0.2% |
| Latin America | 547 | 2.1% |
| Mexico | 473 | 1.8% |
| Netherlands | 44 | 0.2% |
| Nigeria | 2 | 0.0% |
| Northern Africa | 66 | 0.3% |
| Northern Europe | 5 | 0.0% |
| Oceania | 14 | 0.1% |
| Peru | 19 | 0.1% |
| Somalia | 235 | 0.9% |
| South America | 19 | 0.1% |
| South Eastern Asia | 11 | 0.0% |
| Southern Europe | 37 | 0.1% |
| Spain | 37 | 0.1% |
| Sudan | 45 | 0.2% |
| Sweden | 5 | 0.0% |
| Thailand | 11 | 0.0% |
| Western Africa | 2 | 0.0% |
| Western Asia | 107 | 0.4% |
| Western Europe | 44 | 0.2% | View All 37 Rows |
Sex and Age in Owatonna
Sex and Age in Owatonna
The most populous age groups in Owatonna are 15 to 19 Years (1,121 | 8.5%) for men and 10 to 14 Years (1,115 | 8.4%) for women.
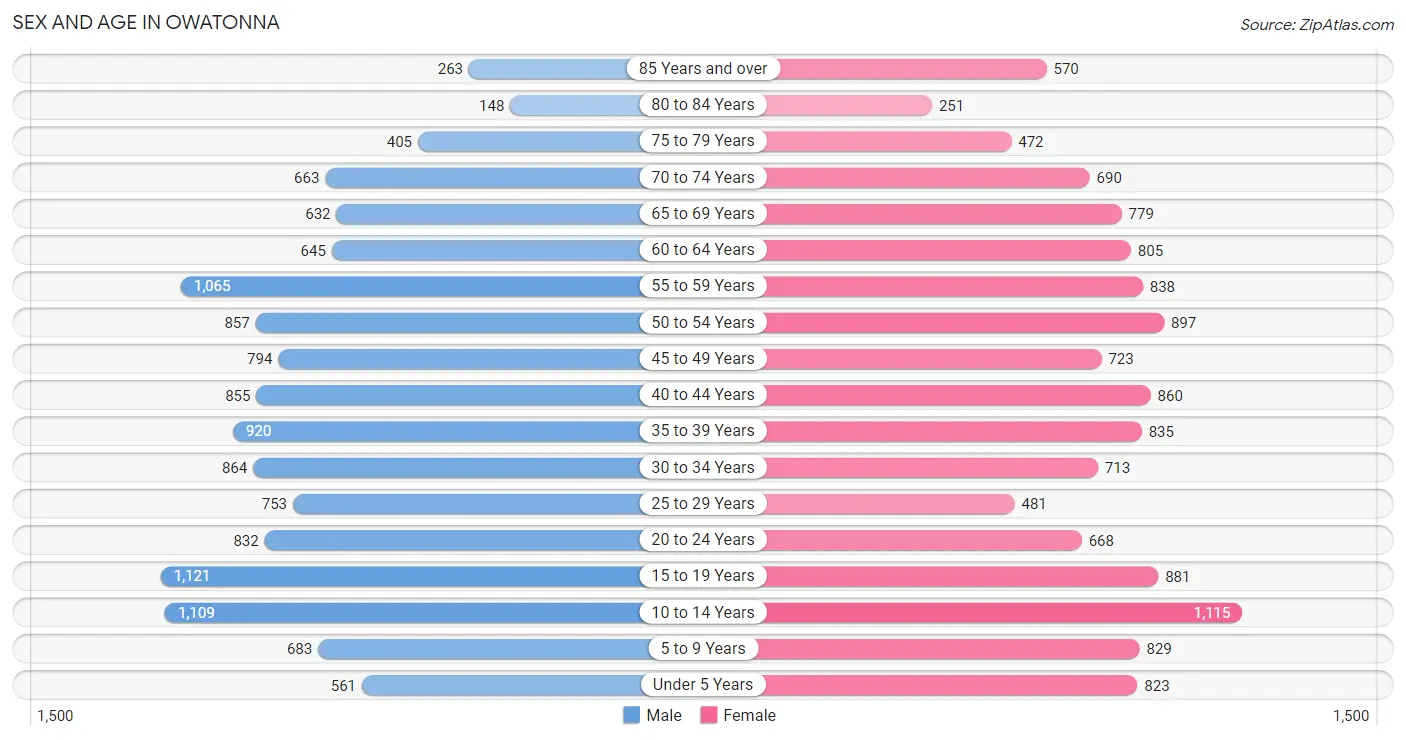
| Age Bracket | Male | Female |
| Under 5 Years | 561 (4.3%) | 823 (6.2%) |
| 5 to 9 Years | 683 (5.2%) | 829 (6.3%) |
| 10 to 14 Years | 1,109 (8.4%) | 1,115 (8.4%) |
| 15 to 19 Years | 1,121 (8.5%) | 881 (6.7%) |
| 20 to 24 Years | 832 (6.3%) | 668 (5.1%) |
| 25 to 29 Years | 753 (5.7%) | 481 (3.6%) |
| 30 to 34 Years | 864 (6.6%) | 713 (5.4%) |
| 35 to 39 Years | 920 (7.0%) | 835 (6.3%) |
| 40 to 44 Years | 855 (6.5%) | 860 (6.5%) |
| 45 to 49 Years | 794 (6.0%) | 723 (5.5%) |
| 50 to 54 Years | 857 (6.5%) | 897 (6.8%) |
| 55 to 59 Years | 1,065 (8.1%) | 838 (6.3%) |
| 60 to 64 Years | 645 (4.9%) | 805 (6.1%) |
| 65 to 69 Years | 632 (4.8%) | 779 (5.9%) |
| 70 to 74 Years | 663 (5.0%) | 690 (5.2%) |
| 75 to 79 Years | 405 (3.1%) | 472 (3.6%) |
| 80 to 84 Years | 148 (1.1%) | 251 (1.9%) |
| 85 Years and over | 263 (2.0%) | 570 (4.3%) |
| Total | 13,170 (100.0%) | 13,230 (100.0%) |
Families and Households in Owatonna
Median Family Size in Owatonna
The median family size in Owatonna is 2.98 persons per family, with single female/mother families (959 | 14.1%) accounting for the largest median family size of 3.2 persons per family. On the other hand, single male/father families (228 | 3.4%) represent the smallest median family size with 1.94 persons per family.

| Family Type | # Families | Family Size |
| Married-Couple | 5,627 (82.6%) | 2.98 |
| Single Male/Father | 228 (3.4%) | 1.94 |
| Single Female/Mother | 959 (14.1%) | 3.20 |
| Total Families | 6,814 (100.0%) | 2.98 |
Median Household Size in Owatonna
The median household size in Owatonna is 2.36 persons per household, with single female/mother households (959 | 8.7%) accounting for the largest median household size of 3.44 persons per household. non-family households (4,144 | 37.8%) represent the smallest median household size with 1.21 persons per household.
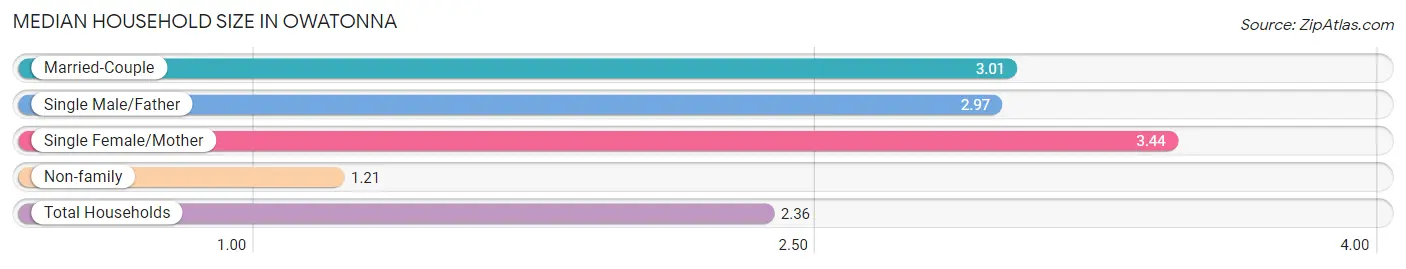
| Household Type | # Households | Household Size |
| Married-Couple | 5,627 (51.3%) | 3.01 |
| Single Male/Father | 228 (2.1%) | 2.97 |
| Single Female/Mother | 959 (8.7%) | 3.44 |
| Non-family | 4,144 (37.8%) | 1.21 |
| Total Households | 10,958 (100.0%) | 2.36 |
Household Size by Marriage Status in Owatonna
Out of a total of 10,958 households in Owatonna, 6,814 (62.2%) are family households, while 4,144 (37.8%) are nonfamily households. The most numerous type of family households are 2-person households, comprising 3,407, and the most common type of nonfamily households are 1-person households, comprising 3,548.
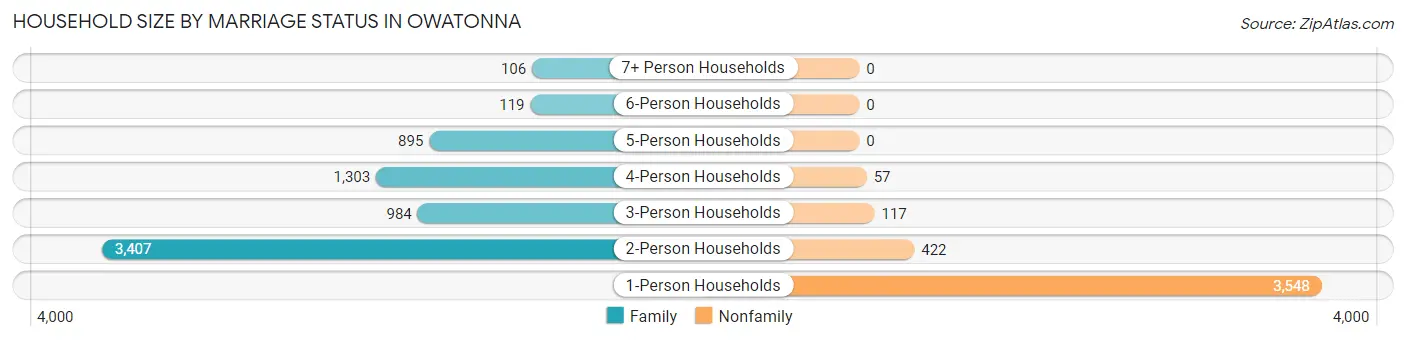
| Household Size | Family Households | Nonfamily Households |
| 1-Person Households | - | 3,548 (32.4%) |
| 2-Person Households | 3,407 (31.1%) | 422 (3.8%) |
| 3-Person Households | 984 (9.0%) | 117 (1.1%) |
| 4-Person Households | 1,303 (11.9%) | 57 (0.5%) |
| 5-Person Households | 895 (8.2%) | 0 (0.0%) |
| 6-Person Households | 119 (1.1%) | 0 (0.0%) |
| 7+ Person Households | 106 (1.0%) | 0 (0.0%) |
| Total | 6,814 (62.2%) | 4,144 (37.8%) |
Female Fertility in Owatonna
Fertility by Age in Owatonna
Average fertility rate in Owatonna is 53.0 births per 1,000 women. Women in the age bracket of 20 to 34 years have the highest fertility rate with 112.0 births per 1,000 women. Women in the age bracket of 20 to 34 years acount for 74.4% of all women with births.
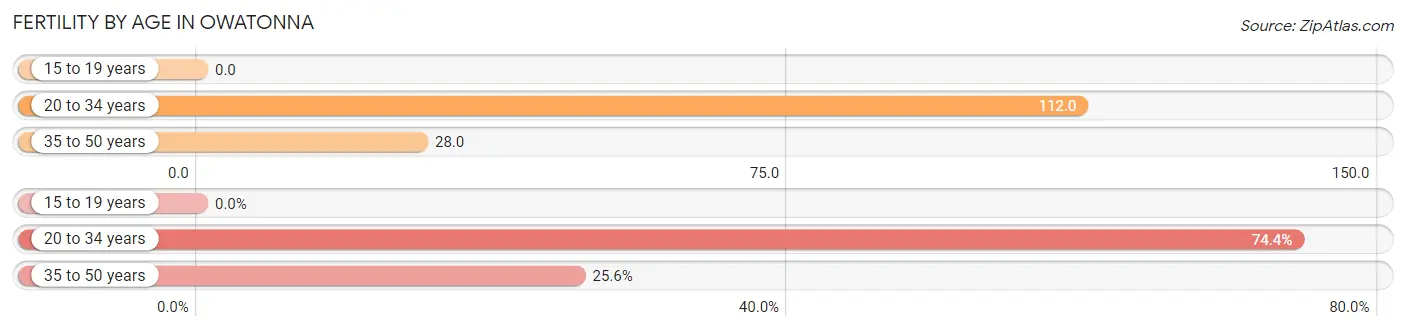
| Age Bracket | Women with Births | Births / 1,000 Women |
| 15 to 19 years | 0 (0.0%) | 0.0 |
| 20 to 34 years | 209 (74.4%) | 112.0 |
| 35 to 50 years | 72 (25.6%) | 28.0 |
| Total | 281 (100.0%) | 53.0 |
Fertility by Age by Marriage Status in Owatonna
67.3% of women with births (281) in Owatonna are married. The highest percentage of unmarried women with births falls into 35 to 50 years age bracket with 75.0% of them unmarried at the time of birth, while the lowest percentage of unmarried women with births belong to 20 to 34 years age bracket with 18.2% of them unmarried.
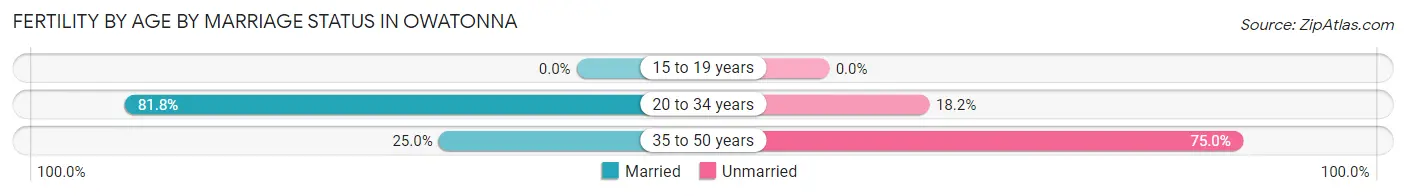
| Age Bracket | Married | Unmarried |
| 15 to 19 years | 0 (0.0%) | 0 (0.0%) |
| 20 to 34 years | 171 (81.8%) | 38 (18.2%) |
| 35 to 50 years | 18 (25.0%) | 54 (75.0%) |
| Total | 189 (67.3%) | 92 (32.7%) |
Fertility by Education in Owatonna
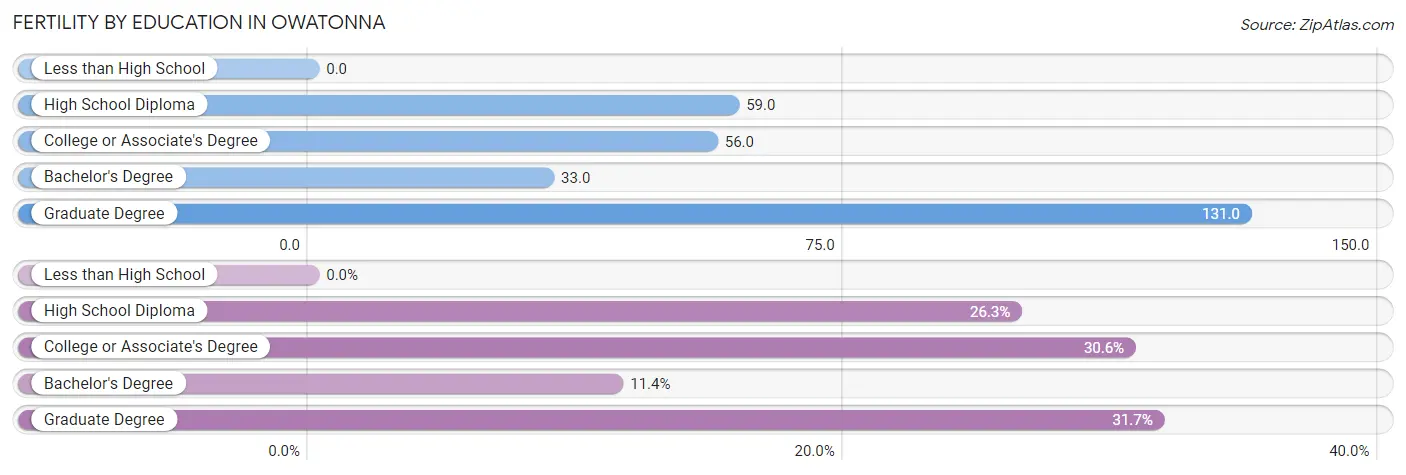
| Educational Attainment | Women with Births | Births / 1,000 Women |
| Less than High School | 0 (0.0%) | 0.0 |
| High School Diploma | 74 (26.3%) | 59.0 |
| College or Associate's Degree | 86 (30.6%) | 56.0 |
| Bachelor's Degree | 32 (11.4%) | 33.0 |
| Graduate Degree | 89 (31.7%) | 131.0 |
| Total | 281 (100.0%) | 53.0 |
Fertility by Education by Marriage Status in Owatonna
32.7% of women with births in Owatonna are unmarried. Women with the educational attainment of bachelor's degree are most likely to be married with 100.0% of them married at childbirth, while women with the educational attainment of high school diploma are least likely to be married with 47.3% of them unmarried at childbirth.
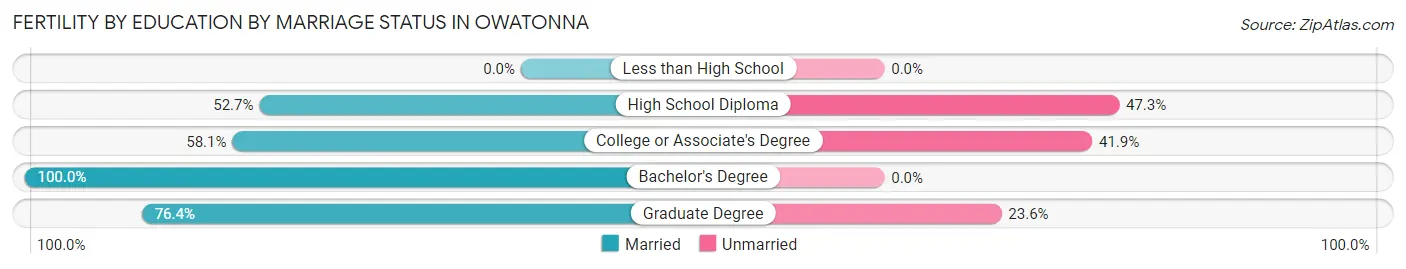
| Educational Attainment | Married | Unmarried |
| Less than High School | 0 (0.0%) | 0 (0.0%) |
| High School Diploma | 39 (52.7%) | 35 (47.3%) |
| College or Associate's Degree | 50 (58.1%) | 36 (41.9%) |
| Bachelor's Degree | 32 (100.0%) | 0 (0.0%) |
| Graduate Degree | 68 (76.4%) | 21 (23.6%) |
| Total | 189 (67.3%) | 92 (32.7%) |
Employment Characteristics in Owatonna
Employment by Class of Employer in Owatonna
Among the 13,217 employed individuals in Owatonna, private company employees (9,215 | 69.7%), local government employees (1,268 | 9.6%), and not-for-profit organizations (1,016 | 7.7%) make up the most common classes of employment.
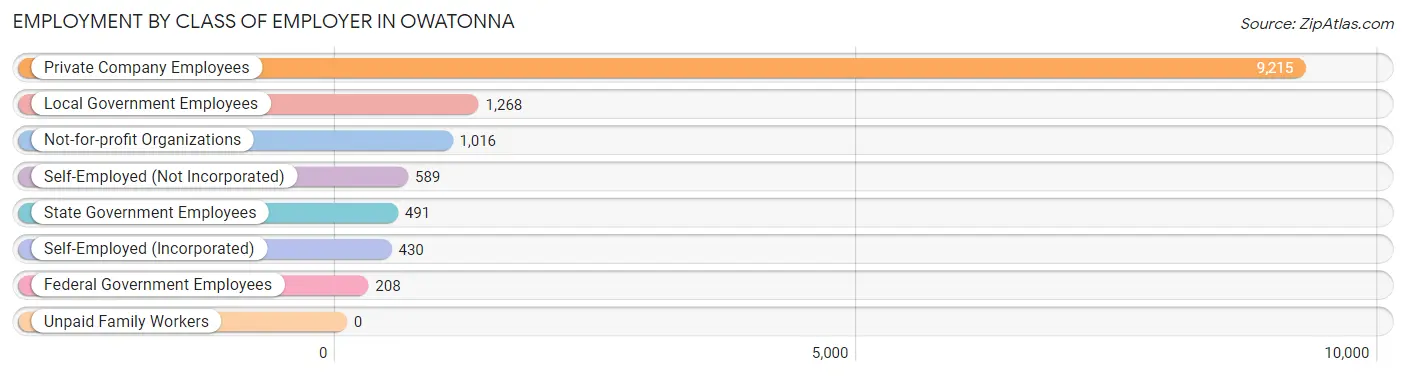
| Employer Class | # Employees | % Employees |
| Private Company Employees | 9,215 | 69.7% |
| Self-Employed (Incorporated) | 430 | 3.3% |
| Self-Employed (Not Incorporated) | 589 | 4.5% |
| Not-for-profit Organizations | 1,016 | 7.7% |
| Local Government Employees | 1,268 | 9.6% |
| State Government Employees | 491 | 3.7% |
| Federal Government Employees | 208 | 1.6% |
| Unpaid Family Workers | 0 | 0.0% |
| Total | 13,217 | 100.0% |
Employment Status by Age in Owatonna
According to the labor force statistics for Owatonna, out of the total population over 16 years of age (20,712), 67.3% or 13,939 individuals are in the labor force, with 3.6% or 502 of them unemployed. The age group with the highest labor force participation rate is 20 to 24 years, with 95.7% or 1,436 individuals in the labor force. Within the labor force, the 25 to 29 years age range has the highest percentage of unemployed individuals, with 14.5% or 159 of them being unemployed.
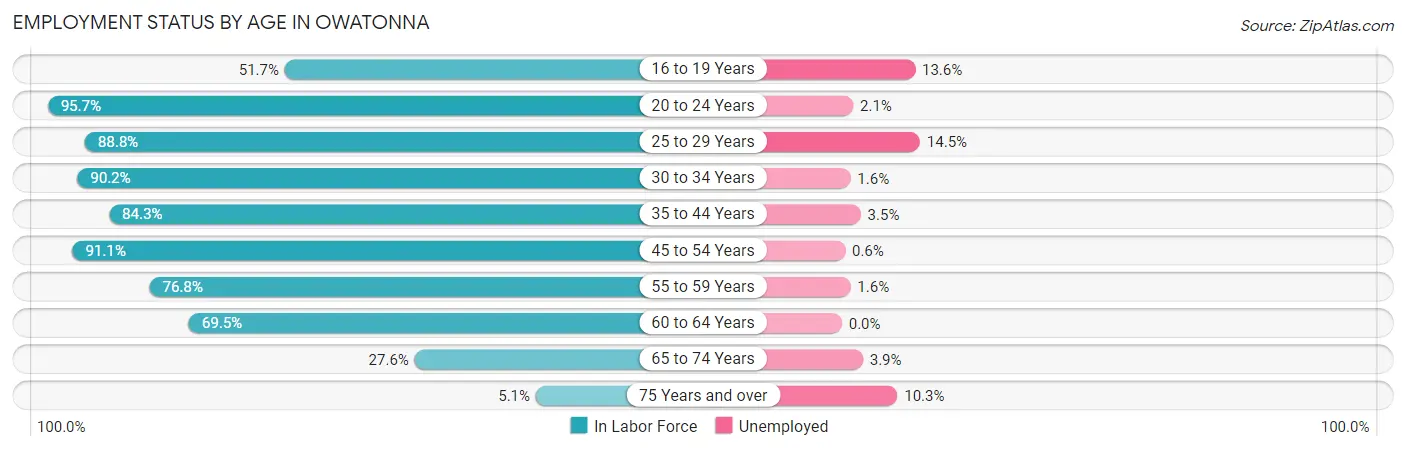
| Age Bracket | In Labor Force | Unemployed |
| 16 to 19 Years | 741 (51.7%) | 101 (13.6%) |
| 20 to 24 Years | 1,436 (95.7%) | 30 (2.1%) |
| 25 to 29 Years | 1,096 (88.8%) | 159 (14.5%) |
| 30 to 34 Years | 1,422 (90.2%) | 23 (1.6%) |
| 35 to 44 Years | 2,925 (84.3%) | 102 (3.5%) |
| 45 to 54 Years | 2,980 (91.1%) | 18 (0.6%) |
| 55 to 59 Years | 1,462 (76.8%) | 23 (1.6%) |
| 60 to 64 Years | 1,008 (69.5%) | 0 (0.0%) |
| 65 to 74 Years | 763 (27.6%) | 30 (3.9%) |
| 75 Years and over | 108 (5.1%) | 11 (10.3%) |
| Total | 13,939 (67.3%) | 502 (3.6%) |
Employment Status by Educational Attainment in Owatonna
According to labor force statistics for Owatonna, 84.4% of individuals (10,892) out of the total population between 25 and 64 years of age (12,905) are in the labor force, with 3.0% or 327 of them being unemployed. The group with the highest labor force participation rate are those with the educational attainment of bachelor's degree or higher, with 90.3% or 3,957 individuals in the labor force. Within the labor force, individuals with less than high school education have the highest percentage of unemployment, with 15.4% or 84 of them being unemployed.
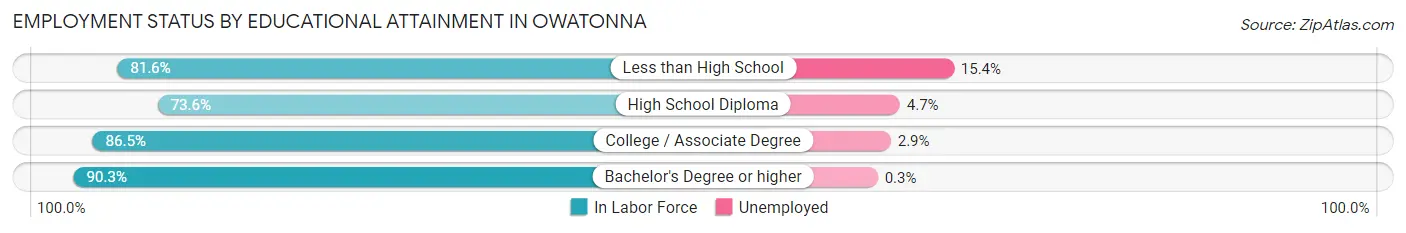
| Educational Attainment | In Labor Force | Unemployed |
| Less than High School | 545 (81.6%) | 103 (15.4%) |
| High School Diploma | 2,321 (73.6%) | 148 (4.7%) |
| College / Associate Degree | 4,067 (86.5%) | 136 (2.9%) |
| Bachelor's Degree or higher | 3,957 (90.3%) | 13 (0.3%) |
| Total | 10,892 (84.4%) | 387 (3.0%) |
Employment Occupations by Sex in Owatonna
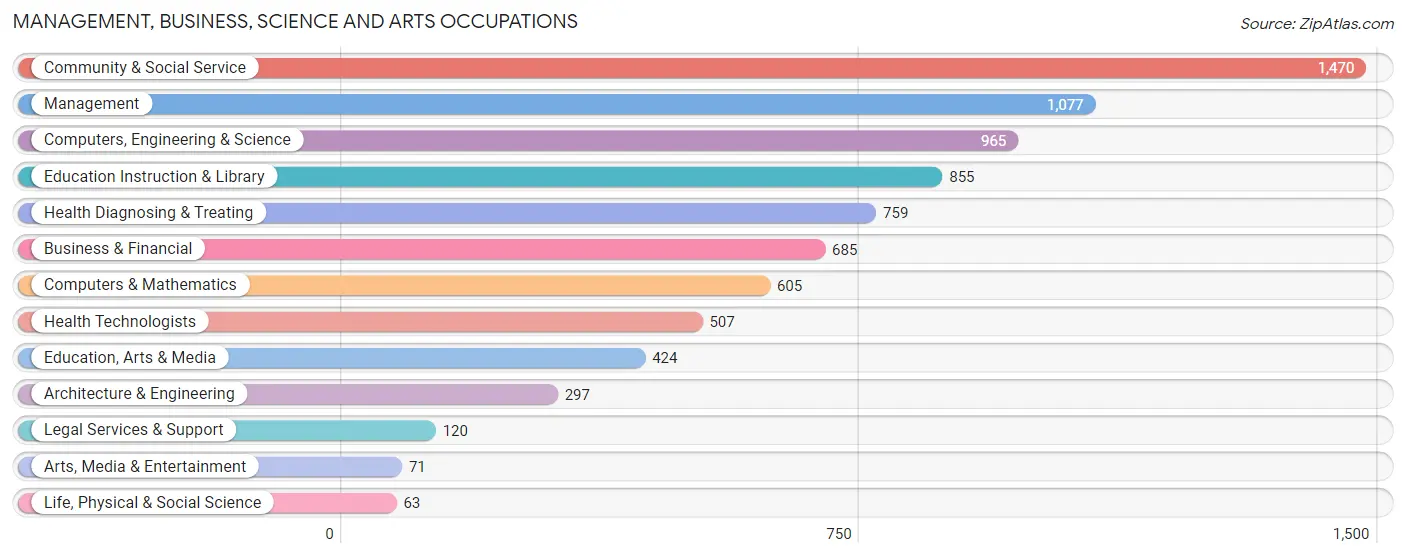
Management, Business, Science and Arts Occupations
The most common Management, Business, Science and Arts occupations in Owatonna are Community & Social Service (1,470 | 10.9%), Management (1,077 | 8.0%), Computers, Engineering & Science (965 | 7.2%), Education Instruction & Library (855 | 6.4%), and Health Diagnosing & Treating (759 | 5.7%).
Management, Business, Science and Arts Occupations by Sex
Within the Management, Business, Science and Arts occupations in Owatonna, the most male-oriented occupations are Life, Physical & Social Science (100.0%), Architecture & Engineering (95.3%), and Computers, Engineering & Science (88.3%), while the most female-oriented occupations are Health Diagnosing & Treating (86.6%), Education Instruction & Library (81.8%), and Health Technologists (79.9%).
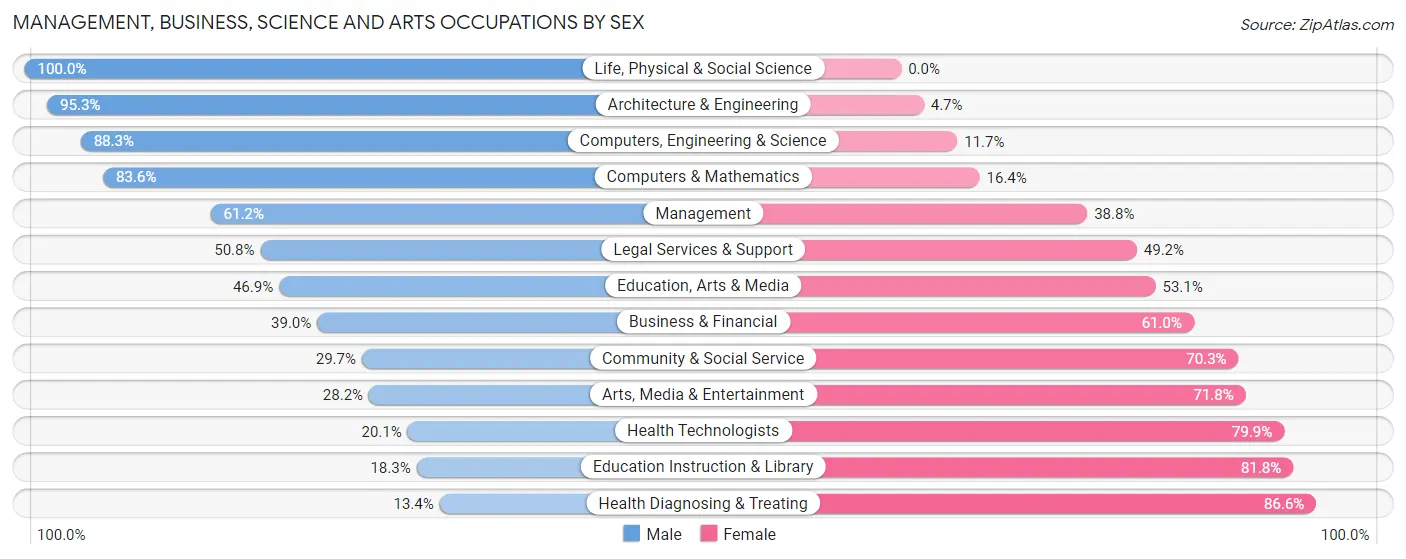
| Occupation | Male | Female |
| Management | 659 (61.2%) | 418 (38.8%) |
| Business & Financial | 267 (39.0%) | 418 (61.0%) |
| Computers, Engineering & Science | 852 (88.3%) | 113 (11.7%) |
| Computers & Mathematics | 506 (83.6%) | 99 (16.4%) |
| Architecture & Engineering | 283 (95.3%) | 14 (4.7%) |
| Life, Physical & Social Science | 63 (100.0%) | 0 (0.0%) |
| Community & Social Service | 436 (29.7%) | 1,034 (70.3%) |
| Education, Arts & Media | 199 (46.9%) | 225 (53.1%) |
| Legal Services & Support | 61 (50.8%) | 59 (49.2%) |
| Education Instruction & Library | 156 (18.2%) | 699 (81.8%) |
| Arts, Media & Entertainment | 20 (28.2%) | 51 (71.8%) |
| Health Diagnosing & Treating | 102 (13.4%) | 657 (86.6%) |
| Health Technologists | 102 (20.1%) | 405 (79.9%) |
| Total (Category) | 2,316 (46.7%) | 2,640 (53.3%) |
| Total (Overall) | 7,381 (54.9%) | 6,061 (45.1%) |
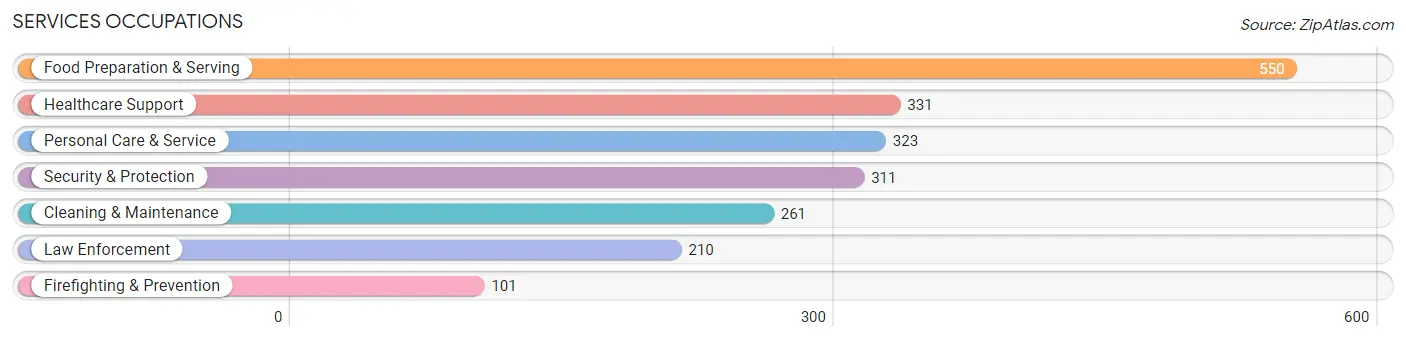
Services Occupations
The most common Services occupations in Owatonna are Food Preparation & Serving (550 | 4.1%), Healthcare Support (331 | 2.5%), Personal Care & Service (323 | 2.4%), Security & Protection (311 | 2.3%), and Cleaning & Maintenance (261 | 1.9%).
Services Occupations by Sex
Within the Services occupations in Owatonna, the most male-oriented occupations are Law Enforcement (80.9%), Security & Protection (80.1%), and Firefighting & Prevention (78.2%), while the most female-oriented occupations are Personal Care & Service (94.4%), Healthcare Support (69.5%), and Food Preparation & Serving (67.3%).
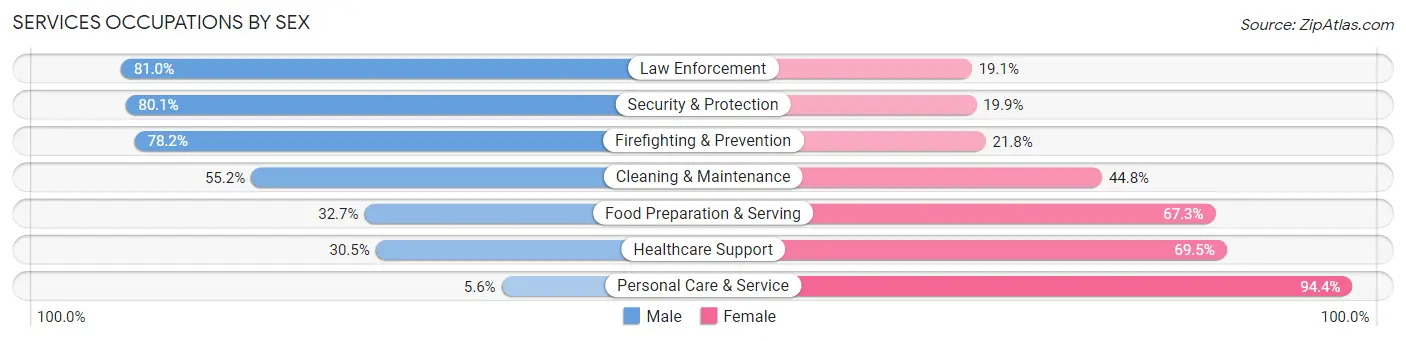
| Occupation | Male | Female |
| Healthcare Support | 101 (30.5%) | 230 (69.5%) |
| Security & Protection | 249 (80.1%) | 62 (19.9%) |
| Firefighting & Prevention | 79 (78.2%) | 22 (21.8%) |
| Law Enforcement | 170 (80.9%) | 40 (19.1%) |
| Food Preparation & Serving | 180 (32.7%) | 370 (67.3%) |
| Cleaning & Maintenance | 144 (55.2%) | 117 (44.8%) |
| Personal Care & Service | 18 (5.6%) | 305 (94.4%) |
| Total (Category) | 692 (39.0%) | 1,084 (61.0%) |
| Total (Overall) | 7,381 (54.9%) | 6,061 (45.1%) |
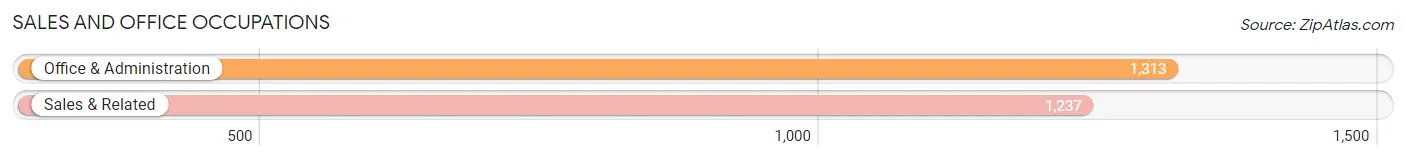
Sales and Office Occupations
The most common Sales and Office occupations in Owatonna are Office & Administration (1,313 | 9.8%), and Sales & Related (1,237 | 9.2%).
Sales and Office Occupations by Sex
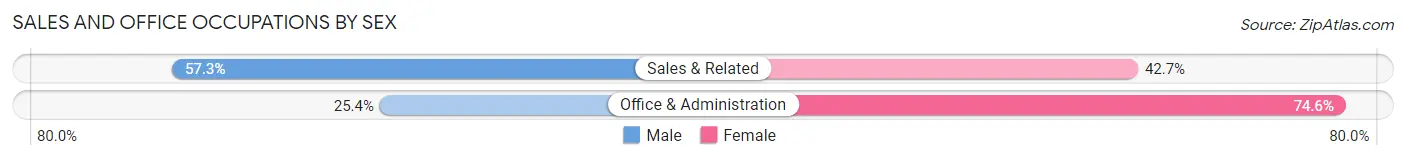
| Occupation | Male | Female |
| Sales & Related | 709 (57.3%) | 528 (42.7%) |
| Office & Administration | 333 (25.4%) | 980 (74.6%) |
| Total (Category) | 1,042 (40.9%) | 1,508 (59.1%) |
| Total (Overall) | 7,381 (54.9%) | 6,061 (45.1%) |
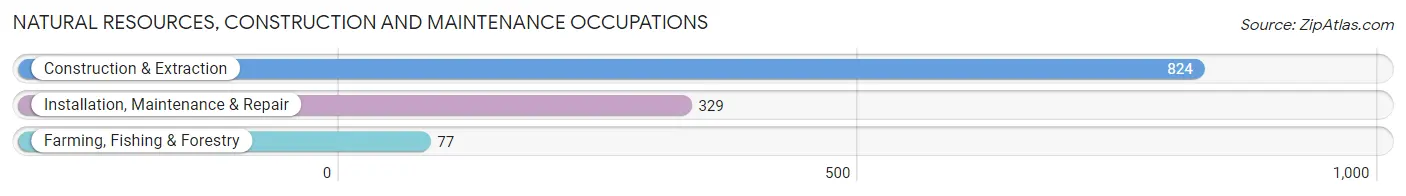
Natural Resources, Construction and Maintenance Occupations
The most common Natural Resources, Construction and Maintenance occupations in Owatonna are Construction & Extraction (824 | 6.1%), Installation, Maintenance & Repair (329 | 2.5%), and Farming, Fishing & Forestry (77 | 0.6%).
Natural Resources, Construction and Maintenance Occupations by Sex
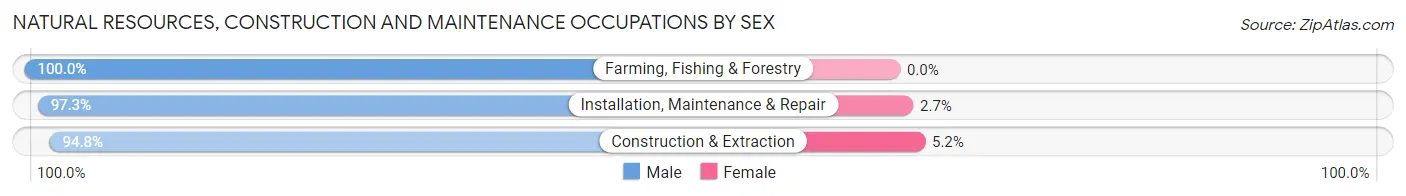
| Occupation | Male | Female |
| Farming, Fishing & Forestry | 77 (100.0%) | 0 (0.0%) |
| Construction & Extraction | 781 (94.8%) | 43 (5.2%) |
| Installation, Maintenance & Repair | 320 (97.3%) | 9 (2.7%) |
| Total (Category) | 1,178 (95.8%) | 52 (4.2%) |
| Total (Overall) | 7,381 (54.9%) | 6,061 (45.1%) |
Production, Transportation and Moving Occupations
The most common Production, Transportation and Moving occupations in Owatonna are Production (1,712 | 12.7%), Material Moving (834 | 6.2%), and Transportation (384 | 2.9%).
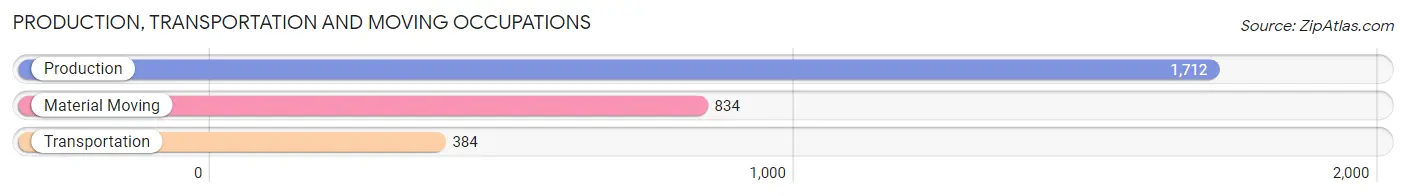
Production, Transportation and Moving Occupations by Sex
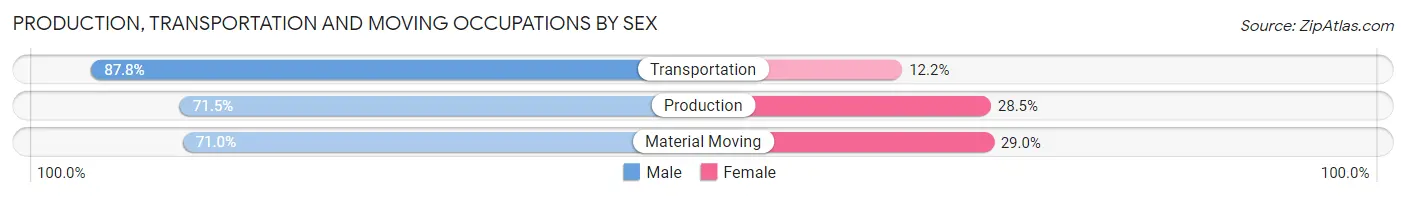
| Occupation | Male | Female |
| Production | 1,224 (71.5%) | 488 (28.5%) |
| Transportation | 337 (87.8%) | 47 (12.2%) |
| Material Moving | 592 (71.0%) | 242 (29.0%) |
| Total (Category) | 2,153 (73.5%) | 777 (26.5%) |
| Total (Overall) | 7,381 (54.9%) | 6,061 (45.1%) |
Employment Industries by Sex in Owatonna
Employment Industries in Owatonna
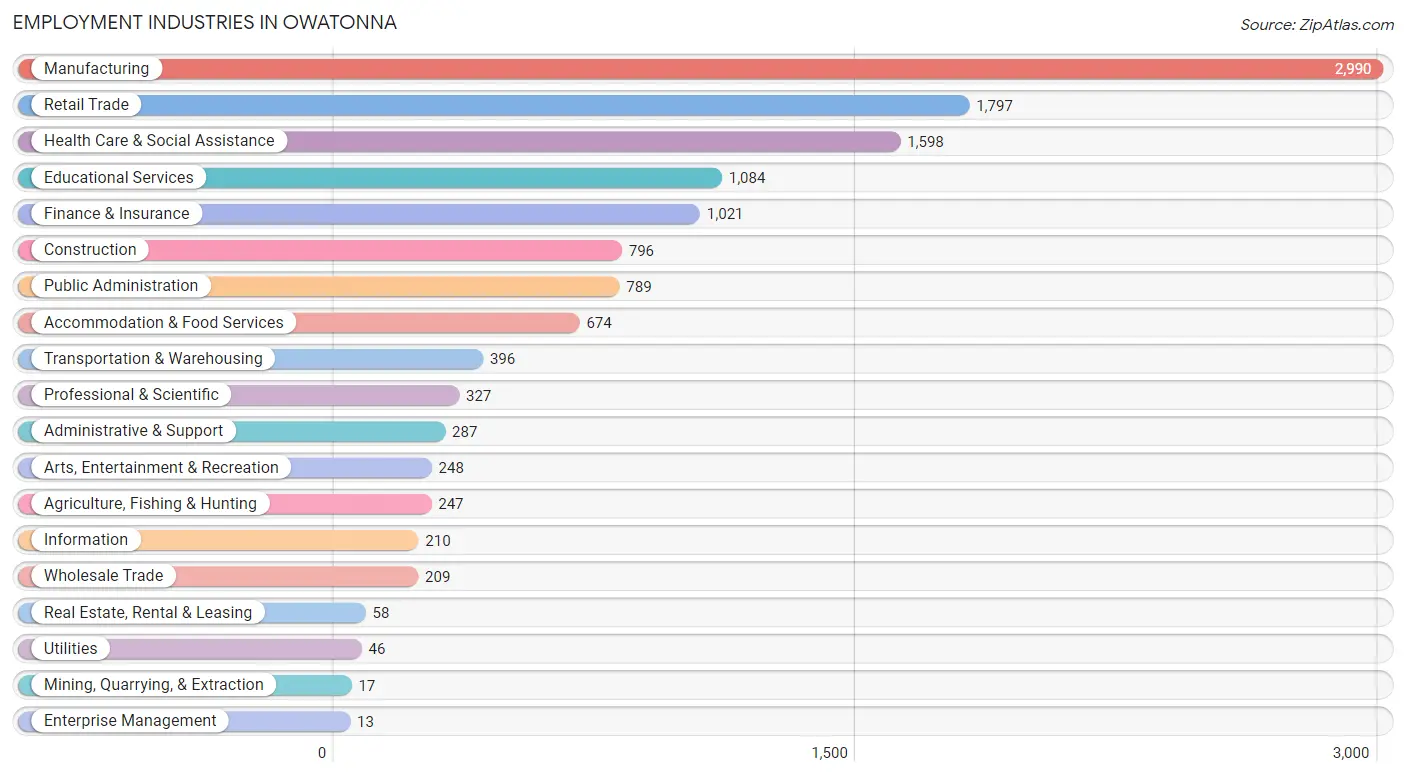
The major employment industries in Owatonna include Manufacturing (2,990 | 22.2%), Retail Trade (1,797 | 13.4%), Health Care & Social Assistance (1,598 | 11.9%), Educational Services (1,084 | 8.1%), and Finance & Insurance (1,021 | 7.6%).
Employment Industries by Sex in Owatonna
The Owatonna industries that see more men than women are Mining, Quarrying, & Extraction (100.0%), Construction (87.1%), and Agriculture, Fishing & Hunting (85.4%), whereas the industries that tend to have a higher number of women are Enterprise Management (100.0%), Health Care & Social Assistance (78.2%), and Educational Services (75.7%).
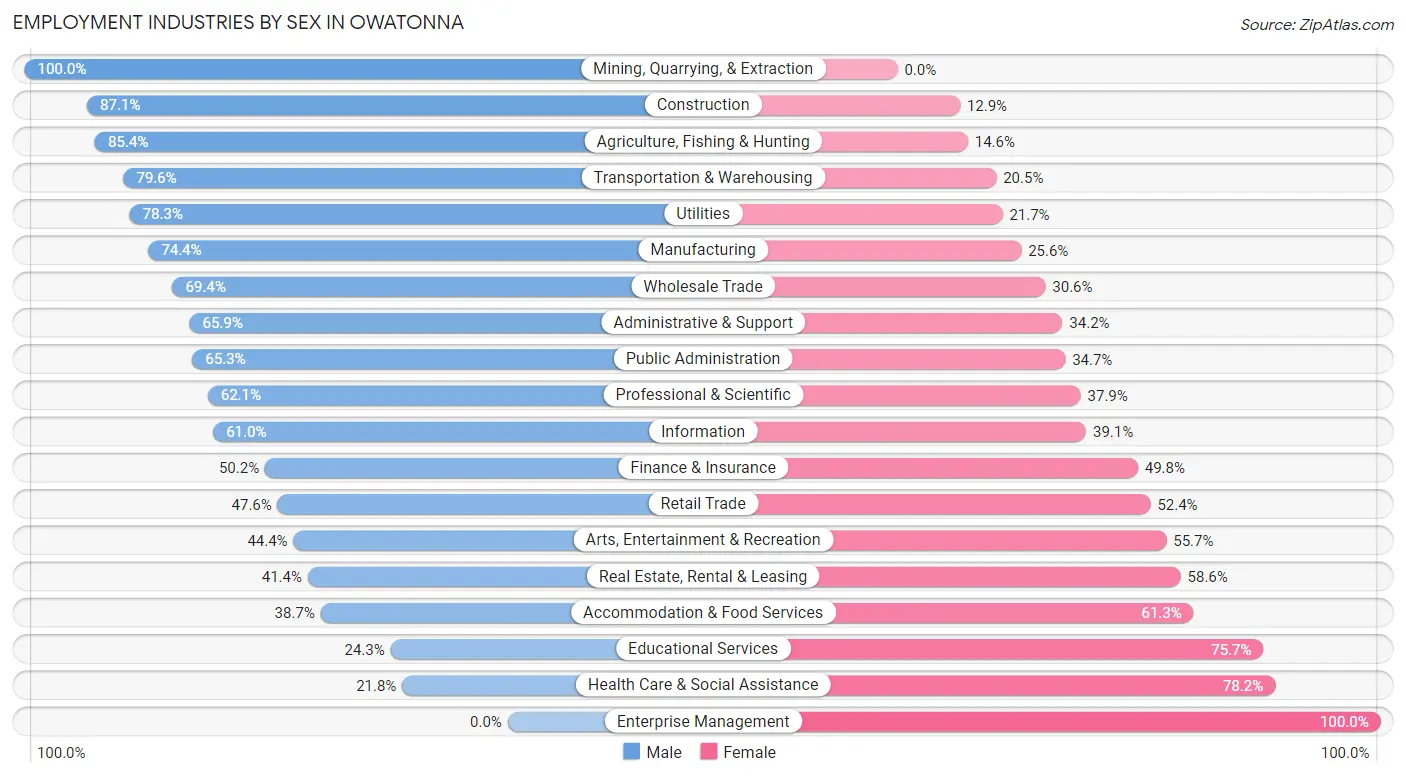
| Industry | Male | Female |
| Agriculture, Fishing & Hunting | 211 (85.4%) | 36 (14.6%) |
| Mining, Quarrying, & Extraction | 17 (100.0%) | 0 (0.0%) |
| Construction | 693 (87.1%) | 103 (12.9%) |
| Manufacturing | 2,224 (74.4%) | 766 (25.6%) |
| Wholesale Trade | 145 (69.4%) | 64 (30.6%) |
| Retail Trade | 856 (47.6%) | 941 (52.4%) |
| Transportation & Warehousing | 315 (79.5%) | 81 (20.4%) |
| Utilities | 36 (78.3%) | 10 (21.7%) |
| Information | 128 (61.0%) | 82 (39.1%) |
| Finance & Insurance | 513 (50.2%) | 508 (49.8%) |
| Real Estate, Rental & Leasing | 24 (41.4%) | 34 (58.6%) |
| Professional & Scientific | 203 (62.1%) | 124 (37.9%) |
| Enterprise Management | 0 (0.0%) | 13 (100.0%) |
| Administrative & Support | 189 (65.8%) | 98 (34.2%) |
| Educational Services | 263 (24.3%) | 821 (75.7%) |
| Health Care & Social Assistance | 349 (21.8%) | 1,249 (78.2%) |
| Arts, Entertainment & Recreation | 110 (44.4%) | 138 (55.6%) |
| Accommodation & Food Services | 261 (38.7%) | 413 (61.3%) |
| Public Administration | 515 (65.3%) | 274 (34.7%) |
| Total | 7,381 (54.9%) | 6,061 (45.1%) |
Education in Owatonna
School Enrollment in Owatonna
The most common levels of schooling among the 6,815 students in Owatonna are middle school (1,759 | 25.8%), high school (1,592 | 23.4%), and college / undergraduate (1,292 | 19.0%).
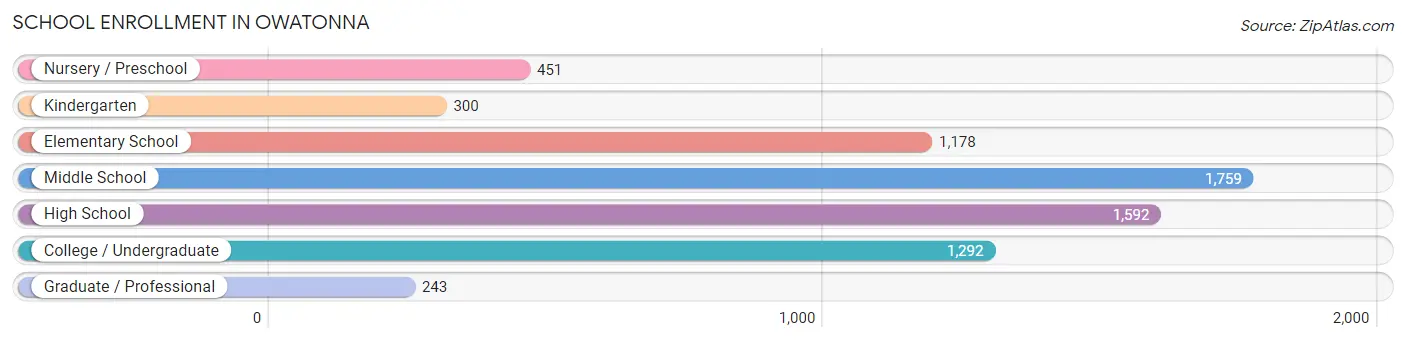
| School Level | # Students | % Students |
| Nursery / Preschool | 451 | 6.6% |
| Kindergarten | 300 | 4.4% |
| Elementary School | 1,178 | 17.3% |
| Middle School | 1,759 | 25.8% |
| High School | 1,592 | 23.4% |
| College / Undergraduate | 1,292 | 19.0% |
| Graduate / Professional | 243 | 3.6% |
| Total | 6,815 | 100.0% |
School Enrollment by Age by Funding Source in Owatonna
Out of a total of 6,815 students who are enrolled in schools in Owatonna, 1,050 (15.4%) attend a private institution, while the remaining 5,765 (84.6%) are enrolled in public schools. The age group of 35 years and over has the highest likelihood of being enrolled in private schools, with 114 (38.6% in the age bracket) enrolled. Conversely, the age group of 25 to 34 year olds has the lowest likelihood of being enrolled in a private school, with 285 (96.0% in the age bracket) attending a public institution.
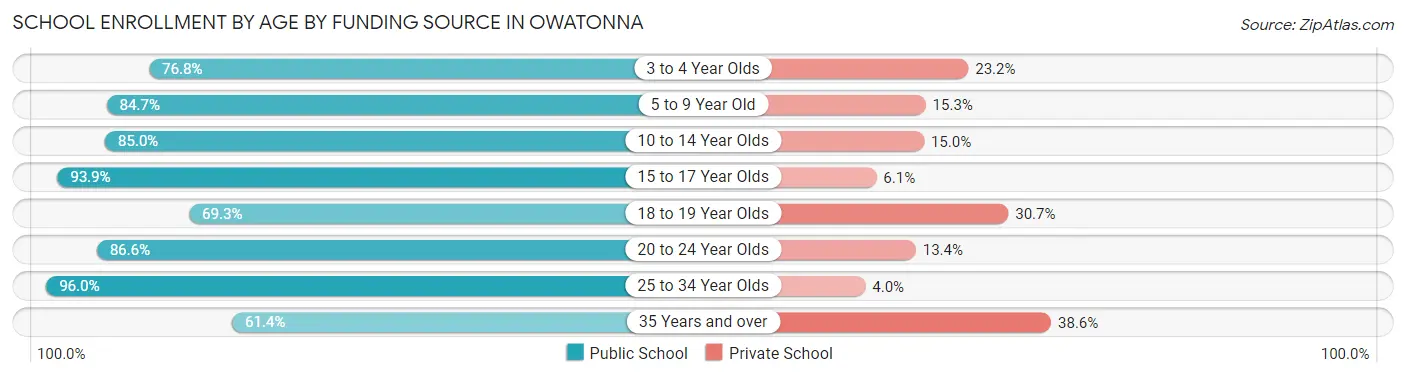
| Age Bracket | Public School | Private School |
| 3 to 4 Year Olds | 182 (76.8%) | 55 (23.2%) |
| 5 to 9 Year Old | 1,243 (84.7%) | 224 (15.3%) |
| 10 to 14 Year Olds | 1,830 (85.0%) | 322 (15.0%) |
| 15 to 17 Year Olds | 1,170 (93.9%) | 76 (6.1%) |
| 18 to 19 Year Olds | 380 (69.3%) | 168 (30.7%) |
| 20 to 24 Year Olds | 496 (86.6%) | 77 (13.4%) |
| 25 to 34 Year Olds | 285 (96.0%) | 12 (4.0%) |
| 35 Years and over | 181 (61.4%) | 114 (38.6%) |
| Total | 5,765 (84.6%) | 1,050 (15.4%) |
Educational Attainment by Field of Study in Owatonna
Business (1,439 | 23.3%), education (1,071 | 17.3%), science & technology (555 | 9.0%), arts & humanities (446 | 7.2%), and bio, nature & agricultural (434 | 7.0%) are the most common fields of study among 6,177 individuals in Owatonna who have obtained a bachelor's degree or higher.
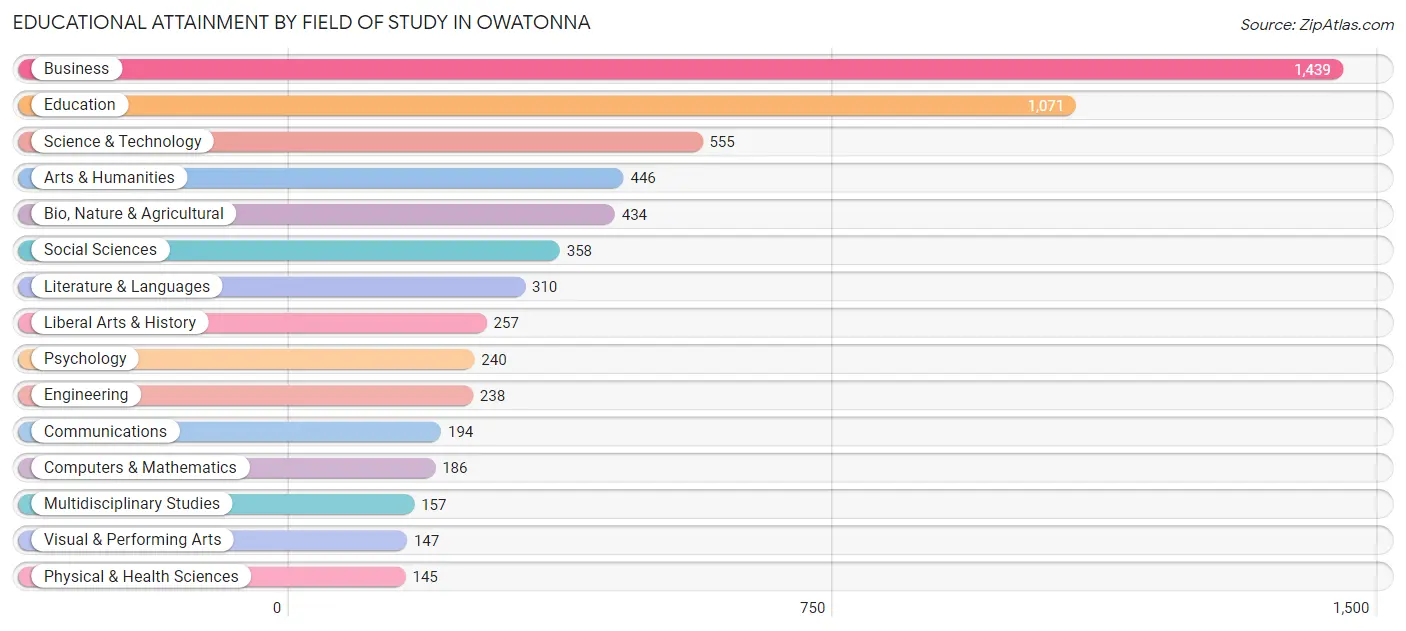
| Field of Study | # Graduates | % Graduates |
| Computers & Mathematics | 186 | 3.0% |
| Bio, Nature & Agricultural | 434 | 7.0% |
| Physical & Health Sciences | 145 | 2.4% |
| Psychology | 240 | 3.9% |
| Social Sciences | 358 | 5.8% |
| Engineering | 238 | 3.8% |
| Multidisciplinary Studies | 157 | 2.5% |
| Science & Technology | 555 | 9.0% |
| Business | 1,439 | 23.3% |
| Education | 1,071 | 17.3% |
| Literature & Languages | 310 | 5.0% |
| Liberal Arts & History | 257 | 4.2% |
| Visual & Performing Arts | 147 | 2.4% |
| Communications | 194 | 3.1% |
| Arts & Humanities | 446 | 7.2% |
| Total | 6,177 | 100.0% |
Transportation & Commute in Owatonna
Vehicle Availability by Sex in Owatonna
The most prevalent vehicle ownership categories in Owatonna are males with 2 vehicles (2,763, accounting for 38.0%) and females with 2 vehicles (2,288, making up 46.7%).
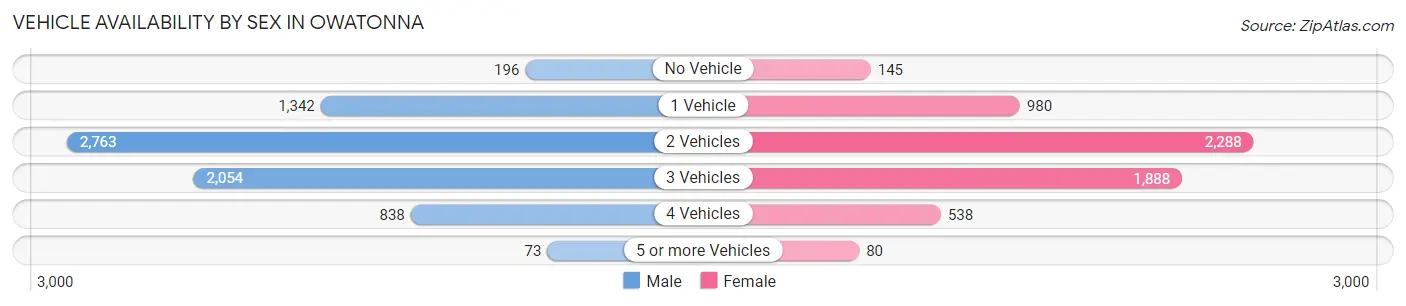
| Vehicles Available | Male | Female |
| No Vehicle | 196 (2.7%) | 145 (2.5%) |
| 1 Vehicle | 1,342 (18.5%) | 980 (16.6%) |
| 2 Vehicles | 2,763 (38.0%) | 2,288 (38.7%) |
| 3 Vehicles | 2,054 (28.3%) | 1,888 (31.9%) |
| 4 Vehicles | 838 (11.5%) | 538 (9.1%) |
| 5 or more Vehicles | 73 (1.0%) | 80 (1.3%) |
| Total | 7,266 (100.0%) | 5,919 (100.0%) |
Commute Time in Owatonna
The most frequently occuring commute durations in Owatonna are 5 to 9 minutes (3,738 commuters, 30.2%), 10 to 14 minutes (3,720 commuters, 30.1%), and 15 to 19 minutes (947 commuters, 7.6%).
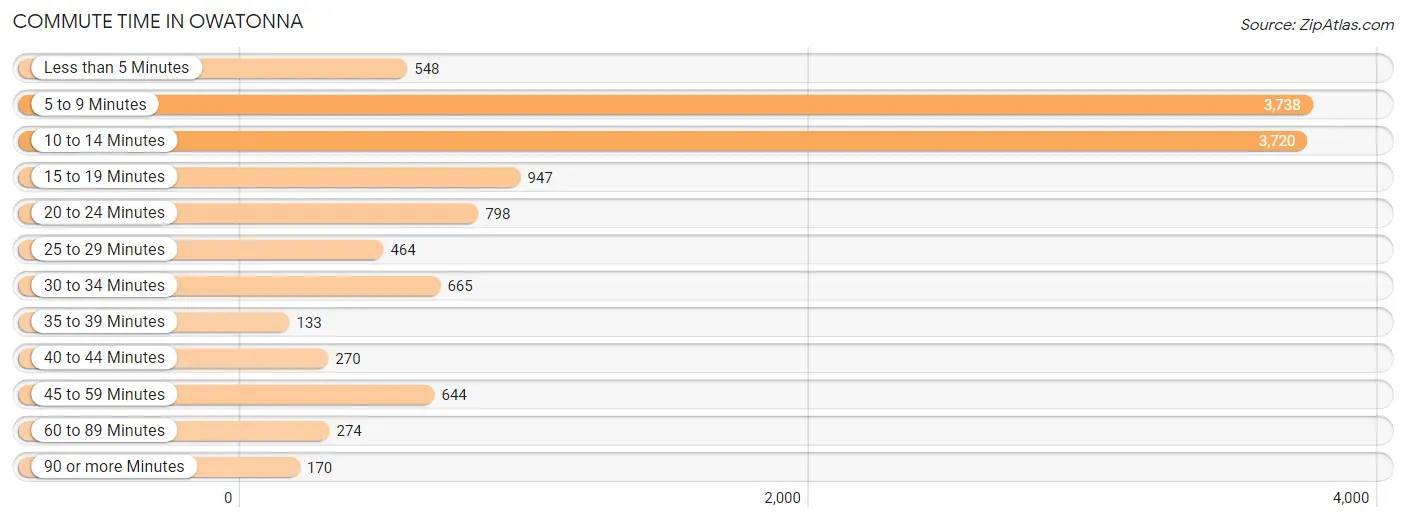
| Commute Time | # Commuters | % Commuters |
| Less than 5 Minutes | 548 | 4.4% |
| 5 to 9 Minutes | 3,738 | 30.2% |
| 10 to 14 Minutes | 3,720 | 30.1% |
| 15 to 19 Minutes | 947 | 7.6% |
| 20 to 24 Minutes | 798 | 6.5% |
| 25 to 29 Minutes | 464 | 3.7% |
| 30 to 34 Minutes | 665 | 5.4% |
| 35 to 39 Minutes | 133 | 1.1% |
| 40 to 44 Minutes | 270 | 2.2% |
| 45 to 59 Minutes | 644 | 5.2% |
| 60 to 89 Minutes | 274 | 2.2% |
| 90 or more Minutes | 170 | 1.4% |
Commute Time by Sex in Owatonna
The most common commute times in Owatonna are 5 to 9 minutes (2,106 commuters, 30.4%) for males and 10 to 14 minutes (1,912 commuters, 35.1%) for females.
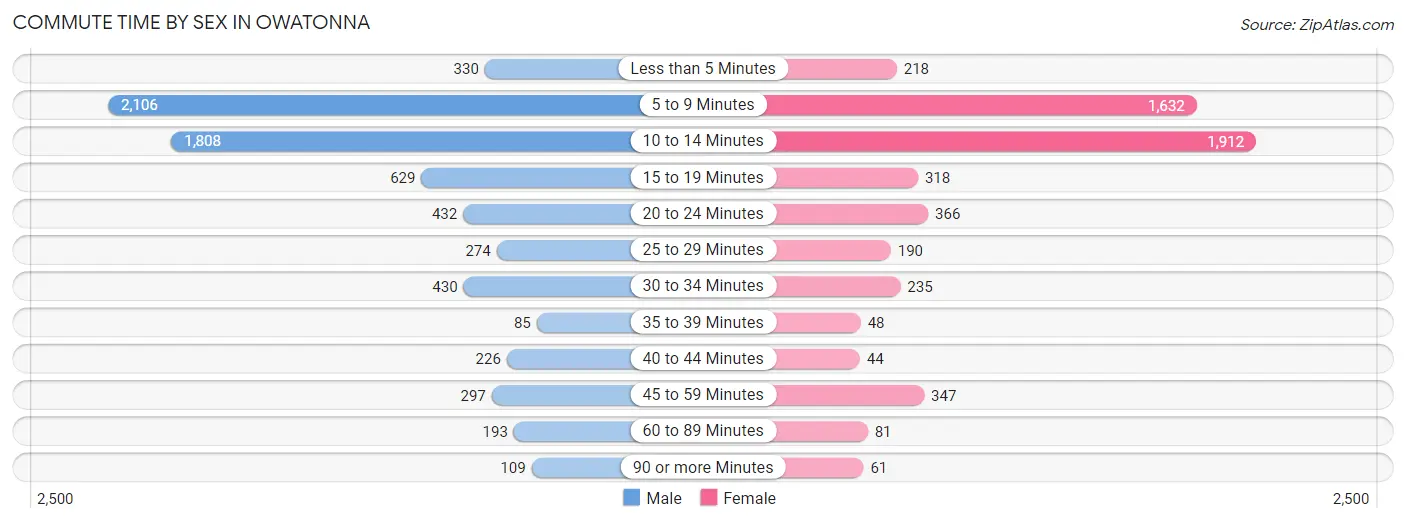
| Commute Time | Male | Female |
| Less than 5 Minutes | 330 (4.8%) | 218 (4.0%) |
| 5 to 9 Minutes | 2,106 (30.4%) | 1,632 (29.9%) |
| 10 to 14 Minutes | 1,808 (26.1%) | 1,912 (35.1%) |
| 15 to 19 Minutes | 629 (9.1%) | 318 (5.8%) |
| 20 to 24 Minutes | 432 (6.2%) | 366 (6.7%) |
| 25 to 29 Minutes | 274 (4.0%) | 190 (3.5%) |
| 30 to 34 Minutes | 430 (6.2%) | 235 (4.3%) |
| 35 to 39 Minutes | 85 (1.2%) | 48 (0.9%) |
| 40 to 44 Minutes | 226 (3.3%) | 44 (0.8%) |
| 45 to 59 Minutes | 297 (4.3%) | 347 (6.4%) |
| 60 to 89 Minutes | 193 (2.8%) | 81 (1.5%) |
| 90 or more Minutes | 109 (1.6%) | 61 (1.1%) |
Time of Departure to Work by Sex in Owatonna
The most frequent times of departure to work in Owatonna are 7:00 AM to 7:29 AM (998, 14.4%) for males and 7:30 AM to 7:59 AM (1,211, 22.2%) for females.
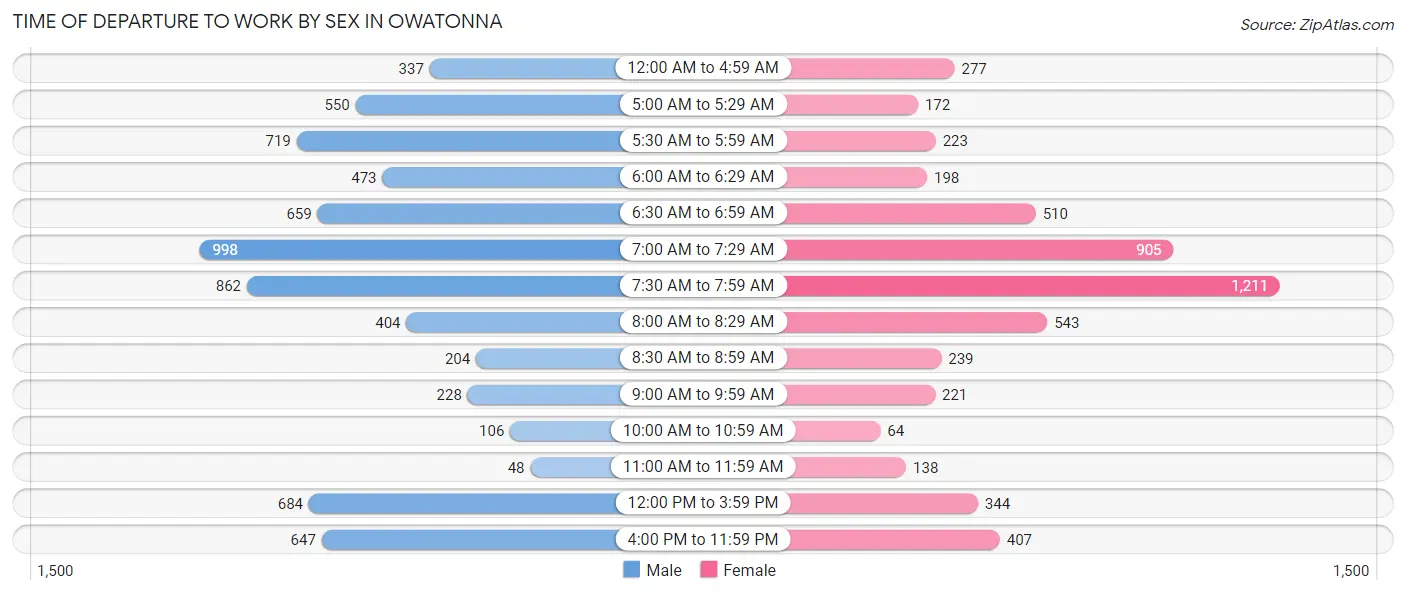
| Time of Departure | Male | Female |
| 12:00 AM to 4:59 AM | 337 (4.9%) | 277 (5.1%) |
| 5:00 AM to 5:29 AM | 550 (8.0%) | 172 (3.2%) |
| 5:30 AM to 5:59 AM | 719 (10.4%) | 223 (4.1%) |
| 6:00 AM to 6:29 AM | 473 (6.8%) | 198 (3.6%) |
| 6:30 AM to 6:59 AM | 659 (9.5%) | 510 (9.3%) |
| 7:00 AM to 7:29 AM | 998 (14.4%) | 905 (16.6%) |
| 7:30 AM to 7:59 AM | 862 (12.5%) | 1,211 (22.2%) |
| 8:00 AM to 8:29 AM | 404 (5.8%) | 543 (10.0%) |
| 8:30 AM to 8:59 AM | 204 (2.9%) | 239 (4.4%) |
| 9:00 AM to 9:59 AM | 228 (3.3%) | 221 (4.1%) |
| 10:00 AM to 10:59 AM | 106 (1.5%) | 64 (1.2%) |
| 11:00 AM to 11:59 AM | 48 (0.7%) | 138 (2.5%) |
| 12:00 PM to 3:59 PM | 684 (9.9%) | 344 (6.3%) |
| 4:00 PM to 11:59 PM | 647 (9.3%) | 407 (7.5%) |
| Total | 6,919 (100.0%) | 5,452 (100.0%) |
Housing Occupancy in Owatonna
Occupancy by Ownership in Owatonna
Of the total 10,958 dwellings in Owatonna, owner-occupied units account for 8,081 (73.8%), while renter-occupied units make up 2,877 (26.3%).
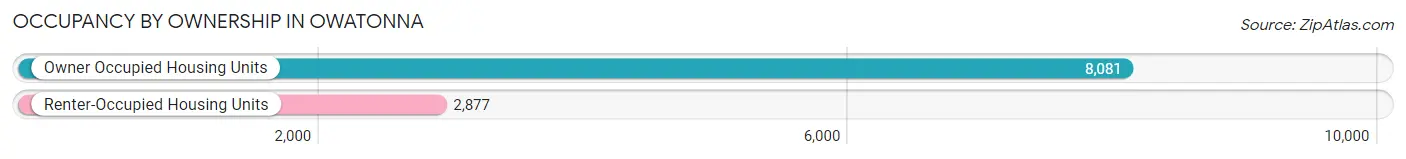
| Occupancy | # Housing Units | % Housing Units |
| Owner Occupied Housing Units | 8,081 | 73.8% |
| Renter-Occupied Housing Units | 2,877 | 26.3% |
| Total Occupied Housing Units | 10,958 | 100.0% |
Occupancy by Household Size in Owatonna
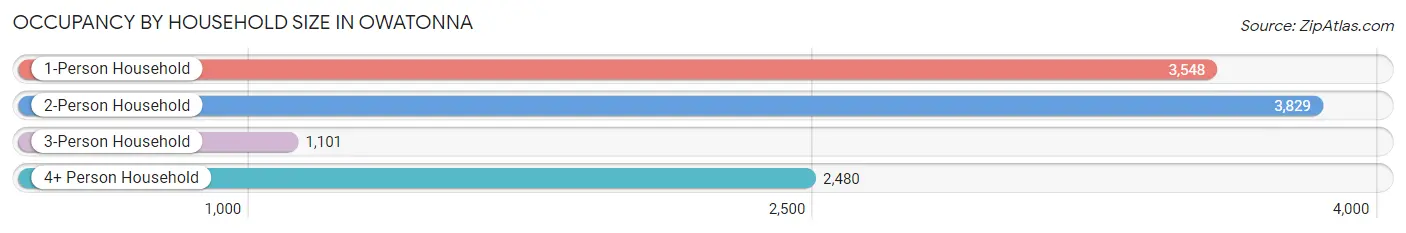
| Household Size | # Housing Units | % Housing Units |
| 1-Person Household | 3,548 | 32.4% |
| 2-Person Household | 3,829 | 34.9% |
| 3-Person Household | 1,101 | 10.1% |
| 4+ Person Household | 2,480 | 22.6% |
| Total Housing Units | 10,958 | 100.0% |
Occupancy by Ownership by Household Size in Owatonna
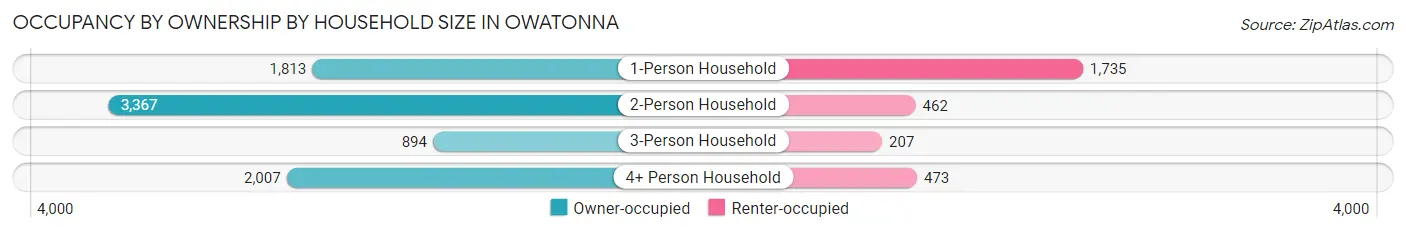
| Household Size | Owner-occupied | Renter-occupied |
| 1-Person Household | 1,813 (51.1%) | 1,735 (48.9%) |
| 2-Person Household | 3,367 (87.9%) | 462 (12.1%) |
| 3-Person Household | 894 (81.2%) | 207 (18.8%) |
| 4+ Person Household | 2,007 (80.9%) | 473 (19.1%) |
| Total Housing Units | 8,081 (73.8%) | 2,877 (26.3%) |
Occupancy by Educational Attainment in Owatonna
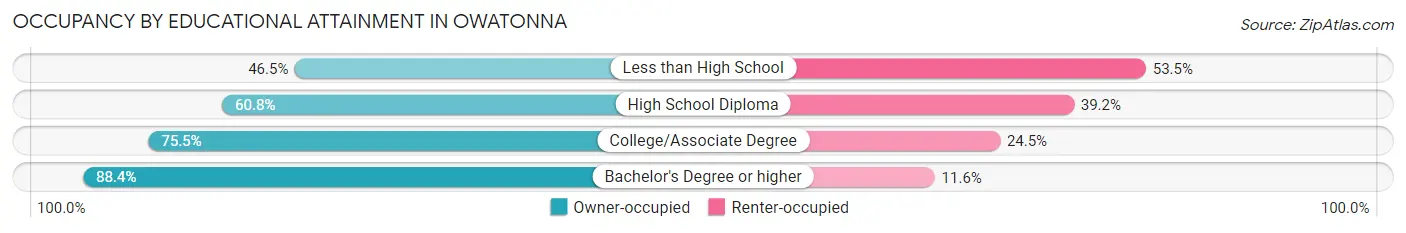
| Household Size | Owner-occupied | Renter-occupied |
| Less than High School | 309 (46.5%) | 355 (53.5%) |
| High School Diploma | 1,790 (60.8%) | 1,153 (39.2%) |
| College/Associate Degree | 3,010 (75.5%) | 979 (24.5%) |
| Bachelor's Degree or higher | 2,972 (88.4%) | 390 (11.6%) |
Occupancy by Age of Householder in Owatonna
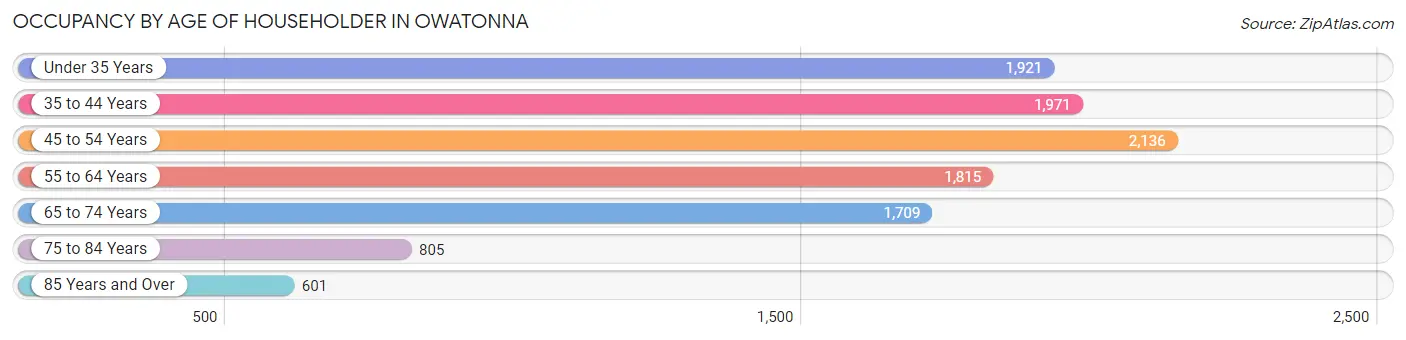
| Age Bracket | # Households | % Households |
| Under 35 Years | 1,921 | 17.5% |
| 35 to 44 Years | 1,971 | 18.0% |
| 45 to 54 Years | 2,136 | 19.5% |
| 55 to 64 Years | 1,815 | 16.6% |
| 65 to 74 Years | 1,709 | 15.6% |
| 75 to 84 Years | 805 | 7.3% |
| 85 Years and Over | 601 | 5.5% |
| Total | 10,958 | 100.0% |
Housing Finances in Owatonna
Median Income by Occupancy in Owatonna
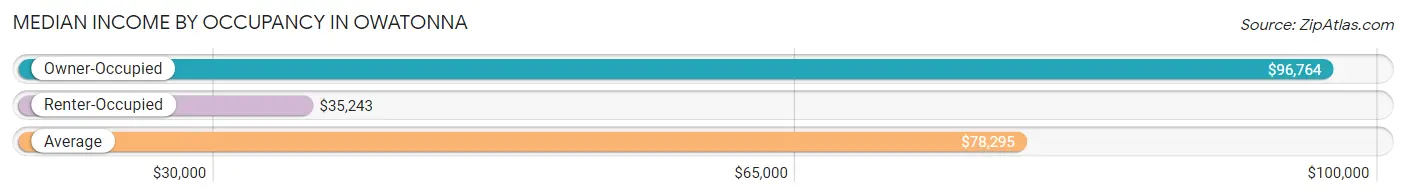
| Occupancy Type | # Households | Median Income |
| Owner-Occupied | 8,081 (73.8%) | $96,764 |
| Renter-Occupied | 2,877 (26.3%) | $35,243 |
| Average | 10,958 (100.0%) | $78,295 |
Occupancy by Householder Income Bracket in Owatonna
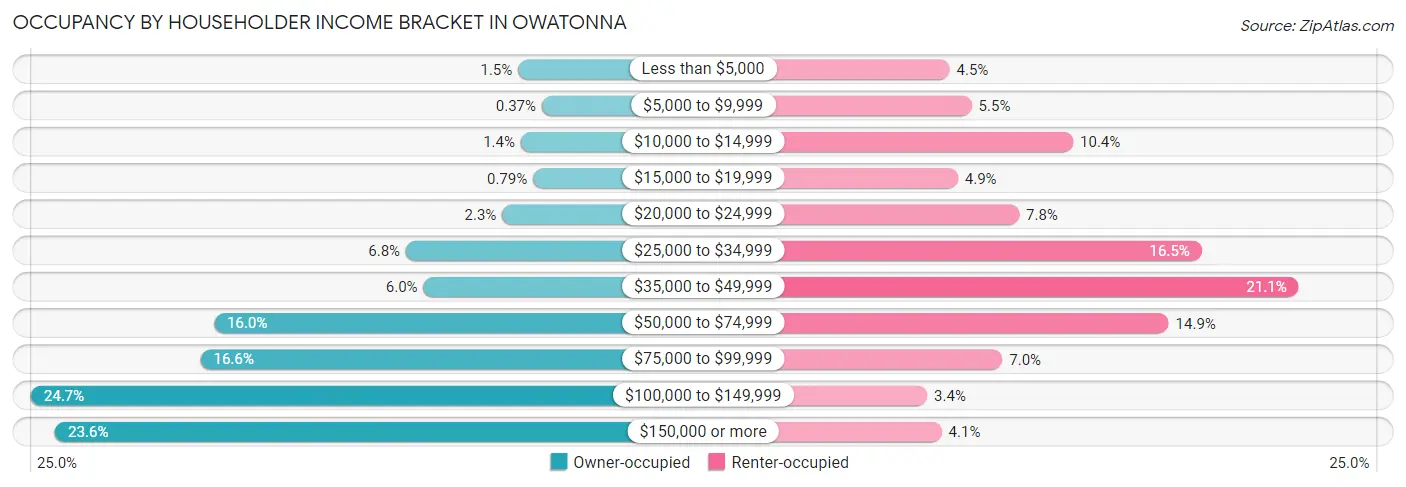
| Income Bracket | Owner-occupied | Renter-occupied |
| Less than $5,000 | 121 (1.5%) | 129 (4.5%) |
| $5,000 to $9,999 | 30 (0.4%) | 159 (5.5%) |
| $10,000 to $14,999 | 111 (1.4%) | 298 (10.4%) |
| $15,000 to $19,999 | 64 (0.8%) | 140 (4.9%) |
| $20,000 to $24,999 | 183 (2.3%) | 224 (7.8%) |
| $25,000 to $34,999 | 553 (6.8%) | 474 (16.5%) |
| $35,000 to $49,999 | 486 (6.0%) | 607 (21.1%) |
| $50,000 to $74,999 | 1,291 (16.0%) | 429 (14.9%) |
| $75,000 to $99,999 | 1,343 (16.6%) | 201 (7.0%) |
| $100,000 to $149,999 | 1,996 (24.7%) | 98 (3.4%) |
| $150,000 or more | 1,903 (23.5%) | 118 (4.1%) |
| Total | 8,081 (100.0%) | 2,877 (100.0%) |
Monthly Housing Cost Tiers in Owatonna
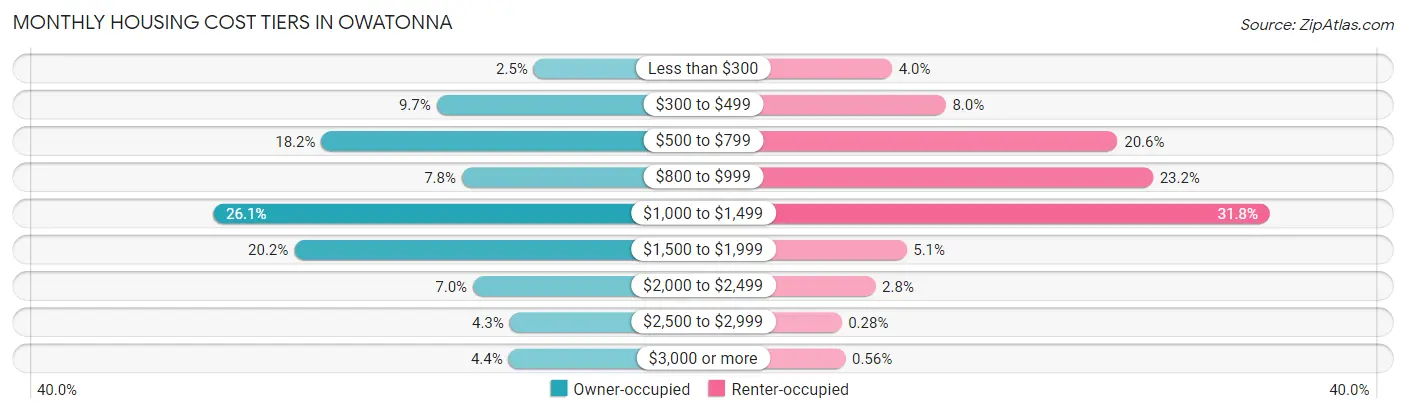
| Monthly Cost | Owner-occupied | Renter-occupied |
| Less than $300 | 203 (2.5%) | 115 (4.0%) |
| $300 to $499 | 781 (9.7%) | 229 (8.0%) |
| $500 to $799 | 1,467 (18.1%) | 593 (20.6%) |
| $800 to $999 | 630 (7.8%) | 668 (23.2%) |
| $1,000 to $1,499 | 2,110 (26.1%) | 916 (31.8%) |
| $1,500 to $1,999 | 1,628 (20.2%) | 146 (5.1%) |
| $2,000 to $2,499 | 564 (7.0%) | 80 (2.8%) |
| $2,500 to $2,999 | 346 (4.3%) | 8 (0.3%) |
| $3,000 or more | 352 (4.4%) | 16 (0.6%) |
| Total | 8,081 (100.0%) | 2,877 (100.0%) |
Physical Housing Characteristics in Owatonna
Housing Structures in Owatonna
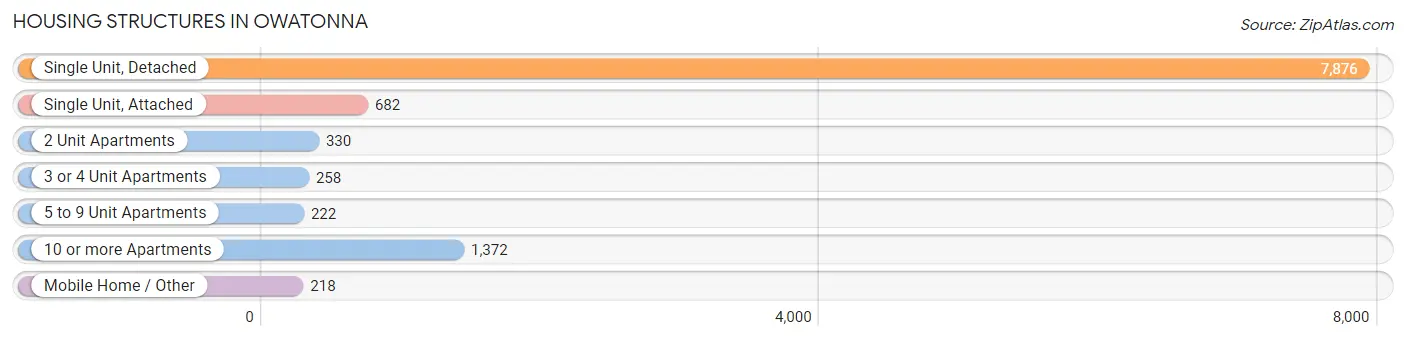
| Structure Type | # Housing Units | % Housing Units |
| Single Unit, Detached | 7,876 | 71.9% |
| Single Unit, Attached | 682 | 6.2% |
| 2 Unit Apartments | 330 | 3.0% |
| 3 or 4 Unit Apartments | 258 | 2.4% |
| 5 to 9 Unit Apartments | 222 | 2.0% |
| 10 or more Apartments | 1,372 | 12.5% |
| Mobile Home / Other | 218 | 2.0% |
| Total | 10,958 | 100.0% |
Housing Structures by Occupancy in Owatonna
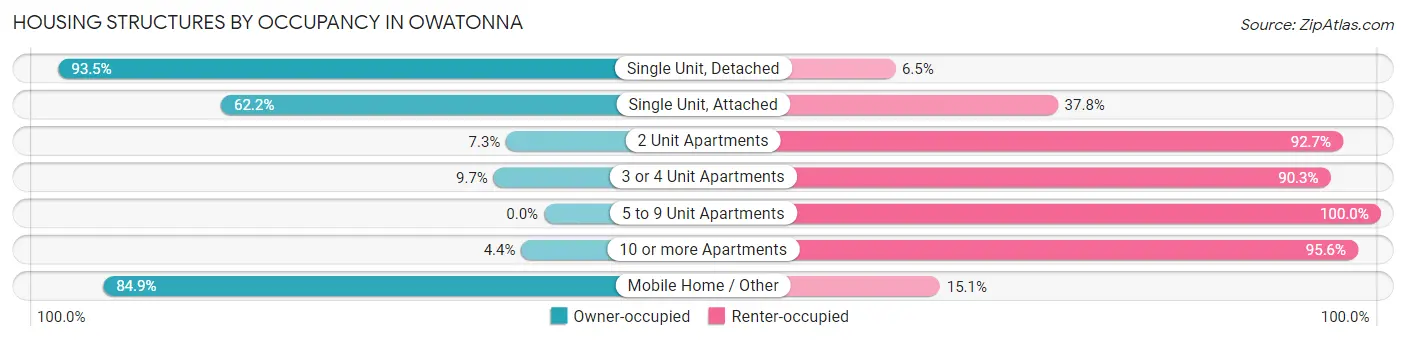
| Structure Type | Owner-occupied | Renter-occupied |
| Single Unit, Detached | 7,363 (93.5%) | 513 (6.5%) |
| Single Unit, Attached | 424 (62.2%) | 258 (37.8%) |
| 2 Unit Apartments | 24 (7.3%) | 306 (92.7%) |
| 3 or 4 Unit Apartments | 25 (9.7%) | 233 (90.3%) |
| 5 to 9 Unit Apartments | 0 (0.0%) | 222 (100.0%) |
| 10 or more Apartments | 60 (4.4%) | 1,312 (95.6%) |
| Mobile Home / Other | 185 (84.9%) | 33 (15.1%) |
| Total | 8,081 (73.8%) | 2,877 (26.3%) |
Housing Structures by Number of Rooms in Owatonna
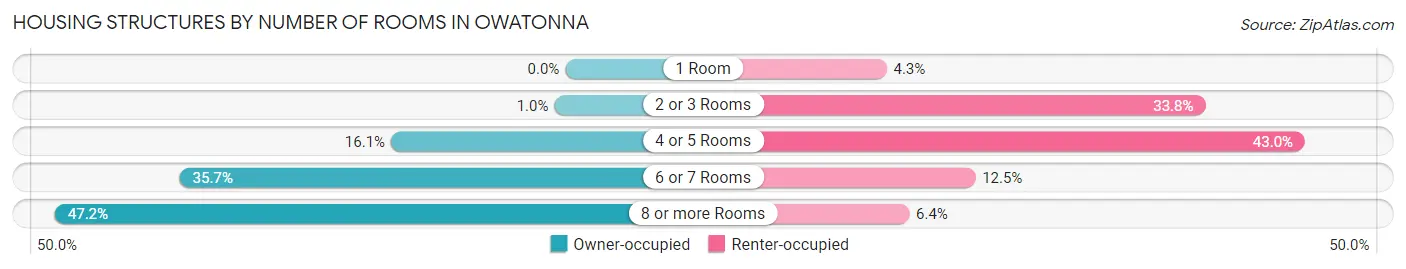
| Number of Rooms | Owner-occupied | Renter-occupied |
| 1 Room | 0 (0.0%) | 124 (4.3%) |
| 2 or 3 Rooms | 82 (1.0%) | 972 (33.8%) |
| 4 or 5 Rooms | 1,303 (16.1%) | 1,237 (43.0%) |
| 6 or 7 Rooms | 2,882 (35.7%) | 360 (12.5%) |
| 8 or more Rooms | 3,814 (47.2%) | 184 (6.4%) |
| Total | 8,081 (100.0%) | 2,877 (100.0%) |
Housing Structure by Heating Type in Owatonna
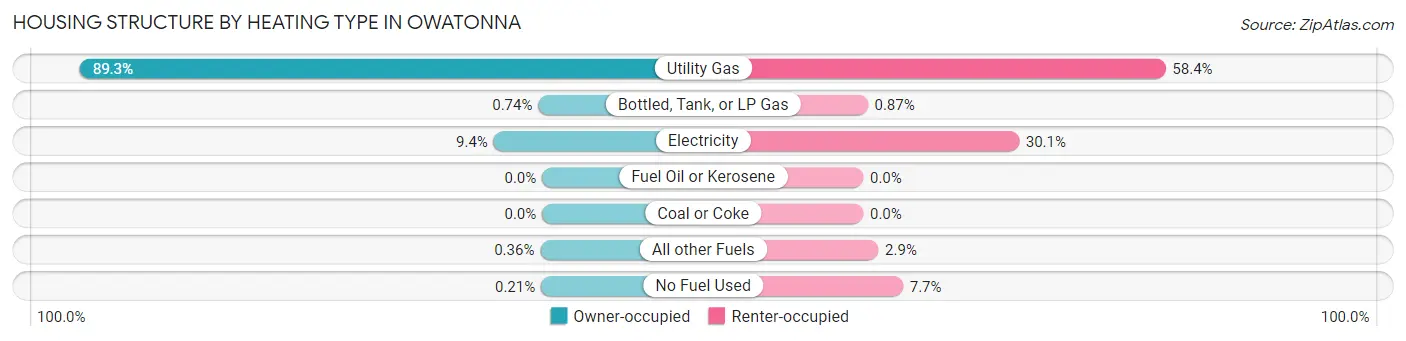
| Heating Type | Owner-occupied | Renter-occupied |
| Utility Gas | 7,219 (89.3%) | 1,681 (58.4%) |
| Bottled, Tank, or LP Gas | 60 (0.7%) | 25 (0.9%) |
| Electricity | 756 (9.4%) | 866 (30.1%) |
| Fuel Oil or Kerosene | 0 (0.0%) | 0 (0.0%) |
| Coal or Coke | 0 (0.0%) | 0 (0.0%) |
| All other Fuels | 29 (0.4%) | 84 (2.9%) |
| No Fuel Used | 17 (0.2%) | 221 (7.7%) |
| Total | 8,081 (100.0%) | 2,877 (100.0%) |
Household Vehicle Usage in Owatonna
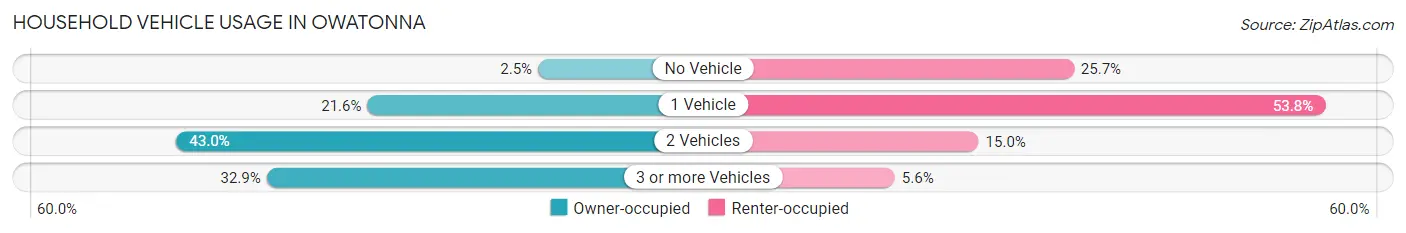
| Vehicles per Household | Owner-occupied | Renter-occupied |
| No Vehicle | 202 (2.5%) | 738 (25.7%) |
| 1 Vehicle | 1,746 (21.6%) | 1,547 (53.8%) |
| 2 Vehicles | 3,474 (43.0%) | 431 (15.0%) |
| 3 or more Vehicles | 2,659 (32.9%) | 161 (5.6%) |
| Total | 8,081 (100.0%) | 2,877 (100.0%) |
Real Estate & Mortgages in Owatonna
Real Estate and Mortgage Overview in Owatonna
| Characteristic | Without Mortgage | With Mortgage |
| Housing Units | 2,760 | 5,321 |
| Median Property Value | $208,700 | $221,300 |
| Median Household Income | $65,573 | $1,576 |
| Monthly Housing Costs | $609 | $352 |
| Real Estate Taxes | $2,777 | $145 |
Property Value by Mortgage Status in Owatonna
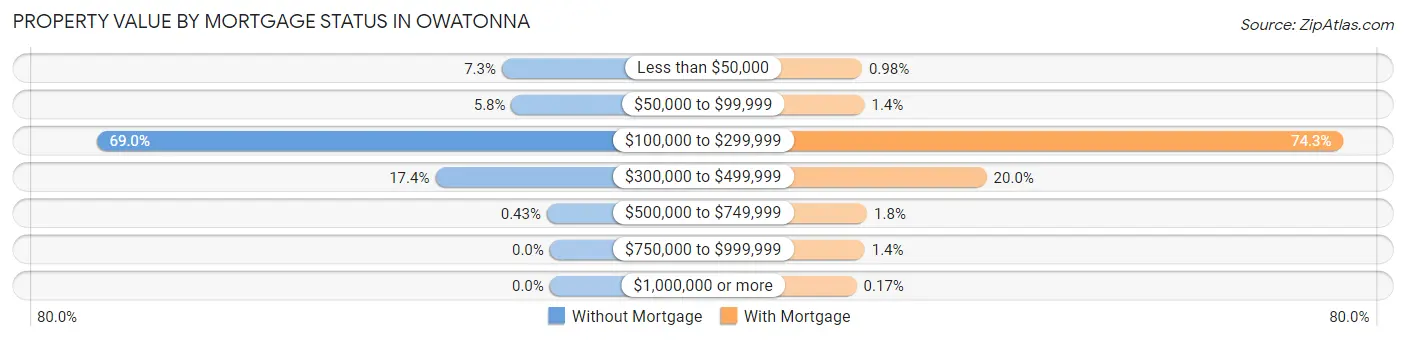
| Property Value | Without Mortgage | With Mortgage |
| Less than $50,000 | 201 (7.3%) | 52 (1.0%) |
| $50,000 to $99,999 | 161 (5.8%) | 73 (1.4%) |
| $100,000 to $299,999 | 1,905 (69.0%) | 3,955 (74.3%) |
| $300,000 to $499,999 | 481 (17.4%) | 1,063 (20.0%) |
| $500,000 to $749,999 | 12 (0.4%) | 94 (1.8%) |
| $750,000 to $999,999 | 0 (0.0%) | 75 (1.4%) |
| $1,000,000 or more | 0 (0.0%) | 9 (0.2%) |
| Total | 2,760 (100.0%) | 5,321 (100.0%) |
Household Income by Mortgage Status in Owatonna
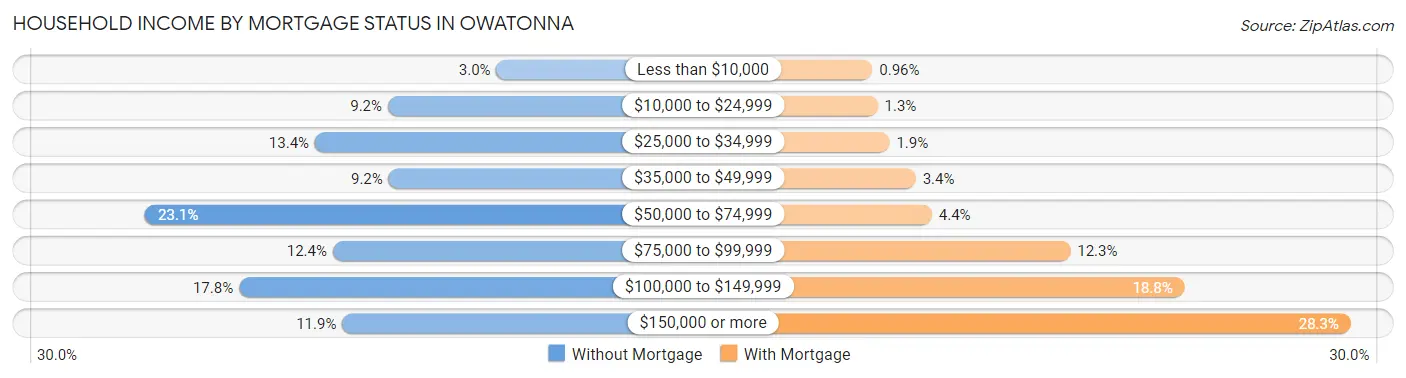
| Household Income | Without Mortgage | With Mortgage |
| Less than $10,000 | 84 (3.0%) | 51 (1.0%) |
| $10,000 to $24,999 | 255 (9.2%) | 67 (1.3%) |
| $25,000 to $34,999 | 370 (13.4%) | 103 (1.9%) |
| $35,000 to $49,999 | 254 (9.2%) | 183 (3.4%) |
| $50,000 to $74,999 | 638 (23.1%) | 232 (4.4%) |
| $75,000 to $99,999 | 342 (12.4%) | 653 (12.3%) |
| $100,000 to $149,999 | 490 (17.7%) | 1,001 (18.8%) |
| $150,000 or more | 327 (11.8%) | 1,506 (28.3%) |
| Total | 2,760 (100.0%) | 5,321 (100.0%) |
Property Value to Household Income Ratio in Owatonna
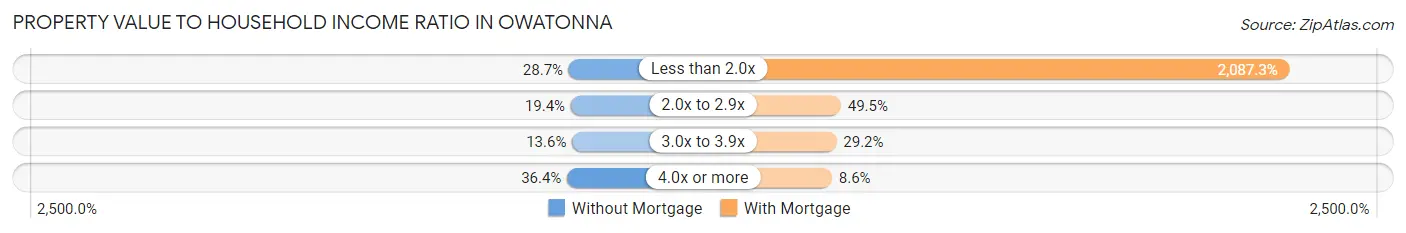
| Value-to-Income Ratio | Without Mortgage | With Mortgage |
| Less than 2.0x | 792 (28.7%) | 111,064 (2,087.3%) |
| 2.0x to 2.9x | 535 (19.4%) | 2,631 (49.4%) |
| 3.0x to 3.9x | 376 (13.6%) | 1,552 (29.2%) |
| 4.0x or more | 1,005 (36.4%) | 458 (8.6%) |
| Total | 2,760 (100.0%) | 5,321 (100.0%) |
Real Estate Taxes by Mortgage Status in Owatonna
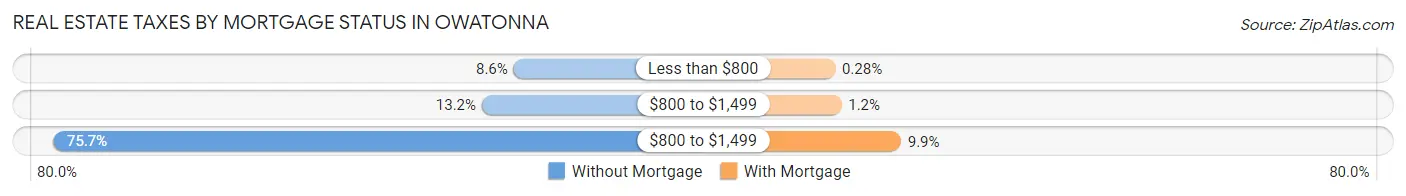
| Property Taxes | Without Mortgage | With Mortgage |
| Less than $800 | 236 (8.6%) | 15 (0.3%) |
| $800 to $1,499 | 364 (13.2%) | 64 (1.2%) |
| $800 to $1,499 | 2,090 (75.7%) | 527 (9.9%) |
| Total | 2,760 (100.0%) | 5,321 (100.0%) |
Health & Disability in Owatonna
Health Insurance Coverage by Age in Owatonna
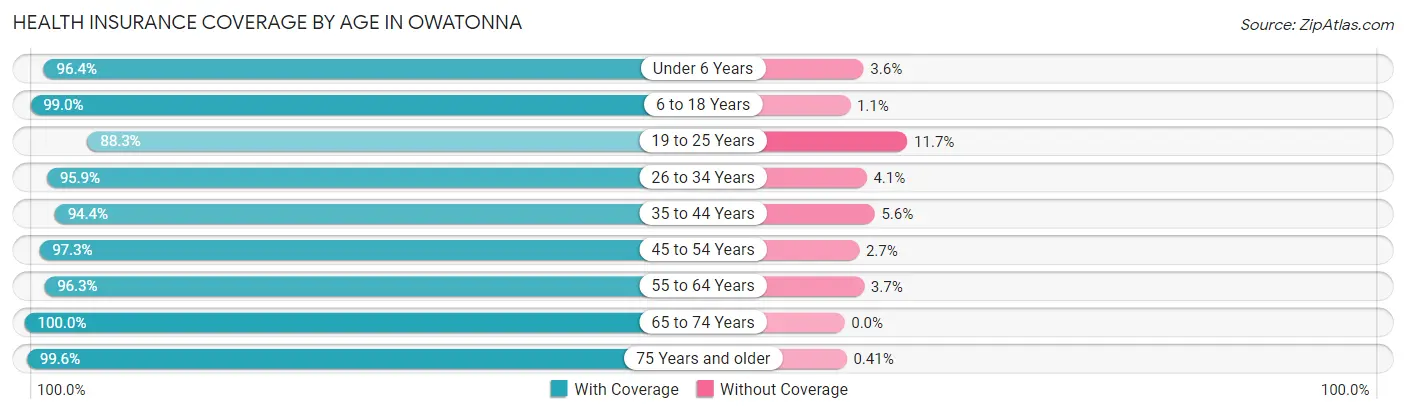
| Age Bracket | With Coverage | Without Coverage |
| Under 6 Years | 1,678 (96.4%) | 62 (3.6%) |
| 6 to 18 Years | 4,977 (99.0%) | 53 (1.1%) |
| 19 to 25 Years | 1,823 (88.3%) | 242 (11.7%) |
| 26 to 34 Years | 2,460 (95.9%) | 106 (4.1%) |
| 35 to 44 Years | 3,239 (94.4%) | 193 (5.6%) |
| 45 to 54 Years | 3,175 (97.3%) | 89 (2.7%) |
| 55 to 64 Years | 3,185 (96.3%) | 121 (3.7%) |
| 65 to 74 Years | 2,716 (100.0%) | 0 (0.0%) |
| 75 Years and older | 1,924 (99.6%) | 8 (0.4%) |
| Total | 25,177 (96.7%) | 874 (3.4%) |
Health Insurance Coverage by Citizenship Status in Owatonna
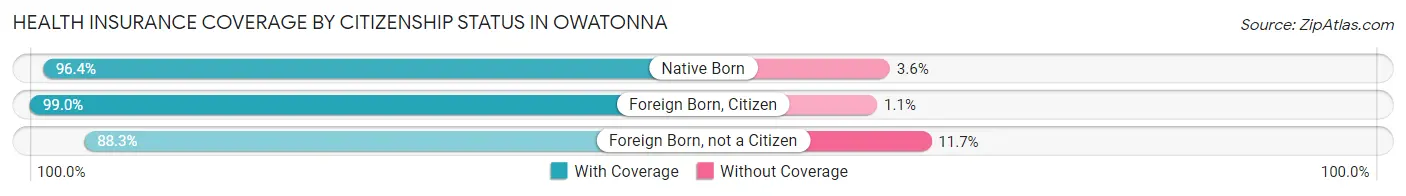
| Citizenship Status | With Coverage | Without Coverage |
| Native Born | 1,678 (96.4%) | 62 (3.6%) |
| Foreign Born, Citizen | 4,977 (99.0%) | 53 (1.1%) |
| Foreign Born, not a Citizen | 1,823 (88.3%) | 242 (11.7%) |
Health Insurance Coverage by Household Income in Owatonna
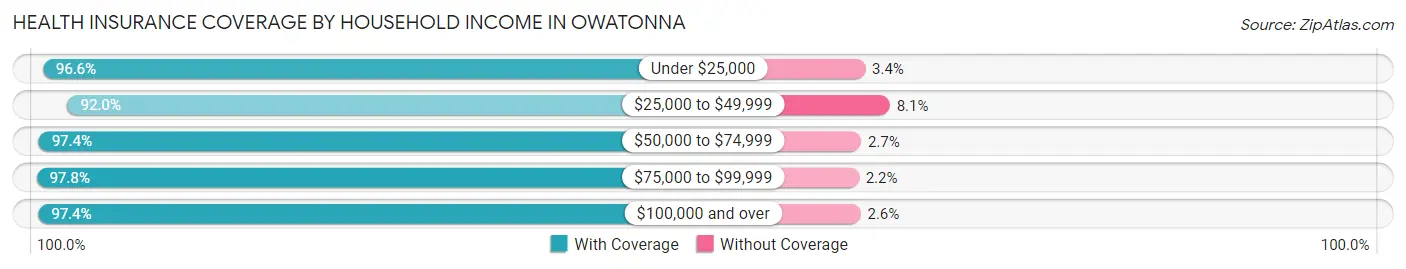
| Household Income | With Coverage | Without Coverage |
| Under $25,000 | 2,109 (96.6%) | 75 (3.4%) |
| $25,000 to $49,999 | 3,369 (91.9%) | 295 (8.1%) |
| $50,000 to $74,999 | 3,823 (97.4%) | 104 (2.6%) |
| $75,000 to $99,999 | 4,042 (97.8%) | 92 (2.2%) |
| $100,000 and over | 11,668 (97.4%) | 308 (2.6%) |
Public vs Private Health Insurance Coverage by Age in Owatonna
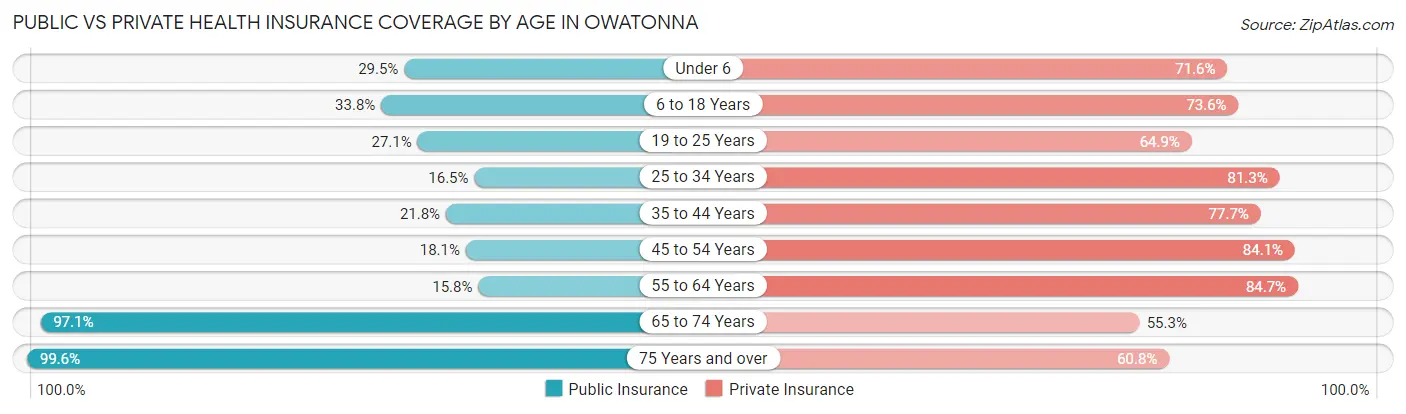
| Age Bracket | Public Insurance | Private Insurance |
| Under 6 | 514 (29.5%) | 1,245 (71.6%) |
| 6 to 18 Years | 1,701 (33.8%) | 3,703 (73.6%) |
| 19 to 25 Years | 559 (27.1%) | 1,341 (64.9%) |
| 25 to 34 Years | 424 (16.5%) | 2,085 (81.2%) |
| 35 to 44 Years | 748 (21.8%) | 2,668 (77.7%) |
| 45 to 54 Years | 591 (18.1%) | 2,745 (84.1%) |
| 55 to 64 Years | 522 (15.8%) | 2,799 (84.7%) |
| 65 to 74 Years | 2,637 (97.1%) | 1,502 (55.3%) |
| 75 Years and over | 1,924 (99.6%) | 1,174 (60.8%) |
| Total | 9,620 (36.9%) | 19,262 (73.9%) |
Disability Status by Sex by Age in Owatonna
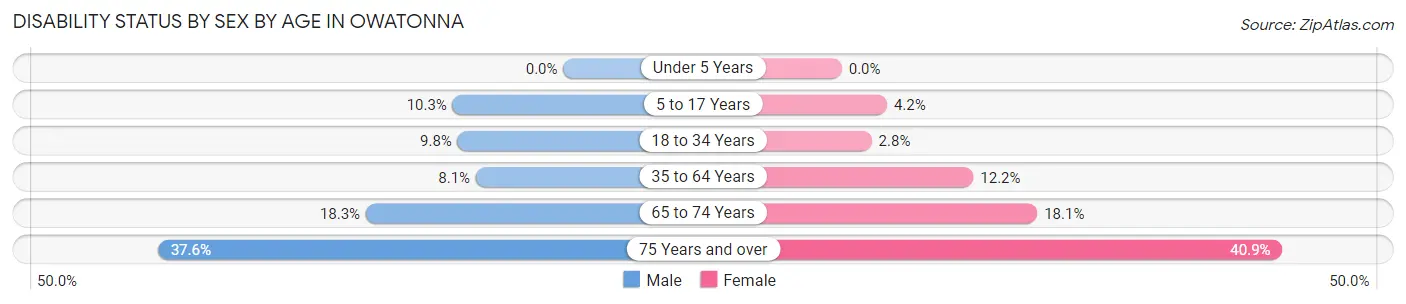
| Age Bracket | Male | Female |
| Under 5 Years | 0 (0.0%) | 0 (0.0%) |
| 5 to 17 Years | 250 (10.3%) | 108 (4.2%) |
| 18 to 34 Years | 285 (9.8%) | 58 (2.8%) |
| 35 to 64 Years | 412 (8.1%) | 601 (12.2%) |
| 65 to 74 Years | 229 (18.3%) | 266 (18.1%) |
| 75 Years and over | 277 (37.6%) | 489 (40.9%) |
Disability Class by Sex by Age in Owatonna
Disability Class: Hearing Difficulty
| Age Bracket | Male | Female |
| Under 5 Years | 0 (0.0%) | 0 (0.0%) |
| 5 to 17 Years | 0 (0.0%) | 18 (0.7%) |
| 18 to 34 Years | 0 (0.0%) | 0 (0.0%) |
| 35 to 64 Years | 142 (2.8%) | 109 (2.2%) |
| 65 to 74 Years | 71 (5.7%) | 104 (7.1%) |
| 75 Years and over | 106 (14.4%) | 132 (11.0%) |
Disability Class: Vision Difficulty
| Age Bracket | Male | Female |
| Under 5 Years | 0 (0.0%) | 0 (0.0%) |
| 5 to 17 Years | 18 (0.7%) | 23 (0.9%) |
| 18 to 34 Years | 66 (2.3%) | 0 (0.0%) |
| 35 to 64 Years | 27 (0.5%) | 65 (1.3%) |
| 65 to 74 Years | 37 (3.0%) | 103 (7.0%) |
| 75 Years and over | 9 (1.2%) | 40 (3.3%) |
Disability Class: Cognitive Difficulty
| Age Bracket | Male | Female |
| 5 to 17 Years | 232 (9.5%) | 76 (2.9%) |
| 18 to 34 Years | 214 (7.4%) | 50 (2.4%) |
| 35 to 64 Years | 229 (4.5%) | 292 (5.9%) |
| 65 to 74 Years | 56 (4.5%) | 79 (5.4%) |
| 75 Years and over | 104 (14.1%) | 62 (5.2%) |
Disability Class: Ambulatory Difficulty
| Age Bracket | Male | Female |
| 5 to 17 Years | 0 (0.0%) | 0 (0.0%) |
| 18 to 34 Years | 20 (0.7%) | 0 (0.0%) |
| 35 to 64 Years | 148 (2.9%) | 219 (4.4%) |
| 65 to 74 Years | 116 (9.3%) | 151 (10.3%) |
| 75 Years and over | 180 (24.5%) | 272 (22.7%) |
Disability Class: Self-Care Difficulty
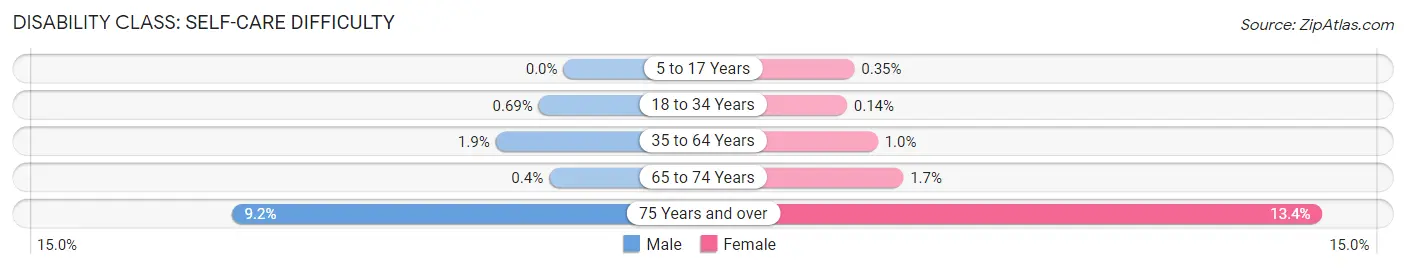
| Age Bracket | Male | Female |
| 5 to 17 Years | 0 (0.0%) | 9 (0.4%) |
| 18 to 34 Years | 20 (0.7%) | 3 (0.1%) |
| 35 to 64 Years | 96 (1.9%) | 49 (1.0%) |
| 65 to 74 Years | 5 (0.4%) | 25 (1.7%) |
| 75 Years and over | 68 (9.2%) | 160 (13.4%) |
Technology Access in Owatonna
Computing Device Access in Owatonna
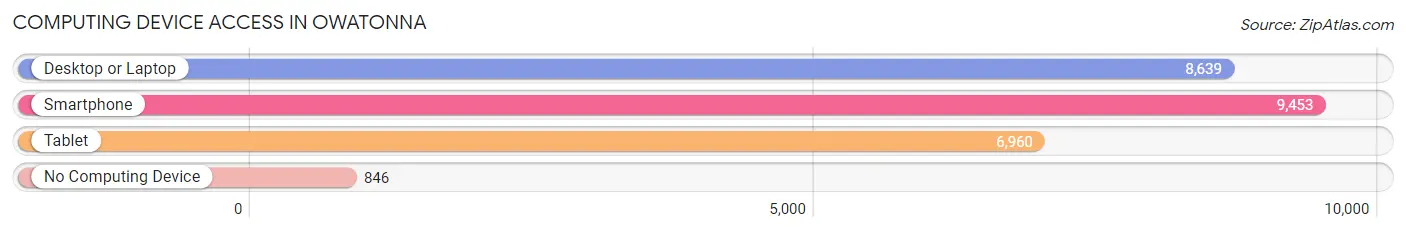
| Device Type | # Households | % Households |
| Desktop or Laptop | 8,639 | 78.8% |
| Smartphone | 9,453 | 86.3% |
| Tablet | 6,960 | 63.5% |
| No Computing Device | 846 | 7.7% |
| Total | 10,958 | 100.0% |
Internet Access in Owatonna
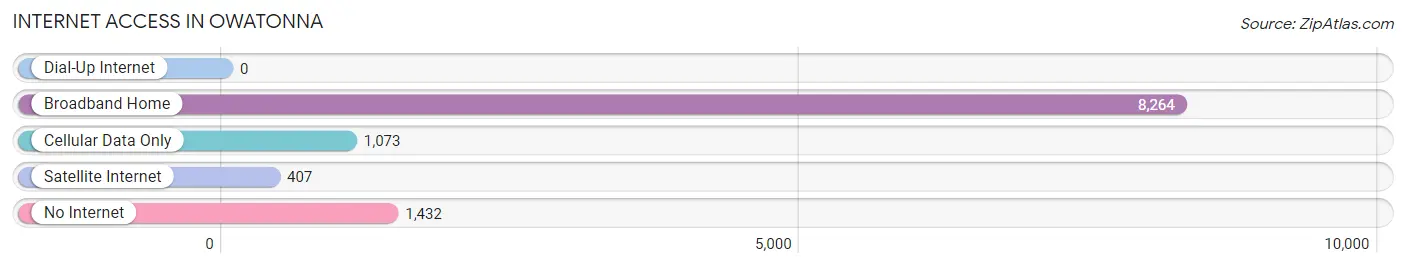
| Internet Type | # Households | % Households |
| Dial-Up Internet | 0 | 0.0% |
| Broadband Home | 8,264 | 75.4% |
| Cellular Data Only | 1,073 | 9.8% |
| Satellite Internet | 407 | 3.7% |
| No Internet | 1,432 | 13.1% |
| Total | 10,958 | 100.0% |
Owatonna Summary
Owatonna, Minnesota is a city located in Steele County in the south-central part of the state. It is situated along the Straight River, approximately 50 miles south of Minneapolis and St. Paul. The city has a population of approximately 25,000 people and is the county seat of Steele County.
History
Owatonna was founded in 1854 by settlers from New England. The city was named after the Straight River, which was derived from the Dakota word for “straight”. The city was incorporated in 1856 and was the first city in Steele County.
In the late 19th century, Owatonna was a major center for the production of agricultural equipment. The city was home to the Owatonna Manufacturing Company, which produced threshing machines, plows, and other farm equipment. The company was later acquired by the Minneapolis-based Massey-Harris Company, which continued to produce farm equipment in Owatonna until the mid-20th century.
In the early 20th century, Owatonna was a major center for the production of furniture. The city was home to the Owatonna Chair Company, which produced chairs, tables, and other furniture. The company was later acquired by the Minneapolis-based American Seating Company, which continued to produce furniture in Owatonna until the mid-20th century.
Geography
Owatonna is located in the south-central part of Minnesota, approximately 50 miles south of Minneapolis and St. Paul. The city is situated along the Straight River, which flows through the city from north to south. The city is located in a flat, open area of the Minnesota River Valley.
The city has a total area of 11.2 square miles, of which 11.1 square miles is land and 0.1 square miles is water. The city is located in the Central Hardwood Forest ecoregion, which is characterized by deciduous forests of oak, maple, and other hardwood trees.
Economy
Owatonna’s economy is largely based on manufacturing and agriculture. The city is home to several large manufacturing companies, including the Owatonna Tool Company, which produces tools and other industrial equipment; the Owatonna Manufacturing Company, which produces farm equipment; and the Owatonna Chair Company, which produces furniture.
The city is also home to several agricultural companies, including the Owatonna Grain Company, which produces grain and other agricultural products; the Owatonna Dairy Company, which produces dairy products; and the Owatonna Livestock Company, which produces livestock.
Demographics
As of the 2010 census, the population of Owatonna was 25,599. The racial makeup of the city was 92.3% White, 2.2% African American, 0.5% Native American, 1.7% Asian, 0.1% Pacific Islander, 1.7% from other races, and 2.5% from two or more races. Hispanic or Latino of any race were 4.3% of the population.
The median household income in Owatonna was $50,945, and the median family income was $62,917. The per capita income for the city was $25,945. About 8.2% of families and 11.2% of the population were below the poverty line, including 15.2% of those under age 18 and 8.2% of those age 65 or over.
Common Questions
What is Per Capita Income in Owatonna?
Per Capita income in Owatonna is $40,889.
What is the Median Family Income in Owatonna?
Median Family Income in Owatonna is $103,829.
What is the Median Household income in Owatonna?
Median Household Income in Owatonna is $78,295.
What is Income or Wage Gap in Owatonna?
Income or Wage Gap in Owatonna is 32.7%.
Women in Owatonna earn 67.3 cents for every dollar earned by a man.
What is Family Income Deficit in Owatonna?
Family Income Deficit in Owatonna is $11,219.
Families that are below poverty line in Owatonna earn $11,219 less on average than the poverty threshold level.
What is Inequality or Gini Index in Owatonna?
Inequality or Gini Index in Owatonna is 0.44.
What is the Total Population of Owatonna?
Total Population of Owatonna is 26,400.
What is the Total Male Population of Owatonna?
Total Male Population of Owatonna is 13,170.
What is the Total Female Population of Owatonna?
Total Female Population of Owatonna is 13,230.
What is the Ratio of Males per 100 Females in Owatonna?
There are 99.55 Males per 100 Females in Owatonna.
What is the Ratio of Females per 100 Males in Owatonna?
There are 100.46 Females per 100 Males in Owatonna.
What is the Median Population Age in Owatonna?
Median Population Age in Owatonna is 40.0 Years.
What is the Average Family Size in Owatonna
Average Family Size in Owatonna is 3.0 People.
What is the Average Household Size in Owatonna
Average Household Size in Owatonna is 2.4 People.
How Large is the Labor Force in Owatonna?
There are 13,939 People in the Labor Forcein in Owatonna.
What is the Percentage of People in the Labor Force in Owatonna?
67.3% of People are in the Labor Force in Owatonna.
What is the Unemployment Rate in Owatonna?
Unemployment Rate in Owatonna is 3.6%.