Woodbury, MN Map & Demographics
Woodbury Map
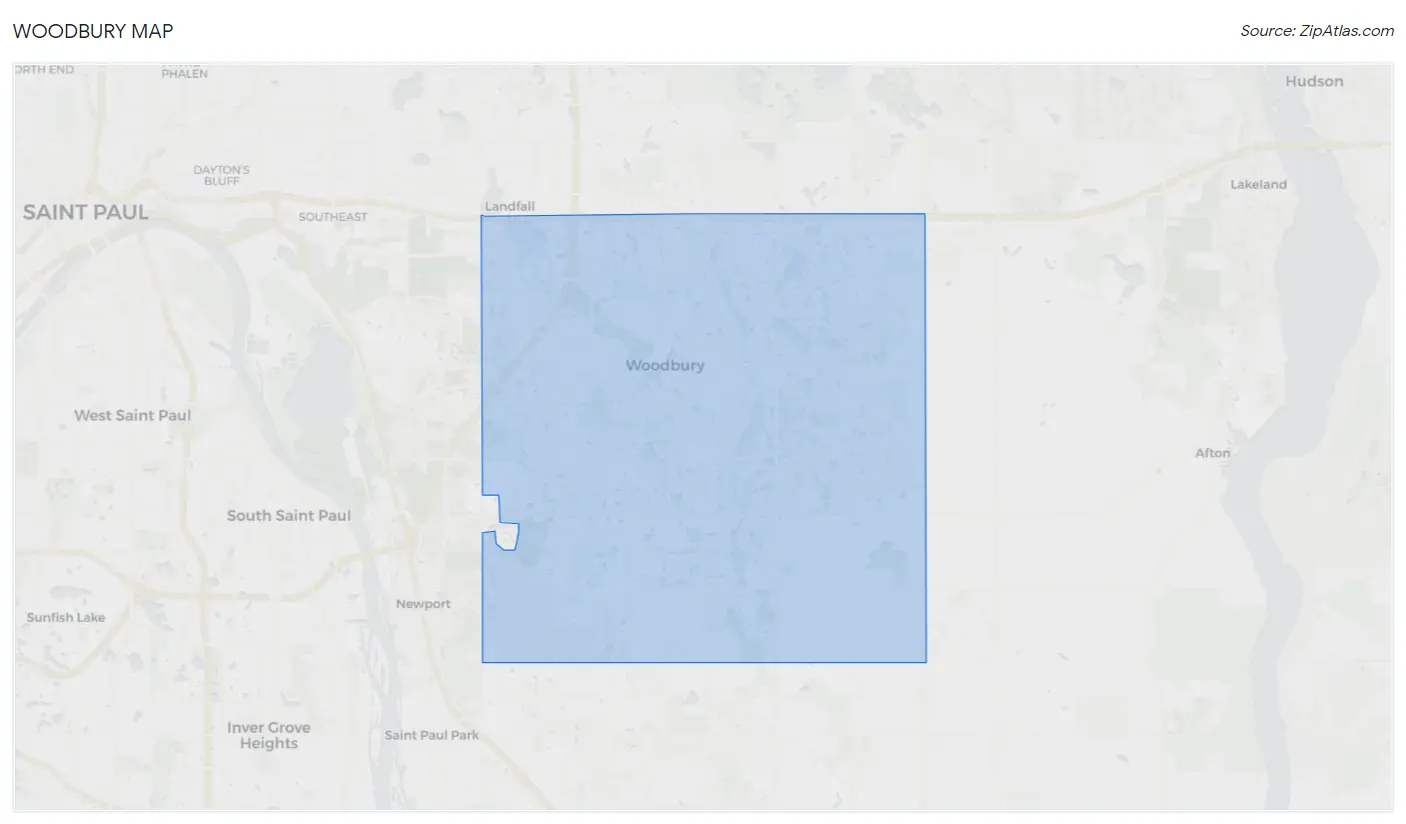
Woodbury Overview
$58,891
PER CAPITA INCOME
$148,164
AVG FAMILY INCOME
$125,097
AVG HOUSEHOLD INCOME
34.3%
WAGE / INCOME GAP [ % ]
65.7¢/ $1
WAGE / INCOME GAP [ $ ]
$11,084
FAMILY INCOME DEFICIT
0.41
INEQUALITY / GINI INDEX
75,549
TOTAL POPULATION
37,558
MALE POPULATION
37,991
FEMALE POPULATION
98.86
MALES / 100 FEMALES
101.15
FEMALES / 100 MALES
38.0
MEDIAN AGE
3.2
AVG FAMILY SIZE
2.7
AVG HOUSEHOLD SIZE
42,630
LABOR FORCE [ PEOPLE ]
73.6%
PERCENT IN LABOR FORCE
3.2%
UNEMPLOYMENT RATE
Woodbury Area Codes
Income in Woodbury
Income Overview in Woodbury
Per Capita Income in Woodbury is $58,891, while median incomes of families and households are $148,164 and $125,097 respectively.
| Characteristic | Number | Measure |
| Per Capita Income | 75,549 | $58,891 |
| Median Family Income | 20,237 | $148,164 |
| Mean Family Income | 20,237 | $177,169 |
| Median Household Income | 28,207 | $125,097 |
| Mean Household Income | 28,207 | $156,224 |
| Income Deficit | 20,237 | $11,084 |
| Wage / Income Gap (%) | 75,549 | 34.27% |
| Wage / Income Gap ($) | 75,549 | 65.73¢ per $1 |
| Gini / Inequality Index | 75,549 | 0.41 |
Earnings by Sex in Woodbury
Average Earnings in Woodbury are $63,670, $77,928 for men and $51,225 for women, a difference of 34.3%.
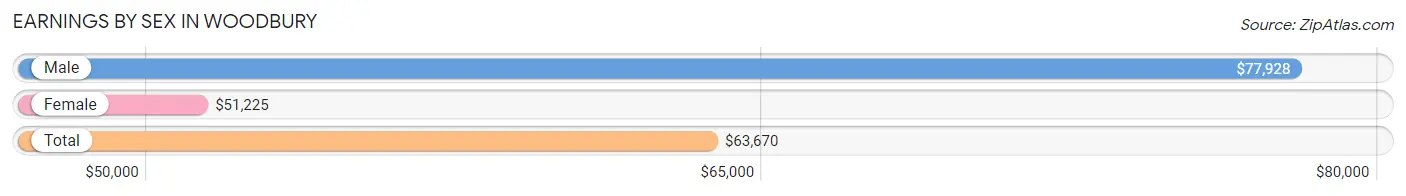
| Sex | Number | Average Earnings |
| Male | 22,717 (51.5%) | $77,928 |
| Female | 21,400 (48.5%) | $51,225 |
| Total | 44,117 (100.0%) | $63,670 |
Earnings by Sex by Income Bracket in Woodbury
The most common earnings brackets in Woodbury are $100,000+ for men (8,653 | 38.1%) and $100,000+ for women (4,186 | 19.6%).
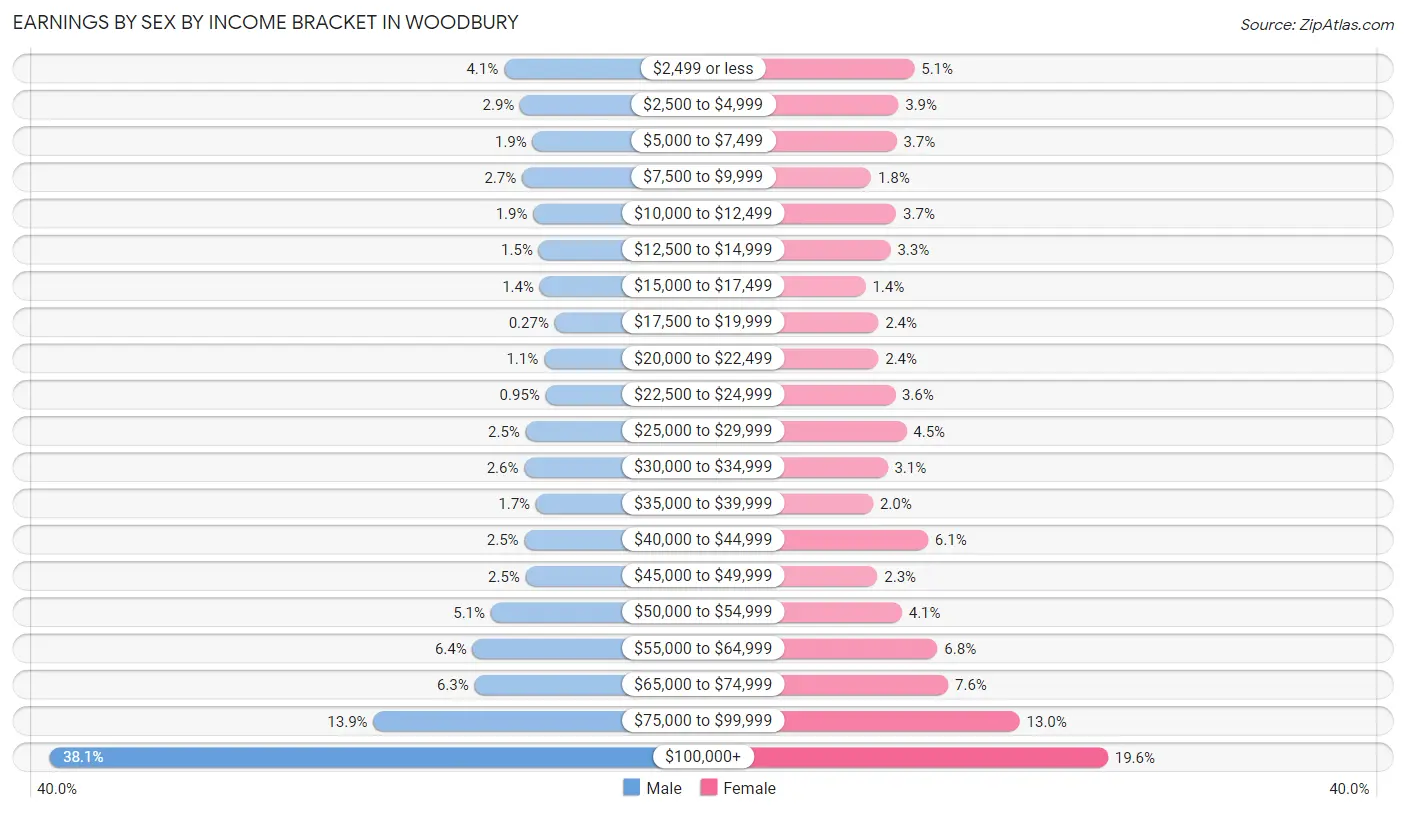
| Income | Male | Female |
| $2,499 or less | 925 (4.1%) | 1,083 (5.1%) |
| $2,500 to $4,999 | 650 (2.9%) | 826 (3.9%) |
| $5,000 to $7,499 | 438 (1.9%) | 797 (3.7%) |
| $7,500 to $9,999 | 617 (2.7%) | 387 (1.8%) |
| $10,000 to $12,499 | 428 (1.9%) | 792 (3.7%) |
| $12,500 to $14,999 | 333 (1.5%) | 699 (3.3%) |
| $15,000 to $17,499 | 316 (1.4%) | 299 (1.4%) |
| $17,500 to $19,999 | 62 (0.3%) | 505 (2.4%) |
| $20,000 to $22,499 | 243 (1.1%) | 505 (2.4%) |
| $22,500 to $24,999 | 216 (0.9%) | 772 (3.6%) |
| $25,000 to $29,999 | 557 (2.5%) | 955 (4.5%) |
| $30,000 to $34,999 | 580 (2.5%) | 652 (3.0%) |
| $35,000 to $39,999 | 381 (1.7%) | 420 (2.0%) |
| $40,000 to $44,999 | 576 (2.5%) | 1,302 (6.1%) |
| $45,000 to $49,999 | 557 (2.5%) | 489 (2.3%) |
| $50,000 to $54,999 | 1,149 (5.1%) | 882 (4.1%) |
| $55,000 to $64,999 | 1,461 (6.4%) | 1,453 (6.8%) |
| $65,000 to $74,999 | 1,427 (6.3%) | 1,625 (7.6%) |
| $75,000 to $99,999 | 3,148 (13.9%) | 2,771 (13.0%) |
| $100,000+ | 8,653 (38.1%) | 4,186 (19.6%) |
| Total | 22,717 (100.0%) | 21,400 (100.0%) |
Earnings by Sex by Educational Attainment in Woodbury
Average earnings in Woodbury are $89,545 for men and $58,434 for women, a difference of 34.7%. Men with an educational attainment of graduate degree enjoy the highest average annual earnings of $130,833, while those with less than high school education earn the least with $40,066. Women with an educational attainment of graduate degree earn the most with the average annual earnings of $88,248, while those with high school diploma education have the smallest earnings of $27,079.
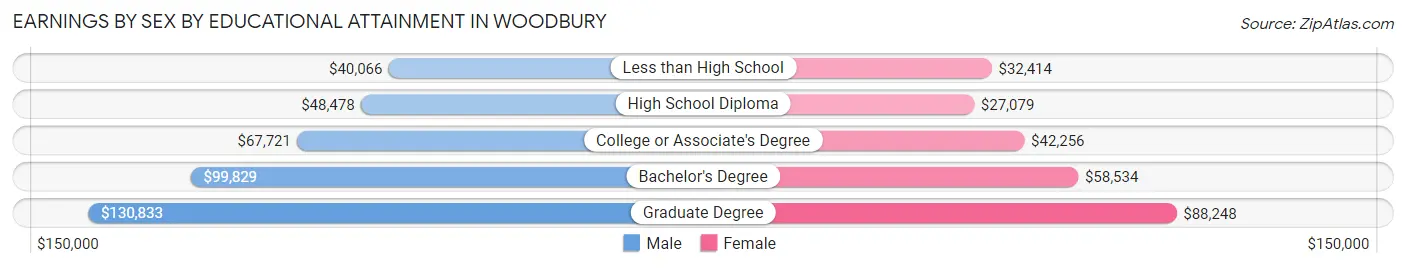
| Educational Attainment | Male Income | Female Income |
| Less than High School | $40,066 | $32,414 |
| High School Diploma | $48,478 | $27,079 |
| College or Associate's Degree | $67,721 | $42,256 |
| Bachelor's Degree | $99,829 | $58,534 |
| Graduate Degree | $130,833 | $88,248 |
| Total | $89,545 | $58,434 |
Family Income in Woodbury
Family Income Brackets in Woodbury
According to the Woodbury family income data, there are 5,950 families falling into the $200,000+ income range, which is the most common income bracket and makes up 29.4% of all families. Conversely, the $10,000 to $14,999 income bracket is the least frequent group with only 61 families (0.3%) belonging to this category.
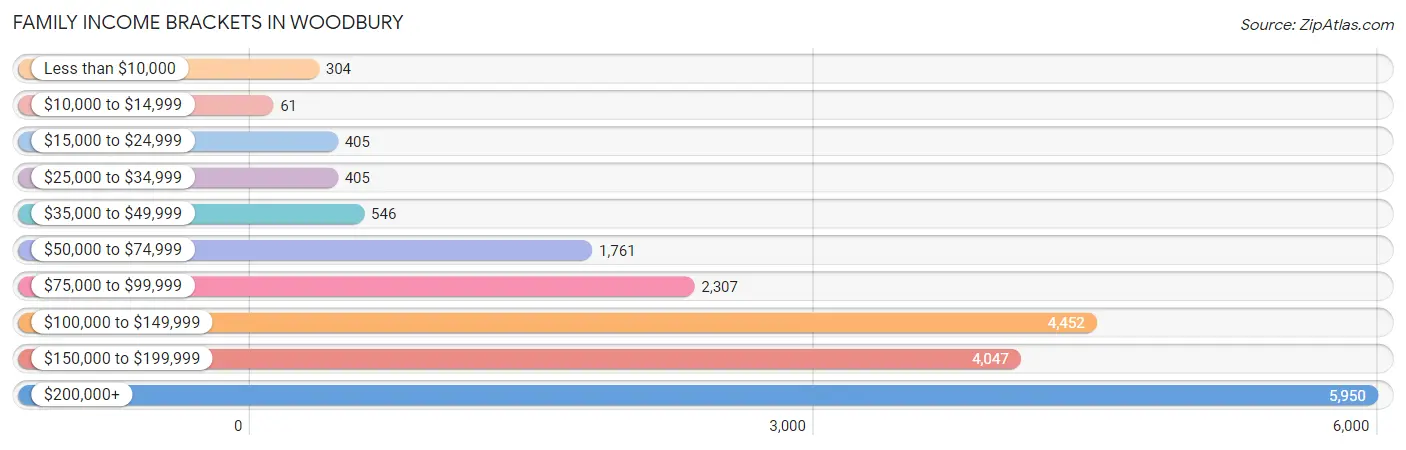
| Income Bracket | # Families | % Families |
| Less than $10,000 | 304 | 1.5% |
| $10,000 to $14,999 | 61 | 0.3% |
| $15,000 to $24,999 | 405 | 2.0% |
| $25,000 to $34,999 | 405 | 2.0% |
| $35,000 to $49,999 | 546 | 2.7% |
| $50,000 to $74,999 | 1,761 | 8.7% |
| $75,000 to $99,999 | 2,307 | 11.4% |
| $100,000 to $149,999 | 4,452 | 22.0% |
| $150,000 to $199,999 | 4,047 | 20.0% |
| $200,000+ | 5,950 | 29.4% |
Family Income by Famaliy Size in Woodbury
5-person families (1,843 | 9.1%) account for the highest median family income in Woodbury with $188,551 per family, while 2-person families (8,704 | 43.0%) have the highest median income of $56,930 per family member.
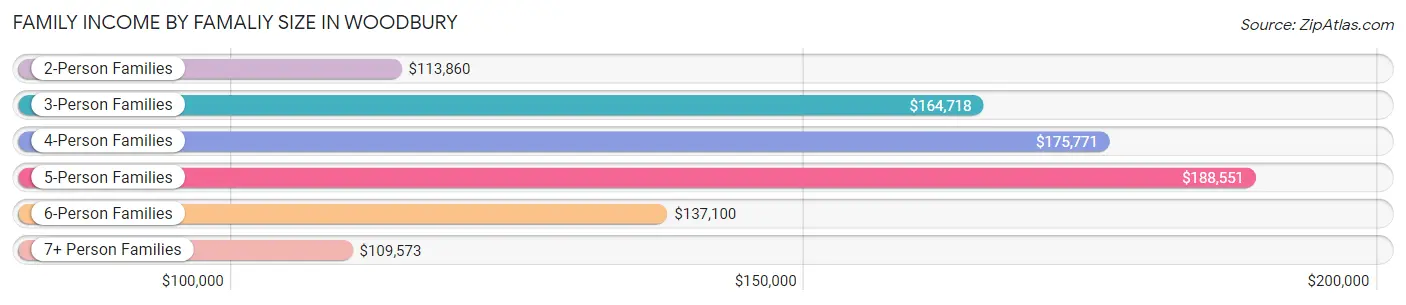
| Income Bracket | # Families | Median Income |
| 2-Person Families | 8,704 (43.0%) | $113,860 |
| 3-Person Families | 4,240 (20.9%) | $164,718 |
| 4-Person Families | 4,669 (23.1%) | $175,771 |
| 5-Person Families | 1,843 (9.1%) | $188,551 |
| 6-Person Families | 503 (2.5%) | $137,100 |
| 7+ Person Families | 278 (1.4%) | $109,573 |
| Total | 20,237 (100.0%) | $148,164 |
Family Income by Number of Earners in Woodbury
The median family income in Woodbury is $148,164, with families comprising 3+ earners (2,497) having the highest median family income of $196,585, while families with no earners (2,075) have the lowest median family income of $85,257, accounting for 12.3% and 10.2% of families, respectively.
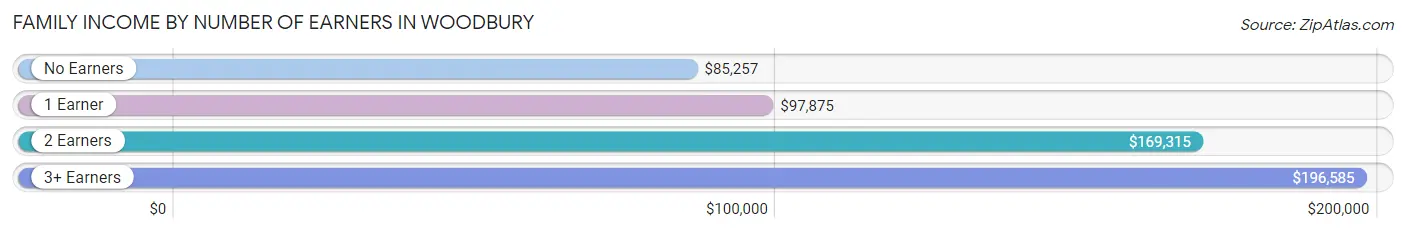
| Number of Earners | # Families | Median Income |
| No Earners | 2,075 (10.2%) | $85,257 |
| 1 Earner | 4,801 (23.7%) | $97,875 |
| 2 Earners | 10,864 (53.7%) | $169,315 |
| 3+ Earners | 2,497 (12.3%) | $196,585 |
| Total | 20,237 (100.0%) | $148,164 |
Household Income in Woodbury
Household Income Brackets in Woodbury
With 6,741 households falling in the category, the $200,000+ income range is the most frequent in Woodbury, accounting for 23.9% of all households. In contrast, only 423 households (1.5%) fall into the less than $10,000 income bracket, making it the least populous group.
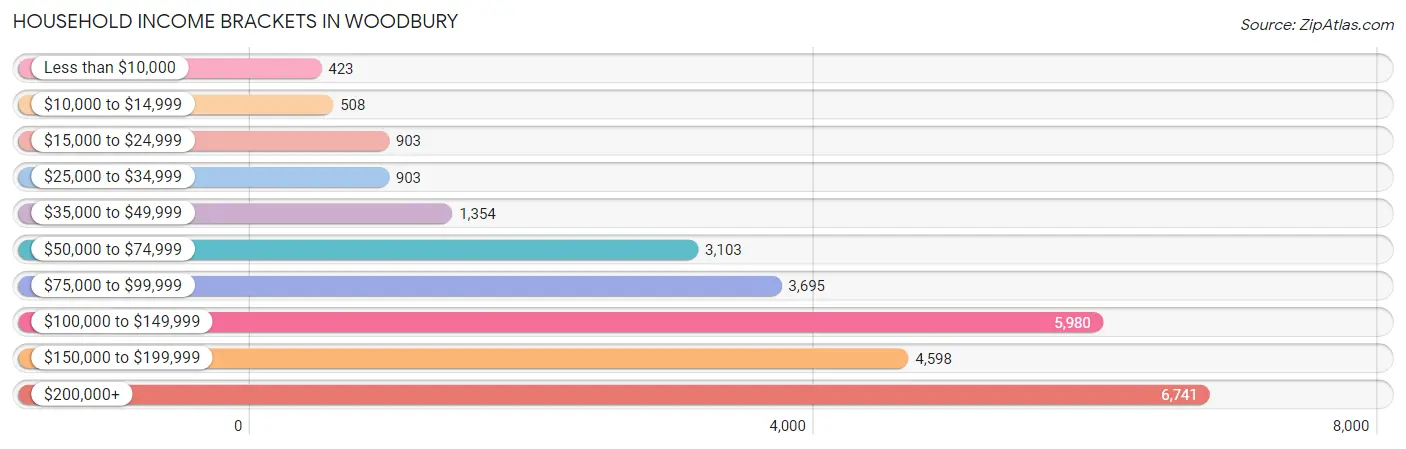
| Income Bracket | # Households | % Households |
| Less than $10,000 | 423 | 1.5% |
| $10,000 to $14,999 | 508 | 1.8% |
| $15,000 to $24,999 | 903 | 3.2% |
| $25,000 to $34,999 | 903 | 3.2% |
| $35,000 to $49,999 | 1,354 | 4.8% |
| $50,000 to $74,999 | 3,103 | 11.0% |
| $75,000 to $99,999 | 3,695 | 13.1% |
| $100,000 to $149,999 | 5,980 | 21.2% |
| $150,000 to $199,999 | 4,598 | 16.3% |
| $200,000+ | 6,741 | 23.9% |
Household Income by Householder Age in Woodbury
The median household income in Woodbury is $125,097, with the highest median household income of $160,925 found in the 45 to 64 years age bracket for the primary householder. A total of 11,671 households (41.4%) fall into this category. Meanwhile, the 65+ years age bracket for the primary householder has the lowest median household income of $79,089, with 5,964 households (21.1%) in this group.
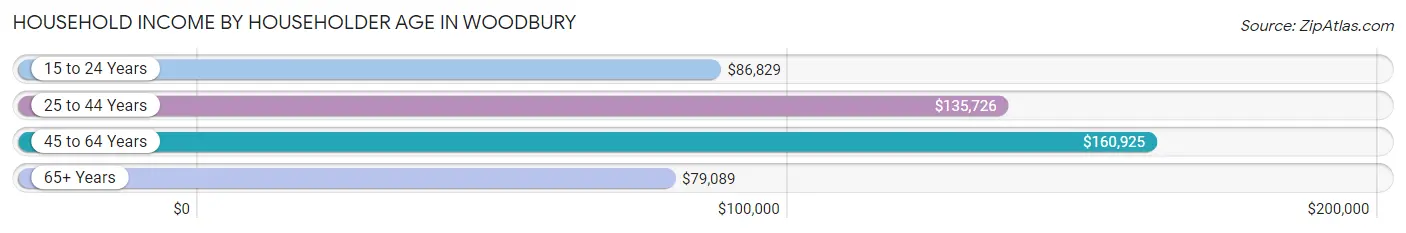
| Income Bracket | # Households | Median Income |
| 15 to 24 Years | 1,100 (3.9%) | $86,829 |
| 25 to 44 Years | 9,472 (33.6%) | $135,726 |
| 45 to 64 Years | 11,671 (41.4%) | $160,925 |
| 65+ Years | 5,964 (21.1%) | $79,089 |
| Total | 28,207 (100.0%) | $125,097 |
Poverty in Woodbury
Income Below Poverty by Sex and Age in Woodbury
With 4.0% poverty level for males and 4.5% for females among the residents of Woodbury, 5 year old males and under 5 year old females are the most vulnerable to poverty, with 103 males (19.9%) and 120 females (6.3%) in their respective age groups living below the poverty level.
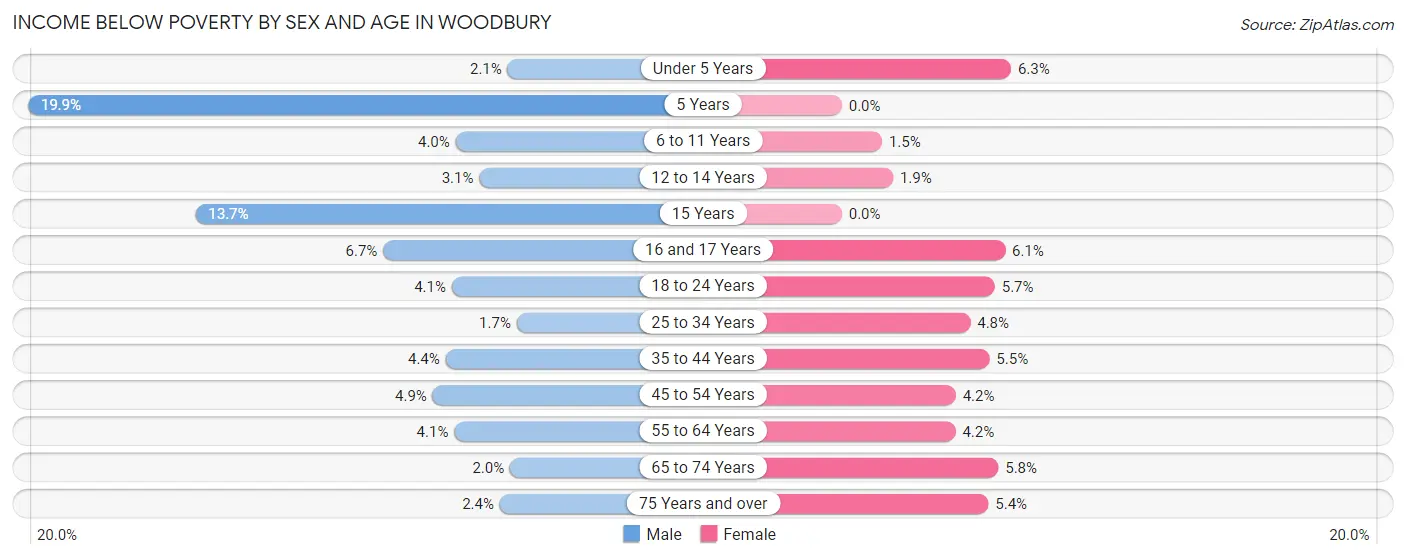
| Age Bracket | Male | Female |
| Under 5 Years | 43 (2.1%) | 120 (6.3%) |
| 5 Years | 103 (19.9%) | 0 (0.0%) |
| 6 to 11 Years | 178 (4.0%) | 45 (1.5%) |
| 12 to 14 Years | 58 (3.1%) | 32 (1.9%) |
| 15 Years | 66 (13.7%) | 0 (0.0%) |
| 16 and 17 Years | 98 (6.7%) | 51 (6.1%) |
| 18 to 24 Years | 116 (4.1%) | 182 (5.7%) |
| 25 to 34 Years | 68 (1.7%) | 208 (4.8%) |
| 35 to 44 Years | 240 (4.4%) | 323 (5.5%) |
| 45 to 54 Years | 261 (4.9%) | 226 (4.2%) |
| 55 to 64 Years | 189 (4.1%) | 208 (4.2%) |
| 65 to 74 Years | 55 (2.0%) | 204 (5.8%) |
| 75 Years and over | 34 (2.4%) | 92 (5.4%) |
| Total | 1,509 (4.0%) | 1,691 (4.5%) |
Income Above Poverty by Sex and Age in Woodbury
According to the poverty statistics in Woodbury, males aged 25 to 34 years and females aged 5 years are the age groups that are most secure financially, with 98.3% of males and 100.0% of females in these age groups living above the poverty line.
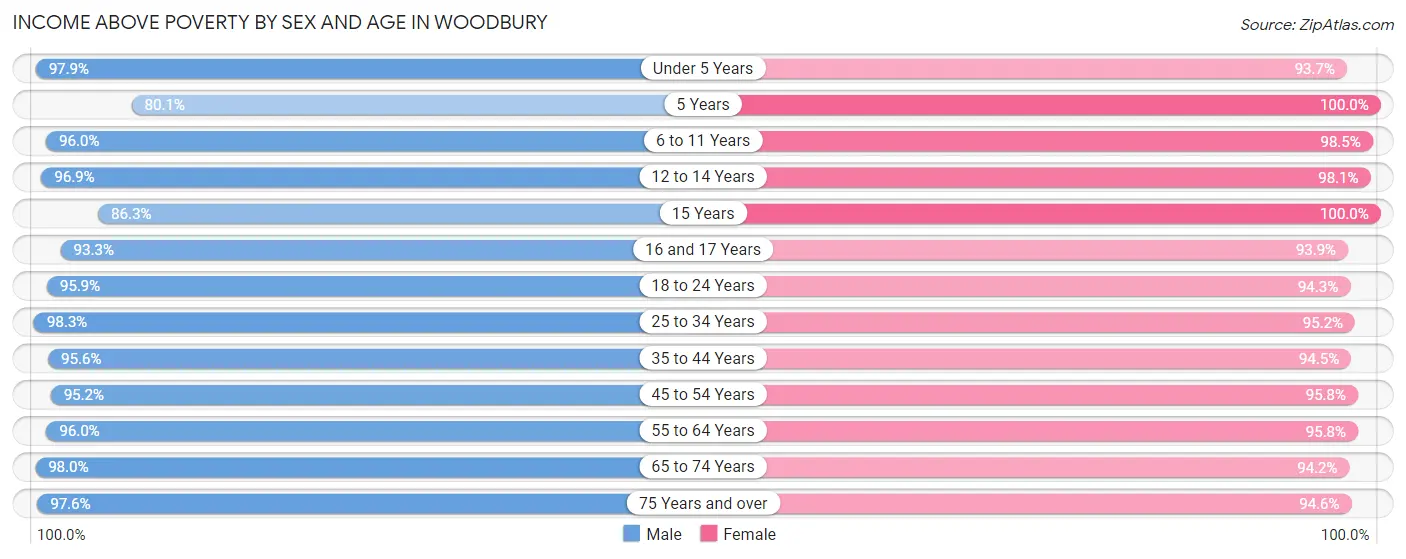
| Age Bracket | Male | Female |
| Under 5 Years | 2,031 (97.9%) | 1,790 (93.7%) |
| 5 Years | 415 (80.1%) | 687 (100.0%) |
| 6 to 11 Years | 4,275 (96.0%) | 2,967 (98.5%) |
| 12 to 14 Years | 1,798 (96.9%) | 1,656 (98.1%) |
| 15 Years | 417 (86.3%) | 681 (100.0%) |
| 16 and 17 Years | 1,367 (93.3%) | 790 (93.9%) |
| 18 to 24 Years | 2,686 (95.9%) | 3,023 (94.3%) |
| 25 to 34 Years | 3,872 (98.3%) | 4,150 (95.2%) |
| 35 to 44 Years | 5,254 (95.6%) | 5,571 (94.5%) |
| 45 to 54 Years | 5,121 (95.2%) | 5,112 (95.8%) |
| 55 to 64 Years | 4,473 (96.0%) | 4,720 (95.8%) |
| 65 to 74 Years | 2,717 (98.0%) | 3,306 (94.2%) |
| 75 Years and over | 1,408 (97.6%) | 1,598 (94.6%) |
| Total | 35,834 (96.0%) | 36,051 (95.5%) |
Income Below Poverty Among Married-Couple Families in Woodbury
The poverty statistics for married-couple families in Woodbury show that 1.7% or 284 of the total 16,941 families live below the poverty line. Families with 1 or 2 children have the highest poverty rate of 3.1%, comprising of 204 families. On the other hand, families with 3 or 4 children have the lowest poverty rate of 0.0%, which includes 0 families.
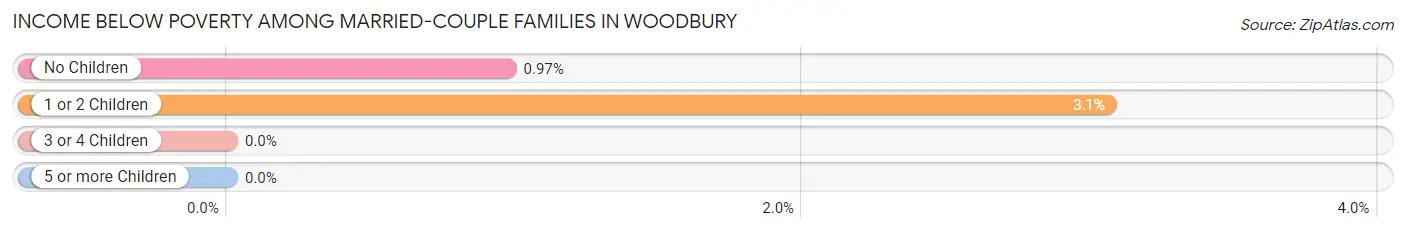
| Children | Above Poverty | Below Poverty |
| No Children | 8,199 (99.0%) | 80 (1.0%) |
| 1 or 2 Children | 6,469 (96.9%) | 204 (3.1%) |
| 3 or 4 Children | 1,881 (100.0%) | 0 (0.0%) |
| 5 or more Children | 108 (100.0%) | 0 (0.0%) |
| Total | 16,657 (98.3%) | 284 (1.7%) |
Income Below Poverty Among Single-Parent Households in Woodbury
According to the poverty data in Woodbury, 6.0% or 58 single-father households and 13.4% or 311 single-mother households are living below the poverty line. Among single-father households, those with 1 or 2 children have the highest poverty rate, with 58 households (11.9%) experiencing poverty. Likewise, among single-mother households, those with 3 or 4 children have the highest poverty rate, with 35 households (21.3%) falling below the poverty line.
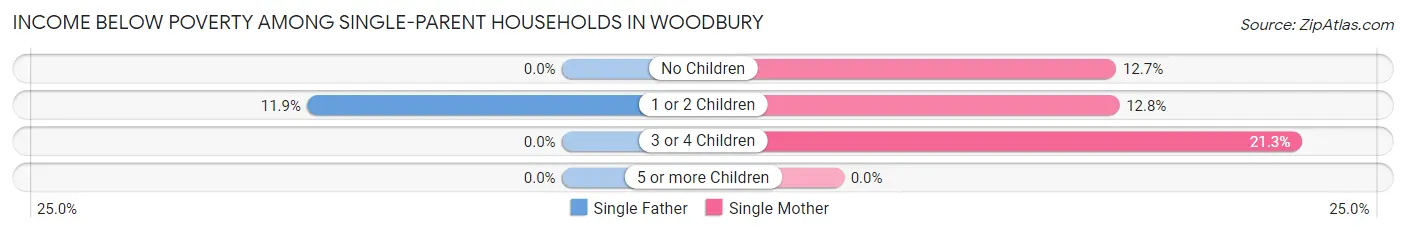
| Children | Single Father | Single Mother |
| No Children | 0 (0.0%) | 155 (12.7%) |
| 1 or 2 Children | 58 (11.9%) | 121 (12.8%) |
| 3 or 4 Children | 0 (0.0%) | 35 (21.3%) |
| 5 or more Children | 0 (0.0%) | 0 (0.0%) |
| Total | 58 (6.0%) | 311 (13.4%) |
Income Below Poverty Among Married-Couple vs Single-Parent Households in Woodbury
The poverty data for Woodbury shows that 284 of the married-couple family households (1.7%) and 369 of the single-parent households (11.2%) are living below the poverty level. Within the married-couple family households, those with 1 or 2 children have the highest poverty rate, with 204 households (3.1%) falling below the poverty line. Among the single-parent households, those with 3 or 4 children have the highest poverty rate, with 35 household (13.4%) living below poverty.
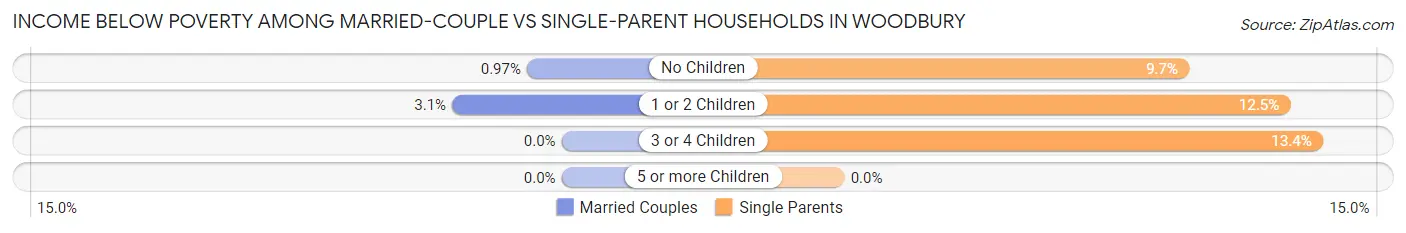
| Children | Married-Couple Families | Single-Parent Households |
| No Children | 80 (1.0%) | 155 (9.7%) |
| 1 or 2 Children | 204 (3.1%) | 179 (12.5%) |
| 3 or 4 Children | 0 (0.0%) | 35 (13.4%) |
| 5 or more Children | 0 (0.0%) | 0 (0.0%) |
| Total | 284 (1.7%) | 369 (11.2%) |
Race in Woodbury
The most populous races in Woodbury are White / Caucasian (57,673 | 76.3%), Asian (9,244 | 12.2%), and Black / African American (3,776 | 5.0%).
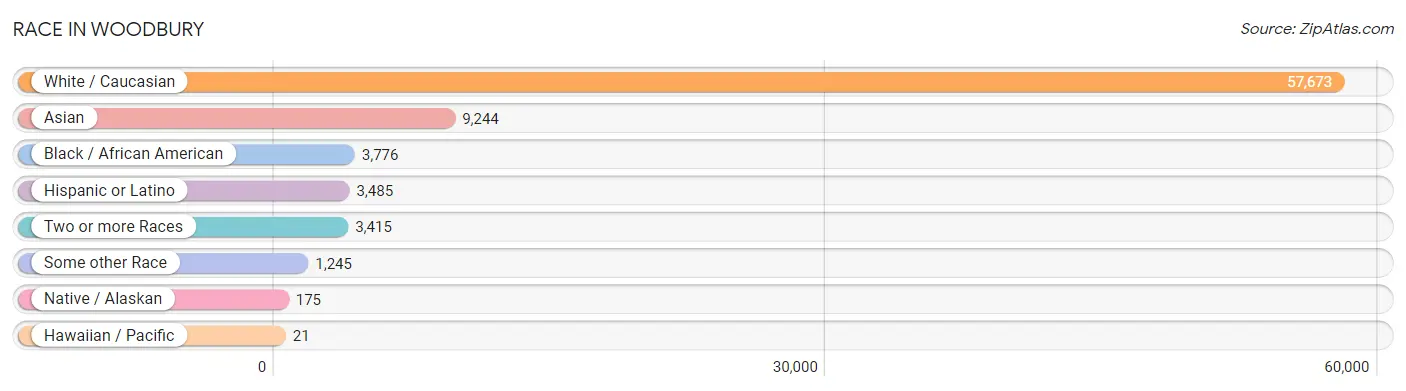
| Race | # Population | % Population |
| Asian | 9,244 | 12.2% |
| Black / African American | 3,776 | 5.0% |
| Hawaiian / Pacific | 21 | 0.0% |
| Hispanic or Latino | 3,485 | 4.6% |
| Native / Alaskan | 175 | 0.2% |
| White / Caucasian | 57,673 | 76.3% |
| Two or more Races | 3,415 | 4.5% |
| Some other Race | 1,245 | 1.7% |
| Total | 75,549 | 100.0% |
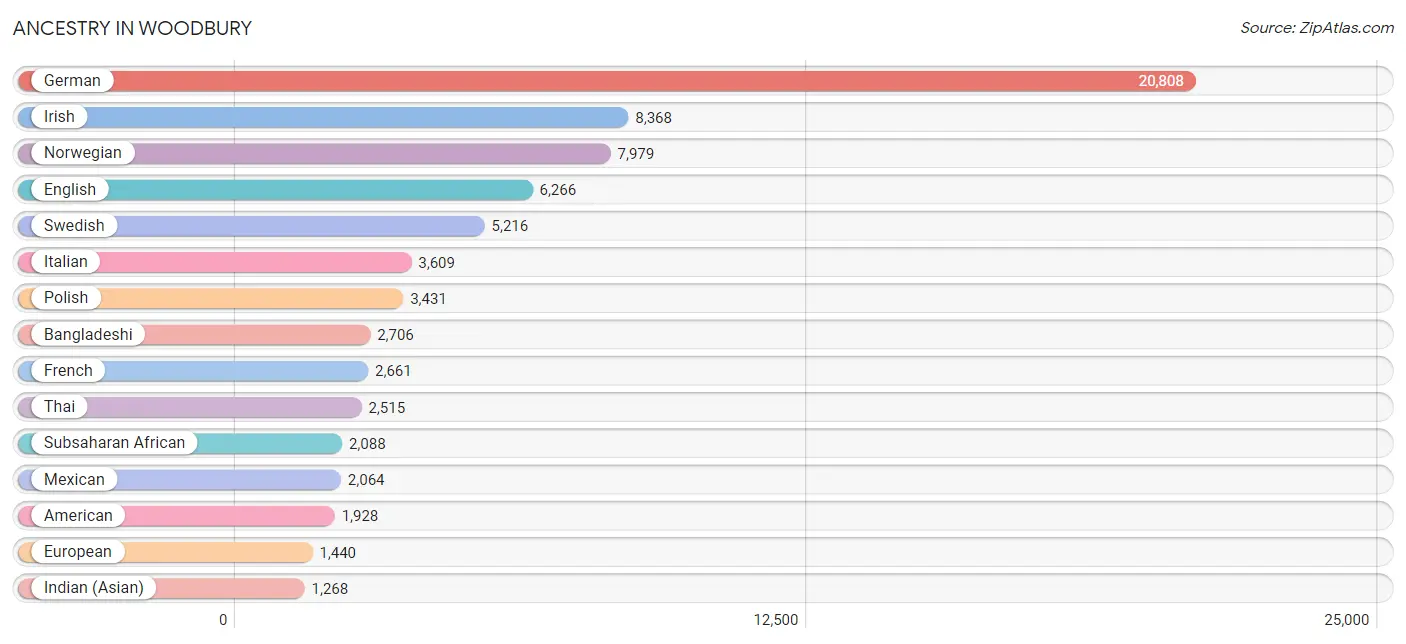
Ancestry in Woodbury
The most populous ancestries reported in Woodbury are German (20,808 | 27.5%), Irish (8,368 | 11.1%), Norwegian (7,979 | 10.6%), English (6,266 | 8.3%), and Swedish (5,216 | 6.9%), together accounting for 64.4% of all Woodbury residents.
| Ancestry | # Population | % Population |
| African | 116 | 0.2% |
| Albanian | 58 | 0.1% |
| American | 1,928 | 2.5% |
| Apache | 14 | 0.0% |
| Arab | 604 | 0.8% |
| Argentinean | 36 | 0.1% |
| Austrian | 270 | 0.4% |
| Bangladeshi | 2,706 | 3.6% |
| Belgian | 399 | 0.5% |
| Bhutanese | 262 | 0.4% |
| Blackfeet | 49 | 0.1% |
| Brazilian | 13 | 0.0% |
| British | 236 | 0.3% |
| British West Indian | 15 | 0.0% |
| Bulgarian | 62 | 0.1% |
| Burmese | 946 | 1.3% |
| Cambodian | 76 | 0.1% |
| Canadian | 65 | 0.1% |
| Celtic | 52 | 0.1% |
| Central American | 306 | 0.4% |
| Cherokee | 50 | 0.1% |
| Chilean | 54 | 0.1% |
| Chippewa | 131 | 0.2% |
| Choctaw | 28 | 0.0% |
| Colombian | 81 | 0.1% |
| Croatian | 146 | 0.2% |
| Cuban | 77 | 0.1% |
| Czech | 1,035 | 1.4% |
| Czechoslovakian | 61 | 0.1% |
| Danish | 834 | 1.1% |
| Dominican | 65 | 0.1% |
| Dutch | 994 | 1.3% |
| Eastern European | 183 | 0.2% |
| Ecuadorian | 35 | 0.1% |
| English | 6,266 | 8.3% |
| Ethiopian | 806 | 1.1% |
| European | 1,440 | 1.9% |
| Filipino | 121 | 0.2% |
| Finnish | 609 | 0.8% |
| French | 2,661 | 3.5% |
| French Canadian | 585 | 0.8% |
| German | 20,808 | 27.5% |
| German Russian | 6 | 0.0% |
| Greek | 146 | 0.2% |
| Guatemalan | 99 | 0.1% |
| Haitian | 10 | 0.0% |
| Honduran | 10 | 0.0% |
| Hungarian | 177 | 0.2% |
| Icelander | 25 | 0.0% |
| Indian (Asian) | 1,268 | 1.7% |
| Iranian | 219 | 0.3% |
| Irish | 8,368 | 11.1% |
| Italian | 3,609 | 4.8% |
| Japanese | 140 | 0.2% |
| Korean | 302 | 0.4% |
| Latvian | 11 | 0.0% |
| Lebanese | 437 | 0.6% |
| Liberian | 189 | 0.3% |
| Lithuanian | 109 | 0.1% |
| Luxembourger | 45 | 0.1% |
| Macedonian | 28 | 0.0% |
| Mexican | 2,064 | 2.7% |
| Mexican American Indian | 22 | 0.0% |
| Moroccan | 90 | 0.1% |
| Native Hawaiian | 41 | 0.1% |
| Nicaraguan | 84 | 0.1% |
| Nigerian | 230 | 0.3% |
| Northern European | 113 | 0.2% |
| Norwegian | 7,979 | 10.6% |
| Pakistani | 15 | 0.0% |
| Palestinian | 53 | 0.1% |
| Panamanian | 4 | 0.0% |
| Pennsylvania German | 6 | 0.0% |
| Peruvian | 137 | 0.2% |
| Polish | 3,431 | 4.5% |
| Portuguese | 111 | 0.2% |
| Pueblo | 27 | 0.0% |
| Puerto Rican | 303 | 0.4% |
| Romanian | 188 | 0.3% |
| Russian | 385 | 0.5% |
| Salvadoran | 109 | 0.1% |
| Scandinavian | 944 | 1.3% |
| Scotch-Irish | 303 | 0.4% |
| Scottish | 824 | 1.1% |
| Serbian | 43 | 0.1% |
| Sioux | 40 | 0.1% |
| Slavic | 13 | 0.0% |
| Slovak | 73 | 0.1% |
| Slovene | 65 | 0.1% |
| Somali | 573 | 0.8% |
| South African | 6 | 0.0% |
| South American | 427 | 0.6% |
| Spaniard | 179 | 0.2% |
| Spanish | 33 | 0.0% |
| Spanish American | 18 | 0.0% |
| Spanish American Indian | 70 | 0.1% |
| Sri Lankan | 1,011 | 1.3% |
| Subsaharan African | 2,088 | 2.8% |
| Sudanese | 65 | 0.1% |
| Swedish | 5,216 | 6.9% |
| Swiss | 355 | 0.5% |
| Syrian | 7 | 0.0% |
| Thai | 2,515 | 3.3% |
| Turkish | 12 | 0.0% |
| Ukrainian | 402 | 0.5% |
| Venezuelan | 84 | 0.1% |
| Welsh | 229 | 0.3% |
| Yugoslavian | 70 | 0.1% | View All 108 Rows |
Immigrants in Woodbury
The most numerous immigrant groups reported in Woodbury came from Asia (5,618 | 7.4%), South Central Asia (2,711 | 3.6%), India (2,058 | 2.7%), Eastern Asia (1,481 | 2.0%), and Latin America (1,389 | 1.8%), together accounting for 17.5% of all Woodbury residents.
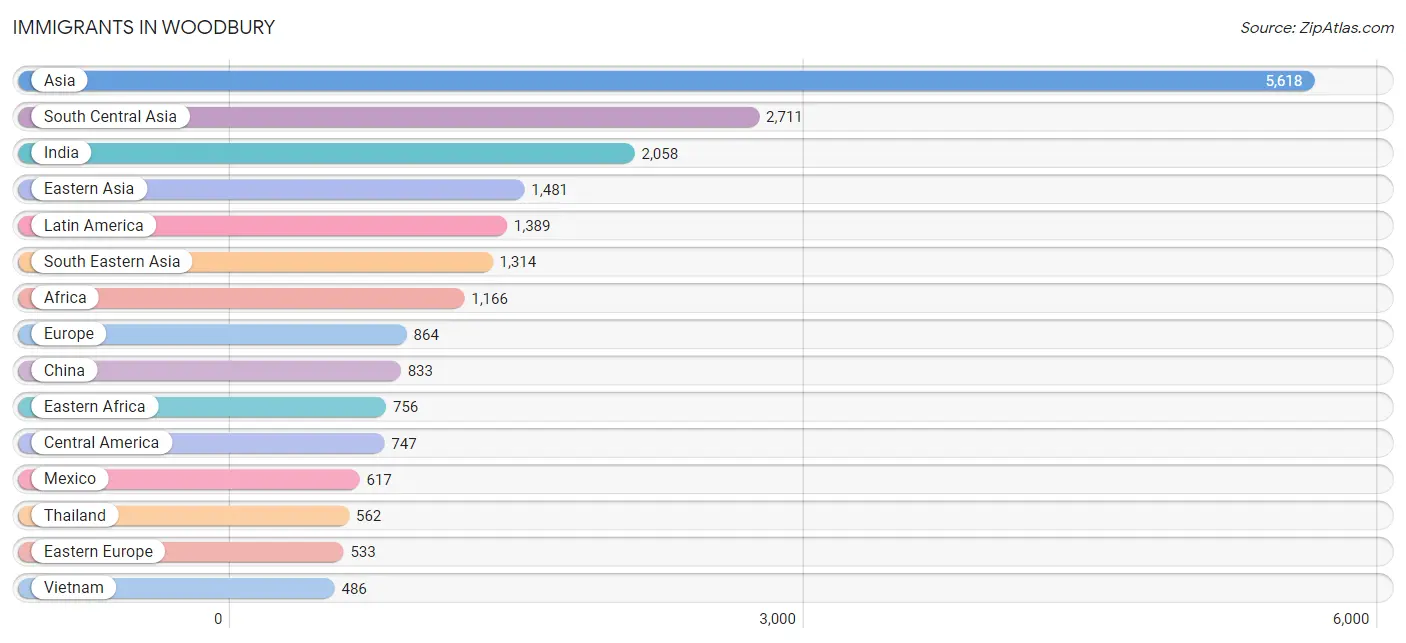
| Immigration Origin | # Population | % Population |
| Africa | 1,166 | 1.5% |
| Argentina | 46 | 0.1% |
| Asia | 5,618 | 7.4% |
| Australia | 53 | 0.1% |
| Bangladesh | 97 | 0.1% |
| Belarus | 3 | 0.0% |
| Belgium | 30 | 0.0% |
| Bosnia and Herzegovina | 70 | 0.1% |
| Brazil | 102 | 0.1% |
| Bulgaria | 62 | 0.1% |
| Cambodia | 25 | 0.0% |
| Cameroon | 22 | 0.0% |
| Canada | 136 | 0.2% |
| Caribbean | 165 | 0.2% |
| Central America | 747 | 1.0% |
| China | 833 | 1.1% |
| Colombia | 71 | 0.1% |
| Croatia | 59 | 0.1% |
| Cuba | 73 | 0.1% |
| Dominican Republic | 58 | 0.1% |
| Eastern Africa | 756 | 1.0% |
| Eastern Asia | 1,481 | 2.0% |
| Eastern Europe | 533 | 0.7% |
| Ecuador | 23 | 0.0% |
| Egypt | 32 | 0.0% |
| El Salvador | 73 | 0.1% |
| England | 20 | 0.0% |
| Eritrea | 104 | 0.1% |
| Ethiopia | 238 | 0.3% |
| Europe | 864 | 1.1% |
| France | 50 | 0.1% |
| Germany | 50 | 0.1% |
| Ghana | 22 | 0.0% |
| Guatemala | 26 | 0.0% |
| Guyana | 21 | 0.0% |
| Haiti | 10 | 0.0% |
| Hong Kong | 135 | 0.2% |
| India | 2,058 | 2.7% |
| Indonesia | 8 | 0.0% |
| Iran | 111 | 0.2% |
| Ireland | 12 | 0.0% |
| Israel | 10 | 0.0% |
| Italy | 5 | 0.0% |
| Japan | 178 | 0.2% |
| Kenya | 106 | 0.1% |
| Korea | 448 | 0.6% |
| Laos | 78 | 0.1% |
| Latin America | 1,389 | 1.8% |
| Lebanon | 34 | 0.1% |
| Liberia | 32 | 0.0% |
| Mexico | 617 | 0.8% |
| Middle Africa | 22 | 0.0% |
| Moldova | 48 | 0.1% |
| Morocco | 46 | 0.1% |
| Nepal | 45 | 0.1% |
| Netherlands | 9 | 0.0% |
| Nicaragua | 29 | 0.0% |
| Nigeria | 162 | 0.2% |
| Northern Africa | 126 | 0.2% |
| Northern Europe | 134 | 0.2% |
| Norway | 15 | 0.0% |
| Oceania | 53 | 0.1% |
| Pakistan | 372 | 0.5% |
| Panama | 2 | 0.0% |
| Peru | 176 | 0.2% |
| Philippines | 155 | 0.2% |
| Poland | 109 | 0.1% |
| Portugal | 10 | 0.0% |
| Romania | 27 | 0.0% |
| Russia | 71 | 0.1% |
| Somalia | 270 | 0.4% |
| South Africa | 6 | 0.0% |
| South America | 477 | 0.6% |
| South Central Asia | 2,711 | 3.6% |
| South Eastern Asia | 1,314 | 1.7% |
| Southern Europe | 15 | 0.0% |
| Sri Lanka | 28 | 0.0% |
| Sudan | 48 | 0.1% |
| Sweden | 7 | 0.0% |
| Switzerland | 12 | 0.0% |
| Taiwan | 132 | 0.2% |
| Thailand | 562 | 0.7% |
| Trinidad and Tobago | 24 | 0.0% |
| Turkey | 12 | 0.0% |
| Ukraine | 63 | 0.1% |
| Venezuela | 23 | 0.0% |
| Vietnam | 486 | 0.6% |
| Western Africa | 231 | 0.3% |
| Western Asia | 94 | 0.1% |
| Western Europe | 151 | 0.2% | View All 90 Rows |
Sex and Age in Woodbury
Sex and Age in Woodbury
The most populous age groups in Woodbury are 5 to 9 Years (3,629 | 9.7%) for men and 35 to 39 Years (3,274 | 8.6%) for women.
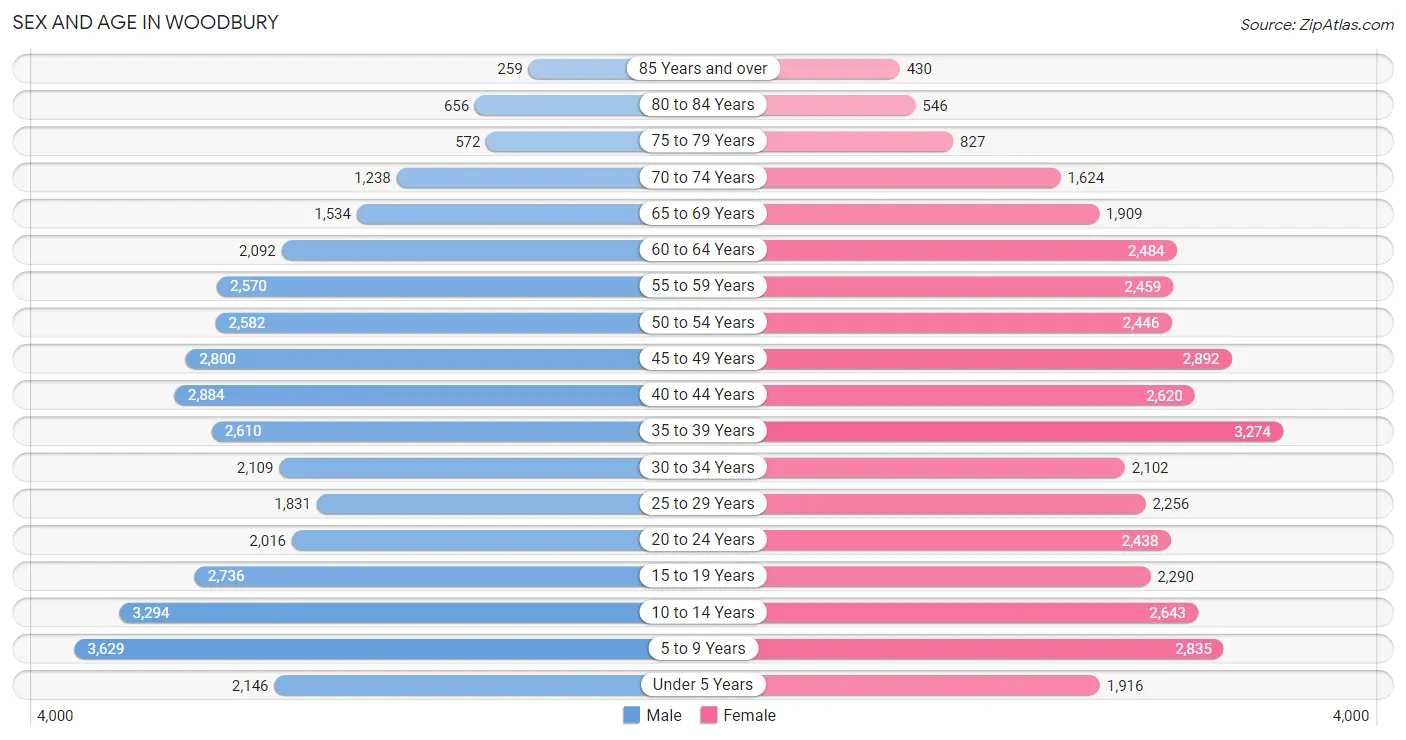
| Age Bracket | Male | Female |
| Under 5 Years | 2,146 (5.7%) | 1,916 (5.0%) |
| 5 to 9 Years | 3,629 (9.7%) | 2,835 (7.5%) |
| 10 to 14 Years | 3,294 (8.8%) | 2,643 (7.0%) |
| 15 to 19 Years | 2,736 (7.3%) | 2,290 (6.0%) |
| 20 to 24 Years | 2,016 (5.4%) | 2,438 (6.4%) |
| 25 to 29 Years | 1,831 (4.9%) | 2,256 (5.9%) |
| 30 to 34 Years | 2,109 (5.6%) | 2,102 (5.5%) |
| 35 to 39 Years | 2,610 (7.0%) | 3,274 (8.6%) |
| 40 to 44 Years | 2,884 (7.7%) | 2,620 (6.9%) |
| 45 to 49 Years | 2,800 (7.5%) | 2,892 (7.6%) |
| 50 to 54 Years | 2,582 (6.9%) | 2,446 (6.4%) |
| 55 to 59 Years | 2,570 (6.8%) | 2,459 (6.5%) |
| 60 to 64 Years | 2,092 (5.6%) | 2,484 (6.5%) |
| 65 to 69 Years | 1,534 (4.1%) | 1,909 (5.0%) |
| 70 to 74 Years | 1,238 (3.3%) | 1,624 (4.3%) |
| 75 to 79 Years | 572 (1.5%) | 827 (2.2%) |
| 80 to 84 Years | 656 (1.8%) | 546 (1.4%) |
| 85 Years and over | 259 (0.7%) | 430 (1.1%) |
| Total | 37,558 (100.0%) | 37,991 (100.0%) |
Families and Households in Woodbury
Median Family Size in Woodbury
The median family size in Woodbury is 3.16 persons per family, with married-couple families (16,941 | 83.7%) accounting for the largest median family size of 3.23 persons per family. On the other hand, single male/father families (967 | 4.8%) represent the smallest median family size with 2.69 persons per family.
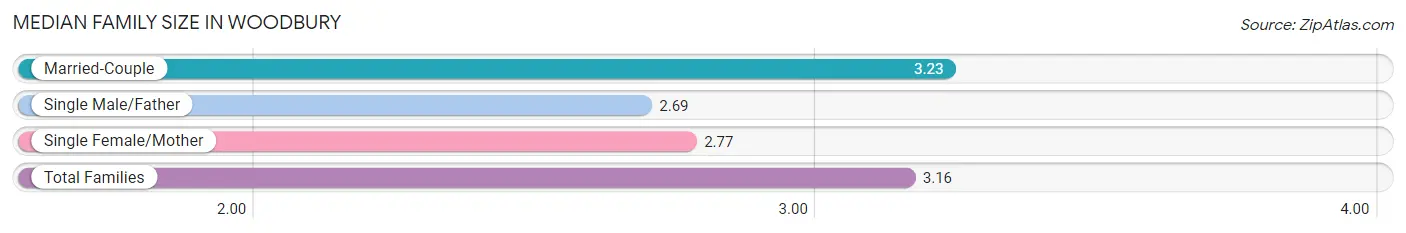
| Family Type | # Families | Family Size |
| Married-Couple | 16,941 (83.7%) | 3.23 |
| Single Male/Father | 967 (4.8%) | 2.69 |
| Single Female/Mother | 2,329 (11.5%) | 2.77 |
| Total Families | 20,237 (100.0%) | 3.16 |
Median Household Size in Woodbury
The median household size in Woodbury is 2.67 persons per household, with married-couple households (16,941 | 60.1%) accounting for the largest median household size of 3.24 persons per household. non-family households (7,970 | 28.3%) represent the smallest median household size with 1.30 persons per household.
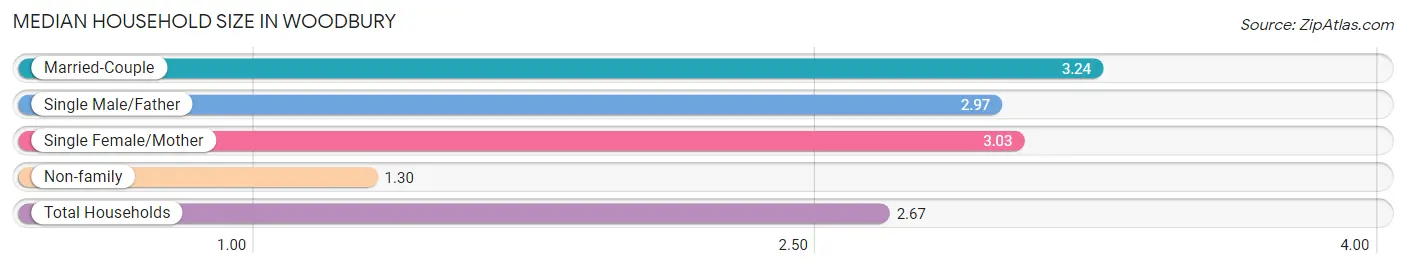
| Household Type | # Households | Household Size |
| Married-Couple | 16,941 (60.1%) | 3.24 |
| Single Male/Father | 967 (3.4%) | 2.97 |
| Single Female/Mother | 2,329 (8.3%) | 3.03 |
| Non-family | 7,970 (28.3%) | 1.30 |
| Total Households | 28,207 (100.0%) | 2.67 |
Household Size by Marriage Status in Woodbury
Out of a total of 28,207 households in Woodbury, 20,237 (71.7%) are family households, while 7,970 (28.3%) are nonfamily households. The most numerous type of family households are 2-person households, comprising 8,198, and the most common type of nonfamily households are 1-person households, comprising 6,018.
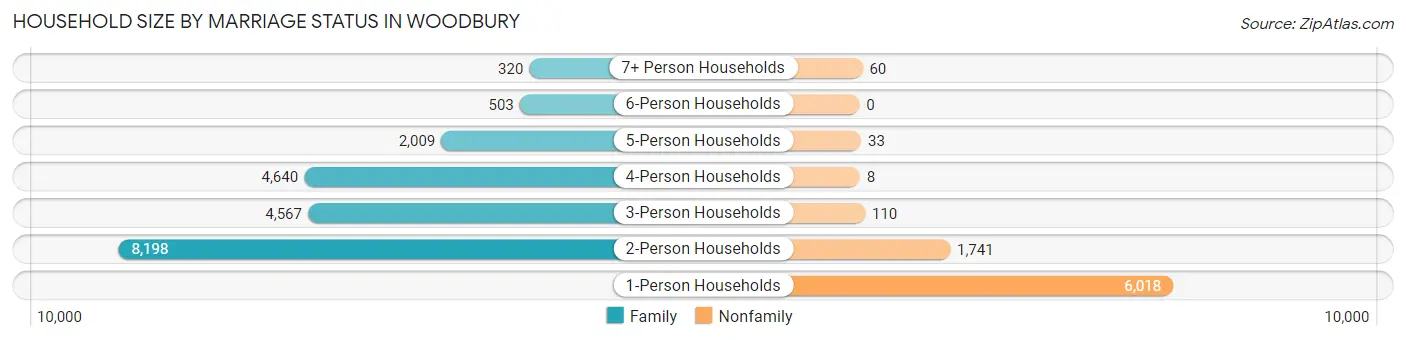
| Household Size | Family Households | Nonfamily Households |
| 1-Person Households | - | 6,018 (21.3%) |
| 2-Person Households | 8,198 (29.1%) | 1,741 (6.2%) |
| 3-Person Households | 4,567 (16.2%) | 110 (0.4%) |
| 4-Person Households | 4,640 (16.5%) | 8 (0.0%) |
| 5-Person Households | 2,009 (7.1%) | 33 (0.1%) |
| 6-Person Households | 503 (1.8%) | 0 (0.0%) |
| 7+ Person Households | 320 (1.1%) | 60 (0.2%) |
| Total | 20,237 (71.7%) | 7,970 (28.3%) |
Female Fertility in Woodbury
Fertility by Age in Woodbury
Average fertility rate in Woodbury is 49.0 births per 1,000 women. Women in the age bracket of 20 to 34 years have the highest fertility rate with 72.0 births per 1,000 women. Women in the age bracket of 20 to 34 years acount for 54.8% of all women with births.
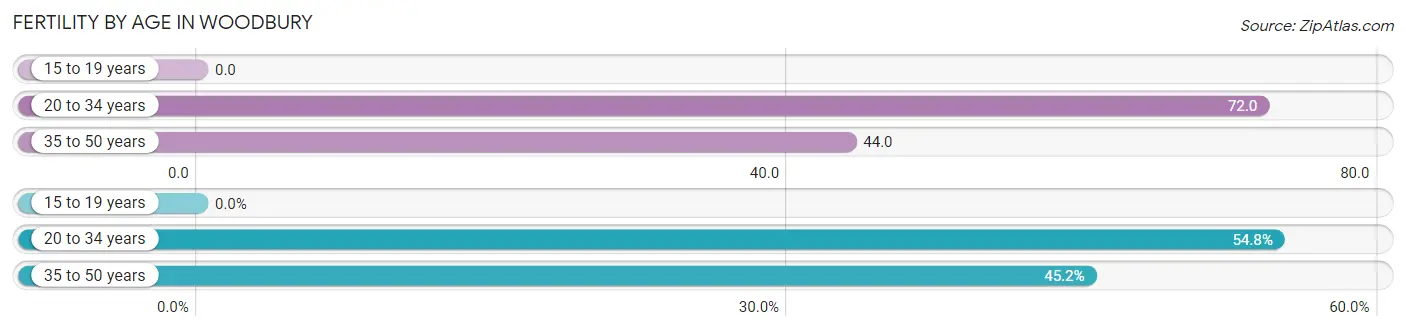
| Age Bracket | Women with Births | Births / 1,000 Women |
| 15 to 19 years | 0 (0.0%) | 0.0 |
| 20 to 34 years | 486 (54.8%) | 72.0 |
| 35 to 50 years | 401 (45.2%) | 44.0 |
| Total | 887 (100.0%) | 49.0 |
Fertility by Age by Marriage Status in Woodbury
81.4% of women with births (887) in Woodbury are married. The highest percentage of unmarried women with births falls into 20 to 34 years age bracket with 26.8% of them unmarried at the time of birth, while the lowest percentage of unmarried women with births belong to 35 to 50 years age bracket with 8.7% of them unmarried.
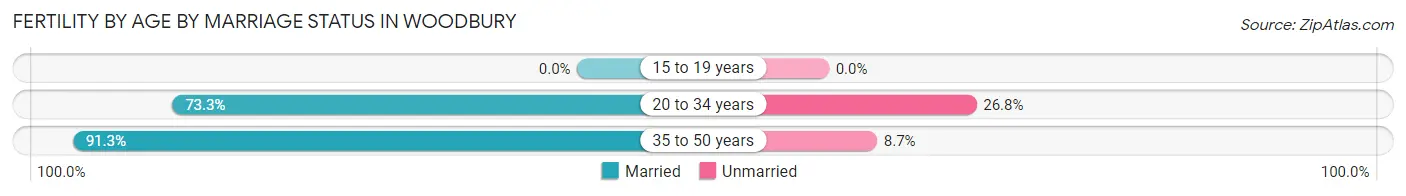
| Age Bracket | Married | Unmarried |
| 15 to 19 years | 0 (0.0%) | 0 (0.0%) |
| 20 to 34 years | 356 (73.3%) | 130 (26.8%) |
| 35 to 50 years | 366 (91.3%) | 35 (8.7%) |
| Total | 722 (81.4%) | 165 (18.6%) |
Fertility by Education in Woodbury
Average fertility rate in Woodbury is 49.0 births per 1,000 women. Women with the education attainment of graduate degree have the highest fertility rate of 96.0 births per 1,000 women, while women with the education attainment of less than high school have the lowest fertility at 7.0 births per 1,000 women. Women with the education attainment of graduate degree represent 38.3% of all women with births.
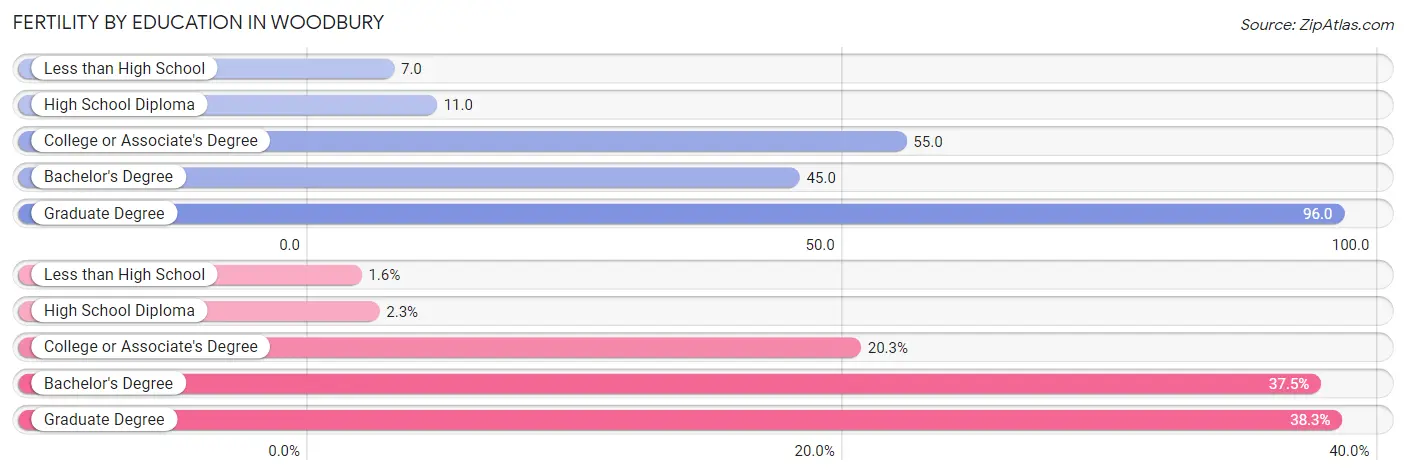
| Educational Attainment | Women with Births | Births / 1,000 Women |
| Less than High School | 14 (1.6%) | 7.0 |
| High School Diploma | 20 (2.2%) | 11.0 |
| College or Associate's Degree | 180 (20.3%) | 55.0 |
| Bachelor's Degree | 333 (37.5%) | 45.0 |
| Graduate Degree | 340 (38.3%) | 96.0 |
| Total | 887 (100.0%) | 49.0 |
Fertility by Education by Marriage Status in Woodbury
18.6% of women with births in Woodbury are unmarried. Women with the educational attainment of graduate degree are most likely to be married with 100.0% of them married at childbirth, while women with the educational attainment of less than high school are least likely to be married with 100.0% of them unmarried at childbirth.
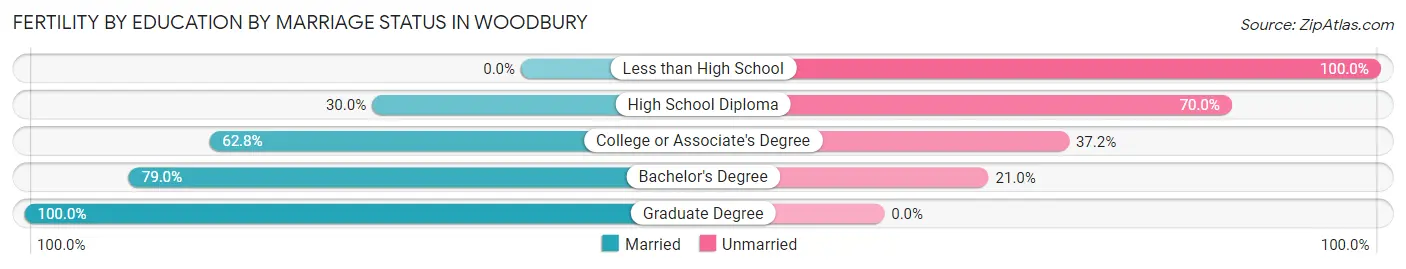
| Educational Attainment | Married | Unmarried |
| Less than High School | 0 (0.0%) | 14 (100.0%) |
| High School Diploma | 6 (30.0%) | 14 (70.0%) |
| College or Associate's Degree | 113 (62.8%) | 67 (37.2%) |
| Bachelor's Degree | 263 (79.0%) | 70 (21.0%) |
| Graduate Degree | 340 (100.0%) | 0 (0.0%) |
| Total | 722 (81.4%) | 165 (18.6%) |
Employment Characteristics in Woodbury
Employment by Class of Employer in Woodbury
Among the 40,484 employed individuals in Woodbury, private company employees (27,446 | 67.8%), not-for-profit organizations (4,907 | 12.1%), and local government employees (3,156 | 7.8%) make up the most common classes of employment.
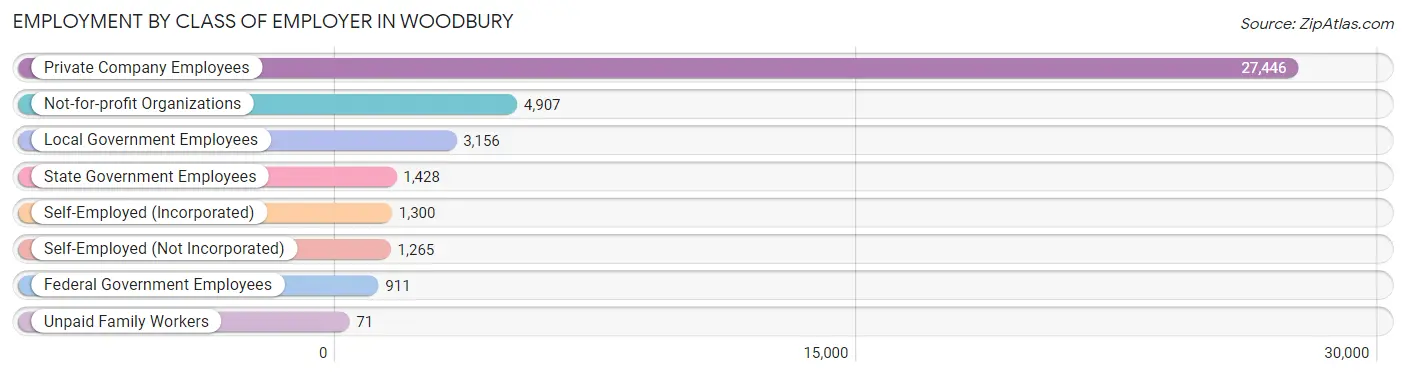
| Employer Class | # Employees | % Employees |
| Private Company Employees | 27,446 | 67.8% |
| Self-Employed (Incorporated) | 1,300 | 3.2% |
| Self-Employed (Not Incorporated) | 1,265 | 3.1% |
| Not-for-profit Organizations | 4,907 | 12.1% |
| Local Government Employees | 3,156 | 7.8% |
| State Government Employees | 1,428 | 3.5% |
| Federal Government Employees | 911 | 2.2% |
| Unpaid Family Workers | 71 | 0.2% |
| Total | 40,484 | 100.0% |
Employment Status by Age in Woodbury
According to the labor force statistics for Woodbury, out of the total population over 16 years of age (57,921), 73.6% or 42,630 individuals are in the labor force, with 3.2% or 1,364 of them unemployed. The age group with the highest labor force participation rate is 30 to 34 years, with 94.6% or 3,984 individuals in the labor force. Within the labor force, the 65 to 74 years age range has the highest percentage of unemployed individuals, with 8.5% or 113 of them being unemployed.
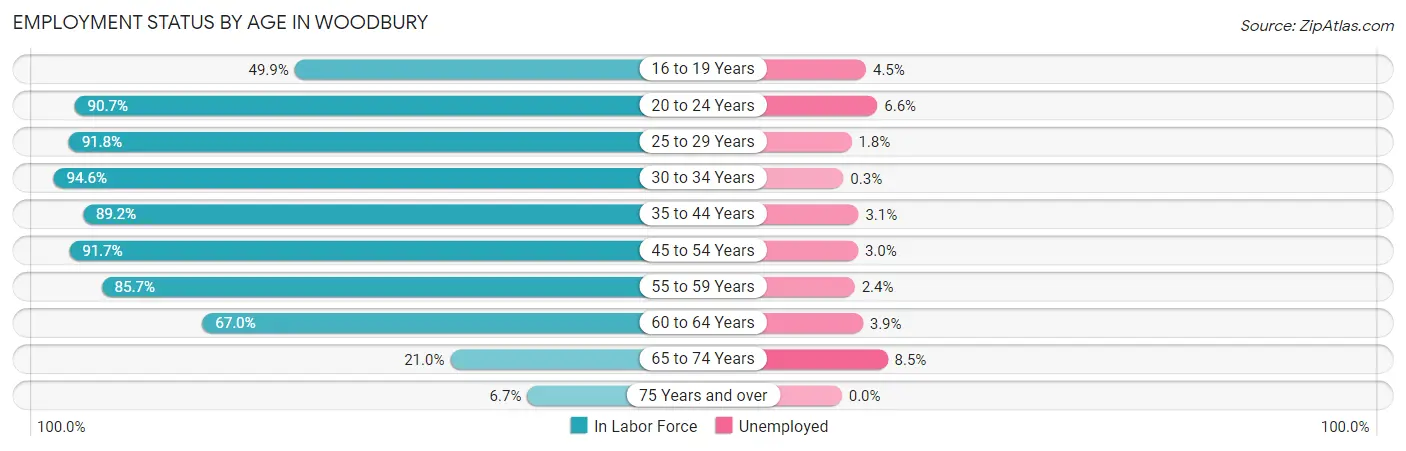
| Age Bracket | In Labor Force | Unemployed |
| 16 to 19 Years | 1,927 (49.9%) | 87 (4.5%) |
| 20 to 24 Years | 4,040 (90.7%) | 267 (6.6%) |
| 25 to 29 Years | 3,752 (91.8%) | 68 (1.8%) |
| 30 to 34 Years | 3,984 (94.6%) | 12 (0.3%) |
| 35 to 44 Years | 10,158 (89.2%) | 315 (3.1%) |
| 45 to 54 Years | 9,830 (91.7%) | 295 (3.0%) |
| 55 to 59 Years | 4,310 (85.7%) | 103 (2.4%) |
| 60 to 64 Years | 3,066 (67.0%) | 120 (3.9%) |
| 65 to 74 Years | 1,324 (21.0%) | 113 (8.5%) |
| 75 Years and over | 220 (6.7%) | 0 (0.0%) |
| Total | 42,630 (73.6%) | 1,364 (3.2%) |
Employment Status by Educational Attainment in Woodbury
According to labor force statistics for Woodbury, 87.7% of individuals (35,090) out of the total population between 25 and 64 years of age (40,011) are in the labor force, with 2.6% or 912 of them being unemployed. The group with the highest labor force participation rate are those with the educational attainment of bachelor's degree or higher, with 91.1% or 24,152 individuals in the labor force. Within the labor force, individuals with college / associate degree education have the highest percentage of unemployment, with 5.5% or 424 of them being unemployed.
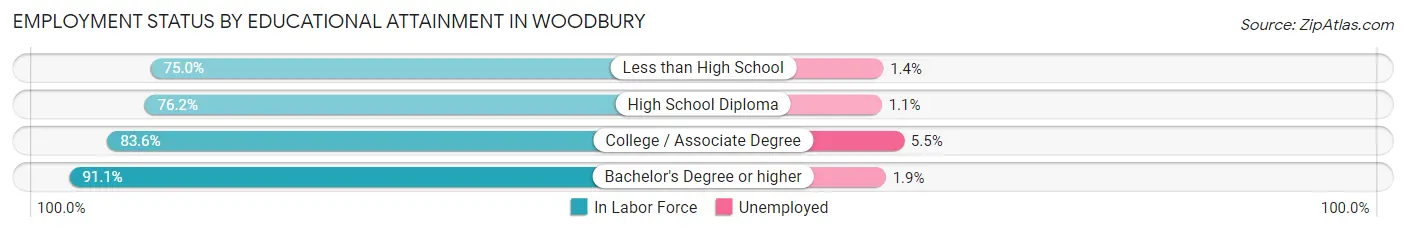
| Educational Attainment | In Labor Force | Unemployed |
| Less than High School | 576 (75.0%) | 11 (1.4%) |
| High School Diploma | 2,676 (76.2%) | 39 (1.1%) |
| College / Associate Degree | 7,707 (83.6%) | 507 (5.5%) |
| Bachelor's Degree or higher | 24,152 (91.1%) | 504 (1.9%) |
| Total | 35,090 (87.7%) | 1,040 (2.6%) |
Employment Occupations by Sex in Woodbury
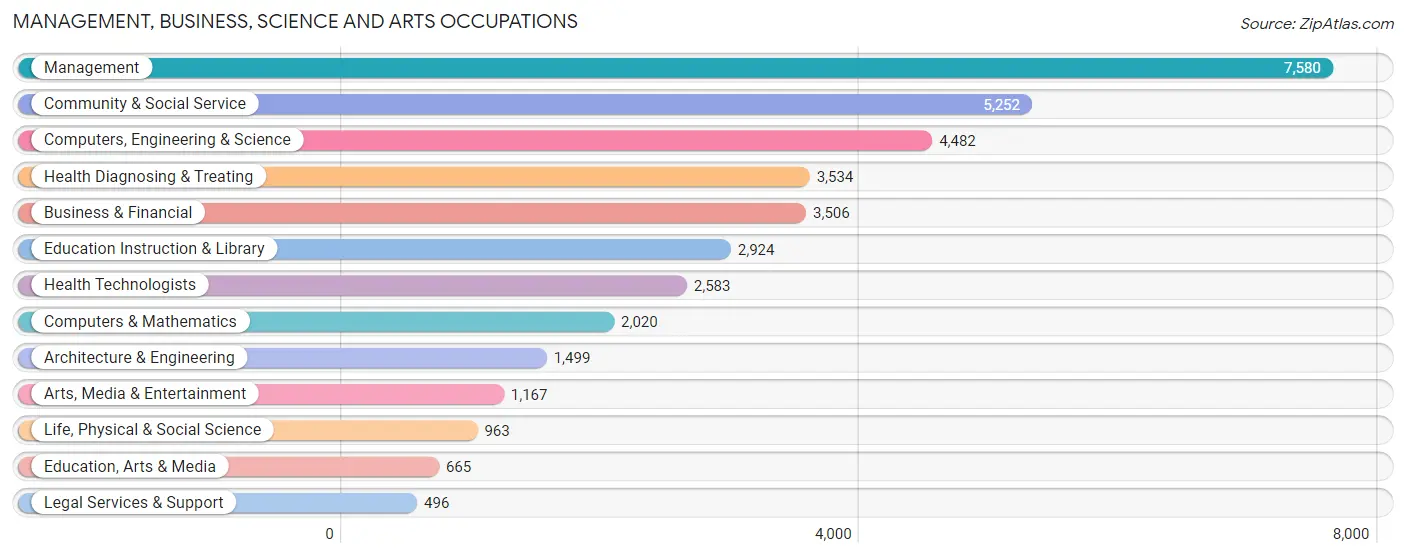
Management, Business, Science and Arts Occupations
The most common Management, Business, Science and Arts occupations in Woodbury are Management (7,580 | 18.4%), Community & Social Service (5,252 | 12.8%), Computers, Engineering & Science (4,482 | 10.9%), Health Diagnosing & Treating (3,534 | 8.6%), and Business & Financial (3,506 | 8.5%).
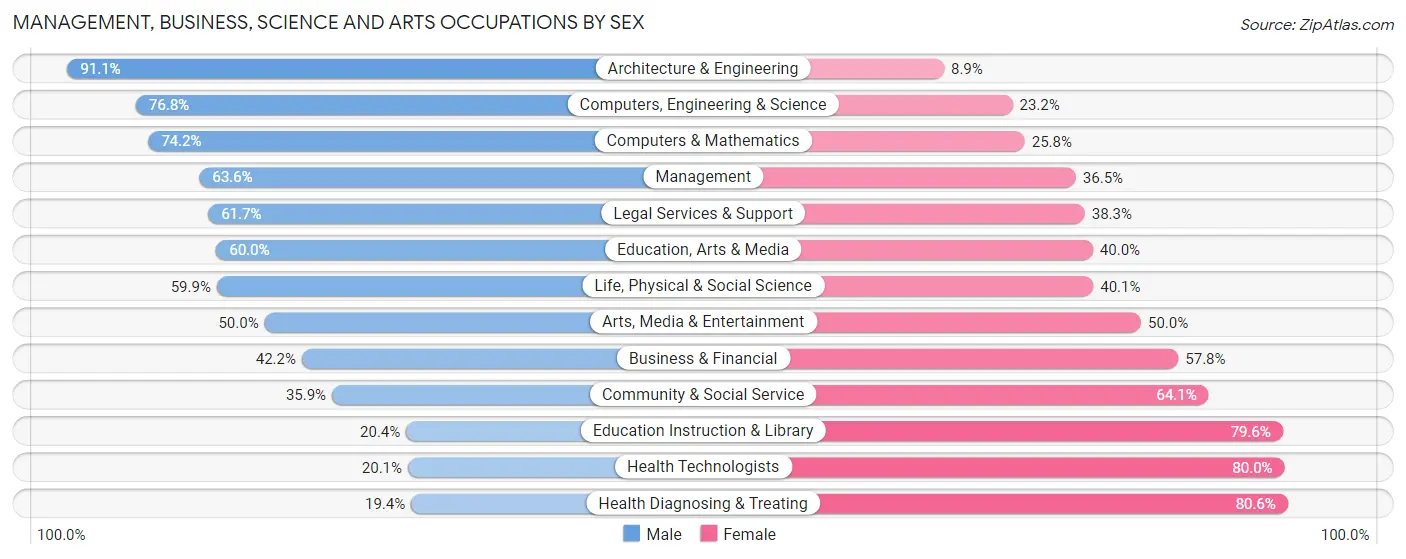
Management, Business, Science and Arts Occupations by Sex
Within the Management, Business, Science and Arts occupations in Woodbury, the most male-oriented occupations are Architecture & Engineering (91.1%), Computers, Engineering & Science (76.8%), and Computers & Mathematics (74.2%), while the most female-oriented occupations are Health Diagnosing & Treating (80.6%), Health Technologists (79.9%), and Education Instruction & Library (79.6%).
| Occupation | Male | Female |
| Management | 4,817 (63.5%) | 2,763 (36.4%) |
| Business & Financial | 1,479 (42.2%) | 2,027 (57.8%) |
| Computers, Engineering & Science | 3,441 (76.8%) | 1,041 (23.2%) |
| Computers & Mathematics | 1,499 (74.2%) | 521 (25.8%) |
| Architecture & Engineering | 1,365 (91.1%) | 134 (8.9%) |
| Life, Physical & Social Science | 577 (59.9%) | 386 (40.1%) |
| Community & Social Service | 1,885 (35.9%) | 3,367 (64.1%) |
| Education, Arts & Media | 399 (60.0%) | 266 (40.0%) |
| Legal Services & Support | 306 (61.7%) | 190 (38.3%) |
| Education Instruction & Library | 597 (20.4%) | 2,327 (79.6%) |
| Arts, Media & Entertainment | 583 (50.0%) | 584 (50.0%) |
| Health Diagnosing & Treating | 685 (19.4%) | 2,849 (80.6%) |
| Health Technologists | 518 (20.1%) | 2,065 (79.9%) |
| Total (Category) | 12,307 (50.5%) | 12,047 (49.5%) |
| Total (Overall) | 21,553 (52.3%) | 19,653 (47.7%) |
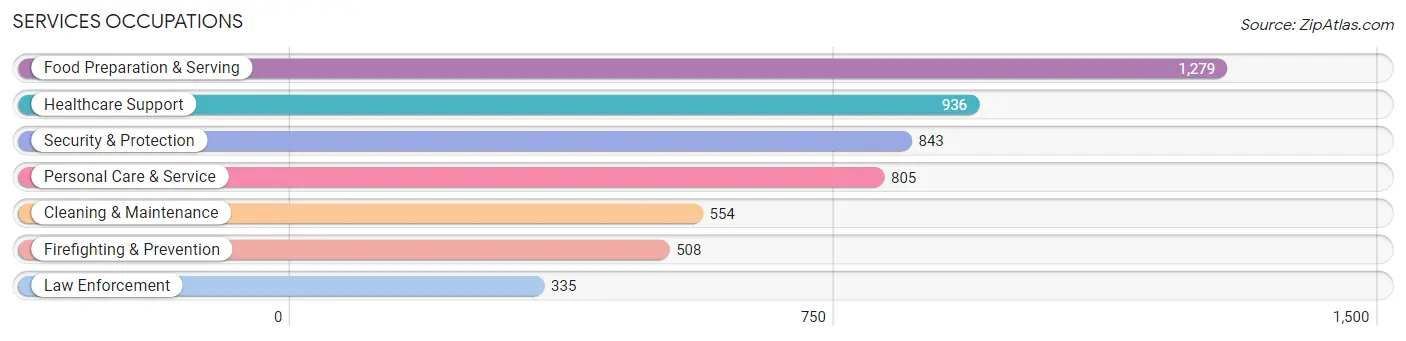
Services Occupations
The most common Services occupations in Woodbury are Food Preparation & Serving (1,279 | 3.1%), Healthcare Support (936 | 2.3%), Security & Protection (843 | 2.1%), Personal Care & Service (805 | 1.9%), and Cleaning & Maintenance (554 | 1.3%).
Services Occupations by Sex
Within the Services occupations in Woodbury, the most male-oriented occupations are Law Enforcement (90.1%), Security & Protection (84.3%), and Firefighting & Prevention (80.5%), while the most female-oriented occupations are Healthcare Support (84.3%), Personal Care & Service (77.3%), and Food Preparation & Serving (45.7%).
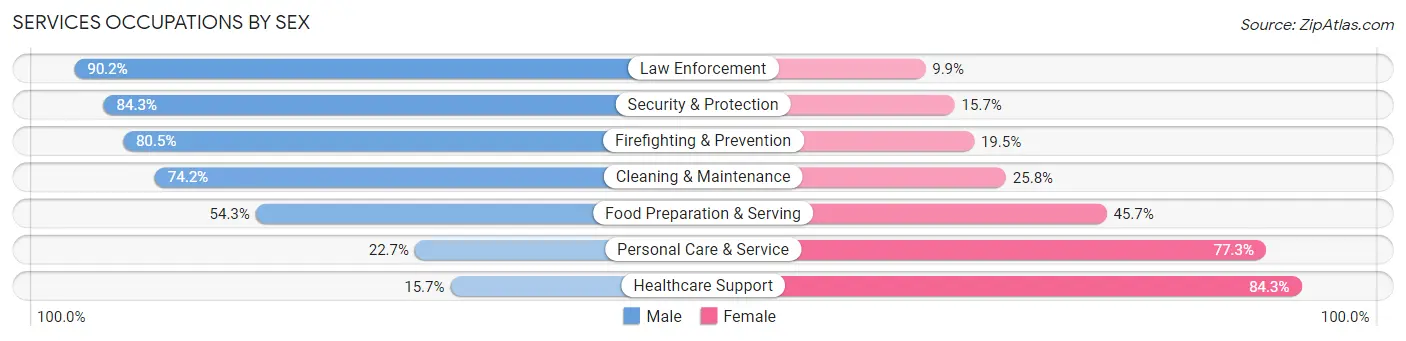
| Occupation | Male | Female |
| Healthcare Support | 147 (15.7%) | 789 (84.3%) |
| Security & Protection | 711 (84.3%) | 132 (15.7%) |
| Firefighting & Prevention | 409 (80.5%) | 99 (19.5%) |
| Law Enforcement | 302 (90.1%) | 33 (9.9%) |
| Food Preparation & Serving | 694 (54.3%) | 585 (45.7%) |
| Cleaning & Maintenance | 411 (74.2%) | 143 (25.8%) |
| Personal Care & Service | 183 (22.7%) | 622 (77.3%) |
| Total (Category) | 2,146 (48.6%) | 2,271 (51.4%) |
| Total (Overall) | 21,553 (52.3%) | 19,653 (47.7%) |
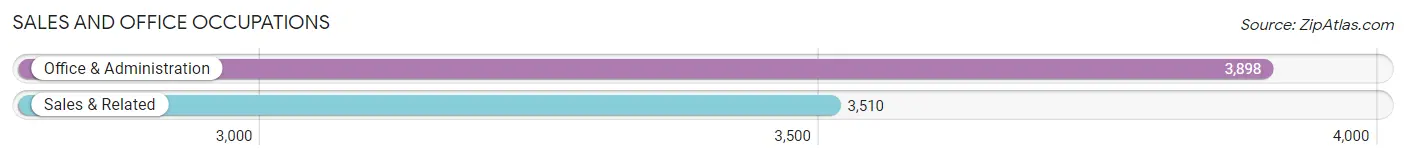
Sales and Office Occupations
The most common Sales and Office occupations in Woodbury are Office & Administration (3,898 | 9.5%), and Sales & Related (3,510 | 8.5%).
Sales and Office Occupations by Sex
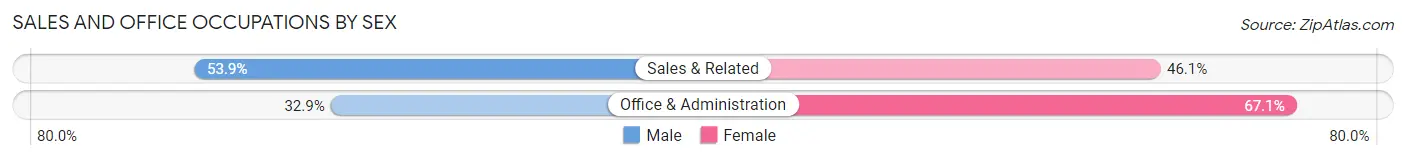
| Occupation | Male | Female |
| Sales & Related | 1,893 (53.9%) | 1,617 (46.1%) |
| Office & Administration | 1,284 (32.9%) | 2,614 (67.1%) |
| Total (Category) | 3,177 (42.9%) | 4,231 (57.1%) |
| Total (Overall) | 21,553 (52.3%) | 19,653 (47.7%) |
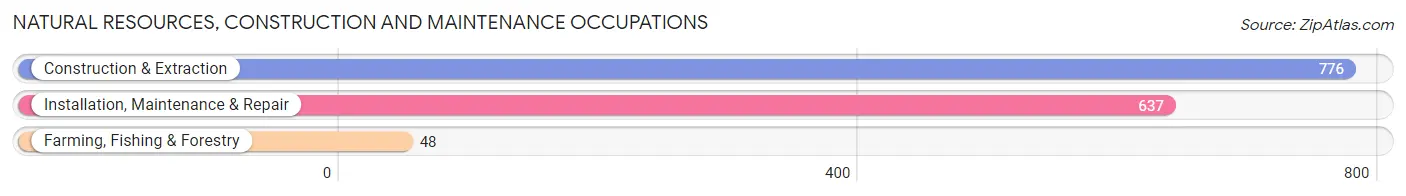
Natural Resources, Construction and Maintenance Occupations
The most common Natural Resources, Construction and Maintenance occupations in Woodbury are Construction & Extraction (776 | 1.9%), Installation, Maintenance & Repair (637 | 1.5%), and Farming, Fishing & Forestry (48 | 0.1%).
Natural Resources, Construction and Maintenance Occupations by Sex
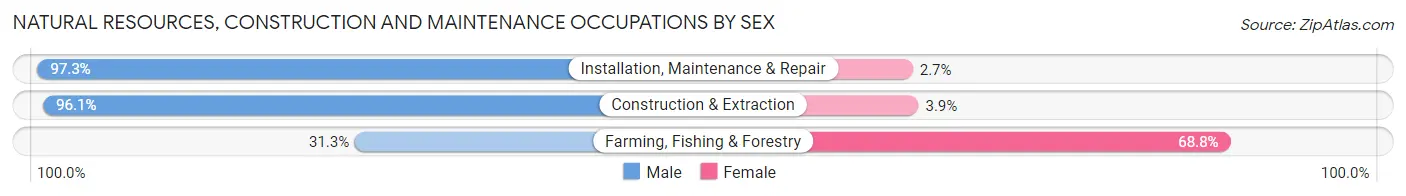
| Occupation | Male | Female |
| Farming, Fishing & Forestry | 15 (31.2%) | 33 (68.8%) |
| Construction & Extraction | 746 (96.1%) | 30 (3.9%) |
| Installation, Maintenance & Repair | 620 (97.3%) | 17 (2.7%) |
| Total (Category) | 1,381 (94.5%) | 80 (5.5%) |
| Total (Overall) | 21,553 (52.3%) | 19,653 (47.7%) |
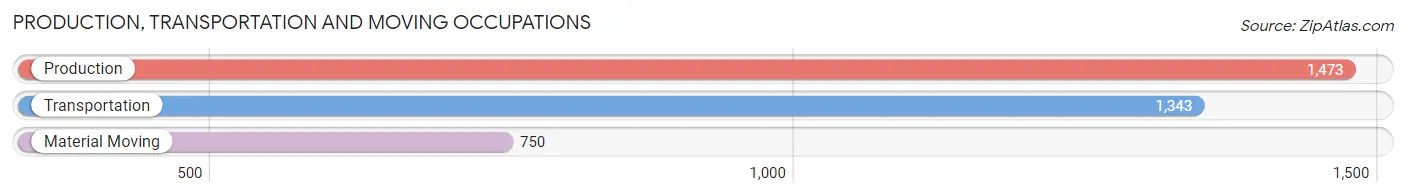
Production, Transportation and Moving Occupations
The most common Production, Transportation and Moving occupations in Woodbury are Production (1,473 | 3.6%), Transportation (1,343 | 3.3%), and Material Moving (750 | 1.8%).
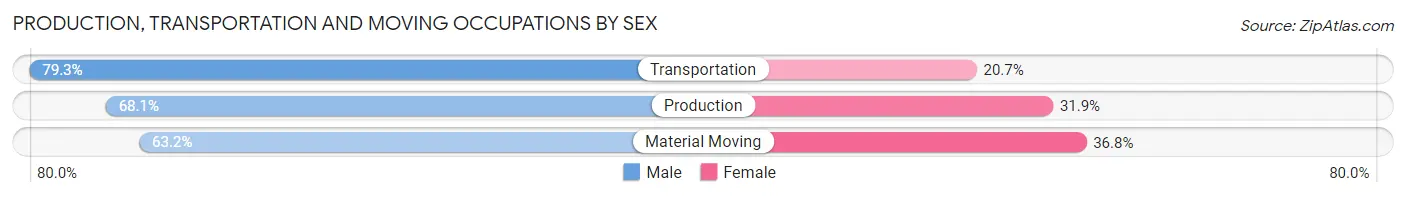
Production, Transportation and Moving Occupations by Sex
| Occupation | Male | Female |
| Production | 1,003 (68.1%) | 470 (31.9%) |
| Transportation | 1,065 (79.3%) | 278 (20.7%) |
| Material Moving | 474 (63.2%) | 276 (36.8%) |
| Total (Category) | 2,542 (71.3%) | 1,024 (28.7%) |
| Total (Overall) | 21,553 (52.3%) | 19,653 (47.7%) |
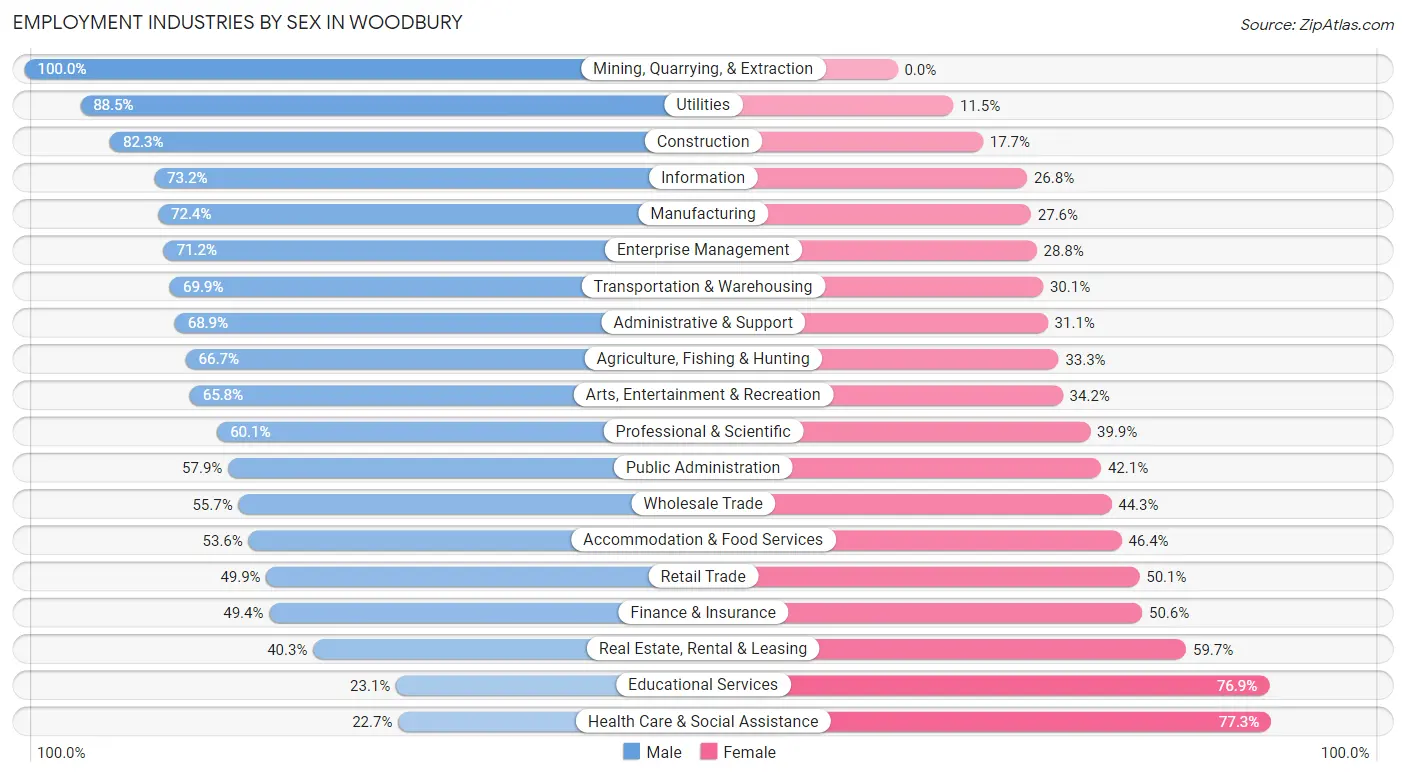
Employment Industries by Sex in Woodbury
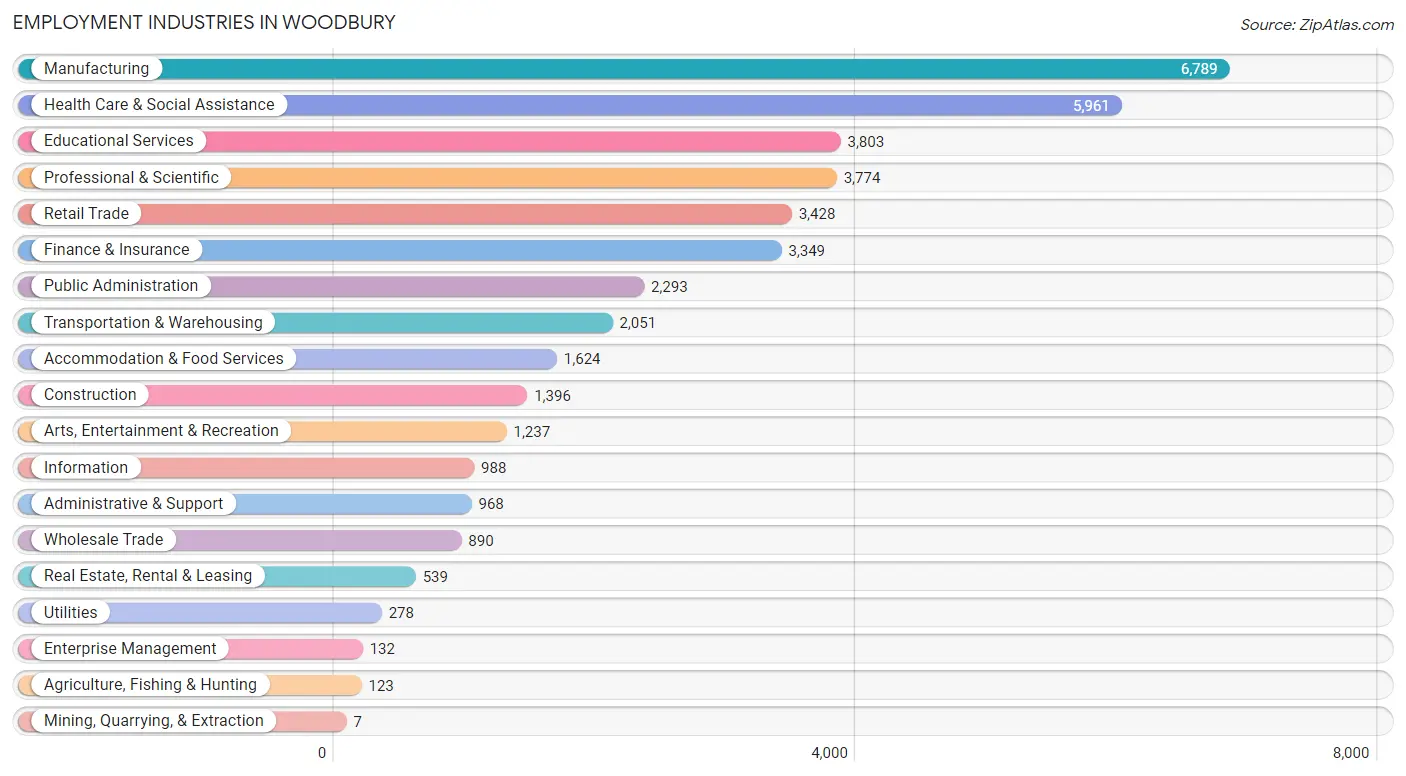
Employment Industries in Woodbury
The major employment industries in Woodbury include Manufacturing (6,789 | 16.5%), Health Care & Social Assistance (5,961 | 14.5%), Educational Services (3,803 | 9.2%), Professional & Scientific (3,774 | 9.2%), and Retail Trade (3,428 | 8.3%).
Employment Industries by Sex in Woodbury
The Woodbury industries that see more men than women are Mining, Quarrying, & Extraction (100.0%), Utilities (88.5%), and Construction (82.3%), whereas the industries that tend to have a higher number of women are Health Care & Social Assistance (77.3%), Educational Services (76.9%), and Real Estate, Rental & Leasing (59.7%).
| Industry | Male | Female |
| Agriculture, Fishing & Hunting | 82 (66.7%) | 41 (33.3%) |
| Mining, Quarrying, & Extraction | 7 (100.0%) | 0 (0.0%) |
| Construction | 1,149 (82.3%) | 247 (17.7%) |
| Manufacturing | 4,914 (72.4%) | 1,875 (27.6%) |
| Wholesale Trade | 496 (55.7%) | 394 (44.3%) |
| Retail Trade | 1,712 (49.9%) | 1,716 (50.1%) |
| Transportation & Warehousing | 1,433 (69.9%) | 618 (30.1%) |
| Utilities | 246 (88.5%) | 32 (11.5%) |
| Information | 723 (73.2%) | 265 (26.8%) |
| Finance & Insurance | 1,653 (49.4%) | 1,696 (50.6%) |
| Real Estate, Rental & Leasing | 217 (40.3%) | 322 (59.7%) |
| Professional & Scientific | 2,269 (60.1%) | 1,505 (39.9%) |
| Enterprise Management | 94 (71.2%) | 38 (28.8%) |
| Administrative & Support | 667 (68.9%) | 301 (31.1%) |
| Educational Services | 878 (23.1%) | 2,925 (76.9%) |
| Health Care & Social Assistance | 1,351 (22.7%) | 4,610 (77.3%) |
| Arts, Entertainment & Recreation | 814 (65.8%) | 423 (34.2%) |
| Accommodation & Food Services | 871 (53.6%) | 753 (46.4%) |
| Public Administration | 1,327 (57.9%) | 966 (42.1%) |
| Total | 21,553 (52.3%) | 19,653 (47.7%) |
Education in Woodbury
School Enrollment in Woodbury
The most common levels of schooling among the 21,413 students in Woodbury are elementary school (4,906 | 22.9%), middle school (4,876 | 22.8%), and high school (4,687 | 21.9%).
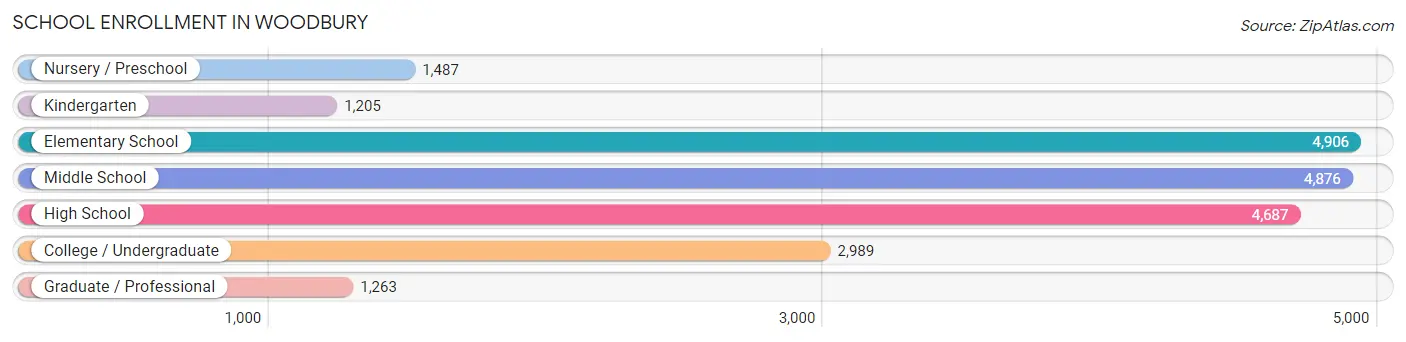
| School Level | # Students | % Students |
| Nursery / Preschool | 1,487 | 6.9% |
| Kindergarten | 1,205 | 5.6% |
| Elementary School | 4,906 | 22.9% |
| Middle School | 4,876 | 22.8% |
| High School | 4,687 | 21.9% |
| College / Undergraduate | 2,989 | 14.0% |
| Graduate / Professional | 1,263 | 5.9% |
| Total | 21,413 | 100.0% |
School Enrollment by Age by Funding Source in Woodbury
Out of a total of 21,413 students who are enrolled in schools in Woodbury, 3,319 (15.5%) attend a private institution, while the remaining 18,094 (84.5%) are enrolled in public schools. The age group of 3 to 4 year olds has the highest likelihood of being enrolled in private schools, with 436 (52.1% in the age bracket) enrolled. Conversely, the age group of 15 to 17 year olds has the lowest likelihood of being enrolled in a private school, with 3,157 (92.6% in the age bracket) attending a public institution.
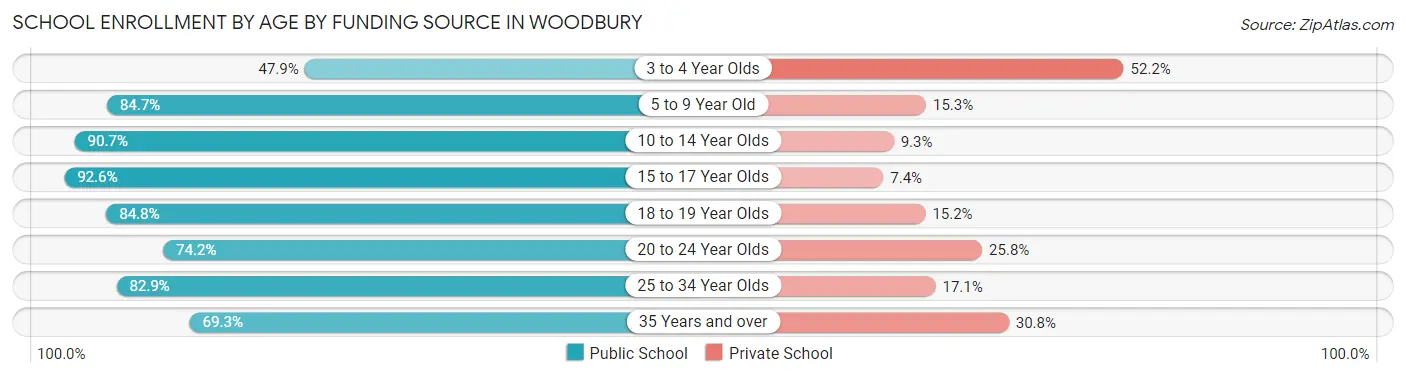
| Age Bracket | Public School | Private School |
| 3 to 4 Year Olds | 400 (47.8%) | 436 (52.1%) |
| 5 to 9 Year Old | 5,360 (84.7%) | 971 (15.3%) |
| 10 to 14 Year Olds | 5,232 (90.7%) | 538 (9.3%) |
| 15 to 17 Year Olds | 3,157 (92.6%) | 252 (7.4%) |
| 18 to 19 Year Olds | 1,141 (84.8%) | 205 (15.2%) |
| 20 to 24 Year Olds | 1,162 (74.2%) | 404 (25.8%) |
| 25 to 34 Year Olds | 964 (82.9%) | 199 (17.1%) |
| 35 Years and over | 687 (69.3%) | 305 (30.7%) |
| Total | 18,094 (84.5%) | 3,319 (15.5%) |
Educational Attainment by Field of Study in Woodbury
Business (8,279 | 24.3%), engineering (3,274 | 9.6%), science & technology (3,206 | 9.4%), education (3,080 | 9.0%), and social sciences (2,712 | 8.0%) are the most common fields of study among 34,101 individuals in Woodbury who have obtained a bachelor's degree or higher.
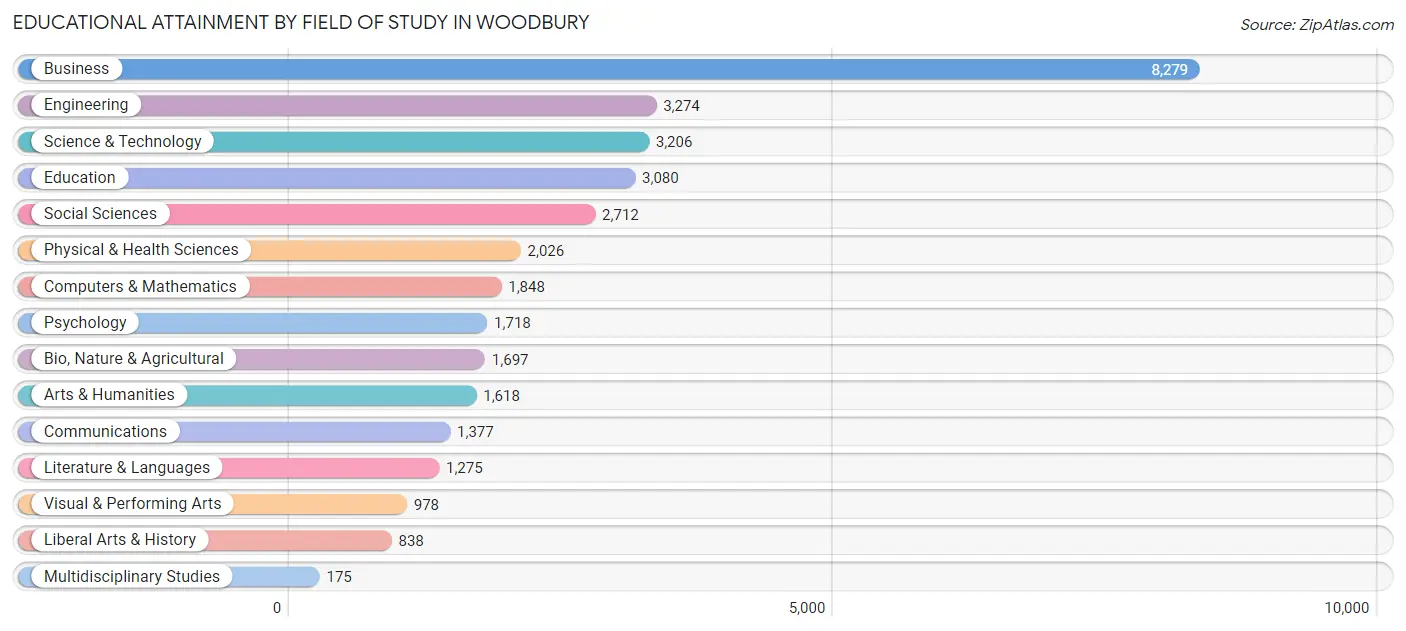
| Field of Study | # Graduates | % Graduates |
| Computers & Mathematics | 1,848 | 5.4% |
| Bio, Nature & Agricultural | 1,697 | 5.0% |
| Physical & Health Sciences | 2,026 | 5.9% |
| Psychology | 1,718 | 5.0% |
| Social Sciences | 2,712 | 8.0% |
| Engineering | 3,274 | 9.6% |
| Multidisciplinary Studies | 175 | 0.5% |
| Science & Technology | 3,206 | 9.4% |
| Business | 8,279 | 24.3% |
| Education | 3,080 | 9.0% |
| Literature & Languages | 1,275 | 3.7% |
| Liberal Arts & History | 838 | 2.5% |
| Visual & Performing Arts | 978 | 2.9% |
| Communications | 1,377 | 4.0% |
| Arts & Humanities | 1,618 | 4.7% |
| Total | 34,101 | 100.0% |
Transportation & Commute in Woodbury
Vehicle Availability by Sex in Woodbury
The most prevalent vehicle ownership categories in Woodbury are males with 2 vehicles (11,027, accounting for 51.8%) and females with 2 vehicles (9,234, making up 57.6%).
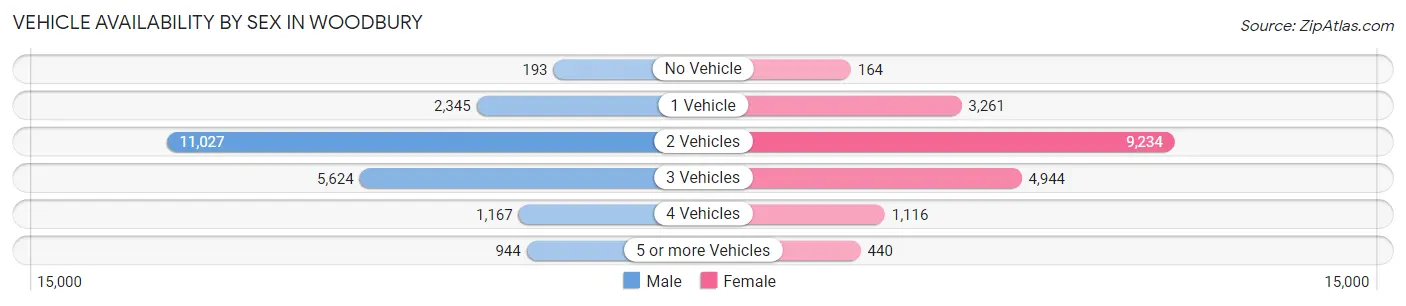
| Vehicles Available | Male | Female |
| No Vehicle | 193 (0.9%) | 164 (0.9%) |
| 1 Vehicle | 2,345 (11.0%) | 3,261 (17.0%) |
| 2 Vehicles | 11,027 (51.8%) | 9,234 (48.2%) |
| 3 Vehicles | 5,624 (26.4%) | 4,944 (25.8%) |
| 4 Vehicles | 1,167 (5.5%) | 1,116 (5.8%) |
| 5 or more Vehicles | 944 (4.4%) | 440 (2.3%) |
| Total | 21,300 (100.0%) | 19,159 (100.0%) |
Commute Time in Woodbury
The most frequently occuring commute durations in Woodbury are 30 to 34 minutes (5,581 commuters, 17.6%), 20 to 24 minutes (5,412 commuters, 17.1%), and 15 to 19 minutes (4,900 commuters, 15.5%).
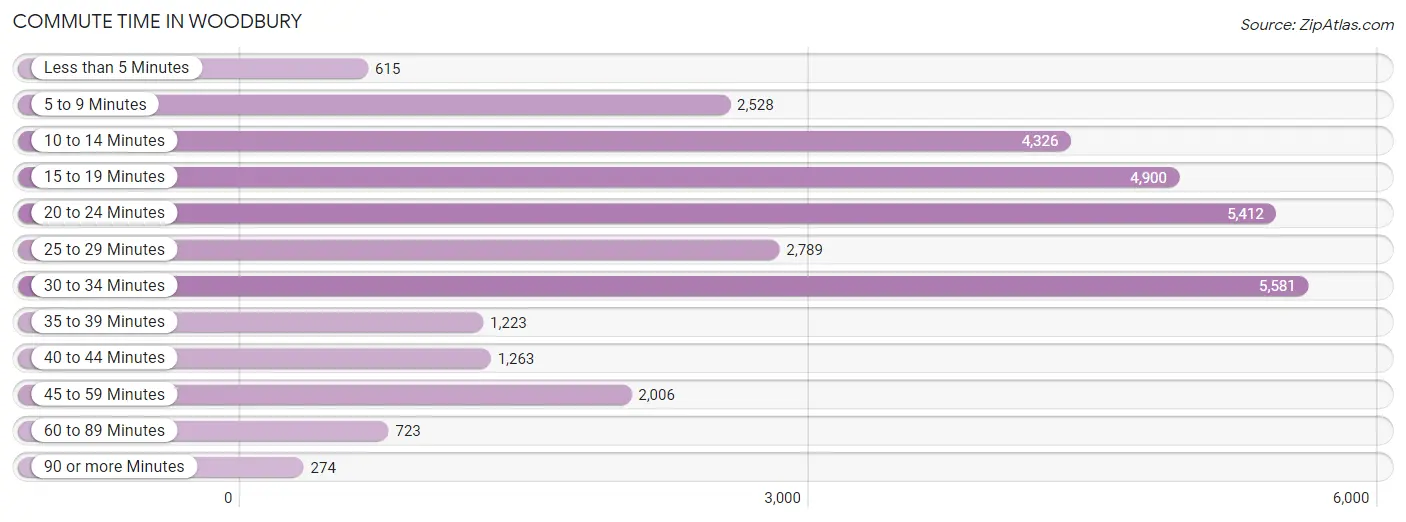
| Commute Time | # Commuters | % Commuters |
| Less than 5 Minutes | 615 | 1.9% |
| 5 to 9 Minutes | 2,528 | 8.0% |
| 10 to 14 Minutes | 4,326 | 13.7% |
| 15 to 19 Minutes | 4,900 | 15.5% |
| 20 to 24 Minutes | 5,412 | 17.1% |
| 25 to 29 Minutes | 2,789 | 8.8% |
| 30 to 34 Minutes | 5,581 | 17.6% |
| 35 to 39 Minutes | 1,223 | 3.9% |
| 40 to 44 Minutes | 1,263 | 4.0% |
| 45 to 59 Minutes | 2,006 | 6.3% |
| 60 to 89 Minutes | 723 | 2.3% |
| 90 or more Minutes | 274 | 0.9% |
Commute Time by Sex in Woodbury
The most common commute times in Woodbury are 30 to 34 minutes (3,124 commuters, 18.3%) for males and 20 to 24 minutes (2,579 commuters, 17.6%) for females.
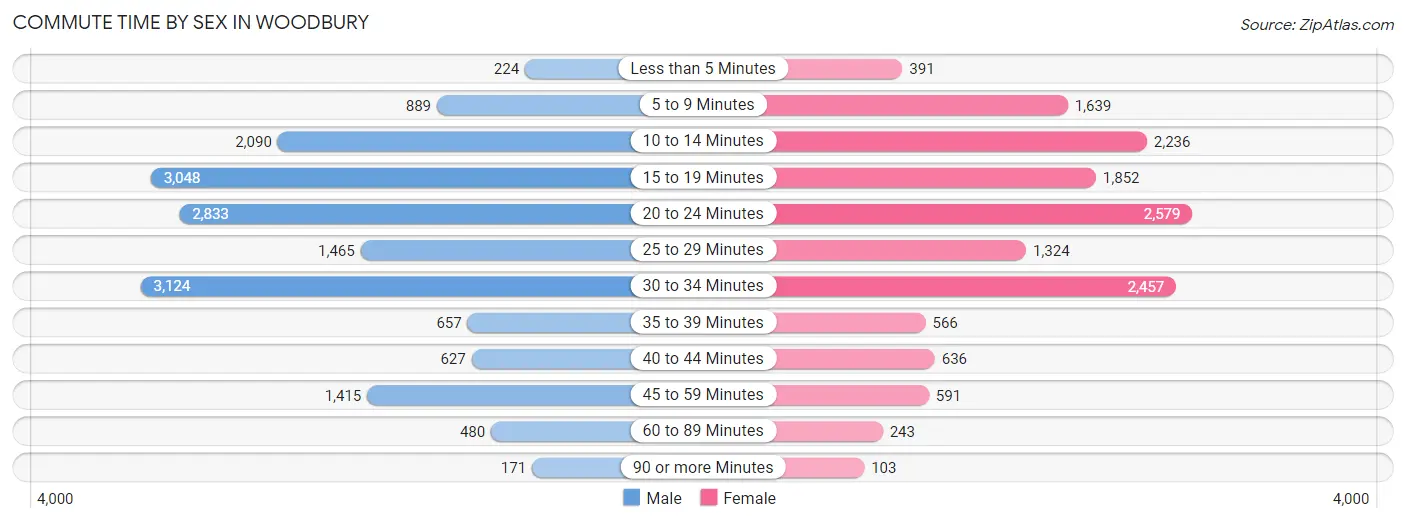
| Commute Time | Male | Female |
| Less than 5 Minutes | 224 (1.3%) | 391 (2.7%) |
| 5 to 9 Minutes | 889 (5.2%) | 1,639 (11.2%) |
| 10 to 14 Minutes | 2,090 (12.3%) | 2,236 (15.3%) |
| 15 to 19 Minutes | 3,048 (17.9%) | 1,852 (12.7%) |
| 20 to 24 Minutes | 2,833 (16.6%) | 2,579 (17.6%) |
| 25 to 29 Minutes | 1,465 (8.6%) | 1,324 (9.1%) |
| 30 to 34 Minutes | 3,124 (18.3%) | 2,457 (16.8%) |
| 35 to 39 Minutes | 657 (3.9%) | 566 (3.9%) |
| 40 to 44 Minutes | 627 (3.7%) | 636 (4.3%) |
| 45 to 59 Minutes | 1,415 (8.3%) | 591 (4.0%) |
| 60 to 89 Minutes | 480 (2.8%) | 243 (1.7%) |
| 90 or more Minutes | 171 (1.0%) | 103 (0.7%) |
Time of Departure to Work by Sex in Woodbury
The most frequent times of departure to work in Woodbury are 7:00 AM to 7:29 AM (2,844, 16.7%) for males and 7:30 AM to 7:59 AM (3,063, 21.0%) for females.
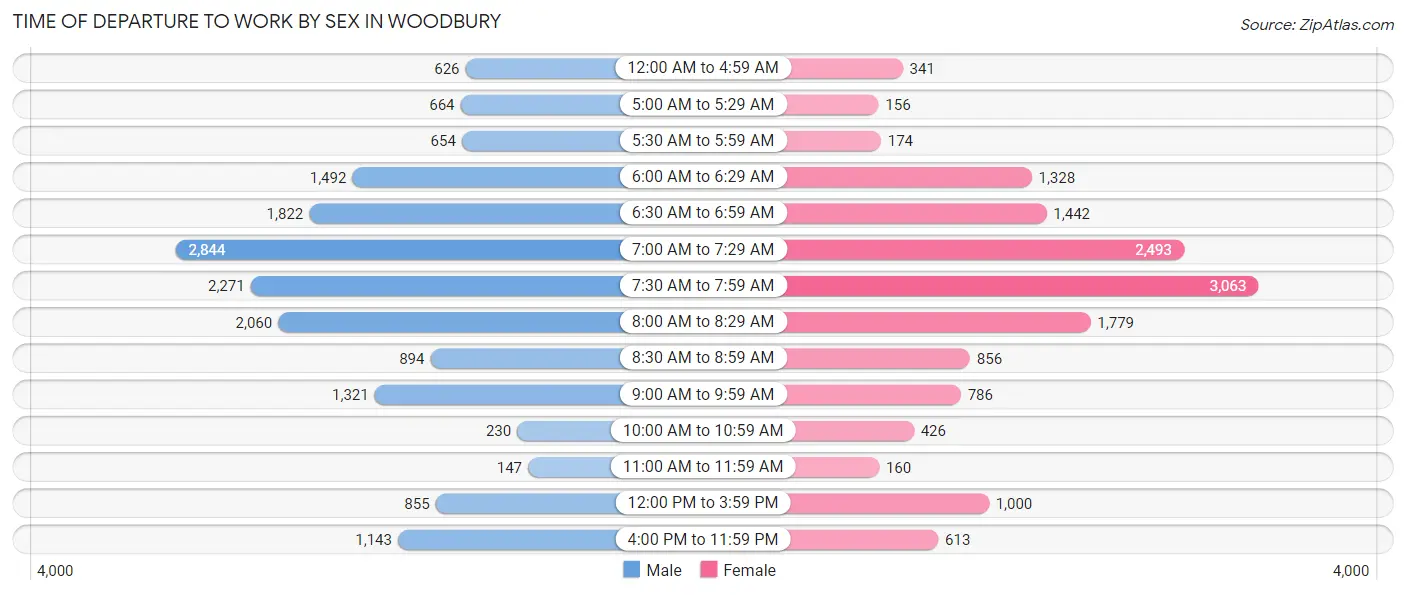
| Time of Departure | Male | Female |
| 12:00 AM to 4:59 AM | 626 (3.7%) | 341 (2.3%) |
| 5:00 AM to 5:29 AM | 664 (3.9%) | 156 (1.1%) |
| 5:30 AM to 5:59 AM | 654 (3.8%) | 174 (1.2%) |
| 6:00 AM to 6:29 AM | 1,492 (8.8%) | 1,328 (9.1%) |
| 6:30 AM to 6:59 AM | 1,822 (10.7%) | 1,442 (9.9%) |
| 7:00 AM to 7:29 AM | 2,844 (16.7%) | 2,493 (17.1%) |
| 7:30 AM to 7:59 AM | 2,271 (13.3%) | 3,063 (21.0%) |
| 8:00 AM to 8:29 AM | 2,060 (12.1%) | 1,779 (12.2%) |
| 8:30 AM to 8:59 AM | 894 (5.2%) | 856 (5.9%) |
| 9:00 AM to 9:59 AM | 1,321 (7.8%) | 786 (5.4%) |
| 10:00 AM to 10:59 AM | 230 (1.3%) | 426 (2.9%) |
| 11:00 AM to 11:59 AM | 147 (0.9%) | 160 (1.1%) |
| 12:00 PM to 3:59 PM | 855 (5.0%) | 1,000 (6.8%) |
| 4:00 PM to 11:59 PM | 1,143 (6.7%) | 613 (4.2%) |
| Total | 17,023 (100.0%) | 14,617 (100.0%) |
Housing Occupancy in Woodbury
Occupancy by Ownership in Woodbury
Of the total 28,207 dwellings in Woodbury, owner-occupied units account for 22,574 (80.0%), while renter-occupied units make up 5,633 (20.0%).
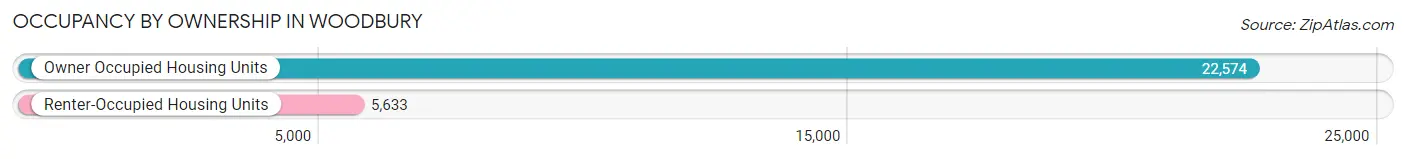
| Occupancy | # Housing Units | % Housing Units |
| Owner Occupied Housing Units | 22,574 | 80.0% |
| Renter-Occupied Housing Units | 5,633 | 20.0% |
| Total Occupied Housing Units | 28,207 | 100.0% |
Occupancy by Household Size in Woodbury
| Household Size | # Housing Units | % Housing Units |
| 1-Person Household | 6,018 | 21.3% |
| 2-Person Household | 9,939 | 35.2% |
| 3-Person Household | 4,677 | 16.6% |
| 4+ Person Household | 7,573 | 26.9% |
| Total Housing Units | 28,207 | 100.0% |
Occupancy by Ownership by Household Size in Woodbury
| Household Size | Owner-occupied | Renter-occupied |
| 1-Person Household | 4,086 (67.9%) | 1,932 (32.1%) |
| 2-Person Household | 7,531 (75.8%) | 2,408 (24.2%) |
| 3-Person Household | 4,014 (85.8%) | 663 (14.2%) |
| 4+ Person Household | 6,943 (91.7%) | 630 (8.3%) |
| Total Housing Units | 22,574 (80.0%) | 5,633 (20.0%) |
Occupancy by Educational Attainment in Woodbury
| Household Size | Owner-occupied | Renter-occupied |
| Less than High School | 268 (68.4%) | 124 (31.6%) |
| High School Diploma | 1,775 (72.9%) | 659 (27.1%) |
| College/Associate Degree | 4,980 (76.1%) | 1,567 (23.9%) |
| Bachelor's Degree or higher | 15,551 (82.6%) | 3,283 (17.4%) |
Occupancy by Age of Householder in Woodbury
| Age Bracket | # Households | % Households |
| Under 35 Years | 4,780 | 17.0% |
| 35 to 44 Years | 5,792 | 20.5% |
| 45 to 54 Years | 6,176 | 21.9% |
| 55 to 64 Years | 5,495 | 19.5% |
| 65 to 74 Years | 3,912 | 13.9% |
| 75 to 84 Years | 1,532 | 5.4% |
| 85 Years and Over | 520 | 1.8% |
| Total | 28,207 | 100.0% |
Housing Finances in Woodbury
Median Income by Occupancy in Woodbury
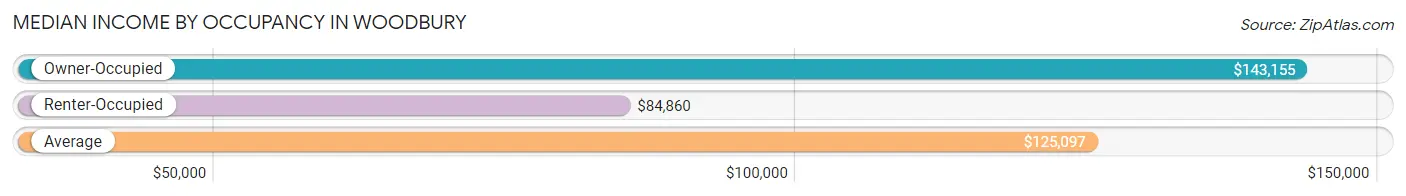
| Occupancy Type | # Households | Median Income |
| Owner-Occupied | 22,574 (80.0%) | $143,155 |
| Renter-Occupied | 5,633 (20.0%) | $84,860 |
| Average | 28,207 (100.0%) | $125,097 |
Occupancy by Householder Income Bracket in Woodbury
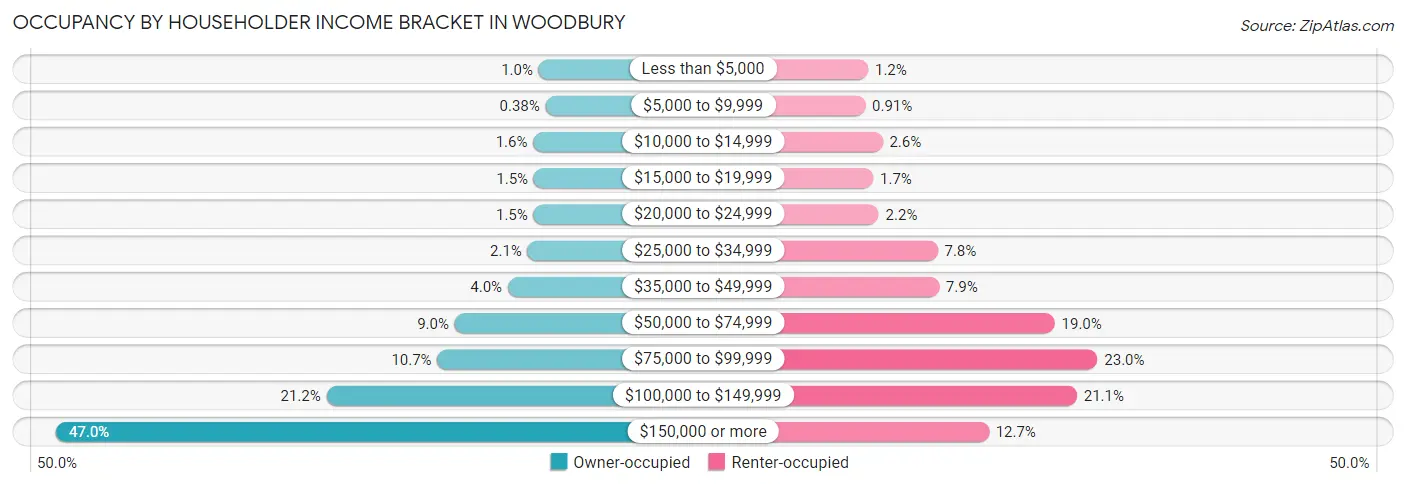
| Income Bracket | Owner-occupied | Renter-occupied |
| Less than $5,000 | 233 (1.0%) | 67 (1.2%) |
| $5,000 to $9,999 | 86 (0.4%) | 51 (0.9%) |
| $10,000 to $14,999 | 350 (1.5%) | 144 (2.6%) |
| $15,000 to $19,999 | 336 (1.5%) | 94 (1.7%) |
| $20,000 to $24,999 | 344 (1.5%) | 124 (2.2%) |
| $25,000 to $34,999 | 472 (2.1%) | 440 (7.8%) |
| $35,000 to $49,999 | 896 (4.0%) | 447 (7.9%) |
| $50,000 to $74,999 | 2,039 (9.0%) | 1,068 (19.0%) |
| $75,000 to $99,999 | 2,410 (10.7%) | 1,297 (23.0%) |
| $100,000 to $149,999 | 4,795 (21.2%) | 1,187 (21.1%) |
| $150,000 or more | 10,613 (47.0%) | 714 (12.7%) |
| Total | 22,574 (100.0%) | 5,633 (100.0%) |
Monthly Housing Cost Tiers in Woodbury
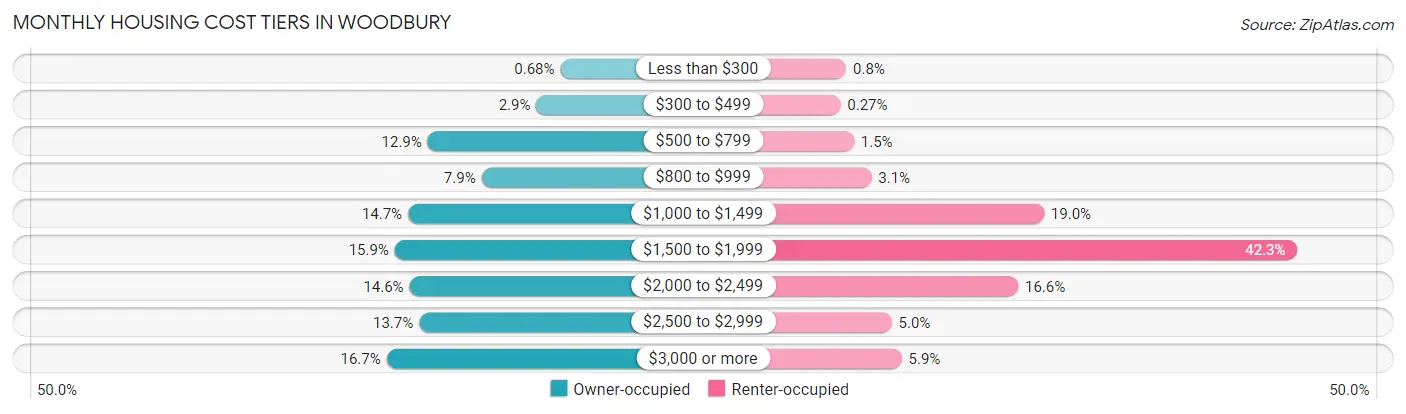
| Monthly Cost | Owner-occupied | Renter-occupied |
| Less than $300 | 154 (0.7%) | 45 (0.8%) |
| $300 to $499 | 653 (2.9%) | 15 (0.3%) |
| $500 to $799 | 2,913 (12.9%) | 85 (1.5%) |
| $800 to $999 | 1,792 (7.9%) | 176 (3.1%) |
| $1,000 to $1,499 | 3,321 (14.7%) | 1,071 (19.0%) |
| $1,500 to $1,999 | 3,596 (15.9%) | 2,385 (42.3%) |
| $2,000 to $2,499 | 3,288 (14.6%) | 937 (16.6%) |
| $2,500 to $2,999 | 3,091 (13.7%) | 281 (5.0%) |
| $3,000 or more | 3,766 (16.7%) | 333 (5.9%) |
| Total | 22,574 (100.0%) | 5,633 (100.0%) |
Physical Housing Characteristics in Woodbury
Housing Structures in Woodbury
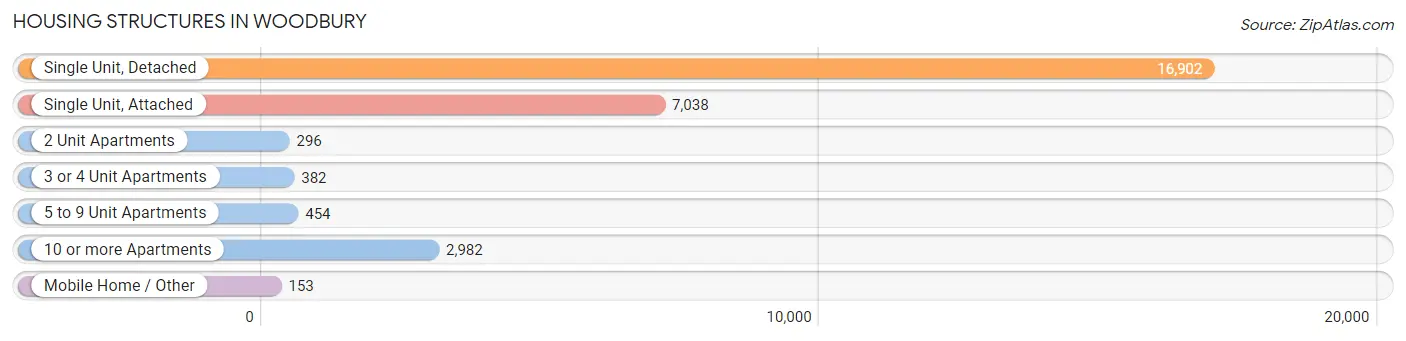
| Structure Type | # Housing Units | % Housing Units |
| Single Unit, Detached | 16,902 | 59.9% |
| Single Unit, Attached | 7,038 | 24.9% |
| 2 Unit Apartments | 296 | 1.1% |
| 3 or 4 Unit Apartments | 382 | 1.3% |
| 5 to 9 Unit Apartments | 454 | 1.6% |
| 10 or more Apartments | 2,982 | 10.6% |
| Mobile Home / Other | 153 | 0.5% |
| Total | 28,207 | 100.0% |
Housing Structures by Occupancy in Woodbury
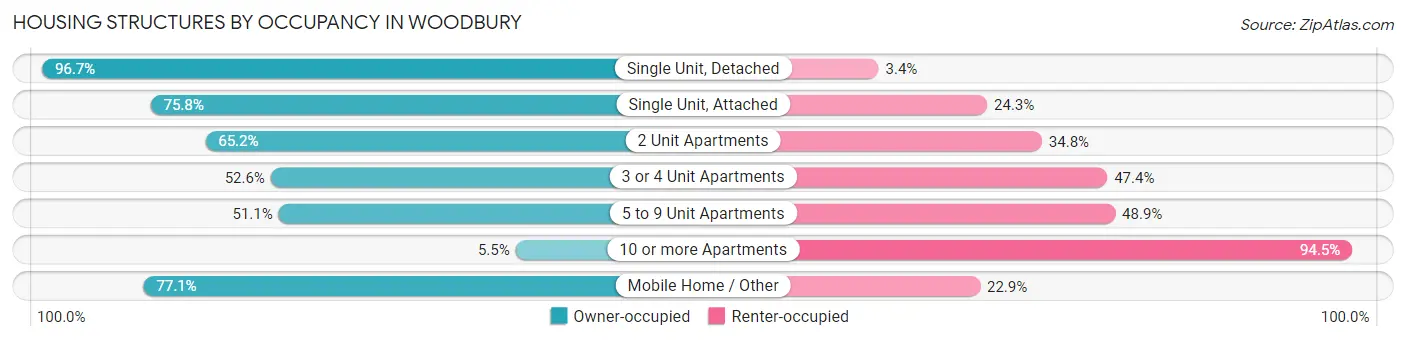
| Structure Type | Owner-occupied | Renter-occupied |
| Single Unit, Detached | 16,336 (96.7%) | 566 (3.4%) |
| Single Unit, Attached | 5,331 (75.7%) | 1,707 (24.2%) |
| 2 Unit Apartments | 193 (65.2%) | 103 (34.8%) |
| 3 or 4 Unit Apartments | 201 (52.6%) | 181 (47.4%) |
| 5 to 9 Unit Apartments | 232 (51.1%) | 222 (48.9%) |
| 10 or more Apartments | 163 (5.5%) | 2,819 (94.5%) |
| Mobile Home / Other | 118 (77.1%) | 35 (22.9%) |
| Total | 22,574 (80.0%) | 5,633 (20.0%) |
Housing Structures by Number of Rooms in Woodbury
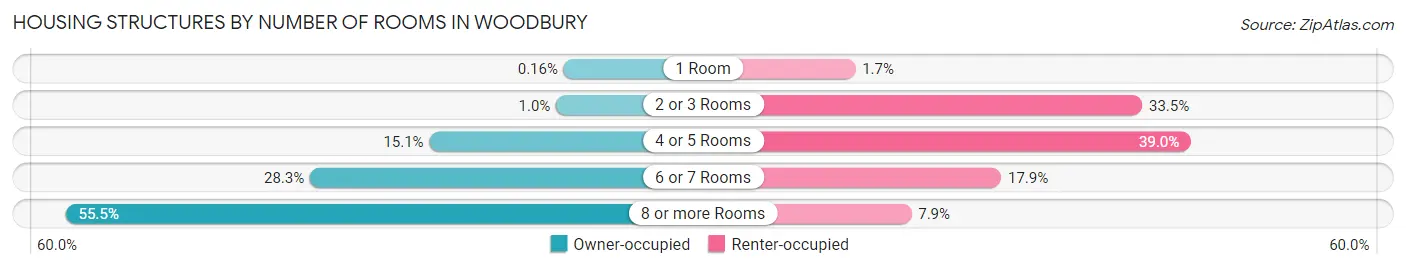
| Number of Rooms | Owner-occupied | Renter-occupied |
| 1 Room | 35 (0.2%) | 96 (1.7%) |
| 2 or 3 Rooms | 225 (1.0%) | 1,889 (33.5%) |
| 4 or 5 Rooms | 3,403 (15.1%) | 2,195 (39.0%) |
| 6 or 7 Rooms | 6,394 (28.3%) | 1,007 (17.9%) |
| 8 or more Rooms | 12,517 (55.4%) | 446 (7.9%) |
| Total | 22,574 (100.0%) | 5,633 (100.0%) |
Housing Structure by Heating Type in Woodbury
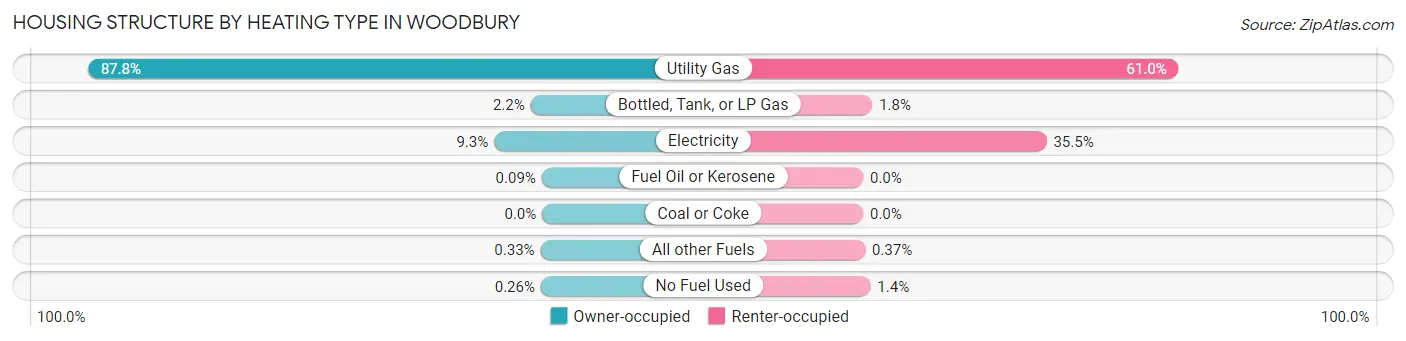
| Heating Type | Owner-occupied | Renter-occupied |
| Utility Gas | 19,820 (87.8%) | 3,435 (61.0%) |
| Bottled, Tank, or LP Gas | 503 (2.2%) | 100 (1.8%) |
| Electricity | 2,096 (9.3%) | 1,997 (35.4%) |
| Fuel Oil or Kerosene | 21 (0.1%) | 0 (0.0%) |
| Coal or Coke | 0 (0.0%) | 0 (0.0%) |
| All other Fuels | 75 (0.3%) | 21 (0.4%) |
| No Fuel Used | 59 (0.3%) | 80 (1.4%) |
| Total | 22,574 (100.0%) | 5,633 (100.0%) |
Household Vehicle Usage in Woodbury
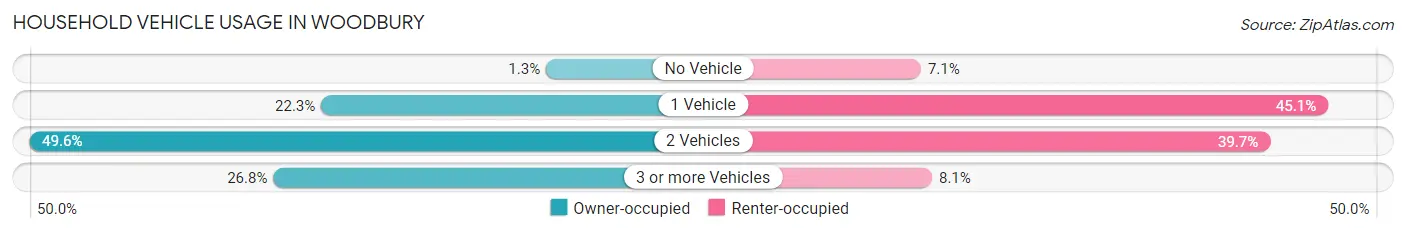
| Vehicles per Household | Owner-occupied | Renter-occupied |
| No Vehicle | 300 (1.3%) | 400 (7.1%) |
| 1 Vehicle | 5,038 (22.3%) | 2,540 (45.1%) |
| 2 Vehicles | 11,189 (49.6%) | 2,235 (39.7%) |
| 3 or more Vehicles | 6,047 (26.8%) | 458 (8.1%) |
| Total | 22,574 (100.0%) | 5,633 (100.0%) |
Real Estate & Mortgages in Woodbury
Real Estate and Mortgage Overview in Woodbury
| Characteristic | Without Mortgage | With Mortgage |
| Housing Units | 6,429 | 16,145 |
| Median Property Value | $400,500 | $413,200 |
| Median Household Income | $109,303 | $8,368 |
| Monthly Housing Costs | $773 | $3,766 |
| Real Estate Taxes | $4,412 | $340 |
Property Value by Mortgage Status in Woodbury
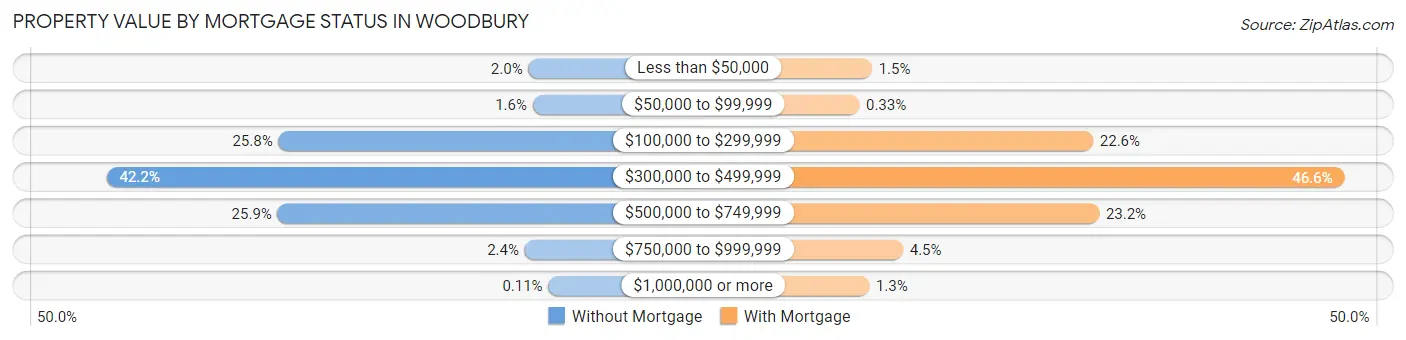
| Property Value | Without Mortgage | With Mortgage |
| Less than $50,000 | 129 (2.0%) | 249 (1.5%) |
| $50,000 to $99,999 | 103 (1.6%) | 54 (0.3%) |
| $100,000 to $299,999 | 1,660 (25.8%) | 3,649 (22.6%) |
| $300,000 to $499,999 | 2,713 (42.2%) | 7,519 (46.6%) |
| $500,000 to $749,999 | 1,665 (25.9%) | 3,742 (23.2%) |
| $750,000 to $999,999 | 152 (2.4%) | 726 (4.5%) |
| $1,000,000 or more | 7 (0.1%) | 206 (1.3%) |
| Total | 6,429 (100.0%) | 16,145 (100.0%) |
Household Income by Mortgage Status in Woodbury
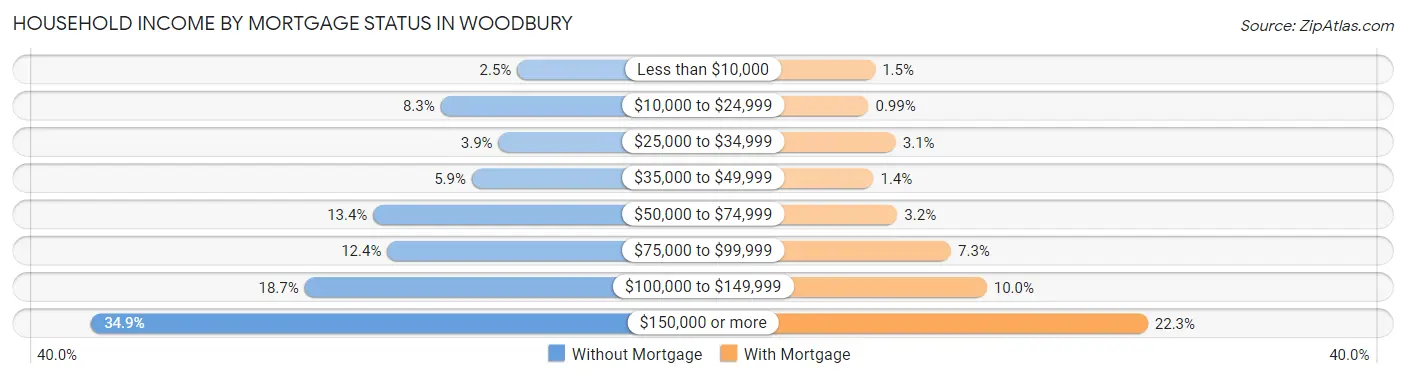
| Household Income | Without Mortgage | With Mortgage |
| Less than $10,000 | 159 (2.5%) | 242 (1.5%) |
| $10,000 to $24,999 | 534 (8.3%) | 160 (1.0%) |
| $25,000 to $34,999 | 251 (3.9%) | 496 (3.1%) |
| $35,000 to $49,999 | 381 (5.9%) | 221 (1.4%) |
| $50,000 to $74,999 | 864 (13.4%) | 515 (3.2%) |
| $75,000 to $99,999 | 795 (12.4%) | 1,175 (7.3%) |
| $100,000 to $149,999 | 1,200 (18.7%) | 1,615 (10.0%) |
| $150,000 or more | 2,245 (34.9%) | 3,595 (22.3%) |
| Total | 6,429 (100.0%) | 16,145 (100.0%) |
Property Value to Household Income Ratio in Woodbury
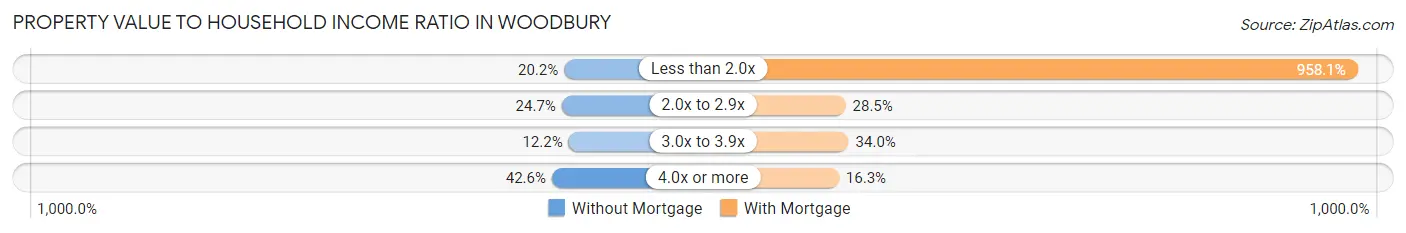
| Value-to-Income Ratio | Without Mortgage | With Mortgage |
| Less than 2.0x | 1,300 (20.2%) | 154,683 (958.1%) |
| 2.0x to 2.9x | 1,586 (24.7%) | 4,603 (28.5%) |
| 3.0x to 3.9x | 786 (12.2%) | 5,493 (34.0%) |
| 4.0x or more | 2,741 (42.6%) | 2,638 (16.3%) |
| Total | 6,429 (100.0%) | 16,145 (100.0%) |
Real Estate Taxes by Mortgage Status in Woodbury
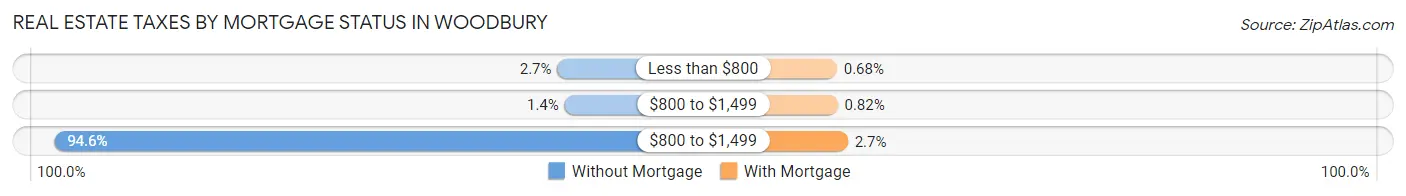
| Property Taxes | Without Mortgage | With Mortgage |
| Less than $800 | 173 (2.7%) | 109 (0.7%) |
| $800 to $1,499 | 88 (1.4%) | 133 (0.8%) |
| $800 to $1,499 | 6,081 (94.6%) | 433 (2.7%) |
| Total | 6,429 (100.0%) | 16,145 (100.0%) |
Health & Disability in Woodbury
Health Insurance Coverage by Age in Woodbury
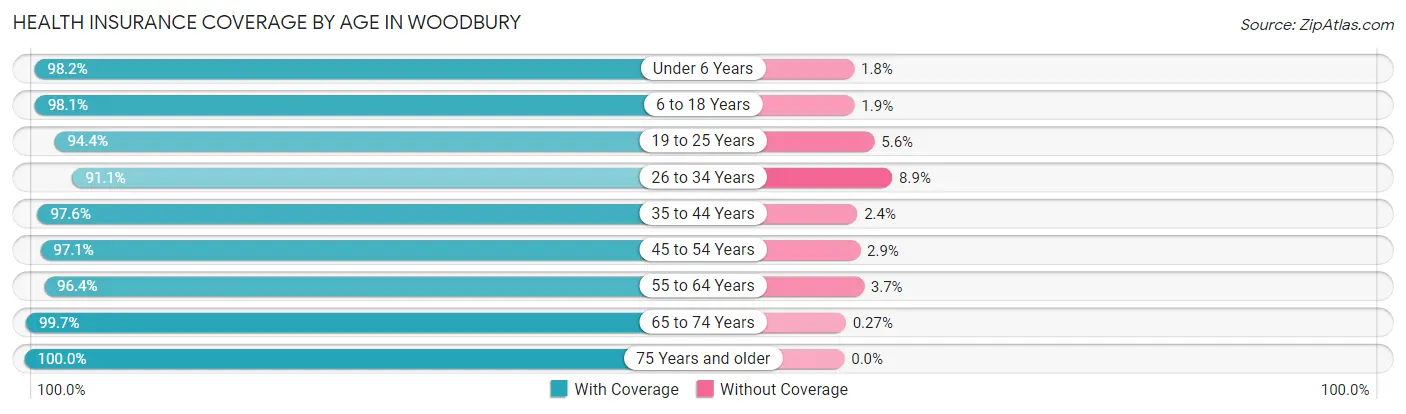
| Age Bracket | With Coverage | Without Coverage |
| Under 6 Years | 5,171 (98.2%) | 96 (1.8%) |
| 6 to 18 Years | 15,259 (98.1%) | 294 (1.9%) |
| 19 to 25 Years | 5,606 (94.4%) | 333 (5.6%) |
| 26 to 34 Years | 6,802 (91.1%) | 667 (8.9%) |
| 35 to 44 Years | 11,088 (97.6%) | 274 (2.4%) |
| 45 to 54 Years | 10,405 (97.1%) | 315 (2.9%) |
| 55 to 64 Years | 9,240 (96.4%) | 350 (3.6%) |
| 65 to 74 Years | 6,265 (99.7%) | 17 (0.3%) |
| 75 Years and older | 3,132 (100.0%) | 0 (0.0%) |
| Total | 72,968 (96.9%) | 2,346 (3.1%) |
Health Insurance Coverage by Citizenship Status in Woodbury
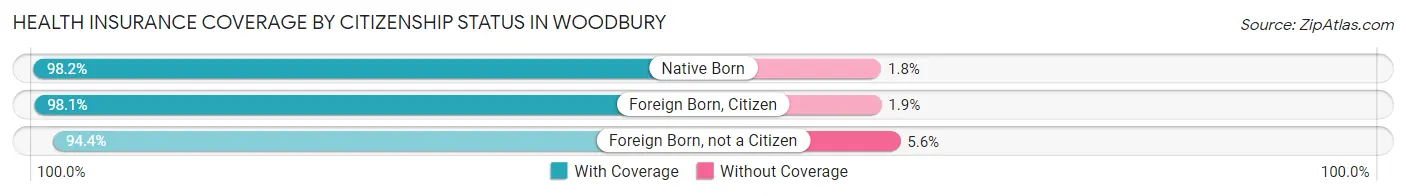
| Citizenship Status | With Coverage | Without Coverage |
| Native Born | 5,171 (98.2%) | 96 (1.8%) |
| Foreign Born, Citizen | 15,259 (98.1%) | 294 (1.9%) |
| Foreign Born, not a Citizen | 5,606 (94.4%) | 333 (5.6%) |
Health Insurance Coverage by Household Income in Woodbury
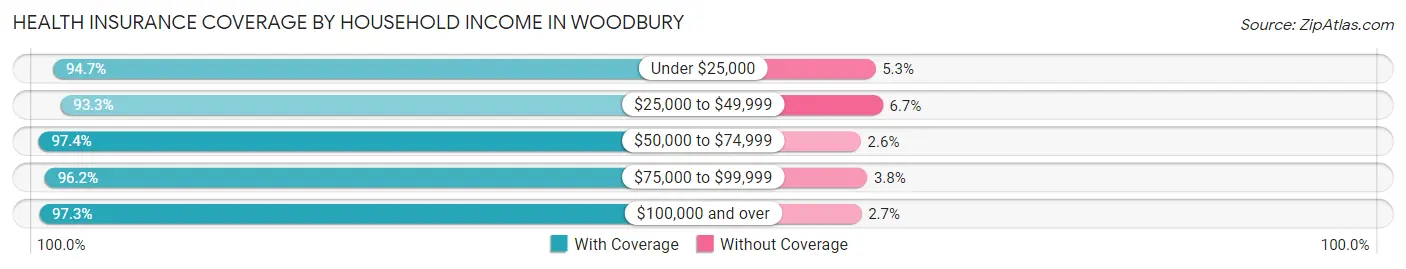
| Household Income | With Coverage | Without Coverage |
| Under $25,000 | 3,081 (94.7%) | 173 (5.3%) |
| $25,000 to $49,999 | 3,512 (93.3%) | 252 (6.7%) |
| $50,000 to $74,999 | 6,261 (97.4%) | 167 (2.6%) |
| $75,000 to $99,999 | 7,173 (96.2%) | 282 (3.8%) |
| $100,000 and over | 52,797 (97.3%) | 1,465 (2.7%) |
Public vs Private Health Insurance Coverage by Age in Woodbury
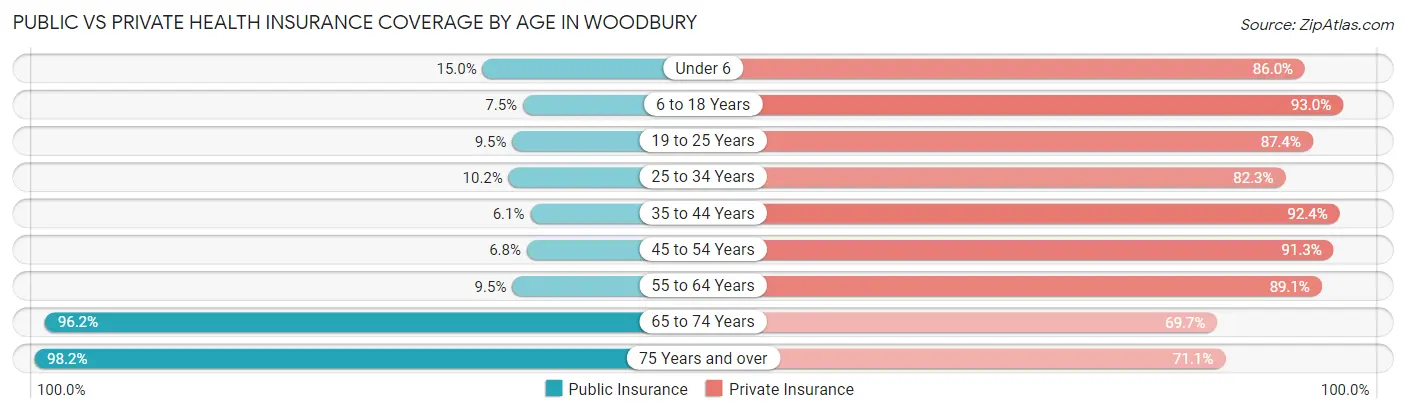
| Age Bracket | Public Insurance | Private Insurance |
| Under 6 | 790 (15.0%) | 4,527 (86.0%) |
| 6 to 18 Years | 1,167 (7.5%) | 14,469 (93.0%) |
| 19 to 25 Years | 563 (9.5%) | 5,191 (87.4%) |
| 25 to 34 Years | 759 (10.2%) | 6,149 (82.3%) |
| 35 to 44 Years | 698 (6.1%) | 10,498 (92.4%) |
| 45 to 54 Years | 727 (6.8%) | 9,785 (91.3%) |
| 55 to 64 Years | 910 (9.5%) | 8,542 (89.1%) |
| 65 to 74 Years | 6,045 (96.2%) | 4,378 (69.7%) |
| 75 Years and over | 3,077 (98.2%) | 2,228 (71.1%) |
| Total | 14,736 (19.6%) | 65,767 (87.3%) |
Disability Status by Sex by Age in Woodbury
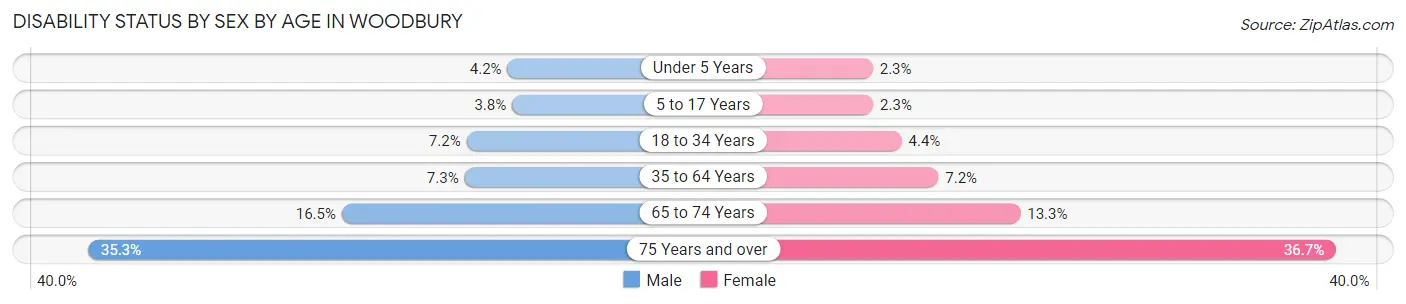
| Age Bracket | Male | Female |
| Under 5 Years | 89 (4.2%) | 44 (2.3%) |
| 5 to 17 Years | 338 (3.8%) | 163 (2.3%) |
| 18 to 34 Years | 484 (7.2%) | 336 (4.4%) |
| 35 to 64 Years | 1,139 (7.3%) | 1,158 (7.2%) |
| 65 to 74 Years | 456 (16.5%) | 465 (13.3%) |
| 75 Years and over | 509 (35.3%) | 620 (36.7%) |
Disability Class by Sex by Age in Woodbury
Disability Class: Hearing Difficulty
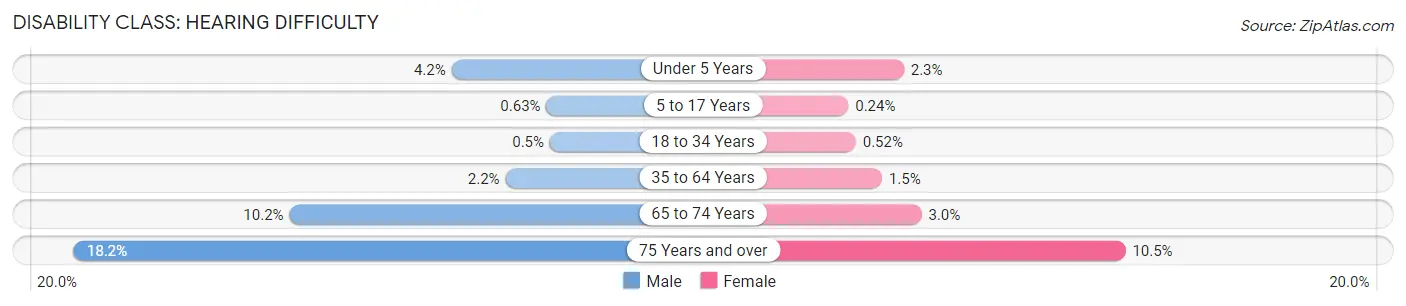
| Age Bracket | Male | Female |
| Under 5 Years | 89 (4.2%) | 44 (2.3%) |
| 5 to 17 Years | 56 (0.6%) | 17 (0.2%) |
| 18 to 34 Years | 34 (0.5%) | 39 (0.5%) |
| 35 to 64 Years | 333 (2.1%) | 240 (1.5%) |
| 65 to 74 Years | 282 (10.2%) | 104 (3.0%) |
| 75 Years and over | 262 (18.2%) | 178 (10.5%) |
Disability Class: Vision Difficulty
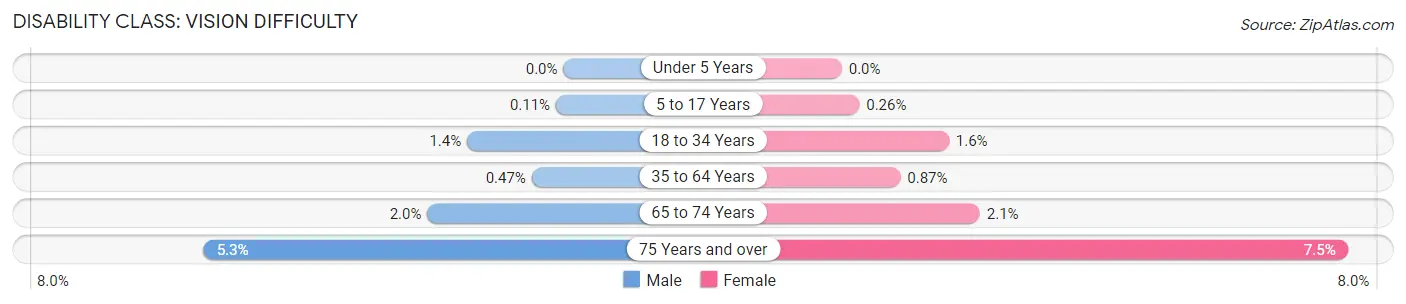
| Age Bracket | Male | Female |
| Under 5 Years | 0 (0.0%) | 0 (0.0%) |
| 5 to 17 Years | 10 (0.1%) | 18 (0.3%) |
| 18 to 34 Years | 96 (1.4%) | 120 (1.6%) |
| 35 to 64 Years | 73 (0.5%) | 141 (0.9%) |
| 65 to 74 Years | 56 (2.0%) | 72 (2.1%) |
| 75 Years and over | 77 (5.3%) | 127 (7.5%) |
Disability Class: Cognitive Difficulty
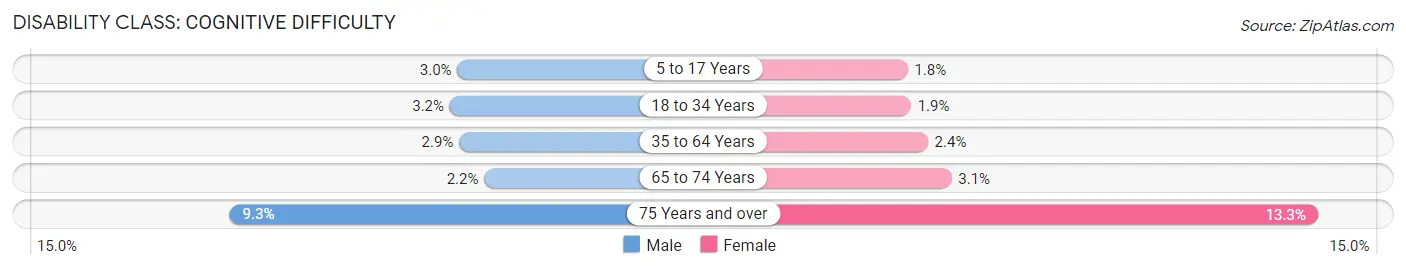
| Age Bracket | Male | Female |
| 5 to 17 Years | 262 (2.9%) | 128 (1.8%) |
| 18 to 34 Years | 213 (3.2%) | 145 (1.9%) |
| 35 to 64 Years | 450 (2.9%) | 386 (2.4%) |
| 65 to 74 Years | 61 (2.2%) | 107 (3.0%) |
| 75 Years and over | 134 (9.3%) | 224 (13.3%) |
Disability Class: Ambulatory Difficulty
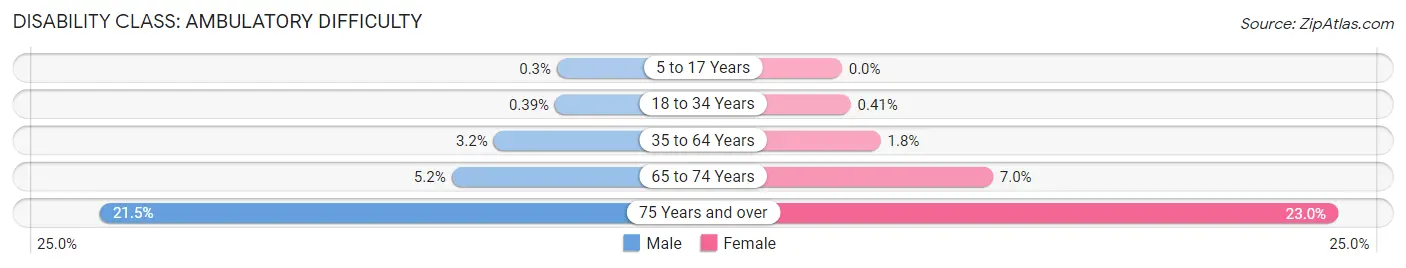
| Age Bracket | Male | Female |
| 5 to 17 Years | 27 (0.3%) | 0 (0.0%) |
| 18 to 34 Years | 26 (0.4%) | 31 (0.4%) |
| 35 to 64 Years | 502 (3.2%) | 291 (1.8%) |
| 65 to 74 Years | 144 (5.2%) | 246 (7.0%) |
| 75 Years and over | 310 (21.5%) | 389 (23.0%) |
Disability Class: Self-Care Difficulty
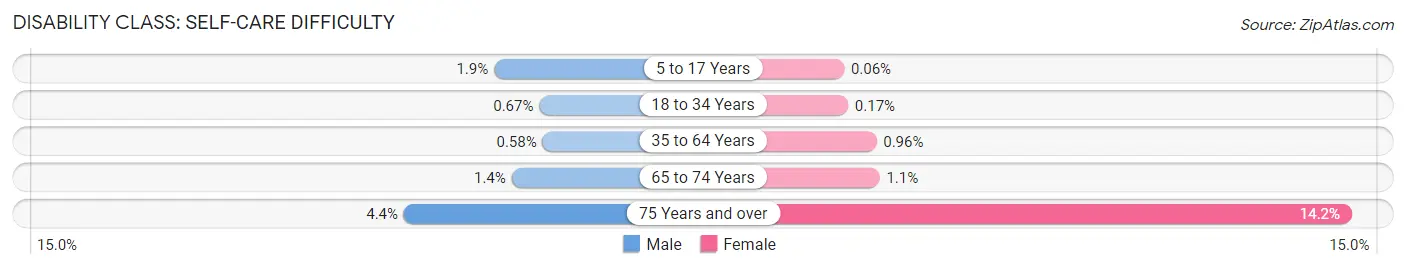
| Age Bracket | Male | Female |
| 5 to 17 Years | 171 (1.9%) | 4 (0.1%) |
| 18 to 34 Years | 45 (0.7%) | 13 (0.2%) |
| 35 to 64 Years | 90 (0.6%) | 155 (1.0%) |
| 65 to 74 Years | 40 (1.4%) | 37 (1.1%) |
| 75 Years and over | 64 (4.4%) | 240 (14.2%) |
Technology Access in Woodbury
Computing Device Access in Woodbury
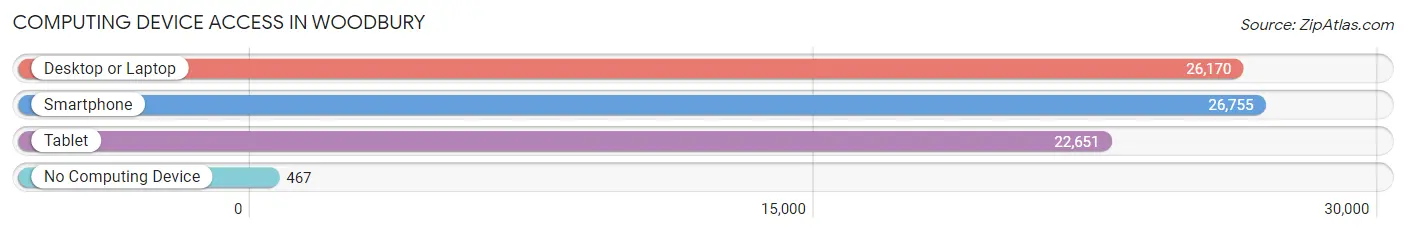
| Device Type | # Households | % Households |
| Desktop or Laptop | 26,170 | 92.8% |
| Smartphone | 26,755 | 94.9% |
| Tablet | 22,651 | 80.3% |
| No Computing Device | 467 | 1.7% |
| Total | 28,207 | 100.0% |
Internet Access in Woodbury
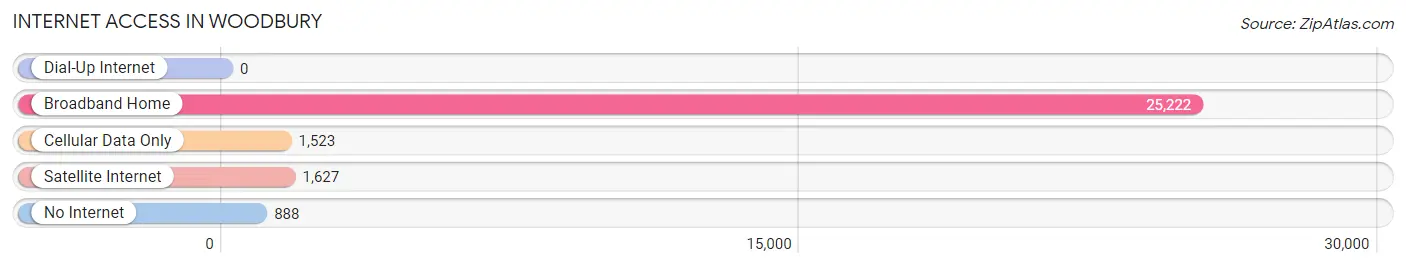
| Internet Type | # Households | % Households |
| Dial-Up Internet | 0 | 0.0% |
| Broadband Home | 25,222 | 89.4% |
| Cellular Data Only | 1,523 | 5.4% |
| Satellite Internet | 1,627 | 5.8% |
| No Internet | 888 | 3.2% |
| Total | 28,207 | 100.0% |
Woodbury Summary
Woodbury, Minnesota is a city located in Washington County, Minnesota, United States. It is part of the Twin Cities metropolitan area and is located just east of Saint Paul. As of the 2010 census, the city had a population of 61,961, making it the ninth-largest city in Minnesota.
History
The area that is now Woodbury was first settled in 1844 by John McKusick and his family. The area was originally known as Red Rock, named for the red sandstone bluffs that line the banks of the nearby St. Croix River. In 1854, the area was renamed Woodbury after Levi Woodbury, a former United States Senator from New Hampshire.
In the late 19th century, the area began to grow rapidly as a result of the construction of the Stillwater and St. Paul Railroad. The railroad connected the area to the Twin Cities and allowed for the development of the area's first industries, including lumber mills, brickyards, and a flour mill.
In the early 20th century, Woodbury continued to grow as a result of the construction of the Woodbury-Oakdale Interurban Railway. The railway connected Woodbury to the nearby cities of Oakdale and Stillwater, allowing for the development of new industries and businesses.
In the 1950s, Woodbury began to experience a population boom as a result of the construction of Interstate 94. The highway connected Woodbury to the Twin Cities and allowed for the development of new residential neighborhoods.
Geography
Woodbury is located in Washington County, Minnesota, United States. It is part of the Twin Cities metropolitan area and is located just east of Saint Paul. The city has a total area of 33.2 square miles, of which 32.9 square miles is land and 0.3 square miles is water.
The city is located on the banks of the St. Croix River and is bordered by the cities of Oakdale, Lake Elmo, and Cottage Grove. The city is also located near the cities of Stillwater and Hudson, Wisconsin.
Economy
Woodbury is home to a variety of businesses and industries. The city is home to several large employers, including 3M, Andersen Windows, and the Woodbury Corporation. The city is also home to a variety of small businesses, including restaurants, retail stores, and professional services.
The city is also home to a variety of shopping centers, including the Woodbury Lakes Shopping Center, the Tamarack Village Shopping Center, and the Valley Creek Mall.
Demographics
As of the 2010 census, the city had a population of 61,961. The racial makeup of the city was 84.2% White, 5.3% African American, 0.3% Native American, 5.7% Asian, 0.1% Pacific Islander, 1.7% from other races, and 2.1% from two or more races. Hispanic or Latino of any race were 4.3% of the population.
The median income for a household in the city was $76,845, and the median income for a family was $90,945. The per capita income for the city was $37,945. About 3.2% of families and 4.7% of the population were below the poverty line, including 5.2% of those under age 18 and 4.2% of those age 65 or over.
Common Questions
What is Per Capita Income in Woodbury?
Per Capita income in Woodbury is $58,891.
What is the Median Family Income in Woodbury?
Median Family Income in Woodbury is $148,164.
What is the Median Household income in Woodbury?
Median Household Income in Woodbury is $125,097.
What is Income or Wage Gap in Woodbury?
Income or Wage Gap in Woodbury is 34.3%.
Women in Woodbury earn 65.7 cents for every dollar earned by a man.
What is Family Income Deficit in Woodbury?
Family Income Deficit in Woodbury is $11,084.
Families that are below poverty line in Woodbury earn $11,084 less on average than the poverty threshold level.
What is Inequality or Gini Index in Woodbury?
Inequality or Gini Index in Woodbury is 0.41.
What is the Total Population of Woodbury?
Total Population of Woodbury is 75,549.
What is the Total Male Population of Woodbury?
Total Male Population of Woodbury is 37,558.
What is the Total Female Population of Woodbury?
Total Female Population of Woodbury is 37,991.
What is the Ratio of Males per 100 Females in Woodbury?
There are 98.86 Males per 100 Females in Woodbury.
What is the Ratio of Females per 100 Males in Woodbury?
There are 101.15 Females per 100 Males in Woodbury.
What is the Median Population Age in Woodbury?
Median Population Age in Woodbury is 38.0 Years.
What is the Average Family Size in Woodbury
Average Family Size in Woodbury is 3.2 People.
What is the Average Household Size in Woodbury
Average Household Size in Woodbury is 2.7 People.
How Large is the Labor Force in Woodbury?
There are 42,630 People in the Labor Forcein in Woodbury.
What is the Percentage of People in the Labor Force in Woodbury?
73.6% of People are in the Labor Force in Woodbury.
What is the Unemployment Rate in Woodbury?
Unemployment Rate in Woodbury is 3.2%.