Lewiston, ME Map & Demographics
Lewiston Map
Lewiston Overview
$29,223
PER CAPITA INCOME
$72,649
AVG FAMILY INCOME
$54,317
AVG HOUSEHOLD INCOME
14.9%
WAGE / INCOME GAP [ % ]
85.1¢/ $1
WAGE / INCOME GAP [ $ ]
$10,773
FAMILY INCOME DEFICIT
0.44
INEQUALITY / GINI INDEX
37,577
TOTAL POPULATION
18,508
MALE POPULATION
19,069
FEMALE POPULATION
97.06
MALES / 100 FEMALES
103.03
FEMALES / 100 MALES
39.5
MEDIAN AGE
3.0
AVG FAMILY SIZE
2.2
AVG HOUSEHOLD SIZE
18,997
LABOR FORCE [ PEOPLE ]
61.4%
PERCENT IN LABOR FORCE
5.6%
UNEMPLOYMENT RATE
Lewiston Zip Codes
Lewiston Area Codes
Income in Lewiston
Income Overview in Lewiston
Per Capita Income in Lewiston is $29,223, while median incomes of families and households are $72,649 and $54,317 respectively.
| Characteristic | Number | Measure |
| Per Capita Income | 37,577 | $29,223 |
| Median Family Income | 8,350 | $72,649 |
| Mean Family Income | 8,350 | $84,231 |
| Median Household Income | 15,611 | $54,317 |
| Mean Household Income | 15,611 | $69,389 |
| Income Deficit | 8,350 | $10,773 |
| Wage / Income Gap (%) | 37,577 | 14.94% |
| Wage / Income Gap ($) | 37,577 | 85.06¢ per $1 |
| Gini / Inequality Index | 37,577 | 0.44 |
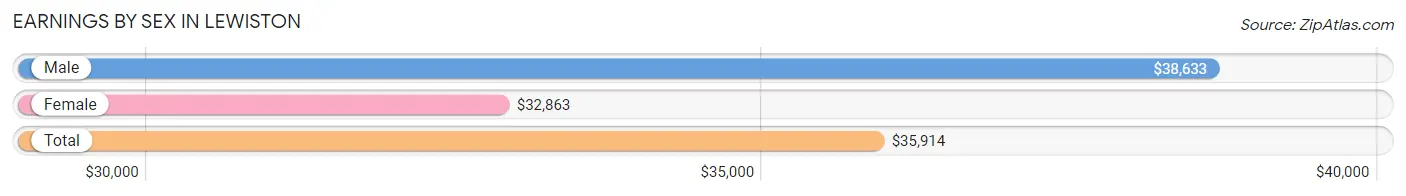
Earnings by Sex in Lewiston
Average Earnings in Lewiston are $35,914, $38,633 for men and $32,863 for women, a difference of 14.9%.
| Sex | Number | Average Earnings |
| Male | 10,232 (49.9%) | $38,633 |
| Female | 10,287 (50.1%) | $32,863 |
| Total | 20,519 (100.0%) | $35,914 |
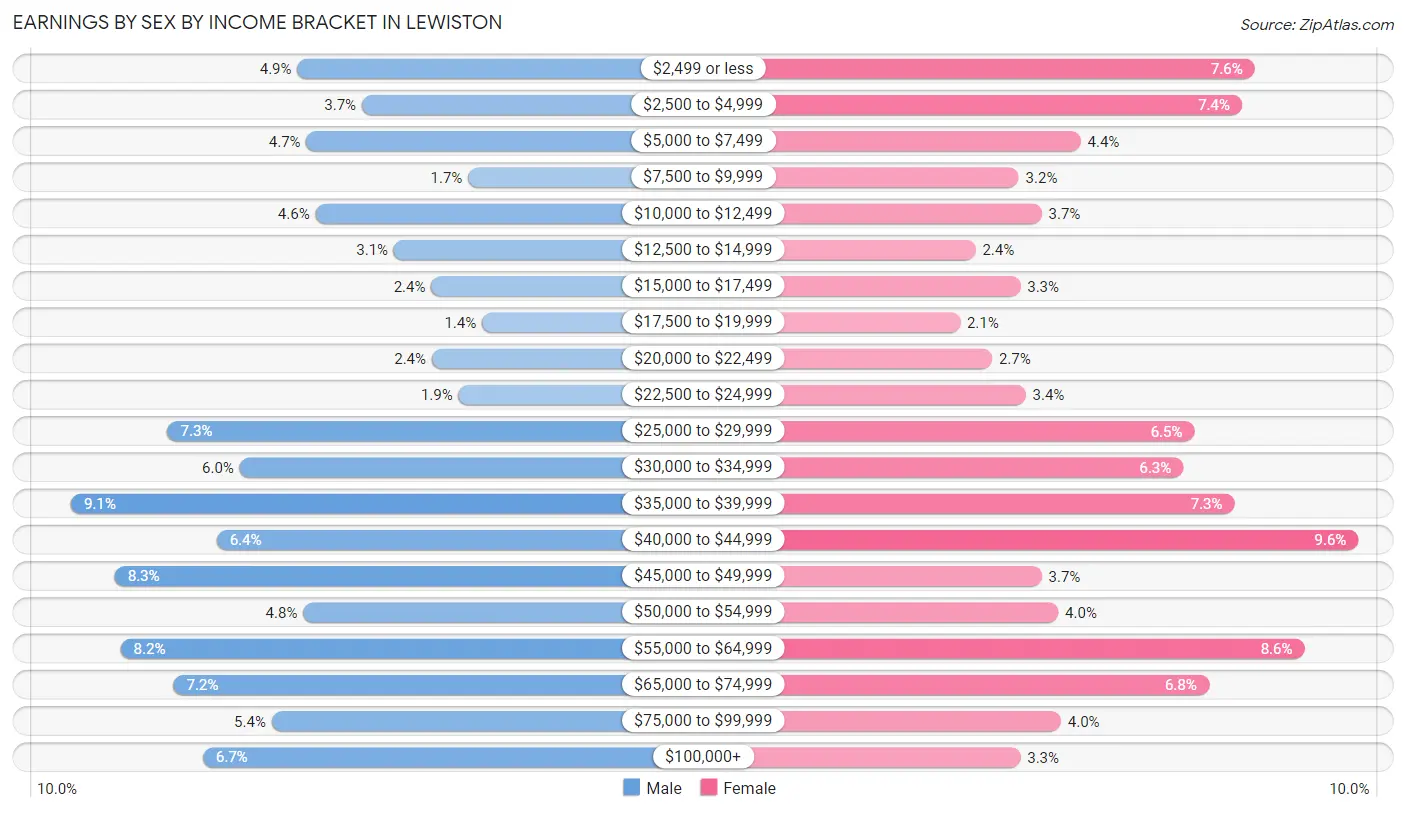
Earnings by Sex by Income Bracket in Lewiston
The most common earnings brackets in Lewiston are $35,000 to $39,999 for men (934 | 9.1%) and $40,000 to $44,999 for women (986 | 9.6%).
| Income | Male | Female |
| $2,499 or less | 500 (4.9%) | 786 (7.6%) |
| $2,500 to $4,999 | 377 (3.7%) | 761 (7.4%) |
| $5,000 to $7,499 | 483 (4.7%) | 451 (4.4%) |
| $7,500 to $9,999 | 173 (1.7%) | 331 (3.2%) |
| $10,000 to $12,499 | 466 (4.5%) | 375 (3.6%) |
| $12,500 to $14,999 | 315 (3.1%) | 248 (2.4%) |
| $15,000 to $17,499 | 244 (2.4%) | 334 (3.3%) |
| $17,500 to $19,999 | 146 (1.4%) | 218 (2.1%) |
| $20,000 to $22,499 | 242 (2.4%) | 280 (2.7%) |
| $22,500 to $24,999 | 191 (1.9%) | 345 (3.4%) |
| $25,000 to $29,999 | 749 (7.3%) | 670 (6.5%) |
| $30,000 to $34,999 | 611 (6.0%) | 648 (6.3%) |
| $35,000 to $39,999 | 934 (9.1%) | 747 (7.3%) |
| $40,000 to $44,999 | 655 (6.4%) | 986 (9.6%) |
| $45,000 to $49,999 | 850 (8.3%) | 375 (3.6%) |
| $50,000 to $54,999 | 489 (4.8%) | 407 (4.0%) |
| $55,000 to $64,999 | 839 (8.2%) | 882 (8.6%) |
| $65,000 to $74,999 | 738 (7.2%) | 697 (6.8%) |
| $75,000 to $99,999 | 549 (5.4%) | 412 (4.0%) |
| $100,000+ | 681 (6.7%) | 334 (3.3%) |
| Total | 10,232 (100.0%) | 10,287 (100.0%) |
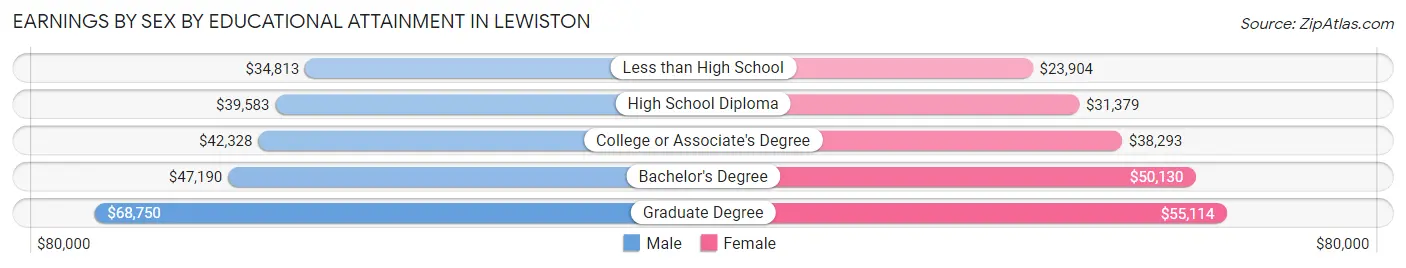
Earnings by Sex by Educational Attainment in Lewiston
Average earnings in Lewiston are $43,008 for men and $37,389 for women, a difference of 13.1%. Men with an educational attainment of graduate degree enjoy the highest average annual earnings of $68,750, while those with less than high school education earn the least with $34,813. Women with an educational attainment of graduate degree earn the most with the average annual earnings of $55,114, while those with less than high school education have the smallest earnings of $23,904.
| Educational Attainment | Male Income | Female Income |
| Less than High School | $34,813 | $23,904 |
| High School Diploma | $39,583 | $31,379 |
| College or Associate's Degree | $42,328 | $38,293 |
| Bachelor's Degree | $47,190 | $50,130 |
| Graduate Degree | $68,750 | $55,114 |
| Total | $43,008 | $37,389 |
Family Income in Lewiston
Family Income Brackets in Lewiston
According to the Lewiston family income data, there are 1,603 families falling into the $100,000 to $149,999 income range, which is the most common income bracket and makes up 19.2% of all families. Conversely, the $10,000 to $14,999 income bracket is the least frequent group with only 200 families (2.4%) belonging to this category.
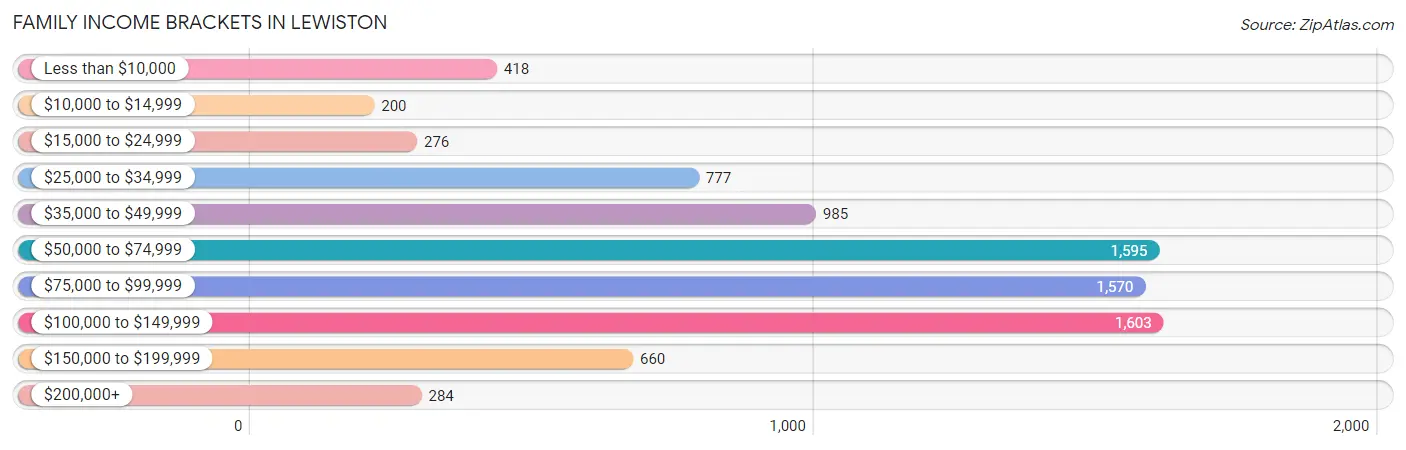
| Income Bracket | # Families | % Families |
| Less than $10,000 | 418 | 5.0% |
| $10,000 to $14,999 | 200 | 2.4% |
| $15,000 to $24,999 | 276 | 3.3% |
| $25,000 to $34,999 | 777 | 9.3% |
| $35,000 to $49,999 | 985 | 11.8% |
| $50,000 to $74,999 | 1,595 | 19.1% |
| $75,000 to $99,999 | 1,570 | 18.8% |
| $100,000 to $149,999 | 1,603 | 19.2% |
| $150,000 to $199,999 | 660 | 7.9% |
| $200,000+ | 284 | 3.4% |
Family Income by Famaliy Size in Lewiston
6-person families (151 | 1.8%) account for the highest median family income in Lewiston with $121,157 per family, while 2-person families (4,338 | 51.9%) have the highest median income of $33,518 per family member.
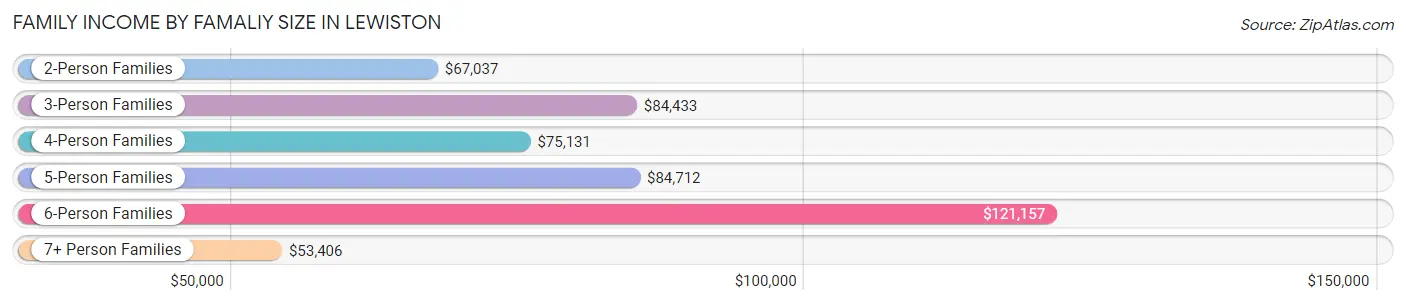
| Income Bracket | # Families | Median Income |
| 2-Person Families | 4,338 (51.9%) | $67,037 |
| 3-Person Families | 1,954 (23.4%) | $84,433 |
| 4-Person Families | 1,439 (17.2%) | $75,131 |
| 5-Person Families | 335 (4.0%) | $84,712 |
| 6-Person Families | 151 (1.8%) | $121,157 |
| 7+ Person Families | 133 (1.6%) | $53,406 |
| Total | 8,350 (100.0%) | $72,649 |
Family Income by Number of Earners in Lewiston
The median family income in Lewiston is $72,649, with families comprising 3+ earners (994) having the highest median family income of $130,926, while families with no earners (1,254) have the lowest median family income of $37,083, accounting for 11.9% and 15.0% of families, respectively.
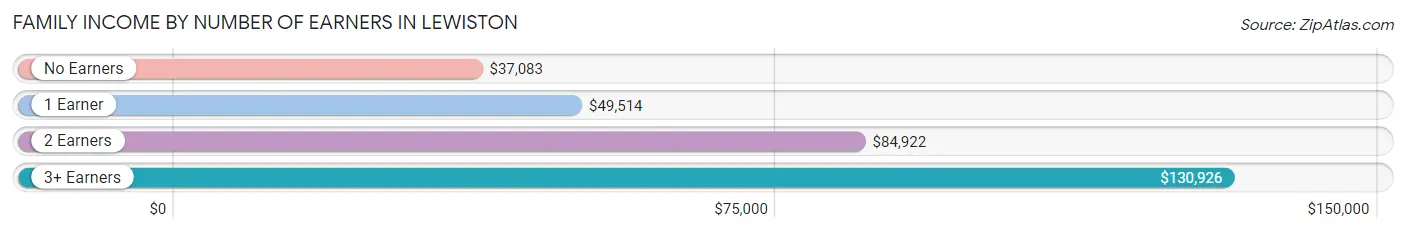
| Number of Earners | # Families | Median Income |
| No Earners | 1,254 (15.0%) | $37,083 |
| 1 Earner | 2,456 (29.4%) | $49,514 |
| 2 Earners | 3,646 (43.7%) | $84,922 |
| 3+ Earners | 994 (11.9%) | $130,926 |
| Total | 8,350 (100.0%) | $72,649 |
Household Income in Lewiston
Household Income Brackets in Lewiston
With 2,654 households falling in the category, the $50,000 to $74,999 income range is the most frequent in Lewiston, accounting for 17.0% of all households. In contrast, only 390 households (2.5%) fall into the $200,000+ income bracket, making it the least populous group.
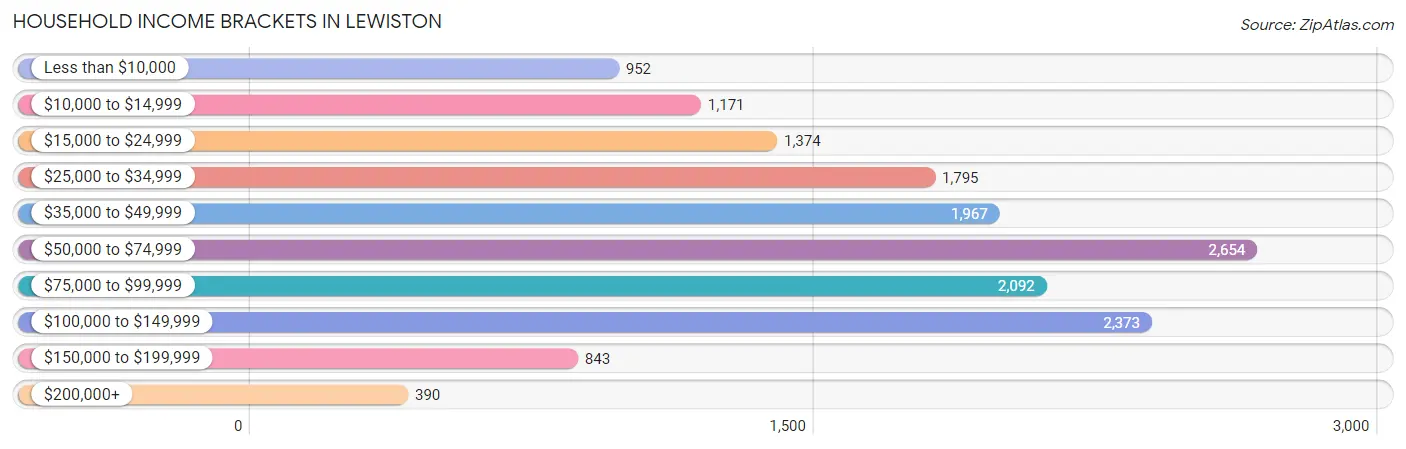
| Income Bracket | # Households | % Households |
| Less than $10,000 | 952 | 6.1% |
| $10,000 to $14,999 | 1,171 | 7.5% |
| $15,000 to $24,999 | 1,374 | 8.8% |
| $25,000 to $34,999 | 1,795 | 11.5% |
| $35,000 to $49,999 | 1,967 | 12.6% |
| $50,000 to $74,999 | 2,654 | 17.0% |
| $75,000 to $99,999 | 2,092 | 13.4% |
| $100,000 to $149,999 | 2,373 | 15.2% |
| $150,000 to $199,999 | 843 | 5.4% |
| $200,000+ | 390 | 2.5% |
Household Income by Householder Age in Lewiston
The median household income in Lewiston is $54,317, with the highest median household income of $64,129 found in the 45 to 64 years age bracket for the primary householder. A total of 5,918 households (37.9%) fall into this category. Meanwhile, the 65+ years age bracket for the primary householder has the lowest median household income of $36,339, with 4,373 households (28.0%) in this group.
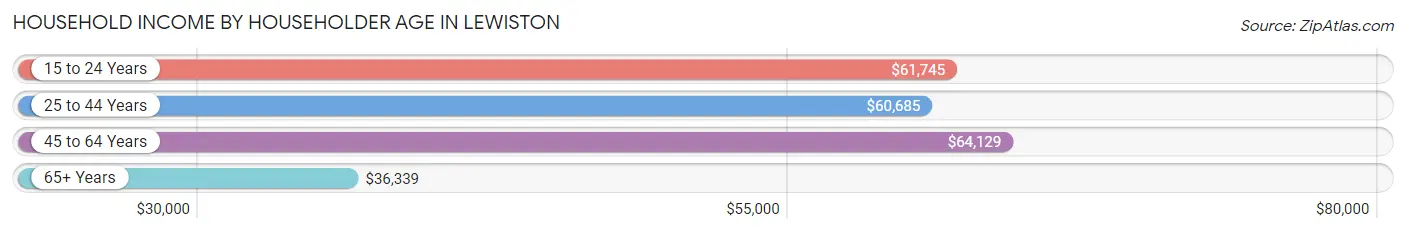
| Income Bracket | # Households | Median Income |
| 15 to 24 Years | 506 (3.2%) | $61,745 |
| 25 to 44 Years | 4,814 (30.8%) | $60,685 |
| 45 to 64 Years | 5,918 (37.9%) | $64,129 |
| 65+ Years | 4,373 (28.0%) | $36,339 |
| Total | 15,611 (100.0%) | $54,317 |
Poverty in Lewiston
Income Below Poverty by Sex and Age in Lewiston
With 18.8% poverty level for males and 16.9% for females among the residents of Lewiston, 5 year old males and under 5 year old females are the most vulnerable to poverty, with 102 males (61.1%) and 347 females (32.5%) in their respective age groups living below the poverty level.
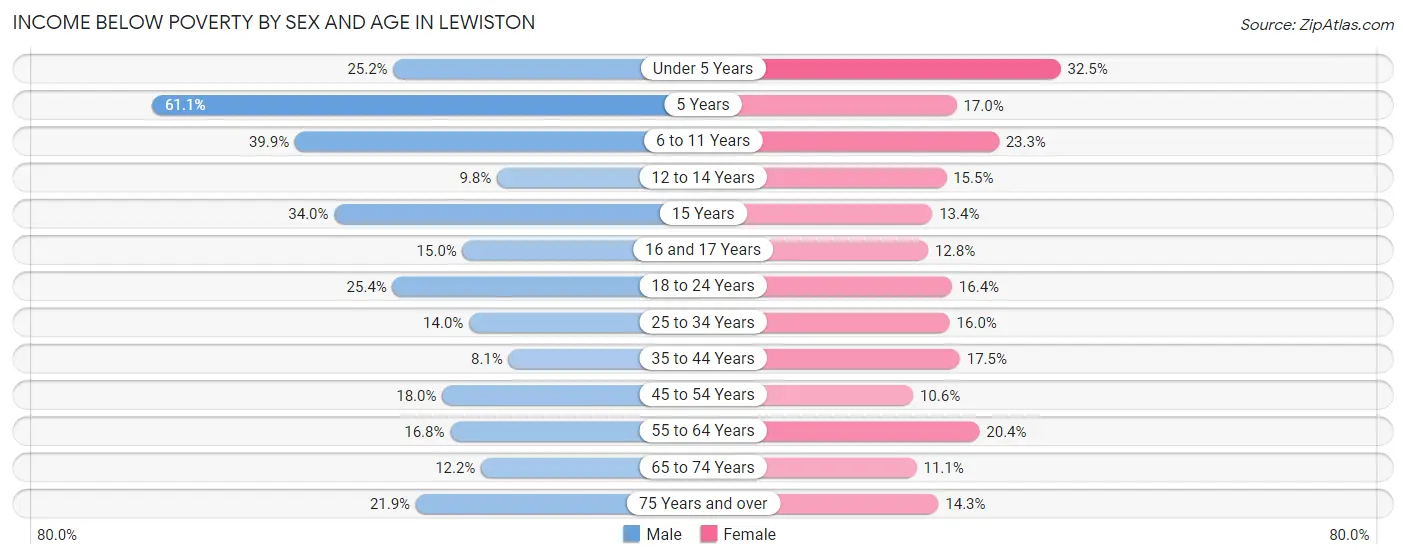
| Age Bracket | Male | Female |
| Under 5 Years | 332 (25.2%) | 347 (32.5%) |
| 5 Years | 102 (61.1%) | 39 (17.0%) |
| 6 to 11 Years | 420 (39.9%) | 267 (23.3%) |
| 12 to 14 Years | 63 (9.8%) | 47 (15.5%) |
| 15 Years | 136 (34.0%) | 27 (13.4%) |
| 16 and 17 Years | 55 (14.9%) | 64 (12.8%) |
| 18 to 24 Years | 378 (25.4%) | 251 (16.4%) |
| 25 to 34 Years | 357 (14.0%) | 421 (16.0%) |
| 35 to 44 Years | 151 (8.1%) | 350 (17.5%) |
| 45 to 54 Years | 405 (18.0%) | 228 (10.6%) |
| 55 to 64 Years | 409 (16.8%) | 534 (20.4%) |
| 65 to 74 Years | 215 (12.2%) | 200 (11.1%) |
| 75 Years and over | 257 (21.9%) | 225 (14.3%) |
| Total | 3,280 (18.8%) | 3,000 (16.9%) |
Income Above Poverty by Sex and Age in Lewiston
According to the poverty statistics in Lewiston, males aged 35 to 44 years and females aged 45 to 54 years are the age groups that are most secure financially, with 91.9% of males and 89.4% of females in these age groups living above the poverty line.
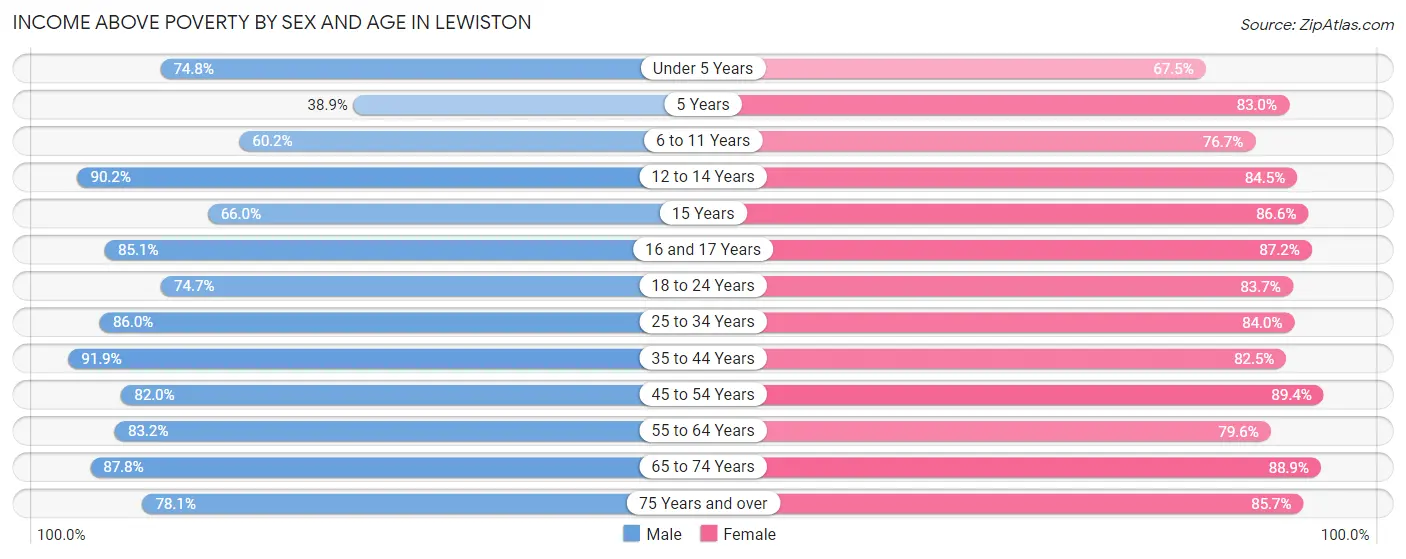
| Age Bracket | Male | Female |
| Under 5 Years | 984 (74.8%) | 721 (67.5%) |
| 5 Years | 65 (38.9%) | 190 (83.0%) |
| 6 to 11 Years | 634 (60.2%) | 879 (76.7%) |
| 12 to 14 Years | 577 (90.2%) | 256 (84.5%) |
| 15 Years | 264 (66.0%) | 174 (86.6%) |
| 16 and 17 Years | 313 (85.1%) | 436 (87.2%) |
| 18 to 24 Years | 1,113 (74.7%) | 1,284 (83.7%) |
| 25 to 34 Years | 2,195 (86.0%) | 2,207 (84.0%) |
| 35 to 44 Years | 1,707 (91.9%) | 1,648 (82.5%) |
| 45 to 54 Years | 1,849 (82.0%) | 1,929 (89.4%) |
| 55 to 64 Years | 2,027 (83.2%) | 2,080 (79.6%) |
| 65 to 74 Years | 1,547 (87.8%) | 1,601 (88.9%) |
| 75 Years and over | 917 (78.1%) | 1,344 (85.7%) |
| Total | 14,192 (81.2%) | 14,749 (83.1%) |
Income Below Poverty Among Married-Couple Families in Lewiston
The poverty statistics for married-couple families in Lewiston show that 5.3% or 309 of the total 5,832 families live below the poverty line. Families with 3 or 4 children have the highest poverty rate of 62.9%, comprising of 61 families. On the other hand, families with 1 or 2 children have the lowest poverty rate of 3.1%, which includes 56 families.
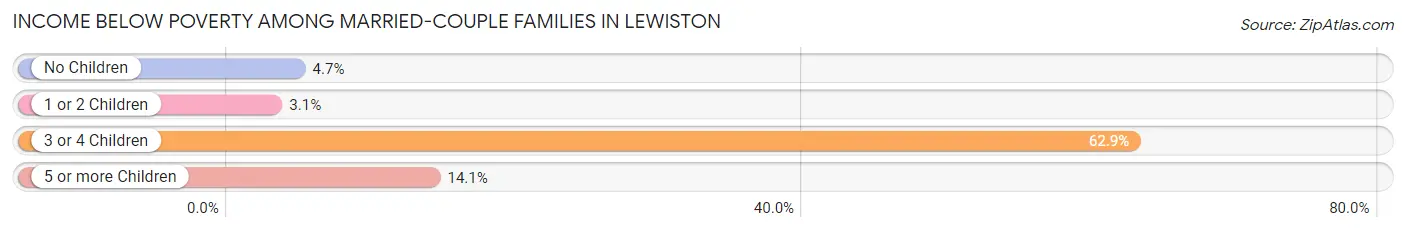
| Children | Above Poverty | Below Poverty |
| No Children | 3,665 (95.3%) | 181 (4.7%) |
| 1 or 2 Children | 1,755 (96.9%) | 56 (3.1%) |
| 3 or 4 Children | 36 (37.1%) | 61 (62.9%) |
| 5 or more Children | 67 (85.9%) | 11 (14.1%) |
| Total | 5,523 (94.7%) | 309 (5.3%) |
Income Below Poverty Among Single-Parent Households in Lewiston
According to the poverty data in Lewiston, 17.2% or 125 single-father households and 31.5% or 564 single-mother households are living below the poverty line. Among single-father households, those with 3 or 4 children have the highest poverty rate, with 41 households (54.7%) experiencing poverty. Likewise, among single-mother households, those with 3 or 4 children have the highest poverty rate, with 120 households (58.0%) falling below the poverty line.
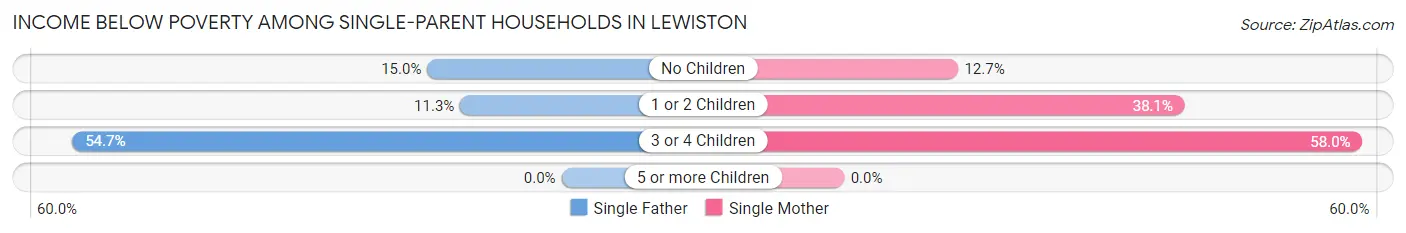
| Children | Single Father | Single Mother |
| No Children | 48 (15.0%) | 80 (12.7%) |
| 1 or 2 Children | 36 (11.3%) | 364 (38.1%) |
| 3 or 4 Children | 41 (54.7%) | 120 (58.0%) |
| 5 or more Children | 0 (0.0%) | 0 (0.0%) |
| Total | 125 (17.2%) | 564 (31.5%) |
Income Below Poverty Among Married-Couple vs Single-Parent Households in Lewiston
The poverty data for Lewiston shows that 309 of the married-couple family households (5.3%) and 689 of the single-parent households (27.4%) are living below the poverty level. Within the married-couple family households, those with 3 or 4 children have the highest poverty rate, with 61 households (62.9%) falling below the poverty line. Among the single-parent households, those with 3 or 4 children have the highest poverty rate, with 161 household (57.1%) living below poverty.
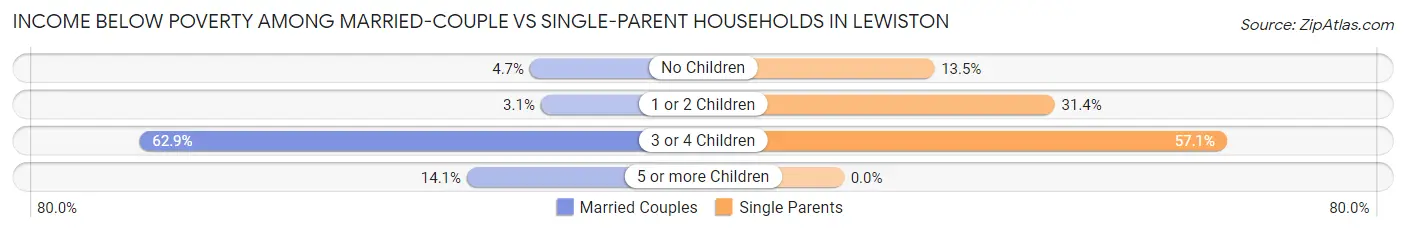
| Children | Married-Couple Families | Single-Parent Households |
| No Children | 181 (4.7%) | 128 (13.5%) |
| 1 or 2 Children | 56 (3.1%) | 400 (31.4%) |
| 3 or 4 Children | 61 (62.9%) | 161 (57.1%) |
| 5 or more Children | 11 (14.1%) | 0 (0.0%) |
| Total | 309 (5.3%) | 689 (27.4%) |
Race in Lewiston
The most populous races in Lewiston are White / Caucasian (30,329 | 80.7%), Black / African American (4,092 | 10.9%), and Two or more Races (2,114 | 5.6%).
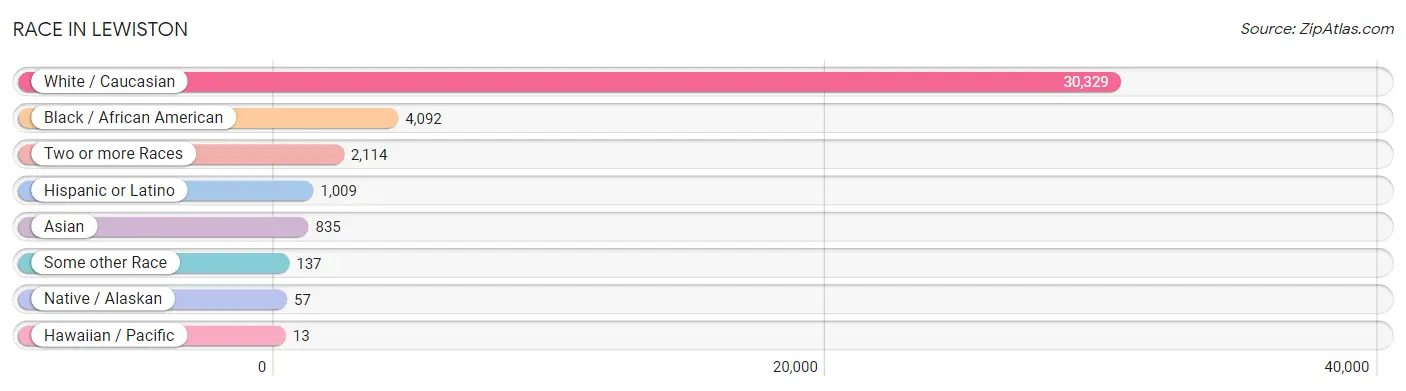
| Race | # Population | % Population |
| Asian | 835 | 2.2% |
| Black / African American | 4,092 | 10.9% |
| Hawaiian / Pacific | 13 | 0.0% |
| Hispanic or Latino | 1,009 | 2.7% |
| Native / Alaskan | 57 | 0.2% |
| White / Caucasian | 30,329 | 80.7% |
| Two or more Races | 2,114 | 5.6% |
| Some other Race | 137 | 0.4% |
| Total | 37,577 | 100.0% |
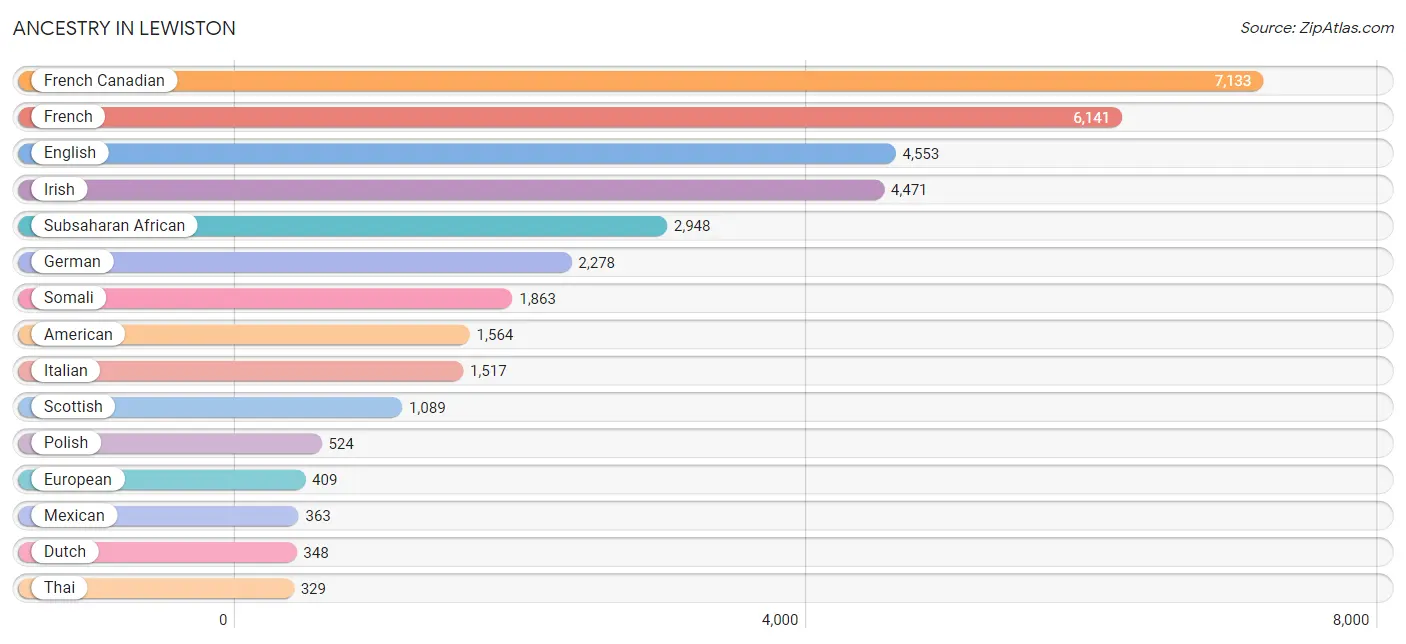
Ancestry in Lewiston
The most populous ancestries reported in Lewiston are French Canadian (7,133 | 19.0%), French (6,141 | 16.3%), English (4,553 | 12.1%), Irish (4,471 | 11.9%), and Subsaharan African (2,948 | 7.9%), together accounting for 67.2% of all Lewiston residents.
| Ancestry | # Population | % Population |
| African | 150 | 0.4% |
| American | 1,564 | 4.2% |
| Arab | 244 | 0.6% |
| Armenian | 29 | 0.1% |
| Australian | 38 | 0.1% |
| Austrian | 18 | 0.1% |
| Belgian | 97 | 0.3% |
| Bhutanese | 47 | 0.1% |
| Blackfeet | 4 | 0.0% |
| Bolivian | 85 | 0.2% |
| Brazilian | 51 | 0.1% |
| British | 158 | 0.4% |
| Burmese | 30 | 0.1% |
| Cajun | 2 | 0.0% |
| Canadian | 259 | 0.7% |
| Cape Verdean | 7 | 0.0% |
| Central American | 112 | 0.3% |
| Central American Indian | 18 | 0.1% |
| Cherokee | 170 | 0.4% |
| Chippewa | 46 | 0.1% |
| Colombian | 26 | 0.1% |
| Costa Rican | 24 | 0.1% |
| Cuban | 23 | 0.1% |
| Czech | 33 | 0.1% |
| Czechoslovakian | 51 | 0.1% |
| Danish | 28 | 0.1% |
| Dominican | 112 | 0.3% |
| Dutch | 348 | 0.9% |
| Eastern European | 29 | 0.1% |
| Ecuadorian | 4 | 0.0% |
| Egyptian | 2 | 0.0% |
| English | 4,553 | 12.1% |
| Ethiopian | 12 | 0.0% |
| European | 409 | 1.1% |
| Finnish | 151 | 0.4% |
| French | 6,141 | 16.3% |
| French American Indian | 17 | 0.1% |
| French Canadian | 7,133 | 19.0% |
| German | 2,278 | 6.1% |
| Greek | 104 | 0.3% |
| Guatemalan | 9 | 0.0% |
| Haitian | 12 | 0.0% |
| Hungarian | 13 | 0.0% |
| Indian (Asian) | 325 | 0.9% |
| Inupiat | 5 | 0.0% |
| Irish | 4,471 | 11.9% |
| Italian | 1,517 | 4.0% |
| Jamaican | 117 | 0.3% |
| Kenyan | 57 | 0.2% |
| Korean | 178 | 0.5% |
| Lithuanian | 92 | 0.2% |
| Mexican | 363 | 1.0% |
| Native Hawaiian | 4 | 0.0% |
| Nigerian | 125 | 0.3% |
| Northern European | 115 | 0.3% |
| Norwegian | 88 | 0.2% |
| Pakistani | 49 | 0.1% |
| Panamanian | 26 | 0.1% |
| Peruvian | 10 | 0.0% |
| Polish | 524 | 1.4% |
| Portuguese | 77 | 0.2% |
| Puerto Rican | 227 | 0.6% |
| Russian | 61 | 0.2% |
| Salvadoran | 53 | 0.1% |
| Scandinavian | 31 | 0.1% |
| Scotch-Irish | 272 | 0.7% |
| Scottish | 1,089 | 2.9% |
| Seminole | 5 | 0.0% |
| Serbian | 3 | 0.0% |
| Sioux | 5 | 0.0% |
| Slovak | 76 | 0.2% |
| Slovene | 2 | 0.0% |
| Somali | 1,863 | 5.0% |
| South American | 135 | 0.4% |
| Spaniard | 30 | 0.1% |
| Sri Lankan | 63 | 0.2% |
| Subsaharan African | 2,948 | 7.9% |
| Swedish | 181 | 0.5% |
| Thai | 329 | 0.9% |
| Trinidadian and Tobagonian | 63 | 0.2% |
| Turkish | 48 | 0.1% |
| Ukrainian | 83 | 0.2% |
| Uruguayan | 10 | 0.0% |
| Welsh | 165 | 0.4% |
| Zimbabwean | 27 | 0.1% | View All 85 Rows |
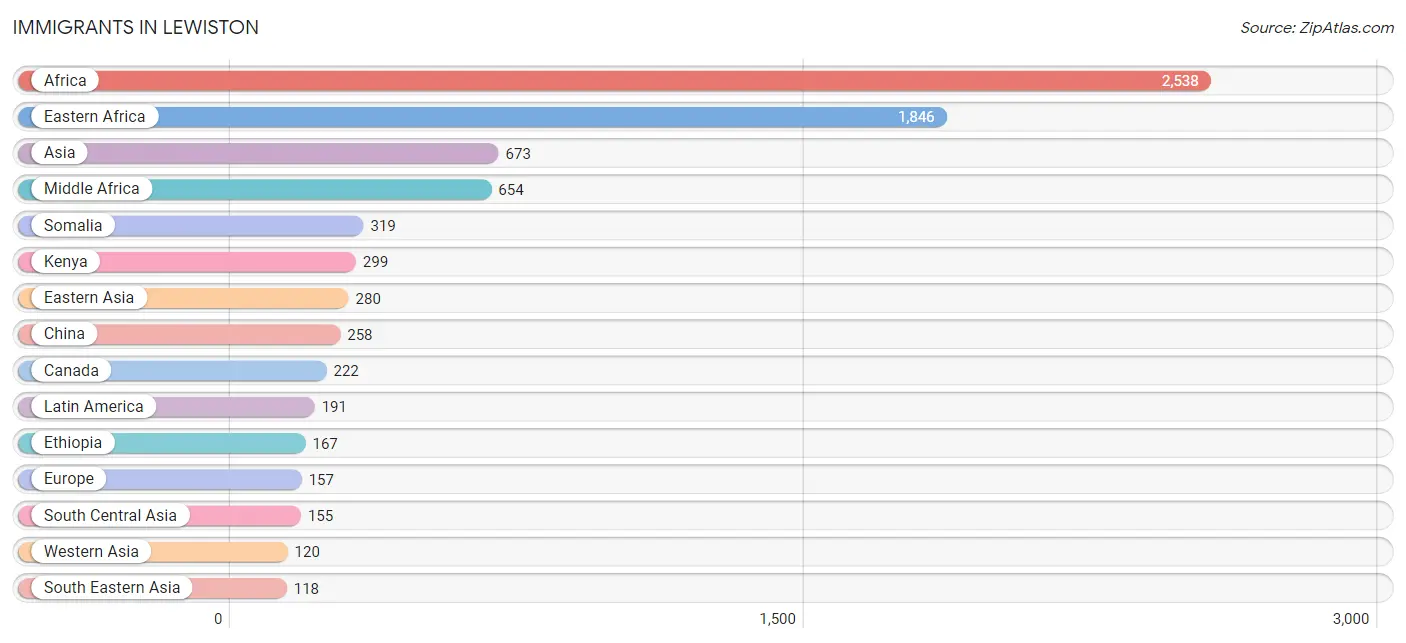
Immigrants in Lewiston
The most numerous immigrant groups reported in Lewiston came from Africa (2,538 | 6.8%), Eastern Africa (1,846 | 4.9%), Asia (673 | 1.8%), Middle Africa (654 | 1.7%), and Somalia (319 | 0.9%), together accounting for 16.0% of all Lewiston residents.
| Immigration Origin | # Population | % Population |
| Africa | 2,538 | 6.8% |
| Asia | 673 | 1.8% |
| Bangladesh | 108 | 0.3% |
| Bolivia | 24 | 0.1% |
| Canada | 222 | 0.6% |
| Caribbean | 39 | 0.1% |
| Central America | 113 | 0.3% |
| China | 258 | 0.7% |
| Colombia | 15 | 0.0% |
| Congo | 61 | 0.2% |
| Dominican Republic | 13 | 0.0% |
| Eastern Africa | 1,846 | 4.9% |
| Eastern Asia | 280 | 0.7% |
| Eastern Europe | 12 | 0.0% |
| El Salvador | 2 | 0.0% |
| England | 25 | 0.1% |
| Ethiopia | 167 | 0.4% |
| Europe | 157 | 0.4% |
| France | 16 | 0.0% |
| Germany | 89 | 0.2% |
| India | 46 | 0.1% |
| Jamaica | 26 | 0.1% |
| Japan | 22 | 0.1% |
| Kenya | 299 | 0.8% |
| Latin America | 191 | 0.5% |
| Mexico | 111 | 0.3% |
| Middle Africa | 654 | 1.7% |
| Northern Europe | 40 | 0.1% |
| Pakistan | 1 | 0.0% |
| Philippines | 18 | 0.1% |
| Poland | 6 | 0.0% |
| Saudi Arabia | 101 | 0.3% |
| Somalia | 319 | 0.9% |
| South America | 39 | 0.1% |
| South Central Asia | 155 | 0.4% |
| South Eastern Asia | 118 | 0.3% |
| Thailand | 43 | 0.1% |
| Turkey | 19 | 0.1% |
| Ukraine | 6 | 0.0% |
| Vietnam | 57 | 0.2% |
| Western Africa | 21 | 0.1% |
| Western Asia | 120 | 0.3% |
| Western Europe | 105 | 0.3% |
| Zaire | 75 | 0.2% |
| Zimbabwe | 22 | 0.1% | View All 45 Rows |
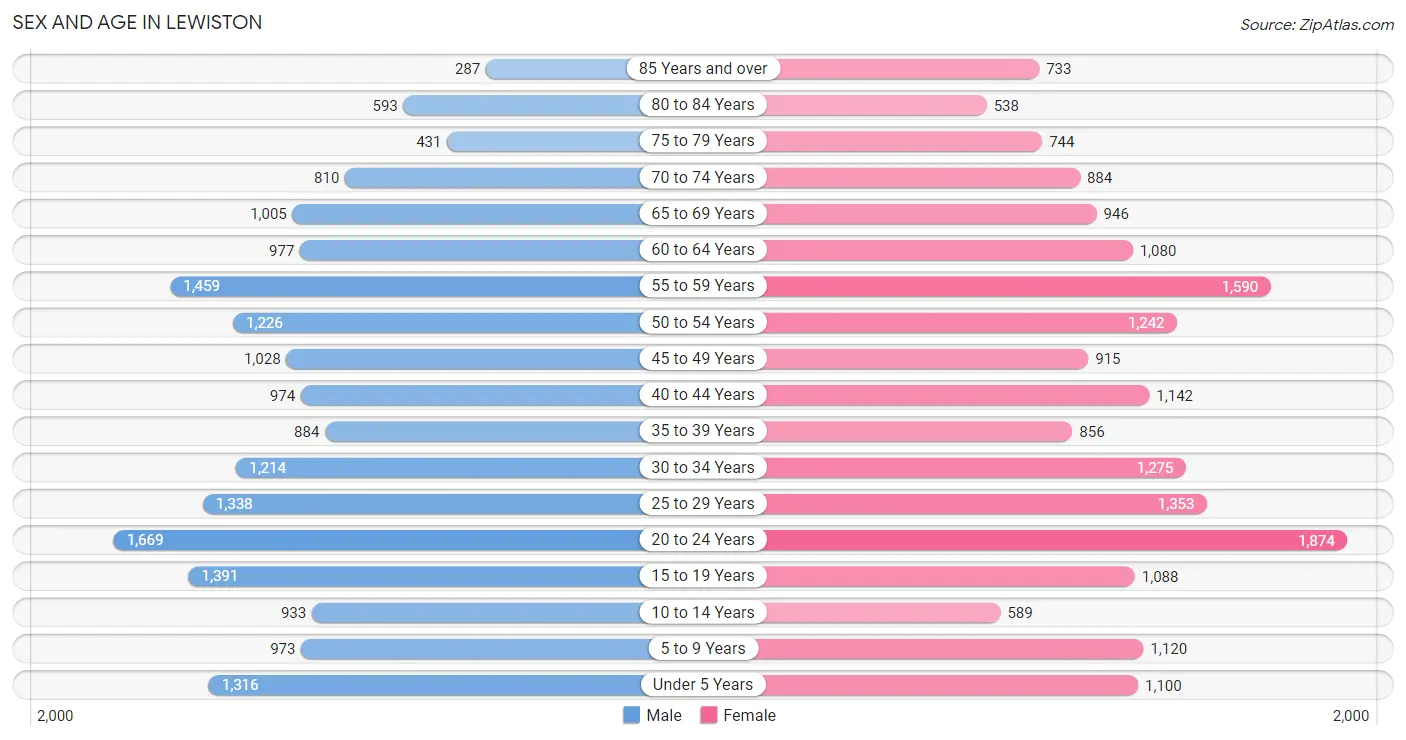
Sex and Age in Lewiston
Sex and Age in Lewiston
The most populous age groups in Lewiston are 20 to 24 Years (1,669 | 9.0%) for men and 20 to 24 Years (1,874 | 9.8%) for women.
| Age Bracket | Male | Female |
| Under 5 Years | 1,316 (7.1%) | 1,100 (5.8%) |
| 5 to 9 Years | 973 (5.3%) | 1,120 (5.9%) |
| 10 to 14 Years | 933 (5.0%) | 589 (3.1%) |
| 15 to 19 Years | 1,391 (7.5%) | 1,088 (5.7%) |
| 20 to 24 Years | 1,669 (9.0%) | 1,874 (9.8%) |
| 25 to 29 Years | 1,338 (7.2%) | 1,353 (7.1%) |
| 30 to 34 Years | 1,214 (6.6%) | 1,275 (6.7%) |
| 35 to 39 Years | 884 (4.8%) | 856 (4.5%) |
| 40 to 44 Years | 974 (5.3%) | 1,142 (6.0%) |
| 45 to 49 Years | 1,028 (5.6%) | 915 (4.8%) |
| 50 to 54 Years | 1,226 (6.6%) | 1,242 (6.5%) |
| 55 to 59 Years | 1,459 (7.9%) | 1,590 (8.3%) |
| 60 to 64 Years | 977 (5.3%) | 1,080 (5.7%) |
| 65 to 69 Years | 1,005 (5.4%) | 946 (5.0%) |
| 70 to 74 Years | 810 (4.4%) | 884 (4.6%) |
| 75 to 79 Years | 431 (2.3%) | 744 (3.9%) |
| 80 to 84 Years | 593 (3.2%) | 538 (2.8%) |
| 85 Years and over | 287 (1.5%) | 733 (3.8%) |
| Total | 18,508 (100.0%) | 19,069 (100.0%) |
Families and Households in Lewiston
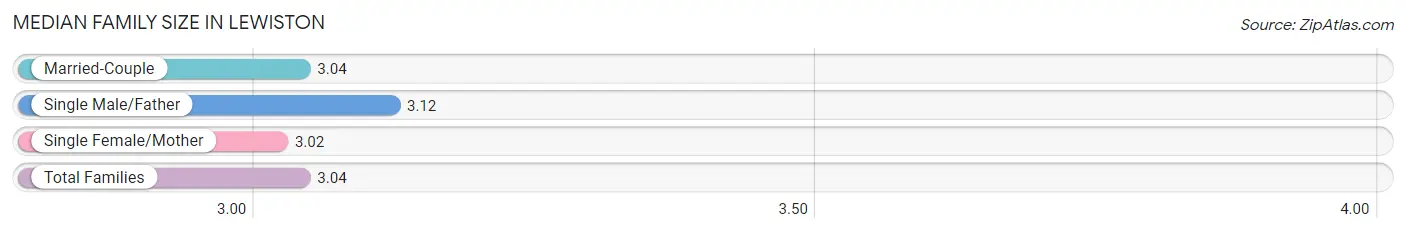
Median Family Size in Lewiston
The median family size in Lewiston is 3.04 persons per family, with single male/father families (727 | 8.7%) accounting for the largest median family size of 3.12 persons per family. On the other hand, single female/mother families (1,791 | 21.4%) represent the smallest median family size with 3.02 persons per family.
| Family Type | # Families | Family Size |
| Married-Couple | 5,832 (69.8%) | 3.04 |
| Single Male/Father | 727 (8.7%) | 3.12 |
| Single Female/Mother | 1,791 (21.4%) | 3.02 |
| Total Families | 8,350 (100.0%) | 3.04 |
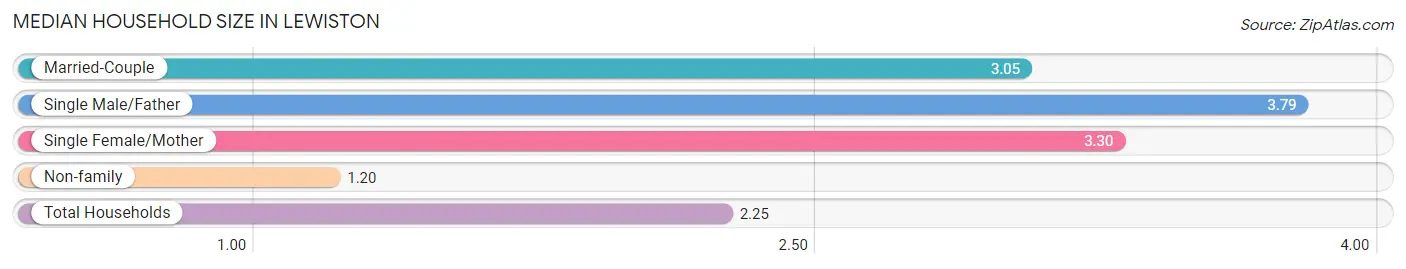
Median Household Size in Lewiston
The median household size in Lewiston is 2.25 persons per household, with single male/father households (727 | 4.7%) accounting for the largest median household size of 3.79 persons per household. non-family households (7,261 | 46.5%) represent the smallest median household size with 1.20 persons per household.
| Household Type | # Households | Household Size |
| Married-Couple | 5,832 (37.4%) | 3.05 |
| Single Male/Father | 727 (4.7%) | 3.79 |
| Single Female/Mother | 1,791 (11.5%) | 3.30 |
| Non-family | 7,261 (46.5%) | 1.20 |
| Total Households | 15,611 (100.0%) | 2.25 |
Household Size by Marriage Status in Lewiston
Out of a total of 15,611 households in Lewiston, 8,350 (53.5%) are family households, while 7,261 (46.5%) are nonfamily households. The most numerous type of family households are 2-person households, comprising 3,936, and the most common type of nonfamily households are 1-person households, comprising 5,884.
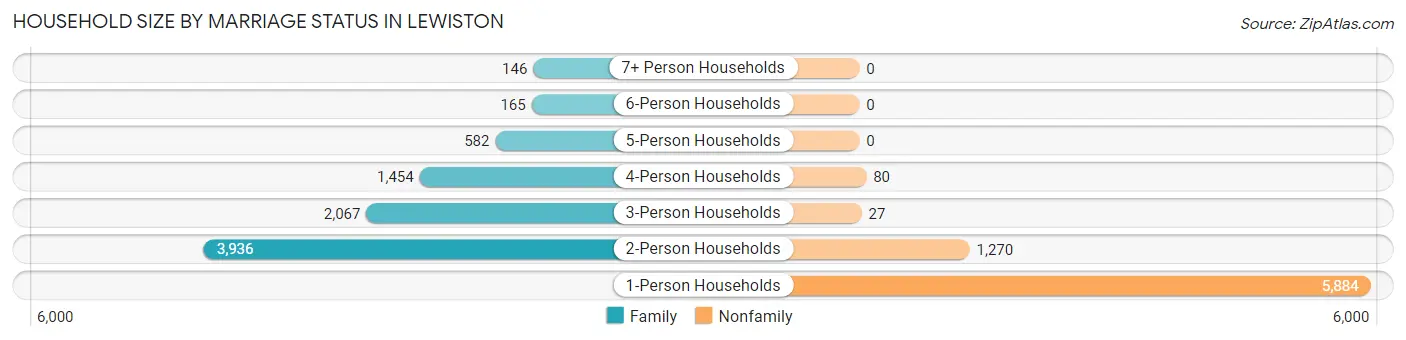
| Household Size | Family Households | Nonfamily Households |
| 1-Person Households | - | 5,884 (37.7%) |
| 2-Person Households | 3,936 (25.2%) | 1,270 (8.1%) |
| 3-Person Households | 2,067 (13.2%) | 27 (0.2%) |
| 4-Person Households | 1,454 (9.3%) | 80 (0.5%) |
| 5-Person Households | 582 (3.7%) | 0 (0.0%) |
| 6-Person Households | 165 (1.1%) | 0 (0.0%) |
| 7+ Person Households | 146 (0.9%) | 0 (0.0%) |
| Total | 8,350 (53.5%) | 7,261 (46.5%) |
Female Fertility in Lewiston
Fertility by Age in Lewiston
Average fertility rate in Lewiston is 56.0 births per 1,000 women. Women in the age bracket of 20 to 34 years have the highest fertility rate with 95.0 births per 1,000 women. Women in the age bracket of 20 to 34 years acount for 87.2% of all women with births.
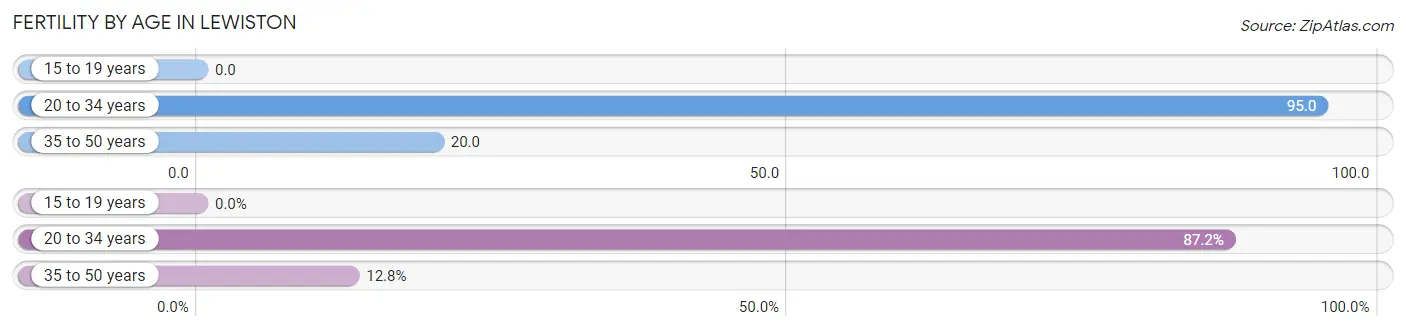
| Age Bracket | Women with Births | Births / 1,000 Women |
| 15 to 19 years | 0 (0.0%) | 0.0 |
| 20 to 34 years | 428 (87.2%) | 95.0 |
| 35 to 50 years | 63 (12.8%) | 20.0 |
| Total | 491 (100.0%) | 56.0 |
Fertility by Age by Marriage Status in Lewiston
75.6% of women with births (491) in Lewiston are married. The highest percentage of unmarried women with births falls into 20 to 34 years age bracket with 26.9% of them unmarried at the time of birth, while the lowest percentage of unmarried women with births belong to 35 to 50 years age bracket with 7.9% of them unmarried.
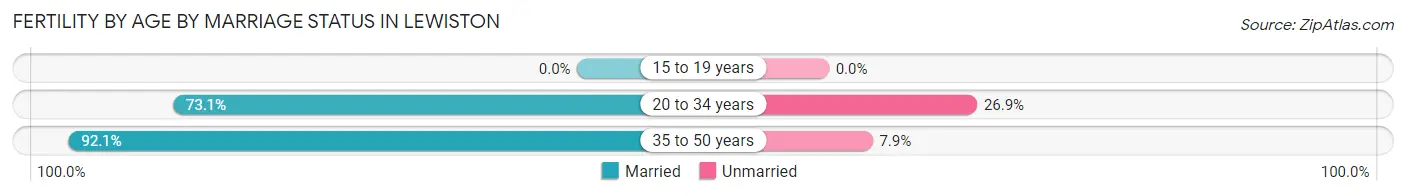
| Age Bracket | Married | Unmarried |
| 15 to 19 years | 0 (0.0%) | 0 (0.0%) |
| 20 to 34 years | 313 (73.1%) | 115 (26.9%) |
| 35 to 50 years | 58 (92.1%) | 5 (7.9%) |
| Total | 371 (75.6%) | 120 (24.4%) |
Fertility by Education in Lewiston
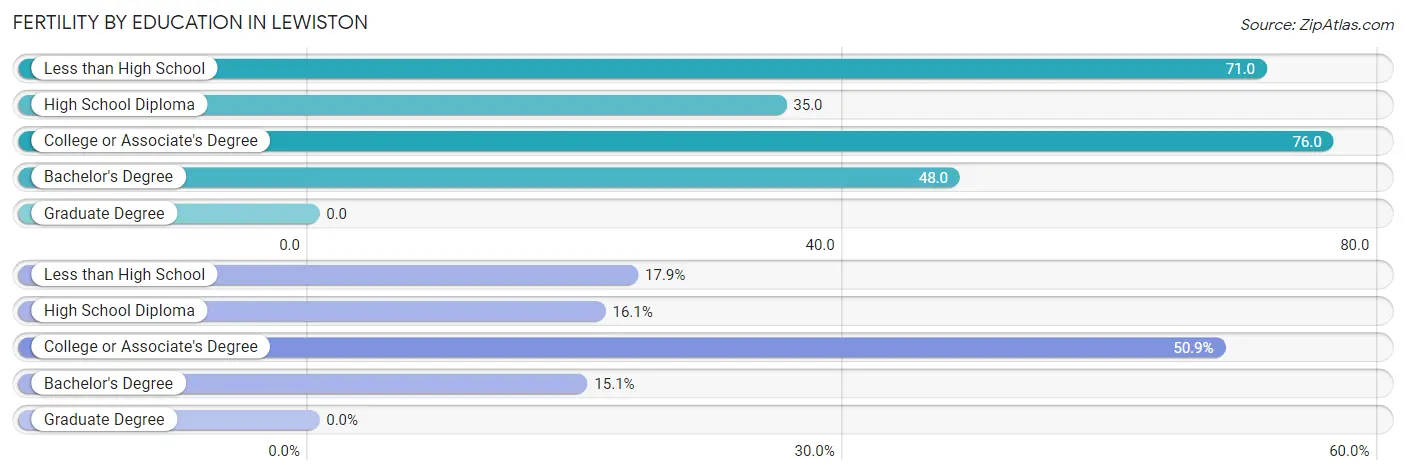
| Educational Attainment | Women with Births | Births / 1,000 Women |
| Less than High School | 88 (17.9%) | 71.0 |
| High School Diploma | 79 (16.1%) | 35.0 |
| College or Associate's Degree | 250 (50.9%) | 76.0 |
| Bachelor's Degree | 74 (15.1%) | 48.0 |
| Graduate Degree | 0 (0.0%) | 0.0 |
| Total | 491 (100.0%) | 56.0 |
Fertility by Education by Marriage Status in Lewiston
24.4% of women with births in Lewiston are unmarried. Women with the educational attainment of college or associate's degree are most likely to be married with 100.0% of them married at childbirth, while women with the educational attainment of high school diploma are least likely to be married with 77.2% of them unmarried at childbirth.
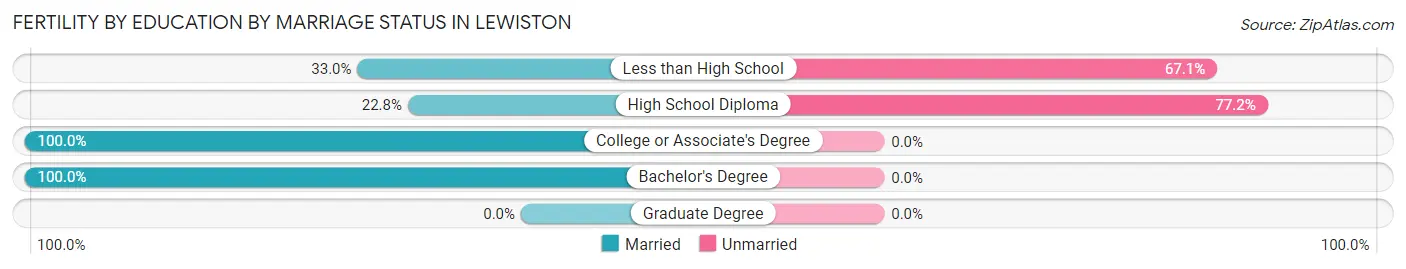
| Educational Attainment | Married | Unmarried |
| Less than High School | 29 (33.0%) | 59 (67.0%) |
| High School Diploma | 18 (22.8%) | 61 (77.2%) |
| College or Associate's Degree | 250 (100.0%) | 0 (0.0%) |
| Bachelor's Degree | 74 (100.0%) | 0 (0.0%) |
| Graduate Degree | 0 (0.0%) | 0 (0.0%) |
| Total | 371 (75.6%) | 120 (24.4%) |
Employment Characteristics in Lewiston
Employment by Class of Employer in Lewiston
Among the 17,541 employed individuals in Lewiston, private company employees (11,467 | 65.4%), not-for-profit organizations (3,116 | 17.8%), and local government employees (942 | 5.4%) make up the most common classes of employment.
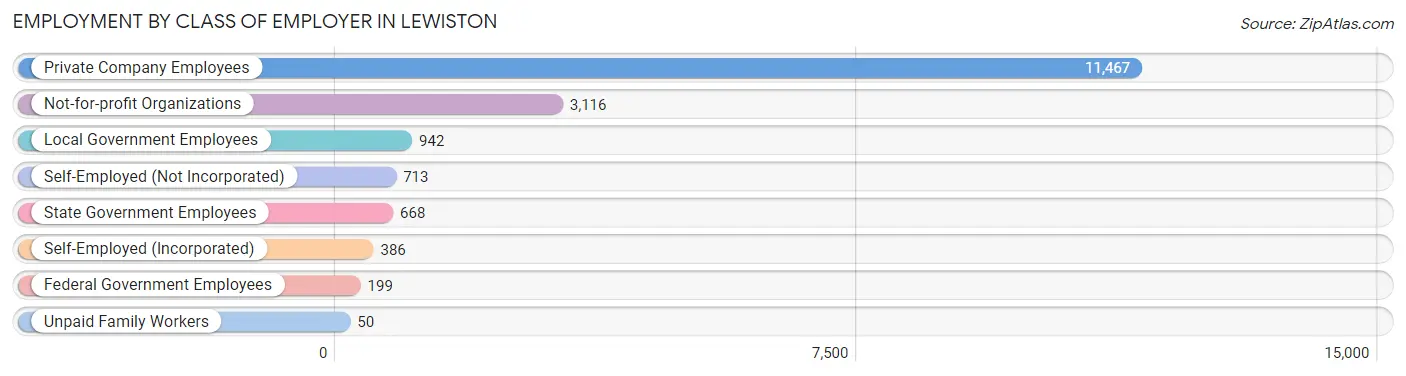
| Employer Class | # Employees | % Employees |
| Private Company Employees | 11,467 | 65.4% |
| Self-Employed (Incorporated) | 386 | 2.2% |
| Self-Employed (Not Incorporated) | 713 | 4.1% |
| Not-for-profit Organizations | 3,116 | 17.8% |
| Local Government Employees | 942 | 5.4% |
| State Government Employees | 668 | 3.8% |
| Federal Government Employees | 199 | 1.1% |
| Unpaid Family Workers | 50 | 0.3% |
| Total | 17,541 | 100.0% |
Employment Status by Age in Lewiston
According to the labor force statistics for Lewiston, out of the total population over 16 years of age (30,939), 61.4% or 18,997 individuals are in the labor force, with 5.6% or 1,064 of them unemployed. The age group with the highest labor force participation rate is 30 to 34 years, with 86.9% or 2,163 individuals in the labor force. Within the labor force, the 16 to 19 years age range has the highest percentage of unemployed individuals, with 18.4% or 178 of them being unemployed.
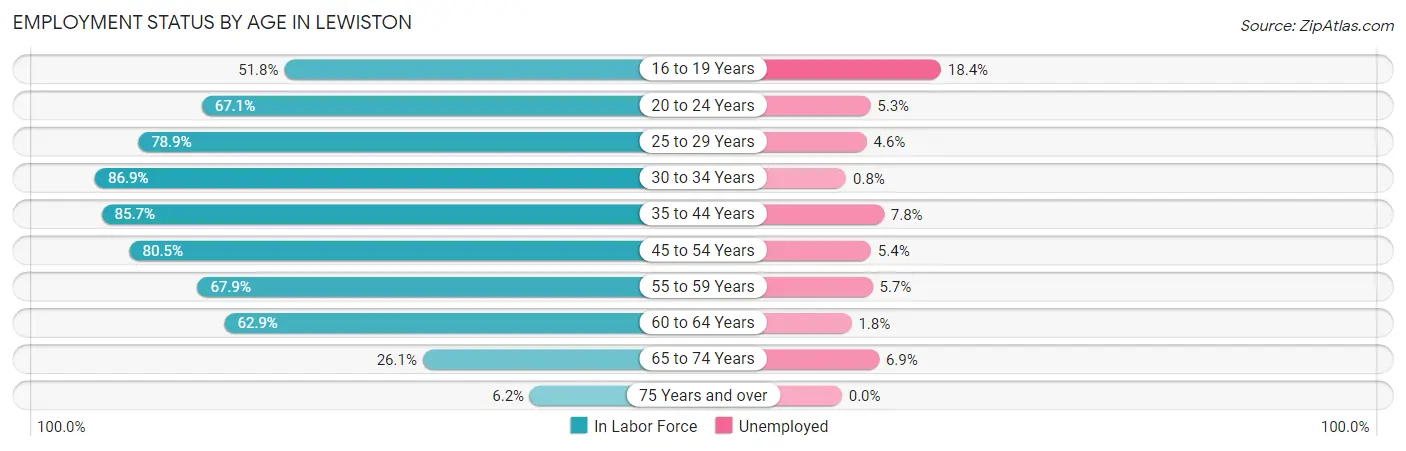
| Age Bracket | In Labor Force | Unemployed |
| 16 to 19 Years | 970 (51.8%) | 178 (18.4%) |
| 20 to 24 Years | 2,377 (67.1%) | 126 (5.3%) |
| 25 to 29 Years | 2,123 (78.9%) | 98 (4.6%) |
| 30 to 34 Years | 2,163 (86.9%) | 17 (0.8%) |
| 35 to 44 Years | 3,305 (85.7%) | 258 (7.8%) |
| 45 to 54 Years | 3,551 (80.5%) | 192 (5.4%) |
| 55 to 59 Years | 2,070 (67.9%) | 118 (5.7%) |
| 60 to 64 Years | 1,294 (62.9%) | 23 (1.8%) |
| 65 to 74 Years | 951 (26.1%) | 66 (6.9%) |
| 75 Years and over | 206 (6.2%) | 0 (0.0%) |
| Total | 18,997 (61.4%) | 1,064 (5.6%) |
Employment Status by Educational Attainment in Lewiston
According to labor force statistics for Lewiston, 78.2% of individuals (14,508) out of the total population between 25 and 64 years of age (18,553) are in the labor force, with 4.9% or 711 of them being unemployed. The group with the highest labor force participation rate are those with the educational attainment of bachelor's degree or higher, with 89.4% or 3,897 individuals in the labor force. Within the labor force, individuals with less than high school education have the highest percentage of unemployment, with 7.0% or 69 of them being unemployed.
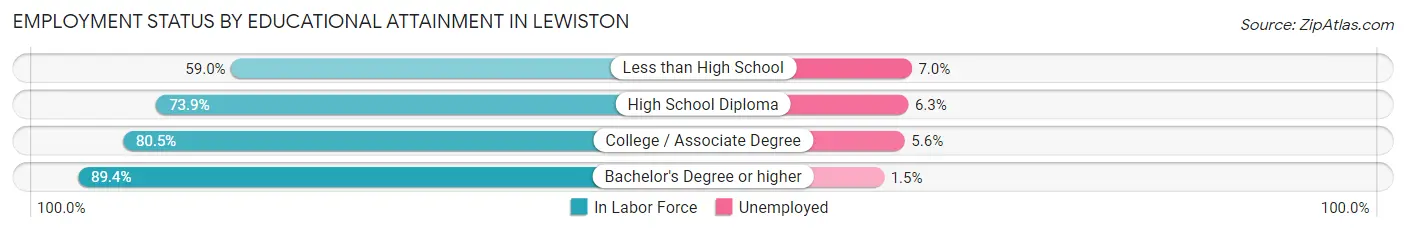
| Educational Attainment | In Labor Force | Unemployed |
| Less than High School | 981 (59.0%) | 116 (7.0%) |
| High School Diploma | 5,162 (73.9%) | 440 (6.3%) |
| College / Associate Degree | 4,465 (80.5%) | 311 (5.6%) |
| Bachelor's Degree or higher | 3,897 (89.4%) | 65 (1.5%) |
| Total | 14,508 (78.2%) | 909 (4.9%) |
Employment Occupations by Sex in Lewiston
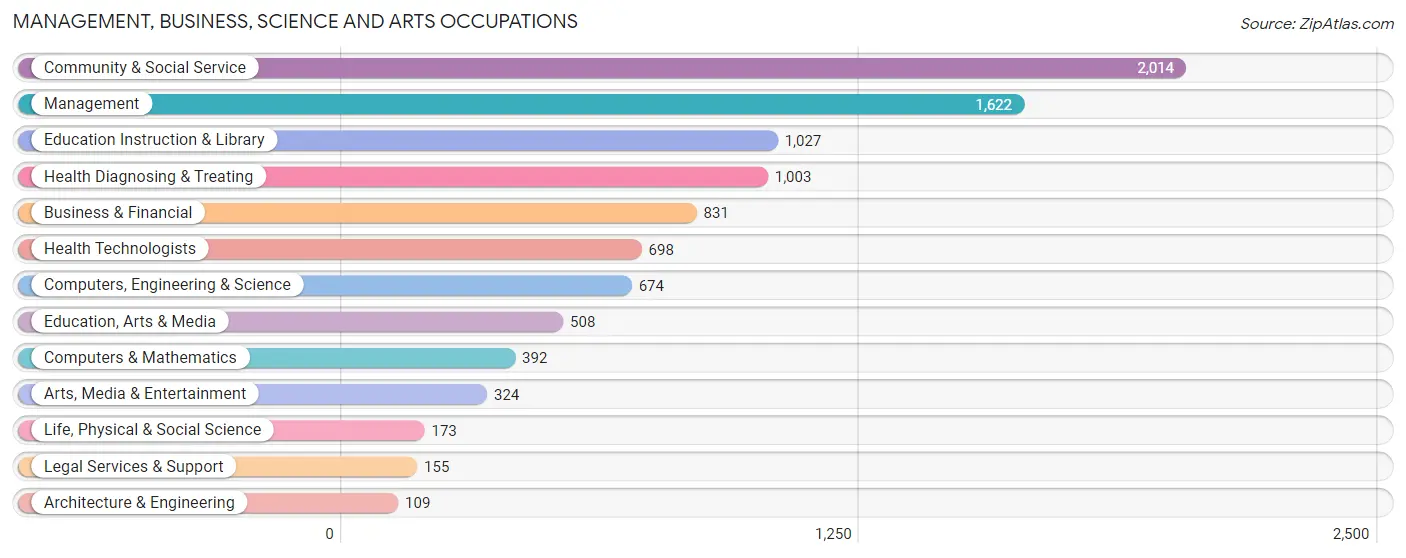
Management, Business, Science and Arts Occupations
The most common Management, Business, Science and Arts occupations in Lewiston are Community & Social Service (2,014 | 11.2%), Management (1,622 | 9.0%), Education Instruction & Library (1,027 | 5.7%), Health Diagnosing & Treating (1,003 | 5.6%), and Business & Financial (831 | 4.6%).
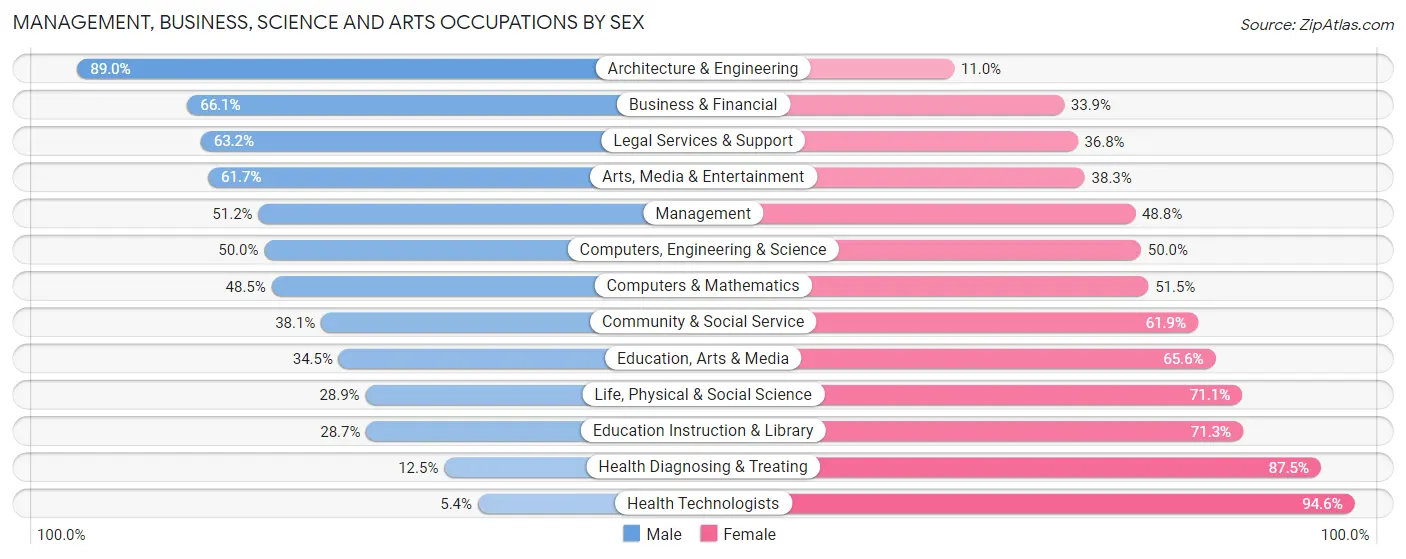
Management, Business, Science and Arts Occupations by Sex
Within the Management, Business, Science and Arts occupations in Lewiston, the most male-oriented occupations are Architecture & Engineering (89.0%), Business & Financial (66.1%), and Legal Services & Support (63.2%), while the most female-oriented occupations are Health Technologists (94.6%), Health Diagnosing & Treating (87.5%), and Education Instruction & Library (71.3%).
| Occupation | Male | Female |
| Management | 831 (51.2%) | 791 (48.8%) |
| Business & Financial | 549 (66.1%) | 282 (33.9%) |
| Computers, Engineering & Science | 337 (50.0%) | 337 (50.0%) |
| Computers & Mathematics | 190 (48.5%) | 202 (51.5%) |
| Architecture & Engineering | 97 (89.0%) | 12 (11.0%) |
| Life, Physical & Social Science | 50 (28.9%) | 123 (71.1%) |
| Community & Social Service | 768 (38.1%) | 1,246 (61.9%) |
| Education, Arts & Media | 175 (34.4%) | 333 (65.5%) |
| Legal Services & Support | 98 (63.2%) | 57 (36.8%) |
| Education Instruction & Library | 295 (28.7%) | 732 (71.3%) |
| Arts, Media & Entertainment | 200 (61.7%) | 124 (38.3%) |
| Health Diagnosing & Treating | 125 (12.5%) | 878 (87.5%) |
| Health Technologists | 38 (5.4%) | 660 (94.6%) |
| Total (Category) | 2,610 (42.5%) | 3,534 (57.5%) |
| Total (Overall) | 9,031 (50.3%) | 8,905 (49.6%) |
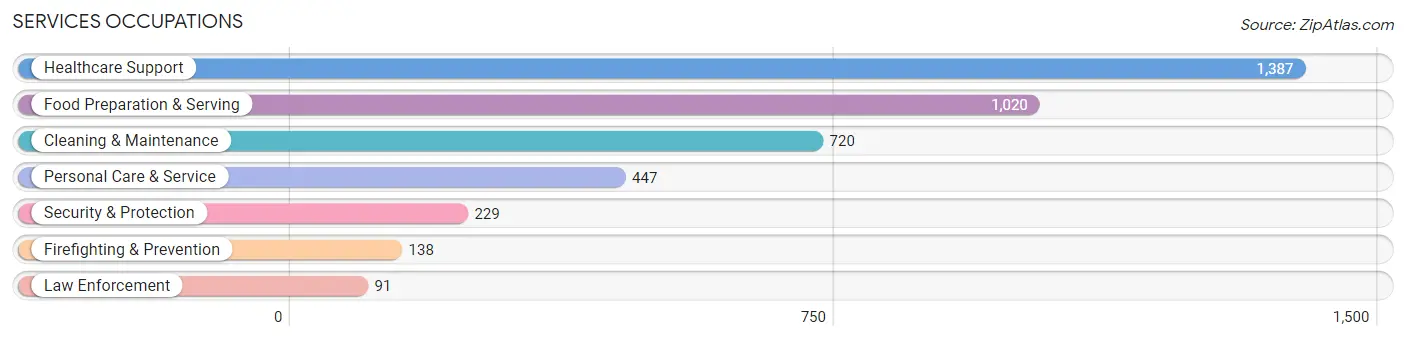
Services Occupations
The most common Services occupations in Lewiston are Healthcare Support (1,387 | 7.7%), Food Preparation & Serving (1,020 | 5.7%), Cleaning & Maintenance (720 | 4.0%), Personal Care & Service (447 | 2.5%), and Security & Protection (229 | 1.3%).
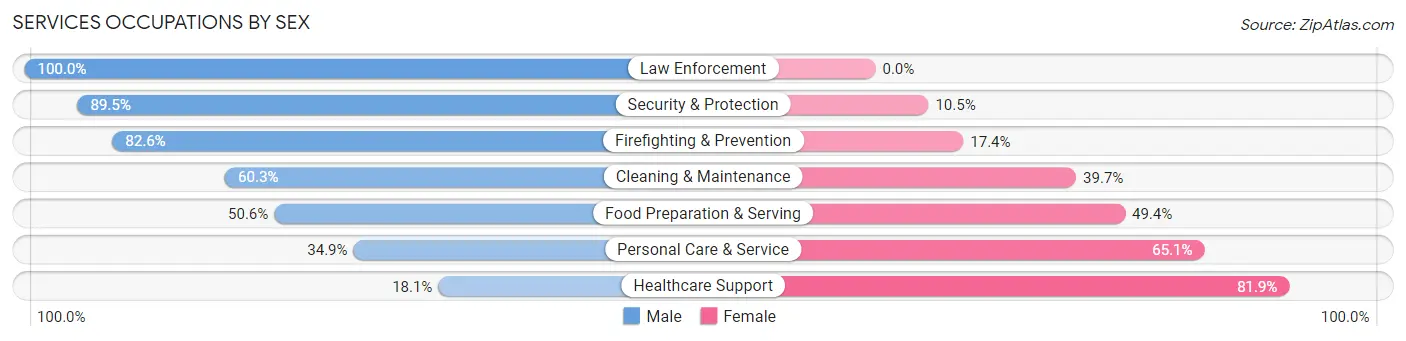
Services Occupations by Sex
Within the Services occupations in Lewiston, the most male-oriented occupations are Law Enforcement (100.0%), Security & Protection (89.5%), and Firefighting & Prevention (82.6%), while the most female-oriented occupations are Healthcare Support (81.9%), Personal Care & Service (65.1%), and Food Preparation & Serving (49.4%).
| Occupation | Male | Female |
| Healthcare Support | 251 (18.1%) | 1,136 (81.9%) |
| Security & Protection | 205 (89.5%) | 24 (10.5%) |
| Firefighting & Prevention | 114 (82.6%) | 24 (17.4%) |
| Law Enforcement | 91 (100.0%) | 0 (0.0%) |
| Food Preparation & Serving | 516 (50.6%) | 504 (49.4%) |
| Cleaning & Maintenance | 434 (60.3%) | 286 (39.7%) |
| Personal Care & Service | 156 (34.9%) | 291 (65.1%) |
| Total (Category) | 1,562 (41.1%) | 2,241 (58.9%) |
| Total (Overall) | 9,031 (50.3%) | 8,905 (49.6%) |
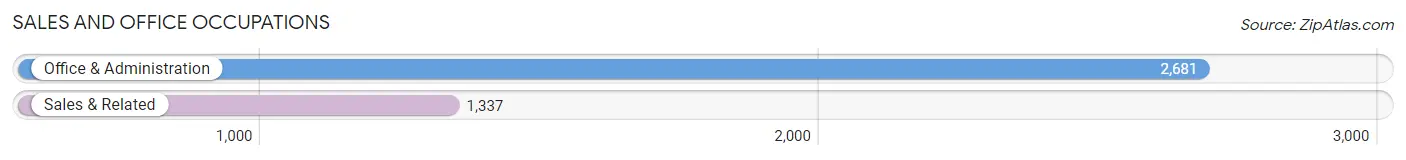
Sales and Office Occupations
The most common Sales and Office occupations in Lewiston are Office & Administration (2,681 | 14.9%), and Sales & Related (1,337 | 7.4%).
Sales and Office Occupations by Sex
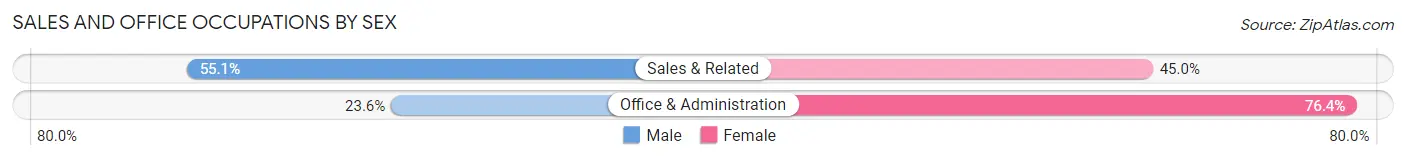
| Occupation | Male | Female |
| Sales & Related | 736 (55.0%) | 601 (45.0%) |
| Office & Administration | 633 (23.6%) | 2,048 (76.4%) |
| Total (Category) | 1,369 (34.1%) | 2,649 (65.9%) |
| Total (Overall) | 9,031 (50.3%) | 8,905 (49.6%) |
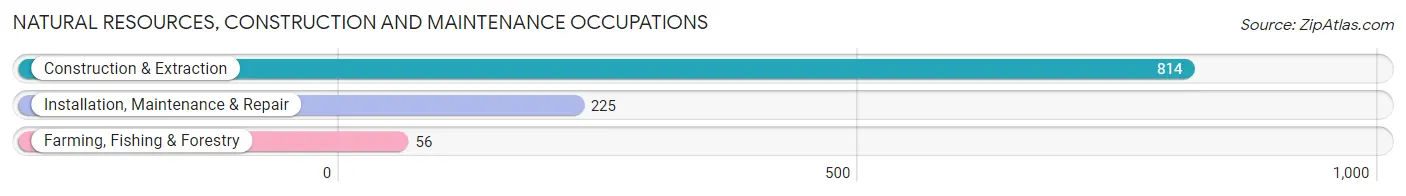
Natural Resources, Construction and Maintenance Occupations
The most common Natural Resources, Construction and Maintenance occupations in Lewiston are Construction & Extraction (814 | 4.5%), Installation, Maintenance & Repair (225 | 1.3%), and Farming, Fishing & Forestry (56 | 0.3%).
Natural Resources, Construction and Maintenance Occupations by Sex
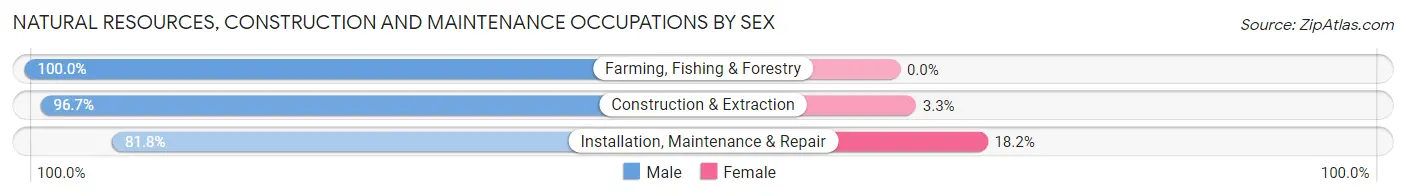
| Occupation | Male | Female |
| Farming, Fishing & Forestry | 56 (100.0%) | 0 (0.0%) |
| Construction & Extraction | 787 (96.7%) | 27 (3.3%) |
| Installation, Maintenance & Repair | 184 (81.8%) | 41 (18.2%) |
| Total (Category) | 1,027 (93.8%) | 68 (6.2%) |
| Total (Overall) | 9,031 (50.3%) | 8,905 (49.6%) |
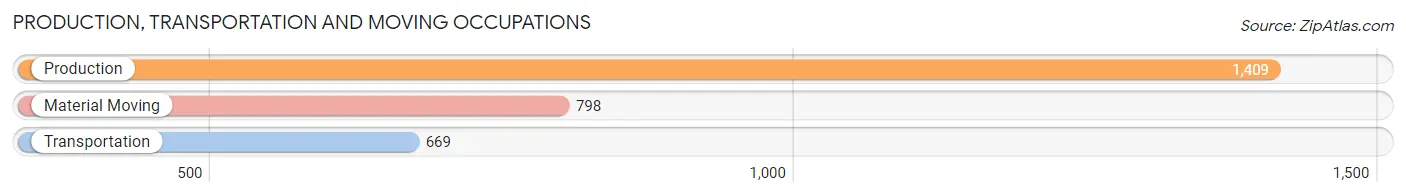
Production, Transportation and Moving Occupations
The most common Production, Transportation and Moving occupations in Lewiston are Production (1,409 | 7.9%), Material Moving (798 | 4.4%), and Transportation (669 | 3.7%).
Production, Transportation and Moving Occupations by Sex
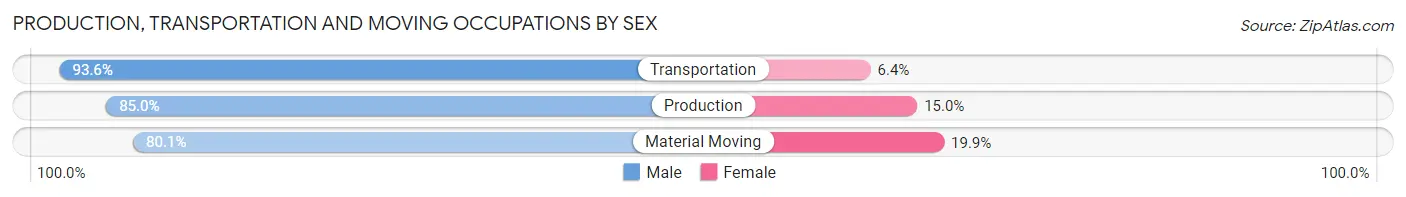
| Occupation | Male | Female |
| Production | 1,198 (85.0%) | 211 (15.0%) |
| Transportation | 626 (93.6%) | 43 (6.4%) |
| Material Moving | 639 (80.1%) | 159 (19.9%) |
| Total (Category) | 2,463 (85.6%) | 413 (14.4%) |
| Total (Overall) | 9,031 (50.3%) | 8,905 (49.6%) |
Employment Industries by Sex in Lewiston
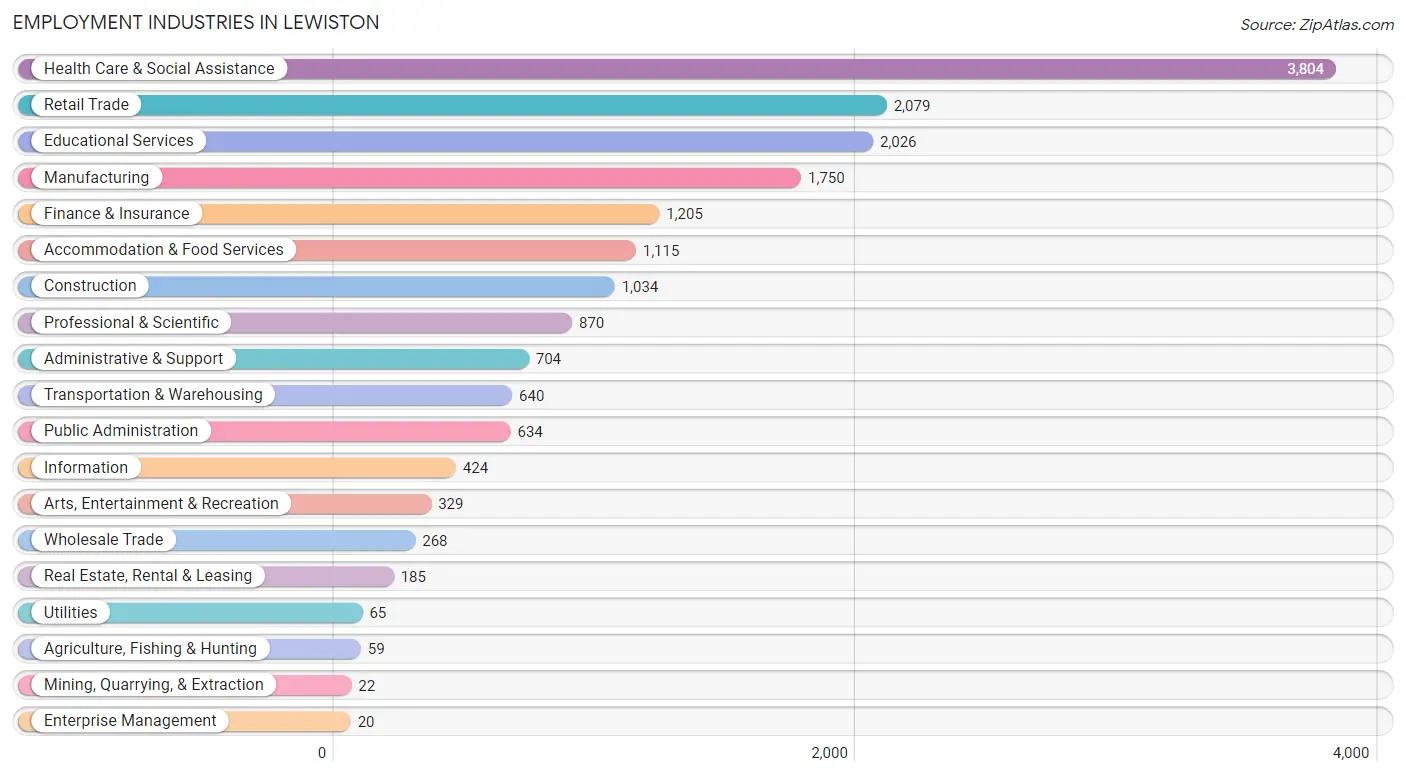
Employment Industries in Lewiston
The major employment industries in Lewiston include Health Care & Social Assistance (3,804 | 21.2%), Retail Trade (2,079 | 11.6%), Educational Services (2,026 | 11.3%), Manufacturing (1,750 | 9.8%), and Finance & Insurance (1,205 | 6.7%).
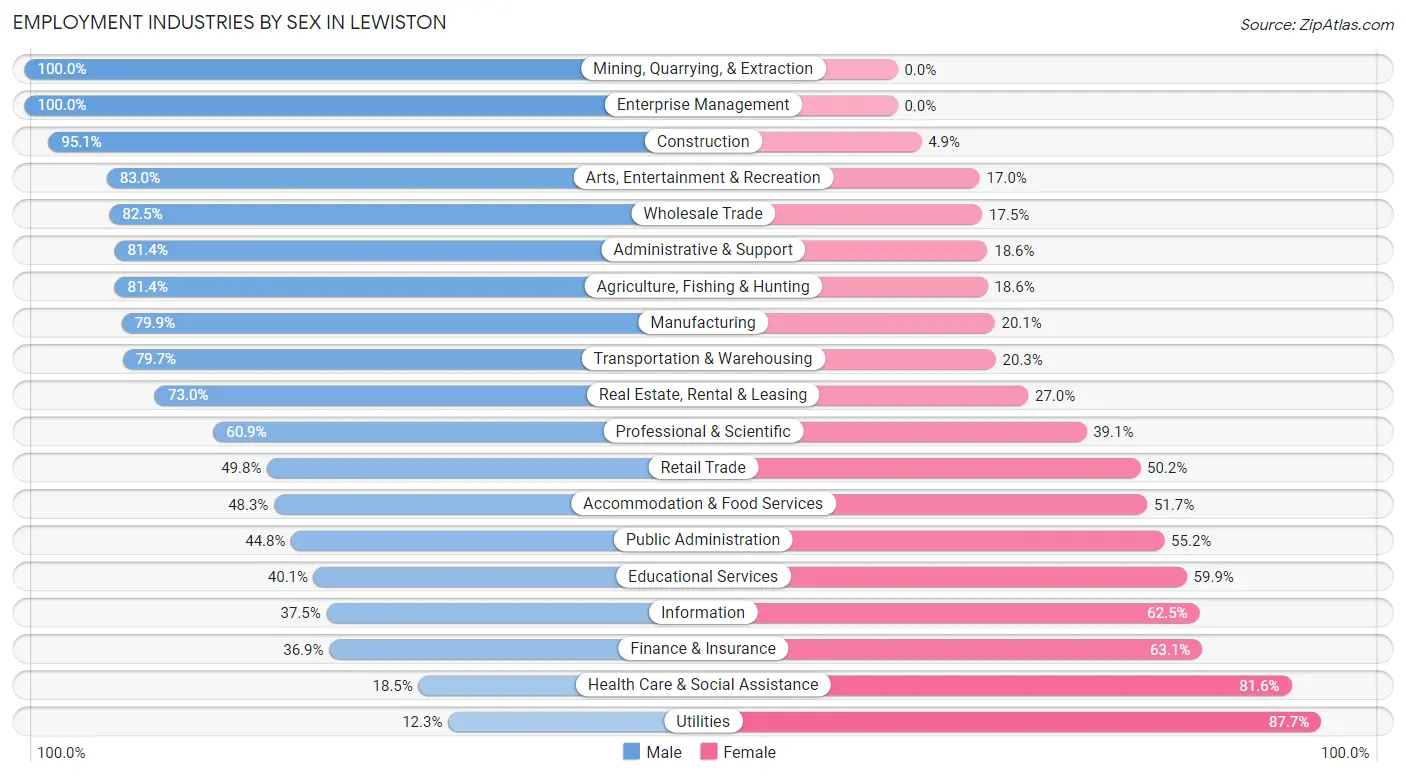
Employment Industries by Sex in Lewiston
The Lewiston industries that see more men than women are Mining, Quarrying, & Extraction (100.0%), Enterprise Management (100.0%), and Construction (95.1%), whereas the industries that tend to have a higher number of women are Utilities (87.7%), Health Care & Social Assistance (81.6%), and Finance & Insurance (63.1%).
| Industry | Male | Female |
| Agriculture, Fishing & Hunting | 48 (81.4%) | 11 (18.6%) |
| Mining, Quarrying, & Extraction | 22 (100.0%) | 0 (0.0%) |
| Construction | 983 (95.1%) | 51 (4.9%) |
| Manufacturing | 1,398 (79.9%) | 352 (20.1%) |
| Wholesale Trade | 221 (82.5%) | 47 (17.5%) |
| Retail Trade | 1,035 (49.8%) | 1,044 (50.2%) |
| Transportation & Warehousing | 510 (79.7%) | 130 (20.3%) |
| Utilities | 8 (12.3%) | 57 (87.7%) |
| Information | 159 (37.5%) | 265 (62.5%) |
| Finance & Insurance | 445 (36.9%) | 760 (63.1%) |
| Real Estate, Rental & Leasing | 135 (73.0%) | 50 (27.0%) |
| Professional & Scientific | 530 (60.9%) | 340 (39.1%) |
| Enterprise Management | 20 (100.0%) | 0 (0.0%) |
| Administrative & Support | 573 (81.4%) | 131 (18.6%) |
| Educational Services | 813 (40.1%) | 1,213 (59.9%) |
| Health Care & Social Assistance | 702 (18.4%) | 3,102 (81.6%) |
| Arts, Entertainment & Recreation | 273 (83.0%) | 56 (17.0%) |
| Accommodation & Food Services | 539 (48.3%) | 576 (51.7%) |
| Public Administration | 284 (44.8%) | 350 (55.2%) |
| Total | 9,031 (50.3%) | 8,905 (49.6%) |
Education in Lewiston
School Enrollment in Lewiston
The most common levels of schooling among the 8,643 students in Lewiston are college / undergraduate (3,033 | 35.1%), elementary school (1,676 | 19.4%), and high school (1,627 | 18.8%).
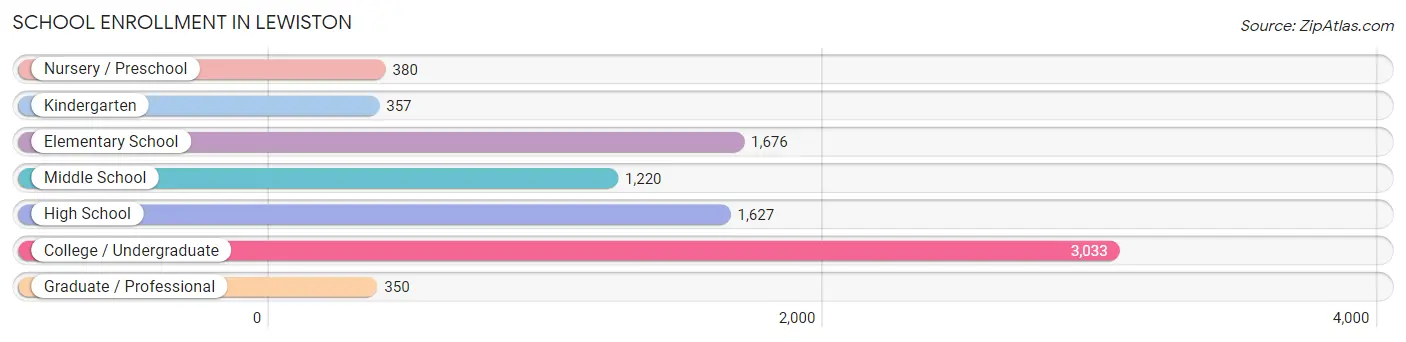
| School Level | # Students | % Students |
| Nursery / Preschool | 380 | 4.4% |
| Kindergarten | 357 | 4.1% |
| Elementary School | 1,676 | 19.4% |
| Middle School | 1,220 | 14.1% |
| High School | 1,627 | 18.8% |
| College / Undergraduate | 3,033 | 35.1% |
| Graduate / Professional | 350 | 4.1% |
| Total | 8,643 | 100.0% |
School Enrollment by Age by Funding Source in Lewiston
Out of a total of 8,643 students who are enrolled in schools in Lewiston, 2,290 (26.5%) attend a private institution, while the remaining 6,353 (73.5%) are enrolled in public schools. The age group of 20 to 24 year olds has the highest likelihood of being enrolled in private schools, with 1,108 (63.2% in the age bracket) enrolled. Conversely, the age group of 15 to 17 year olds has the lowest likelihood of being enrolled in a private school, with 1,213 (94.4% in the age bracket) attending a public institution.
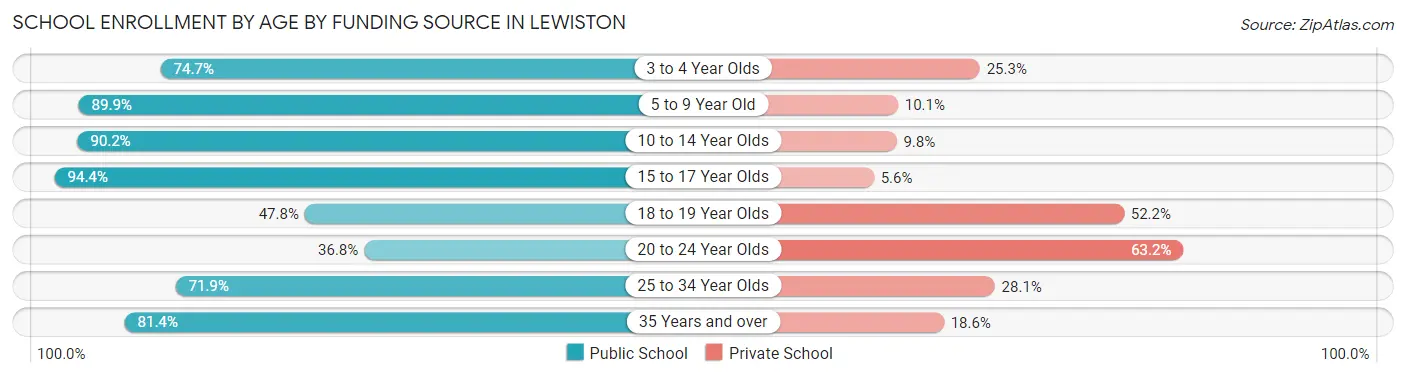
| Age Bracket | Public School | Private School |
| 3 to 4 Year Olds | 165 (74.7%) | 56 (25.3%) |
| 5 to 9 Year Old | 1,882 (89.9%) | 211 (10.1%) |
| 10 to 14 Year Olds | 1,292 (90.2%) | 141 (9.8%) |
| 15 to 17 Year Olds | 1,213 (94.4%) | 72 (5.6%) |
| 18 to 19 Year Olds | 427 (47.8%) | 466 (52.2%) |
| 20 to 24 Year Olds | 644 (36.8%) | 1,108 (63.2%) |
| 25 to 34 Year Olds | 432 (71.9%) | 169 (28.1%) |
| 35 Years and over | 297 (81.4%) | 68 (18.6%) |
| Total | 6,353 (73.5%) | 2,290 (26.5%) |
Educational Attainment by Field of Study in Lewiston
Education (946 | 15.0%), business (870 | 13.8%), social sciences (648 | 10.3%), science & technology (642 | 10.2%), and liberal arts & history (469 | 7.4%) are the most common fields of study among 6,298 individuals in Lewiston who have obtained a bachelor's degree or higher.
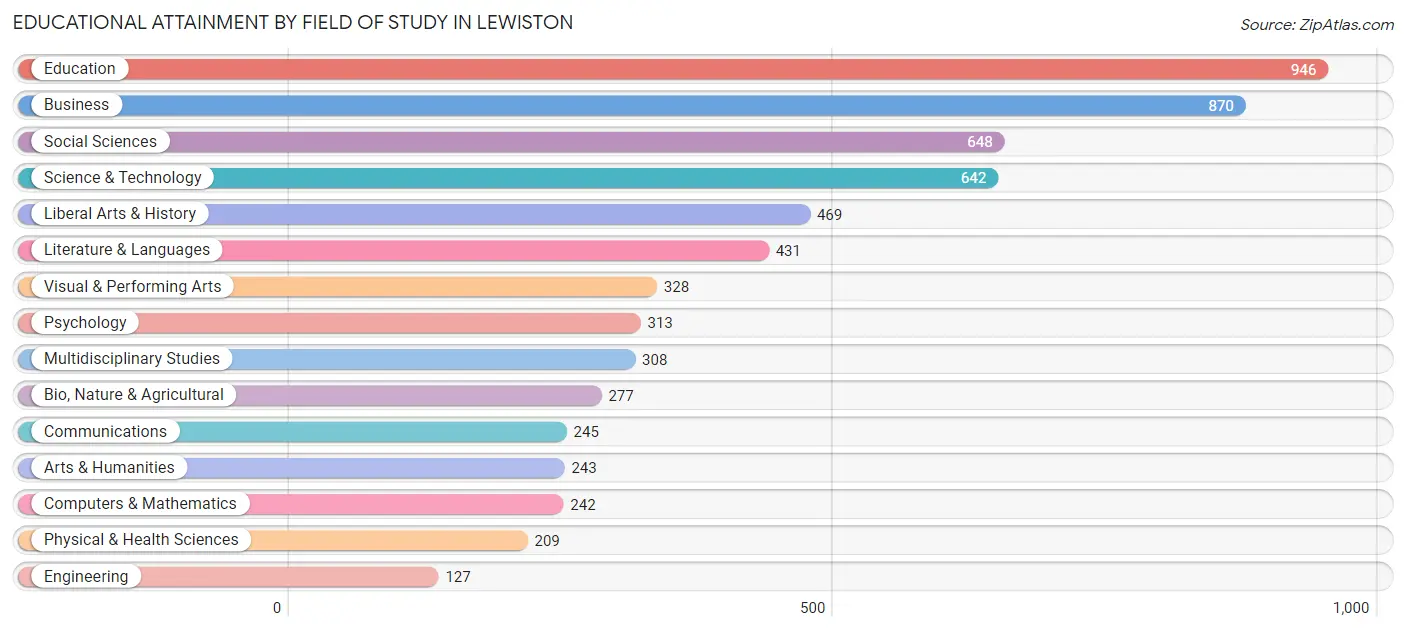
| Field of Study | # Graduates | % Graduates |
| Computers & Mathematics | 242 | 3.8% |
| Bio, Nature & Agricultural | 277 | 4.4% |
| Physical & Health Sciences | 209 | 3.3% |
| Psychology | 313 | 5.0% |
| Social Sciences | 648 | 10.3% |
| Engineering | 127 | 2.0% |
| Multidisciplinary Studies | 308 | 4.9% |
| Science & Technology | 642 | 10.2% |
| Business | 870 | 13.8% |
| Education | 946 | 15.0% |
| Literature & Languages | 431 | 6.8% |
| Liberal Arts & History | 469 | 7.4% |
| Visual & Performing Arts | 328 | 5.2% |
| Communications | 245 | 3.9% |
| Arts & Humanities | 243 | 3.9% |
| Total | 6,298 | 100.0% |
Transportation & Commute in Lewiston
Vehicle Availability by Sex in Lewiston
The most prevalent vehicle ownership categories in Lewiston are males with 2 vehicles (3,761, accounting for 44.0%) and females with 2 vehicles (3,632, making up 45.3%).
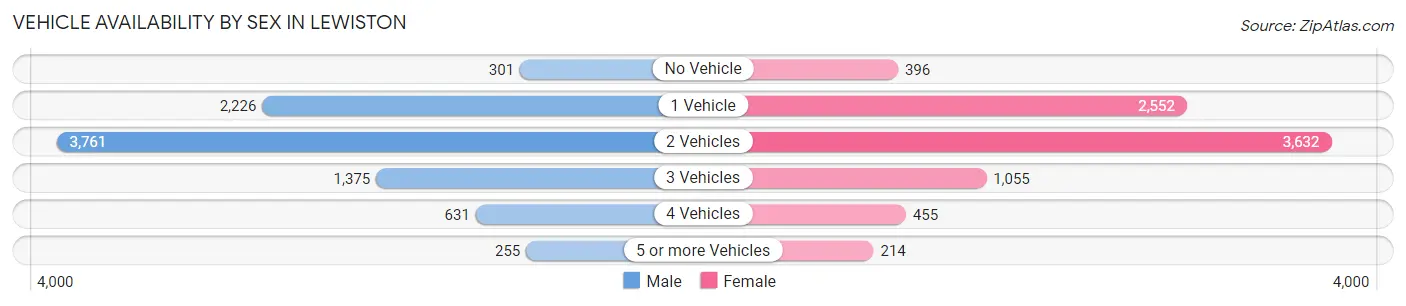
| Vehicles Available | Male | Female |
| No Vehicle | 301 (3.5%) | 396 (4.8%) |
| 1 Vehicle | 2,226 (26.0%) | 2,552 (30.7%) |
| 2 Vehicles | 3,761 (44.0%) | 3,632 (43.7%) |
| 3 Vehicles | 1,375 (16.1%) | 1,055 (12.7%) |
| 4 Vehicles | 631 (7.4%) | 455 (5.5%) |
| 5 or more Vehicles | 255 (3.0%) | 214 (2.6%) |
| Total | 8,549 (100.0%) | 8,304 (100.0%) |
Commute Time in Lewiston
The most frequently occuring commute durations in Lewiston are 5 to 9 minutes (3,708 commuters, 23.4%), 10 to 14 minutes (3,429 commuters, 21.6%), and 15 to 19 minutes (1,945 commuters, 12.2%).
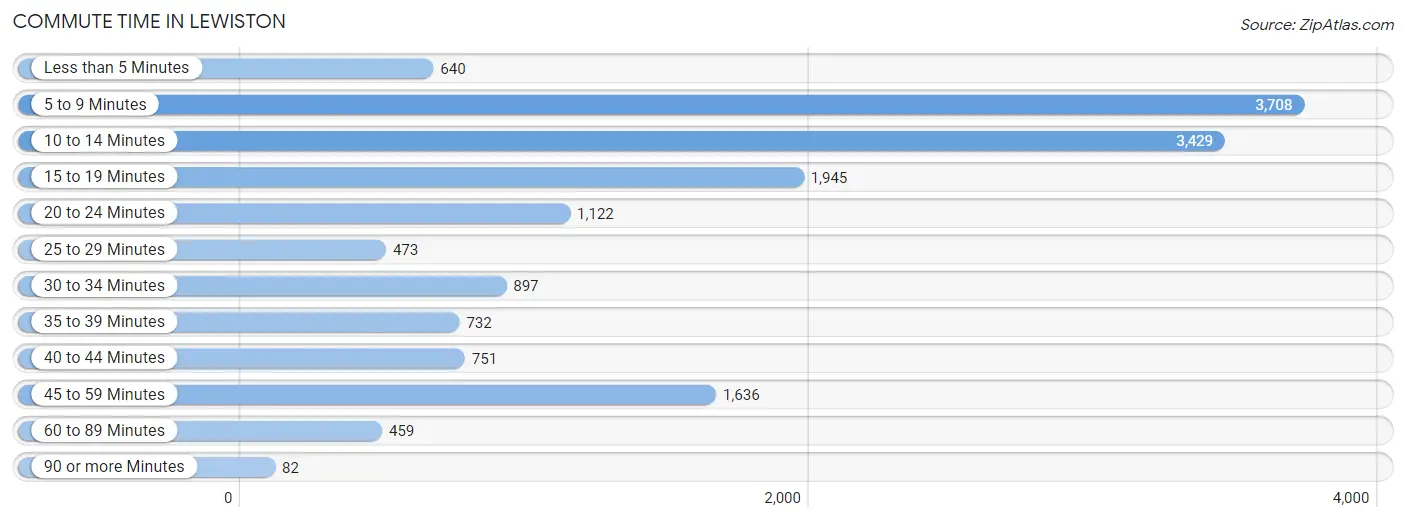
| Commute Time | # Commuters | % Commuters |
| Less than 5 Minutes | 640 | 4.0% |
| 5 to 9 Minutes | 3,708 | 23.4% |
| 10 to 14 Minutes | 3,429 | 21.6% |
| 15 to 19 Minutes | 1,945 | 12.2% |
| 20 to 24 Minutes | 1,122 | 7.1% |
| 25 to 29 Minutes | 473 | 3.0% |
| 30 to 34 Minutes | 897 | 5.7% |
| 35 to 39 Minutes | 732 | 4.6% |
| 40 to 44 Minutes | 751 | 4.7% |
| 45 to 59 Minutes | 1,636 | 10.3% |
| 60 to 89 Minutes | 459 | 2.9% |
| 90 or more Minutes | 82 | 0.5% |
Commute Time by Sex in Lewiston
The most common commute times in Lewiston are 5 to 9 minutes (1,529 commuters, 18.5%) for males and 5 to 9 minutes (2,179 commuters, 28.6%) for females.
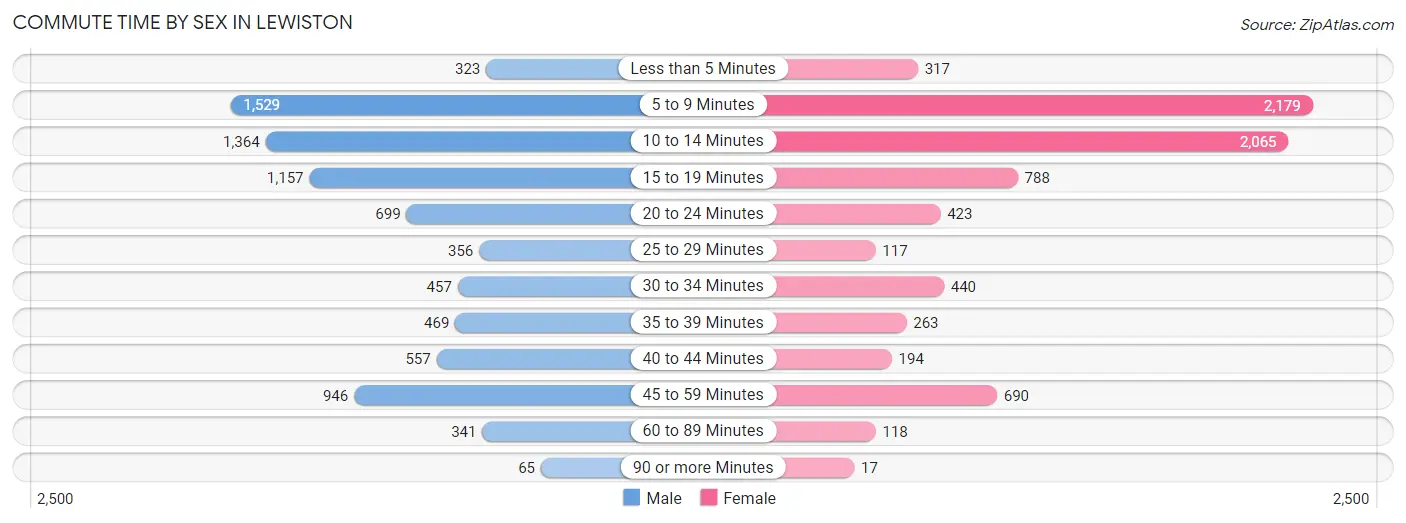
| Commute Time | Male | Female |
| Less than 5 Minutes | 323 (3.9%) | 317 (4.2%) |
| 5 to 9 Minutes | 1,529 (18.5%) | 2,179 (28.6%) |
| 10 to 14 Minutes | 1,364 (16.5%) | 2,065 (27.1%) |
| 15 to 19 Minutes | 1,157 (14.0%) | 788 (10.3%) |
| 20 to 24 Minutes | 699 (8.5%) | 423 (5.6%) |
| 25 to 29 Minutes | 356 (4.3%) | 117 (1.5%) |
| 30 to 34 Minutes | 457 (5.5%) | 440 (5.8%) |
| 35 to 39 Minutes | 469 (5.7%) | 263 (3.5%) |
| 40 to 44 Minutes | 557 (6.7%) | 194 (2.5%) |
| 45 to 59 Minutes | 946 (11.5%) | 690 (9.1%) |
| 60 to 89 Minutes | 341 (4.1%) | 118 (1.5%) |
| 90 or more Minutes | 65 (0.8%) | 17 (0.2%) |
Time of Departure to Work by Sex in Lewiston
The most frequent times of departure to work in Lewiston are 12:00 PM to 3:59 PM (955, 11.6%) for males and 7:30 AM to 7:59 AM (1,314, 17.3%) for females.
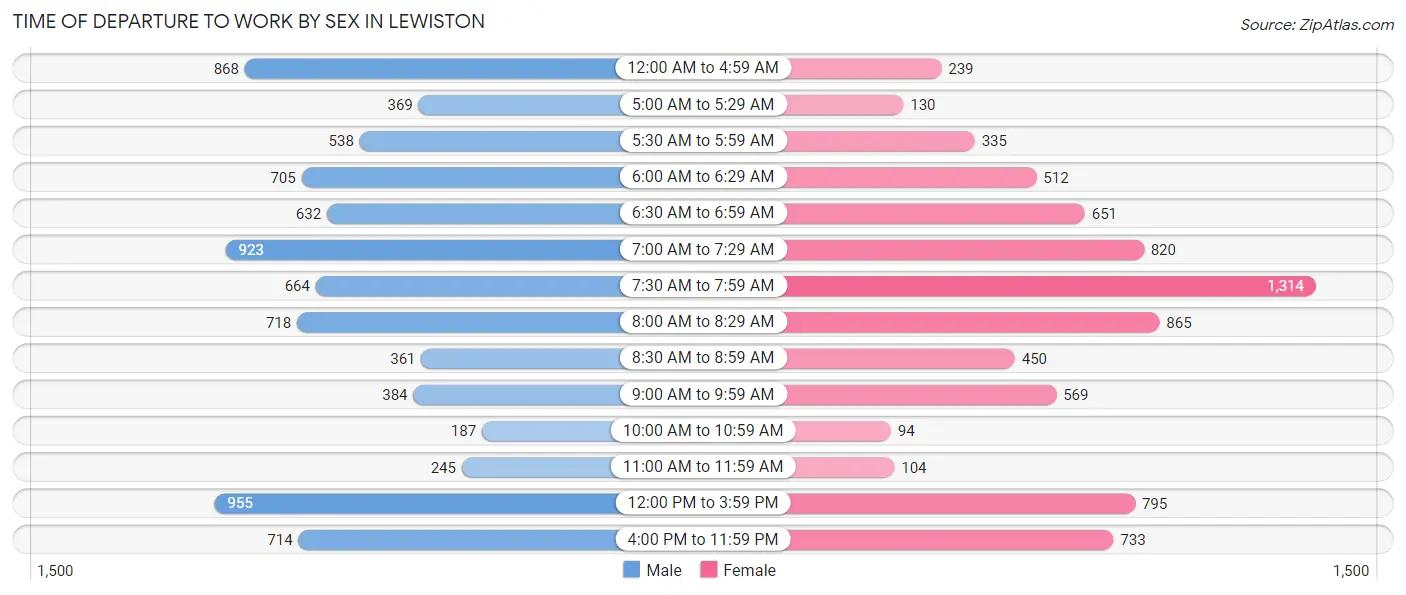
| Time of Departure | Male | Female |
| 12:00 AM to 4:59 AM | 868 (10.5%) | 239 (3.1%) |
| 5:00 AM to 5:29 AM | 369 (4.5%) | 130 (1.7%) |
| 5:30 AM to 5:59 AM | 538 (6.5%) | 335 (4.4%) |
| 6:00 AM to 6:29 AM | 705 (8.5%) | 512 (6.7%) |
| 6:30 AM to 6:59 AM | 632 (7.6%) | 651 (8.6%) |
| 7:00 AM to 7:29 AM | 923 (11.2%) | 820 (10.8%) |
| 7:30 AM to 7:59 AM | 664 (8.0%) | 1,314 (17.3%) |
| 8:00 AM to 8:29 AM | 718 (8.7%) | 865 (11.4%) |
| 8:30 AM to 8:59 AM | 361 (4.4%) | 450 (5.9%) |
| 9:00 AM to 9:59 AM | 384 (4.6%) | 569 (7.5%) |
| 10:00 AM to 10:59 AM | 187 (2.3%) | 94 (1.2%) |
| 11:00 AM to 11:59 AM | 245 (3.0%) | 104 (1.4%) |
| 12:00 PM to 3:59 PM | 955 (11.6%) | 795 (10.4%) |
| 4:00 PM to 11:59 PM | 714 (8.6%) | 733 (9.6%) |
| Total | 8,263 (100.0%) | 7,611 (100.0%) |
Housing Occupancy in Lewiston
Occupancy by Ownership in Lewiston
Of the total 15,611 dwellings in Lewiston, owner-occupied units account for 7,725 (49.5%), while renter-occupied units make up 7,886 (50.5%).
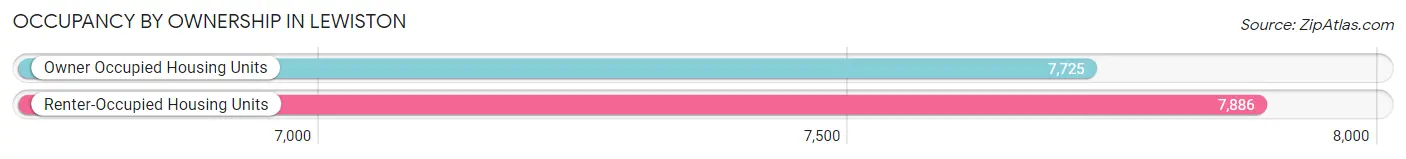
| Occupancy | # Housing Units | % Housing Units |
| Owner Occupied Housing Units | 7,725 | 49.5% |
| Renter-Occupied Housing Units | 7,886 | 50.5% |
| Total Occupied Housing Units | 15,611 | 100.0% |
Occupancy by Household Size in Lewiston
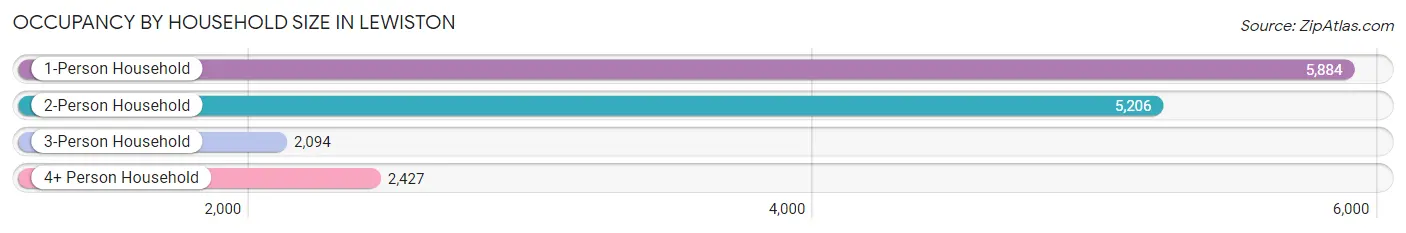
| Household Size | # Housing Units | % Housing Units |
| 1-Person Household | 5,884 | 37.7% |
| 2-Person Household | 5,206 | 33.4% |
| 3-Person Household | 2,094 | 13.4% |
| 4+ Person Household | 2,427 | 15.5% |
| Total Housing Units | 15,611 | 100.0% |
Occupancy by Ownership by Household Size in Lewiston
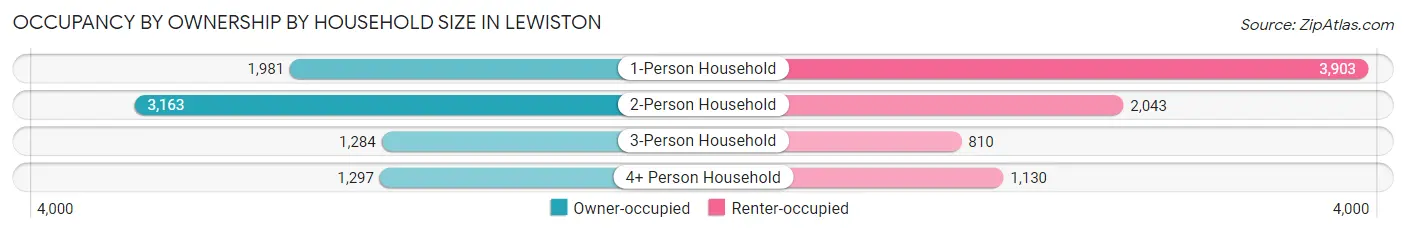
| Household Size | Owner-occupied | Renter-occupied |
| 1-Person Household | 1,981 (33.7%) | 3,903 (66.3%) |
| 2-Person Household | 3,163 (60.8%) | 2,043 (39.2%) |
| 3-Person Household | 1,284 (61.3%) | 810 (38.7%) |
| 4+ Person Household | 1,297 (53.4%) | 1,130 (46.6%) |
| Total Housing Units | 7,725 (49.5%) | 7,886 (50.5%) |
Occupancy by Educational Attainment in Lewiston
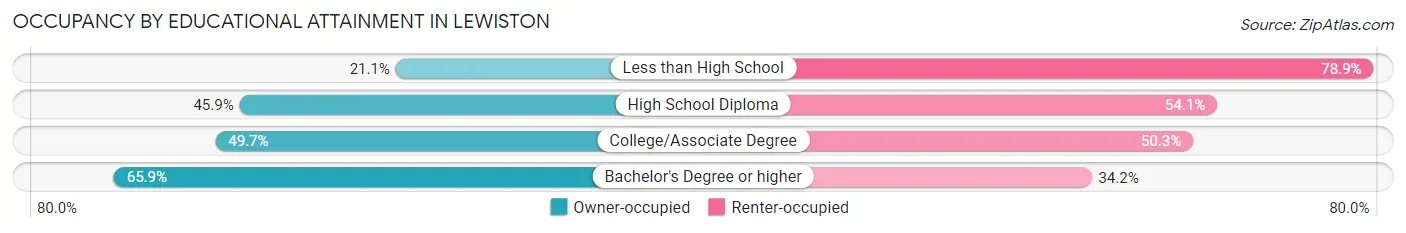
| Household Size | Owner-occupied | Renter-occupied |
| Less than High School | 323 (21.1%) | 1,205 (78.9%) |
| High School Diploma | 2,663 (45.9%) | 3,136 (54.1%) |
| College/Associate Degree | 2,211 (49.7%) | 2,234 (50.3%) |
| Bachelor's Degree or higher | 2,528 (65.8%) | 1,311 (34.2%) |
Occupancy by Age of Householder in Lewiston
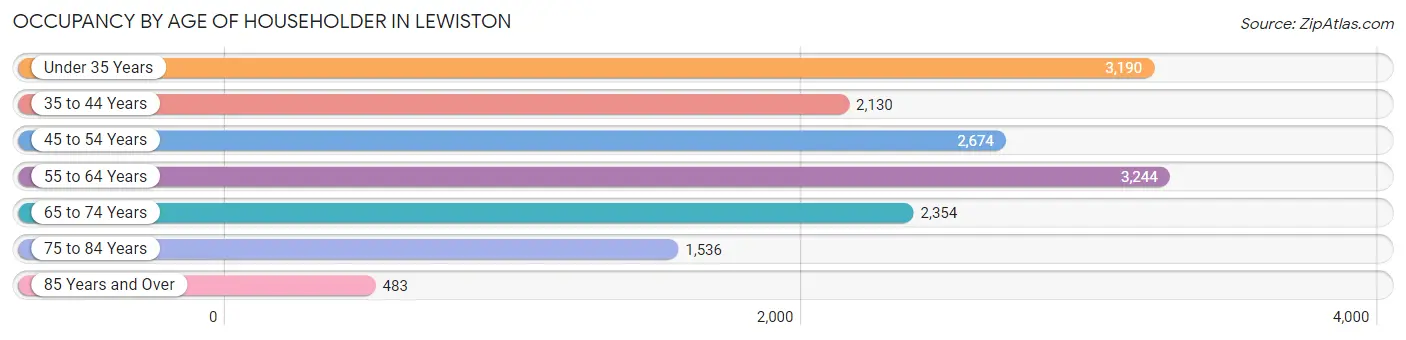
| Age Bracket | # Households | % Households |
| Under 35 Years | 3,190 | 20.4% |
| 35 to 44 Years | 2,130 | 13.6% |
| 45 to 54 Years | 2,674 | 17.1% |
| 55 to 64 Years | 3,244 | 20.8% |
| 65 to 74 Years | 2,354 | 15.1% |
| 75 to 84 Years | 1,536 | 9.8% |
| 85 Years and Over | 483 | 3.1% |
| Total | 15,611 | 100.0% |
Housing Finances in Lewiston
Median Income by Occupancy in Lewiston
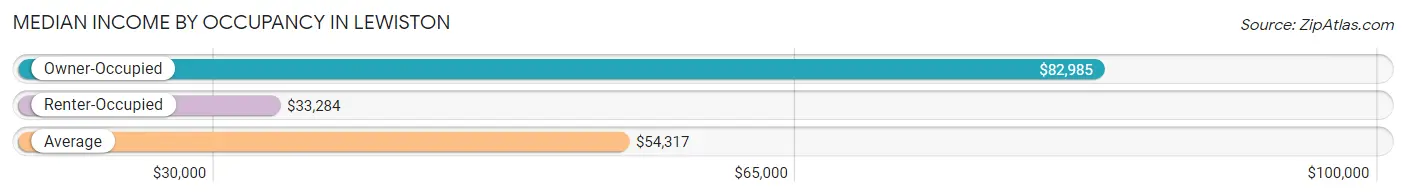
| Occupancy Type | # Households | Median Income |
| Owner-Occupied | 7,725 (49.5%) | $82,985 |
| Renter-Occupied | 7,886 (50.5%) | $33,284 |
| Average | 15,611 (100.0%) | $54,317 |
Occupancy by Householder Income Bracket in Lewiston
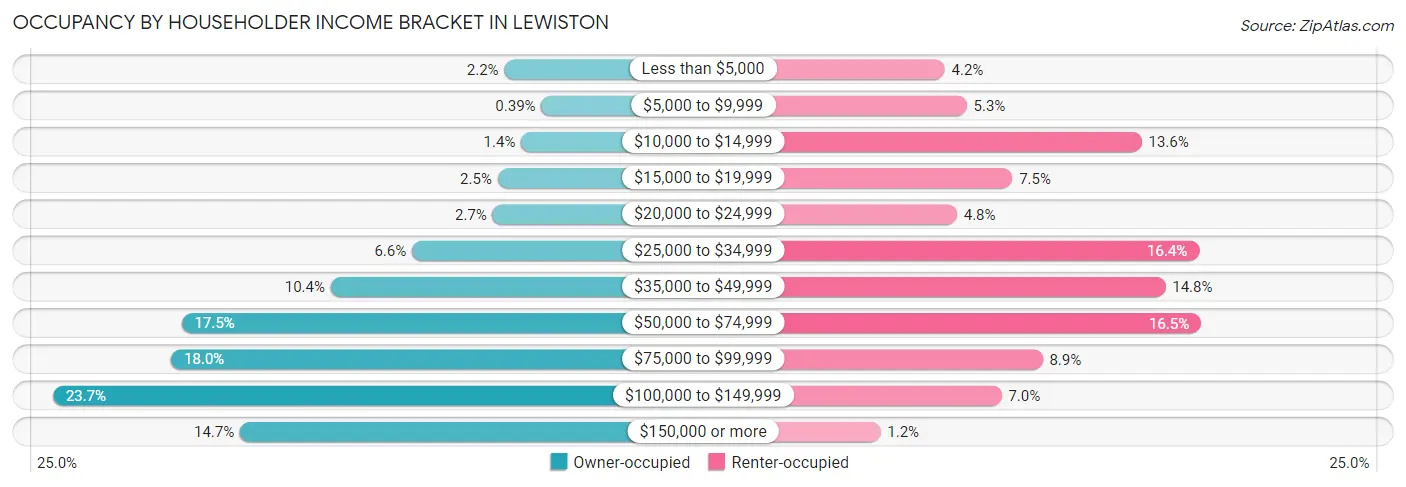
| Income Bracket | Owner-occupied | Renter-occupied |
| Less than $5,000 | 166 (2.1%) | 334 (4.2%) |
| $5,000 to $9,999 | 30 (0.4%) | 417 (5.3%) |
| $10,000 to $14,999 | 104 (1.3%) | 1,074 (13.6%) |
| $15,000 to $19,999 | 191 (2.5%) | 588 (7.5%) |
| $20,000 to $24,999 | 209 (2.7%) | 380 (4.8%) |
| $25,000 to $34,999 | 506 (6.6%) | 1,290 (16.4%) |
| $35,000 to $49,999 | 805 (10.4%) | 1,163 (14.7%) |
| $50,000 to $74,999 | 1,354 (17.5%) | 1,297 (16.5%) |
| $75,000 to $99,999 | 1,393 (18.0%) | 702 (8.9%) |
| $100,000 to $149,999 | 1,828 (23.7%) | 548 (7.0%) |
| $150,000 or more | 1,139 (14.7%) | 93 (1.2%) |
| Total | 7,725 (100.0%) | 7,886 (100.0%) |
Monthly Housing Cost Tiers in Lewiston
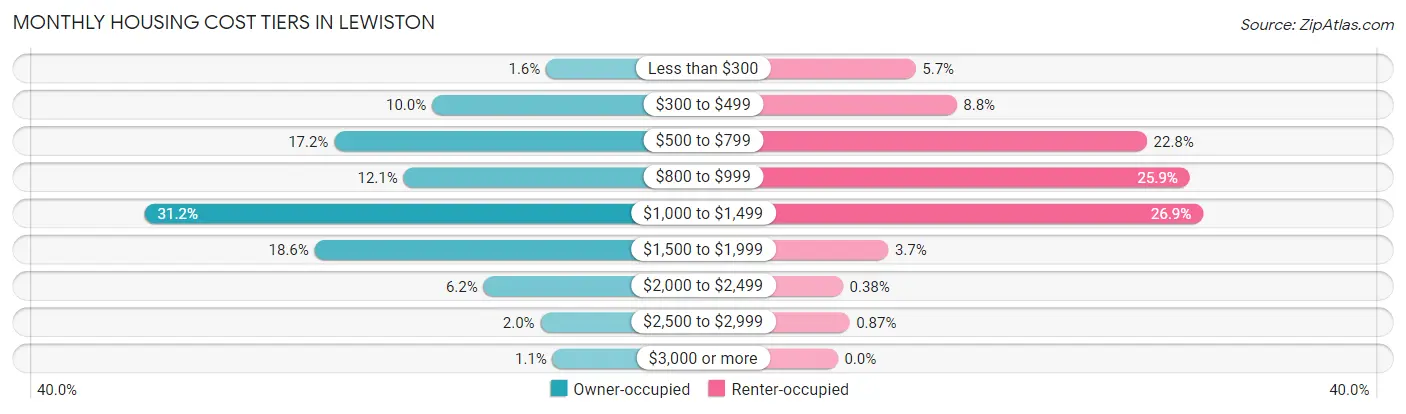
| Monthly Cost | Owner-occupied | Renter-occupied |
| Less than $300 | 123 (1.6%) | 453 (5.7%) |
| $300 to $499 | 772 (10.0%) | 691 (8.8%) |
| $500 to $799 | 1,329 (17.2%) | 1,796 (22.8%) |
| $800 to $999 | 934 (12.1%) | 2,046 (25.9%) |
| $1,000 to $1,499 | 2,407 (31.2%) | 2,124 (26.9%) |
| $1,500 to $1,999 | 1,440 (18.6%) | 293 (3.7%) |
| $2,000 to $2,499 | 479 (6.2%) | 30 (0.4%) |
| $2,500 to $2,999 | 155 (2.0%) | 69 (0.9%) |
| $3,000 or more | 86 (1.1%) | 0 (0.0%) |
| Total | 7,725 (100.0%) | 7,886 (100.0%) |
Physical Housing Characteristics in Lewiston
Housing Structures in Lewiston
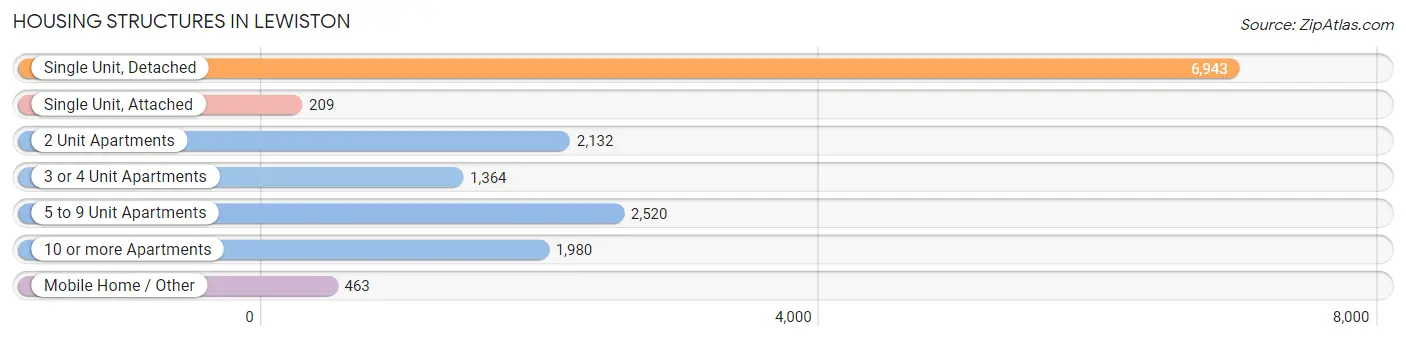
| Structure Type | # Housing Units | % Housing Units |
| Single Unit, Detached | 6,943 | 44.5% |
| Single Unit, Attached | 209 | 1.3% |
| 2 Unit Apartments | 2,132 | 13.7% |
| 3 or 4 Unit Apartments | 1,364 | 8.7% |
| 5 to 9 Unit Apartments | 2,520 | 16.1% |
| 10 or more Apartments | 1,980 | 12.7% |
| Mobile Home / Other | 463 | 3.0% |
| Total | 15,611 | 100.0% |
Housing Structures by Occupancy in Lewiston
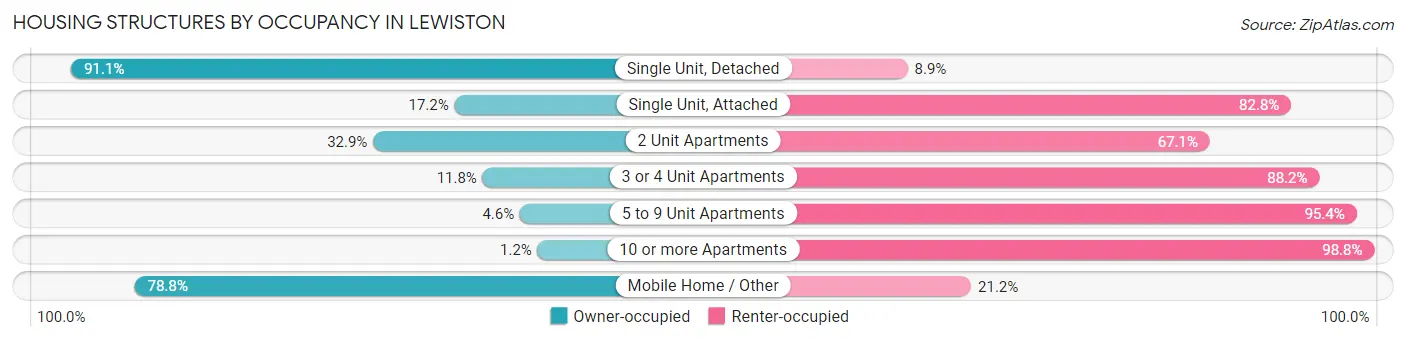
| Structure Type | Owner-occupied | Renter-occupied |
| Single Unit, Detached | 6,322 (91.1%) | 621 (8.9%) |
| Single Unit, Attached | 36 (17.2%) | 173 (82.8%) |
| 2 Unit Apartments | 701 (32.9%) | 1,431 (67.1%) |
| 3 or 4 Unit Apartments | 161 (11.8%) | 1,203 (88.2%) |
| 5 to 9 Unit Apartments | 116 (4.6%) | 2,404 (95.4%) |
| 10 or more Apartments | 24 (1.2%) | 1,956 (98.8%) |
| Mobile Home / Other | 365 (78.8%) | 98 (21.2%) |
| Total | 7,725 (49.5%) | 7,886 (50.5%) |
Housing Structures by Number of Rooms in Lewiston
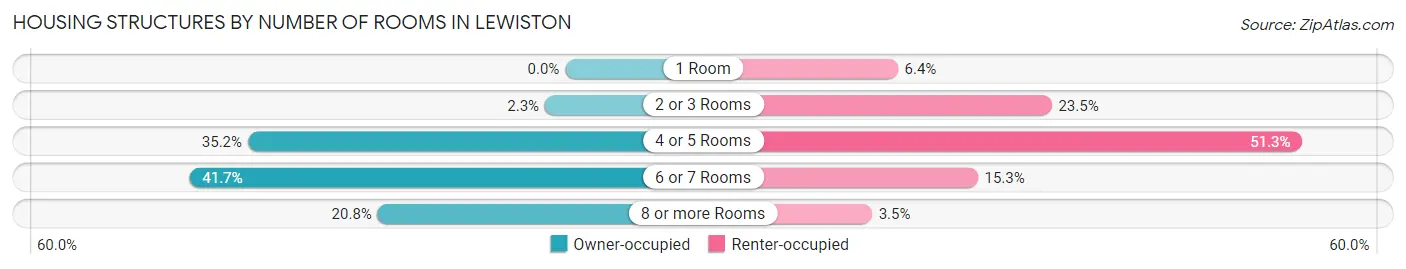
| Number of Rooms | Owner-occupied | Renter-occupied |
| 1 Room | 0 (0.0%) | 505 (6.4%) |
| 2 or 3 Rooms | 174 (2.2%) | 1,852 (23.5%) |
| 4 or 5 Rooms | 2,721 (35.2%) | 4,047 (51.3%) |
| 6 or 7 Rooms | 3,222 (41.7%) | 1,204 (15.3%) |
| 8 or more Rooms | 1,608 (20.8%) | 278 (3.5%) |
| Total | 7,725 (100.0%) | 7,886 (100.0%) |
Housing Structure by Heating Type in Lewiston
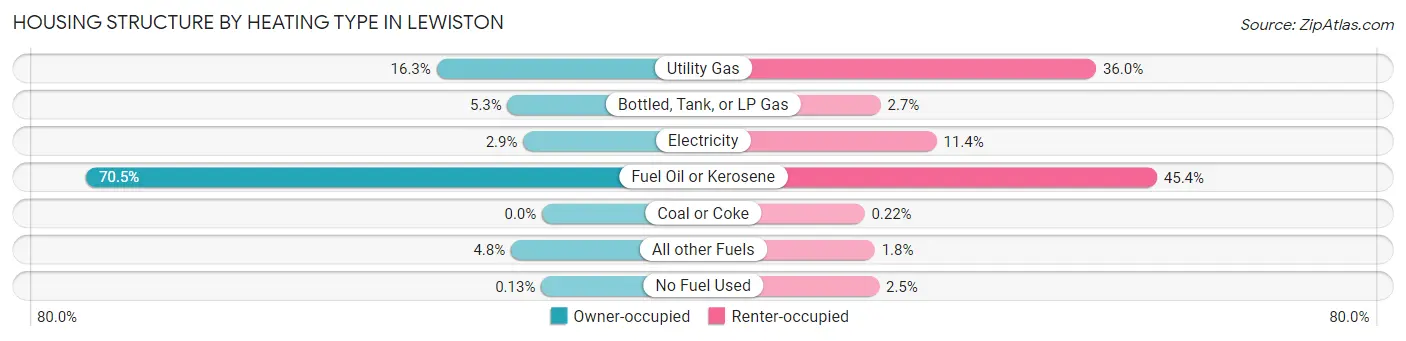
| Heating Type | Owner-occupied | Renter-occupied |
| Utility Gas | 1,260 (16.3%) | 2,840 (36.0%) |
| Bottled, Tank, or LP Gas | 412 (5.3%) | 213 (2.7%) |
| Electricity | 225 (2.9%) | 896 (11.4%) |
| Fuel Oil or Kerosene | 5,447 (70.5%) | 3,582 (45.4%) |
| Coal or Coke | 0 (0.0%) | 17 (0.2%) |
| All other Fuels | 371 (4.8%) | 143 (1.8%) |
| No Fuel Used | 10 (0.1%) | 195 (2.5%) |
| Total | 7,725 (100.0%) | 7,886 (100.0%) |
Household Vehicle Usage in Lewiston
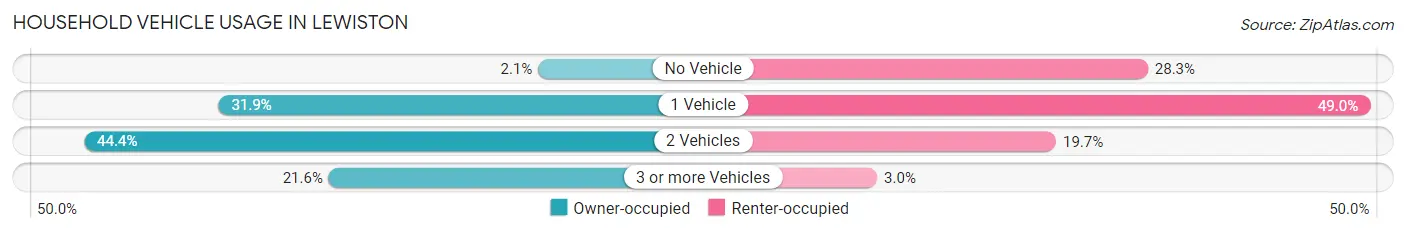
| Vehicles per Household | Owner-occupied | Renter-occupied |
| No Vehicle | 159 (2.1%) | 2,230 (28.3%) |
| 1 Vehicle | 2,464 (31.9%) | 3,865 (49.0%) |
| 2 Vehicles | 3,433 (44.4%) | 1,554 (19.7%) |
| 3 or more Vehicles | 1,669 (21.6%) | 237 (3.0%) |
| Total | 7,725 (100.0%) | 7,886 (100.0%) |
Real Estate & Mortgages in Lewiston
Real Estate and Mortgage Overview in Lewiston
| Characteristic | Without Mortgage | With Mortgage |
| Housing Units | 2,648 | 5,077 |
| Median Property Value | $189,600 | $189,500 |
| Median Household Income | $65,714 | $738 |
| Monthly Housing Costs | $591 | $75 |
| Real Estate Taxes | $2,661 | $0 |
Property Value by Mortgage Status in Lewiston
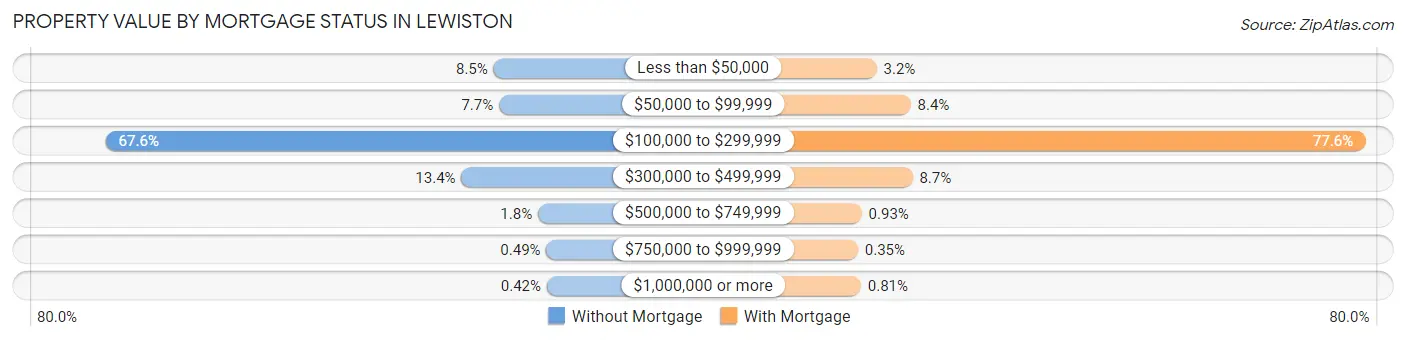
| Property Value | Without Mortgage | With Mortgage |
| Less than $50,000 | 226 (8.5%) | 163 (3.2%) |
| $50,000 to $99,999 | 204 (7.7%) | 426 (8.4%) |
| $100,000 to $299,999 | 1,791 (67.6%) | 3,942 (77.6%) |
| $300,000 to $499,999 | 356 (13.4%) | 440 (8.7%) |
| $500,000 to $749,999 | 47 (1.8%) | 47 (0.9%) |
| $750,000 to $999,999 | 13 (0.5%) | 18 (0.4%) |
| $1,000,000 or more | 11 (0.4%) | 41 (0.8%) |
| Total | 2,648 (100.0%) | 5,077 (100.0%) |
Household Income by Mortgage Status in Lewiston
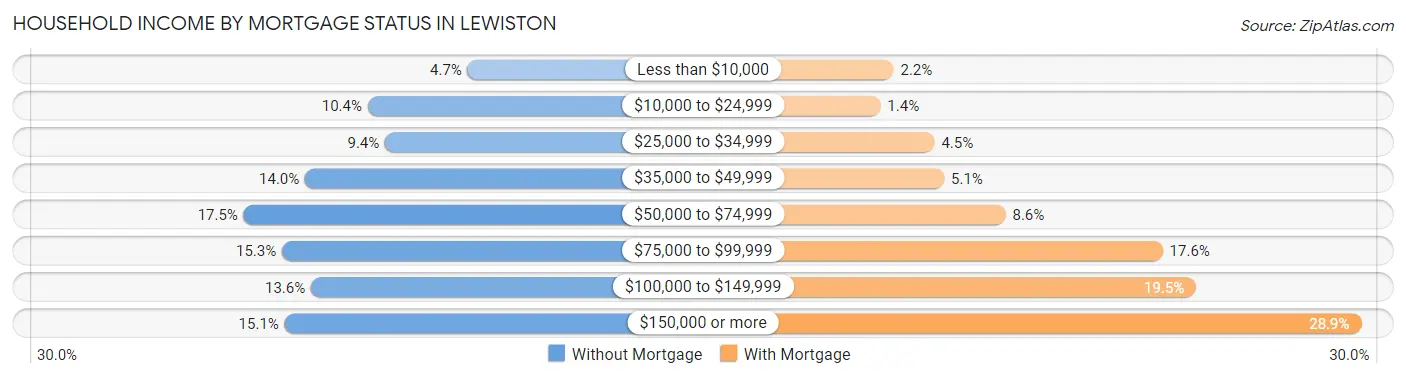
| Household Income | Without Mortgage | With Mortgage |
| Less than $10,000 | 124 (4.7%) | 110 (2.2%) |
| $10,000 to $24,999 | 275 (10.4%) | 72 (1.4%) |
| $25,000 to $34,999 | 249 (9.4%) | 229 (4.5%) |
| $35,000 to $49,999 | 370 (14.0%) | 257 (5.1%) |
| $50,000 to $74,999 | 463 (17.5%) | 435 (8.6%) |
| $75,000 to $99,999 | 405 (15.3%) | 891 (17.5%) |
| $100,000 to $149,999 | 361 (13.6%) | 988 (19.5%) |
| $150,000 or more | 401 (15.1%) | 1,467 (28.9%) |
| Total | 2,648 (100.0%) | 5,077 (100.0%) |
Property Value to Household Income Ratio in Lewiston
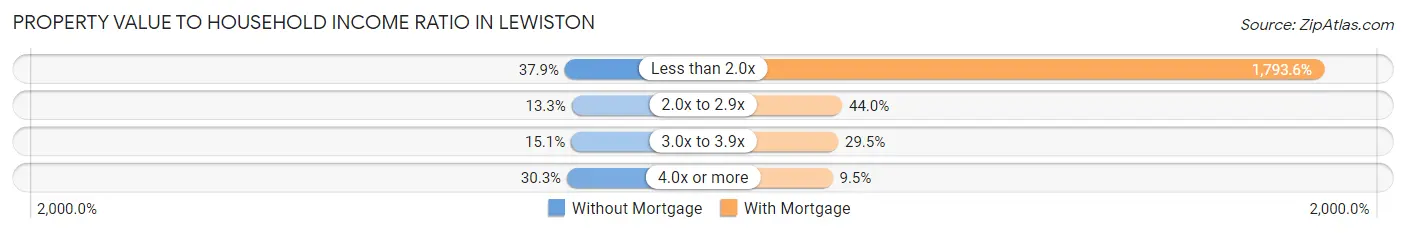
| Value-to-Income Ratio | Without Mortgage | With Mortgage |
| Less than 2.0x | 1,004 (37.9%) | 91,063 (1,793.6%) |
| 2.0x to 2.9x | 353 (13.3%) | 2,236 (44.0%) |
| 3.0x to 3.9x | 400 (15.1%) | 1,497 (29.5%) |
| 4.0x or more | 802 (30.3%) | 481 (9.5%) |
| Total | 2,648 (100.0%) | 5,077 (100.0%) |
Real Estate Taxes by Mortgage Status in Lewiston
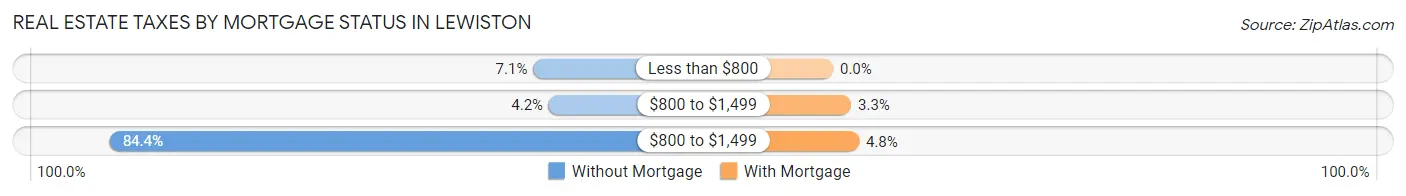
| Property Taxes | Without Mortgage | With Mortgage |
| Less than $800 | 188 (7.1%) | 0 (0.0%) |
| $800 to $1,499 | 112 (4.2%) | 167 (3.3%) |
| $800 to $1,499 | 2,236 (84.4%) | 241 (4.8%) |
| Total | 2,648 (100.0%) | 5,077 (100.0%) |
Health & Disability in Lewiston
Health Insurance Coverage by Age in Lewiston
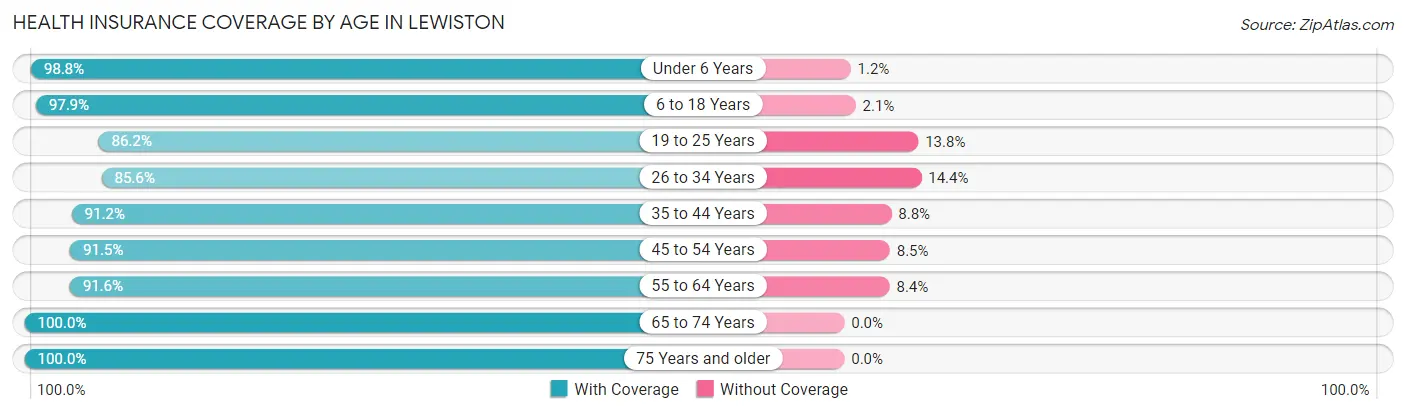
| Age Bracket | With Coverage | Without Coverage |
| Under 6 Years | 2,779 (98.8%) | 33 (1.2%) |
| 6 to 18 Years | 5,012 (97.9%) | 108 (2.1%) |
| 19 to 25 Years | 4,063 (86.2%) | 650 (13.8%) |
| 26 to 34 Years | 3,917 (85.6%) | 657 (14.4%) |
| 35 to 44 Years | 3,518 (91.2%) | 338 (8.8%) |
| 45 to 54 Years | 4,037 (91.5%) | 374 (8.5%) |
| 55 to 64 Years | 4,624 (91.6%) | 426 (8.4%) |
| 65 to 74 Years | 3,563 (100.0%) | 0 (0.0%) |
| 75 Years and older | 2,743 (100.0%) | 0 (0.0%) |
| Total | 34,256 (93.0%) | 2,586 (7.0%) |
Health Insurance Coverage by Citizenship Status in Lewiston
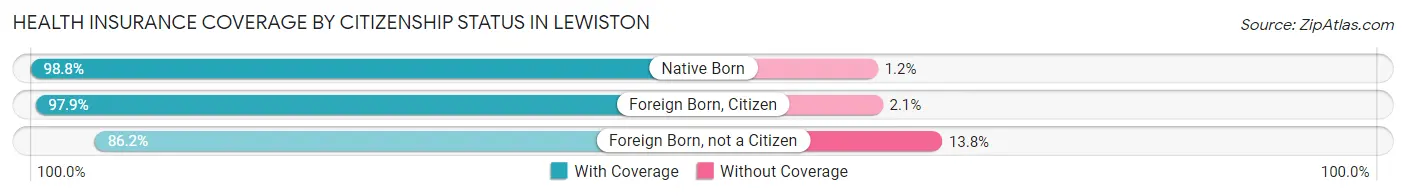
| Citizenship Status | With Coverage | Without Coverage |
| Native Born | 2,779 (98.8%) | 33 (1.2%) |
| Foreign Born, Citizen | 5,012 (97.9%) | 108 (2.1%) |
| Foreign Born, not a Citizen | 4,063 (86.2%) | 650 (13.8%) |
Health Insurance Coverage by Household Income in Lewiston
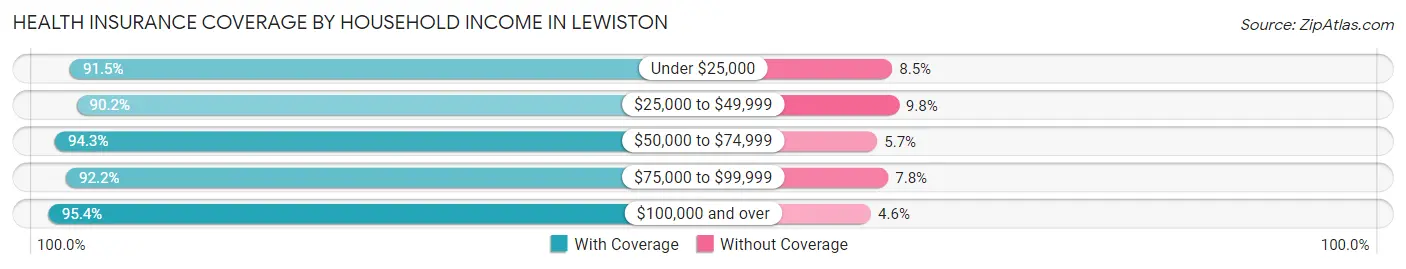
| Household Income | With Coverage | Without Coverage |
| Under $25,000 | 4,664 (91.5%) | 435 (8.5%) |
| $25,000 to $49,999 | 7,237 (90.2%) | 783 (9.8%) |
| $50,000 to $74,999 | 5,700 (94.3%) | 346 (5.7%) |
| $75,000 to $99,999 | 5,555 (92.2%) | 469 (7.8%) |
| $100,000 and over | 9,517 (95.4%) | 455 (4.6%) |
Public vs Private Health Insurance Coverage by Age in Lewiston
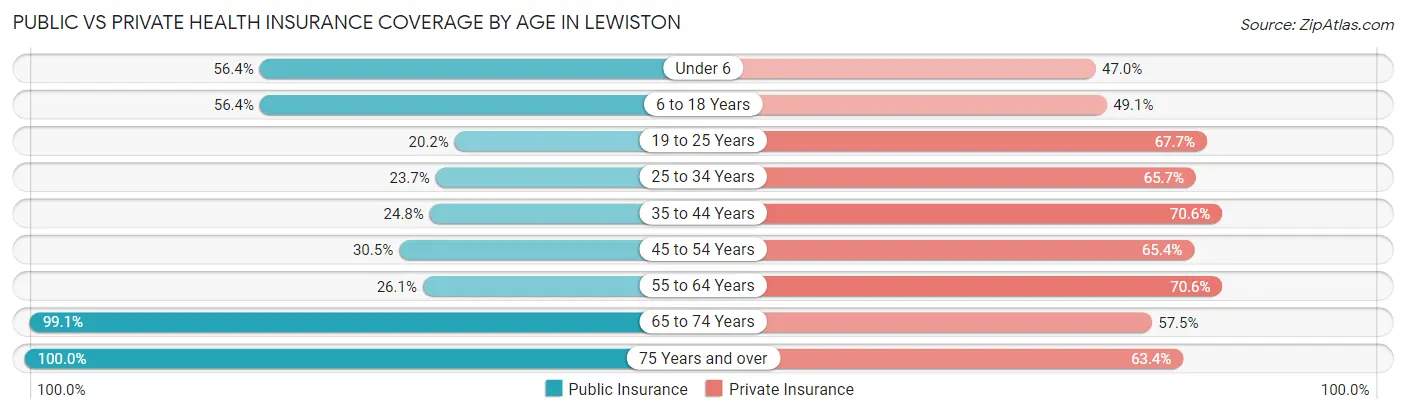
| Age Bracket | Public Insurance | Private Insurance |
| Under 6 | 1,586 (56.4%) | 1,322 (47.0%) |
| 6 to 18 Years | 2,885 (56.4%) | 2,513 (49.1%) |
| 19 to 25 Years | 951 (20.2%) | 3,192 (67.7%) |
| 25 to 34 Years | 1,085 (23.7%) | 3,005 (65.7%) |
| 35 to 44 Years | 957 (24.8%) | 2,721 (70.6%) |
| 45 to 54 Years | 1,346 (30.5%) | 2,885 (65.4%) |
| 55 to 64 Years | 1,318 (26.1%) | 3,567 (70.6%) |
| 65 to 74 Years | 3,529 (99.1%) | 2,047 (57.5%) |
| 75 Years and over | 2,743 (100.0%) | 1,738 (63.4%) |
| Total | 16,400 (44.5%) | 22,990 (62.4%) |
Disability Status by Sex by Age in Lewiston
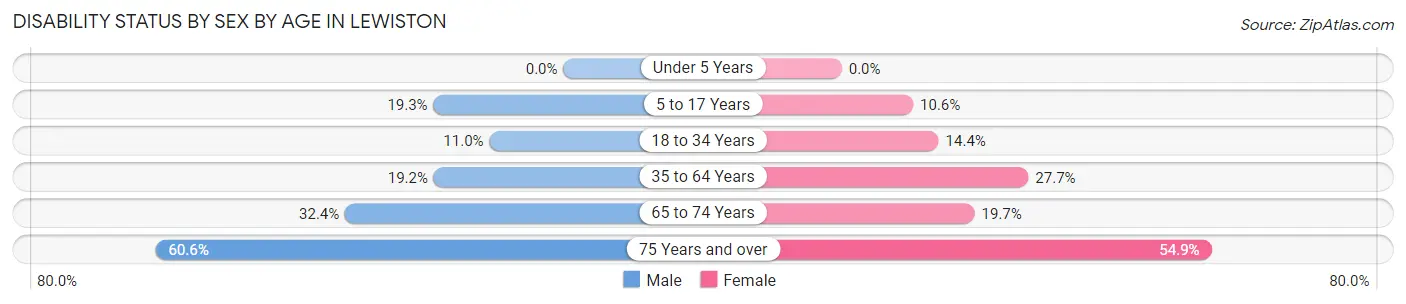
| Age Bracket | Male | Female |
| Under 5 Years | 0 (0.0%) | 0 (0.0%) |
| 5 to 17 Years | 516 (19.3%) | 255 (10.6%) |
| 18 to 34 Years | 531 (11.0%) | 702 (14.4%) |
| 35 to 64 Years | 1,260 (19.2%) | 1,876 (27.7%) |
| 65 to 74 Years | 571 (32.4%) | 355 (19.7%) |
| 75 Years and over | 711 (60.6%) | 861 (54.9%) |
Disability Class by Sex by Age in Lewiston
Disability Class: Hearing Difficulty
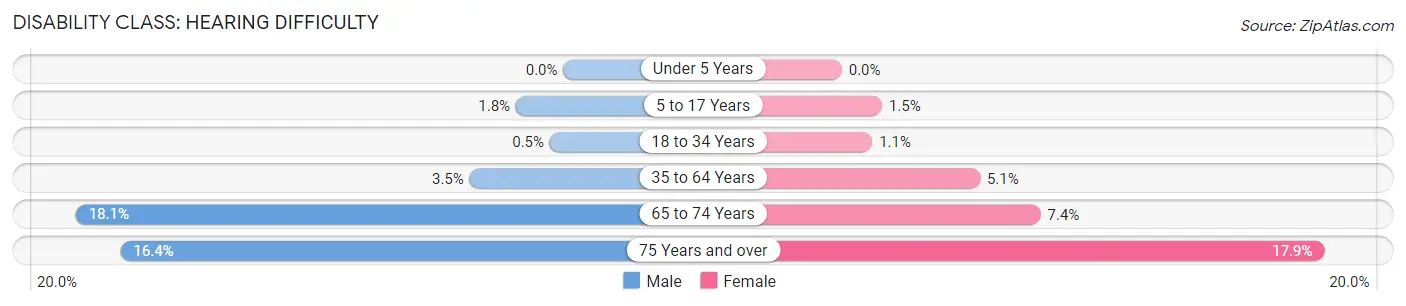
| Age Bracket | Male | Female |
| Under 5 Years | 0 (0.0%) | 0 (0.0%) |
| 5 to 17 Years | 47 (1.8%) | 36 (1.5%) |
| 18 to 34 Years | 24 (0.5%) | 55 (1.1%) |
| 35 to 64 Years | 228 (3.5%) | 347 (5.1%) |
| 65 to 74 Years | 319 (18.1%) | 133 (7.4%) |
| 75 Years and over | 193 (16.4%) | 281 (17.9%) |
Disability Class: Vision Difficulty
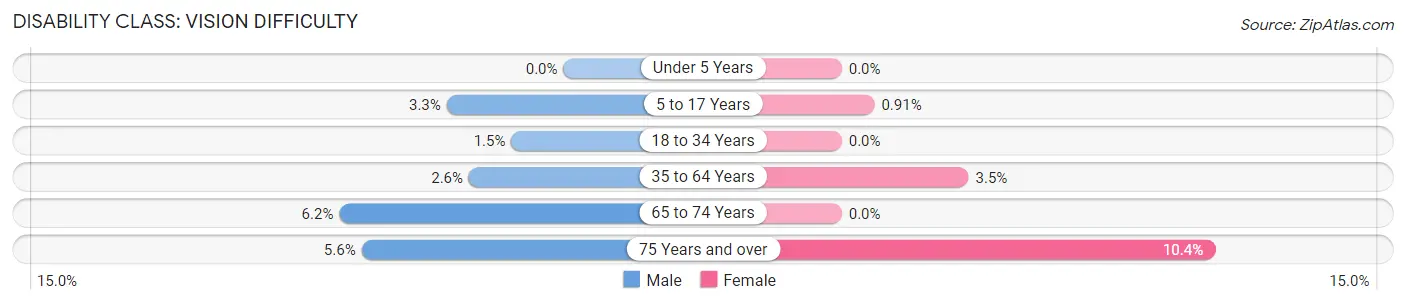
| Age Bracket | Male | Female |
| Under 5 Years | 0 (0.0%) | 0 (0.0%) |
| 5 to 17 Years | 87 (3.3%) | 22 (0.9%) |
| 18 to 34 Years | 70 (1.5%) | 0 (0.0%) |
| 35 to 64 Years | 172 (2.6%) | 239 (3.5%) |
| 65 to 74 Years | 110 (6.2%) | 0 (0.0%) |
| 75 Years and over | 66 (5.6%) | 163 (10.4%) |
Disability Class: Cognitive Difficulty
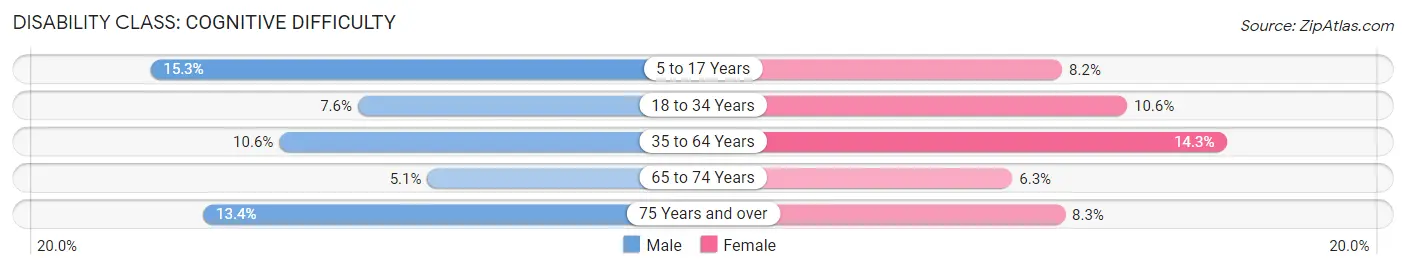
| Age Bracket | Male | Female |
| 5 to 17 Years | 410 (15.3%) | 197 (8.2%) |
| 18 to 34 Years | 369 (7.6%) | 517 (10.6%) |
| 35 to 64 Years | 691 (10.5%) | 966 (14.3%) |
| 65 to 74 Years | 89 (5.1%) | 114 (6.3%) |
| 75 Years and over | 157 (13.4%) | 130 (8.3%) |
Disability Class: Ambulatory Difficulty
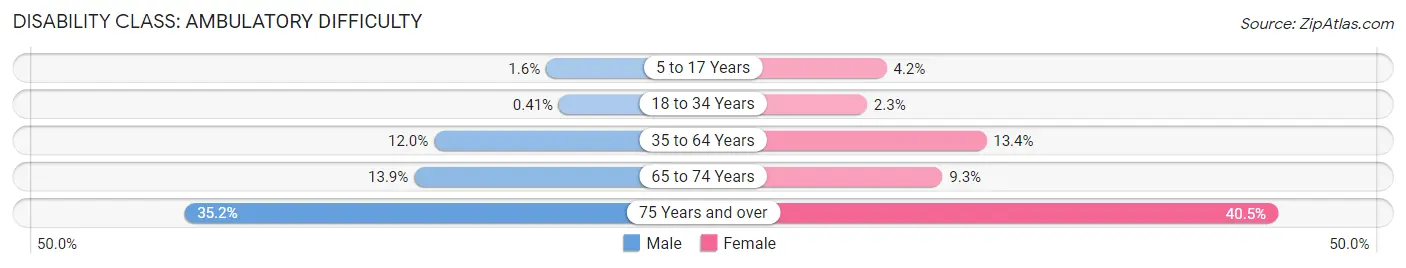
| Age Bracket | Male | Female |
| 5 to 17 Years | 43 (1.6%) | 100 (4.2%) |
| 18 to 34 Years | 20 (0.4%) | 114 (2.3%) |
| 35 to 64 Years | 786 (12.0%) | 908 (13.4%) |
| 65 to 74 Years | 244 (13.9%) | 168 (9.3%) |
| 75 Years and over | 413 (35.2%) | 635 (40.5%) |
Disability Class: Self-Care Difficulty
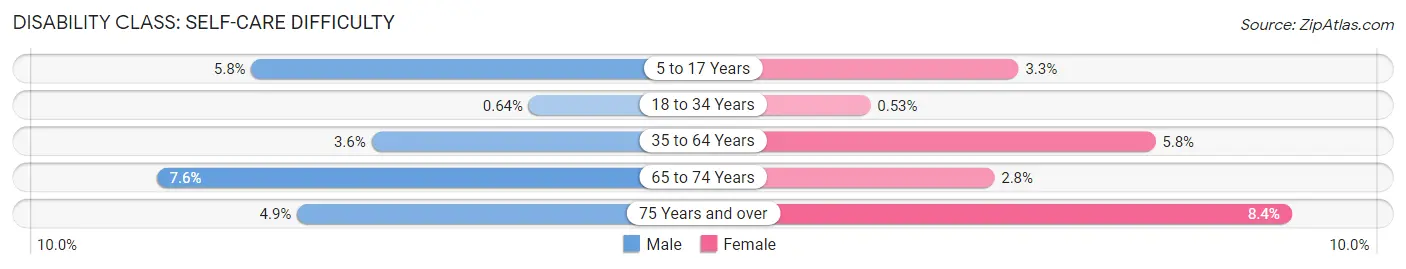
| Age Bracket | Male | Female |
| 5 to 17 Years | 155 (5.8%) | 79 (3.3%) |
| 18 to 34 Years | 31 (0.6%) | 26 (0.5%) |
| 35 to 64 Years | 233 (3.6%) | 394 (5.8%) |
| 65 to 74 Years | 133 (7.5%) | 51 (2.8%) |
| 75 Years and over | 58 (4.9%) | 131 (8.4%) |
Technology Access in Lewiston
Computing Device Access in Lewiston
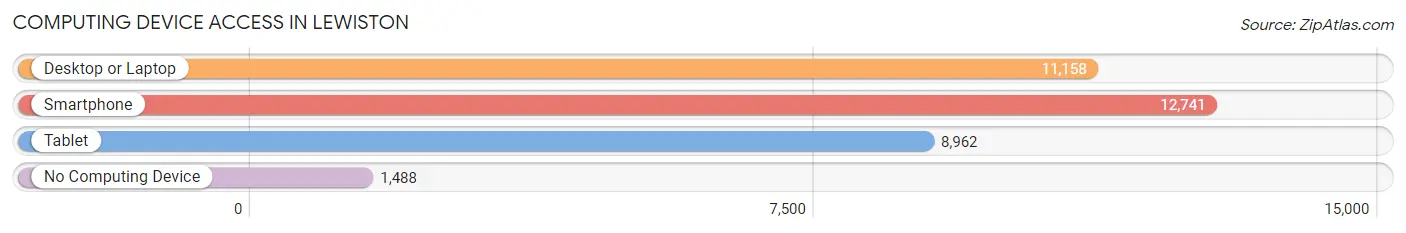
| Device Type | # Households | % Households |
| Desktop or Laptop | 11,158 | 71.5% |
| Smartphone | 12,741 | 81.6% |
| Tablet | 8,962 | 57.4% |
| No Computing Device | 1,488 | 9.5% |
| Total | 15,611 | 100.0% |
Internet Access in Lewiston
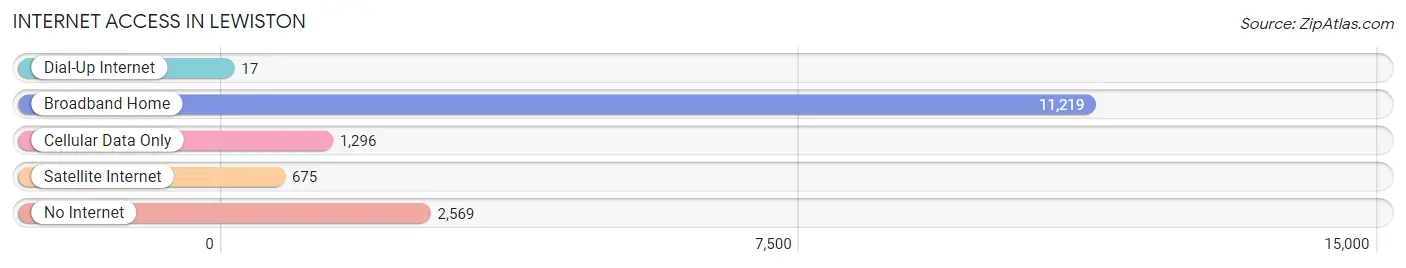
| Internet Type | # Households | % Households |
| Dial-Up Internet | 17 | 0.1% |
| Broadband Home | 11,219 | 71.9% |
| Cellular Data Only | 1,296 | 8.3% |
| Satellite Internet | 675 | 4.3% |
| No Internet | 2,569 | 16.5% |
| Total | 15,611 | 100.0% |
Lewiston Summary
Lewiston, Maine is a city located in Androscoggin County in the state of Maine. It is the second largest city in the state, with a population of 36,592 as of the 2010 census. The city is situated on the banks of the Androscoggin River, and is part of the Lewiston-Auburn metropolitan area, which has a population of 107,702.
History
The area that is now Lewiston was originally inhabited by the Abenaki people, who called it Androscoggin, meaning “river of many falls.” The first European settlers arrived in the area in the late 17th century, and the town was officially incorporated in 1795. The city was named after Lewiston, New York, which was named after the explorer Meriwether Lewis.
In the 19th century, Lewiston became an important industrial center, with several textile mills and paper mills being established in the area. The city was also home to a large immigrant population, with many French-Canadians and Irish immigrants settling in the area.
Geography
Lewiston is located in the western part of Androscoggin County, at the confluence of the Androscoggin River and the Little Androscoggin River. The city is situated on a hill overlooking the rivers, and is surrounded by rolling hills and forests. The city has a total area of 16.2 square miles, of which 15.9 square miles is land and 0.3 square miles is water.
Climate
Lewiston has a humid continental climate, with cold, snowy winters and warm, humid summers. The average annual temperature is 41.3°F, and the average annual precipitation is 39.3 inches.
Demographics
As of the 2010 census, there were 36,592 people, 14,845 households, and 8,845 families residing in the city. The population density was 2,294.3 people per square mile. The racial makeup of the city was 94.2% White, 1.2% African American, 0.5% Native American, 1.2% Asian, 0.1% Pacific Islander, 0.7% from other races, and 2.1% from two or more races. Hispanic or Latino of any race were 2.3% of the population.
Economy
Lewiston’s economy is largely based on manufacturing and services. The city is home to several large manufacturing companies, including St. Mary’s Health System, Central Maine Medical Center, and the Androscoggin Mill. The city is also home to several large retail stores, including Walmart, Target, and Home Depot. The city’s largest employer is Central Maine Medical Center, which employs over 3,000 people.
Lewiston is also home to several educational institutions, including the University of Southern Maine, Bates College, and the Lewiston-Auburn College. The city is also home to several cultural attractions, including the Lewiston Public Library, the Lewiston-Auburn Art Walk, and the Lewiston-Auburn Film Festival.
Conclusion
Lewiston, Maine is a city located in Androscoggin County in the state of Maine. It is the second largest city in the state, with a population of 36,592 as of the 2010 census. The city is situated on the banks of the Androscoggin River, and is part of the Lewiston-Auburn metropolitan area, which has a population of 107,702. The city has a humid continental climate, with cold, snowy winters and warm, humid summers. The city’s economy is largely based on manufacturing and services, and its largest employer is Central Maine Medical Center. Lewiston is also home to several educational institutions, including the University of Southern Maine, Bates College, and the Lewiston-Auburn College. The city is also home to several cultural attractions, including the Lewiston Public Library, the Lewiston-Auburn Art Walk, and the Lewiston-Auburn Film Festival.
Common Questions
What is Per Capita Income in Lewiston?
Per Capita income in Lewiston is $29,223.
What is the Median Family Income in Lewiston?
Median Family Income in Lewiston is $72,649.
What is the Median Household income in Lewiston?
Median Household Income in Lewiston is $54,317.
What is Income or Wage Gap in Lewiston?
Income or Wage Gap in Lewiston is 14.9%.
Women in Lewiston earn 85.1 cents for every dollar earned by a man.
What is Family Income Deficit in Lewiston?
Family Income Deficit in Lewiston is $10,773.
Families that are below poverty line in Lewiston earn $10,773 less on average than the poverty threshold level.
What is Inequality or Gini Index in Lewiston?
Inequality or Gini Index in Lewiston is 0.44.
What is the Total Population of Lewiston?
Total Population of Lewiston is 37,577.
What is the Total Male Population of Lewiston?
Total Male Population of Lewiston is 18,508.
What is the Total Female Population of Lewiston?
Total Female Population of Lewiston is 19,069.
What is the Ratio of Males per 100 Females in Lewiston?
There are 97.06 Males per 100 Females in Lewiston.
What is the Ratio of Females per 100 Males in Lewiston?
There are 103.03 Females per 100 Males in Lewiston.
What is the Median Population Age in Lewiston?
Median Population Age in Lewiston is 39.5 Years.
What is the Average Family Size in Lewiston
Average Family Size in Lewiston is 3.0 People.
What is the Average Household Size in Lewiston
Average Household Size in Lewiston is 2.2 People.
How Large is the Labor Force in Lewiston?
There are 18,997 People in the Labor Forcein in Lewiston.
What is the Percentage of People in the Labor Force in Lewiston?
61.4% of People are in the Labor Force in Lewiston.
What is the Unemployment Rate in Lewiston?
Unemployment Rate in Lewiston is 5.6%.