West Valley City, UT Map & Demographics
West Valley City Map
West Valley City Overview
$27,259
PER CAPITA INCOME
$88,750
AVG FAMILY INCOME
$81,719
AVG HOUSEHOLD INCOME
25.0%
WAGE / INCOME GAP [ % ]
75.0¢/ $1
WAGE / INCOME GAP [ $ ]
$9,618
FAMILY INCOME DEFICIT
0.36
INEQUALITY / GINI INDEX
138,868
TOTAL POPULATION
70,263
MALE POPULATION
68,605
FEMALE POPULATION
102.42
MALES / 100 FEMALES
97.64
FEMALES / 100 MALES
30.2
MEDIAN AGE
3.9
AVG FAMILY SIZE
3.6
AVG HOUSEHOLD SIZE
73,013
LABOR FORCE [ PEOPLE ]
72.2%
PERCENT IN LABOR FORCE
4.0%
UNEMPLOYMENT RATE
Income in West Valley City
Income Overview in West Valley City
Per Capita Income in West Valley City is $27,259, while median incomes of families and households are $88,750 and $81,719 respectively.
| Characteristic | Number | Measure |
| Per Capita Income | 138,868 | $27,259 |
| Median Family Income | 30,640 | $88,750 |
| Mean Family Income | 30,640 | $100,484 |
| Median Household Income | 38,838 | $81,719 |
| Mean Household Income | 38,838 | $94,663 |
| Income Deficit | 30,640 | $9,618 |
| Wage / Income Gap (%) | 138,868 | 25.03% |
| Wage / Income Gap ($) | 138,868 | 74.97¢ per $1 |
| Gini / Inequality Index | 138,868 | 0.36 |
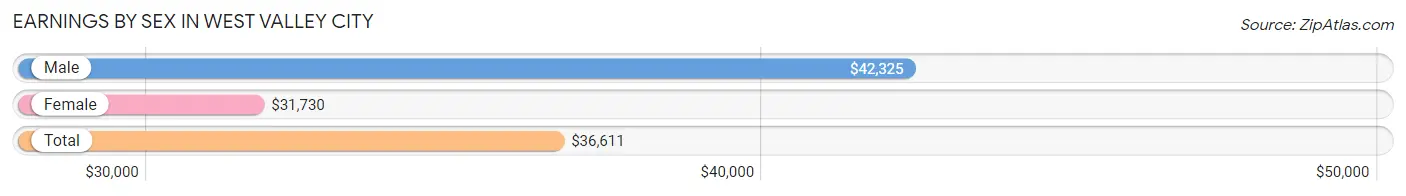
Earnings by Sex in West Valley City
Average Earnings in West Valley City are $36,611, $42,325 for men and $31,730 for women, a difference of 25.0%.
| Sex | Number | Average Earnings |
| Male | 41,156 (54.6%) | $42,325 |
| Female | 34,222 (45.4%) | $31,730 |
| Total | 75,378 (100.0%) | $36,611 |
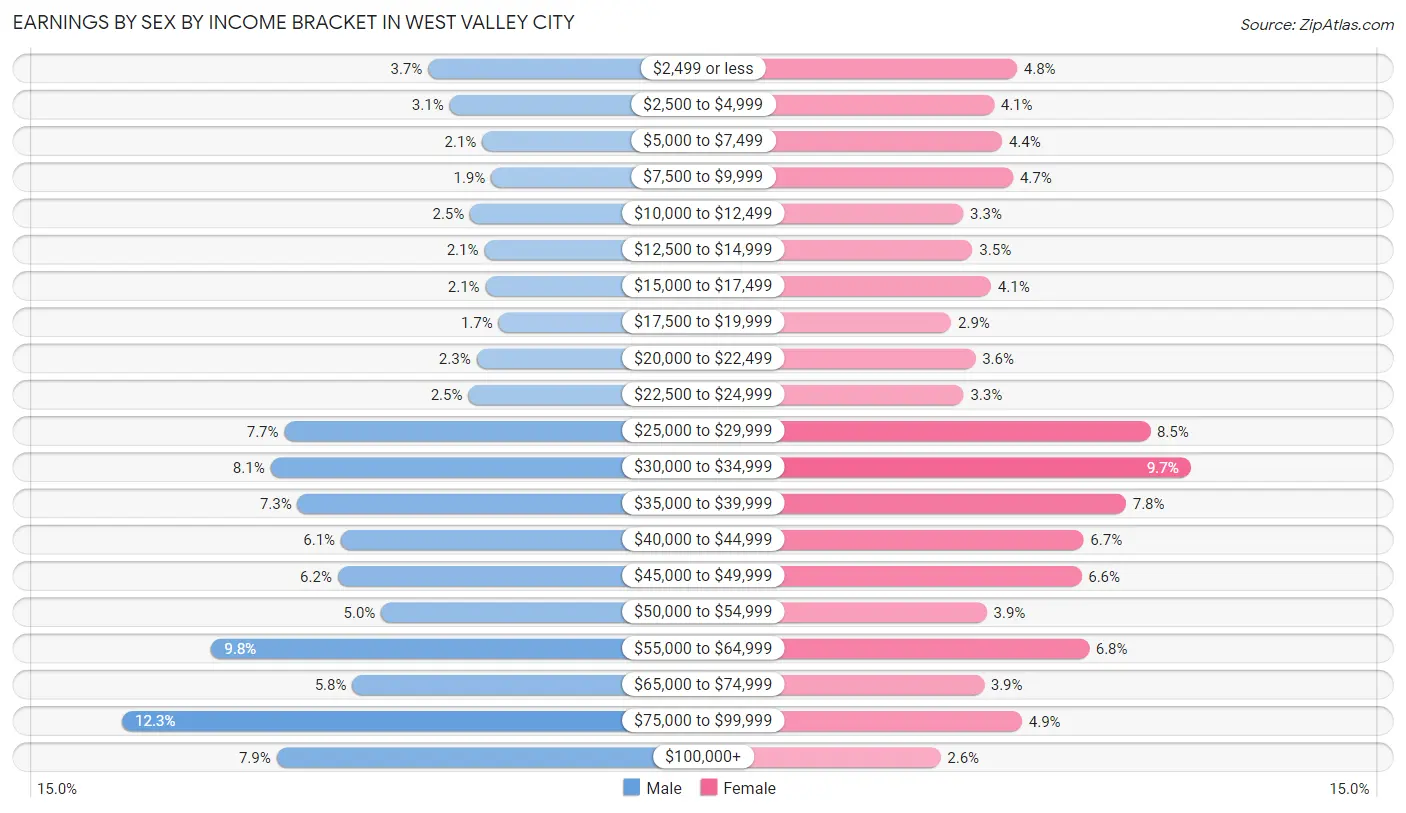
Earnings by Sex by Income Bracket in West Valley City
The most common earnings brackets in West Valley City are $75,000 to $99,999 for men (5,046 | 12.3%) and $30,000 to $34,999 for women (3,306 | 9.7%).
| Income | Male | Female |
| $2,499 or less | 1,507 (3.7%) | 1,636 (4.8%) |
| $2,500 to $4,999 | 1,258 (3.1%) | 1,413 (4.1%) |
| $5,000 to $7,499 | 879 (2.1%) | 1,491 (4.4%) |
| $7,500 to $9,999 | 779 (1.9%) | 1,599 (4.7%) |
| $10,000 to $12,499 | 1,021 (2.5%) | 1,118 (3.3%) |
| $12,500 to $14,999 | 856 (2.1%) | 1,209 (3.5%) |
| $15,000 to $17,499 | 844 (2.1%) | 1,387 (4.1%) |
| $17,500 to $19,999 | 691 (1.7%) | 1,002 (2.9%) |
| $20,000 to $22,499 | 946 (2.3%) | 1,234 (3.6%) |
| $22,500 to $24,999 | 1,040 (2.5%) | 1,122 (3.3%) |
| $25,000 to $29,999 | 3,171 (7.7%) | 2,916 (8.5%) |
| $30,000 to $34,999 | 3,329 (8.1%) | 3,306 (9.7%) |
| $35,000 to $39,999 | 3,018 (7.3%) | 2,683 (7.8%) |
| $40,000 to $44,999 | 2,515 (6.1%) | 2,277 (6.7%) |
| $45,000 to $49,999 | 2,551 (6.2%) | 2,255 (6.6%) |
| $50,000 to $54,999 | 2,049 (5.0%) | 1,345 (3.9%) |
| $55,000 to $64,999 | 4,013 (9.8%) | 2,328 (6.8%) |
| $65,000 to $74,999 | 2,382 (5.8%) | 1,318 (3.8%) |
| $75,000 to $99,999 | 5,046 (12.3%) | 1,683 (4.9%) |
| $100,000+ | 3,261 (7.9%) | 900 (2.6%) |
| Total | 41,156 (100.0%) | 34,222 (100.0%) |
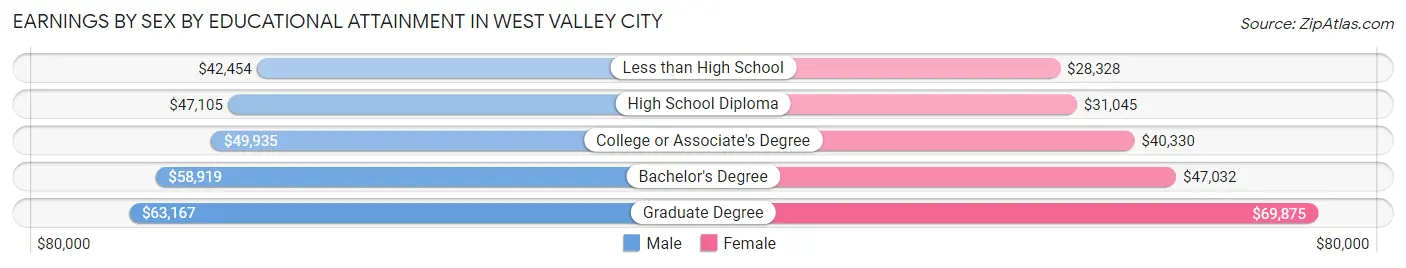
Earnings by Sex by Educational Attainment in West Valley City
Average earnings in West Valley City are $49,014 for men and $35,764 for women, a difference of 27.0%. Men with an educational attainment of graduate degree enjoy the highest average annual earnings of $63,167, while those with less than high school education earn the least with $42,454. Women with an educational attainment of graduate degree earn the most with the average annual earnings of $69,875, while those with less than high school education have the smallest earnings of $28,328.
| Educational Attainment | Male Income | Female Income |
| Less than High School | $42,454 | $28,328 |
| High School Diploma | $47,105 | $31,045 |
| College or Associate's Degree | $49,935 | $40,330 |
| Bachelor's Degree | $58,919 | $47,032 |
| Graduate Degree | $63,167 | $69,875 |
| Total | $49,014 | $35,764 |
Family Income in West Valley City
Family Income Brackets in West Valley City
According to the West Valley City family income data, there are 7,354 families falling into the $100,000 to $149,999 income range, which is the most common income bracket and makes up 24.0% of all families. Conversely, the $10,000 to $14,999 income bracket is the least frequent group with only 337 families (1.1%) belonging to this category.
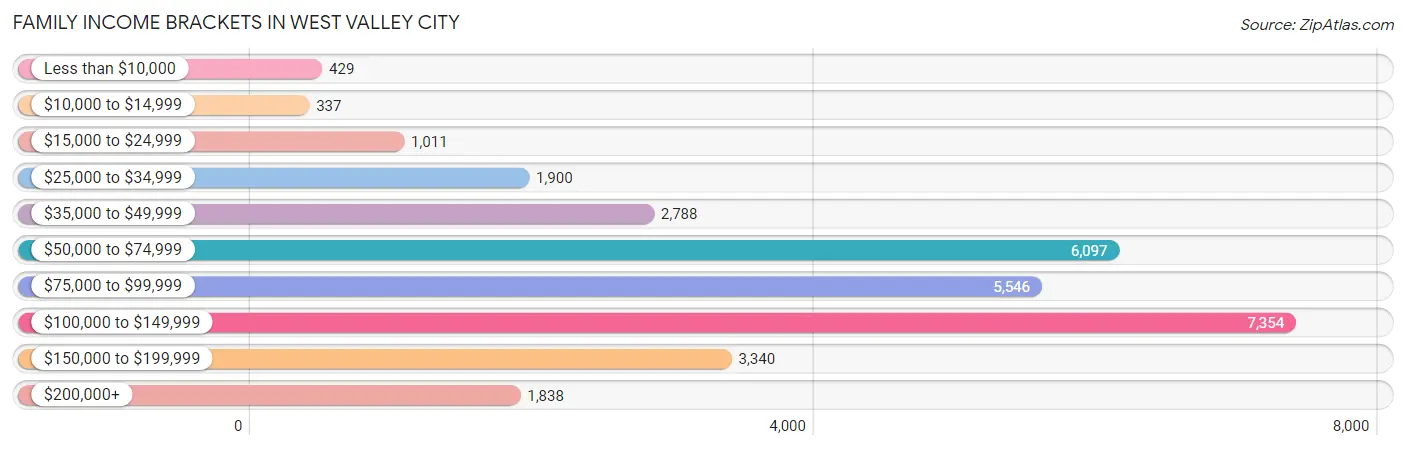
| Income Bracket | # Families | % Families |
| Less than $10,000 | 429 | 1.4% |
| $10,000 to $14,999 | 337 | 1.1% |
| $15,000 to $24,999 | 1,011 | 3.3% |
| $25,000 to $34,999 | 1,900 | 6.2% |
| $35,000 to $49,999 | 2,788 | 9.1% |
| $50,000 to $74,999 | 6,097 | 19.9% |
| $75,000 to $99,999 | 5,546 | 18.1% |
| $100,000 to $149,999 | 7,354 | 24.0% |
| $150,000 to $199,999 | 3,340 | 10.9% |
| $200,000+ | 1,838 | 6.0% |
Family Income by Famaliy Size in West Valley City
7+ person families (1,976 | 6.5%) account for the highest median family income in West Valley City with $128,030 per family, while 2-person families (9,477 | 30.9%) have the highest median income of $35,637 per family member.
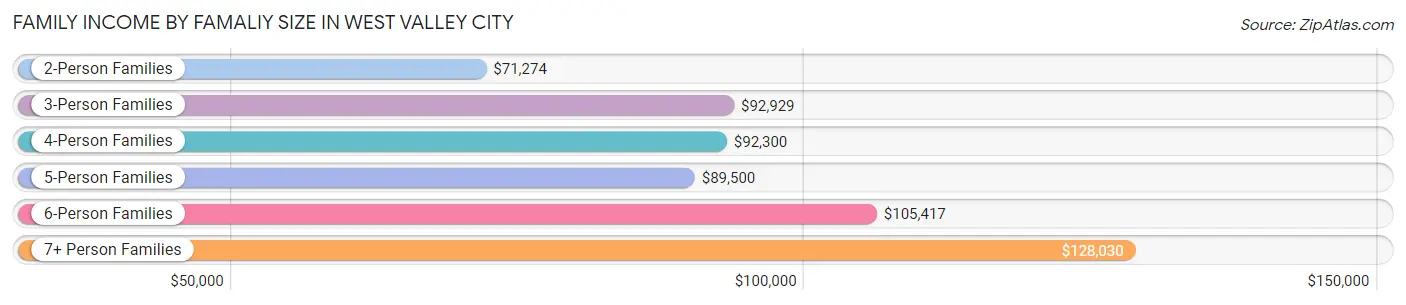
| Income Bracket | # Families | Median Income |
| 2-Person Families | 9,477 (30.9%) | $71,274 |
| 3-Person Families | 6,223 (20.3%) | $92,929 |
| 4-Person Families | 6,073 (19.8%) | $92,300 |
| 5-Person Families | 4,276 (14.0%) | $89,500 |
| 6-Person Families | 2,615 (8.5%) | $105,417 |
| 7+ Person Families | 1,976 (6.5%) | $128,030 |
| Total | 30,640 (100.0%) | $88,750 |
Family Income by Number of Earners in West Valley City
The median family income in West Valley City is $88,750, with families comprising 3+ earners (8,070) having the highest median family income of $138,617, while families with no earners (2,403) have the lowest median family income of $44,780, accounting for 26.3% and 7.8% of families, respectively.
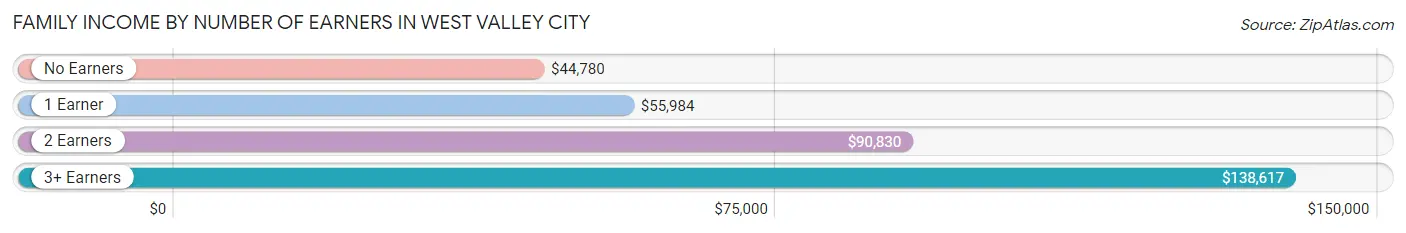
| Number of Earners | # Families | Median Income |
| No Earners | 2,403 (7.8%) | $44,780 |
| 1 Earner | 7,715 (25.2%) | $55,984 |
| 2 Earners | 12,452 (40.6%) | $90,830 |
| 3+ Earners | 8,070 (26.3%) | $138,617 |
| Total | 30,640 (100.0%) | $88,750 |
Household Income in West Valley City
Household Income Brackets in West Valley City
With 9,088 households falling in the category, the $100,000 to $149,999 income range is the most frequent in West Valley City, accounting for 23.4% of all households. In contrast, only 816 households (2.1%) fall into the less than $10,000 income bracket, making it the least populous group.
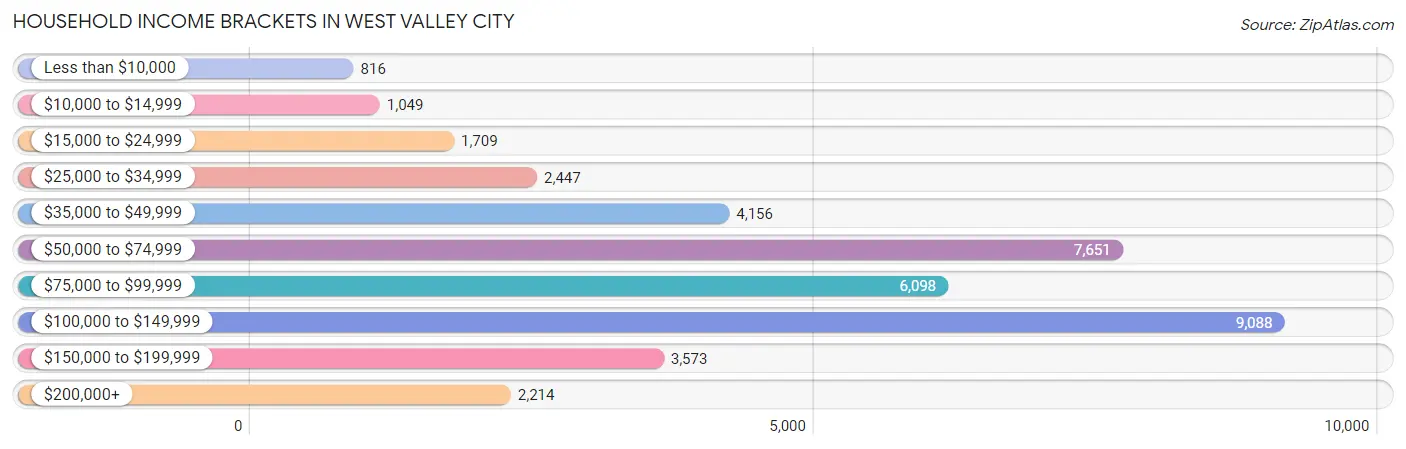
| Income Bracket | # Households | % Households |
| Less than $10,000 | 816 | 2.1% |
| $10,000 to $14,999 | 1,049 | 2.7% |
| $15,000 to $24,999 | 1,709 | 4.4% |
| $25,000 to $34,999 | 2,447 | 6.3% |
| $35,000 to $49,999 | 4,156 | 10.7% |
| $50,000 to $74,999 | 7,651 | 19.7% |
| $75,000 to $99,999 | 6,098 | 15.7% |
| $100,000 to $149,999 | 9,088 | 23.4% |
| $150,000 to $199,999 | 3,573 | 9.2% |
| $200,000+ | 2,214 | 5.7% |
Household Income by Householder Age in West Valley City
The median household income in West Valley City is $81,719, with the highest median household income of $97,866 found in the 45 to 64 years age bracket for the primary householder. A total of 14,018 households (36.1%) fall into this category. Meanwhile, the 65+ years age bracket for the primary householder has the lowest median household income of $58,329, with 6,769 households (17.4%) in this group.
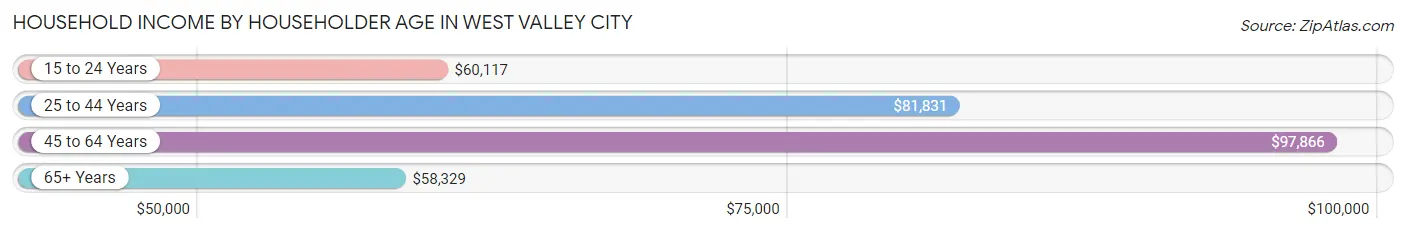
| Income Bracket | # Households | Median Income |
| 15 to 24 Years | 1,967 (5.1%) | $60,117 |
| 25 to 44 Years | 16,084 (41.4%) | $81,831 |
| 45 to 64 Years | 14,018 (36.1%) | $97,866 |
| 65+ Years | 6,769 (17.4%) | $58,329 |
| Total | 38,838 (100.0%) | $81,719 |
Poverty in West Valley City
Income Below Poverty by Sex and Age in West Valley City
With 10.5% poverty level for males and 11.2% for females among the residents of West Valley City, 5 year old males and 5 year old females are the most vulnerable to poverty, with 284 males (29.6%) and 188 females (22.5%) in their respective age groups living below the poverty level.
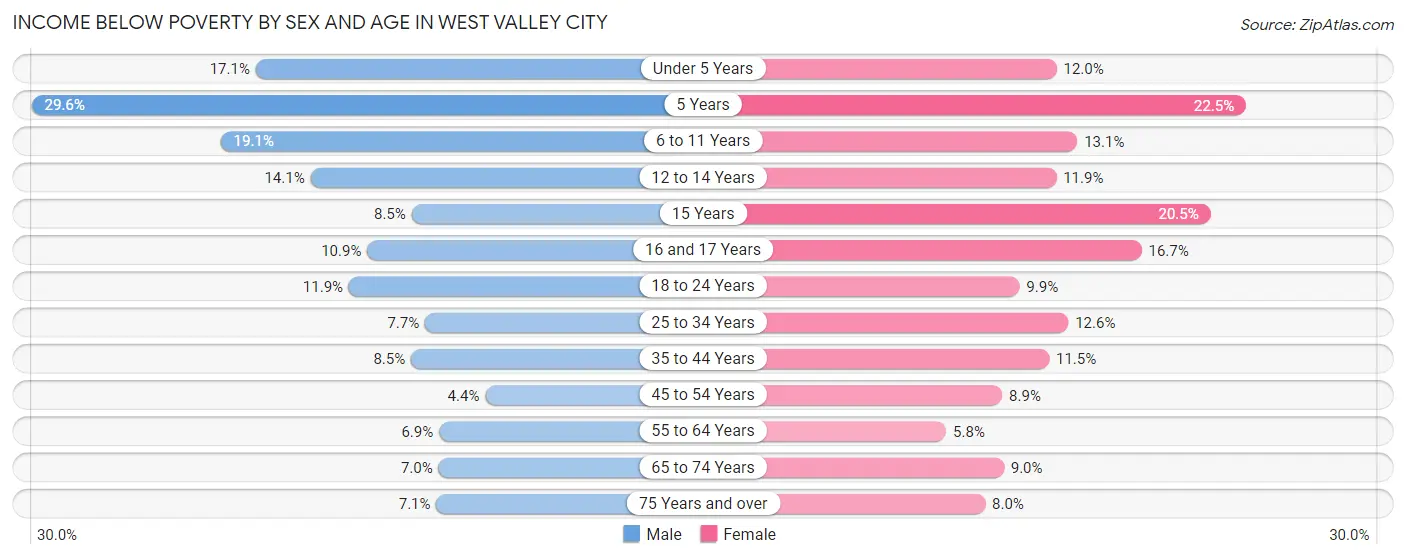
| Age Bracket | Male | Female |
| Under 5 Years | 1,028 (17.1%) | 626 (12.0%) |
| 5 Years | 284 (29.6%) | 188 (22.5%) |
| 6 to 11 Years | 1,404 (19.1%) | 865 (13.1%) |
| 12 to 14 Years | 451 (14.1%) | 375 (11.9%) |
| 15 Years | 119 (8.5%) | 273 (20.5%) |
| 16 and 17 Years | 274 (10.9%) | 508 (16.7%) |
| 18 to 24 Years | 929 (11.9%) | 703 (9.9%) |
| 25 to 34 Years | 817 (7.7%) | 1,346 (12.6%) |
| 35 to 44 Years | 821 (8.5%) | 1,027 (11.5%) |
| 45 to 54 Years | 330 (4.3%) | 649 (8.9%) |
| 55 to 64 Years | 468 (6.9%) | 384 (5.8%) |
| 65 to 74 Years | 247 (7.0%) | 345 (9.0%) |
| 75 Years and over | 156 (7.1%) | 221 (8.0%) |
| Total | 7,328 (10.5%) | 7,510 (11.2%) |
Income Above Poverty by Sex and Age in West Valley City
According to the poverty statistics in West Valley City, males aged 45 to 54 years and females aged 55 to 64 years are the age groups that are most secure financially, with 95.7% of males and 94.2% of females in these age groups living above the poverty line.
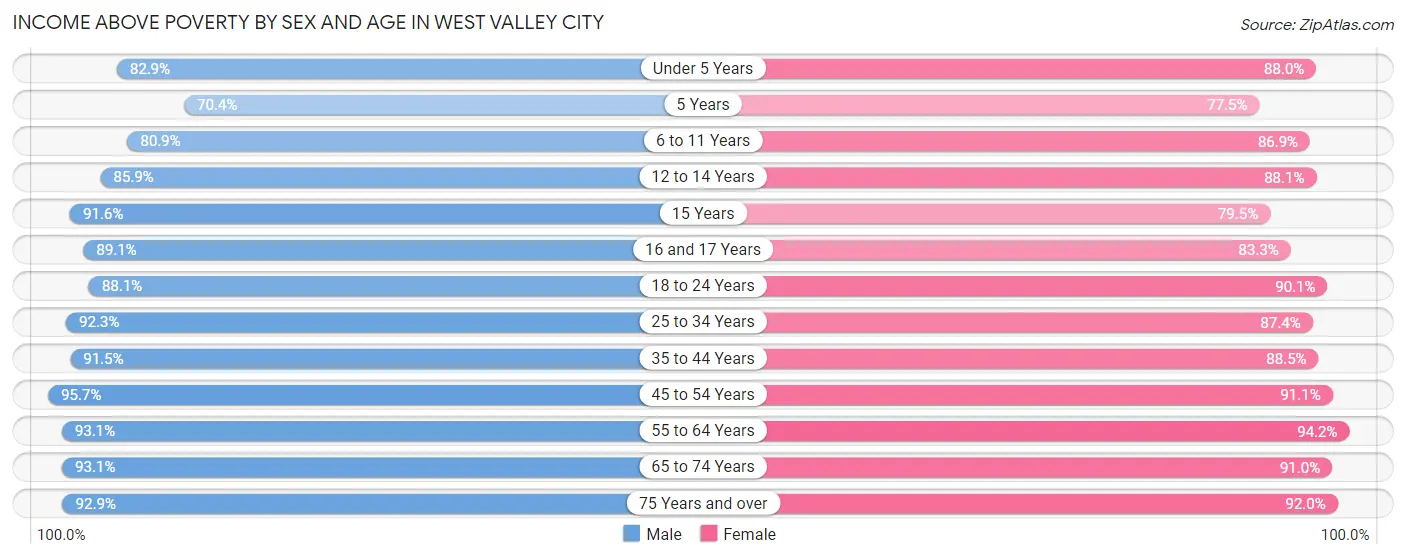
| Age Bracket | Male | Female |
| Under 5 Years | 4,972 (82.9%) | 4,608 (88.0%) |
| 5 Years | 675 (70.4%) | 647 (77.5%) |
| 6 to 11 Years | 5,955 (80.9%) | 5,731 (86.9%) |
| 12 to 14 Years | 2,753 (85.9%) | 2,767 (88.1%) |
| 15 Years | 1,290 (91.5%) | 1,057 (79.5%) |
| 16 and 17 Years | 2,235 (89.1%) | 2,536 (83.3%) |
| 18 to 24 Years | 6,853 (88.1%) | 6,402 (90.1%) |
| 25 to 34 Years | 9,797 (92.3%) | 9,325 (87.4%) |
| 35 to 44 Years | 8,864 (91.5%) | 7,871 (88.5%) |
| 45 to 54 Years | 7,251 (95.7%) | 6,615 (91.1%) |
| 55 to 64 Years | 6,293 (93.1%) | 6,227 (94.2%) |
| 65 to 74 Years | 3,309 (93.0%) | 3,481 (91.0%) |
| 75 Years and over | 2,050 (92.9%) | 2,549 (92.0%) |
| Total | 62,297 (89.5%) | 59,816 (88.8%) |
Income Below Poverty Among Married-Couple Families in West Valley City
The poverty statistics for married-couple families in West Valley City show that 4.7% or 1,028 of the total 22,071 families live below the poverty line. Families with 5 or more children have the highest poverty rate of 19.9%, comprising of 150 families. On the other hand, families with no children have the lowest poverty rate of 1.9%, which includes 176 families.
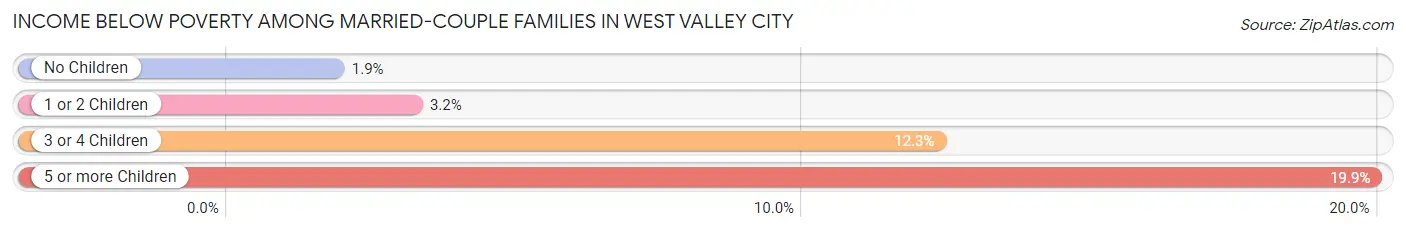
| Children | Above Poverty | Below Poverty |
| No Children | 9,304 (98.1%) | 176 (1.9%) |
| 1 or 2 Children | 8,049 (96.8%) | 268 (3.2%) |
| 3 or 4 Children | 3,087 (87.7%) | 434 (12.3%) |
| 5 or more Children | 603 (80.1%) | 150 (19.9%) |
| Total | 21,043 (95.3%) | 1,028 (4.7%) |
Income Below Poverty Among Single-Parent Households in West Valley City
According to the poverty data in West Valley City, 7.1% or 210 single-father households and 19.9% or 1,115 single-mother households are living below the poverty line. Among single-father households, those with 3 or 4 children have the highest poverty rate, with 74 households (27.0%) experiencing poverty. Likewise, among single-mother households, those with 5 or more children have the highest poverty rate, with 155 households (67.4%) falling below the poverty line.
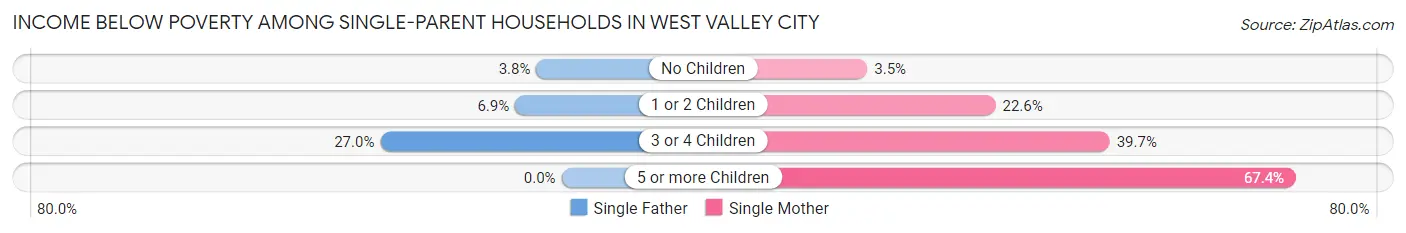
| Children | Single Father | Single Mother |
| No Children | 55 (3.7%) | 74 (3.5%) |
| 1 or 2 Children | 81 (6.9%) | 549 (22.6%) |
| 3 or 4 Children | 74 (27.0%) | 337 (39.7%) |
| 5 or more Children | 0 (0.0%) | 155 (67.4%) |
| Total | 210 (7.1%) | 1,115 (19.9%) |
Income Below Poverty Among Married-Couple vs Single-Parent Households in West Valley City
The poverty data for West Valley City shows that 1,028 of the married-couple family households (4.7%) and 1,325 of the single-parent households (15.5%) are living below the poverty level. Within the married-couple family households, those with 5 or more children have the highest poverty rate, with 150 households (19.9%) falling below the poverty line. Among the single-parent households, those with 5 or more children have the highest poverty rate, with 155 household (54.2%) living below poverty.
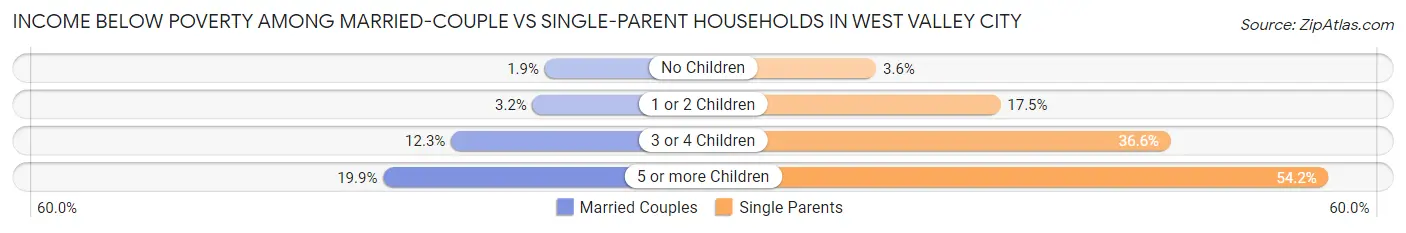
| Children | Married-Couple Families | Single-Parent Households |
| No Children | 176 (1.9%) | 129 (3.6%) |
| 1 or 2 Children | 268 (3.2%) | 630 (17.5%) |
| 3 or 4 Children | 434 (12.3%) | 411 (36.6%) |
| 5 or more Children | 150 (19.9%) | 155 (54.2%) |
| Total | 1,028 (4.7%) | 1,325 (15.5%) |
Race in West Valley City
The most populous races in West Valley City are White / Caucasian (72,025 | 51.9%), Hispanic or Latino (57,564 | 41.4%), and Some other Race (34,694 | 25.0%).
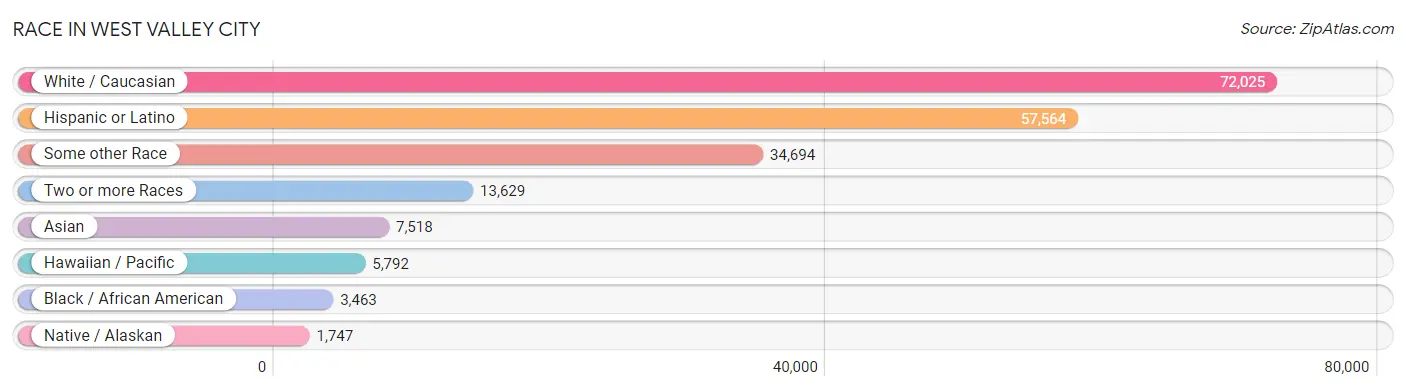
| Race | # Population | % Population |
| Asian | 7,518 | 5.4% |
| Black / African American | 3,463 | 2.5% |
| Hawaiian / Pacific | 5,792 | 4.2% |
| Hispanic or Latino | 57,564 | 41.4% |
| Native / Alaskan | 1,747 | 1.3% |
| White / Caucasian | 72,025 | 51.9% |
| Two or more Races | 13,629 | 9.8% |
| Some other Race | 34,694 | 25.0% |
| Total | 138,868 | 100.0% |
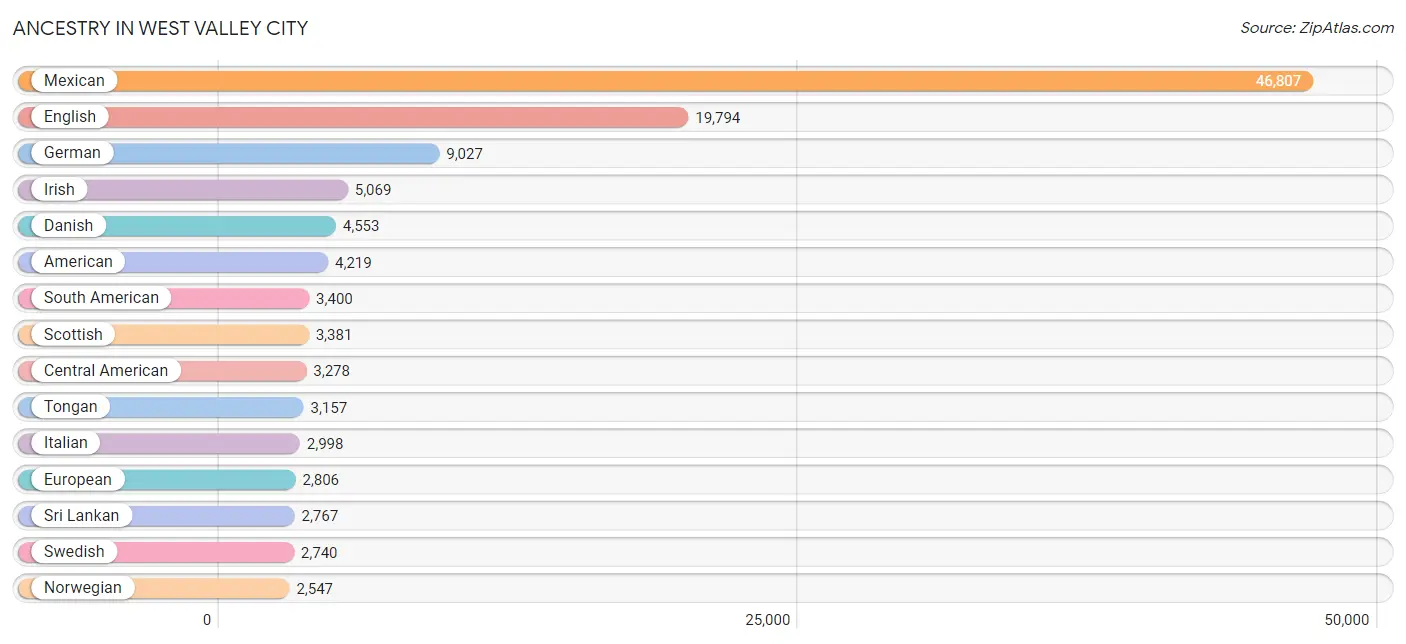
Ancestry in West Valley City
The most populous ancestries reported in West Valley City are Mexican (46,807 | 33.7%), English (19,794 | 14.2%), German (9,027 | 6.5%), Irish (5,069 | 3.6%), and Danish (4,553 | 3.3%), together accounting for 61.4% of all West Valley City residents.
| Ancestry | # Population | % Population |
| African | 471 | 0.3% |
| Alaska Native | 42 | 0.0% |
| American | 4,219 | 3.0% |
| Apache | 57 | 0.0% |
| Arab | 322 | 0.2% |
| Argentinean | 183 | 0.1% |
| Armenian | 115 | 0.1% |
| Australian | 58 | 0.0% |
| Austrian | 47 | 0.0% |
| Basque | 142 | 0.1% |
| Belgian | 50 | 0.0% |
| Belizean | 99 | 0.1% |
| Bhutanese | 793 | 0.6% |
| Blackfeet | 306 | 0.2% |
| Bolivian | 142 | 0.1% |
| Brazilian | 216 | 0.2% |
| British | 1,297 | 0.9% |
| Bulgarian | 6 | 0.0% |
| Burmese | 316 | 0.2% |
| Cajun | 4 | 0.0% |
| Canadian | 178 | 0.1% |
| Celtic | 15 | 0.0% |
| Central American | 3,278 | 2.4% |
| Central American Indian | 89 | 0.1% |
| Cherokee | 432 | 0.3% |
| Chickasaw | 8 | 0.0% |
| Chilean | 292 | 0.2% |
| Chippewa | 101 | 0.1% |
| Choctaw | 31 | 0.0% |
| Colombian | 758 | 0.5% |
| Costa Rican | 75 | 0.1% |
| Croatian | 62 | 0.0% |
| Crow | 23 | 0.0% |
| Cuban | 35 | 0.0% |
| Czech | 40 | 0.0% |
| Czechoslovakian | 7 | 0.0% |
| Danish | 4,553 | 3.3% |
| Dominican | 235 | 0.2% |
| Dutch | 1,503 | 1.1% |
| Eastern European | 114 | 0.1% |
| Ecuadorian | 273 | 0.2% |
| Egyptian | 138 | 0.1% |
| English | 19,794 | 14.2% |
| Ethiopian | 173 | 0.1% |
| European | 2,806 | 2.0% |
| Fijian | 250 | 0.2% |
| Filipino | 4 | 0.0% |
| Finnish | 224 | 0.2% |
| French | 1,422 | 1.0% |
| French American Indian | 14 | 0.0% |
| French Canadian | 226 | 0.2% |
| German | 9,027 | 6.5% |
| Ghanaian | 26 | 0.0% |
| Greek | 259 | 0.2% |
| Guamanian / Chamorro | 17 | 0.0% |
| Guatemalan | 1,555 | 1.1% |
| Haitian | 33 | 0.0% |
| Honduran | 613 | 0.4% |
| Hungarian | 195 | 0.1% |
| Icelander | 15 | 0.0% |
| Indian (Asian) | 928 | 0.7% |
| Indonesian | 148 | 0.1% |
| Iranian | 81 | 0.1% |
| Iraqi | 46 | 0.0% |
| Irish | 5,069 | 3.6% |
| Italian | 2,998 | 2.2% |
| Japanese | 994 | 0.7% |
| Kenyan | 310 | 0.2% |
| Korean | 974 | 0.7% |
| Laotian | 75 | 0.1% |
| Lebanese | 4 | 0.0% |
| Liberian | 57 | 0.0% |
| Lithuanian | 7 | 0.0% |
| Luxembourger | 18 | 0.0% |
| Macedonian | 21 | 0.0% |
| Malaysian | 404 | 0.3% |
| Maltese | 7 | 0.0% |
| Mexican | 46,807 | 33.7% |
| Mexican American Indian | 1,088 | 0.8% |
| Native Hawaiian | 389 | 0.3% |
| Navajo | 380 | 0.3% |
| New Zealander | 43 | 0.0% |
| Nicaraguan | 26 | 0.0% |
| Nigerian | 11 | 0.0% |
| Northern European | 283 | 0.2% |
| Norwegian | 2,547 | 1.8% |
| Okinawan | 21 | 0.0% |
| Paiute | 57 | 0.0% |
| Pakistani | 276 | 0.2% |
| Panamanian | 5 | 0.0% |
| Paraguayan | 14 | 0.0% |
| Peruvian | 927 | 0.7% |
| Pima | 51 | 0.0% |
| Polish | 617 | 0.4% |
| Portuguese | 152 | 0.1% |
| Potawatomi | 5 | 0.0% |
| Pueblo | 20 | 0.0% |
| Puerto Rican | 879 | 0.6% |
| Romanian | 61 | 0.0% |
| Russian | 292 | 0.2% |
| Salvadoran | 987 | 0.7% |
| Samoan | 2,521 | 1.8% |
| Scandinavian | 1,332 | 1.0% |
| Scotch-Irish | 873 | 0.6% |
| Scottish | 3,381 | 2.4% |
| Senegalese | 6 | 0.0% |
| Serbian | 84 | 0.1% |
| Shoshone | 69 | 0.1% |
| Sierra Leonean | 118 | 0.1% |
| Sioux | 48 | 0.0% |
| Slavic | 49 | 0.0% |
| Slovak | 28 | 0.0% |
| Slovene | 31 | 0.0% |
| Somali | 978 | 0.7% |
| South American | 3,400 | 2.5% |
| South American Indian | 103 | 0.1% |
| Spaniard | 651 | 0.5% |
| Spanish | 1,152 | 0.8% |
| Spanish American | 77 | 0.1% |
| Sri Lankan | 2,767 | 2.0% |
| Subsaharan African | 2,478 | 1.8% |
| Sudanese | 142 | 0.1% |
| Swedish | 2,740 | 2.0% |
| Swiss | 651 | 0.5% |
| Thai | 814 | 0.6% |
| Tongan | 3,157 | 2.3% |
| Trinidadian and Tobagonian | 12 | 0.0% |
| Turkish | 13 | 0.0% |
| Ukrainian | 49 | 0.0% |
| Uruguayan | 116 | 0.1% |
| Ute | 96 | 0.1% |
| Venezuelan | 686 | 0.5% |
| Welsh | 1,466 | 1.1% |
| Yugoslavian | 847 | 0.6% | View All 134 Rows |
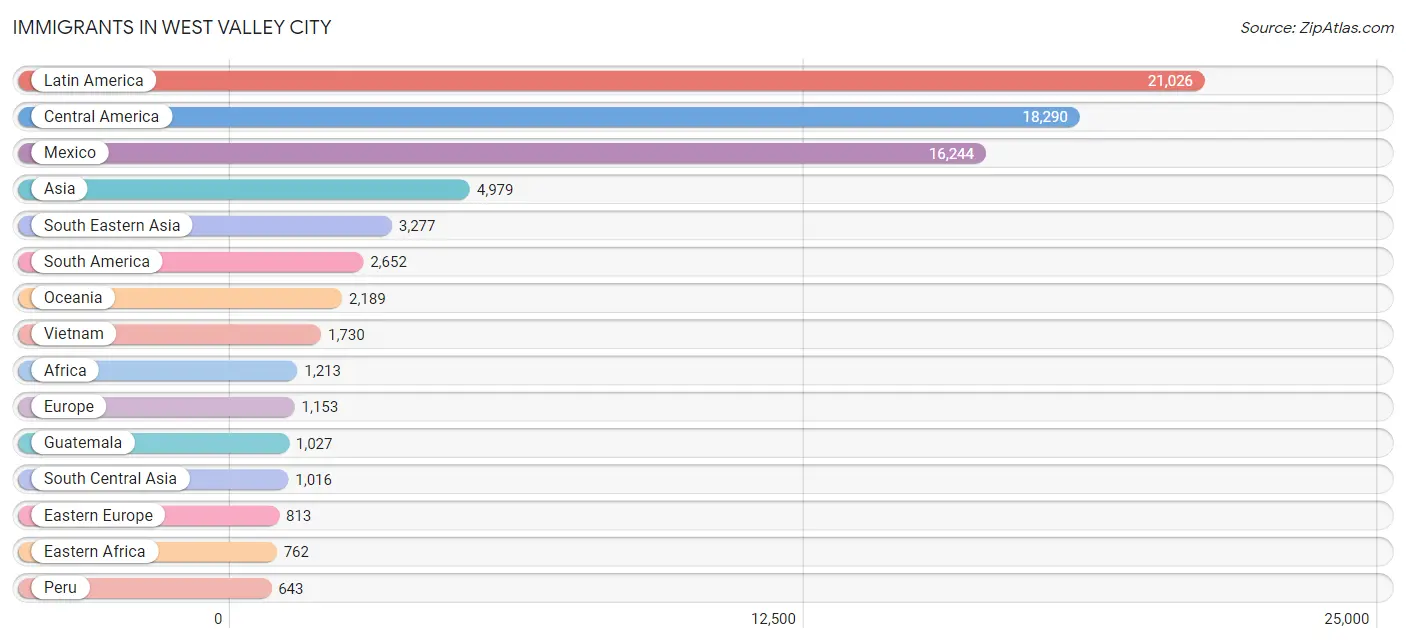
Immigrants in West Valley City
The most numerous immigrant groups reported in West Valley City came from Latin America (21,026 | 15.1%), Central America (18,290 | 13.2%), Mexico (16,244 | 11.7%), Asia (4,979 | 3.6%), and South Eastern Asia (3,277 | 2.4%), together accounting for 46.0% of all West Valley City residents.
| Immigration Origin | # Population | % Population |
| Afghanistan | 17 | 0.0% |
| Africa | 1,213 | 0.9% |
| Argentina | 96 | 0.1% |
| Asia | 4,979 | 3.6% |
| Australia | 28 | 0.0% |
| Bangladesh | 30 | 0.0% |
| Belgium | 5 | 0.0% |
| Belize | 99 | 0.1% |
| Bolivia | 86 | 0.1% |
| Bosnia and Herzegovina | 435 | 0.3% |
| Brazil | 184 | 0.1% |
| Bulgaria | 6 | 0.0% |
| Cambodia | 565 | 0.4% |
| Canada | 43 | 0.0% |
| Caribbean | 84 | 0.1% |
| Central America | 18,290 | 13.2% |
| Chile | 226 | 0.2% |
| China | 343 | 0.3% |
| Colombia | 473 | 0.3% |
| Costa Rica | 28 | 0.0% |
| Croatia | 44 | 0.0% |
| Cuba | 22 | 0.0% |
| Denmark | 7 | 0.0% |
| Dominican Republic | 62 | 0.0% |
| Eastern Africa | 762 | 0.5% |
| Eastern Asia | 596 | 0.4% |
| Eastern Europe | 813 | 0.6% |
| Ecuador | 226 | 0.2% |
| Egypt | 25 | 0.0% |
| El Salvador | 574 | 0.4% |
| England | 83 | 0.1% |
| Eritrea | 121 | 0.1% |
| Ethiopia | 18 | 0.0% |
| Europe | 1,153 | 0.8% |
| Fiji | 114 | 0.1% |
| France | 5 | 0.0% |
| Germany | 94 | 0.1% |
| Guatemala | 1,027 | 0.7% |
| Honduras | 275 | 0.2% |
| Hong Kong | 45 | 0.0% |
| India | 588 | 0.4% |
| Indonesia | 34 | 0.0% |
| Iran | 47 | 0.0% |
| Iraq | 79 | 0.1% |
| Italy | 6 | 0.0% |
| Japan | 61 | 0.0% |
| Jordan | 9 | 0.0% |
| Kenya | 156 | 0.1% |
| Korea | 192 | 0.1% |
| Laos | 151 | 0.1% |
| Latin America | 21,026 | 15.1% |
| Liberia | 25 | 0.0% |
| Malaysia | 5 | 0.0% |
| Mexico | 16,244 | 11.7% |
| Middle Africa | 97 | 0.1% |
| Morocco | 10 | 0.0% |
| Netherlands | 71 | 0.1% |
| Nicaragua | 43 | 0.0% |
| Northern Africa | 121 | 0.1% |
| Northern Europe | 122 | 0.1% |
| Oceania | 2,189 | 1.6% |
| Pakistan | 276 | 0.2% |
| Peru | 643 | 0.5% |
| Philippines | 454 | 0.3% |
| Poland | 73 | 0.1% |
| Romania | 22 | 0.0% |
| Scotland | 14 | 0.0% |
| Senegal | 6 | 0.0% |
| Serbia | 26 | 0.0% |
| Sierra Leone | 124 | 0.1% |
| Somalia | 277 | 0.2% |
| South Africa | 78 | 0.1% |
| South America | 2,652 | 1.9% |
| South Central Asia | 1,016 | 0.7% |
| South Eastern Asia | 3,277 | 2.4% |
| Southern Europe | 35 | 0.0% |
| Spain | 29 | 0.0% |
| Sudan | 86 | 0.1% |
| Sweden | 17 | 0.0% |
| Taiwan | 11 | 0.0% |
| Thailand | 205 | 0.2% |
| Turkey | 1 | 0.0% |
| Uganda | 50 | 0.0% |
| Uruguay | 61 | 0.0% |
| Venezuela | 643 | 0.5% |
| Vietnam | 1,730 | 1.3% |
| Western Africa | 155 | 0.1% |
| Western Asia | 90 | 0.1% |
| Western Europe | 183 | 0.1% |
| Zaire | 97 | 0.1% |
| Zimbabwe | 9 | 0.0% | View All 91 Rows |
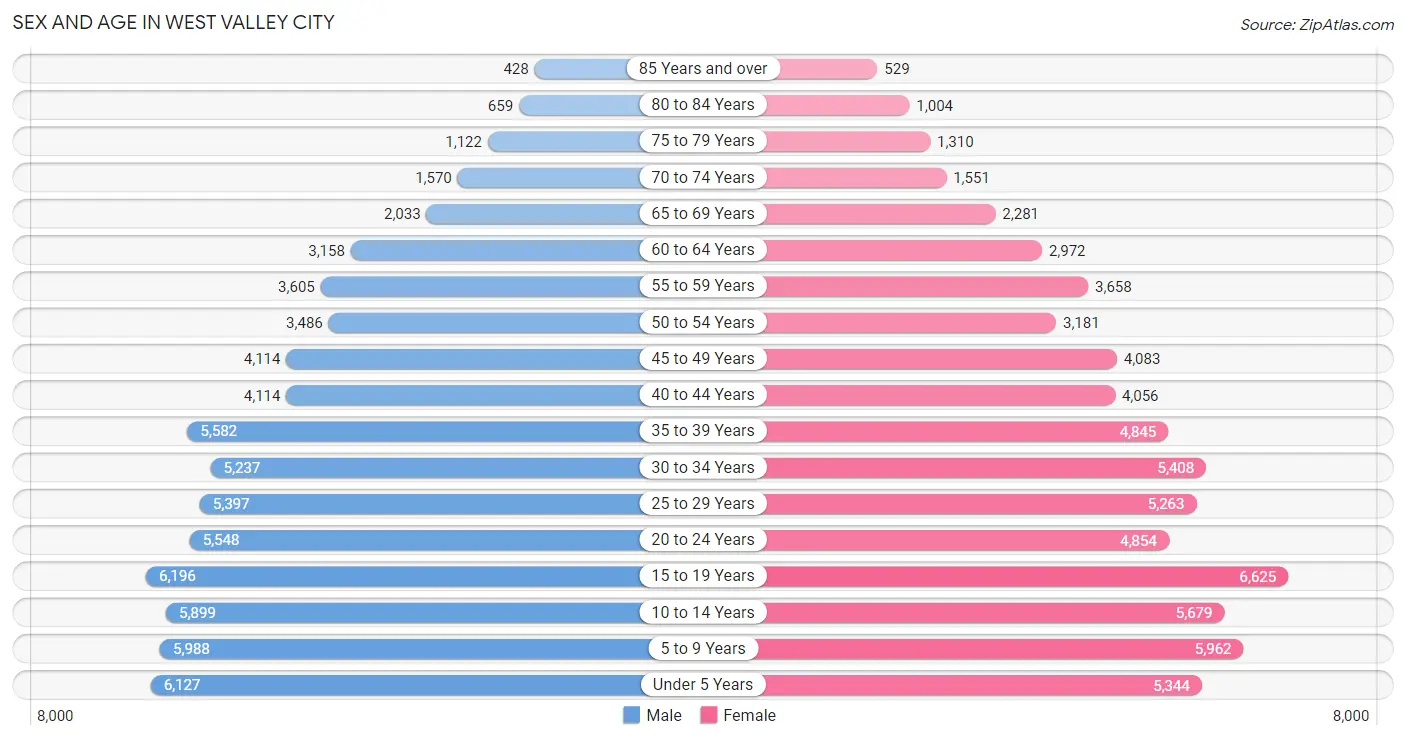
Sex and Age in West Valley City
Sex and Age in West Valley City
The most populous age groups in West Valley City are 15 to 19 Years (6,196 | 8.8%) for men and 15 to 19 Years (6,625 | 9.7%) for women.
| Age Bracket | Male | Female |
| Under 5 Years | 6,127 (8.7%) | 5,344 (7.8%) |
| 5 to 9 Years | 5,988 (8.5%) | 5,962 (8.7%) |
| 10 to 14 Years | 5,899 (8.4%) | 5,679 (8.3%) |
| 15 to 19 Years | 6,196 (8.8%) | 6,625 (9.7%) |
| 20 to 24 Years | 5,548 (7.9%) | 4,854 (7.1%) |
| 25 to 29 Years | 5,397 (7.7%) | 5,263 (7.7%) |
| 30 to 34 Years | 5,237 (7.4%) | 5,408 (7.9%) |
| 35 to 39 Years | 5,582 (7.9%) | 4,845 (7.1%) |
| 40 to 44 Years | 4,114 (5.9%) | 4,056 (5.9%) |
| 45 to 49 Years | 4,114 (5.9%) | 4,083 (5.9%) |
| 50 to 54 Years | 3,486 (5.0%) | 3,181 (4.6%) |
| 55 to 59 Years | 3,605 (5.1%) | 3,658 (5.3%) |
| 60 to 64 Years | 3,158 (4.5%) | 2,972 (4.3%) |
| 65 to 69 Years | 2,033 (2.9%) | 2,281 (3.3%) |
| 70 to 74 Years | 1,570 (2.2%) | 1,551 (2.3%) |
| 75 to 79 Years | 1,122 (1.6%) | 1,310 (1.9%) |
| 80 to 84 Years | 659 (0.9%) | 1,004 (1.5%) |
| 85 Years and over | 428 (0.6%) | 529 (0.8%) |
| Total | 70,263 (100.0%) | 68,605 (100.0%) |
Families and Households in West Valley City
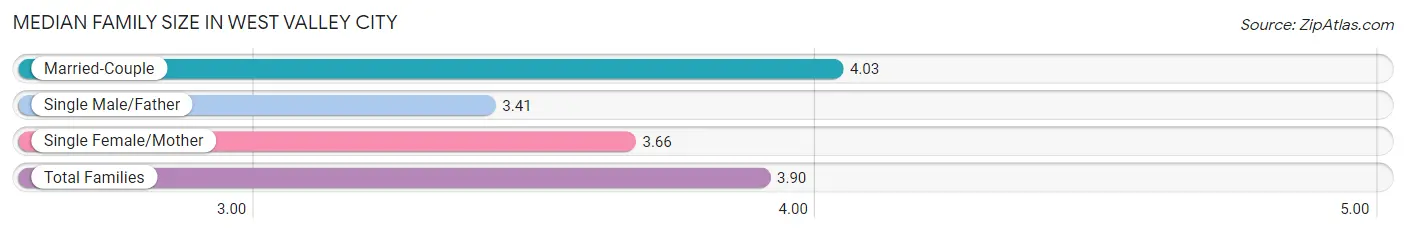
Median Family Size in West Valley City
The median family size in West Valley City is 3.90 persons per family, with married-couple families (22,071 | 72.0%) accounting for the largest median family size of 4.03 persons per family. On the other hand, single male/father families (2,968 | 9.7%) represent the smallest median family size with 3.41 persons per family.
| Family Type | # Families | Family Size |
| Married-Couple | 22,071 (72.0%) | 4.03 |
| Single Male/Father | 2,968 (9.7%) | 3.41 |
| Single Female/Mother | 5,601 (18.3%) | 3.66 |
| Total Families | 30,640 (100.0%) | 3.90 |
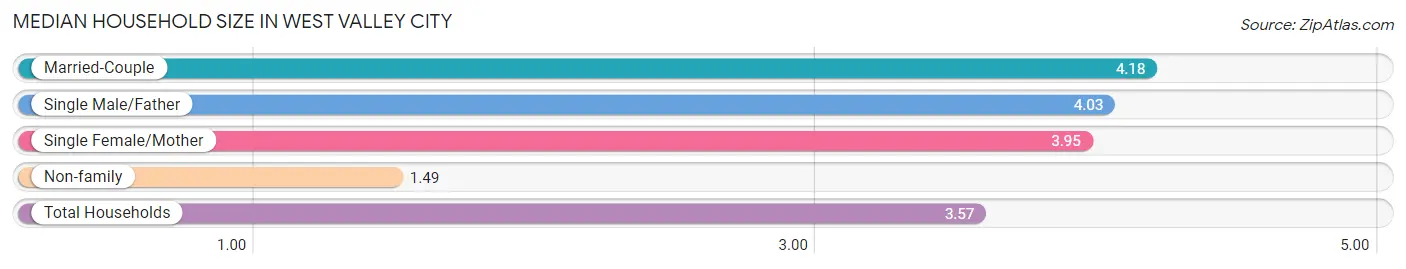
Median Household Size in West Valley City
The median household size in West Valley City is 3.57 persons per household, with married-couple households (22,071 | 56.8%) accounting for the largest median household size of 4.18 persons per household. non-family households (8,198 | 21.1%) represent the smallest median household size with 1.49 persons per household.
| Household Type | # Households | Household Size |
| Married-Couple | 22,071 (56.8%) | 4.18 |
| Single Male/Father | 2,968 (7.6%) | 4.03 |
| Single Female/Mother | 5,601 (14.4%) | 3.95 |
| Non-family | 8,198 (21.1%) | 1.49 |
| Total Households | 38,838 (100.0%) | 3.57 |
Household Size by Marriage Status in West Valley City
Out of a total of 38,838 households in West Valley City, 30,640 (78.9%) are family households, while 8,198 (21.1%) are nonfamily households. The most numerous type of family households are 2-person households, comprising 8,169, and the most common type of nonfamily households are 1-person households, comprising 5,579.
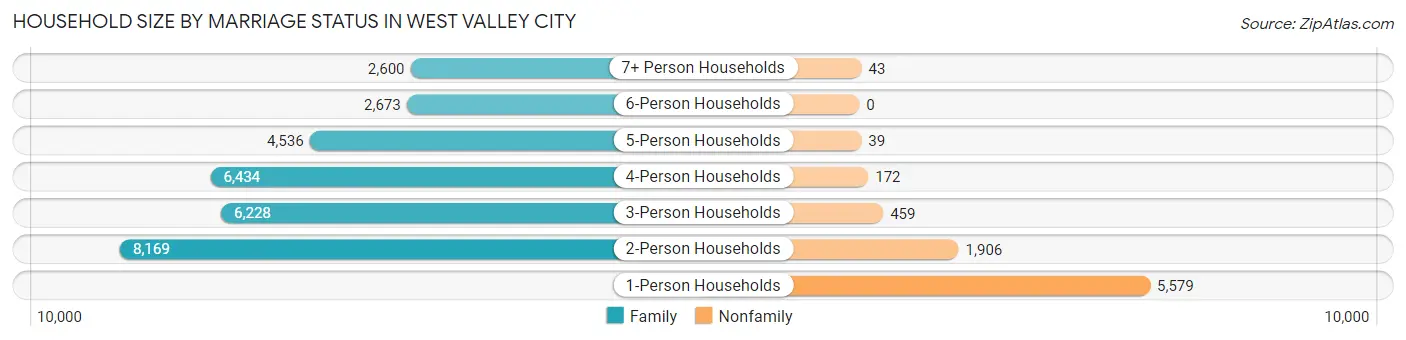
| Household Size | Family Households | Nonfamily Households |
| 1-Person Households | - | 5,579 (14.4%) |
| 2-Person Households | 8,169 (21.0%) | 1,906 (4.9%) |
| 3-Person Households | 6,228 (16.0%) | 459 (1.2%) |
| 4-Person Households | 6,434 (16.6%) | 172 (0.4%) |
| 5-Person Households | 4,536 (11.7%) | 39 (0.1%) |
| 6-Person Households | 2,673 (6.9%) | 0 (0.0%) |
| 7+ Person Households | 2,600 (6.7%) | 43 (0.1%) |
| Total | 30,640 (78.9%) | 8,198 (21.1%) |
Female Fertility in West Valley City
Fertility by Age in West Valley City
Average fertility rate in West Valley City is 59.0 births per 1,000 women. Women in the age bracket of 20 to 34 years have the highest fertility rate with 108.0 births per 1,000 women. Women in the age bracket of 20 to 34 years acount for 79.4% of all women with births.
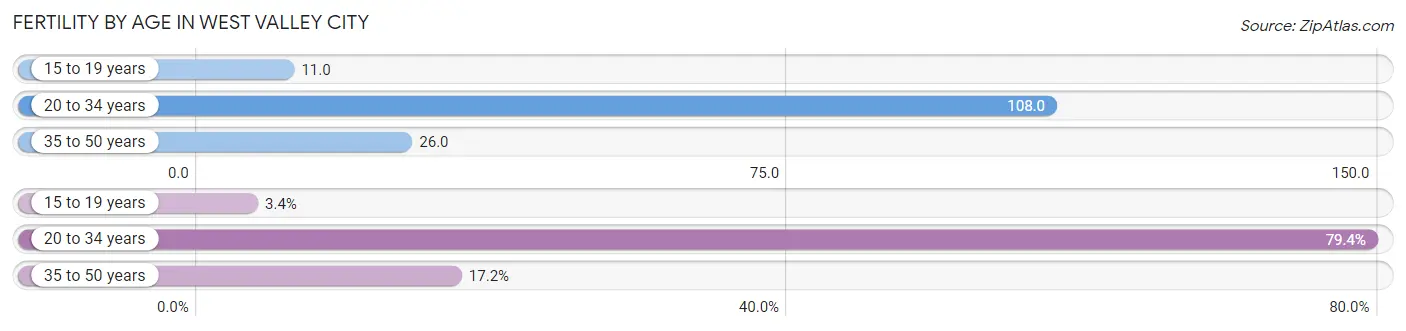
| Age Bracket | Women with Births | Births / 1,000 Women |
| 15 to 19 years | 72 (3.4%) | 11.0 |
| 20 to 34 years | 1,682 (79.4%) | 108.0 |
| 35 to 50 years | 365 (17.2%) | 26.0 |
| Total | 2,119 (100.0%) | 59.0 |
Fertility by Age by Marriage Status in West Valley City
73.7% of women with births (2,119) in West Valley City are married. The highest percentage of unmarried women with births falls into 15 to 19 years age bracket with 87.5% of them unmarried at the time of birth, while the lowest percentage of unmarried women with births belong to 35 to 50 years age bracket with 12.6% of them unmarried.
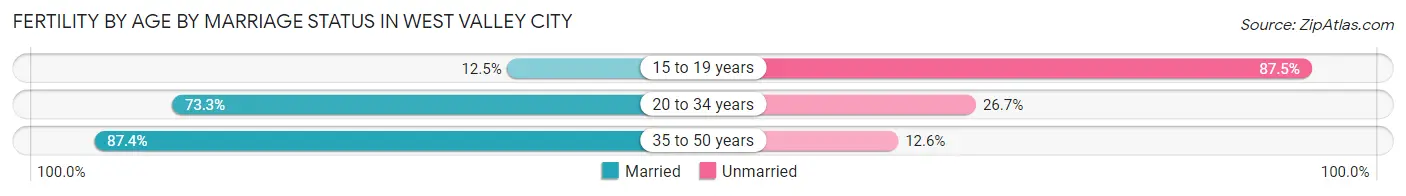
| Age Bracket | Married | Unmarried |
| 15 to 19 years | 9 (12.5%) | 63 (87.5%) |
| 20 to 34 years | 1,233 (73.3%) | 449 (26.7%) |
| 35 to 50 years | 319 (87.4%) | 46 (12.6%) |
| Total | 1,562 (73.7%) | 557 (26.3%) |
Fertility by Education in West Valley City
Average fertility rate in West Valley City is 59.0 births per 1,000 women. Women with the education attainment of graduate degree have the highest fertility rate of 116.0 births per 1,000 women, while women with the education attainment of less than high school have the lowest fertility at 41.0 births per 1,000 women. Women with the education attainment of high school diploma represent 34.5% of all women with births.
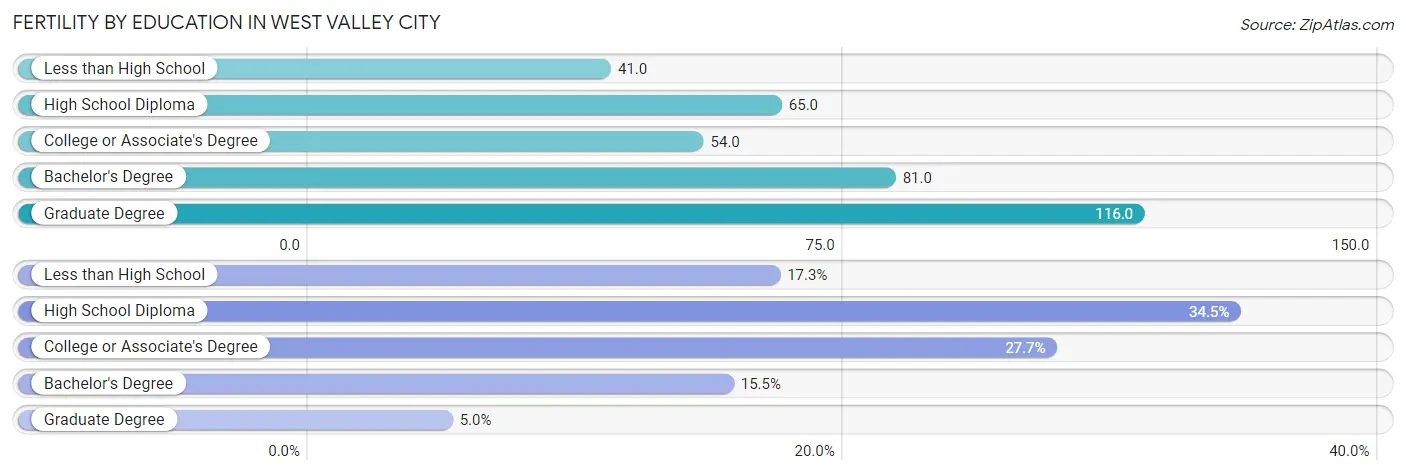
| Educational Attainment | Women with Births | Births / 1,000 Women |
| Less than High School | 366 (17.3%) | 41.0 |
| High School Diploma | 732 (34.5%) | 65.0 |
| College or Associate's Degree | 586 (27.7%) | 54.0 |
| Bachelor's Degree | 329 (15.5%) | 81.0 |
| Graduate Degree | 106 (5.0%) | 116.0 |
| Total | 2,119 (100.0%) | 59.0 |
Fertility by Education by Marriage Status in West Valley City
26.3% of women with births in West Valley City are unmarried. Women with the educational attainment of bachelor's degree are most likely to be married with 100.0% of them married at childbirth, while women with the educational attainment of high school diploma are least likely to be married with 38.3% of them unmarried at childbirth.
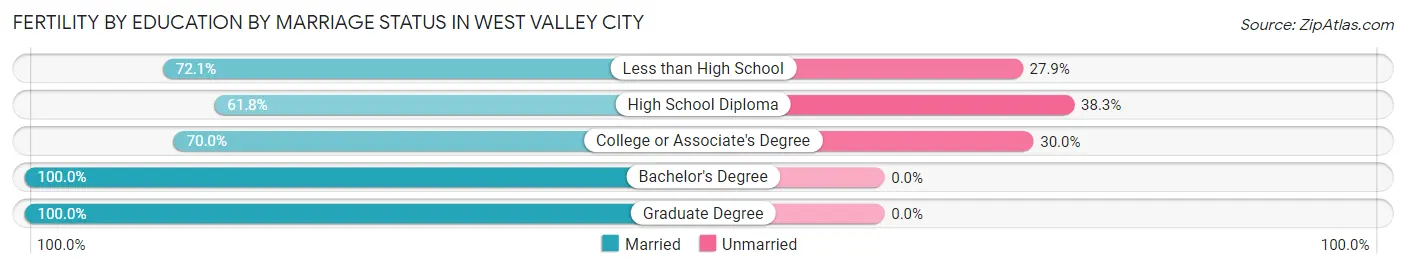
| Educational Attainment | Married | Unmarried |
| Less than High School | 264 (72.1%) | 102 (27.9%) |
| High School Diploma | 452 (61.8%) | 280 (38.3%) |
| College or Associate's Degree | 410 (70.0%) | 176 (30.0%) |
| Bachelor's Degree | 329 (100.0%) | 0 (0.0%) |
| Graduate Degree | 106 (100.0%) | 0 (0.0%) |
| Total | 1,562 (73.7%) | 557 (26.3%) |
Employment Characteristics in West Valley City
Employment by Class of Employer in West Valley City
Among the 68,662 employed individuals in West Valley City, private company employees (53,339 | 77.7%), not-for-profit organizations (3,673 | 5.3%), and local government employees (3,370 | 4.9%) make up the most common classes of employment.
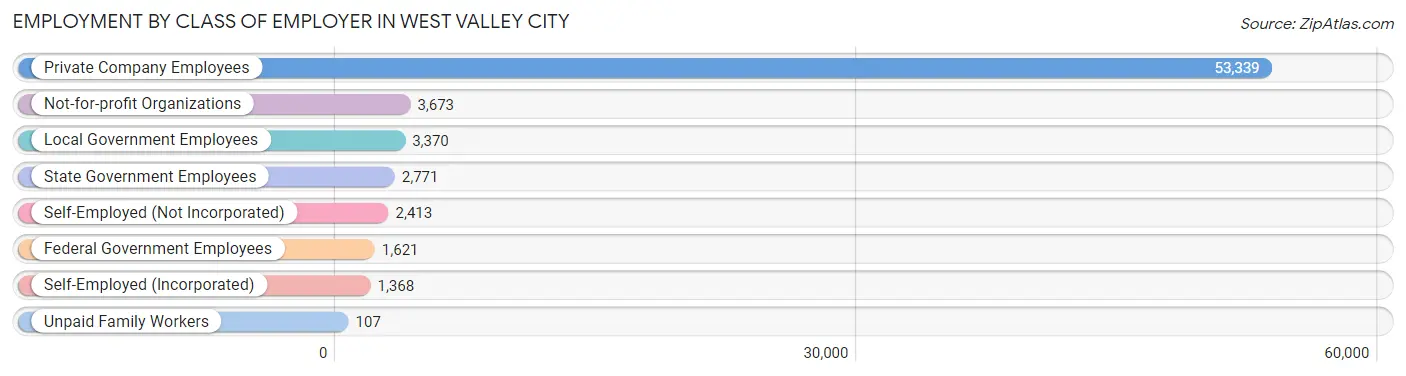
| Employer Class | # Employees | % Employees |
| Private Company Employees | 53,339 | 77.7% |
| Self-Employed (Incorporated) | 1,368 | 2.0% |
| Self-Employed (Not Incorporated) | 2,413 | 3.5% |
| Not-for-profit Organizations | 3,673 | 5.3% |
| Local Government Employees | 3,370 | 4.9% |
| State Government Employees | 2,771 | 4.0% |
| Federal Government Employees | 1,621 | 2.4% |
| Unpaid Family Workers | 107 | 0.2% |
| Total | 68,662 | 100.0% |
Employment Status by Age in West Valley City
According to the labor force statistics for West Valley City, out of the total population over 16 years of age (101,126), 72.2% or 73,013 individuals are in the labor force, with 4.0% or 2,921 of them unemployed. The age group with the highest labor force participation rate is 20 to 24 years, with 86.6% or 9,008 individuals in the labor force. Within the labor force, the 16 to 19 years age range has the highest percentage of unemployed individuals, with 12.8% or 752 of them being unemployed.
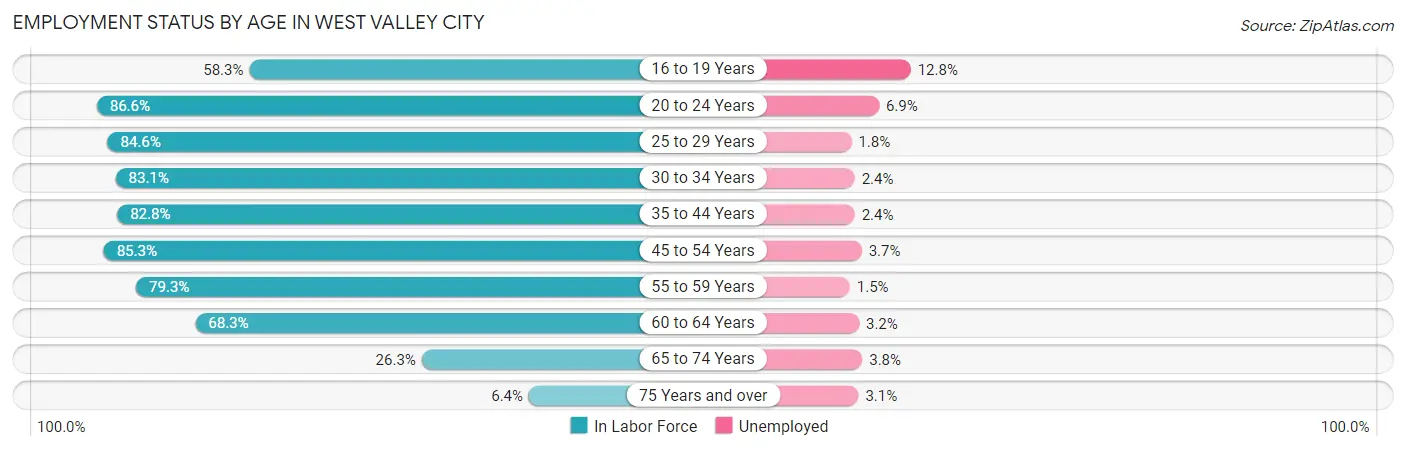
| Age Bracket | In Labor Force | Unemployed |
| 16 to 19 Years | 5,875 (58.3%) | 752 (12.8%) |
| 20 to 24 Years | 9,008 (86.6%) | 622 (6.9%) |
| 25 to 29 Years | 9,018 (84.6%) | 162 (1.8%) |
| 30 to 34 Years | 8,846 (83.1%) | 212 (2.4%) |
| 35 to 44 Years | 15,398 (82.8%) | 370 (2.4%) |
| 45 to 54 Years | 12,679 (85.3%) | 469 (3.7%) |
| 55 to 59 Years | 5,760 (79.3%) | 86 (1.5%) |
| 60 to 64 Years | 4,187 (68.3%) | 134 (3.2%) |
| 65 to 74 Years | 1,955 (26.3%) | 74 (3.8%) |
| 75 Years and over | 323 (6.4%) | 10 (3.1%) |
| Total | 73,013 (72.2%) | 2,921 (4.0%) |
Employment Status by Educational Attainment in West Valley City
According to labor force statistics for West Valley City, 82.0% of individuals (55,890) out of the total population between 25 and 64 years of age (68,159) are in the labor force, with 2.6% or 1,453 of them being unemployed. The group with the highest labor force participation rate are those with the educational attainment of bachelor's degree or higher, with 90.2% or 9,526 individuals in the labor force. Within the labor force, individuals with high school diploma education have the highest percentage of unemployment, with 2.7% or 522 of them being unemployed.
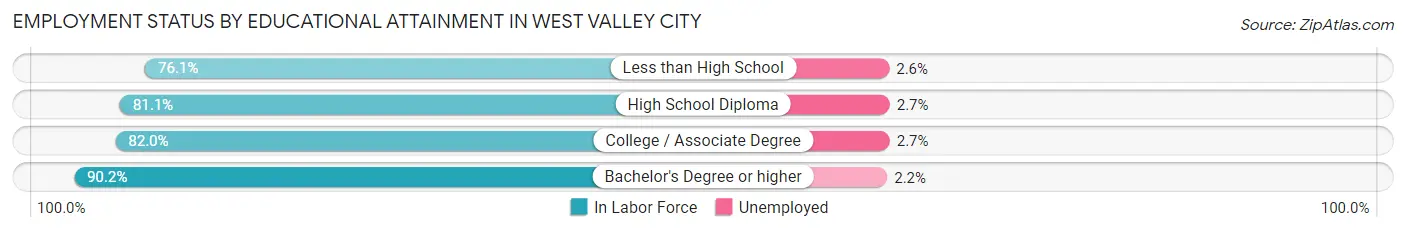
| Educational Attainment | In Labor Force | Unemployed |
| Less than High School | 8,840 (76.1%) | 302 (2.6%) |
| High School Diploma | 19,338 (81.1%) | 644 (2.7%) |
| College / Associate Degree | 18,152 (82.0%) | 598 (2.7%) |
| Bachelor's Degree or higher | 9,526 (90.2%) | 232 (2.2%) |
| Total | 55,890 (82.0%) | 1,772 (2.6%) |
Employment Occupations by Sex in West Valley City
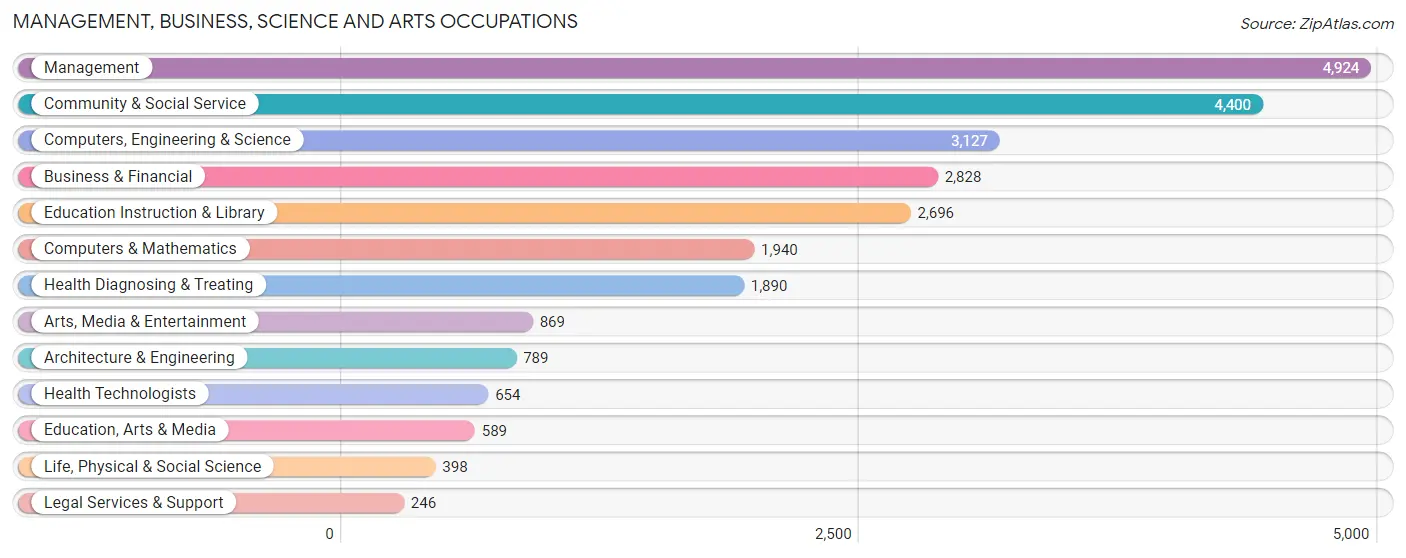
Management, Business, Science and Arts Occupations
The most common Management, Business, Science and Arts occupations in West Valley City are Management (4,924 | 7.0%), Community & Social Service (4,400 | 6.3%), Computers, Engineering & Science (3,127 | 4.5%), Business & Financial (2,828 | 4.1%), and Education Instruction & Library (2,696 | 3.9%).
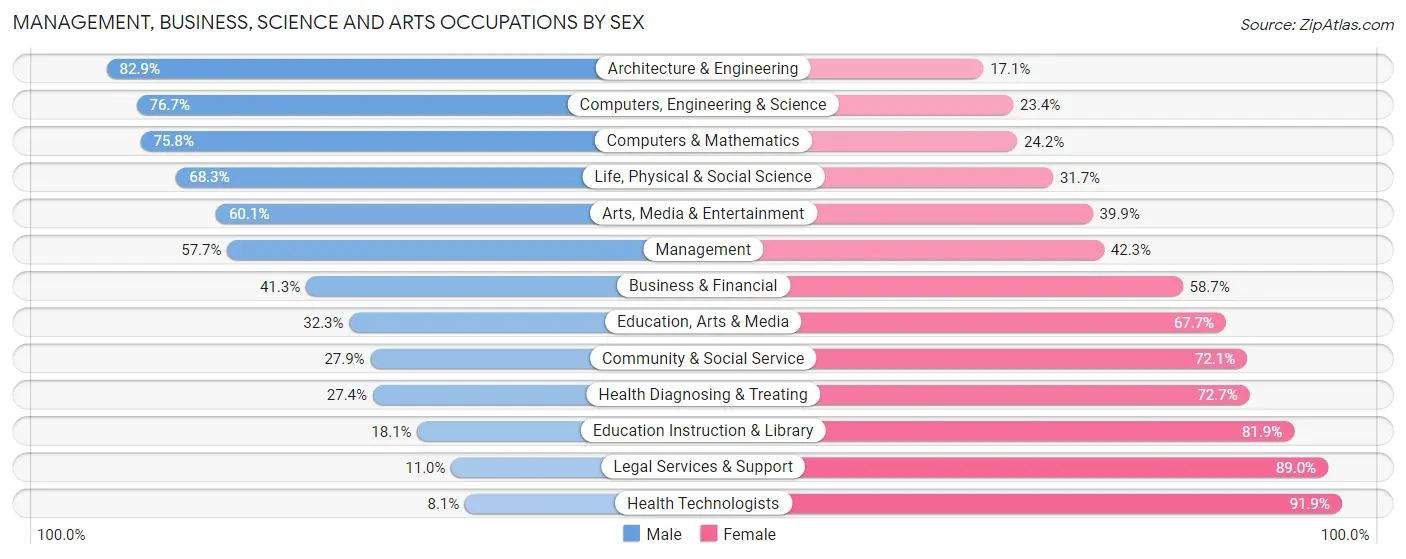
Management, Business, Science and Arts Occupations by Sex
Within the Management, Business, Science and Arts occupations in West Valley City, the most male-oriented occupations are Architecture & Engineering (82.9%), Computers, Engineering & Science (76.6%), and Computers & Mathematics (75.8%), while the most female-oriented occupations are Health Technologists (91.9%), Legal Services & Support (89.0%), and Education Instruction & Library (81.9%).
| Occupation | Male | Female |
| Management | 2,842 (57.7%) | 2,082 (42.3%) |
| Business & Financial | 1,168 (41.3%) | 1,660 (58.7%) |
| Computers, Engineering & Science | 2,397 (76.6%) | 730 (23.4%) |
| Computers & Mathematics | 1,471 (75.8%) | 469 (24.2%) |
| Architecture & Engineering | 654 (82.9%) | 135 (17.1%) |
| Life, Physical & Social Science | 272 (68.3%) | 126 (31.7%) |
| Community & Social Service | 1,226 (27.9%) | 3,174 (72.1%) |
| Education, Arts & Media | 190 (32.3%) | 399 (67.7%) |
| Legal Services & Support | 27 (11.0%) | 219 (89.0%) |
| Education Instruction & Library | 487 (18.1%) | 2,209 (81.9%) |
| Arts, Media & Entertainment | 522 (60.1%) | 347 (39.9%) |
| Health Diagnosing & Treating | 517 (27.4%) | 1,373 (72.7%) |
| Health Technologists | 53 (8.1%) | 601 (91.9%) |
| Total (Category) | 8,150 (47.5%) | 9,019 (52.5%) |
| Total (Overall) | 38,286 (54.8%) | 31,626 (45.2%) |
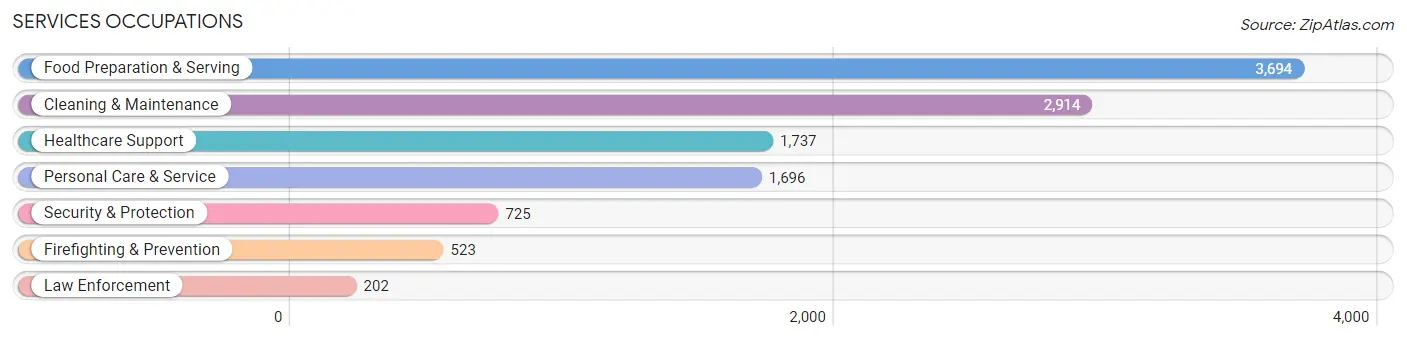
Services Occupations
The most common Services occupations in West Valley City are Food Preparation & Serving (3,694 | 5.3%), Cleaning & Maintenance (2,914 | 4.2%), Healthcare Support (1,737 | 2.5%), Personal Care & Service (1,696 | 2.4%), and Security & Protection (725 | 1.0%).
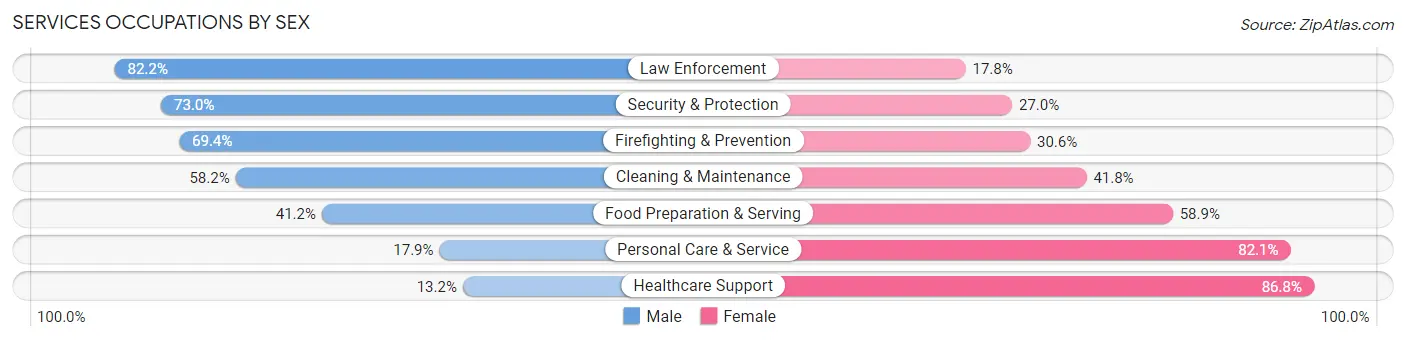
Services Occupations by Sex
Within the Services occupations in West Valley City, the most male-oriented occupations are Law Enforcement (82.2%), Security & Protection (73.0%), and Firefighting & Prevention (69.4%), while the most female-oriented occupations are Healthcare Support (86.8%), Personal Care & Service (82.1%), and Food Preparation & Serving (58.9%).
| Occupation | Male | Female |
| Healthcare Support | 230 (13.2%) | 1,507 (86.8%) |
| Security & Protection | 529 (73.0%) | 196 (27.0%) |
| Firefighting & Prevention | 363 (69.4%) | 160 (30.6%) |
| Law Enforcement | 166 (82.2%) | 36 (17.8%) |
| Food Preparation & Serving | 1,520 (41.1%) | 2,174 (58.9%) |
| Cleaning & Maintenance | 1,697 (58.2%) | 1,217 (41.8%) |
| Personal Care & Service | 303 (17.9%) | 1,393 (82.1%) |
| Total (Category) | 4,279 (39.8%) | 6,487 (60.3%) |
| Total (Overall) | 38,286 (54.8%) | 31,626 (45.2%) |
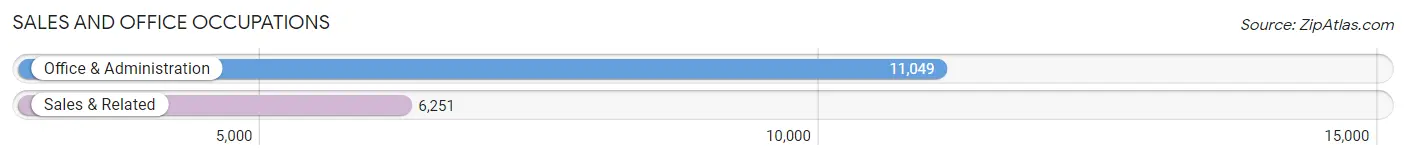
Sales and Office Occupations
The most common Sales and Office occupations in West Valley City are Office & Administration (11,049 | 15.8%), and Sales & Related (6,251 | 8.9%).
Sales and Office Occupations by Sex
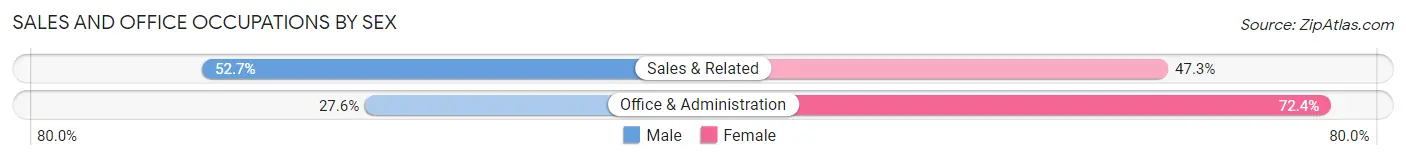
| Occupation | Male | Female |
| Sales & Related | 3,293 (52.7%) | 2,958 (47.3%) |
| Office & Administration | 3,053 (27.6%) | 7,996 (72.4%) |
| Total (Category) | 6,346 (36.7%) | 10,954 (63.3%) |
| Total (Overall) | 38,286 (54.8%) | 31,626 (45.2%) |
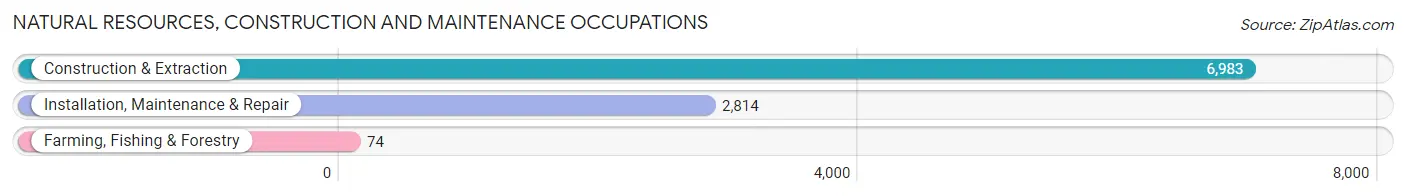
Natural Resources, Construction and Maintenance Occupations
The most common Natural Resources, Construction and Maintenance occupations in West Valley City are Construction & Extraction (6,983 | 10.0%), Installation, Maintenance & Repair (2,814 | 4.0%), and Farming, Fishing & Forestry (74 | 0.1%).
Natural Resources, Construction and Maintenance Occupations by Sex
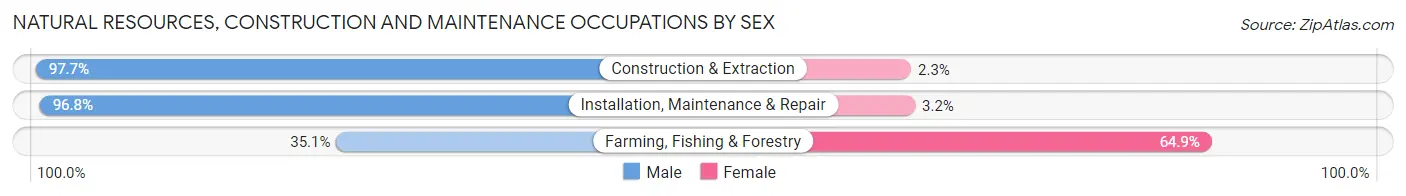
| Occupation | Male | Female |
| Farming, Fishing & Forestry | 26 (35.1%) | 48 (64.9%) |
| Construction & Extraction | 6,820 (97.7%) | 163 (2.3%) |
| Installation, Maintenance & Repair | 2,725 (96.8%) | 89 (3.2%) |
| Total (Category) | 9,571 (97.0%) | 300 (3.0%) |
| Total (Overall) | 38,286 (54.8%) | 31,626 (45.2%) |
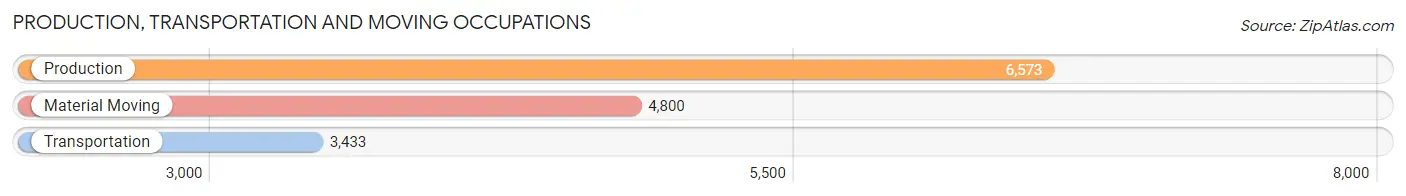
Production, Transportation and Moving Occupations
The most common Production, Transportation and Moving occupations in West Valley City are Production (6,573 | 9.4%), Material Moving (4,800 | 6.9%), and Transportation (3,433 | 4.9%).
Production, Transportation and Moving Occupations by Sex
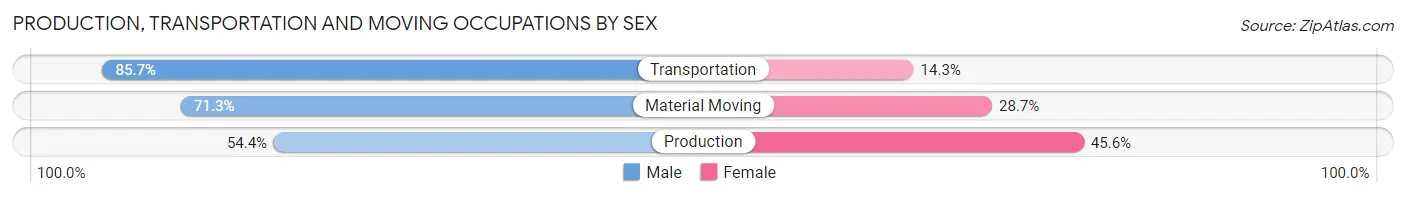
| Occupation | Male | Female |
| Production | 3,578 (54.4%) | 2,995 (45.6%) |
| Transportation | 2,941 (85.7%) | 492 (14.3%) |
| Material Moving | 3,421 (71.3%) | 1,379 (28.7%) |
| Total (Category) | 9,940 (67.1%) | 4,866 (32.9%) |
| Total (Overall) | 38,286 (54.8%) | 31,626 (45.2%) |
Employment Industries by Sex in West Valley City
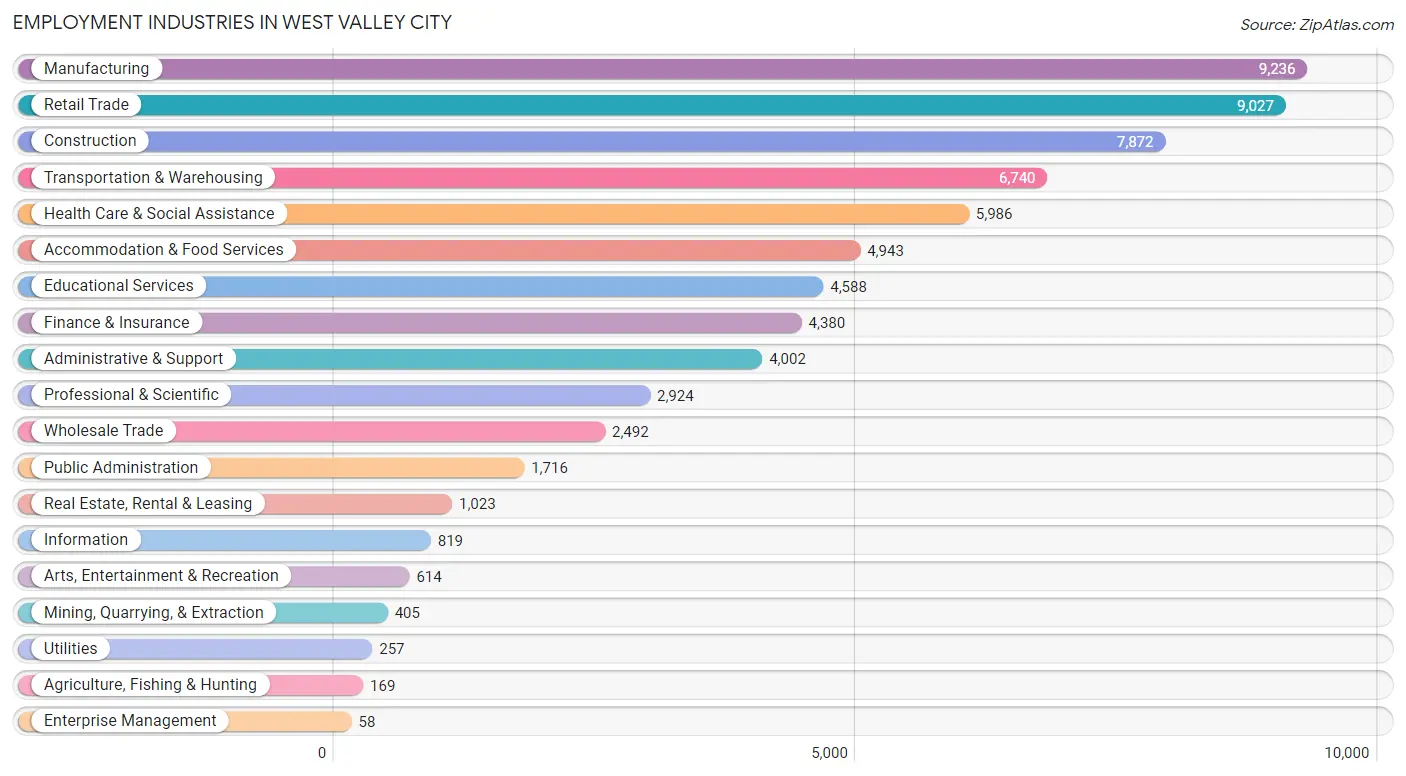
Employment Industries in West Valley City
The major employment industries in West Valley City include Manufacturing (9,236 | 13.2%), Retail Trade (9,027 | 12.9%), Construction (7,872 | 11.3%), Transportation & Warehousing (6,740 | 9.6%), and Health Care & Social Assistance (5,986 | 8.6%).
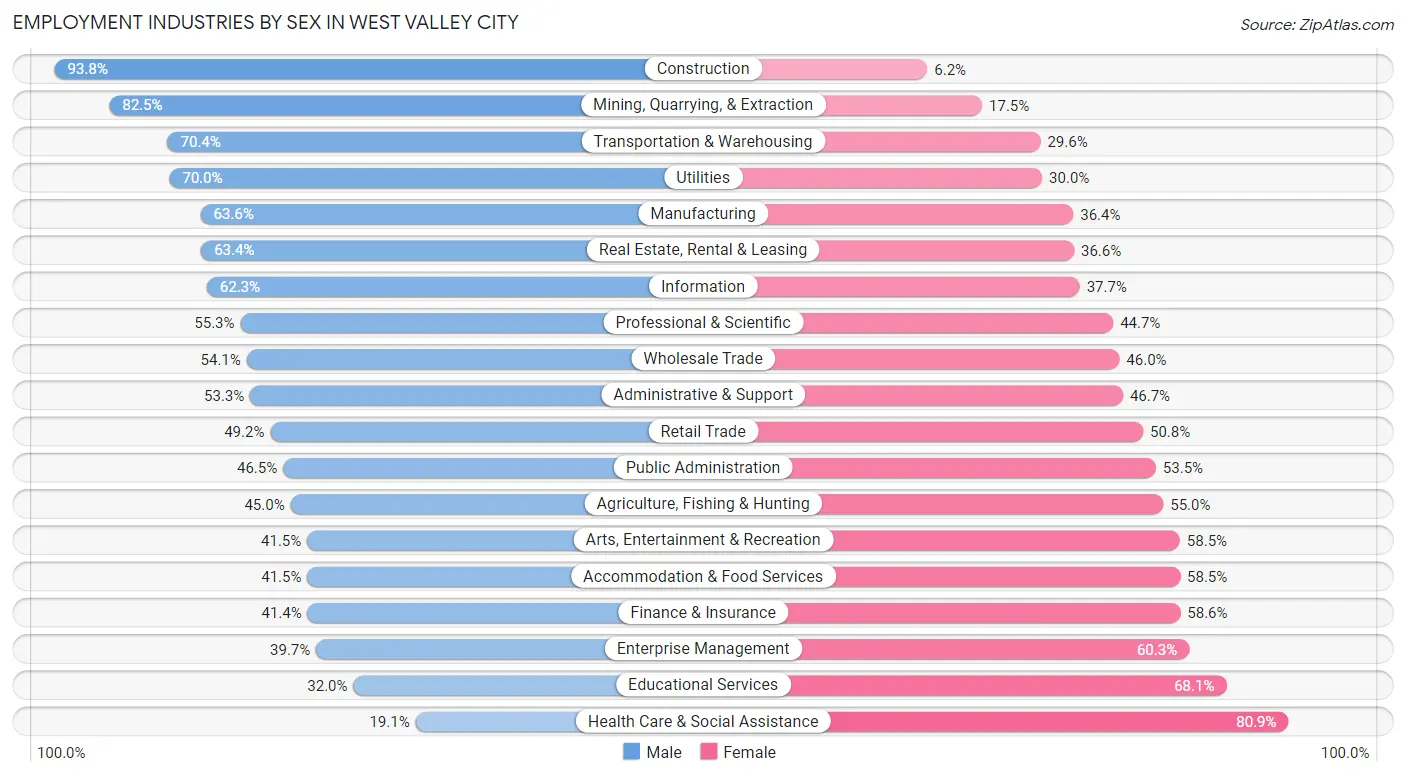
Employment Industries by Sex in West Valley City
The West Valley City industries that see more men than women are Construction (93.8%), Mining, Quarrying, & Extraction (82.5%), and Transportation & Warehousing (70.4%), whereas the industries that tend to have a higher number of women are Health Care & Social Assistance (80.9%), Educational Services (68.0%), and Enterprise Management (60.3%).
| Industry | Male | Female |
| Agriculture, Fishing & Hunting | 76 (45.0%) | 93 (55.0%) |
| Mining, Quarrying, & Extraction | 334 (82.5%) | 71 (17.5%) |
| Construction | 7,385 (93.8%) | 487 (6.2%) |
| Manufacturing | 5,873 (63.6%) | 3,363 (36.4%) |
| Wholesale Trade | 1,347 (54.0%) | 1,145 (46.0%) |
| Retail Trade | 4,438 (49.2%) | 4,589 (50.8%) |
| Transportation & Warehousing | 4,744 (70.4%) | 1,996 (29.6%) |
| Utilities | 180 (70.0%) | 77 (30.0%) |
| Information | 510 (62.3%) | 309 (37.7%) |
| Finance & Insurance | 1,815 (41.4%) | 2,565 (58.6%) |
| Real Estate, Rental & Leasing | 649 (63.4%) | 374 (36.6%) |
| Professional & Scientific | 1,618 (55.3%) | 1,306 (44.7%) |
| Enterprise Management | 23 (39.7%) | 35 (60.3%) |
| Administrative & Support | 2,134 (53.3%) | 1,868 (46.7%) |
| Educational Services | 1,466 (32.0%) | 3,122 (68.0%) |
| Health Care & Social Assistance | 1,143 (19.1%) | 4,843 (80.9%) |
| Arts, Entertainment & Recreation | 255 (41.5%) | 359 (58.5%) |
| Accommodation & Food Services | 2,051 (41.5%) | 2,892 (58.5%) |
| Public Administration | 798 (46.5%) | 918 (53.5%) |
| Total | 38,286 (54.8%) | 31,626 (45.2%) |
Education in West Valley City
School Enrollment in West Valley City
The most common levels of schooling among the 40,824 students in West Valley City are high school (10,515 | 25.8%), elementary school (9,866 | 24.2%), and middle school (8,994 | 22.0%).
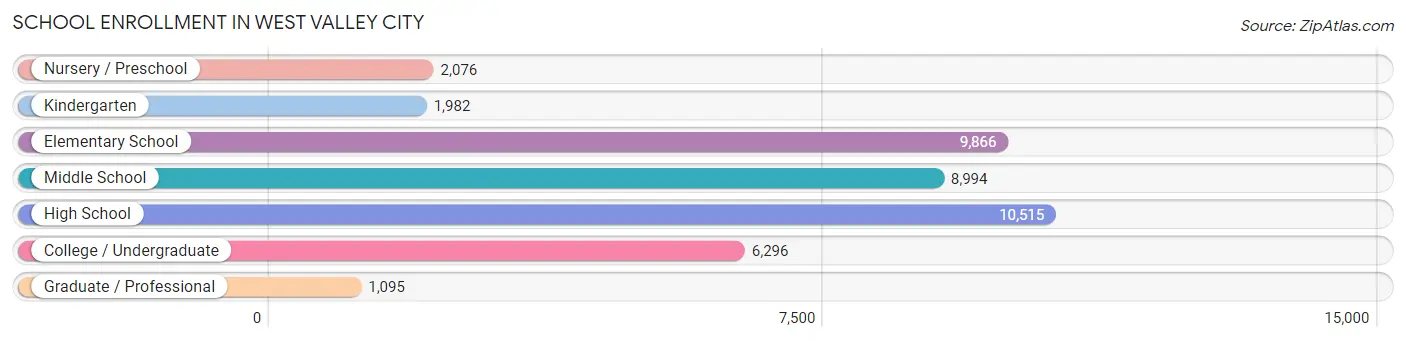
| School Level | # Students | % Students |
| Nursery / Preschool | 2,076 | 5.1% |
| Kindergarten | 1,982 | 4.9% |
| Elementary School | 9,866 | 24.2% |
| Middle School | 8,994 | 22.0% |
| High School | 10,515 | 25.8% |
| College / Undergraduate | 6,296 | 15.4% |
| Graduate / Professional | 1,095 | 2.7% |
| Total | 40,824 | 100.0% |
School Enrollment by Age by Funding Source in West Valley City
Out of a total of 40,824 students who are enrolled in schools in West Valley City, 3,266 (8.0%) attend a private institution, while the remaining 37,558 (92.0%) are enrolled in public schools. The age group of 35 years and over has the highest likelihood of being enrolled in private schools, with 447 (30.2% in the age bracket) enrolled. Conversely, the age group of 10 to 14 year olds has the lowest likelihood of being enrolled in a private school, with 10,966 (96.8% in the age bracket) attending a public institution.
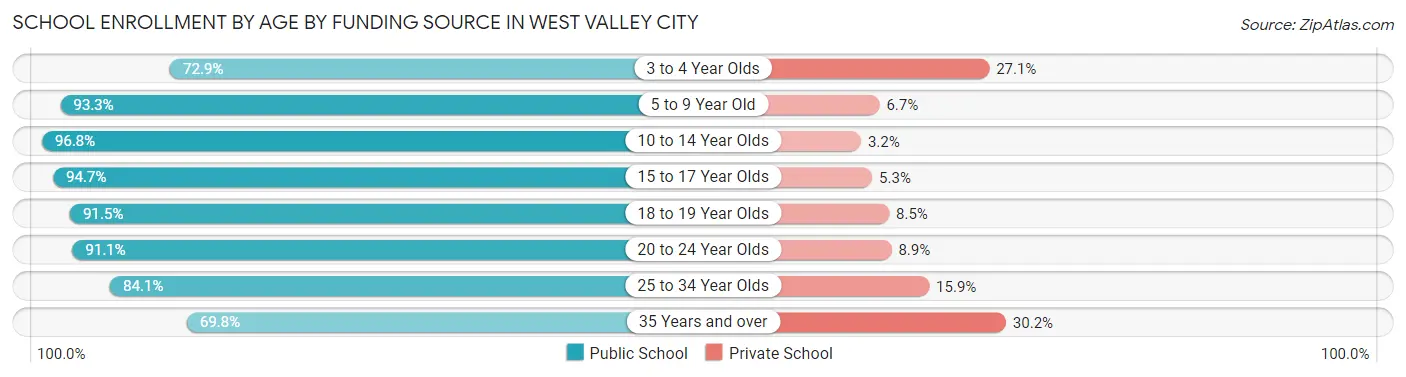
| Age Bracket | Public School | Private School |
| 3 to 4 Year Olds | 1,234 (72.9%) | 459 (27.1%) |
| 5 to 9 Year Old | 10,396 (93.3%) | 743 (6.7%) |
| 10 to 14 Year Olds | 10,966 (96.8%) | 365 (3.2%) |
| 15 to 17 Year Olds | 7,288 (94.7%) | 409 (5.3%) |
| 18 to 19 Year Olds | 2,251 (91.5%) | 208 (8.5%) |
| 20 to 24 Year Olds | 2,313 (91.1%) | 226 (8.9%) |
| 25 to 34 Year Olds | 2,091 (84.1%) | 396 (15.9%) |
| 35 Years and over | 1,032 (69.8%) | 447 (30.2%) |
| Total | 37,558 (92.0%) | 3,266 (8.0%) |
Educational Attainment by Field of Study in West Valley City
Business (2,320 | 16.7%), science & technology (1,779 | 12.8%), education (1,760 | 12.7%), social sciences (1,205 | 8.7%), and computers & mathematics (1,017 | 7.3%) are the most common fields of study among 13,865 individuals in West Valley City who have obtained a bachelor's degree or higher.
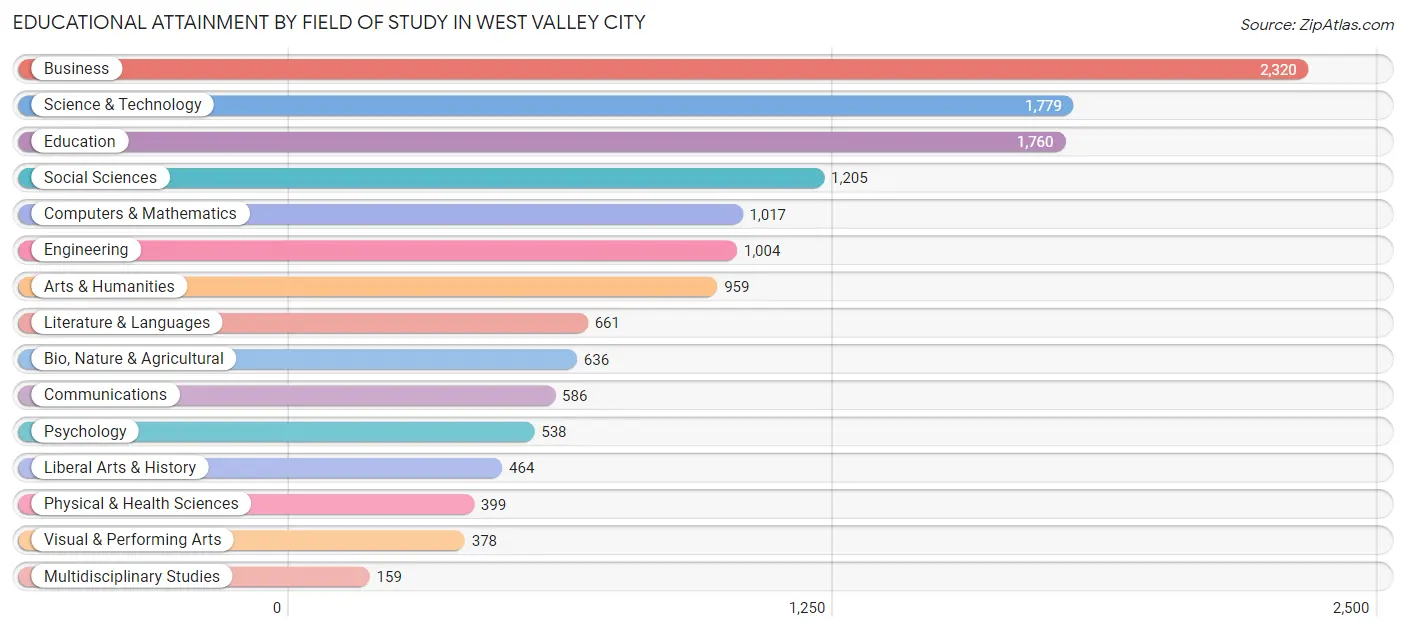
| Field of Study | # Graduates | % Graduates |
| Computers & Mathematics | 1,017 | 7.3% |
| Bio, Nature & Agricultural | 636 | 4.6% |
| Physical & Health Sciences | 399 | 2.9% |
| Psychology | 538 | 3.9% |
| Social Sciences | 1,205 | 8.7% |
| Engineering | 1,004 | 7.2% |
| Multidisciplinary Studies | 159 | 1.1% |
| Science & Technology | 1,779 | 12.8% |
| Business | 2,320 | 16.7% |
| Education | 1,760 | 12.7% |
| Literature & Languages | 661 | 4.8% |
| Liberal Arts & History | 464 | 3.4% |
| Visual & Performing Arts | 378 | 2.7% |
| Communications | 586 | 4.2% |
| Arts & Humanities | 959 | 6.9% |
| Total | 13,865 | 100.0% |
Transportation & Commute in West Valley City
Vehicle Availability by Sex in West Valley City
The most prevalent vehicle ownership categories in West Valley City are males with 2 vehicles (12,286, accounting for 32.5%) and females with 2 vehicles (10,234, making up 39.8%).
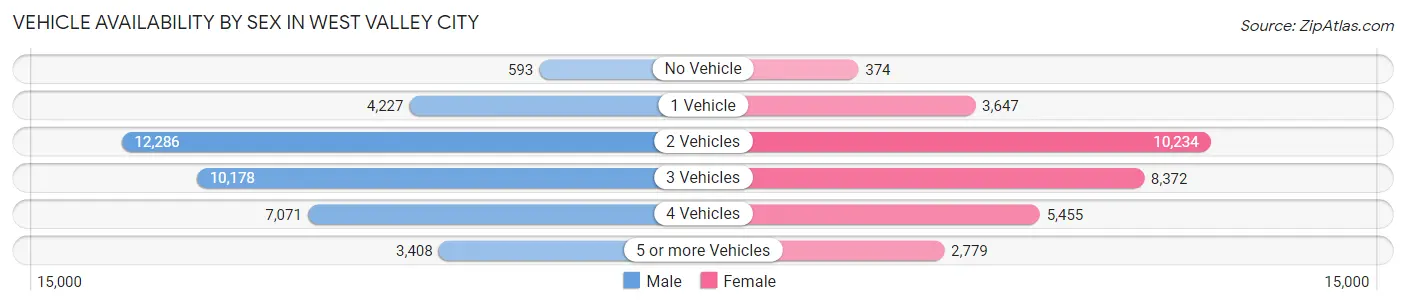
| Vehicles Available | Male | Female |
| No Vehicle | 593 (1.6%) | 374 (1.2%) |
| 1 Vehicle | 4,227 (11.2%) | 3,647 (11.8%) |
| 2 Vehicles | 12,286 (32.5%) | 10,234 (33.2%) |
| 3 Vehicles | 10,178 (27.0%) | 8,372 (27.1%) |
| 4 Vehicles | 7,071 (18.7%) | 5,455 (17.7%) |
| 5 or more Vehicles | 3,408 (9.0%) | 2,779 (9.0%) |
| Total | 37,763 (100.0%) | 30,861 (100.0%) |
Commute Time in West Valley City
The most frequently occuring commute durations in West Valley City are 20 to 24 minutes (14,191 commuters, 22.5%), 15 to 19 minutes (13,391 commuters, 21.3%), and 10 to 14 minutes (9,350 commuters, 14.8%).
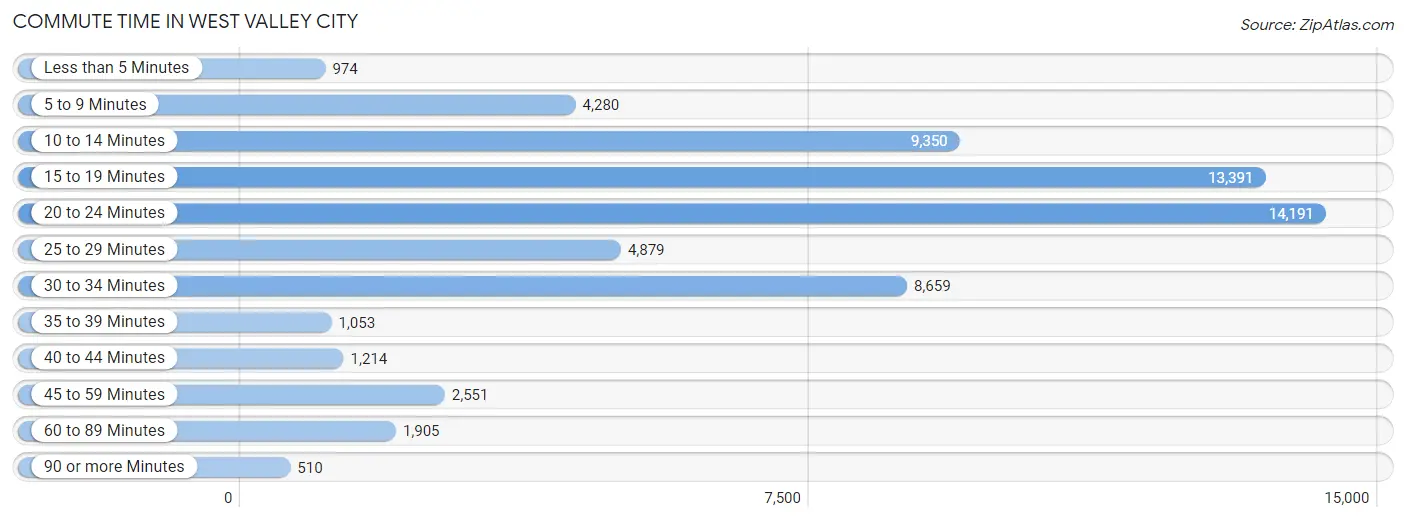
| Commute Time | # Commuters | % Commuters |
| Less than 5 Minutes | 974 | 1.5% |
| 5 to 9 Minutes | 4,280 | 6.8% |
| 10 to 14 Minutes | 9,350 | 14.8% |
| 15 to 19 Minutes | 13,391 | 21.3% |
| 20 to 24 Minutes | 14,191 | 22.5% |
| 25 to 29 Minutes | 4,879 | 7.7% |
| 30 to 34 Minutes | 8,659 | 13.8% |
| 35 to 39 Minutes | 1,053 | 1.7% |
| 40 to 44 Minutes | 1,214 | 1.9% |
| 45 to 59 Minutes | 2,551 | 4.1% |
| 60 to 89 Minutes | 1,905 | 3.0% |
| 90 or more Minutes | 510 | 0.8% |
Commute Time by Sex in West Valley City
The most common commute times in West Valley City are 15 to 19 minutes (7,982 commuters, 22.6%) for males and 20 to 24 minutes (6,307 commuters, 22.9%) for females.
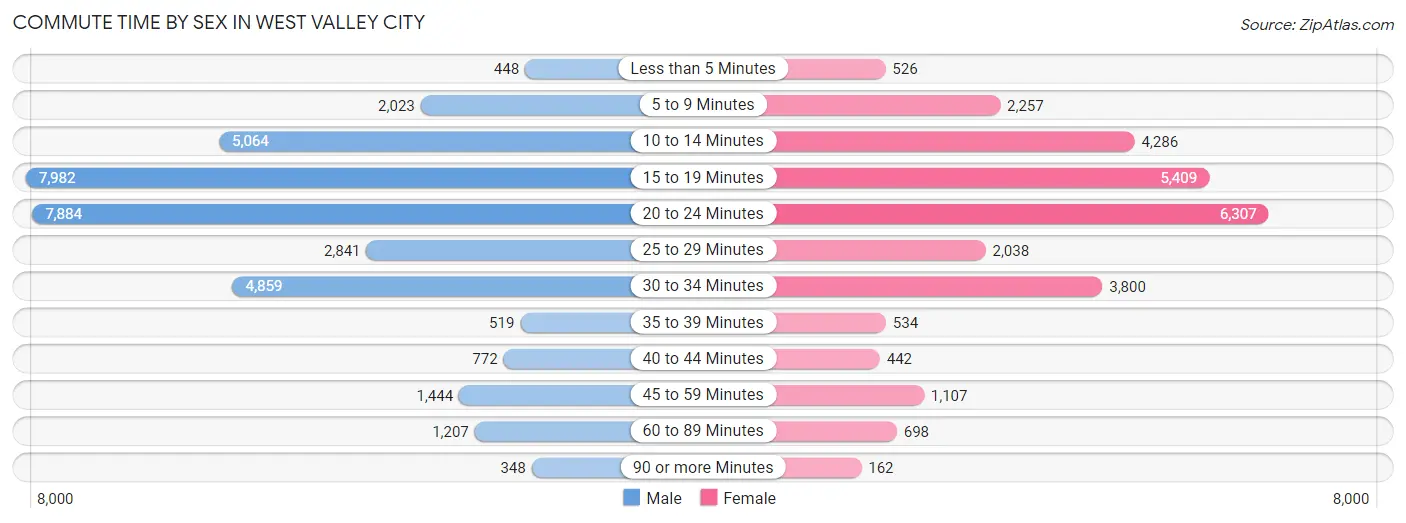
| Commute Time | Male | Female |
| Less than 5 Minutes | 448 (1.3%) | 526 (1.9%) |
| 5 to 9 Minutes | 2,023 (5.7%) | 2,257 (8.2%) |
| 10 to 14 Minutes | 5,064 (14.3%) | 4,286 (15.5%) |
| 15 to 19 Minutes | 7,982 (22.6%) | 5,409 (19.6%) |
| 20 to 24 Minutes | 7,884 (22.3%) | 6,307 (22.9%) |
| 25 to 29 Minutes | 2,841 (8.0%) | 2,038 (7.4%) |
| 30 to 34 Minutes | 4,859 (13.7%) | 3,800 (13.8%) |
| 35 to 39 Minutes | 519 (1.5%) | 534 (1.9%) |
| 40 to 44 Minutes | 772 (2.2%) | 442 (1.6%) |
| 45 to 59 Minutes | 1,444 (4.1%) | 1,107 (4.0%) |
| 60 to 89 Minutes | 1,207 (3.4%) | 698 (2.5%) |
| 90 or more Minutes | 348 (1.0%) | 162 (0.6%) |
Time of Departure to Work by Sex in West Valley City
The most frequent times of departure to work in West Valley City are 7:00 AM to 7:29 AM (4,013, 11.3%) for males and 7:00 AM to 7:29 AM (3,393, 12.3%) for females.
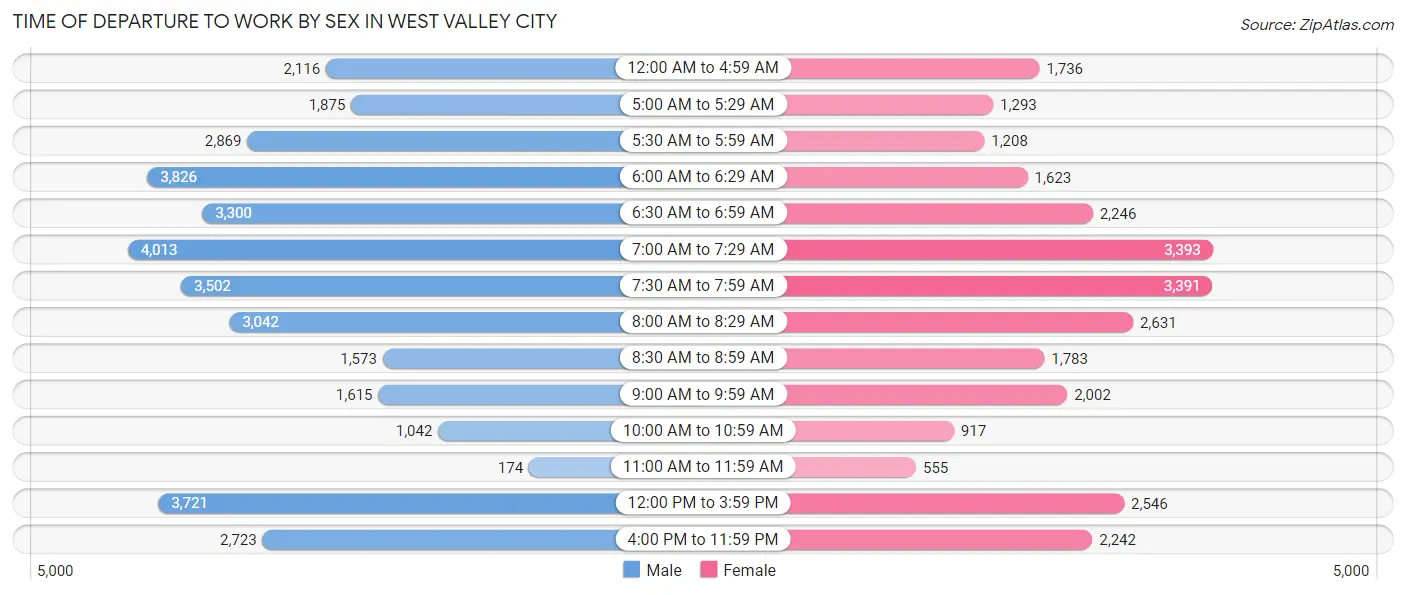
| Time of Departure | Male | Female |
| 12:00 AM to 4:59 AM | 2,116 (6.0%) | 1,736 (6.3%) |
| 5:00 AM to 5:29 AM | 1,875 (5.3%) | 1,293 (4.7%) |
| 5:30 AM to 5:59 AM | 2,869 (8.1%) | 1,208 (4.4%) |
| 6:00 AM to 6:29 AM | 3,826 (10.8%) | 1,623 (5.9%) |
| 6:30 AM to 6:59 AM | 3,300 (9.3%) | 2,246 (8.2%) |
| 7:00 AM to 7:29 AM | 4,013 (11.3%) | 3,393 (12.3%) |
| 7:30 AM to 7:59 AM | 3,502 (9.9%) | 3,391 (12.3%) |
| 8:00 AM to 8:29 AM | 3,042 (8.6%) | 2,631 (9.5%) |
| 8:30 AM to 8:59 AM | 1,573 (4.4%) | 1,783 (6.5%) |
| 9:00 AM to 9:59 AM | 1,615 (4.6%) | 2,002 (7.3%) |
| 10:00 AM to 10:59 AM | 1,042 (2.9%) | 917 (3.3%) |
| 11:00 AM to 11:59 AM | 174 (0.5%) | 555 (2.0%) |
| 12:00 PM to 3:59 PM | 3,721 (10.5%) | 2,546 (9.2%) |
| 4:00 PM to 11:59 PM | 2,723 (7.7%) | 2,242 (8.1%) |
| Total | 35,391 (100.0%) | 27,566 (100.0%) |
Housing Occupancy in West Valley City
Occupancy by Ownership in West Valley City
Of the total 38,838 dwellings in West Valley City, owner-occupied units account for 27,607 (71.1%), while renter-occupied units make up 11,231 (28.9%).
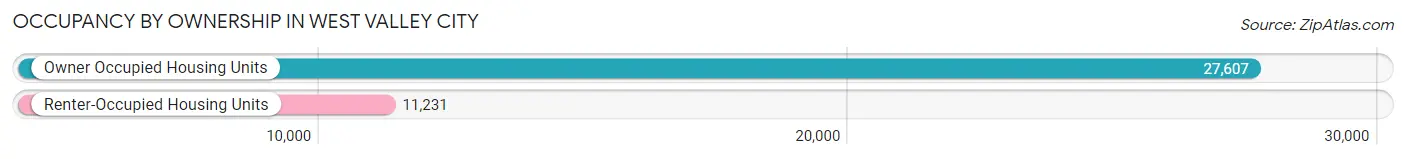
| Occupancy | # Housing Units | % Housing Units |
| Owner Occupied Housing Units | 27,607 | 71.1% |
| Renter-Occupied Housing Units | 11,231 | 28.9% |
| Total Occupied Housing Units | 38,838 | 100.0% |
Occupancy by Household Size in West Valley City
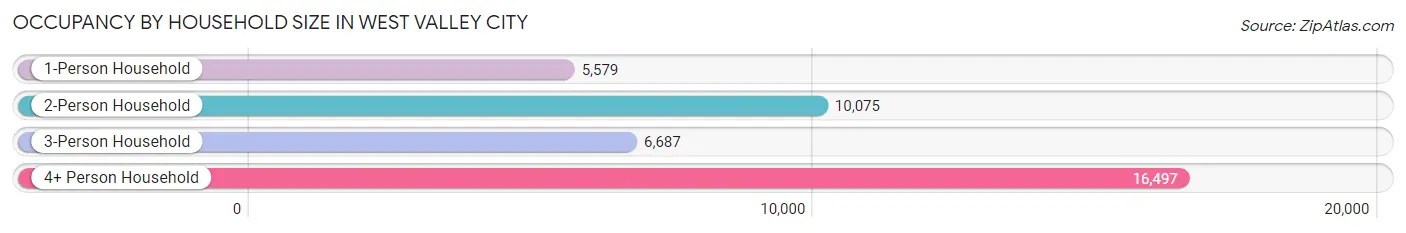
| Household Size | # Housing Units | % Housing Units |
| 1-Person Household | 5,579 | 14.4% |
| 2-Person Household | 10,075 | 25.9% |
| 3-Person Household | 6,687 | 17.2% |
| 4+ Person Household | 16,497 | 42.5% |
| Total Housing Units | 38,838 | 100.0% |
Occupancy by Ownership by Household Size in West Valley City
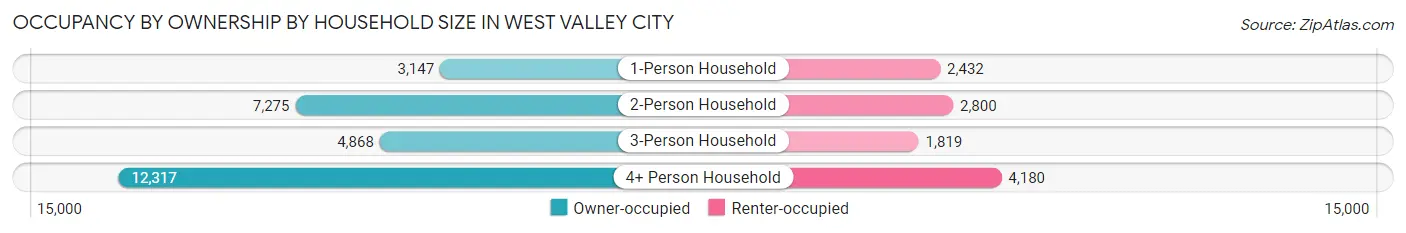
| Household Size | Owner-occupied | Renter-occupied |
| 1-Person Household | 3,147 (56.4%) | 2,432 (43.6%) |
| 2-Person Household | 7,275 (72.2%) | 2,800 (27.8%) |
| 3-Person Household | 4,868 (72.8%) | 1,819 (27.2%) |
| 4+ Person Household | 12,317 (74.7%) | 4,180 (25.3%) |
| Total Housing Units | 27,607 (71.1%) | 11,231 (28.9%) |
Occupancy by Educational Attainment in West Valley City
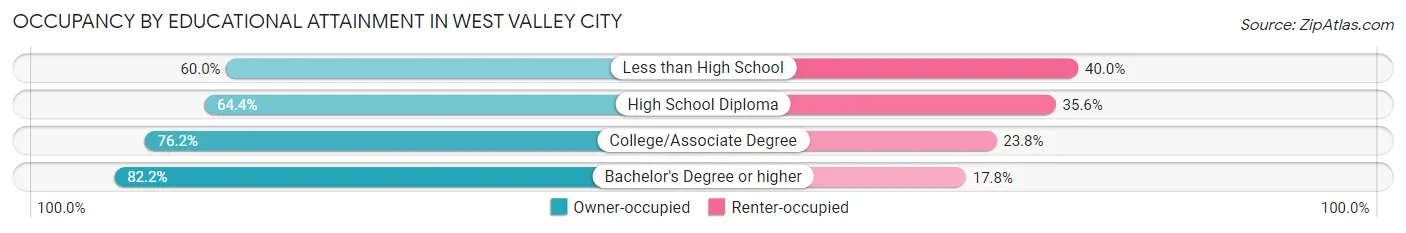
| Household Size | Owner-occupied | Renter-occupied |
| Less than High School | 3,369 (60.0%) | 2,248 (40.0%) |
| High School Diploma | 8,008 (64.4%) | 4,423 (35.6%) |
| College/Associate Degree | 10,921 (76.2%) | 3,413 (23.8%) |
| Bachelor's Degree or higher | 5,309 (82.2%) | 1,147 (17.8%) |
Occupancy by Age of Householder in West Valley City
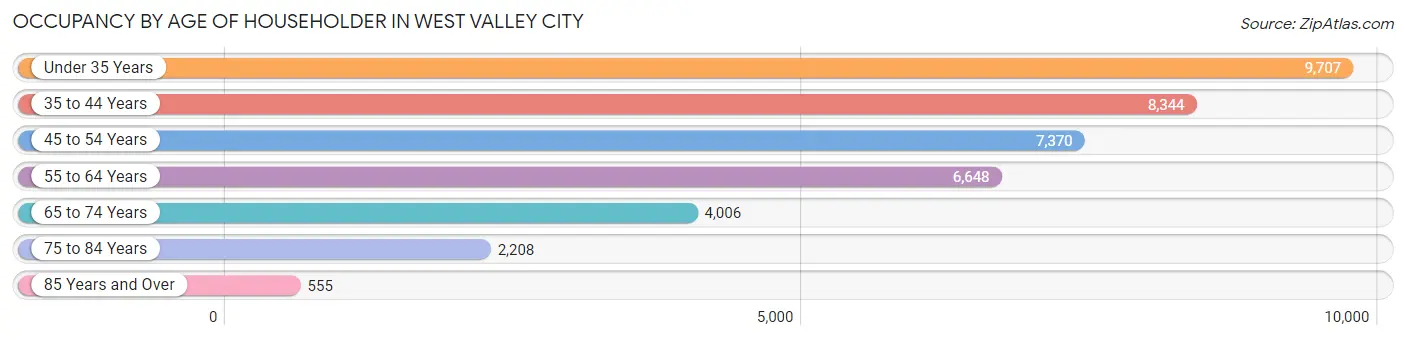
| Age Bracket | # Households | % Households |
| Under 35 Years | 9,707 | 25.0% |
| 35 to 44 Years | 8,344 | 21.5% |
| 45 to 54 Years | 7,370 | 19.0% |
| 55 to 64 Years | 6,648 | 17.1% |
| 65 to 74 Years | 4,006 | 10.3% |
| 75 to 84 Years | 2,208 | 5.7% |
| 85 Years and Over | 555 | 1.4% |
| Total | 38,838 | 100.0% |
Housing Finances in West Valley City
Median Income by Occupancy in West Valley City
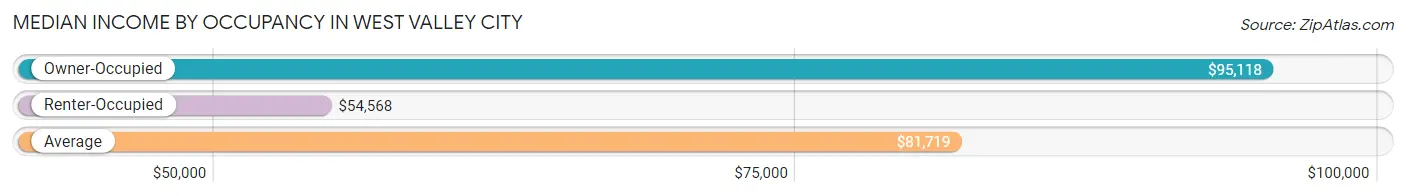
| Occupancy Type | # Households | Median Income |
| Owner-Occupied | 27,607 (71.1%) | $95,118 |
| Renter-Occupied | 11,231 (28.9%) | $54,568 |
| Average | 38,838 (100.0%) | $81,719 |
Occupancy by Householder Income Bracket in West Valley City
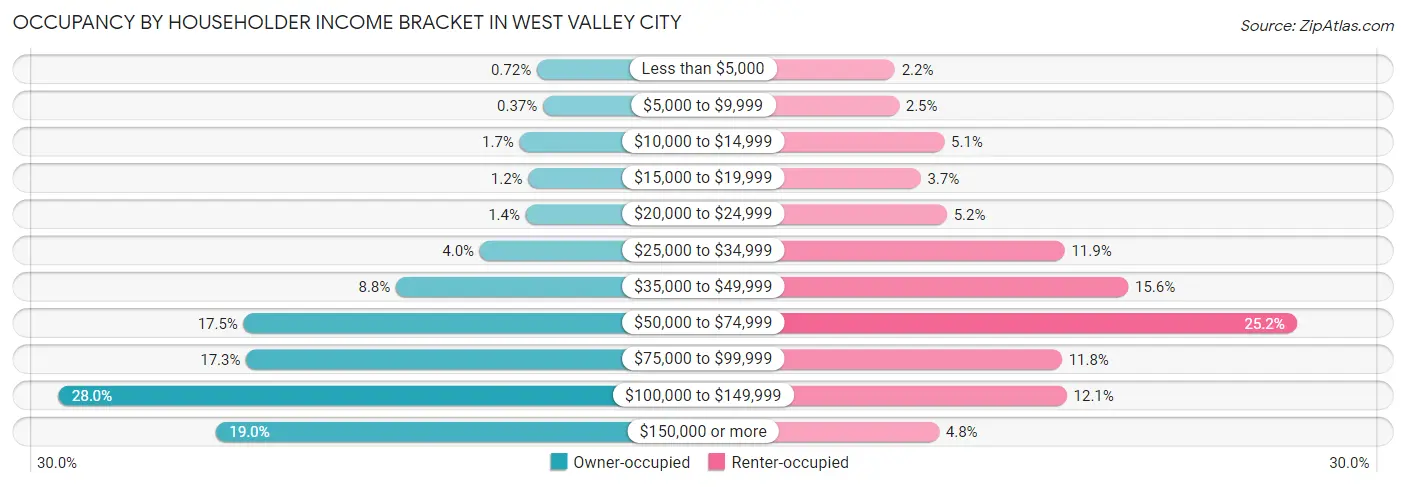
| Income Bracket | Owner-occupied | Renter-occupied |
| Less than $5,000 | 198 (0.7%) | 252 (2.2%) |
| $5,000 to $9,999 | 101 (0.4%) | 277 (2.5%) |
| $10,000 to $14,999 | 473 (1.7%) | 568 (5.1%) |
| $15,000 to $19,999 | 333 (1.2%) | 417 (3.7%) |
| $20,000 to $24,999 | 376 (1.4%) | 585 (5.2%) |
| $25,000 to $34,999 | 1,099 (4.0%) | 1,341 (11.9%) |
| $35,000 to $49,999 | 2,420 (8.8%) | 1,749 (15.6%) |
| $50,000 to $74,999 | 4,827 (17.5%) | 2,830 (25.2%) |
| $75,000 to $99,999 | 4,784 (17.3%) | 1,323 (11.8%) |
| $100,000 to $149,999 | 7,740 (28.0%) | 1,354 (12.1%) |
| $150,000 or more | 5,256 (19.0%) | 535 (4.8%) |
| Total | 27,607 (100.0%) | 11,231 (100.0%) |
Monthly Housing Cost Tiers in West Valley City
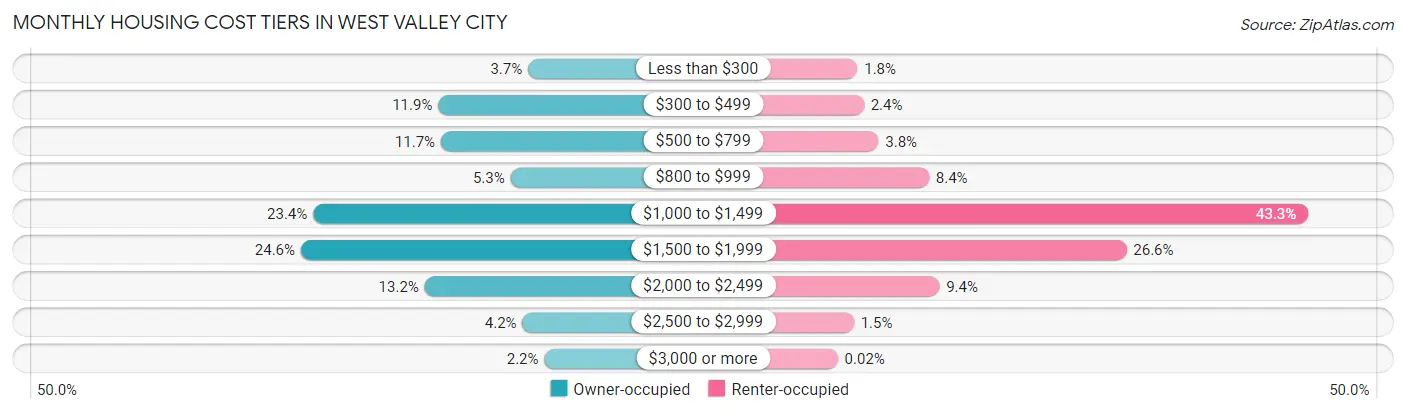
| Monthly Cost | Owner-occupied | Renter-occupied |
| Less than $300 | 1,008 (3.6%) | 205 (1.8%) |
| $300 to $499 | 3,292 (11.9%) | 272 (2.4%) |
| $500 to $799 | 3,223 (11.7%) | 423 (3.8%) |
| $800 to $999 | 1,451 (5.3%) | 946 (8.4%) |
| $1,000 to $1,499 | 6,472 (23.4%) | 4,866 (43.3%) |
| $1,500 to $1,999 | 6,783 (24.6%) | 2,988 (26.6%) |
| $2,000 to $2,499 | 3,635 (13.2%) | 1,052 (9.4%) |
| $2,500 to $2,999 | 1,150 (4.2%) | 168 (1.5%) |
| $3,000 or more | 593 (2.1%) | 2 (0.0%) |
| Total | 27,607 (100.0%) | 11,231 (100.0%) |
Physical Housing Characteristics in West Valley City
Housing Structures in West Valley City
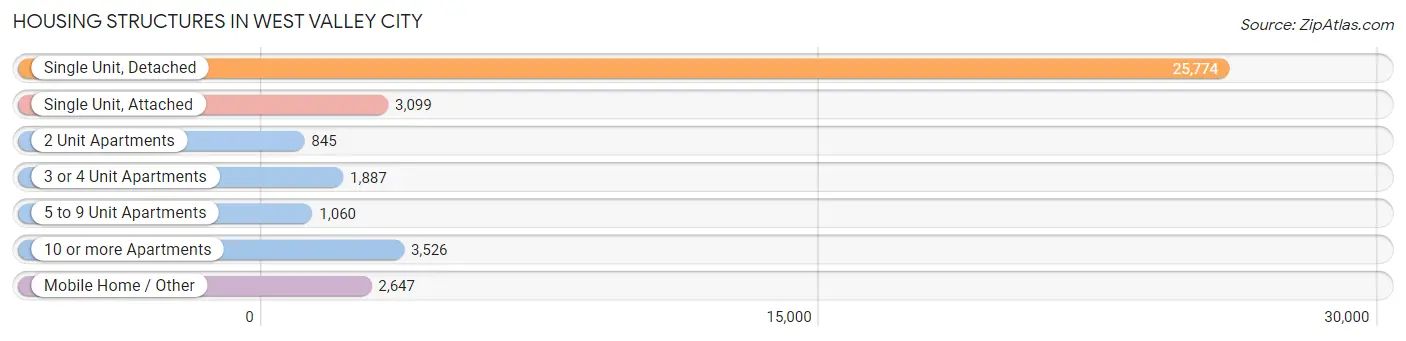
| Structure Type | # Housing Units | % Housing Units |
| Single Unit, Detached | 25,774 | 66.4% |
| Single Unit, Attached | 3,099 | 8.0% |
| 2 Unit Apartments | 845 | 2.2% |
| 3 or 4 Unit Apartments | 1,887 | 4.9% |
| 5 to 9 Unit Apartments | 1,060 | 2.7% |
| 10 or more Apartments | 3,526 | 9.1% |
| Mobile Home / Other | 2,647 | 6.8% |
| Total | 38,838 | 100.0% |
Housing Structures by Occupancy in West Valley City
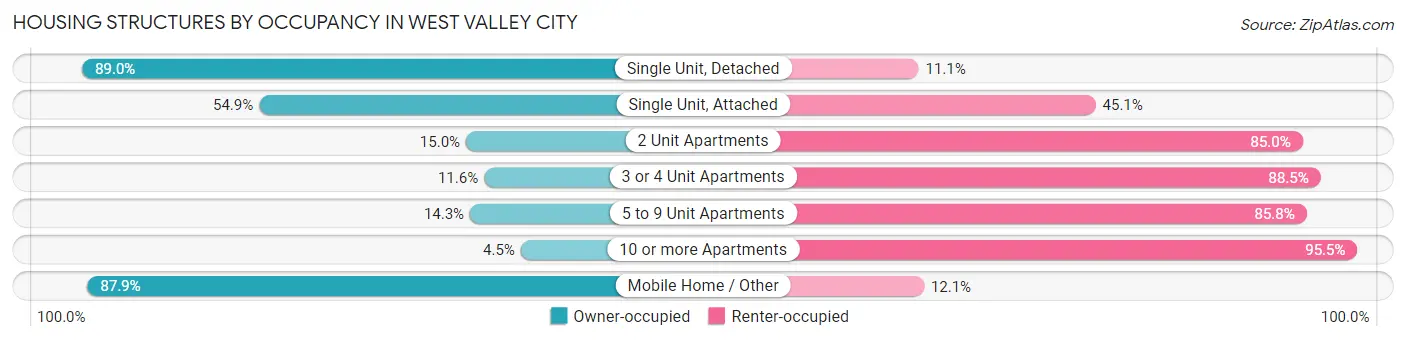
| Structure Type | Owner-occupied | Renter-occupied |
| Single Unit, Detached | 22,926 (88.9%) | 2,848 (11.1%) |
| Single Unit, Attached | 1,700 (54.9%) | 1,399 (45.1%) |
| 2 Unit Apartments | 127 (15.0%) | 718 (85.0%) |
| 3 or 4 Unit Apartments | 218 (11.6%) | 1,669 (88.4%) |
| 5 to 9 Unit Apartments | 151 (14.2%) | 909 (85.8%) |
| 10 or more Apartments | 158 (4.5%) | 3,368 (95.5%) |
| Mobile Home / Other | 2,327 (87.9%) | 320 (12.1%) |
| Total | 27,607 (71.1%) | 11,231 (28.9%) |
Housing Structures by Number of Rooms in West Valley City
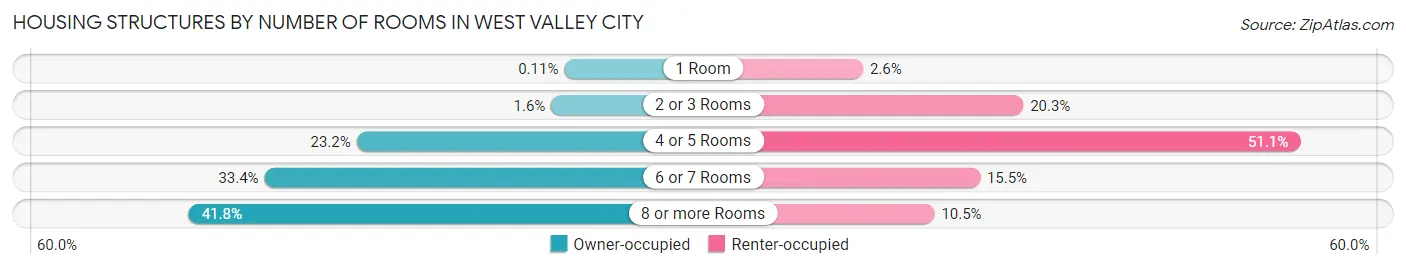
| Number of Rooms | Owner-occupied | Renter-occupied |
| 1 Room | 31 (0.1%) | 288 (2.6%) |
| 2 or 3 Rooms | 432 (1.6%) | 2,284 (20.3%) |
| 4 or 5 Rooms | 6,395 (23.2%) | 5,736 (51.1%) |
| 6 or 7 Rooms | 9,214 (33.4%) | 1,745 (15.5%) |
| 8 or more Rooms | 11,535 (41.8%) | 1,178 (10.5%) |
| Total | 27,607 (100.0%) | 11,231 (100.0%) |
Housing Structure by Heating Type in West Valley City
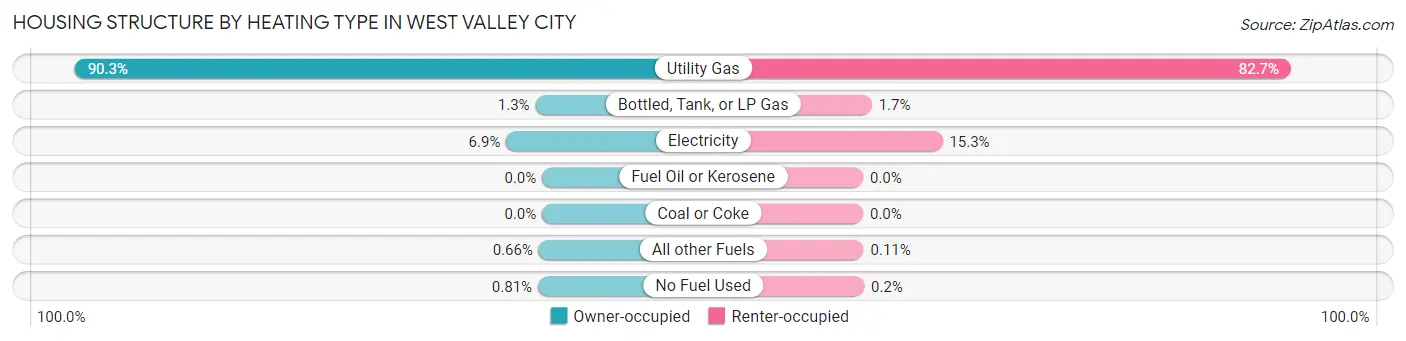
| Heating Type | Owner-occupied | Renter-occupied |
| Utility Gas | 24,931 (90.3%) | 9,284 (82.7%) |
| Bottled, Tank, or LP Gas | 355 (1.3%) | 189 (1.7%) |
| Electricity | 1,914 (6.9%) | 1,723 (15.3%) |
| Fuel Oil or Kerosene | 0 (0.0%) | 0 (0.0%) |
| Coal or Coke | 0 (0.0%) | 0 (0.0%) |
| All other Fuels | 183 (0.7%) | 12 (0.1%) |
| No Fuel Used | 224 (0.8%) | 23 (0.2%) |
| Total | 27,607 (100.0%) | 11,231 (100.0%) |
Household Vehicle Usage in West Valley City
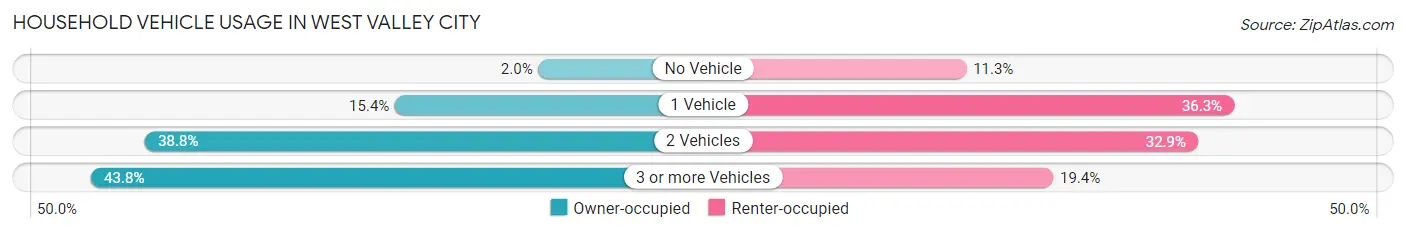
| Vehicles per Household | Owner-occupied | Renter-occupied |
| No Vehicle | 561 (2.0%) | 1,271 (11.3%) |
| 1 Vehicle | 4,253 (15.4%) | 4,078 (36.3%) |
| 2 Vehicles | 10,700 (38.8%) | 3,700 (32.9%) |
| 3 or more Vehicles | 12,093 (43.8%) | 2,182 (19.4%) |
| Total | 27,607 (100.0%) | 11,231 (100.0%) |
Real Estate & Mortgages in West Valley City
Real Estate and Mortgage Overview in West Valley City
| Characteristic | Without Mortgage | With Mortgage |
| Housing Units | 7,990 | 19,617 |
| Median Property Value | $303,400 | $345,600 |
| Median Household Income | $71,569 | $4,241 |
| Monthly Housing Costs | $497 | $593 |
| Real Estate Taxes | $2,143 | $641 |
Property Value by Mortgage Status in West Valley City
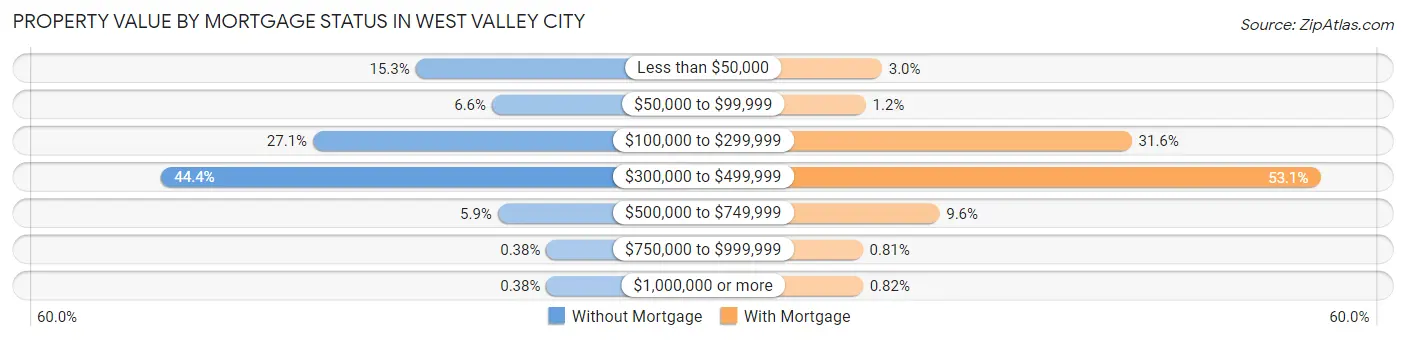
| Property Value | Without Mortgage | With Mortgage |
| Less than $50,000 | 1,224 (15.3%) | 588 (3.0%) |
| $50,000 to $99,999 | 527 (6.6%) | 225 (1.1%) |
| $100,000 to $299,999 | 2,161 (27.1%) | 6,189 (31.6%) |
| $300,000 to $499,999 | 3,544 (44.4%) | 10,419 (53.1%) |
| $500,000 to $749,999 | 474 (5.9%) | 1,877 (9.6%) |
| $750,000 to $999,999 | 30 (0.4%) | 158 (0.8%) |
| $1,000,000 or more | 30 (0.4%) | 161 (0.8%) |
| Total | 7,990 (100.0%) | 19,617 (100.0%) |
Household Income by Mortgage Status in West Valley City
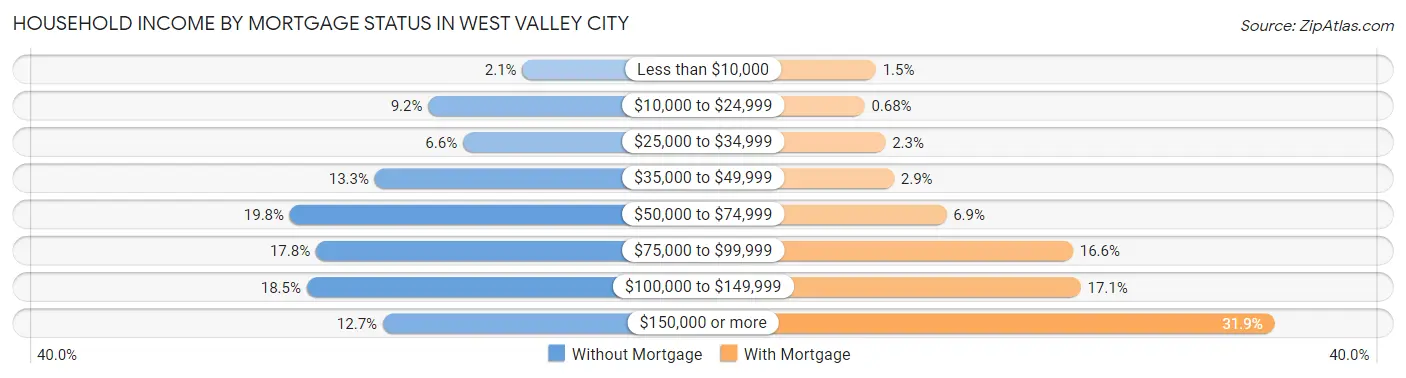
| Household Income | Without Mortgage | With Mortgage |
| Less than $10,000 | 165 (2.1%) | 302 (1.5%) |
| $10,000 to $24,999 | 738 (9.2%) | 134 (0.7%) |
| $25,000 to $34,999 | 527 (6.6%) | 444 (2.3%) |
| $35,000 to $49,999 | 1,064 (13.3%) | 572 (2.9%) |
| $50,000 to $74,999 | 1,581 (19.8%) | 1,356 (6.9%) |
| $75,000 to $99,999 | 1,422 (17.8%) | 3,246 (16.6%) |
| $100,000 to $149,999 | 1,478 (18.5%) | 3,362 (17.1%) |
| $150,000 or more | 1,015 (12.7%) | 6,262 (31.9%) |
| Total | 7,990 (100.0%) | 19,617 (100.0%) |
Property Value to Household Income Ratio in West Valley City
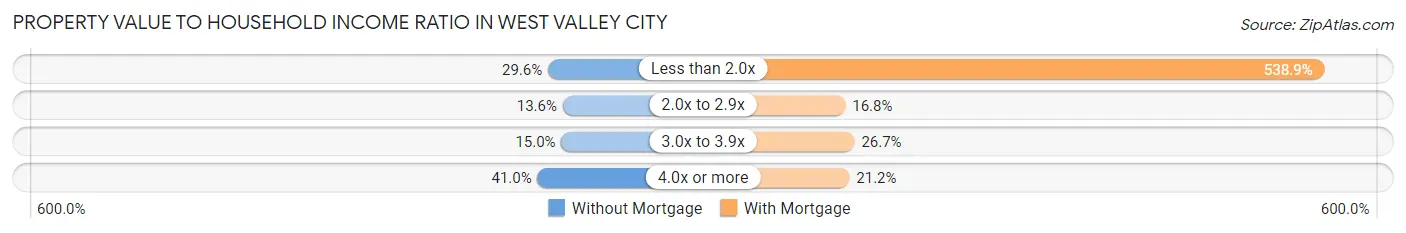
| Value-to-Income Ratio | Without Mortgage | With Mortgage |
| Less than 2.0x | 2,365 (29.6%) | 105,719 (538.9%) |
| 2.0x to 2.9x | 1,084 (13.6%) | 3,294 (16.8%) |
| 3.0x to 3.9x | 1,200 (15.0%) | 5,239 (26.7%) |
| 4.0x or more | 3,279 (41.0%) | 4,155 (21.2%) |
| Total | 7,990 (100.0%) | 19,617 (100.0%) |
Real Estate Taxes by Mortgage Status in West Valley City
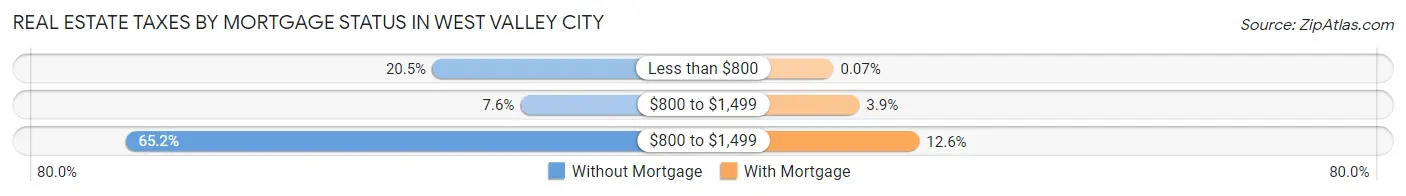
| Property Taxes | Without Mortgage | With Mortgage |
| Less than $800 | 1,636 (20.5%) | 14 (0.1%) |
| $800 to $1,499 | 606 (7.6%) | 756 (3.8%) |
| $800 to $1,499 | 5,213 (65.2%) | 2,476 (12.6%) |
| Total | 7,990 (100.0%) | 19,617 (100.0%) |
Health & Disability in West Valley City
Health Insurance Coverage by Age in West Valley City
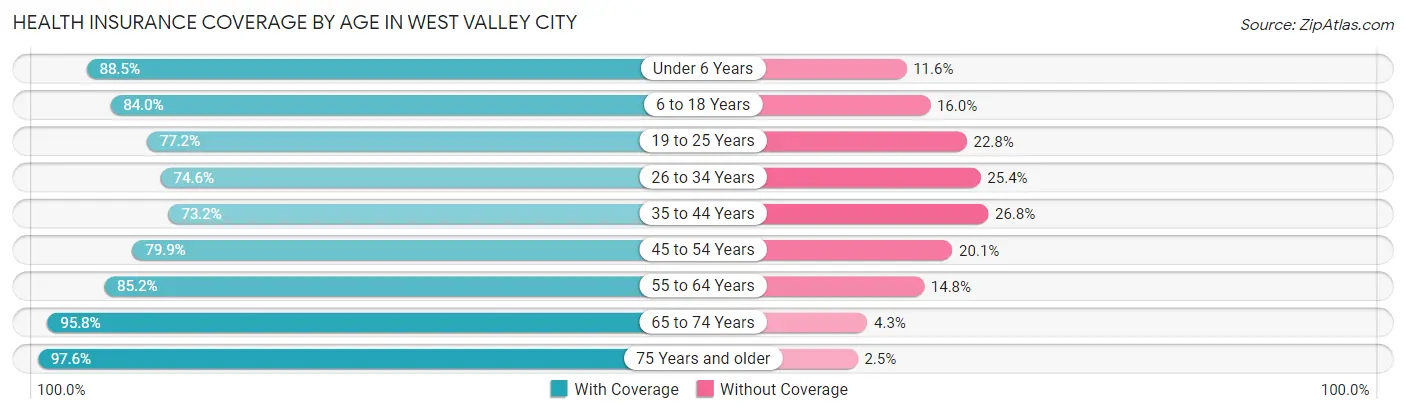
| Age Bracket | With Coverage | Without Coverage |
| Under 6 Years | 11,728 (88.4%) | 1,532 (11.6%) |
| 6 to 18 Years | 27,207 (84.0%) | 5,173 (16.0%) |
| 19 to 25 Years | 10,960 (77.2%) | 3,236 (22.8%) |
| 26 to 34 Years | 14,471 (74.6%) | 4,923 (25.4%) |
| 35 to 44 Years | 13,592 (73.2%) | 4,979 (26.8%) |
| 45 to 54 Years | 11,853 (79.9%) | 2,983 (20.1%) |
| 55 to 64 Years | 11,388 (85.2%) | 1,984 (14.8%) |
| 65 to 74 Years | 7,068 (95.8%) | 314 (4.3%) |
| 75 Years and older | 4,854 (97.6%) | 122 (2.5%) |
| Total | 113,121 (81.8%) | 25,246 (18.2%) |
Health Insurance Coverage by Citizenship Status in West Valley City
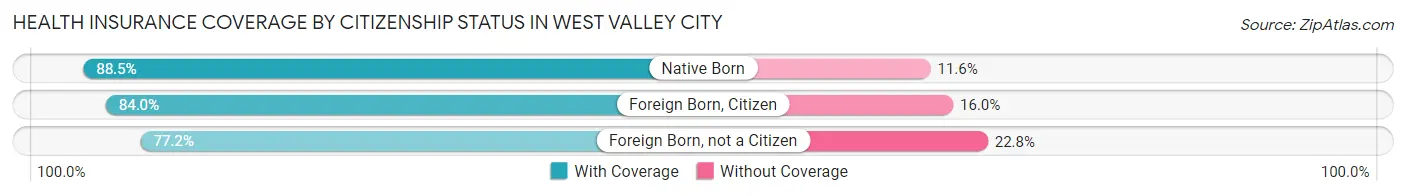
| Citizenship Status | With Coverage | Without Coverage |
| Native Born | 11,728 (88.4%) | 1,532 (11.6%) |
| Foreign Born, Citizen | 27,207 (84.0%) | 5,173 (16.0%) |
| Foreign Born, not a Citizen | 10,960 (77.2%) | 3,236 (22.8%) |
Health Insurance Coverage by Household Income in West Valley City
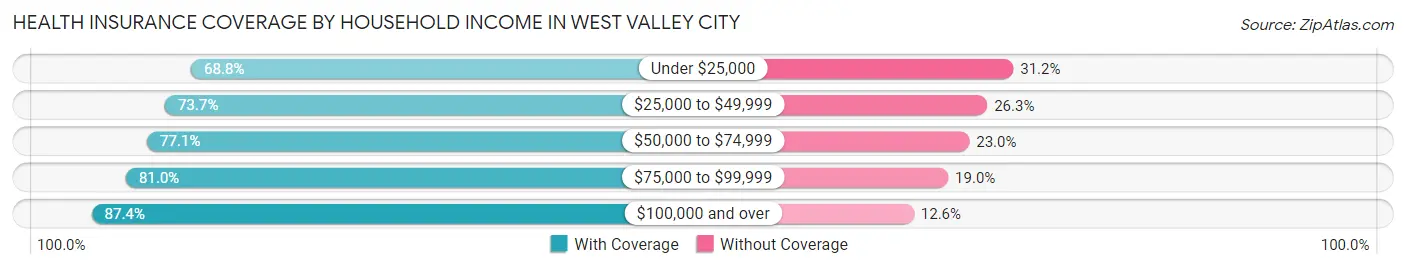
| Household Income | With Coverage | Without Coverage |
| Under $25,000 | 5,074 (68.8%) | 2,300 (31.2%) |
| $25,000 to $49,999 | 13,508 (73.7%) | 4,823 (26.3%) |
| $50,000 to $74,999 | 19,106 (77.0%) | 5,692 (23.0%) |
| $75,000 to $99,999 | 17,699 (81.0%) | 4,150 (19.0%) |
| $100,000 and over | 57,641 (87.4%) | 8,278 (12.6%) |
Public vs Private Health Insurance Coverage by Age in West Valley City
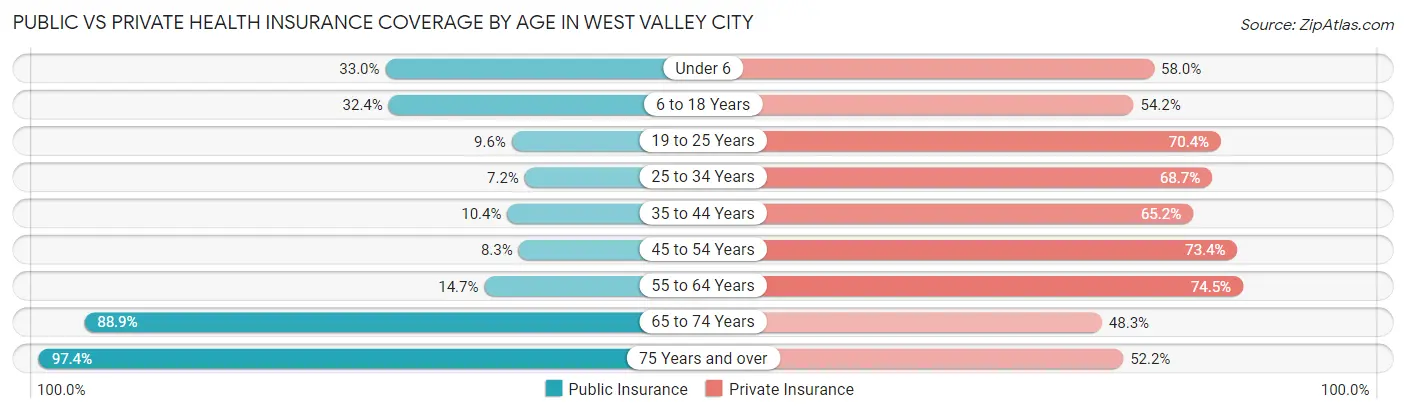
| Age Bracket | Public Insurance | Private Insurance |
| Under 6 | 4,381 (33.0%) | 7,685 (58.0%) |
| 6 to 18 Years | 10,500 (32.4%) | 17,533 (54.1%) |
| 19 to 25 Years | 1,362 (9.6%) | 9,989 (70.4%) |
| 25 to 34 Years | 1,393 (7.2%) | 13,328 (68.7%) |
| 35 to 44 Years | 1,934 (10.4%) | 12,104 (65.2%) |
| 45 to 54 Years | 1,234 (8.3%) | 10,894 (73.4%) |
| 55 to 64 Years | 1,963 (14.7%) | 9,955 (74.5%) |
| 65 to 74 Years | 6,564 (88.9%) | 3,564 (48.3%) |
| 75 Years and over | 4,844 (97.4%) | 2,599 (52.2%) |
| Total | 34,175 (24.7%) | 87,651 (63.3%) |
Disability Status by Sex by Age in West Valley City
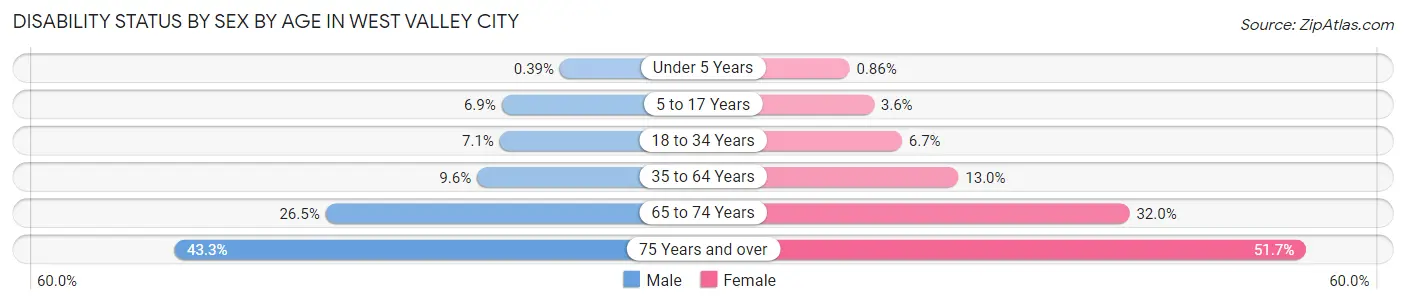
| Age Bracket | Male | Female |
| Under 5 Years | 24 (0.4%) | 46 (0.9%) |
| 5 to 17 Years | 1,077 (6.9%) | 572 (3.6%) |
| 18 to 34 Years | 1,301 (7.1%) | 1,188 (6.7%) |
| 35 to 64 Years | 2,310 (9.6%) | 2,955 (13.0%) |
| 65 to 74 Years | 942 (26.5%) | 1,226 (32.0%) |
| 75 Years and over | 956 (43.3%) | 1,432 (51.7%) |
Disability Class by Sex by Age in West Valley City
Disability Class: Hearing Difficulty
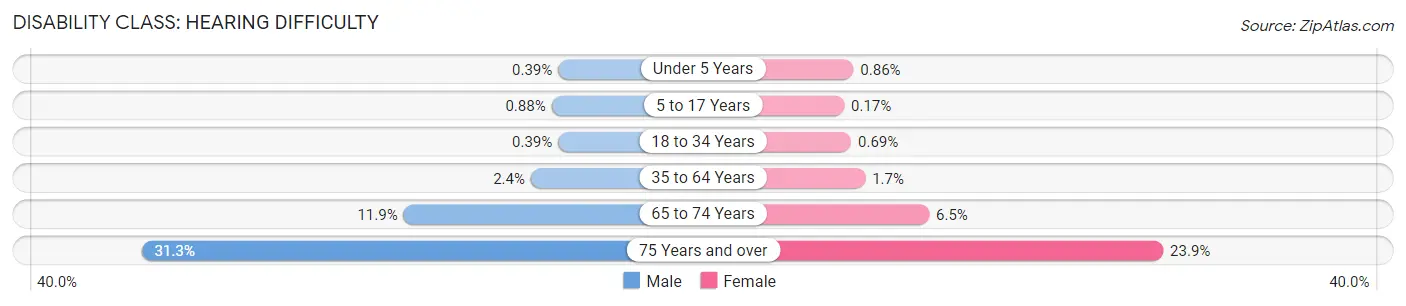
| Age Bracket | Male | Female |
| Under 5 Years | 24 (0.4%) | 46 (0.9%) |
| 5 to 17 Years | 138 (0.9%) | 28 (0.2%) |
| 18 to 34 Years | 72 (0.4%) | 122 (0.7%) |
| 35 to 64 Years | 581 (2.4%) | 396 (1.7%) |
| 65 to 74 Years | 422 (11.9%) | 248 (6.5%) |
| 75 Years and over | 691 (31.3%) | 661 (23.9%) |
Disability Class: Vision Difficulty
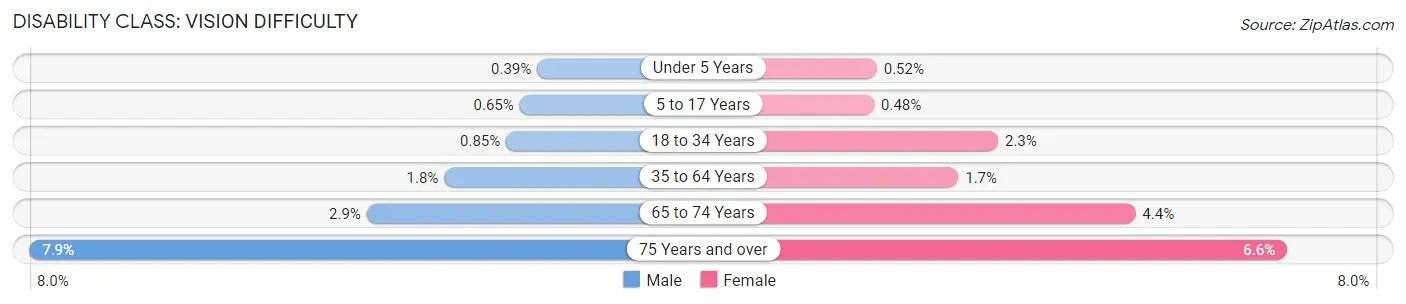
| Age Bracket | Male | Female |
| Under 5 Years | 24 (0.4%) | 28 (0.5%) |
| 5 to 17 Years | 101 (0.6%) | 77 (0.5%) |
| 18 to 34 Years | 155 (0.9%) | 412 (2.3%) |
| 35 to 64 Years | 425 (1.8%) | 394 (1.7%) |
| 65 to 74 Years | 104 (2.9%) | 167 (4.4%) |
| 75 Years and over | 175 (7.9%) | 183 (6.6%) |
Disability Class: Cognitive Difficulty
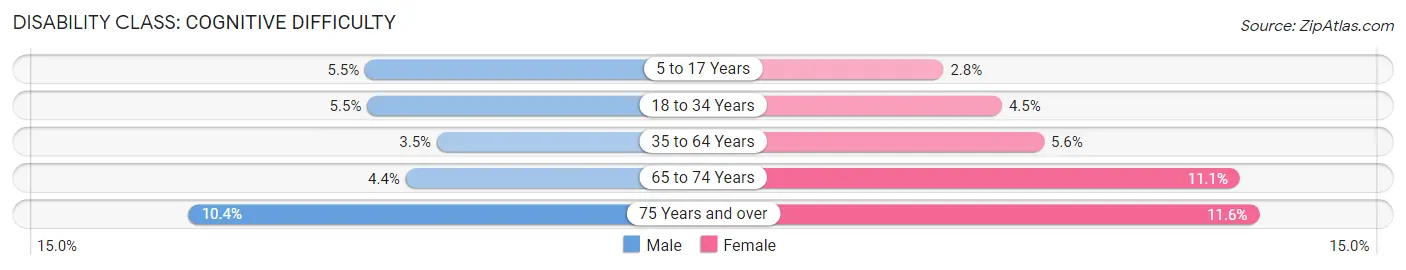
| Age Bracket | Male | Female |
| 5 to 17 Years | 863 (5.5%) | 453 (2.8%) |
| 18 to 34 Years | 1,001 (5.5%) | 792 (4.5%) |
| 35 to 64 Years | 845 (3.5%) | 1,281 (5.6%) |
| 65 to 74 Years | 156 (4.4%) | 424 (11.1%) |
| 75 Years and over | 230 (10.4%) | 322 (11.6%) |
Disability Class: Ambulatory Difficulty
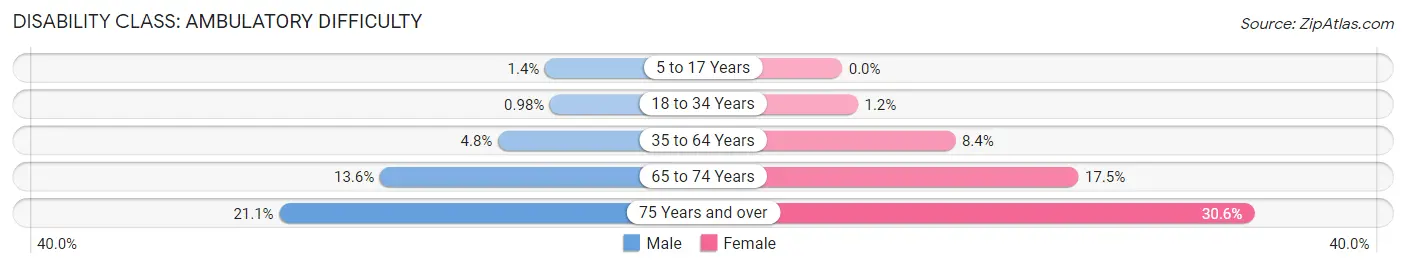
| Age Bracket | Male | Female |
| 5 to 17 Years | 211 (1.3%) | 0 (0.0%) |
| 18 to 34 Years | 179 (1.0%) | 207 (1.2%) |
| 35 to 64 Years | 1,162 (4.8%) | 1,913 (8.4%) |
| 65 to 74 Years | 484 (13.6%) | 671 (17.5%) |
| 75 Years and over | 465 (21.1%) | 848 (30.6%) |
Disability Class: Self-Care Difficulty
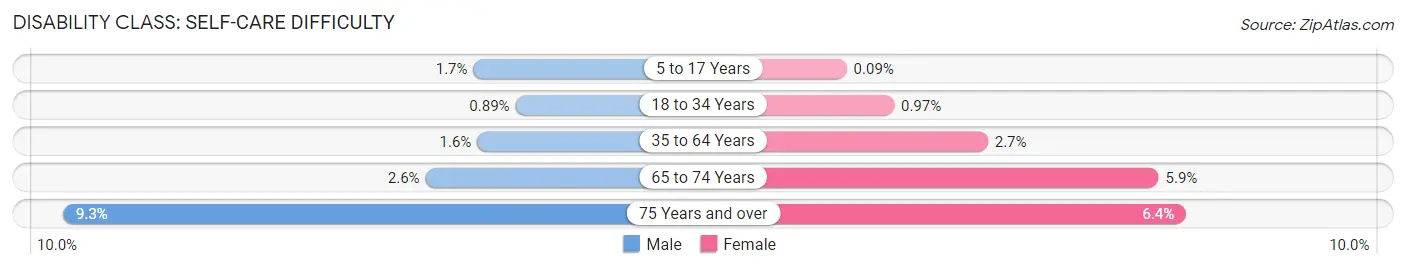
| Age Bracket | Male | Female |
| 5 to 17 Years | 262 (1.7%) | 14 (0.1%) |
| 18 to 34 Years | 164 (0.9%) | 173 (1.0%) |
| 35 to 64 Years | 383 (1.6%) | 618 (2.7%) |
| 65 to 74 Years | 91 (2.6%) | 225 (5.9%) |
| 75 Years and over | 205 (9.3%) | 177 (6.4%) |
Technology Access in West Valley City
Computing Device Access in West Valley City
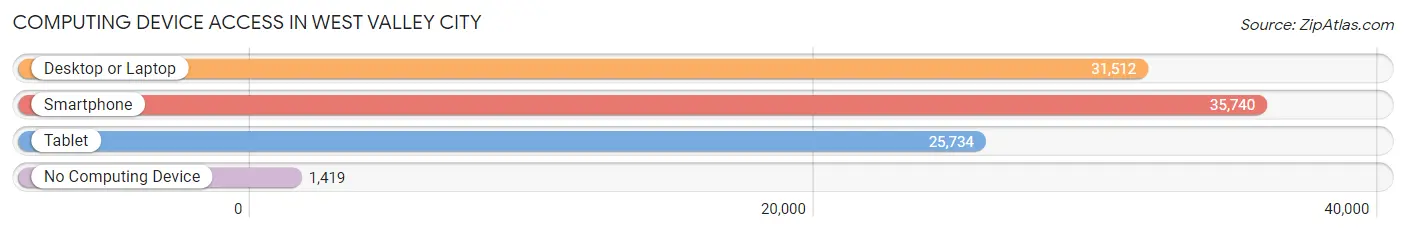
| Device Type | # Households | % Households |
| Desktop or Laptop | 31,512 | 81.1% |
| Smartphone | 35,740 | 92.0% |
| Tablet | 25,734 | 66.3% |
| No Computing Device | 1,419 | 3.6% |
| Total | 38,838 | 100.0% |
Internet Access in West Valley City
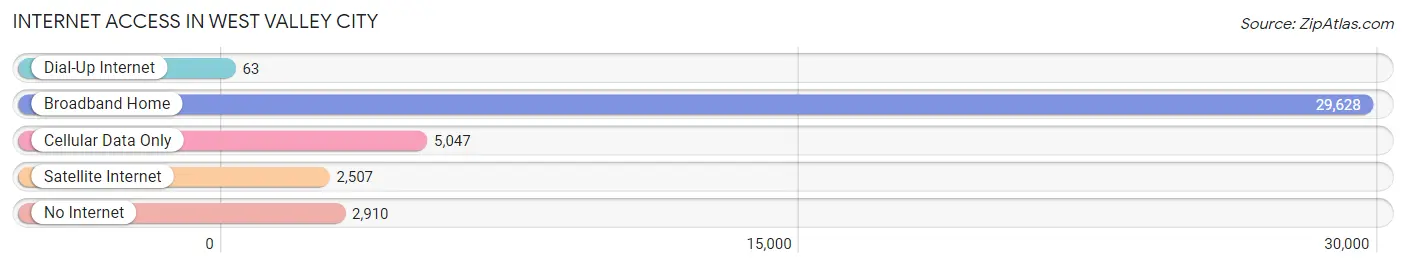
| Internet Type | # Households | % Households |
| Dial-Up Internet | 63 | 0.2% |
| Broadband Home | 29,628 | 76.3% |
| Cellular Data Only | 5,047 | 13.0% |
| Satellite Internet | 2,507 | 6.5% |
| No Internet | 2,910 | 7.5% |
| Total | 38,838 | 100.0% |
West Valley City Summary
Introduction
West Valley City is a city located in Salt Lake County, Utah, United States. It is the second largest city in the state of Utah, with a population of 129,480 as of the 2010 census. The city is part of the Salt Lake City metropolitan area, which has a population of 1,124,197. West Valley City is located in the western part of the Salt Lake Valley, and is bordered by the cities of Taylorsville, Kearns, Magna, and West Jordan.
History
West Valley City was incorporated in 1980, and is the result of a merger between the cities of Granger and Hunter. The two cities had been growing rapidly since the 1950s, and the merger was seen as a way to provide better services to the residents of the area.
The city was named after the nearby West Valley, which was originally known as Granger Valley. The name was changed to West Valley in the late 1800s, when the area was settled by Mormon pioneers.
Geography
West Valley City is located in the western part of the Salt Lake Valley, and is bordered by the cities of Taylorsville, Kearns, Magna, and West Jordan. The city covers an area of approximately 35 square miles, and is located at an elevation of 4,300 feet.
The city is located in a semi-arid climate, with hot summers and cold winters. The average annual temperature is around 50 degrees Fahrenheit, and the average annual precipitation is around 15 inches.
Economy
West Valley City is home to a variety of businesses and industries, including manufacturing, retail, healthcare, and technology. The city is also home to the Valley Fair Mall, which is the largest shopping mall in the state of Utah.
The city is also home to the Utah Olympic Oval, which was built for the 2002 Winter Olympics. The oval is now used for a variety of events, including speed skating, hockey, and figure skating.
Demographics
As of the 2010 census, West Valley City had a population of 129,480. The racial makeup of the city was 73.3% White, 4.2% African American, 1.2% Native American, 5.7% Asian, 0.3% Pacific Islander, 11.2% from other races, and 4.3% from two or more races. Hispanic or Latino of any race were 22.3% of the population.
The median income for a household in the city was $50,945, and the median income for a family was $56,945. The per capita income for the city was $21,945.
Conclusion
West Valley City is a vibrant and growing city located in Salt Lake County, Utah. The city has a rich history, and is home to a variety of businesses and industries. The city is also home to the Valley Fair Mall, and the Utah Olympic Oval. The population of the city is diverse, with a variety of racial and ethnic backgrounds. The median income for a household in the city is $50,945, and the per capita income is $21,945. West Valley City is an exciting and vibrant city, and is a great place to live and work.
Common Questions
What is Per Capita Income in West Valley City?
Per Capita income in West Valley City is $27,259.
What is the Median Family Income in West Valley City?
Median Family Income in West Valley City is $88,750.
What is the Median Household income in West Valley City?
Median Household Income in West Valley City is $81,719.
What is Income or Wage Gap in West Valley City?
Income or Wage Gap in West Valley City is 25.0%.
Women in West Valley City earn 75.0 cents for every dollar earned by a man.
What is Family Income Deficit in West Valley City?
Family Income Deficit in West Valley City is $9,618.
Families that are below poverty line in West Valley City earn $9,618 less on average than the poverty threshold level.
What is Inequality or Gini Index in West Valley City?
Inequality or Gini Index in West Valley City is 0.36.
What is the Total Population of West Valley City?
Total Population of West Valley City is 138,868.
What is the Total Male Population of West Valley City?
Total Male Population of West Valley City is 70,263.
What is the Total Female Population of West Valley City?
Total Female Population of West Valley City is 68,605.
What is the Ratio of Males per 100 Females in West Valley City?
There are 102.42 Males per 100 Females in West Valley City.
What is the Ratio of Females per 100 Males in West Valley City?
There are 97.64 Females per 100 Males in West Valley City.
What is the Median Population Age in West Valley City?
Median Population Age in West Valley City is 30.2 Years.
What is the Average Family Size in West Valley City
Average Family Size in West Valley City is 3.9 People.
What is the Average Household Size in West Valley City
Average Household Size in West Valley City is 3.6 People.
How Large is the Labor Force in West Valley City?
There are 73,013 People in the Labor Forcein in West Valley City.
What is the Percentage of People in the Labor Force in West Valley City?
72.2% of People are in the Labor Force in West Valley City.
What is the Unemployment Rate in West Valley City?
Unemployment Rate in West Valley City is 4.0%.