St Louis Park, MN Map & Demographics
St Louis Park Map
St Louis Park Overview
$60,434
PER CAPITA INCOME
$142,528
AVG FAMILY INCOME
$94,263
AVG HOUSEHOLD INCOME
21.3%
WAGE / INCOME GAP [ % ]
78.7¢/ $1
WAGE / INCOME GAP [ $ ]
0.43
INEQUALITY / GINI INDEX
49,500
TOTAL POPULATION
23,713
MALE POPULATION
25,787
FEMALE POPULATION
91.96
MALES / 100 FEMALES
108.75
FEMALES / 100 MALES
36.0
MEDIAN AGE
2.9
AVG FAMILY SIZE
2.0
AVG HOUSEHOLD SIZE
31,427
LABOR FORCE [ PEOPLE ]
75.8%
PERCENT IN LABOR FORCE
2.8%
UNEMPLOYMENT RATE
Income in St Louis Park
Income Overview in St Louis Park
Per Capita Income in St Louis Park is $60,434, while median incomes of families and households are $142,528 and $94,263 respectively.
| Characteristic | Number | Measure |
| Per Capita Income | 49,500 | $60,434 |
| Median Family Income | 10,708 | $142,528 |
| Mean Family Income | 10,708 | $161,973 |
| Median Household Income | 24,098 | $94,263 |
| Mean Household Income | 24,098 | $122,725 |
| Income Deficit | 10,708 | $0 |
| Wage / Income Gap (%) | 49,500 | 21.29% |
| Wage / Income Gap ($) | 49,500 | 78.71¢ per $1 |
| Gini / Inequality Index | 49,500 | 0.43 |
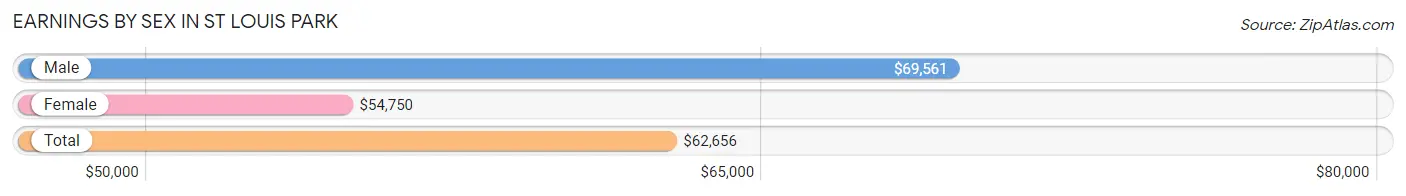
Earnings by Sex in St Louis Park
Average Earnings in St Louis Park are $62,656, $69,561 for men and $54,750 for women, a difference of 21.3%.
| Sex | Number | Average Earnings |
| Male | 15,711 (48.9%) | $69,561 |
| Female | 16,393 (51.1%) | $54,750 |
| Total | 32,104 (100.0%) | $62,656 |
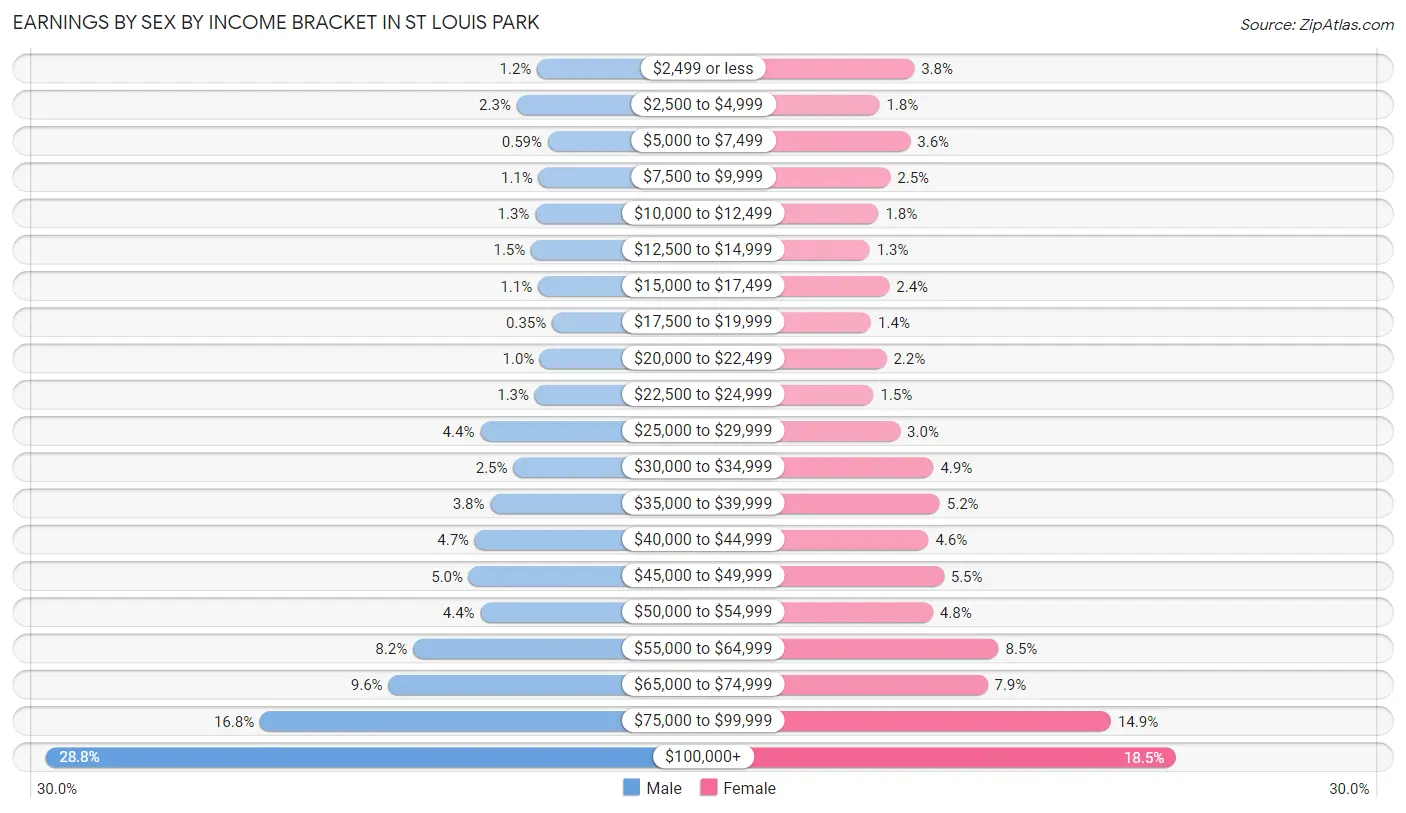
Earnings by Sex by Income Bracket in St Louis Park
The most common earnings brackets in St Louis Park are $100,000+ for men (4,521 | 28.8%) and $100,000+ for women (3,034 | 18.5%).
| Income | Male | Female |
| $2,499 or less | 187 (1.2%) | 621 (3.8%) |
| $2,500 to $4,999 | 368 (2.3%) | 302 (1.8%) |
| $5,000 to $7,499 | 93 (0.6%) | 586 (3.6%) |
| $7,500 to $9,999 | 174 (1.1%) | 402 (2.5%) |
| $10,000 to $12,499 | 205 (1.3%) | 292 (1.8%) |
| $12,500 to $14,999 | 240 (1.5%) | 211 (1.3%) |
| $15,000 to $17,499 | 179 (1.1%) | 391 (2.4%) |
| $17,500 to $19,999 | 55 (0.4%) | 225 (1.4%) |
| $20,000 to $22,499 | 161 (1.0%) | 365 (2.2%) |
| $22,500 to $24,999 | 208 (1.3%) | 246 (1.5%) |
| $25,000 to $29,999 | 689 (4.4%) | 491 (3.0%) |
| $30,000 to $34,999 | 398 (2.5%) | 799 (4.9%) |
| $35,000 to $39,999 | 600 (3.8%) | 857 (5.2%) |
| $40,000 to $44,999 | 737 (4.7%) | 753 (4.6%) |
| $45,000 to $49,999 | 790 (5.0%) | 894 (5.4%) |
| $50,000 to $54,999 | 688 (4.4%) | 794 (4.8%) |
| $55,000 to $64,999 | 1,284 (8.2%) | 1,399 (8.5%) |
| $65,000 to $74,999 | 1,500 (9.6%) | 1,296 (7.9%) |
| $75,000 to $99,999 | 2,634 (16.8%) | 2,435 (14.8%) |
| $100,000+ | 4,521 (28.8%) | 3,034 (18.5%) |
| Total | 15,711 (100.0%) | 16,393 (100.0%) |
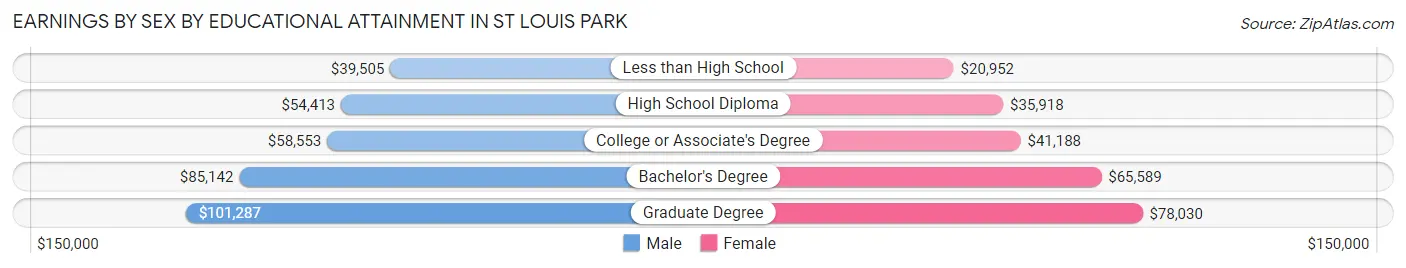
Earnings by Sex by Educational Attainment in St Louis Park
Average earnings in St Louis Park are $74,053 for men and $58,713 for women, a difference of 20.7%. Men with an educational attainment of graduate degree enjoy the highest average annual earnings of $101,287, while those with less than high school education earn the least with $39,505. Women with an educational attainment of graduate degree earn the most with the average annual earnings of $78,030, while those with less than high school education have the smallest earnings of $20,952.
| Educational Attainment | Male Income | Female Income |
| Less than High School | $39,505 | $20,952 |
| High School Diploma | $54,413 | $35,918 |
| College or Associate's Degree | $58,553 | $41,188 |
| Bachelor's Degree | $85,142 | $65,589 |
| Graduate Degree | $101,287 | $78,030 |
| Total | $74,053 | $58,713 |
Family Income in St Louis Park
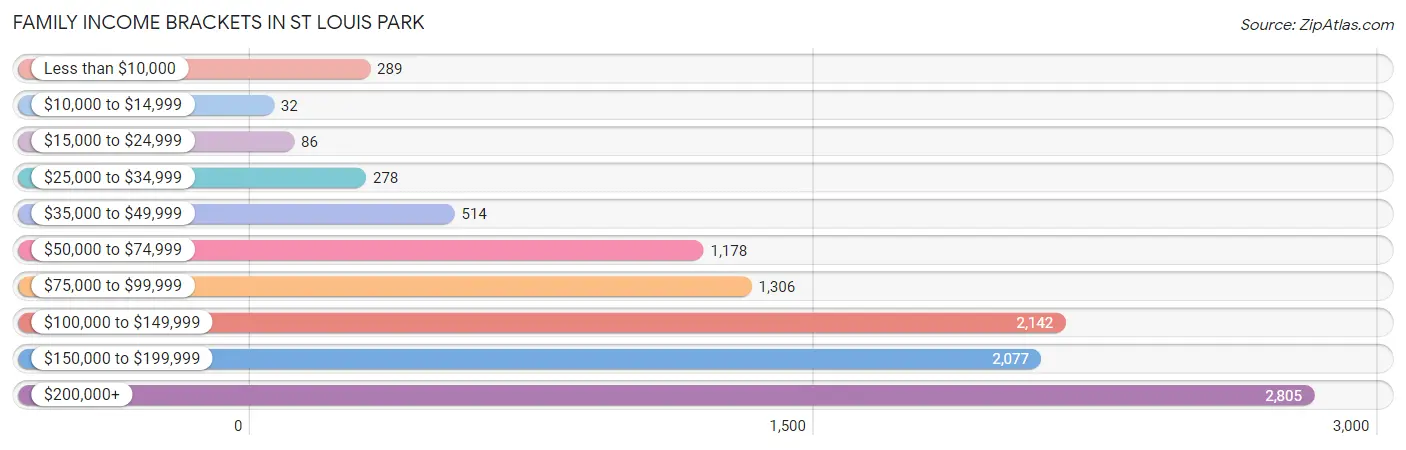
Family Income Brackets in St Louis Park
According to the St Louis Park family income data, there are 2,805 families falling into the $200,000+ income range, which is the most common income bracket and makes up 26.2% of all families. Conversely, the $10,000 to $14,999 income bracket is the least frequent group with only 32 families (0.3%) belonging to this category.
| Income Bracket | # Families | % Families |
| Less than $10,000 | 289 | 2.7% |
| $10,000 to $14,999 | 32 | 0.3% |
| $15,000 to $24,999 | 86 | 0.8% |
| $25,000 to $34,999 | 278 | 2.6% |
| $35,000 to $49,999 | 514 | 4.8% |
| $50,000 to $74,999 | 1,178 | 11.0% |
| $75,000 to $99,999 | 1,306 | 12.2% |
| $100,000 to $149,999 | 2,142 | 20.0% |
| $150,000 to $199,999 | 2,077 | 19.4% |
| $200,000+ | 2,805 | 26.2% |
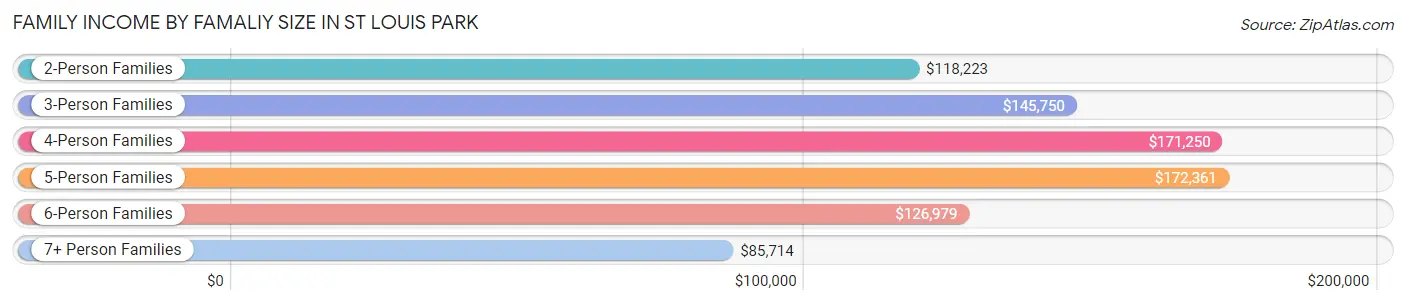
Family Income by Famaliy Size in St Louis Park
5-person families (635 | 5.9%) account for the highest median family income in St Louis Park with $172,361 per family, while 2-person families (5,647 | 52.7%) have the highest median income of $59,112 per family member.
| Income Bracket | # Families | Median Income |
| 2-Person Families | 5,647 (52.7%) | $118,223 |
| 3-Person Families | 2,369 (22.1%) | $145,750 |
| 4-Person Families | 1,841 (17.2%) | $171,250 |
| 5-Person Families | 635 (5.9%) | $172,361 |
| 6-Person Families | 116 (1.1%) | $126,979 |
| 7+ Person Families | 100 (0.9%) | $85,714 |
| Total | 10,708 (100.0%) | $142,528 |
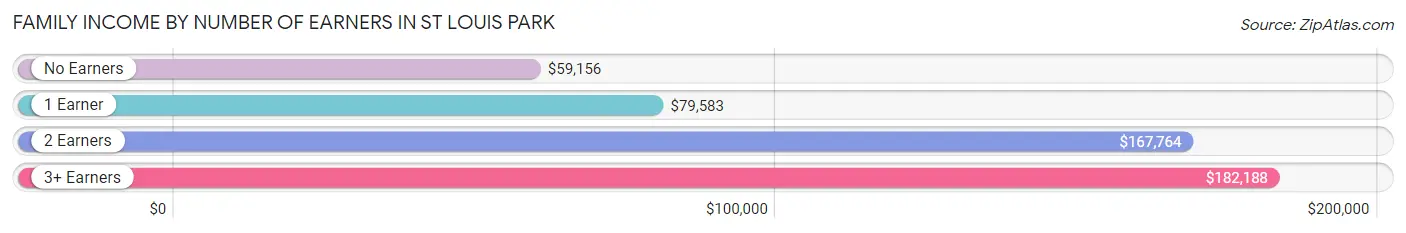
Family Income by Number of Earners in St Louis Park
The median family income in St Louis Park is $142,528, with families comprising 3+ earners (813) having the highest median family income of $182,188, while families with no earners (1,111) have the lowest median family income of $59,156, accounting for 7.6% and 10.4% of families, respectively.
| Number of Earners | # Families | Median Income |
| No Earners | 1,111 (10.4%) | $59,156 |
| 1 Earner | 2,687 (25.1%) | $79,583 |
| 2 Earners | 6,097 (56.9%) | $167,764 |
| 3+ Earners | 813 (7.6%) | $182,188 |
| Total | 10,708 (100.0%) | $142,528 |
Household Income in St Louis Park
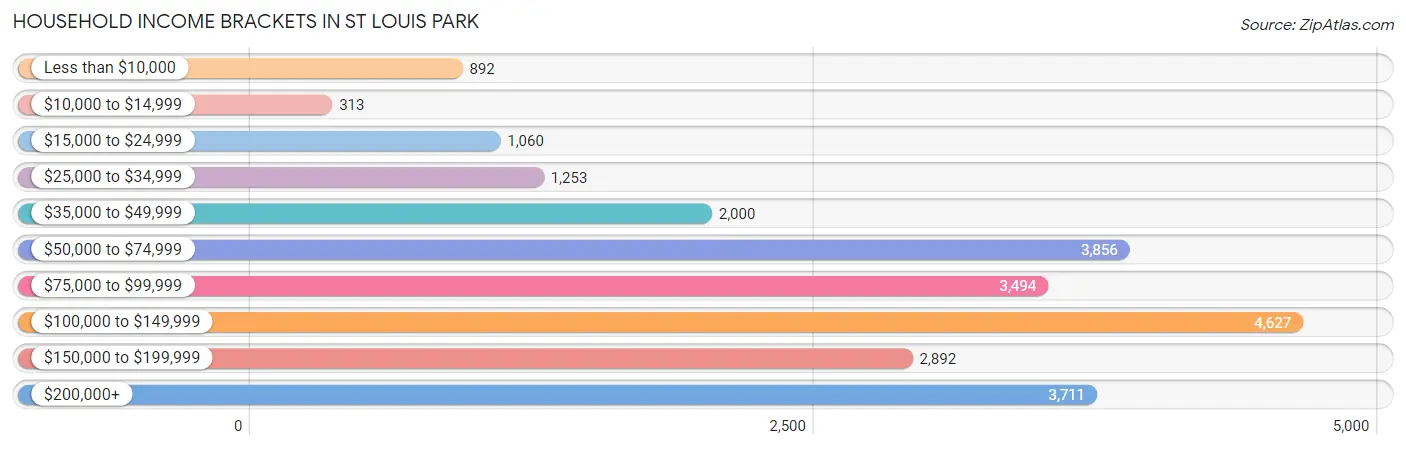
Household Income Brackets in St Louis Park
With 4,627 households falling in the category, the $100,000 to $149,999 income range is the most frequent in St Louis Park, accounting for 19.2% of all households. In contrast, only 313 households (1.3%) fall into the $10,000 to $14,999 income bracket, making it the least populous group.
| Income Bracket | # Households | % Households |
| Less than $10,000 | 892 | 3.7% |
| $10,000 to $14,999 | 313 | 1.3% |
| $15,000 to $24,999 | 1,060 | 4.4% |
| $25,000 to $34,999 | 1,253 | 5.2% |
| $35,000 to $49,999 | 2,000 | 8.3% |
| $50,000 to $74,999 | 3,856 | 16.0% |
| $75,000 to $99,999 | 3,494 | 14.5% |
| $100,000 to $149,999 | 4,627 | 19.2% |
| $150,000 to $199,999 | 2,892 | 12.0% |
| $200,000+ | 3,711 | 15.4% |
Household Income by Householder Age in St Louis Park
The median household income in St Louis Park is $94,263, with the highest median household income of $115,239 found in the 45 to 64 years age bracket for the primary householder. A total of 6,345 households (26.3%) fall into this category. Meanwhile, the 65+ years age bracket for the primary householder has the lowest median household income of $59,674, with 5,597 households (23.2%) in this group.
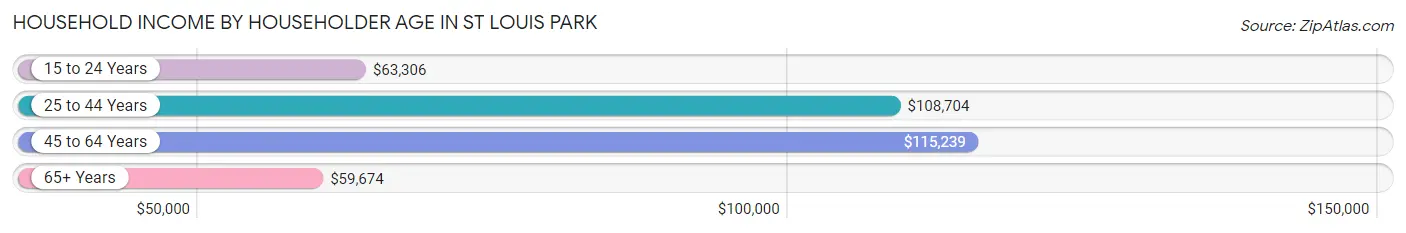
| Income Bracket | # Households | Median Income |
| 15 to 24 Years | 1,244 (5.2%) | $63,306 |
| 25 to 44 Years | 10,912 (45.3%) | $108,704 |
| 45 to 64 Years | 6,345 (26.3%) | $115,239 |
| 65+ Years | 5,597 (23.2%) | $59,674 |
| Total | 24,098 (100.0%) | $94,263 |
Poverty in St Louis Park
Income Below Poverty by Sex and Age in St Louis Park
With 6.3% poverty level for males and 8.0% for females among the residents of St Louis Park, 15 year old males and 15 year old females are the most vulnerable to poverty, with 42 males (15.4%) and 37 females (18.7%) in their respective age groups living below the poverty level.
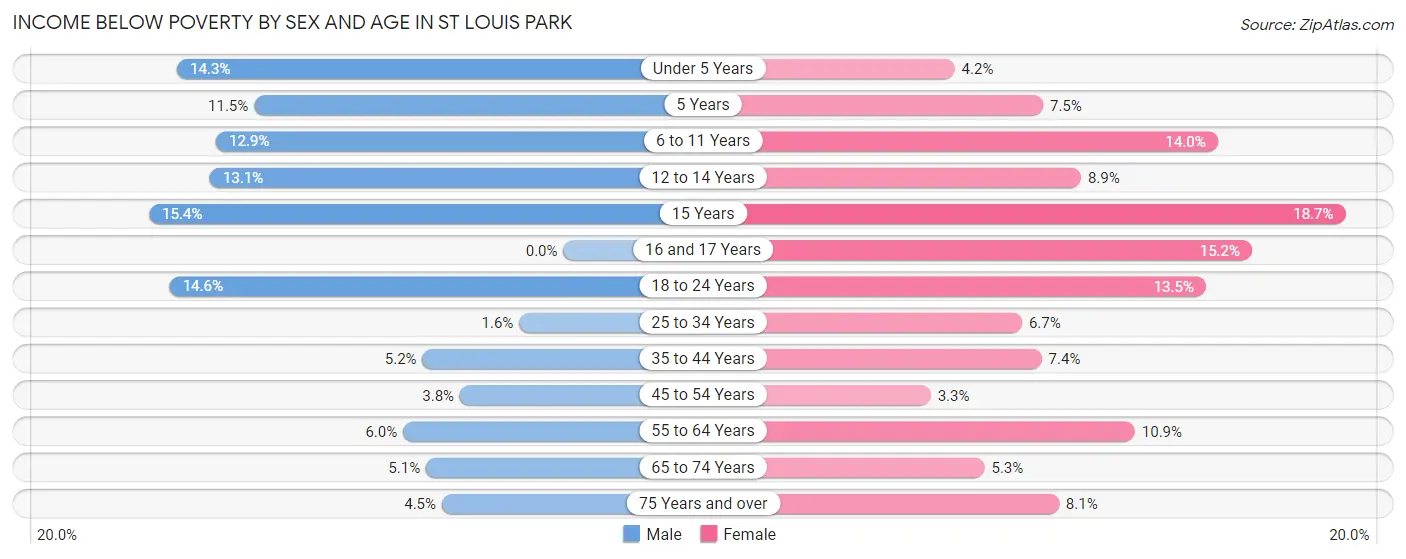
| Age Bracket | Male | Female |
| Under 5 Years | 215 (14.3%) | 50 (4.2%) |
| 5 Years | 42 (11.5%) | 18 (7.5%) |
| 6 to 11 Years | 191 (12.9%) | 215 (14.0%) |
| 12 to 14 Years | 77 (13.1%) | 57 (8.9%) |
| 15 Years | 42 (15.4%) | 37 (18.7%) |
| 16 and 17 Years | 0 (0.0%) | 65 (15.2%) |
| 18 to 24 Years | 251 (14.6%) | 214 (13.5%) |
| 25 to 34 Years | 92 (1.6%) | 413 (6.7%) |
| 35 to 44 Years | 177 (5.2%) | 256 (7.4%) |
| 45 to 54 Years | 105 (3.8%) | 73 (3.3%) |
| 55 to 64 Years | 144 (5.9%) | 309 (10.9%) |
| 65 to 74 Years | 102 (5.1%) | 134 (5.3%) |
| 75 Years and over | 50 (4.5%) | 190 (8.1%) |
| Total | 1,488 (6.3%) | 2,031 (8.0%) |
Income Above Poverty by Sex and Age in St Louis Park
According to the poverty statistics in St Louis Park, males aged 16 and 17 years and females aged 45 to 54 years are the age groups that are most secure financially, with 100.0% of males and 96.7% of females in these age groups living above the poverty line.
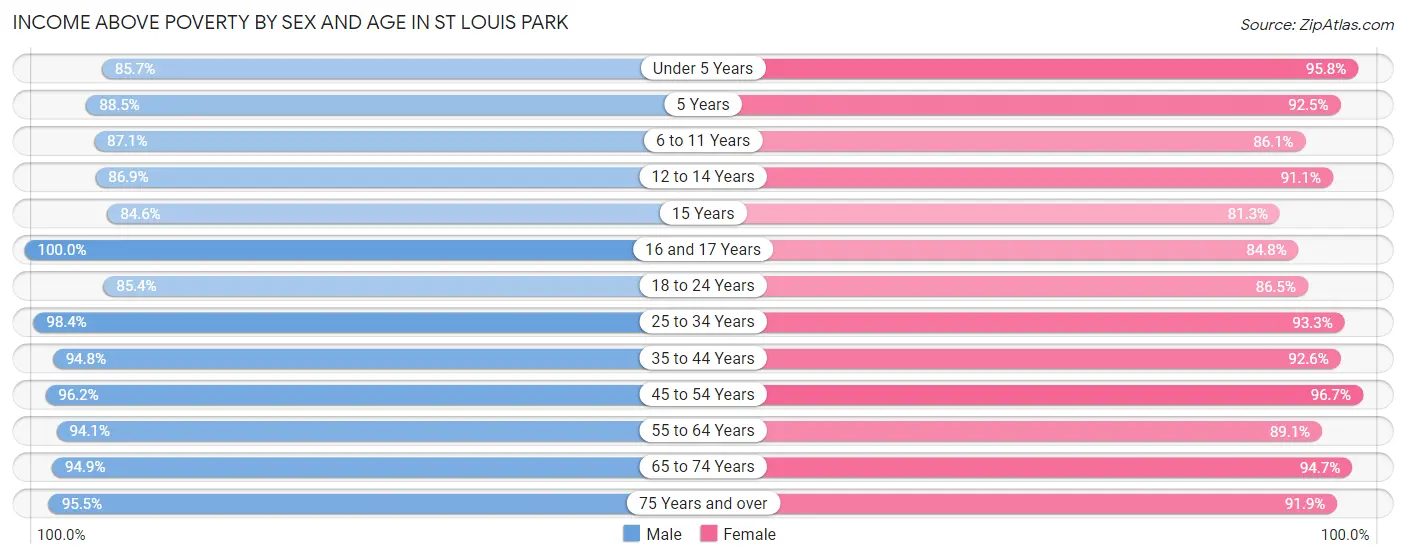
| Age Bracket | Male | Female |
| Under 5 Years | 1,284 (85.7%) | 1,142 (95.8%) |
| 5 Years | 324 (88.5%) | 223 (92.5%) |
| 6 to 11 Years | 1,291 (87.1%) | 1,326 (86.1%) |
| 12 to 14 Years | 510 (86.9%) | 585 (91.1%) |
| 15 Years | 231 (84.6%) | 161 (81.3%) |
| 16 and 17 Years | 282 (100.0%) | 362 (84.8%) |
| 18 to 24 Years | 1,467 (85.4%) | 1,370 (86.5%) |
| 25 to 34 Years | 5,511 (98.4%) | 5,764 (93.3%) |
| 35 to 44 Years | 3,208 (94.8%) | 3,192 (92.6%) |
| 45 to 54 Years | 2,629 (96.2%) | 2,139 (96.7%) |
| 55 to 64 Years | 2,277 (94.1%) | 2,532 (89.1%) |
| 65 to 74 Years | 1,898 (94.9%) | 2,395 (94.7%) |
| 75 Years and over | 1,058 (95.5%) | 2,166 (91.9%) |
| Total | 21,970 (93.7%) | 23,357 (92.0%) |
Income Below Poverty Among Married-Couple Families in St Louis Park
The poverty statistics for married-couple families in St Louis Park show that 1.9% or 160 of the total 8,564 families live below the poverty line. Families with 5 or more children have the highest poverty rate of 43.5%, comprising of 40 families. On the other hand, families with 1 or 2 children have the lowest poverty rate of 0.1%, which includes 4 families.
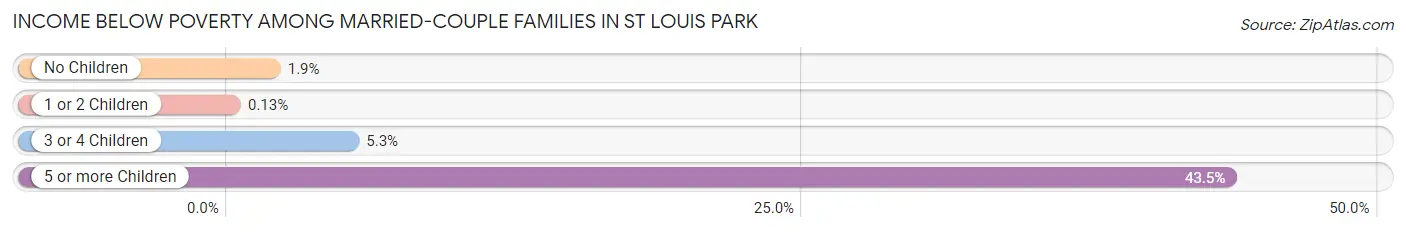
| Children | Above Poverty | Below Poverty |
| No Children | 4,972 (98.1%) | 94 (1.9%) |
| 1 or 2 Children | 2,985 (99.9%) | 4 (0.1%) |
| 3 or 4 Children | 395 (94.7%) | 22 (5.3%) |
| 5 or more Children | 52 (56.5%) | 40 (43.5%) |
| Total | 8,404 (98.1%) | 160 (1.9%) |
Income Below Poverty Among Single-Parent Households in St Louis Park
According to the poverty data in St Louis Park, 0.9% or 6 single-father households and 18.9% or 285 single-mother households are living below the poverty line. Among single-father households, those with 5 or more children have the highest poverty rate, with 6 households (100.0%) experiencing poverty. Likewise, among single-mother households, those with 3 or 4 children have the highest poverty rate, with 76 households (62.3%) falling below the poverty line.
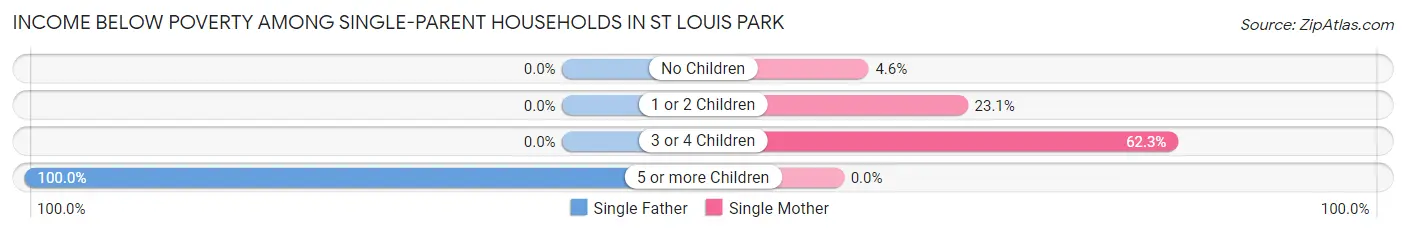
| Children | Single Father | Single Mother |
| No Children | 0 (0.0%) | 28 (4.6%) |
| 1 or 2 Children | 0 (0.0%) | 181 (23.1%) |
| 3 or 4 Children | 0 (0.0%) | 76 (62.3%) |
| 5 or more Children | 6 (100.0%) | 0 (0.0%) |
| Total | 6 (0.9%) | 285 (18.9%) |
Income Below Poverty Among Married-Couple vs Single-Parent Households in St Louis Park
The poverty data for St Louis Park shows that 160 of the married-couple family households (1.9%) and 291 of the single-parent households (13.6%) are living below the poverty level. Within the married-couple family households, those with 5 or more children have the highest poverty rate, with 40 households (43.5%) falling below the poverty line. Among the single-parent households, those with 5 or more children have the highest poverty rate, with 6 household (100.0%) living below poverty.
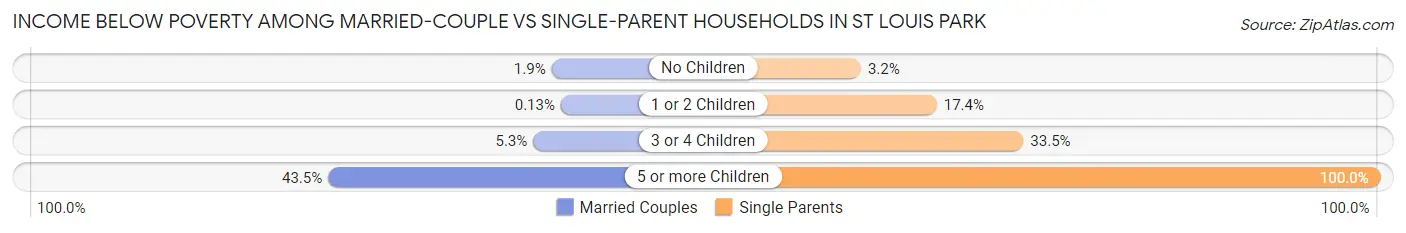
| Children | Married-Couple Families | Single-Parent Households |
| No Children | 94 (1.9%) | 28 (3.2%) |
| 1 or 2 Children | 4 (0.1%) | 181 (17.3%) |
| 3 or 4 Children | 22 (5.3%) | 76 (33.5%) |
| 5 or more Children | 40 (43.5%) | 6 (100.0%) |
| Total | 160 (1.9%) | 291 (13.6%) |
Race in St Louis Park
The most populous races in St Louis Park are White / Caucasian (39,690 | 80.2%), Two or more Races (3,115 | 6.3%), and Black / African American (2,619 | 5.3%).
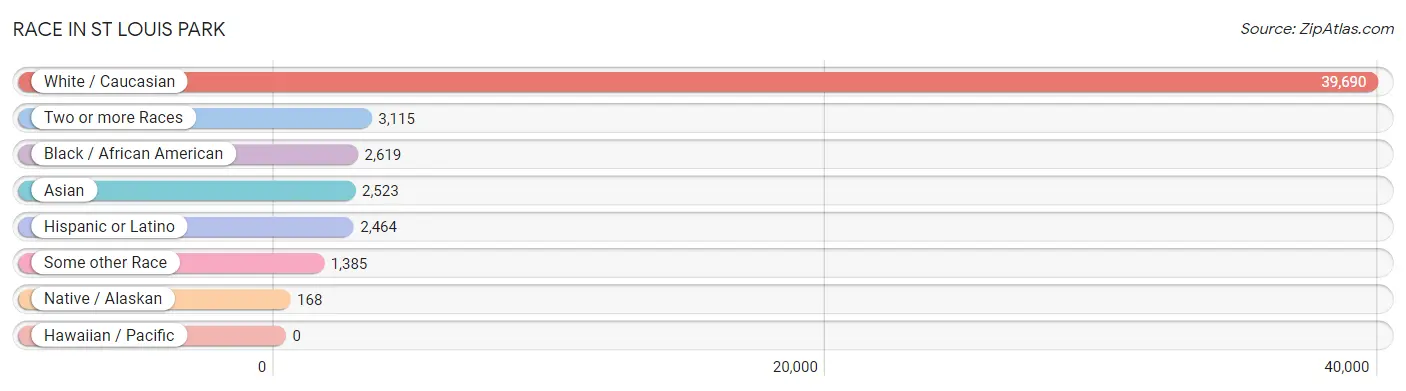
| Race | # Population | % Population |
| Asian | 2,523 | 5.1% |
| Black / African American | 2,619 | 5.3% |
| Hawaiian / Pacific | 0 | 0.0% |
| Hispanic or Latino | 2,464 | 5.0% |
| Native / Alaskan | 168 | 0.3% |
| White / Caucasian | 39,690 | 80.2% |
| Two or more Races | 3,115 | 6.3% |
| Some other Race | 1,385 | 2.8% |
| Total | 49,500 | 100.0% |
Ancestry in St Louis Park
The most populous ancestries reported in St Louis Park are German (13,344 | 27.0%), Irish (5,707 | 11.5%), Norwegian (5,684 | 11.5%), Swedish (3,817 | 7.7%), and English (3,780 | 7.6%), together accounting for 65.3% of all St Louis Park residents.
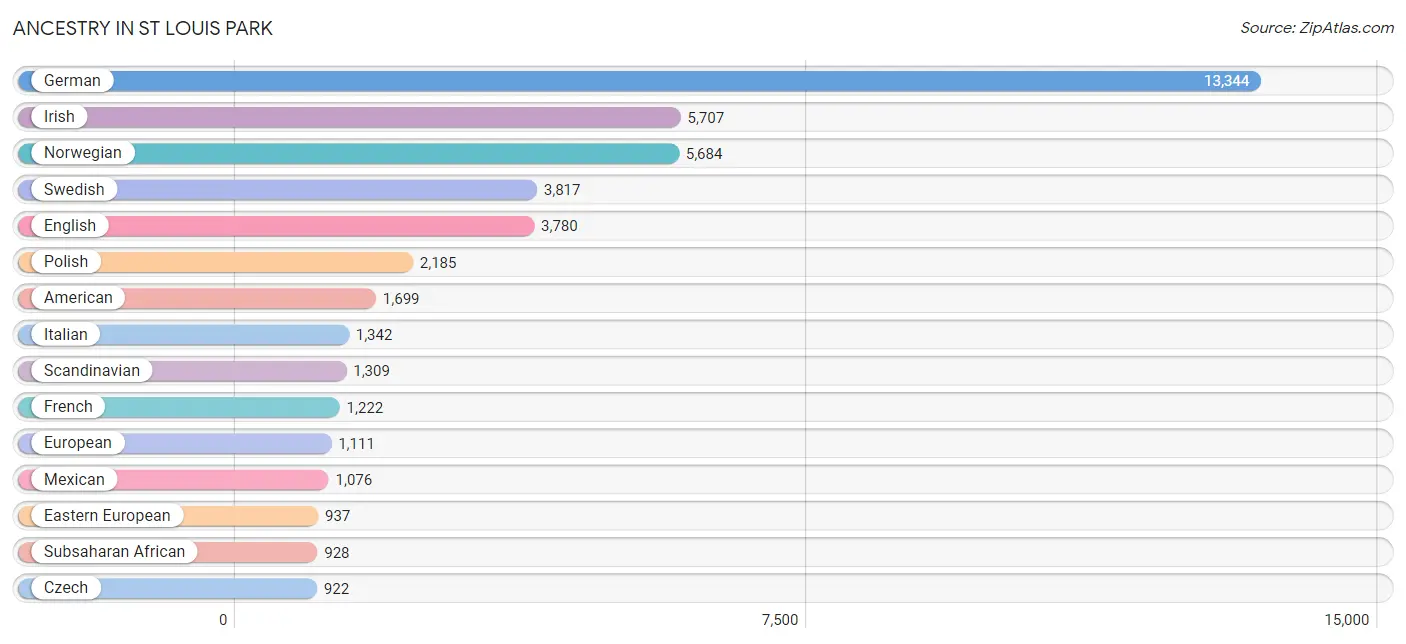
| Ancestry | # Population | % Population |
| African | 76 | 0.2% |
| American | 1,699 | 3.4% |
| Arab | 251 | 0.5% |
| Armenian | 17 | 0.0% |
| Assyrian / Chaldean / Syriac | 12 | 0.0% |
| Australian | 8 | 0.0% |
| Austrian | 157 | 0.3% |
| Bahamian | 12 | 0.0% |
| Bangladeshi | 98 | 0.2% |
| Belgian | 70 | 0.1% |
| Belizean | 13 | 0.0% |
| Bhutanese | 259 | 0.5% |
| Brazilian | 29 | 0.1% |
| British | 266 | 0.5% |
| Bulgarian | 28 | 0.1% |
| Burmese | 358 | 0.7% |
| Canadian | 126 | 0.3% |
| Carpatho Rusyn | 14 | 0.0% |
| Central American | 191 | 0.4% |
| Central American Indian | 58 | 0.1% |
| Cherokee | 64 | 0.1% |
| Chilean | 22 | 0.0% |
| Chippewa | 268 | 0.5% |
| Colombian | 202 | 0.4% |
| Costa Rican | 43 | 0.1% |
| Croatian | 189 | 0.4% |
| Cuban | 115 | 0.2% |
| Czech | 922 | 1.9% |
| Czechoslovakian | 88 | 0.2% |
| Danish | 629 | 1.3% |
| Dutch | 862 | 1.7% |
| Eastern European | 937 | 1.9% |
| Ecuadorian | 353 | 0.7% |
| Egyptian | 25 | 0.1% |
| English | 3,780 | 7.6% |
| Estonian | 6 | 0.0% |
| Ethiopian | 76 | 0.2% |
| European | 1,111 | 2.2% |
| Filipino | 29 | 0.1% |
| Finnish | 452 | 0.9% |
| French | 1,222 | 2.5% |
| French Canadian | 304 | 0.6% |
| German | 13,344 | 27.0% |
| German Russian | 24 | 0.1% |
| Ghanaian | 4 | 0.0% |
| Greek | 174 | 0.4% |
| Guatemalan | 50 | 0.1% |
| Guyanese | 40 | 0.1% |
| Haitian | 24 | 0.1% |
| Honduran | 17 | 0.0% |
| Hungarian | 95 | 0.2% |
| Icelander | 42 | 0.1% |
| Indian (Asian) | 828 | 1.7% |
| Indonesian | 3 | 0.0% |
| Iranian | 86 | 0.2% |
| Irish | 5,707 | 11.5% |
| Israeli | 10 | 0.0% |
| Italian | 1,342 | 2.7% |
| Jamaican | 5 | 0.0% |
| Japanese | 74 | 0.2% |
| Jordanian | 11 | 0.0% |
| Kenyan | 79 | 0.2% |
| Korean | 322 | 0.6% |
| Latvian | 40 | 0.1% |
| Lebanese | 106 | 0.2% |
| Liberian | 3 | 0.0% |
| Lithuanian | 117 | 0.2% |
| Luxembourger | 122 | 0.3% |
| Malaysian | 64 | 0.1% |
| Menominee | 15 | 0.0% |
| Mexican | 1,076 | 2.2% |
| Mexican American Indian | 42 | 0.1% |
| Mongolian | 11 | 0.0% |
| Moroccan | 15 | 0.0% |
| Nicaraguan | 16 | 0.0% |
| Nigerian | 75 | 0.2% |
| Northern European | 285 | 0.6% |
| Norwegian | 5,684 | 11.5% |
| Pakistani | 166 | 0.3% |
| Panamanian | 44 | 0.1% |
| Paraguayan | 18 | 0.0% |
| Pennsylvania German | 14 | 0.0% |
| Peruvian | 38 | 0.1% |
| Polish | 2,185 | 4.4% |
| Portuguese | 21 | 0.0% |
| Puerto Rican | 266 | 0.5% |
| Romanian | 161 | 0.3% |
| Russian | 885 | 1.8% |
| Salvadoran | 21 | 0.0% |
| Scandinavian | 1,309 | 2.6% |
| Scotch-Irish | 369 | 0.7% |
| Scottish | 823 | 1.7% |
| Sioux | 48 | 0.1% |
| Slavic | 7 | 0.0% |
| Slovak | 82 | 0.2% |
| Slovene | 183 | 0.4% |
| Somali | 508 | 1.0% |
| South American | 727 | 1.5% |
| Spaniard | 8 | 0.0% |
| Spanish | 34 | 0.1% |
| Sri Lankan | 111 | 0.2% |
| Subsaharan African | 928 | 1.9% |
| Swedish | 3,817 | 7.7% |
| Swiss | 210 | 0.4% |
| Syrian | 26 | 0.1% |
| Thai | 725 | 1.5% |
| Ukrainian | 303 | 0.6% |
| Uruguayan | 57 | 0.1% |
| Venezuelan | 37 | 0.1% |
| Vietnamese | 15 | 0.0% |
| Welsh | 179 | 0.4% |
| West Indian | 30 | 0.1% |
| Yuman | 4 | 0.0% |
| Zimbabwean | 9 | 0.0% | View All 114 Rows |
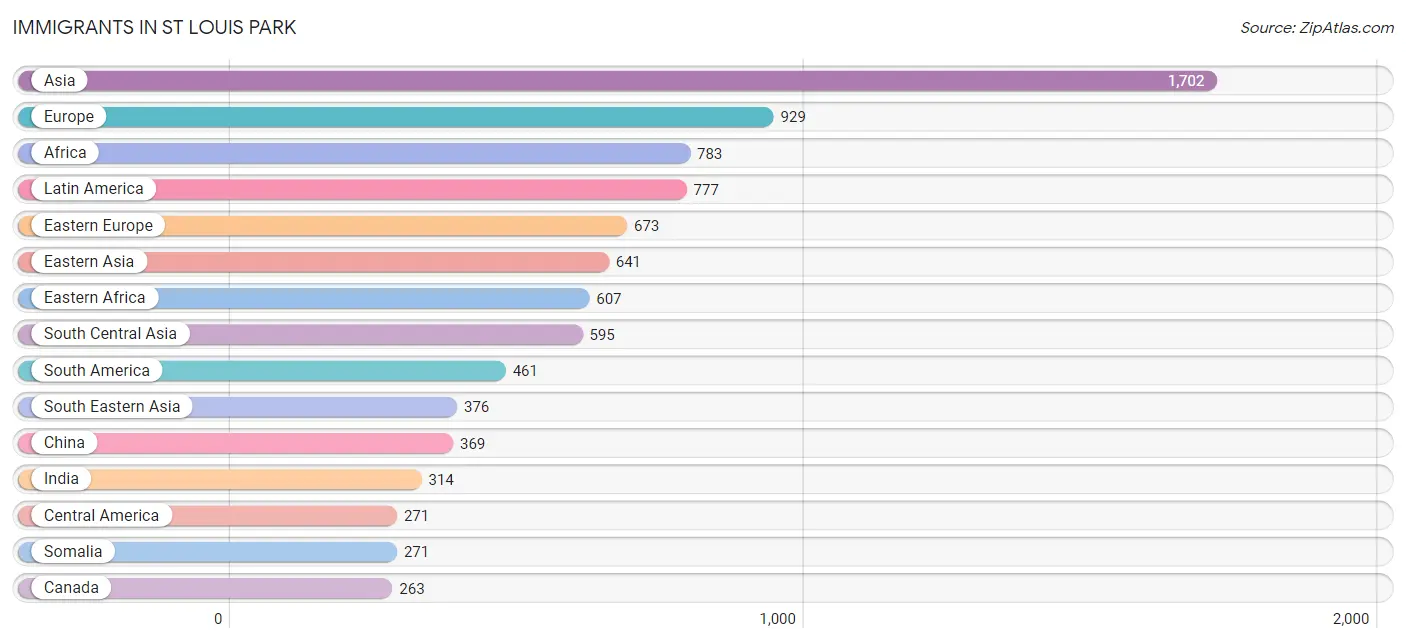
Immigrants in St Louis Park
The most numerous immigrant groups reported in St Louis Park came from Asia (1,702 | 3.4%), Europe (929 | 1.9%), Africa (783 | 1.6%), Latin America (777 | 1.6%), and Eastern Europe (673 | 1.4%), together accounting for 9.8% of all St Louis Park residents.
| Immigration Origin | # Population | % Population |
| Africa | 783 | 1.6% |
| Asia | 1,702 | 3.4% |
| Australia | 8 | 0.0% |
| Bangladesh | 15 | 0.0% |
| Belarus | 77 | 0.2% |
| Belgium | 21 | 0.0% |
| Belize | 6 | 0.0% |
| Bosnia and Herzegovina | 57 | 0.1% |
| Brazil | 64 | 0.1% |
| Cambodia | 24 | 0.1% |
| Cameroon | 11 | 0.0% |
| Canada | 263 | 0.5% |
| Caribbean | 45 | 0.1% |
| Central America | 271 | 0.5% |
| China | 369 | 0.7% |
| Colombia | 26 | 0.1% |
| Congo | 40 | 0.1% |
| Costa Rica | 43 | 0.1% |
| Croatia | 15 | 0.0% |
| Cuba | 10 | 0.0% |
| Denmark | 20 | 0.0% |
| Eastern Africa | 607 | 1.2% |
| Eastern Asia | 641 | 1.3% |
| Eastern Europe | 673 | 1.4% |
| Ecuador | 201 | 0.4% |
| England | 64 | 0.1% |
| Eritrea | 32 | 0.1% |
| Ethiopia | 119 | 0.2% |
| Europe | 929 | 1.9% |
| France | 10 | 0.0% |
| Germany | 75 | 0.2% |
| Ghana | 16 | 0.0% |
| Guatemala | 46 | 0.1% |
| Guyana | 41 | 0.1% |
| Honduras | 12 | 0.0% |
| Hong Kong | 20 | 0.0% |
| Hungary | 3 | 0.0% |
| India | 314 | 0.6% |
| Iran | 27 | 0.1% |
| Ireland | 7 | 0.0% |
| Israel | 16 | 0.0% |
| Jamaica | 5 | 0.0% |
| Japan | 64 | 0.1% |
| Jordan | 34 | 0.1% |
| Kazakhstan | 11 | 0.0% |
| Kenya | 166 | 0.3% |
| Korea | 208 | 0.4% |
| Latin America | 777 | 1.6% |
| Latvia | 31 | 0.1% |
| Liberia | 15 | 0.0% |
| Malaysia | 11 | 0.0% |
| Mexico | 164 | 0.3% |
| Middle Africa | 74 | 0.2% |
| Moldova | 135 | 0.3% |
| Nepal | 197 | 0.4% |
| Netherlands | 12 | 0.0% |
| Nigeria | 35 | 0.1% |
| Northern Europe | 134 | 0.3% |
| Norway | 12 | 0.0% |
| Oceania | 8 | 0.0% |
| Pakistan | 31 | 0.1% |
| Peru | 22 | 0.0% |
| Philippines | 178 | 0.4% |
| Russia | 178 | 0.4% |
| Saudi Arabia | 23 | 0.1% |
| Scotland | 11 | 0.0% |
| Somalia | 271 | 0.5% |
| South America | 461 | 0.9% |
| South Central Asia | 595 | 1.2% |
| South Eastern Asia | 376 | 0.8% |
| Southern Europe | 4 | 0.0% |
| Spain | 4 | 0.0% |
| Taiwan | 41 | 0.1% |
| Thailand | 116 | 0.2% |
| Trinidad and Tobago | 30 | 0.1% |
| Ukraine | 103 | 0.2% |
| Uruguay | 57 | 0.1% |
| Venezuela | 32 | 0.1% |
| Vietnam | 44 | 0.1% |
| Western Africa | 98 | 0.2% |
| Western Asia | 83 | 0.2% |
| Western Europe | 118 | 0.2% |
| Zaire | 23 | 0.1% |
| Zimbabwe | 9 | 0.0% | View All 84 Rows |
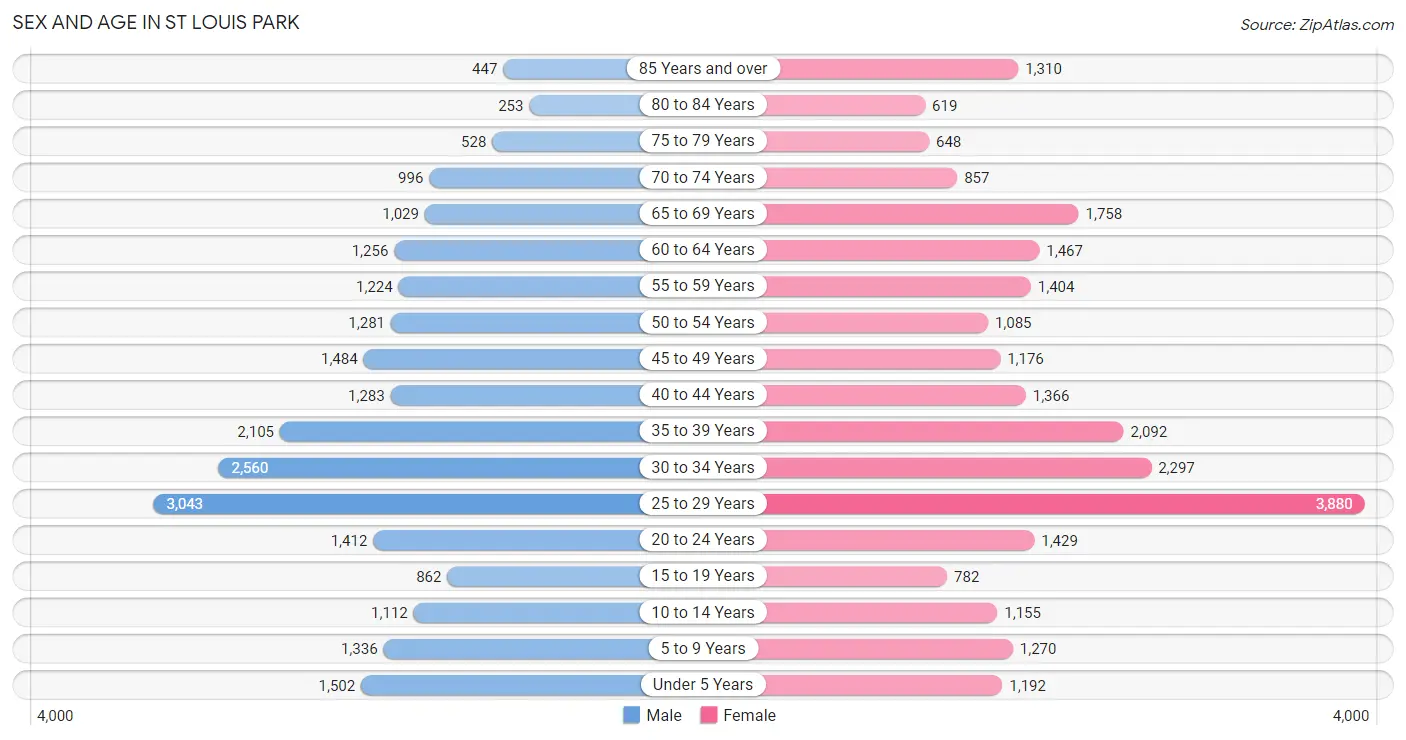
Sex and Age in St Louis Park
Sex and Age in St Louis Park
The most populous age groups in St Louis Park are 25 to 29 Years (3,043 | 12.8%) for men and 25 to 29 Years (3,880 | 15.0%) for women.
| Age Bracket | Male | Female |
| Under 5 Years | 1,502 (6.3%) | 1,192 (4.6%) |
| 5 to 9 Years | 1,336 (5.6%) | 1,270 (4.9%) |
| 10 to 14 Years | 1,112 (4.7%) | 1,155 (4.5%) |
| 15 to 19 Years | 862 (3.6%) | 782 (3.0%) |
| 20 to 24 Years | 1,412 (5.9%) | 1,429 (5.5%) |
| 25 to 29 Years | 3,043 (12.8%) | 3,880 (15.0%) |
| 30 to 34 Years | 2,560 (10.8%) | 2,297 (8.9%) |
| 35 to 39 Years | 2,105 (8.9%) | 2,092 (8.1%) |
| 40 to 44 Years | 1,283 (5.4%) | 1,366 (5.3%) |
| 45 to 49 Years | 1,484 (6.3%) | 1,176 (4.6%) |
| 50 to 54 Years | 1,281 (5.4%) | 1,085 (4.2%) |
| 55 to 59 Years | 1,224 (5.2%) | 1,404 (5.4%) |
| 60 to 64 Years | 1,256 (5.3%) | 1,467 (5.7%) |
| 65 to 69 Years | 1,029 (4.3%) | 1,758 (6.8%) |
| 70 to 74 Years | 996 (4.2%) | 857 (3.3%) |
| 75 to 79 Years | 528 (2.2%) | 648 (2.5%) |
| 80 to 84 Years | 253 (1.1%) | 619 (2.4%) |
| 85 Years and over | 447 (1.9%) | 1,310 (5.1%) |
| Total | 23,713 (100.0%) | 25,787 (100.0%) |
Families and Households in St Louis Park
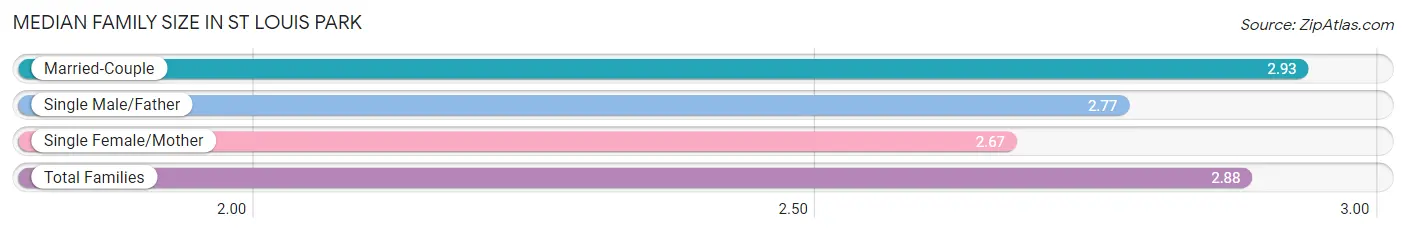
Median Family Size in St Louis Park
The median family size in St Louis Park is 2.88 persons per family, with married-couple families (8,564 | 80.0%) accounting for the largest median family size of 2.93 persons per family. On the other hand, single female/mother families (1,512 | 14.1%) represent the smallest median family size with 2.67 persons per family.
| Family Type | # Families | Family Size |
| Married-Couple | 8,564 (80.0%) | 2.93 |
| Single Male/Father | 632 (5.9%) | 2.77 |
| Single Female/Mother | 1,512 (14.1%) | 2.67 |
| Total Families | 10,708 (100.0%) | 2.88 |
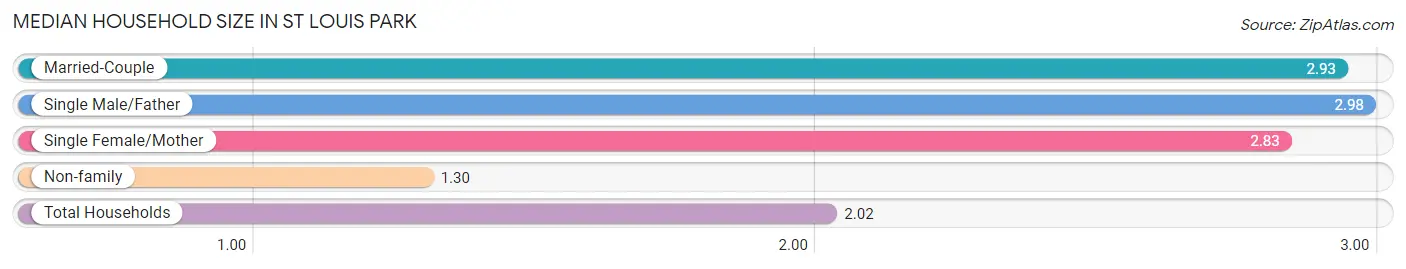
Median Household Size in St Louis Park
The median household size in St Louis Park is 2.02 persons per household, with single male/father households (632 | 2.6%) accounting for the largest median household size of 2.98 persons per household. non-family households (13,390 | 55.6%) represent the smallest median household size with 1.30 persons per household.
| Household Type | # Households | Household Size |
| Married-Couple | 8,564 (35.5%) | 2.93 |
| Single Male/Father | 632 (2.6%) | 2.98 |
| Single Female/Mother | 1,512 (6.3%) | 2.83 |
| Non-family | 13,390 (55.6%) | 1.30 |
| Total Households | 24,098 (100.0%) | 2.02 |
Household Size by Marriage Status in St Louis Park
Out of a total of 24,098 households in St Louis Park, 10,708 (44.4%) are family households, while 13,390 (55.6%) are nonfamily households. The most numerous type of family households are 2-person households, comprising 5,418, and the most common type of nonfamily households are 1-person households, comprising 10,103.
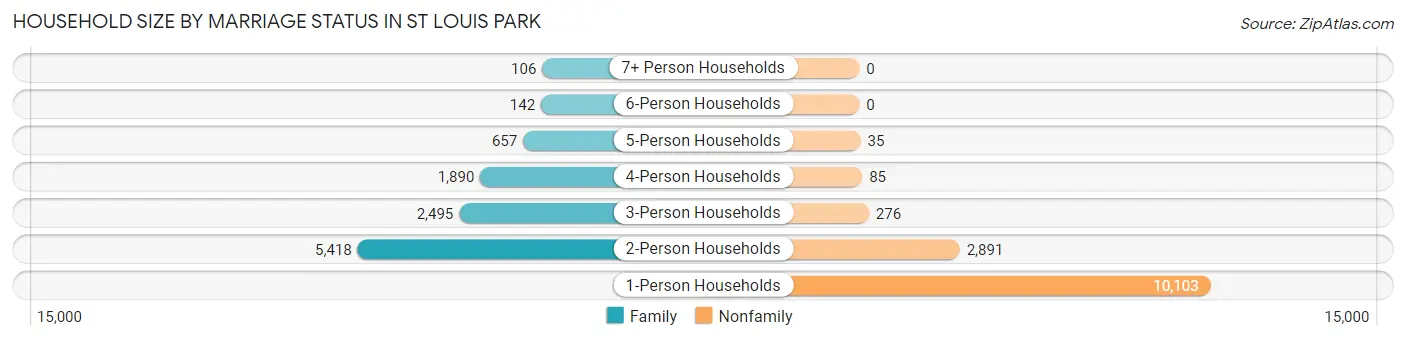
| Household Size | Family Households | Nonfamily Households |
| 1-Person Households | - | 10,103 (41.9%) |
| 2-Person Households | 5,418 (22.5%) | 2,891 (12.0%) |
| 3-Person Households | 2,495 (10.3%) | 276 (1.1%) |
| 4-Person Households | 1,890 (7.8%) | 85 (0.4%) |
| 5-Person Households | 657 (2.7%) | 35 (0.2%) |
| 6-Person Households | 142 (0.6%) | 0 (0.0%) |
| 7+ Person Households | 106 (0.4%) | 0 (0.0%) |
| Total | 10,708 (44.4%) | 13,390 (55.6%) |
Female Fertility in St Louis Park
Fertility by Age in St Louis Park
Average fertility rate in St Louis Park is 58.0 births per 1,000 women. Women in the age bracket of 35 to 50 years have the highest fertility rate with 68.0 births per 1,000 women. Women in the age bracket of 20 to 34 years acount for 57.6% of all women with births.
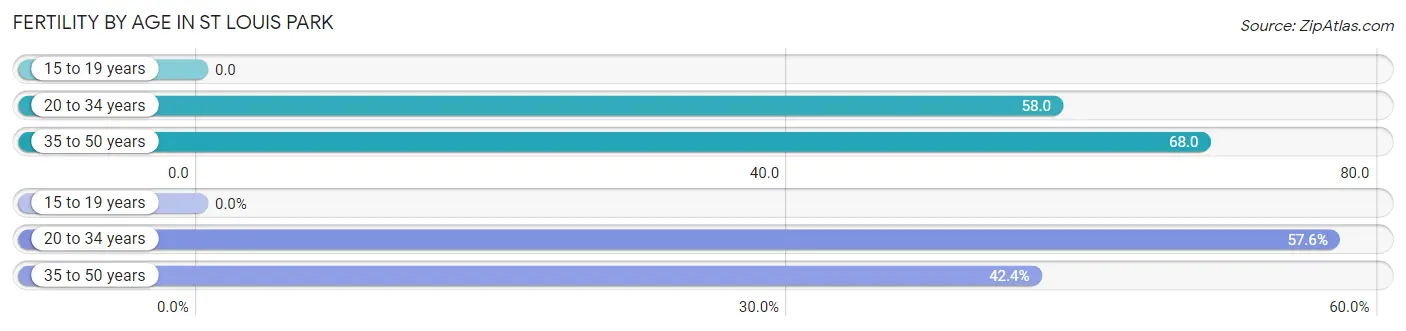
| Age Bracket | Women with Births | Births / 1,000 Women |
| 15 to 19 years | 0 (0.0%) | 0.0 |
| 20 to 34 years | 444 (57.6%) | 58.0 |
| 35 to 50 years | 327 (42.4%) | 68.0 |
| Total | 771 (100.0%) | 58.0 |
Fertility by Age by Marriage Status in St Louis Park
89.0% of women with births (771) in St Louis Park are married. The highest percentage of unmarried women with births falls into 20 to 34 years age bracket with 14.0% of them unmarried at the time of birth, while the lowest percentage of unmarried women with births belong to 35 to 50 years age bracket with 7.0% of them unmarried.
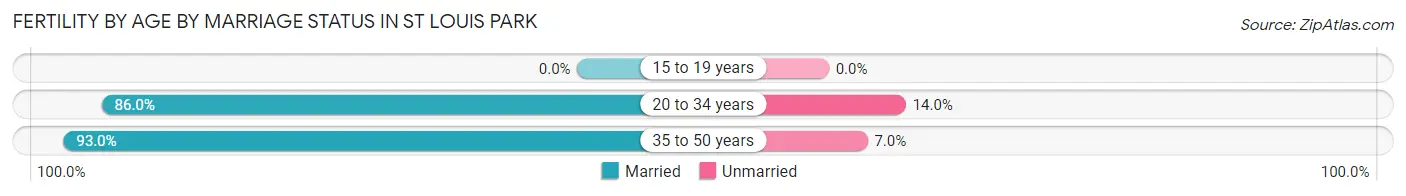
| Age Bracket | Married | Unmarried |
| 15 to 19 years | 0 (0.0%) | 0 (0.0%) |
| 20 to 34 years | 382 (86.0%) | 62 (14.0%) |
| 35 to 50 years | 304 (93.0%) | 23 (7.0%) |
| Total | 686 (89.0%) | 85 (11.0%) |
Fertility by Education in St Louis Park
Average fertility rate in St Louis Park is 58.0 births per 1,000 women. Women with the education attainment of high school diploma have the highest fertility rate of 104.0 births per 1,000 women, while women with the education attainment of college or associate's degree have the lowest fertility at 29.0 births per 1,000 women. Women with the education attainment of bachelor's degree represent 40.9% of all women with births.
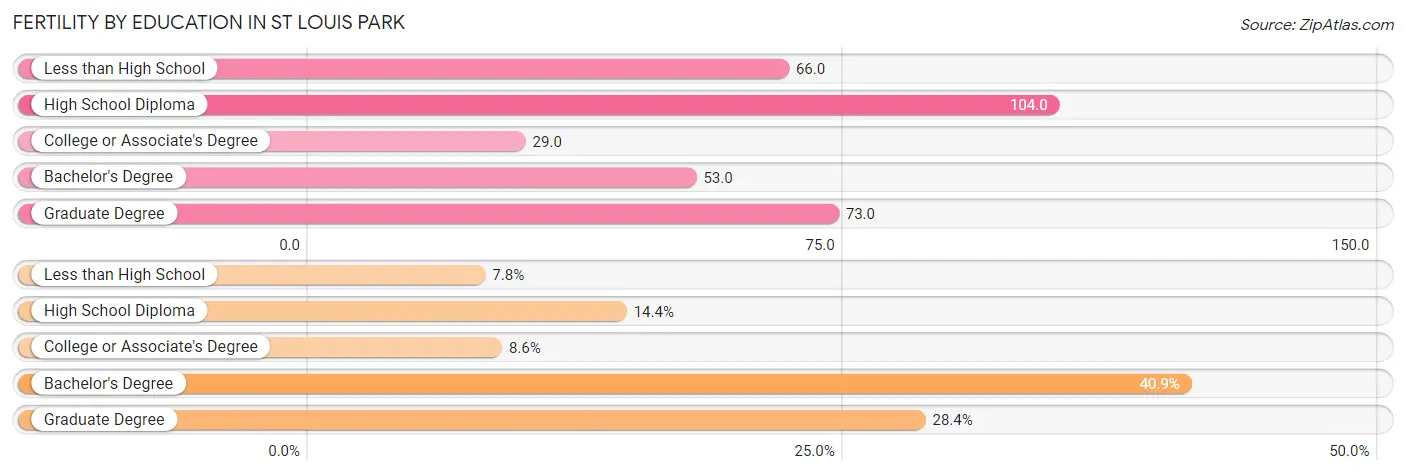
| Educational Attainment | Women with Births | Births / 1,000 Women |
| Less than High School | 60 (7.8%) | 66.0 |
| High School Diploma | 111 (14.4%) | 104.0 |
| College or Associate's Degree | 66 (8.6%) | 29.0 |
| Bachelor's Degree | 315 (40.9%) | 53.0 |
| Graduate Degree | 219 (28.4%) | 73.0 |
| Total | 771 (100.0%) | 58.0 |
Fertility by Education by Marriage Status in St Louis Park
11.0% of women with births in St Louis Park are unmarried. Women with the educational attainment of less than high school are most likely to be married with 100.0% of them married at childbirth, while women with the educational attainment of high school diploma are least likely to be married with 41.4% of them unmarried at childbirth.
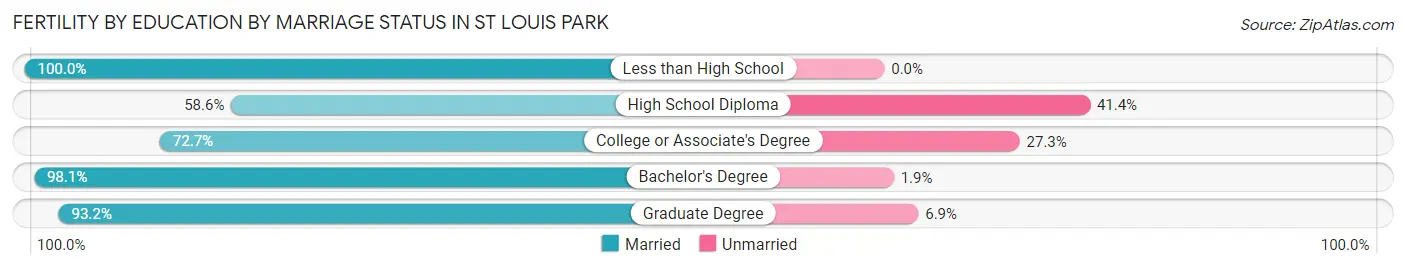
| Educational Attainment | Married | Unmarried |
| Less than High School | 60 (100.0%) | 0 (0.0%) |
| High School Diploma | 65 (58.6%) | 46 (41.4%) |
| College or Associate's Degree | 48 (72.7%) | 18 (27.3%) |
| Bachelor's Degree | 309 (98.1%) | 6 (1.9%) |
| Graduate Degree | 204 (93.1%) | 15 (6.9%) |
| Total | 686 (89.0%) | 85 (11.0%) |
Employment Characteristics in St Louis Park
Employment by Class of Employer in St Louis Park
Among the 30,258 employed individuals in St Louis Park, private company employees (20,879 | 69.0%), not-for-profit organizations (3,770 | 12.5%), and local government employees (1,813 | 6.0%) make up the most common classes of employment.
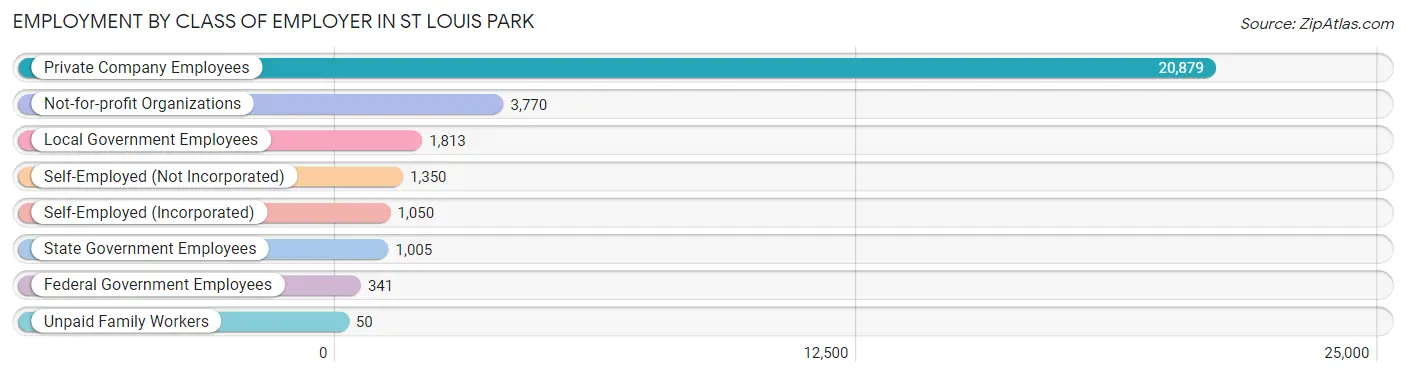
| Employer Class | # Employees | % Employees |
| Private Company Employees | 20,879 | 69.0% |
| Self-Employed (Incorporated) | 1,050 | 3.5% |
| Self-Employed (Not Incorporated) | 1,350 | 4.5% |
| Not-for-profit Organizations | 3,770 | 12.5% |
| Local Government Employees | 1,813 | 6.0% |
| State Government Employees | 1,005 | 3.3% |
| Federal Government Employees | 341 | 1.1% |
| Unpaid Family Workers | 50 | 0.2% |
| Total | 30,258 | 100.0% |
Employment Status by Age in St Louis Park
According to the labor force statistics for St Louis Park, out of the total population over 16 years of age (41,461), 75.8% or 31,427 individuals are in the labor force, with 2.8% or 880 of them unemployed. The age group with the highest labor force participation rate is 30 to 34 years, with 95.3% or 4,629 individuals in the labor force. Within the labor force, the 16 to 19 years age range has the highest percentage of unemployed individuals, with 15.3% or 80 of them being unemployed.
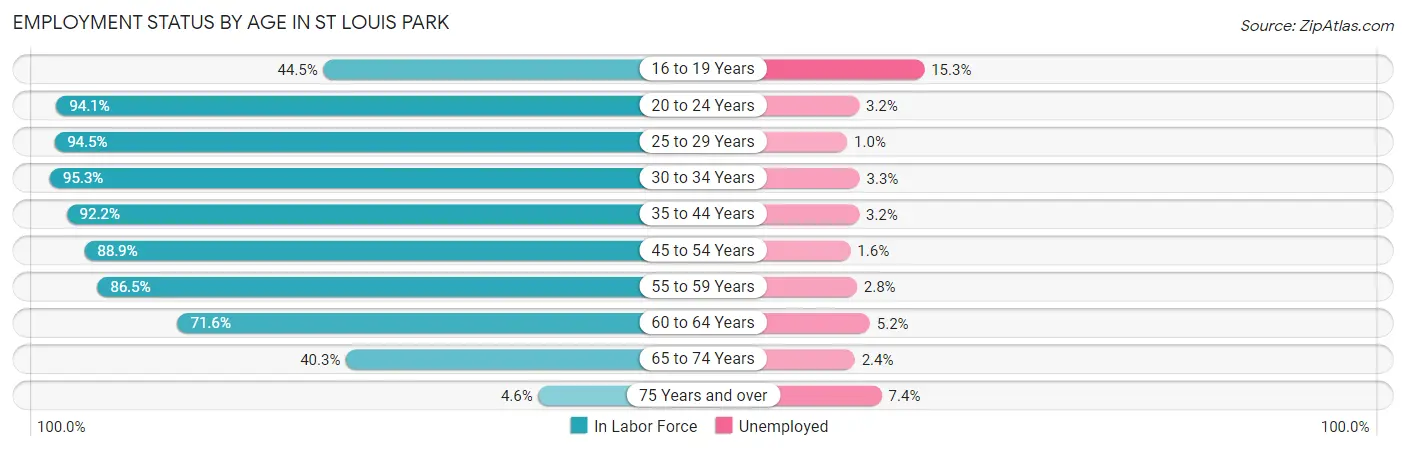
| Age Bracket | In Labor Force | Unemployed |
| 16 to 19 Years | 522 (44.5%) | 80 (15.3%) |
| 20 to 24 Years | 2,673 (94.1%) | 86 (3.2%) |
| 25 to 29 Years | 6,542 (94.5%) | 65 (1.0%) |
| 30 to 34 Years | 4,629 (95.3%) | 153 (3.3%) |
| 35 to 44 Years | 6,312 (92.2%) | 202 (3.2%) |
| 45 to 54 Years | 4,468 (88.9%) | 71 (1.6%) |
| 55 to 59 Years | 2,273 (86.5%) | 64 (2.8%) |
| 60 to 64 Years | 1,950 (71.6%) | 101 (5.2%) |
| 65 to 74 Years | 1,870 (40.3%) | 45 (2.4%) |
| 75 Years and over | 175 (4.6%) | 13 (7.4%) |
| Total | 31,427 (75.8%) | 880 (2.8%) |
Employment Status by Educational Attainment in St Louis Park
According to labor force statistics for St Louis Park, 90.2% of individuals (26,161) out of the total population between 25 and 64 years of age (29,003) are in the labor force, with 2.5% or 654 of them being unemployed. The group with the highest labor force participation rate are those with the educational attainment of bachelor's degree or higher, with 94.2% or 18,557 individuals in the labor force. Within the labor force, individuals with high school diploma education have the highest percentage of unemployment, with 3.9% or 76 of them being unemployed.
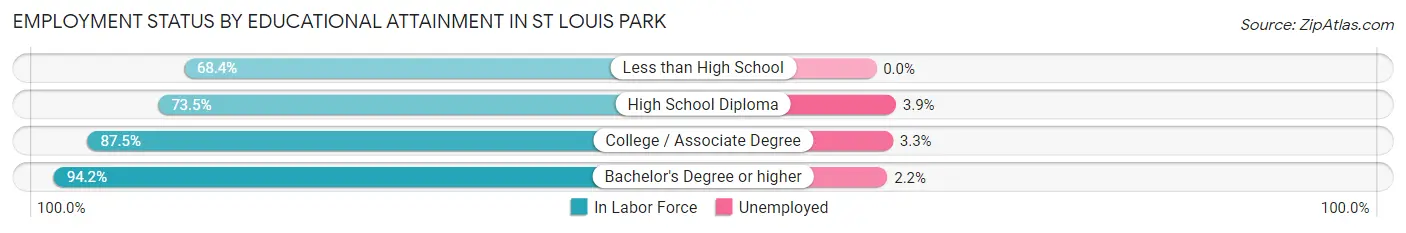
| Educational Attainment | In Labor Force | Unemployed |
| Less than High School | 565 (68.4%) | 0 (0.0%) |
| High School Diploma | 1,939 (73.5%) | 103 (3.9%) |
| College / Associate Degree | 5,109 (87.5%) | 193 (3.3%) |
| Bachelor's Degree or higher | 18,557 (94.2%) | 433 (2.2%) |
| Total | 26,161 (90.2%) | 725 (2.5%) |
Employment Occupations by Sex in St Louis Park
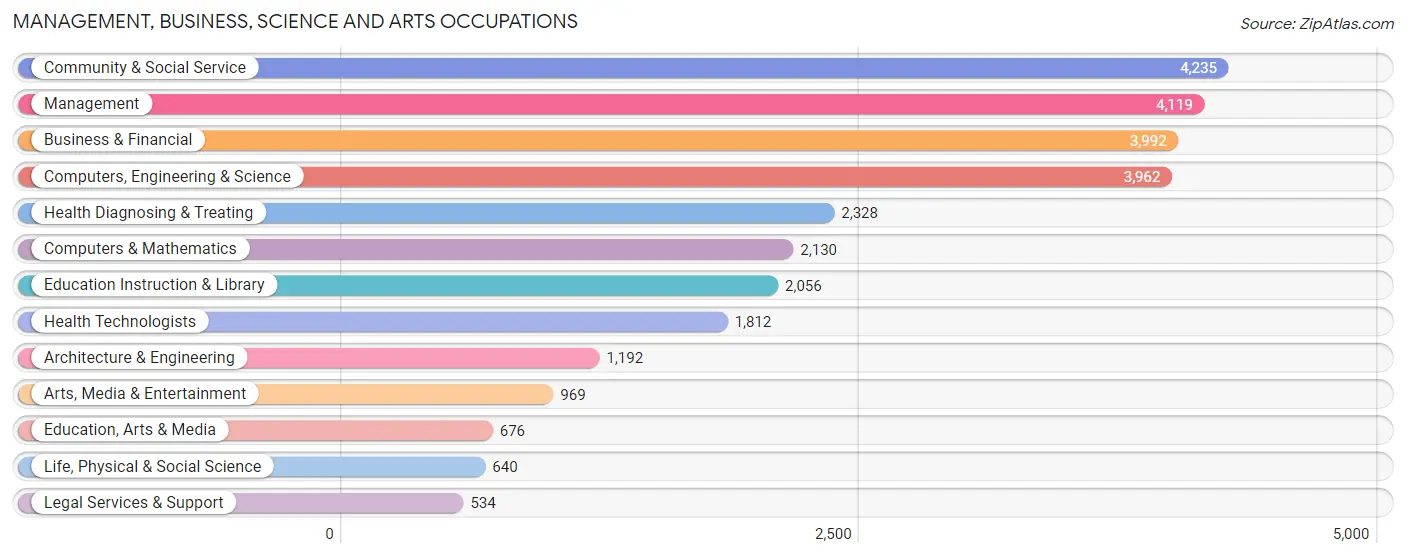
Management, Business, Science and Arts Occupations
The most common Management, Business, Science and Arts occupations in St Louis Park are Community & Social Service (4,235 | 13.9%), Management (4,119 | 13.5%), Business & Financial (3,992 | 13.1%), Computers, Engineering & Science (3,962 | 13.0%), and Health Diagnosing & Treating (2,328 | 7.6%).
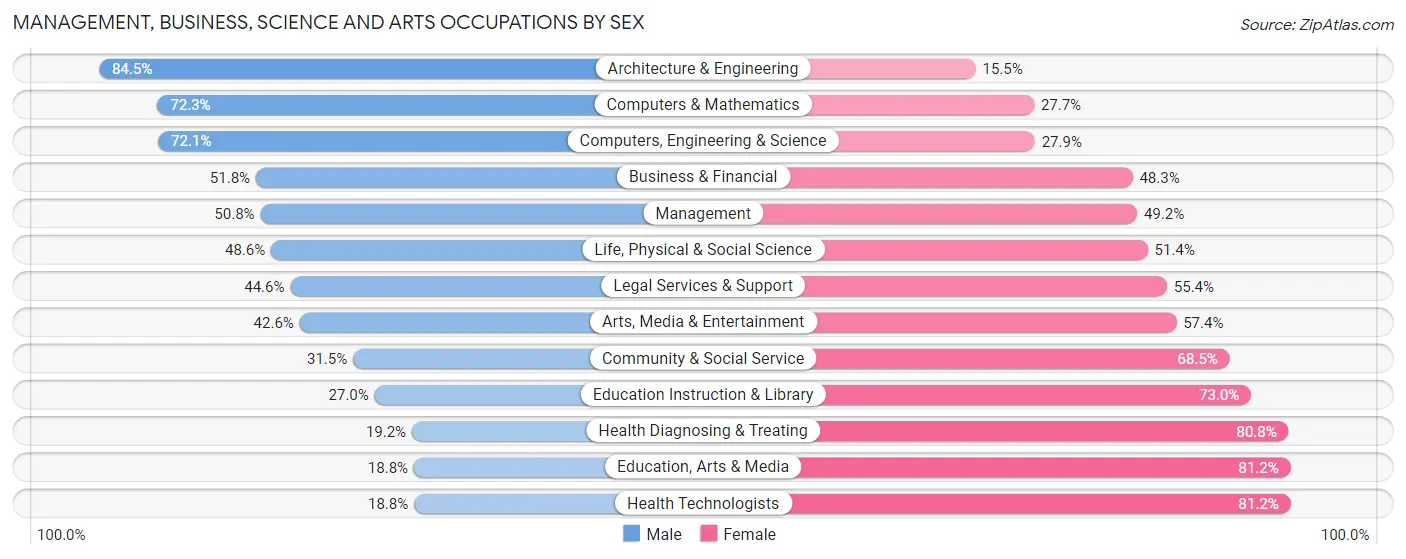
Management, Business, Science and Arts Occupations by Sex
Within the Management, Business, Science and Arts occupations in St Louis Park, the most male-oriented occupations are Architecture & Engineering (84.5%), Computers & Mathematics (72.3%), and Computers, Engineering & Science (72.1%), while the most female-oriented occupations are Health Technologists (81.2%), Education, Arts & Media (81.2%), and Health Diagnosing & Treating (80.8%).
| Occupation | Male | Female |
| Management | 2,093 (50.8%) | 2,026 (49.2%) |
| Business & Financial | 2,066 (51.7%) | 1,926 (48.2%) |
| Computers, Engineering & Science | 2,858 (72.1%) | 1,104 (27.9%) |
| Computers & Mathematics | 1,540 (72.3%) | 590 (27.7%) |
| Architecture & Engineering | 1,007 (84.5%) | 185 (15.5%) |
| Life, Physical & Social Science | 311 (48.6%) | 329 (51.4%) |
| Community & Social Service | 1,333 (31.5%) | 2,902 (68.5%) |
| Education, Arts & Media | 127 (18.8%) | 549 (81.2%) |
| Legal Services & Support | 238 (44.6%) | 296 (55.4%) |
| Education Instruction & Library | 555 (27.0%) | 1,501 (73.0%) |
| Arts, Media & Entertainment | 413 (42.6%) | 556 (57.4%) |
| Health Diagnosing & Treating | 447 (19.2%) | 1,881 (80.8%) |
| Health Technologists | 340 (18.8%) | 1,472 (81.2%) |
| Total (Category) | 8,797 (47.2%) | 9,839 (52.8%) |
| Total (Overall) | 15,027 (49.2%) | 15,502 (50.8%) |
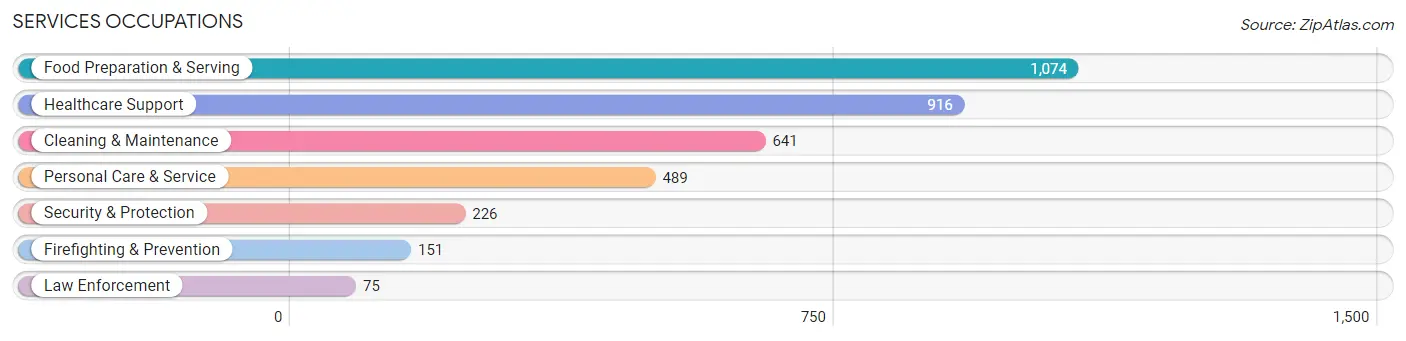
Services Occupations
The most common Services occupations in St Louis Park are Food Preparation & Serving (1,074 | 3.5%), Healthcare Support (916 | 3.0%), Cleaning & Maintenance (641 | 2.1%), Personal Care & Service (489 | 1.6%), and Security & Protection (226 | 0.7%).
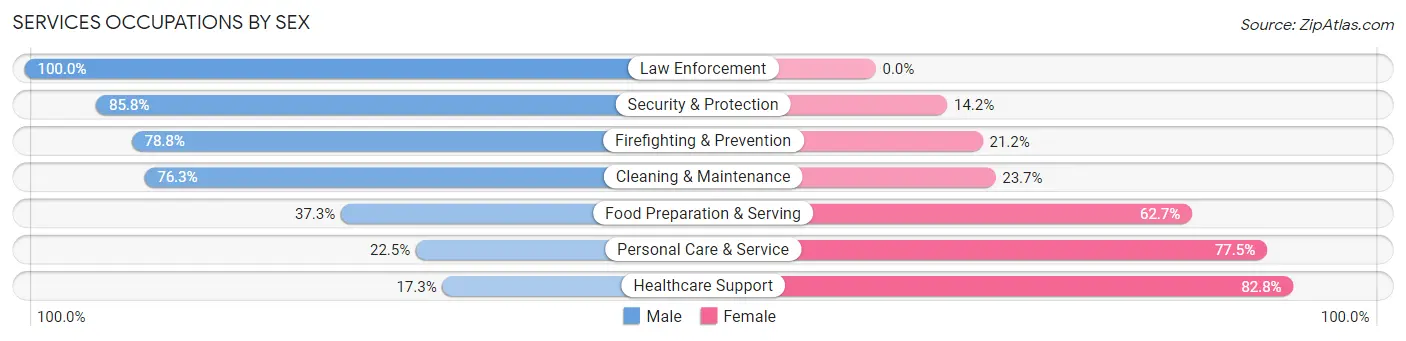
Services Occupations by Sex
Within the Services occupations in St Louis Park, the most male-oriented occupations are Law Enforcement (100.0%), Security & Protection (85.8%), and Firefighting & Prevention (78.8%), while the most female-oriented occupations are Healthcare Support (82.8%), Personal Care & Service (77.5%), and Food Preparation & Serving (62.7%).
| Occupation | Male | Female |
| Healthcare Support | 158 (17.2%) | 758 (82.8%) |
| Security & Protection | 194 (85.8%) | 32 (14.2%) |
| Firefighting & Prevention | 119 (78.8%) | 32 (21.2%) |
| Law Enforcement | 75 (100.0%) | 0 (0.0%) |
| Food Preparation & Serving | 401 (37.3%) | 673 (62.7%) |
| Cleaning & Maintenance | 489 (76.3%) | 152 (23.7%) |
| Personal Care & Service | 110 (22.5%) | 379 (77.5%) |
| Total (Category) | 1,352 (40.4%) | 1,994 (59.6%) |
| Total (Overall) | 15,027 (49.2%) | 15,502 (50.8%) |
Sales and Office Occupations
The most common Sales and Office occupations in St Louis Park are Sales & Related (2,904 | 9.5%), and Office & Administration (2,608 | 8.5%).
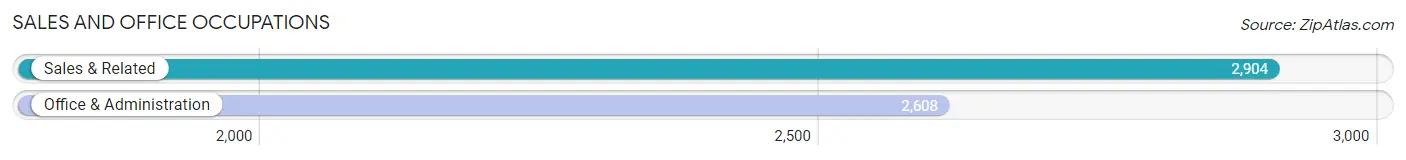
Sales and Office Occupations by Sex
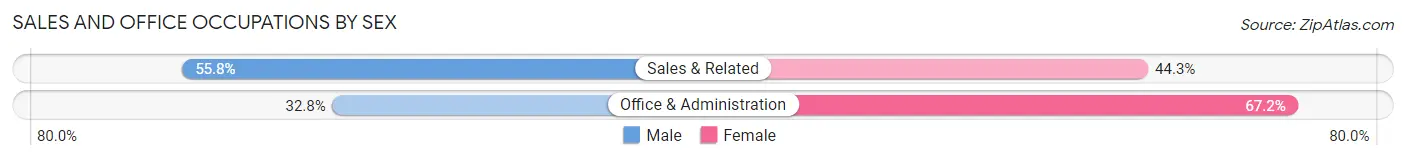
| Occupation | Male | Female |
| Sales & Related | 1,619 (55.7%) | 1,285 (44.3%) |
| Office & Administration | 855 (32.8%) | 1,753 (67.2%) |
| Total (Category) | 2,474 (44.9%) | 3,038 (55.1%) |
| Total (Overall) | 15,027 (49.2%) | 15,502 (50.8%) |
Natural Resources, Construction and Maintenance Occupations
The most common Natural Resources, Construction and Maintenance occupations in St Louis Park are Construction & Extraction (493 | 1.6%), Installation, Maintenance & Repair (300 | 1.0%), and Farming, Fishing & Forestry (134 | 0.4%).
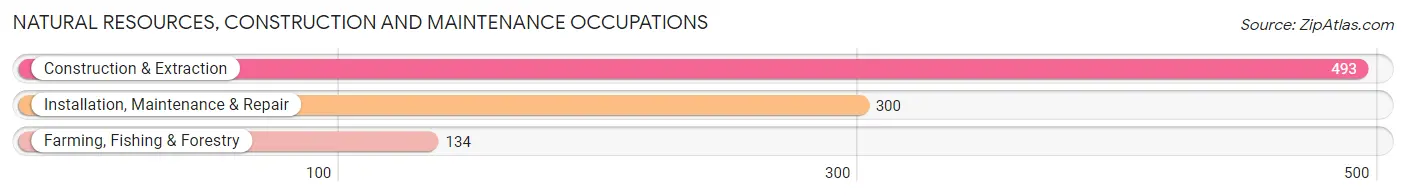
Natural Resources, Construction and Maintenance Occupations by Sex
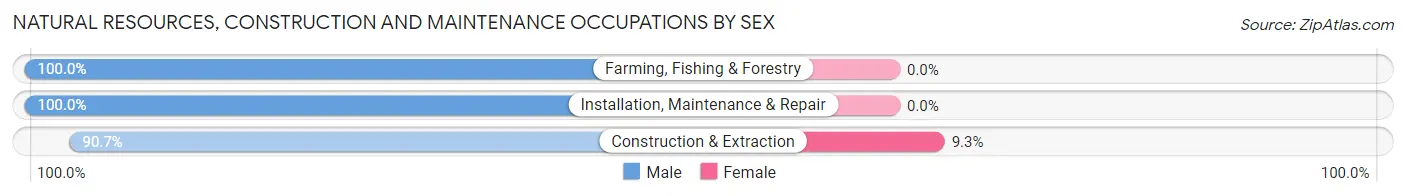
| Occupation | Male | Female |
| Farming, Fishing & Forestry | 134 (100.0%) | 0 (0.0%) |
| Construction & Extraction | 447 (90.7%) | 46 (9.3%) |
| Installation, Maintenance & Repair | 300 (100.0%) | 0 (0.0%) |
| Total (Category) | 881 (95.0%) | 46 (5.0%) |
| Total (Overall) | 15,027 (49.2%) | 15,502 (50.8%) |
Production, Transportation and Moving Occupations
The most common Production, Transportation and Moving occupations in St Louis Park are Production (879 | 2.9%), Material Moving (629 | 2.1%), and Transportation (600 | 2.0%).
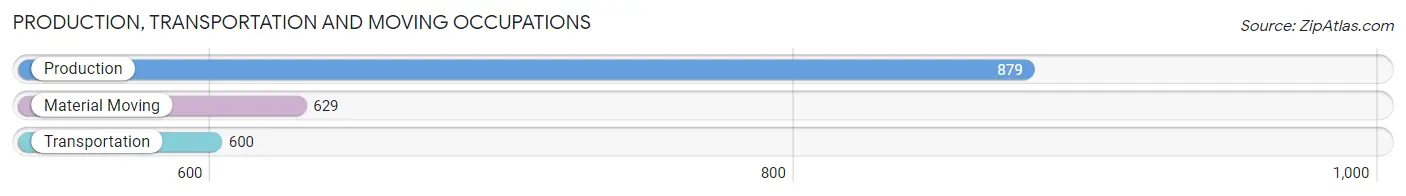
Production, Transportation and Moving Occupations by Sex
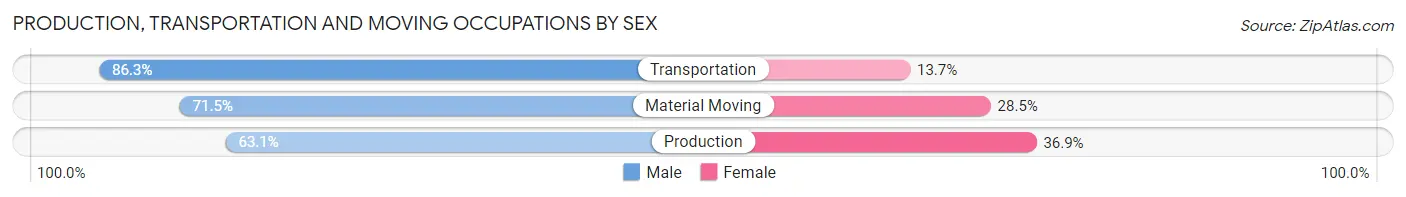
| Occupation | Male | Female |
| Production | 555 (63.1%) | 324 (36.9%) |
| Transportation | 518 (86.3%) | 82 (13.7%) |
| Material Moving | 450 (71.5%) | 179 (28.5%) |
| Total (Category) | 1,523 (72.3%) | 585 (27.8%) |
| Total (Overall) | 15,027 (49.2%) | 15,502 (50.8%) |
Employment Industries by Sex in St Louis Park
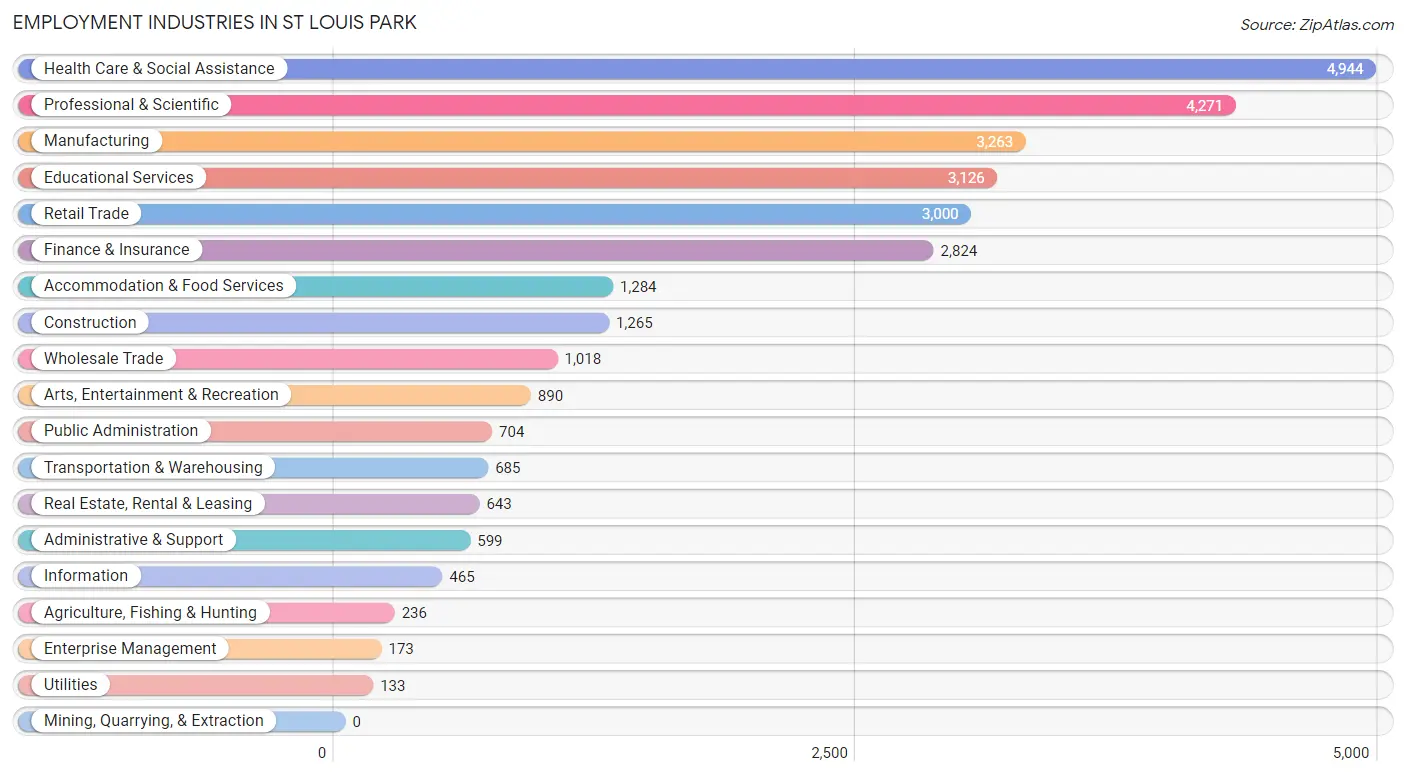
Employment Industries in St Louis Park
The major employment industries in St Louis Park include Health Care & Social Assistance (4,944 | 16.2%), Professional & Scientific (4,271 | 14.0%), Manufacturing (3,263 | 10.7%), Educational Services (3,126 | 10.2%), and Retail Trade (3,000 | 9.8%).
Employment Industries by Sex in St Louis Park
The St Louis Park industries that see more men than women are Agriculture, Fishing & Hunting (96.2%), Construction (76.4%), and Information (74.8%), whereas the industries that tend to have a higher number of women are Health Care & Social Assistance (77.4%), Educational Services (65.7%), and Real Estate, Rental & Leasing (57.2%).
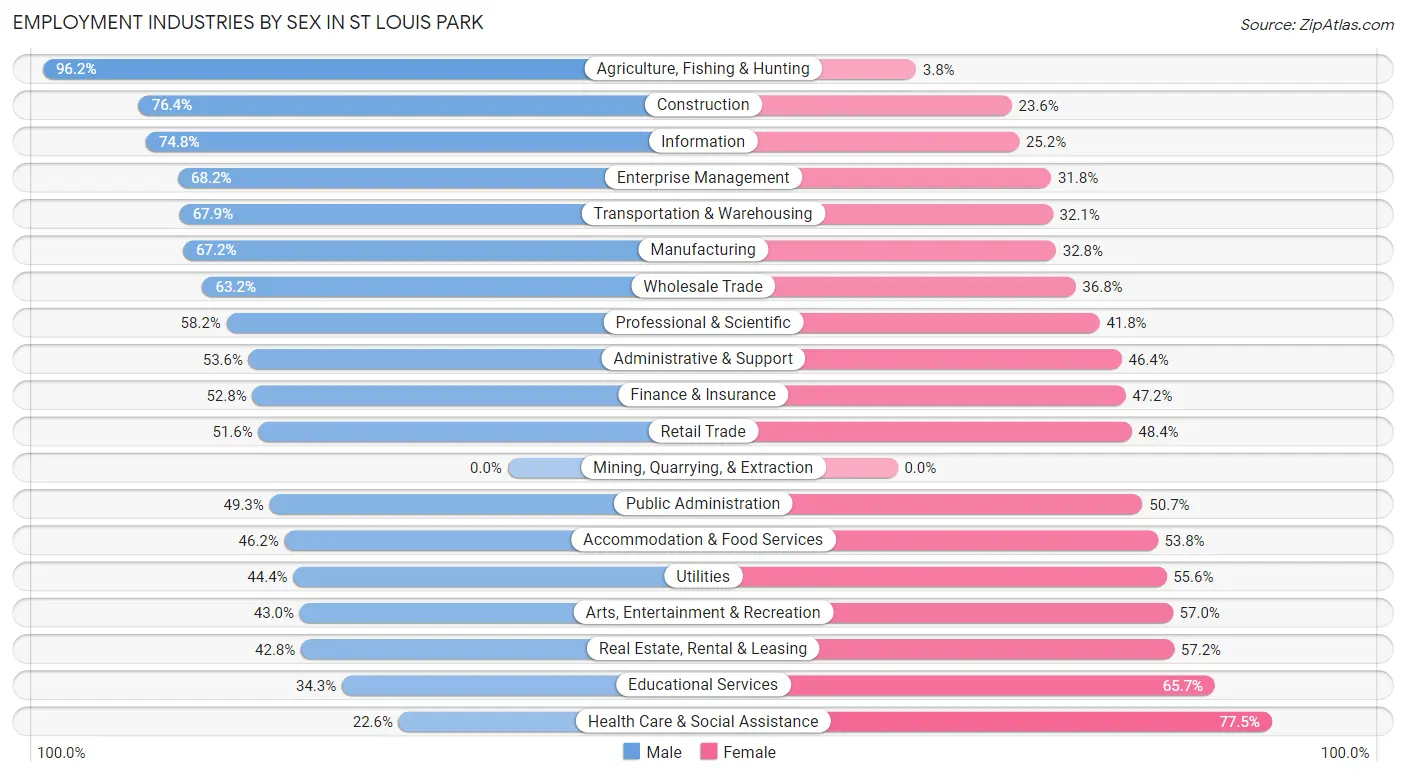
| Industry | Male | Female |
| Agriculture, Fishing & Hunting | 227 (96.2%) | 9 (3.8%) |
| Mining, Quarrying, & Extraction | 0 (0.0%) | 0 (0.0%) |
| Construction | 966 (76.4%) | 299 (23.6%) |
| Manufacturing | 2,193 (67.2%) | 1,070 (32.8%) |
| Wholesale Trade | 643 (63.2%) | 375 (36.8%) |
| Retail Trade | 1,547 (51.6%) | 1,453 (48.4%) |
| Transportation & Warehousing | 465 (67.9%) | 220 (32.1%) |
| Utilities | 59 (44.4%) | 74 (55.6%) |
| Information | 348 (74.8%) | 117 (25.2%) |
| Finance & Insurance | 1,492 (52.8%) | 1,332 (47.2%) |
| Real Estate, Rental & Leasing | 275 (42.8%) | 368 (57.2%) |
| Professional & Scientific | 2,485 (58.2%) | 1,786 (41.8%) |
| Enterprise Management | 118 (68.2%) | 55 (31.8%) |
| Administrative & Support | 321 (53.6%) | 278 (46.4%) |
| Educational Services | 1,072 (34.3%) | 2,054 (65.7%) |
| Health Care & Social Assistance | 1,115 (22.6%) | 3,829 (77.4%) |
| Arts, Entertainment & Recreation | 383 (43.0%) | 507 (57.0%) |
| Accommodation & Food Services | 593 (46.2%) | 691 (53.8%) |
| Public Administration | 347 (49.3%) | 357 (50.7%) |
| Total | 15,027 (49.2%) | 15,502 (50.8%) |
Education in St Louis Park
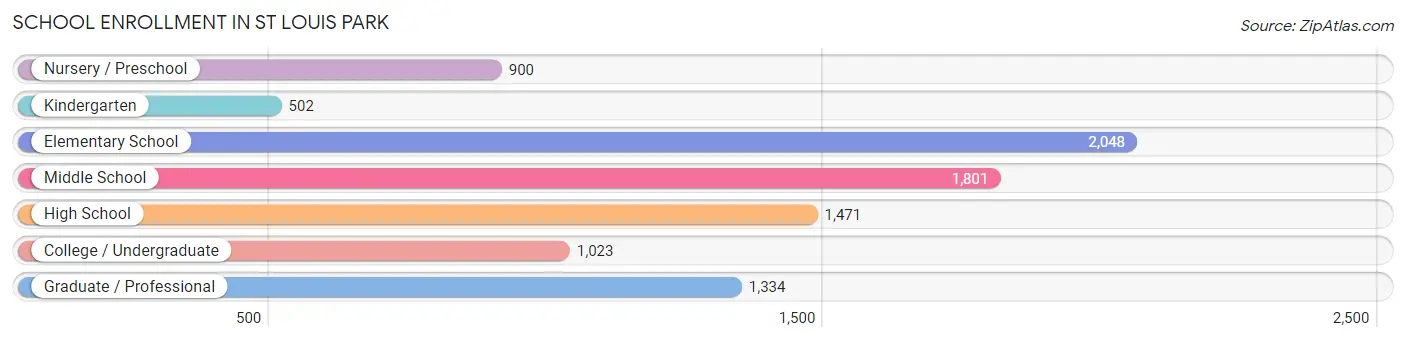
School Enrollment in St Louis Park
The most common levels of schooling among the 9,079 students in St Louis Park are elementary school (2,048 | 22.6%), middle school (1,801 | 19.8%), and high school (1,471 | 16.2%).
| School Level | # Students | % Students |
| Nursery / Preschool | 900 | 9.9% |
| Kindergarten | 502 | 5.5% |
| Elementary School | 2,048 | 22.6% |
| Middle School | 1,801 | 19.8% |
| High School | 1,471 | 16.2% |
| College / Undergraduate | 1,023 | 11.3% |
| Graduate / Professional | 1,334 | 14.7% |
| Total | 9,079 | 100.0% |
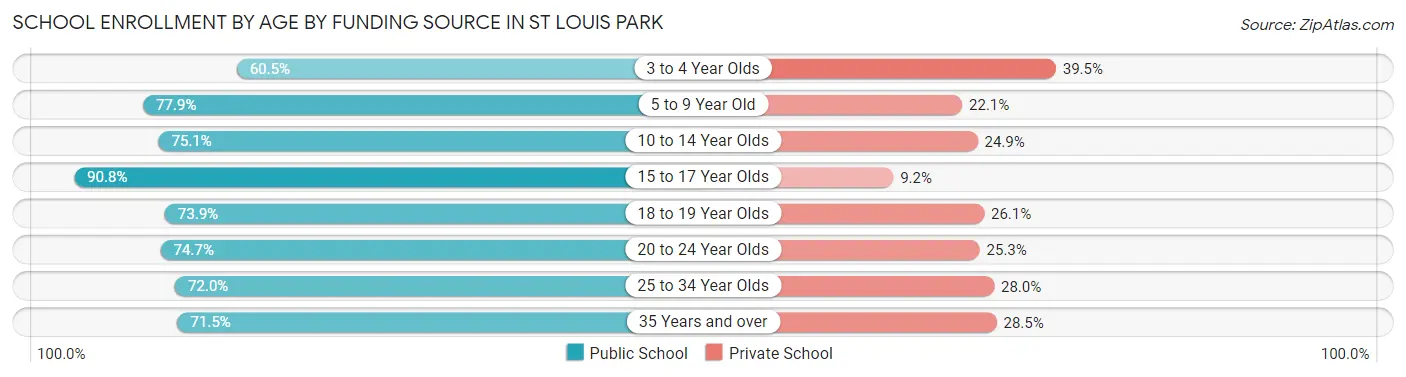
School Enrollment by Age by Funding Source in St Louis Park
Out of a total of 9,079 students who are enrolled in schools in St Louis Park, 2,170 (23.9%) attend a private institution, while the remaining 6,909 (76.1%) are enrolled in public schools. The age group of 3 to 4 year olds has the highest likelihood of being enrolled in private schools, with 273 (39.5% in the age bracket) enrolled. Conversely, the age group of 15 to 17 year olds has the lowest likelihood of being enrolled in a private school, with 1,072 (90.8% in the age bracket) attending a public institution.
| Age Bracket | Public School | Private School |
| 3 to 4 Year Olds | 418 (60.5%) | 273 (39.5%) |
| 5 to 9 Year Old | 1,890 (77.9%) | 535 (22.1%) |
| 10 to 14 Year Olds | 1,676 (75.1%) | 557 (24.9%) |
| 15 to 17 Year Olds | 1,072 (90.8%) | 109 (9.2%) |
| 18 to 19 Year Olds | 243 (73.9%) | 86 (26.1%) |
| 20 to 24 Year Olds | 345 (74.7%) | 117 (25.3%) |
| 25 to 34 Year Olds | 861 (72.0%) | 335 (28.0%) |
| 35 Years and over | 402 (71.5%) | 160 (28.5%) |
| Total | 6,909 (76.1%) | 2,170 (23.9%) |
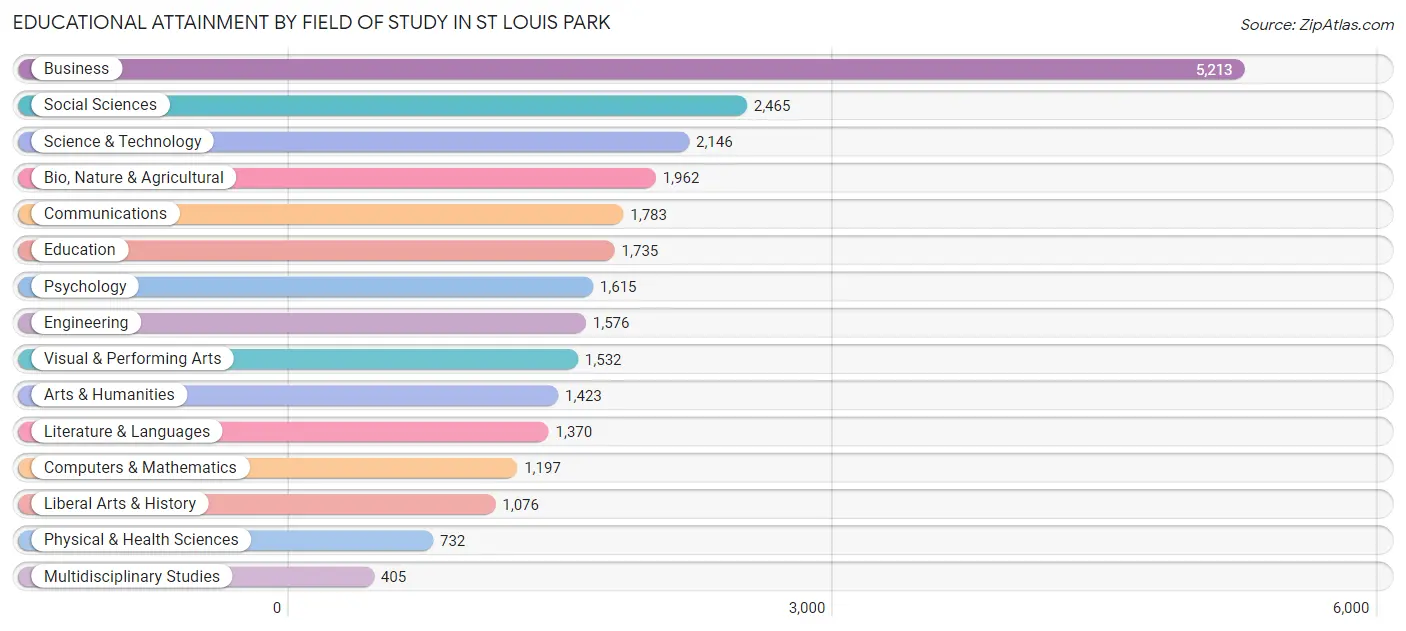
Educational Attainment by Field of Study in St Louis Park
Business (5,213 | 19.9%), social sciences (2,465 | 9.4%), science & technology (2,146 | 8.2%), bio, nature & agricultural (1,962 | 7.5%), and communications (1,783 | 6.8%) are the most common fields of study among 26,230 individuals in St Louis Park who have obtained a bachelor's degree or higher.
| Field of Study | # Graduates | % Graduates |
| Computers & Mathematics | 1,197 | 4.6% |
| Bio, Nature & Agricultural | 1,962 | 7.5% |
| Physical & Health Sciences | 732 | 2.8% |
| Psychology | 1,615 | 6.2% |
| Social Sciences | 2,465 | 9.4% |
| Engineering | 1,576 | 6.0% |
| Multidisciplinary Studies | 405 | 1.5% |
| Science & Technology | 2,146 | 8.2% |
| Business | 5,213 | 19.9% |
| Education | 1,735 | 6.6% |
| Literature & Languages | 1,370 | 5.2% |
| Liberal Arts & History | 1,076 | 4.1% |
| Visual & Performing Arts | 1,532 | 5.8% |
| Communications | 1,783 | 6.8% |
| Arts & Humanities | 1,423 | 5.4% |
| Total | 26,230 | 100.0% |
Transportation & Commute in St Louis Park
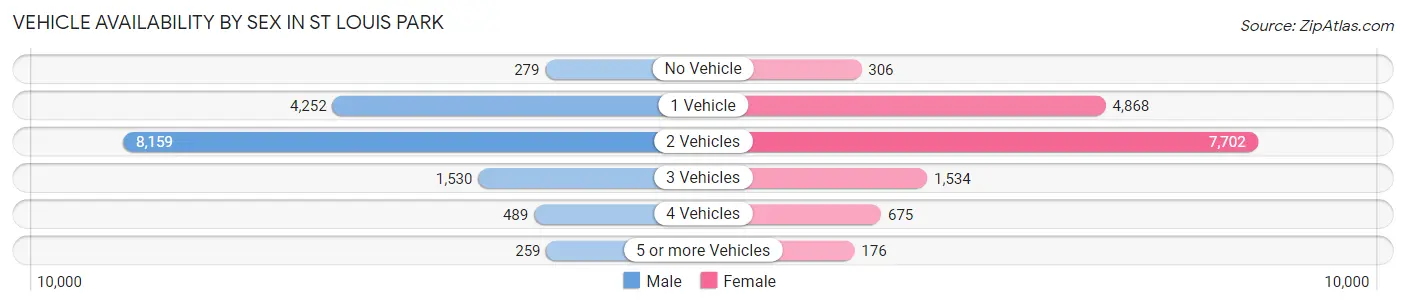
Vehicle Availability by Sex in St Louis Park
The most prevalent vehicle ownership categories in St Louis Park are males with 2 vehicles (8,159, accounting for 54.5%) and females with 2 vehicles (7,702, making up 53.5%).
| Vehicles Available | Male | Female |
| No Vehicle | 279 (1.9%) | 306 (2.0%) |
| 1 Vehicle | 4,252 (28.4%) | 4,868 (31.9%) |
| 2 Vehicles | 8,159 (54.5%) | 7,702 (50.5%) |
| 3 Vehicles | 1,530 (10.2%) | 1,534 (10.1%) |
| 4 Vehicles | 489 (3.3%) | 675 (4.4%) |
| 5 or more Vehicles | 259 (1.7%) | 176 (1.1%) |
| Total | 14,968 (100.0%) | 15,261 (100.0%) |
Commute Time in St Louis Park
The most frequently occuring commute durations in St Louis Park are 20 to 24 minutes (5,287 commuters, 22.2%), 15 to 19 minutes (4,939 commuters, 20.7%), and 10 to 14 minutes (3,477 commuters, 14.6%).
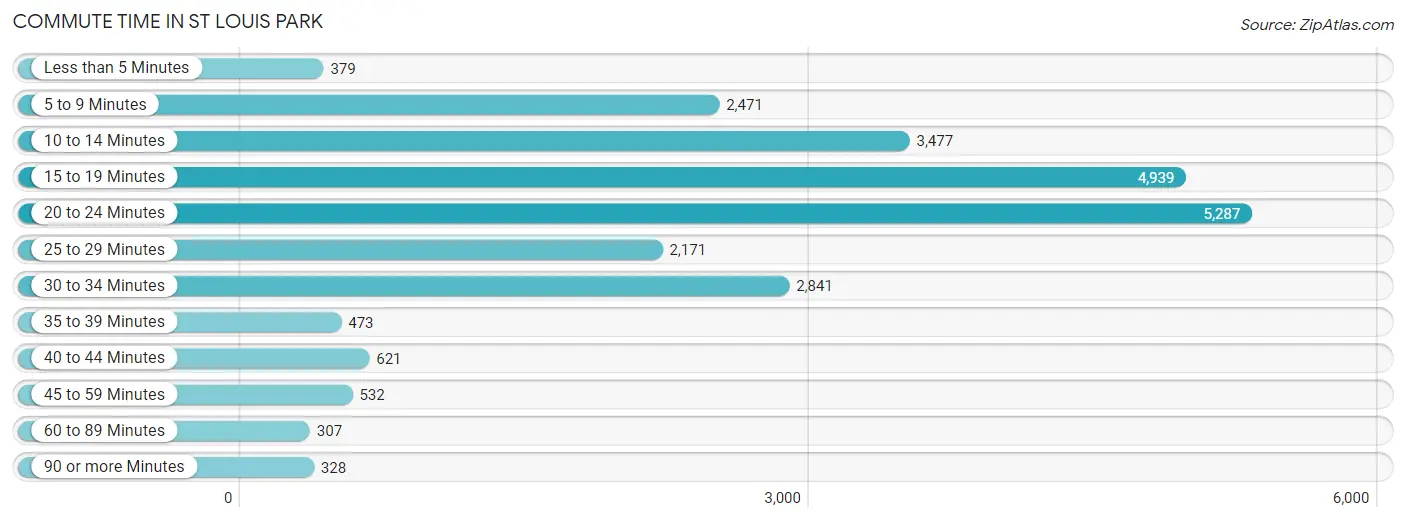
| Commute Time | # Commuters | % Commuters |
| Less than 5 Minutes | 379 | 1.6% |
| 5 to 9 Minutes | 2,471 | 10.4% |
| 10 to 14 Minutes | 3,477 | 14.6% |
| 15 to 19 Minutes | 4,939 | 20.7% |
| 20 to 24 Minutes | 5,287 | 22.2% |
| 25 to 29 Minutes | 2,171 | 9.1% |
| 30 to 34 Minutes | 2,841 | 11.9% |
| 35 to 39 Minutes | 473 | 2.0% |
| 40 to 44 Minutes | 621 | 2.6% |
| 45 to 59 Minutes | 532 | 2.2% |
| 60 to 89 Minutes | 307 | 1.3% |
| 90 or more Minutes | 328 | 1.4% |
Commute Time by Sex in St Louis Park
The most common commute times in St Louis Park are 20 to 24 minutes (3,093 commuters, 26.0%) for males and 15 to 19 minutes (2,645 commuters, 22.2%) for females.
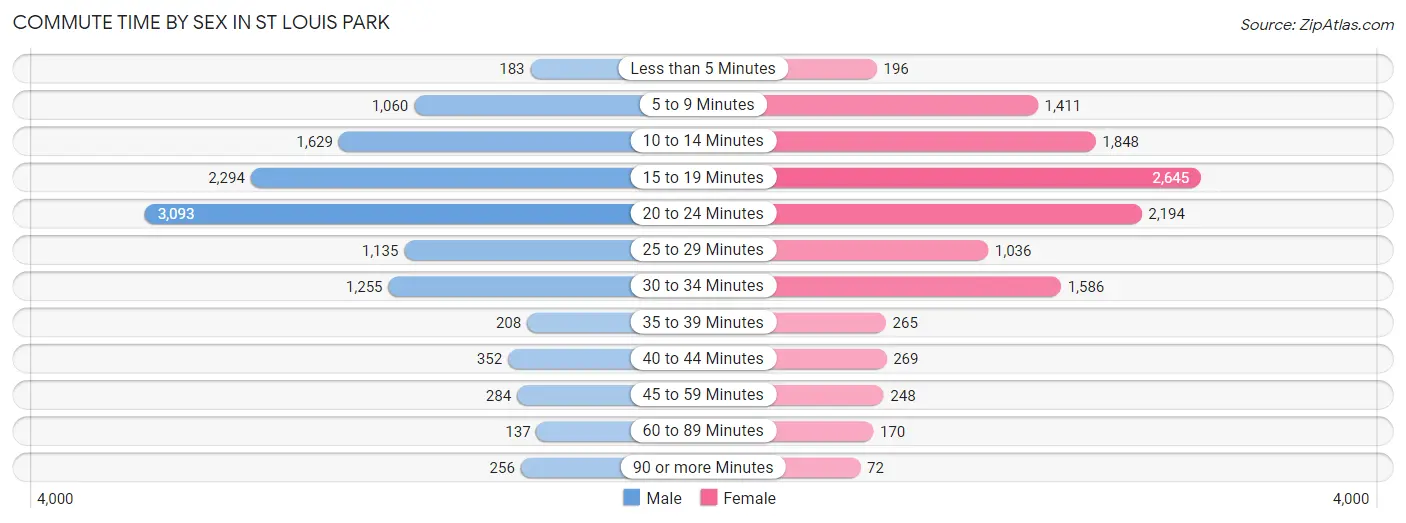
| Commute Time | Male | Female |
| Less than 5 Minutes | 183 (1.5%) | 196 (1.6%) |
| 5 to 9 Minutes | 1,060 (8.9%) | 1,411 (11.8%) |
| 10 to 14 Minutes | 1,629 (13.7%) | 1,848 (15.5%) |
| 15 to 19 Minutes | 2,294 (19.3%) | 2,645 (22.2%) |
| 20 to 24 Minutes | 3,093 (26.0%) | 2,194 (18.4%) |
| 25 to 29 Minutes | 1,135 (9.6%) | 1,036 (8.7%) |
| 30 to 34 Minutes | 1,255 (10.6%) | 1,586 (13.3%) |
| 35 to 39 Minutes | 208 (1.8%) | 265 (2.2%) |
| 40 to 44 Minutes | 352 (3.0%) | 269 (2.2%) |
| 45 to 59 Minutes | 284 (2.4%) | 248 (2.1%) |
| 60 to 89 Minutes | 137 (1.1%) | 170 (1.4%) |
| 90 or more Minutes | 256 (2.1%) | 72 (0.6%) |
Time of Departure to Work by Sex in St Louis Park
The most frequent times of departure to work in St Louis Park are 7:30 AM to 7:59 AM (2,156, 18.1%) for males and 7:30 AM to 7:59 AM (2,116, 17.7%) for females.
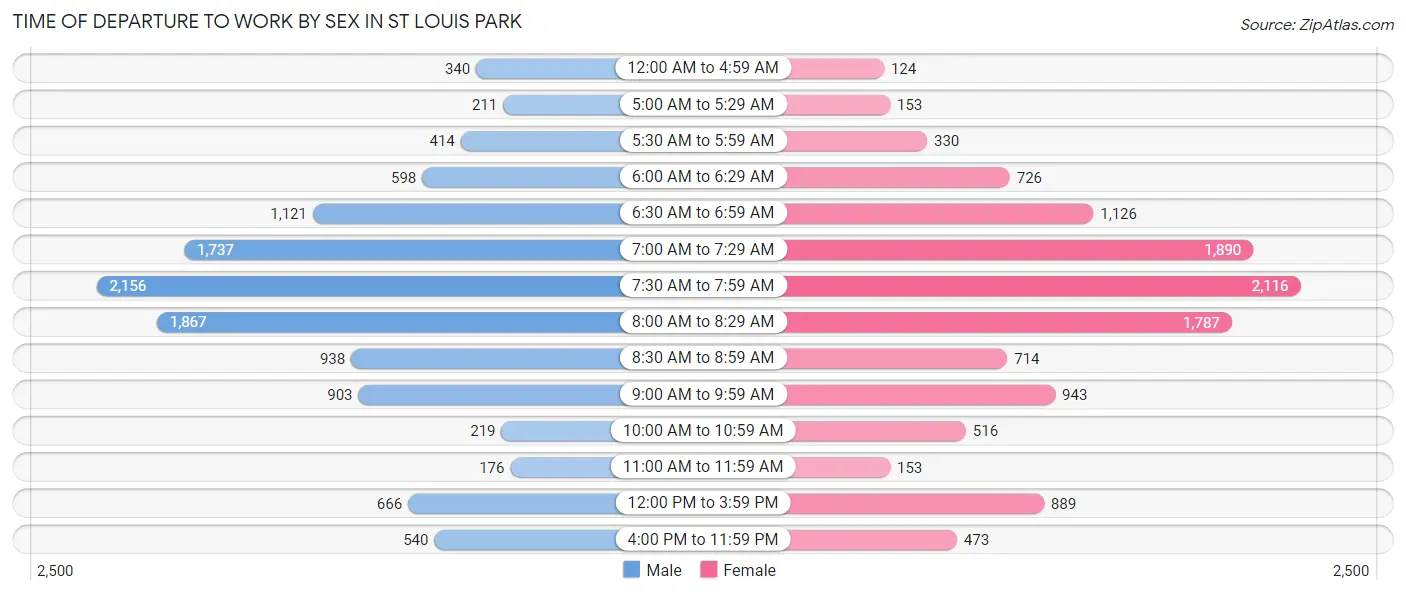
| Time of Departure | Male | Female |
| 12:00 AM to 4:59 AM | 340 (2.9%) | 124 (1.0%) |
| 5:00 AM to 5:29 AM | 211 (1.8%) | 153 (1.3%) |
| 5:30 AM to 5:59 AM | 414 (3.5%) | 330 (2.8%) |
| 6:00 AM to 6:29 AM | 598 (5.0%) | 726 (6.1%) |
| 6:30 AM to 6:59 AM | 1,121 (9.4%) | 1,126 (9.4%) |
| 7:00 AM to 7:29 AM | 1,737 (14.6%) | 1,890 (15.8%) |
| 7:30 AM to 7:59 AM | 2,156 (18.1%) | 2,116 (17.7%) |
| 8:00 AM to 8:29 AM | 1,867 (15.7%) | 1,787 (15.0%) |
| 8:30 AM to 8:59 AM | 938 (7.9%) | 714 (6.0%) |
| 9:00 AM to 9:59 AM | 903 (7.6%) | 943 (7.9%) |
| 10:00 AM to 10:59 AM | 219 (1.8%) | 516 (4.3%) |
| 11:00 AM to 11:59 AM | 176 (1.5%) | 153 (1.3%) |
| 12:00 PM to 3:59 PM | 666 (5.6%) | 889 (7.4%) |
| 4:00 PM to 11:59 PM | 540 (4.5%) | 473 (4.0%) |
| Total | 11,886 (100.0%) | 11,940 (100.0%) |
Housing Occupancy in St Louis Park
Occupancy by Ownership in St Louis Park
Of the total 24,098 dwellings in St Louis Park, owner-occupied units account for 14,155 (58.7%), while renter-occupied units make up 9,943 (41.3%).
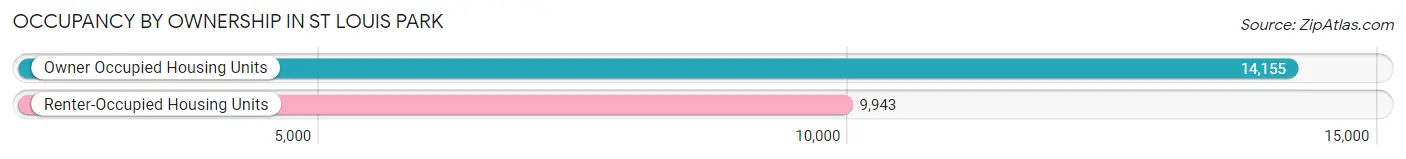
| Occupancy | # Housing Units | % Housing Units |
| Owner Occupied Housing Units | 14,155 | 58.7% |
| Renter-Occupied Housing Units | 9,943 | 41.3% |
| Total Occupied Housing Units | 24,098 | 100.0% |
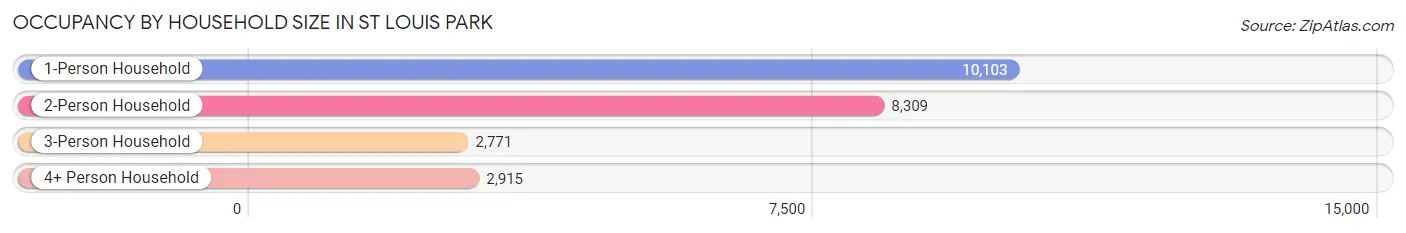
Occupancy by Household Size in St Louis Park
| Household Size | # Housing Units | % Housing Units |
| 1-Person Household | 10,103 | 41.9% |
| 2-Person Household | 8,309 | 34.5% |
| 3-Person Household | 2,771 | 11.5% |
| 4+ Person Household | 2,915 | 12.1% |
| Total Housing Units | 24,098 | 100.0% |
Occupancy by Ownership by Household Size in St Louis Park
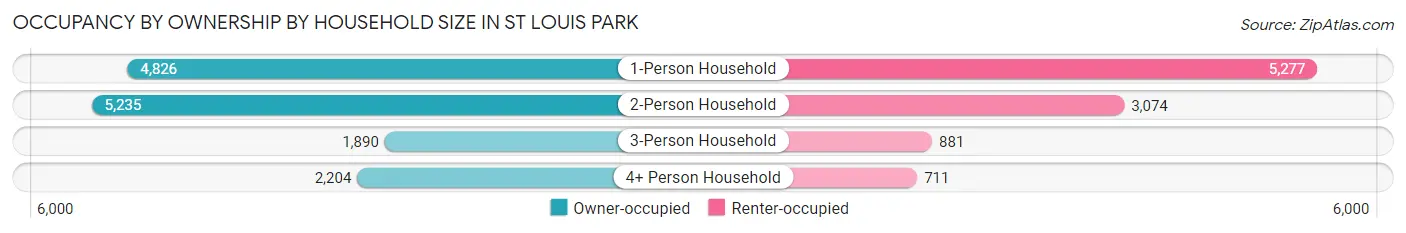
| Household Size | Owner-occupied | Renter-occupied |
| 1-Person Household | 4,826 (47.8%) | 5,277 (52.2%) |
| 2-Person Household | 5,235 (63.0%) | 3,074 (37.0%) |
| 3-Person Household | 1,890 (68.2%) | 881 (31.8%) |
| 4+ Person Household | 2,204 (75.6%) | 711 (24.4%) |
| Total Housing Units | 14,155 (58.7%) | 9,943 (41.3%) |
Occupancy by Educational Attainment in St Louis Park
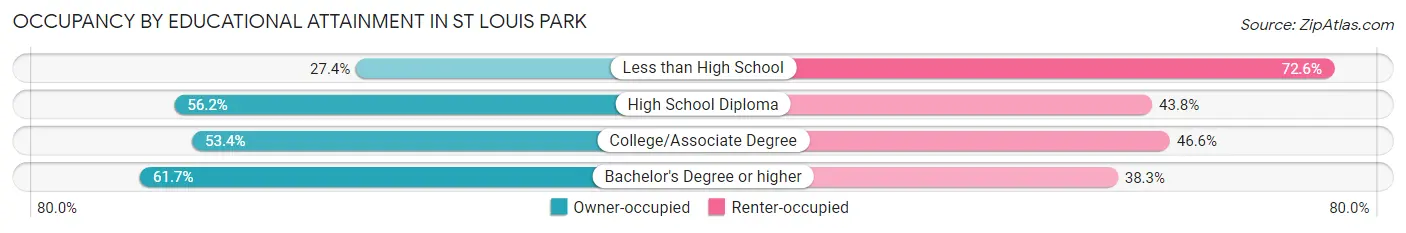
| Household Size | Owner-occupied | Renter-occupied |
| Less than High School | 105 (27.4%) | 278 (72.6%) |
| High School Diploma | 1,418 (56.2%) | 1,104 (43.8%) |
| College/Associate Degree | 2,835 (53.4%) | 2,472 (46.6%) |
| Bachelor's Degree or higher | 9,797 (61.7%) | 6,089 (38.3%) |
Occupancy by Age of Householder in St Louis Park
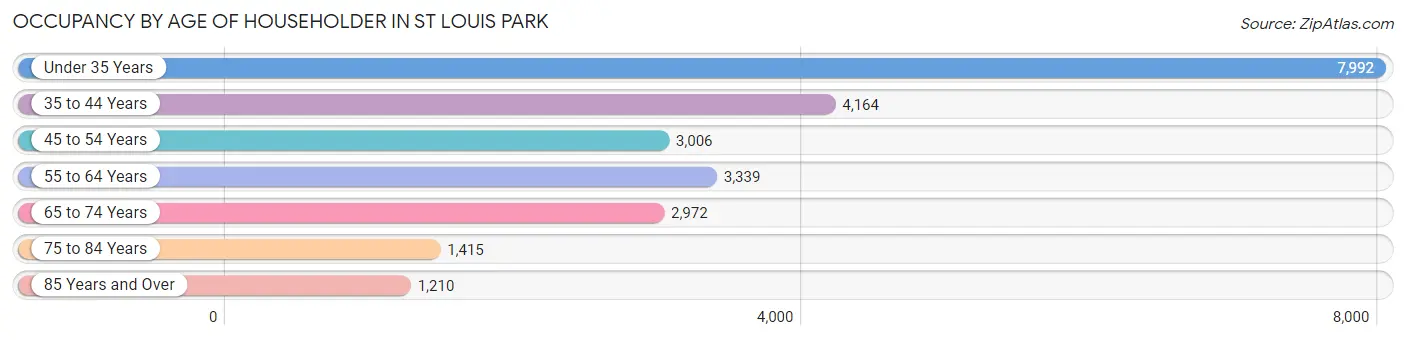
| Age Bracket | # Households | % Households |
| Under 35 Years | 7,992 | 33.2% |
| 35 to 44 Years | 4,164 | 17.3% |
| 45 to 54 Years | 3,006 | 12.5% |
| 55 to 64 Years | 3,339 | 13.9% |
| 65 to 74 Years | 2,972 | 12.3% |
| 75 to 84 Years | 1,415 | 5.9% |
| 85 Years and Over | 1,210 | 5.0% |
| Total | 24,098 | 100.0% |
Housing Finances in St Louis Park
Median Income by Occupancy in St Louis Park
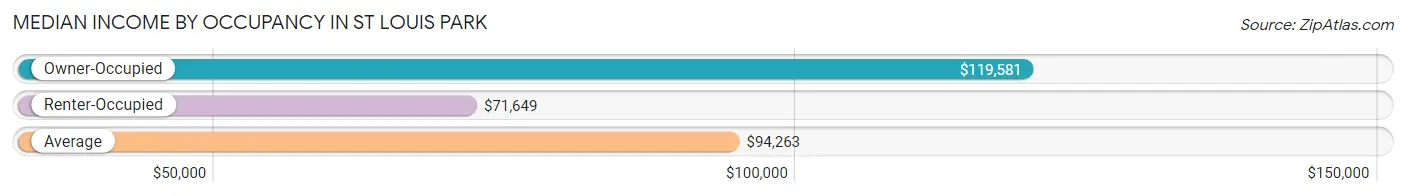
| Occupancy Type | # Households | Median Income |
| Owner-Occupied | 14,155 (58.7%) | $119,581 |
| Renter-Occupied | 9,943 (41.3%) | $71,649 |
| Average | 24,098 (100.0%) | $94,263 |
Occupancy by Householder Income Bracket in St Louis Park
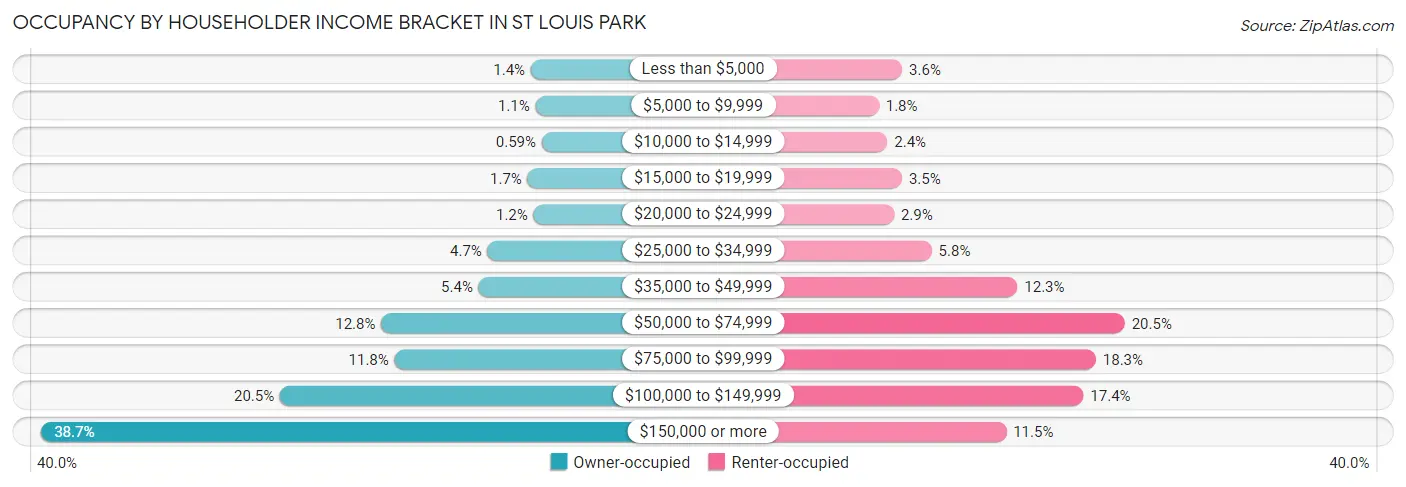
| Income Bracket | Owner-occupied | Renter-occupied |
| Less than $5,000 | 201 (1.4%) | 353 (3.5%) |
| $5,000 to $9,999 | 152 (1.1%) | 176 (1.8%) |
| $10,000 to $14,999 | 83 (0.6%) | 241 (2.4%) |
| $15,000 to $19,999 | 237 (1.7%) | 352 (3.5%) |
| $20,000 to $24,999 | 172 (1.2%) | 291 (2.9%) |
| $25,000 to $34,999 | 668 (4.7%) | 577 (5.8%) |
| $35,000 to $49,999 | 765 (5.4%) | 1,226 (12.3%) |
| $50,000 to $74,999 | 1,815 (12.8%) | 2,039 (20.5%) |
| $75,000 to $99,999 | 1,672 (11.8%) | 1,821 (18.3%) |
| $100,000 to $149,999 | 2,908 (20.5%) | 1,726 (17.4%) |
| $150,000 or more | 5,482 (38.7%) | 1,141 (11.5%) |
| Total | 14,155 (100.0%) | 9,943 (100.0%) |
Monthly Housing Cost Tiers in St Louis Park
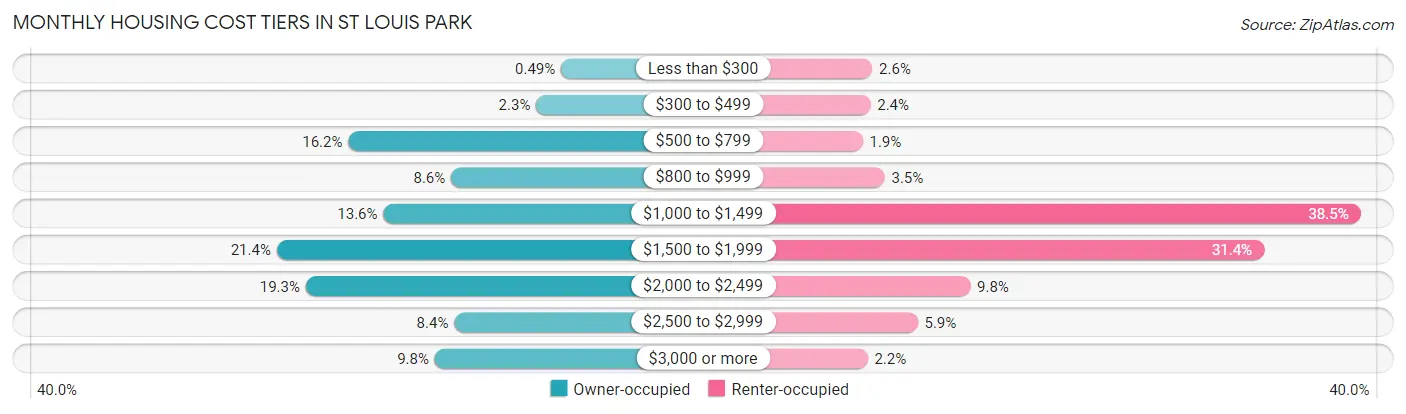
| Monthly Cost | Owner-occupied | Renter-occupied |
| Less than $300 | 70 (0.5%) | 255 (2.6%) |
| $300 to $499 | 328 (2.3%) | 241 (2.4%) |
| $500 to $799 | 2,287 (16.2%) | 184 (1.8%) |
| $800 to $999 | 1,216 (8.6%) | 345 (3.5%) |
| $1,000 to $1,499 | 1,922 (13.6%) | 3,830 (38.5%) |
| $1,500 to $1,999 | 3,033 (21.4%) | 3,123 (31.4%) |
| $2,000 to $2,499 | 2,730 (19.3%) | 971 (9.8%) |
| $2,500 to $2,999 | 1,183 (8.4%) | 587 (5.9%) |
| $3,000 or more | 1,386 (9.8%) | 220 (2.2%) |
| Total | 14,155 (100.0%) | 9,943 (100.0%) |
Physical Housing Characteristics in St Louis Park
Housing Structures in St Louis Park
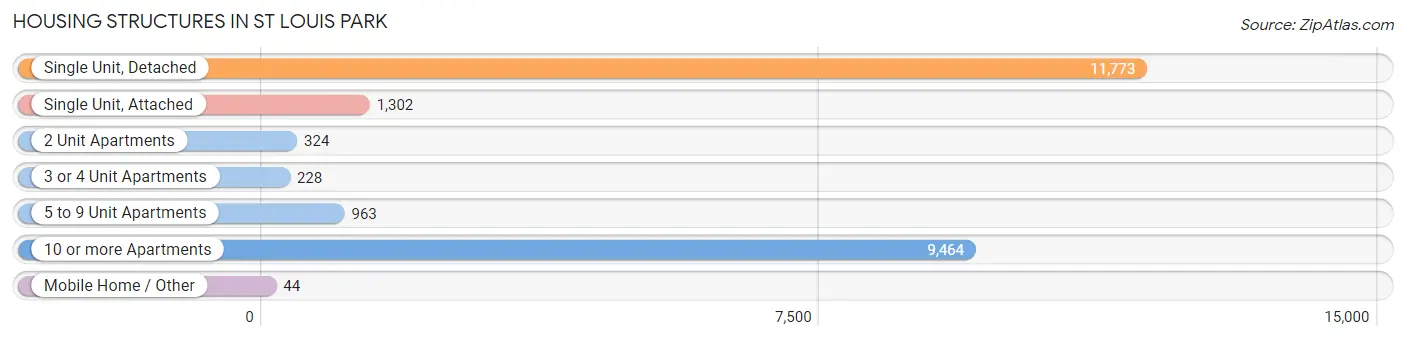
| Structure Type | # Housing Units | % Housing Units |
| Single Unit, Detached | 11,773 | 48.8% |
| Single Unit, Attached | 1,302 | 5.4% |
| 2 Unit Apartments | 324 | 1.3% |
| 3 or 4 Unit Apartments | 228 | 0.9% |
| 5 to 9 Unit Apartments | 963 | 4.0% |
| 10 or more Apartments | 9,464 | 39.3% |
| Mobile Home / Other | 44 | 0.2% |
| Total | 24,098 | 100.0% |
Housing Structures by Occupancy in St Louis Park
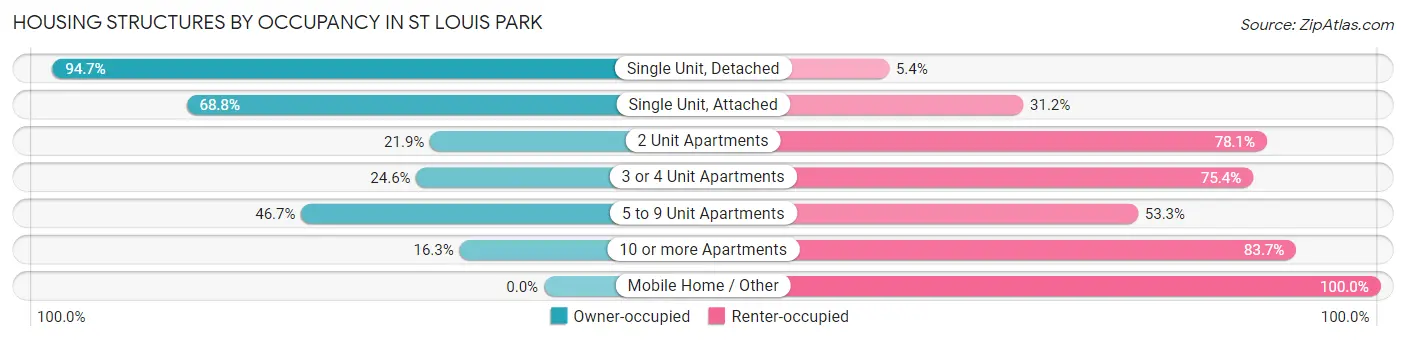
| Structure Type | Owner-occupied | Renter-occupied |
| Single Unit, Detached | 11,143 (94.7%) | 630 (5.3%) |
| Single Unit, Attached | 896 (68.8%) | 406 (31.2%) |
| 2 Unit Apartments | 71 (21.9%) | 253 (78.1%) |
| 3 or 4 Unit Apartments | 56 (24.6%) | 172 (75.4%) |
| 5 to 9 Unit Apartments | 450 (46.7%) | 513 (53.3%) |
| 10 or more Apartments | 1,539 (16.3%) | 7,925 (83.7%) |
| Mobile Home / Other | 0 (0.0%) | 44 (100.0%) |
| Total | 14,155 (58.7%) | 9,943 (41.3%) |
Housing Structures by Number of Rooms in St Louis Park
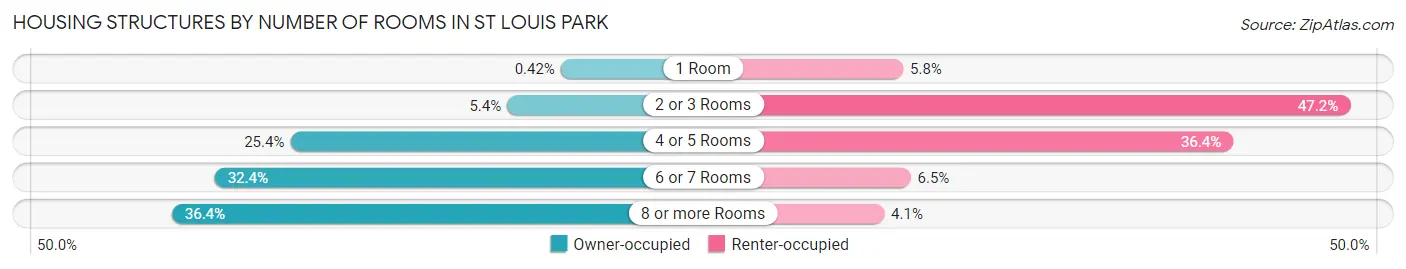
| Number of Rooms | Owner-occupied | Renter-occupied |
| 1 Room | 59 (0.4%) | 581 (5.8%) |
| 2 or 3 Rooms | 761 (5.4%) | 4,690 (47.2%) |
| 4 or 5 Rooms | 3,599 (25.4%) | 3,615 (36.4%) |
| 6 or 7 Rooms | 4,587 (32.4%) | 650 (6.5%) |
| 8 or more Rooms | 5,149 (36.4%) | 407 (4.1%) |
| Total | 14,155 (100.0%) | 9,943 (100.0%) |
Housing Structure by Heating Type in St Louis Park
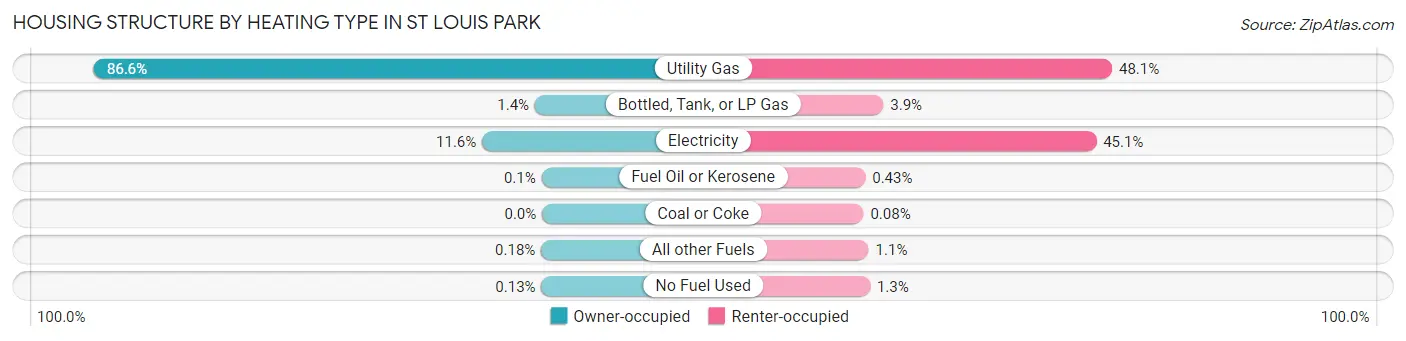
| Heating Type | Owner-occupied | Renter-occupied |
| Utility Gas | 12,260 (86.6%) | 4,784 (48.1%) |
| Bottled, Tank, or LP Gas | 196 (1.4%) | 390 (3.9%) |
| Electricity | 1,641 (11.6%) | 4,479 (45.1%) |
| Fuel Oil or Kerosene | 14 (0.1%) | 43 (0.4%) |
| Coal or Coke | 0 (0.0%) | 8 (0.1%) |
| All other Fuels | 25 (0.2%) | 107 (1.1%) |
| No Fuel Used | 19 (0.1%) | 132 (1.3%) |
| Total | 14,155 (100.0%) | 9,943 (100.0%) |
Household Vehicle Usage in St Louis Park
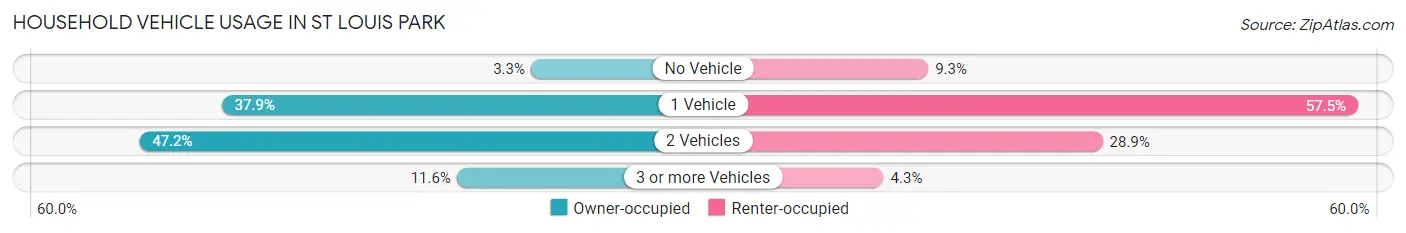
| Vehicles per Household | Owner-occupied | Renter-occupied |
| No Vehicle | 467 (3.3%) | 928 (9.3%) |
| 1 Vehicle | 5,370 (37.9%) | 5,713 (57.5%) |
| 2 Vehicles | 6,676 (47.2%) | 2,870 (28.9%) |
| 3 or more Vehicles | 1,642 (11.6%) | 432 (4.3%) |
| Total | 14,155 (100.0%) | 9,943 (100.0%) |
Real Estate & Mortgages in St Louis Park
Real Estate and Mortgage Overview in St Louis Park
| Characteristic | Without Mortgage | With Mortgage |
| Housing Units | 4,398 | 9,757 |
| Median Property Value | $335,700 | $366,600 |
| Median Household Income | $79,167 | $4,399 |
| Monthly Housing Costs | $758 | $1,386 |
| Real Estate Taxes | $4,189 | $61 |
Property Value by Mortgage Status in St Louis Park
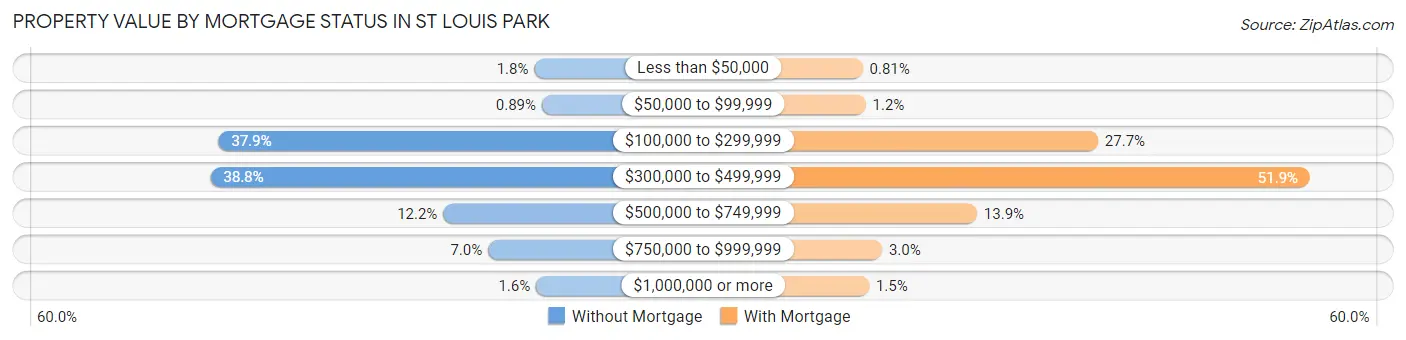
| Property Value | Without Mortgage | With Mortgage |
| Less than $50,000 | 77 (1.8%) | 79 (0.8%) |
| $50,000 to $99,999 | 39 (0.9%) | 112 (1.1%) |
| $100,000 to $299,999 | 1,665 (37.9%) | 2,703 (27.7%) |
| $300,000 to $499,999 | 1,705 (38.8%) | 5,066 (51.9%) |
| $500,000 to $749,999 | 535 (12.2%) | 1,353 (13.9%) |
| $750,000 to $999,999 | 309 (7.0%) | 295 (3.0%) |
| $1,000,000 or more | 68 (1.5%) | 149 (1.5%) |
| Total | 4,398 (100.0%) | 9,757 (100.0%) |
Household Income by Mortgage Status in St Louis Park
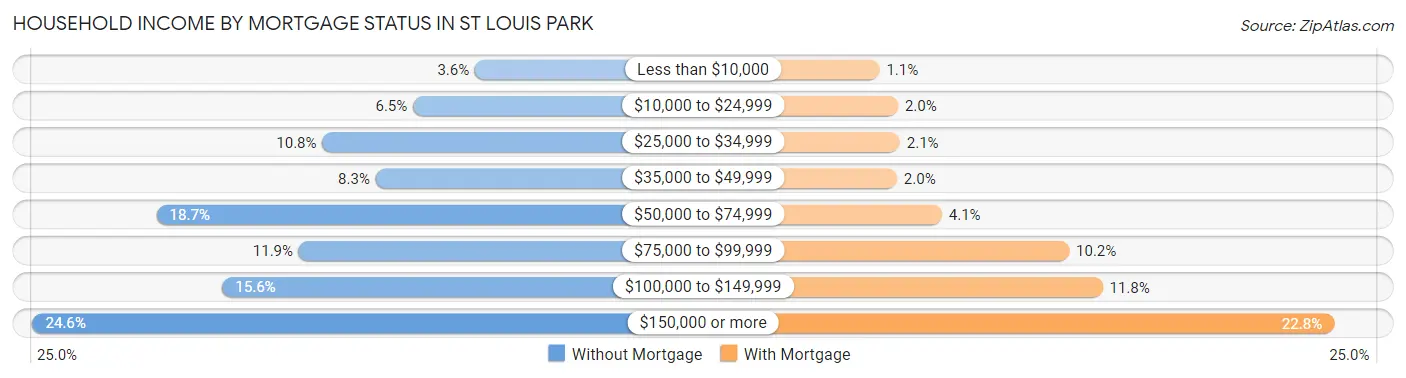
| Household Income | Without Mortgage | With Mortgage |
| Less than $10,000 | 156 (3.5%) | 111 (1.1%) |
| $10,000 to $24,999 | 286 (6.5%) | 197 (2.0%) |
| $25,000 to $34,999 | 476 (10.8%) | 206 (2.1%) |
| $35,000 to $49,999 | 364 (8.3%) | 192 (2.0%) |
| $50,000 to $74,999 | 823 (18.7%) | 401 (4.1%) |
| $75,000 to $99,999 | 525 (11.9%) | 992 (10.2%) |
| $100,000 to $149,999 | 685 (15.6%) | 1,147 (11.8%) |
| $150,000 or more | 1,083 (24.6%) | 2,223 (22.8%) |
| Total | 4,398 (100.0%) | 9,757 (100.0%) |
Property Value to Household Income Ratio in St Louis Park
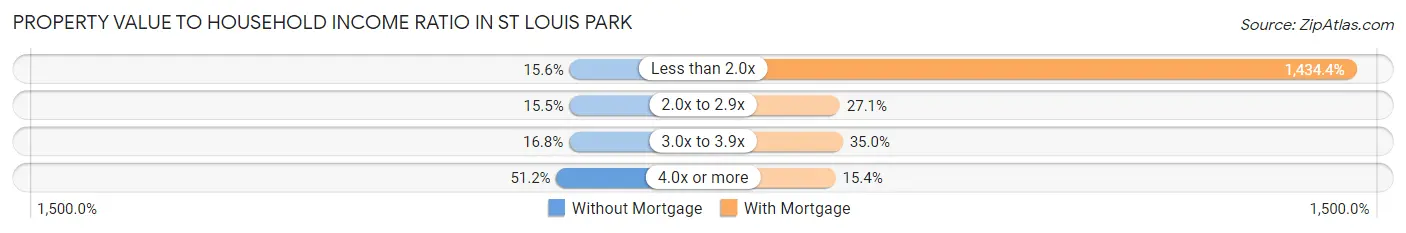
| Value-to-Income Ratio | Without Mortgage | With Mortgage |
| Less than 2.0x | 688 (15.6%) | 139,955 (1,434.4%) |
| 2.0x to 2.9x | 681 (15.5%) | 2,646 (27.1%) |
| 3.0x to 3.9x | 737 (16.8%) | 3,410 (34.9%) |
| 4.0x or more | 2,251 (51.2%) | 1,500 (15.4%) |
| Total | 4,398 (100.0%) | 9,757 (100.0%) |
Real Estate Taxes by Mortgage Status in St Louis Park
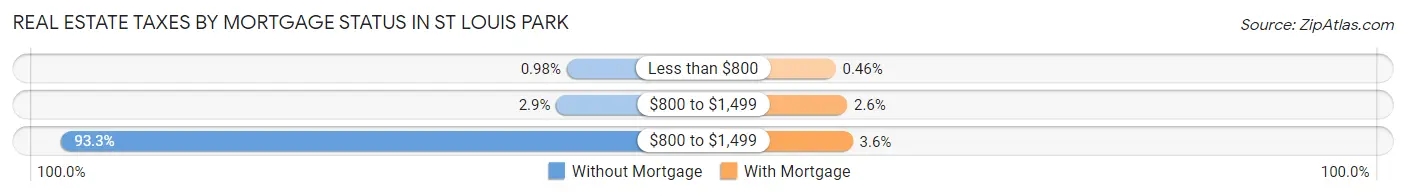
| Property Taxes | Without Mortgage | With Mortgage |
| Less than $800 | 43 (1.0%) | 45 (0.5%) |
| $800 to $1,499 | 127 (2.9%) | 250 (2.6%) |
| $800 to $1,499 | 4,103 (93.3%) | 348 (3.6%) |
| Total | 4,398 (100.0%) | 9,757 (100.0%) |
Health & Disability in St Louis Park
Health Insurance Coverage by Age in St Louis Park
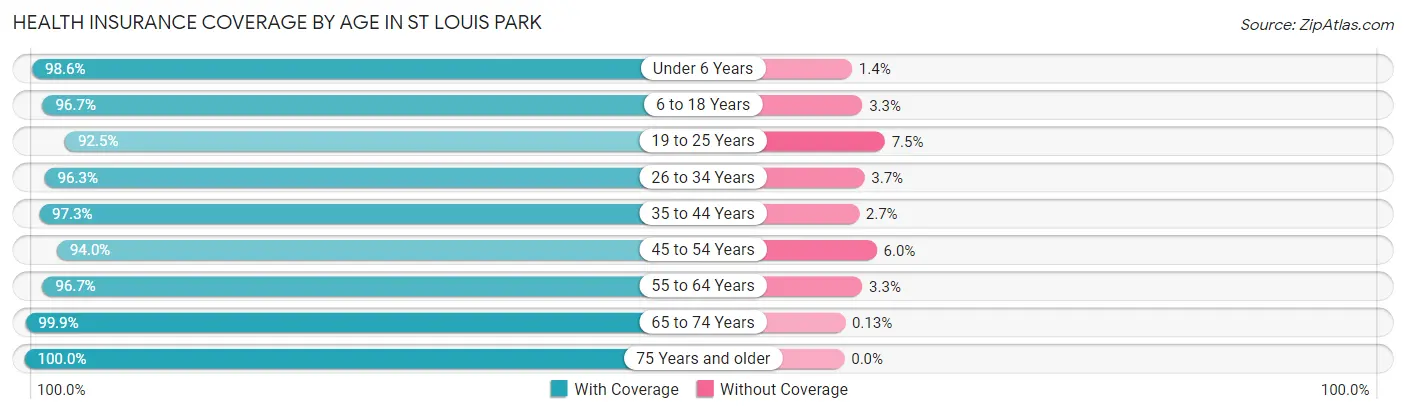
| Age Bracket | With Coverage | Without Coverage |
| Under 6 Years | 3,254 (98.6%) | 47 (1.4%) |
| 6 to 18 Years | 5,462 (96.7%) | 189 (3.3%) |
| 19 to 25 Years | 4,083 (92.5%) | 333 (7.5%) |
| 26 to 34 Years | 10,069 (96.3%) | 391 (3.7%) |
| 35 to 44 Years | 6,647 (97.3%) | 186 (2.7%) |
| 45 to 54 Years | 4,648 (94.0%) | 298 (6.0%) |
| 55 to 64 Years | 5,087 (96.7%) | 175 (3.3%) |
| 65 to 74 Years | 4,523 (99.9%) | 6 (0.1%) |
| 75 Years and older | 3,464 (100.0%) | 0 (0.0%) |
| Total | 47,237 (96.7%) | 1,625 (3.3%) |
Health Insurance Coverage by Citizenship Status in St Louis Park
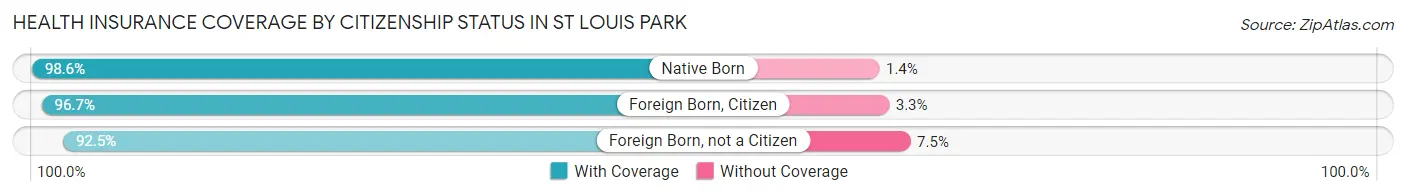
| Citizenship Status | With Coverage | Without Coverage |
| Native Born | 3,254 (98.6%) | 47 (1.4%) |
| Foreign Born, Citizen | 5,462 (96.7%) | 189 (3.3%) |
| Foreign Born, not a Citizen | 4,083 (92.5%) | 333 (7.5%) |
Health Insurance Coverage by Household Income in St Louis Park

| Household Income | With Coverage | Without Coverage |
| Under $25,000 | 2,921 (95.9%) | 125 (4.1%) |
| $25,000 to $49,999 | 5,041 (93.7%) | 338 (6.3%) |
| $50,000 to $74,999 | 5,839 (94.7%) | 328 (5.3%) |
| $75,000 to $99,999 | 6,047 (94.9%) | 328 (5.1%) |
| $100,000 and over | 27,250 (98.2%) | 500 (1.8%) |
Public vs Private Health Insurance Coverage by Age in St Louis Park
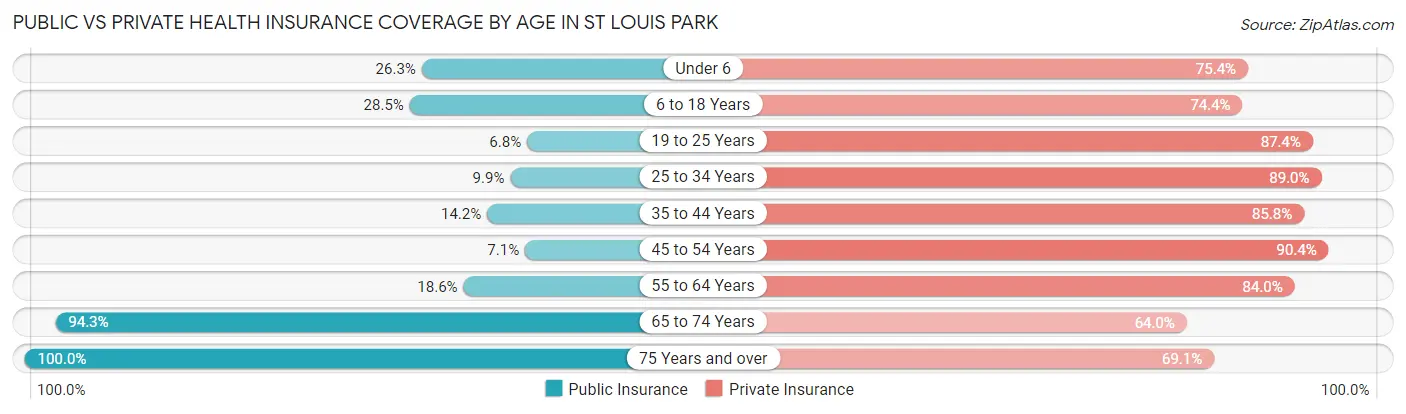
| Age Bracket | Public Insurance | Private Insurance |
| Under 6 | 868 (26.3%) | 2,488 (75.4%) |
| 6 to 18 Years | 1,612 (28.5%) | 4,202 (74.4%) |
| 19 to 25 Years | 298 (6.8%) | 3,860 (87.4%) |
| 25 to 34 Years | 1,031 (9.9%) | 9,310 (89.0%) |
| 35 to 44 Years | 968 (14.2%) | 5,862 (85.8%) |
| 45 to 54 Years | 352 (7.1%) | 4,469 (90.4%) |
| 55 to 64 Years | 976 (18.5%) | 4,422 (84.0%) |
| 65 to 74 Years | 4,270 (94.3%) | 2,899 (64.0%) |
| 75 Years and over | 3,464 (100.0%) | 2,393 (69.1%) |
| Total | 13,839 (28.3%) | 39,905 (81.7%) |
Disability Status by Sex by Age in St Louis Park
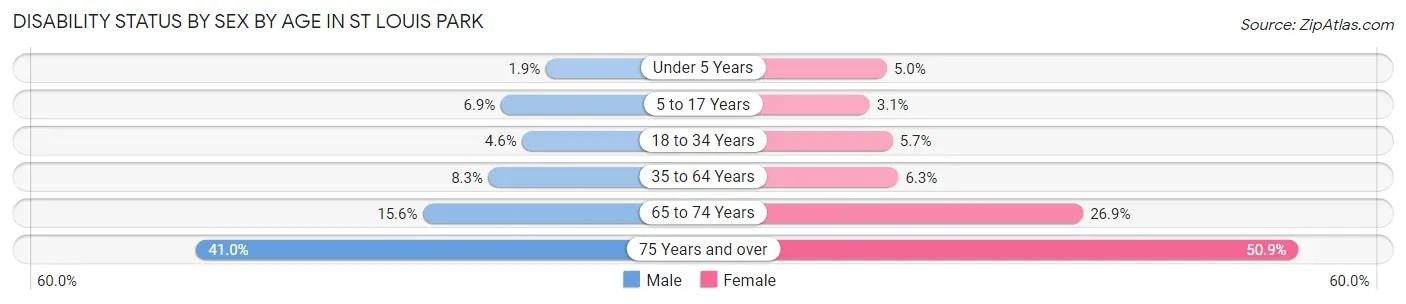
| Age Bracket | Male | Female |
| Under 5 Years | 29 (1.9%) | 60 (5.0%) |
| 5 to 17 Years | 208 (6.9%) | 95 (3.1%) |
| 18 to 34 Years | 333 (4.5%) | 441 (5.7%) |
| 35 to 64 Years | 709 (8.3%) | 536 (6.3%) |
| 65 to 74 Years | 312 (15.6%) | 680 (26.9%) |
| 75 Years and over | 454 (41.0%) | 1,198 (50.8%) |
Disability Class by Sex by Age in St Louis Park
Disability Class: Hearing Difficulty
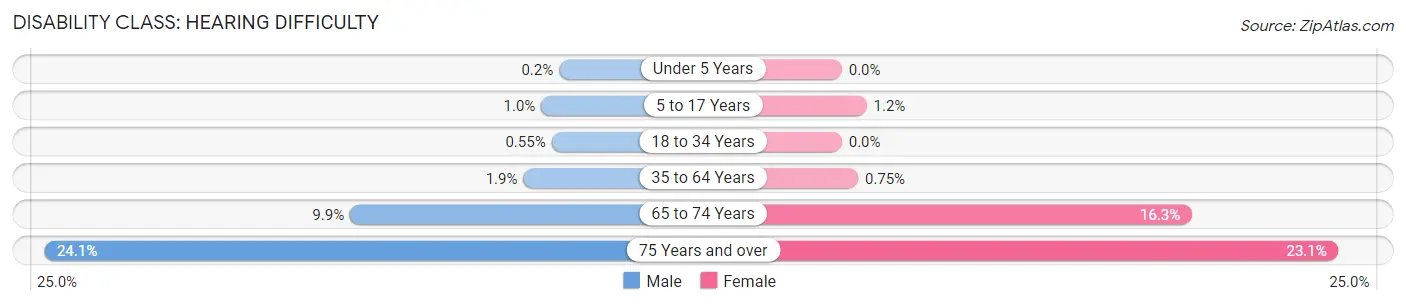
| Age Bracket | Male | Female |
| Under 5 Years | 3 (0.2%) | 0 (0.0%) |
| 5 to 17 Years | 31 (1.0%) | 35 (1.1%) |
| 18 to 34 Years | 40 (0.5%) | 0 (0.0%) |
| 35 to 64 Years | 159 (1.9%) | 64 (0.7%) |
| 65 to 74 Years | 198 (9.9%) | 411 (16.3%) |
| 75 Years and over | 267 (24.1%) | 543 (23.1%) |
Disability Class: Vision Difficulty
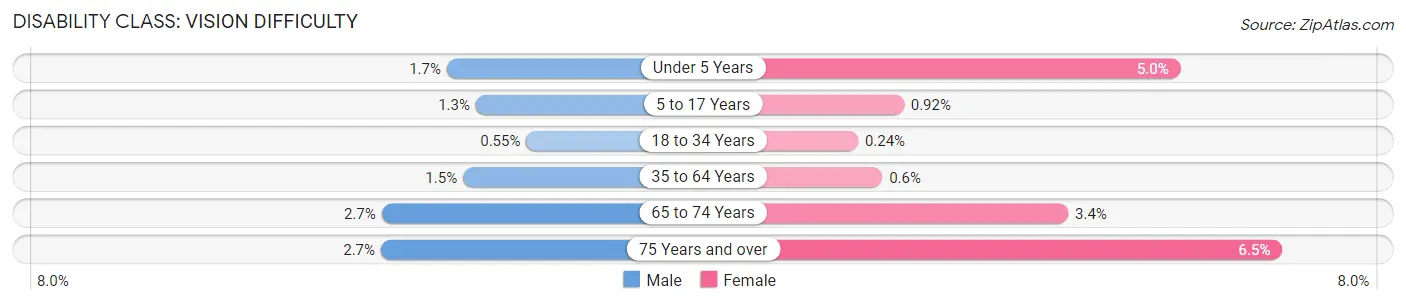
| Age Bracket | Male | Female |
| Under 5 Years | 26 (1.7%) | 60 (5.0%) |
| 5 to 17 Years | 39 (1.3%) | 28 (0.9%) |
| 18 to 34 Years | 40 (0.5%) | 19 (0.2%) |
| 35 to 64 Years | 127 (1.5%) | 51 (0.6%) |
| 65 to 74 Years | 54 (2.7%) | 85 (3.4%) |
| 75 Years and over | 30 (2.7%) | 154 (6.5%) |
Disability Class: Cognitive Difficulty
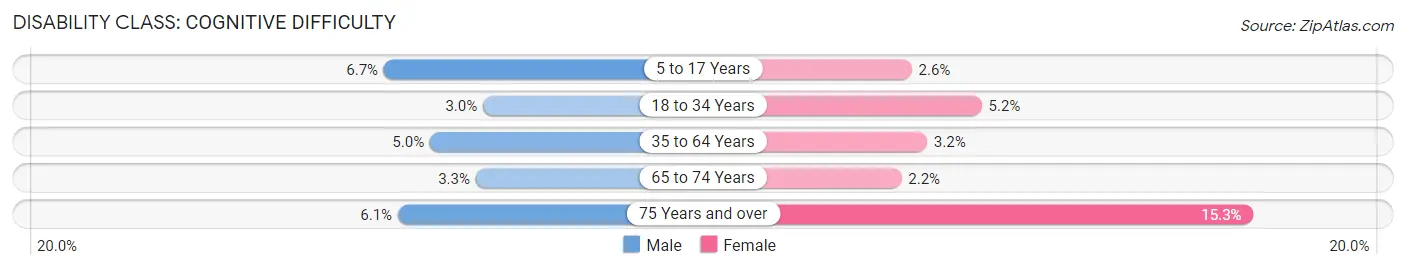
| Age Bracket | Male | Female |
| 5 to 17 Years | 200 (6.7%) | 79 (2.6%) |
| 18 to 34 Years | 218 (3.0%) | 403 (5.2%) |
| 35 to 64 Years | 423 (5.0%) | 269 (3.2%) |
| 65 to 74 Years | 65 (3.3%) | 56 (2.2%) |
| 75 Years and over | 68 (6.1%) | 360 (15.3%) |
Disability Class: Ambulatory Difficulty
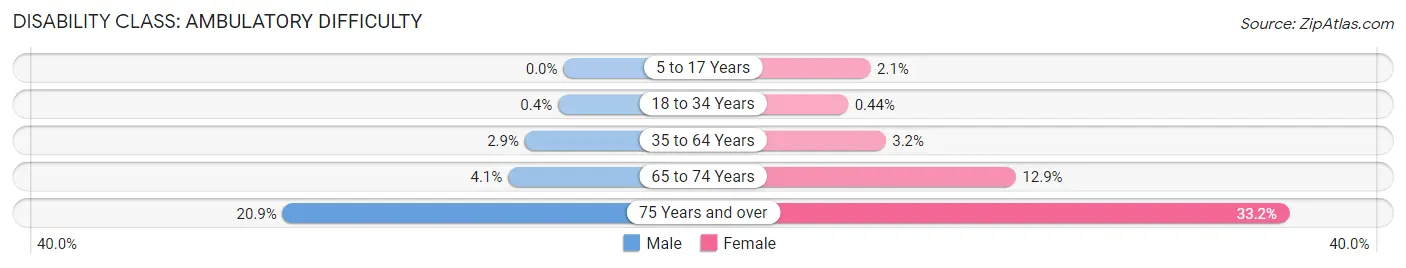
| Age Bracket | Male | Female |
| 5 to 17 Years | 0 (0.0%) | 64 (2.1%) |
| 18 to 34 Years | 29 (0.4%) | 34 (0.4%) |
| 35 to 64 Years | 244 (2.9%) | 275 (3.2%) |
| 65 to 74 Years | 82 (4.1%) | 326 (12.9%) |
| 75 Years and over | 231 (20.8%) | 782 (33.2%) |
Disability Class: Self-Care Difficulty
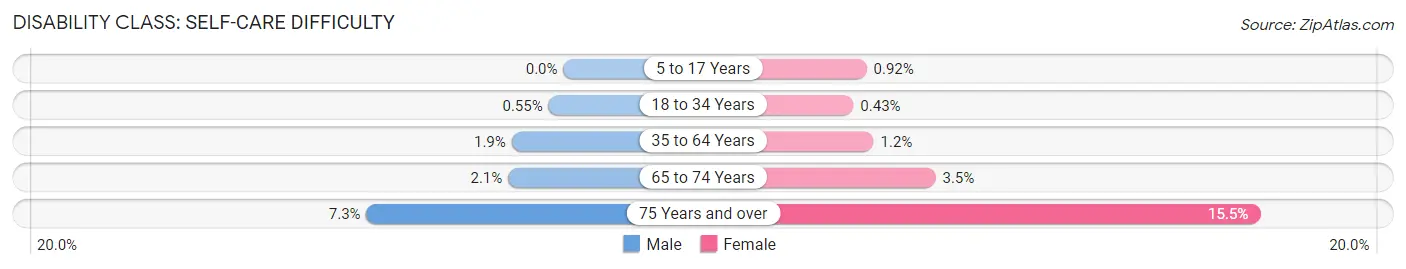
| Age Bracket | Male | Female |
| 5 to 17 Years | 0 (0.0%) | 28 (0.9%) |
| 18 to 34 Years | 40 (0.5%) | 33 (0.4%) |
| 35 to 64 Years | 164 (1.9%) | 100 (1.2%) |
| 65 to 74 Years | 41 (2.1%) | 88 (3.5%) |
| 75 Years and over | 81 (7.3%) | 366 (15.5%) |
Technology Access in St Louis Park
Computing Device Access in St Louis Park
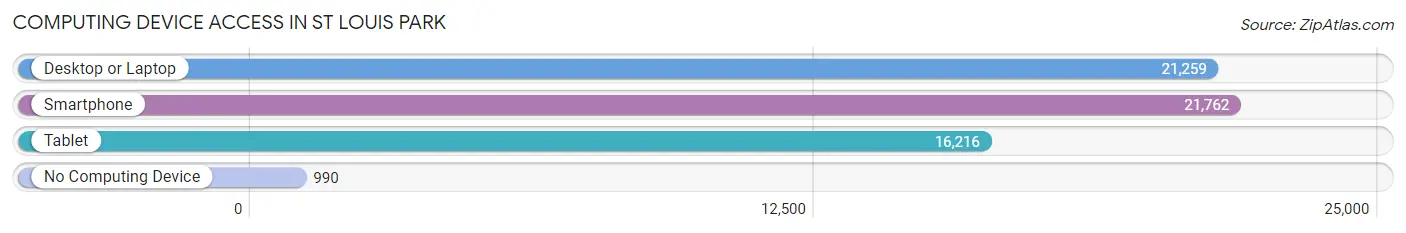
| Device Type | # Households | % Households |
| Desktop or Laptop | 21,259 | 88.2% |
| Smartphone | 21,762 | 90.3% |
| Tablet | 16,216 | 67.3% |
| No Computing Device | 990 | 4.1% |
| Total | 24,098 | 100.0% |
Internet Access in St Louis Park
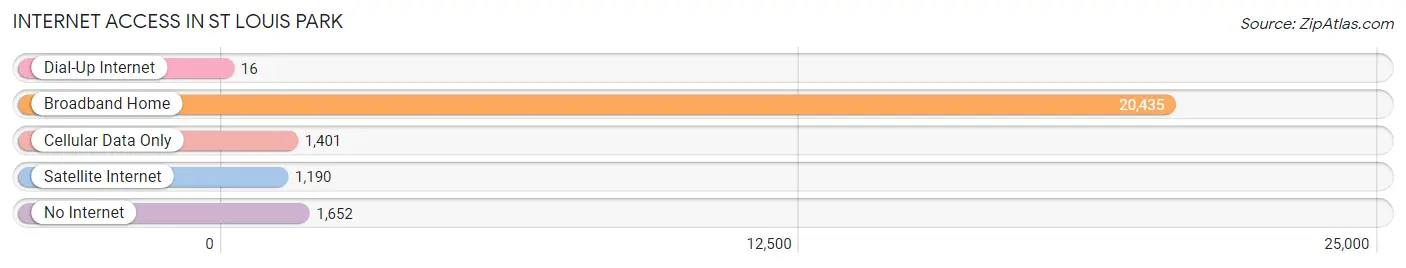
| Internet Type | # Households | % Households |
| Dial-Up Internet | 16 | 0.1% |
| Broadband Home | 20,435 | 84.8% |
| Cellular Data Only | 1,401 | 5.8% |
| Satellite Internet | 1,190 | 4.9% |
| No Internet | 1,652 | 6.9% |
| Total | 24,098 | 100.0% |
St Louis Park Summary
St. Louis Park, Minnesota is a city located in Hennepin County, just west of Minneapolis. It is a suburb of the Twin Cities metropolitan area and is home to a population of approximately 45,250 people. The city is known for its diverse population, excellent schools, and vibrant business community.
History
St. Louis Park was first settled in the mid-1800s by French-Canadian immigrants. The city was originally known as Elmwood, but was renamed St. Louis Park in 1892 after the St. Louis Park Land Company purchased the land. The city was incorporated in 1886 and was initially a farming community. In the early 1900s, the city began to grow rapidly as the Twin Cities area experienced a population boom. The city was home to a number of factories, including the Minneapolis Moline tractor factory, which employed many of the city’s residents.
In the 1950s, St. Louis Park began to experience a period of rapid growth and development. The city was home to a number of new businesses, including the Miracle Mile Shopping Center, which opened in 1956. The city also experienced a population boom, with the population increasing from 8,000 in 1950 to over 45,000 in 2000.
Geography
St. Louis Park is located in Hennepin County, just west of Minneapolis. The city is bordered by the cities of Golden Valley, Edina, and Hopkins. The city covers an area of approximately 8.5 square miles and is located at an elevation of 830 feet. The city is located on the banks of the Mississippi River and is home to a number of parks and green spaces.
Economy
St. Louis Park is home to a vibrant business community. The city is home to a number of corporate headquarters, including the headquarters of the Carlson Companies, the parent company of Radisson Hotels. The city is also home to a number of retail stores, restaurants, and other businesses. The city is also home to a number of medical facilities, including the Park Nicollet Health Services.
Demographics
As of the 2010 census, St. Louis Park had a population of 45,250 people. The city has a diverse population, with the largest racial/ethnic groups being White (77.2%), African American (7.2%), Asian (6.2%), and Hispanic (4.7%). The median household income in the city is $63,945, and the median home value is $250,000. The city has a high rate of homeownership, with over 70% of residents owning their own homes.
St. Louis Park is a vibrant and diverse city with a rich history and a bright future. The city is home to a number of businesses, excellent schools, and a diverse population. The city is a great place to live, work, and play, and is a great place to call home.
Common Questions
What is Per Capita Income in St Louis Park?
Per Capita income in St Louis Park is $60,434.
What is the Median Family Income in St Louis Park?
Median Family Income in St Louis Park is $142,528.
What is the Median Household income in St Louis Park?
Median Household Income in St Louis Park is $94,263.
What is Income or Wage Gap in St Louis Park?
Income or Wage Gap in St Louis Park is 21.3%.
Women in St Louis Park earn 78.7 cents for every dollar earned by a man.
What is Inequality or Gini Index in St Louis Park?
Inequality or Gini Index in St Louis Park is 0.43.
What is the Total Population of St Louis Park?
Total Population of St Louis Park is 49,500.
What is the Total Male Population of St Louis Park?
Total Male Population of St Louis Park is 23,713.
What is the Total Female Population of St Louis Park?
Total Female Population of St Louis Park is 25,787.
What is the Ratio of Males per 100 Females in St Louis Park?
There are 91.96 Males per 100 Females in St Louis Park.
What is the Ratio of Females per 100 Males in St Louis Park?
There are 108.75 Females per 100 Males in St Louis Park.
What is the Median Population Age in St Louis Park?
Median Population Age in St Louis Park is 36.0 Years.
What is the Average Family Size in St Louis Park
Average Family Size in St Louis Park is 2.9 People.
What is the Average Household Size in St Louis Park
Average Household Size in St Louis Park is 2.0 People.
How Large is the Labor Force in St Louis Park?
There are 31,427 People in the Labor Forcein in St Louis Park.
What is the Percentage of People in the Labor Force in St Louis Park?
75.8% of People are in the Labor Force in St Louis Park.
What is the Unemployment Rate in St Louis Park?
Unemployment Rate in St Louis Park is 2.8%.