Burnsville, MN Map & Demographics
Burnsville Map
Burnsville Overview
$42,761
PER CAPITA INCOME
$108,098
AVG FAMILY INCOME
$85,801
AVG HOUSEHOLD INCOME
26.0%
WAGE / INCOME GAP [ % ]
74.0¢/ $1
WAGE / INCOME GAP [ $ ]
$11,588
FAMILY INCOME DEFICIT
0.40
INEQUALITY / GINI INDEX
64,075
TOTAL POPULATION
31,342
MALE POPULATION
32,733
FEMALE POPULATION
95.75
MALES / 100 FEMALES
104.44
FEMALES / 100 MALES
37.2
MEDIAN AGE
3.1
AVG FAMILY SIZE
2.5
AVG HOUSEHOLD SIZE
36,760
LABOR FORCE [ PEOPLE ]
70.9%
PERCENT IN LABOR FORCE
4.5%
UNEMPLOYMENT RATE
Burnsville Area Codes
Income in Burnsville
Income Overview in Burnsville
Per Capita Income in Burnsville is $42,761, while median incomes of families and households are $108,098 and $85,801 respectively.
| Characteristic | Number | Measure |
| Per Capita Income | 64,075 | $42,761 |
| Median Family Income | 16,153 | $108,098 |
| Mean Family Income | 16,153 | $123,982 |
| Median Household Income | 25,359 | $85,801 |
| Mean Household Income | 25,359 | $105,236 |
| Income Deficit | 16,153 | $11,588 |
| Wage / Income Gap (%) | 64,075 | 26.04% |
| Wage / Income Gap ($) | 64,075 | 73.96¢ per $1 |
| Gini / Inequality Index | 64,075 | 0.40 |
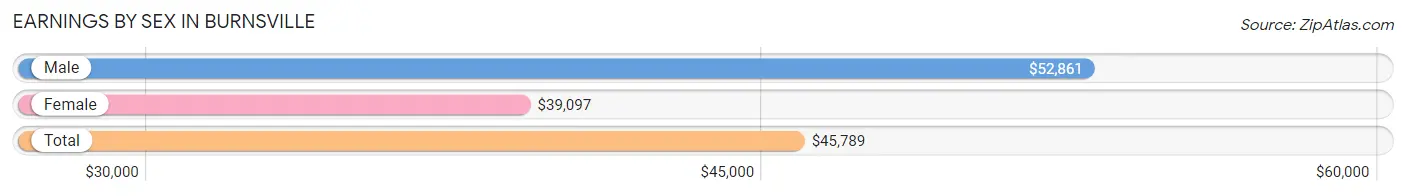
Earnings by Sex in Burnsville
Average Earnings in Burnsville are $45,789, $52,861 for men and $39,097 for women, a difference of 26.0%.
| Sex | Number | Average Earnings |
| Male | 19,854 (51.6%) | $52,861 |
| Female | 18,602 (48.4%) | $39,097 |
| Total | 38,456 (100.0%) | $45,789 |
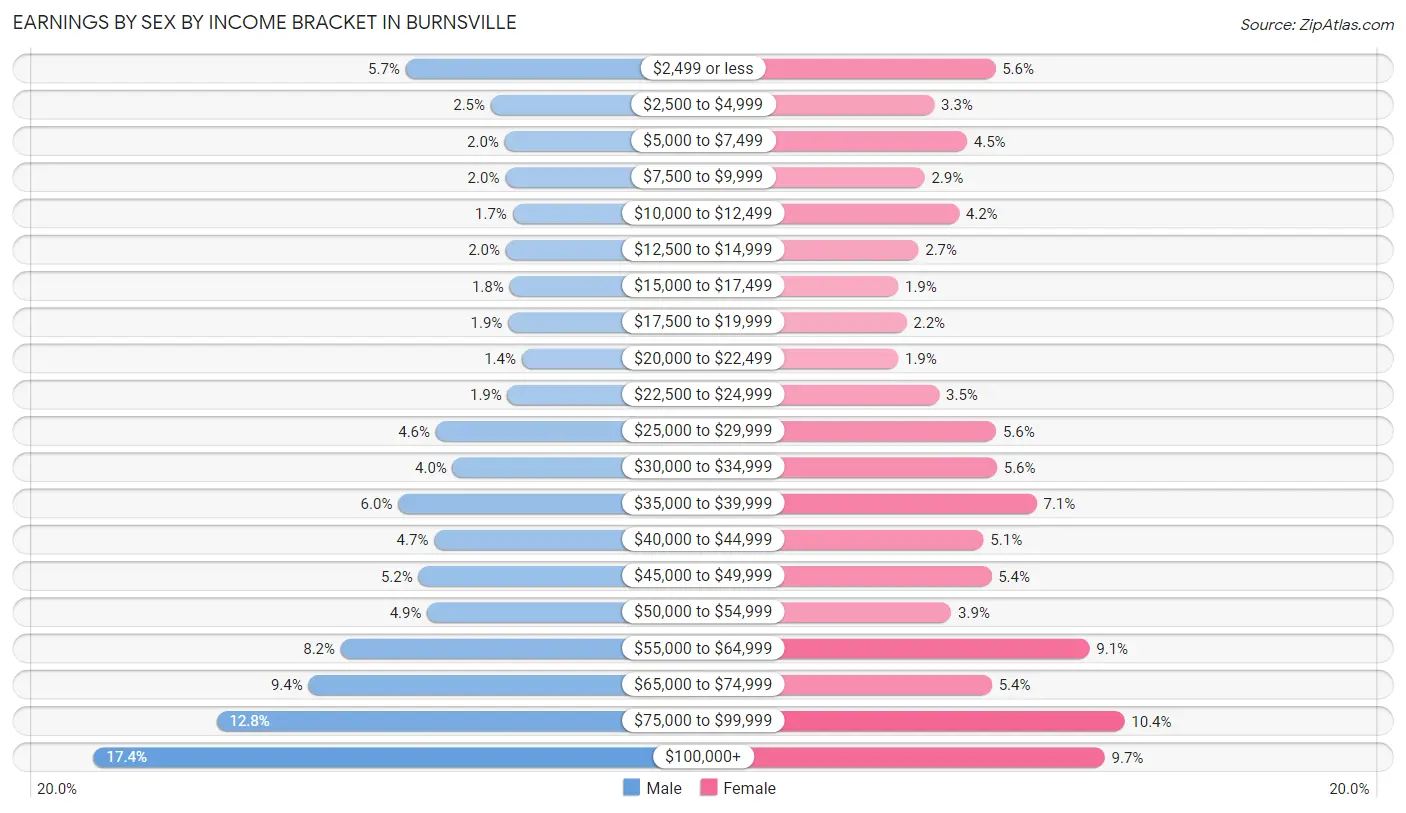
Earnings by Sex by Income Bracket in Burnsville
The most common earnings brackets in Burnsville are $100,000+ for men (3,456 | 17.4%) and $75,000 to $99,999 for women (1,935 | 10.4%).
| Income | Male | Female |
| $2,499 or less | 1,135 (5.7%) | 1,035 (5.6%) |
| $2,500 to $4,999 | 502 (2.5%) | 609 (3.3%) |
| $5,000 to $7,499 | 400 (2.0%) | 838 (4.5%) |
| $7,500 to $9,999 | 396 (2.0%) | 541 (2.9%) |
| $10,000 to $12,499 | 339 (1.7%) | 782 (4.2%) |
| $12,500 to $14,999 | 391 (2.0%) | 499 (2.7%) |
| $15,000 to $17,499 | 364 (1.8%) | 357 (1.9%) |
| $17,500 to $19,999 | 373 (1.9%) | 414 (2.2%) |
| $20,000 to $22,499 | 272 (1.4%) | 358 (1.9%) |
| $22,500 to $24,999 | 377 (1.9%) | 644 (3.5%) |
| $25,000 to $29,999 | 911 (4.6%) | 1,039 (5.6%) |
| $30,000 to $34,999 | 786 (4.0%) | 1,045 (5.6%) |
| $35,000 to $39,999 | 1,192 (6.0%) | 1,322 (7.1%) |
| $40,000 to $44,999 | 924 (4.6%) | 953 (5.1%) |
| $45,000 to $49,999 | 1,040 (5.2%) | 1,006 (5.4%) |
| $50,000 to $54,999 | 975 (4.9%) | 728 (3.9%) |
| $55,000 to $64,999 | 1,619 (8.2%) | 1,690 (9.1%) |
| $65,000 to $74,999 | 1,858 (9.4%) | 1,010 (5.4%) |
| $75,000 to $99,999 | 2,544 (12.8%) | 1,935 (10.4%) |
| $100,000+ | 3,456 (17.4%) | 1,797 (9.7%) |
| Total | 19,854 (100.0%) | 18,602 (100.0%) |
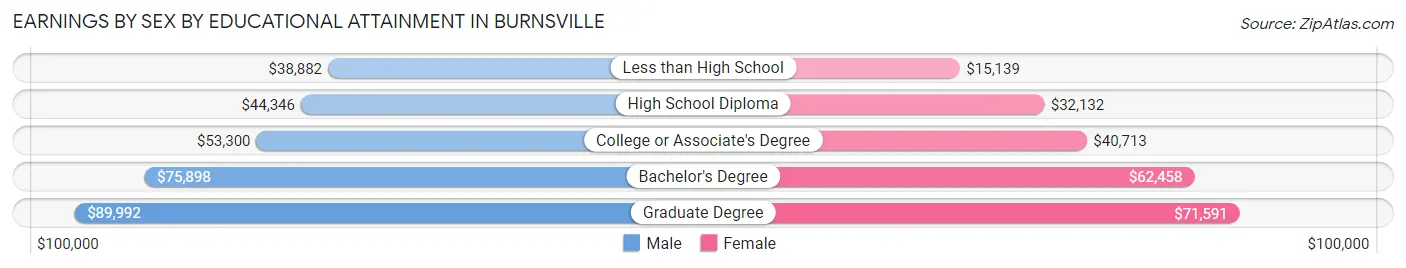
Earnings by Sex by Educational Attainment in Burnsville
Average earnings in Burnsville are $59,200 for men and $45,371 for women, a difference of 23.4%. Men with an educational attainment of graduate degree enjoy the highest average annual earnings of $89,992, while those with less than high school education earn the least with $38,882. Women with an educational attainment of graduate degree earn the most with the average annual earnings of $71,591, while those with less than high school education have the smallest earnings of $15,139.
| Educational Attainment | Male Income | Female Income |
| Less than High School | $38,882 | $15,139 |
| High School Diploma | $44,346 | $32,132 |
| College or Associate's Degree | $53,300 | $40,713 |
| Bachelor's Degree | $75,898 | $62,458 |
| Graduate Degree | $89,992 | $71,591 |
| Total | $59,200 | $45,371 |
Family Income in Burnsville
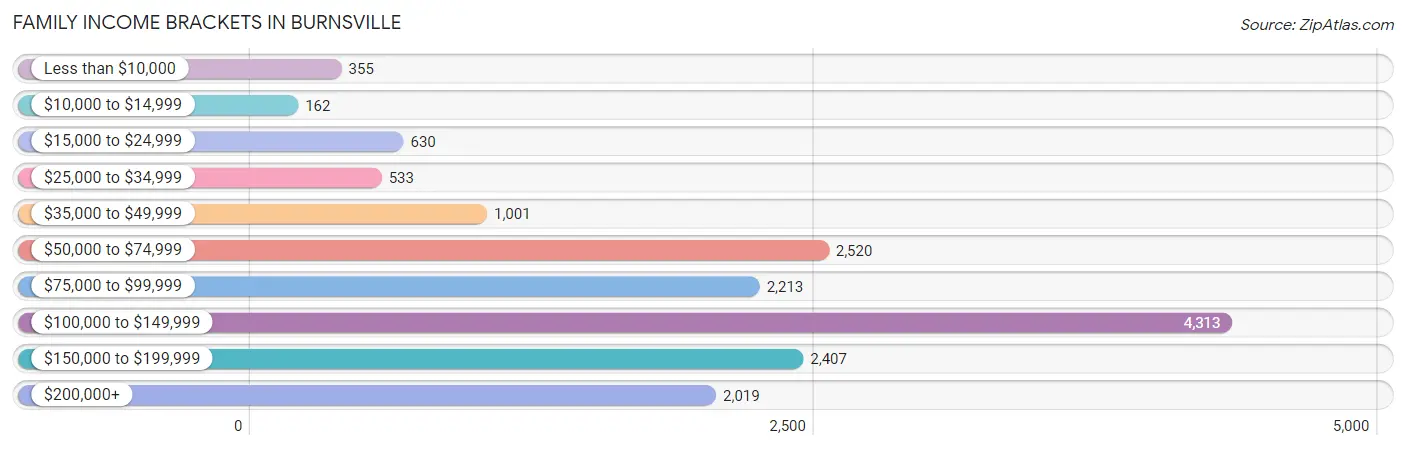
Family Income Brackets in Burnsville
According to the Burnsville family income data, there are 4,313 families falling into the $100,000 to $149,999 income range, which is the most common income bracket and makes up 26.7% of all families. Conversely, the $10,000 to $14,999 income bracket is the least frequent group with only 162 families (1.0%) belonging to this category.
| Income Bracket | # Families | % Families |
| Less than $10,000 | 355 | 2.2% |
| $10,000 to $14,999 | 162 | 1.0% |
| $15,000 to $24,999 | 630 | 3.9% |
| $25,000 to $34,999 | 533 | 3.3% |
| $35,000 to $49,999 | 1,001 | 6.2% |
| $50,000 to $74,999 | 2,520 | 15.6% |
| $75,000 to $99,999 | 2,213 | 13.7% |
| $100,000 to $149,999 | 4,313 | 26.7% |
| $150,000 to $199,999 | 2,407 | 14.9% |
| $200,000+ | 2,019 | 12.5% |
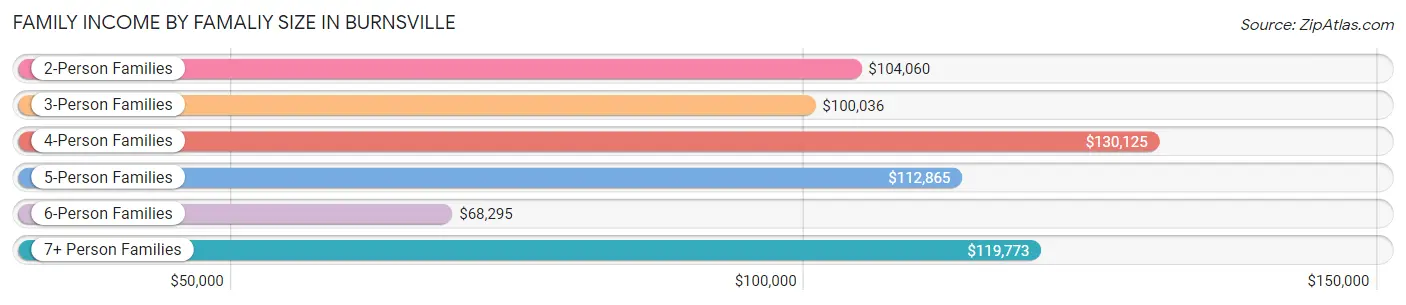
Family Income by Famaliy Size in Burnsville
4-person families (2,701 | 16.7%) account for the highest median family income in Burnsville with $130,125 per family, while 2-person families (8,056 | 49.9%) have the highest median income of $52,030 per family member.
| Income Bracket | # Families | Median Income |
| 2-Person Families | 8,056 (49.9%) | $104,060 |
| 3-Person Families | 3,406 (21.1%) | $100,036 |
| 4-Person Families | 2,701 (16.7%) | $130,125 |
| 5-Person Families | 1,155 (7.1%) | $112,865 |
| 6-Person Families | 537 (3.3%) | $68,295 |
| 7+ Person Families | 298 (1.8%) | $119,773 |
| Total | 16,153 (100.0%) | $108,098 |
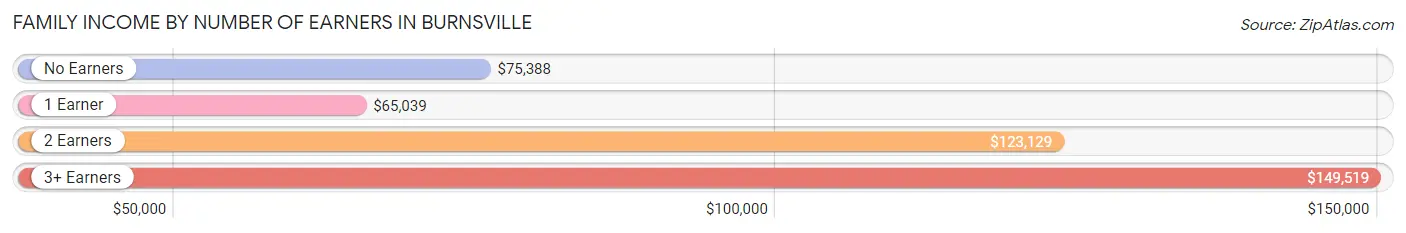
Family Income by Number of Earners in Burnsville
The median family income in Burnsville is $108,098, with families comprising 3+ earners (2,244) having the highest median family income of $149,519, while families with 1 earner (3,897) have the lowest median family income of $65,039, accounting for 13.9% and 24.1% of families, respectively.
| Number of Earners | # Families | Median Income |
| No Earners | 2,085 (12.9%) | $75,388 |
| 1 Earner | 3,897 (24.1%) | $65,039 |
| 2 Earners | 7,927 (49.1%) | $123,129 |
| 3+ Earners | 2,244 (13.9%) | $149,519 |
| Total | 16,153 (100.0%) | $108,098 |
Household Income in Burnsville
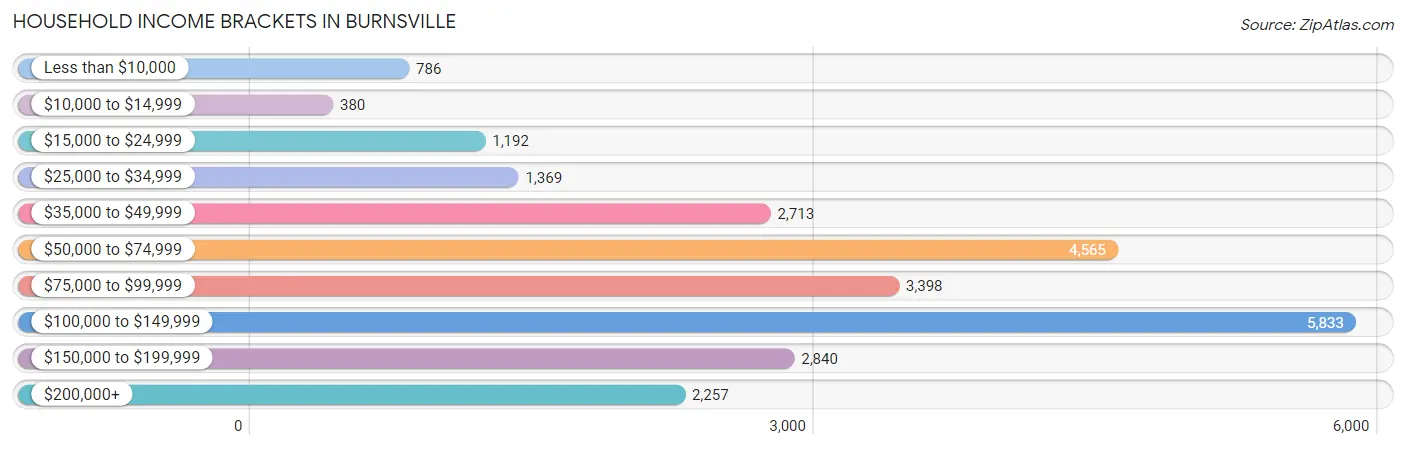
Household Income Brackets in Burnsville
With 5,833 households falling in the category, the $100,000 to $149,999 income range is the most frequent in Burnsville, accounting for 23.0% of all households. In contrast, only 380 households (1.5%) fall into the $10,000 to $14,999 income bracket, making it the least populous group.
| Income Bracket | # Households | % Households |
| Less than $10,000 | 786 | 3.1% |
| $10,000 to $14,999 | 380 | 1.5% |
| $15,000 to $24,999 | 1,192 | 4.7% |
| $25,000 to $34,999 | 1,369 | 5.4% |
| $35,000 to $49,999 | 2,713 | 10.7% |
| $50,000 to $74,999 | 4,565 | 18.0% |
| $75,000 to $99,999 | 3,398 | 13.4% |
| $100,000 to $149,999 | 5,833 | 23.0% |
| $150,000 to $199,999 | 2,840 | 11.2% |
| $200,000+ | 2,257 | 8.9% |
Household Income by Householder Age in Burnsville
The median household income in Burnsville is $85,801, with the highest median household income of $107,231 found in the 45 to 64 years age bracket for the primary householder. A total of 8,942 households (35.3%) fall into this category. Meanwhile, the 15 to 24 years age bracket for the primary householder has the lowest median household income of $52,535, with 1,179 households (4.6%) in this group.
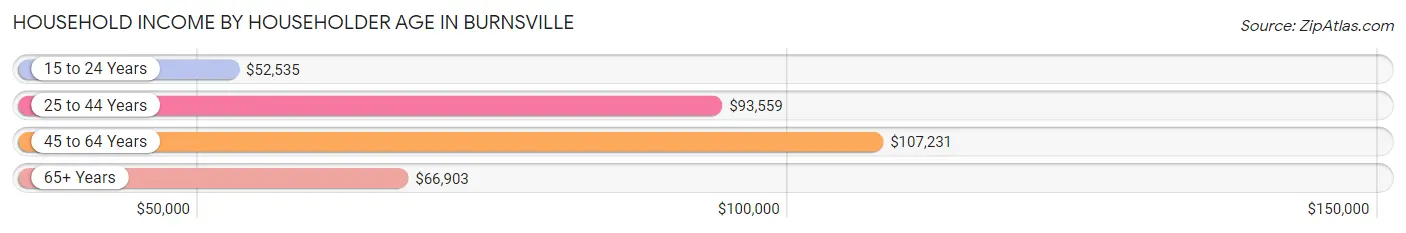
| Income Bracket | # Households | Median Income |
| 15 to 24 Years | 1,179 (4.6%) | $52,535 |
| 25 to 44 Years | 8,591 (33.9%) | $93,559 |
| 45 to 64 Years | 8,942 (35.3%) | $107,231 |
| 65+ Years | 6,647 (26.2%) | $66,903 |
| Total | 25,359 (100.0%) | $85,801 |
Poverty in Burnsville
Income Below Poverty by Sex and Age in Burnsville
With 7.2% poverty level for males and 8.8% for females among the residents of Burnsville, 15 year old males and under 5 year old females are the most vulnerable to poverty, with 159 males (33.9%) and 428 females (19.0%) in their respective age groups living below the poverty level.
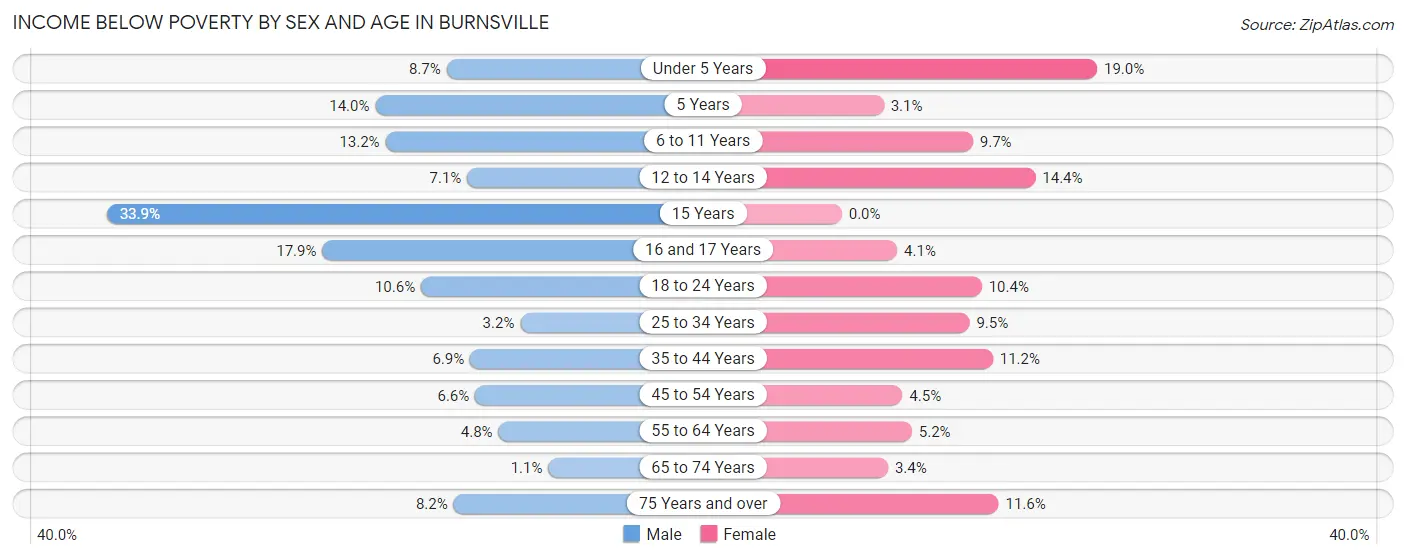
| Age Bracket | Male | Female |
| Under 5 Years | 155 (8.7%) | 428 (19.0%) |
| 5 Years | 79 (14.0%) | 9 (3.1%) |
| 6 to 11 Years | 241 (13.2%) | 257 (9.7%) |
| 12 to 14 Years | 74 (7.1%) | 125 (14.4%) |
| 15 Years | 159 (33.9%) | 0 (0.0%) |
| 16 and 17 Years | 150 (17.9%) | 29 (4.1%) |
| 18 to 24 Years | 314 (10.6%) | 299 (10.4%) |
| 25 to 34 Years | 159 (3.2%) | 477 (9.5%) |
| 35 to 44 Years | 297 (6.9%) | 426 (11.2%) |
| 45 to 54 Years | 227 (6.6%) | 142 (4.5%) |
| 55 to 64 Years | 208 (4.8%) | 238 (5.2%) |
| 65 to 74 Years | 31 (1.1%) | 115 (3.4%) |
| 75 Years and over | 154 (8.2%) | 298 (11.6%) |
| Total | 2,248 (7.2%) | 2,843 (8.8%) |
Income Above Poverty by Sex and Age in Burnsville
According to the poverty statistics in Burnsville, males aged 65 to 74 years and females aged 15 years are the age groups that are most secure financially, with 98.9% of males and 100.0% of females in these age groups living above the poverty line.

| Age Bracket | Male | Female |
| Under 5 Years | 1,633 (91.3%) | 1,830 (81.0%) |
| 5 Years | 487 (86.0%) | 280 (96.9%) |
| 6 to 11 Years | 1,583 (86.8%) | 2,383 (90.3%) |
| 12 to 14 Years | 963 (92.9%) | 745 (85.6%) |
| 15 Years | 310 (66.1%) | 351 (100.0%) |
| 16 and 17 Years | 688 (82.1%) | 676 (95.9%) |
| 18 to 24 Years | 2,656 (89.4%) | 2,578 (89.6%) |
| 25 to 34 Years | 4,815 (96.8%) | 4,552 (90.5%) |
| 35 to 44 Years | 3,986 (93.1%) | 3,374 (88.8%) |
| 45 to 54 Years | 3,240 (93.4%) | 3,015 (95.5%) |
| 55 to 64 Years | 4,104 (95.2%) | 4,336 (94.8%) |
| 65 to 74 Years | 2,747 (98.9%) | 3,233 (96.6%) |
| 75 Years and over | 1,736 (91.8%) | 2,263 (88.4%) |
| Total | 28,948 (92.8%) | 29,616 (91.2%) |
Income Below Poverty Among Married-Couple Families in Burnsville
The poverty statistics for married-couple families in Burnsville show that 1.8% or 223 of the total 12,304 families live below the poverty line. Families with 3 or 4 children have the highest poverty rate of 9.0%, comprising of 88 families. On the other hand, families with 5 or more children have the lowest poverty rate of 0.0%, which includes 0 families.
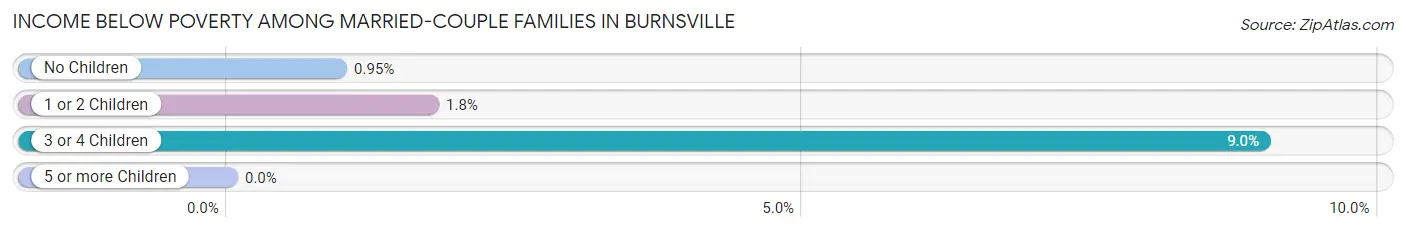
| Children | Above Poverty | Below Poverty |
| No Children | 7,647 (99.1%) | 73 (0.9%) |
| 1 or 2 Children | 3,480 (98.3%) | 62 (1.8%) |
| 3 or 4 Children | 891 (91.0%) | 88 (9.0%) |
| 5 or more Children | 63 (100.0%) | 0 (0.0%) |
| Total | 12,081 (98.2%) | 223 (1.8%) |
Income Below Poverty Among Single-Parent Households in Burnsville
According to the poverty data in Burnsville, 10.2% or 96 single-father households and 19.8% or 574 single-mother households are living below the poverty line. Among single-father households, those with 3 or 4 children have the highest poverty rate, with 52 households (35.4%) experiencing poverty. Likewise, among single-mother households, those with 3 or 4 children have the highest poverty rate, with 100 households (62.1%) falling below the poverty line.
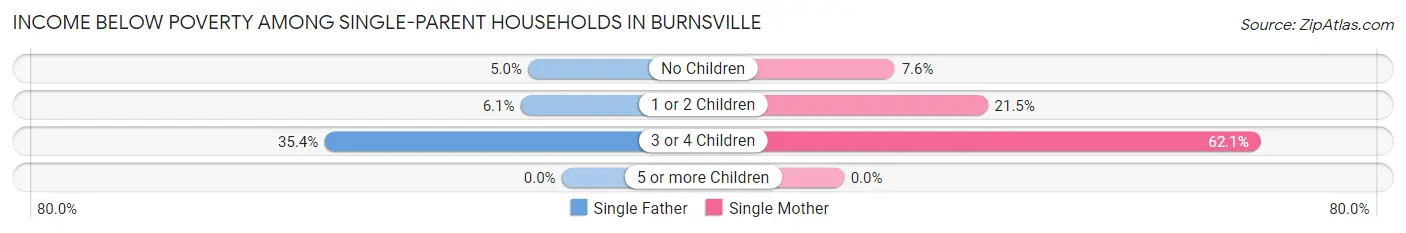
| Children | Single Father | Single Mother |
| No Children | 22 (5.0%) | 63 (7.6%) |
| 1 or 2 Children | 22 (6.1%) | 411 (21.4%) |
| 3 or 4 Children | 52 (35.4%) | 100 (62.1%) |
| 5 or more Children | 0 (0.0%) | 0 (0.0%) |
| Total | 96 (10.2%) | 574 (19.8%) |
Income Below Poverty Among Married-Couple vs Single-Parent Households in Burnsville
The poverty data for Burnsville shows that 223 of the married-couple family households (1.8%) and 670 of the single-parent households (17.4%) are living below the poverty level. Within the married-couple family households, those with 3 or 4 children have the highest poverty rate, with 88 households (9.0%) falling below the poverty line. Among the single-parent households, those with 3 or 4 children have the highest poverty rate, with 152 household (49.3%) living below poverty.
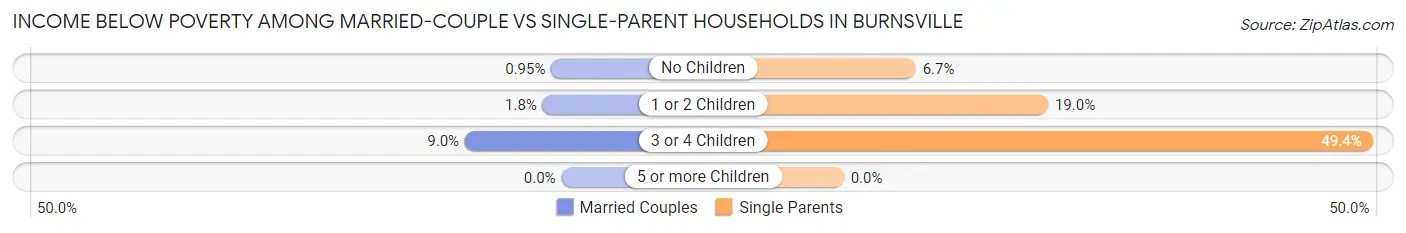
| Children | Married-Couple Families | Single-Parent Households |
| No Children | 73 (0.9%) | 85 (6.7%) |
| 1 or 2 Children | 62 (1.8%) | 433 (19.0%) |
| 3 or 4 Children | 88 (9.0%) | 152 (49.3%) |
| 5 or more Children | 0 (0.0%) | 0 (0.0%) |
| Total | 223 (1.8%) | 670 (17.4%) |
Race in Burnsville
The most populous races in Burnsville are White / Caucasian (43,237 | 67.5%), Black / African American (9,019 | 14.1%), and Hispanic or Latino (6,494 | 10.1%).
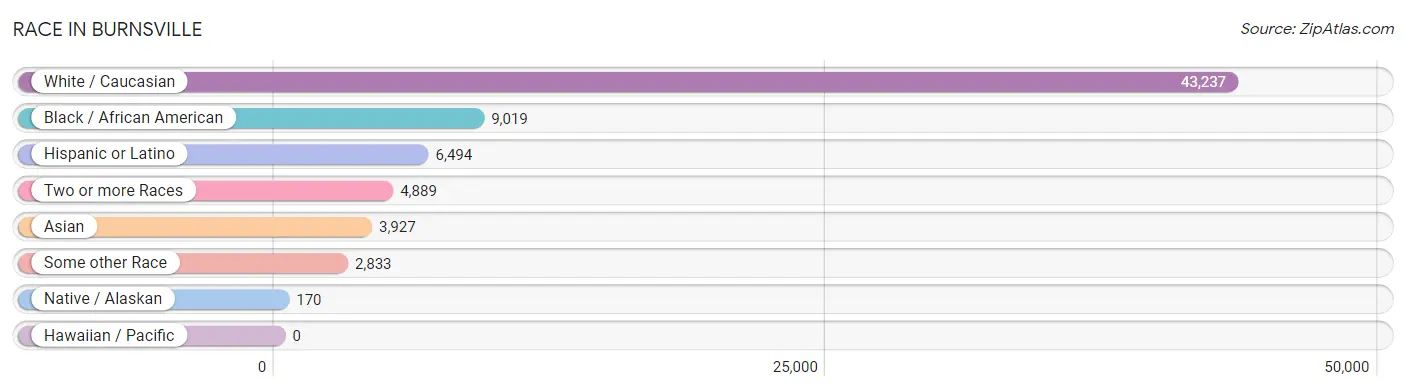
| Race | # Population | % Population |
| Asian | 3,927 | 6.1% |
| Black / African American | 9,019 | 14.1% |
| Hawaiian / Pacific | 0 | 0.0% |
| Hispanic or Latino | 6,494 | 10.1% |
| Native / Alaskan | 170 | 0.3% |
| White / Caucasian | 43,237 | 67.5% |
| Two or more Races | 4,889 | 7.6% |
| Some other Race | 2,833 | 4.4% |
| Total | 64,075 | 100.0% |
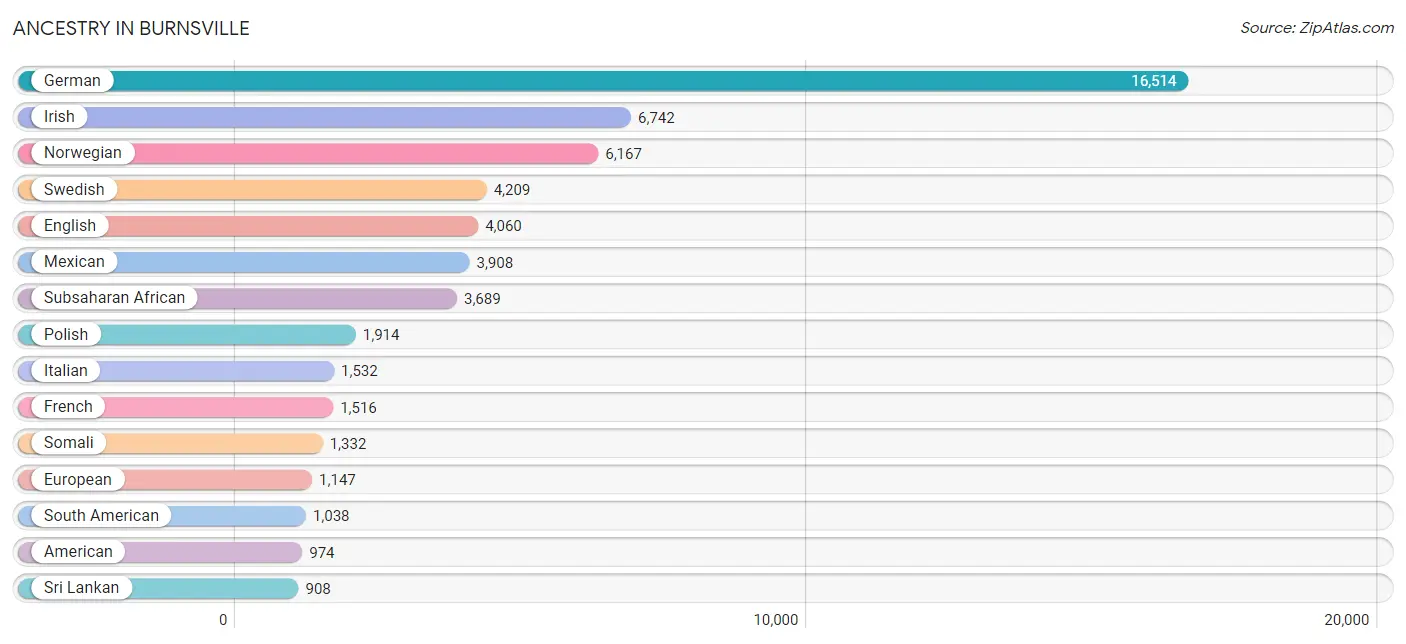
Ancestry in Burnsville
The most populous ancestries reported in Burnsville are German (16,514 | 25.8%), Irish (6,742 | 10.5%), Norwegian (6,167 | 9.6%), Swedish (4,209 | 6.6%), and English (4,060 | 6.3%), together accounting for 58.8% of all Burnsville residents.
| Ancestry | # Population | % Population |
| Afghan | 7 | 0.0% |
| African | 741 | 1.2% |
| Alaska Native | 6 | 0.0% |
| Aleut | 19 | 0.0% |
| American | 974 | 1.5% |
| Arab | 292 | 0.5% |
| Argentinean | 61 | 0.1% |
| Austrian | 152 | 0.2% |
| Bahamian | 8 | 0.0% |
| Bangladeshi | 288 | 0.4% |
| Basque | 11 | 0.0% |
| Belgian | 56 | 0.1% |
| Bhutanese | 286 | 0.4% |
| Blackfeet | 75 | 0.1% |
| Brazilian | 20 | 0.0% |
| British | 201 | 0.3% |
| Burmese | 362 | 0.6% |
| Canadian | 32 | 0.1% |
| Celtic | 4 | 0.0% |
| Central American | 513 | 0.8% |
| Central American Indian | 15 | 0.0% |
| Cherokee | 128 | 0.2% |
| Chippewa | 80 | 0.1% |
| Choctaw | 16 | 0.0% |
| Colombian | 45 | 0.1% |
| Creek | 26 | 0.0% |
| Croatian | 53 | 0.1% |
| Cuban | 205 | 0.3% |
| Czech | 662 | 1.0% |
| Czechoslovakian | 67 | 0.1% |
| Danish | 773 | 1.2% |
| Delaware | 3 | 0.0% |
| Dominican | 104 | 0.2% |
| Dutch | 771 | 1.2% |
| Eastern European | 300 | 0.5% |
| Ecuadorian | 651 | 1.0% |
| Egyptian | 64 | 0.1% |
| English | 4,060 | 6.3% |
| Ethiopian | 521 | 0.8% |
| European | 1,147 | 1.8% |
| Finnish | 535 | 0.8% |
| French | 1,516 | 2.4% |
| French Canadian | 613 | 1.0% |
| German | 16,514 | 25.8% |
| Ghanaian | 12 | 0.0% |
| Greek | 192 | 0.3% |
| Guatemalan | 81 | 0.1% |
| Honduran | 162 | 0.3% |
| Hungarian | 175 | 0.3% |
| Icelander | 17 | 0.0% |
| Indian (Asian) | 389 | 0.6% |
| Indonesian | 165 | 0.3% |
| Iranian | 311 | 0.5% |
| Iraqi | 54 | 0.1% |
| Irish | 6,742 | 10.5% |
| Iroquois | 42 | 0.1% |
| Italian | 1,532 | 2.4% |
| Jamaican | 84 | 0.1% |
| Japanese | 642 | 1.0% |
| Kenyan | 386 | 0.6% |
| Korean | 447 | 0.7% |
| Lebanese | 29 | 0.1% |
| Liberian | 16 | 0.0% |
| Lithuanian | 27 | 0.0% |
| Luxembourger | 14 | 0.0% |
| Malaysian | 456 | 0.7% |
| Mexican | 3,908 | 6.1% |
| Moroccan | 16 | 0.0% |
| Native Hawaiian | 16 | 0.0% |
| Nigerian | 93 | 0.2% |
| Northern European | 173 | 0.3% |
| Norwegian | 6,167 | 9.6% |
| Pakistani | 30 | 0.1% |
| Palestinian | 13 | 0.0% |
| Panamanian | 33 | 0.1% |
| Polish | 1,914 | 3.0% |
| Portuguese | 23 | 0.0% |
| Puerto Rican | 429 | 0.7% |
| Romanian | 51 | 0.1% |
| Russian | 585 | 0.9% |
| Salvadoran | 237 | 0.4% |
| Scandinavian | 863 | 1.3% |
| Scotch-Irish | 456 | 0.7% |
| Scottish | 662 | 1.0% |
| Serbian | 38 | 0.1% |
| Sioux | 153 | 0.2% |
| Slavic | 32 | 0.1% |
| Slovak | 85 | 0.1% |
| Slovene | 85 | 0.1% |
| Somali | 1,332 | 2.1% |
| South American | 1,038 | 1.6% |
| South American Indian | 63 | 0.1% |
| Soviet Union | 12 | 0.0% |
| Spaniard | 119 | 0.2% |
| Spanish | 2 | 0.0% |
| Sri Lankan | 908 | 1.4% |
| Subsaharan African | 3,689 | 5.8% |
| Sudanese | 305 | 0.5% |
| Swedish | 4,209 | 6.6% |
| Swiss | 278 | 0.4% |
| Syrian | 8 | 0.0% |
| Thai | 608 | 0.9% |
| Trinidadian and Tobagonian | 9 | 0.0% |
| Turkish | 27 | 0.0% |
| Ukrainian | 288 | 0.4% |
| Venezuelan | 281 | 0.4% |
| Vietnamese | 143 | 0.2% |
| Welsh | 250 | 0.4% |
| West Indian | 6 | 0.0% |
| Yugoslavian | 66 | 0.1% | View All 110 Rows |
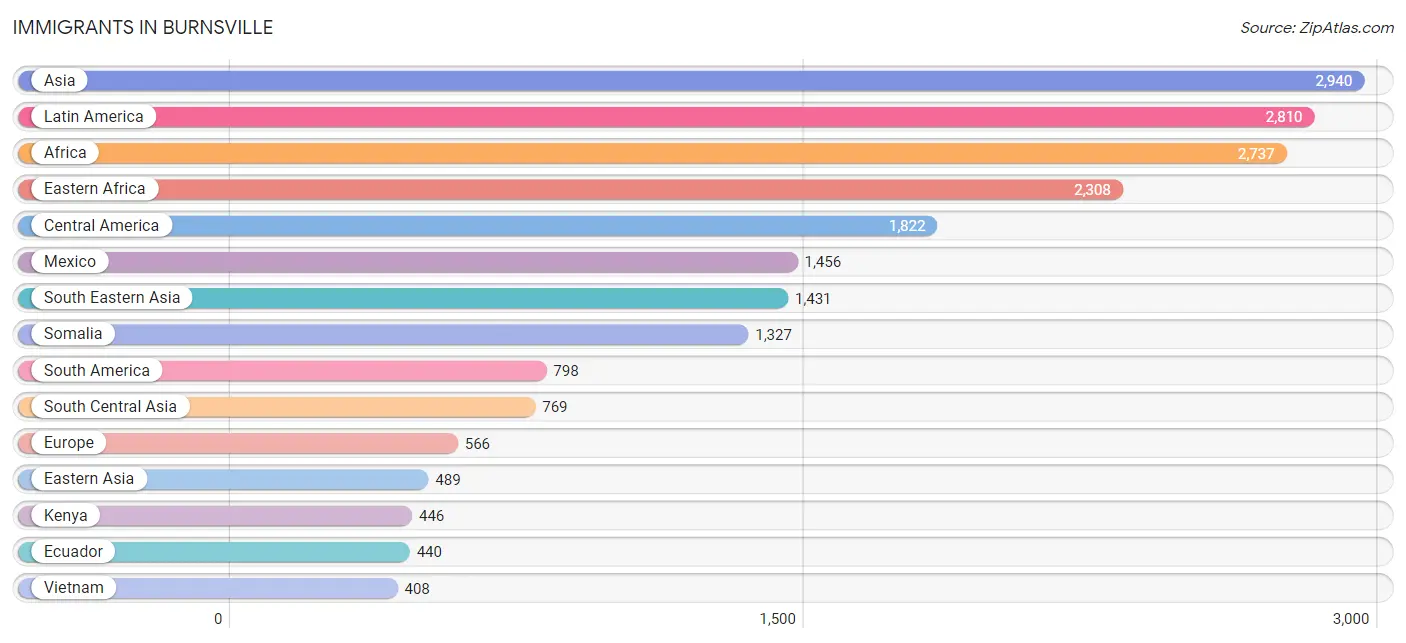
Immigrants in Burnsville
The most numerous immigrant groups reported in Burnsville came from Asia (2,940 | 4.6%), Latin America (2,810 | 4.4%), Africa (2,737 | 4.3%), Eastern Africa (2,308 | 3.6%), and Central America (1,822 | 2.8%), together accounting for 19.7% of all Burnsville residents.
| Immigration Origin | # Population | % Population |
| Afghanistan | 7 | 0.0% |
| Africa | 2,737 | 4.3% |
| Argentina | 61 | 0.1% |
| Asia | 2,940 | 4.6% |
| Bahamas | 8 | 0.0% |
| Bangladesh | 72 | 0.1% |
| Belarus | 74 | 0.1% |
| Brazil | 20 | 0.0% |
| Cambodia | 147 | 0.2% |
| Canada | 97 | 0.2% |
| Caribbean | 190 | 0.3% |
| Central America | 1,822 | 2.8% |
| China | 206 | 0.3% |
| Colombia | 45 | 0.1% |
| Cuba | 38 | 0.1% |
| Czechoslovakia | 9 | 0.0% |
| Dominican Republic | 83 | 0.1% |
| Eastern Africa | 2,308 | 3.6% |
| Eastern Asia | 489 | 0.8% |
| Eastern Europe | 365 | 0.6% |
| Ecuador | 440 | 0.7% |
| Egypt | 15 | 0.0% |
| El Salvador | 122 | 0.2% |
| England | 10 | 0.0% |
| Eritrea | 202 | 0.3% |
| Ethiopia | 183 | 0.3% |
| Europe | 566 | 0.9% |
| France | 20 | 0.0% |
| Germany | 130 | 0.2% |
| Ghana | 46 | 0.1% |
| Guatemala | 82 | 0.1% |
| Guyana | 79 | 0.1% |
| Honduras | 162 | 0.3% |
| Hong Kong | 23 | 0.0% |
| India | 268 | 0.4% |
| Iran | 240 | 0.4% |
| Iraq | 33 | 0.1% |
| Italy | 12 | 0.0% |
| Jamaica | 52 | 0.1% |
| Japan | 27 | 0.0% |
| Jordan | 30 | 0.1% |
| Kazakhstan | 49 | 0.1% |
| Kenya | 446 | 0.7% |
| Korea | 256 | 0.4% |
| Kuwait | 145 | 0.2% |
| Laos | 239 | 0.4% |
| Latin America | 2,810 | 4.4% |
| Liberia | 37 | 0.1% |
| Malaysia | 16 | 0.0% |
| Mexico | 1,456 | 2.3% |
| Morocco | 27 | 0.0% |
| Nigeria | 46 | 0.1% |
| Northern Africa | 82 | 0.1% |
| Northern Europe | 28 | 0.0% |
| Norway | 7 | 0.0% |
| Pakistan | 45 | 0.1% |
| Philippines | 246 | 0.4% |
| Romania | 29 | 0.1% |
| Russia | 101 | 0.2% |
| Somalia | 1,327 | 2.1% |
| South America | 798 | 1.3% |
| South Central Asia | 769 | 1.2% |
| South Eastern Asia | 1,431 | 2.2% |
| Southern Europe | 23 | 0.0% |
| Spain | 11 | 0.0% |
| Sri Lanka | 43 | 0.1% |
| Sudan | 19 | 0.0% |
| Taiwan | 45 | 0.1% |
| Thailand | 207 | 0.3% |
| Trinidad and Tobago | 9 | 0.0% |
| Turkey | 27 | 0.0% |
| Uganda | 51 | 0.1% |
| Ukraine | 152 | 0.2% |
| Venezuela | 153 | 0.2% |
| Vietnam | 408 | 0.6% |
| Western Africa | 330 | 0.5% |
| Western Asia | 251 | 0.4% |
| Western Europe | 150 | 0.2% | View All 78 Rows |
Sex and Age in Burnsville
Sex and Age in Burnsville
The most populous age groups in Burnsville are 25 to 29 Years (2,640 | 8.4%) for men and 55 to 59 Years (2,696 | 8.2%) for women.
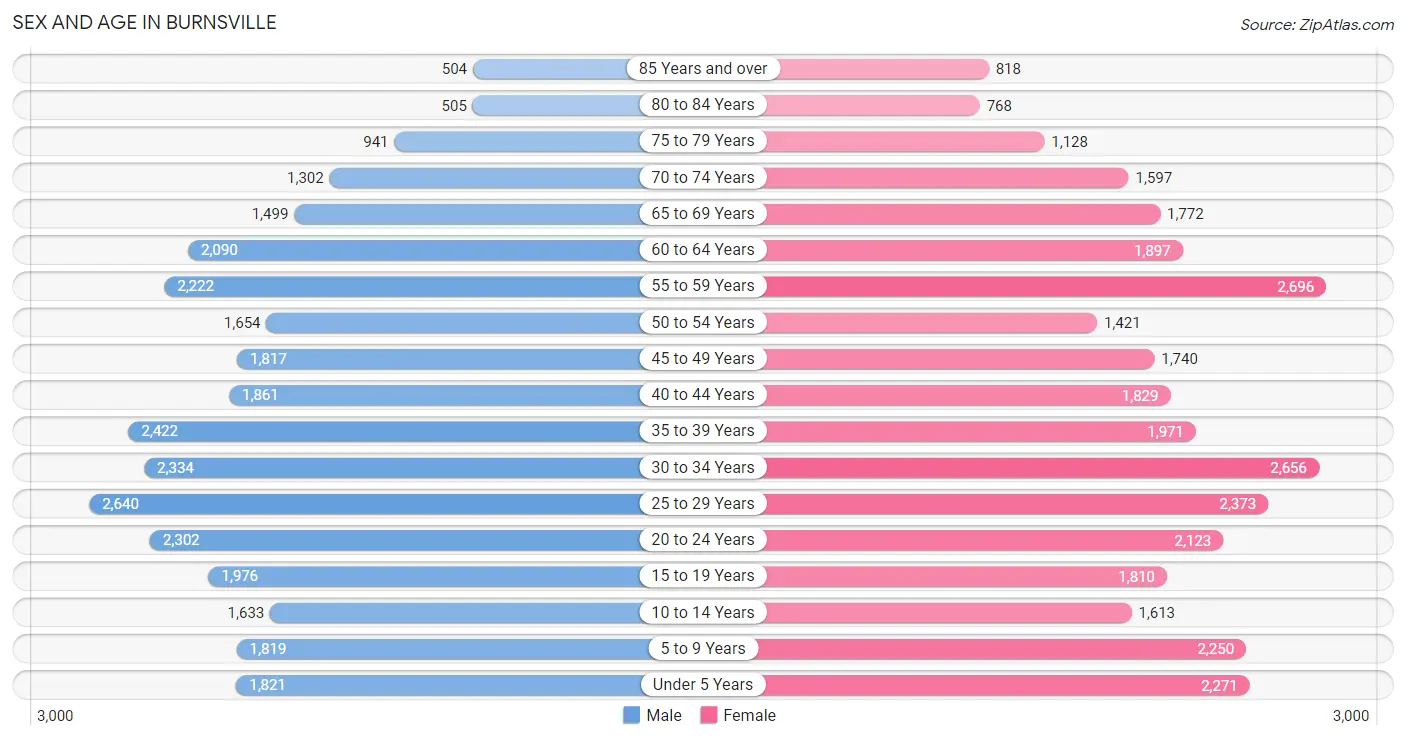
| Age Bracket | Male | Female |
| Under 5 Years | 1,821 (5.8%) | 2,271 (6.9%) |
| 5 to 9 Years | 1,819 (5.8%) | 2,250 (6.9%) |
| 10 to 14 Years | 1,633 (5.2%) | 1,613 (4.9%) |
| 15 to 19 Years | 1,976 (6.3%) | 1,810 (5.5%) |
| 20 to 24 Years | 2,302 (7.3%) | 2,123 (6.5%) |
| 25 to 29 Years | 2,640 (8.4%) | 2,373 (7.2%) |
| 30 to 34 Years | 2,334 (7.4%) | 2,656 (8.1%) |
| 35 to 39 Years | 2,422 (7.7%) | 1,971 (6.0%) |
| 40 to 44 Years | 1,861 (5.9%) | 1,829 (5.6%) |
| 45 to 49 Years | 1,817 (5.8%) | 1,740 (5.3%) |
| 50 to 54 Years | 1,654 (5.3%) | 1,421 (4.3%) |
| 55 to 59 Years | 2,222 (7.1%) | 2,696 (8.2%) |
| 60 to 64 Years | 2,090 (6.7%) | 1,897 (5.8%) |
| 65 to 69 Years | 1,499 (4.8%) | 1,772 (5.4%) |
| 70 to 74 Years | 1,302 (4.2%) | 1,597 (4.9%) |
| 75 to 79 Years | 941 (3.0%) | 1,128 (3.5%) |
| 80 to 84 Years | 505 (1.6%) | 768 (2.4%) |
| 85 Years and over | 504 (1.6%) | 818 (2.5%) |
| Total | 31,342 (100.0%) | 32,733 (100.0%) |
Families and Households in Burnsville
Median Family Size in Burnsville
The median family size in Burnsville is 3.12 persons per family, with single male/father families (944 | 5.8%) accounting for the largest median family size of 3.27 persons per family. On the other hand, single female/mother families (2,905 | 18.0%) represent the smallest median family size with 2.97 persons per family.
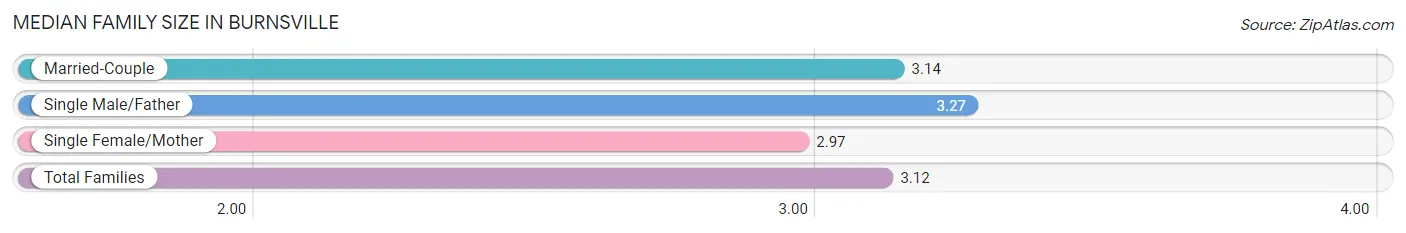
| Family Type | # Families | Family Size |
| Married-Couple | 12,304 (76.2%) | 3.14 |
| Single Male/Father | 944 (5.8%) | 3.27 |
| Single Female/Mother | 2,905 (18.0%) | 2.97 |
| Total Families | 16,153 (100.0%) | 3.12 |
Median Household Size in Burnsville
The median household size in Burnsville is 2.51 persons per household, with single male/father households (944 | 3.7%) accounting for the largest median household size of 3.74 persons per household. non-family households (9,206 | 36.3%) represent the smallest median household size with 1.24 persons per household.
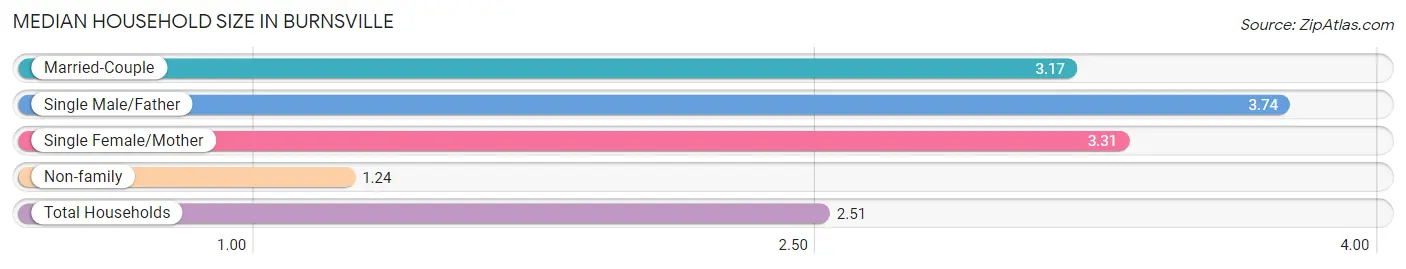
| Household Type | # Households | Household Size |
| Married-Couple | 12,304 (48.5%) | 3.17 |
| Single Male/Father | 944 (3.7%) | 3.74 |
| Single Female/Mother | 2,905 (11.5%) | 3.31 |
| Non-family | 9,206 (36.3%) | 1.24 |
| Total Households | 25,359 (100.0%) | 2.51 |
Household Size by Marriage Status in Burnsville
Out of a total of 25,359 households in Burnsville, 16,153 (63.7%) are family households, while 9,206 (36.3%) are nonfamily households. The most numerous type of family households are 2-person households, comprising 7,597, and the most common type of nonfamily households are 1-person households, comprising 7,301.
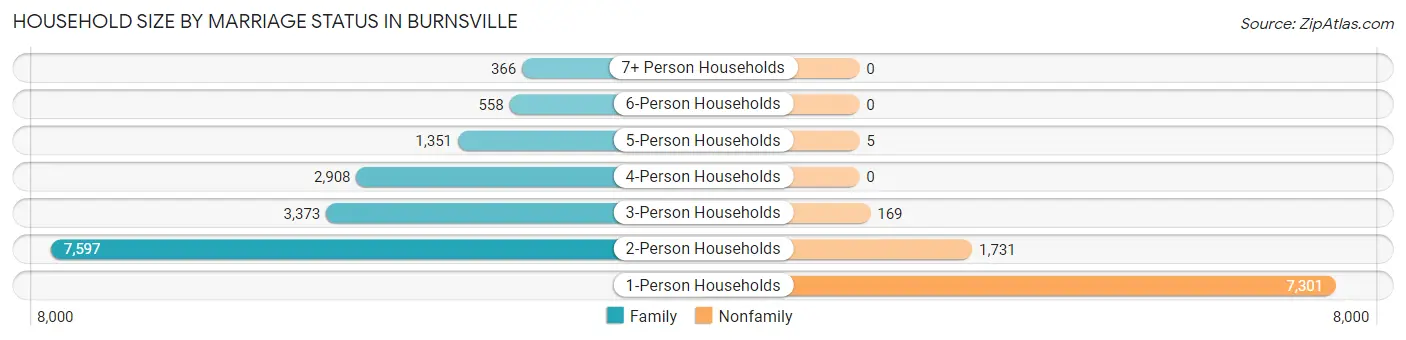
| Household Size | Family Households | Nonfamily Households |
| 1-Person Households | - | 7,301 (28.8%) |
| 2-Person Households | 7,597 (30.0%) | 1,731 (6.8%) |
| 3-Person Households | 3,373 (13.3%) | 169 (0.7%) |
| 4-Person Households | 2,908 (11.5%) | 0 (0.0%) |
| 5-Person Households | 1,351 (5.3%) | 5 (0.0%) |
| 6-Person Households | 558 (2.2%) | 0 (0.0%) |
| 7+ Person Households | 366 (1.4%) | 0 (0.0%) |
| Total | 16,153 (63.7%) | 9,206 (36.3%) |
Female Fertility in Burnsville
Fertility by Age in Burnsville
Average fertility rate in Burnsville is 79.0 births per 1,000 women. Women in the age bracket of 20 to 34 years have the highest fertility rate with 137.0 births per 1,000 women. Women in the age bracket of 20 to 34 years acount for 84.2% of all women with births.
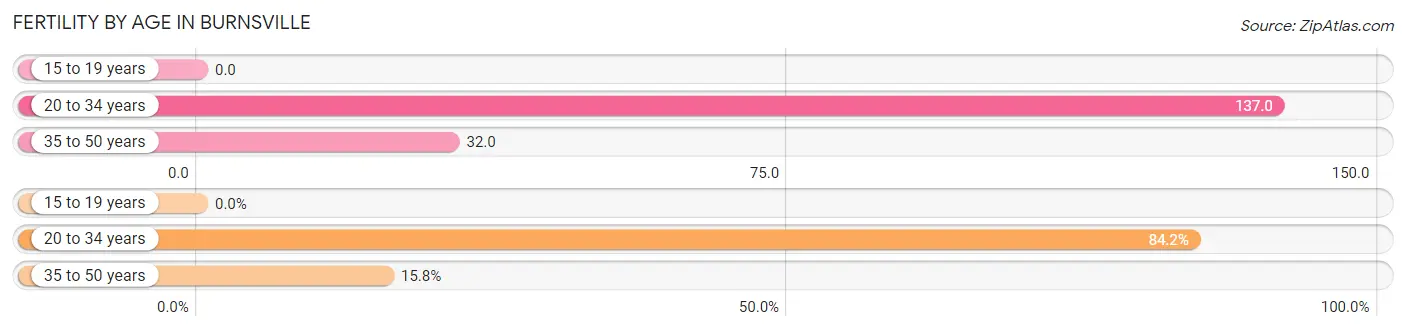
| Age Bracket | Women with Births | Births / 1,000 Women |
| 15 to 19 years | 0 (0.0%) | 0.0 |
| 20 to 34 years | 982 (84.2%) | 137.0 |
| 35 to 50 years | 184 (15.8%) | 32.0 |
| Total | 1,166 (100.0%) | 79.0 |
Fertility by Age by Marriage Status in Burnsville
67.0% of women with births (1,166) in Burnsville are married. The highest percentage of unmarried women with births falls into 20 to 34 years age bracket with 35.6% of them unmarried at the time of birth, while the lowest percentage of unmarried women with births belong to 35 to 50 years age bracket with 19.0% of them unmarried.
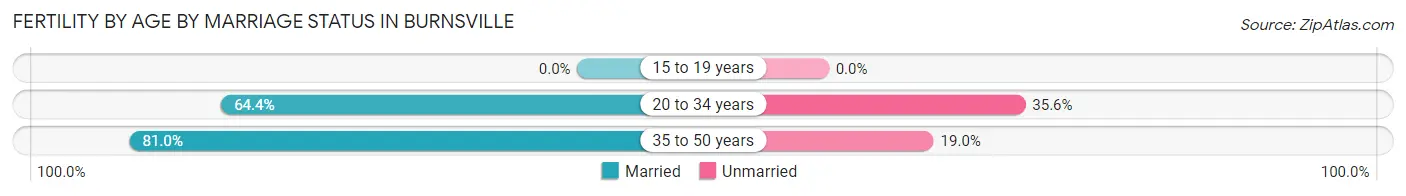
| Age Bracket | Married | Unmarried |
| 15 to 19 years | 0 (0.0%) | 0 (0.0%) |
| 20 to 34 years | 632 (64.4%) | 350 (35.6%) |
| 35 to 50 years | 149 (81.0%) | 35 (19.0%) |
| Total | 781 (67.0%) | 385 (33.0%) |
Fertility by Education in Burnsville
Average fertility rate in Burnsville is 79.0 births per 1,000 women. Women with the education attainment of high school diploma have the highest fertility rate of 100.0 births per 1,000 women, while women with the education attainment of bachelor's degree have the lowest fertility at 59.0 births per 1,000 women. Women with the education attainment of college or associate's degree represent 32.9% of all women with births.
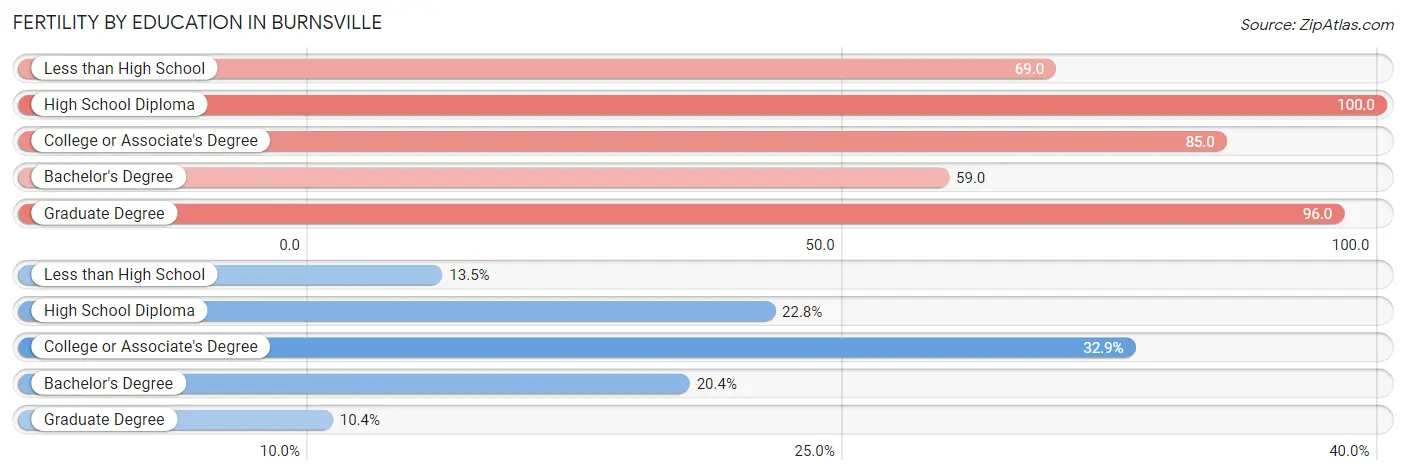
| Educational Attainment | Women with Births | Births / 1,000 Women |
| Less than High School | 157 (13.5%) | 69.0 |
| High School Diploma | 266 (22.8%) | 100.0 |
| College or Associate's Degree | 384 (32.9%) | 85.0 |
| Bachelor's Degree | 238 (20.4%) | 59.0 |
| Graduate Degree | 121 (10.4%) | 96.0 |
| Total | 1,166 (100.0%) | 79.0 |
Fertility by Education by Marriage Status in Burnsville
33.0% of women with births in Burnsville are unmarried. Women with the educational attainment of bachelor's degree are most likely to be married with 96.2% of them married at childbirth, while women with the educational attainment of high school diploma are least likely to be married with 75.9% of them unmarried at childbirth.
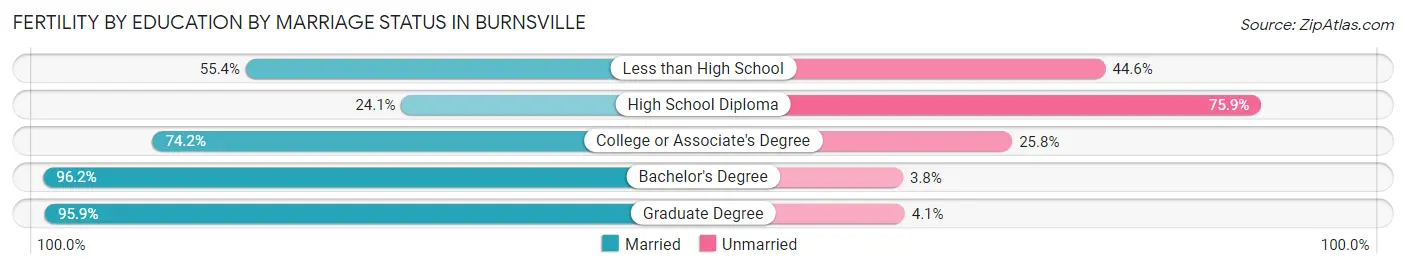
| Educational Attainment | Married | Unmarried |
| Less than High School | 87 (55.4%) | 70 (44.6%) |
| High School Diploma | 64 (24.1%) | 202 (75.9%) |
| College or Associate's Degree | 285 (74.2%) | 99 (25.8%) |
| Bachelor's Degree | 229 (96.2%) | 9 (3.8%) |
| Graduate Degree | 116 (95.9%) | 5 (4.1%) |
| Total | 781 (67.0%) | 385 (33.0%) |
Employment Characteristics in Burnsville
Employment by Class of Employer in Burnsville
Among the 34,383 employed individuals in Burnsville, private company employees (24,410 | 71.0%), not-for-profit organizations (3,180 | 9.2%), and local government employees (2,024 | 5.9%) make up the most common classes of employment.
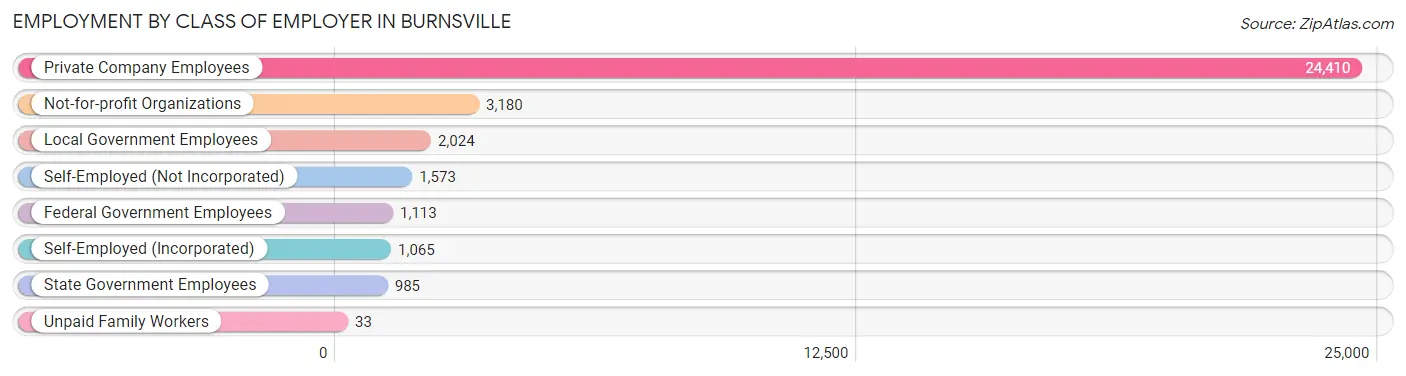
| Employer Class | # Employees | % Employees |
| Private Company Employees | 24,410 | 71.0% |
| Self-Employed (Incorporated) | 1,065 | 3.1% |
| Self-Employed (Not Incorporated) | 1,573 | 4.6% |
| Not-for-profit Organizations | 3,180 | 9.2% |
| Local Government Employees | 2,024 | 5.9% |
| State Government Employees | 985 | 2.9% |
| Federal Government Employees | 1,113 | 3.2% |
| Unpaid Family Workers | 33 | 0.1% |
| Total | 34,383 | 100.0% |
Employment Status by Age in Burnsville
According to the labor force statistics for Burnsville, out of the total population over 16 years of age (51,848), 70.9% or 36,760 individuals are in the labor force, with 4.5% or 1,654 of them unemployed. The age group with the highest labor force participation rate is 25 to 29 years, with 91.2% or 4,572 individuals in the labor force. Within the labor force, the 20 to 24 years age range has the highest percentage of unemployed individuals, with 11.4% or 414 of them being unemployed.
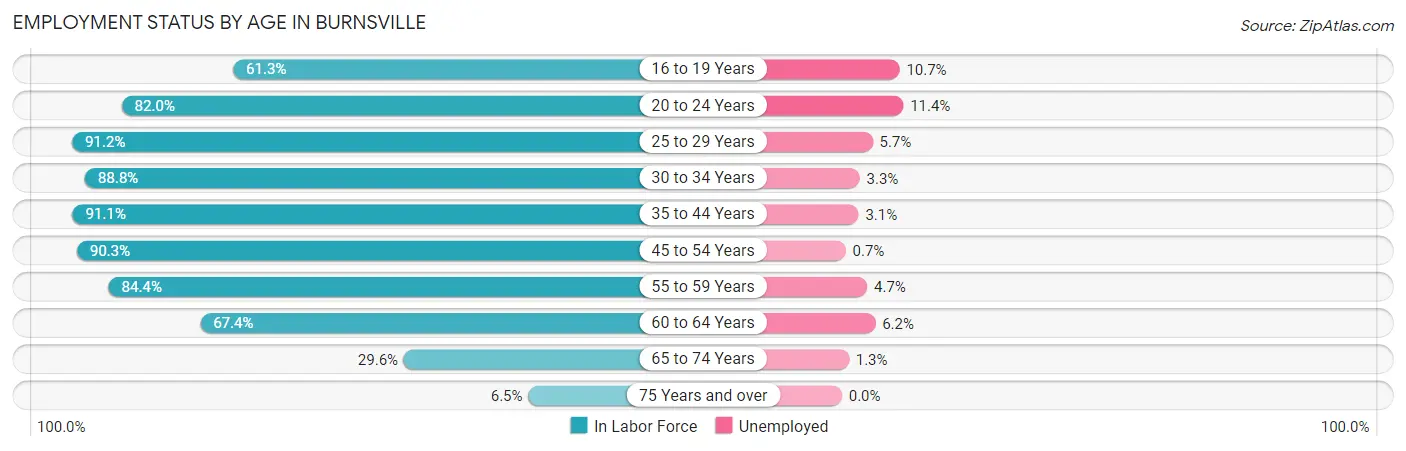
| Age Bracket | In Labor Force | Unemployed |
| 16 to 19 Years | 1,818 (61.3%) | 195 (10.7%) |
| 20 to 24 Years | 3,628 (82.0%) | 414 (11.4%) |
| 25 to 29 Years | 4,572 (91.2%) | 261 (5.7%) |
| 30 to 34 Years | 4,431 (88.8%) | 146 (3.3%) |
| 35 to 44 Years | 7,364 (91.1%) | 228 (3.1%) |
| 45 to 54 Years | 5,989 (90.3%) | 42 (0.7%) |
| 55 to 59 Years | 4,151 (84.4%) | 195 (4.7%) |
| 60 to 64 Years | 2,687 (67.4%) | 167 (6.2%) |
| 65 to 74 Years | 1,826 (29.6%) | 24 (1.3%) |
| 75 Years and over | 303 (6.5%) | 0 (0.0%) |
| Total | 36,760 (70.9%) | 1,654 (4.5%) |
Employment Status by Educational Attainment in Burnsville
According to labor force statistics for Burnsville, 86.8% of individuals (29,185) out of the total population between 25 and 64 years of age (33,623) are in the labor force, with 3.6% or 1,051 of them being unemployed. The group with the highest labor force participation rate are those with the educational attainment of bachelor's degree or higher, with 90.3% or 12,346 individuals in the labor force. Within the labor force, individuals with less than high school education have the highest percentage of unemployment, with 8.2% or 162 of them being unemployed.
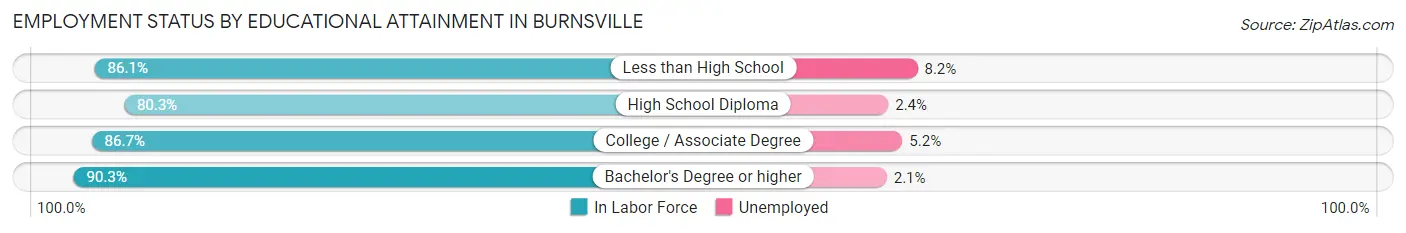
| Educational Attainment | In Labor Force | Unemployed |
| Less than High School | 1,973 (86.1%) | 188 (8.2%) |
| High School Diploma | 5,431 (80.3%) | 162 (2.4%) |
| College / Associate Degree | 9,447 (86.7%) | 567 (5.2%) |
| Bachelor's Degree or higher | 12,346 (90.3%) | 287 (2.1%) |
| Total | 29,185 (86.8%) | 1,210 (3.6%) |
Employment Occupations by Sex in Burnsville
Management, Business, Science and Arts Occupations
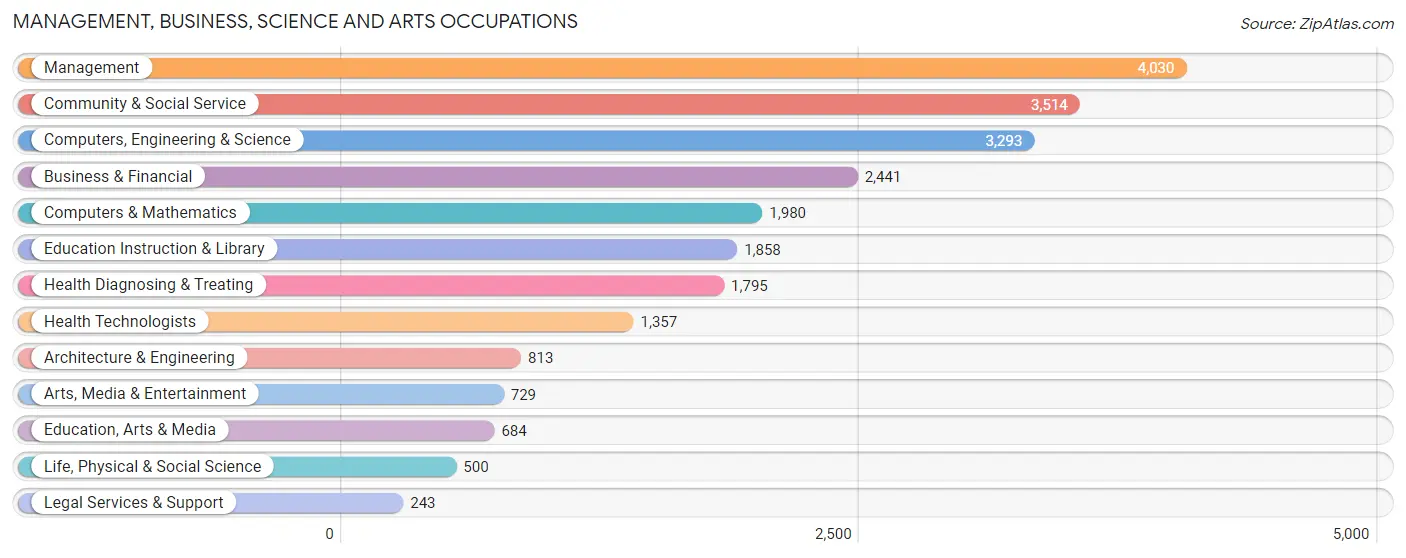
The most common Management, Business, Science and Arts occupations in Burnsville are Management (4,030 | 11.5%), Community & Social Service (3,514 | 10.0%), Computers, Engineering & Science (3,293 | 9.4%), Business & Financial (2,441 | 7.0%), and Computers & Mathematics (1,980 | 5.7%).
Management, Business, Science and Arts Occupations by Sex
Within the Management, Business, Science and Arts occupations in Burnsville, the most male-oriented occupations are Computers & Mathematics (82.9%), Architecture & Engineering (80.8%), and Computers, Engineering & Science (79.5%), while the most female-oriented occupations are Health Technologists (90.0%), Health Diagnosing & Treating (85.8%), and Education Instruction & Library (70.3%).
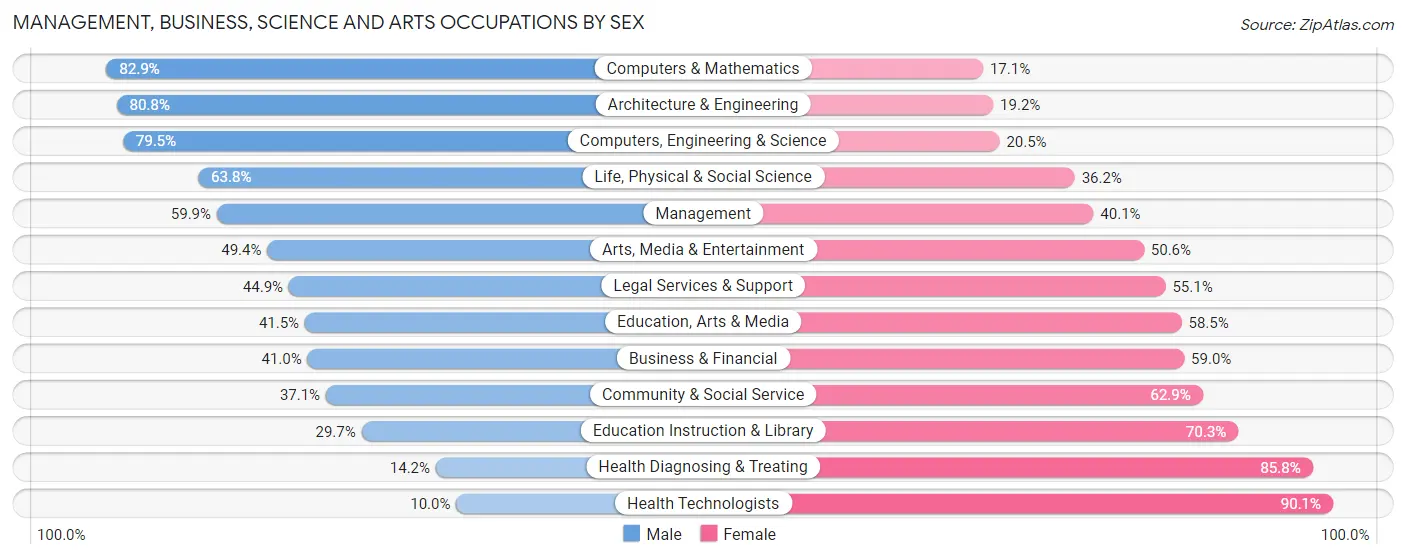
| Occupation | Male | Female |
| Management | 2,414 (59.9%) | 1,616 (40.1%) |
| Business & Financial | 1,000 (41.0%) | 1,441 (59.0%) |
| Computers, Engineering & Science | 2,618 (79.5%) | 675 (20.5%) |
| Computers & Mathematics | 1,642 (82.9%) | 338 (17.1%) |
| Architecture & Engineering | 657 (80.8%) | 156 (19.2%) |
| Life, Physical & Social Science | 319 (63.8%) | 181 (36.2%) |
| Community & Social Service | 1,305 (37.1%) | 2,209 (62.9%) |
| Education, Arts & Media | 284 (41.5%) | 400 (58.5%) |
| Legal Services & Support | 109 (44.9%) | 134 (55.1%) |
| Education Instruction & Library | 552 (29.7%) | 1,306 (70.3%) |
| Arts, Media & Entertainment | 360 (49.4%) | 369 (50.6%) |
| Health Diagnosing & Treating | 255 (14.2%) | 1,540 (85.8%) |
| Health Technologists | 135 (10.0%) | 1,222 (90.0%) |
| Total (Category) | 7,592 (50.4%) | 7,481 (49.6%) |
| Total (Overall) | 18,117 (51.7%) | 16,928 (48.3%) |
Services Occupations
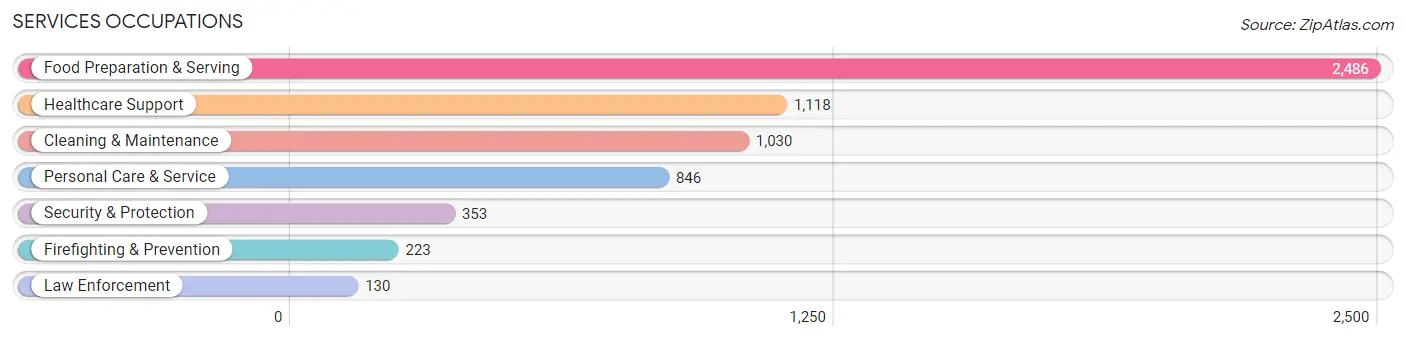
The most common Services occupations in Burnsville are Food Preparation & Serving (2,486 | 7.1%), Healthcare Support (1,118 | 3.2%), Cleaning & Maintenance (1,030 | 2.9%), Personal Care & Service (846 | 2.4%), and Security & Protection (353 | 1.0%).
Services Occupations by Sex
Within the Services occupations in Burnsville, the most male-oriented occupations are Law Enforcement (100.0%), Security & Protection (84.7%), and Firefighting & Prevention (75.8%), while the most female-oriented occupations are Personal Care & Service (88.2%), Healthcare Support (80.1%), and Food Preparation & Serving (55.6%).
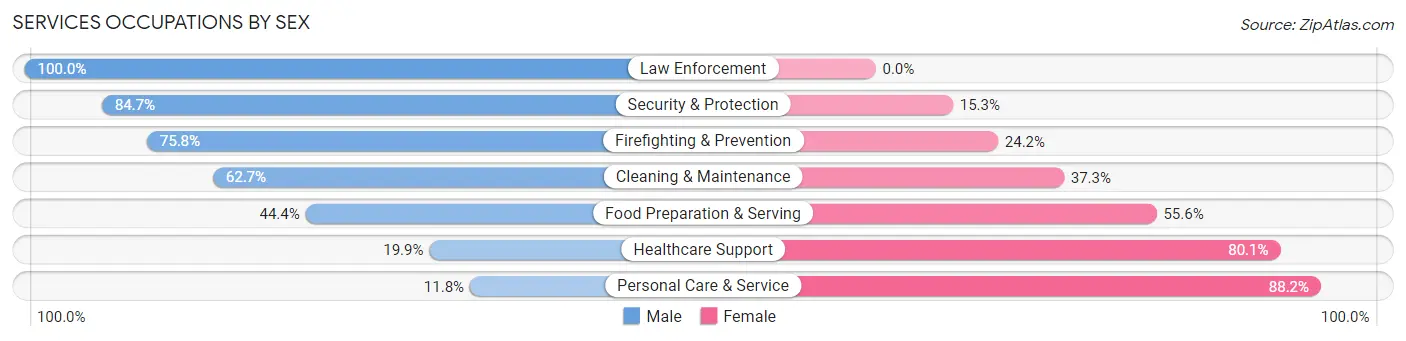
| Occupation | Male | Female |
| Healthcare Support | 222 (19.9%) | 896 (80.1%) |
| Security & Protection | 299 (84.7%) | 54 (15.3%) |
| Firefighting & Prevention | 169 (75.8%) | 54 (24.2%) |
| Law Enforcement | 130 (100.0%) | 0 (0.0%) |
| Food Preparation & Serving | 1,103 (44.4%) | 1,383 (55.6%) |
| Cleaning & Maintenance | 646 (62.7%) | 384 (37.3%) |
| Personal Care & Service | 100 (11.8%) | 746 (88.2%) |
| Total (Category) | 2,370 (40.6%) | 3,463 (59.4%) |
| Total (Overall) | 18,117 (51.7%) | 16,928 (48.3%) |
Sales and Office Occupations
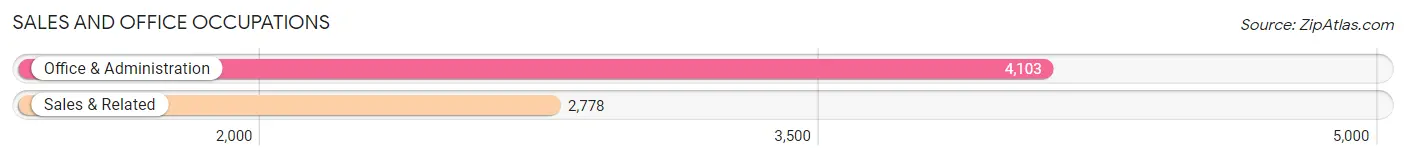
The most common Sales and Office occupations in Burnsville are Office & Administration (4,103 | 11.7%), and Sales & Related (2,778 | 7.9%).
Sales and Office Occupations by Sex
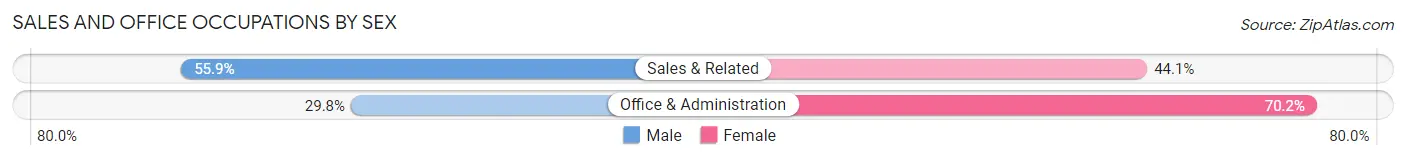
| Occupation | Male | Female |
| Sales & Related | 1,553 (55.9%) | 1,225 (44.1%) |
| Office & Administration | 1,223 (29.8%) | 2,880 (70.2%) |
| Total (Category) | 2,776 (40.3%) | 4,105 (59.7%) |
| Total (Overall) | 18,117 (51.7%) | 16,928 (48.3%) |
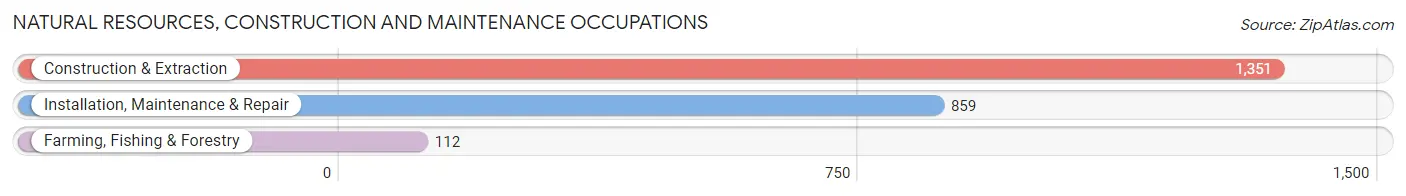
Natural Resources, Construction and Maintenance Occupations
The most common Natural Resources, Construction and Maintenance occupations in Burnsville are Construction & Extraction (1,351 | 3.9%), Installation, Maintenance & Repair (859 | 2.5%), and Farming, Fishing & Forestry (112 | 0.3%).
Natural Resources, Construction and Maintenance Occupations by Sex
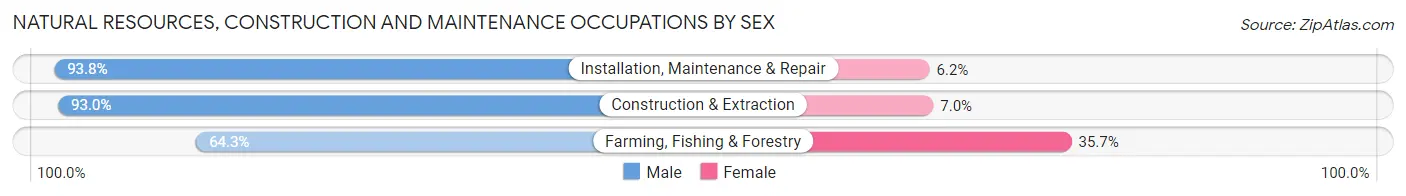
| Occupation | Male | Female |
| Farming, Fishing & Forestry | 72 (64.3%) | 40 (35.7%) |
| Construction & Extraction | 1,257 (93.0%) | 94 (7.0%) |
| Installation, Maintenance & Repair | 806 (93.8%) | 53 (6.2%) |
| Total (Category) | 2,135 (91.9%) | 187 (8.1%) |
| Total (Overall) | 18,117 (51.7%) | 16,928 (48.3%) |
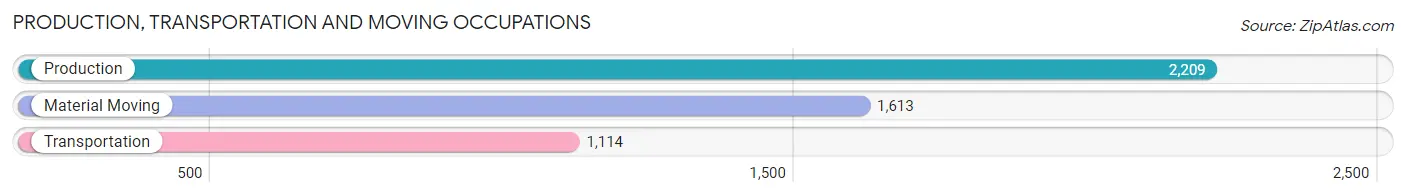
Production, Transportation and Moving Occupations
The most common Production, Transportation and Moving occupations in Burnsville are Production (2,209 | 6.3%), Material Moving (1,613 | 4.6%), and Transportation (1,114 | 3.2%).
Production, Transportation and Moving Occupations by Sex
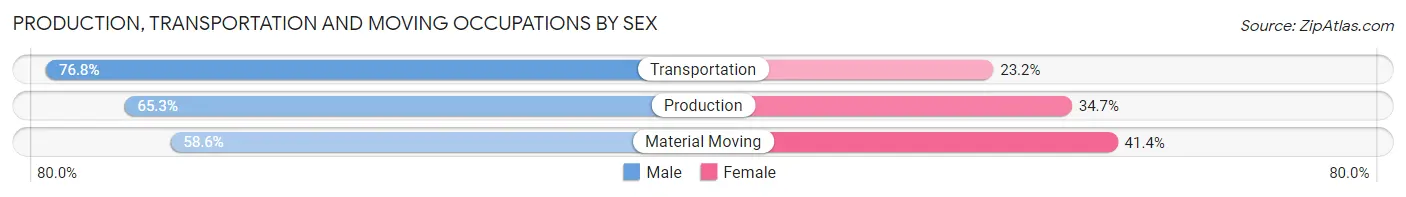
| Occupation | Male | Female |
| Production | 1,443 (65.3%) | 766 (34.7%) |
| Transportation | 856 (76.8%) | 258 (23.2%) |
| Material Moving | 945 (58.6%) | 668 (41.4%) |
| Total (Category) | 3,244 (65.7%) | 1,692 (34.3%) |
| Total (Overall) | 18,117 (51.7%) | 16,928 (48.3%) |
Employment Industries by Sex in Burnsville
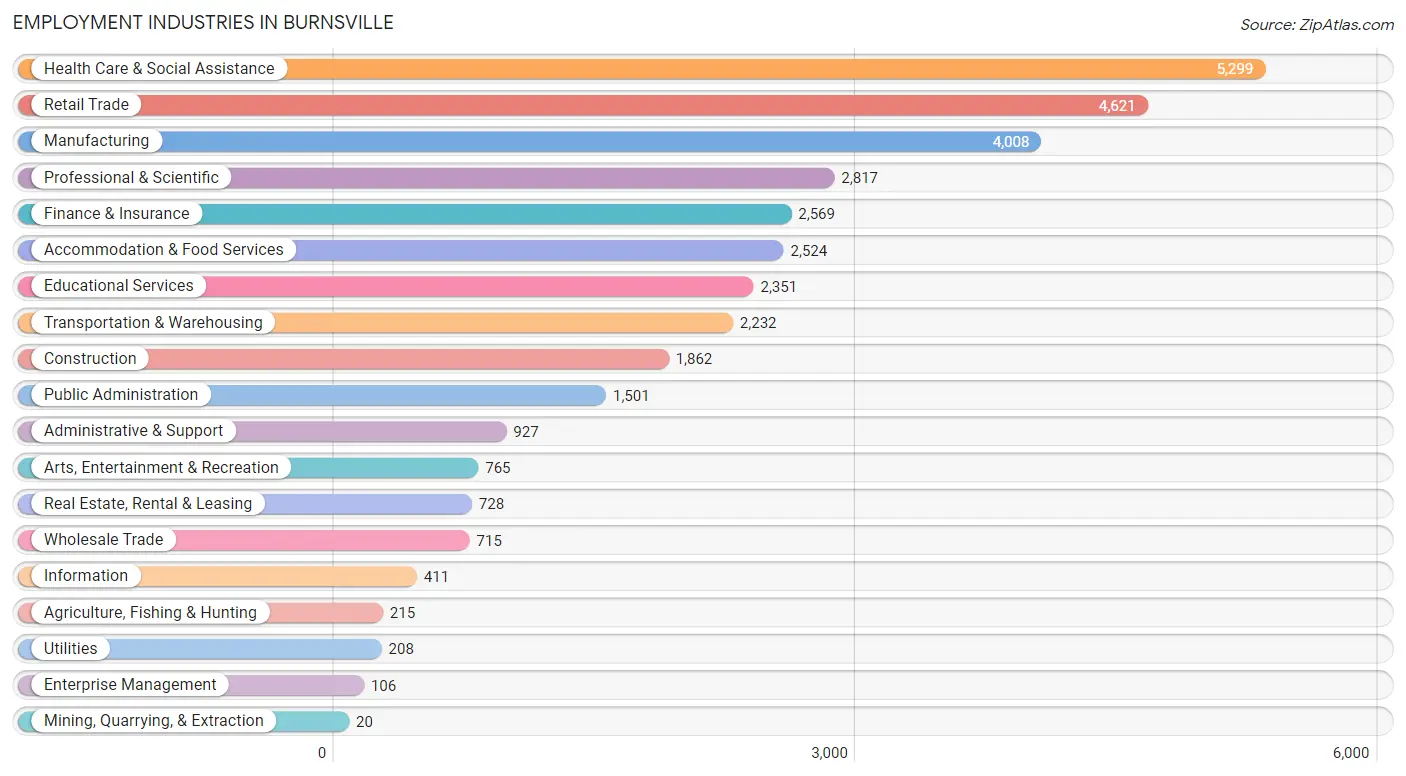
Employment Industries in Burnsville
The major employment industries in Burnsville include Health Care & Social Assistance (5,299 | 15.1%), Retail Trade (4,621 | 13.2%), Manufacturing (4,008 | 11.4%), Professional & Scientific (2,817 | 8.0%), and Finance & Insurance (2,569 | 7.3%).
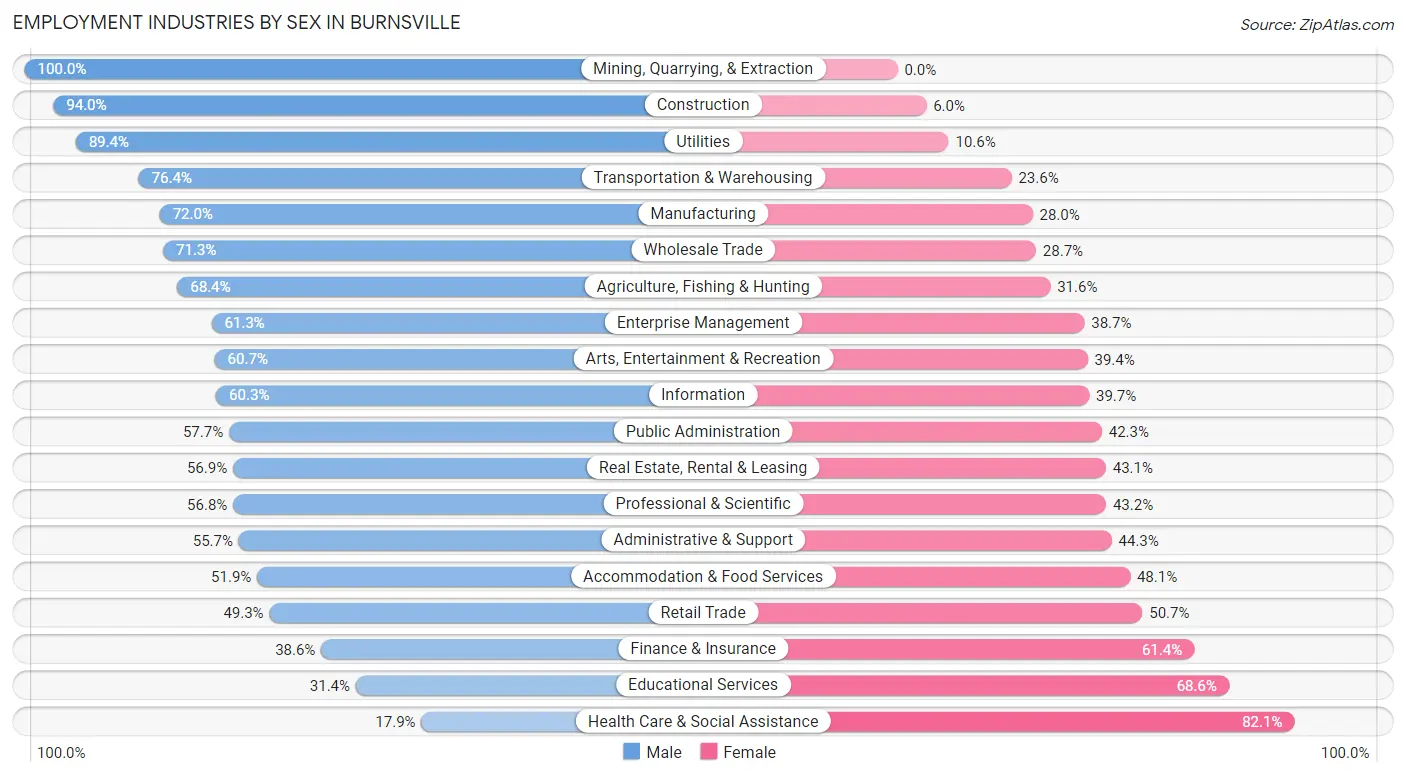
Employment Industries by Sex in Burnsville
The Burnsville industries that see more men than women are Mining, Quarrying, & Extraction (100.0%), Construction (94.0%), and Utilities (89.4%), whereas the industries that tend to have a higher number of women are Health Care & Social Assistance (82.1%), Educational Services (68.6%), and Finance & Insurance (61.4%).
| Industry | Male | Female |
| Agriculture, Fishing & Hunting | 147 (68.4%) | 68 (31.6%) |
| Mining, Quarrying, & Extraction | 20 (100.0%) | 0 (0.0%) |
| Construction | 1,751 (94.0%) | 111 (6.0%) |
| Manufacturing | 2,887 (72.0%) | 1,121 (28.0%) |
| Wholesale Trade | 510 (71.3%) | 205 (28.7%) |
| Retail Trade | 2,279 (49.3%) | 2,342 (50.7%) |
| Transportation & Warehousing | 1,705 (76.4%) | 527 (23.6%) |
| Utilities | 186 (89.4%) | 22 (10.6%) |
| Information | 248 (60.3%) | 163 (39.7%) |
| Finance & Insurance | 992 (38.6%) | 1,577 (61.4%) |
| Real Estate, Rental & Leasing | 414 (56.9%) | 314 (43.1%) |
| Professional & Scientific | 1,601 (56.8%) | 1,216 (43.2%) |
| Enterprise Management | 65 (61.3%) | 41 (38.7%) |
| Administrative & Support | 516 (55.7%) | 411 (44.3%) |
| Educational Services | 739 (31.4%) | 1,612 (68.6%) |
| Health Care & Social Assistance | 947 (17.9%) | 4,352 (82.1%) |
| Arts, Entertainment & Recreation | 464 (60.7%) | 301 (39.4%) |
| Accommodation & Food Services | 1,309 (51.9%) | 1,215 (48.1%) |
| Public Administration | 866 (57.7%) | 635 (42.3%) |
| Total | 18,117 (51.7%) | 16,928 (48.3%) |
Education in Burnsville
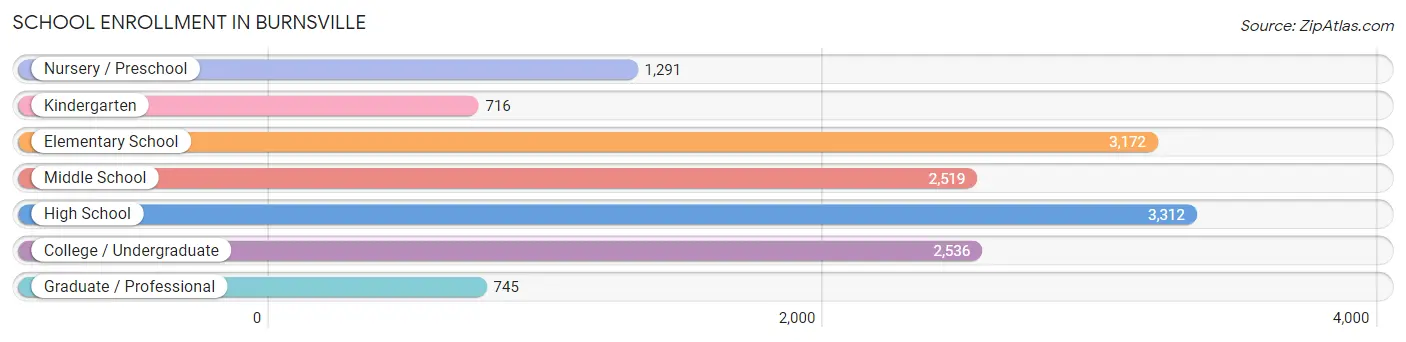
School Enrollment in Burnsville
The most common levels of schooling among the 14,291 students in Burnsville are high school (3,312 | 23.2%), elementary school (3,172 | 22.2%), and college / undergraduate (2,536 | 17.7%).
| School Level | # Students | % Students |
| Nursery / Preschool | 1,291 | 9.0% |
| Kindergarten | 716 | 5.0% |
| Elementary School | 3,172 | 22.2% |
| Middle School | 2,519 | 17.6% |
| High School | 3,312 | 23.2% |
| College / Undergraduate | 2,536 | 17.7% |
| Graduate / Professional | 745 | 5.2% |
| Total | 14,291 | 100.0% |
School Enrollment by Age by Funding Source in Burnsville
Out of a total of 14,291 students who are enrolled in schools in Burnsville, 1,858 (13.0%) attend a private institution, while the remaining 12,433 (87.0%) are enrolled in public schools. The age group of 35 years and over has the highest likelihood of being enrolled in private schools, with 271 (41.9% in the age bracket) enrolled. Conversely, the age group of 15 to 17 year olds has the lowest likelihood of being enrolled in a private school, with 2,245 (96.2% in the age bracket) attending a public institution.
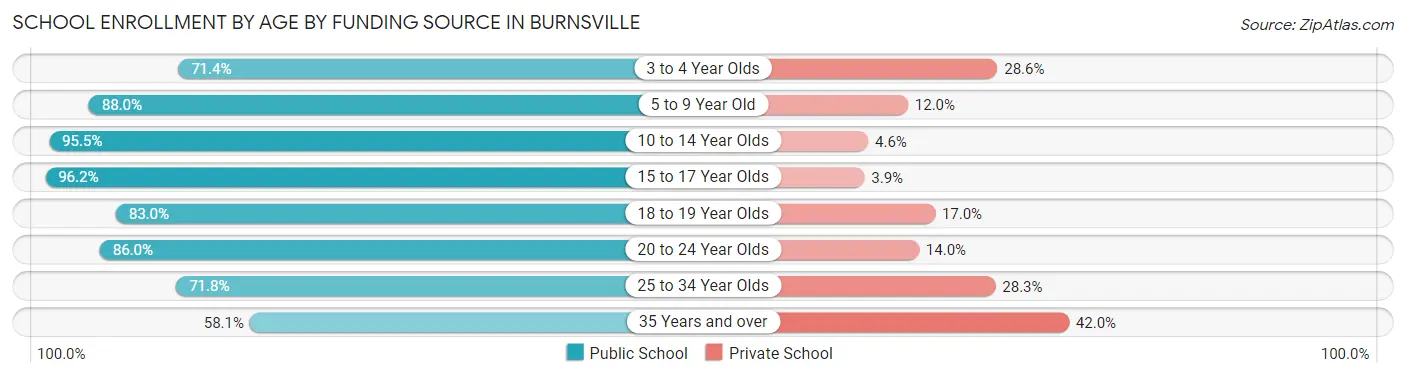
| Age Bracket | Public School | Private School |
| 3 to 4 Year Olds | 571 (71.4%) | 229 (28.6%) |
| 5 to 9 Year Old | 3,498 (88.0%) | 475 (12.0%) |
| 10 to 14 Year Olds | 3,039 (95.5%) | 145 (4.5%) |
| 15 to 17 Year Olds | 2,245 (96.2%) | 90 (3.8%) |
| 18 to 19 Year Olds | 835 (83.0%) | 171 (17.0%) |
| 20 to 24 Year Olds | 1,111 (86.0%) | 181 (14.0%) |
| 25 to 34 Year Olds | 757 (71.8%) | 298 (28.2%) |
| 35 Years and over | 375 (58.1%) | 271 (41.9%) |
| Total | 12,433 (87.0%) | 1,858 (13.0%) |
Educational Attainment by Field of Study in Burnsville
Business (4,304 | 22.2%), education (2,122 | 10.9%), science & technology (1,858 | 9.6%), social sciences (1,643 | 8.5%), and arts & humanities (1,238 | 6.4%) are the most common fields of study among 19,428 individuals in Burnsville who have obtained a bachelor's degree or higher.
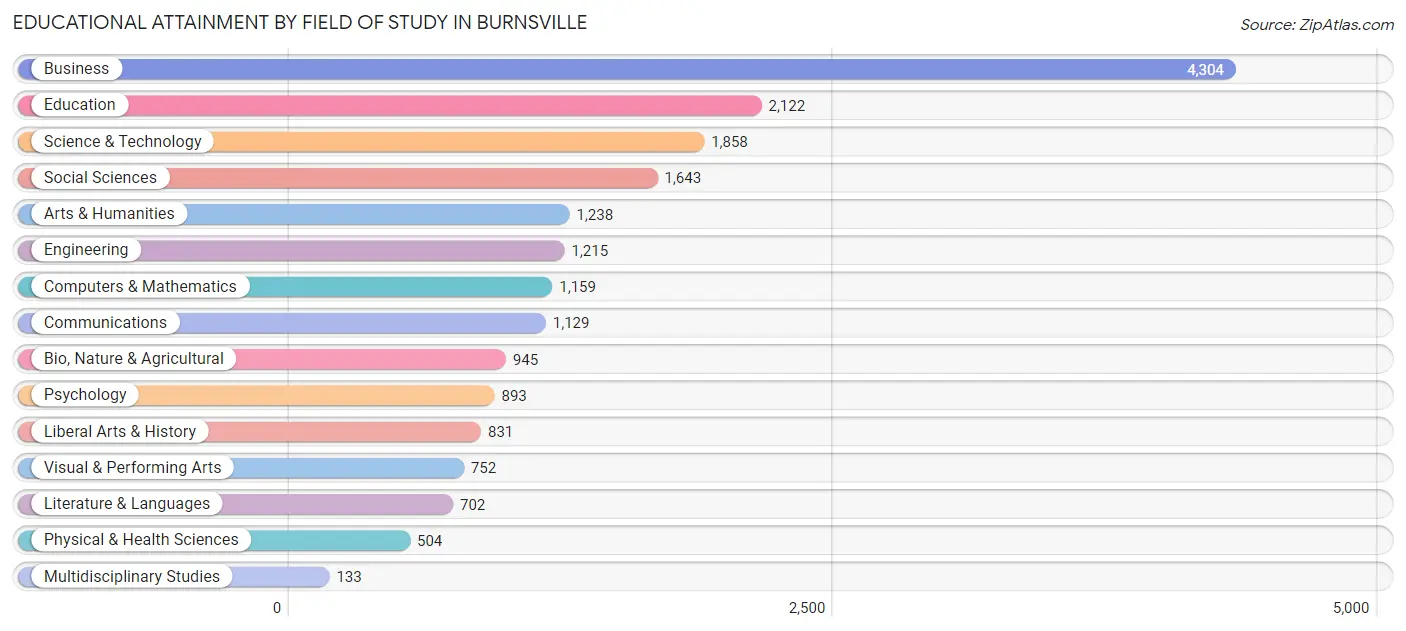
| Field of Study | # Graduates | % Graduates |
| Computers & Mathematics | 1,159 | 6.0% |
| Bio, Nature & Agricultural | 945 | 4.9% |
| Physical & Health Sciences | 504 | 2.6% |
| Psychology | 893 | 4.6% |
| Social Sciences | 1,643 | 8.5% |
| Engineering | 1,215 | 6.2% |
| Multidisciplinary Studies | 133 | 0.7% |
| Science & Technology | 1,858 | 9.6% |
| Business | 4,304 | 22.2% |
| Education | 2,122 | 10.9% |
| Literature & Languages | 702 | 3.6% |
| Liberal Arts & History | 831 | 4.3% |
| Visual & Performing Arts | 752 | 3.9% |
| Communications | 1,129 | 5.8% |
| Arts & Humanities | 1,238 | 6.4% |
| Total | 19,428 | 100.0% |
Transportation & Commute in Burnsville
Vehicle Availability by Sex in Burnsville
The most prevalent vehicle ownership categories in Burnsville are males with 2 vehicles (8,419, accounting for 47.0%) and females with 2 vehicles (7,442, making up 51.3%).
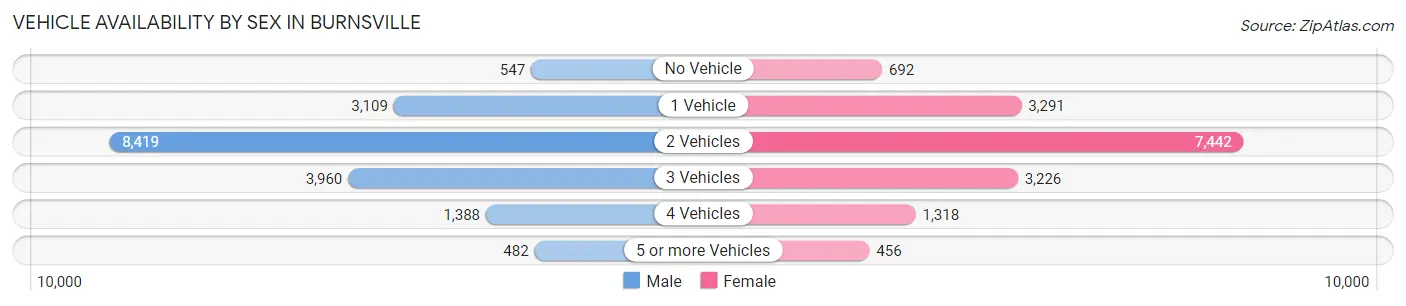
| Vehicles Available | Male | Female |
| No Vehicle | 547 (3.1%) | 692 (4.2%) |
| 1 Vehicle | 3,109 (17.4%) | 3,291 (20.0%) |
| 2 Vehicles | 8,419 (47.0%) | 7,442 (45.3%) |
| 3 Vehicles | 3,960 (22.1%) | 3,226 (19.6%) |
| 4 Vehicles | 1,388 (7.7%) | 1,318 (8.0%) |
| 5 or more Vehicles | 482 (2.7%) | 456 (2.8%) |
| Total | 17,905 (100.0%) | 16,425 (100.0%) |
Commute Time in Burnsville
The most frequently occuring commute durations in Burnsville are 15 to 19 minutes (5,123 commuters, 17.1%), 20 to 24 minutes (4,710 commuters, 15.7%), and 30 to 34 minutes (4,219 commuters, 14.1%).
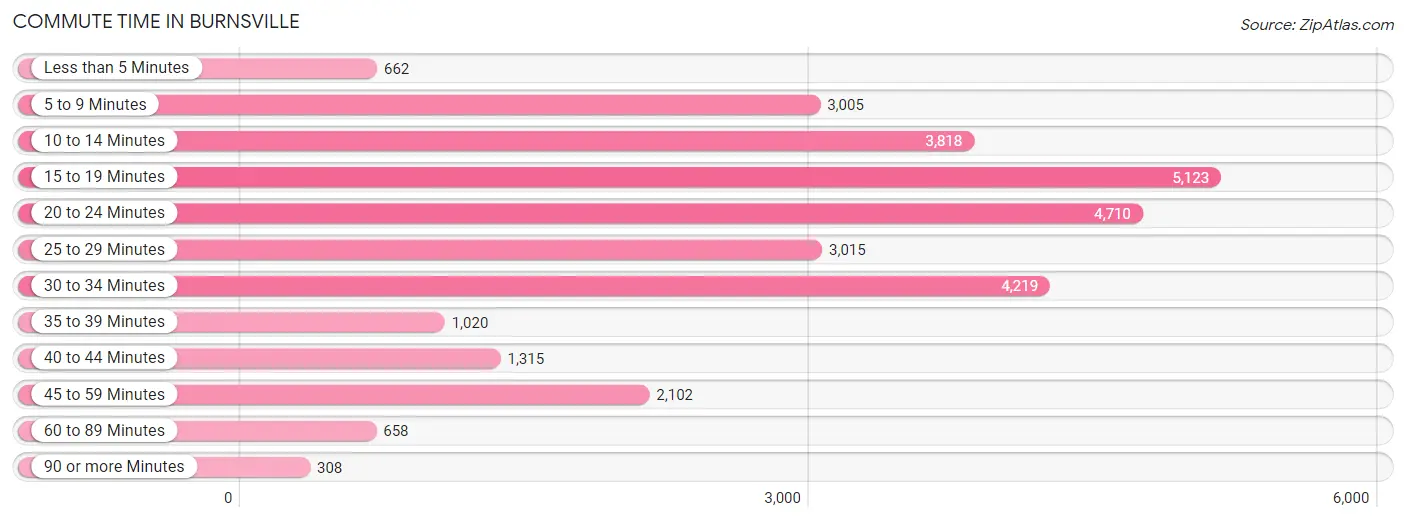
| Commute Time | # Commuters | % Commuters |
| Less than 5 Minutes | 662 | 2.2% |
| 5 to 9 Minutes | 3,005 | 10.0% |
| 10 to 14 Minutes | 3,818 | 12.8% |
| 15 to 19 Minutes | 5,123 | 17.1% |
| 20 to 24 Minutes | 4,710 | 15.7% |
| 25 to 29 Minutes | 3,015 | 10.1% |
| 30 to 34 Minutes | 4,219 | 14.1% |
| 35 to 39 Minutes | 1,020 | 3.4% |
| 40 to 44 Minutes | 1,315 | 4.4% |
| 45 to 59 Minutes | 2,102 | 7.0% |
| 60 to 89 Minutes | 658 | 2.2% |
| 90 or more Minutes | 308 | 1.0% |
Commute Time by Sex in Burnsville
The most common commute times in Burnsville are 30 to 34 minutes (2,685 commuters, 16.9%) for males and 15 to 19 minutes (2,632 commuters, 18.7%) for females.
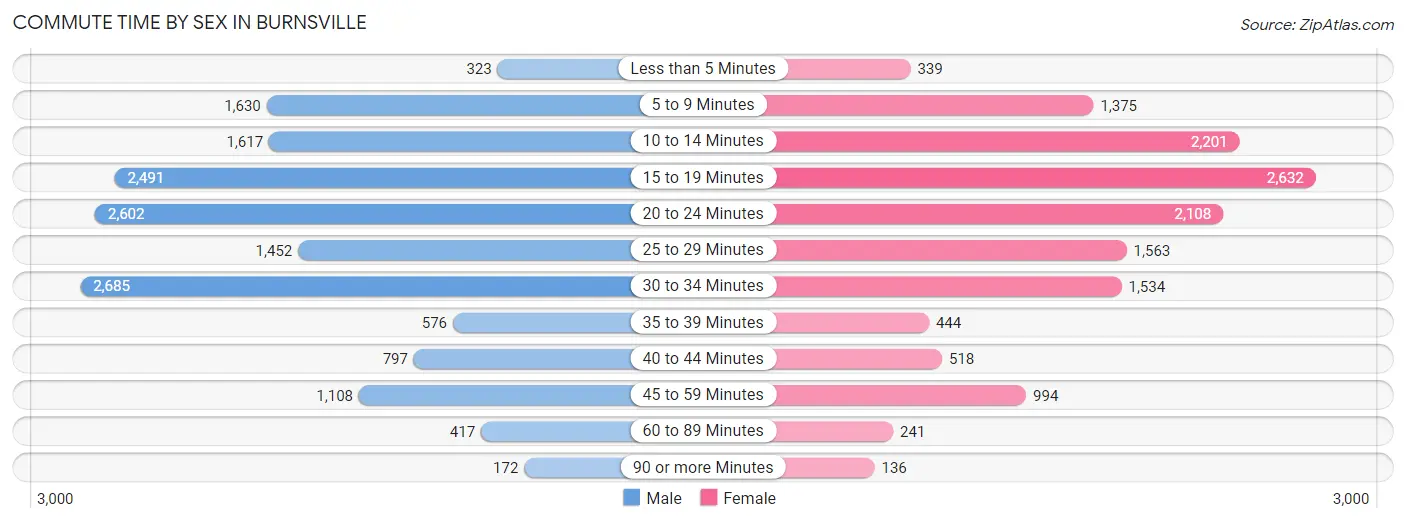
| Commute Time | Male | Female |
| Less than 5 Minutes | 323 (2.0%) | 339 (2.4%) |
| 5 to 9 Minutes | 1,630 (10.3%) | 1,375 (9.8%) |
| 10 to 14 Minutes | 1,617 (10.2%) | 2,201 (15.6%) |
| 15 to 19 Minutes | 2,491 (15.7%) | 2,632 (18.7%) |
| 20 to 24 Minutes | 2,602 (16.4%) | 2,108 (15.0%) |
| 25 to 29 Minutes | 1,452 (9.1%) | 1,563 (11.1%) |
| 30 to 34 Minutes | 2,685 (16.9%) | 1,534 (10.9%) |
| 35 to 39 Minutes | 576 (3.6%) | 444 (3.2%) |
| 40 to 44 Minutes | 797 (5.0%) | 518 (3.7%) |
| 45 to 59 Minutes | 1,108 (7.0%) | 994 (7.1%) |
| 60 to 89 Minutes | 417 (2.6%) | 241 (1.7%) |
| 90 or more Minutes | 172 (1.1%) | 136 (1.0%) |
Time of Departure to Work by Sex in Burnsville
The most frequent times of departure to work in Burnsville are 7:00 AM to 7:29 AM (1,954, 12.3%) for males and 7:00 AM to 7:29 AM (2,486, 17.6%) for females.
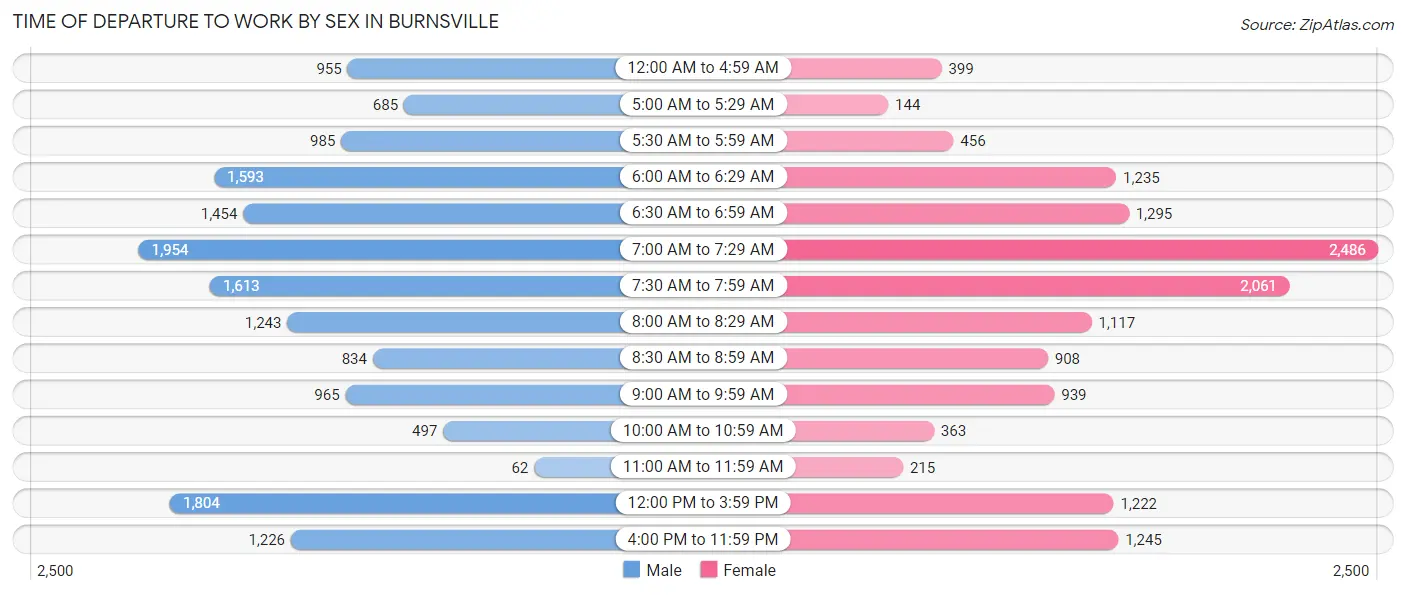
| Time of Departure | Male | Female |
| 12:00 AM to 4:59 AM | 955 (6.0%) | 399 (2.8%) |
| 5:00 AM to 5:29 AM | 685 (4.3%) | 144 (1.0%) |
| 5:30 AM to 5:59 AM | 985 (6.2%) | 456 (3.2%) |
| 6:00 AM to 6:29 AM | 1,593 (10.0%) | 1,235 (8.8%) |
| 6:30 AM to 6:59 AM | 1,454 (9.2%) | 1,295 (9.2%) |
| 7:00 AM to 7:29 AM | 1,954 (12.3%) | 2,486 (17.6%) |
| 7:30 AM to 7:59 AM | 1,613 (10.2%) | 2,061 (14.6%) |
| 8:00 AM to 8:29 AM | 1,243 (7.8%) | 1,117 (7.9%) |
| 8:30 AM to 8:59 AM | 834 (5.3%) | 908 (6.5%) |
| 9:00 AM to 9:59 AM | 965 (6.1%) | 939 (6.7%) |
| 10:00 AM to 10:59 AM | 497 (3.1%) | 363 (2.6%) |
| 11:00 AM to 11:59 AM | 62 (0.4%) | 215 (1.5%) |
| 12:00 PM to 3:59 PM | 1,804 (11.4%) | 1,222 (8.7%) |
| 4:00 PM to 11:59 PM | 1,226 (7.7%) | 1,245 (8.8%) |
| Total | 15,870 (100.0%) | 14,085 (100.0%) |
Housing Occupancy in Burnsville
Occupancy by Ownership in Burnsville
Of the total 25,359 dwellings in Burnsville, owner-occupied units account for 17,304 (68.2%), while renter-occupied units make up 8,055 (31.8%).
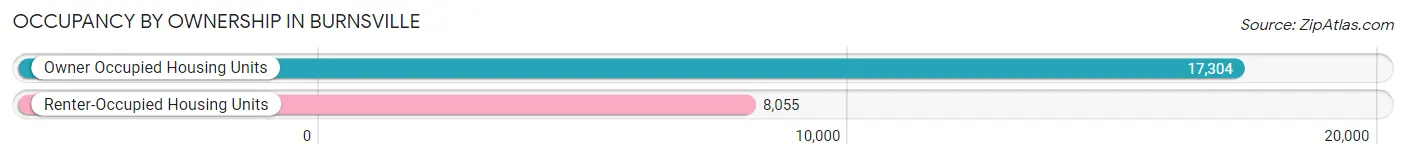
| Occupancy | # Housing Units | % Housing Units |
| Owner Occupied Housing Units | 17,304 | 68.2% |
| Renter-Occupied Housing Units | 8,055 | 31.8% |
| Total Occupied Housing Units | 25,359 | 100.0% |
Occupancy by Household Size in Burnsville
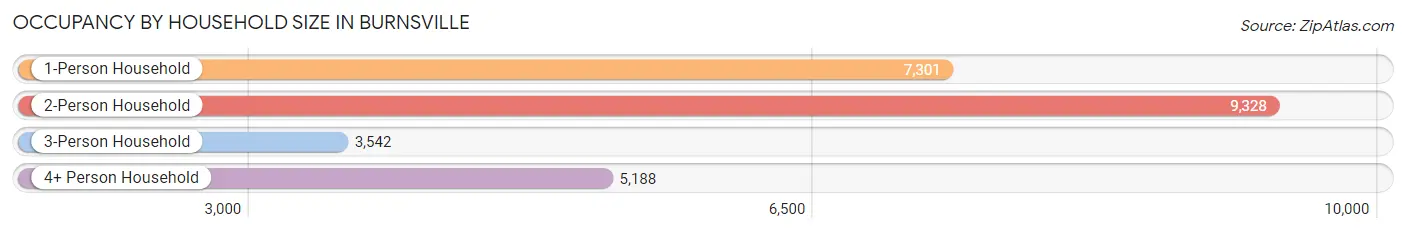
| Household Size | # Housing Units | % Housing Units |
| 1-Person Household | 7,301 | 28.8% |
| 2-Person Household | 9,328 | 36.8% |
| 3-Person Household | 3,542 | 14.0% |
| 4+ Person Household | 5,188 | 20.5% |
| Total Housing Units | 25,359 | 100.0% |
Occupancy by Ownership by Household Size in Burnsville
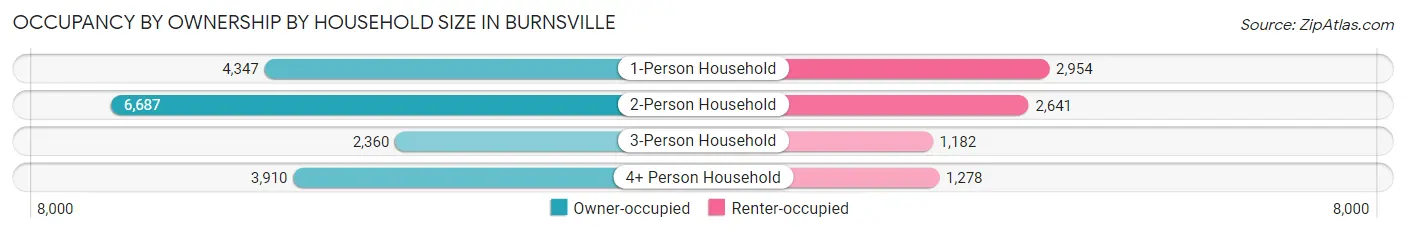
| Household Size | Owner-occupied | Renter-occupied |
| 1-Person Household | 4,347 (59.5%) | 2,954 (40.5%) |
| 2-Person Household | 6,687 (71.7%) | 2,641 (28.3%) |
| 3-Person Household | 2,360 (66.6%) | 1,182 (33.4%) |
| 4+ Person Household | 3,910 (75.4%) | 1,278 (24.6%) |
| Total Housing Units | 17,304 (68.2%) | 8,055 (31.8%) |
Occupancy by Educational Attainment in Burnsville
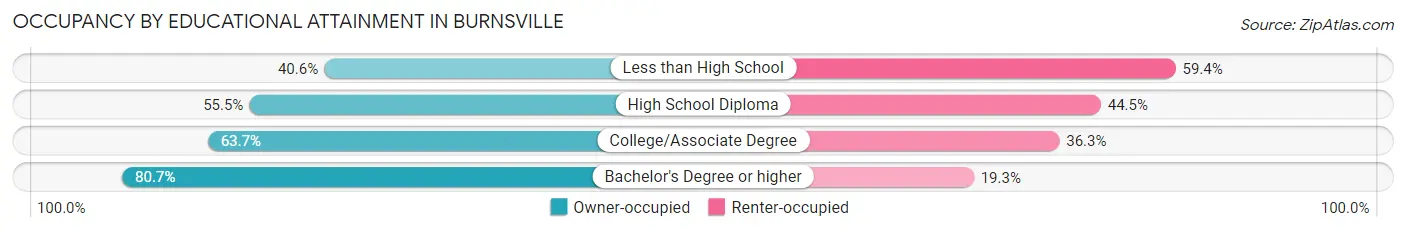
| Household Size | Owner-occupied | Renter-occupied |
| Less than High School | 495 (40.6%) | 723 (59.4%) |
| High School Diploma | 2,494 (55.5%) | 2,002 (44.5%) |
| College/Associate Degree | 5,742 (63.7%) | 3,274 (36.3%) |
| Bachelor's Degree or higher | 8,573 (80.7%) | 2,056 (19.3%) |
Occupancy by Age of Householder in Burnsville
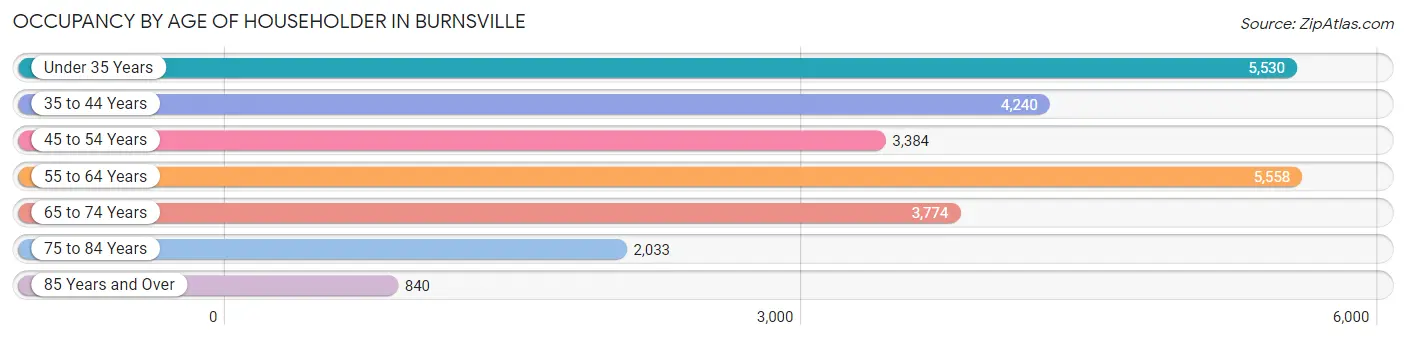
| Age Bracket | # Households | % Households |
| Under 35 Years | 5,530 | 21.8% |
| 35 to 44 Years | 4,240 | 16.7% |
| 45 to 54 Years | 3,384 | 13.3% |
| 55 to 64 Years | 5,558 | 21.9% |
| 65 to 74 Years | 3,774 | 14.9% |
| 75 to 84 Years | 2,033 | 8.0% |
| 85 Years and Over | 840 | 3.3% |
| Total | 25,359 | 100.0% |
Housing Finances in Burnsville
Median Income by Occupancy in Burnsville
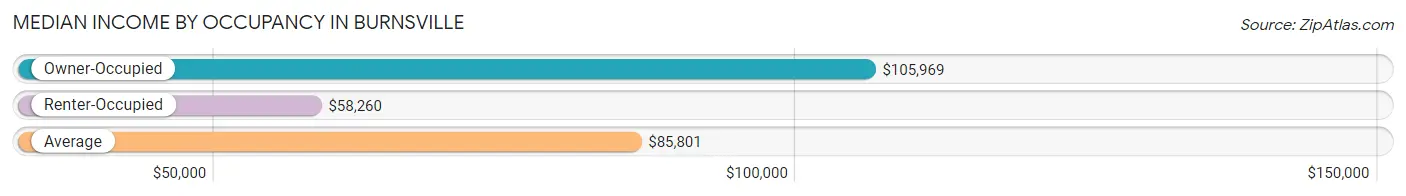
| Occupancy Type | # Households | Median Income |
| Owner-Occupied | 17,304 (68.2%) | $105,969 |
| Renter-Occupied | 8,055 (31.8%) | $58,260 |
| Average | 25,359 (100.0%) | $85,801 |
Occupancy by Householder Income Bracket in Burnsville
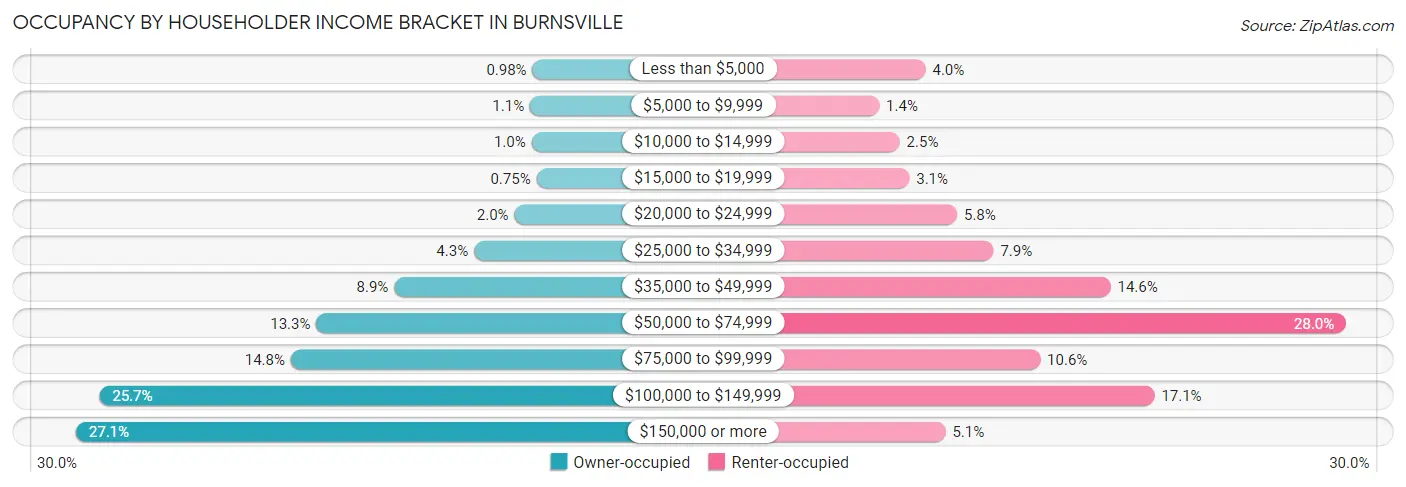
| Income Bracket | Owner-occupied | Renter-occupied |
| Less than $5,000 | 170 (1.0%) | 322 (4.0%) |
| $5,000 to $9,999 | 194 (1.1%) | 109 (1.3%) |
| $10,000 to $14,999 | 178 (1.0%) | 203 (2.5%) |
| $15,000 to $19,999 | 129 (0.7%) | 247 (3.1%) |
| $20,000 to $24,999 | 348 (2.0%) | 467 (5.8%) |
| $25,000 to $34,999 | 747 (4.3%) | 635 (7.9%) |
| $35,000 to $49,999 | 1,536 (8.9%) | 1,174 (14.6%) |
| $50,000 to $74,999 | 2,306 (13.3%) | 2,258 (28.0%) |
| $75,000 to $99,999 | 2,560 (14.8%) | 850 (10.5%) |
| $100,000 to $149,999 | 4,452 (25.7%) | 1,376 (17.1%) |
| $150,000 or more | 4,684 (27.1%) | 414 (5.1%) |
| Total | 17,304 (100.0%) | 8,055 (100.0%) |
Monthly Housing Cost Tiers in Burnsville
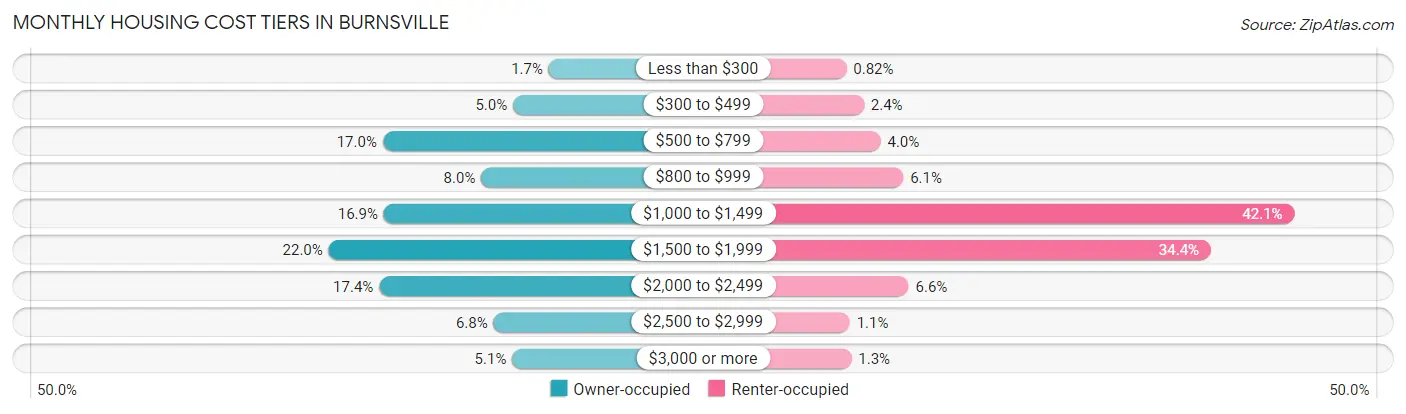
| Monthly Cost | Owner-occupied | Renter-occupied |
| Less than $300 | 301 (1.7%) | 66 (0.8%) |
| $300 to $499 | 871 (5.0%) | 196 (2.4%) |
| $500 to $799 | 2,947 (17.0%) | 320 (4.0%) |
| $800 to $999 | 1,377 (8.0%) | 488 (6.1%) |
| $1,000 to $1,499 | 2,930 (16.9%) | 3,389 (42.1%) |
| $1,500 to $1,999 | 3,809 (22.0%) | 2,769 (34.4%) |
| $2,000 to $2,499 | 3,004 (17.4%) | 528 (6.6%) |
| $2,500 to $2,999 | 1,181 (6.8%) | 91 (1.1%) |
| $3,000 or more | 884 (5.1%) | 103 (1.3%) |
| Total | 17,304 (100.0%) | 8,055 (100.0%) |
Physical Housing Characteristics in Burnsville
Housing Structures in Burnsville
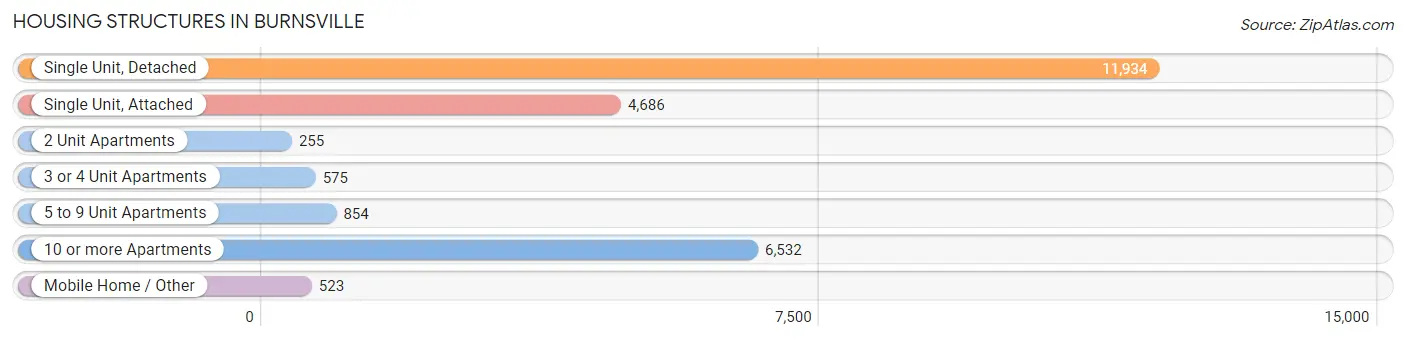
| Structure Type | # Housing Units | % Housing Units |
| Single Unit, Detached | 11,934 | 47.1% |
| Single Unit, Attached | 4,686 | 18.5% |
| 2 Unit Apartments | 255 | 1.0% |
| 3 or 4 Unit Apartments | 575 | 2.3% |
| 5 to 9 Unit Apartments | 854 | 3.4% |
| 10 or more Apartments | 6,532 | 25.8% |
| Mobile Home / Other | 523 | 2.1% |
| Total | 25,359 | 100.0% |
Housing Structures by Occupancy in Burnsville
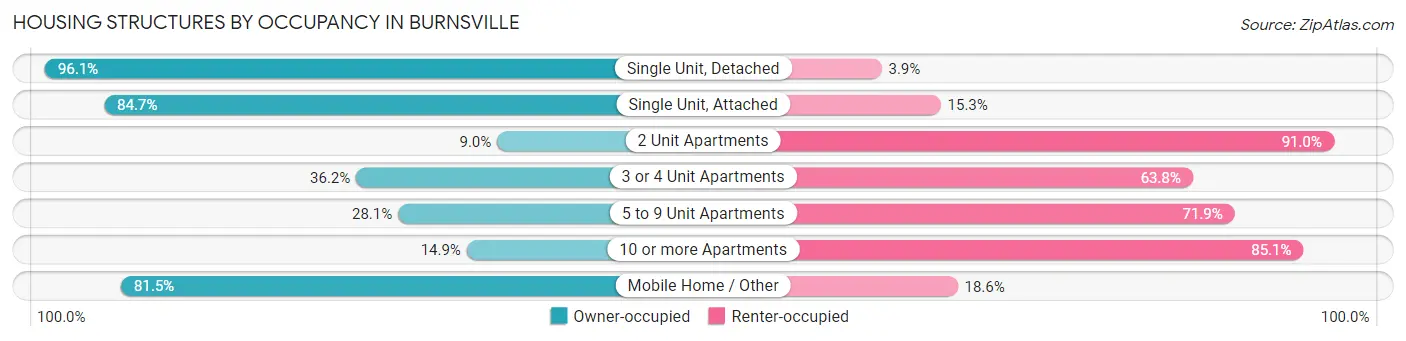
| Structure Type | Owner-occupied | Renter-occupied |
| Single Unit, Detached | 11,466 (96.1%) | 468 (3.9%) |
| Single Unit, Attached | 3,969 (84.7%) | 717 (15.3%) |
| 2 Unit Apartments | 23 (9.0%) | 232 (91.0%) |
| 3 or 4 Unit Apartments | 208 (36.2%) | 367 (63.8%) |
| 5 to 9 Unit Apartments | 240 (28.1%) | 614 (71.9%) |
| 10 or more Apartments | 972 (14.9%) | 5,560 (85.1%) |
| Mobile Home / Other | 426 (81.5%) | 97 (18.5%) |
| Total | 17,304 (68.2%) | 8,055 (31.8%) |
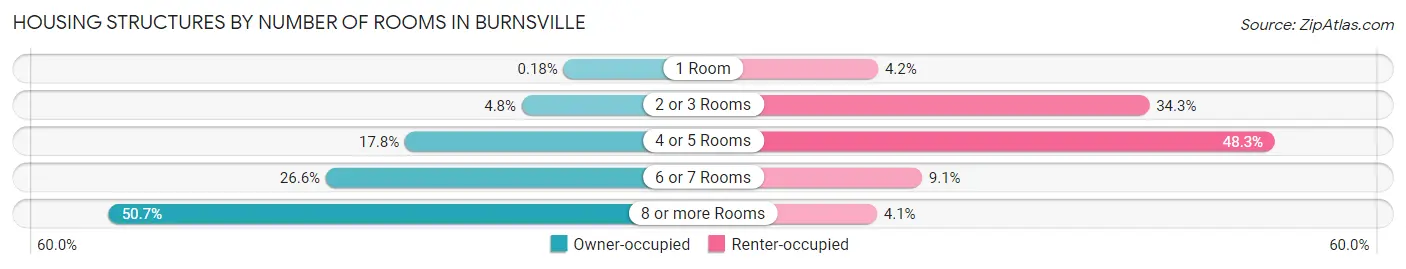
Housing Structures by Number of Rooms in Burnsville
| Number of Rooms | Owner-occupied | Renter-occupied |
| 1 Room | 32 (0.2%) | 340 (4.2%) |
| 2 or 3 Rooms | 833 (4.8%) | 2,765 (34.3%) |
| 4 or 5 Rooms | 3,077 (17.8%) | 3,888 (48.3%) |
| 6 or 7 Rooms | 4,596 (26.6%) | 732 (9.1%) |
| 8 or more Rooms | 8,766 (50.7%) | 330 (4.1%) |
| Total | 17,304 (100.0%) | 8,055 (100.0%) |
Housing Structure by Heating Type in Burnsville
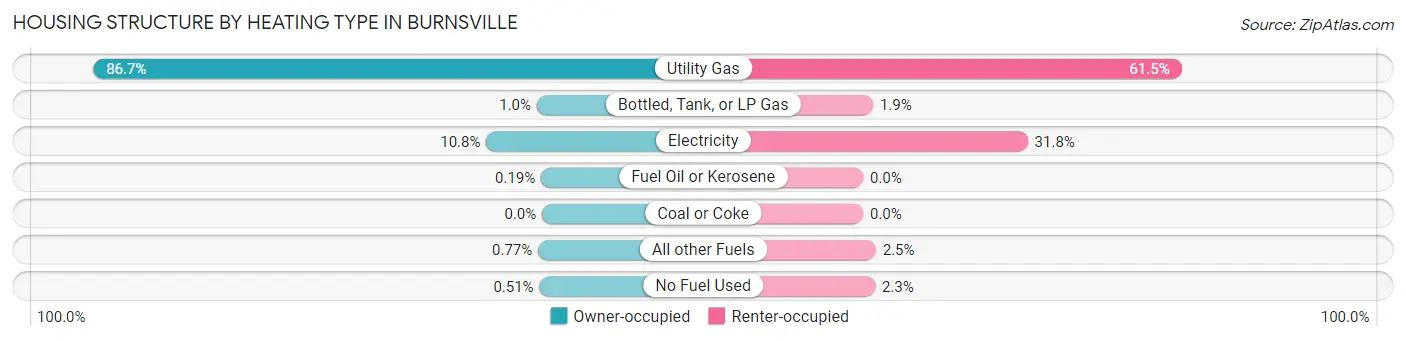
| Heating Type | Owner-occupied | Renter-occupied |
| Utility Gas | 15,009 (86.7%) | 4,956 (61.5%) |
| Bottled, Tank, or LP Gas | 174 (1.0%) | 154 (1.9%) |
| Electricity | 1,866 (10.8%) | 2,562 (31.8%) |
| Fuel Oil or Kerosene | 33 (0.2%) | 0 (0.0%) |
| Coal or Coke | 0 (0.0%) | 0 (0.0%) |
| All other Fuels | 134 (0.8%) | 198 (2.5%) |
| No Fuel Used | 88 (0.5%) | 185 (2.3%) |
| Total | 17,304 (100.0%) | 8,055 (100.0%) |
Household Vehicle Usage in Burnsville
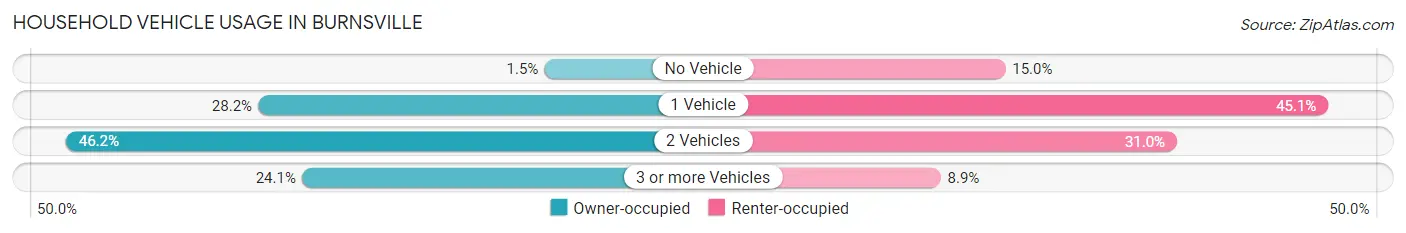
| Vehicles per Household | Owner-occupied | Renter-occupied |
| No Vehicle | 260 (1.5%) | 1,206 (15.0%) |
| 1 Vehicle | 4,883 (28.2%) | 3,634 (45.1%) |
| 2 Vehicles | 7,986 (46.2%) | 2,496 (31.0%) |
| 3 or more Vehicles | 4,175 (24.1%) | 719 (8.9%) |
| Total | 17,304 (100.0%) | 8,055 (100.0%) |
Real Estate & Mortgages in Burnsville
Real Estate and Mortgage Overview in Burnsville
| Characteristic | Without Mortgage | With Mortgage |
| Housing Units | 5,409 | 11,895 |
| Median Property Value | $299,600 | $321,300 |
| Median Household Income | $75,901 | $3,639 |
| Monthly Housing Costs | $661 | $875 |
| Real Estate Taxes | $3,169 | $156 |
Property Value by Mortgage Status in Burnsville
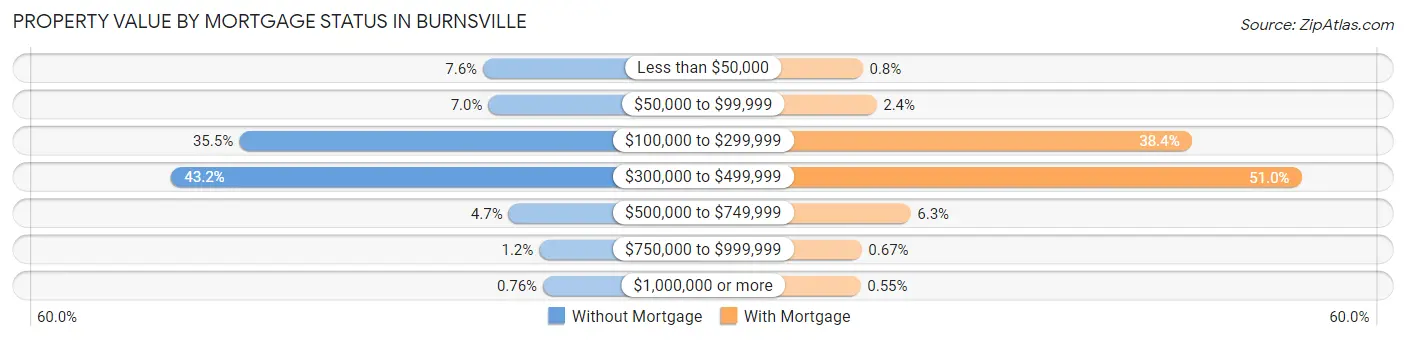
| Property Value | Without Mortgage | With Mortgage |
| Less than $50,000 | 412 (7.6%) | 95 (0.8%) |
| $50,000 to $99,999 | 379 (7.0%) | 282 (2.4%) |
| $100,000 to $299,999 | 1,920 (35.5%) | 4,567 (38.4%) |
| $300,000 to $499,999 | 2,338 (43.2%) | 6,061 (50.9%) |
| $500,000 to $749,999 | 254 (4.7%) | 745 (6.3%) |
| $750,000 to $999,999 | 65 (1.2%) | 80 (0.7%) |
| $1,000,000 or more | 41 (0.8%) | 65 (0.5%) |
| Total | 5,409 (100.0%) | 11,895 (100.0%) |
Household Income by Mortgage Status in Burnsville
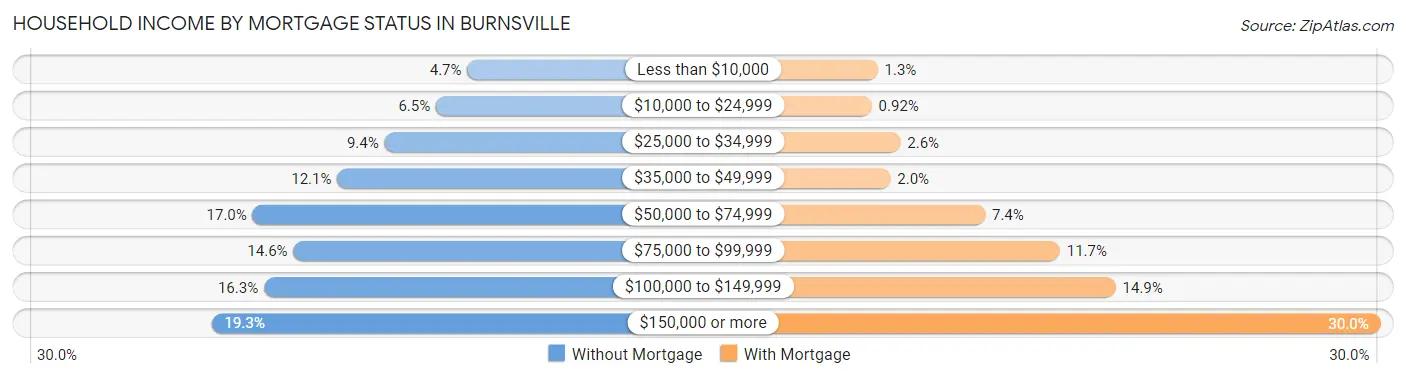
| Household Income | Without Mortgage | With Mortgage |
| Less than $10,000 | 254 (4.7%) | 150 (1.3%) |
| $10,000 to $24,999 | 351 (6.5%) | 110 (0.9%) |
| $25,000 to $34,999 | 510 (9.4%) | 304 (2.6%) |
| $35,000 to $49,999 | 656 (12.1%) | 237 (2.0%) |
| $50,000 to $74,999 | 918 (17.0%) | 880 (7.4%) |
| $75,000 to $99,999 | 792 (14.6%) | 1,388 (11.7%) |
| $100,000 to $149,999 | 883 (16.3%) | 1,768 (14.9%) |
| $150,000 or more | 1,045 (19.3%) | 3,569 (30.0%) |
| Total | 5,409 (100.0%) | 11,895 (100.0%) |
Property Value to Household Income Ratio in Burnsville
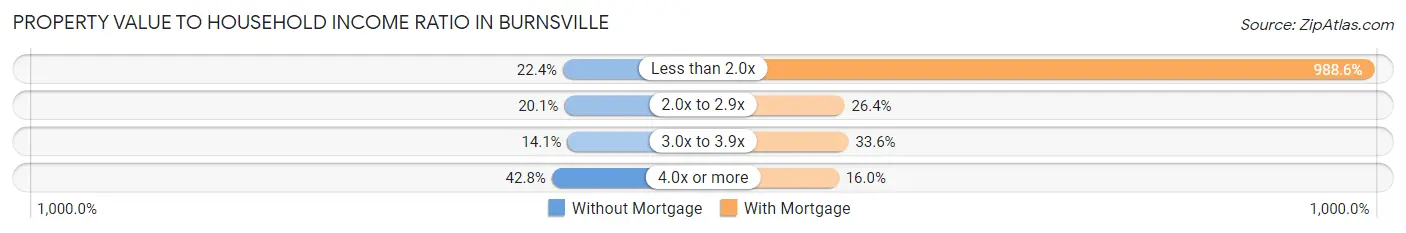
| Value-to-Income Ratio | Without Mortgage | With Mortgage |
| Less than 2.0x | 1,210 (22.4%) | 117,588 (988.6%) |
| 2.0x to 2.9x | 1,085 (20.1%) | 3,143 (26.4%) |
| 3.0x to 3.9x | 763 (14.1%) | 4,001 (33.6%) |
| 4.0x or more | 2,316 (42.8%) | 1,905 (16.0%) |
| Total | 5,409 (100.0%) | 11,895 (100.0%) |
Real Estate Taxes by Mortgage Status in Burnsville
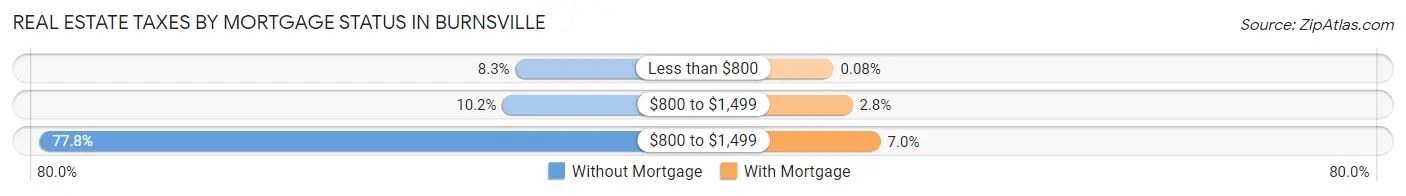
| Property Taxes | Without Mortgage | With Mortgage |
| Less than $800 | 448 (8.3%) | 10 (0.1%) |
| $800 to $1,499 | 551 (10.2%) | 338 (2.8%) |
| $800 to $1,499 | 4,208 (77.8%) | 828 (7.0%) |
| Total | 5,409 (100.0%) | 11,895 (100.0%) |
Health & Disability in Burnsville
Health Insurance Coverage by Age in Burnsville
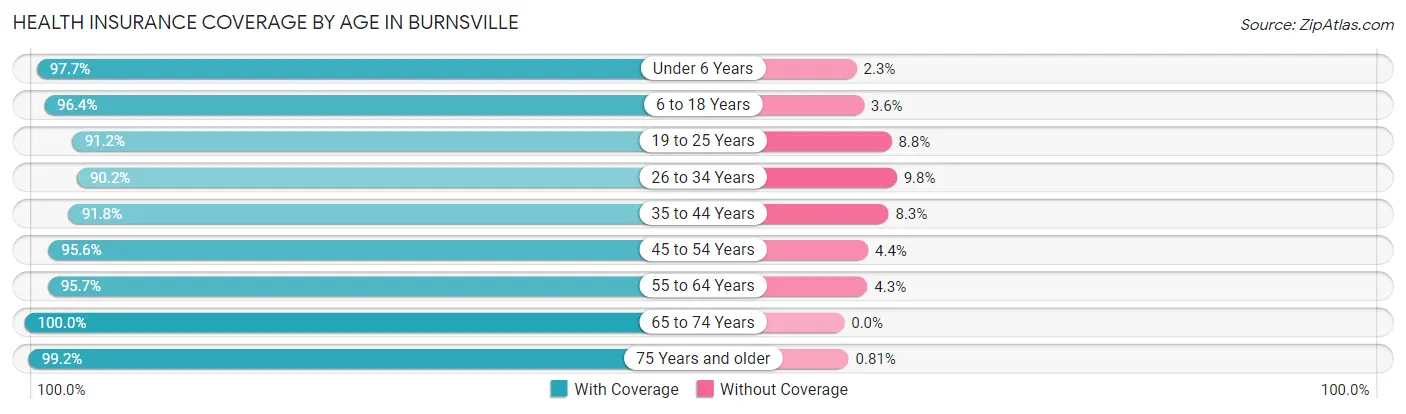
| Age Bracket | With Coverage | Without Coverage |
| Under 6 Years | 4,838 (97.7%) | 114 (2.3%) |
| 6 to 18 Years | 9,432 (96.4%) | 356 (3.6%) |
| 19 to 25 Years | 5,507 (91.2%) | 531 (8.8%) |
| 26 to 34 Years | 7,938 (90.2%) | 860 (9.8%) |
| 35 to 44 Years | 7,406 (91.7%) | 666 (8.3%) |
| 45 to 54 Years | 6,330 (95.6%) | 294 (4.4%) |
| 55 to 64 Years | 8,503 (95.7%) | 383 (4.3%) |
| 65 to 74 Years | 6,126 (100.0%) | 0 (0.0%) |
| 75 Years and older | 4,415 (99.2%) | 36 (0.8%) |
| Total | 60,495 (94.9%) | 3,240 (5.1%) |
Health Insurance Coverage by Citizenship Status in Burnsville
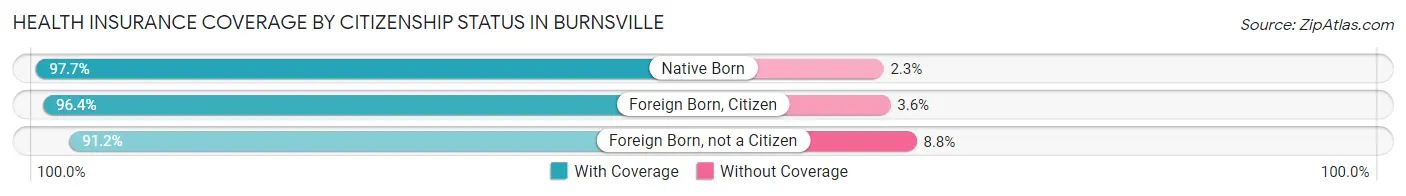
| Citizenship Status | With Coverage | Without Coverage |
| Native Born | 4,838 (97.7%) | 114 (2.3%) |
| Foreign Born, Citizen | 9,432 (96.4%) | 356 (3.6%) |
| Foreign Born, not a Citizen | 5,507 (91.2%) | 531 (8.8%) |
Health Insurance Coverage by Household Income in Burnsville
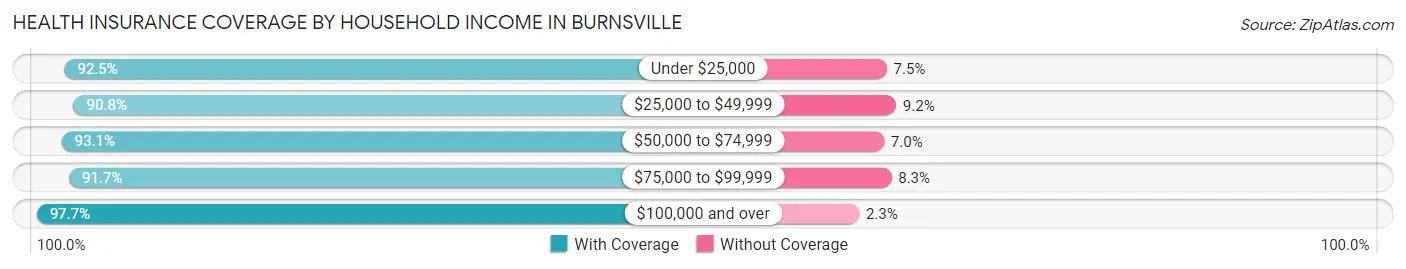
| Household Income | With Coverage | Without Coverage |
| Under $25,000 | 3,475 (92.5%) | 280 (7.5%) |
| $25,000 to $49,999 | 6,989 (90.8%) | 708 (9.2%) |
| $50,000 to $74,999 | 10,156 (93.0%) | 759 (7.0%) |
| $75,000 to $99,999 | 8,260 (91.7%) | 751 (8.3%) |
| $100,000 and over | 31,416 (97.7%) | 732 (2.3%) |
Public vs Private Health Insurance Coverage by Age in Burnsville
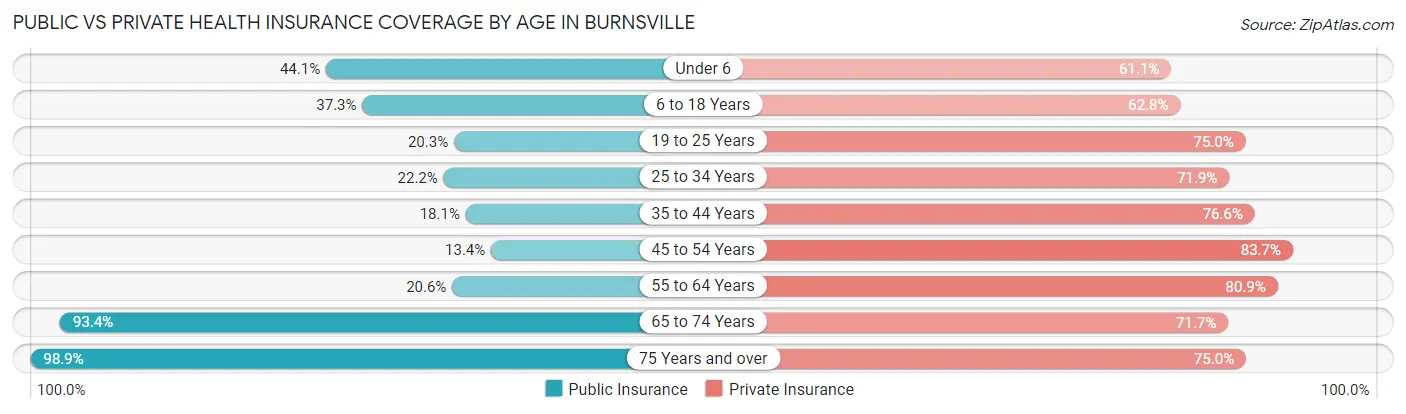
| Age Bracket | Public Insurance | Private Insurance |
| Under 6 | 2,182 (44.1%) | 3,027 (61.1%) |
| 6 to 18 Years | 3,652 (37.3%) | 6,151 (62.8%) |
| 19 to 25 Years | 1,226 (20.3%) | 4,526 (75.0%) |
| 25 to 34 Years | 1,955 (22.2%) | 6,326 (71.9%) |
| 35 to 44 Years | 1,463 (18.1%) | 6,186 (76.6%) |
| 45 to 54 Years | 888 (13.4%) | 5,545 (83.7%) |
| 55 to 64 Years | 1,833 (20.6%) | 7,188 (80.9%) |
| 65 to 74 Years | 5,724 (93.4%) | 4,393 (71.7%) |
| 75 Years and over | 4,403 (98.9%) | 3,339 (75.0%) |
| Total | 23,326 (36.6%) | 46,681 (73.2%) |
Disability Status by Sex by Age in Burnsville
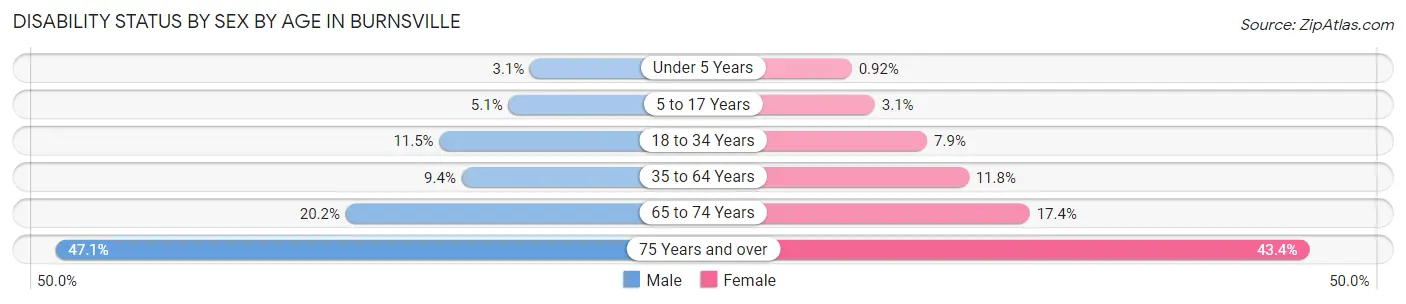
| Age Bracket | Male | Female |
| Under 5 Years | 56 (3.1%) | 21 (0.9%) |
| 5 to 17 Years | 242 (5.1%) | 151 (3.1%) |
| 18 to 34 Years | 909 (11.5%) | 626 (7.9%) |
| 35 to 64 Years | 1,137 (9.4%) | 1,358 (11.8%) |
| 65 to 74 Years | 561 (20.2%) | 584 (17.4%) |
| 75 Years and over | 891 (47.1%) | 1,111 (43.4%) |
Disability Class by Sex by Age in Burnsville
Disability Class: Hearing Difficulty
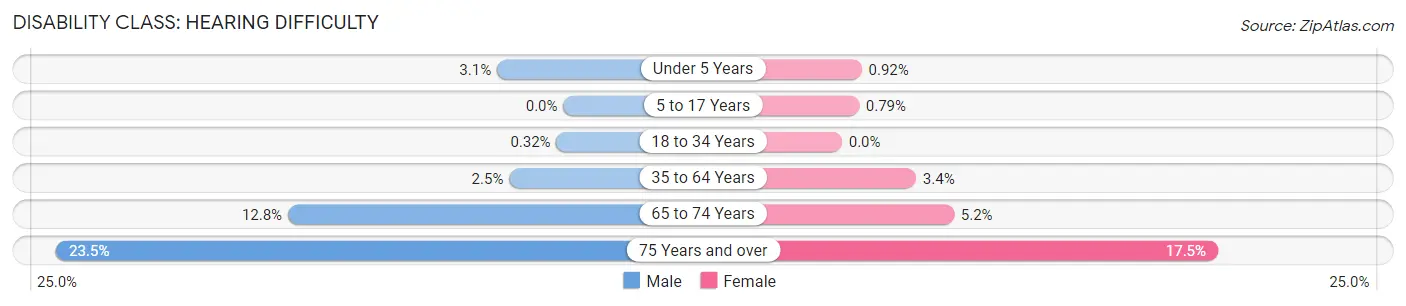
| Age Bracket | Male | Female |
| Under 5 Years | 56 (3.1%) | 21 (0.9%) |
| 5 to 17 Years | 0 (0.0%) | 39 (0.8%) |
| 18 to 34 Years | 25 (0.3%) | 0 (0.0%) |
| 35 to 64 Years | 302 (2.5%) | 396 (3.4%) |
| 65 to 74 Years | 355 (12.8%) | 174 (5.2%) |
| 75 Years and over | 445 (23.5%) | 447 (17.4%) |
Disability Class: Vision Difficulty
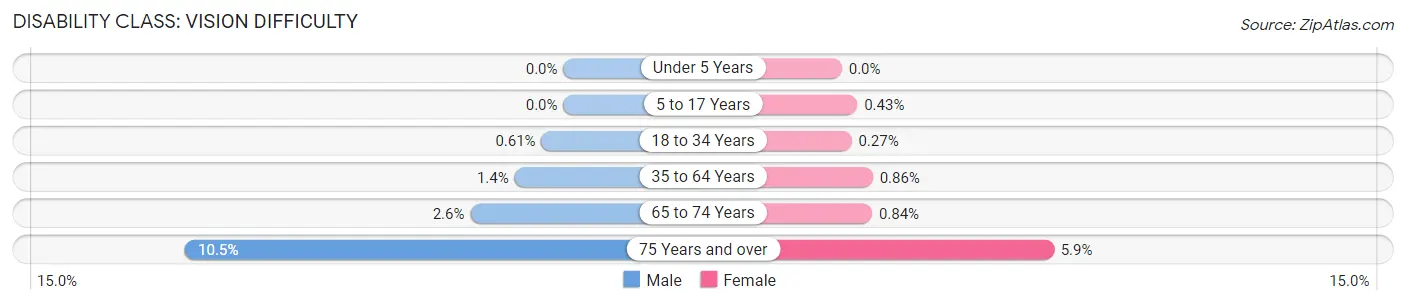
| Age Bracket | Male | Female |
| Under 5 Years | 0 (0.0%) | 0 (0.0%) |
| 5 to 17 Years | 0 (0.0%) | 21 (0.4%) |
| 18 to 34 Years | 48 (0.6%) | 21 (0.3%) |
| 35 to 64 Years | 164 (1.4%) | 99 (0.9%) |
| 65 to 74 Years | 72 (2.6%) | 28 (0.8%) |
| 75 Years and over | 199 (10.5%) | 151 (5.9%) |
Disability Class: Cognitive Difficulty
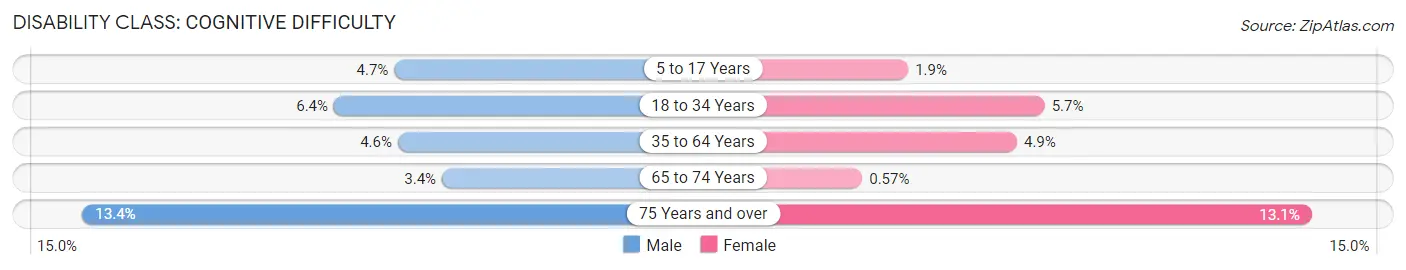
| Age Bracket | Male | Female |
| 5 to 17 Years | 224 (4.7%) | 91 (1.8%) |
| 18 to 34 Years | 505 (6.4%) | 447 (5.7%) |
| 35 to 64 Years | 556 (4.6%) | 562 (4.9%) |
| 65 to 74 Years | 94 (3.4%) | 19 (0.6%) |
| 75 Years and over | 253 (13.4%) | 335 (13.1%) |
Disability Class: Ambulatory Difficulty
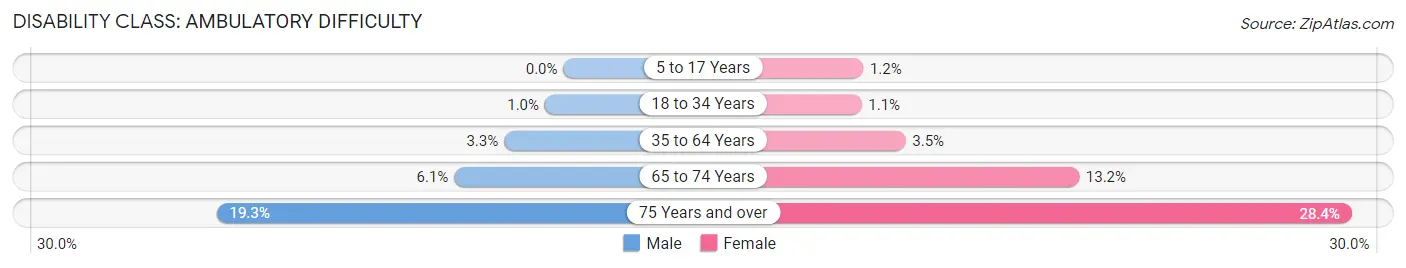
| Age Bracket | Male | Female |
| 5 to 17 Years | 0 (0.0%) | 58 (1.2%) |
| 18 to 34 Years | 81 (1.0%) | 86 (1.1%) |
| 35 to 64 Years | 398 (3.3%) | 408 (3.5%) |
| 65 to 74 Years | 169 (6.1%) | 442 (13.2%) |
| 75 Years and over | 365 (19.3%) | 727 (28.4%) |
Disability Class: Self-Care Difficulty
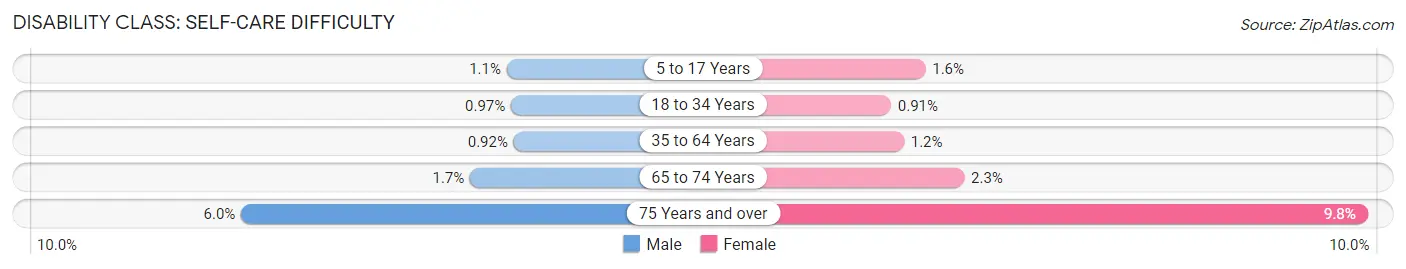
| Age Bracket | Male | Female |
| 5 to 17 Years | 50 (1.1%) | 76 (1.5%) |
| 18 to 34 Years | 77 (1.0%) | 72 (0.9%) |
| 35 to 64 Years | 111 (0.9%) | 132 (1.1%) |
| 65 to 74 Years | 48 (1.7%) | 76 (2.3%) |
| 75 Years and over | 113 (6.0%) | 250 (9.8%) |
Technology Access in Burnsville
Computing Device Access in Burnsville
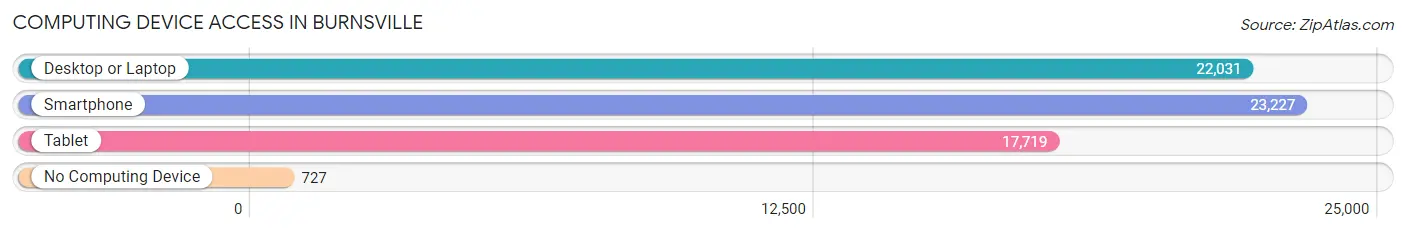
| Device Type | # Households | % Households |
| Desktop or Laptop | 22,031 | 86.9% |
| Smartphone | 23,227 | 91.6% |
| Tablet | 17,719 | 69.9% |
| No Computing Device | 727 | 2.9% |
| Total | 25,359 | 100.0% |
Internet Access in Burnsville
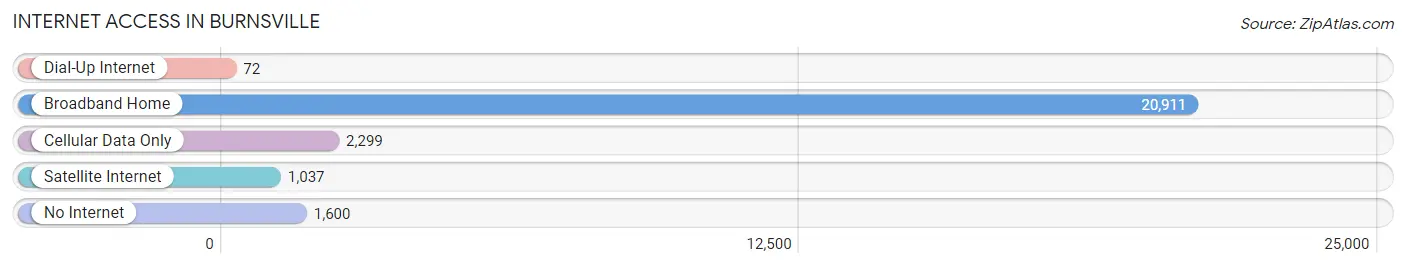
| Internet Type | # Households | % Households |
| Dial-Up Internet | 72 | 0.3% |
| Broadband Home | 20,911 | 82.5% |
| Cellular Data Only | 2,299 | 9.1% |
| Satellite Internet | 1,037 | 4.1% |
| No Internet | 1,600 | 6.3% |
| Total | 25,359 | 100.0% |
Burnsville Summary
Burnsville, Minnesota is a city located in Dakota County, Minnesota, United States. The city is situated on the south bank of the Minnesota River, approximately 15 miles south of downtown Minneapolis. As of the 2010 census, the city had a population of 60,306, making it the twelfth largest city in Minnesota.
History
The area that is now Burnsville was first settled in the early 1800s by a group of settlers from New England. The settlers named the area after their leader, Isaac Burns. The area was primarily used for farming and logging until the late 1800s when the Minneapolis and St. Louis Railway was built through the area. This allowed for the development of the city as a suburb of Minneapolis.
In the early 1900s, the city was incorporated as a village and in 1960, it was incorporated as a city. During the 1960s and 1970s, the city experienced rapid growth as it became a popular bedroom community for Minneapolis. In the 1980s, the city began to focus on economic development and the construction of a new city hall and library.
Geography
Burnsville is located in Dakota County, Minnesota, approximately 15 miles south of downtown Minneapolis. The city is situated on the south bank of the Minnesota River and is bordered by Savage to the north, Apple Valley to the east, Eagan to the south, and Lakeville to the west. The city has a total area of 33.2 square miles, of which 32.9 square miles is land and 0.3 square miles is water.
Economy
Burnsville is home to a variety of businesses and industries. The city is home to several large employers, including the Burnsville Center Mall, Fairview Ridges Hospital, and the Burnsville-Eagan-Savage School District. The city is also home to several smaller businesses, including restaurants, retail stores, and professional services.
The city is also home to several major employers in the technology sector, including Seagate Technology, Imation, and 3M. The city is also home to several major employers in the healthcare sector, including Fairview Ridges Hospital and HealthEast Care System.
Demographics
As of the 2010 census, the city had a population of 60,306. The racial makeup of the city was 79.2% White, 8.3% African American, 0.4% Native American, 6.2% Asian, 0.1% Pacific Islander, 3.2% from other races, and 2.6% from two or more races. Hispanic or Latino of any race were 6.7% of the population.
The median income for a household in the city was $60,945 and the median income for a family was $71,945. The per capita income for the city was $27,945. About 4.3% of families and 6.2% of the population were below the poverty line, including 8.2% of those under age 18 and 4.2% of those age 65 or over.
Common Questions
What is Per Capita Income in Burnsville?
Per Capita income in Burnsville is $42,761.
What is the Median Family Income in Burnsville?
Median Family Income in Burnsville is $108,098.
What is the Median Household income in Burnsville?
Median Household Income in Burnsville is $85,801.
What is Income or Wage Gap in Burnsville?
Income or Wage Gap in Burnsville is 26.0%.
Women in Burnsville earn 74.0 cents for every dollar earned by a man.
What is Family Income Deficit in Burnsville?
Family Income Deficit in Burnsville is $11,588.
Families that are below poverty line in Burnsville earn $11,588 less on average than the poverty threshold level.
What is Inequality or Gini Index in Burnsville?
Inequality or Gini Index in Burnsville is 0.40.
What is the Total Population of Burnsville?
Total Population of Burnsville is 64,075.
What is the Total Male Population of Burnsville?
Total Male Population of Burnsville is 31,342.
What is the Total Female Population of Burnsville?
Total Female Population of Burnsville is 32,733.
What is the Ratio of Males per 100 Females in Burnsville?
There are 95.75 Males per 100 Females in Burnsville.
What is the Ratio of Females per 100 Males in Burnsville?
There are 104.44 Females per 100 Males in Burnsville.
What is the Median Population Age in Burnsville?
Median Population Age in Burnsville is 37.2 Years.
What is the Average Family Size in Burnsville
Average Family Size in Burnsville is 3.1 People.
What is the Average Household Size in Burnsville
Average Household Size in Burnsville is 2.5 People.
How Large is the Labor Force in Burnsville?
There are 36,760 People in the Labor Forcein in Burnsville.
What is the Percentage of People in the Labor Force in Burnsville?
70.9% of People are in the Labor Force in Burnsville.
What is the Unemployment Rate in Burnsville?
Unemployment Rate in Burnsville is 4.5%.