Green Bay, WI Map & Demographics
Green Bay Map
Green Bay Overview
$32,001
PER CAPITA INCOME
$75,189
AVG FAMILY INCOME
$59,174
AVG HOUSEHOLD INCOME
29.3%
WAGE / INCOME GAP [ % ]
70.7¢/ $1
WAGE / INCOME GAP [ $ ]
$9,238
FAMILY INCOME DEFICIT
0.43
INEQUALITY / GINI INDEX
106,846
TOTAL POPULATION
53,251
MALE POPULATION
53,595
FEMALE POPULATION
99.36
MALES / 100 FEMALES
100.65
FEMALES / 100 MALES
35.6
MEDIAN AGE
3.1
AVG FAMILY SIZE
2.4
AVG HOUSEHOLD SIZE
56,834
LABOR FORCE [ PEOPLE ]
67.5%
PERCENT IN LABOR FORCE
4.1%
UNEMPLOYMENT RATE
Income in Green Bay
Income Overview in Green Bay
Per Capita Income in Green Bay is $32,001, while median incomes of families and households are $75,189 and $59,174 respectively.
| Characteristic | Number | Measure |
| Per Capita Income | 106,846 | $32,001 |
| Median Family Income | 24,369 | $75,189 |
| Mean Family Income | 24,369 | $89,780 |
| Median Household Income | 43,892 | $59,174 |
| Mean Household Income | 43,892 | $75,430 |
| Income Deficit | 24,369 | $9,238 |
| Wage / Income Gap (%) | 106,846 | 29.34% |
| Wage / Income Gap ($) | 106,846 | 70.66¢ per $1 |
| Gini / Inequality Index | 106,846 | 0.43 |
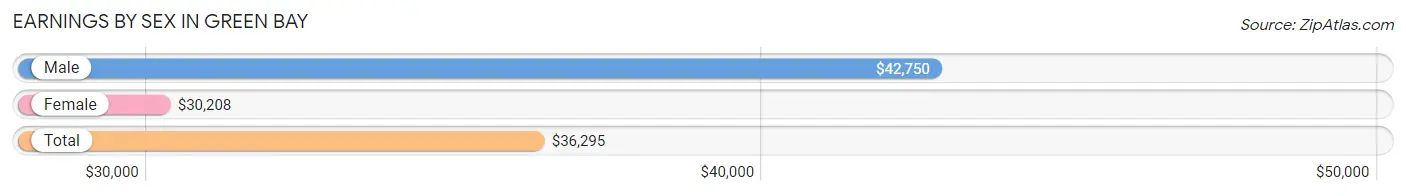
Earnings by Sex in Green Bay
Average Earnings in Green Bay are $36,295, $42,750 for men and $30,208 for women, a difference of 29.3%.
| Sex | Number | Average Earnings |
| Male | 31,133 (52.1%) | $42,750 |
| Female | 28,664 (47.9%) | $30,208 |
| Total | 59,797 (100.0%) | $36,295 |
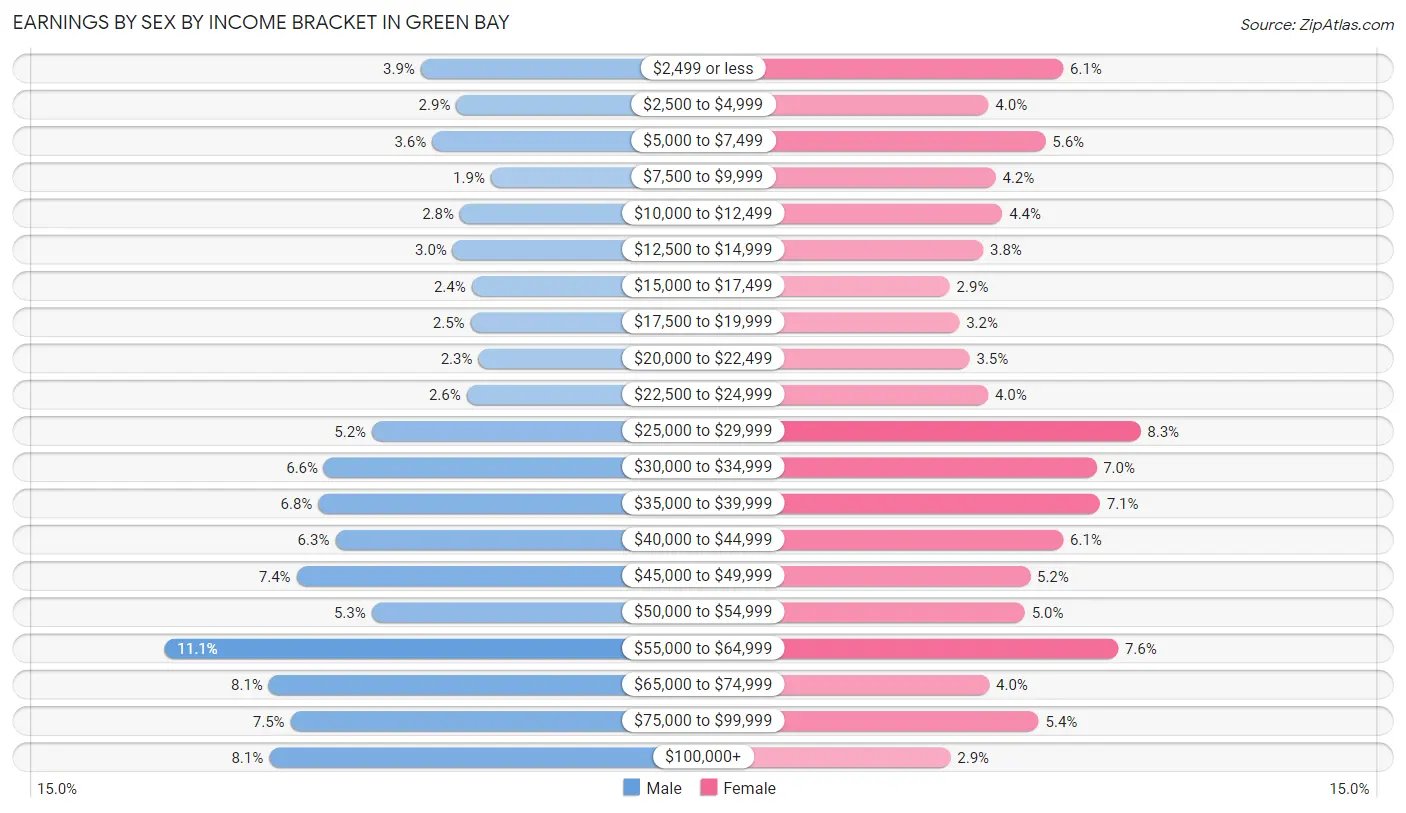
Earnings by Sex by Income Bracket in Green Bay
The most common earnings brackets in Green Bay are $55,000 to $64,999 for men (3,445 | 11.1%) and $25,000 to $29,999 for women (2,364 | 8.3%).
| Income | Male | Female |
| $2,499 or less | 1,205 (3.9%) | 1,742 (6.1%) |
| $2,500 to $4,999 | 894 (2.9%) | 1,140 (4.0%) |
| $5,000 to $7,499 | 1,106 (3.5%) | 1,600 (5.6%) |
| $7,500 to $9,999 | 593 (1.9%) | 1,197 (4.2%) |
| $10,000 to $12,499 | 862 (2.8%) | 1,254 (4.4%) |
| $12,500 to $14,999 | 926 (3.0%) | 1,097 (3.8%) |
| $15,000 to $17,499 | 761 (2.4%) | 828 (2.9%) |
| $17,500 to $19,999 | 770 (2.5%) | 907 (3.2%) |
| $20,000 to $22,499 | 700 (2.2%) | 990 (3.5%) |
| $22,500 to $24,999 | 802 (2.6%) | 1,139 (4.0%) |
| $25,000 to $29,999 | 1,631 (5.2%) | 2,364 (8.3%) |
| $30,000 to $34,999 | 2,052 (6.6%) | 2,008 (7.0%) |
| $35,000 to $39,999 | 2,100 (6.8%) | 2,037 (7.1%) |
| $40,000 to $44,999 | 1,951 (6.3%) | 1,744 (6.1%) |
| $45,000 to $49,999 | 2,292 (7.4%) | 1,477 (5.1%) |
| $50,000 to $54,999 | 1,633 (5.2%) | 1,433 (5.0%) |
| $55,000 to $64,999 | 3,445 (11.1%) | 2,183 (7.6%) |
| $65,000 to $74,999 | 2,535 (8.1%) | 1,146 (4.0%) |
| $75,000 to $99,999 | 2,345 (7.5%) | 1,545 (5.4%) |
| $100,000+ | 2,530 (8.1%) | 833 (2.9%) |
| Total | 31,133 (100.0%) | 28,664 (100.0%) |
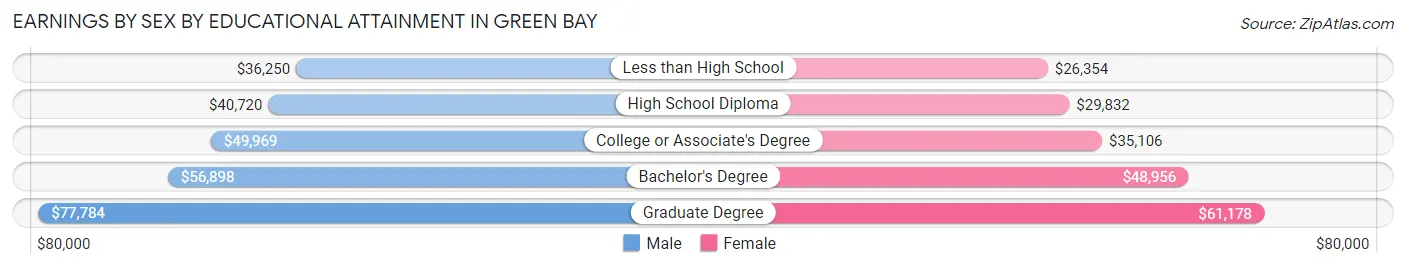
Earnings by Sex by Educational Attainment in Green Bay
Average earnings in Green Bay are $48,116 for men and $35,769 for women, a difference of 25.7%. Men with an educational attainment of graduate degree enjoy the highest average annual earnings of $77,784, while those with less than high school education earn the least with $36,250. Women with an educational attainment of graduate degree earn the most with the average annual earnings of $61,178, while those with less than high school education have the smallest earnings of $26,354.
| Educational Attainment | Male Income | Female Income |
| Less than High School | $36,250 | $26,354 |
| High School Diploma | $40,720 | $29,832 |
| College or Associate's Degree | $49,969 | $35,106 |
| Bachelor's Degree | $56,898 | $48,956 |
| Graduate Degree | $77,784 | $61,178 |
| Total | $48,116 | $35,769 |
Family Income in Green Bay
Family Income Brackets in Green Bay
According to the Green Bay family income data, there are 5,288 families falling into the $100,000 to $149,999 income range, which is the most common income bracket and makes up 21.7% of all families. Conversely, the less than $10,000 income bracket is the least frequent group with only 707 families (2.9%) belonging to this category.
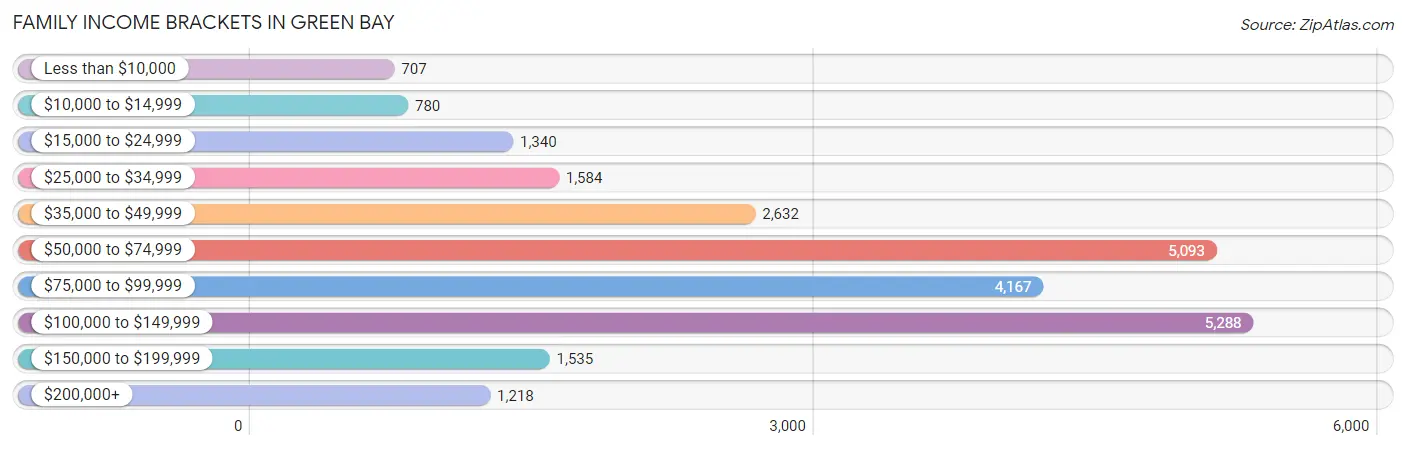
| Income Bracket | # Families | % Families |
| Less than $10,000 | 707 | 2.9% |
| $10,000 to $14,999 | 780 | 3.2% |
| $15,000 to $24,999 | 1,340 | 5.5% |
| $25,000 to $34,999 | 1,584 | 6.5% |
| $35,000 to $49,999 | 2,632 | 10.8% |
| $50,000 to $74,999 | 5,093 | 20.9% |
| $75,000 to $99,999 | 4,167 | 17.1% |
| $100,000 to $149,999 | 5,288 | 21.7% |
| $150,000 to $199,999 | 1,535 | 6.3% |
| $200,000+ | 1,218 | 5.0% |
Family Income by Famaliy Size in Green Bay
4-person families (4,027 | 16.5%) account for the highest median family income in Green Bay with $90,080 per family, while 2-person families (11,480 | 47.1%) have the highest median income of $35,533 per family member.
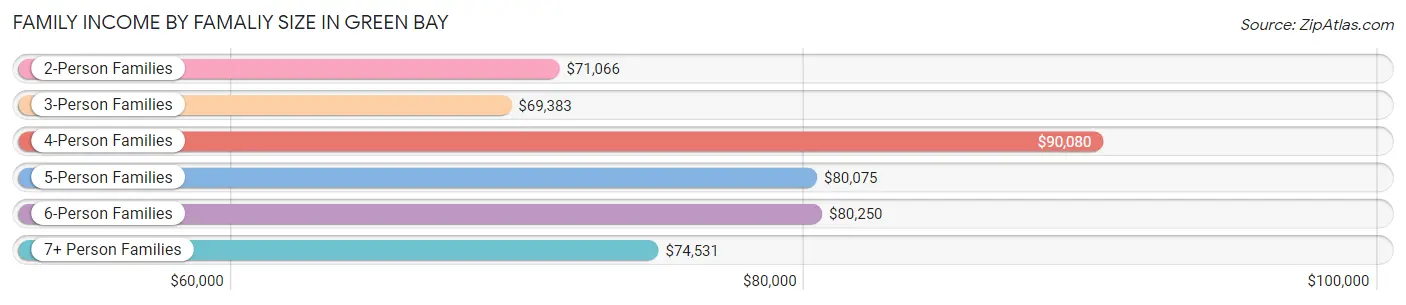
| Income Bracket | # Families | Median Income |
| 2-Person Families | 11,480 (47.1%) | $71,066 |
| 3-Person Families | 5,758 (23.6%) | $69,383 |
| 4-Person Families | 4,027 (16.5%) | $90,080 |
| 5-Person Families | 1,878 (7.7%) | $80,075 |
| 6-Person Families | 711 (2.9%) | $80,250 |
| 7+ Person Families | 515 (2.1%) | $74,531 |
| Total | 24,369 (100.0%) | $75,189 |
Family Income by Number of Earners in Green Bay
The median family income in Green Bay is $75,189, with families comprising 3+ earners (2,916) having the highest median family income of $114,950, while families with no earners (3,297) have the lowest median family income of $49,050, accounting for 12.0% and 13.5% of families, respectively.
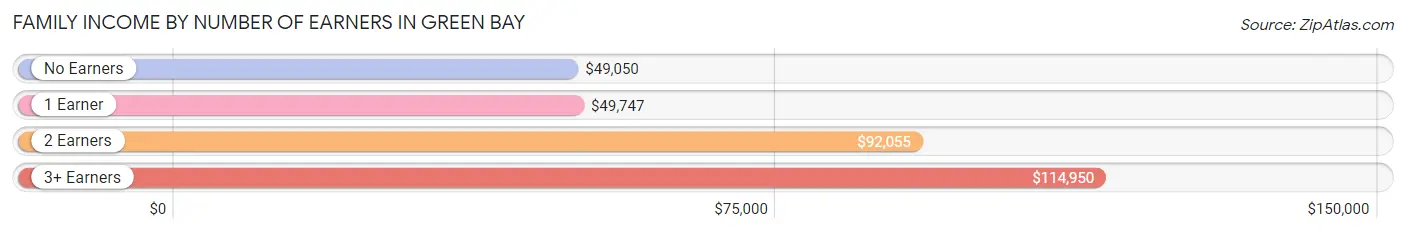
| Number of Earners | # Families | Median Income |
| No Earners | 3,297 (13.5%) | $49,050 |
| 1 Earner | 7,390 (30.3%) | $49,747 |
| 2 Earners | 10,766 (44.2%) | $92,055 |
| 3+ Earners | 2,916 (12.0%) | $114,950 |
| Total | 24,369 (100.0%) | $75,189 |
Household Income in Green Bay
Household Income Brackets in Green Bay
With 9,437 households falling in the category, the $50,000 to $74,999 income range is the most frequent in Green Bay, accounting for 21.5% of all households. In contrast, only 1,536 households (3.5%) fall into the $200,000+ income bracket, making it the least populous group.
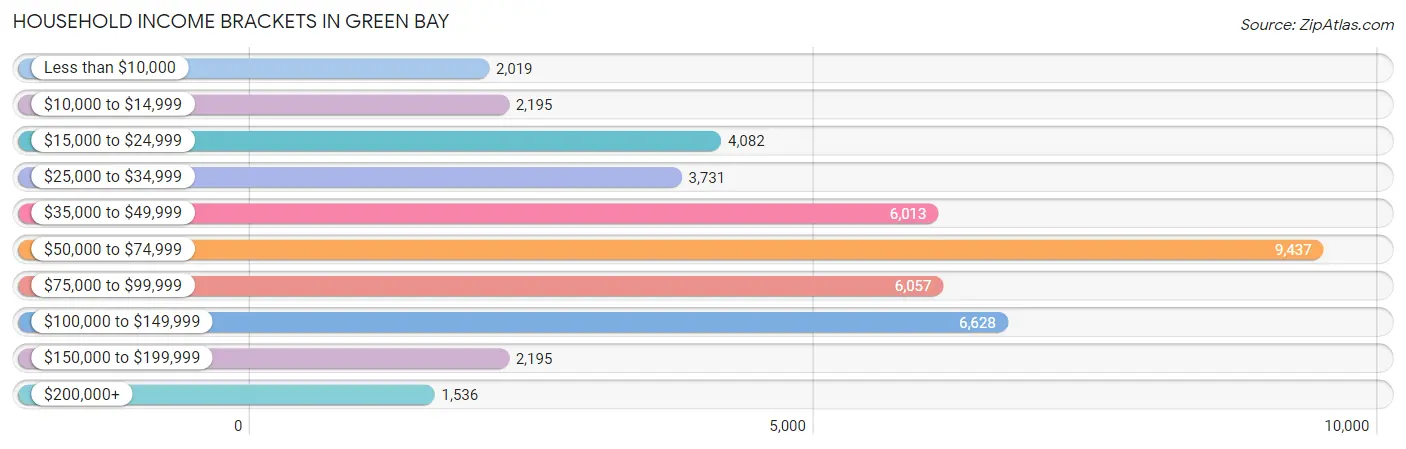
| Income Bracket | # Households | % Households |
| Less than $10,000 | 2,019 | 4.6% |
| $10,000 to $14,999 | 2,195 | 5.0% |
| $15,000 to $24,999 | 4,082 | 9.3% |
| $25,000 to $34,999 | 3,731 | 8.5% |
| $35,000 to $49,999 | 6,013 | 13.7% |
| $50,000 to $74,999 | 9,437 | 21.5% |
| $75,000 to $99,999 | 6,057 | 13.8% |
| $100,000 to $149,999 | 6,628 | 15.1% |
| $150,000 to $199,999 | 2,195 | 5.0% |
| $200,000+ | 1,536 | 3.5% |
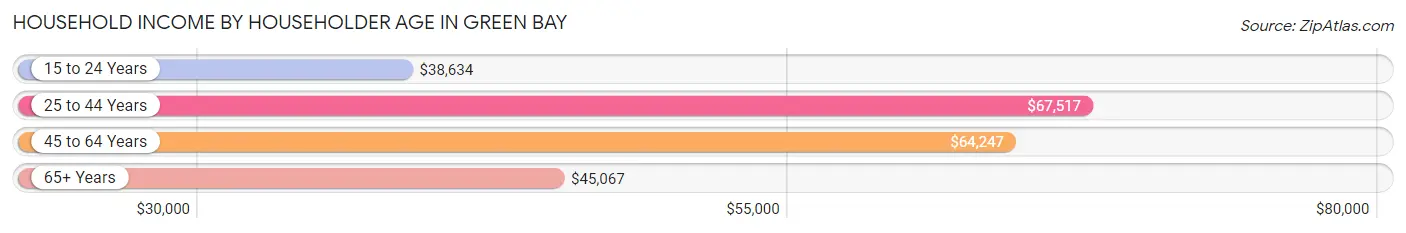
Household Income by Householder Age in Green Bay
The median household income in Green Bay is $59,174, with the highest median household income of $67,517 found in the 25 to 44 years age bracket for the primary householder. A total of 15,779 households (35.9%) fall into this category. Meanwhile, the 15 to 24 years age bracket for the primary householder has the lowest median household income of $38,634, with 2,279 households (5.2%) in this group.
| Income Bracket | # Households | Median Income |
| 15 to 24 Years | 2,279 (5.2%) | $38,634 |
| 25 to 44 Years | 15,779 (35.9%) | $67,517 |
| 45 to 64 Years | 15,950 (36.3%) | $64,247 |
| 65+ Years | 9,884 (22.5%) | $45,067 |
| Total | 43,892 (100.0%) | $59,174 |
Poverty in Green Bay
Income Below Poverty by Sex and Age in Green Bay
With 14.1% poverty level for males and 18.0% for females among the residents of Green Bay, 6 to 11 year old males and 16 and 17 year old females are the most vulnerable to poverty, with 1,240 males (25.8%) and 379 females (27.4%) in their respective age groups living below the poverty level.
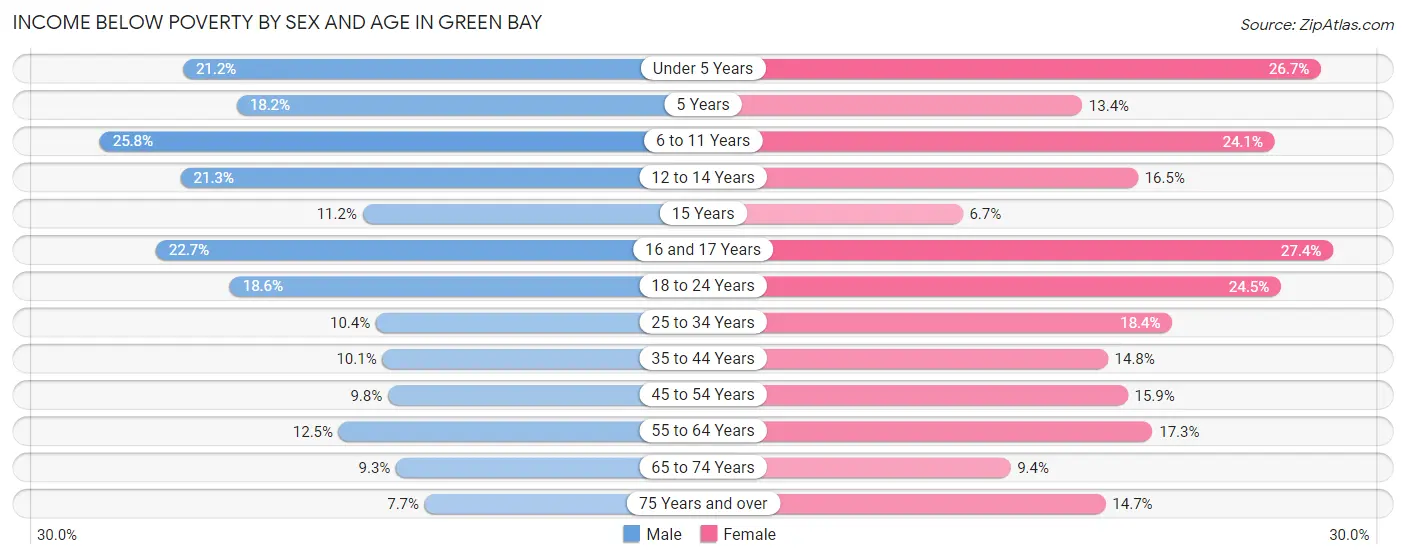
| Age Bracket | Male | Female |
| Under 5 Years | 804 (21.2%) | 930 (26.7%) |
| 5 Years | 96 (18.2%) | 98 (13.4%) |
| 6 to 11 Years | 1,240 (25.8%) | 985 (24.1%) |
| 12 to 14 Years | 354 (21.3%) | 325 (16.5%) |
| 15 Years | 86 (11.2%) | 24 (6.7%) |
| 16 and 17 Years | 351 (22.7%) | 379 (27.4%) |
| 18 to 24 Years | 915 (18.6%) | 1,127 (24.5%) |
| 25 to 34 Years | 821 (10.4%) | 1,379 (18.4%) |
| 35 to 44 Years | 711 (10.1%) | 978 (14.8%) |
| 45 to 54 Years | 637 (9.8%) | 1,005 (15.9%) |
| 55 to 64 Years | 801 (12.5%) | 1,107 (17.3%) |
| 65 to 74 Years | 345 (9.3%) | 453 (9.4%) |
| 75 Years and over | 171 (7.7%) | 544 (14.7%) |
| Total | 7,332 (14.1%) | 9,334 (18.0%) |
Income Above Poverty by Sex and Age in Green Bay
According to the poverty statistics in Green Bay, males aged 75 years and over and females aged 15 years are the age groups that are most secure financially, with 92.3% of males and 93.3% of females in these age groups living above the poverty line.
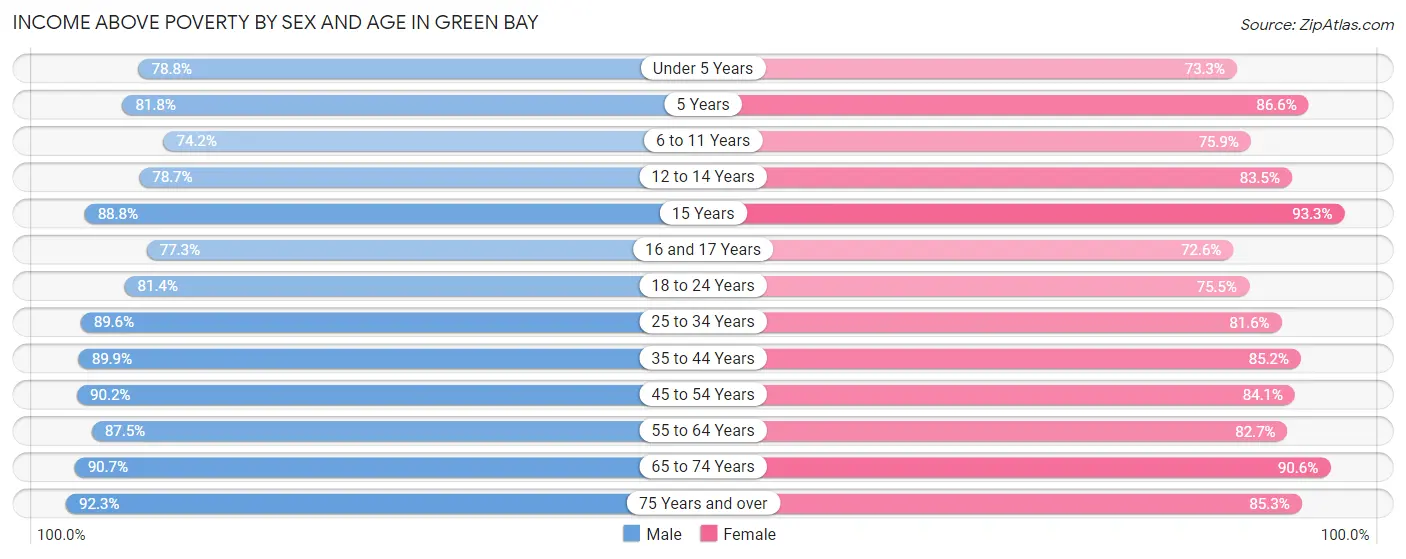
| Age Bracket | Male | Female |
| Under 5 Years | 2,992 (78.8%) | 2,555 (73.3%) |
| 5 Years | 432 (81.8%) | 635 (86.6%) |
| 6 to 11 Years | 3,565 (74.2%) | 3,101 (75.9%) |
| 12 to 14 Years | 1,307 (78.7%) | 1,647 (83.5%) |
| 15 Years | 684 (88.8%) | 333 (93.3%) |
| 16 and 17 Years | 1,196 (77.3%) | 1,006 (72.6%) |
| 18 to 24 Years | 4,013 (81.4%) | 3,481 (75.5%) |
| 25 to 34 Years | 7,047 (89.6%) | 6,115 (81.6%) |
| 35 to 44 Years | 6,353 (89.9%) | 5,628 (85.2%) |
| 45 to 54 Years | 5,887 (90.2%) | 5,311 (84.1%) |
| 55 to 64 Years | 5,605 (87.5%) | 5,296 (82.7%) |
| 65 to 74 Years | 3,361 (90.7%) | 4,376 (90.6%) |
| 75 Years and over | 2,047 (92.3%) | 3,161 (85.3%) |
| Total | 44,489 (85.9%) | 42,645 (82.0%) |
Income Below Poverty Among Married-Couple Families in Green Bay
The poverty statistics for married-couple families in Green Bay show that 4.8% or 808 of the total 16,890 families live below the poverty line. Families with 5 or more children have the highest poverty rate of 23.4%, comprising of 52 families. On the other hand, families with no children have the lowest poverty rate of 2.5%, which includes 250 families.
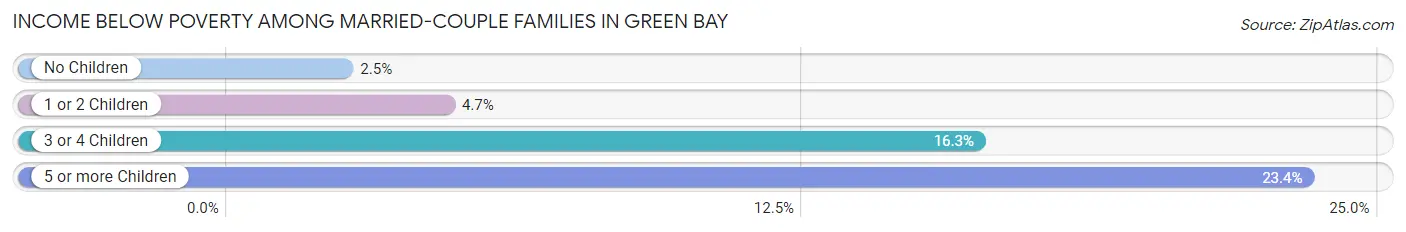
| Children | Above Poverty | Below Poverty |
| No Children | 9,716 (97.5%) | 250 (2.5%) |
| 1 or 2 Children | 4,822 (95.3%) | 239 (4.7%) |
| 3 or 4 Children | 1,374 (83.7%) | 267 (16.3%) |
| 5 or more Children | 170 (76.6%) | 52 (23.4%) |
| Total | 16,082 (95.2%) | 808 (4.8%) |
Income Below Poverty Among Single-Parent Households in Green Bay
According to the poverty data in Green Bay, 13.9% or 335 single-father households and 35.5% or 1,802 single-mother households are living below the poverty line. Among single-father households, those with 3 or 4 children have the highest poverty rate, with 62 households (26.7%) experiencing poverty. Likewise, among single-mother households, those with 5 or more children have the highest poverty rate, with 9 households (100.0%) falling below the poverty line.
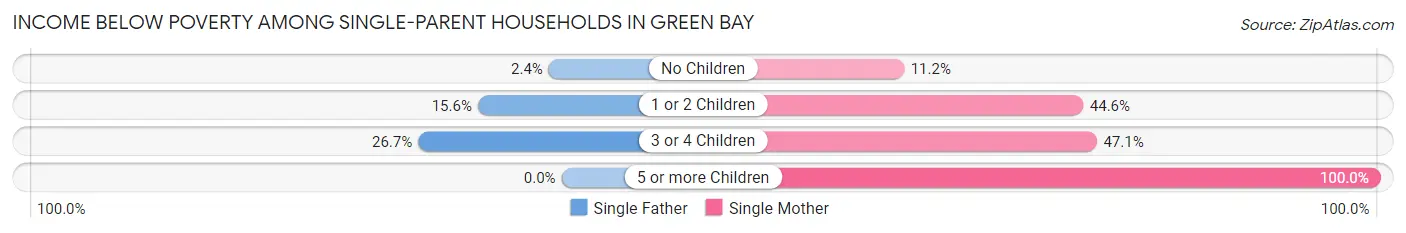
| Children | Single Father | Single Mother |
| No Children | 12 (2.4%) | 161 (11.2%) |
| 1 or 2 Children | 261 (15.6%) | 1,300 (44.6%) |
| 3 or 4 Children | 62 (26.7%) | 332 (47.1%) |
| 5 or more Children | 0 (0.0%) | 9 (100.0%) |
| Total | 335 (13.9%) | 1,802 (35.5%) |
Income Below Poverty Among Married-Couple vs Single-Parent Households in Green Bay
The poverty data for Green Bay shows that 808 of the married-couple family households (4.8%) and 2,137 of the single-parent households (28.6%) are living below the poverty level. Within the married-couple family households, those with 5 or more children have the highest poverty rate, with 52 households (23.4%) falling below the poverty line. Among the single-parent households, those with 5 or more children have the highest poverty rate, with 9 household (100.0%) living below poverty.
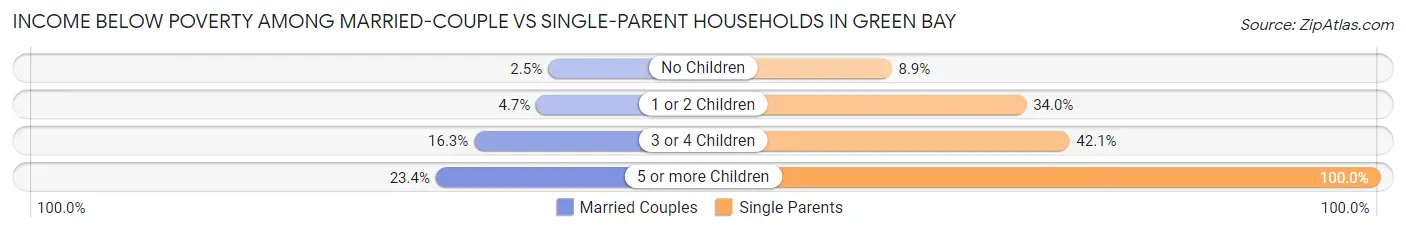
| Children | Married-Couple Families | Single-Parent Households |
| No Children | 250 (2.5%) | 173 (8.9%) |
| 1 or 2 Children | 239 (4.7%) | 1,561 (34.0%) |
| 3 or 4 Children | 267 (16.3%) | 394 (42.0%) |
| 5 or more Children | 52 (23.4%) | 9 (100.0%) |
| Total | 808 (4.8%) | 2,137 (28.6%) |
Race in Green Bay
The most populous races in Green Bay are White / Caucasian (77,299 | 72.4%), Hispanic or Latino (18,270 | 17.1%), and Two or more Races (11,214 | 10.5%).
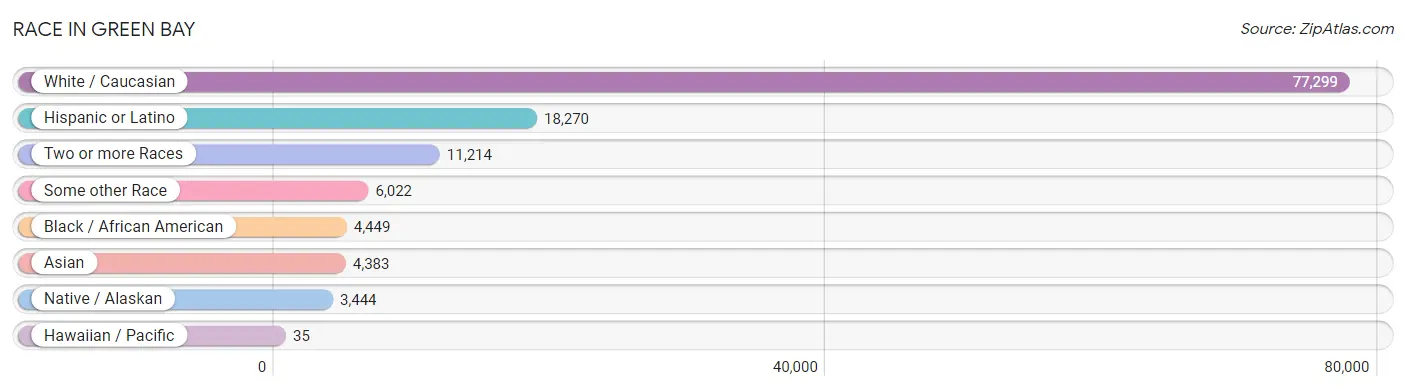
| Race | # Population | % Population |
| Asian | 4,383 | 4.1% |
| Black / African American | 4,449 | 4.2% |
| Hawaiian / Pacific | 35 | 0.0% |
| Hispanic or Latino | 18,270 | 17.1% |
| Native / Alaskan | 3,444 | 3.2% |
| White / Caucasian | 77,299 | 72.4% |
| Two or more Races | 11,214 | 10.5% |
| Some other Race | 6,022 | 5.6% |
| Total | 106,846 | 100.0% |
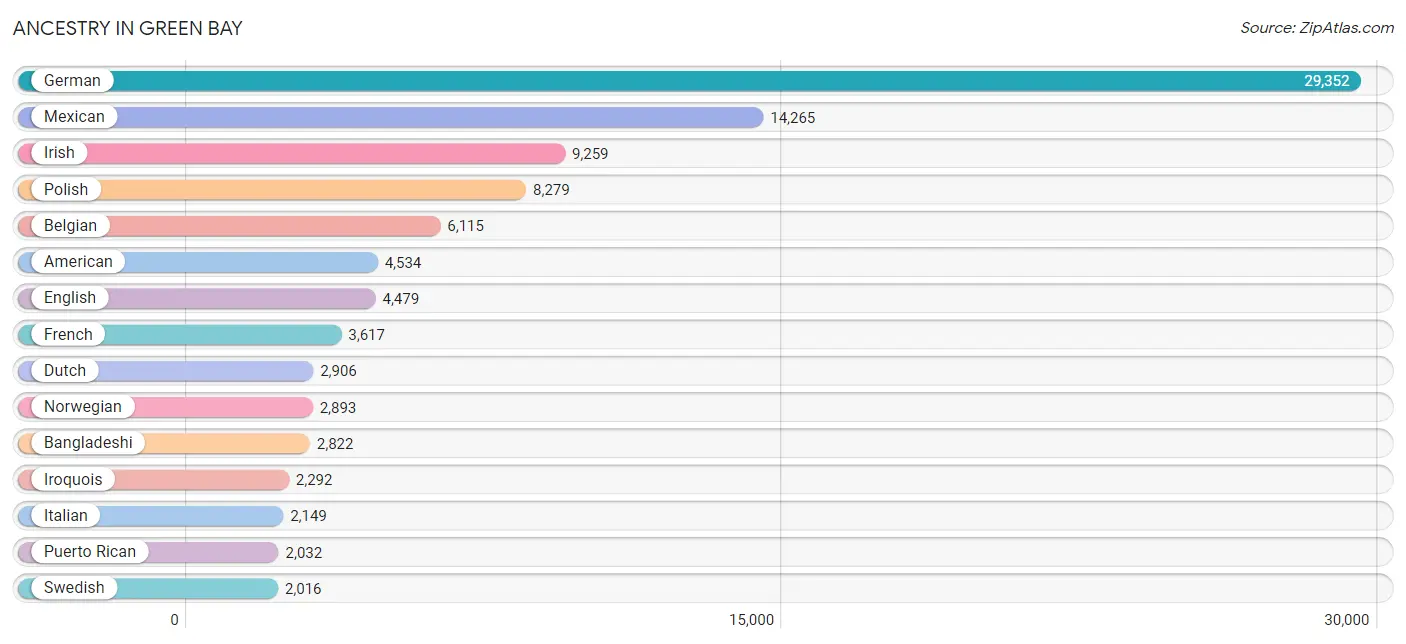
Ancestry in Green Bay
The most populous ancestries reported in Green Bay are German (29,352 | 27.5%), Mexican (14,265 | 13.4%), Irish (9,259 | 8.7%), Polish (8,279 | 7.7%), and Belgian (6,115 | 5.7%), together accounting for 63.0% of all Green Bay residents.
| Ancestry | # Population | % Population |
| Afghan | 52 | 0.1% |
| African | 281 | 0.3% |
| Alaskan Athabascan | 4 | 0.0% |
| American | 4,534 | 4.2% |
| Apache | 35 | 0.0% |
| Arab | 242 | 0.2% |
| Armenian | 19 | 0.0% |
| Austrian | 267 | 0.3% |
| Bangladeshi | 2,822 | 2.6% |
| Belgian | 6,115 | 5.7% |
| Bhutanese | 606 | 0.6% |
| Blackfeet | 49 | 0.1% |
| Brazilian | 151 | 0.1% |
| British | 153 | 0.1% |
| Bulgarian | 230 | 0.2% |
| Burmese | 445 | 0.4% |
| Canadian | 145 | 0.1% |
| Celtic | 17 | 0.0% |
| Central American | 871 | 0.8% |
| Central American Indian | 112 | 0.1% |
| Cherokee | 275 | 0.3% |
| Chilean | 22 | 0.0% |
| Chippewa | 519 | 0.5% |
| Choctaw | 13 | 0.0% |
| Colombian | 71 | 0.1% |
| Costa Rican | 11 | 0.0% |
| Cree | 5 | 0.0% |
| Croatian | 152 | 0.1% |
| Crow | 5 | 0.0% |
| Cuban | 59 | 0.1% |
| Czech | 1,454 | 1.4% |
| Czechoslovakian | 162 | 0.2% |
| Danish | 704 | 0.7% |
| Dominican | 152 | 0.1% |
| Dutch | 2,906 | 2.7% |
| Eastern European | 162 | 0.2% |
| Egyptian | 15 | 0.0% |
| English | 4,479 | 4.2% |
| Ethiopian | 14 | 0.0% |
| European | 1,778 | 1.7% |
| Finnish | 906 | 0.9% |
| French | 3,617 | 3.4% |
| French Canadian | 1,762 | 1.7% |
| German | 29,352 | 27.5% |
| German Russian | 1 | 0.0% |
| Greek | 275 | 0.3% |
| Guatemalan | 158 | 0.2% |
| Haitian | 26 | 0.0% |
| Honduran | 550 | 0.5% |
| Hungarian | 392 | 0.4% |
| Icelander | 15 | 0.0% |
| Indian (Asian) | 213 | 0.2% |
| Indonesian | 26 | 0.0% |
| Irish | 9,259 | 8.7% |
| Iroquois | 2,292 | 2.1% |
| Israeli | 20 | 0.0% |
| Italian | 2,149 | 2.0% |
| Jamaican | 123 | 0.1% |
| Kenyan | 32 | 0.0% |
| Korean | 323 | 0.3% |
| Laotian | 9 | 0.0% |
| Latvian | 31 | 0.0% |
| Lebanese | 187 | 0.2% |
| Lithuanian | 43 | 0.0% |
| Lumbee | 9 | 0.0% |
| Luxembourger | 50 | 0.1% |
| Malaysian | 217 | 0.2% |
| Maltese | 10 | 0.0% |
| Menominee | 1,050 | 1.0% |
| Mexican | 14,265 | 13.4% |
| Mexican American Indian | 138 | 0.1% |
| Mongolian | 30 | 0.0% |
| Native Hawaiian | 48 | 0.0% |
| Navajo | 18 | 0.0% |
| Nicaraguan | 96 | 0.1% |
| Northern European | 126 | 0.1% |
| Norwegian | 2,893 | 2.7% |
| Ottawa | 77 | 0.1% |
| Pakistani | 9 | 0.0% |
| Peruvian | 87 | 0.1% |
| Polish | 8,279 | 7.7% |
| Portuguese | 52 | 0.1% |
| Potawatomi | 202 | 0.2% |
| Puerto Rican | 2,032 | 1.9% |
| Romanian | 3 | 0.0% |
| Russian | 352 | 0.3% |
| Salvadoran | 56 | 0.1% |
| Samoan | 12 | 0.0% |
| Scandinavian | 327 | 0.3% |
| Scotch-Irish | 262 | 0.3% |
| Scottish | 1,021 | 1.0% |
| Serbian | 39 | 0.0% |
| Sioux | 34 | 0.0% |
| Slavic | 65 | 0.1% |
| Slovak | 113 | 0.1% |
| Slovene | 32 | 0.0% |
| Somali | 683 | 0.6% |
| South American | 241 | 0.2% |
| Spaniard | 337 | 0.3% |
| Spanish | 81 | 0.1% |
| Sri Lankan | 193 | 0.2% |
| Subsaharan African | 1,028 | 1.0% |
| Swedish | 2,016 | 1.9% |
| Swiss | 300 | 0.3% |
| Syrian | 28 | 0.0% |
| Thai | 395 | 0.4% |
| Tohono O'Odham | 20 | 0.0% |
| Turkish | 10 | 0.0% |
| Ukrainian | 67 | 0.1% |
| Venezuelan | 61 | 0.1% |
| Welsh | 301 | 0.3% |
| West Indian | 36 | 0.0% |
| Yugoslavian | 20 | 0.0% | View All 113 Rows |
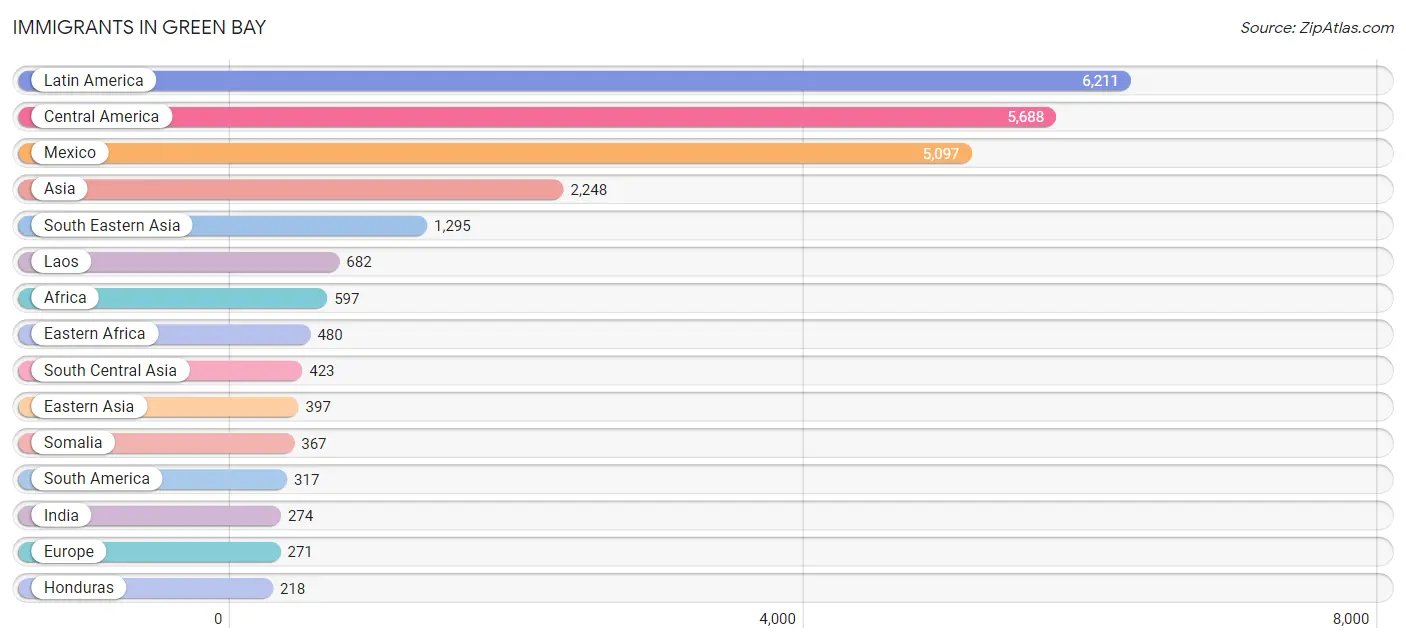
Immigrants in Green Bay
The most numerous immigrant groups reported in Green Bay came from Latin America (6,211 | 5.8%), Central America (5,688 | 5.3%), Mexico (5,097 | 4.8%), Asia (2,248 | 2.1%), and South Eastern Asia (1,295 | 1.2%), together accounting for 19.2% of all Green Bay residents.
| Immigration Origin | # Population | % Population |
| Afghanistan | 107 | 0.1% |
| Africa | 597 | 0.6% |
| Asia | 2,248 | 2.1% |
| Belarus | 17 | 0.0% |
| Belgium | 9 | 0.0% |
| Brazil | 71 | 0.1% |
| Canada | 163 | 0.2% |
| Caribbean | 206 | 0.2% |
| Central America | 5,688 | 5.3% |
| Chile | 19 | 0.0% |
| China | 137 | 0.1% |
| Colombia | 37 | 0.0% |
| Congo | 54 | 0.1% |
| Costa Rica | 11 | 0.0% |
| Cuba | 47 | 0.0% |
| Dominican Republic | 99 | 0.1% |
| Eastern Africa | 480 | 0.4% |
| Eastern Asia | 397 | 0.4% |
| Eastern Europe | 88 | 0.1% |
| El Salvador | 120 | 0.1% |
| England | 42 | 0.0% |
| Eritrea | 21 | 0.0% |
| Ethiopia | 29 | 0.0% |
| Europe | 271 | 0.3% |
| Germany | 75 | 0.1% |
| Ghana | 7 | 0.0% |
| Guatemala | 146 | 0.1% |
| Honduras | 218 | 0.2% |
| India | 274 | 0.3% |
| Indonesia | 9 | 0.0% |
| Ireland | 6 | 0.0% |
| Jamaica | 60 | 0.1% |
| Japan | 86 | 0.1% |
| Kenya | 42 | 0.0% |
| Korea | 174 | 0.2% |
| Laos | 682 | 0.6% |
| Latin America | 6,211 | 5.8% |
| Mexico | 5,097 | 4.8% |
| Middle Africa | 54 | 0.1% |
| Netherlands | 18 | 0.0% |
| Nicaragua | 96 | 0.1% |
| Northern Africa | 30 | 0.0% |
| Northern Europe | 81 | 0.1% |
| Oceania | 30 | 0.0% |
| Pakistan | 42 | 0.0% |
| Peru | 87 | 0.1% |
| Philippines | 186 | 0.2% |
| Poland | 19 | 0.0% |
| Russia | 6 | 0.0% |
| Saudi Arabia | 124 | 0.1% |
| Serbia | 20 | 0.0% |
| Somalia | 367 | 0.3% |
| South Africa | 9 | 0.0% |
| South America | 317 | 0.3% |
| South Central Asia | 423 | 0.4% |
| South Eastern Asia | 1,295 | 1.2% |
| Thailand | 205 | 0.2% |
| Ukraine | 26 | 0.0% |
| Venezuela | 103 | 0.1% |
| Vietnam | 213 | 0.2% |
| Western Africa | 7 | 0.0% |
| Western Asia | 133 | 0.1% |
| Western Europe | 102 | 0.1% | View All 63 Rows |
Sex and Age in Green Bay
Sex and Age in Green Bay
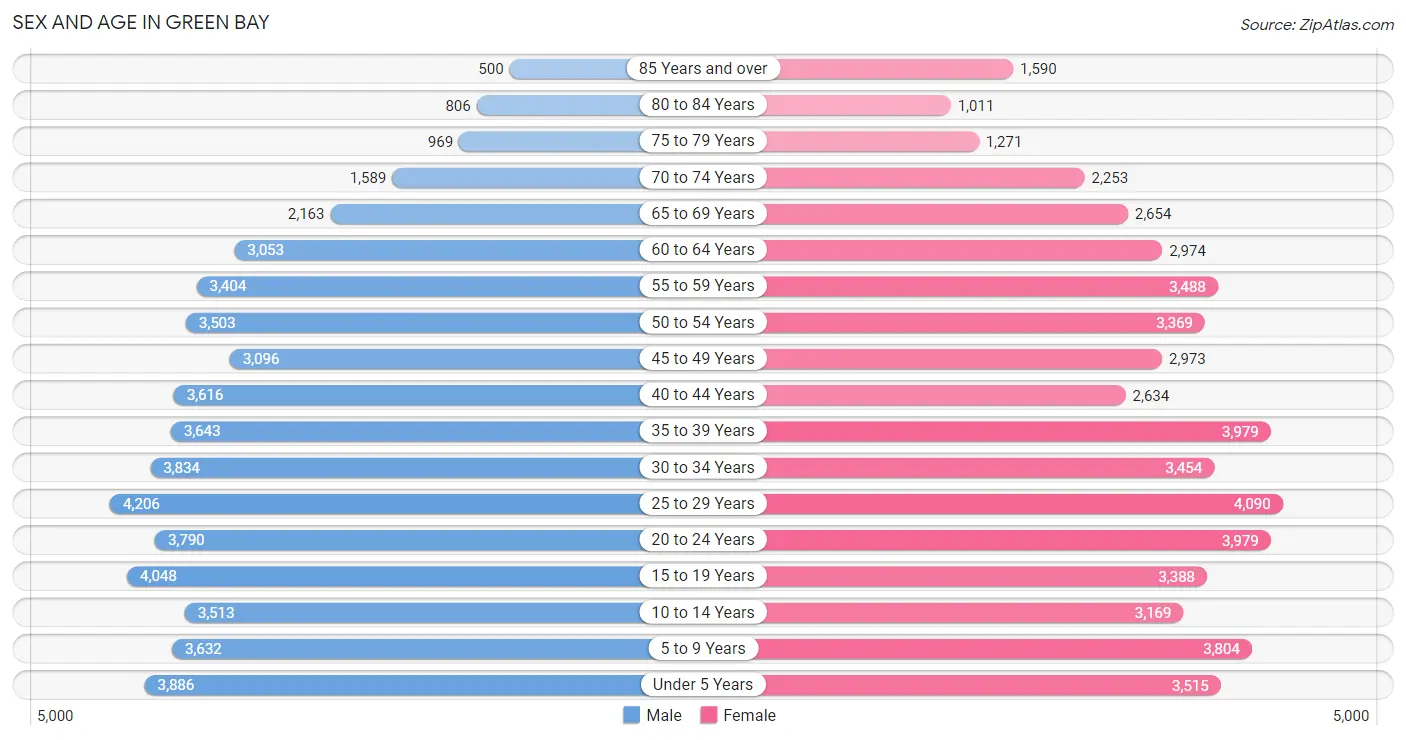
The most populous age groups in Green Bay are 25 to 29 Years (4,206 | 7.9%) for men and 25 to 29 Years (4,090 | 7.6%) for women.
| Age Bracket | Male | Female |
| Under 5 Years | 3,886 (7.3%) | 3,515 (6.6%) |
| 5 to 9 Years | 3,632 (6.8%) | 3,804 (7.1%) |
| 10 to 14 Years | 3,513 (6.6%) | 3,169 (5.9%) |
| 15 to 19 Years | 4,048 (7.6%) | 3,388 (6.3%) |
| 20 to 24 Years | 3,790 (7.1%) | 3,979 (7.4%) |
| 25 to 29 Years | 4,206 (7.9%) | 4,090 (7.6%) |
| 30 to 34 Years | 3,834 (7.2%) | 3,454 (6.4%) |
| 35 to 39 Years | 3,643 (6.8%) | 3,979 (7.4%) |
| 40 to 44 Years | 3,616 (6.8%) | 2,634 (4.9%) |
| 45 to 49 Years | 3,096 (5.8%) | 2,973 (5.6%) |
| 50 to 54 Years | 3,503 (6.6%) | 3,369 (6.3%) |
| 55 to 59 Years | 3,404 (6.4%) | 3,488 (6.5%) |
| 60 to 64 Years | 3,053 (5.7%) | 2,974 (5.6%) |
| 65 to 69 Years | 2,163 (4.1%) | 2,654 (5.0%) |
| 70 to 74 Years | 1,589 (3.0%) | 2,253 (4.2%) |
| 75 to 79 Years | 969 (1.8%) | 1,271 (2.4%) |
| 80 to 84 Years | 806 (1.5%) | 1,011 (1.9%) |
| 85 Years and over | 500 (0.9%) | 1,590 (3.0%) |
| Total | 53,251 (100.0%) | 53,595 (100.0%) |
Families and Households in Green Bay
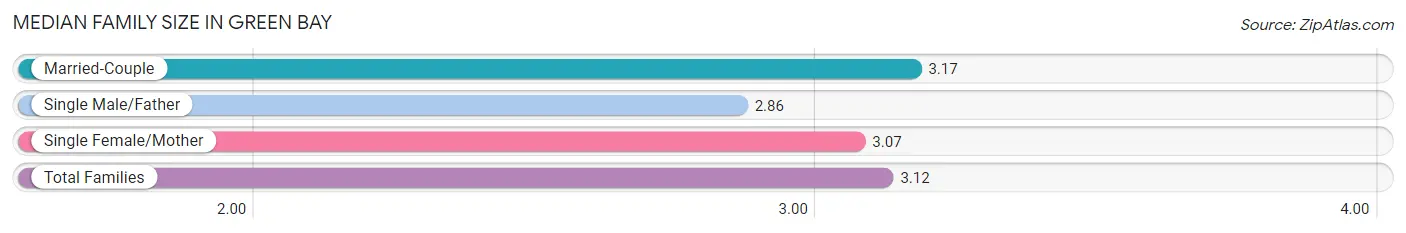
Median Family Size in Green Bay
The median family size in Green Bay is 3.12 persons per family, with married-couple families (16,890 | 69.3%) accounting for the largest median family size of 3.17 persons per family. On the other hand, single male/father families (2,408 | 9.9%) represent the smallest median family size with 2.86 persons per family.
| Family Type | # Families | Family Size |
| Married-Couple | 16,890 (69.3%) | 3.17 |
| Single Male/Father | 2,408 (9.9%) | 2.86 |
| Single Female/Mother | 5,071 (20.8%) | 3.07 |
| Total Families | 24,369 (100.0%) | 3.12 |
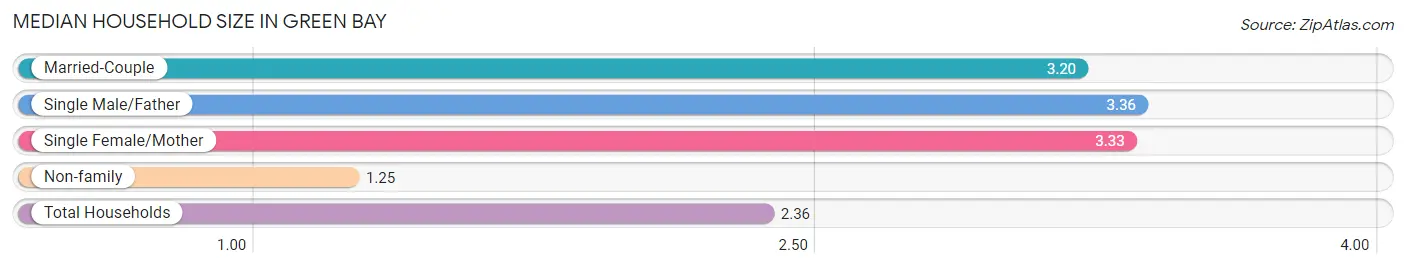
Median Household Size in Green Bay
The median household size in Green Bay is 2.36 persons per household, with single male/father households (2,408 | 5.5%) accounting for the largest median household size of 3.36 persons per household. non-family households (19,523 | 44.5%) represent the smallest median household size with 1.25 persons per household.
| Household Type | # Households | Household Size |
| Married-Couple | 16,890 (38.5%) | 3.20 |
| Single Male/Father | 2,408 (5.5%) | 3.36 |
| Single Female/Mother | 5,071 (11.6%) | 3.33 |
| Non-family | 19,523 (44.5%) | 1.25 |
| Total Households | 43,892 (100.0%) | 2.36 |
Household Size by Marriage Status in Green Bay
Out of a total of 43,892 households in Green Bay, 24,369 (55.5%) are family households, while 19,523 (44.5%) are nonfamily households. The most numerous type of family households are 2-person households, comprising 10,628, and the most common type of nonfamily households are 1-person households, comprising 15,639.
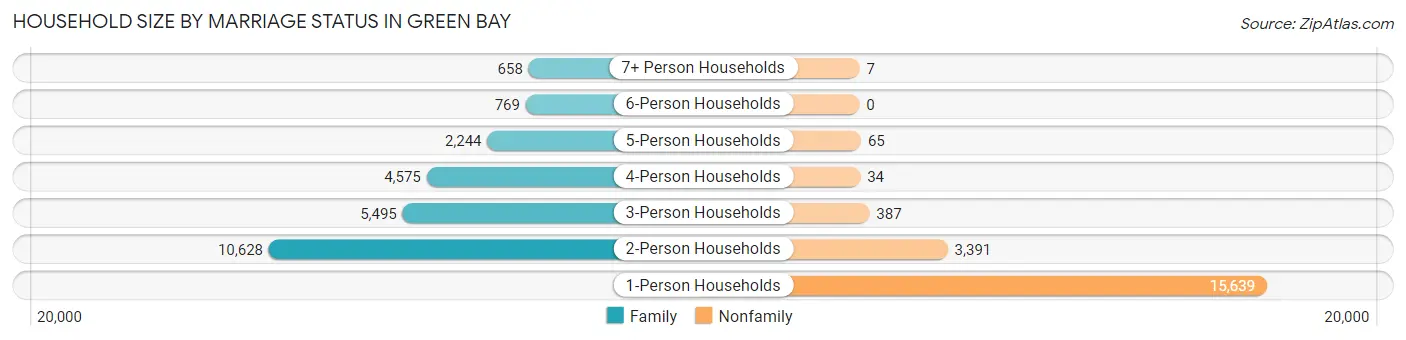
| Household Size | Family Households | Nonfamily Households |
| 1-Person Households | - | 15,639 (35.6%) |
| 2-Person Households | 10,628 (24.2%) | 3,391 (7.7%) |
| 3-Person Households | 5,495 (12.5%) | 387 (0.9%) |
| 4-Person Households | 4,575 (10.4%) | 34 (0.1%) |
| 5-Person Households | 2,244 (5.1%) | 65 (0.2%) |
| 6-Person Households | 769 (1.8%) | 0 (0.0%) |
| 7+ Person Households | 658 (1.5%) | 7 (0.0%) |
| Total | 24,369 (55.5%) | 19,523 (44.5%) |
Female Fertility in Green Bay
Fertility by Age in Green Bay
Average fertility rate in Green Bay is 38.0 births per 1,000 women. Women in the age bracket of 20 to 34 years have the highest fertility rate with 74.0 births per 1,000 women. Women in the age bracket of 20 to 34 years acount for 88.4% of all women with births.
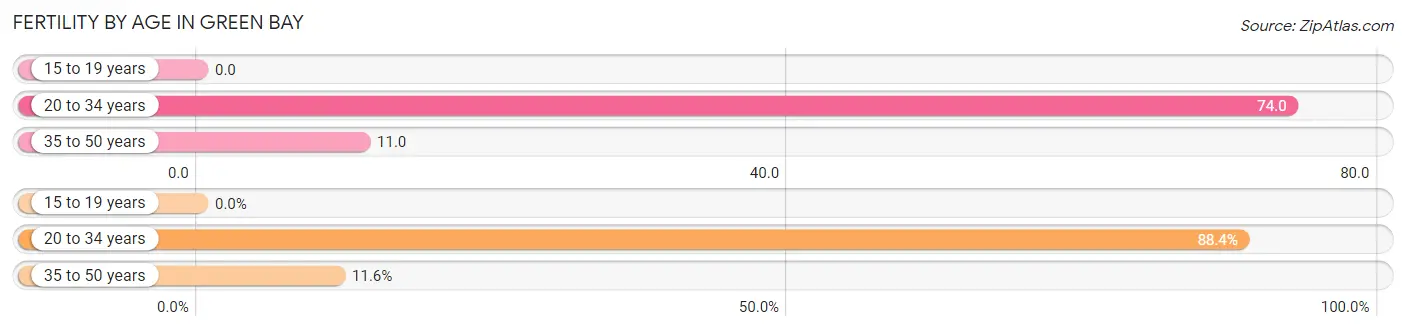
| Age Bracket | Women with Births | Births / 1,000 Women |
| 15 to 19 years | 0 (0.0%) | 0.0 |
| 20 to 34 years | 851 (88.4%) | 74.0 |
| 35 to 50 years | 112 (11.6%) | 11.0 |
| Total | 963 (100.0%) | 38.0 |
Fertility by Age by Marriage Status in Green Bay
63.8% of women with births (963) in Green Bay are married. The highest percentage of unmarried women with births falls into 35 to 50 years age bracket with 67.9% of them unmarried at the time of birth, while the lowest percentage of unmarried women with births belong to 20 to 34 years age bracket with 32.1% of them unmarried.
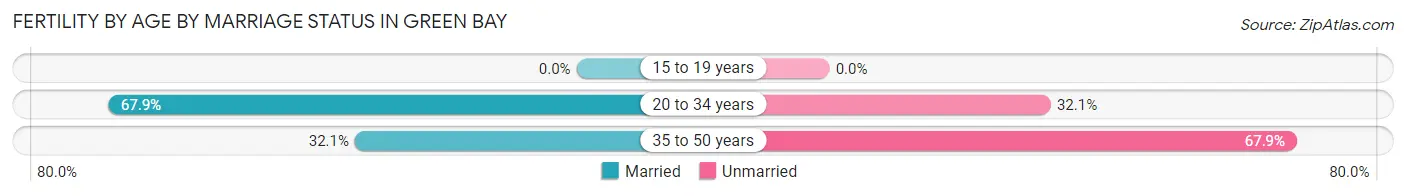
| Age Bracket | Married | Unmarried |
| 15 to 19 years | 0 (0.0%) | 0 (0.0%) |
| 20 to 34 years | 578 (67.9%) | 273 (32.1%) |
| 35 to 50 years | 36 (32.1%) | 76 (67.9%) |
| Total | 614 (63.8%) | 349 (36.2%) |
Fertility by Education in Green Bay
Average fertility rate in Green Bay is 38.0 births per 1,000 women. Women with the education attainment of bachelor's degree have the highest fertility rate of 54.0 births per 1,000 women, while women with the education attainment of less than high school have the lowest fertility at 16.0 births per 1,000 women. Women with the education attainment of college or associate's degree represent 39.0% of all women with births.
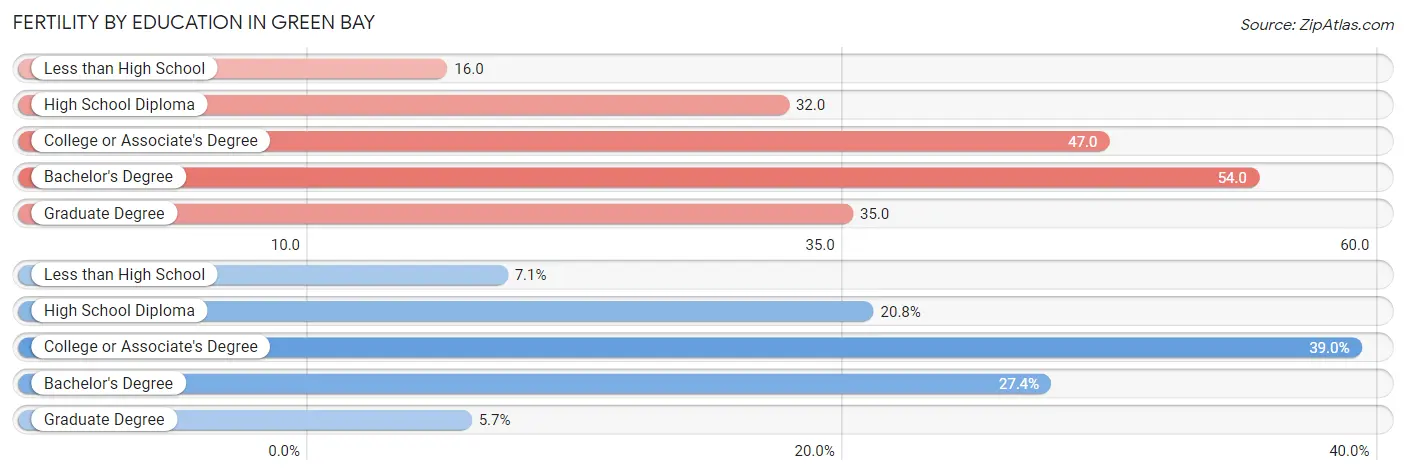
| Educational Attainment | Women with Births | Births / 1,000 Women |
| Less than High School | 68 (7.1%) | 16.0 |
| High School Diploma | 200 (20.8%) | 32.0 |
| College or Associate's Degree | 376 (39.0%) | 47.0 |
| Bachelor's Degree | 264 (27.4%) | 54.0 |
| Graduate Degree | 55 (5.7%) | 35.0 |
| Total | 963 (100.0%) | 38.0 |
Fertility by Education by Marriage Status in Green Bay
36.2% of women with births in Green Bay are unmarried. Women with the educational attainment of graduate degree are most likely to be married with 100.0% of them married at childbirth, while women with the educational attainment of less than high school are least likely to be married with 52.9% of them unmarried at childbirth.
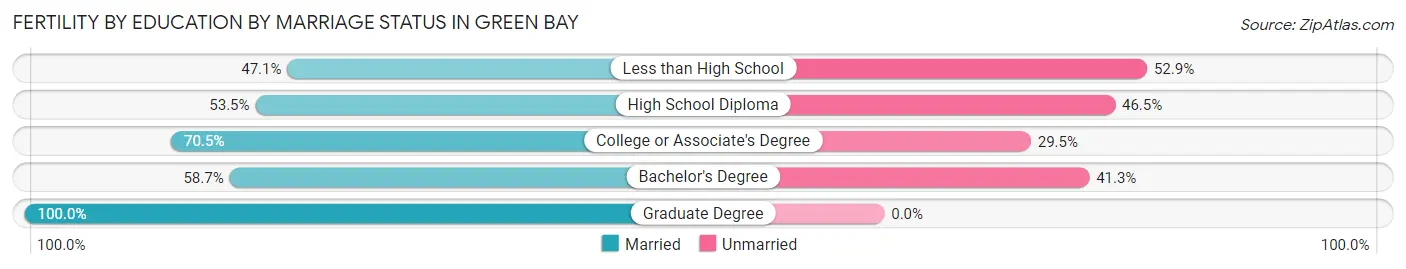
| Educational Attainment | Married | Unmarried |
| Less than High School | 32 (47.1%) | 36 (52.9%) |
| High School Diploma | 107 (53.5%) | 93 (46.5%) |
| College or Associate's Degree | 265 (70.5%) | 111 (29.5%) |
| Bachelor's Degree | 155 (58.7%) | 109 (41.3%) |
| Graduate Degree | 55 (100.0%) | 0 (0.0%) |
| Total | 614 (63.8%) | 349 (36.2%) |
Employment Characteristics in Green Bay
Employment by Class of Employer in Green Bay
Among the 53,308 employed individuals in Green Bay, private company employees (40,343 | 75.7%), not-for-profit organizations (4,171 | 7.8%), and local government employees (2,995 | 5.6%) make up the most common classes of employment.
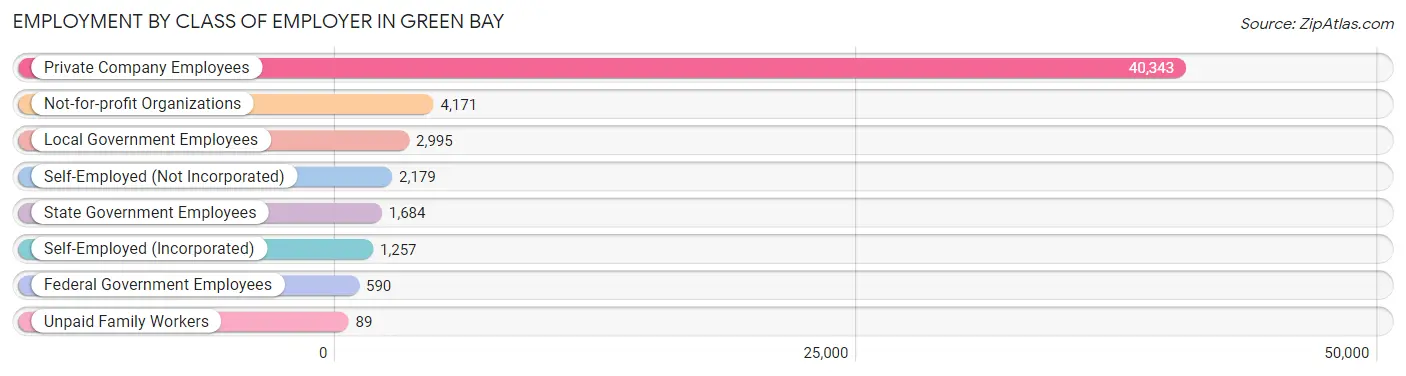
| Employer Class | # Employees | % Employees |
| Private Company Employees | 40,343 | 75.7% |
| Self-Employed (Incorporated) | 1,257 | 2.4% |
| Self-Employed (Not Incorporated) | 2,179 | 4.1% |
| Not-for-profit Organizations | 4,171 | 7.8% |
| Local Government Employees | 2,995 | 5.6% |
| State Government Employees | 1,684 | 3.2% |
| Federal Government Employees | 590 | 1.1% |
| Unpaid Family Workers | 89 | 0.2% |
| Total | 53,308 | 100.0% |
Employment Status by Age in Green Bay
According to the labor force statistics for Green Bay, out of the total population over 16 years of age (84,199), 67.5% or 56,834 individuals are in the labor force, with 4.1% or 2,330 of them unemployed. The age group with the highest labor force participation rate is 30 to 34 years, with 87.5% or 6,377 individuals in the labor force. Within the labor force, the 16 to 19 years age range has the highest percentage of unemployed individuals, with 10.8% or 386 of them being unemployed.
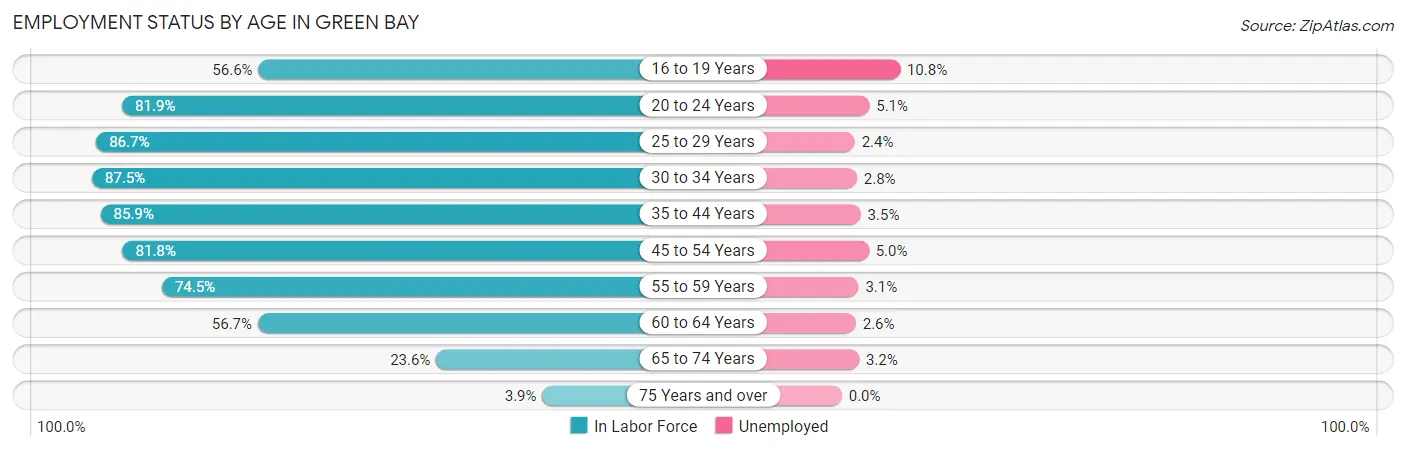
| Age Bracket | In Labor Force | Unemployed |
| 16 to 19 Years | 3,570 (56.6%) | 386 (10.8%) |
| 20 to 24 Years | 6,363 (81.9%) | 325 (5.1%) |
| 25 to 29 Years | 7,193 (86.7%) | 173 (2.4%) |
| 30 to 34 Years | 6,377 (87.5%) | 179 (2.8%) |
| 35 to 44 Years | 11,916 (85.9%) | 417 (3.5%) |
| 45 to 54 Years | 10,586 (81.8%) | 529 (5.0%) |
| 55 to 59 Years | 5,135 (74.5%) | 159 (3.1%) |
| 60 to 64 Years | 3,417 (56.7%) | 89 (2.6%) |
| 65 to 74 Years | 2,044 (23.6%) | 65 (3.2%) |
| 75 Years and over | 240 (3.9%) | 0 (0.0%) |
| Total | 56,834 (67.5%) | 2,330 (4.1%) |
Employment Status by Educational Attainment in Green Bay
According to labor force statistics for Green Bay, 80.7% of individuals (44,640) out of the total population between 25 and 64 years of age (55,316) are in the labor force, with 3.5% or 1,562 of them being unemployed. The group with the highest labor force participation rate are those with the educational attainment of bachelor's degree or higher, with 89.3% or 12,770 individuals in the labor force. Within the labor force, individuals with less than high school education have the highest percentage of unemployment, with 6.1% or 281 of them being unemployed.
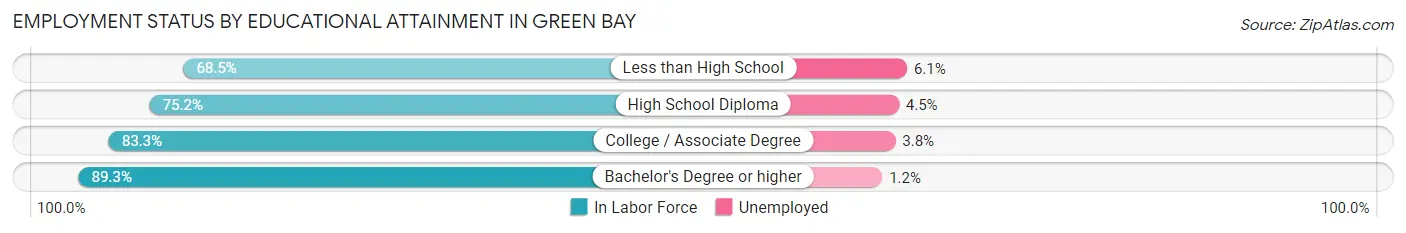
| Educational Attainment | In Labor Force | Unemployed |
| Less than High School | 4,601 (68.5%) | 410 (6.1%) |
| High School Diploma | 12,361 (75.2%) | 740 (4.5%) |
| College / Associate Degree | 14,878 (83.3%) | 679 (3.8%) |
| Bachelor's Degree or higher | 12,770 (89.3%) | 172 (1.2%) |
| Total | 44,640 (80.7%) | 1,936 (3.5%) |
Employment Occupations by Sex in Green Bay
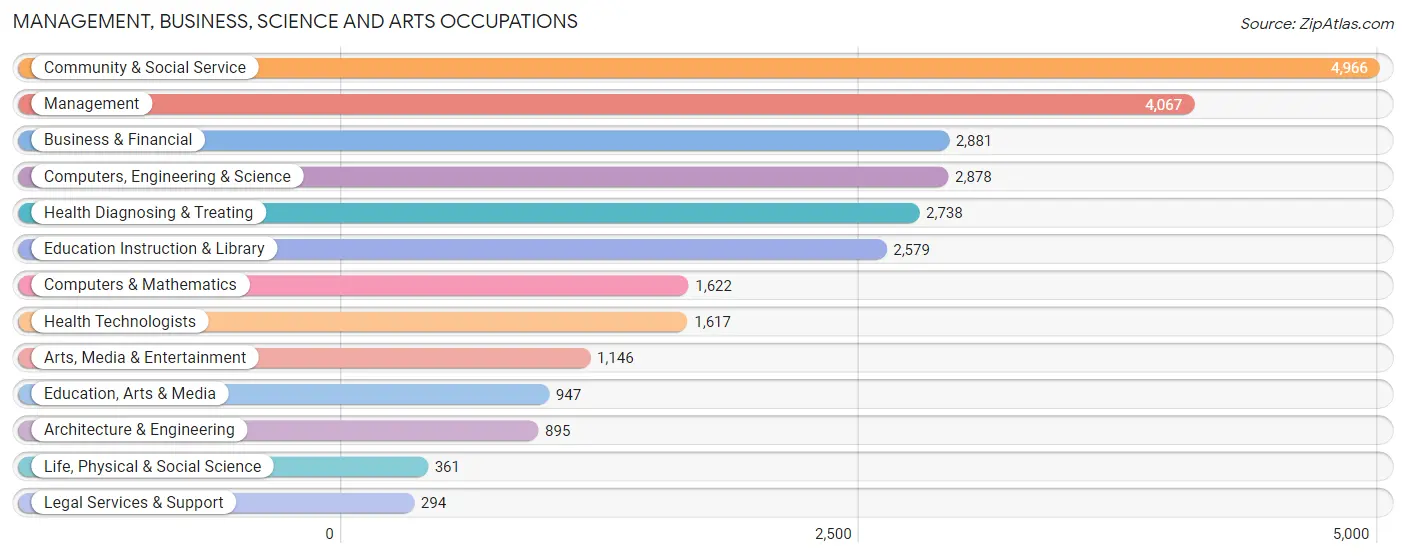
Management, Business, Science and Arts Occupations
The most common Management, Business, Science and Arts occupations in Green Bay are Community & Social Service (4,966 | 9.1%), Management (4,067 | 7.5%), Business & Financial (2,881 | 5.3%), Computers, Engineering & Science (2,878 | 5.3%), and Health Diagnosing & Treating (2,738 | 5.0%).
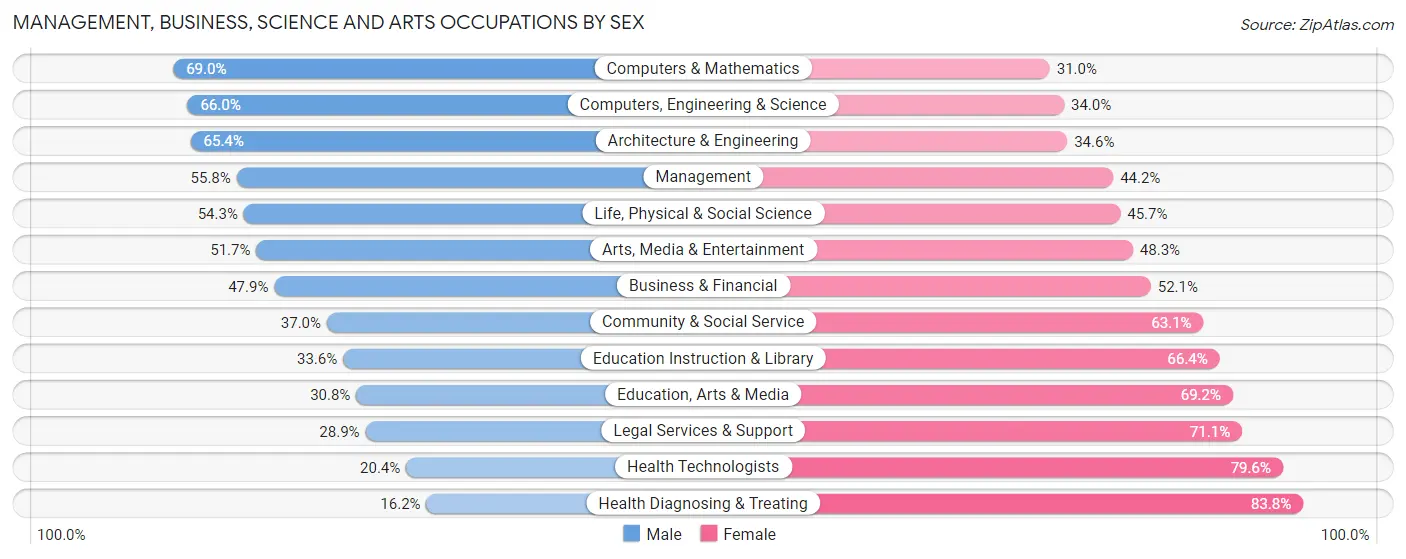
Management, Business, Science and Arts Occupations by Sex
Within the Management, Business, Science and Arts occupations in Green Bay, the most male-oriented occupations are Computers & Mathematics (69.0%), Computers, Engineering & Science (66.0%), and Architecture & Engineering (65.4%), while the most female-oriented occupations are Health Diagnosing & Treating (83.8%), Health Technologists (79.6%), and Legal Services & Support (71.1%).
| Occupation | Male | Female |
| Management | 2,268 (55.8%) | 1,799 (44.2%) |
| Business & Financial | 1,381 (47.9%) | 1,500 (52.1%) |
| Computers, Engineering & Science | 1,900 (66.0%) | 978 (34.0%) |
| Computers & Mathematics | 1,119 (69.0%) | 503 (31.0%) |
| Architecture & Engineering | 585 (65.4%) | 310 (34.6%) |
| Life, Physical & Social Science | 196 (54.3%) | 165 (45.7%) |
| Community & Social Service | 1,835 (36.9%) | 3,131 (63.0%) |
| Education, Arts & Media | 292 (30.8%) | 655 (69.2%) |
| Legal Services & Support | 85 (28.9%) | 209 (71.1%) |
| Education Instruction & Library | 866 (33.6%) | 1,713 (66.4%) |
| Arts, Media & Entertainment | 592 (51.7%) | 554 (48.3%) |
| Health Diagnosing & Treating | 443 (16.2%) | 2,295 (83.8%) |
| Health Technologists | 330 (20.4%) | 1,287 (79.6%) |
| Total (Category) | 7,827 (44.7%) | 9,703 (55.3%) |
| Total (Overall) | 28,587 (52.4%) | 25,929 (47.6%) |
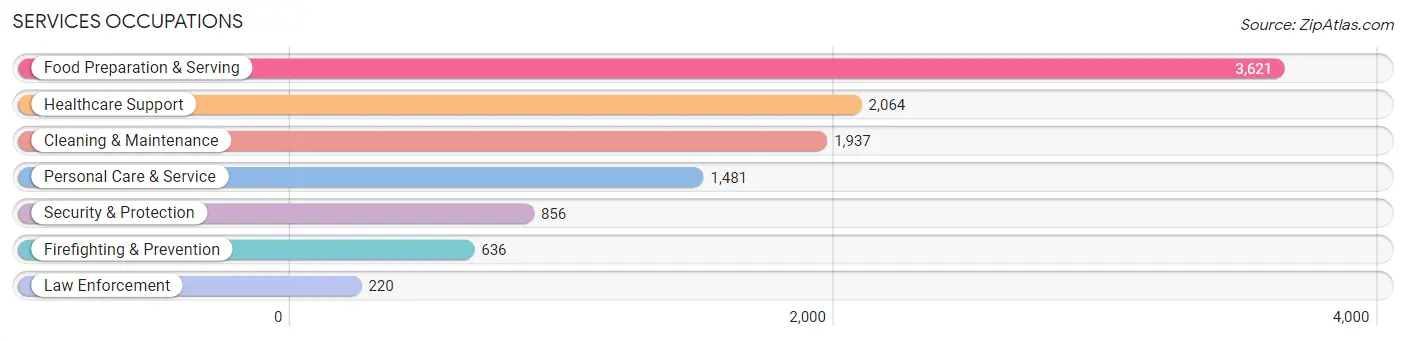
Services Occupations
The most common Services occupations in Green Bay are Food Preparation & Serving (3,621 | 6.6%), Healthcare Support (2,064 | 3.8%), Cleaning & Maintenance (1,937 | 3.5%), Personal Care & Service (1,481 | 2.7%), and Security & Protection (856 | 1.6%).
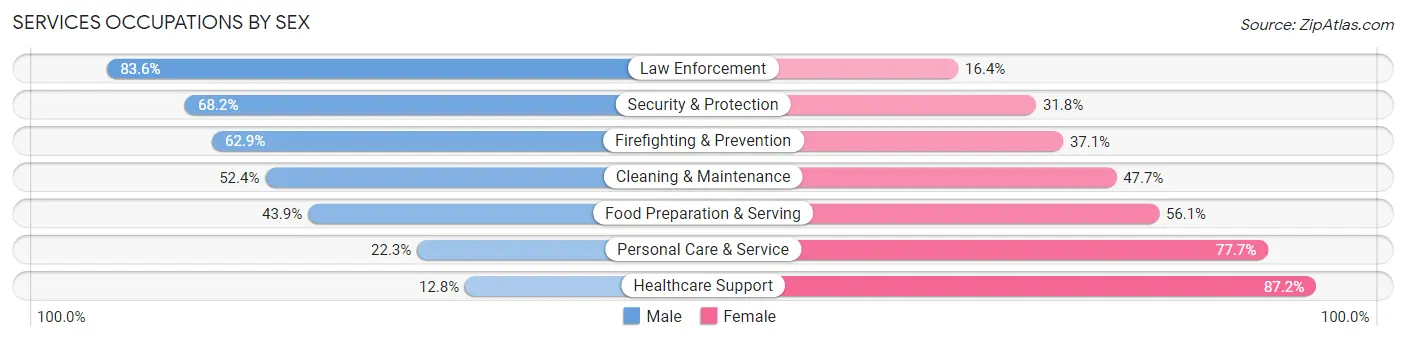
Services Occupations by Sex
Within the Services occupations in Green Bay, the most male-oriented occupations are Law Enforcement (83.6%), Security & Protection (68.2%), and Firefighting & Prevention (62.9%), while the most female-oriented occupations are Healthcare Support (87.2%), Personal Care & Service (77.7%), and Food Preparation & Serving (56.1%).
| Occupation | Male | Female |
| Healthcare Support | 264 (12.8%) | 1,800 (87.2%) |
| Security & Protection | 584 (68.2%) | 272 (31.8%) |
| Firefighting & Prevention | 400 (62.9%) | 236 (37.1%) |
| Law Enforcement | 184 (83.6%) | 36 (16.4%) |
| Food Preparation & Serving | 1,589 (43.9%) | 2,032 (56.1%) |
| Cleaning & Maintenance | 1,014 (52.3%) | 923 (47.6%) |
| Personal Care & Service | 330 (22.3%) | 1,151 (77.7%) |
| Total (Category) | 3,781 (38.0%) | 6,178 (62.0%) |
| Total (Overall) | 28,587 (52.4%) | 25,929 (47.6%) |
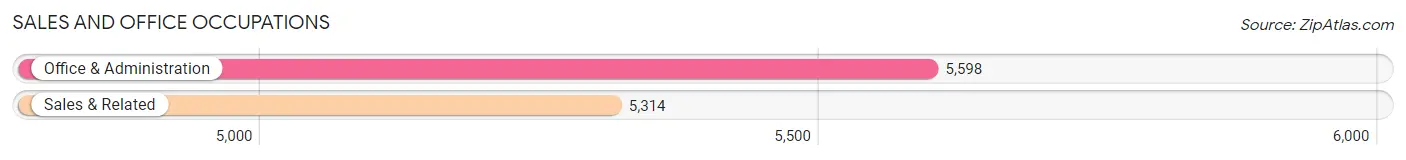
Sales and Office Occupations
The most common Sales and Office occupations in Green Bay are Office & Administration (5,598 | 10.3%), and Sales & Related (5,314 | 9.8%).
Sales and Office Occupations by Sex
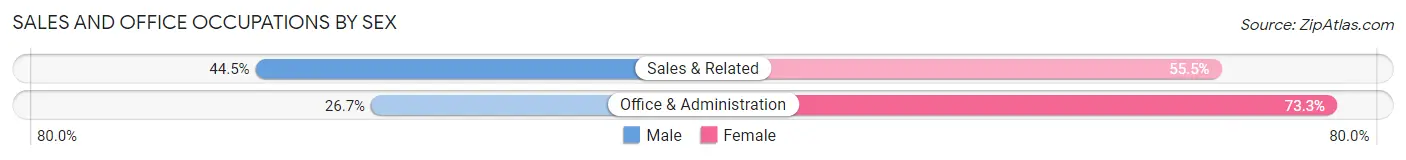
| Occupation | Male | Female |
| Sales & Related | 2,364 (44.5%) | 2,950 (55.5%) |
| Office & Administration | 1,496 (26.7%) | 4,102 (73.3%) |
| Total (Category) | 3,860 (35.4%) | 7,052 (64.6%) |
| Total (Overall) | 28,587 (52.4%) | 25,929 (47.6%) |
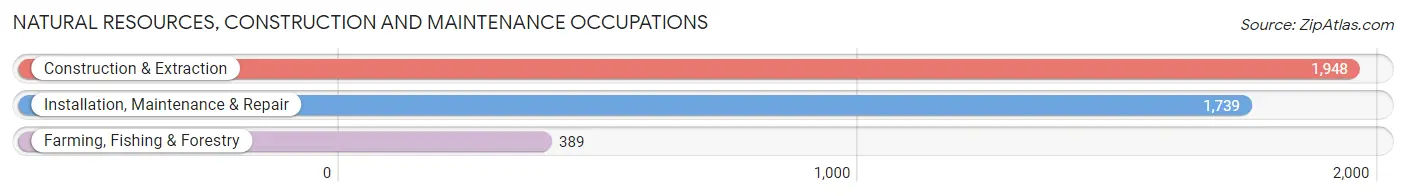
Natural Resources, Construction and Maintenance Occupations
The most common Natural Resources, Construction and Maintenance occupations in Green Bay are Construction & Extraction (1,948 | 3.6%), Installation, Maintenance & Repair (1,739 | 3.2%), and Farming, Fishing & Forestry (389 | 0.7%).
Natural Resources, Construction and Maintenance Occupations by Sex
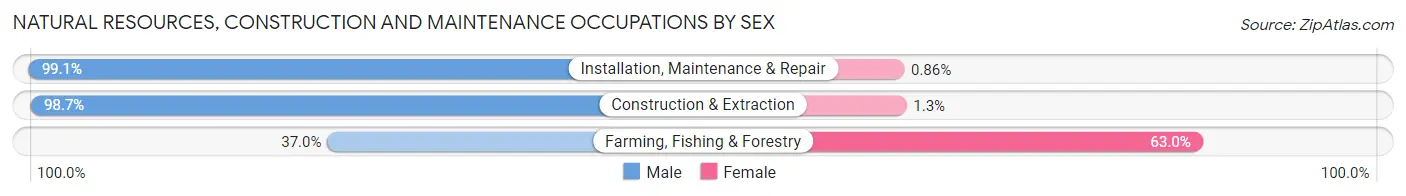
| Occupation | Male | Female |
| Farming, Fishing & Forestry | 144 (37.0%) | 245 (63.0%) |
| Construction & Extraction | 1,922 (98.7%) | 26 (1.3%) |
| Installation, Maintenance & Repair | 1,724 (99.1%) | 15 (0.9%) |
| Total (Category) | 3,790 (93.0%) | 286 (7.0%) |
| Total (Overall) | 28,587 (52.4%) | 25,929 (47.6%) |
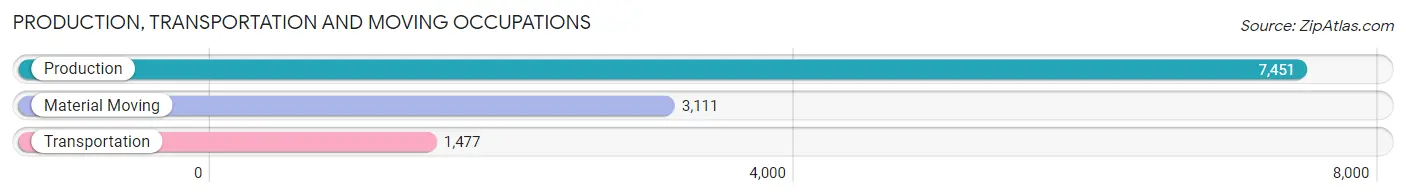
Production, Transportation and Moving Occupations
The most common Production, Transportation and Moving occupations in Green Bay are Production (7,451 | 13.7%), Material Moving (3,111 | 5.7%), and Transportation (1,477 | 2.7%).
Production, Transportation and Moving Occupations by Sex
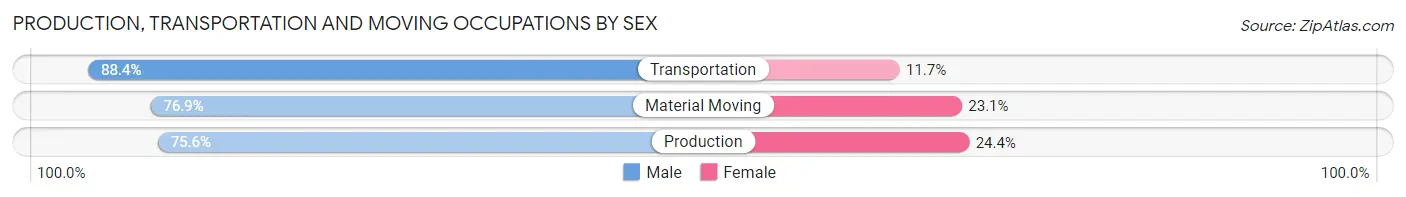
| Occupation | Male | Female |
| Production | 5,631 (75.6%) | 1,820 (24.4%) |
| Transportation | 1,305 (88.3%) | 172 (11.7%) |
| Material Moving | 2,393 (76.9%) | 718 (23.1%) |
| Total (Category) | 9,329 (77.5%) | 2,710 (22.5%) |
| Total (Overall) | 28,587 (52.4%) | 25,929 (47.6%) |
Employment Industries by Sex in Green Bay
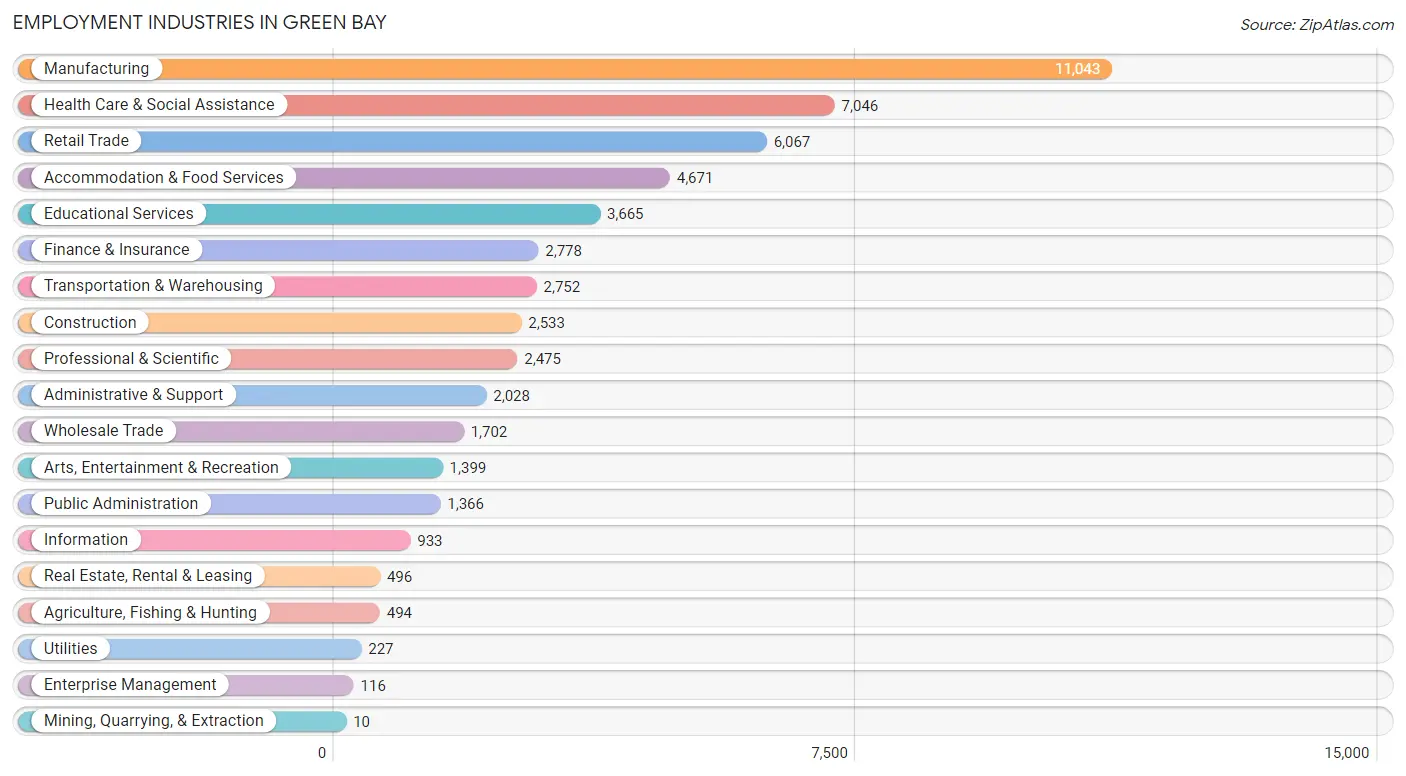
Employment Industries in Green Bay
The major employment industries in Green Bay include Manufacturing (11,043 | 20.3%), Health Care & Social Assistance (7,046 | 12.9%), Retail Trade (6,067 | 11.1%), Accommodation & Food Services (4,671 | 8.6%), and Educational Services (3,665 | 6.7%).
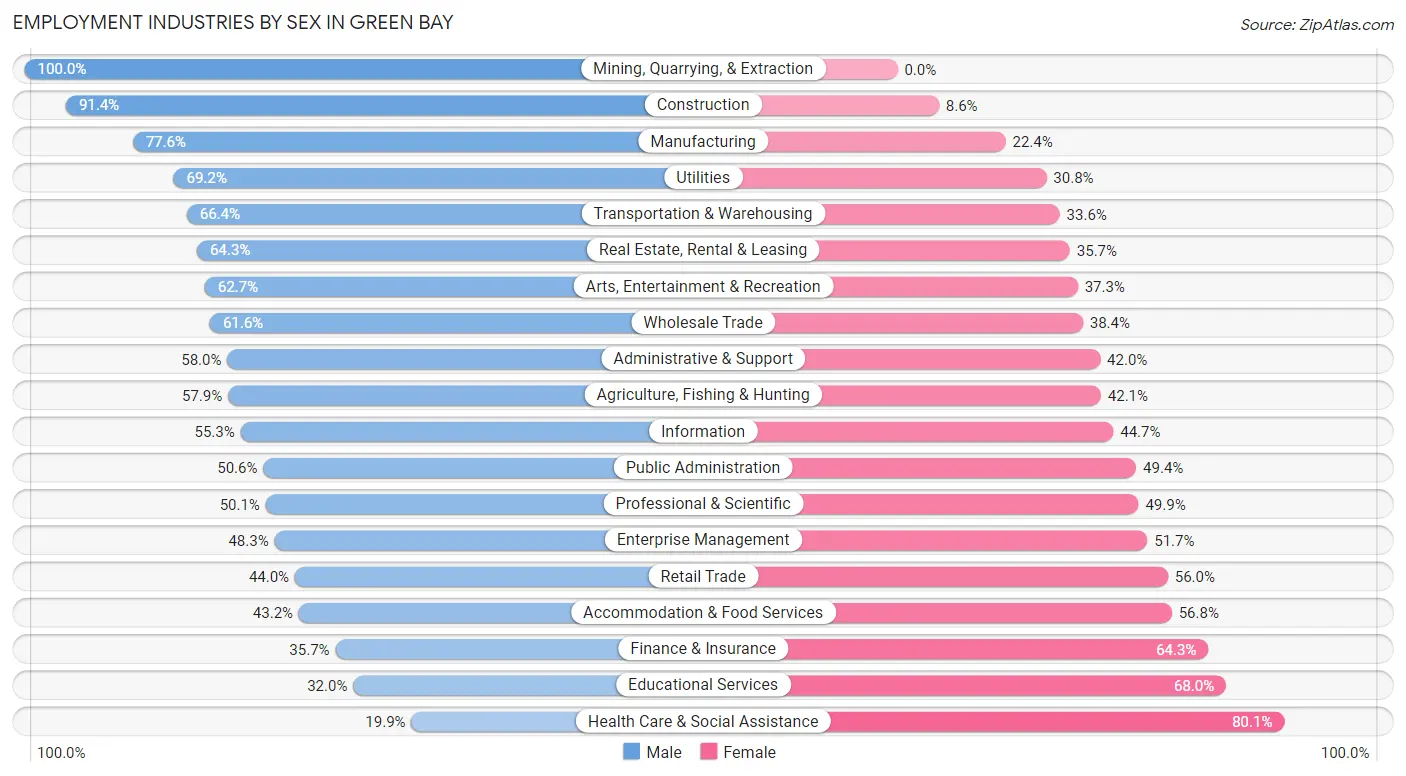
Employment Industries by Sex in Green Bay
The Green Bay industries that see more men than women are Mining, Quarrying, & Extraction (100.0%), Construction (91.4%), and Manufacturing (77.6%), whereas the industries that tend to have a higher number of women are Health Care & Social Assistance (80.1%), Educational Services (68.0%), and Finance & Insurance (64.3%).
| Industry | Male | Female |
| Agriculture, Fishing & Hunting | 286 (57.9%) | 208 (42.1%) |
| Mining, Quarrying, & Extraction | 10 (100.0%) | 0 (0.0%) |
| Construction | 2,316 (91.4%) | 217 (8.6%) |
| Manufacturing | 8,572 (77.6%) | 2,471 (22.4%) |
| Wholesale Trade | 1,049 (61.6%) | 653 (38.4%) |
| Retail Trade | 2,672 (44.0%) | 3,395 (56.0%) |
| Transportation & Warehousing | 1,828 (66.4%) | 924 (33.6%) |
| Utilities | 157 (69.2%) | 70 (30.8%) |
| Information | 516 (55.3%) | 417 (44.7%) |
| Finance & Insurance | 991 (35.7%) | 1,787 (64.3%) |
| Real Estate, Rental & Leasing | 319 (64.3%) | 177 (35.7%) |
| Professional & Scientific | 1,240 (50.1%) | 1,235 (49.9%) |
| Enterprise Management | 56 (48.3%) | 60 (51.7%) |
| Administrative & Support | 1,177 (58.0%) | 851 (42.0%) |
| Educational Services | 1,172 (32.0%) | 2,493 (68.0%) |
| Health Care & Social Assistance | 1,405 (19.9%) | 5,641 (80.1%) |
| Arts, Entertainment & Recreation | 877 (62.7%) | 522 (37.3%) |
| Accommodation & Food Services | 2,019 (43.2%) | 2,652 (56.8%) |
| Public Administration | 691 (50.6%) | 675 (49.4%) |
| Total | 28,587 (52.4%) | 25,929 (47.6%) |
Education in Green Bay
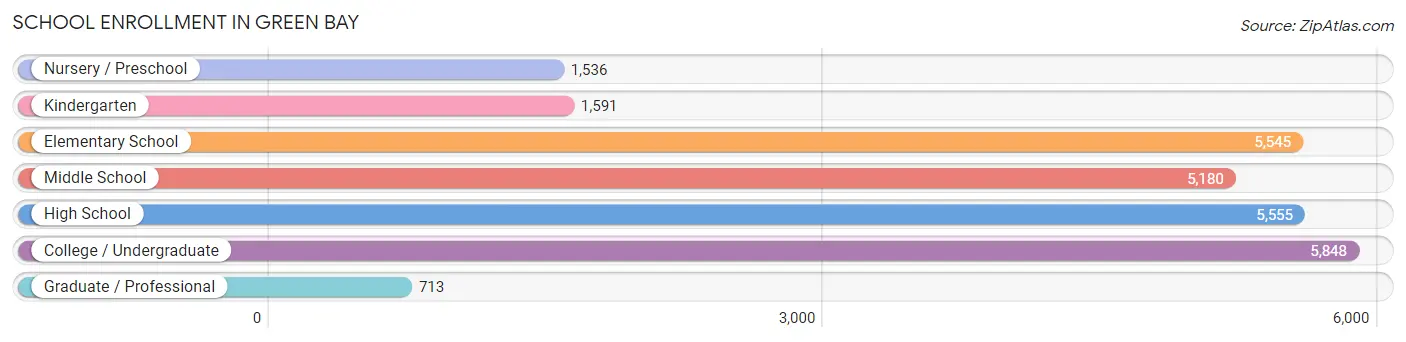
School Enrollment in Green Bay
The most common levels of schooling among the 25,968 students in Green Bay are college / undergraduate (5,848 | 22.5%), high school (5,555 | 21.4%), and elementary school (5,545 | 21.3%).
| School Level | # Students | % Students |
| Nursery / Preschool | 1,536 | 5.9% |
| Kindergarten | 1,591 | 6.1% |
| Elementary School | 5,545 | 21.3% |
| Middle School | 5,180 | 20.0% |
| High School | 5,555 | 21.4% |
| College / Undergraduate | 5,848 | 22.5% |
| Graduate / Professional | 713 | 2.8% |
| Total | 25,968 | 100.0% |
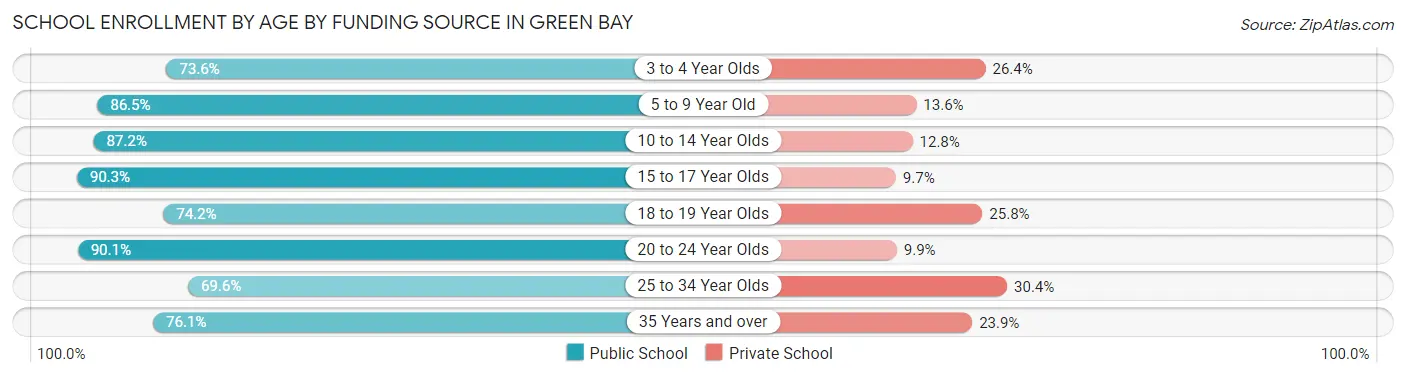
School Enrollment by Age by Funding Source in Green Bay
Out of a total of 25,968 students who are enrolled in schools in Green Bay, 3,999 (15.4%) attend a private institution, while the remaining 21,969 (84.6%) are enrolled in public schools. The age group of 25 to 34 year olds has the highest likelihood of being enrolled in private schools, with 432 (30.4% in the age bracket) enrolled. Conversely, the age group of 15 to 17 year olds has the lowest likelihood of being enrolled in a private school, with 3,545 (90.3% in the age bracket) attending a public institution.
| Age Bracket | Public School | Private School |
| 3 to 4 Year Olds | 816 (73.6%) | 293 (26.4%) |
| 5 to 9 Year Old | 6,033 (86.5%) | 946 (13.6%) |
| 10 to 14 Year Olds | 5,547 (87.2%) | 817 (12.8%) |
| 15 to 17 Year Olds | 3,545 (90.3%) | 382 (9.7%) |
| 18 to 19 Year Olds | 1,705 (74.2%) | 594 (25.8%) |
| 20 to 24 Year Olds | 2,577 (90.1%) | 283 (9.9%) |
| 25 to 34 Year Olds | 987 (69.6%) | 432 (30.4%) |
| 35 Years and over | 769 (76.1%) | 242 (23.9%) |
| Total | 21,969 (84.6%) | 3,999 (15.4%) |
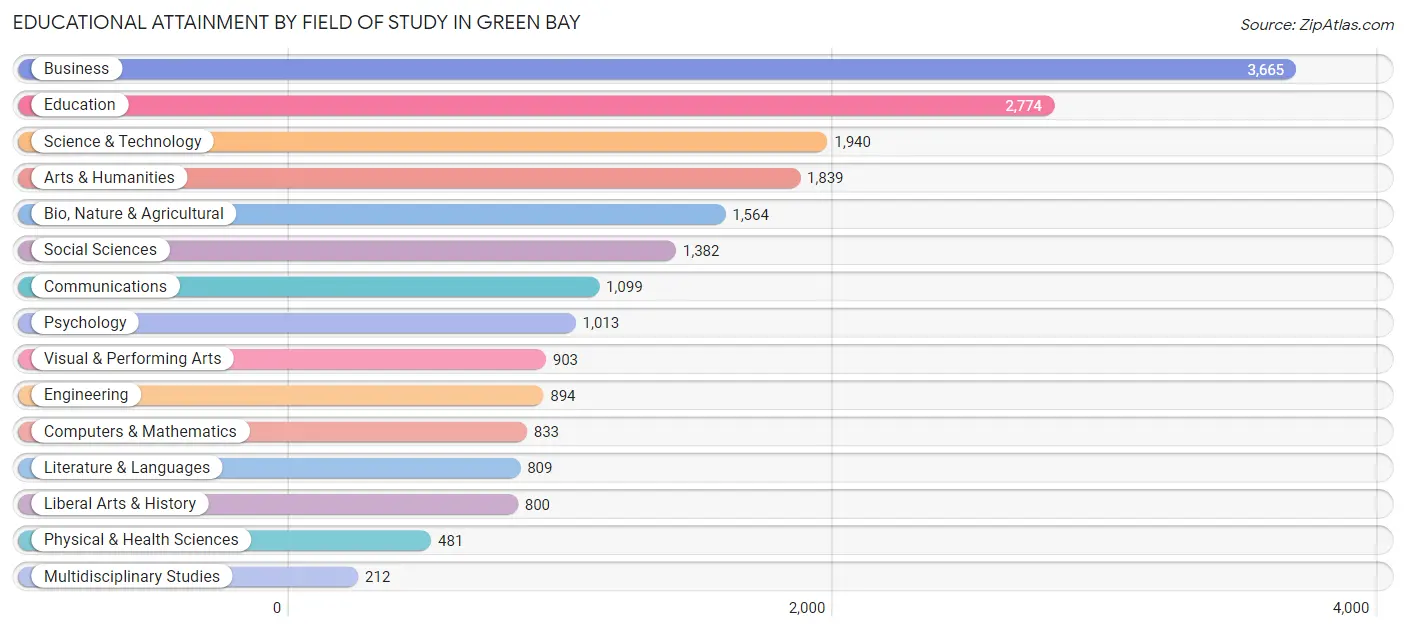
Educational Attainment by Field of Study in Green Bay
Business (3,665 | 18.1%), education (2,774 | 13.7%), science & technology (1,940 | 9.6%), arts & humanities (1,839 | 9.1%), and bio, nature & agricultural (1,564 | 7.7%) are the most common fields of study among 20,208 individuals in Green Bay who have obtained a bachelor's degree or higher.
| Field of Study | # Graduates | % Graduates |
| Computers & Mathematics | 833 | 4.1% |
| Bio, Nature & Agricultural | 1,564 | 7.7% |
| Physical & Health Sciences | 481 | 2.4% |
| Psychology | 1,013 | 5.0% |
| Social Sciences | 1,382 | 6.8% |
| Engineering | 894 | 4.4% |
| Multidisciplinary Studies | 212 | 1.1% |
| Science & Technology | 1,940 | 9.6% |
| Business | 3,665 | 18.1% |
| Education | 2,774 | 13.7% |
| Literature & Languages | 809 | 4.0% |
| Liberal Arts & History | 800 | 4.0% |
| Visual & Performing Arts | 903 | 4.5% |
| Communications | 1,099 | 5.4% |
| Arts & Humanities | 1,839 | 9.1% |
| Total | 20,208 | 100.0% |
Transportation & Commute in Green Bay
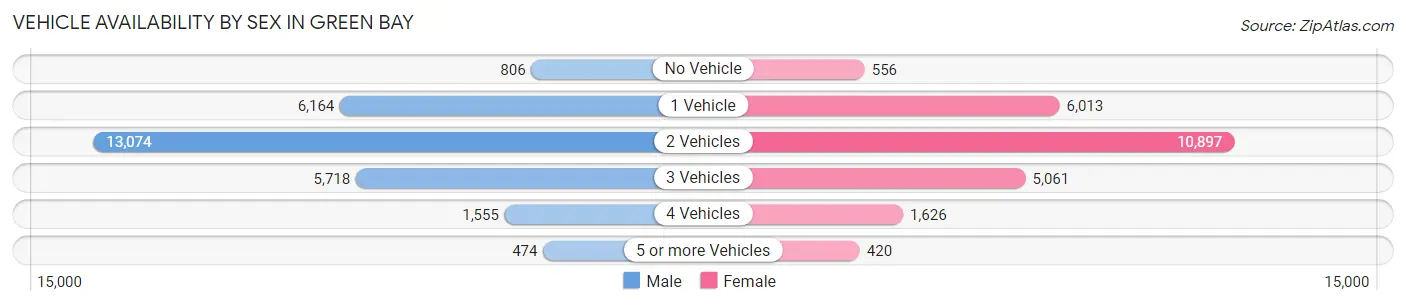
Vehicle Availability by Sex in Green Bay
The most prevalent vehicle ownership categories in Green Bay are males with 2 vehicles (13,074, accounting for 47.0%) and females with 2 vehicles (10,897, making up 53.2%).
| Vehicles Available | Male | Female |
| No Vehicle | 806 (2.9%) | 556 (2.3%) |
| 1 Vehicle | 6,164 (22.2%) | 6,013 (24.5%) |
| 2 Vehicles | 13,074 (47.0%) | 10,897 (44.4%) |
| 3 Vehicles | 5,718 (20.6%) | 5,061 (20.6%) |
| 4 Vehicles | 1,555 (5.6%) | 1,626 (6.6%) |
| 5 or more Vehicles | 474 (1.7%) | 420 (1.7%) |
| Total | 27,791 (100.0%) | 24,573 (100.0%) |
Commute Time in Green Bay
The most frequently occuring commute durations in Green Bay are 15 to 19 minutes (12,521 commuters, 25.4%), 10 to 14 minutes (11,504 commuters, 23.4%), and 5 to 9 minutes (7,827 commuters, 15.9%).
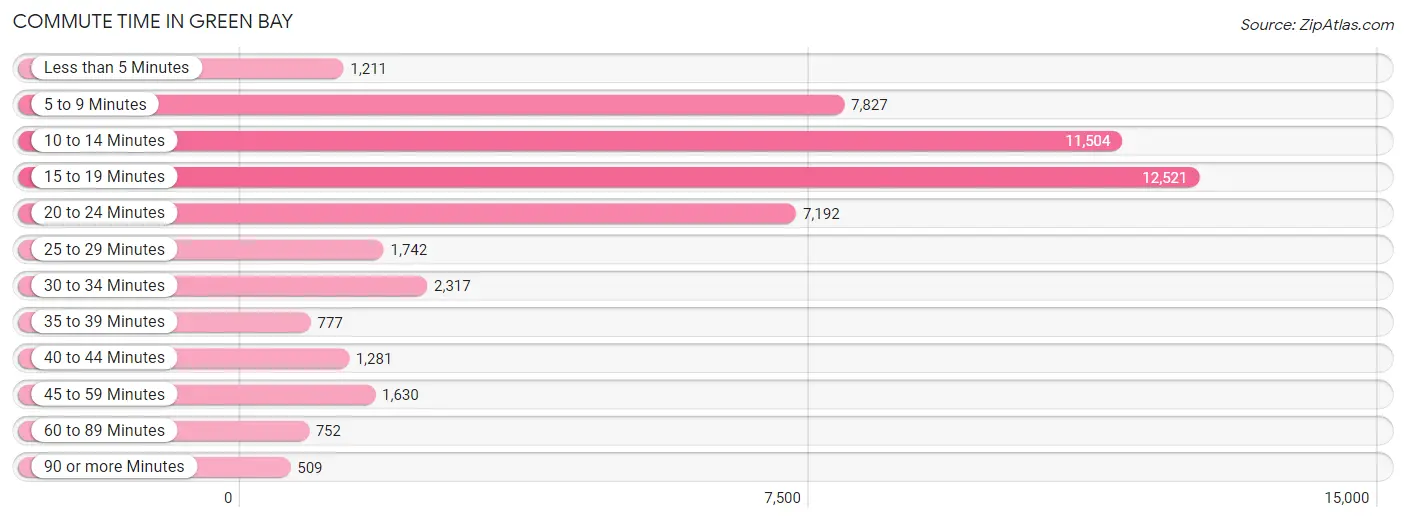
| Commute Time | # Commuters | % Commuters |
| Less than 5 Minutes | 1,211 | 2.5% |
| 5 to 9 Minutes | 7,827 | 15.9% |
| 10 to 14 Minutes | 11,504 | 23.4% |
| 15 to 19 Minutes | 12,521 | 25.4% |
| 20 to 24 Minutes | 7,192 | 14.6% |
| 25 to 29 Minutes | 1,742 | 3.5% |
| 30 to 34 Minutes | 2,317 | 4.7% |
| 35 to 39 Minutes | 777 | 1.6% |
| 40 to 44 Minutes | 1,281 | 2.6% |
| 45 to 59 Minutes | 1,630 | 3.3% |
| 60 to 89 Minutes | 752 | 1.5% |
| 90 or more Minutes | 509 | 1.0% |
Commute Time by Sex in Green Bay
The most common commute times in Green Bay are 15 to 19 minutes (6,425 commuters, 24.6%) for males and 15 to 19 minutes (6,096 commuters, 26.4%) for females.
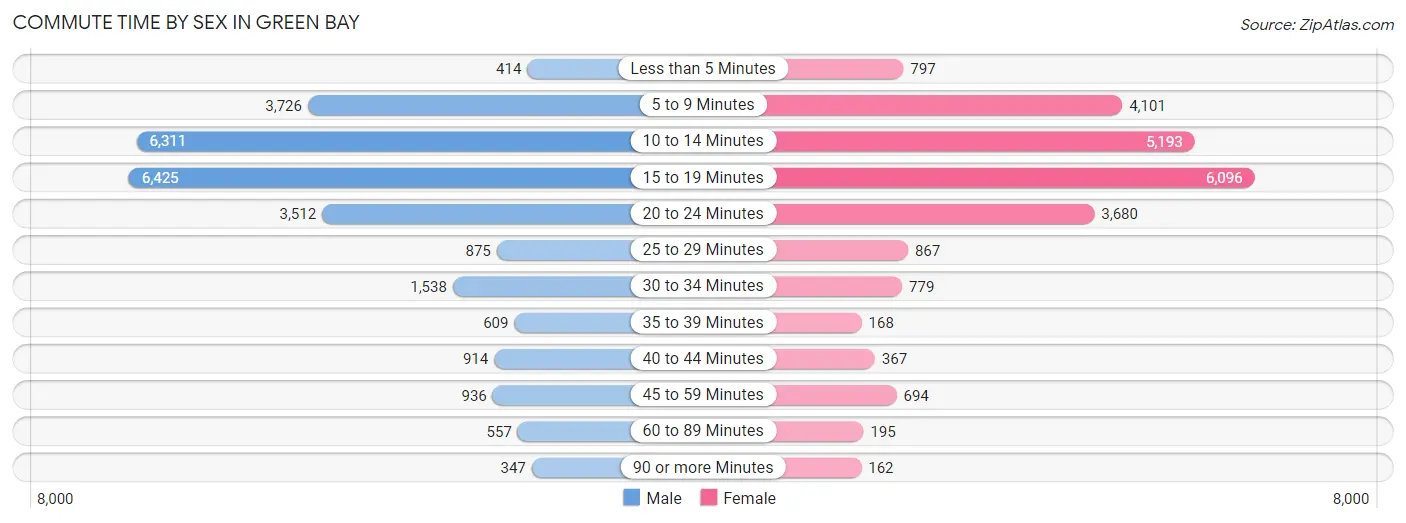
| Commute Time | Male | Female |
| Less than 5 Minutes | 414 (1.6%) | 797 (3.5%) |
| 5 to 9 Minutes | 3,726 (14.2%) | 4,101 (17.7%) |
| 10 to 14 Minutes | 6,311 (24.1%) | 5,193 (22.5%) |
| 15 to 19 Minutes | 6,425 (24.6%) | 6,096 (26.4%) |
| 20 to 24 Minutes | 3,512 (13.4%) | 3,680 (15.9%) |
| 25 to 29 Minutes | 875 (3.3%) | 867 (3.7%) |
| 30 to 34 Minutes | 1,538 (5.9%) | 779 (3.4%) |
| 35 to 39 Minutes | 609 (2.3%) | 168 (0.7%) |
| 40 to 44 Minutes | 914 (3.5%) | 367 (1.6%) |
| 45 to 59 Minutes | 936 (3.6%) | 694 (3.0%) |
| 60 to 89 Minutes | 557 (2.1%) | 195 (0.8%) |
| 90 or more Minutes | 347 (1.3%) | 162 (0.7%) |
Time of Departure to Work by Sex in Green Bay
The most frequent times of departure to work in Green Bay are 12:00 AM to 4:59 AM (3,054, 11.7%) for males and 7:30 AM to 7:59 AM (3,401, 14.7%) for females.
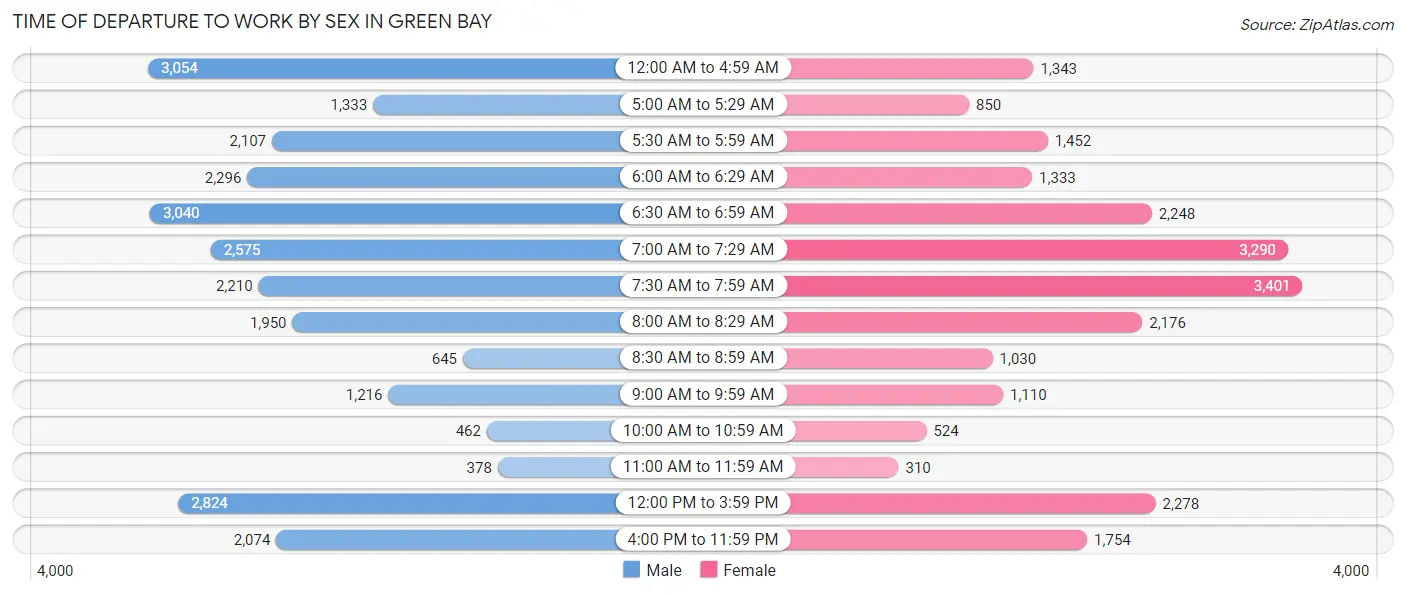
| Time of Departure | Male | Female |
| 12:00 AM to 4:59 AM | 3,054 (11.7%) | 1,343 (5.8%) |
| 5:00 AM to 5:29 AM | 1,333 (5.1%) | 850 (3.7%) |
| 5:30 AM to 5:59 AM | 2,107 (8.1%) | 1,452 (6.3%) |
| 6:00 AM to 6:29 AM | 2,296 (8.8%) | 1,333 (5.8%) |
| 6:30 AM to 6:59 AM | 3,040 (11.6%) | 2,248 (9.7%) |
| 7:00 AM to 7:29 AM | 2,575 (9.8%) | 3,290 (14.2%) |
| 7:30 AM to 7:59 AM | 2,210 (8.5%) | 3,401 (14.7%) |
| 8:00 AM to 8:29 AM | 1,950 (7.4%) | 2,176 (9.4%) |
| 8:30 AM to 8:59 AM | 645 (2.5%) | 1,030 (4.5%) |
| 9:00 AM to 9:59 AM | 1,216 (4.6%) | 1,110 (4.8%) |
| 10:00 AM to 10:59 AM | 462 (1.8%) | 524 (2.3%) |
| 11:00 AM to 11:59 AM | 378 (1.4%) | 310 (1.3%) |
| 12:00 PM to 3:59 PM | 2,824 (10.8%) | 2,278 (9.9%) |
| 4:00 PM to 11:59 PM | 2,074 (7.9%) | 1,754 (7.6%) |
| Total | 26,164 (100.0%) | 23,099 (100.0%) |
Housing Occupancy in Green Bay
Occupancy by Ownership in Green Bay
Of the total 43,892 dwellings in Green Bay, owner-occupied units account for 24,646 (56.1%), while renter-occupied units make up 19,246 (43.9%).
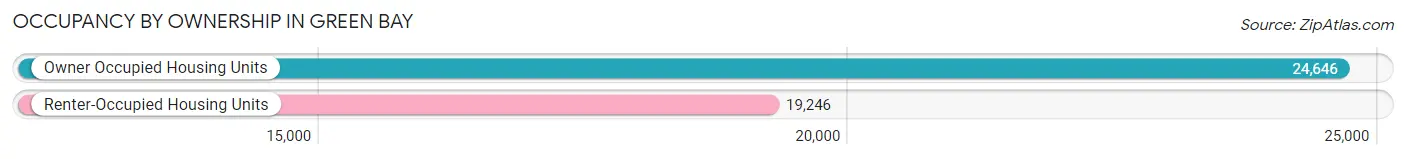
| Occupancy | # Housing Units | % Housing Units |
| Owner Occupied Housing Units | 24,646 | 56.1% |
| Renter-Occupied Housing Units | 19,246 | 43.9% |
| Total Occupied Housing Units | 43,892 | 100.0% |
Occupancy by Household Size in Green Bay
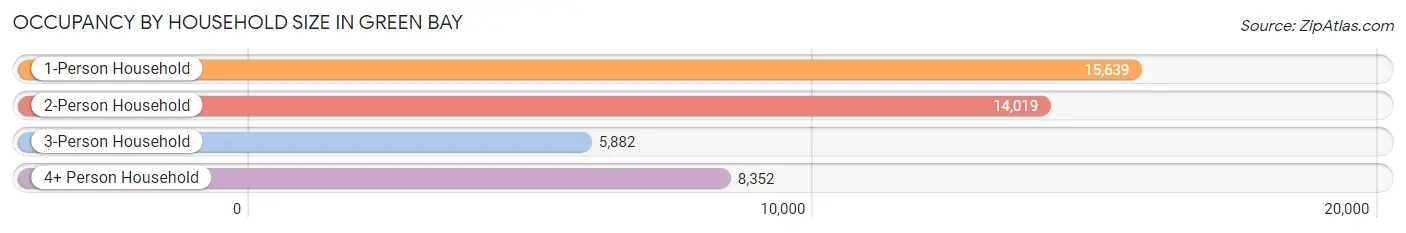
| Household Size | # Housing Units | % Housing Units |
| 1-Person Household | 15,639 | 35.6% |
| 2-Person Household | 14,019 | 31.9% |
| 3-Person Household | 5,882 | 13.4% |
| 4+ Person Household | 8,352 | 19.0% |
| Total Housing Units | 43,892 | 100.0% |
Occupancy by Ownership by Household Size in Green Bay
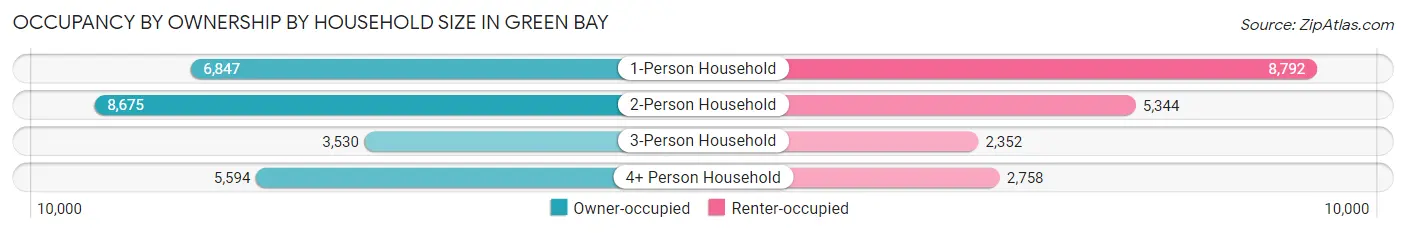
| Household Size | Owner-occupied | Renter-occupied |
| 1-Person Household | 6,847 (43.8%) | 8,792 (56.2%) |
| 2-Person Household | 8,675 (61.9%) | 5,344 (38.1%) |
| 3-Person Household | 3,530 (60.0%) | 2,352 (40.0%) |
| 4+ Person Household | 5,594 (67.0%) | 2,758 (33.0%) |
| Total Housing Units | 24,646 (56.1%) | 19,246 (43.9%) |
Occupancy by Educational Attainment in Green Bay
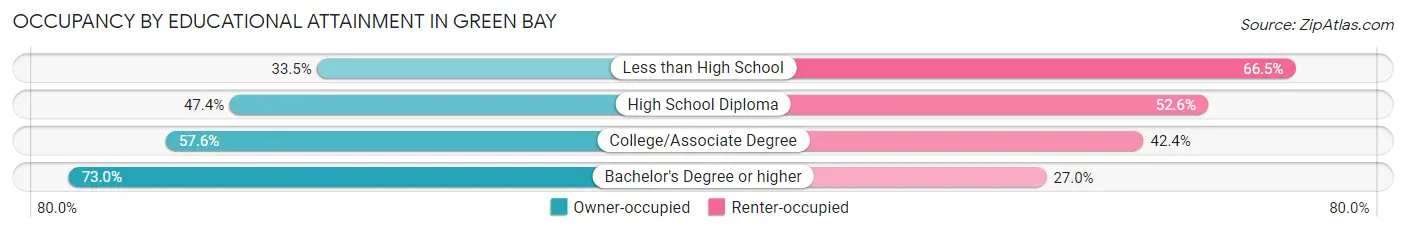
| Household Size | Owner-occupied | Renter-occupied |
| Less than High School | 1,446 (33.5%) | 2,867 (66.5%) |
| High School Diploma | 6,249 (47.4%) | 6,931 (52.6%) |
| College/Associate Degree | 8,657 (57.6%) | 6,379 (42.4%) |
| Bachelor's Degree or higher | 8,294 (73.0%) | 3,069 (27.0%) |
Occupancy by Age of Householder in Green Bay
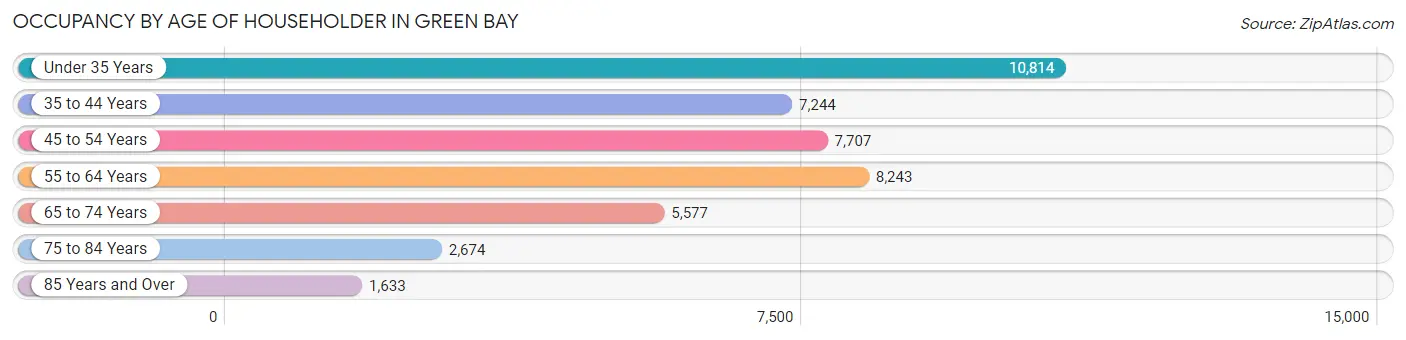
| Age Bracket | # Households | % Households |
| Under 35 Years | 10,814 | 24.6% |
| 35 to 44 Years | 7,244 | 16.5% |
| 45 to 54 Years | 7,707 | 17.6% |
| 55 to 64 Years | 8,243 | 18.8% |
| 65 to 74 Years | 5,577 | 12.7% |
| 75 to 84 Years | 2,674 | 6.1% |
| 85 Years and Over | 1,633 | 3.7% |
| Total | 43,892 | 100.0% |
Housing Finances in Green Bay
Median Income by Occupancy in Green Bay
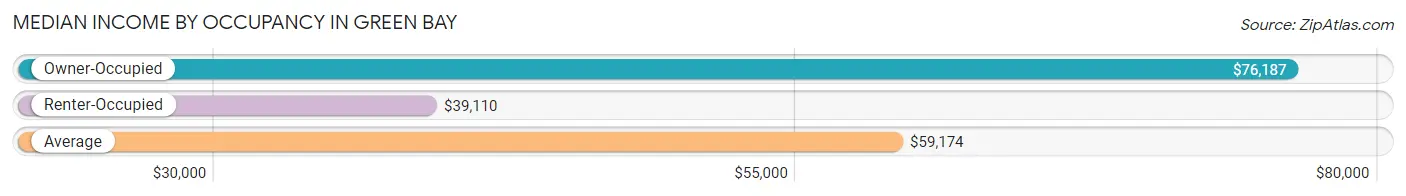
| Occupancy Type | # Households | Median Income |
| Owner-Occupied | 24,646 (56.1%) | $76,187 |
| Renter-Occupied | 19,246 (43.9%) | $39,110 |
| Average | 43,892 (100.0%) | $59,174 |
Occupancy by Householder Income Bracket in Green Bay
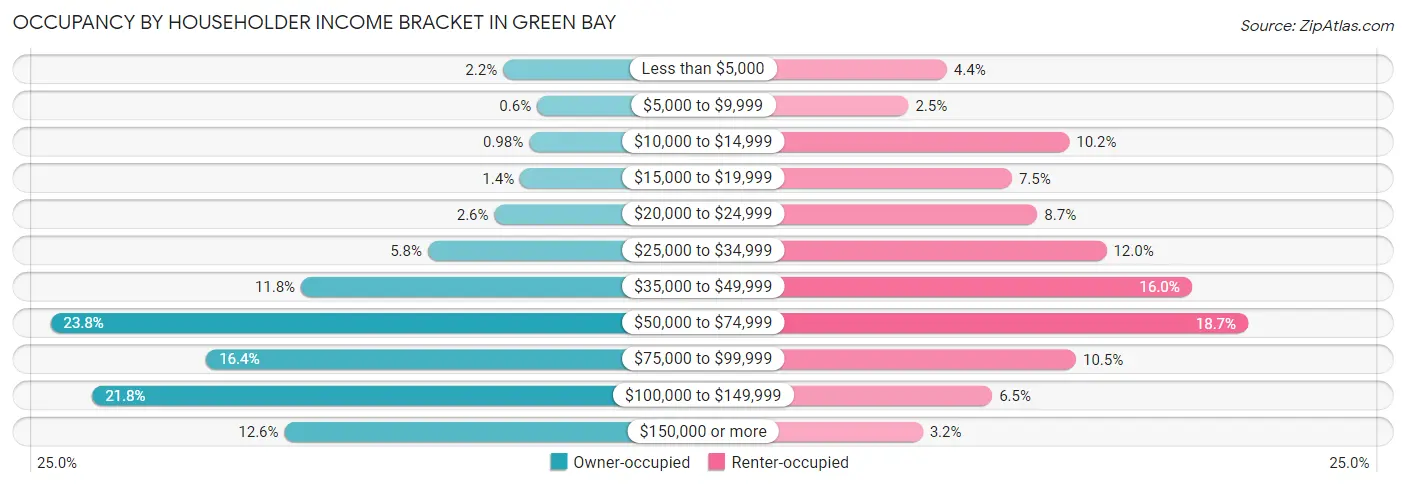
| Income Bracket | Owner-occupied | Renter-occupied |
| Less than $5,000 | 546 (2.2%) | 838 (4.3%) |
| $5,000 to $9,999 | 147 (0.6%) | 485 (2.5%) |
| $10,000 to $14,999 | 242 (1.0%) | 1,960 (10.2%) |
| $15,000 to $19,999 | 348 (1.4%) | 1,434 (7.4%) |
| $20,000 to $24,999 | 647 (2.6%) | 1,667 (8.7%) |
| $25,000 to $34,999 | 1,430 (5.8%) | 2,299 (11.9%) |
| $35,000 to $49,999 | 2,917 (11.8%) | 3,079 (16.0%) |
| $50,000 to $74,999 | 5,858 (23.8%) | 3,596 (18.7%) |
| $75,000 to $99,999 | 4,029 (16.4%) | 2,020 (10.5%) |
| $100,000 to $149,999 | 5,369 (21.8%) | 1,252 (6.5%) |
| $150,000 or more | 3,113 (12.6%) | 616 (3.2%) |
| Total | 24,646 (100.0%) | 19,246 (100.0%) |
Monthly Housing Cost Tiers in Green Bay
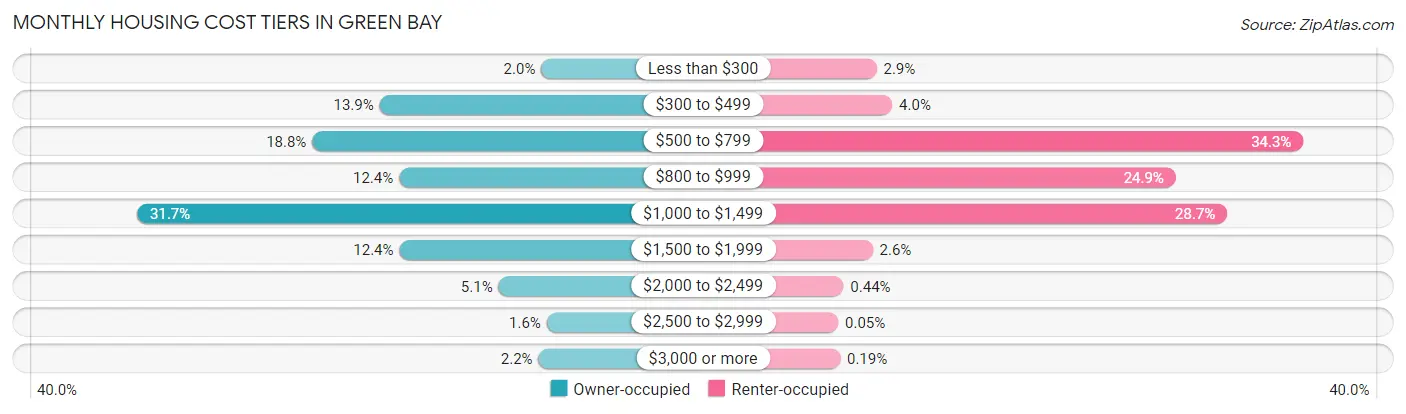
| Monthly Cost | Owner-occupied | Renter-occupied |
| Less than $300 | 480 (1.9%) | 554 (2.9%) |
| $300 to $499 | 3,417 (13.9%) | 775 (4.0%) |
| $500 to $799 | 4,639 (18.8%) | 6,602 (34.3%) |
| $800 to $999 | 3,061 (12.4%) | 4,795 (24.9%) |
| $1,000 to $1,499 | 7,820 (31.7%) | 5,524 (28.7%) |
| $1,500 to $1,999 | 3,057 (12.4%) | 499 (2.6%) |
| $2,000 to $2,499 | 1,258 (5.1%) | 84 (0.4%) |
| $2,500 to $2,999 | 381 (1.5%) | 10 (0.1%) |
| $3,000 or more | 533 (2.2%) | 37 (0.2%) |
| Total | 24,646 (100.0%) | 19,246 (100.0%) |
Physical Housing Characteristics in Green Bay
Housing Structures in Green Bay
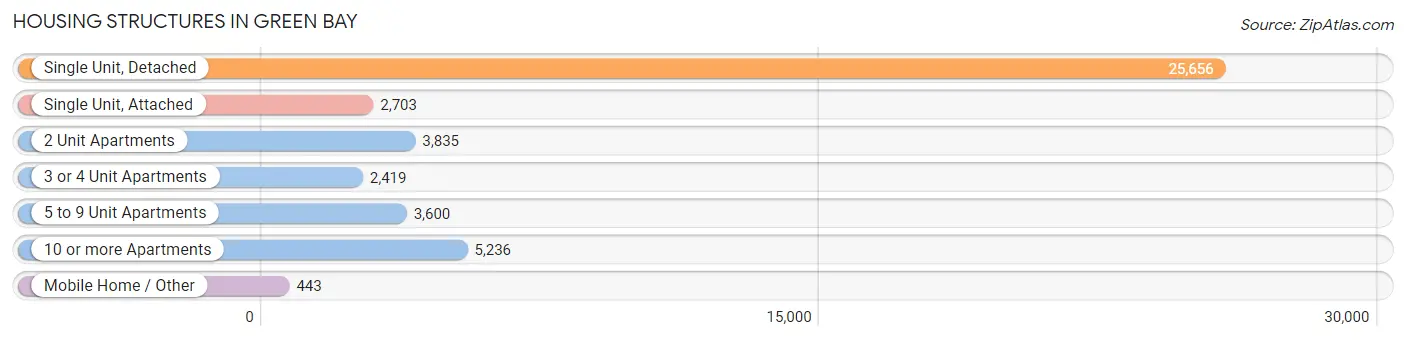
| Structure Type | # Housing Units | % Housing Units |
| Single Unit, Detached | 25,656 | 58.5% |
| Single Unit, Attached | 2,703 | 6.2% |
| 2 Unit Apartments | 3,835 | 8.7% |
| 3 or 4 Unit Apartments | 2,419 | 5.5% |
| 5 to 9 Unit Apartments | 3,600 | 8.2% |
| 10 or more Apartments | 5,236 | 11.9% |
| Mobile Home / Other | 443 | 1.0% |
| Total | 43,892 | 100.0% |
Housing Structures by Occupancy in Green Bay
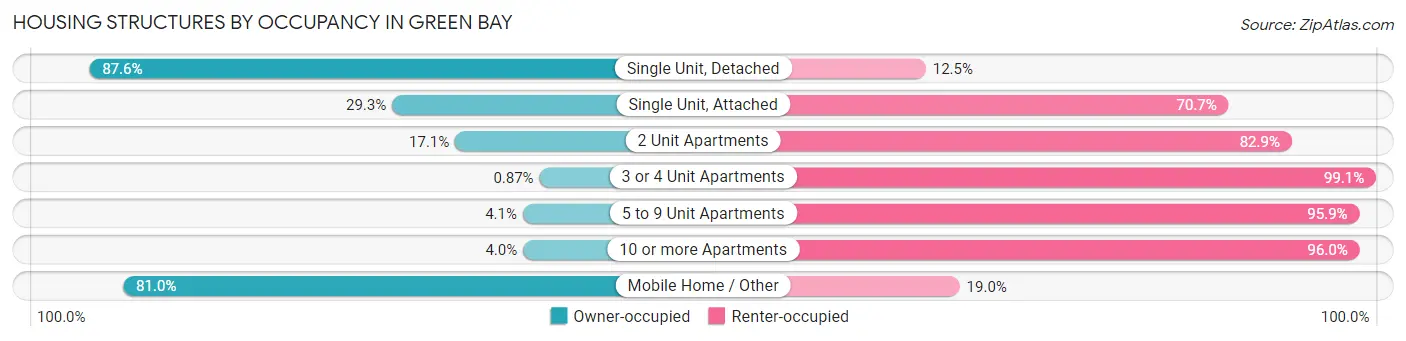
| Structure Type | Owner-occupied | Renter-occupied |
| Single Unit, Detached | 22,461 (87.5%) | 3,195 (12.4%) |
| Single Unit, Attached | 791 (29.3%) | 1,912 (70.7%) |
| 2 Unit Apartments | 656 (17.1%) | 3,179 (82.9%) |
| 3 or 4 Unit Apartments | 21 (0.9%) | 2,398 (99.1%) |
| 5 to 9 Unit Apartments | 147 (4.1%) | 3,453 (95.9%) |
| 10 or more Apartments | 211 (4.0%) | 5,025 (96.0%) |
| Mobile Home / Other | 359 (81.0%) | 84 (19.0%) |
| Total | 24,646 (56.1%) | 19,246 (43.9%) |
Housing Structures by Number of Rooms in Green Bay
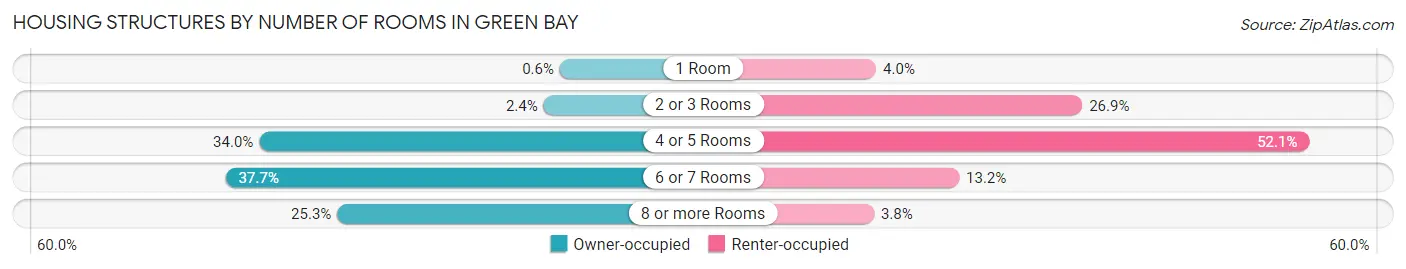
| Number of Rooms | Owner-occupied | Renter-occupied |
| 1 Room | 149 (0.6%) | 773 (4.0%) |
| 2 or 3 Rooms | 595 (2.4%) | 5,175 (26.9%) |
| 4 or 5 Rooms | 8,372 (34.0%) | 10,024 (52.1%) |
| 6 or 7 Rooms | 9,292 (37.7%) | 2,547 (13.2%) |
| 8 or more Rooms | 6,238 (25.3%) | 727 (3.8%) |
| Total | 24,646 (100.0%) | 19,246 (100.0%) |
Housing Structure by Heating Type in Green Bay
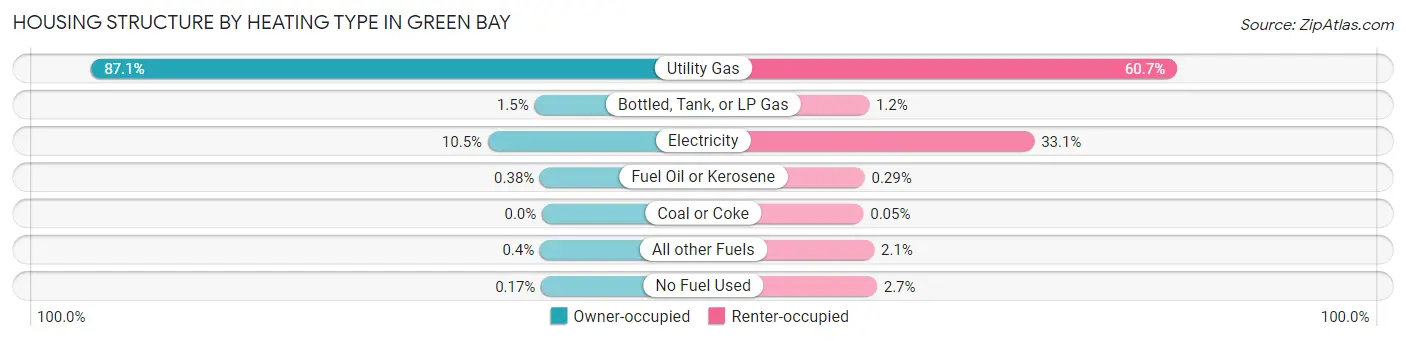
| Heating Type | Owner-occupied | Renter-occupied |
| Utility Gas | 21,471 (87.1%) | 11,674 (60.7%) |
| Bottled, Tank, or LP Gas | 360 (1.5%) | 221 (1.1%) |
| Electricity | 2,580 (10.5%) | 6,365 (33.1%) |
| Fuel Oil or Kerosene | 94 (0.4%) | 56 (0.3%) |
| Coal or Coke | 0 (0.0%) | 10 (0.1%) |
| All other Fuels | 98 (0.4%) | 410 (2.1%) |
| No Fuel Used | 43 (0.2%) | 510 (2.6%) |
| Total | 24,646 (100.0%) | 19,246 (100.0%) |
Household Vehicle Usage in Green Bay
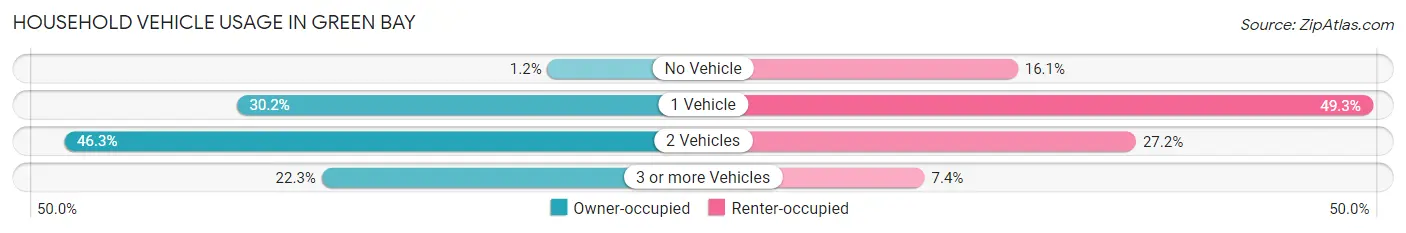
| Vehicles per Household | Owner-occupied | Renter-occupied |
| No Vehicle | 293 (1.2%) | 3,106 (16.1%) |
| 1 Vehicle | 7,448 (30.2%) | 9,479 (49.2%) |
| 2 Vehicles | 11,417 (46.3%) | 5,229 (27.2%) |
| 3 or more Vehicles | 5,488 (22.3%) | 1,432 (7.4%) |
| Total | 24,646 (100.0%) | 19,246 (100.0%) |
Real Estate & Mortgages in Green Bay
Real Estate and Mortgage Overview in Green Bay
| Characteristic | Without Mortgage | With Mortgage |
| Housing Units | 8,404 | 16,242 |
| Median Property Value | $168,600 | $174,500 |
| Median Household Income | $63,094 | $2,261 |
| Monthly Housing Costs | $526 | $532 |
| Real Estate Taxes | $2,847 | $210 |
Property Value by Mortgage Status in Green Bay
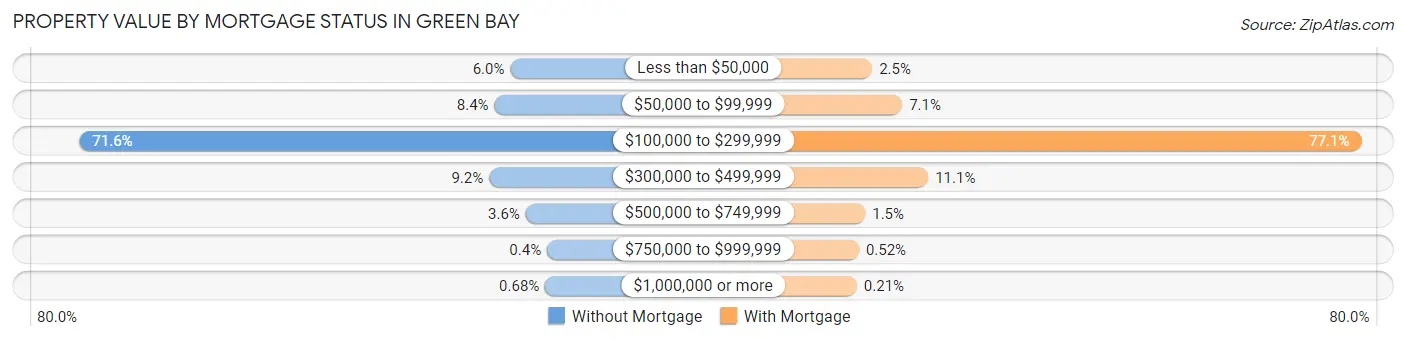
| Property Value | Without Mortgage | With Mortgage |
| Less than $50,000 | 503 (6.0%) | 412 (2.5%) |
| $50,000 to $99,999 | 707 (8.4%) | 1,155 (7.1%) |
| $100,000 to $299,999 | 6,021 (71.6%) | 12,516 (77.1%) |
| $300,000 to $499,999 | 776 (9.2%) | 1,800 (11.1%) |
| $500,000 to $749,999 | 306 (3.6%) | 241 (1.5%) |
| $750,000 to $999,999 | 34 (0.4%) | 84 (0.5%) |
| $1,000,000 or more | 57 (0.7%) | 34 (0.2%) |
| Total | 8,404 (100.0%) | 16,242 (100.0%) |
Household Income by Mortgage Status in Green Bay
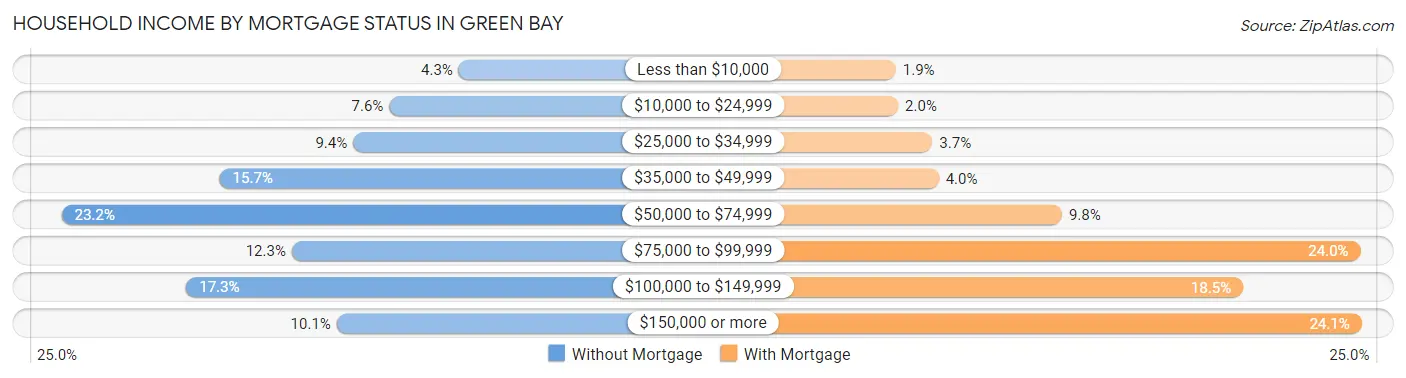
| Household Income | Without Mortgage | With Mortgage |
| Less than $10,000 | 364 (4.3%) | 312 (1.9%) |
| $10,000 to $24,999 | 642 (7.6%) | 329 (2.0%) |
| $25,000 to $34,999 | 787 (9.4%) | 595 (3.7%) |
| $35,000 to $49,999 | 1,320 (15.7%) | 643 (4.0%) |
| $50,000 to $74,999 | 1,953 (23.2%) | 1,597 (9.8%) |
| $75,000 to $99,999 | 1,032 (12.3%) | 3,905 (24.0%) |
| $100,000 to $149,999 | 1,454 (17.3%) | 2,997 (18.4%) |
| $150,000 or more | 852 (10.1%) | 3,915 (24.1%) |
| Total | 8,404 (100.0%) | 16,242 (100.0%) |
Property Value to Household Income Ratio in Green Bay
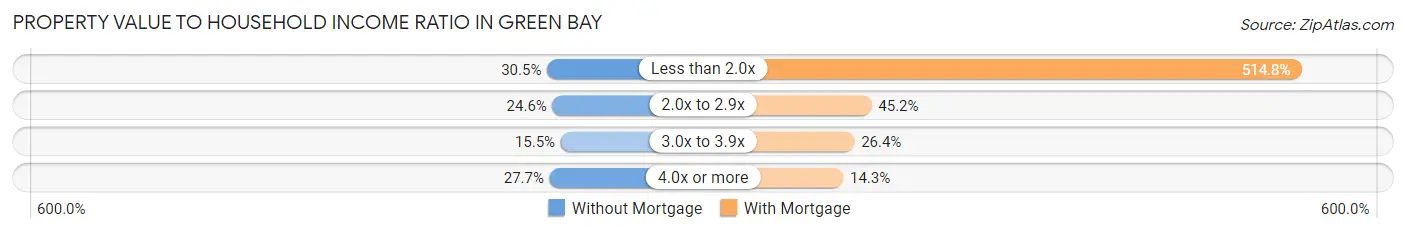
| Value-to-Income Ratio | Without Mortgage | With Mortgage |
| Less than 2.0x | 2,562 (30.5%) | 83,609 (514.8%) |
| 2.0x to 2.9x | 2,069 (24.6%) | 7,335 (45.2%) |
| 3.0x to 3.9x | 1,306 (15.5%) | 4,294 (26.4%) |
| 4.0x or more | 2,329 (27.7%) | 2,323 (14.3%) |
| Total | 8,404 (100.0%) | 16,242 (100.0%) |
Real Estate Taxes by Mortgage Status in Green Bay
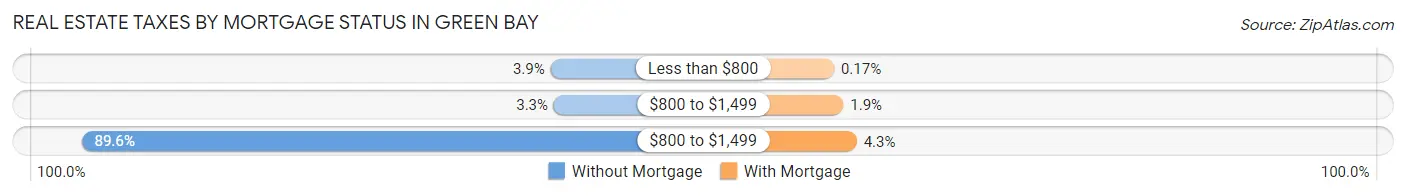
| Property Taxes | Without Mortgage | With Mortgage |
| Less than $800 | 331 (3.9%) | 28 (0.2%) |
| $800 to $1,499 | 280 (3.3%) | 306 (1.9%) |
| $800 to $1,499 | 7,529 (89.6%) | 701 (4.3%) |
| Total | 8,404 (100.0%) | 16,242 (100.0%) |
Health & Disability in Green Bay
Health Insurance Coverage by Age in Green Bay
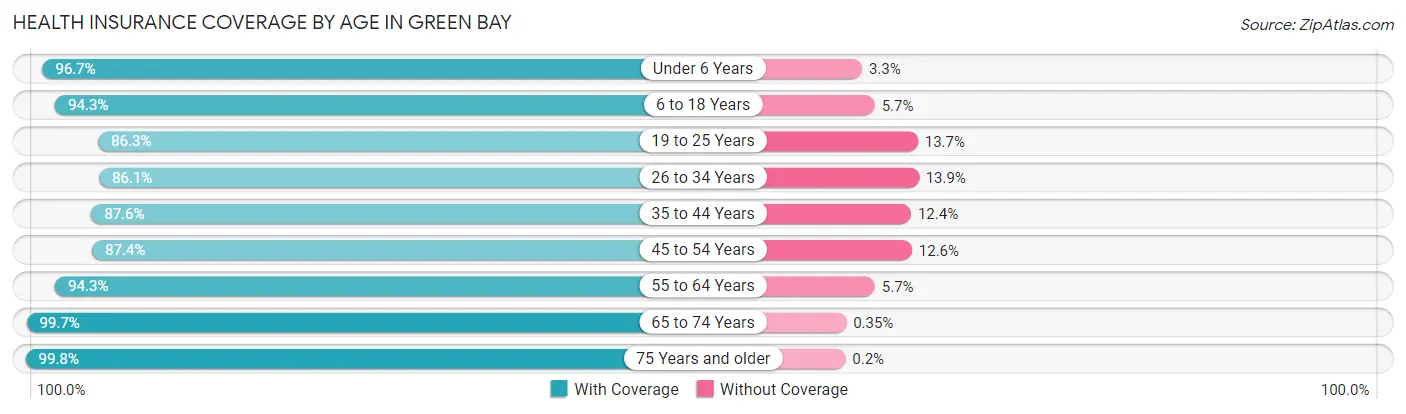
| Age Bracket | With Coverage | Without Coverage |
| Under 6 Years | 8,441 (96.7%) | 288 (3.3%) |
| 6 to 18 Years | 17,509 (94.3%) | 1,054 (5.7%) |
| 19 to 25 Years | 9,371 (86.3%) | 1,488 (13.7%) |
| 26 to 34 Years | 11,940 (86.1%) | 1,923 (13.9%) |
| 35 to 44 Years | 11,969 (87.6%) | 1,701 (12.4%) |
| 45 to 54 Years | 11,222 (87.4%) | 1,618 (12.6%) |
| 55 to 64 Years | 12,079 (94.3%) | 730 (5.7%) |
| 65 to 74 Years | 8,505 (99.7%) | 30 (0.4%) |
| 75 Years and older | 5,911 (99.8%) | 12 (0.2%) |
| Total | 96,947 (91.6%) | 8,844 (8.4%) |
Health Insurance Coverage by Citizenship Status in Green Bay
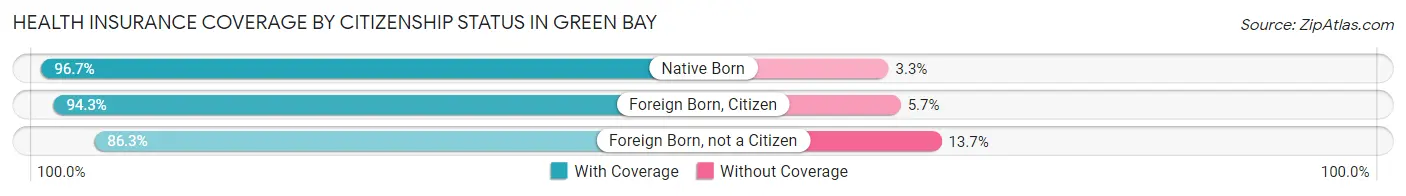
| Citizenship Status | With Coverage | Without Coverage |
| Native Born | 8,441 (96.7%) | 288 (3.3%) |
| Foreign Born, Citizen | 17,509 (94.3%) | 1,054 (5.7%) |
| Foreign Born, not a Citizen | 9,371 (86.3%) | 1,488 (13.7%) |
Health Insurance Coverage by Household Income in Green Bay
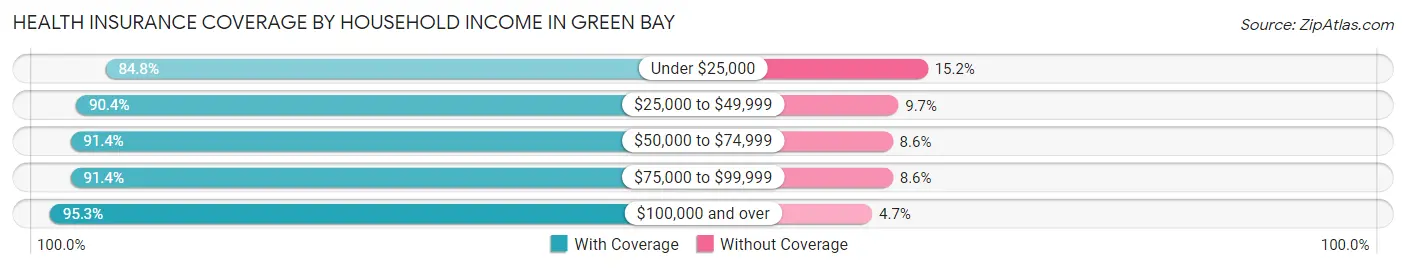
| Household Income | With Coverage | Without Coverage |
| Under $25,000 | 11,672 (84.8%) | 2,086 (15.2%) |
| $25,000 to $49,999 | 16,853 (90.3%) | 1,800 (9.7%) |
| $50,000 to $74,999 | 20,115 (91.4%) | 1,890 (8.6%) |
| $75,000 to $99,999 | 15,918 (91.4%) | 1,502 (8.6%) |
| $100,000 and over | 30,119 (95.3%) | 1,499 (4.7%) |
Public vs Private Health Insurance Coverage by Age in Green Bay
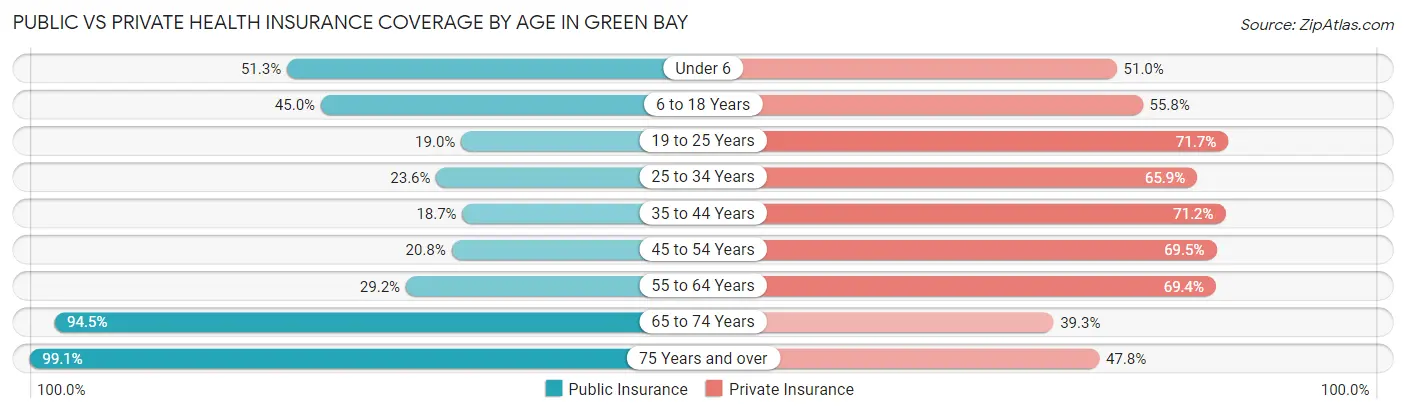
| Age Bracket | Public Insurance | Private Insurance |
| Under 6 | 4,478 (51.3%) | 4,453 (51.0%) |
| 6 to 18 Years | 8,353 (45.0%) | 10,363 (55.8%) |
| 19 to 25 Years | 2,060 (19.0%) | 7,785 (71.7%) |
| 25 to 34 Years | 3,268 (23.6%) | 9,141 (65.9%) |
| 35 to 44 Years | 2,561 (18.7%) | 9,732 (71.2%) |
| 45 to 54 Years | 2,664 (20.7%) | 8,922 (69.5%) |
| 55 to 64 Years | 3,743 (29.2%) | 8,891 (69.4%) |
| 65 to 74 Years | 8,068 (94.5%) | 3,350 (39.3%) |
| 75 Years and over | 5,870 (99.1%) | 2,828 (47.7%) |
| Total | 41,065 (38.8%) | 65,465 (61.9%) |
Disability Status by Sex by Age in Green Bay
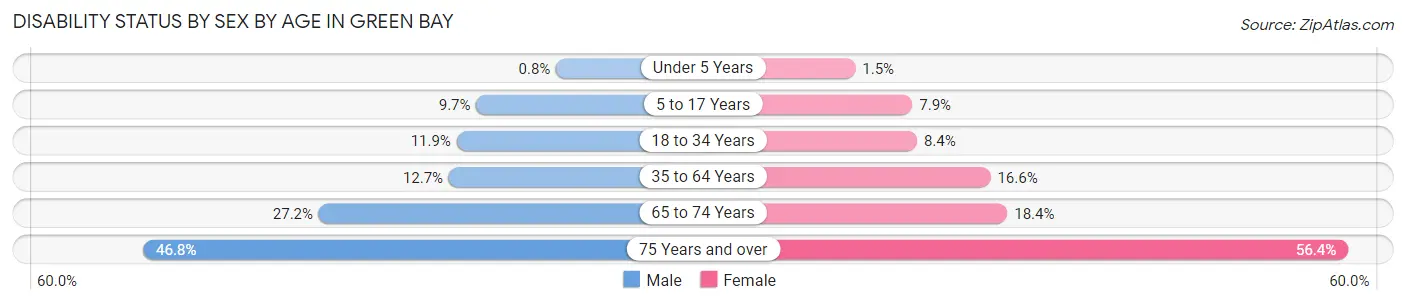
| Age Bracket | Male | Female |
| Under 5 Years | 31 (0.8%) | 53 (1.5%) |
| 5 to 17 Years | 916 (9.7%) | 685 (7.9%) |
| 18 to 34 Years | 1,584 (11.9%) | 1,098 (8.4%) |
| 35 to 64 Years | 2,548 (12.7%) | 3,200 (16.6%) |
| 65 to 74 Years | 1,009 (27.2%) | 890 (18.4%) |
| 75 Years and over | 1,038 (46.8%) | 2,089 (56.4%) |
Disability Class by Sex by Age in Green Bay
Disability Class: Hearing Difficulty
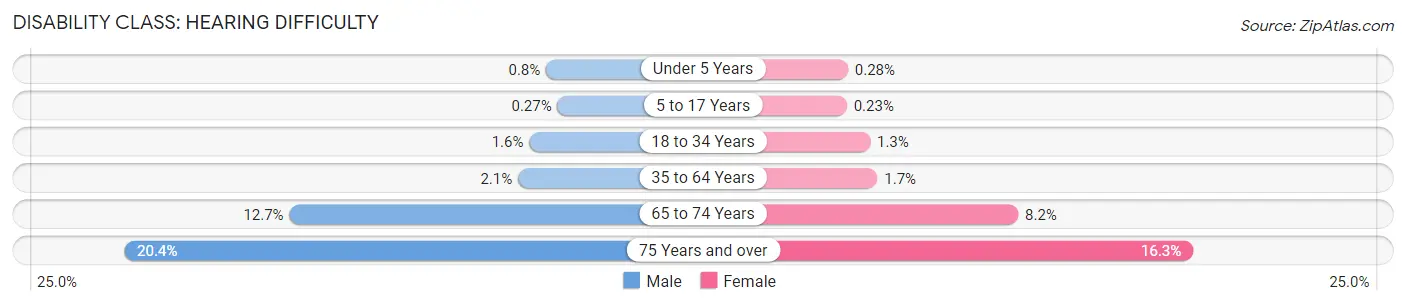
| Age Bracket | Male | Female |
| Under 5 Years | 31 (0.8%) | 10 (0.3%) |
| 5 to 17 Years | 26 (0.3%) | 20 (0.2%) |
| 18 to 34 Years | 211 (1.6%) | 172 (1.3%) |
| 35 to 64 Years | 420 (2.1%) | 318 (1.7%) |
| 65 to 74 Years | 471 (12.7%) | 395 (8.2%) |
| 75 Years and over | 452 (20.4%) | 604 (16.3%) |
Disability Class: Vision Difficulty
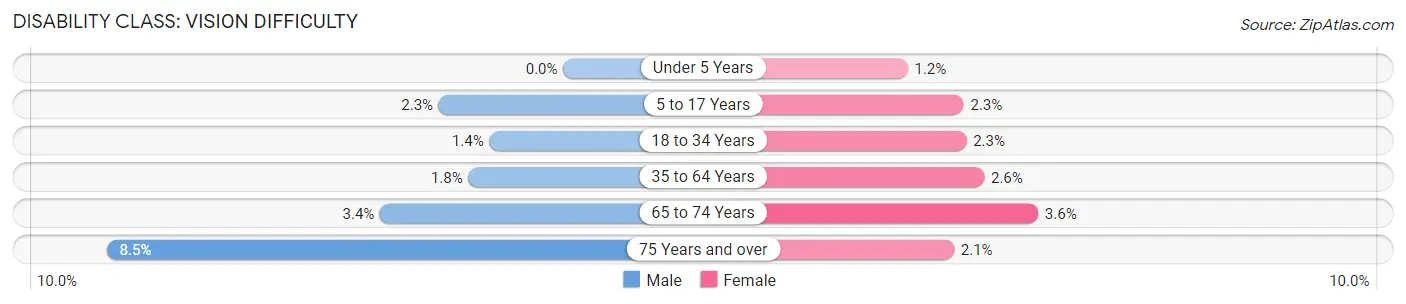
| Age Bracket | Male | Female |
| Under 5 Years | 0 (0.0%) | 43 (1.2%) |
| 5 to 17 Years | 218 (2.3%) | 197 (2.3%) |
| 18 to 34 Years | 183 (1.4%) | 303 (2.3%) |
| 35 to 64 Years | 352 (1.8%) | 511 (2.6%) |
| 65 to 74 Years | 126 (3.4%) | 176 (3.6%) |
| 75 Years and over | 188 (8.5%) | 77 (2.1%) |
Disability Class: Cognitive Difficulty
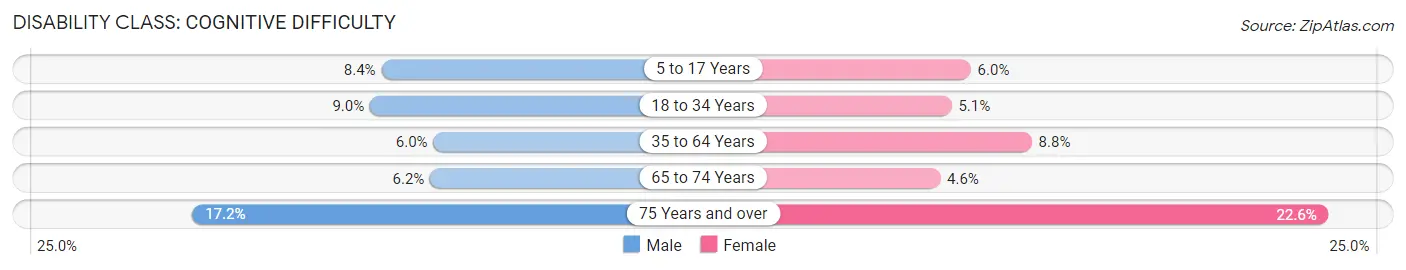
| Age Bracket | Male | Female |
| 5 to 17 Years | 798 (8.4%) | 521 (6.0%) |
| 18 to 34 Years | 1,195 (9.0%) | 668 (5.1%) |
| 35 to 64 Years | 1,205 (6.0%) | 1,702 (8.8%) |
| 65 to 74 Years | 229 (6.2%) | 220 (4.6%) |
| 75 Years and over | 382 (17.2%) | 837 (22.6%) |
Disability Class: Ambulatory Difficulty
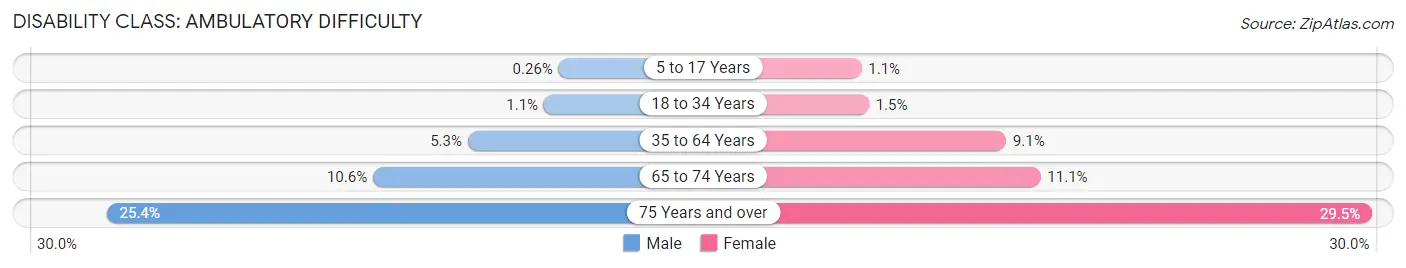
| Age Bracket | Male | Female |
| 5 to 17 Years | 25 (0.3%) | 95 (1.1%) |
| 18 to 34 Years | 144 (1.1%) | 197 (1.5%) |
| 35 to 64 Years | 1,064 (5.3%) | 1,766 (9.1%) |
| 65 to 74 Years | 393 (10.6%) | 534 (11.1%) |
| 75 Years and over | 564 (25.4%) | 1,094 (29.5%) |
Disability Class: Self-Care Difficulty
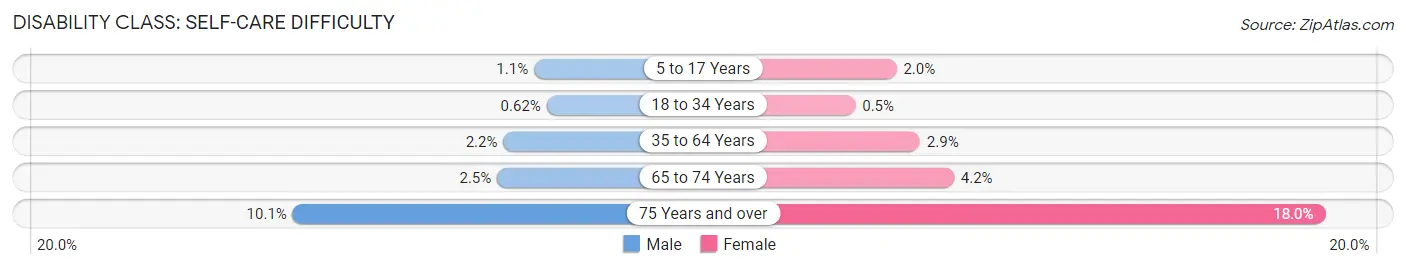
| Age Bracket | Male | Female |
| 5 to 17 Years | 103 (1.1%) | 177 (2.0%) |
| 18 to 34 Years | 83 (0.6%) | 65 (0.5%) |
| 35 to 64 Years | 446 (2.2%) | 561 (2.9%) |
| 65 to 74 Years | 91 (2.5%) | 201 (4.2%) |
| 75 Years and over | 223 (10.1%) | 665 (17.9%) |
Technology Access in Green Bay
Computing Device Access in Green Bay
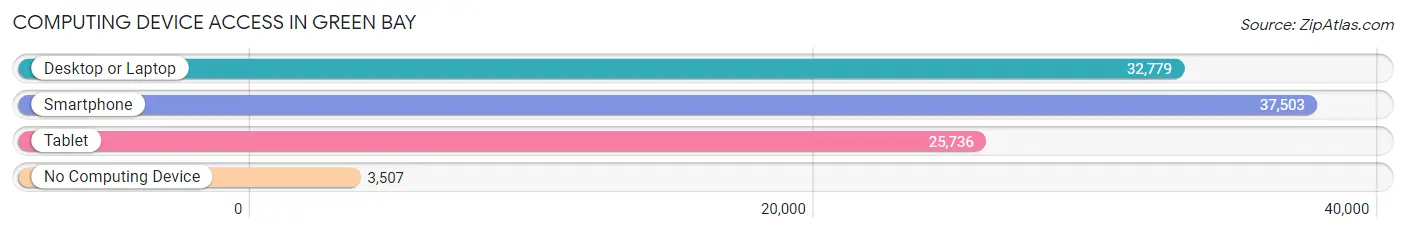
| Device Type | # Households | % Households |
| Desktop or Laptop | 32,779 | 74.7% |
| Smartphone | 37,503 | 85.4% |
| Tablet | 25,736 | 58.6% |
| No Computing Device | 3,507 | 8.0% |
| Total | 43,892 | 100.0% |
Internet Access in Green Bay
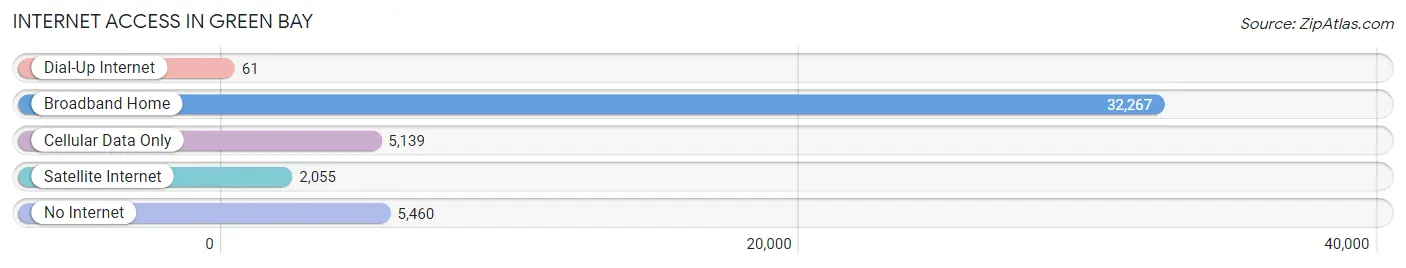
| Internet Type | # Households | % Households |
| Dial-Up Internet | 61 | 0.1% |
| Broadband Home | 32,267 | 73.5% |
| Cellular Data Only | 5,139 | 11.7% |
| Satellite Internet | 2,055 | 4.7% |
| No Internet | 5,460 | 12.4% |
| Total | 43,892 | 100.0% |
Green Bay Summary
Green Bay, Wisconsin is a city located in the northeastern part of the state, in Brown County. It is the third-largest city in Wisconsin, with a population of 104,057 as of the 2019 census. The city is situated on the Fox River, which flows into Lake Michigan. It is the county seat of Brown County and is part of the Green Bay Metropolitan Statistical Area.
History
Green Bay was first settled by French fur traders in the late 17th century. The area was part of the French colony of New France until 1763, when it was ceded to the British after the French and Indian War. The British maintained control of the area until the War of 1812, when it was ceded to the United States. The area was part of the Michigan Territory until 1836, when it became part of the Wisconsin Territory.
Green Bay was incorporated as a city in 1854. The city grew rapidly in the late 19th century, due to its location on the Fox River and its proximity to Lake Michigan. The city was a major port for the lumber industry, and it was also a major center for the paper industry.
Geography
Green Bay is located in northeastern Wisconsin, in Brown County. It is situated on the Fox River, which flows into Lake Michigan. The city is located at the mouth of the Fox River, and is surrounded by the towns of Allouez, Ashwaubenon, De Pere, Howard, and Suamico. The city covers an area of 55.2 square miles, and has a population density of 1,876 people per square mile.
Climate
Green Bay has a humid continental climate, with cold winters and warm summers. The average high temperature in January is 24°F, and the average low temperature is 11°F. The average high temperature in July is 79°F, and the average low temperature is 59°F. The city receives an average of 33 inches of precipitation per year.
Economy
Green Bay’s economy is largely based on manufacturing, healthcare, and tourism. The city is home to several major employers, including the Green Bay Packers, Schneider National, and the University of Wisconsin-Green Bay. The city is also home to several major healthcare providers, including Aurora BayCare Medical Center and Bellin Health.
Tourism is also an important part of the city’s economy. The city is home to several attractions, including the National Railroad Museum, the Green Bay Botanical Garden, and the Bay Beach Amusement Park.
Demographics
As of the 2019 census, Green Bay had a population of 104,057. The racial makeup of the city was 79.2% White, 8.3% African American, 0.7% Native American, 3.2% Asian, and 8.6% from other races. The median household income was $48,945, and the median family income was $60,945. The per capita income was $25,945.
Green Bay is home to several religious denominations, including Roman Catholic, Lutheran, Methodist, and Presbyterian. The city is also home to several higher education institutions, including the University of Wisconsin-Green Bay, St. Norbert College, and Bellin College of Nursing.
Common Questions
What is Per Capita Income in Green Bay?
Per Capita income in Green Bay is $32,001.
What is the Median Family Income in Green Bay?
Median Family Income in Green Bay is $75,189.
What is the Median Household income in Green Bay?
Median Household Income in Green Bay is $59,174.
What is Income or Wage Gap in Green Bay?
Income or Wage Gap in Green Bay is 29.3%.
Women in Green Bay earn 70.7 cents for every dollar earned by a man.
What is Family Income Deficit in Green Bay?
Family Income Deficit in Green Bay is $9,238.
Families that are below poverty line in Green Bay earn $9,238 less on average than the poverty threshold level.
What is Inequality or Gini Index in Green Bay?
Inequality or Gini Index in Green Bay is 0.43.
What is the Total Population of Green Bay?
Total Population of Green Bay is 106,846.
What is the Total Male Population of Green Bay?
Total Male Population of Green Bay is 53,251.
What is the Total Female Population of Green Bay?
Total Female Population of Green Bay is 53,595.
What is the Ratio of Males per 100 Females in Green Bay?
There are 99.36 Males per 100 Females in Green Bay.
What is the Ratio of Females per 100 Males in Green Bay?
There are 100.65 Females per 100 Males in Green Bay.
What is the Median Population Age in Green Bay?
Median Population Age in Green Bay is 35.6 Years.
What is the Average Family Size in Green Bay
Average Family Size in Green Bay is 3.1 People.
What is the Average Household Size in Green Bay
Average Household Size in Green Bay is 2.4 People.
How Large is the Labor Force in Green Bay?
There are 56,834 People in the Labor Forcein in Green Bay.
What is the Percentage of People in the Labor Force in Green Bay?
67.5% of People are in the Labor Force in Green Bay.
What is the Unemployment Rate in Green Bay?
Unemployment Rate in Green Bay is 4.1%.