Edina, MN Map & Demographics
Edina Map
Edina Overview
$84,049
PER CAPITA INCOME
$181,235
AVG FAMILY INCOME
$125,506
AVG HOUSEHOLD INCOME
43.3%
WAGE / INCOME GAP [ % ]
56.7¢/ $1
WAGE / INCOME GAP [ $ ]
0.52
INEQUALITY / GINI INDEX
53,037
TOTAL POPULATION
25,299
MALE POPULATION
27,738
FEMALE POPULATION
91.21
MALES / 100 FEMALES
109.64
FEMALES / 100 MALES
44.8
MEDIAN AGE
3.0
AVG FAMILY SIZE
2.3
AVG HOUSEHOLD SIZE
27,225
LABOR FORCE [ PEOPLE ]
63.9%
PERCENT IN LABOR FORCE
3.7%
UNEMPLOYMENT RATE
Income in Edina
Income Overview in Edina
Per Capita Income in Edina is $84,049, while median incomes of families and households are $181,235 and $125,506 respectively.
| Characteristic | Number | Measure |
| Per Capita Income | 53,037 | $84,049 |
| Median Family Income | 14,469 | $181,235 |
| Mean Family Income | 14,469 | $257,428 |
| Median Household Income | 22,609 | $125,506 |
| Mean Household Income | 22,609 | $194,947 |
| Income Deficit | 14,469 | $0 |
| Wage / Income Gap (%) | 53,037 | 43.34% |
| Wage / Income Gap ($) | 53,037 | 56.66¢ per $1 |
| Gini / Inequality Index | 53,037 | 0.52 |
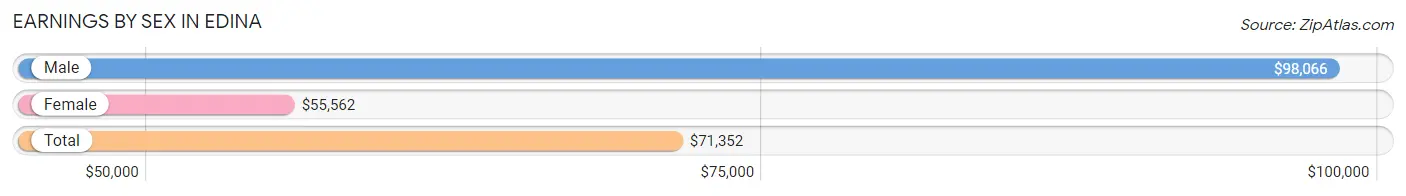
Earnings by Sex in Edina
Average Earnings in Edina are $71,352, $98,066 for men and $55,562 for women, a difference of 43.3%.
| Sex | Number | Average Earnings |
| Male | 14,873 (51.6%) | $98,066 |
| Female | 13,932 (48.4%) | $55,562 |
| Total | 28,805 (100.0%) | $71,352 |
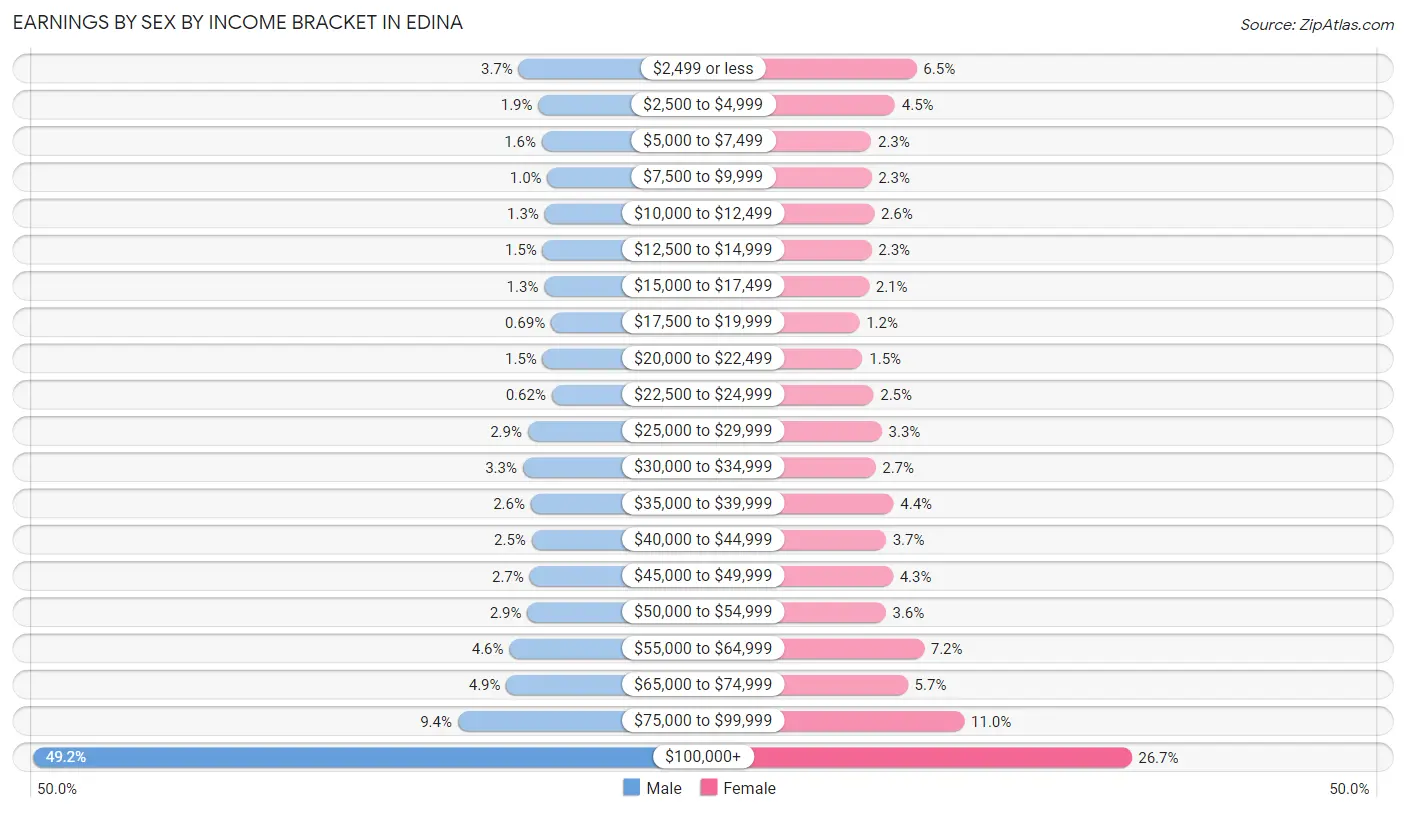
Earnings by Sex by Income Bracket in Edina
The most common earnings brackets in Edina are $100,000+ for men (7,322 | 49.2%) and $100,000+ for women (3,713 | 26.7%).
| Income | Male | Female |
| $2,499 or less | 554 (3.7%) | 909 (6.5%) |
| $2,500 to $4,999 | 278 (1.9%) | 627 (4.5%) |
| $5,000 to $7,499 | 231 (1.5%) | 316 (2.3%) |
| $7,500 to $9,999 | 152 (1.0%) | 319 (2.3%) |
| $10,000 to $12,499 | 191 (1.3%) | 355 (2.5%) |
| $12,500 to $14,999 | 218 (1.5%) | 320 (2.3%) |
| $15,000 to $17,499 | 197 (1.3%) | 287 (2.1%) |
| $17,500 to $19,999 | 103 (0.7%) | 161 (1.2%) |
| $20,000 to $22,499 | 219 (1.5%) | 203 (1.5%) |
| $22,500 to $24,999 | 92 (0.6%) | 346 (2.5%) |
| $25,000 to $29,999 | 425 (2.9%) | 454 (3.3%) |
| $30,000 to $34,999 | 496 (3.3%) | 372 (2.7%) |
| $35,000 to $39,999 | 383 (2.6%) | 608 (4.4%) |
| $40,000 to $44,999 | 372 (2.5%) | 508 (3.6%) |
| $45,000 to $49,999 | 400 (2.7%) | 599 (4.3%) |
| $50,000 to $54,999 | 431 (2.9%) | 506 (3.6%) |
| $55,000 to $64,999 | 683 (4.6%) | 1,004 (7.2%) |
| $65,000 to $74,999 | 725 (4.9%) | 794 (5.7%) |
| $75,000 to $99,999 | 1,401 (9.4%) | 1,531 (11.0%) |
| $100,000+ | 7,322 (49.2%) | 3,713 (26.7%) |
| Total | 14,873 (100.0%) | 13,932 (100.0%) |
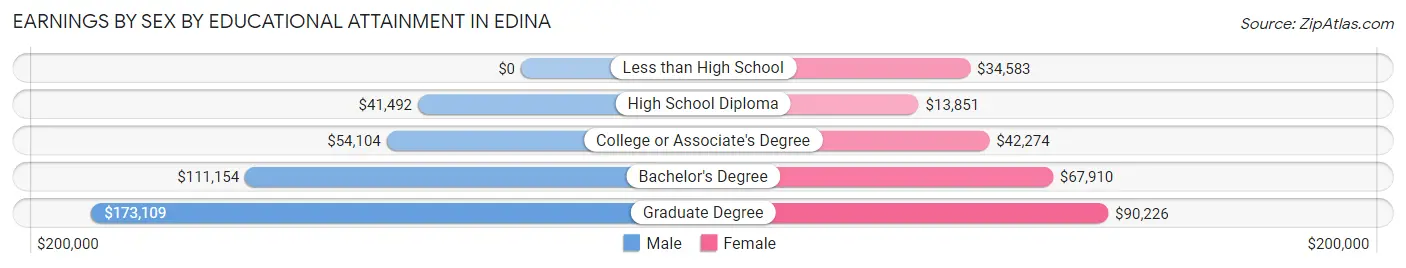
Earnings by Sex by Educational Attainment in Edina
Average earnings in Edina are $113,607 for men and $59,270 for women, a difference of 47.8%. Men with an educational attainment of graduate degree enjoy the highest average annual earnings of $173,109, while those with high school diploma education earn the least with $41,492. Women with an educational attainment of graduate degree earn the most with the average annual earnings of $90,226, while those with high school diploma education have the smallest earnings of $13,851.
| Educational Attainment | Male Income | Female Income |
| Less than High School | - | - |
| High School Diploma | $41,492 | $13,851 |
| College or Associate's Degree | $54,104 | $42,274 |
| Bachelor's Degree | $111,154 | $67,910 |
| Graduate Degree | $173,109 | $90,226 |
| Total | $113,607 | $59,270 |
Family Income in Edina
Family Income Brackets in Edina
According to the Edina family income data, there are 6,757 families falling into the $200,000+ income range, which is the most common income bracket and makes up 46.7% of all families. Conversely, the $10,000 to $14,999 income bracket is the least frequent group with only 72 families (0.5%) belonging to this category.
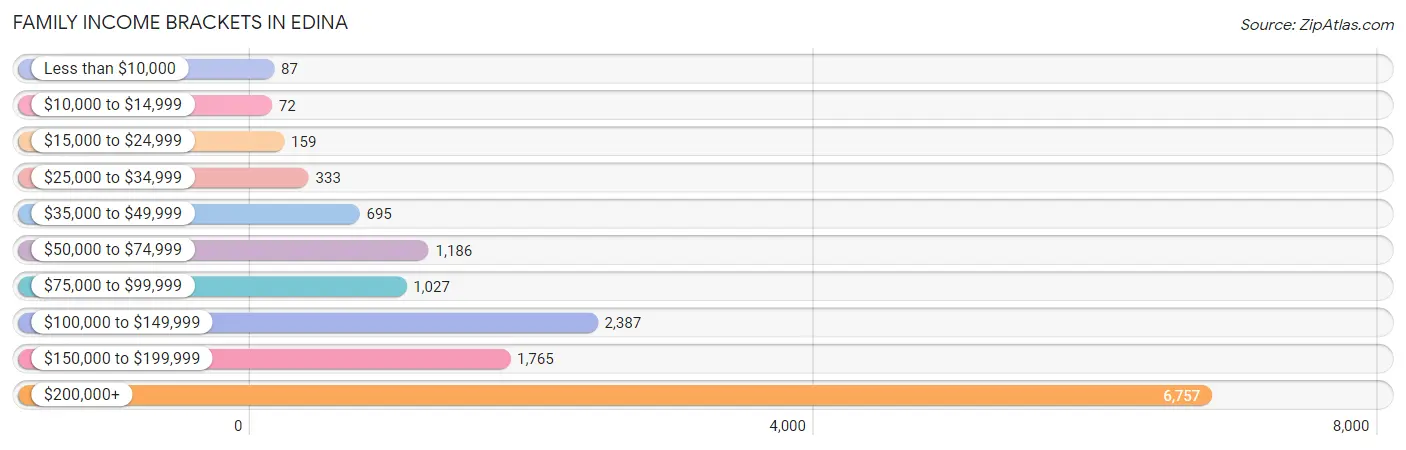
| Income Bracket | # Families | % Families |
| Less than $10,000 | 87 | 0.6% |
| $10,000 to $14,999 | 72 | 0.5% |
| $15,000 to $24,999 | 159 | 1.1% |
| $25,000 to $34,999 | 333 | 2.3% |
| $35,000 to $49,999 | 695 | 4.8% |
| $50,000 to $74,999 | 1,186 | 8.2% |
| $75,000 to $99,999 | 1,027 | 7.1% |
| $100,000 to $149,999 | 2,387 | 16.5% |
| $150,000 to $199,999 | 1,765 | 12.2% |
| $200,000+ | 6,757 | 46.7% |
Family Income by Famaliy Size in Edina
5-person families (1,301 | 9.0%) account for the highest median family income in Edina with $250,001 per family, while 2-person families (7,280 | 50.3%) have the highest median income of $65,334 per family member.
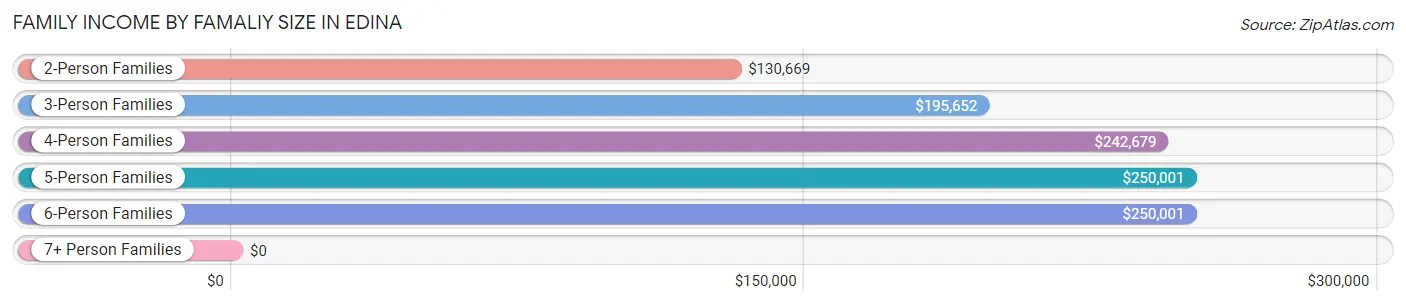
| Income Bracket | # Families | Median Income |
| 2-Person Families | 7,280 (50.3%) | $130,669 |
| 3-Person Families | 2,542 (17.6%) | $195,652 |
| 4-Person Families | 3,058 (21.1%) | $242,679 |
| 5-Person Families | 1,301 (9.0%) | $250,001 |
| 6-Person Families | 258 (1.8%) | $250,001 |
| 7+ Person Families | 30 (0.2%) | $0 |
| Total | 14,469 (100.0%) | $181,235 |
Family Income by Number of Earners in Edina
The median family income in Edina is $181,235, with families comprising 2 earners (7,044) having the highest median family income of $235,882, while families with no earners (1,889) have the lowest median family income of $79,814, accounting for 48.7% and 13.1% of families, respectively.
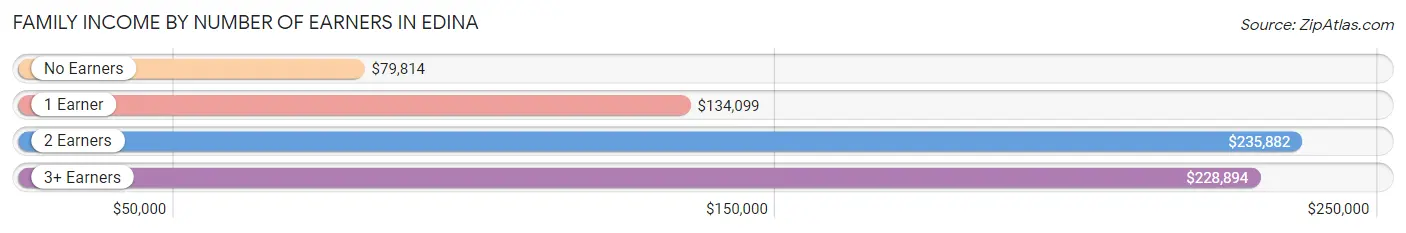
| Number of Earners | # Families | Median Income |
| No Earners | 1,889 (13.1%) | $79,814 |
| 1 Earner | 3,963 (27.4%) | $134,099 |
| 2 Earners | 7,044 (48.7%) | $235,882 |
| 3+ Earners | 1,573 (10.9%) | $228,894 |
| Total | 14,469 (100.0%) | $181,235 |
Household Income in Edina
Household Income Brackets in Edina
With 7,257 households falling in the category, the $200,000+ income range is the most frequent in Edina, accounting for 32.1% of all households. In contrast, only 317 households (1.4%) fall into the $10,000 to $14,999 income bracket, making it the least populous group.
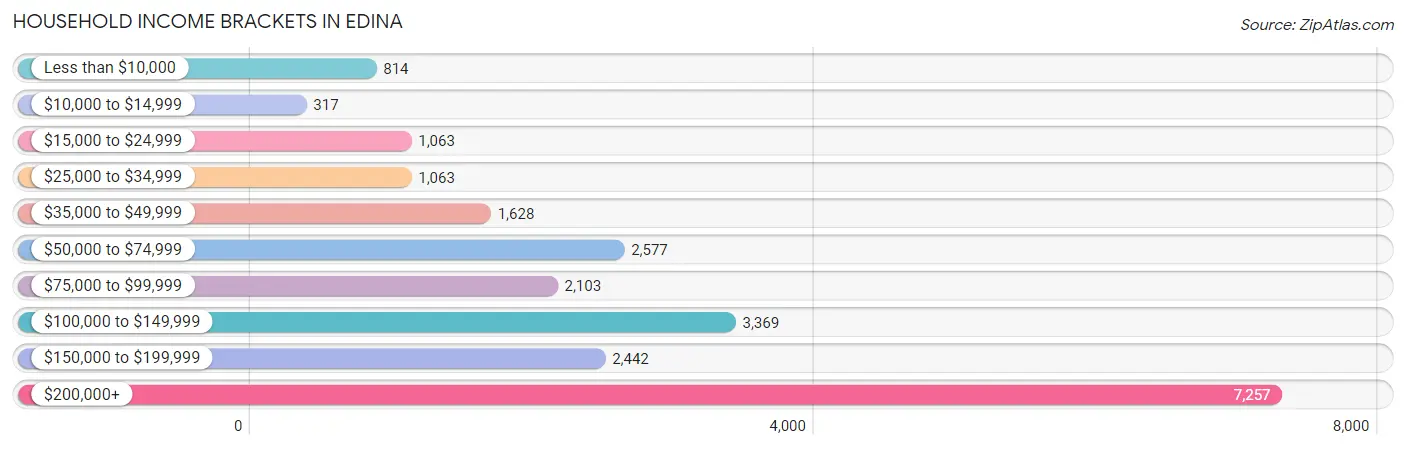
| Income Bracket | # Households | % Households |
| Less than $10,000 | 814 | 3.6% |
| $10,000 to $14,999 | 317 | 1.4% |
| $15,000 to $24,999 | 1,063 | 4.7% |
| $25,000 to $34,999 | 1,063 | 4.7% |
| $35,000 to $49,999 | 1,628 | 7.2% |
| $50,000 to $74,999 | 2,577 | 11.4% |
| $75,000 to $99,999 | 2,103 | 9.3% |
| $100,000 to $149,999 | 3,369 | 14.9% |
| $150,000 to $199,999 | 2,442 | 10.8% |
| $200,000+ | 7,257 | 32.1% |
Household Income by Householder Age in Edina
The median household income in Edina is $125,506, with the highest median household income of $192,583 found in the 45 to 64 years age bracket for the primary householder. A total of 8,141 households (36.0%) fall into this category. Meanwhile, the 15 to 24 years age bracket for the primary householder has the lowest median household income of $55,972, with 434 households (1.9%) in this group.
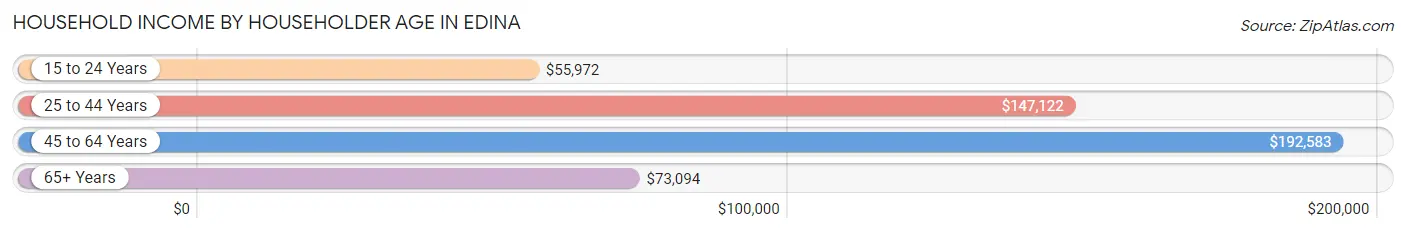
| Income Bracket | # Households | Median Income |
| 15 to 24 Years | 434 (1.9%) | $55,972 |
| 25 to 44 Years | 5,932 (26.2%) | $147,122 |
| 45 to 64 Years | 8,141 (36.0%) | $192,583 |
| 65+ Years | 8,102 (35.8%) | $73,094 |
| Total | 22,609 (100.0%) | $125,506 |
Poverty in Edina
Income Below Poverty by Sex and Age in Edina
With 4.2% poverty level for males and 5.4% for females among the residents of Edina, 15 year old males and 5 year old females are the most vulnerable to poverty, with 61 males (21.3%) and 59 females (19.7%) in their respective age groups living below the poverty level.
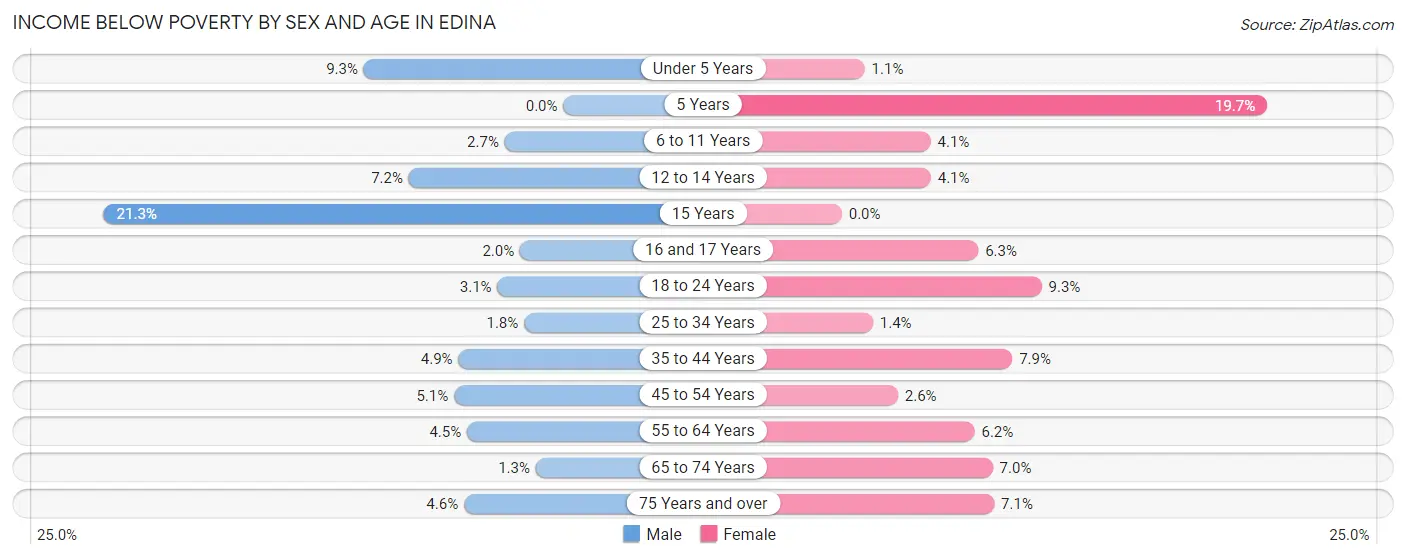
| Age Bracket | Male | Female |
| Under 5 Years | 132 (9.3%) | 16 (1.1%) |
| 5 Years | 0 (0.0%) | 59 (19.7%) |
| 6 to 11 Years | 59 (2.7%) | 77 (4.1%) |
| 12 to 14 Years | 88 (7.2%) | 37 (4.1%) |
| 15 Years | 61 (21.3%) | 0 (0.0%) |
| 16 and 17 Years | 15 (2.0%) | 39 (6.3%) |
| 18 to 24 Years | 50 (3.1%) | 113 (9.3%) |
| 25 to 34 Years | 47 (1.8%) | 37 (1.4%) |
| 35 to 44 Years | 156 (4.9%) | 295 (7.9%) |
| 45 to 54 Years | 155 (5.1%) | 90 (2.6%) |
| 55 to 64 Years | 168 (4.5%) | 242 (6.2%) |
| 65 to 74 Years | 33 (1.3%) | 243 (7.0%) |
| 75 Years and over | 99 (4.6%) | 251 (7.1%) |
| Total | 1,063 (4.2%) | 1,499 (5.4%) |
Income Above Poverty by Sex and Age in Edina
According to the poverty statistics in Edina, males aged 5 years and females aged 15 years are the age groups that are most secure financially, with 100.0% of males and 100.0% of females in these age groups living above the poverty line.
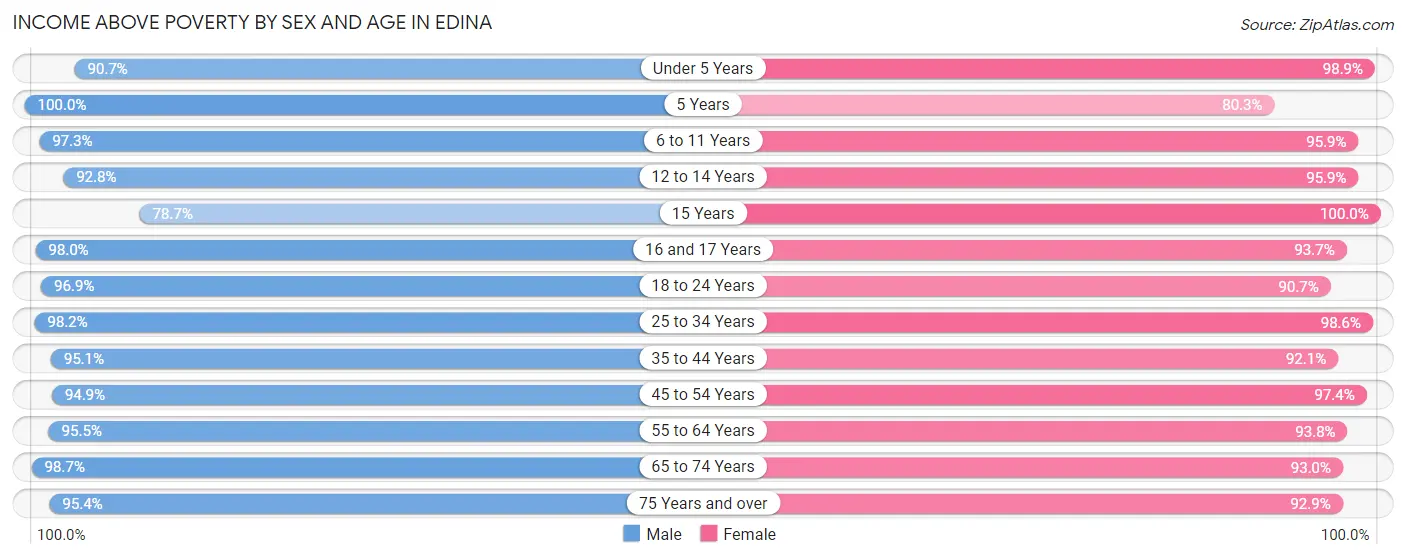
| Age Bracket | Male | Female |
| Under 5 Years | 1,294 (90.7%) | 1,490 (98.9%) |
| 5 Years | 314 (100.0%) | 240 (80.3%) |
| 6 to 11 Years | 2,112 (97.3%) | 1,790 (95.9%) |
| 12 to 14 Years | 1,140 (92.8%) | 858 (95.9%) |
| 15 Years | 225 (78.7%) | 389 (100.0%) |
| 16 and 17 Years | 731 (98.0%) | 577 (93.7%) |
| 18 to 24 Years | 1,583 (96.9%) | 1,106 (90.7%) |
| 25 to 34 Years | 2,539 (98.2%) | 2,539 (98.6%) |
| 35 to 44 Years | 3,049 (95.1%) | 3,436 (92.1%) |
| 45 to 54 Years | 2,901 (94.9%) | 3,370 (97.4%) |
| 55 to 64 Years | 3,591 (95.5%) | 3,685 (93.8%) |
| 65 to 74 Years | 2,540 (98.7%) | 3,229 (93.0%) |
| 75 Years and over | 2,047 (95.4%) | 3,300 (92.9%) |
| Total | 24,066 (95.8%) | 26,009 (94.6%) |
Income Below Poverty Among Married-Couple Families in Edina
The poverty statistics for married-couple families in Edina show that 2.1% or 263 of the total 12,577 families live below the poverty line. Families with 1 or 2 children have the highest poverty rate of 3.0%, comprising of 118 families. On the other hand, families with 5 or more children have the lowest poverty rate of 0.0%, which includes 0 families.
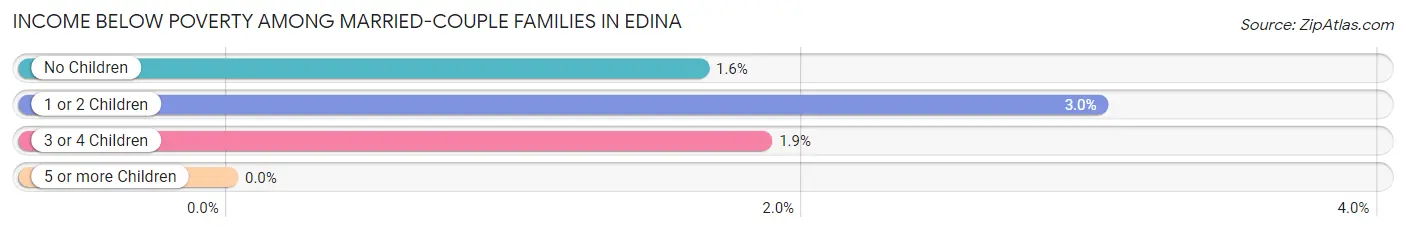
| Children | Above Poverty | Below Poverty |
| No Children | 7,258 (98.4%) | 121 (1.6%) |
| 1 or 2 Children | 3,775 (97.0%) | 118 (3.0%) |
| 3 or 4 Children | 1,265 (98.1%) | 24 (1.9%) |
| 5 or more Children | 16 (100.0%) | 0 (0.0%) |
| Total | 12,314 (97.9%) | 263 (2.1%) |
Income Below Poverty Among Single-Parent Households in Edina
According to the poverty data in Edina, 1.6% or 10 single-father households and 7.6% or 97 single-mother households are living below the poverty line. Among single-father households, those with 1 or 2 children have the highest poverty rate, with 10 households (3.1%) experiencing poverty. Likewise, among single-mother households, those with 1 or 2 children have the highest poverty rate, with 58 households (10.0%) falling below the poverty line.
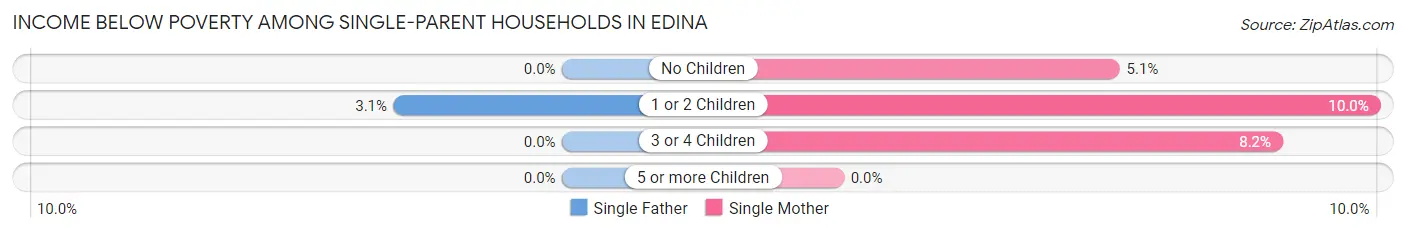
| Children | Single Father | Single Mother |
| No Children | 0 (0.0%) | 30 (5.1%) |
| 1 or 2 Children | 10 (3.1%) | 58 (10.0%) |
| 3 or 4 Children | 0 (0.0%) | 9 (8.2%) |
| 5 or more Children | 0 (0.0%) | 0 (0.0%) |
| Total | 10 (1.6%) | 97 (7.6%) |
Income Below Poverty Among Married-Couple vs Single-Parent Households in Edina
The poverty data for Edina shows that 263 of the married-couple family households (2.1%) and 107 of the single-parent households (5.7%) are living below the poverty level. Within the married-couple family households, those with 1 or 2 children have the highest poverty rate, with 118 households (3.0%) falling below the poverty line. Among the single-parent households, those with 1 or 2 children have the highest poverty rate, with 68 household (7.6%) living below poverty.
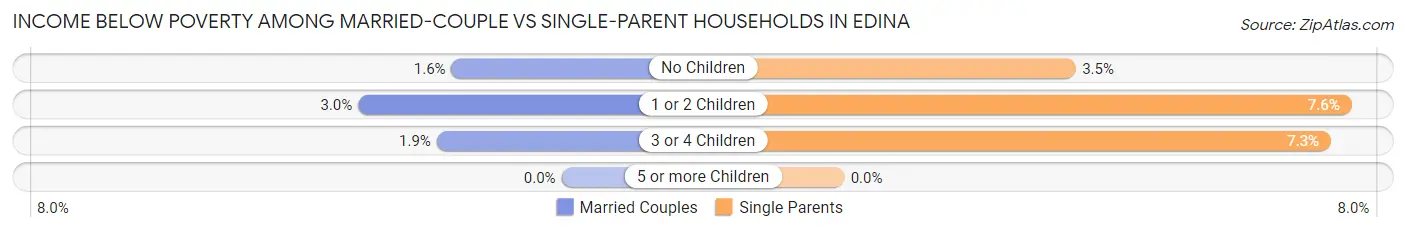
| Children | Married-Couple Families | Single-Parent Households |
| No Children | 121 (1.6%) | 30 (3.5%) |
| 1 or 2 Children | 118 (3.0%) | 68 (7.6%) |
| 3 or 4 Children | 24 (1.9%) | 9 (7.3%) |
| 5 or more Children | 0 (0.0%) | 0 (0.0%) |
| Total | 263 (2.1%) | 107 (5.7%) |
Race in Edina
The most populous races in Edina are White / Caucasian (44,453 | 83.8%), Asian (3,663 | 6.9%), and Two or more Races (2,658 | 5.0%).
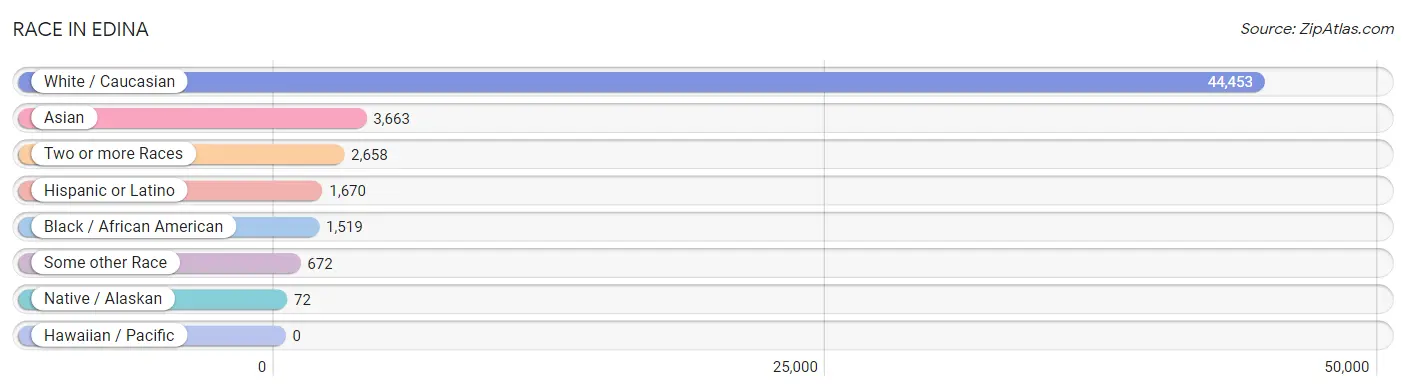
| Race | # Population | % Population |
| Asian | 3,663 | 6.9% |
| Black / African American | 1,519 | 2.9% |
| Hawaiian / Pacific | 0 | 0.0% |
| Hispanic or Latino | 1,670 | 3.2% |
| Native / Alaskan | 72 | 0.1% |
| White / Caucasian | 44,453 | 83.8% |
| Two or more Races | 2,658 | 5.0% |
| Some other Race | 672 | 1.3% |
| Total | 53,037 | 100.0% |
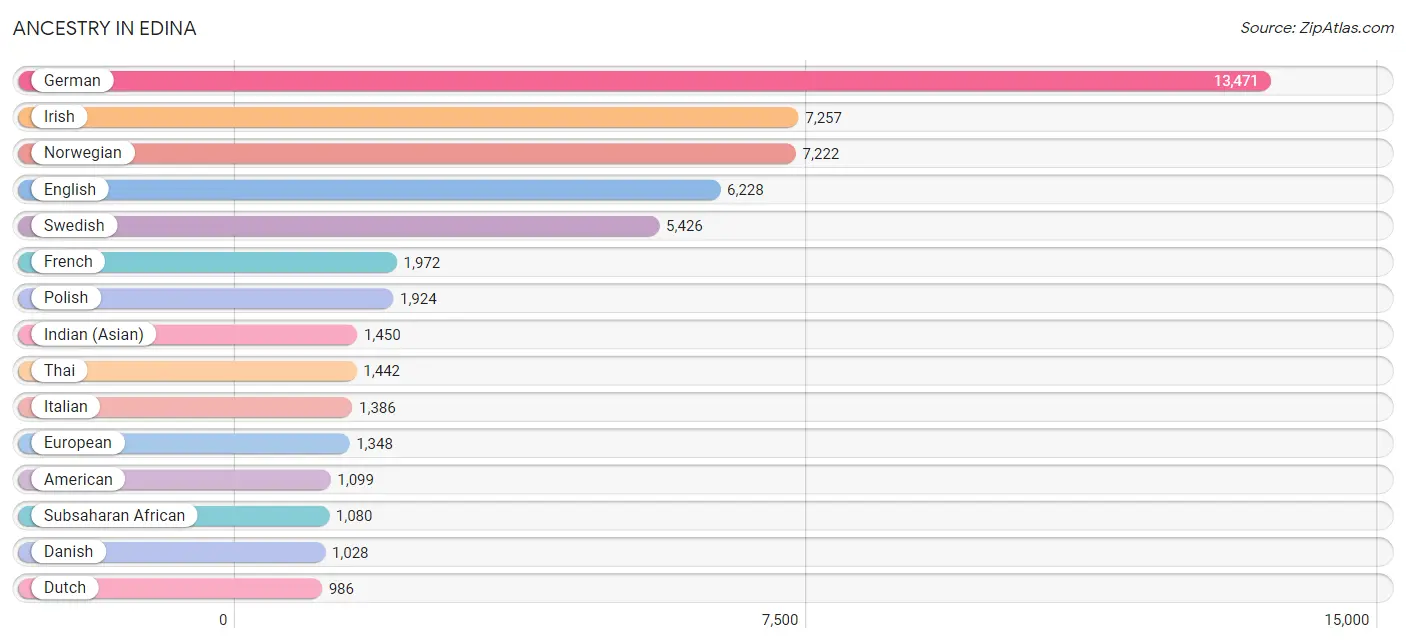
Ancestry in Edina
The most populous ancestries reported in Edina are German (13,471 | 25.4%), Irish (7,257 | 13.7%), Norwegian (7,222 | 13.6%), English (6,228 | 11.7%), and Swedish (5,426 | 10.2%), together accounting for 74.7% of all Edina residents.
| Ancestry | # Population | % Population |
| African | 258 | 0.5% |
| American | 1,099 | 2.1% |
| Arab | 392 | 0.7% |
| Armenian | 7 | 0.0% |
| Australian | 17 | 0.0% |
| Austrian | 284 | 0.5% |
| Bangladeshi | 51 | 0.1% |
| Belgian | 108 | 0.2% |
| Bhutanese | 362 | 0.7% |
| Blackfeet | 5 | 0.0% |
| Bolivian | 14 | 0.0% |
| Brazilian | 27 | 0.1% |
| British | 378 | 0.7% |
| Bulgarian | 49 | 0.1% |
| Burmese | 429 | 0.8% |
| Canadian | 78 | 0.2% |
| Central American | 323 | 0.6% |
| Central American Indian | 57 | 0.1% |
| Cherokee | 11 | 0.0% |
| Chilean | 16 | 0.0% |
| Chippewa | 97 | 0.2% |
| Colombian | 66 | 0.1% |
| Croatian | 136 | 0.3% |
| Cuban | 88 | 0.2% |
| Czech | 766 | 1.4% |
| Czechoslovakian | 29 | 0.1% |
| Danish | 1,028 | 1.9% |
| Dutch | 986 | 1.9% |
| Eastern European | 254 | 0.5% |
| Egyptian | 260 | 0.5% |
| English | 6,228 | 11.7% |
| Estonian | 16 | 0.0% |
| Ethiopian | 28 | 0.1% |
| European | 1,348 | 2.5% |
| Filipino | 17 | 0.0% |
| Finnish | 494 | 0.9% |
| French | 1,972 | 3.7% |
| French Canadian | 373 | 0.7% |
| German | 13,471 | 25.4% |
| Ghanaian | 26 | 0.1% |
| Greek | 178 | 0.3% |
| Guatemalan | 37 | 0.1% |
| Haitian | 10 | 0.0% |
| Honduran | 26 | 0.1% |
| Hungarian | 272 | 0.5% |
| Icelander | 13 | 0.0% |
| Indian (Asian) | 1,450 | 2.7% |
| Indonesian | 43 | 0.1% |
| Iranian | 95 | 0.2% |
| Iraqi | 6 | 0.0% |
| Irish | 7,257 | 13.7% |
| Italian | 1,386 | 2.6% |
| Jamaican | 31 | 0.1% |
| Japanese | 13 | 0.0% |
| Kenyan | 51 | 0.1% |
| Korean | 206 | 0.4% |
| Latvian | 63 | 0.1% |
| Lebanese | 102 | 0.2% |
| Liberian | 113 | 0.2% |
| Lithuanian | 73 | 0.1% |
| Luxembourger | 23 | 0.0% |
| Macedonian | 13 | 0.0% |
| Malaysian | 27 | 0.1% |
| Mexican | 741 | 1.4% |
| Mexican American Indian | 25 | 0.1% |
| Mongolian | 25 | 0.1% |
| Native Hawaiian | 6 | 0.0% |
| Nigerian | 29 | 0.1% |
| Northern European | 409 | 0.8% |
| Norwegian | 7,222 | 13.6% |
| Okinawan | 6 | 0.0% |
| Pakistani | 129 | 0.2% |
| Palestinian | 9 | 0.0% |
| Panamanian | 14 | 0.0% |
| Pennsylvania German | 1 | 0.0% |
| Polish | 1,924 | 3.6% |
| Portuguese | 47 | 0.1% |
| Puerto Rican | 83 | 0.2% |
| Romanian | 66 | 0.1% |
| Russian | 669 | 1.3% |
| Salvadoran | 246 | 0.5% |
| Scandinavian | 751 | 1.4% |
| Scotch-Irish | 424 | 0.8% |
| Scottish | 849 | 1.6% |
| Serbian | 87 | 0.2% |
| Sioux | 28 | 0.1% |
| Slavic | 6 | 0.0% |
| Slovak | 182 | 0.3% |
| Slovene | 137 | 0.3% |
| Somali | 557 | 1.1% |
| South American | 220 | 0.4% |
| Soviet Union | 20 | 0.0% |
| Spaniard | 175 | 0.3% |
| Spanish | 31 | 0.1% |
| Sri Lankan | 207 | 0.4% |
| Subsaharan African | 1,080 | 2.0% |
| Swedish | 5,426 | 10.2% |
| Swiss | 204 | 0.4% |
| Syrian | 24 | 0.1% |
| Thai | 1,442 | 2.7% |
| Tongan | 101 | 0.2% |
| Turkish | 56 | 0.1% |
| Ukrainian | 139 | 0.3% |
| Venezuelan | 124 | 0.2% |
| Vietnamese | 243 | 0.5% |
| Welsh | 488 | 0.9% |
| West Indian | 20 | 0.0% |
| Yugoslavian | 33 | 0.1% | View All 108 Rows |
Immigrants in Edina
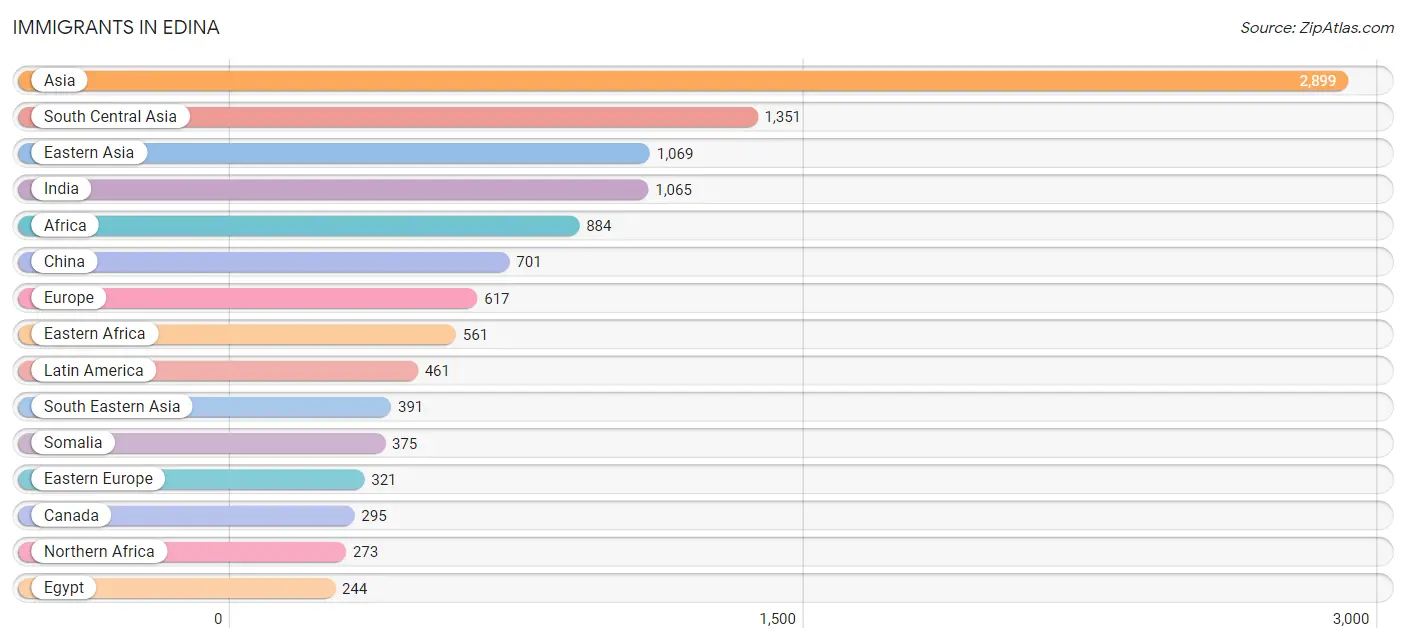
The most numerous immigrant groups reported in Edina came from Asia (2,899 | 5.5%), South Central Asia (1,351 | 2.5%), Eastern Asia (1,069 | 2.0%), India (1,065 | 2.0%), and Africa (884 | 1.7%), together accounting for 13.7% of all Edina residents.
| Immigration Origin | # Population | % Population |
| Africa | 884 | 1.7% |
| Asia | 2,899 | 5.5% |
| Australia | 35 | 0.1% |
| Bangladesh | 169 | 0.3% |
| Belgium | 15 | 0.0% |
| Brazil | 38 | 0.1% |
| Bulgaria | 32 | 0.1% |
| Cambodia | 4 | 0.0% |
| Cameroon | 13 | 0.0% |
| Canada | 295 | 0.6% |
| Caribbean | 27 | 0.1% |
| Central America | 239 | 0.4% |
| Chile | 16 | 0.0% |
| China | 701 | 1.3% |
| Colombia | 17 | 0.0% |
| Czechoslovakia | 8 | 0.0% |
| Denmark | 3 | 0.0% |
| Eastern Africa | 561 | 1.1% |
| Eastern Asia | 1,069 | 2.0% |
| Eastern Europe | 321 | 0.6% |
| Egypt | 244 | 0.5% |
| El Salvador | 87 | 0.2% |
| England | 18 | 0.0% |
| Ethiopia | 61 | 0.1% |
| Europe | 617 | 1.2% |
| France | 67 | 0.1% |
| Germany | 51 | 0.1% |
| Greece | 26 | 0.1% |
| Guatemala | 10 | 0.0% |
| Honduras | 5 | 0.0% |
| Hong Kong | 24 | 0.1% |
| Hungary | 42 | 0.1% |
| India | 1,065 | 2.0% |
| Iran | 50 | 0.1% |
| Ireland | 22 | 0.0% |
| Jamaica | 27 | 0.1% |
| Japan | 132 | 0.3% |
| Kazakhstan | 9 | 0.0% |
| Kenya | 69 | 0.1% |
| Korea | 236 | 0.4% |
| Laos | 27 | 0.1% |
| Latin America | 461 | 0.9% |
| Latvia | 10 | 0.0% |
| Lebanon | 15 | 0.0% |
| Malaysia | 33 | 0.1% |
| Mexico | 123 | 0.2% |
| Middle Africa | 13 | 0.0% |
| Moldova | 9 | 0.0% |
| Morocco | 11 | 0.0% |
| Nepal | 50 | 0.1% |
| Netherlands | 5 | 0.0% |
| Northern Africa | 273 | 0.5% |
| Northern Europe | 96 | 0.2% |
| Norway | 9 | 0.0% |
| Oceania | 115 | 0.2% |
| Pakistan | 8 | 0.0% |
| Panama | 14 | 0.0% |
| Philippines | 54 | 0.1% |
| Poland | 17 | 0.0% |
| Romania | 15 | 0.0% |
| Russia | 90 | 0.2% |
| Scotland | 17 | 0.0% |
| Serbia | 16 | 0.0% |
| Singapore | 17 | 0.0% |
| Somalia | 375 | 0.7% |
| South Africa | 13 | 0.0% |
| South America | 195 | 0.4% |
| South Central Asia | 1,351 | 2.5% |
| South Eastern Asia | 391 | 0.7% |
| Southern Europe | 62 | 0.1% |
| Spain | 36 | 0.1% |
| Sudan | 18 | 0.0% |
| Sweden | 7 | 0.0% |
| Syria | 21 | 0.0% |
| Taiwan | 82 | 0.2% |
| Thailand | 111 | 0.2% |
| Turkey | 23 | 0.0% |
| Ukraine | 65 | 0.1% |
| Venezuela | 124 | 0.2% |
| Vietnam | 102 | 0.2% |
| Western Africa | 21 | 0.0% |
| Western Asia | 88 | 0.2% |
| Western Europe | 138 | 0.3% | View All 83 Rows |
Sex and Age in Edina
Sex and Age in Edina
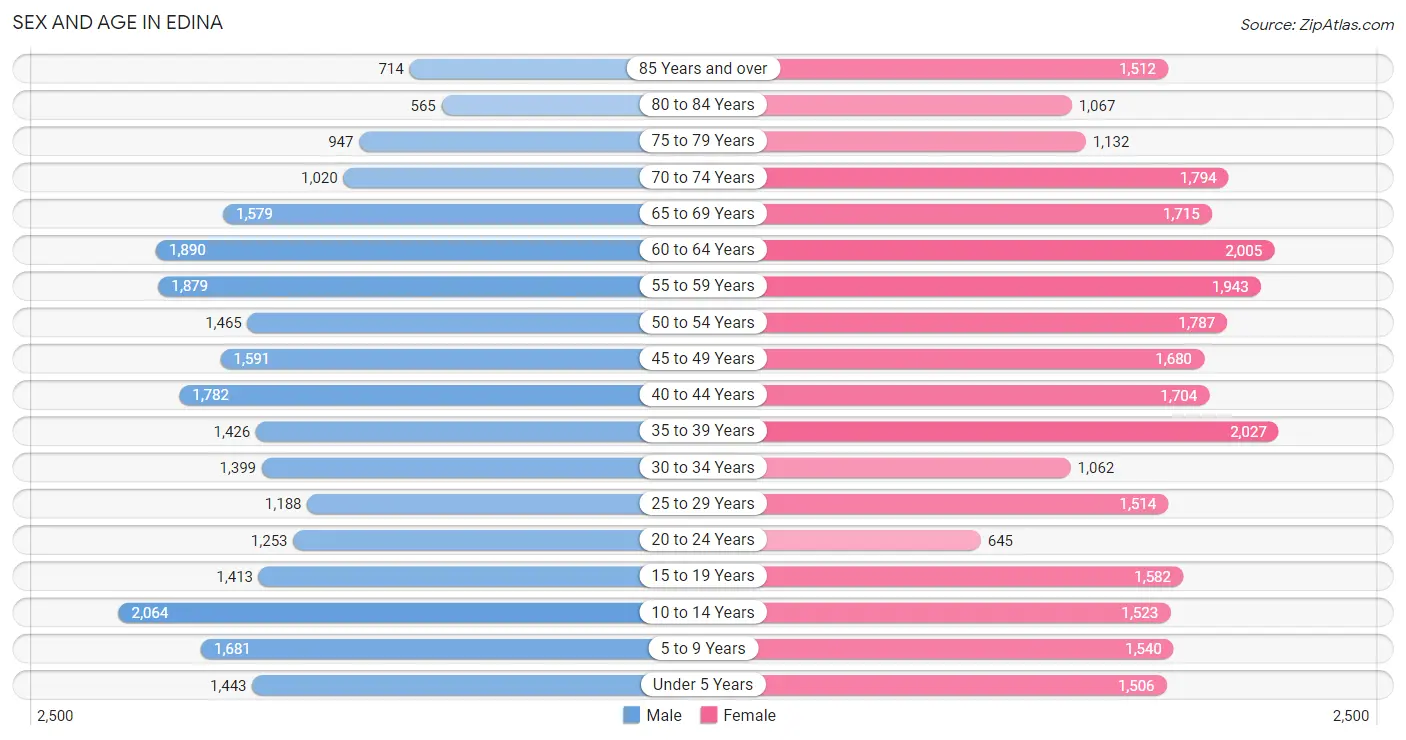
The most populous age groups in Edina are 10 to 14 Years (2,064 | 8.2%) for men and 35 to 39 Years (2,027 | 7.3%) for women.
| Age Bracket | Male | Female |
| Under 5 Years | 1,443 (5.7%) | 1,506 (5.4%) |
| 5 to 9 Years | 1,681 (6.6%) | 1,540 (5.6%) |
| 10 to 14 Years | 2,064 (8.2%) | 1,523 (5.5%) |
| 15 to 19 Years | 1,413 (5.6%) | 1,582 (5.7%) |
| 20 to 24 Years | 1,253 (5.0%) | 645 (2.3%) |
| 25 to 29 Years | 1,188 (4.7%) | 1,514 (5.5%) |
| 30 to 34 Years | 1,399 (5.5%) | 1,062 (3.8%) |
| 35 to 39 Years | 1,426 (5.6%) | 2,027 (7.3%) |
| 40 to 44 Years | 1,782 (7.0%) | 1,704 (6.1%) |
| 45 to 49 Years | 1,591 (6.3%) | 1,680 (6.1%) |
| 50 to 54 Years | 1,465 (5.8%) | 1,787 (6.4%) |
| 55 to 59 Years | 1,879 (7.4%) | 1,943 (7.0%) |
| 60 to 64 Years | 1,890 (7.5%) | 2,005 (7.2%) |
| 65 to 69 Years | 1,579 (6.2%) | 1,715 (6.2%) |
| 70 to 74 Years | 1,020 (4.0%) | 1,794 (6.5%) |
| 75 to 79 Years | 947 (3.7%) | 1,132 (4.1%) |
| 80 to 84 Years | 565 (2.2%) | 1,067 (3.8%) |
| 85 Years and over | 714 (2.8%) | 1,512 (5.4%) |
| Total | 25,299 (100.0%) | 27,738 (100.0%) |
Families and Households in Edina
Median Family Size in Edina
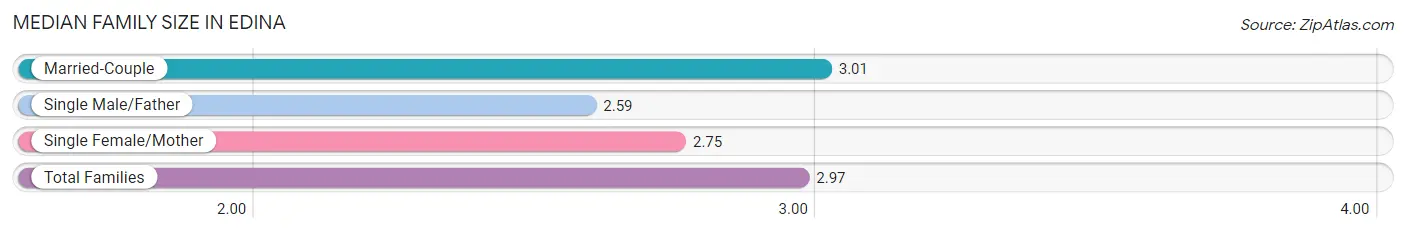
The median family size in Edina is 2.97 persons per family, with married-couple families (12,577 | 86.9%) accounting for the largest median family size of 3.01 persons per family. On the other hand, single male/father families (618 | 4.3%) represent the smallest median family size with 2.59 persons per family.
| Family Type | # Families | Family Size |
| Married-Couple | 12,577 (86.9%) | 3.01 |
| Single Male/Father | 618 (4.3%) | 2.59 |
| Single Female/Mother | 1,274 (8.8%) | 2.75 |
| Total Families | 14,469 (100.0%) | 2.97 |
Median Household Size in Edina
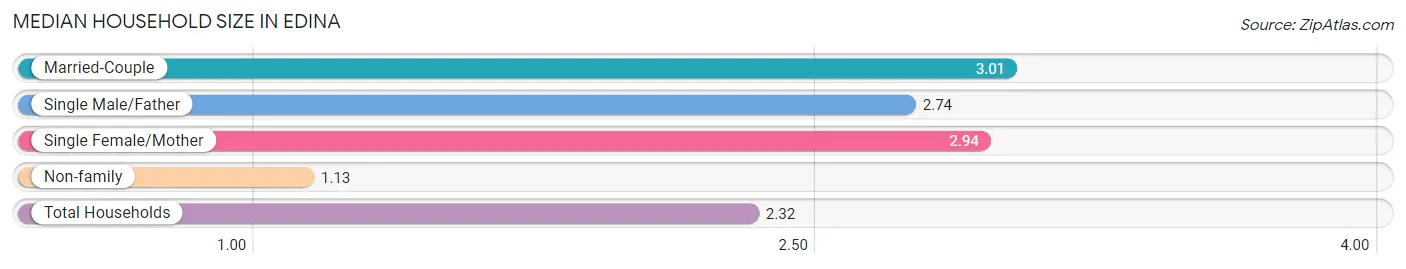
The median household size in Edina is 2.32 persons per household, with married-couple households (12,577 | 55.6%) accounting for the largest median household size of 3.01 persons per household. non-family households (8,140 | 36.0%) represent the smallest median household size with 1.13 persons per household.
| Household Type | # Households | Household Size |
| Married-Couple | 12,577 (55.6%) | 3.01 |
| Single Male/Father | 618 (2.7%) | 2.74 |
| Single Female/Mother | 1,274 (5.6%) | 2.94 |
| Non-family | 8,140 (36.0%) | 1.13 |
| Total Households | 22,609 (100.0%) | 2.32 |
Household Size by Marriage Status in Edina
Out of a total of 22,609 households in Edina, 14,469 (64.0%) are family households, while 8,140 (36.0%) are nonfamily households. The most numerous type of family households are 2-person households, comprising 7,082, and the most common type of nonfamily households are 1-person households, comprising 7,285.
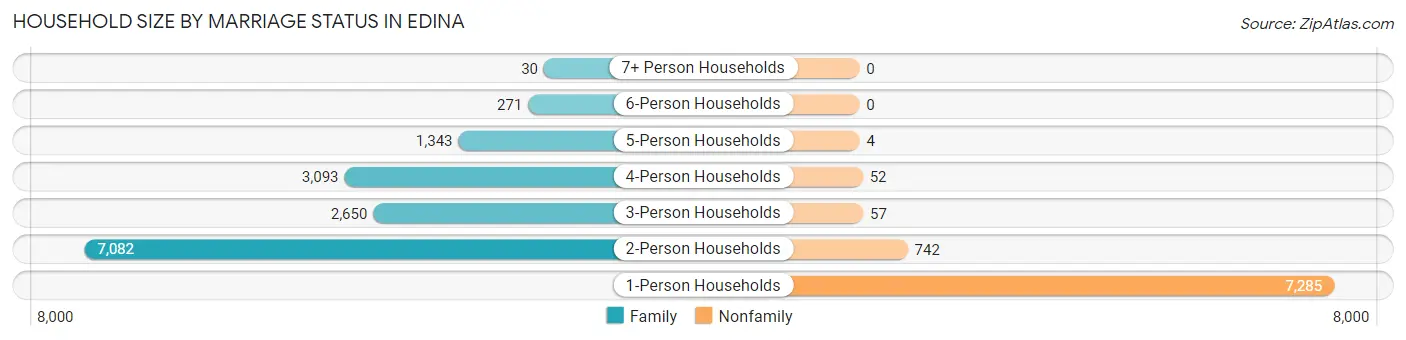
| Household Size | Family Households | Nonfamily Households |
| 1-Person Households | - | 7,285 (32.2%) |
| 2-Person Households | 7,082 (31.3%) | 742 (3.3%) |
| 3-Person Households | 2,650 (11.7%) | 57 (0.3%) |
| 4-Person Households | 3,093 (13.7%) | 52 (0.2%) |
| 5-Person Households | 1,343 (5.9%) | 4 (0.0%) |
| 6-Person Households | 271 (1.2%) | 0 (0.0%) |
| 7+ Person Households | 30 (0.1%) | 0 (0.0%) |
| Total | 14,469 (64.0%) | 8,140 (36.0%) |
Female Fertility in Edina
Fertility by Age in Edina
Average fertility rate in Edina is 47.0 births per 1,000 women. Women in the age bracket of 20 to 34 years have the highest fertility rate with 102.0 births per 1,000 women. Women in the age bracket of 20 to 34 years acount for 66.9% of all women with births.
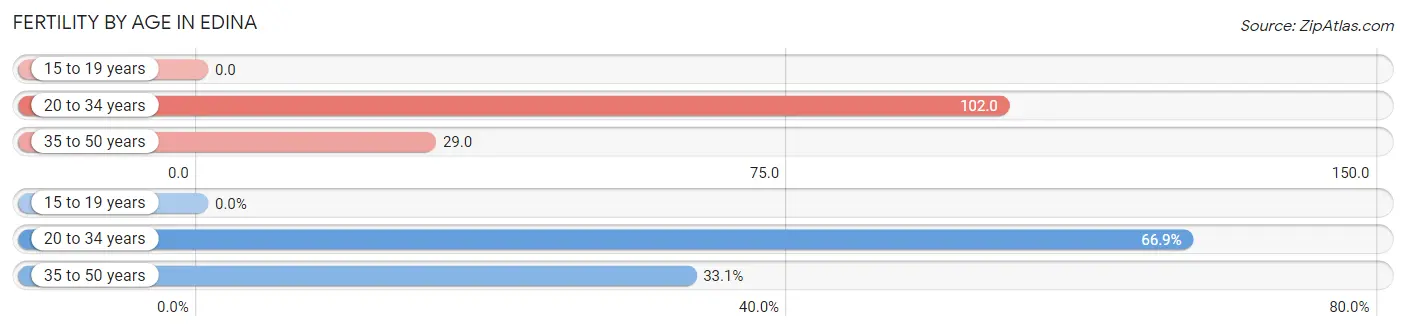
| Age Bracket | Women with Births | Births / 1,000 Women |
| 15 to 19 years | 0 (0.0%) | 0.0 |
| 20 to 34 years | 329 (66.9%) | 102.0 |
| 35 to 50 years | 163 (33.1%) | 29.0 |
| Total | 492 (100.0%) | 47.0 |
Fertility by Age by Marriage Status in Edina
78.0% of women with births (492) in Edina are married. The highest percentage of unmarried women with births falls into 20 to 34 years age bracket with 32.8% of them unmarried at the time of birth, while the lowest percentage of unmarried women with births belong to 35 to 50 years age bracket with 0.0% of them unmarried.
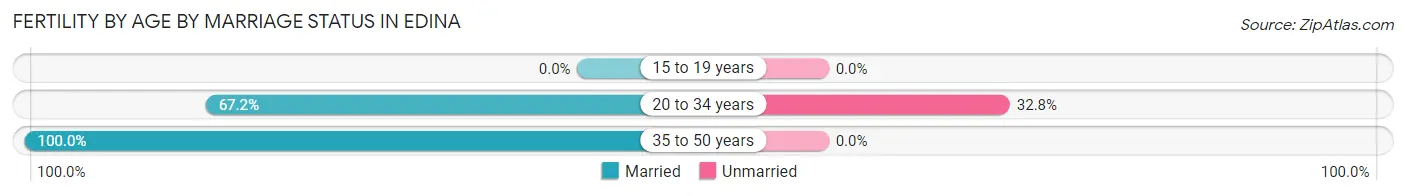
| Age Bracket | Married | Unmarried |
| 15 to 19 years | 0 (0.0%) | 0 (0.0%) |
| 20 to 34 years | 221 (67.2%) | 108 (32.8%) |
| 35 to 50 years | 163 (100.0%) | 0 (0.0%) |
| Total | 384 (78.0%) | 108 (22.0%) |
Fertility by Education in Edina
Average fertility rate in Edina is 47.0 births per 1,000 women. Women with the education attainment of high school diploma have the highest fertility rate of 103.0 births per 1,000 women, while women with the education attainment of less than high school have the lowest fertility at 5.0 births per 1,000 women. Women with the education attainment of bachelor's degree represent 41.7% of all women with births.
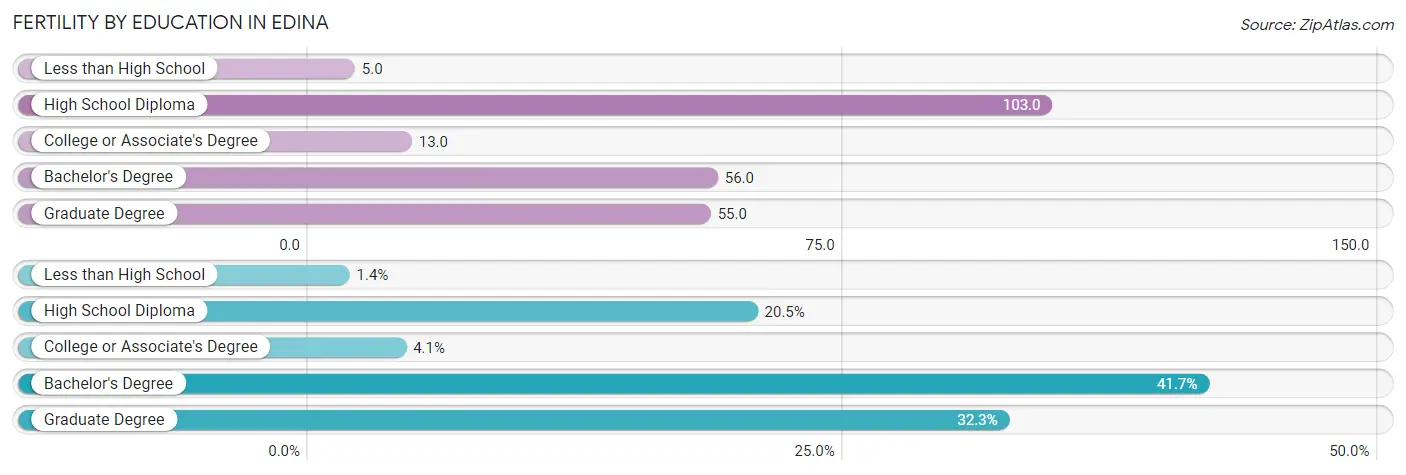
| Educational Attainment | Women with Births | Births / 1,000 Women |
| Less than High School | 7 (1.4%) | 5.0 |
| High School Diploma | 101 (20.5%) | 103.0 |
| College or Associate's Degree | 20 (4.1%) | 13.0 |
| Bachelor's Degree | 205 (41.7%) | 56.0 |
| Graduate Degree | 159 (32.3%) | 55.0 |
| Total | 492 (100.0%) | 47.0 |
Fertility by Education by Marriage Status in Edina
22.0% of women with births in Edina are unmarried. Women with the educational attainment of less than high school are most likely to be married with 100.0% of them married at childbirth, while women with the educational attainment of bachelor's degree are least likely to be married with 45.9% of them unmarried at childbirth.
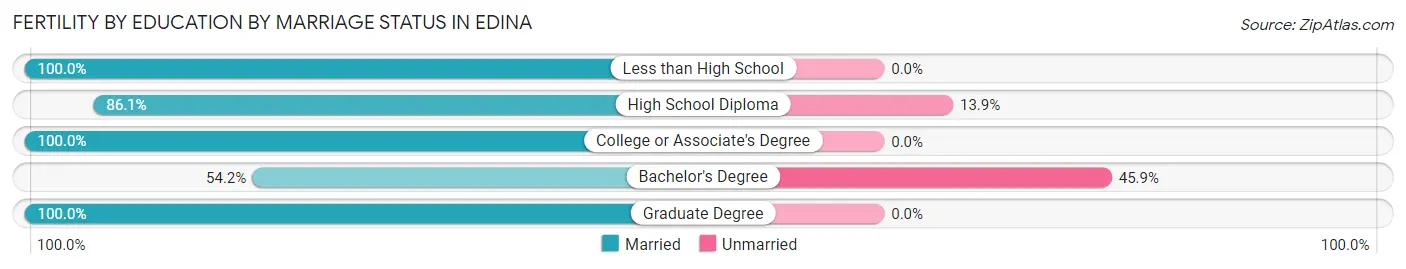
| Educational Attainment | Married | Unmarried |
| Less than High School | 7 (100.0%) | 0 (0.0%) |
| High School Diploma | 87 (86.1%) | 14 (13.9%) |
| College or Associate's Degree | 20 (100.0%) | 0 (0.0%) |
| Bachelor's Degree | 111 (54.1%) | 94 (45.9%) |
| Graduate Degree | 159 (100.0%) | 0 (0.0%) |
| Total | 384 (78.0%) | 108 (22.0%) |
Employment Characteristics in Edina
Employment by Class of Employer in Edina
Among the 25,728 employed individuals in Edina, private company employees (17,152 | 66.7%), not-for-profit organizations (3,203 | 12.4%), and self-employed (incorporated) (1,709 | 6.6%) make up the most common classes of employment.
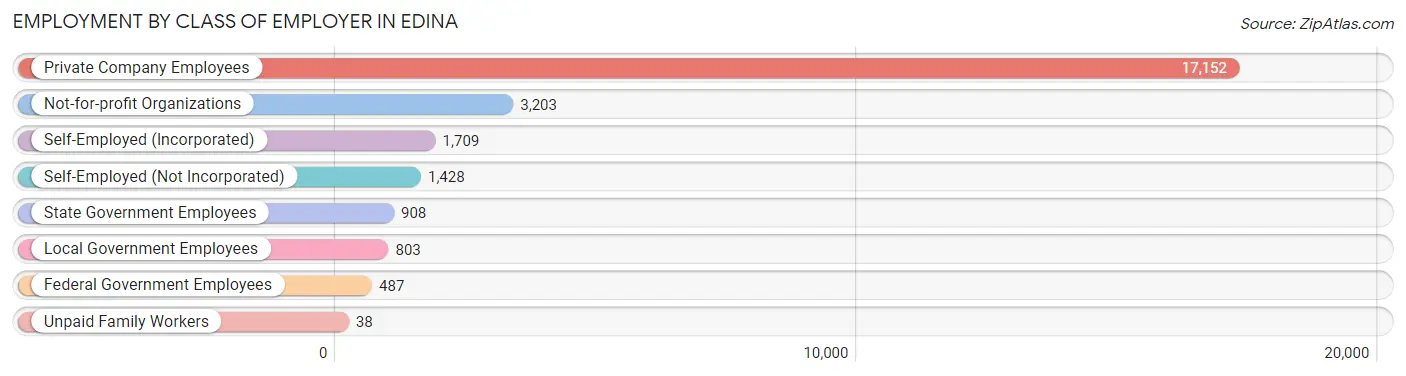
| Employer Class | # Employees | % Employees |
| Private Company Employees | 17,152 | 66.7% |
| Self-Employed (Incorporated) | 1,709 | 6.6% |
| Self-Employed (Not Incorporated) | 1,428 | 5.6% |
| Not-for-profit Organizations | 3,203 | 12.4% |
| Local Government Employees | 803 | 3.1% |
| State Government Employees | 908 | 3.5% |
| Federal Government Employees | 487 | 1.9% |
| Unpaid Family Workers | 38 | 0.2% |
| Total | 25,728 | 100.0% |
Employment Status by Age in Edina
According to the labor force statistics for Edina, out of the total population over 16 years of age (42,605), 63.9% or 27,225 individuals are in the labor force, with 3.7% or 1,007 of them unemployed. The age group with the highest labor force participation rate is 30 to 34 years, with 92.2% or 2,269 individuals in the labor force. Within the labor force, the 16 to 19 years age range has the highest percentage of unemployed individuals, with 13.1% or 100 of them being unemployed.
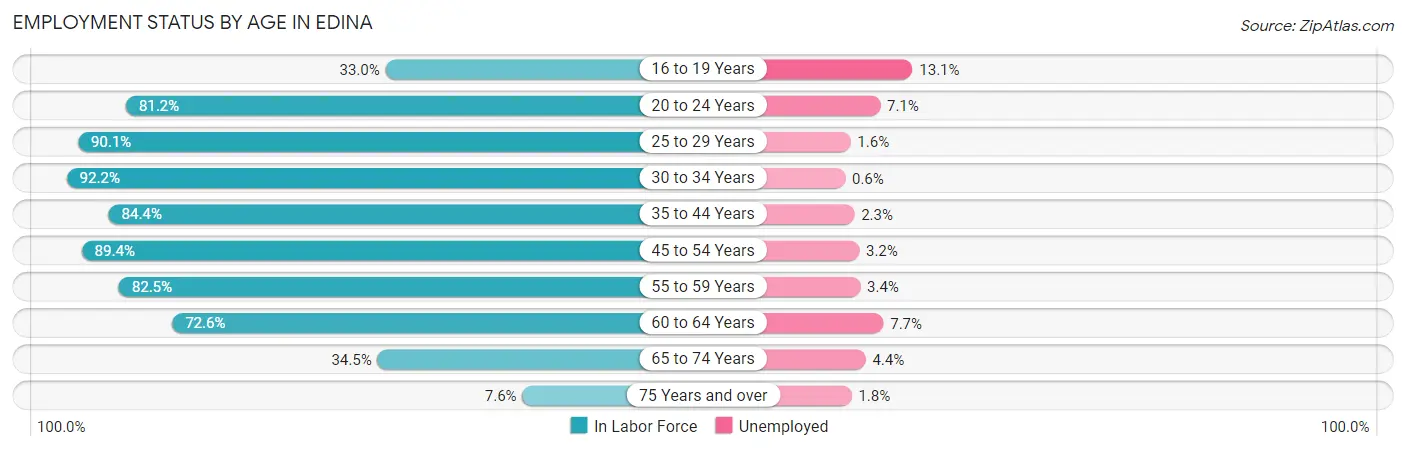
| Age Bracket | In Labor Force | Unemployed |
| 16 to 19 Years | 766 (33.0%) | 100 (13.1%) |
| 20 to 24 Years | 1,541 (81.2%) | 109 (7.1%) |
| 25 to 29 Years | 2,435 (90.1%) | 39 (1.6%) |
| 30 to 34 Years | 2,269 (92.2%) | 14 (0.6%) |
| 35 to 44 Years | 5,857 (84.4%) | 135 (2.3%) |
| 45 to 54 Years | 5,832 (89.4%) | 187 (3.2%) |
| 55 to 59 Years | 3,153 (82.5%) | 107 (3.4%) |
| 60 to 64 Years | 2,828 (72.6%) | 218 (7.7%) |
| 65 to 74 Years | 2,107 (34.5%) | 93 (4.4%) |
| 75 Years and over | 451 (7.6%) | 8 (1.8%) |
| Total | 27,225 (63.9%) | 1,007 (3.7%) |
Employment Status by Educational Attainment in Edina
According to labor force statistics for Edina, 84.9% of individuals (22,364) out of the total population between 25 and 64 years of age (26,342) are in the labor force, with 3.1% or 693 of them being unemployed. The group with the highest labor force participation rate are those with the educational attainment of bachelor's degree or higher, with 87.6% or 17,762 individuals in the labor force. Within the labor force, individuals with college / associate degree education have the highest percentage of unemployment, with 7.5% or 254 of them being unemployed.
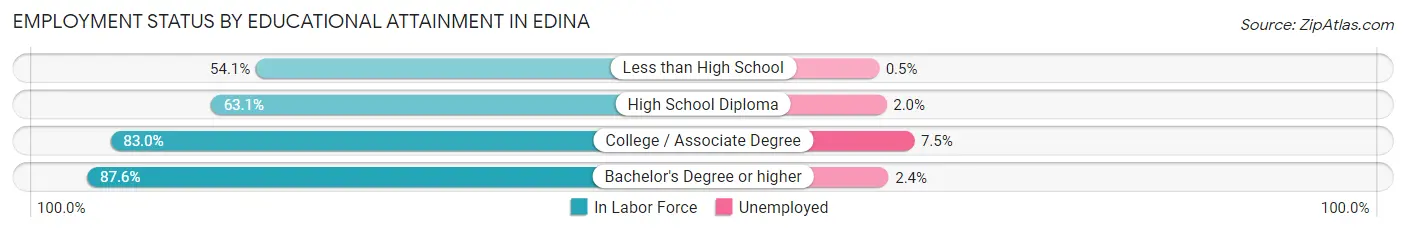
| Educational Attainment | In Labor Force | Unemployed |
| Less than High School | 198 (54.1%) | 2 (0.5%) |
| High School Diploma | 1,018 (63.1%) | 32 (2.0%) |
| College / Associate Degree | 3,392 (83.0%) | 307 (7.5%) |
| Bachelor's Degree or higher | 17,762 (87.6%) | 487 (2.4%) |
| Total | 22,364 (84.9%) | 817 (3.1%) |
Employment Occupations by Sex in Edina
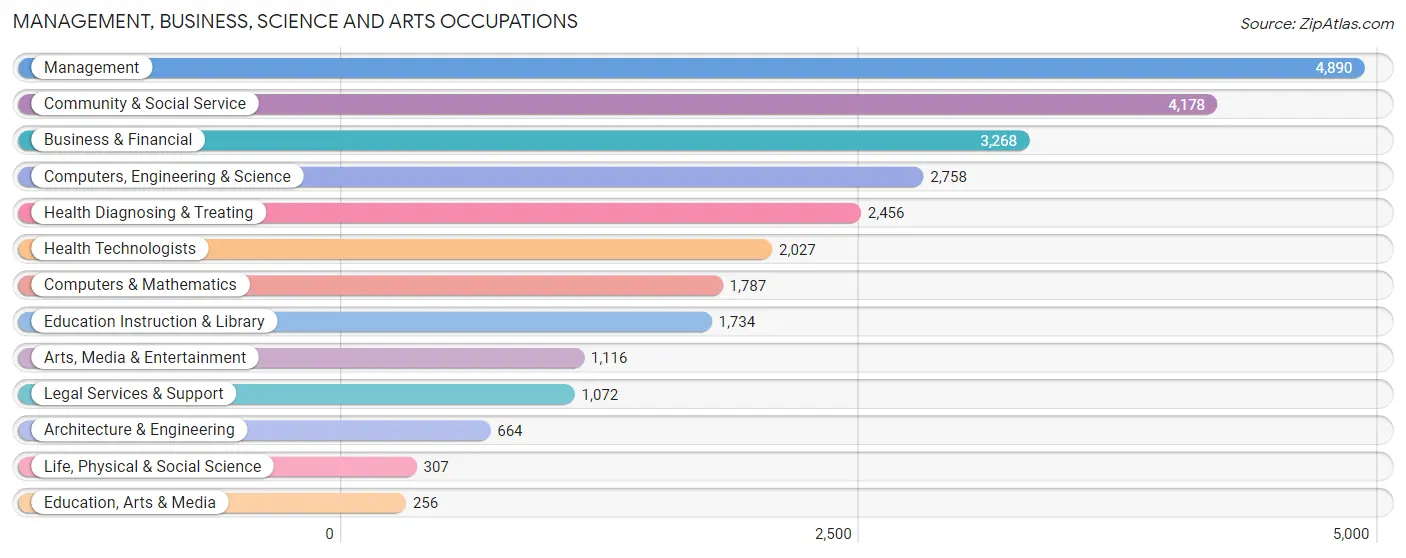
Management, Business, Science and Arts Occupations
The most common Management, Business, Science and Arts occupations in Edina are Management (4,890 | 18.7%), Community & Social Service (4,178 | 16.0%), Business & Financial (3,268 | 12.5%), Computers, Engineering & Science (2,758 | 10.6%), and Health Diagnosing & Treating (2,456 | 9.4%).
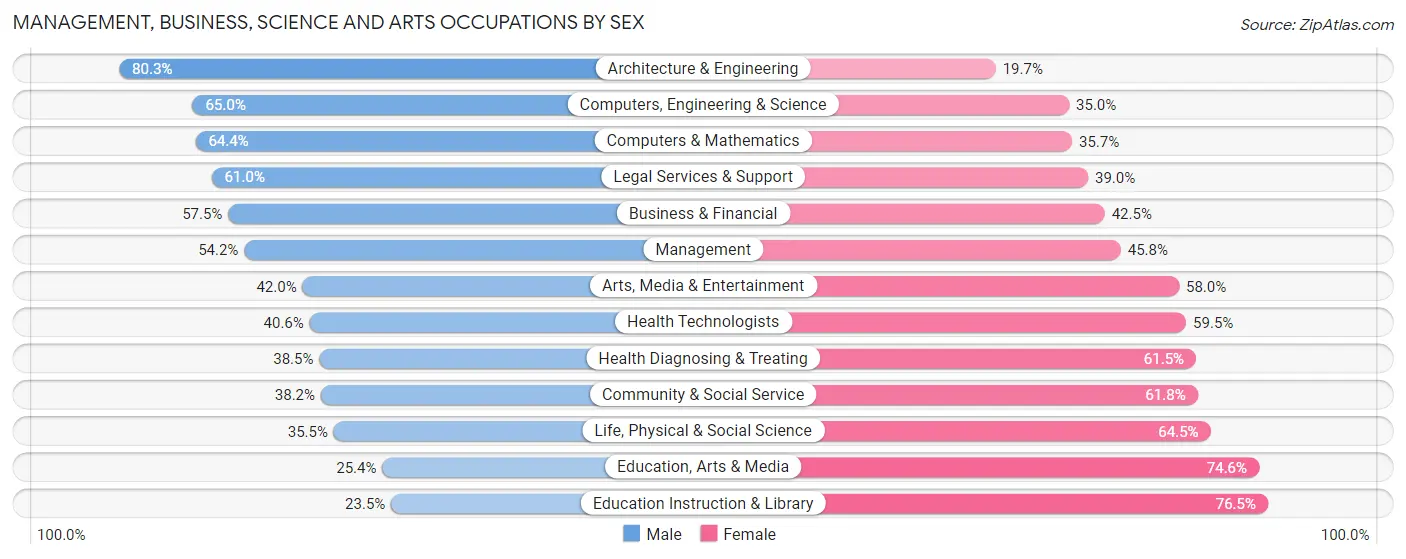
Management, Business, Science and Arts Occupations by Sex
Within the Management, Business, Science and Arts occupations in Edina, the most male-oriented occupations are Architecture & Engineering (80.3%), Computers, Engineering & Science (65.0%), and Computers & Mathematics (64.3%), while the most female-oriented occupations are Education Instruction & Library (76.5%), Education, Arts & Media (74.6%), and Life, Physical & Social Science (64.5%).
| Occupation | Male | Female |
| Management | 2,650 (54.2%) | 2,240 (45.8%) |
| Business & Financial | 1,880 (57.5%) | 1,388 (42.5%) |
| Computers, Engineering & Science | 1,792 (65.0%) | 966 (35.0%) |
| Computers & Mathematics | 1,150 (64.3%) | 637 (35.6%) |
| Architecture & Engineering | 533 (80.3%) | 131 (19.7%) |
| Life, Physical & Social Science | 109 (35.5%) | 198 (64.5%) |
| Community & Social Service | 1,596 (38.2%) | 2,582 (61.8%) |
| Education, Arts & Media | 65 (25.4%) | 191 (74.6%) |
| Legal Services & Support | 654 (61.0%) | 418 (39.0%) |
| Education Instruction & Library | 408 (23.5%) | 1,326 (76.5%) |
| Arts, Media & Entertainment | 469 (42.0%) | 647 (58.0%) |
| Health Diagnosing & Treating | 946 (38.5%) | 1,510 (61.5%) |
| Health Technologists | 822 (40.6%) | 1,205 (59.5%) |
| Total (Category) | 8,864 (50.5%) | 8,686 (49.5%) |
| Total (Overall) | 13,754 (52.7%) | 12,352 (47.3%) |
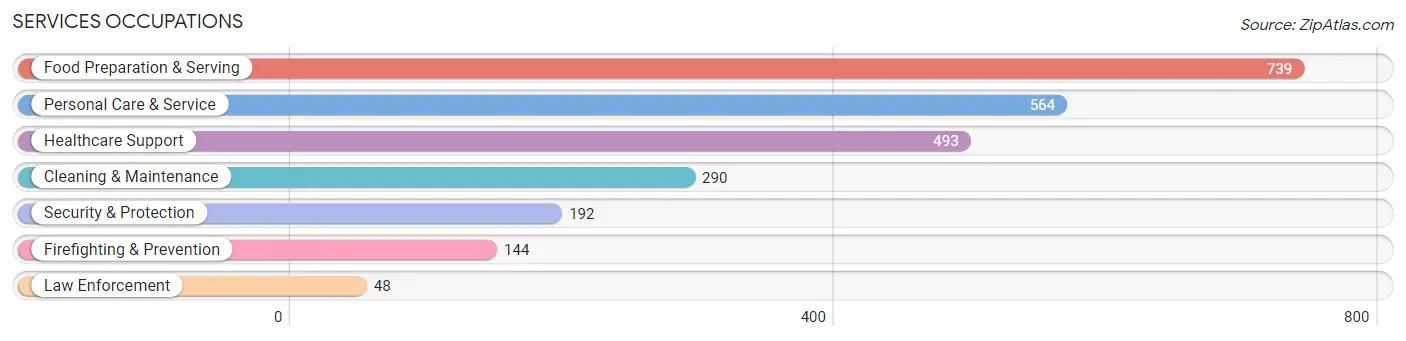
Services Occupations
The most common Services occupations in Edina are Food Preparation & Serving (739 | 2.8%), Personal Care & Service (564 | 2.2%), Healthcare Support (493 | 1.9%), Cleaning & Maintenance (290 | 1.1%), and Security & Protection (192 | 0.7%).
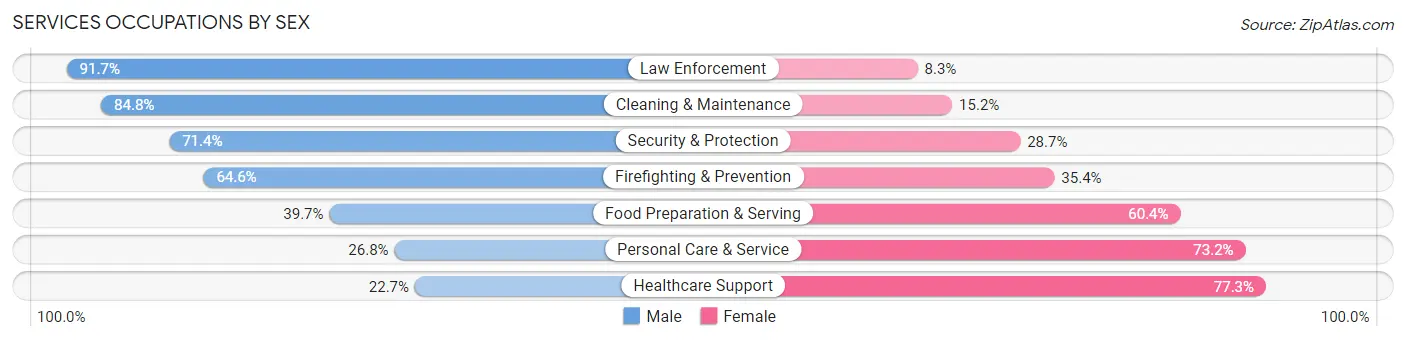
Services Occupations by Sex
Within the Services occupations in Edina, the most male-oriented occupations are Law Enforcement (91.7%), Cleaning & Maintenance (84.8%), and Security & Protection (71.4%), while the most female-oriented occupations are Healthcare Support (77.3%), Personal Care & Service (73.2%), and Food Preparation & Serving (60.4%).
| Occupation | Male | Female |
| Healthcare Support | 112 (22.7%) | 381 (77.3%) |
| Security & Protection | 137 (71.4%) | 55 (28.6%) |
| Firefighting & Prevention | 93 (64.6%) | 51 (35.4%) |
| Law Enforcement | 44 (91.7%) | 4 (8.3%) |
| Food Preparation & Serving | 293 (39.7%) | 446 (60.4%) |
| Cleaning & Maintenance | 246 (84.8%) | 44 (15.2%) |
| Personal Care & Service | 151 (26.8%) | 413 (73.2%) |
| Total (Category) | 939 (41.2%) | 1,339 (58.8%) |
| Total (Overall) | 13,754 (52.7%) | 12,352 (47.3%) |
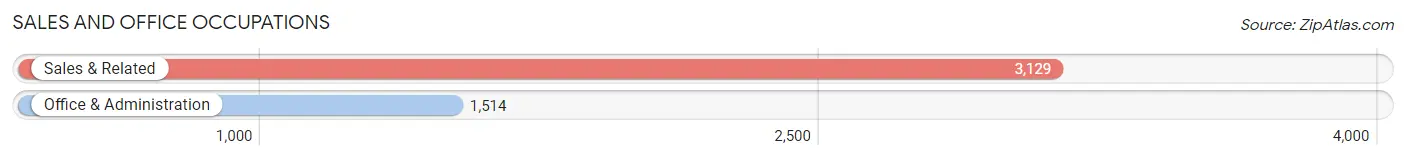
Sales and Office Occupations
The most common Sales and Office occupations in Edina are Sales & Related (3,129 | 12.0%), and Office & Administration (1,514 | 5.8%).
Sales and Office Occupations by Sex
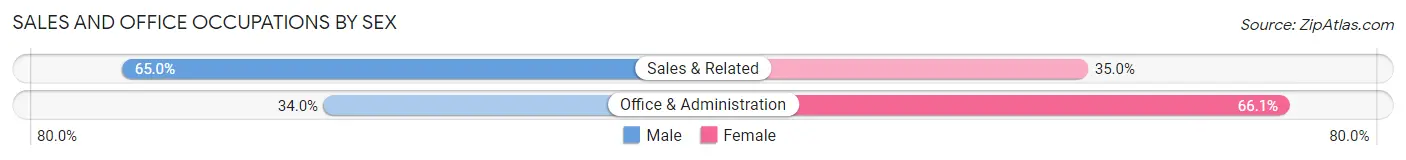
| Occupation | Male | Female |
| Sales & Related | 2,035 (65.0%) | 1,094 (35.0%) |
| Office & Administration | 514 (34.0%) | 1,000 (66.0%) |
| Total (Category) | 2,549 (54.9%) | 2,094 (45.1%) |
| Total (Overall) | 13,754 (52.7%) | 12,352 (47.3%) |
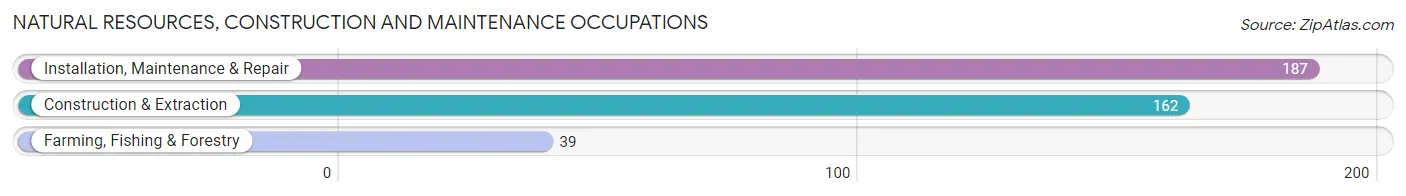
Natural Resources, Construction and Maintenance Occupations
The most common Natural Resources, Construction and Maintenance occupations in Edina are Installation, Maintenance & Repair (187 | 0.7%), Construction & Extraction (162 | 0.6%), and Farming, Fishing & Forestry (39 | 0.2%).
Natural Resources, Construction and Maintenance Occupations by Sex
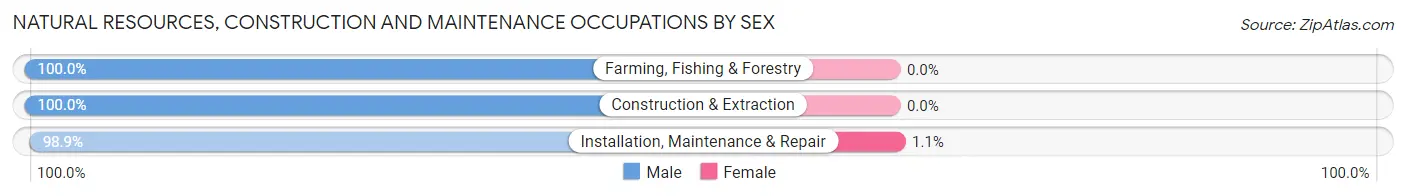
| Occupation | Male | Female |
| Farming, Fishing & Forestry | 39 (100.0%) | 0 (0.0%) |
| Construction & Extraction | 162 (100.0%) | 0 (0.0%) |
| Installation, Maintenance & Repair | 185 (98.9%) | 2 (1.1%) |
| Total (Category) | 386 (99.5%) | 2 (0.5%) |
| Total (Overall) | 13,754 (52.7%) | 12,352 (47.3%) |
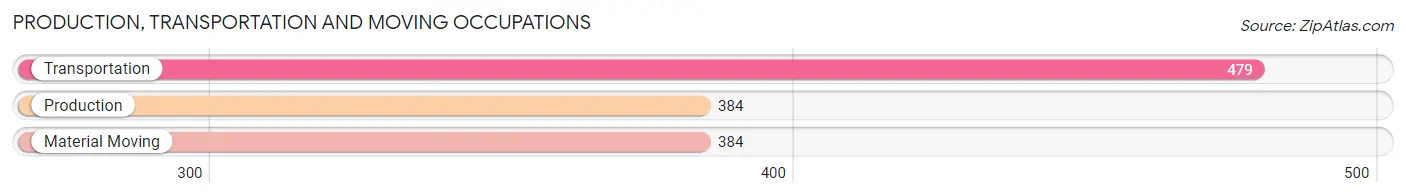
Production, Transportation and Moving Occupations
The most common Production, Transportation and Moving occupations in Edina are Transportation (479 | 1.8%), Production (384 | 1.5%), and Material Moving (384 | 1.5%).
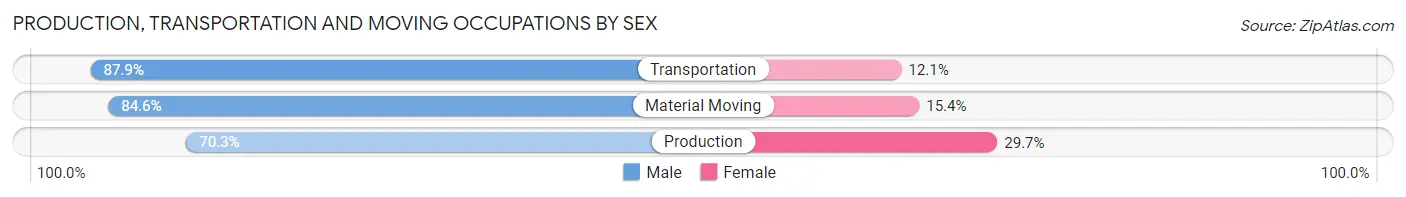
Production, Transportation and Moving Occupations by Sex
| Occupation | Male | Female |
| Production | 270 (70.3%) | 114 (29.7%) |
| Transportation | 421 (87.9%) | 58 (12.1%) |
| Material Moving | 325 (84.6%) | 59 (15.4%) |
| Total (Category) | 1,016 (81.5%) | 231 (18.5%) |
| Total (Overall) | 13,754 (52.7%) | 12,352 (47.3%) |
Employment Industries by Sex in Edina
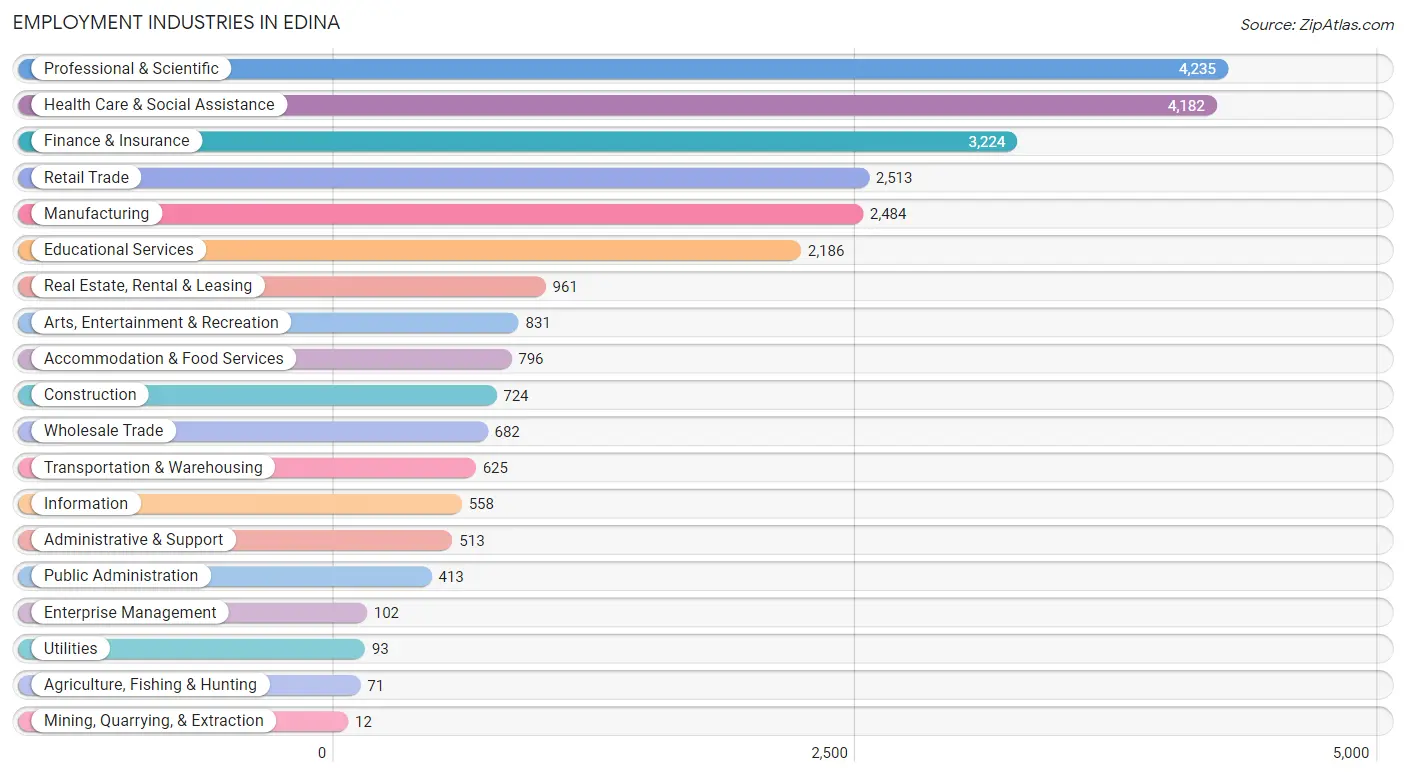
Employment Industries in Edina
The major employment industries in Edina include Professional & Scientific (4,235 | 16.2%), Health Care & Social Assistance (4,182 | 16.0%), Finance & Insurance (3,224 | 12.3%), Retail Trade (2,513 | 9.6%), and Manufacturing (2,484 | 9.5%).
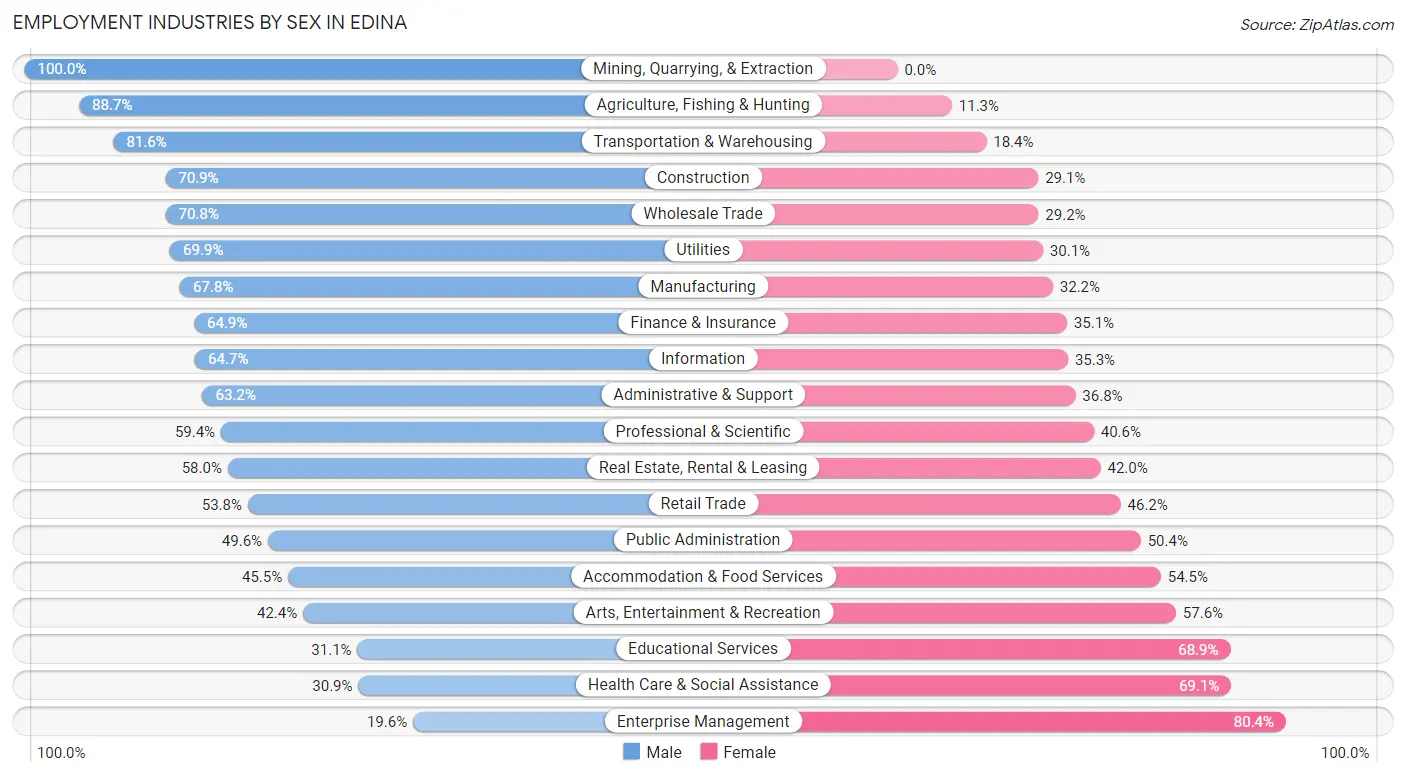
Employment Industries by Sex in Edina
The Edina industries that see more men than women are Mining, Quarrying, & Extraction (100.0%), Agriculture, Fishing & Hunting (88.7%), and Transportation & Warehousing (81.6%), whereas the industries that tend to have a higher number of women are Enterprise Management (80.4%), Health Care & Social Assistance (69.1%), and Educational Services (68.9%).
| Industry | Male | Female |
| Agriculture, Fishing & Hunting | 63 (88.7%) | 8 (11.3%) |
| Mining, Quarrying, & Extraction | 12 (100.0%) | 0 (0.0%) |
| Construction | 513 (70.9%) | 211 (29.1%) |
| Manufacturing | 1,685 (67.8%) | 799 (32.2%) |
| Wholesale Trade | 483 (70.8%) | 199 (29.2%) |
| Retail Trade | 1,352 (53.8%) | 1,161 (46.2%) |
| Transportation & Warehousing | 510 (81.6%) | 115 (18.4%) |
| Utilities | 65 (69.9%) | 28 (30.1%) |
| Information | 361 (64.7%) | 197 (35.3%) |
| Finance & Insurance | 2,093 (64.9%) | 1,131 (35.1%) |
| Real Estate, Rental & Leasing | 557 (58.0%) | 404 (42.0%) |
| Professional & Scientific | 2,514 (59.4%) | 1,721 (40.6%) |
| Enterprise Management | 20 (19.6%) | 82 (80.4%) |
| Administrative & Support | 324 (63.2%) | 189 (36.8%) |
| Educational Services | 680 (31.1%) | 1,506 (68.9%) |
| Health Care & Social Assistance | 1,293 (30.9%) | 2,889 (69.1%) |
| Arts, Entertainment & Recreation | 352 (42.4%) | 479 (57.6%) |
| Accommodation & Food Services | 362 (45.5%) | 434 (54.5%) |
| Public Administration | 205 (49.6%) | 208 (50.4%) |
| Total | 13,754 (52.7%) | 12,352 (47.3%) |
Education in Edina
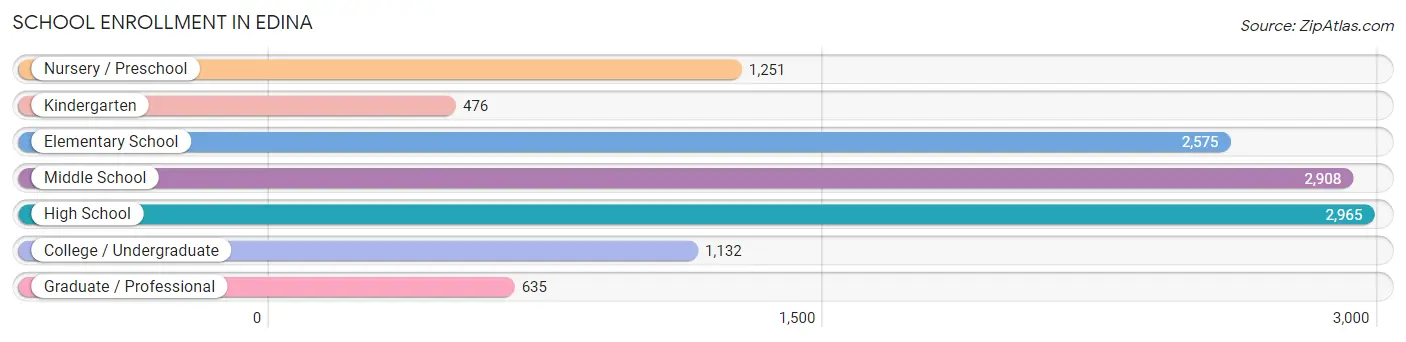
School Enrollment in Edina
The most common levels of schooling among the 11,942 students in Edina are high school (2,965 | 24.8%), middle school (2,908 | 24.3%), and elementary school (2,575 | 21.6%).
| School Level | # Students | % Students |
| Nursery / Preschool | 1,251 | 10.5% |
| Kindergarten | 476 | 4.0% |
| Elementary School | 2,575 | 21.6% |
| Middle School | 2,908 | 24.3% |
| High School | 2,965 | 24.8% |
| College / Undergraduate | 1,132 | 9.5% |
| Graduate / Professional | 635 | 5.3% |
| Total | 11,942 | 100.0% |
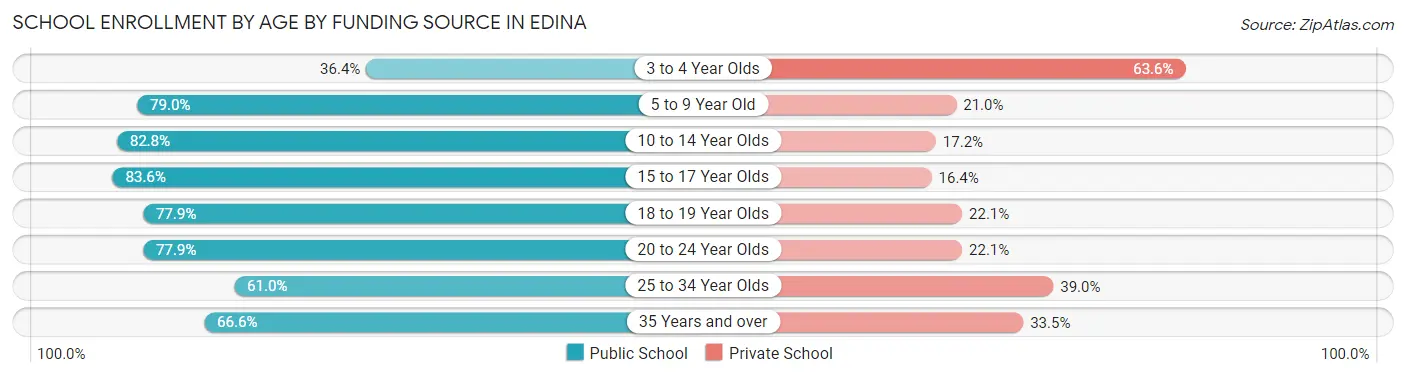
School Enrollment by Age by Funding Source in Edina
Out of a total of 11,942 students who are enrolled in schools in Edina, 2,818 (23.6%) attend a private institution, while the remaining 9,124 (76.4%) are enrolled in public schools. The age group of 3 to 4 year olds has the highest likelihood of being enrolled in private schools, with 577 (63.6% in the age bracket) enrolled. Conversely, the age group of 15 to 17 year olds has the lowest likelihood of being enrolled in a private school, with 1,705 (83.6% in the age bracket) attending a public institution.
| Age Bracket | Public School | Private School |
| 3 to 4 Year Olds | 330 (36.4%) | 577 (63.6%) |
| 5 to 9 Year Old | 2,405 (79.0%) | 638 (21.0%) |
| 10 to 14 Year Olds | 2,921 (82.8%) | 606 (17.2%) |
| 15 to 17 Year Olds | 1,705 (83.6%) | 334 (16.4%) |
| 18 to 19 Year Olds | 629 (77.9%) | 178 (22.1%) |
| 20 to 24 Year Olds | 537 (77.9%) | 152 (22.1%) |
| 25 to 34 Year Olds | 217 (61.0%) | 139 (39.0%) |
| 35 Years and over | 382 (66.5%) | 192 (33.5%) |
| Total | 9,124 (76.4%) | 2,818 (23.6%) |
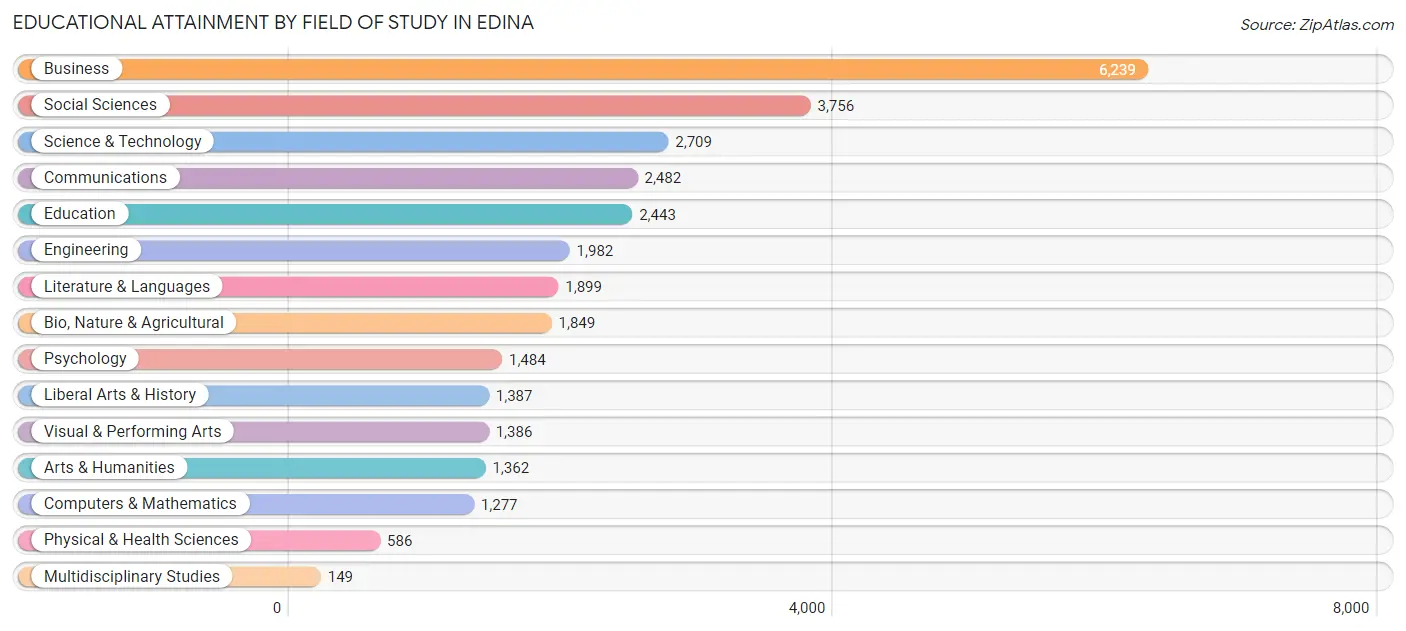
Educational Attainment by Field of Study in Edina
Business (6,239 | 20.1%), social sciences (3,756 | 12.1%), science & technology (2,709 | 8.7%), communications (2,482 | 8.0%), and education (2,443 | 7.9%) are the most common fields of study among 30,990 individuals in Edina who have obtained a bachelor's degree or higher.
| Field of Study | # Graduates | % Graduates |
| Computers & Mathematics | 1,277 | 4.1% |
| Bio, Nature & Agricultural | 1,849 | 6.0% |
| Physical & Health Sciences | 586 | 1.9% |
| Psychology | 1,484 | 4.8% |
| Social Sciences | 3,756 | 12.1% |
| Engineering | 1,982 | 6.4% |
| Multidisciplinary Studies | 149 | 0.5% |
| Science & Technology | 2,709 | 8.7% |
| Business | 6,239 | 20.1% |
| Education | 2,443 | 7.9% |
| Literature & Languages | 1,899 | 6.1% |
| Liberal Arts & History | 1,387 | 4.5% |
| Visual & Performing Arts | 1,386 | 4.5% |
| Communications | 2,482 | 8.0% |
| Arts & Humanities | 1,362 | 4.4% |
| Total | 30,990 | 100.0% |
Transportation & Commute in Edina
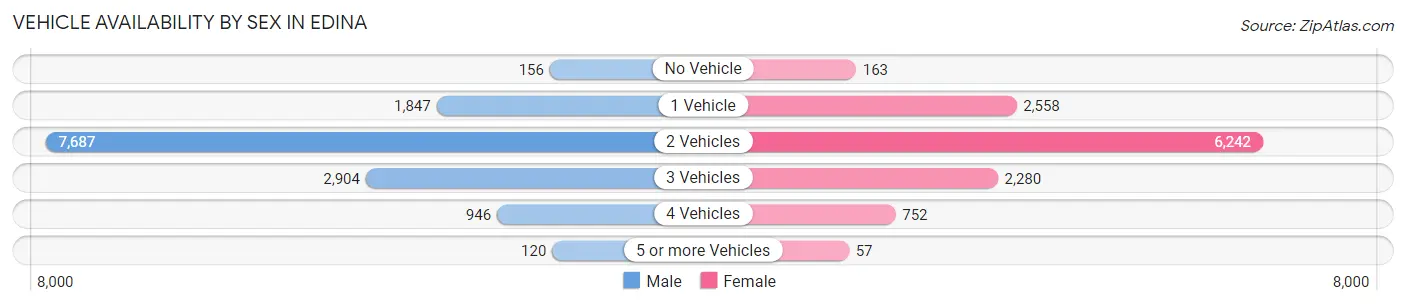
Vehicle Availability by Sex in Edina
The most prevalent vehicle ownership categories in Edina are males with 2 vehicles (7,687, accounting for 56.3%) and females with 2 vehicles (6,242, making up 63.8%).
| Vehicles Available | Male | Female |
| No Vehicle | 156 (1.1%) | 163 (1.3%) |
| 1 Vehicle | 1,847 (13.5%) | 2,558 (21.2%) |
| 2 Vehicles | 7,687 (56.3%) | 6,242 (51.8%) |
| 3 Vehicles | 2,904 (21.3%) | 2,280 (18.9%) |
| 4 Vehicles | 946 (6.9%) | 752 (6.2%) |
| 5 or more Vehicles | 120 (0.9%) | 57 (0.5%) |
| Total | 13,660 (100.0%) | 12,052 (100.0%) |
Commute Time in Edina
The most frequently occuring commute durations in Edina are 15 to 19 minutes (3,880 commuters, 19.4%), 20 to 24 minutes (3,621 commuters, 18.1%), and 10 to 14 minutes (3,019 commuters, 15.1%).
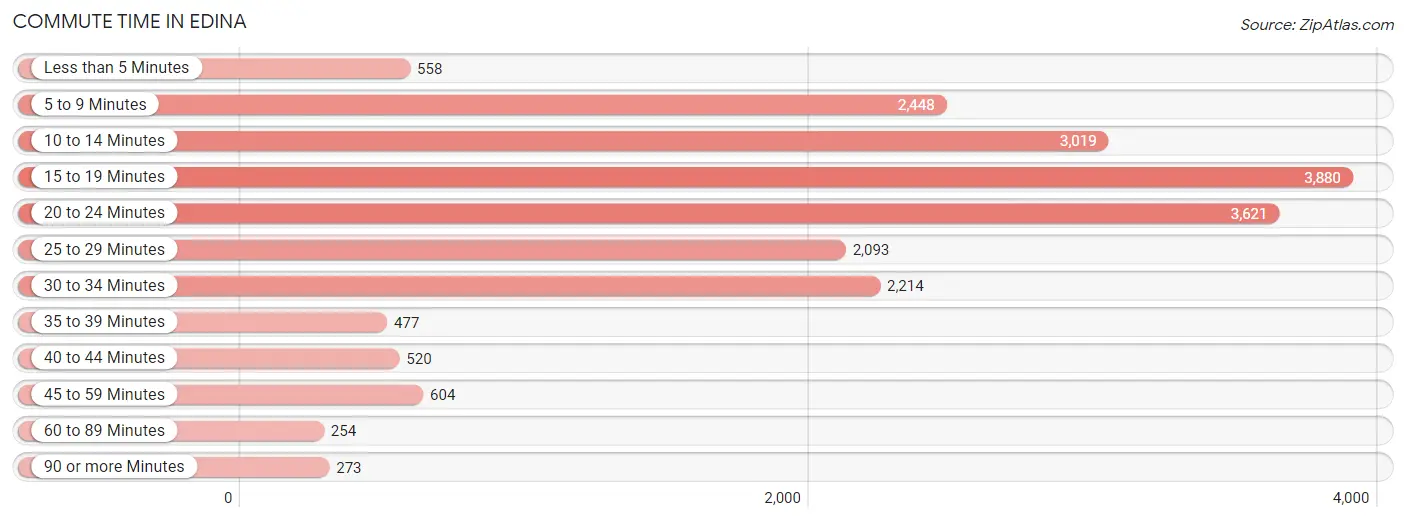
| Commute Time | # Commuters | % Commuters |
| Less than 5 Minutes | 558 | 2.8% |
| 5 to 9 Minutes | 2,448 | 12.3% |
| 10 to 14 Minutes | 3,019 | 15.1% |
| 15 to 19 Minutes | 3,880 | 19.4% |
| 20 to 24 Minutes | 3,621 | 18.1% |
| 25 to 29 Minutes | 2,093 | 10.5% |
| 30 to 34 Minutes | 2,214 | 11.1% |
| 35 to 39 Minutes | 477 | 2.4% |
| 40 to 44 Minutes | 520 | 2.6% |
| 45 to 59 Minutes | 604 | 3.0% |
| 60 to 89 Minutes | 254 | 1.3% |
| 90 or more Minutes | 273 | 1.4% |
Commute Time by Sex in Edina
The most common commute times in Edina are 15 to 19 minutes (2,184 commuters, 20.1%) for males and 15 to 19 minutes (1,696 commuters, 18.6%) for females.
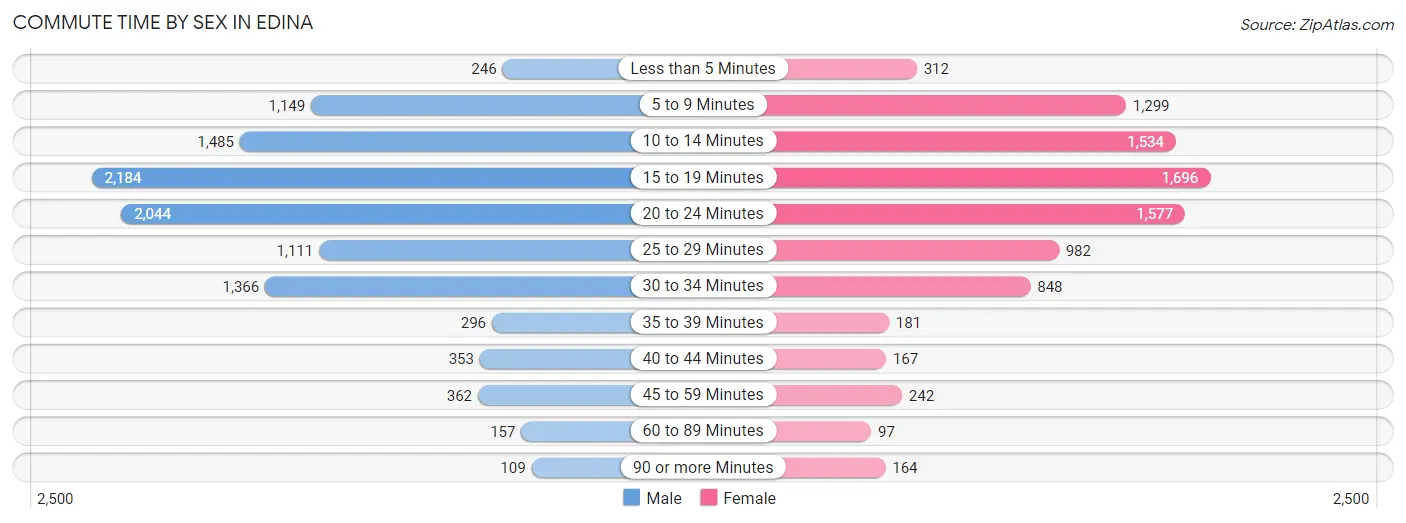
| Commute Time | Male | Female |
| Less than 5 Minutes | 246 (2.3%) | 312 (3.4%) |
| 5 to 9 Minutes | 1,149 (10.6%) | 1,299 (14.3%) |
| 10 to 14 Minutes | 1,485 (13.7%) | 1,534 (16.9%) |
| 15 to 19 Minutes | 2,184 (20.1%) | 1,696 (18.6%) |
| 20 to 24 Minutes | 2,044 (18.8%) | 1,577 (17.3%) |
| 25 to 29 Minutes | 1,111 (10.2%) | 982 (10.8%) |
| 30 to 34 Minutes | 1,366 (12.6%) | 848 (9.3%) |
| 35 to 39 Minutes | 296 (2.7%) | 181 (2.0%) |
| 40 to 44 Minutes | 353 (3.3%) | 167 (1.8%) |
| 45 to 59 Minutes | 362 (3.3%) | 242 (2.7%) |
| 60 to 89 Minutes | 157 (1.5%) | 97 (1.1%) |
| 90 or more Minutes | 109 (1.0%) | 164 (1.8%) |
Time of Departure to Work by Sex in Edina
The most frequent times of departure to work in Edina are 8:00 AM to 8:29 AM (2,084, 19.2%) for males and 7:00 AM to 7:29 AM (1,407, 15.5%) for females.
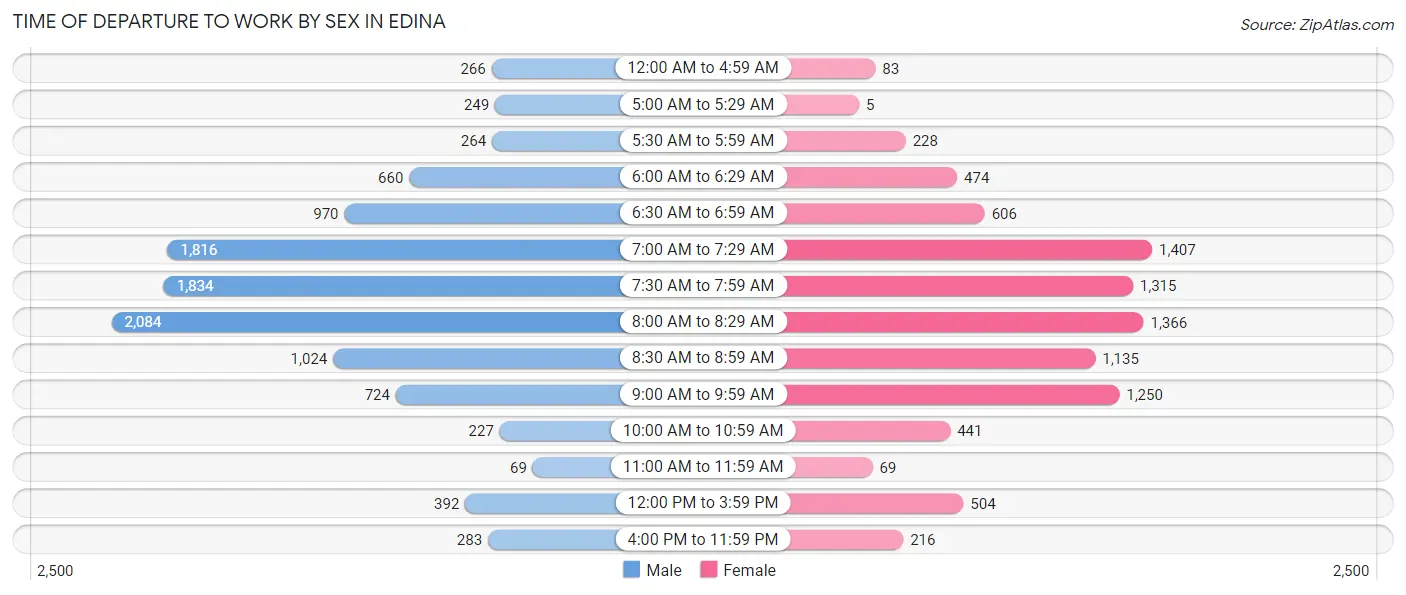
| Time of Departure | Male | Female |
| 12:00 AM to 4:59 AM | 266 (2.5%) | 83 (0.9%) |
| 5:00 AM to 5:29 AM | 249 (2.3%) | 5 (0.1%) |
| 5:30 AM to 5:59 AM | 264 (2.4%) | 228 (2.5%) |
| 6:00 AM to 6:29 AM | 660 (6.1%) | 474 (5.2%) |
| 6:30 AM to 6:59 AM | 970 (8.9%) | 606 (6.7%) |
| 7:00 AM to 7:29 AM | 1,816 (16.7%) | 1,407 (15.5%) |
| 7:30 AM to 7:59 AM | 1,834 (16.9%) | 1,315 (14.4%) |
| 8:00 AM to 8:29 AM | 2,084 (19.2%) | 1,366 (15.0%) |
| 8:30 AM to 8:59 AM | 1,024 (9.4%) | 1,135 (12.5%) |
| 9:00 AM to 9:59 AM | 724 (6.7%) | 1,250 (13.7%) |
| 10:00 AM to 10:59 AM | 227 (2.1%) | 441 (4.9%) |
| 11:00 AM to 11:59 AM | 69 (0.6%) | 69 (0.8%) |
| 12:00 PM to 3:59 PM | 392 (3.6%) | 504 (5.5%) |
| 4:00 PM to 11:59 PM | 283 (2.6%) | 216 (2.4%) |
| Total | 10,862 (100.0%) | 9,099 (100.0%) |
Housing Occupancy in Edina
Occupancy by Ownership in Edina
Of the total 22,609 dwellings in Edina, owner-occupied units account for 16,034 (70.9%), while renter-occupied units make up 6,575 (29.1%).
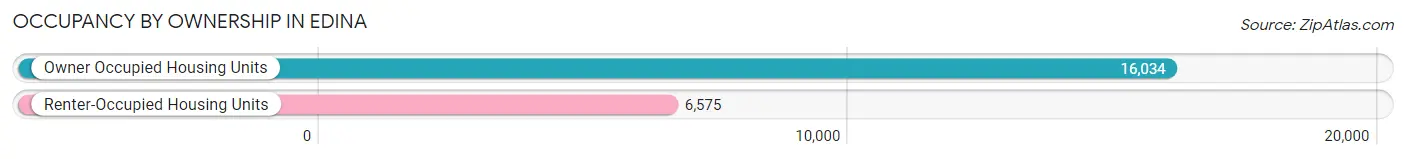
| Occupancy | # Housing Units | % Housing Units |
| Owner Occupied Housing Units | 16,034 | 70.9% |
| Renter-Occupied Housing Units | 6,575 | 29.1% |
| Total Occupied Housing Units | 22,609 | 100.0% |
Occupancy by Household Size in Edina
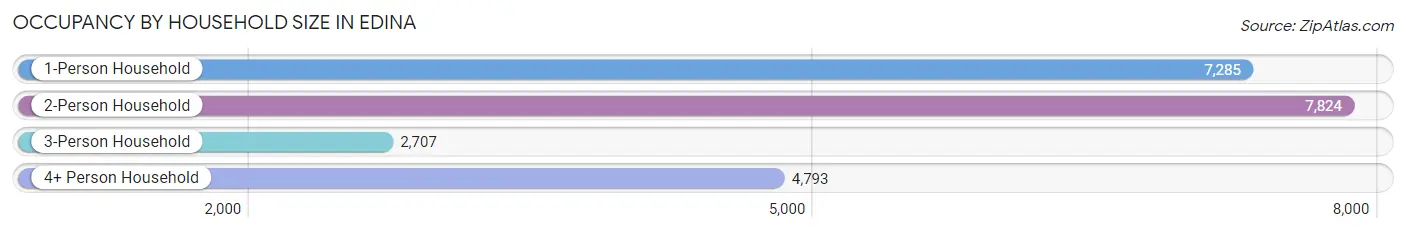
| Household Size | # Housing Units | % Housing Units |
| 1-Person Household | 7,285 | 32.2% |
| 2-Person Household | 7,824 | 34.6% |
| 3-Person Household | 2,707 | 12.0% |
| 4+ Person Household | 4,793 | 21.2% |
| Total Housing Units | 22,609 | 100.0% |
Occupancy by Ownership by Household Size in Edina
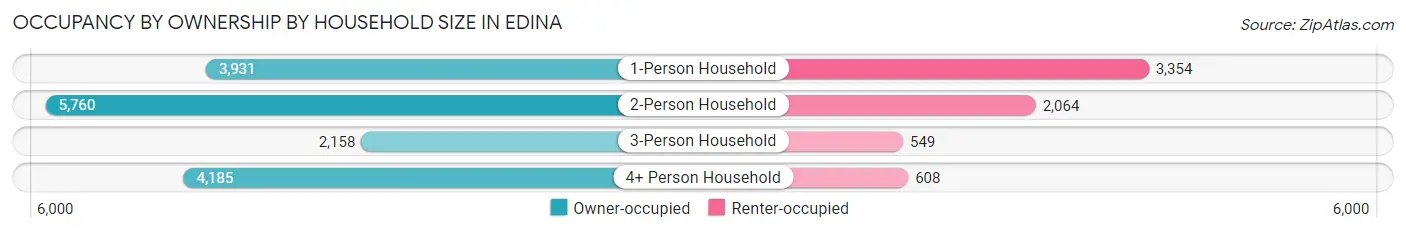
| Household Size | Owner-occupied | Renter-occupied |
| 1-Person Household | 3,931 (54.0%) | 3,354 (46.0%) |
| 2-Person Household | 5,760 (73.6%) | 2,064 (26.4%) |
| 3-Person Household | 2,158 (79.7%) | 549 (20.3%) |
| 4+ Person Household | 4,185 (87.3%) | 608 (12.7%) |
| Total Housing Units | 16,034 (70.9%) | 6,575 (29.1%) |
Occupancy by Educational Attainment in Edina
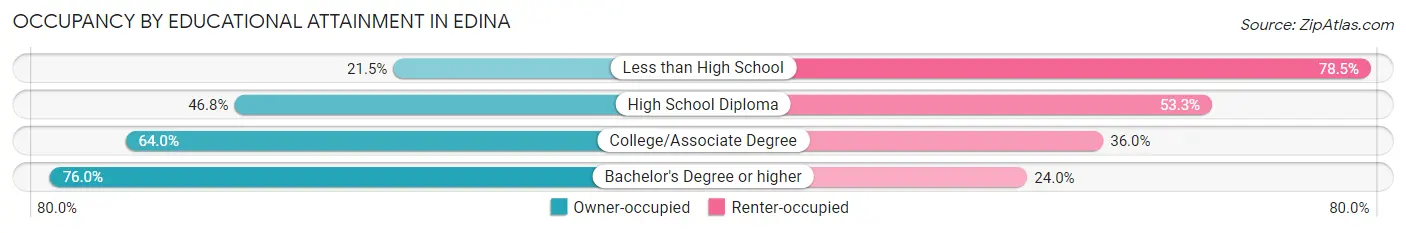
| Household Size | Owner-occupied | Renter-occupied |
| Less than High School | 56 (21.5%) | 204 (78.5%) |
| High School Diploma | 783 (46.8%) | 892 (53.2%) |
| College/Associate Degree | 2,758 (64.0%) | 1,553 (36.0%) |
| Bachelor's Degree or higher | 12,437 (76.0%) | 3,926 (24.0%) |
Occupancy by Age of Householder in Edina
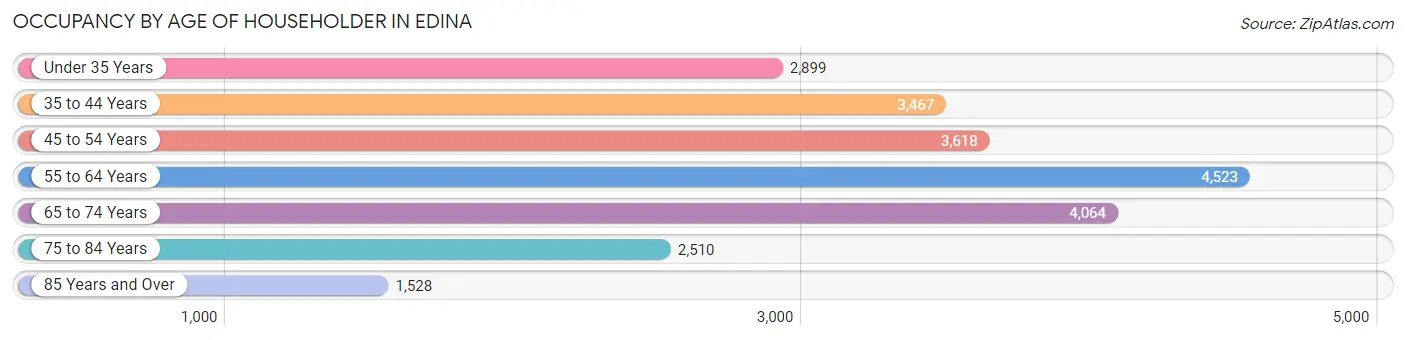
| Age Bracket | # Households | % Households |
| Under 35 Years | 2,899 | 12.8% |
| 35 to 44 Years | 3,467 | 15.3% |
| 45 to 54 Years | 3,618 | 16.0% |
| 55 to 64 Years | 4,523 | 20.0% |
| 65 to 74 Years | 4,064 | 18.0% |
| 75 to 84 Years | 2,510 | 11.1% |
| 85 Years and Over | 1,528 | 6.8% |
| Total | 22,609 | 100.0% |
Housing Finances in Edina
Median Income by Occupancy in Edina
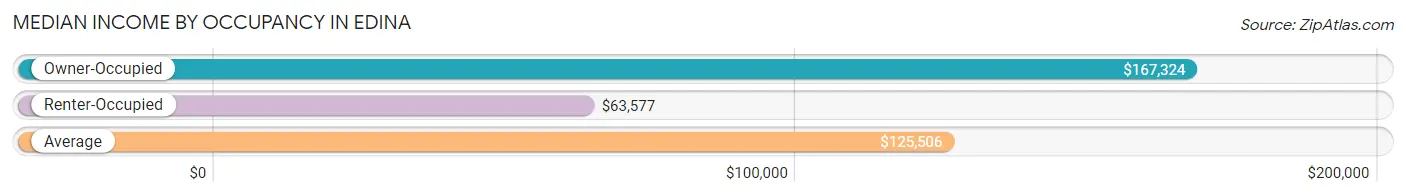
| Occupancy Type | # Households | Median Income |
| Owner-Occupied | 16,034 (70.9%) | $167,324 |
| Renter-Occupied | 6,575 (29.1%) | $63,577 |
| Average | 22,609 (100.0%) | $125,506 |
Occupancy by Householder Income Bracket in Edina
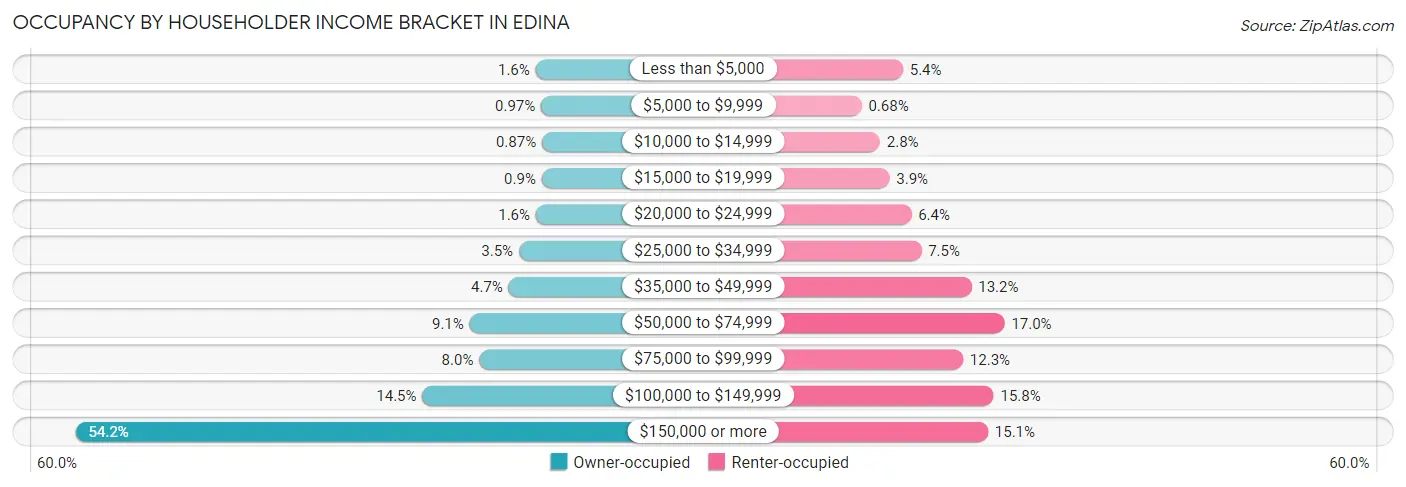
| Income Bracket | Owner-occupied | Renter-occupied |
| Less than $5,000 | 257 (1.6%) | 355 (5.4%) |
| $5,000 to $9,999 | 155 (1.0%) | 45 (0.7%) |
| $10,000 to $14,999 | 140 (0.9%) | 183 (2.8%) |
| $15,000 to $19,999 | 144 (0.9%) | 254 (3.9%) |
| $20,000 to $24,999 | 251 (1.6%) | 418 (6.4%) |
| $25,000 to $34,999 | 561 (3.5%) | 493 (7.5%) |
| $35,000 to $49,999 | 751 (4.7%) | 870 (13.2%) |
| $50,000 to $74,999 | 1,465 (9.1%) | 1,119 (17.0%) |
| $75,000 to $99,999 | 1,289 (8.0%) | 807 (12.3%) |
| $100,000 to $149,999 | 2,332 (14.5%) | 1,037 (15.8%) |
| $150,000 or more | 8,689 (54.2%) | 994 (15.1%) |
| Total | 16,034 (100.0%) | 6,575 (100.0%) |
Monthly Housing Cost Tiers in Edina
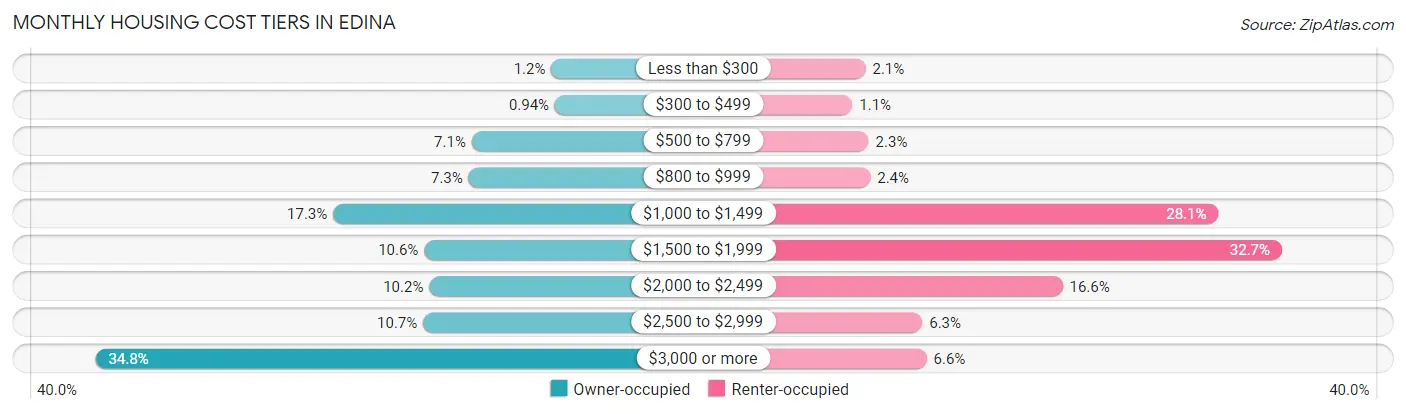
| Monthly Cost | Owner-occupied | Renter-occupied |
| Less than $300 | 194 (1.2%) | 136 (2.1%) |
| $300 to $499 | 151 (0.9%) | 72 (1.1%) |
| $500 to $799 | 1,134 (7.1%) | 151 (2.3%) |
| $800 to $999 | 1,170 (7.3%) | 159 (2.4%) |
| $1,000 to $1,499 | 2,771 (17.3%) | 1,844 (28.1%) |
| $1,500 to $1,999 | 1,695 (10.6%) | 2,152 (32.7%) |
| $2,000 to $2,499 | 1,635 (10.2%) | 1,090 (16.6%) |
| $2,500 to $2,999 | 1,707 (10.6%) | 411 (6.2%) |
| $3,000 or more | 5,577 (34.8%) | 432 (6.6%) |
| Total | 16,034 (100.0%) | 6,575 (100.0%) |
Physical Housing Characteristics in Edina
Housing Structures in Edina
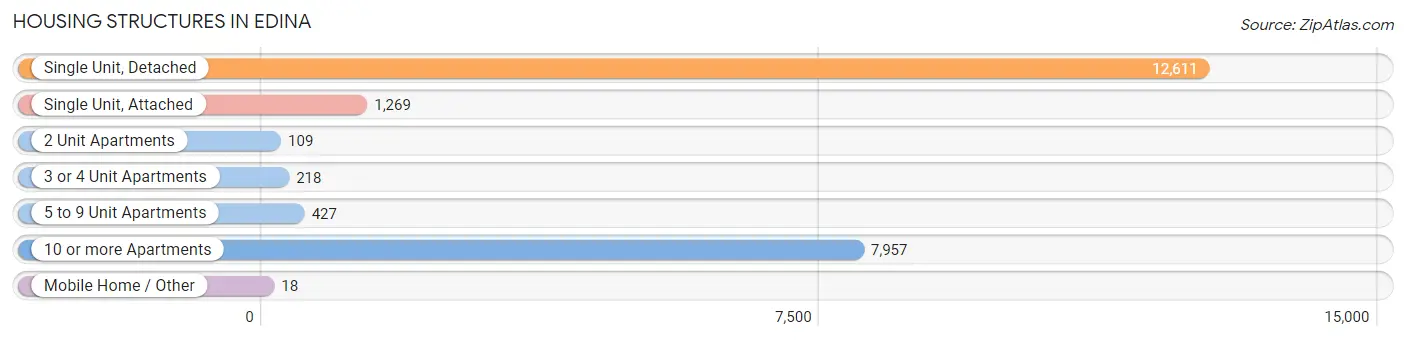
| Structure Type | # Housing Units | % Housing Units |
| Single Unit, Detached | 12,611 | 55.8% |
| Single Unit, Attached | 1,269 | 5.6% |
| 2 Unit Apartments | 109 | 0.5% |
| 3 or 4 Unit Apartments | 218 | 1.0% |
| 5 to 9 Unit Apartments | 427 | 1.9% |
| 10 or more Apartments | 7,957 | 35.2% |
| Mobile Home / Other | 18 | 0.1% |
| Total | 22,609 | 100.0% |
Housing Structures by Occupancy in Edina
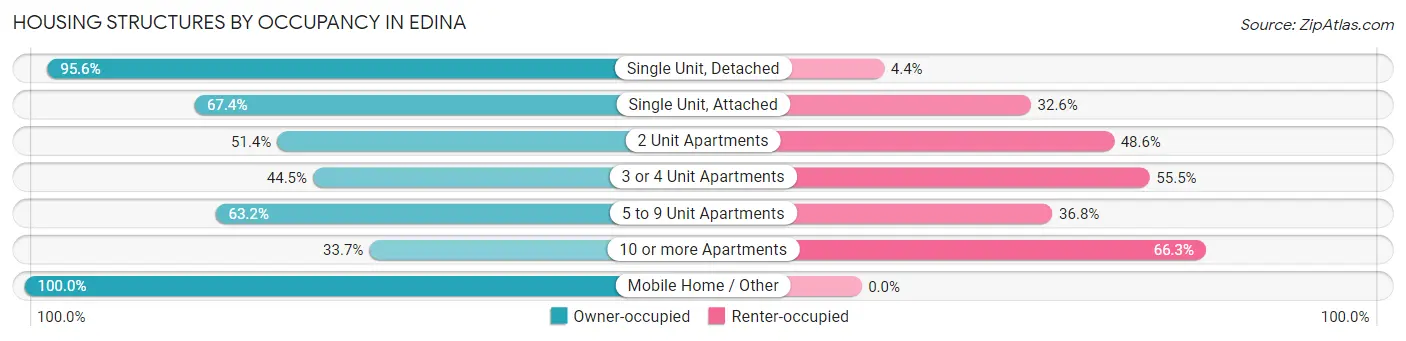
| Structure Type | Owner-occupied | Renter-occupied |
| Single Unit, Detached | 12,060 (95.6%) | 551 (4.4%) |
| Single Unit, Attached | 855 (67.4%) | 414 (32.6%) |
| 2 Unit Apartments | 56 (51.4%) | 53 (48.6%) |
| 3 or 4 Unit Apartments | 97 (44.5%) | 121 (55.5%) |
| 5 to 9 Unit Apartments | 270 (63.2%) | 157 (36.8%) |
| 10 or more Apartments | 2,678 (33.7%) | 5,279 (66.3%) |
| Mobile Home / Other | 18 (100.0%) | 0 (0.0%) |
| Total | 16,034 (70.9%) | 6,575 (29.1%) |
Housing Structures by Number of Rooms in Edina
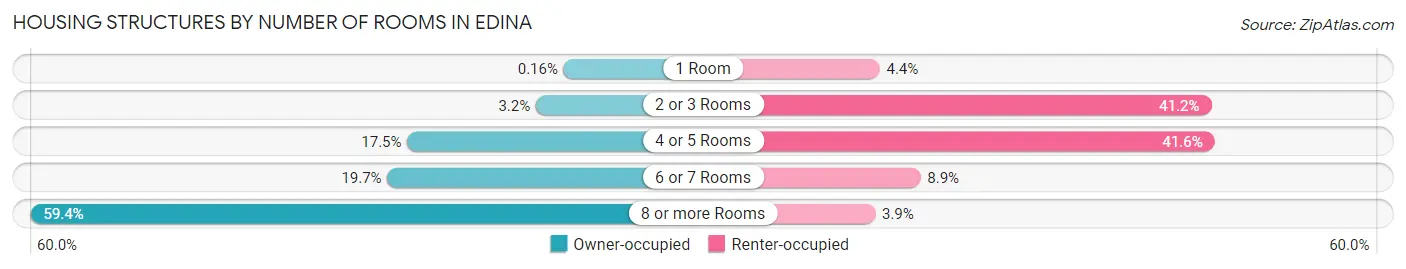
| Number of Rooms | Owner-occupied | Renter-occupied |
| 1 Room | 25 (0.2%) | 289 (4.4%) |
| 2 or 3 Rooms | 520 (3.2%) | 2,710 (41.2%) |
| 4 or 5 Rooms | 2,809 (17.5%) | 2,733 (41.6%) |
| 6 or 7 Rooms | 3,164 (19.7%) | 587 (8.9%) |
| 8 or more Rooms | 9,516 (59.4%) | 256 (3.9%) |
| Total | 16,034 (100.0%) | 6,575 (100.0%) |
Housing Structure by Heating Type in Edina
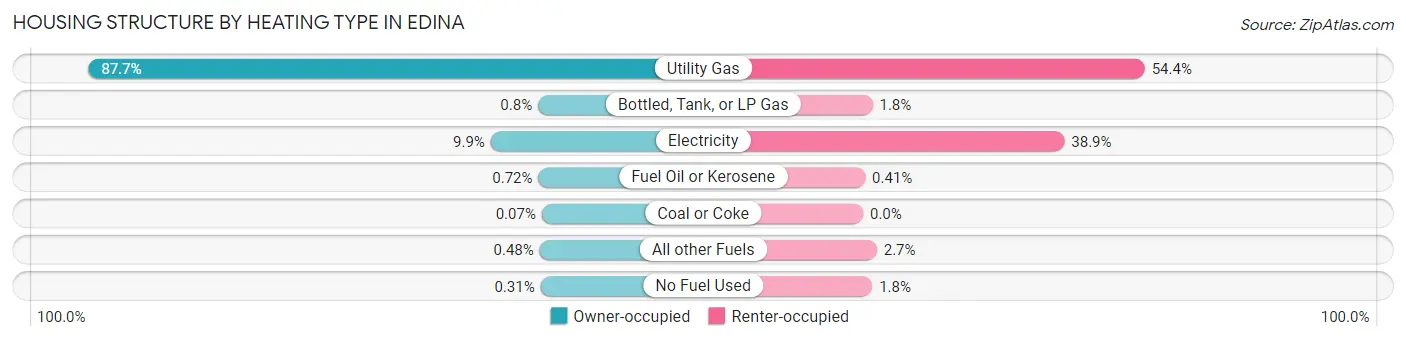
| Heating Type | Owner-occupied | Renter-occupied |
| Utility Gas | 14,058 (87.7%) | 3,579 (54.4%) |
| Bottled, Tank, or LP Gas | 129 (0.8%) | 120 (1.8%) |
| Electricity | 1,593 (9.9%) | 2,558 (38.9%) |
| Fuel Oil or Kerosene | 116 (0.7%) | 27 (0.4%) |
| Coal or Coke | 11 (0.1%) | 0 (0.0%) |
| All other Fuels | 77 (0.5%) | 174 (2.6%) |
| No Fuel Used | 50 (0.3%) | 117 (1.8%) |
| Total | 16,034 (100.0%) | 6,575 (100.0%) |
Household Vehicle Usage in Edina
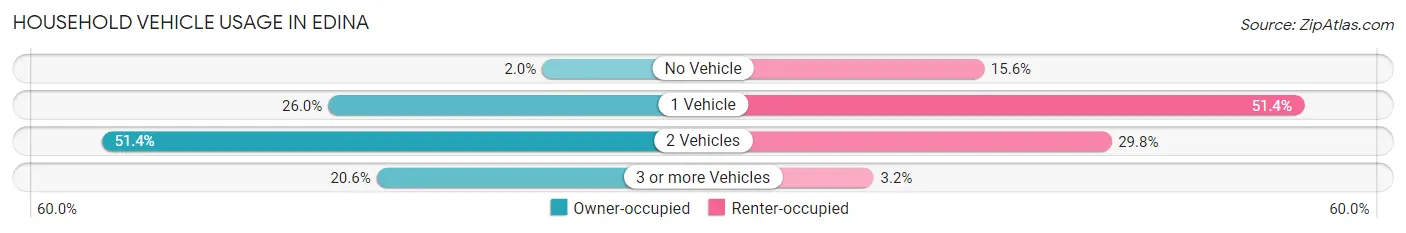
| Vehicles per Household | Owner-occupied | Renter-occupied |
| No Vehicle | 325 (2.0%) | 1,024 (15.6%) |
| 1 Vehicle | 4,169 (26.0%) | 3,379 (51.4%) |
| 2 Vehicles | 8,240 (51.4%) | 1,961 (29.8%) |
| 3 or more Vehicles | 3,300 (20.6%) | 211 (3.2%) |
| Total | 16,034 (100.0%) | 6,575 (100.0%) |
Real Estate & Mortgages in Edina
Real Estate and Mortgage Overview in Edina
| Characteristic | Without Mortgage | With Mortgage |
| Housing Units | 5,731 | 10,303 |
| Median Property Value | $502,300 | $645,100 |
| Median Household Income | $96,511 | $6,709 |
| Monthly Housing Costs | $1,077 | $5,280 |
| Real Estate Taxes | $5,869 | $44 |
Property Value by Mortgage Status in Edina
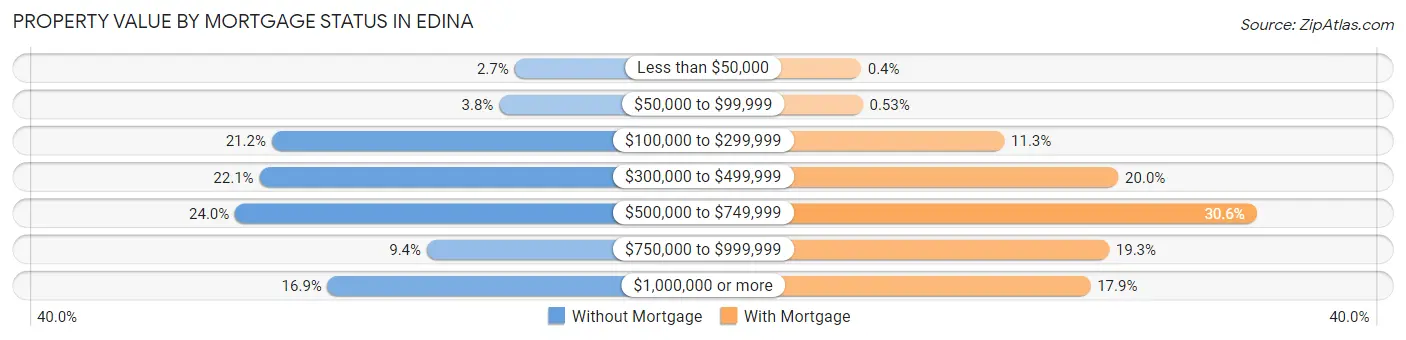
| Property Value | Without Mortgage | With Mortgage |
| Less than $50,000 | 153 (2.7%) | 41 (0.4%) |
| $50,000 to $99,999 | 220 (3.8%) | 55 (0.5%) |
| $100,000 to $299,999 | 1,213 (21.2%) | 1,166 (11.3%) |
| $300,000 to $499,999 | 1,267 (22.1%) | 2,062 (20.0%) |
| $500,000 to $749,999 | 1,373 (24.0%) | 3,149 (30.6%) |
| $750,000 to $999,999 | 536 (9.3%) | 1,988 (19.3%) |
| $1,000,000 or more | 969 (16.9%) | 1,842 (17.9%) |
| Total | 5,731 (100.0%) | 10,303 (100.0%) |
Household Income by Mortgage Status in Edina
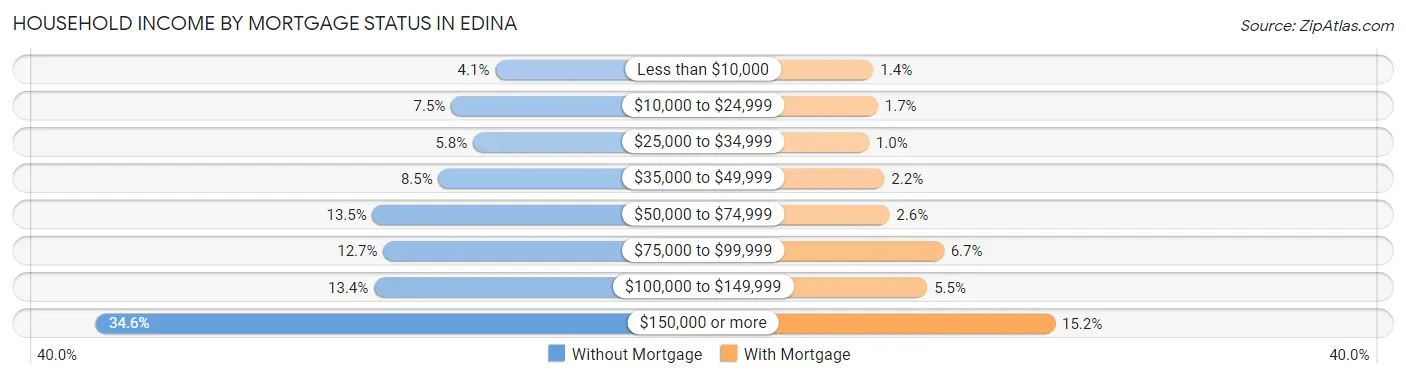
| Household Income | Without Mortgage | With Mortgage |
| Less than $10,000 | 237 (4.1%) | 140 (1.4%) |
| $10,000 to $24,999 | 430 (7.5%) | 175 (1.7%) |
| $25,000 to $34,999 | 334 (5.8%) | 105 (1.0%) |
| $35,000 to $49,999 | 485 (8.5%) | 227 (2.2%) |
| $50,000 to $74,999 | 773 (13.5%) | 266 (2.6%) |
| $75,000 to $99,999 | 726 (12.7%) | 692 (6.7%) |
| $100,000 to $149,999 | 766 (13.4%) | 563 (5.5%) |
| $150,000 or more | 1,980 (34.5%) | 1,566 (15.2%) |
| Total | 5,731 (100.0%) | 10,303 (100.0%) |
Property Value to Household Income Ratio in Edina
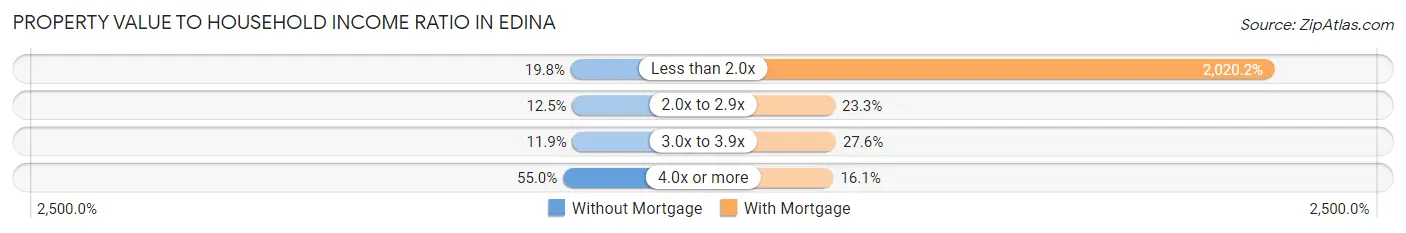
| Value-to-Income Ratio | Without Mortgage | With Mortgage |
| Less than 2.0x | 1,137 (19.8%) | 208,139 (2,020.2%) |
| 2.0x to 2.9x | 717 (12.5%) | 2,402 (23.3%) |
| 3.0x to 3.9x | 683 (11.9%) | 2,843 (27.6%) |
| 4.0x or more | 3,151 (55.0%) | 1,656 (16.1%) |
| Total | 5,731 (100.0%) | 10,303 (100.0%) |
Real Estate Taxes by Mortgage Status in Edina
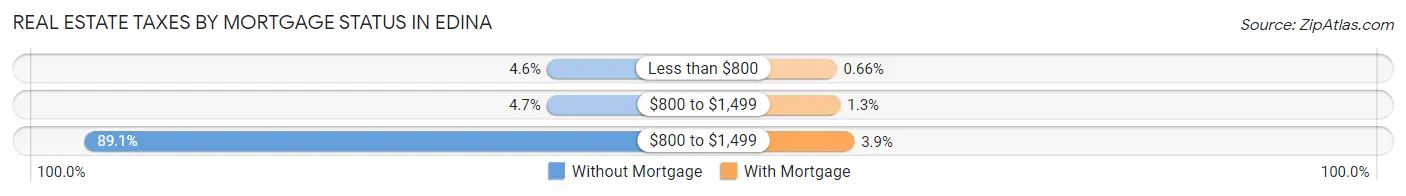
| Property Taxes | Without Mortgage | With Mortgage |
| Less than $800 | 264 (4.6%) | 68 (0.7%) |
| $800 to $1,499 | 267 (4.7%) | 138 (1.3%) |
| $800 to $1,499 | 5,106 (89.1%) | 398 (3.9%) |
| Total | 5,731 (100.0%) | 10,303 (100.0%) |
Health & Disability in Edina
Health Insurance Coverage by Age in Edina
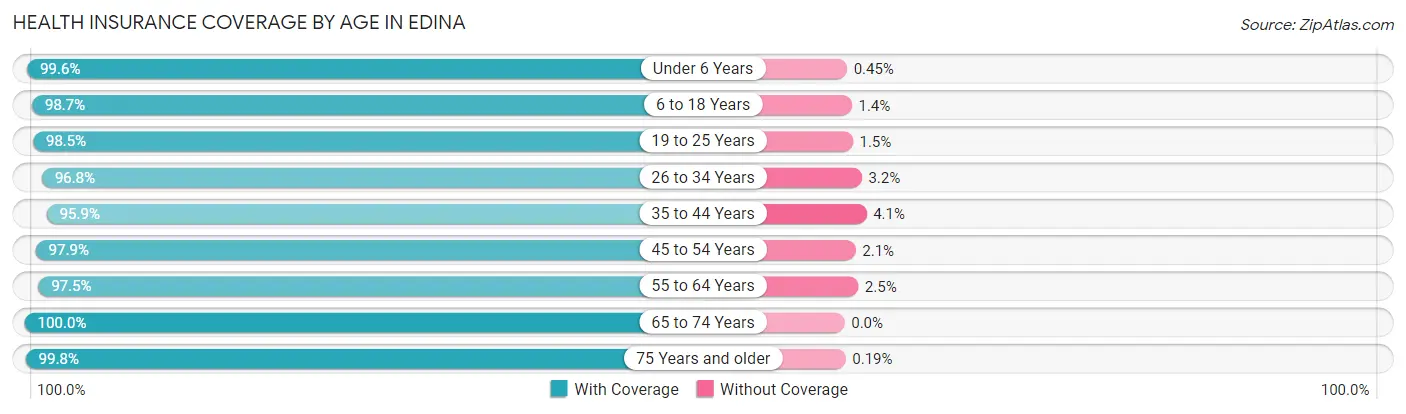
| Age Bracket | With Coverage | Without Coverage |
| Under 6 Years | 3,546 (99.6%) | 16 (0.4%) |
| 6 to 18 Years | 8,740 (98.7%) | 120 (1.3%) |
| 19 to 25 Years | 2,804 (98.5%) | 44 (1.5%) |
| 26 to 34 Years | 4,268 (96.8%) | 141 (3.2%) |
| 35 to 44 Years | 6,652 (95.9%) | 284 (4.1%) |
| 45 to 54 Years | 6,382 (97.9%) | 134 (2.1%) |
| 55 to 64 Years | 7,491 (97.5%) | 195 (2.5%) |
| 65 to 74 Years | 6,045 (100.0%) | 0 (0.0%) |
| 75 Years and older | 5,686 (99.8%) | 11 (0.2%) |
| Total | 51,614 (98.2%) | 945 (1.8%) |
Health Insurance Coverage by Citizenship Status in Edina
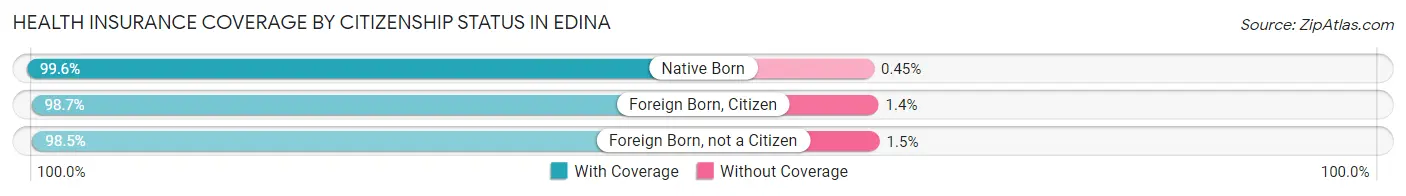
| Citizenship Status | With Coverage | Without Coverage |
| Native Born | 3,546 (99.6%) | 16 (0.4%) |
| Foreign Born, Citizen | 8,740 (98.7%) | 120 (1.3%) |
| Foreign Born, not a Citizen | 2,804 (98.5%) | 44 (1.5%) |
Health Insurance Coverage by Household Income in Edina
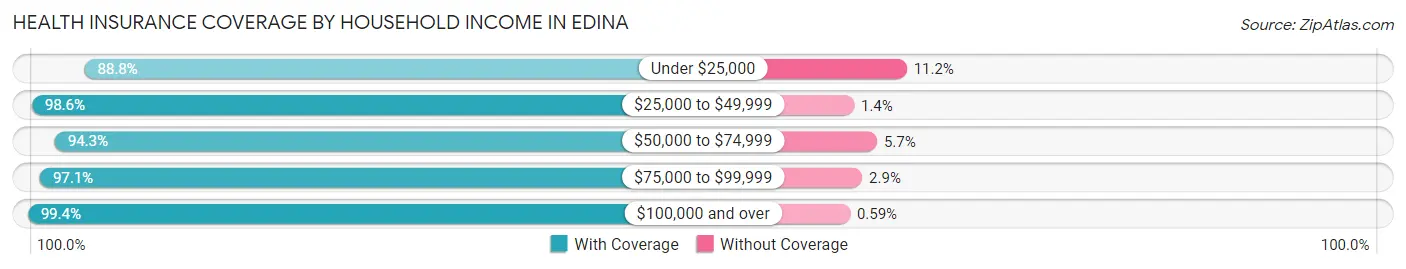
| Household Income | With Coverage | Without Coverage |
| Under $25,000 | 2,532 (88.8%) | 320 (11.2%) |
| $25,000 to $49,999 | 4,286 (98.6%) | 59 (1.4%) |
| $50,000 to $74,999 | 3,899 (94.3%) | 234 (5.7%) |
| $75,000 to $99,999 | 3,745 (97.1%) | 111 (2.9%) |
| $100,000 and over | 36,971 (99.4%) | 219 (0.6%) |
Public vs Private Health Insurance Coverage by Age in Edina
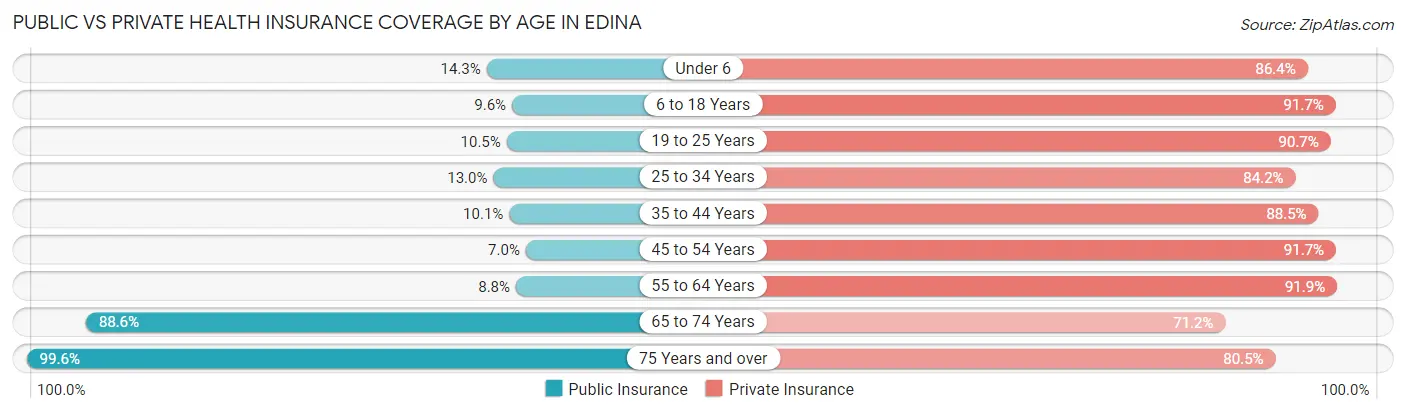
| Age Bracket | Public Insurance | Private Insurance |
| Under 6 | 508 (14.3%) | 3,079 (86.4%) |
| 6 to 18 Years | 846 (9.6%) | 8,121 (91.7%) |
| 19 to 25 Years | 300 (10.5%) | 2,584 (90.7%) |
| 25 to 34 Years | 573 (13.0%) | 3,712 (84.2%) |
| 35 to 44 Years | 698 (10.1%) | 6,136 (88.5%) |
| 45 to 54 Years | 455 (7.0%) | 5,976 (91.7%) |
| 55 to 64 Years | 677 (8.8%) | 7,064 (91.9%) |
| 65 to 74 Years | 5,358 (88.6%) | 4,302 (71.2%) |
| 75 Years and over | 5,675 (99.6%) | 4,585 (80.5%) |
| Total | 15,090 (28.7%) | 45,559 (86.7%) |
Disability Status by Sex by Age in Edina
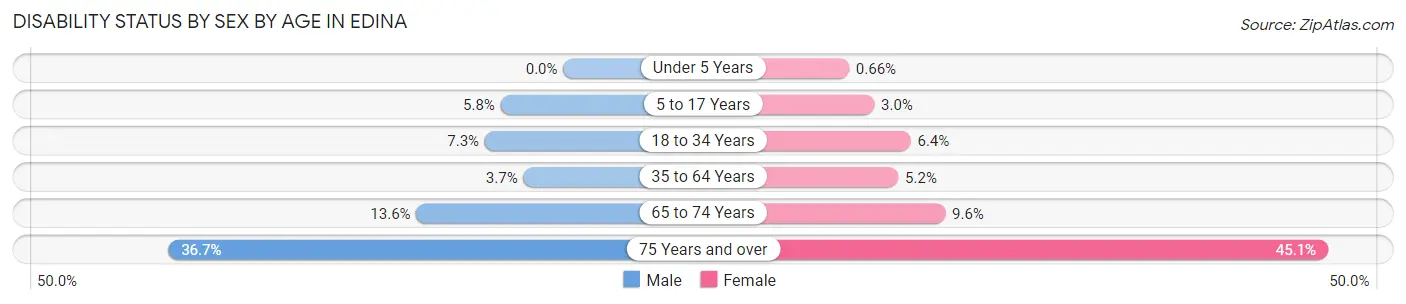
| Age Bracket | Male | Female |
| Under 5 Years | 0 (0.0%) | 10 (0.7%) |
| 5 to 17 Years | 278 (5.8%) | 122 (3.0%) |
| 18 to 34 Years | 298 (7.3%) | 242 (6.4%) |
| 35 to 64 Years | 371 (3.7%) | 582 (5.2%) |
| 65 to 74 Years | 351 (13.6%) | 333 (9.6%) |
| 75 Years and over | 787 (36.7%) | 1,602 (45.1%) |
Disability Class by Sex by Age in Edina
Disability Class: Hearing Difficulty
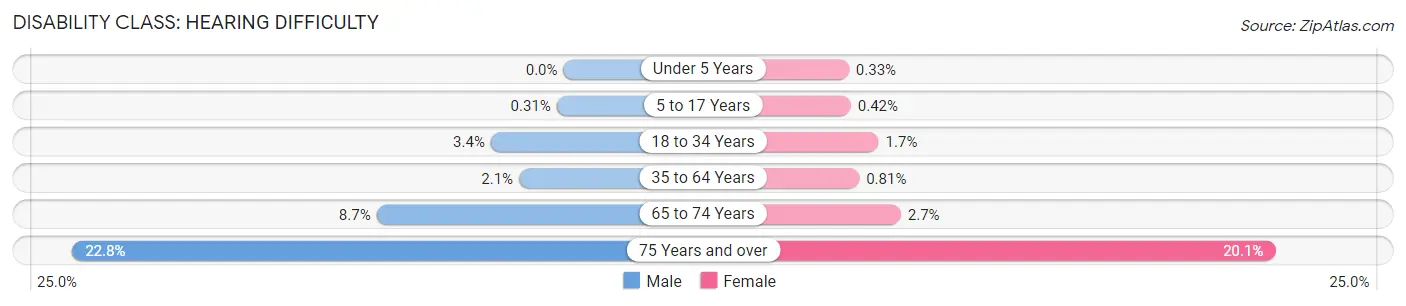
| Age Bracket | Male | Female |
| Under 5 Years | 0 (0.0%) | 5 (0.3%) |
| 5 to 17 Years | 15 (0.3%) | 17 (0.4%) |
| 18 to 34 Years | 138 (3.4%) | 65 (1.7%) |
| 35 to 64 Years | 206 (2.1%) | 90 (0.8%) |
| 65 to 74 Years | 223 (8.7%) | 95 (2.7%) |
| 75 Years and over | 489 (22.8%) | 714 (20.1%) |
Disability Class: Vision Difficulty
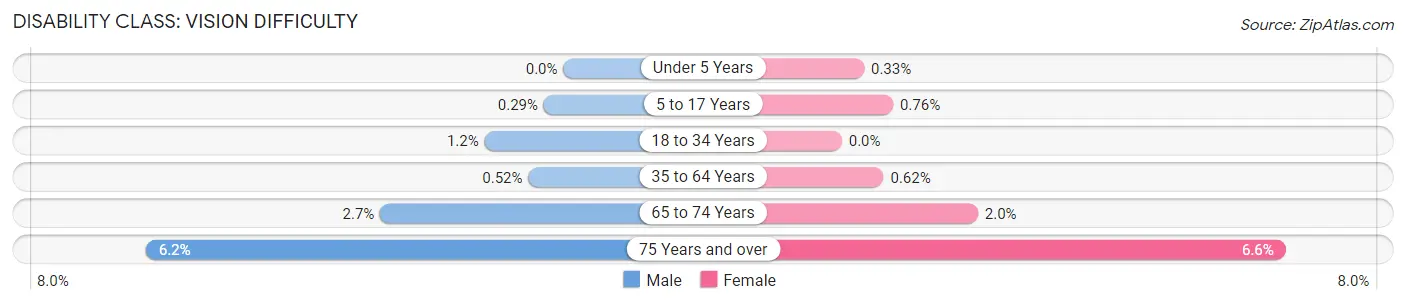
| Age Bracket | Male | Female |
| Under 5 Years | 0 (0.0%) | 5 (0.3%) |
| 5 to 17 Years | 14 (0.3%) | 31 (0.8%) |
| 18 to 34 Years | 48 (1.2%) | 0 (0.0%) |
| 35 to 64 Years | 52 (0.5%) | 69 (0.6%) |
| 65 to 74 Years | 70 (2.7%) | 70 (2.0%) |
| 75 Years and over | 133 (6.2%) | 234 (6.6%) |
Disability Class: Cognitive Difficulty
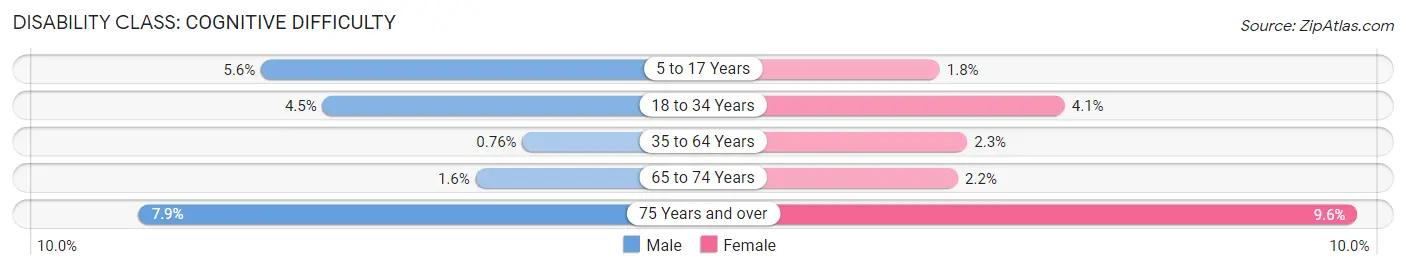
| Age Bracket | Male | Female |
| 5 to 17 Years | 268 (5.6%) | 74 (1.8%) |
| 18 to 34 Years | 183 (4.5%) | 157 (4.1%) |
| 35 to 64 Years | 76 (0.8%) | 259 (2.3%) |
| 65 to 74 Years | 42 (1.6%) | 75 (2.2%) |
| 75 Years and over | 169 (7.9%) | 340 (9.6%) |
Disability Class: Ambulatory Difficulty
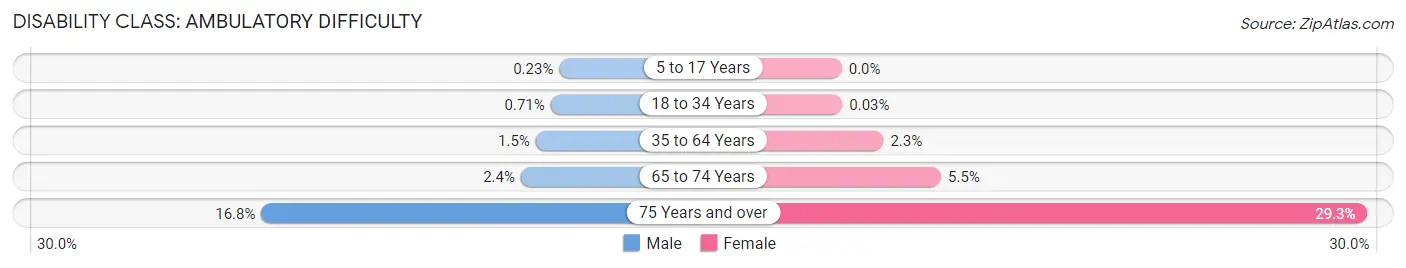
| Age Bracket | Male | Female |
| 5 to 17 Years | 11 (0.2%) | 0 (0.0%) |
| 18 to 34 Years | 29 (0.7%) | 1 (0.0%) |
| 35 to 64 Years | 154 (1.5%) | 258 (2.3%) |
| 65 to 74 Years | 61 (2.4%) | 192 (5.5%) |
| 75 Years and over | 361 (16.8%) | 1,039 (29.3%) |
Disability Class: Self-Care Difficulty
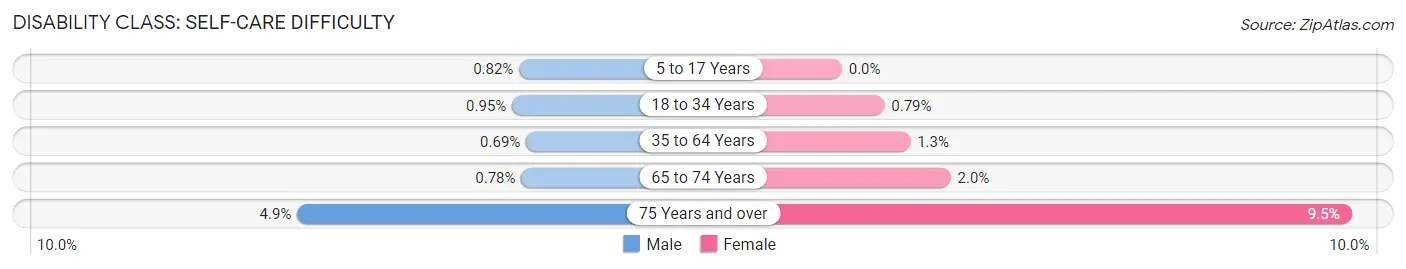
| Age Bracket | Male | Female |
| 5 to 17 Years | 39 (0.8%) | 0 (0.0%) |
| 18 to 34 Years | 39 (0.9%) | 30 (0.8%) |
| 35 to 64 Years | 69 (0.7%) | 141 (1.3%) |
| 65 to 74 Years | 20 (0.8%) | 70 (2.0%) |
| 75 Years and over | 106 (4.9%) | 336 (9.5%) |
Technology Access in Edina
Computing Device Access in Edina
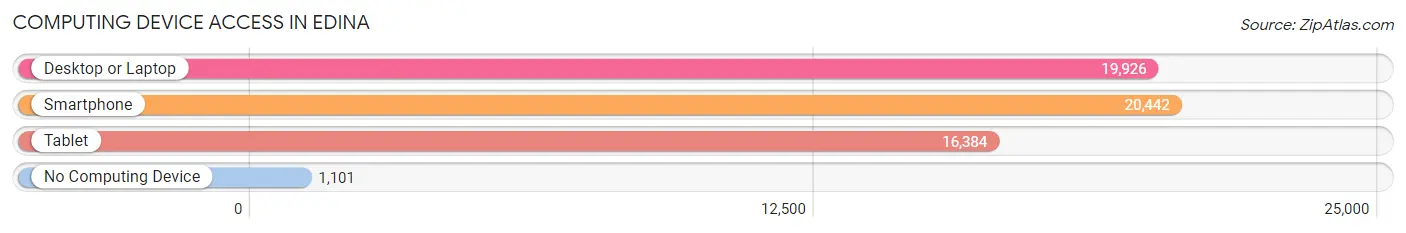
| Device Type | # Households | % Households |
| Desktop or Laptop | 19,926 | 88.1% |
| Smartphone | 20,442 | 90.4% |
| Tablet | 16,384 | 72.5% |
| No Computing Device | 1,101 | 4.9% |
| Total | 22,609 | 100.0% |
Internet Access in Edina
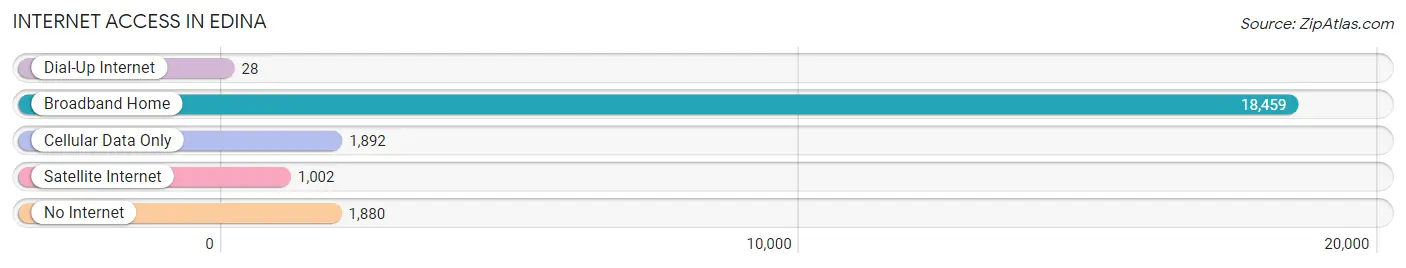
| Internet Type | # Households | % Households |
| Dial-Up Internet | 28 | 0.1% |
| Broadband Home | 18,459 | 81.6% |
| Cellular Data Only | 1,892 | 8.4% |
| Satellite Internet | 1,002 | 4.4% |
| No Internet | 1,880 | 8.3% |
| Total | 22,609 | 100.0% |
Edina Summary
Edina, Minnesota is a city located in Hennepin County, Minnesota, United States. It is a first-ring suburb situated immediately southwest of Minneapolis. The population was 47,941 at the 2010 census.
History
Edina was originally part of Richfield Township, Minnesota, which was incorporated in 1858. The first settlers arrived in the area in 1852. The township was named after the city of Richfield, Ohio. In 1888, the area now known as Edina was incorporated as a separate village. The name Edina was derived from Edinburgh, Scotland, the hometown of a first settler.
In 1905, Edina was incorporated as a city. The city grew rapidly in the 1950s and 1960s, and by 1970, the population had reached 28,000. In the 1970s, Edina began to experience a period of rapid growth and development, and by 1980, the population had grown to over 40,000.
Geography
Edina is located at 44°52′N 93°19′W (44.867, -93.317). According to the United States Census Bureau, the city has a total area of 13.2 square miles (34.2 km2), of which 12.9 square miles (33.4 km2) is land and 0.3 square miles (0.8 km2) is water.
Economy
Edina is home to a variety of businesses, including retail stores, restaurants, and professional services. The city is also home to several corporate headquarters, including the headquarters of the Minnesota Timberwolves and Lynx professional basketball teams.
The city is also home to the Southdale Center, the first enclosed shopping mall in the United States. The mall, which opened in 1956, is located in the heart of Edina and is home to over 150 stores and restaurants.
Demographics
As of the 2010 census, there were 47,941 people, 20,845 households, and 12,845 families residing in the city. The population density was 3,717.2 people per square mile (1,433.2/km2). There were 21,845 housing units at an average density of 1,689.2 per square mile (651.3/km2). The racial makeup of the city was 87.2% White, 4.3% African American, 0.2% Native American, 6.2% Asian, 0.1% Pacific Islander, 0.7% from other races, and 1.4% from two or more races. Hispanic or Latino of any race were 2.7% of the population.
The median income for a household in the city was $76,843, and the median income for a family was $95,837. Males had a median income of $60,945 versus $45,845 for females. The per capita income for the city was $41,945. About 2.2% of families and 3.7% of the population were below the poverty line, including 3.3% of those under age 18 and 4.2% of those age 65 or over.
Common Questions
What is Per Capita Income in Edina?
Per Capita income in Edina is $84,049.
What is the Median Family Income in Edina?
Median Family Income in Edina is $181,235.
What is the Median Household income in Edina?
Median Household Income in Edina is $125,506.
What is Income or Wage Gap in Edina?
Income or Wage Gap in Edina is 43.3%.
Women in Edina earn 56.7 cents for every dollar earned by a man.
What is Inequality or Gini Index in Edina?
Inequality or Gini Index in Edina is 0.52.
What is the Total Population of Edina?
Total Population of Edina is 53,037.
What is the Total Male Population of Edina?
Total Male Population of Edina is 25,299.
What is the Total Female Population of Edina?
Total Female Population of Edina is 27,738.
What is the Ratio of Males per 100 Females in Edina?
There are 91.21 Males per 100 Females in Edina.
What is the Ratio of Females per 100 Males in Edina?
There are 109.64 Females per 100 Males in Edina.
What is the Median Population Age in Edina?
Median Population Age in Edina is 44.8 Years.
What is the Average Family Size in Edina
Average Family Size in Edina is 3.0 People.
What is the Average Household Size in Edina
Average Household Size in Edina is 2.3 People.
How Large is the Labor Force in Edina?
There are 27,225 People in the Labor Forcein in Edina.
What is the Percentage of People in the Labor Force in Edina?
63.9% of People are in the Labor Force in Edina.
What is the Unemployment Rate in Edina?
Unemployment Rate in Edina is 3.7%.