Burlington, VT Map & Demographics
Burlington Map
Burlington Overview
$37,789
PER CAPITA INCOME
$113,981
AVG FAMILY INCOME
$64,931
AVG HOUSEHOLD INCOME
52.8%
WAGE / INCOME GAP [ % ]
47.2¢/ $1
WAGE / INCOME GAP [ $ ]
$11,186
FAMILY INCOME DEFICIT
0.50
INEQUALITY / GINI INDEX
44,646
TOTAL POPULATION
20,882
MALE POPULATION
23,764
FEMALE POPULATION
87.87
MALES / 100 FEMALES
113.80
FEMALES / 100 MALES
27.4
MEDIAN AGE
2.8
AVG FAMILY SIZE
2.1
AVG HOUSEHOLD SIZE
26,219
LABOR FORCE [ PEOPLE ]
64.8%
PERCENT IN LABOR FORCE
4.7%
UNEMPLOYMENT RATE
Burlington Area Codes
Income in Burlington
Income Overview in Burlington
Per Capita Income in Burlington is $37,789, while median incomes of families and households are $113,981 and $64,931 respectively.
| Characteristic | Number | Measure |
| Per Capita Income | 44,646 | $37,789 |
| Median Family Income | 6,490 | $113,981 |
| Mean Family Income | 6,490 | $139,462 |
| Median Household Income | 17,448 | $64,931 |
| Mean Household Income | 17,448 | $93,790 |
| Income Deficit | 6,490 | $11,186 |
| Wage / Income Gap (%) | 44,646 | 52.85% |
| Wage / Income Gap ($) | 44,646 | 47.15¢ per $1 |
| Gini / Inequality Index | 44,646 | 0.50 |
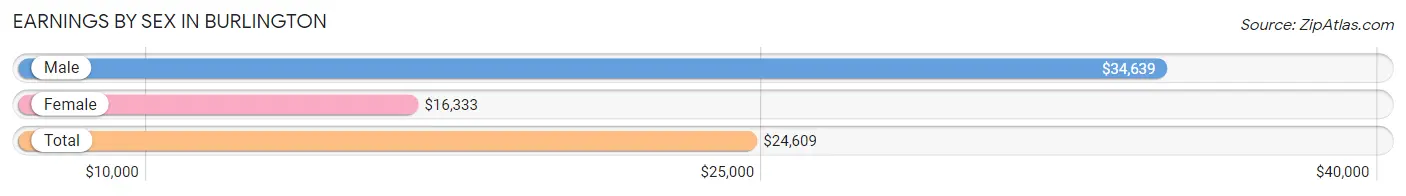
Earnings by Sex in Burlington
Average Earnings in Burlington are $24,609, $34,639 for men and $16,333 for women, a difference of 52.8%.
| Sex | Number | Average Earnings |
| Male | 15,026 (47.0%) | $34,639 |
| Female | 16,963 (53.0%) | $16,333 |
| Total | 31,989 (100.0%) | $24,609 |
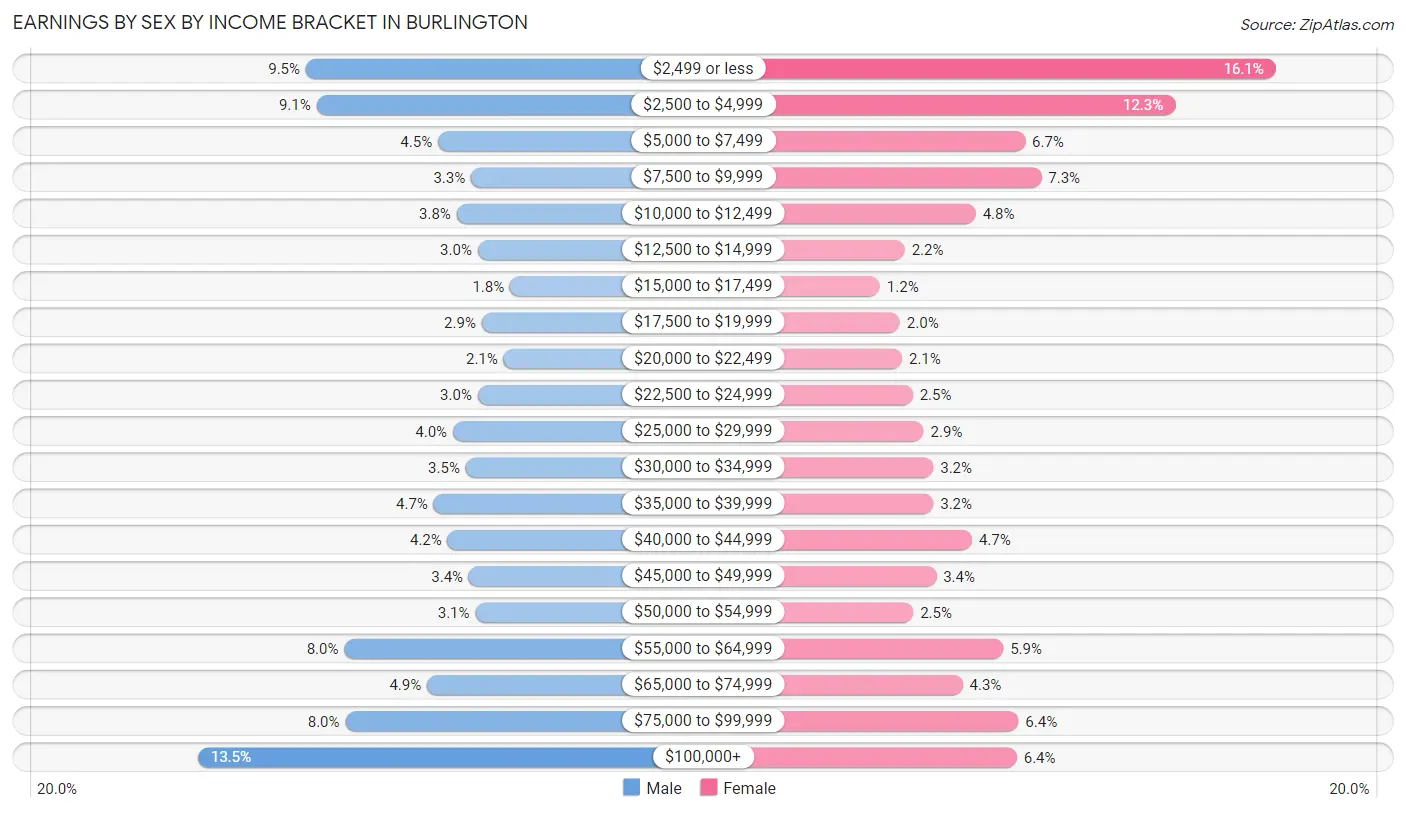
Earnings by Sex by Income Bracket in Burlington
The most common earnings brackets in Burlington are $100,000+ for men (2,030 | 13.5%) and $2,499 or less for women (2,726 | 16.1%).
| Income | Male | Female |
| $2,499 or less | 1,421 (9.5%) | 2,726 (16.1%) |
| $2,500 to $4,999 | 1,361 (9.1%) | 2,086 (12.3%) |
| $5,000 to $7,499 | 678 (4.5%) | 1,133 (6.7%) |
| $7,500 to $9,999 | 491 (3.3%) | 1,237 (7.3%) |
| $10,000 to $12,499 | 573 (3.8%) | 819 (4.8%) |
| $12,500 to $14,999 | 454 (3.0%) | 368 (2.2%) |
| $15,000 to $17,499 | 272 (1.8%) | 211 (1.2%) |
| $17,500 to $19,999 | 431 (2.9%) | 338 (2.0%) |
| $20,000 to $22,499 | 308 (2.1%) | 351 (2.1%) |
| $22,500 to $24,999 | 454 (3.0%) | 419 (2.5%) |
| $25,000 to $29,999 | 594 (4.0%) | 489 (2.9%) |
| $30,000 to $34,999 | 521 (3.5%) | 549 (3.2%) |
| $35,000 to $39,999 | 701 (4.7%) | 550 (3.2%) |
| $40,000 to $44,999 | 623 (4.2%) | 795 (4.7%) |
| $45,000 to $49,999 | 504 (3.4%) | 569 (3.4%) |
| $50,000 to $54,999 | 467 (3.1%) | 422 (2.5%) |
| $55,000 to $64,999 | 1,205 (8.0%) | 994 (5.9%) |
| $65,000 to $74,999 | 739 (4.9%) | 736 (4.3%) |
| $75,000 to $99,999 | 1,199 (8.0%) | 1,090 (6.4%) |
| $100,000+ | 2,030 (13.5%) | 1,081 (6.4%) |
| Total | 15,026 (100.0%) | 16,963 (100.0%) |
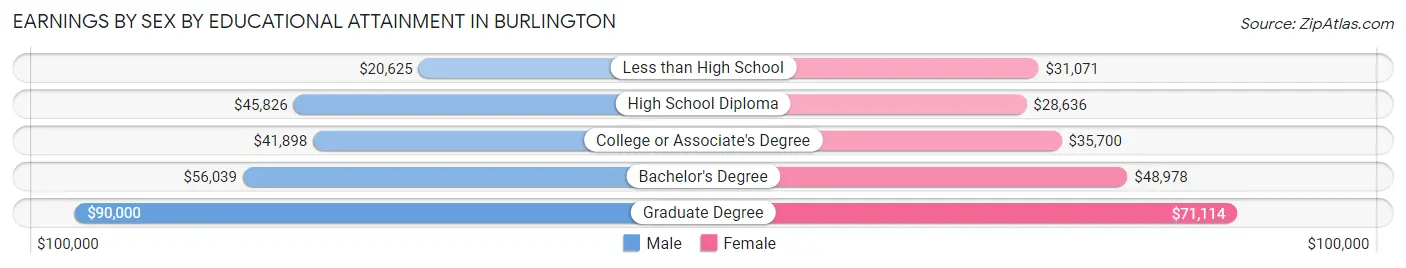
Earnings by Sex by Educational Attainment in Burlington
Average earnings in Burlington are $55,902 for men and $48,901 for women, a difference of 12.5%. Men with an educational attainment of graduate degree enjoy the highest average annual earnings of $90,000, while those with less than high school education earn the least with $20,625. Women with an educational attainment of graduate degree earn the most with the average annual earnings of $71,114, while those with high school diploma education have the smallest earnings of $28,636.
| Educational Attainment | Male Income | Female Income |
| Less than High School | $20,625 | $31,071 |
| High School Diploma | $45,826 | $28,636 |
| College or Associate's Degree | $41,898 | $35,700 |
| Bachelor's Degree | $56,039 | $48,978 |
| Graduate Degree | $90,000 | $71,114 |
| Total | $55,902 | $48,901 |
Family Income in Burlington
Family Income Brackets in Burlington
According to the Burlington family income data, there are 1,285 families falling into the $100,000 to $149,999 income range, which is the most common income bracket and makes up 19.8% of all families. Conversely, the $10,000 to $14,999 income bracket is the least frequent group with only 26 families (0.4%) belonging to this category.
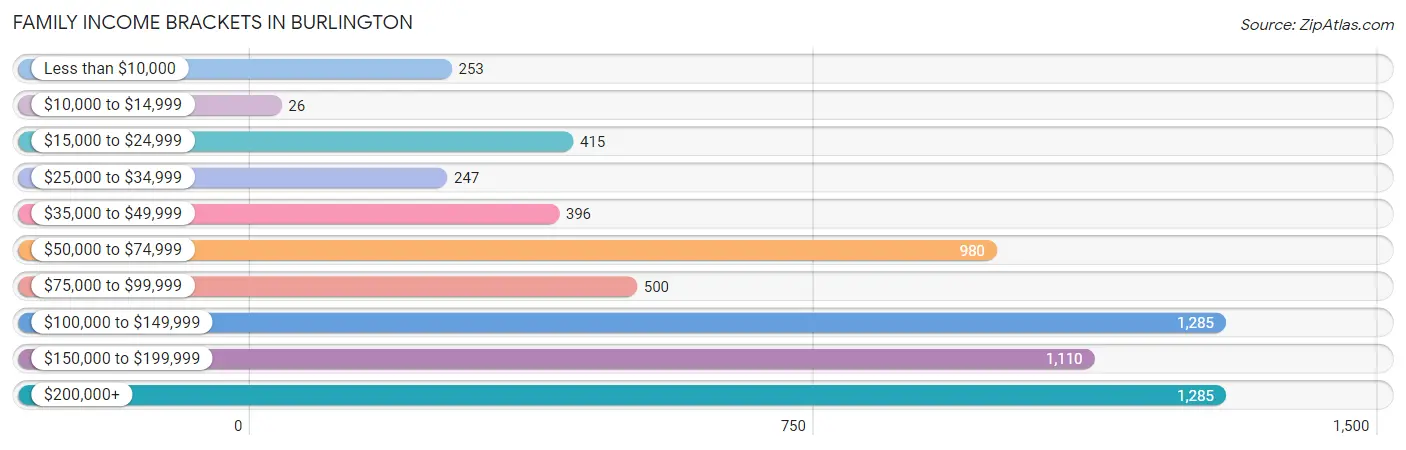
| Income Bracket | # Families | % Families |
| Less than $10,000 | 253 | 3.9% |
| $10,000 to $14,999 | 26 | 0.4% |
| $15,000 to $24,999 | 415 | 6.4% |
| $25,000 to $34,999 | 247 | 3.8% |
| $35,000 to $49,999 | 396 | 6.1% |
| $50,000 to $74,999 | 980 | 15.1% |
| $75,000 to $99,999 | 500 | 7.7% |
| $100,000 to $149,999 | 1,285 | 19.8% |
| $150,000 to $199,999 | 1,110 | 17.1% |
| $200,000+ | 1,285 | 19.8% |
Family Income by Famaliy Size in Burlington
3-person families (1,755 | 27.0%) account for the highest median family income in Burlington with $155,094 per family, while 3-person families (1,755 | 27.0%) have the highest median income of $51,698 per family member.
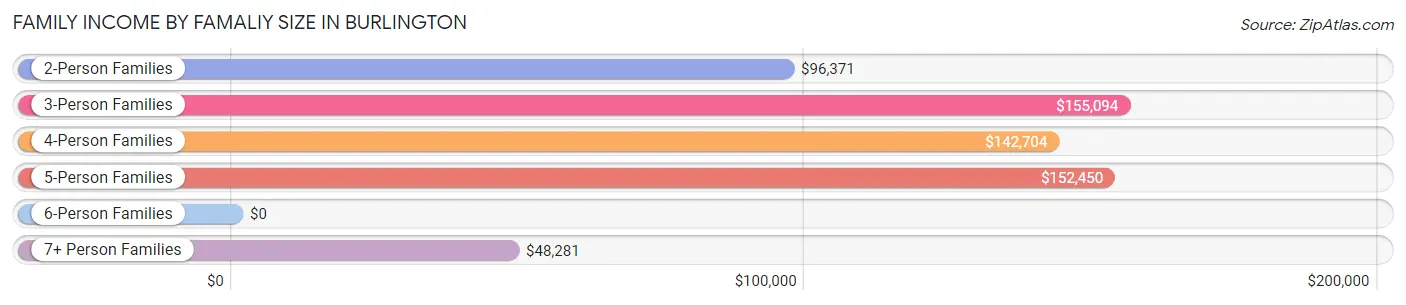
| Income Bracket | # Families | Median Income |
| 2-Person Families | 3,424 (52.8%) | $96,371 |
| 3-Person Families | 1,755 (27.0%) | $155,094 |
| 4-Person Families | 1,024 (15.8%) | $142,704 |
| 5-Person Families | 187 (2.9%) | $152,450 |
| 6-Person Families | 85 (1.3%) | $0 |
| 7+ Person Families | 15 (0.2%) | $48,281 |
| Total | 6,490 (100.0%) | $113,981 |
Family Income by Number of Earners in Burlington
The median family income in Burlington is $113,981, with families comprising 3+ earners (601) having the highest median family income of $189,104, while families with no earners (687) have the lowest median family income of $51,635, accounting for 9.3% and 10.6% of families, respectively.
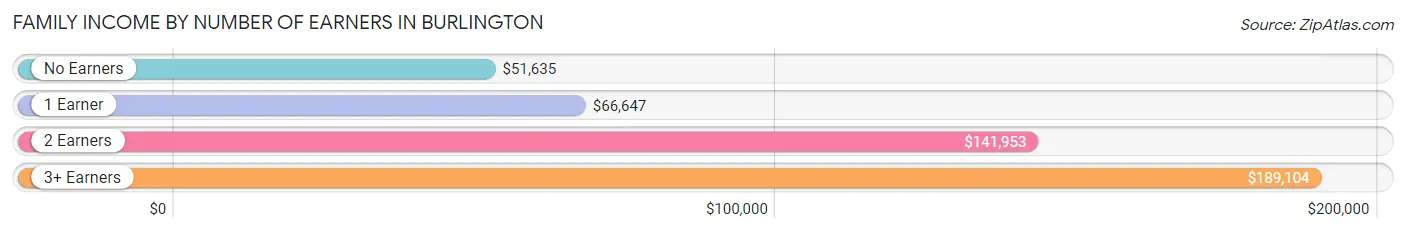
| Number of Earners | # Families | Median Income |
| No Earners | 687 (10.6%) | $51,635 |
| 1 Earner | 2,001 (30.8%) | $66,647 |
| 2 Earners | 3,201 (49.3%) | $141,953 |
| 3+ Earners | 601 (9.3%) | $189,104 |
| Total | 6,490 (100.0%) | $113,981 |
Household Income in Burlington
Household Income Brackets in Burlington
With 2,687 households falling in the category, the $50,000 to $74,999 income range is the most frequent in Burlington, accounting for 15.4% of all households. In contrast, only 995 households (5.7%) fall into the $10,000 to $14,999 income bracket, making it the least populous group.
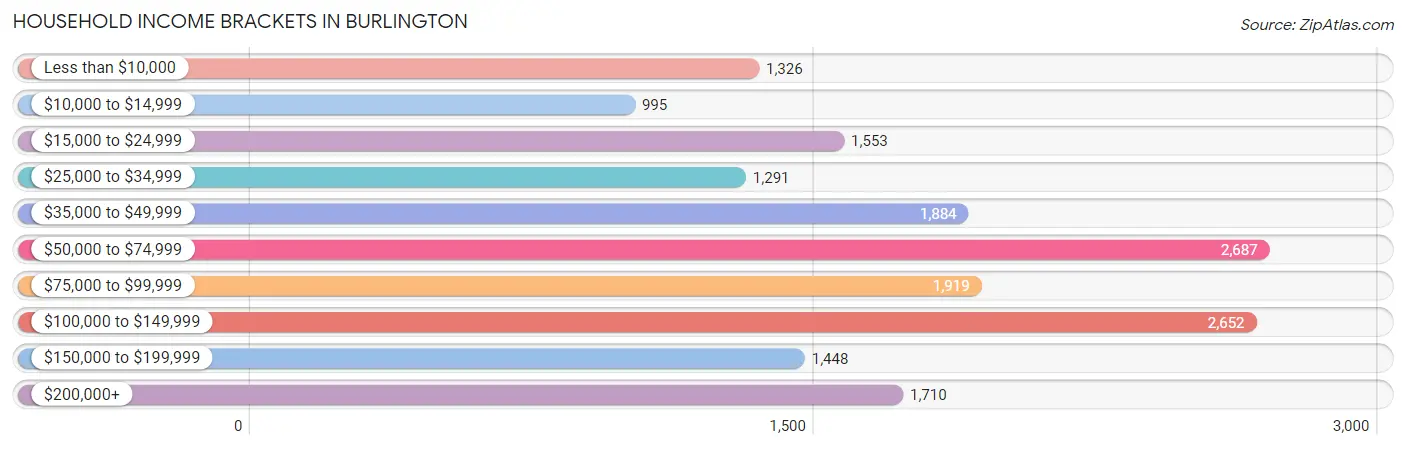
| Income Bracket | # Households | % Households |
| Less than $10,000 | 1,326 | 7.6% |
| $10,000 to $14,999 | 995 | 5.7% |
| $15,000 to $24,999 | 1,553 | 8.9% |
| $25,000 to $34,999 | 1,291 | 7.4% |
| $35,000 to $49,999 | 1,884 | 10.8% |
| $50,000 to $74,999 | 2,687 | 15.4% |
| $75,000 to $99,999 | 1,919 | 11.0% |
| $100,000 to $149,999 | 2,652 | 15.2% |
| $150,000 to $199,999 | 1,448 | 8.3% |
| $200,000+ | 1,710 | 9.8% |
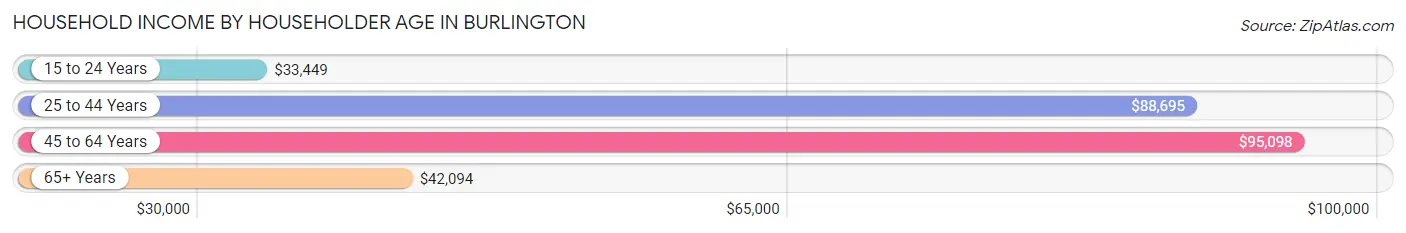
Household Income by Householder Age in Burlington
The median household income in Burlington is $64,931, with the highest median household income of $95,098 found in the 45 to 64 years age bracket for the primary householder. A total of 4,504 households (25.8%) fall into this category. Meanwhile, the 15 to 24 years age bracket for the primary householder has the lowest median household income of $33,449, with 3,400 households (19.5%) in this group.
| Income Bracket | # Households | Median Income |
| 15 to 24 Years | 3,400 (19.5%) | $33,449 |
| 25 to 44 Years | 6,156 (35.3%) | $88,695 |
| 45 to 64 Years | 4,504 (25.8%) | $95,098 |
| 65+ Years | 3,388 (19.4%) | $42,094 |
| Total | 17,448 (100.0%) | $64,931 |
Poverty in Burlington
Income Below Poverty by Sex and Age in Burlington
With 20.7% poverty level for males and 26.3% for females among the residents of Burlington, 18 to 24 year old males and 18 to 24 year old females are the most vulnerable to poverty, with 2,210 males (56.0%) and 3,242 females (65.7%) in their respective age groups living below the poverty level.
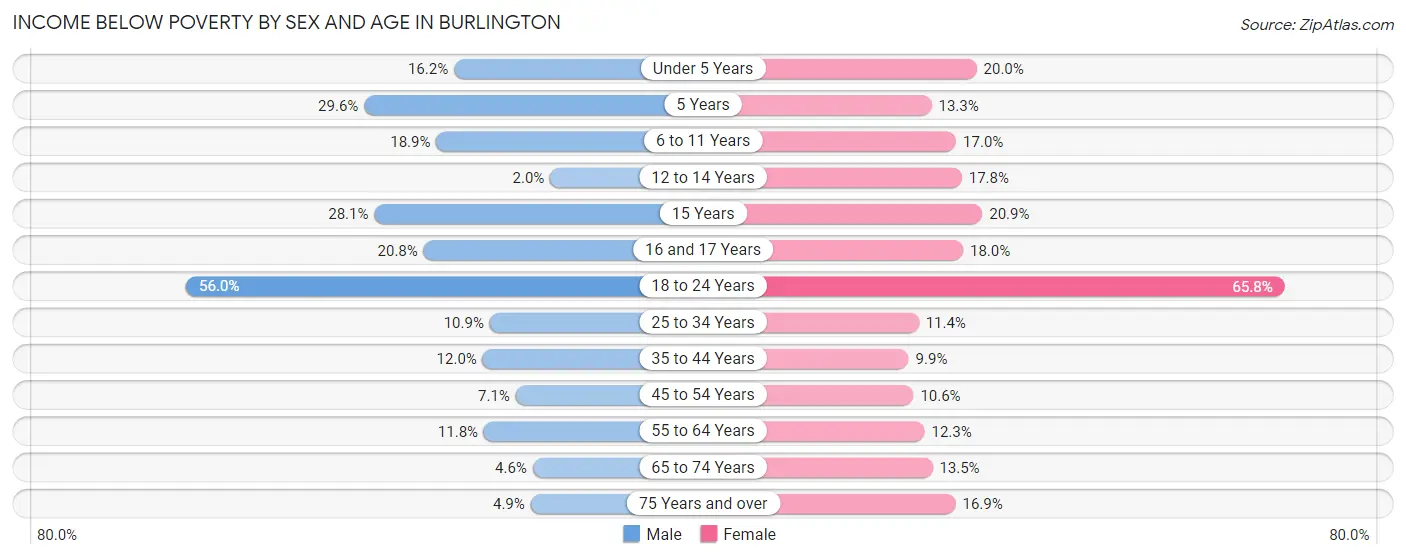
| Age Bracket | Male | Female |
| Under 5 Years | 96 (16.2%) | 171 (20.0%) |
| 5 Years | 42 (29.6%) | 10 (13.3%) |
| 6 to 11 Years | 144 (18.9%) | 107 (17.0%) |
| 12 to 14 Years | 8 (2.0%) | 80 (17.8%) |
| 15 Years | 16 (28.1%) | 34 (20.9%) |
| 16 and 17 Years | 72 (20.7%) | 65 (18.0%) |
| 18 to 24 Years | 2,210 (56.0%) | 3,242 (65.7%) |
| 25 to 34 Years | 434 (10.9%) | 425 (11.4%) |
| 35 to 44 Years | 258 (12.0%) | 204 (9.9%) |
| 45 to 54 Years | 124 (7.1%) | 168 (10.6%) |
| 55 to 64 Years | 237 (11.8%) | 233 (12.3%) |
| 65 to 74 Years | 58 (4.5%) | 247 (13.5%) |
| 75 Years and over | 28 (4.9%) | 186 (16.9%) |
| Total | 3,727 (20.7%) | 5,172 (26.3%) |
Income Above Poverty by Sex and Age in Burlington
According to the poverty statistics in Burlington, males aged 12 to 14 years and females aged 35 to 44 years are the age groups that are most secure financially, with 98.0% of males and 90.1% of females in these age groups living above the poverty line.
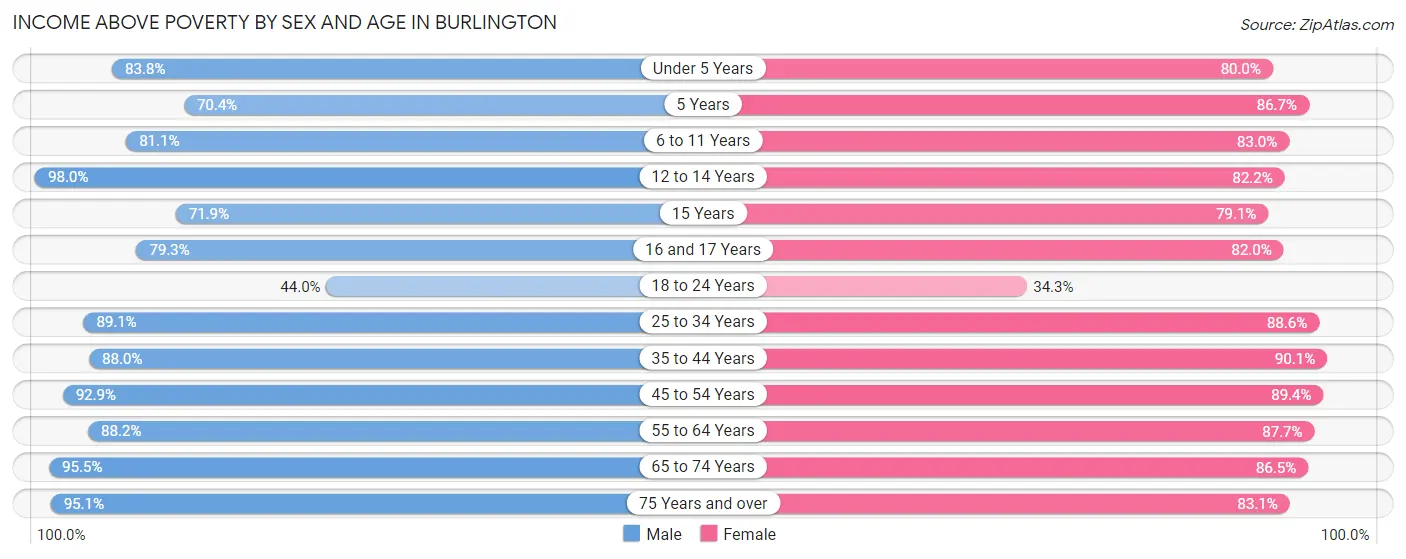
| Age Bracket | Male | Female |
| Under 5 Years | 495 (83.8%) | 683 (80.0%) |
| 5 Years | 100 (70.4%) | 65 (86.7%) |
| 6 to 11 Years | 619 (81.1%) | 523 (83.0%) |
| 12 to 14 Years | 401 (98.0%) | 369 (82.2%) |
| 15 Years | 41 (71.9%) | 129 (79.1%) |
| 16 and 17 Years | 275 (79.2%) | 296 (82.0%) |
| 18 to 24 Years | 1,735 (44.0%) | 1,689 (34.3%) |
| 25 to 34 Years | 3,535 (89.1%) | 3,295 (88.6%) |
| 35 to 44 Years | 1,895 (88.0%) | 1,850 (90.1%) |
| 45 to 54 Years | 1,628 (92.9%) | 1,411 (89.4%) |
| 55 to 64 Years | 1,772 (88.2%) | 1,663 (87.7%) |
| 65 to 74 Years | 1,216 (95.5%) | 1,588 (86.5%) |
| 75 Years and over | 548 (95.1%) | 915 (83.1%) |
| Total | 14,260 (79.3%) | 14,476 (73.7%) |
Income Below Poverty Among Married-Couple Families in Burlington
The poverty statistics for married-couple families in Burlington show that 2.1% or 97 of the total 4,650 families live below the poverty line. Families with 5 or more children have the highest poverty rate of 100.0%, comprising of 8 families. On the other hand, families with 1 or 2 children have the lowest poverty rate of 0.7%, which includes 12 families.
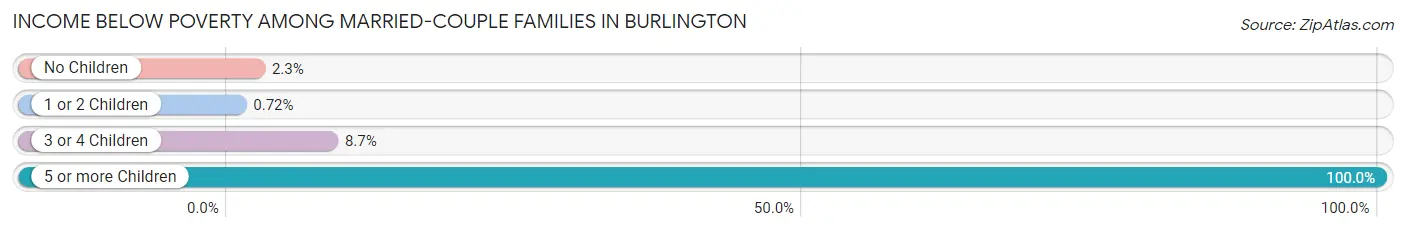
| Children | Above Poverty | Below Poverty |
| No Children | 2,796 (97.7%) | 67 (2.3%) |
| 1 or 2 Children | 1,652 (99.3%) | 12 (0.7%) |
| 3 or 4 Children | 105 (91.3%) | 10 (8.7%) |
| 5 or more Children | 0 (0.0%) | 8 (100.0%) |
| Total | 4,553 (97.9%) | 97 (2.1%) |
Income Below Poverty Among Single-Parent Households in Burlington
According to the poverty data in Burlington, 15.3% or 78 single-father households and 25.5% or 339 single-mother households are living below the poverty line. Among single-father households, those with 5 or more children have the highest poverty rate, with 5 households (100.0%) experiencing poverty. Likewise, among single-mother households, those with 3 or 4 children have the highest poverty rate, with 35 households (53.0%) falling below the poverty line.
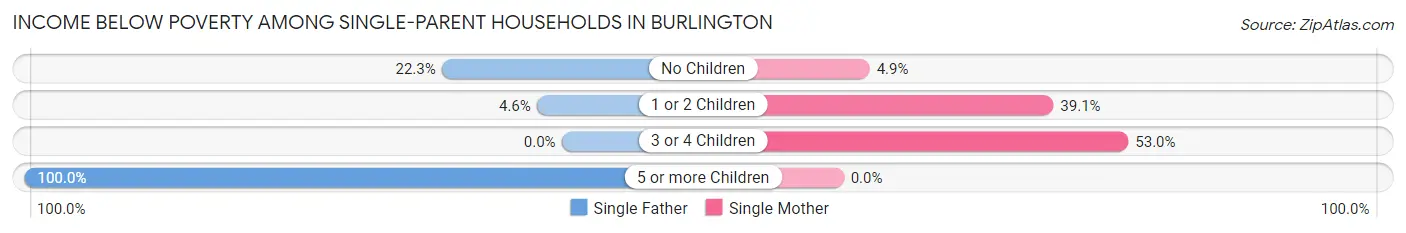
| Children | Single Father | Single Mother |
| No Children | 63 (22.3%) | 27 (4.9%) |
| 1 or 2 Children | 10 (4.6%) | 277 (39.1%) |
| 3 or 4 Children | 0 (0.0%) | 35 (53.0%) |
| 5 or more Children | 5 (100.0%) | 0 (0.0%) |
| Total | 78 (15.3%) | 339 (25.5%) |
Income Below Poverty Among Married-Couple vs Single-Parent Households in Burlington
The poverty data for Burlington shows that 97 of the married-couple family households (2.1%) and 417 of the single-parent households (22.7%) are living below the poverty level. Within the married-couple family households, those with 5 or more children have the highest poverty rate, with 8 households (100.0%) falling below the poverty line. Among the single-parent households, those with 5 or more children have the highest poverty rate, with 5 household (100.0%) living below poverty.
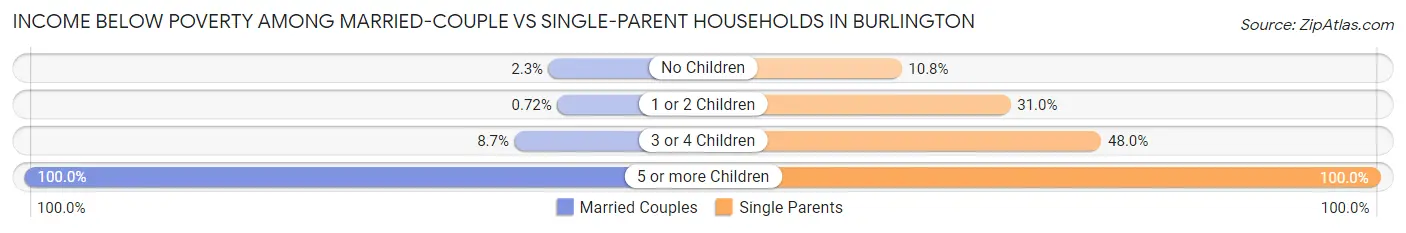
| Children | Married-Couple Families | Single-Parent Households |
| No Children | 67 (2.3%) | 90 (10.7%) |
| 1 or 2 Children | 12 (0.7%) | 287 (31.0%) |
| 3 or 4 Children | 10 (8.7%) | 35 (47.9%) |
| 5 or more Children | 8 (100.0%) | 5 (100.0%) |
| Total | 97 (2.1%) | 417 (22.7%) |
Race in Burlington
The most populous races in Burlington are White / Caucasian (38,987 | 87.3%), Two or more Races (2,350 | 5.3%), and Black / African American (1,656 | 3.7%).
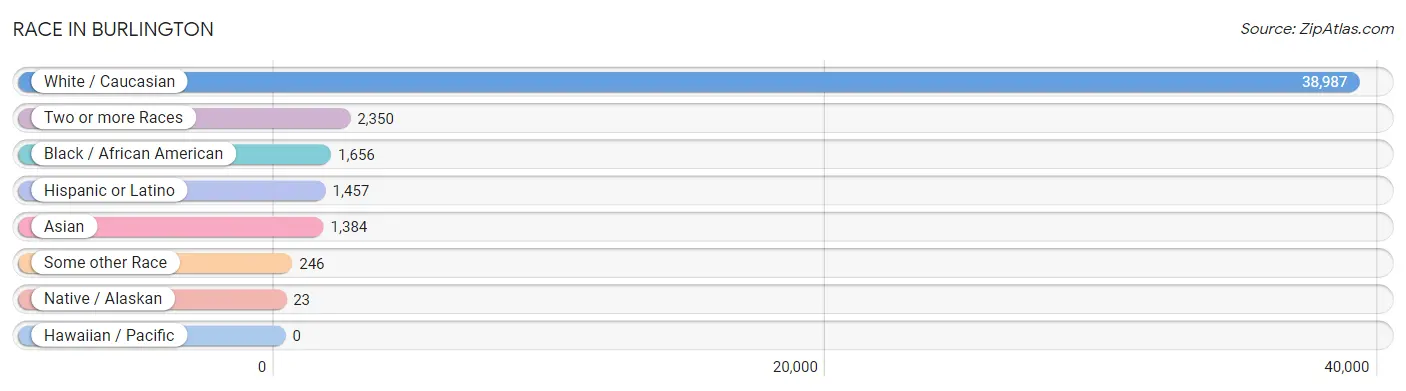
| Race | # Population | % Population |
| Asian | 1,384 | 3.1% |
| Black / African American | 1,656 | 3.7% |
| Hawaiian / Pacific | 0 | 0.0% |
| Hispanic or Latino | 1,457 | 3.3% |
| Native / Alaskan | 23 | 0.1% |
| White / Caucasian | 38,987 | 87.3% |
| Two or more Races | 2,350 | 5.3% |
| Some other Race | 246 | 0.5% |
| Total | 44,646 | 100.0% |
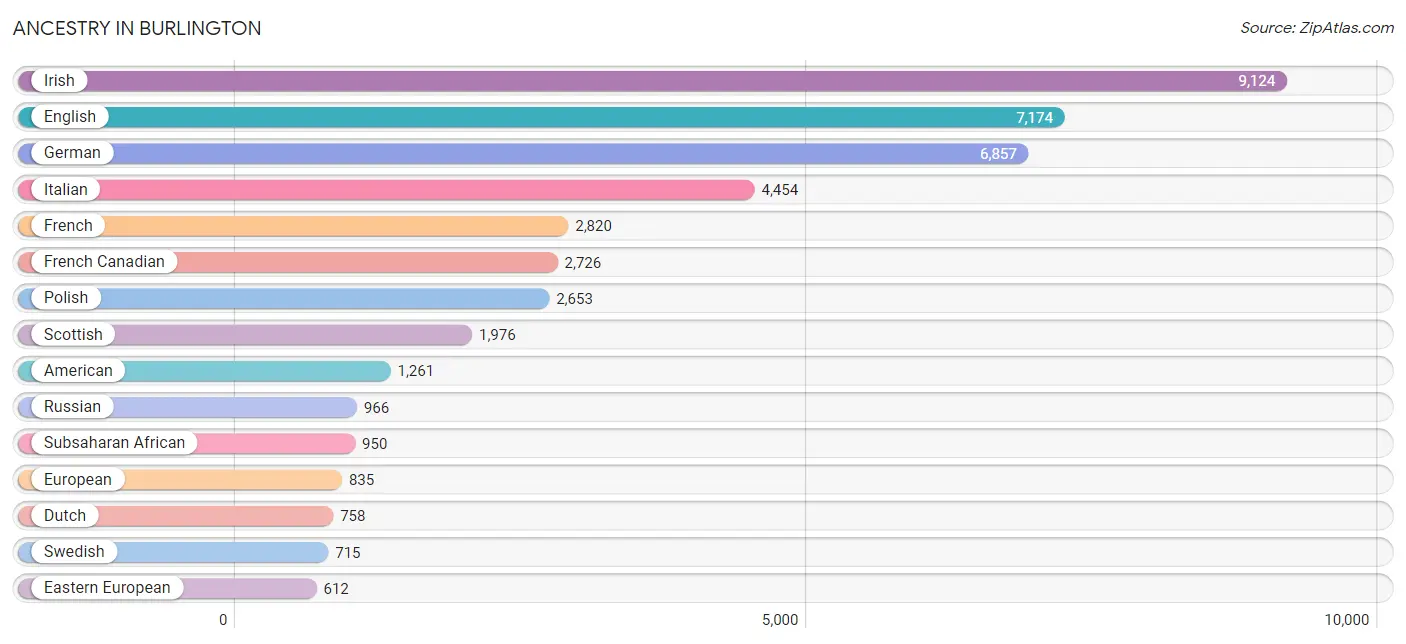
Ancestry in Burlington
The most populous ancestries reported in Burlington are Irish (9,124 | 20.4%), English (7,174 | 16.1%), German (6,857 | 15.4%), Italian (4,454 | 10.0%), and French (2,820 | 6.3%), together accounting for 68.2% of all Burlington residents.
| Ancestry | # Population | % Population |
| African | 134 | 0.3% |
| Albanian | 42 | 0.1% |
| American | 1,261 | 2.8% |
| Arab | 503 | 1.1% |
| Argentinean | 72 | 0.2% |
| Armenian | 205 | 0.5% |
| Austrian | 319 | 0.7% |
| Barbadian | 40 | 0.1% |
| Basque | 28 | 0.1% |
| Belgian | 88 | 0.2% |
| Bhutanese | 71 | 0.2% |
| Blackfeet | 14 | 0.0% |
| Brazilian | 27 | 0.1% |
| British | 314 | 0.7% |
| British West Indian | 21 | 0.1% |
| Burmese | 192 | 0.4% |
| Cajun | 18 | 0.0% |
| Canadian | 342 | 0.8% |
| Celtic | 5 | 0.0% |
| Central American | 88 | 0.2% |
| Cherokee | 8 | 0.0% |
| Chilean | 7 | 0.0% |
| Chippewa | 9 | 0.0% |
| Colombian | 214 | 0.5% |
| Costa Rican | 16 | 0.0% |
| Croatian | 62 | 0.1% |
| Cuban | 131 | 0.3% |
| Czech | 119 | 0.3% |
| Czechoslovakian | 37 | 0.1% |
| Danish | 157 | 0.4% |
| Delaware | 7 | 0.0% |
| Dominican | 28 | 0.1% |
| Dutch | 758 | 1.7% |
| Eastern European | 612 | 1.4% |
| Ecuadorian | 29 | 0.1% |
| English | 7,174 | 16.1% |
| European | 835 | 1.9% |
| Filipino | 26 | 0.1% |
| Finnish | 44 | 0.1% |
| French | 2,820 | 6.3% |
| French Canadian | 2,726 | 6.1% |
| German | 6,857 | 15.4% |
| Ghanaian | 24 | 0.1% |
| Greek | 283 | 0.6% |
| Guamanian / Chamorro | 11 | 0.0% |
| Guatemalan | 22 | 0.1% |
| Guyanese | 10 | 0.0% |
| Haitian | 50 | 0.1% |
| Honduran | 18 | 0.0% |
| Hungarian | 229 | 0.5% |
| Indian (Asian) | 600 | 1.3% |
| Iranian | 128 | 0.3% |
| Iraqi | 6 | 0.0% |
| Irish | 9,124 | 20.4% |
| Italian | 4,454 | 10.0% |
| Jamaican | 307 | 0.7% |
| Korean | 307 | 0.7% |
| Laotian | 81 | 0.2% |
| Latvian | 8 | 0.0% |
| Lebanese | 106 | 0.2% |
| Lithuanian | 194 | 0.4% |
| Luxembourger | 12 | 0.0% |
| Mexican | 307 | 0.7% |
| Mexican American Indian | 9 | 0.0% |
| Moroccan | 5 | 0.0% |
| Native Hawaiian | 14 | 0.0% |
| New Zealander | 23 | 0.1% |
| Nicaraguan | 17 | 0.0% |
| Nigerian | 54 | 0.1% |
| Northern European | 162 | 0.4% |
| Norwegian | 322 | 0.7% |
| Okinawan | 21 | 0.1% |
| Pakistani | 13 | 0.0% |
| Palestinian | 27 | 0.1% |
| Panamanian | 15 | 0.0% |
| Paraguayan | 12 | 0.0% |
| Peruvian | 25 | 0.1% |
| Polish | 2,653 | 5.9% |
| Portuguese | 296 | 0.7% |
| Puerto Rican | 173 | 0.4% |
| Romanian | 133 | 0.3% |
| Russian | 966 | 2.2% |
| Scandinavian | 227 | 0.5% |
| Scotch-Irish | 480 | 1.1% |
| Scottish | 1,976 | 4.4% |
| Serbian | 23 | 0.1% |
| Shoshone | 19 | 0.0% |
| Slovak | 160 | 0.4% |
| Slovene | 10 | 0.0% |
| Somali | 306 | 0.7% |
| South African | 24 | 0.1% |
| South American | 544 | 1.2% |
| Spaniard | 88 | 0.2% |
| Spanish | 54 | 0.1% |
| Sri Lankan | 351 | 0.8% |
| Subsaharan African | 950 | 2.1% |
| Sudanese | 18 | 0.0% |
| Swedish | 715 | 1.6% |
| Swiss | 65 | 0.2% |
| Syrian | 103 | 0.2% |
| Thai | 280 | 0.6% |
| Trinidadian and Tobagonian | 12 | 0.0% |
| Turkish | 92 | 0.2% |
| Ukrainian | 187 | 0.4% |
| Uruguayan | 87 | 0.2% |
| Venezuelan | 98 | 0.2% |
| Vietnamese | 7 | 0.0% |
| Welsh | 470 | 1.1% |
| Yaqui | 8 | 0.0% |
| Yugoslavian | 271 | 0.6% | View All 110 Rows |
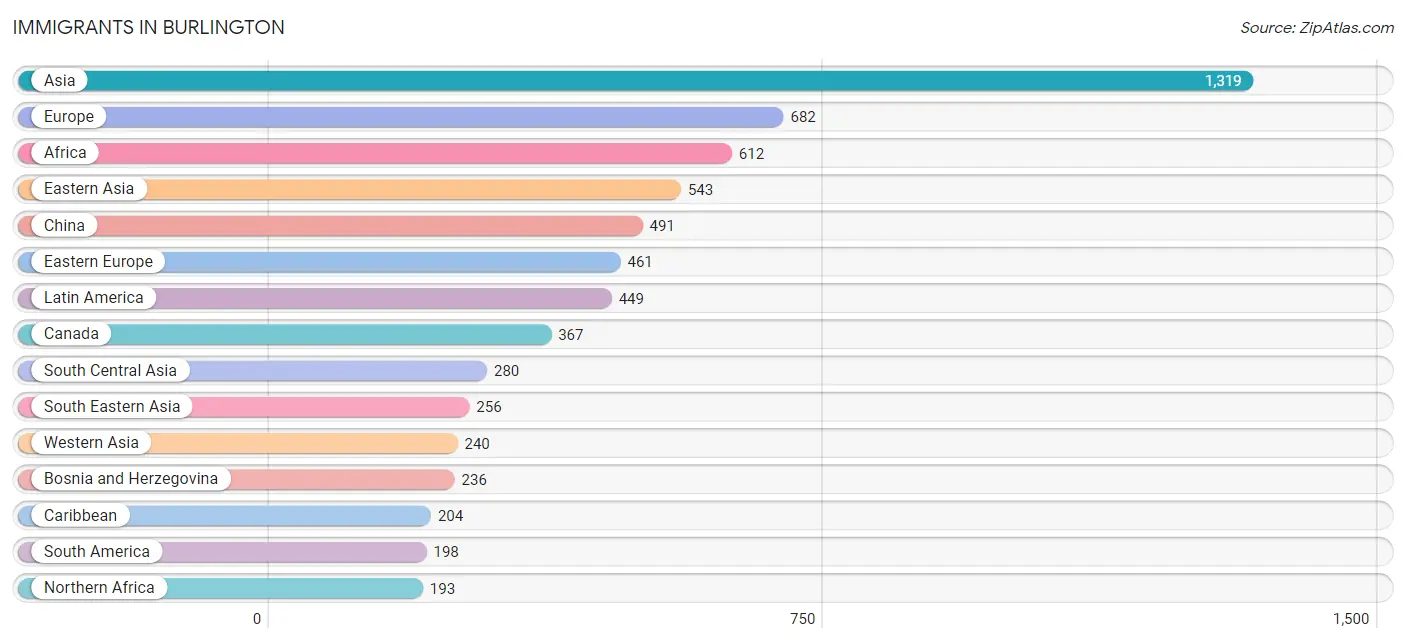
Immigrants in Burlington
The most numerous immigrant groups reported in Burlington came from Asia (1,319 | 2.9%), Europe (682 | 1.5%), Africa (612 | 1.4%), Eastern Asia (543 | 1.2%), and China (491 | 1.1%), together accounting for 8.2% of all Burlington residents.
| Immigration Origin | # Population | % Population |
| Africa | 612 | 1.4% |
| Albania | 29 | 0.1% |
| Argentina | 7 | 0.0% |
| Asia | 1,319 | 2.9% |
| Australia | 5 | 0.0% |
| Bahamas | 11 | 0.0% |
| Bangladesh | 7 | 0.0% |
| Belarus | 5 | 0.0% |
| Bosnia and Herzegovina | 236 | 0.5% |
| Bulgaria | 23 | 0.1% |
| Cambodia | 16 | 0.0% |
| Canada | 367 | 0.8% |
| Caribbean | 204 | 0.5% |
| Central America | 47 | 0.1% |
| China | 491 | 1.1% |
| Colombia | 24 | 0.1% |
| Congo | 12 | 0.0% |
| Croatia | 13 | 0.0% |
| Czechoslovakia | 4 | 0.0% |
| Denmark | 5 | 0.0% |
| Eastern Africa | 139 | 0.3% |
| Eastern Asia | 543 | 1.2% |
| Eastern Europe | 461 | 1.0% |
| Ecuador | 16 | 0.0% |
| El Salvador | 2 | 0.0% |
| England | 45 | 0.1% |
| Europe | 682 | 1.5% |
| France | 31 | 0.1% |
| Germany | 30 | 0.1% |
| Greece | 5 | 0.0% |
| Guatemala | 22 | 0.1% |
| Haiti | 42 | 0.1% |
| Hong Kong | 26 | 0.1% |
| India | 120 | 0.3% |
| Indonesia | 1 | 0.0% |
| Iran | 7 | 0.0% |
| Iraq | 57 | 0.1% |
| Ireland | 14 | 0.0% |
| Italy | 7 | 0.0% |
| Jamaica | 144 | 0.3% |
| Japan | 1 | 0.0% |
| Kazakhstan | 9 | 0.0% |
| Korea | 51 | 0.1% |
| Laos | 12 | 0.0% |
| Latin America | 449 | 1.0% |
| Lebanon | 13 | 0.0% |
| Mexico | 23 | 0.1% |
| Middle Africa | 163 | 0.4% |
| Moldova | 31 | 0.1% |
| Morocco | 34 | 0.1% |
| Nepal | 97 | 0.2% |
| Netherlands | 20 | 0.0% |
| Northern Africa | 193 | 0.4% |
| Northern Europe | 115 | 0.3% |
| Norway | 7 | 0.0% |
| Oceania | 5 | 0.0% |
| Peru | 18 | 0.0% |
| Poland | 25 | 0.1% |
| Romania | 13 | 0.0% |
| Russia | 40 | 0.1% |
| Singapore | 21 | 0.1% |
| Somalia | 139 | 0.3% |
| South Africa | 97 | 0.2% |
| South America | 198 | 0.4% |
| South Central Asia | 280 | 0.6% |
| South Eastern Asia | 256 | 0.6% |
| Southern Europe | 17 | 0.0% |
| Spain | 5 | 0.0% |
| Sudan | 159 | 0.4% |
| Switzerland | 8 | 0.0% |
| Thailand | 13 | 0.0% |
| Turkey | 156 | 0.4% |
| Ukraine | 19 | 0.0% |
| Uruguay | 87 | 0.2% |
| Venezuela | 46 | 0.1% |
| Vietnam | 193 | 0.4% |
| Western Asia | 240 | 0.5% |
| Western Europe | 89 | 0.2% |
| Zaire | 151 | 0.3% | View All 79 Rows |
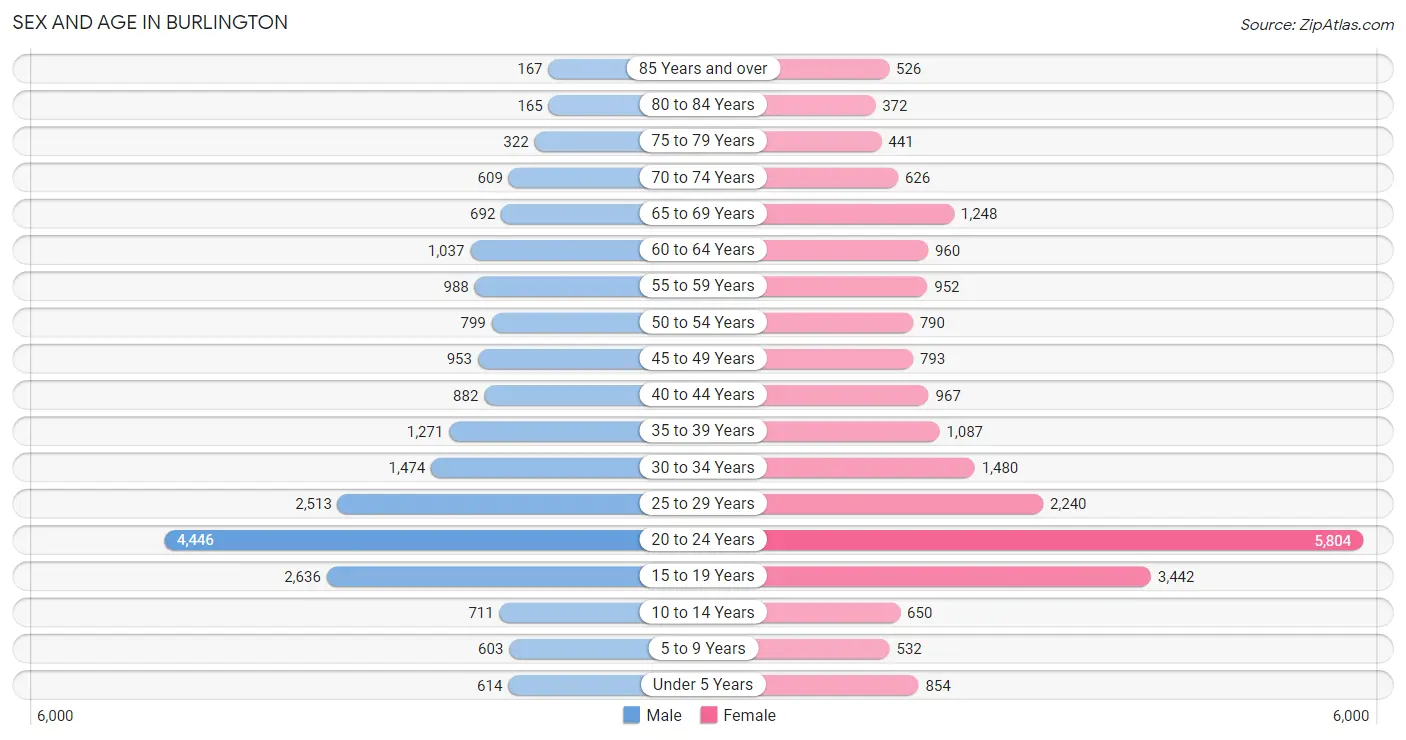
Sex and Age in Burlington
Sex and Age in Burlington
The most populous age groups in Burlington are 20 to 24 Years (4,446 | 21.3%) for men and 20 to 24 Years (5,804 | 24.4%) for women.
| Age Bracket | Male | Female |
| Under 5 Years | 614 (2.9%) | 854 (3.6%) |
| 5 to 9 Years | 603 (2.9%) | 532 (2.2%) |
| 10 to 14 Years | 711 (3.4%) | 650 (2.7%) |
| 15 to 19 Years | 2,636 (12.6%) | 3,442 (14.5%) |
| 20 to 24 Years | 4,446 (21.3%) | 5,804 (24.4%) |
| 25 to 29 Years | 2,513 (12.0%) | 2,240 (9.4%) |
| 30 to 34 Years | 1,474 (7.1%) | 1,480 (6.2%) |
| 35 to 39 Years | 1,271 (6.1%) | 1,087 (4.6%) |
| 40 to 44 Years | 882 (4.2%) | 967 (4.1%) |
| 45 to 49 Years | 953 (4.6%) | 793 (3.3%) |
| 50 to 54 Years | 799 (3.8%) | 790 (3.3%) |
| 55 to 59 Years | 988 (4.7%) | 952 (4.0%) |
| 60 to 64 Years | 1,037 (5.0%) | 960 (4.0%) |
| 65 to 69 Years | 692 (3.3%) | 1,248 (5.2%) |
| 70 to 74 Years | 609 (2.9%) | 626 (2.6%) |
| 75 to 79 Years | 322 (1.5%) | 441 (1.9%) |
| 80 to 84 Years | 165 (0.8%) | 372 (1.6%) |
| 85 Years and over | 167 (0.8%) | 526 (2.2%) |
| Total | 20,882 (100.0%) | 23,764 (100.0%) |
Families and Households in Burlington
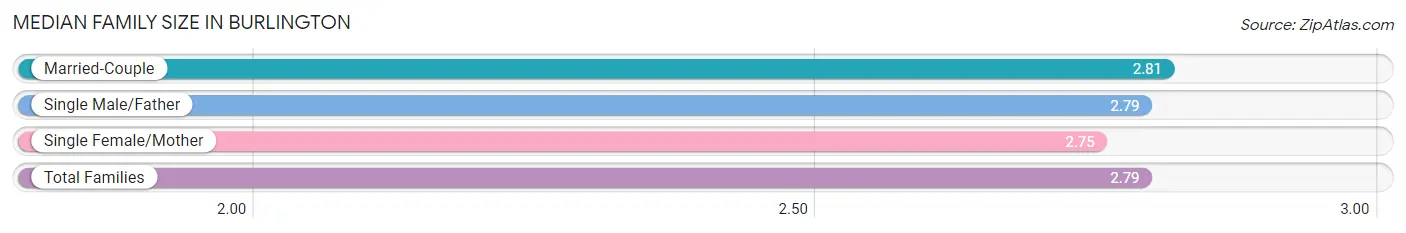
Median Family Size in Burlington
The median family size in Burlington is 2.79 persons per family, with married-couple families (4,650 | 71.7%) accounting for the largest median family size of 2.81 persons per family. On the other hand, single female/mother families (1,330 | 20.5%) represent the smallest median family size with 2.75 persons per family.
| Family Type | # Families | Family Size |
| Married-Couple | 4,650 (71.7%) | 2.81 |
| Single Male/Father | 510 (7.9%) | 2.79 |
| Single Female/Mother | 1,330 (20.5%) | 2.75 |
| Total Families | 6,490 (100.0%) | 2.79 |
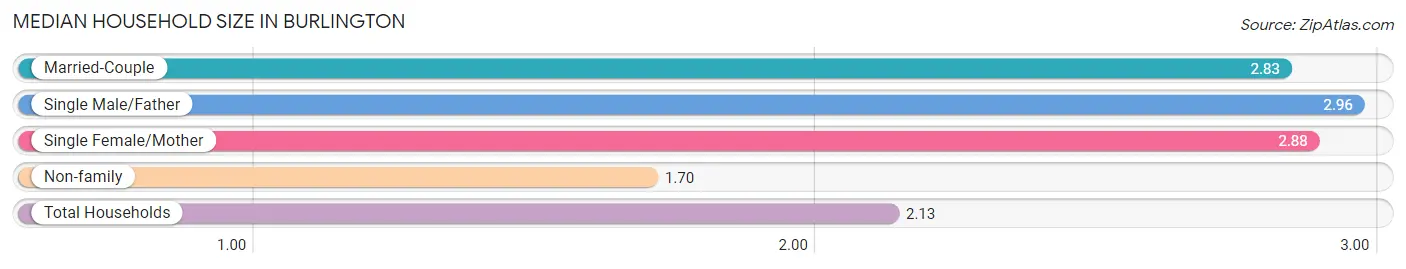
Median Household Size in Burlington
The median household size in Burlington is 2.13 persons per household, with single male/father households (510 | 2.9%) accounting for the largest median household size of 2.96 persons per household. non-family households (10,958 | 62.8%) represent the smallest median household size with 1.70 persons per household.
| Household Type | # Households | Household Size |
| Married-Couple | 4,650 (26.7%) | 2.83 |
| Single Male/Father | 510 (2.9%) | 2.96 |
| Single Female/Mother | 1,330 (7.6%) | 2.88 |
| Non-family | 10,958 (62.8%) | 1.70 |
| Total Households | 17,448 (100.0%) | 2.13 |
Household Size by Marriage Status in Burlington
Out of a total of 17,448 households in Burlington, 6,490 (37.2%) are family households, while 10,958 (62.8%) are nonfamily households. The most numerous type of family households are 2-person households, comprising 3,205, and the most common type of nonfamily households are 1-person households, comprising 6,225.
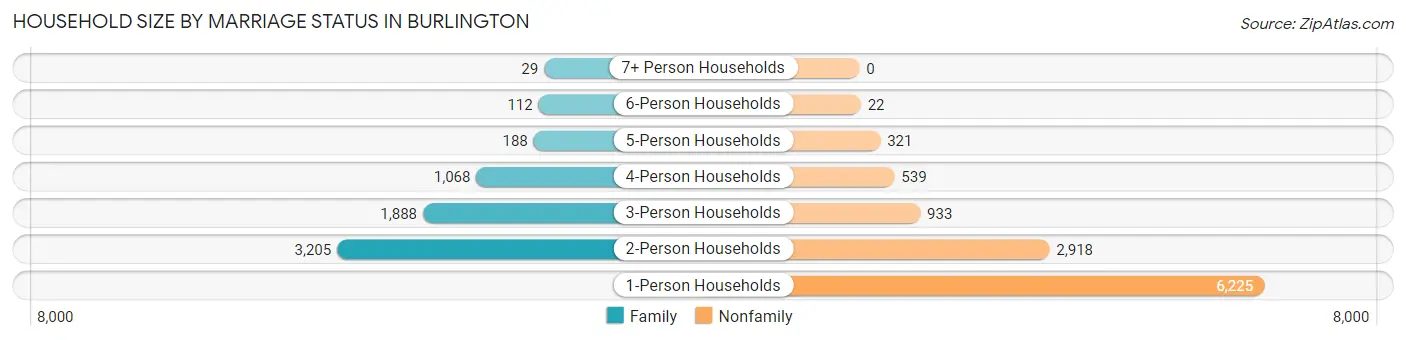
| Household Size | Family Households | Nonfamily Households |
| 1-Person Households | - | 6,225 (35.7%) |
| 2-Person Households | 3,205 (18.4%) | 2,918 (16.7%) |
| 3-Person Households | 1,888 (10.8%) | 933 (5.3%) |
| 4-Person Households | 1,068 (6.1%) | 539 (3.1%) |
| 5-Person Households | 188 (1.1%) | 321 (1.8%) |
| 6-Person Households | 112 (0.6%) | 22 (0.1%) |
| 7+ Person Households | 29 (0.2%) | 0 (0.0%) |
| Total | 6,490 (37.2%) | 10,958 (62.8%) |
Female Fertility in Burlington
Fertility by Age in Burlington
Average fertility rate in Burlington is 25.0 births per 1,000 women. Women in the age bracket of 35 to 50 years have the highest fertility rate with 47.0 births per 1,000 women. Women in the age bracket of 20 to 34 years acount for 59.3% of all women with births.
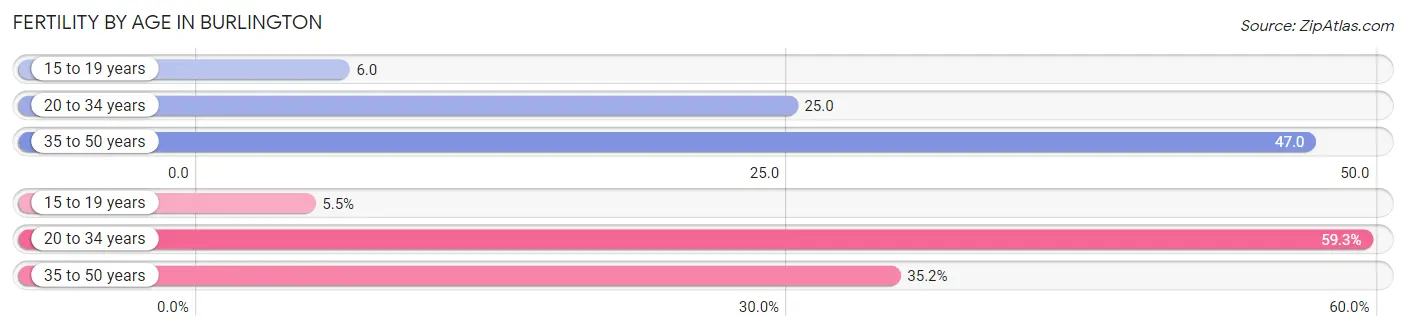
| Age Bracket | Women with Births | Births / 1,000 Women |
| 15 to 19 years | 22 (5.5%) | 6.0 |
| 20 to 34 years | 239 (59.3%) | 25.0 |
| 35 to 50 years | 142 (35.2%) | 47.0 |
| Total | 403 (100.0%) | 25.0 |
Fertility by Age by Marriage Status in Burlington
59.3% of women with births (403) in Burlington are married. The highest percentage of unmarried women with births falls into 15 to 19 years age bracket with 100.0% of them unmarried at the time of birth, while the lowest percentage of unmarried women with births belong to 20 to 34 years age bracket with 37.2% of them unmarried.
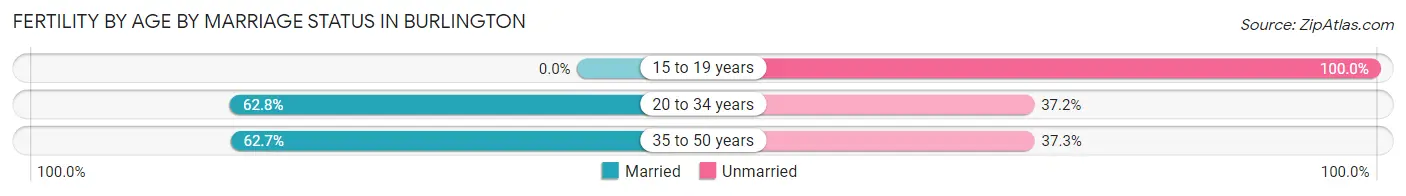
| Age Bracket | Married | Unmarried |
| 15 to 19 years | 0 (0.0%) | 22 (100.0%) |
| 20 to 34 years | 150 (62.8%) | 89 (37.2%) |
| 35 to 50 years | 89 (62.7%) | 53 (37.3%) |
| Total | 239 (59.3%) | 164 (40.7%) |
Fertility by Education in Burlington
Average fertility rate in Burlington is 25.0 births per 1,000 women. Women with the education attainment of less than high school have the highest fertility rate of 101.0 births per 1,000 women, while women with the education attainment of college or associate's degree have the lowest fertility at 8.0 births per 1,000 women. Women with the education attainment of bachelor's degree represent 33.8% of all women with births.
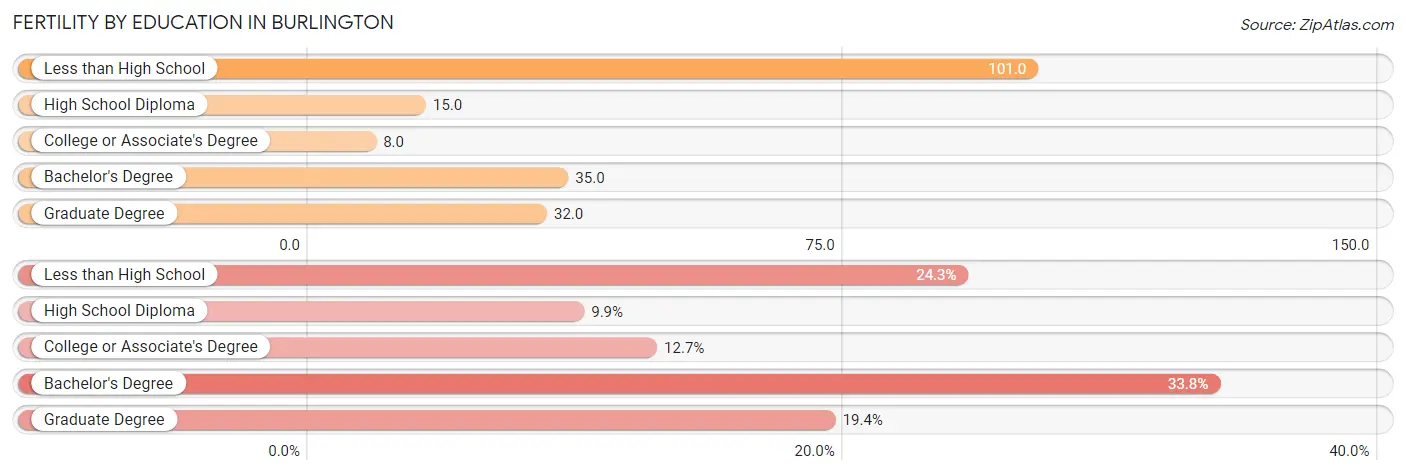
| Educational Attainment | Women with Births | Births / 1,000 Women |
| Less than High School | 98 (24.3%) | 101.0 |
| High School Diploma | 40 (9.9%) | 15.0 |
| College or Associate's Degree | 51 (12.7%) | 8.0 |
| Bachelor's Degree | 136 (33.8%) | 35.0 |
| Graduate Degree | 78 (19.4%) | 32.0 |
| Total | 403 (100.0%) | 25.0 |
Fertility by Education by Marriage Status in Burlington
40.7% of women with births in Burlington are unmarried. Women with the educational attainment of bachelor's degree are most likely to be married with 100.0% of them married at childbirth, while women with the educational attainment of high school diploma are least likely to be married with 100.0% of them unmarried at childbirth.
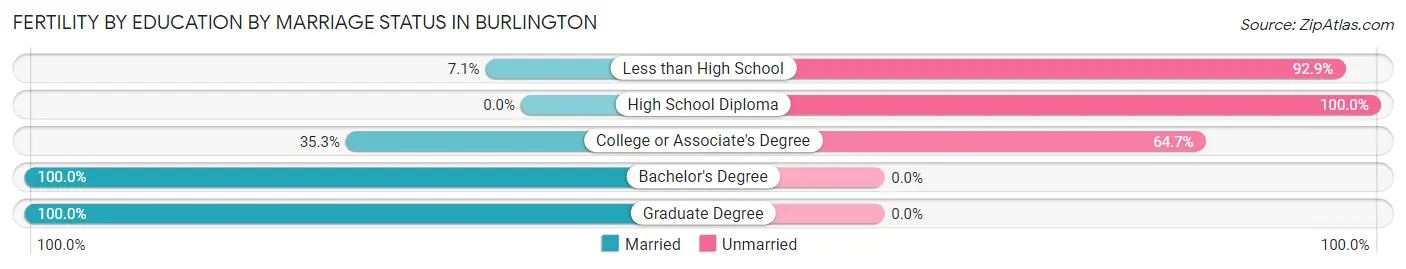
| Educational Attainment | Married | Unmarried |
| Less than High School | 7 (7.1%) | 91 (92.9%) |
| High School Diploma | 0 (0.0%) | 40 (100.0%) |
| College or Associate's Degree | 18 (35.3%) | 33 (64.7%) |
| Bachelor's Degree | 136 (100.0%) | 0 (0.0%) |
| Graduate Degree | 78 (100.0%) | 0 (0.0%) |
| Total | 239 (59.3%) | 164 (40.7%) |
Employment Characteristics in Burlington
Employment by Class of Employer in Burlington
Among the 24,164 employed individuals in Burlington, private company employees (13,368 | 55.3%), not-for-profit organizations (5,018 | 20.8%), and state government employees (2,019 | 8.4%) make up the most common classes of employment.
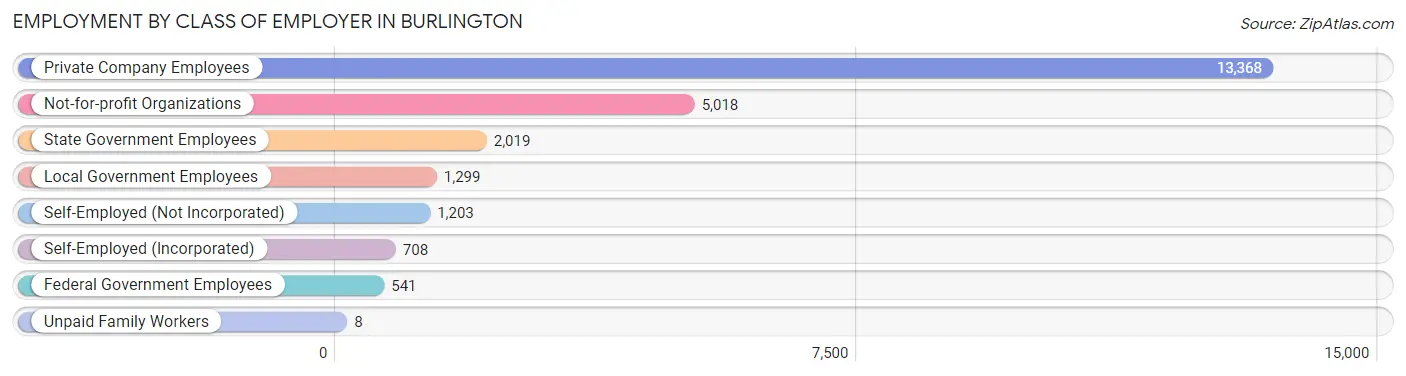
| Employer Class | # Employees | % Employees |
| Private Company Employees | 13,368 | 55.3% |
| Self-Employed (Incorporated) | 708 | 2.9% |
| Self-Employed (Not Incorporated) | 1,203 | 5.0% |
| Not-for-profit Organizations | 5,018 | 20.8% |
| Local Government Employees | 1,299 | 5.4% |
| State Government Employees | 2,019 | 8.4% |
| Federal Government Employees | 541 | 2.2% |
| Unpaid Family Workers | 8 | 0.0% |
| Total | 24,164 | 100.0% |
Employment Status by Age in Burlington
According to the labor force statistics for Burlington, out of the total population over 16 years of age (40,462), 64.8% or 26,219 individuals are in the labor force, with 4.7% or 1,232 of them unemployed. The age group with the highest labor force participation rate is 30 to 34 years, with 91.1% or 2,691 individuals in the labor force. Within the labor force, the 20 to 24 years age range has the highest percentage of unemployed individuals, with 7.3% or 507 of them being unemployed.
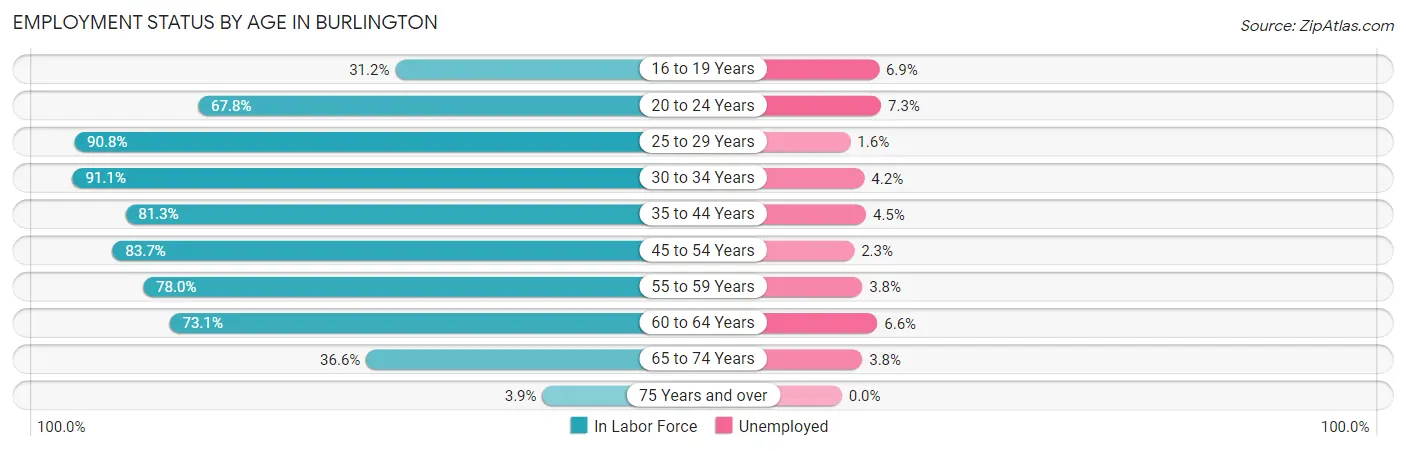
| Age Bracket | In Labor Force | Unemployed |
| 16 to 19 Years | 1,828 (31.2%) | 126 (6.9%) |
| 20 to 24 Years | 6,950 (67.8%) | 507 (7.3%) |
| 25 to 29 Years | 4,316 (90.8%) | 69 (1.6%) |
| 30 to 34 Years | 2,691 (91.1%) | 113 (4.2%) |
| 35 to 44 Years | 3,420 (81.3%) | 154 (4.5%) |
| 45 to 54 Years | 2,791 (83.7%) | 64 (2.3%) |
| 55 to 59 Years | 1,513 (78.0%) | 57 (3.8%) |
| 60 to 64 Years | 1,460 (73.1%) | 96 (6.6%) |
| 65 to 74 Years | 1,162 (36.6%) | 44 (3.8%) |
| 75 Years and over | 78 (3.9%) | 0 (0.0%) |
| Total | 26,219 (64.8%) | 1,232 (4.7%) |
Employment Status by Educational Attainment in Burlington
According to labor force statistics for Burlington, 84.4% of individuals (16,193) out of the total population between 25 and 64 years of age (19,186) are in the labor force, with 3.4% or 551 of them being unemployed. The group with the highest labor force participation rate are those with the educational attainment of bachelor's degree or higher, with 91.1% or 11,273 individuals in the labor force. Within the labor force, individuals with less than high school education have the highest percentage of unemployment, with 21.9% or 86 of them being unemployed.
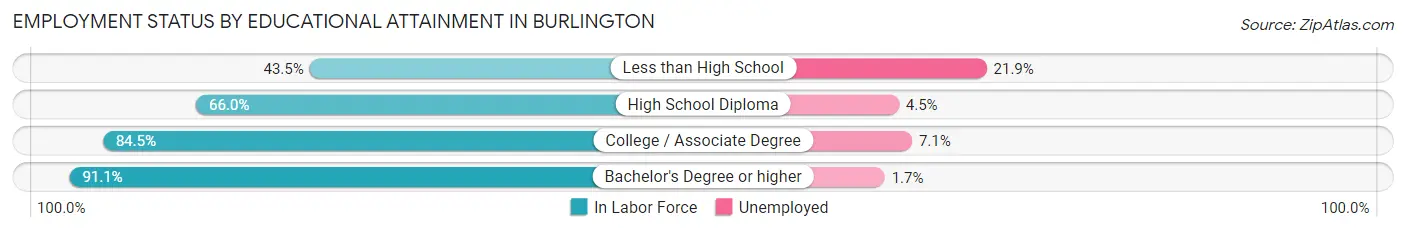
| Educational Attainment | In Labor Force | Unemployed |
| Less than High School | 392 (43.5%) | 198 (21.9%) |
| High School Diploma | 1,659 (66.0%) | 113 (4.5%) |
| College / Associate Degree | 2,870 (84.5%) | 241 (7.1%) |
| Bachelor's Degree or higher | 11,273 (91.1%) | 210 (1.7%) |
| Total | 16,193 (84.4%) | 652 (3.4%) |
Employment Occupations by Sex in Burlington
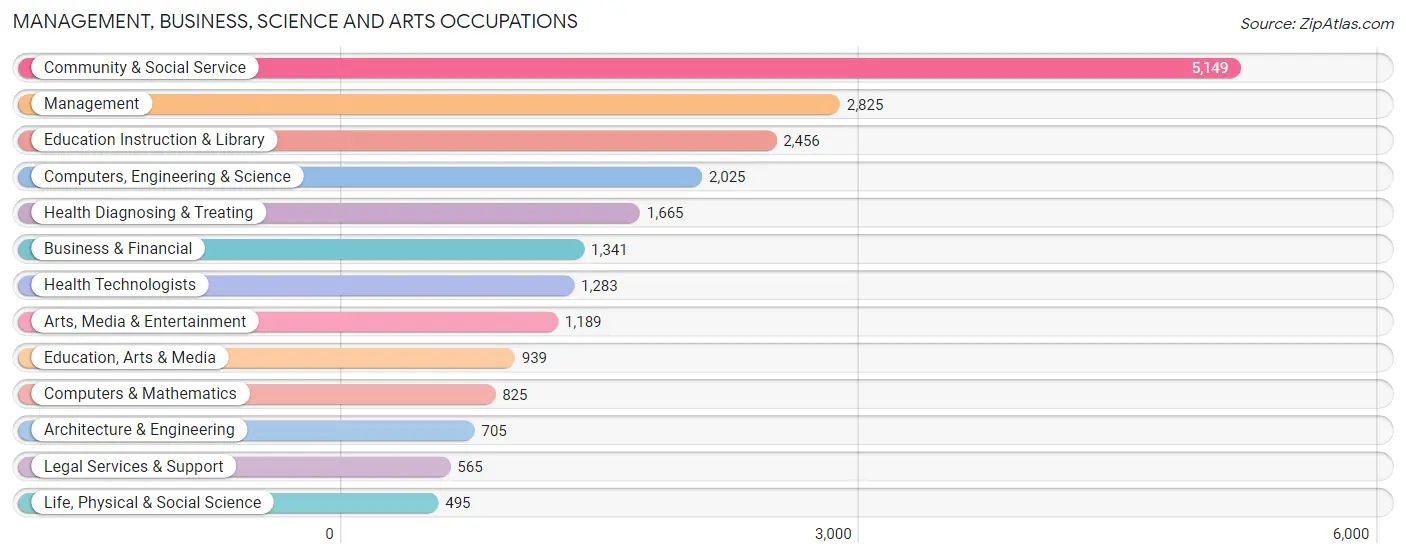
Management, Business, Science and Arts Occupations
The most common Management, Business, Science and Arts occupations in Burlington are Community & Social Service (5,149 | 20.7%), Management (2,825 | 11.3%), Education Instruction & Library (2,456 | 9.9%), Computers, Engineering & Science (2,025 | 8.1%), and Health Diagnosing & Treating (1,665 | 6.7%).
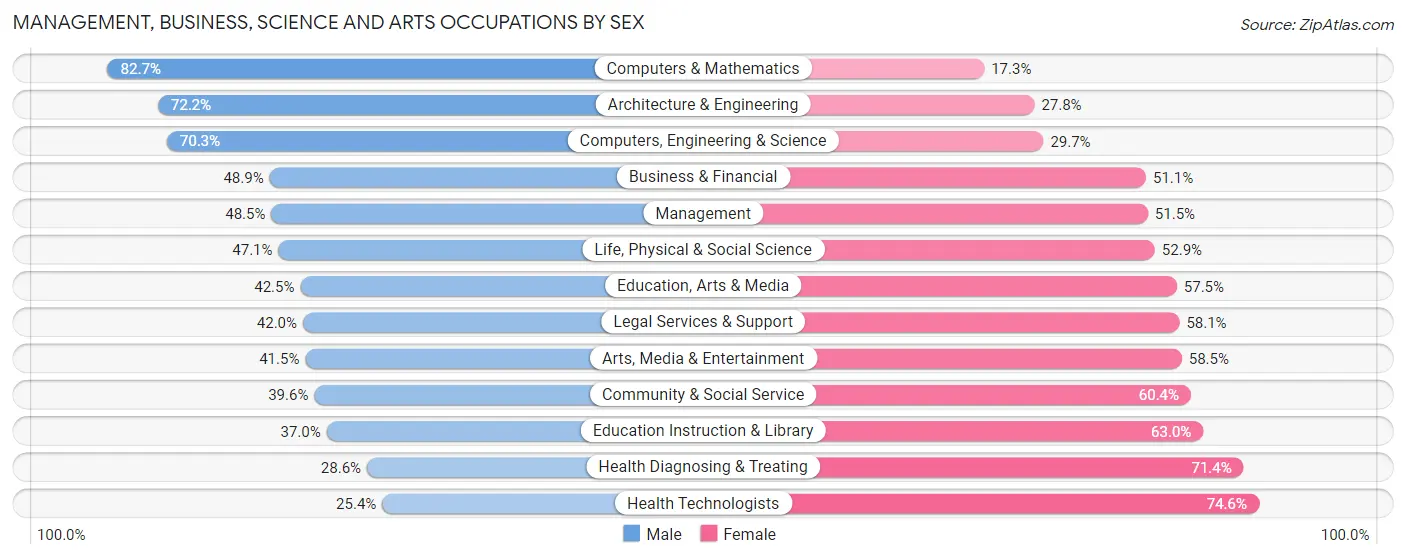
Management, Business, Science and Arts Occupations by Sex
Within the Management, Business, Science and Arts occupations in Burlington, the most male-oriented occupations are Computers & Mathematics (82.7%), Architecture & Engineering (72.2%), and Computers, Engineering & Science (70.3%), while the most female-oriented occupations are Health Technologists (74.6%), Health Diagnosing & Treating (71.4%), and Education Instruction & Library (63.0%).
| Occupation | Male | Female |
| Management | 1,371 (48.5%) | 1,454 (51.5%) |
| Business & Financial | 656 (48.9%) | 685 (51.1%) |
| Computers, Engineering & Science | 1,424 (70.3%) | 601 (29.7%) |
| Computers & Mathematics | 682 (82.7%) | 143 (17.3%) |
| Architecture & Engineering | 509 (72.2%) | 196 (27.8%) |
| Life, Physical & Social Science | 233 (47.1%) | 262 (52.9%) |
| Community & Social Service | 2,038 (39.6%) | 3,111 (60.4%) |
| Education, Arts & Media | 399 (42.5%) | 540 (57.5%) |
| Legal Services & Support | 237 (41.9%) | 328 (58.1%) |
| Education Instruction & Library | 909 (37.0%) | 1,547 (63.0%) |
| Arts, Media & Entertainment | 493 (41.5%) | 696 (58.5%) |
| Health Diagnosing & Treating | 476 (28.6%) | 1,189 (71.4%) |
| Health Technologists | 326 (25.4%) | 957 (74.6%) |
| Total (Category) | 5,965 (45.9%) | 7,040 (54.1%) |
| Total (Overall) | 11,884 (47.7%) | 13,036 (52.3%) |
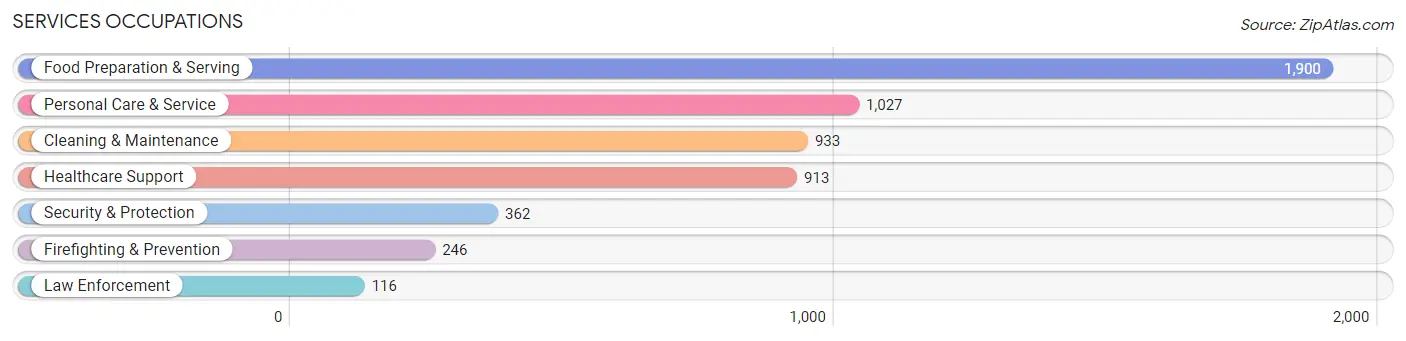
Services Occupations
The most common Services occupations in Burlington are Food Preparation & Serving (1,900 | 7.6%), Personal Care & Service (1,027 | 4.1%), Cleaning & Maintenance (933 | 3.7%), Healthcare Support (913 | 3.7%), and Security & Protection (362 | 1.5%).
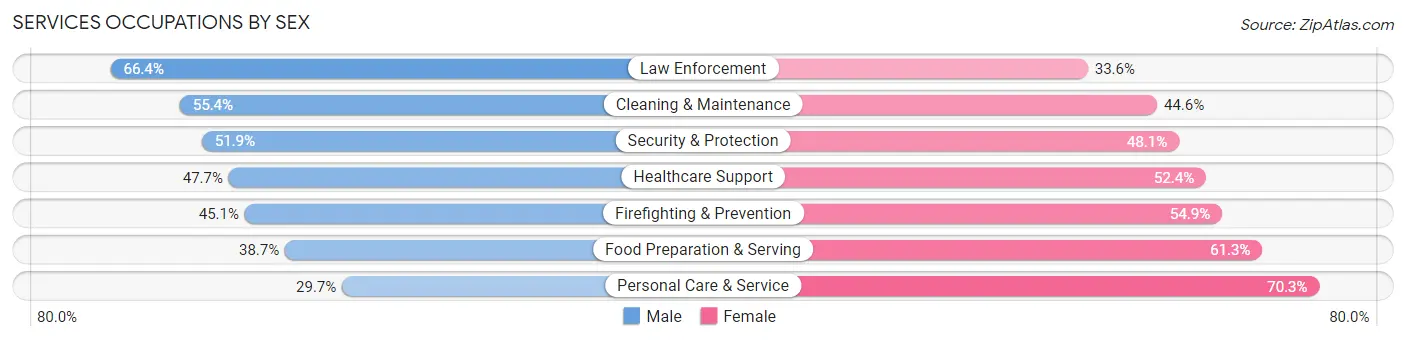
Services Occupations by Sex
Within the Services occupations in Burlington, the most male-oriented occupations are Law Enforcement (66.4%), Cleaning & Maintenance (55.4%), and Security & Protection (51.9%), while the most female-oriented occupations are Personal Care & Service (70.3%), Food Preparation & Serving (61.3%), and Firefighting & Prevention (54.9%).
| Occupation | Male | Female |
| Healthcare Support | 435 (47.6%) | 478 (52.3%) |
| Security & Protection | 188 (51.9%) | 174 (48.1%) |
| Firefighting & Prevention | 111 (45.1%) | 135 (54.9%) |
| Law Enforcement | 77 (66.4%) | 39 (33.6%) |
| Food Preparation & Serving | 736 (38.7%) | 1,164 (61.3%) |
| Cleaning & Maintenance | 517 (55.4%) | 416 (44.6%) |
| Personal Care & Service | 305 (29.7%) | 722 (70.3%) |
| Total (Category) | 2,181 (42.5%) | 2,954 (57.5%) |
| Total (Overall) | 11,884 (47.7%) | 13,036 (52.3%) |
Sales and Office Occupations
The most common Sales and Office occupations in Burlington are Office & Administration (2,113 | 8.5%), and Sales & Related (2,046 | 8.2%).

Sales and Office Occupations by Sex
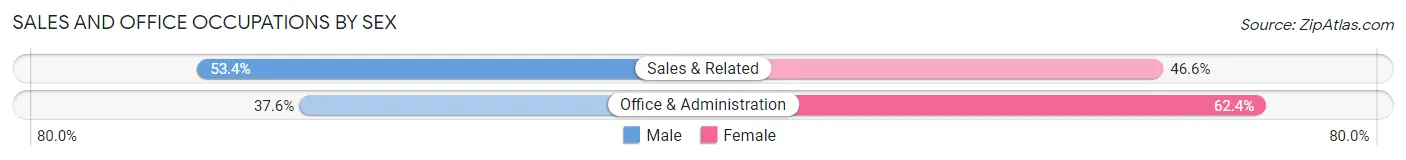
| Occupation | Male | Female |
| Sales & Related | 1,093 (53.4%) | 953 (46.6%) |
| Office & Administration | 795 (37.6%) | 1,318 (62.4%) |
| Total (Category) | 1,888 (45.4%) | 2,271 (54.6%) |
| Total (Overall) | 11,884 (47.7%) | 13,036 (52.3%) |
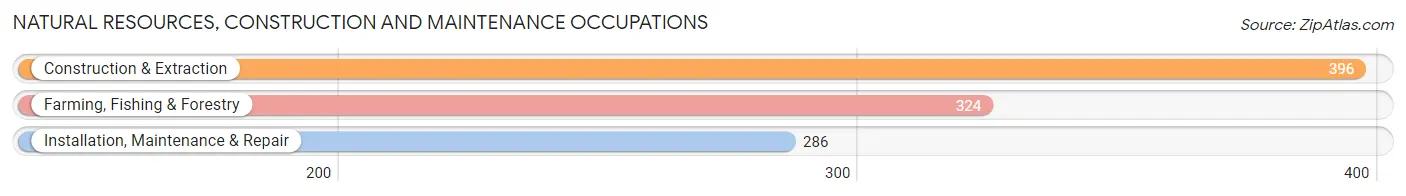
Natural Resources, Construction and Maintenance Occupations
The most common Natural Resources, Construction and Maintenance occupations in Burlington are Construction & Extraction (396 | 1.6%), Farming, Fishing & Forestry (324 | 1.3%), and Installation, Maintenance & Repair (286 | 1.1%).
Natural Resources, Construction and Maintenance Occupations by Sex
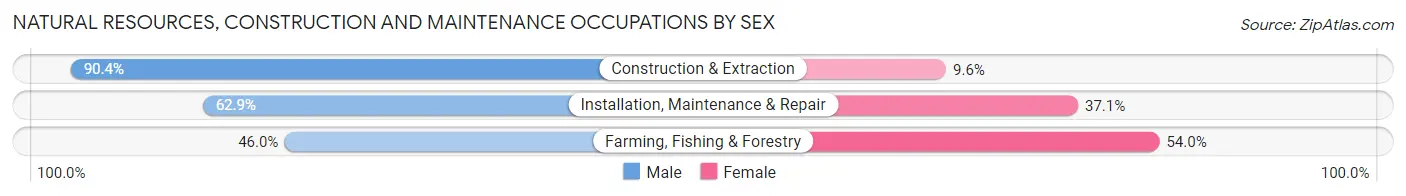
| Occupation | Male | Female |
| Farming, Fishing & Forestry | 149 (46.0%) | 175 (54.0%) |
| Construction & Extraction | 358 (90.4%) | 38 (9.6%) |
| Installation, Maintenance & Repair | 180 (62.9%) | 106 (37.1%) |
| Total (Category) | 687 (68.3%) | 319 (31.7%) |
| Total (Overall) | 11,884 (47.7%) | 13,036 (52.3%) |
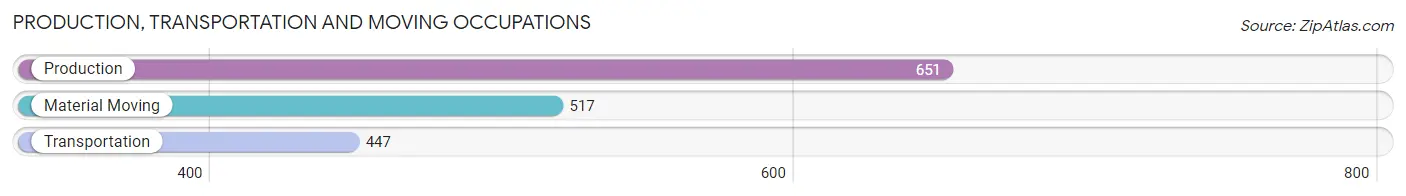
Production, Transportation and Moving Occupations
The most common Production, Transportation and Moving occupations in Burlington are Production (651 | 2.6%), Material Moving (517 | 2.1%), and Transportation (447 | 1.8%).
Production, Transportation and Moving Occupations by Sex
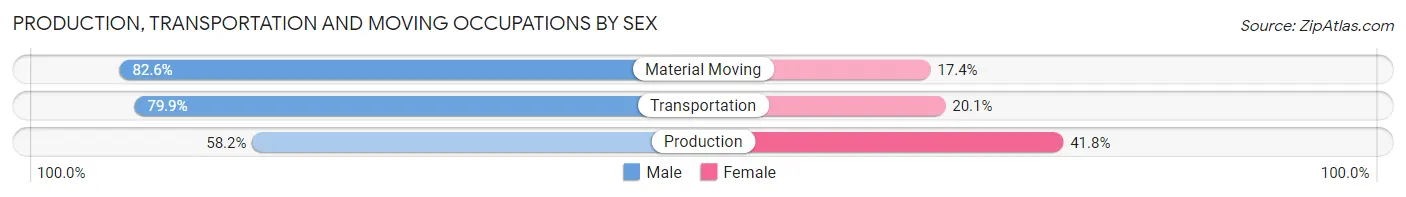
| Occupation | Male | Female |
| Production | 379 (58.2%) | 272 (41.8%) |
| Transportation | 357 (79.9%) | 90 (20.1%) |
| Material Moving | 427 (82.6%) | 90 (17.4%) |
| Total (Category) | 1,163 (72.0%) | 452 (28.0%) |
| Total (Overall) | 11,884 (47.7%) | 13,036 (52.3%) |
Employment Industries by Sex in Burlington
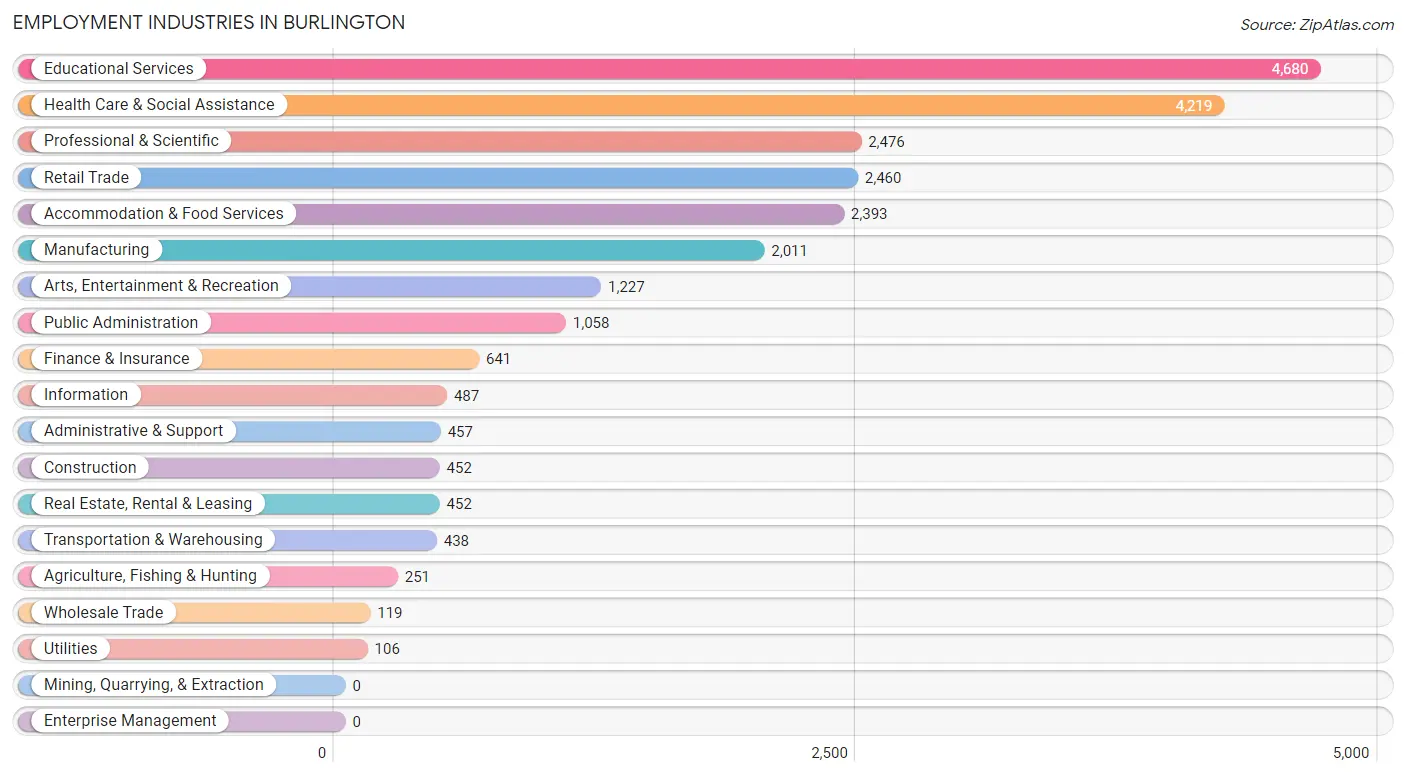
Employment Industries in Burlington
The major employment industries in Burlington include Educational Services (4,680 | 18.8%), Health Care & Social Assistance (4,219 | 16.9%), Professional & Scientific (2,476 | 9.9%), Retail Trade (2,460 | 9.9%), and Accommodation & Food Services (2,393 | 9.6%).
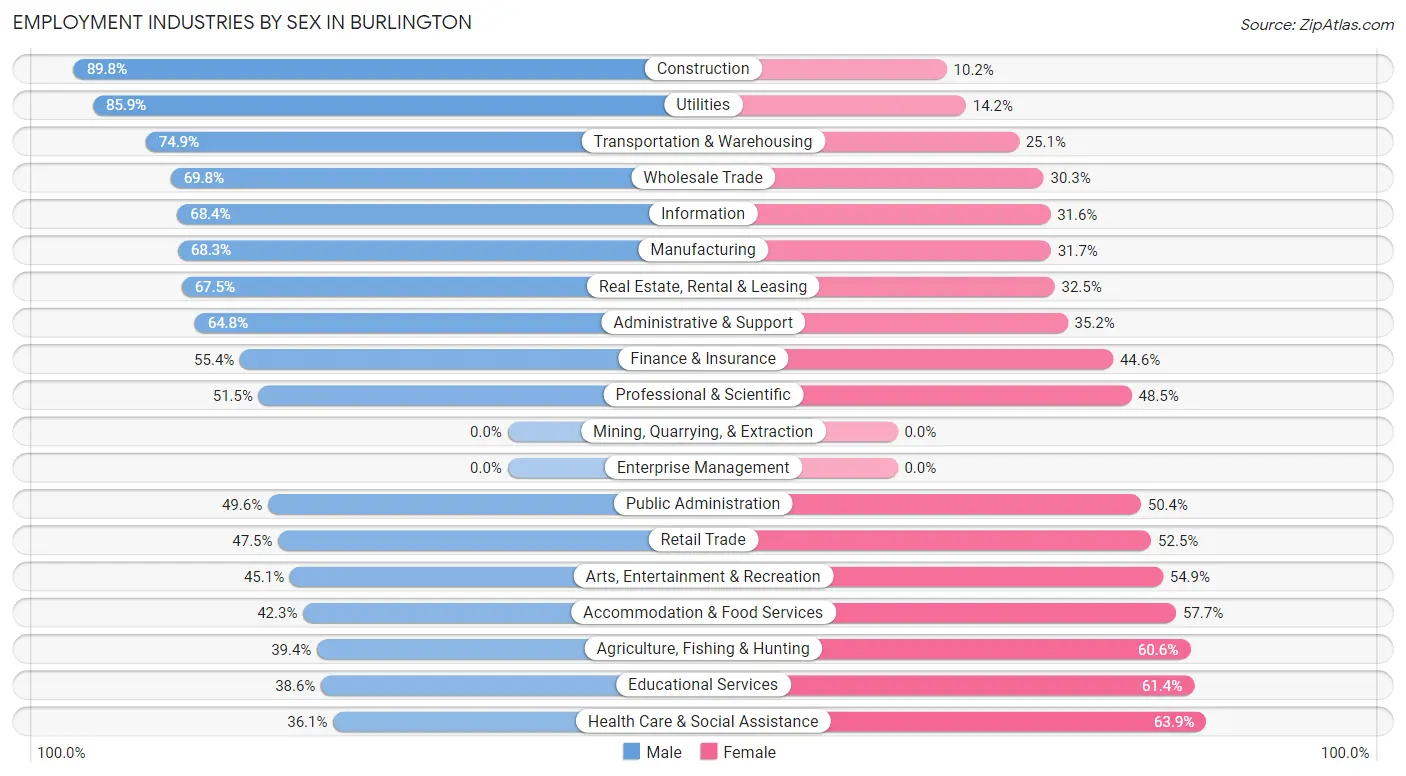
Employment Industries by Sex in Burlington
The Burlington industries that see more men than women are Construction (89.8%), Utilities (85.9%), and Transportation & Warehousing (74.9%), whereas the industries that tend to have a higher number of women are Health Care & Social Assistance (63.9%), Educational Services (61.4%), and Agriculture, Fishing & Hunting (60.6%).
| Industry | Male | Female |
| Agriculture, Fishing & Hunting | 99 (39.4%) | 152 (60.6%) |
| Mining, Quarrying, & Extraction | 0 (0.0%) | 0 (0.0%) |
| Construction | 406 (89.8%) | 46 (10.2%) |
| Manufacturing | 1,373 (68.3%) | 638 (31.7%) |
| Wholesale Trade | 83 (69.8%) | 36 (30.2%) |
| Retail Trade | 1,168 (47.5%) | 1,292 (52.5%) |
| Transportation & Warehousing | 328 (74.9%) | 110 (25.1%) |
| Utilities | 91 (85.9%) | 15 (14.1%) |
| Information | 333 (68.4%) | 154 (31.6%) |
| Finance & Insurance | 355 (55.4%) | 286 (44.6%) |
| Real Estate, Rental & Leasing | 305 (67.5%) | 147 (32.5%) |
| Professional & Scientific | 1,276 (51.5%) | 1,200 (48.5%) |
| Enterprise Management | 0 (0.0%) | 0 (0.0%) |
| Administrative & Support | 296 (64.8%) | 161 (35.2%) |
| Educational Services | 1,807 (38.6%) | 2,873 (61.4%) |
| Health Care & Social Assistance | 1,523 (36.1%) | 2,696 (63.9%) |
| Arts, Entertainment & Recreation | 553 (45.1%) | 674 (54.9%) |
| Accommodation & Food Services | 1,013 (42.3%) | 1,380 (57.7%) |
| Public Administration | 525 (49.6%) | 533 (50.4%) |
| Total | 11,884 (47.7%) | 13,036 (52.3%) |
Education in Burlington
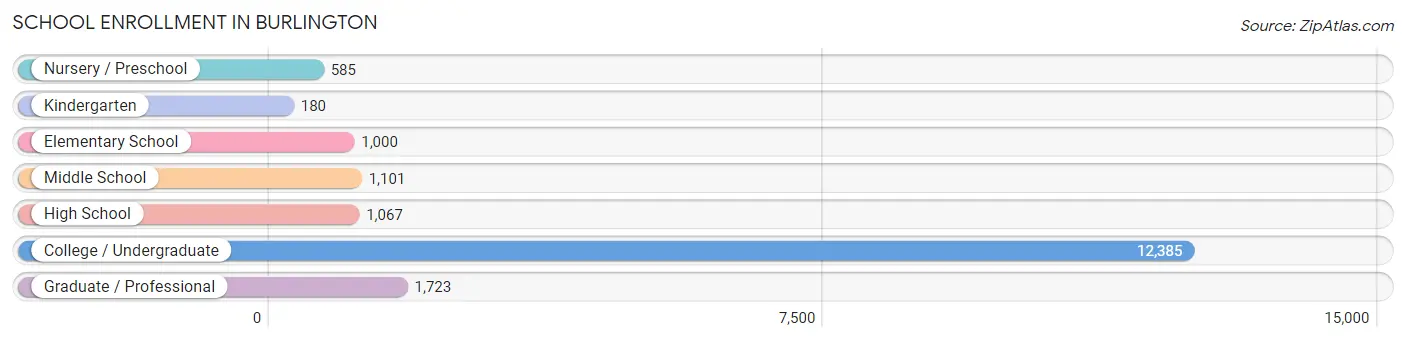
School Enrollment in Burlington
The most common levels of schooling among the 18,041 students in Burlington are college / undergraduate (12,385 | 68.6%), graduate / professional (1,723 | 9.6%), and middle school (1,101 | 6.1%).
| School Level | # Students | % Students |
| Nursery / Preschool | 585 | 3.2% |
| Kindergarten | 180 | 1.0% |
| Elementary School | 1,000 | 5.5% |
| Middle School | 1,101 | 6.1% |
| High School | 1,067 | 5.9% |
| College / Undergraduate | 12,385 | 68.6% |
| Graduate / Professional | 1,723 | 9.6% |
| Total | 18,041 | 100.0% |
School Enrollment by Age by Funding Source in Burlington
Out of a total of 18,041 students who are enrolled in schools in Burlington, 2,724 (15.1%) attend a private institution, while the remaining 15,317 (84.9%) are enrolled in public schools. The age group of 3 to 4 year olds has the highest likelihood of being enrolled in private schools, with 198 (43.1% in the age bracket) enrolled. Conversely, the age group of 10 to 14 year olds has the lowest likelihood of being enrolled in a private school, with 1,270 (93.3% in the age bracket) attending a public institution.
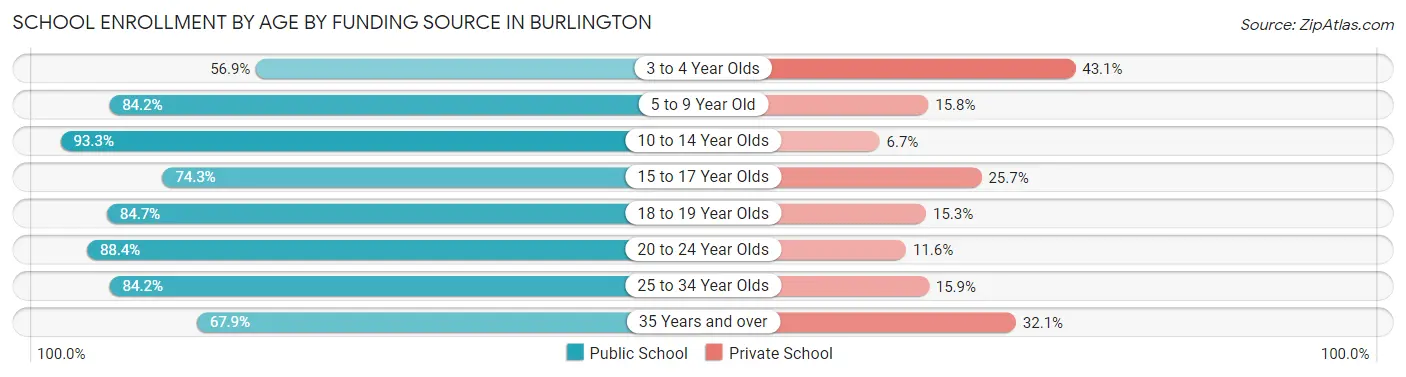
| Age Bracket | Public School | Private School |
| 3 to 4 Year Olds | 261 (56.9%) | 198 (43.1%) |
| 5 to 9 Year Old | 956 (84.2%) | 179 (15.8%) |
| 10 to 14 Year Olds | 1,270 (93.3%) | 91 (6.7%) |
| 15 to 17 Year Olds | 692 (74.3%) | 239 (25.7%) |
| 18 to 19 Year Olds | 4,260 (84.7%) | 772 (15.3%) |
| 20 to 24 Year Olds | 6,397 (88.4%) | 841 (11.6%) |
| 25 to 34 Year Olds | 1,025 (84.2%) | 193 (15.9%) |
| 35 Years and over | 453 (67.9%) | 214 (32.1%) |
| Total | 15,317 (84.9%) | 2,724 (15.1%) |
Educational Attainment by Field of Study in Burlington
Social sciences (2,109 | 12.7%), bio, nature & agricultural (1,835 | 11.1%), literature & languages (1,699 | 10.2%), visual & performing arts (1,580 | 9.5%), and business (1,486 | 9.0%) are the most common fields of study among 16,591 individuals in Burlington who have obtained a bachelor's degree or higher.
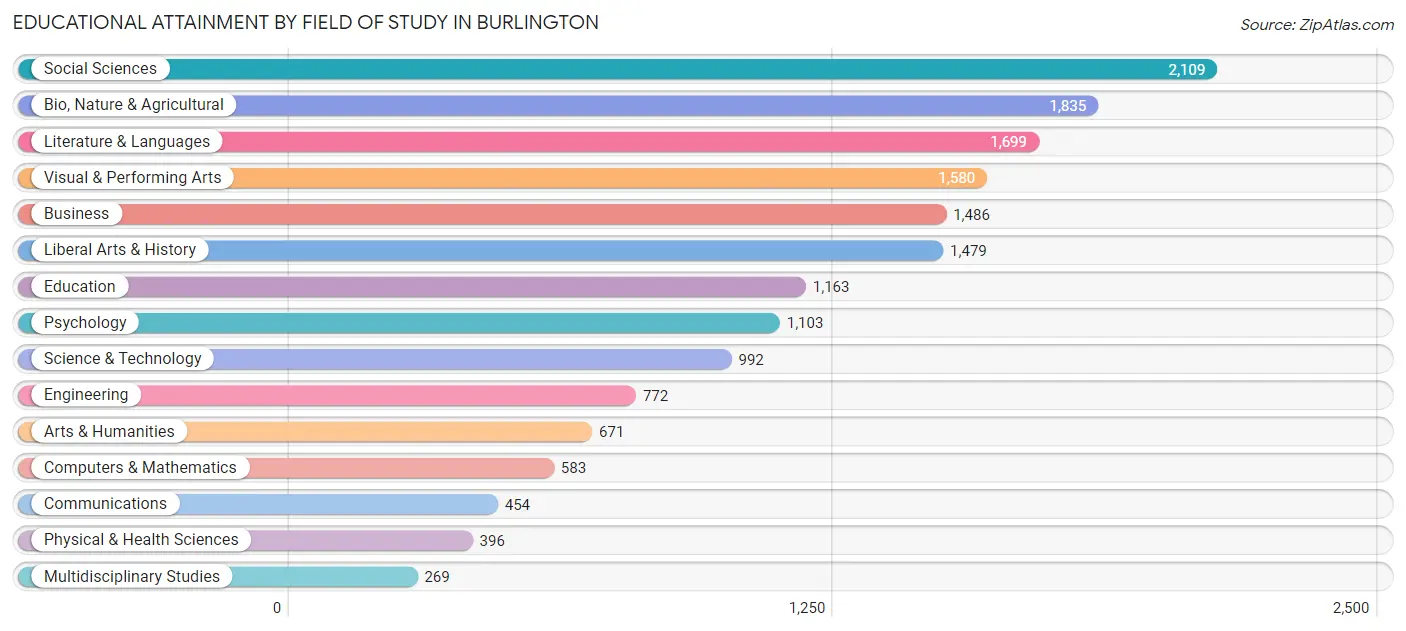
| Field of Study | # Graduates | % Graduates |
| Computers & Mathematics | 583 | 3.5% |
| Bio, Nature & Agricultural | 1,835 | 11.1% |
| Physical & Health Sciences | 396 | 2.4% |
| Psychology | 1,103 | 6.7% |
| Social Sciences | 2,109 | 12.7% |
| Engineering | 772 | 4.6% |
| Multidisciplinary Studies | 269 | 1.6% |
| Science & Technology | 992 | 6.0% |
| Business | 1,486 | 9.0% |
| Education | 1,163 | 7.0% |
| Literature & Languages | 1,699 | 10.2% |
| Liberal Arts & History | 1,479 | 8.9% |
| Visual & Performing Arts | 1,580 | 9.5% |
| Communications | 454 | 2.7% |
| Arts & Humanities | 671 | 4.0% |
| Total | 16,591 | 100.0% |
Transportation & Commute in Burlington
Vehicle Availability by Sex in Burlington
The most prevalent vehicle ownership categories in Burlington are males with 2 vehicles (4,664, accounting for 43.1%) and females with 2 vehicles (4,724, making up 41.2%).
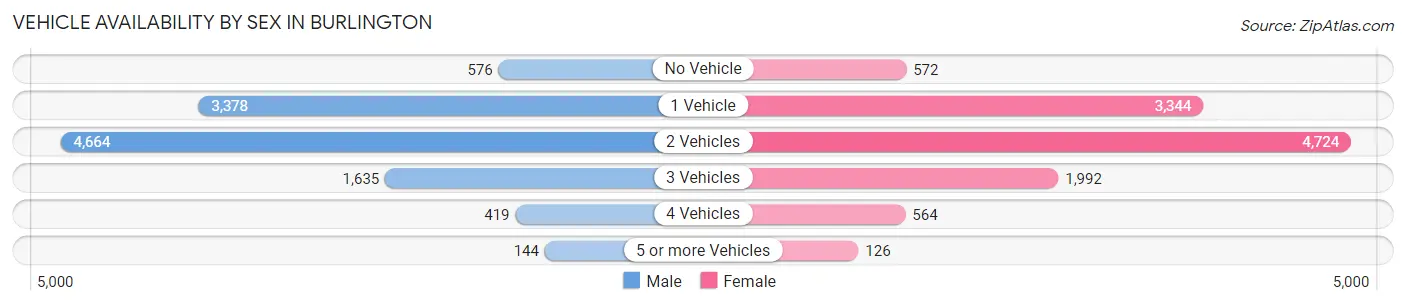
| Vehicles Available | Male | Female |
| No Vehicle | 576 (5.3%) | 572 (5.1%) |
| 1 Vehicle | 3,378 (31.2%) | 3,344 (29.5%) |
| 2 Vehicles | 4,664 (43.1%) | 4,724 (41.7%) |
| 3 Vehicles | 1,635 (15.1%) | 1,992 (17.6%) |
| 4 Vehicles | 419 (3.9%) | 564 (5.0%) |
| 5 or more Vehicles | 144 (1.3%) | 126 (1.1%) |
| Total | 10,816 (100.0%) | 11,322 (100.0%) |
Commute Time in Burlington
The most frequently occuring commute durations in Burlington are 10 to 14 minutes (4,529 commuters, 21.8%), 15 to 19 minutes (4,443 commuters, 21.4%), and 5 to 9 minutes (3,372 commuters, 16.2%).
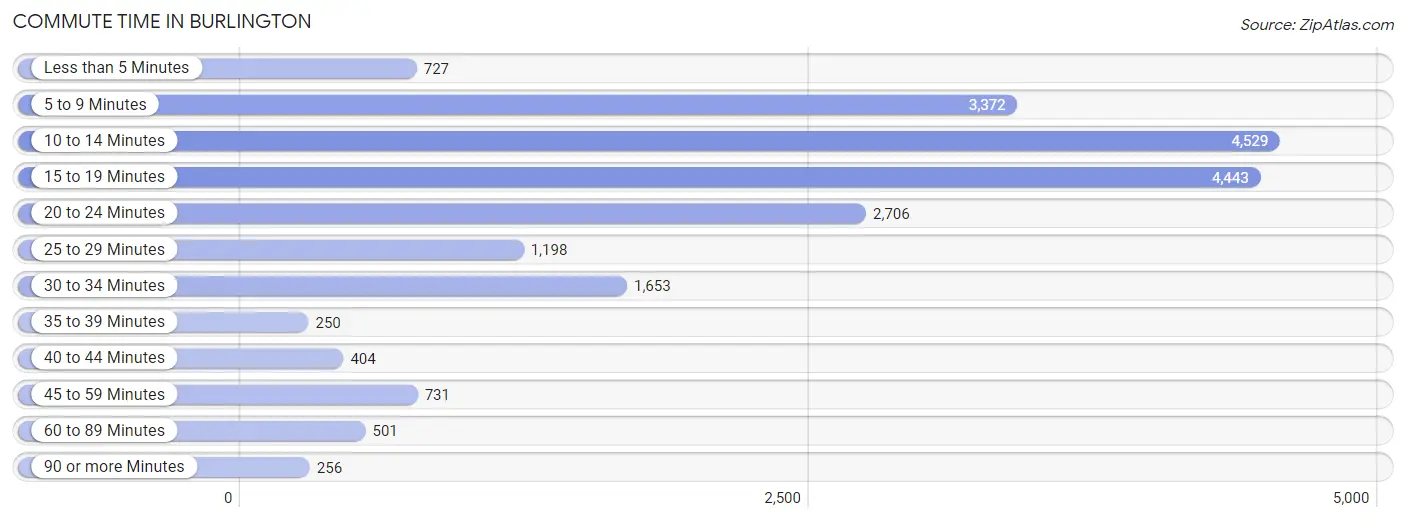
| Commute Time | # Commuters | % Commuters |
| Less than 5 Minutes | 727 | 3.5% |
| 5 to 9 Minutes | 3,372 | 16.2% |
| 10 to 14 Minutes | 4,529 | 21.8% |
| 15 to 19 Minutes | 4,443 | 21.4% |
| 20 to 24 Minutes | 2,706 | 13.0% |
| 25 to 29 Minutes | 1,198 | 5.8% |
| 30 to 34 Minutes | 1,653 | 8.0% |
| 35 to 39 Minutes | 250 | 1.2% |
| 40 to 44 Minutes | 404 | 1.9% |
| 45 to 59 Minutes | 731 | 3.5% |
| 60 to 89 Minutes | 501 | 2.4% |
| 90 or more Minutes | 256 | 1.2% |
Commute Time by Sex in Burlington
The most common commute times in Burlington are 10 to 14 minutes (2,062 commuters, 21.1%) for males and 15 to 19 minutes (2,476 commuters, 22.5%) for females.
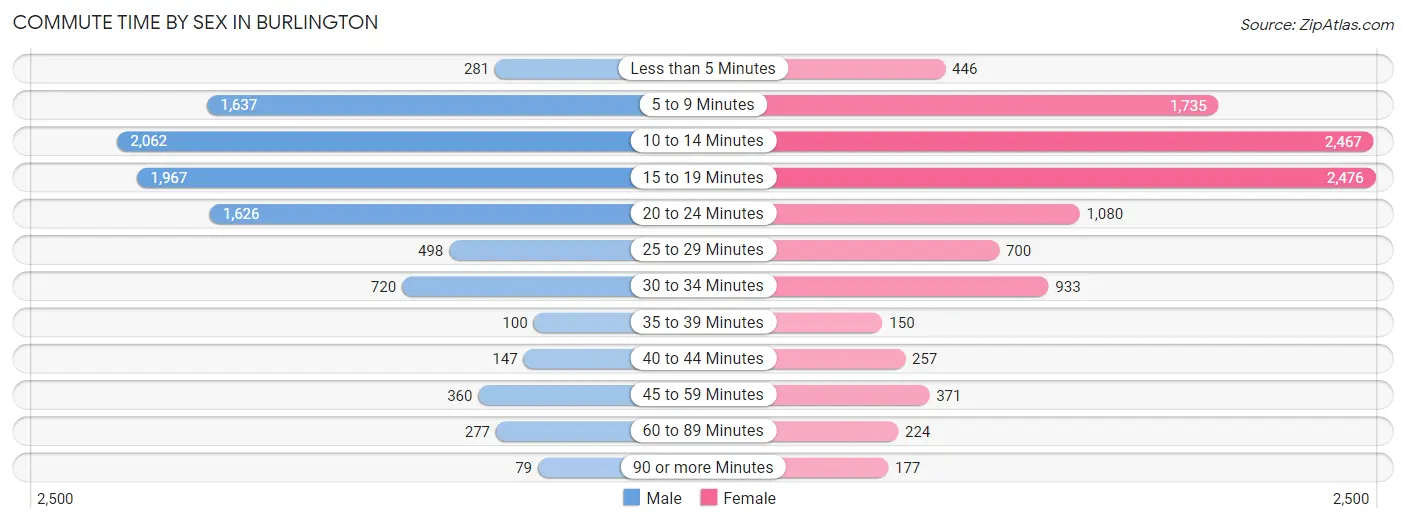
| Commute Time | Male | Female |
| Less than 5 Minutes | 281 (2.9%) | 446 (4.1%) |
| 5 to 9 Minutes | 1,637 (16.8%) | 1,735 (15.8%) |
| 10 to 14 Minutes | 2,062 (21.1%) | 2,467 (22.4%) |
| 15 to 19 Minutes | 1,967 (20.2%) | 2,476 (22.5%) |
| 20 to 24 Minutes | 1,626 (16.7%) | 1,080 (9.8%) |
| 25 to 29 Minutes | 498 (5.1%) | 700 (6.4%) |
| 30 to 34 Minutes | 720 (7.4%) | 933 (8.5%) |
| 35 to 39 Minutes | 100 (1.0%) | 150 (1.4%) |
| 40 to 44 Minutes | 147 (1.5%) | 257 (2.3%) |
| 45 to 59 Minutes | 360 (3.7%) | 371 (3.4%) |
| 60 to 89 Minutes | 277 (2.8%) | 224 (2.0%) |
| 90 or more Minutes | 79 (0.8%) | 177 (1.6%) |
Time of Departure to Work by Sex in Burlington
The most frequent times of departure to work in Burlington are 7:30 AM to 7:59 AM (1,334, 13.7%) for males and 7:30 AM to 7:59 AM (1,941, 17.6%) for females.
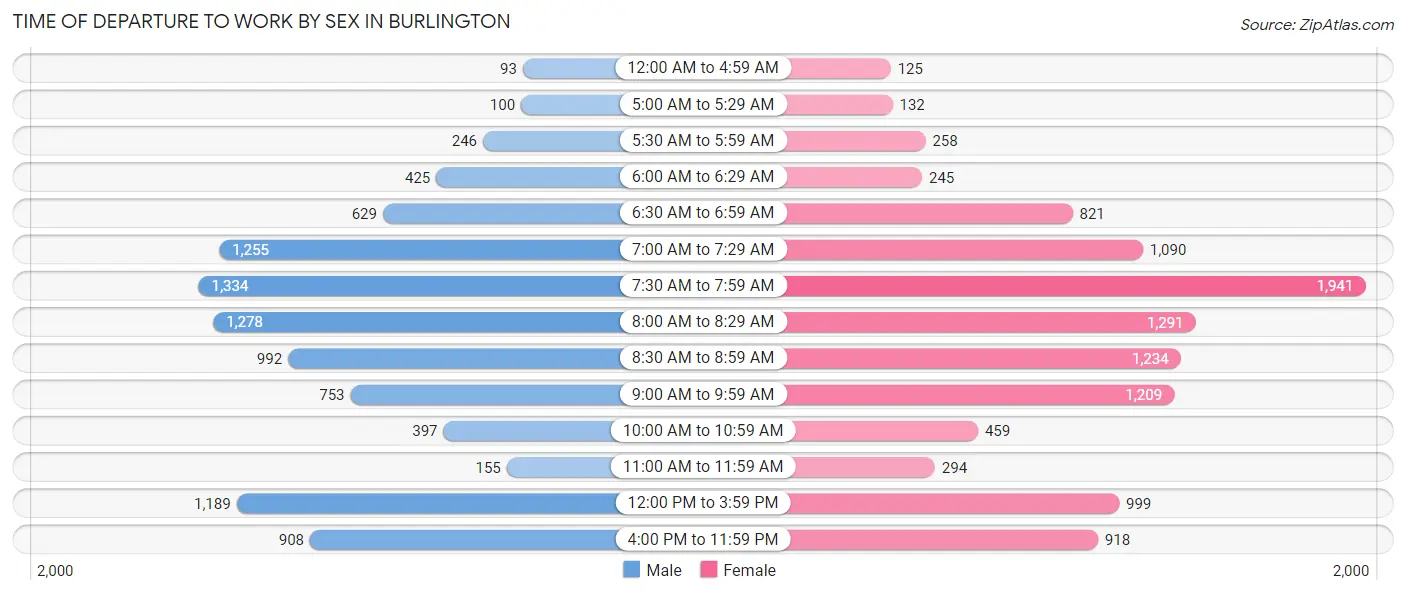
| Time of Departure | Male | Female |
| 12:00 AM to 4:59 AM | 93 (0.9%) | 125 (1.1%) |
| 5:00 AM to 5:29 AM | 100 (1.0%) | 132 (1.2%) |
| 5:30 AM to 5:59 AM | 246 (2.5%) | 258 (2.3%) |
| 6:00 AM to 6:29 AM | 425 (4.4%) | 245 (2.2%) |
| 6:30 AM to 6:59 AM | 629 (6.5%) | 821 (7.4%) |
| 7:00 AM to 7:29 AM | 1,255 (12.9%) | 1,090 (9.9%) |
| 7:30 AM to 7:59 AM | 1,334 (13.7%) | 1,941 (17.6%) |
| 8:00 AM to 8:29 AM | 1,278 (13.1%) | 1,291 (11.7%) |
| 8:30 AM to 8:59 AM | 992 (10.2%) | 1,234 (11.2%) |
| 9:00 AM to 9:59 AM | 753 (7.7%) | 1,209 (11.0%) |
| 10:00 AM to 10:59 AM | 397 (4.1%) | 459 (4.2%) |
| 11:00 AM to 11:59 AM | 155 (1.6%) | 294 (2.7%) |
| 12:00 PM to 3:59 PM | 1,189 (12.2%) | 999 (9.1%) |
| 4:00 PM to 11:59 PM | 908 (9.3%) | 918 (8.3%) |
| Total | 9,754 (100.0%) | 11,016 (100.0%) |
Housing Occupancy in Burlington
Occupancy by Ownership in Burlington
Of the total 17,448 dwellings in Burlington, owner-occupied units account for 6,967 (39.9%), while renter-occupied units make up 10,481 (60.1%).
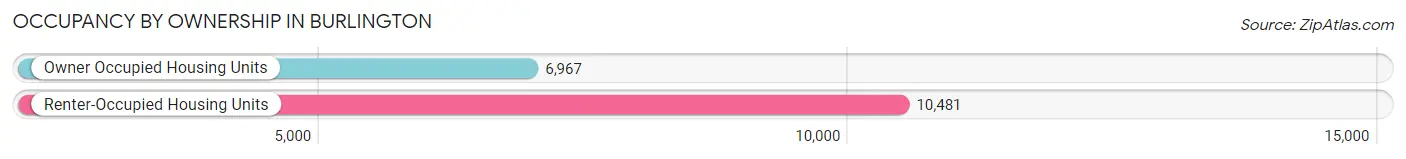
| Occupancy | # Housing Units | % Housing Units |
| Owner Occupied Housing Units | 6,967 | 39.9% |
| Renter-Occupied Housing Units | 10,481 | 60.1% |
| Total Occupied Housing Units | 17,448 | 100.0% |
Occupancy by Household Size in Burlington
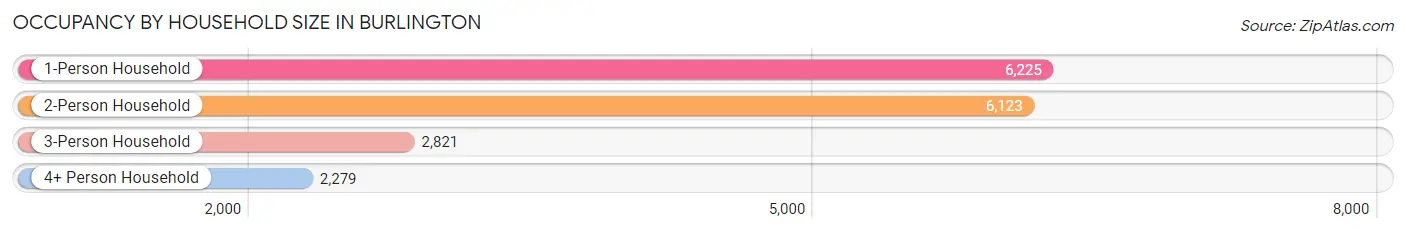
| Household Size | # Housing Units | % Housing Units |
| 1-Person Household | 6,225 | 35.7% |
| 2-Person Household | 6,123 | 35.1% |
| 3-Person Household | 2,821 | 16.2% |
| 4+ Person Household | 2,279 | 13.1% |
| Total Housing Units | 17,448 | 100.0% |
Occupancy by Ownership by Household Size in Burlington
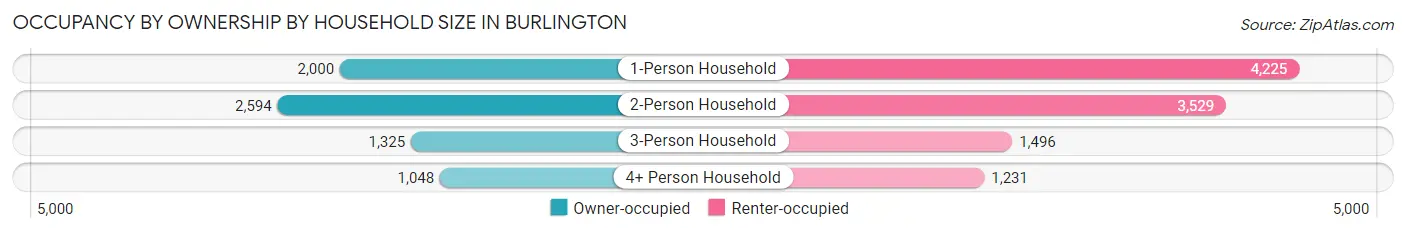
| Household Size | Owner-occupied | Renter-occupied |
| 1-Person Household | 2,000 (32.1%) | 4,225 (67.9%) |
| 2-Person Household | 2,594 (42.4%) | 3,529 (57.6%) |
| 3-Person Household | 1,325 (47.0%) | 1,496 (53.0%) |
| 4+ Person Household | 1,048 (46.0%) | 1,231 (54.0%) |
| Total Housing Units | 6,967 (39.9%) | 10,481 (60.1%) |
Occupancy by Educational Attainment in Burlington
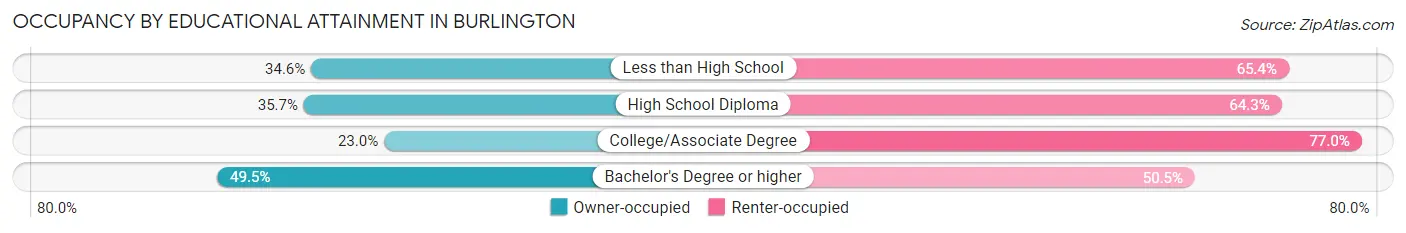
| Household Size | Owner-occupied | Renter-occupied |
| Less than High School | 253 (34.6%) | 479 (65.4%) |
| High School Diploma | 838 (35.7%) | 1,509 (64.3%) |
| College/Associate Degree | 1,070 (23.0%) | 3,582 (77.0%) |
| Bachelor's Degree or higher | 4,806 (49.5%) | 4,911 (50.5%) |
Occupancy by Age of Householder in Burlington
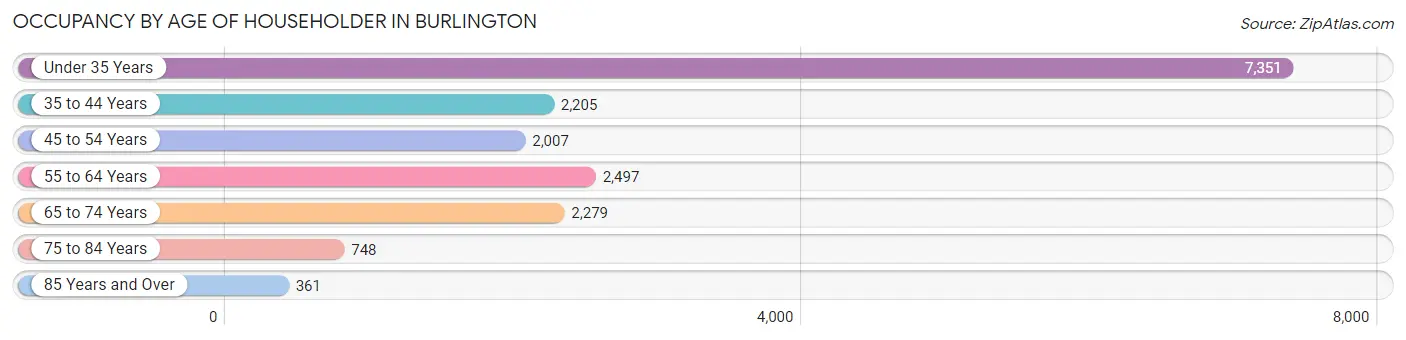
| Age Bracket | # Households | % Households |
| Under 35 Years | 7,351 | 42.1% |
| 35 to 44 Years | 2,205 | 12.6% |
| 45 to 54 Years | 2,007 | 11.5% |
| 55 to 64 Years | 2,497 | 14.3% |
| 65 to 74 Years | 2,279 | 13.1% |
| 75 to 84 Years | 748 | 4.3% |
| 85 Years and Over | 361 | 2.1% |
| Total | 17,448 | 100.0% |
Housing Finances in Burlington
Median Income by Occupancy in Burlington
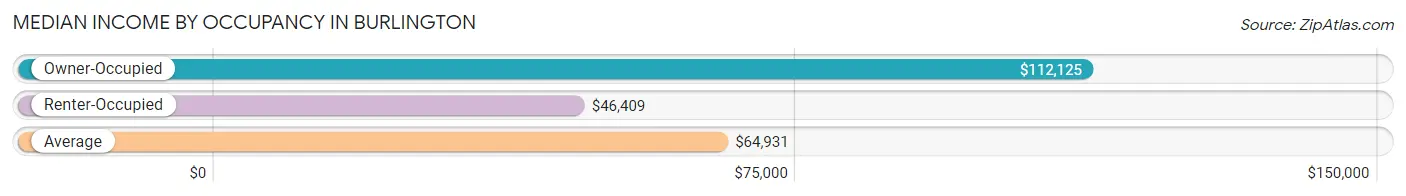
| Occupancy Type | # Households | Median Income |
| Owner-Occupied | 6,967 (39.9%) | $112,125 |
| Renter-Occupied | 10,481 (60.1%) | $46,409 |
| Average | 17,448 (100.0%) | $64,931 |
Occupancy by Householder Income Bracket in Burlington
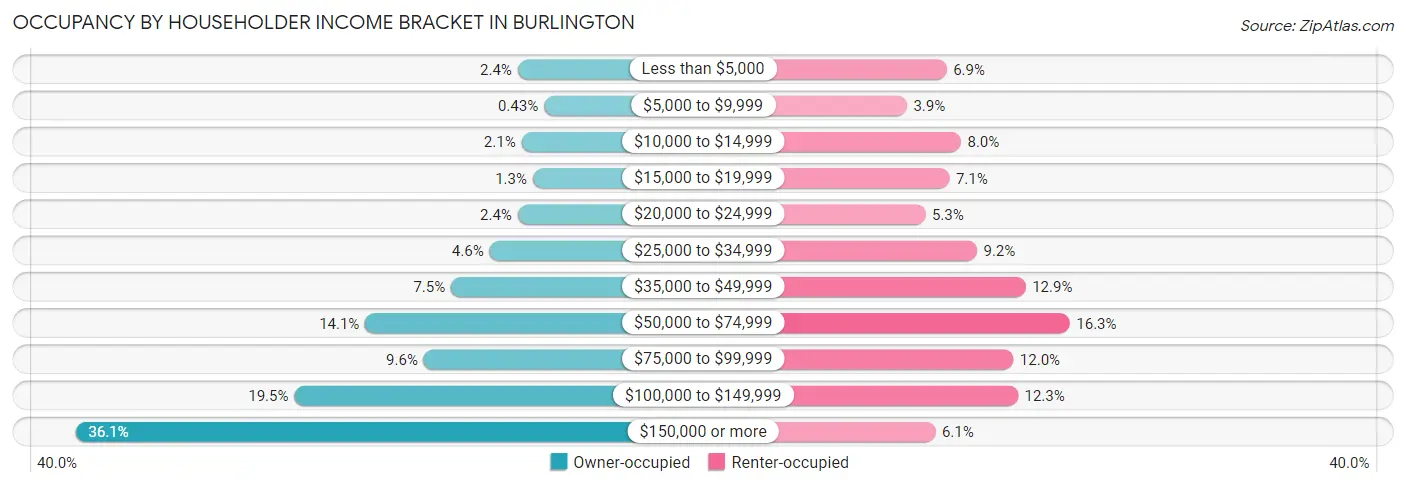
| Income Bracket | Owner-occupied | Renter-occupied |
| Less than $5,000 | 169 (2.4%) | 724 (6.9%) |
| $5,000 to $9,999 | 30 (0.4%) | 407 (3.9%) |
| $10,000 to $14,999 | 149 (2.1%) | 838 (8.0%) |
| $15,000 to $19,999 | 89 (1.3%) | 746 (7.1%) |
| $20,000 to $24,999 | 169 (2.4%) | 554 (5.3%) |
| $25,000 to $34,999 | 319 (4.6%) | 966 (9.2%) |
| $35,000 to $49,999 | 523 (7.5%) | 1,355 (12.9%) |
| $50,000 to $74,999 | 979 (14.1%) | 1,707 (16.3%) |
| $75,000 to $99,999 | 668 (9.6%) | 1,257 (12.0%) |
| $100,000 to $149,999 | 1,355 (19.5%) | 1,293 (12.3%) |
| $150,000 or more | 2,517 (36.1%) | 634 (6.0%) |
| Total | 6,967 (100.0%) | 10,481 (100.0%) |
Monthly Housing Cost Tiers in Burlington
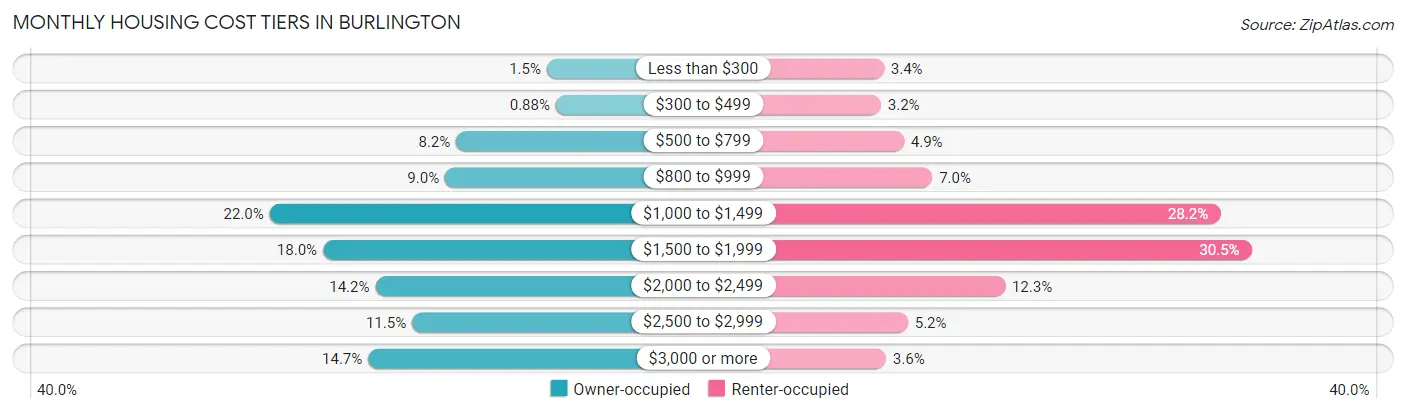
| Monthly Cost | Owner-occupied | Renter-occupied |
| Less than $300 | 107 (1.5%) | 358 (3.4%) |
| $300 to $499 | 61 (0.9%) | 335 (3.2%) |
| $500 to $799 | 573 (8.2%) | 513 (4.9%) |
| $800 to $999 | 630 (9.0%) | 732 (7.0%) |
| $1,000 to $1,499 | 1,530 (22.0%) | 2,954 (28.2%) |
| $1,500 to $1,999 | 1,256 (18.0%) | 3,196 (30.5%) |
| $2,000 to $2,499 | 987 (14.2%) | 1,293 (12.3%) |
| $2,500 to $2,999 | 799 (11.5%) | 543 (5.2%) |
| $3,000 or more | 1,024 (14.7%) | 374 (3.6%) |
| Total | 6,967 (100.0%) | 10,481 (100.0%) |
Physical Housing Characteristics in Burlington
Housing Structures in Burlington
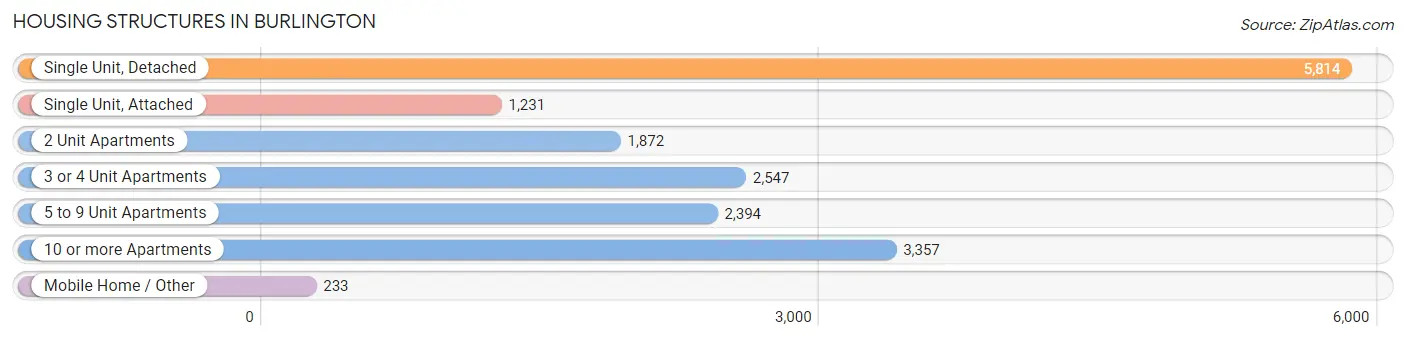
| Structure Type | # Housing Units | % Housing Units |
| Single Unit, Detached | 5,814 | 33.3% |
| Single Unit, Attached | 1,231 | 7.1% |
| 2 Unit Apartments | 1,872 | 10.7% |
| 3 or 4 Unit Apartments | 2,547 | 14.6% |
| 5 to 9 Unit Apartments | 2,394 | 13.7% |
| 10 or more Apartments | 3,357 | 19.2% |
| Mobile Home / Other | 233 | 1.3% |
| Total | 17,448 | 100.0% |
Housing Structures by Occupancy in Burlington
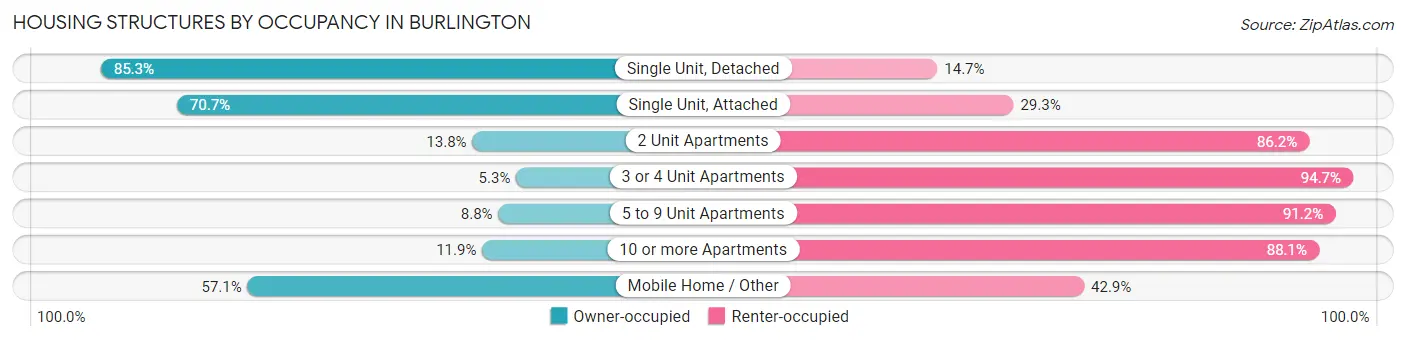
| Structure Type | Owner-occupied | Renter-occupied |
| Single Unit, Detached | 4,961 (85.3%) | 853 (14.7%) |
| Single Unit, Attached | 870 (70.7%) | 361 (29.3%) |
| 2 Unit Apartments | 258 (13.8%) | 1,614 (86.2%) |
| 3 or 4 Unit Apartments | 136 (5.3%) | 2,411 (94.7%) |
| 5 to 9 Unit Apartments | 210 (8.8%) | 2,184 (91.2%) |
| 10 or more Apartments | 399 (11.9%) | 2,958 (88.1%) |
| Mobile Home / Other | 133 (57.1%) | 100 (42.9%) |
| Total | 6,967 (39.9%) | 10,481 (60.1%) |
Housing Structures by Number of Rooms in Burlington
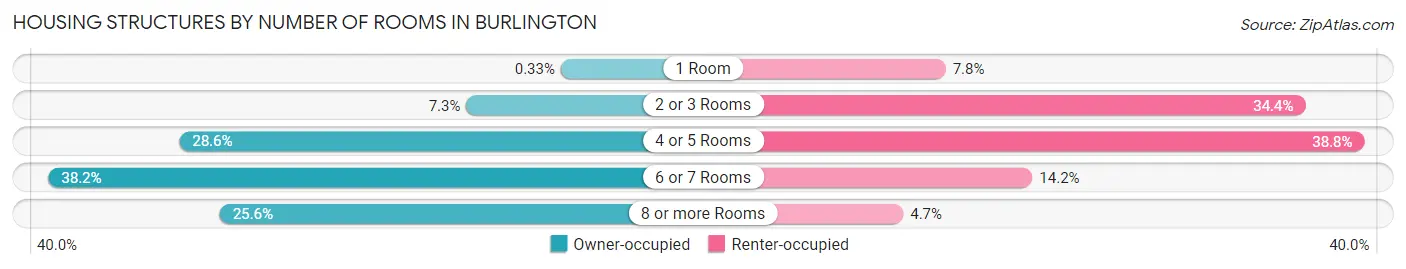
| Number of Rooms | Owner-occupied | Renter-occupied |
| 1 Room | 23 (0.3%) | 821 (7.8%) |
| 2 or 3 Rooms | 510 (7.3%) | 3,609 (34.4%) |
| 4 or 5 Rooms | 1,989 (28.5%) | 4,067 (38.8%) |
| 6 or 7 Rooms | 2,664 (38.2%) | 1,492 (14.2%) |
| 8 or more Rooms | 1,781 (25.6%) | 492 (4.7%) |
| Total | 6,967 (100.0%) | 10,481 (100.0%) |
Housing Structure by Heating Type in Burlington
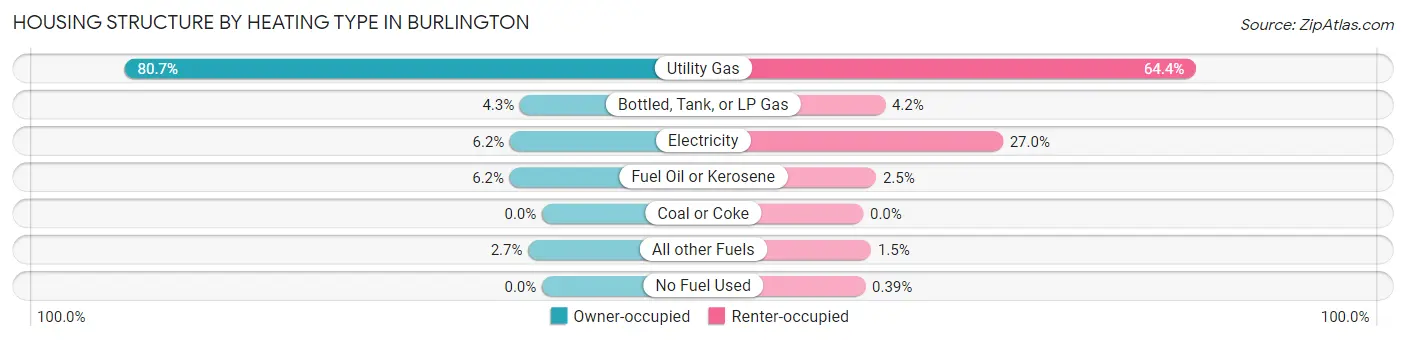
| Heating Type | Owner-occupied | Renter-occupied |
| Utility Gas | 5,620 (80.7%) | 6,746 (64.4%) |
| Bottled, Tank, or LP Gas | 297 (4.3%) | 443 (4.2%) |
| Electricity | 430 (6.2%) | 2,829 (27.0%) |
| Fuel Oil or Kerosene | 434 (6.2%) | 262 (2.5%) |
| Coal or Coke | 0 (0.0%) | 0 (0.0%) |
| All other Fuels | 186 (2.7%) | 160 (1.5%) |
| No Fuel Used | 0 (0.0%) | 41 (0.4%) |
| Total | 6,967 (100.0%) | 10,481 (100.0%) |
Household Vehicle Usage in Burlington
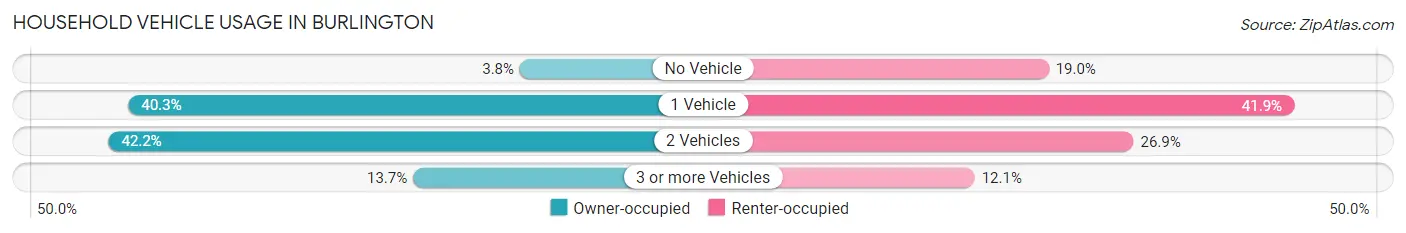
| Vehicles per Household | Owner-occupied | Renter-occupied |
| No Vehicle | 263 (3.8%) | 1,994 (19.0%) |
| 1 Vehicle | 2,809 (40.3%) | 4,393 (41.9%) |
| 2 Vehicles | 2,938 (42.2%) | 2,824 (26.9%) |
| 3 or more Vehicles | 957 (13.7%) | 1,270 (12.1%) |
| Total | 6,967 (100.0%) | 10,481 (100.0%) |
Real Estate & Mortgages in Burlington
Real Estate and Mortgage Overview in Burlington
| Characteristic | Without Mortgage | With Mortgage |
| Housing Units | 2,312 | 4,655 |
| Median Property Value | $373,300 | $388,900 |
| Median Household Income | $75,463 | $1,858 |
| Monthly Housing Costs | $1,017 | $976 |
| Real Estate Taxes | $6,787 | $64 |
Property Value by Mortgage Status in Burlington
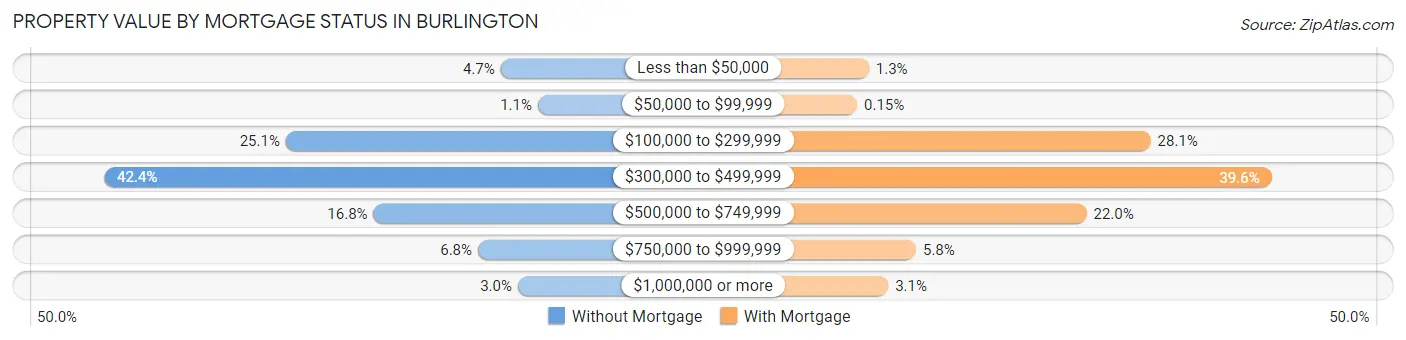
| Property Value | Without Mortgage | With Mortgage |
| Less than $50,000 | 108 (4.7%) | 59 (1.3%) |
| $50,000 to $99,999 | 26 (1.1%) | 7 (0.2%) |
| $100,000 to $299,999 | 581 (25.1%) | 1,308 (28.1%) |
| $300,000 to $499,999 | 981 (42.4%) | 1,844 (39.6%) |
| $500,000 to $749,999 | 388 (16.8%) | 1,024 (22.0%) |
| $750,000 to $999,999 | 158 (6.8%) | 268 (5.8%) |
| $1,000,000 or more | 70 (3.0%) | 145 (3.1%) |
| Total | 2,312 (100.0%) | 4,655 (100.0%) |
Household Income by Mortgage Status in Burlington
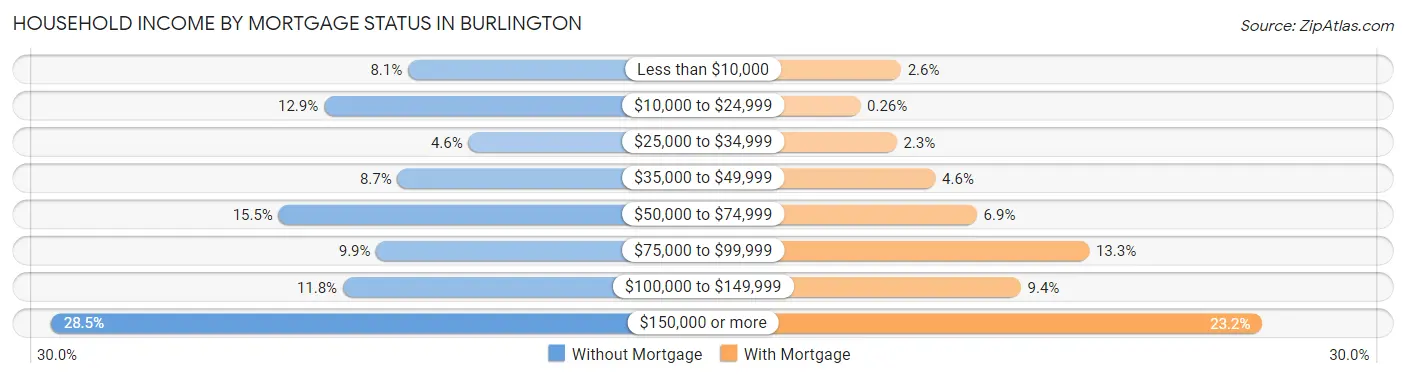
| Household Income | Without Mortgage | With Mortgage |
| Less than $10,000 | 187 (8.1%) | 120 (2.6%) |
| $10,000 to $24,999 | 298 (12.9%) | 12 (0.3%) |
| $25,000 to $34,999 | 107 (4.6%) | 109 (2.3%) |
| $35,000 to $49,999 | 201 (8.7%) | 212 (4.5%) |
| $50,000 to $74,999 | 358 (15.5%) | 322 (6.9%) |
| $75,000 to $99,999 | 229 (9.9%) | 621 (13.3%) |
| $100,000 to $149,999 | 273 (11.8%) | 439 (9.4%) |
| $150,000 or more | 659 (28.5%) | 1,082 (23.2%) |
| Total | 2,312 (100.0%) | 4,655 (100.0%) |
Property Value to Household Income Ratio in Burlington
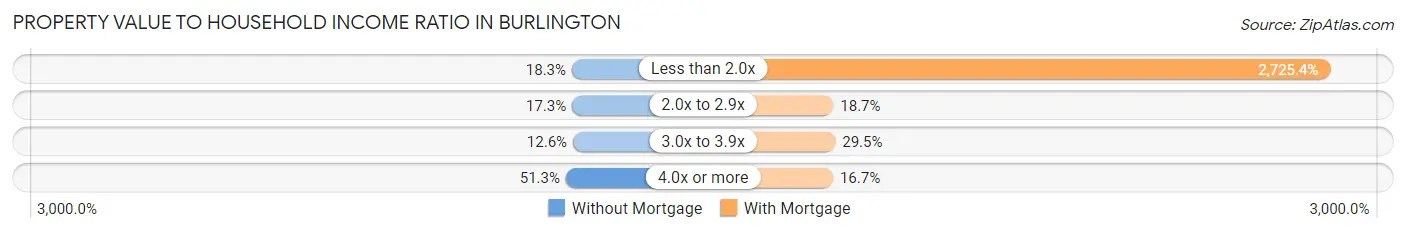
| Value-to-Income Ratio | Without Mortgage | With Mortgage |
| Less than 2.0x | 422 (18.2%) | 126,867 (2,725.4%) |
| 2.0x to 2.9x | 400 (17.3%) | 869 (18.7%) |
| 3.0x to 3.9x | 292 (12.6%) | 1,371 (29.4%) |
| 4.0x or more | 1,185 (51.2%) | 775 (16.7%) |
| Total | 2,312 (100.0%) | 4,655 (100.0%) |
Real Estate Taxes by Mortgage Status in Burlington
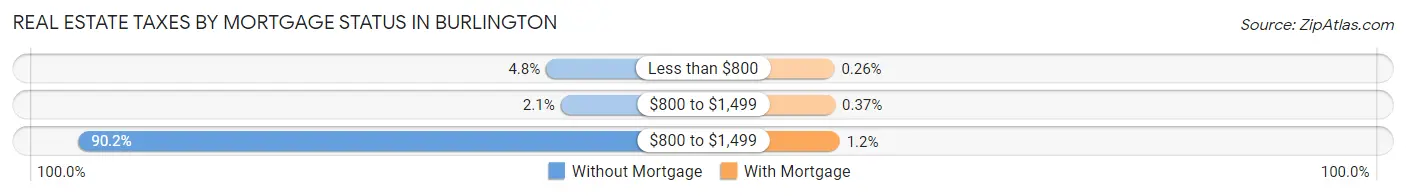
| Property Taxes | Without Mortgage | With Mortgage |
| Less than $800 | 110 (4.8%) | 12 (0.3%) |
| $800 to $1,499 | 49 (2.1%) | 17 (0.4%) |
| $800 to $1,499 | 2,085 (90.2%) | 57 (1.2%) |
| Total | 2,312 (100.0%) | 4,655 (100.0%) |
Health & Disability in Burlington
Health Insurance Coverage by Age in Burlington
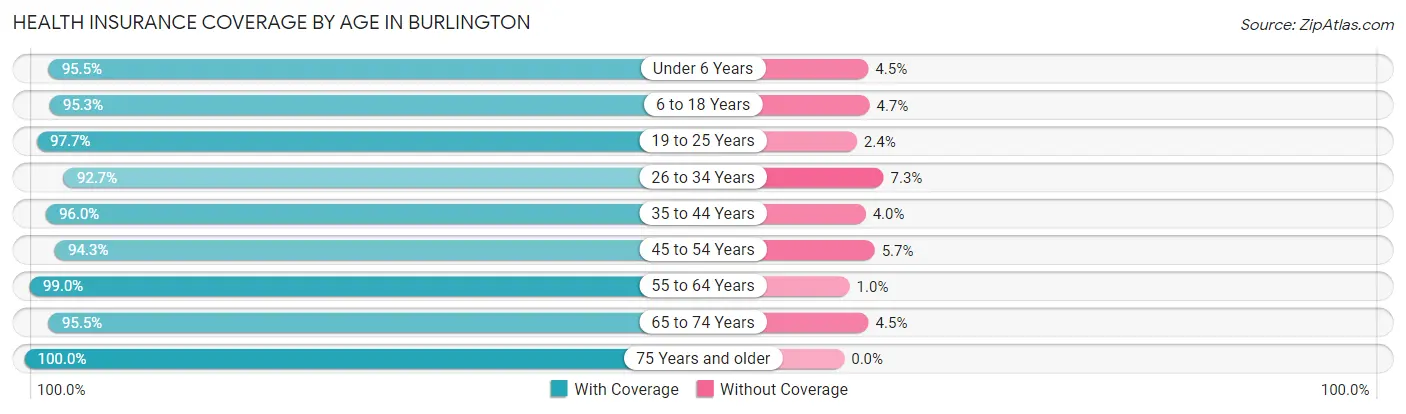
| Age Bracket | With Coverage | Without Coverage |
| Under 6 Years | 1,636 (95.5%) | 77 (4.5%) |
| 6 to 18 Years | 5,303 (95.3%) | 262 (4.7%) |
| 19 to 25 Years | 13,367 (97.7%) | 321 (2.4%) |
| 26 to 34 Years | 6,502 (92.7%) | 514 (7.3%) |
| 35 to 44 Years | 4,014 (96.0%) | 167 (4.0%) |
| 45 to 54 Years | 3,122 (94.3%) | 188 (5.7%) |
| 55 to 64 Years | 3,866 (99.0%) | 39 (1.0%) |
| 65 to 74 Years | 2,968 (95.5%) | 141 (4.5%) |
| 75 Years and older | 1,677 (100.0%) | 0 (0.0%) |
| Total | 42,455 (96.1%) | 1,709 (3.9%) |
Health Insurance Coverage by Citizenship Status in Burlington
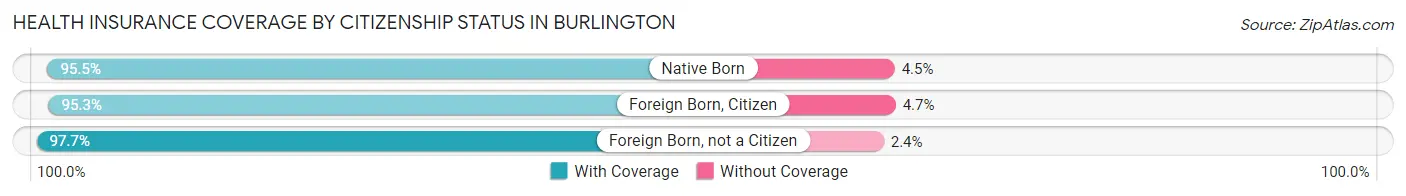
| Citizenship Status | With Coverage | Without Coverage |
| Native Born | 1,636 (95.5%) | 77 (4.5%) |
| Foreign Born, Citizen | 5,303 (95.3%) | 262 (4.7%) |
| Foreign Born, not a Citizen | 13,367 (97.7%) | 321 (2.4%) |
Health Insurance Coverage by Household Income in Burlington
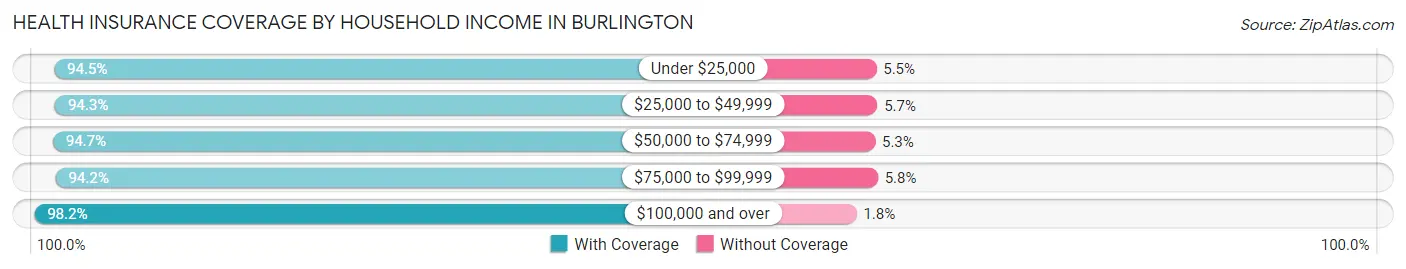
| Household Income | With Coverage | Without Coverage |
| Under $25,000 | 6,125 (94.5%) | 358 (5.5%) |
| $25,000 to $49,999 | 5,530 (94.3%) | 334 (5.7%) |
| $50,000 to $74,999 | 4,964 (94.7%) | 277 (5.3%) |
| $75,000 to $99,999 | 3,967 (94.2%) | 244 (5.8%) |
| $100,000 and over | 14,997 (98.2%) | 277 (1.8%) |
Public vs Private Health Insurance Coverage by Age in Burlington
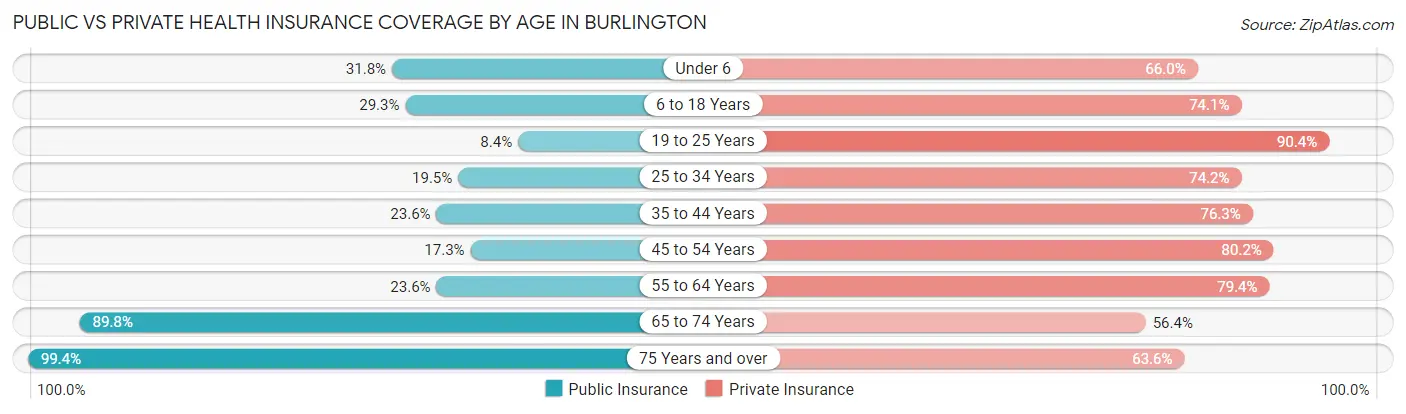
| Age Bracket | Public Insurance | Private Insurance |
| Under 6 | 545 (31.8%) | 1,131 (66.0%) |
| 6 to 18 Years | 1,633 (29.3%) | 4,126 (74.1%) |
| 19 to 25 Years | 1,153 (8.4%) | 12,378 (90.4%) |
| 25 to 34 Years | 1,370 (19.5%) | 5,203 (74.2%) |
| 35 to 44 Years | 985 (23.6%) | 3,188 (76.2%) |
| 45 to 54 Years | 571 (17.2%) | 2,653 (80.1%) |
| 55 to 64 Years | 920 (23.6%) | 3,099 (79.4%) |
| 65 to 74 Years | 2,792 (89.8%) | 1,754 (56.4%) |
| 75 Years and over | 1,667 (99.4%) | 1,066 (63.6%) |
| Total | 11,636 (26.4%) | 34,598 (78.3%) |
Disability Status by Sex by Age in Burlington
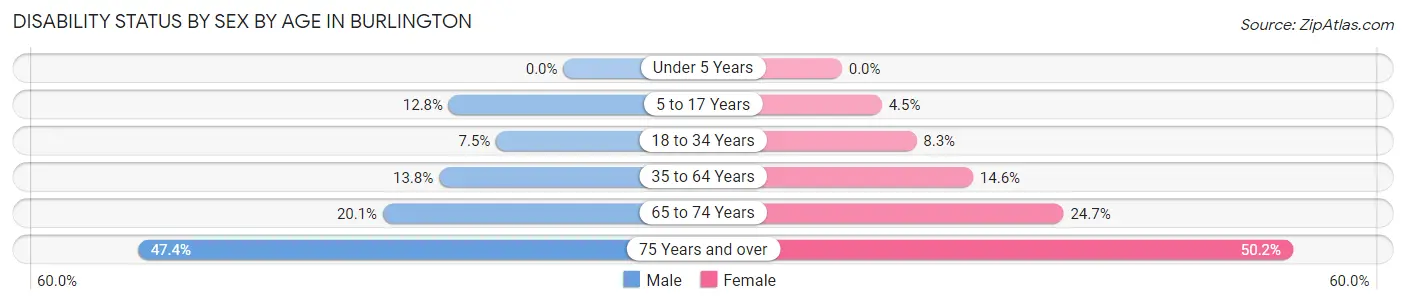
| Age Bracket | Male | Female |
| Under 5 Years | 0 (0.0%) | 0 (0.0%) |
| 5 to 17 Years | 220 (12.8%) | 77 (4.4%) |
| 18 to 34 Years | 796 (7.5%) | 1,031 (8.3%) |
| 35 to 64 Years | 812 (13.8%) | 807 (14.6%) |
| 65 to 74 Years | 256 (20.1%) | 453 (24.7%) |
| 75 Years and over | 273 (47.4%) | 553 (50.2%) |
Disability Class by Sex by Age in Burlington
Disability Class: Hearing Difficulty
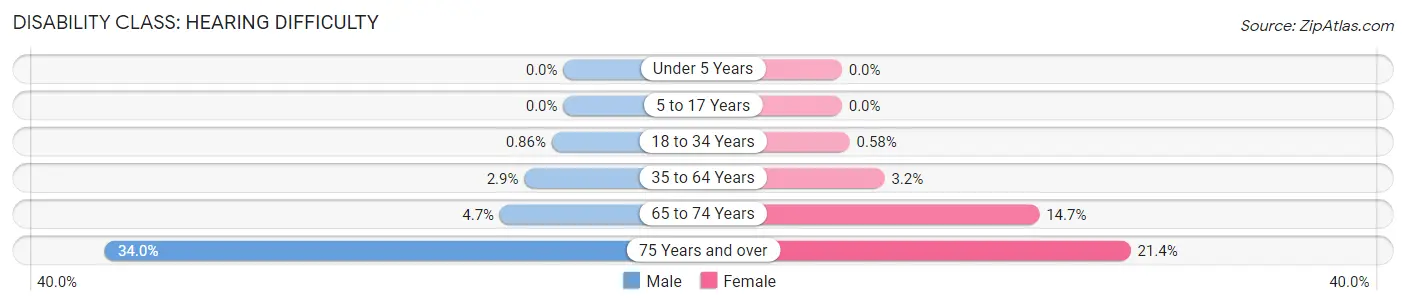
| Age Bracket | Male | Female |
| Under 5 Years | 0 (0.0%) | 0 (0.0%) |
| 5 to 17 Years | 0 (0.0%) | 0 (0.0%) |
| 18 to 34 Years | 92 (0.9%) | 72 (0.6%) |
| 35 to 64 Years | 170 (2.9%) | 175 (3.2%) |
| 65 to 74 Years | 60 (4.7%) | 269 (14.7%) |
| 75 Years and over | 196 (34.0%) | 236 (21.4%) |
Disability Class: Vision Difficulty
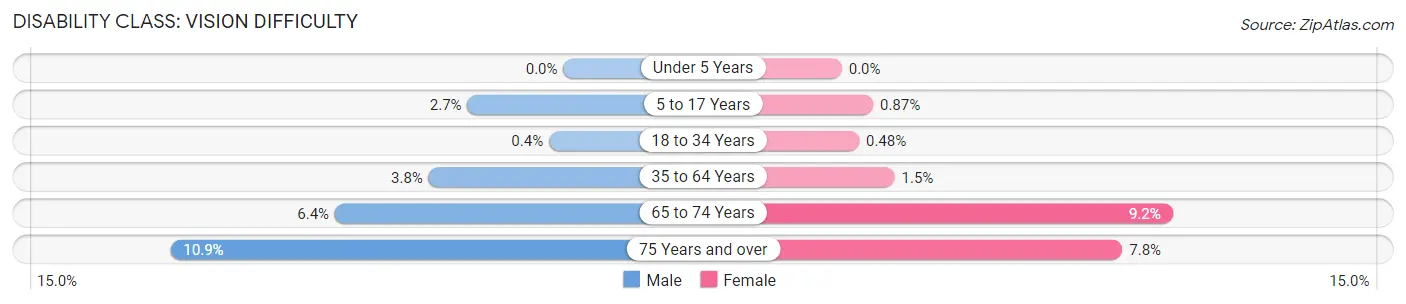
| Age Bracket | Male | Female |
| Under 5 Years | 0 (0.0%) | 0 (0.0%) |
| 5 to 17 Years | 46 (2.7%) | 15 (0.9%) |
| 18 to 34 Years | 43 (0.4%) | 59 (0.5%) |
| 35 to 64 Years | 220 (3.7%) | 81 (1.5%) |
| 65 to 74 Years | 81 (6.4%) | 169 (9.2%) |
| 75 Years and over | 63 (10.9%) | 86 (7.8%) |
Disability Class: Cognitive Difficulty
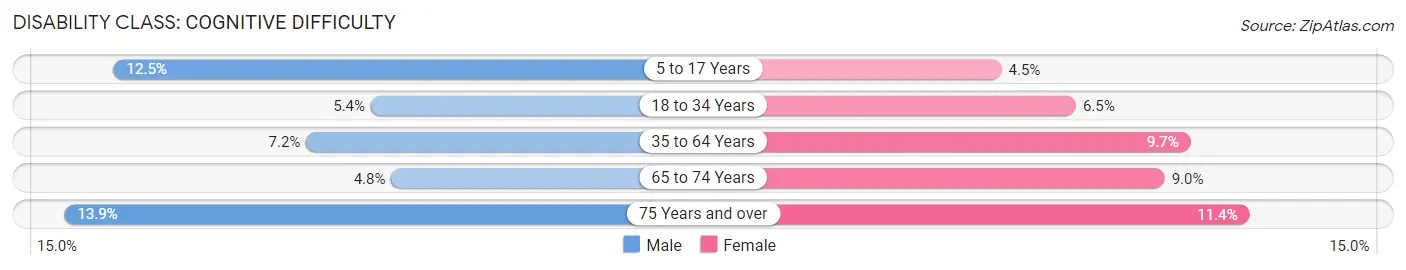
| Age Bracket | Male | Female |
| 5 to 17 Years | 216 (12.5%) | 77 (4.4%) |
| 18 to 34 Years | 570 (5.4%) | 810 (6.5%) |
| 35 to 64 Years | 420 (7.2%) | 537 (9.7%) |
| 65 to 74 Years | 61 (4.8%) | 165 (9.0%) |
| 75 Years and over | 80 (13.9%) | 125 (11.4%) |
Disability Class: Ambulatory Difficulty
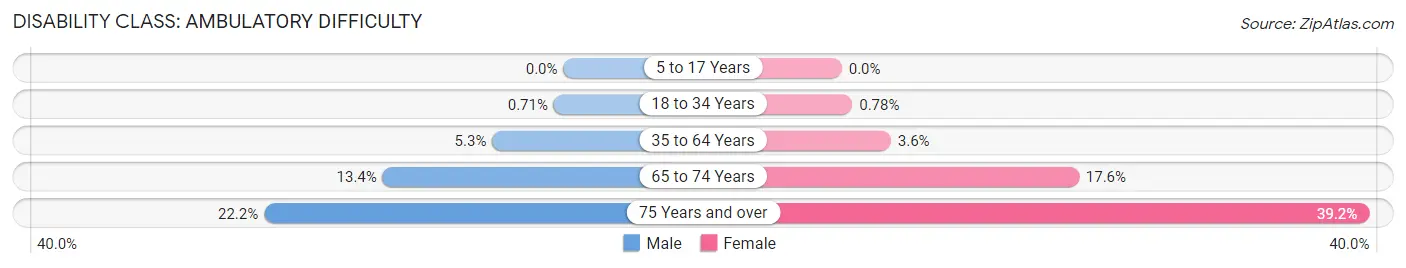
| Age Bracket | Male | Female |
| 5 to 17 Years | 0 (0.0%) | 0 (0.0%) |
| 18 to 34 Years | 76 (0.7%) | 97 (0.8%) |
| 35 to 64 Years | 310 (5.3%) | 201 (3.6%) |
| 65 to 74 Years | 171 (13.4%) | 323 (17.6%) |
| 75 Years and over | 128 (22.2%) | 431 (39.2%) |
Disability Class: Self-Care Difficulty
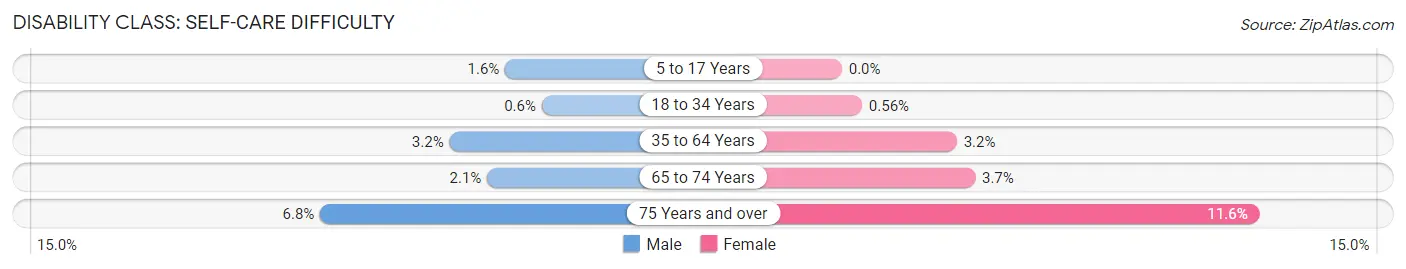
| Age Bracket | Male | Female |
| 5 to 17 Years | 28 (1.6%) | 0 (0.0%) |
| 18 to 34 Years | 64 (0.6%) | 70 (0.6%) |
| 35 to 64 Years | 186 (3.2%) | 177 (3.2%) |
| 65 to 74 Years | 27 (2.1%) | 68 (3.7%) |
| 75 Years and over | 39 (6.8%) | 128 (11.6%) |
Technology Access in Burlington
Computing Device Access in Burlington
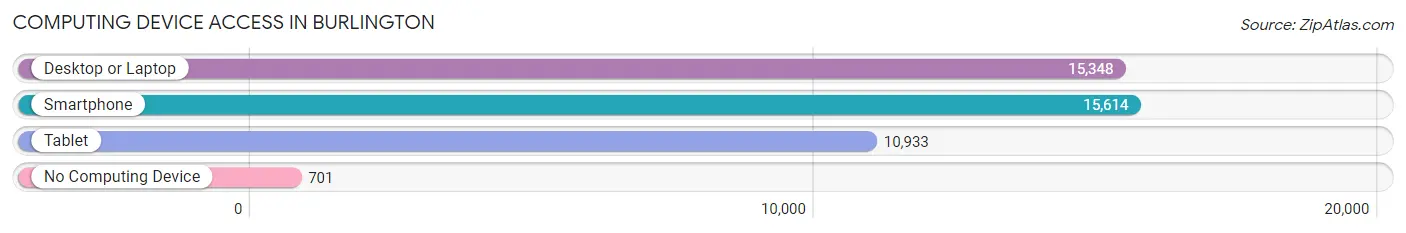
| Device Type | # Households | % Households |
| Desktop or Laptop | 15,348 | 88.0% |
| Smartphone | 15,614 | 89.5% |
| Tablet | 10,933 | 62.7% |
| No Computing Device | 701 | 4.0% |
| Total | 17,448 | 100.0% |
Internet Access in Burlington
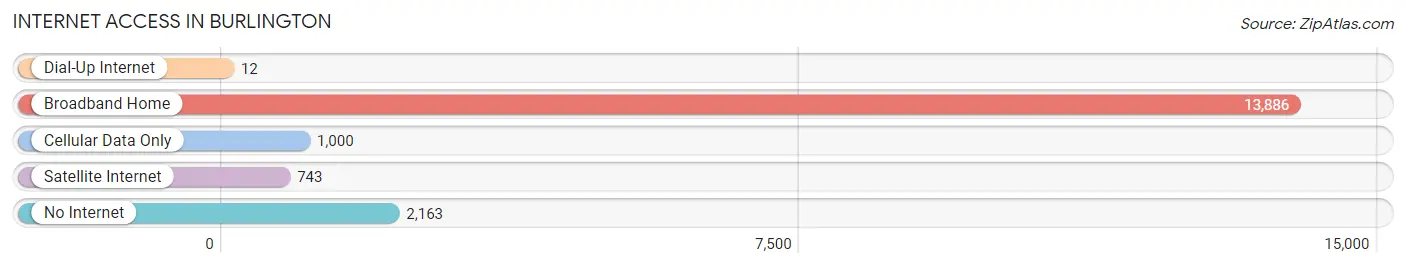
| Internet Type | # Households | % Households |
| Dial-Up Internet | 12 | 0.1% |
| Broadband Home | 13,886 | 79.6% |
| Cellular Data Only | 1,000 | 5.7% |
| Satellite Internet | 743 | 4.3% |
| No Internet | 2,163 | 12.4% |
| Total | 17,448 | 100.0% |
Burlington Summary
Burlington, Vermont is the largest city in the state and the county seat of Chittenden County. Located on the eastern shore of Lake Champlain, Burlington is the cultural, economic, and educational hub of the region. With a population of 42,417 in 2019, Burlington is the least populous city in the United States with a population of over 40,000.
History
The area that is now Burlington was originally inhabited by the Abenaki people, who called the area “Champlain”. The first European settlers arrived in the area in the late 17th century, and the town was officially chartered in 1763. The town was named after the British Earl of Burlington, Richard Boyle.
In the 19th century, Burlington became an important port city, with the opening of the Champlain Canal in 1823. The canal connected Lake Champlain to the Hudson River, allowing for increased trade and transportation. The city also became an important industrial center, with the opening of the Winooski Mill in 1832.
In the late 19th century, Burlington became a popular tourist destination, with the opening of the Shelburne Museum in 1886. The city also became a center of higher education, with the founding of the University of Vermont in 1791.
Geography
Burlington is located in the northwestern corner of Vermont, on the eastern shore of Lake Champlain. The city is situated at the mouth of the Winooski River, and is surrounded by the Green Mountains to the east and the Adirondack Mountains to the west. The city covers an area of 22.2 square miles, and has an elevation of 315 feet.
Economy
Burlington’s economy is largely driven by the education, healthcare, and technology sectors. The University of Vermont is the city’s largest employer, with over 10,000 employees. Other major employers include the University of Vermont Medical Center, IBM, and GlobalFoundries.
The city is also home to a number of small businesses, including restaurants, retail stores, and craft breweries. Tourism is also an important part of the city’s economy, with visitors drawn to the city’s cultural attractions, outdoor recreation, and vibrant nightlife.
Demographics
As of 2019, Burlington had a population of 42,417. The city has a diverse population, with the largest racial/ethnic groups being White (77.2%), Black or African American (7.2%), Asian (4.7%), and Hispanic or Latino (4.3%). The median household income in the city is $50,945, and the median home value is $310,000.
Burlington is a vibrant and diverse city, with a rich history and a bright future. The city is home to a thriving economy, a vibrant cultural scene, and a wealth of outdoor recreation opportunities. With its strong sense of community and commitment to sustainability, Burlington is an ideal place to live, work, and play.
Common Questions
What is Per Capita Income in Burlington?
Per Capita income in Burlington is $37,789.
What is the Median Family Income in Burlington?
Median Family Income in Burlington is $113,981.
What is the Median Household income in Burlington?
Median Household Income in Burlington is $64,931.
What is Income or Wage Gap in Burlington?
Income or Wage Gap in Burlington is 52.8%.
Women in Burlington earn 47.2 cents for every dollar earned by a man.
What is Family Income Deficit in Burlington?
Family Income Deficit in Burlington is $11,186.
Families that are below poverty line in Burlington earn $11,186 less on average than the poverty threshold level.
What is Inequality or Gini Index in Burlington?
Inequality or Gini Index in Burlington is 0.50.
What is the Total Population of Burlington?
Total Population of Burlington is 44,646.
What is the Total Male Population of Burlington?
Total Male Population of Burlington is 20,882.
What is the Total Female Population of Burlington?
Total Female Population of Burlington is 23,764.
What is the Ratio of Males per 100 Females in Burlington?
There are 87.87 Males per 100 Females in Burlington.
What is the Ratio of Females per 100 Males in Burlington?
There are 113.80 Females per 100 Males in Burlington.
What is the Median Population Age in Burlington?
Median Population Age in Burlington is 27.4 Years.
What is the Average Family Size in Burlington
Average Family Size in Burlington is 2.8 People.
What is the Average Household Size in Burlington
Average Household Size in Burlington is 2.1 People.
How Large is the Labor Force in Burlington?
There are 26,219 People in the Labor Forcein in Burlington.
What is the Percentage of People in the Labor Force in Burlington?
64.8% of People are in the Labor Force in Burlington.
What is the Unemployment Rate in Burlington?
Unemployment Rate in Burlington is 4.7%.