Maple Grove, MN Map & Demographics
Maple Grove Map
Maple Grove Overview
$60,824
PER CAPITA INCOME
$153,056
AVG FAMILY INCOME
$127,001
AVG HOUSEHOLD INCOME
26.6%
WAGE / INCOME GAP [ % ]
73.4¢/ $1
WAGE / INCOME GAP [ $ ]
$9,258
FAMILY INCOME DEFICIT
0.41
INEQUALITY / GINI INDEX
70,110
TOTAL POPULATION
34,171
MALE POPULATION
35,939
FEMALE POPULATION
95.08
MALES / 100 FEMALES
105.17
FEMALES / 100 MALES
40.6
MEDIAN AGE
3.1
AVG FAMILY SIZE
2.6
AVG HOUSEHOLD SIZE
40,684
LABOR FORCE [ PEOPLE ]
73.5%
PERCENT IN LABOR FORCE
4.0%
UNEMPLOYMENT RATE
Maple Grove Zip Codes
Maple Grove Area Codes
Income in Maple Grove
Income Overview in Maple Grove
Per Capita Income in Maple Grove is $60,824, while median incomes of families and households are $153,056 and $127,001 respectively.
| Characteristic | Number | Measure |
| Per Capita Income | 70,110 | $60,824 |
| Median Family Income | 19,350 | $153,056 |
| Mean Family Income | 19,350 | $182,320 |
| Median Household Income | 27,106 | $127,001 |
| Mean Household Income | 27,106 | $156,745 |
| Income Deficit | 19,350 | $9,258 |
| Wage / Income Gap (%) | 70,110 | 26.58% |
| Wage / Income Gap ($) | 70,110 | 73.42¢ per $1 |
| Gini / Inequality Index | 70,110 | 0.41 |
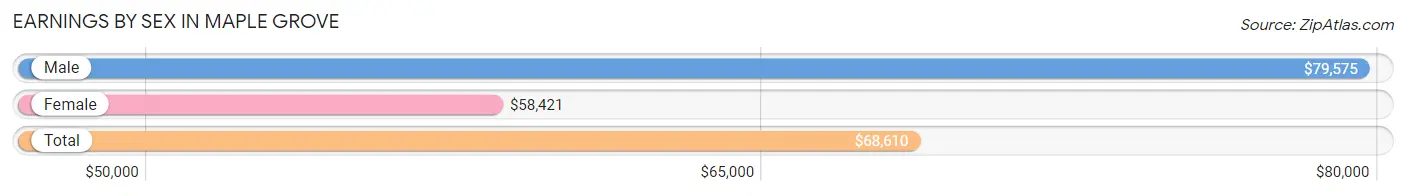
Earnings by Sex in Maple Grove
Average Earnings in Maple Grove are $68,610, $79,575 for men and $58,421 for women, a difference of 26.6%.
| Sex | Number | Average Earnings |
| Male | 20,969 (50.0%) | $79,575 |
| Female | 20,939 (50.0%) | $58,421 |
| Total | 41,908 (100.0%) | $68,610 |
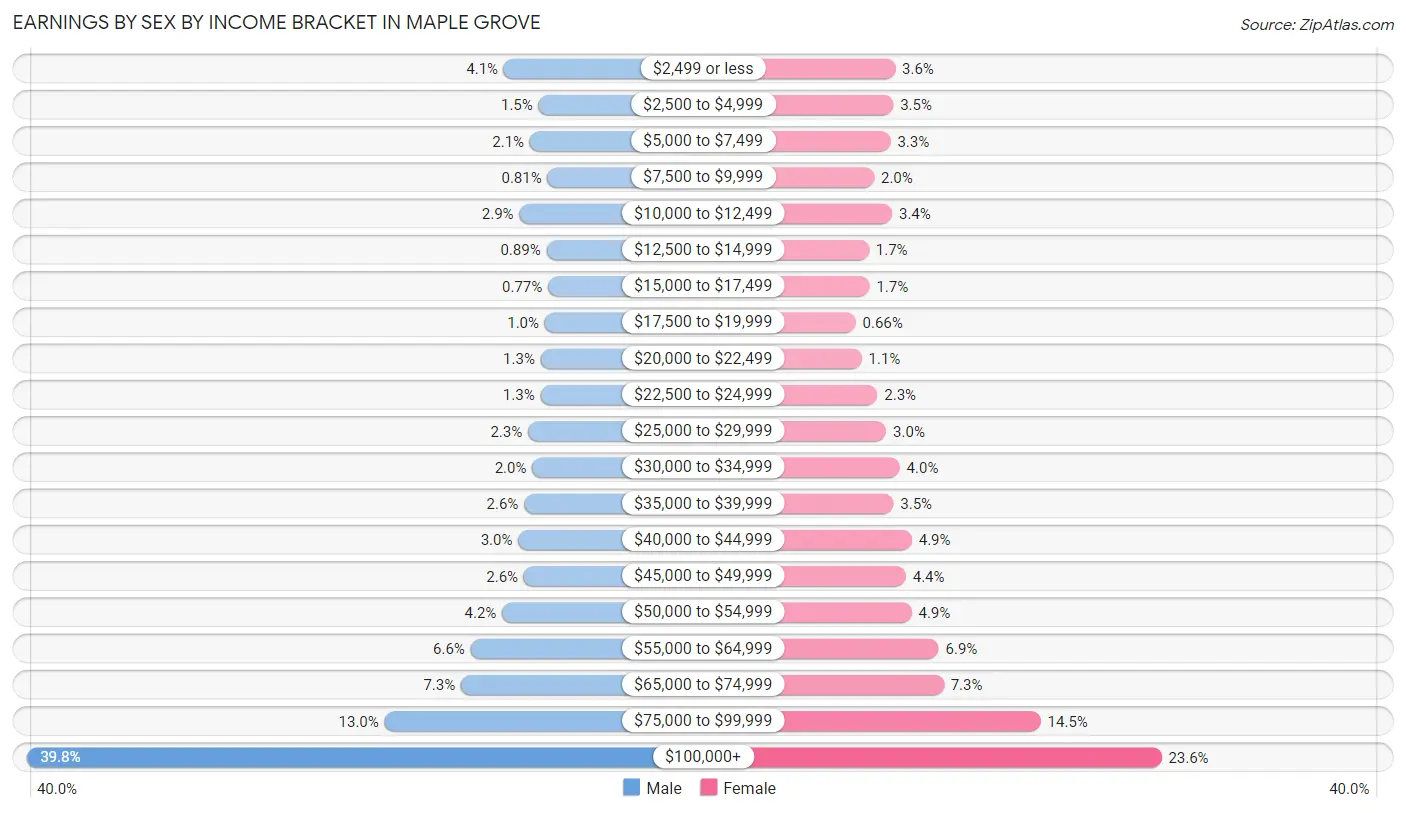
Earnings by Sex by Income Bracket in Maple Grove
The most common earnings brackets in Maple Grove are $100,000+ for men (8,346 | 39.8%) and $100,000+ for women (4,938 | 23.6%).
| Income | Male | Female |
| $2,499 or less | 856 (4.1%) | 758 (3.6%) |
| $2,500 to $4,999 | 310 (1.5%) | 728 (3.5%) |
| $5,000 to $7,499 | 447 (2.1%) | 684 (3.3%) |
| $7,500 to $9,999 | 169 (0.8%) | 428 (2.0%) |
| $10,000 to $12,499 | 612 (2.9%) | 710 (3.4%) |
| $12,500 to $14,999 | 187 (0.9%) | 345 (1.7%) |
| $15,000 to $17,499 | 162 (0.8%) | 355 (1.7%) |
| $17,500 to $19,999 | 211 (1.0%) | 138 (0.7%) |
| $20,000 to $22,499 | 277 (1.3%) | 233 (1.1%) |
| $22,500 to $24,999 | 280 (1.3%) | 480 (2.3%) |
| $25,000 to $29,999 | 477 (2.3%) | 618 (2.9%) |
| $30,000 to $34,999 | 409 (1.9%) | 829 (4.0%) |
| $35,000 to $39,999 | 537 (2.6%) | 731 (3.5%) |
| $40,000 to $44,999 | 629 (3.0%) | 1,019 (4.9%) |
| $45,000 to $49,999 | 542 (2.6%) | 925 (4.4%) |
| $50,000 to $54,999 | 882 (4.2%) | 1,016 (4.9%) |
| $55,000 to $64,999 | 1,378 (6.6%) | 1,440 (6.9%) |
| $65,000 to $74,999 | 1,528 (7.3%) | 1,521 (7.3%) |
| $75,000 to $99,999 | 2,730 (13.0%) | 3,043 (14.5%) |
| $100,000+ | 8,346 (39.8%) | 4,938 (23.6%) |
| Total | 20,969 (100.0%) | 20,939 (100.0%) |
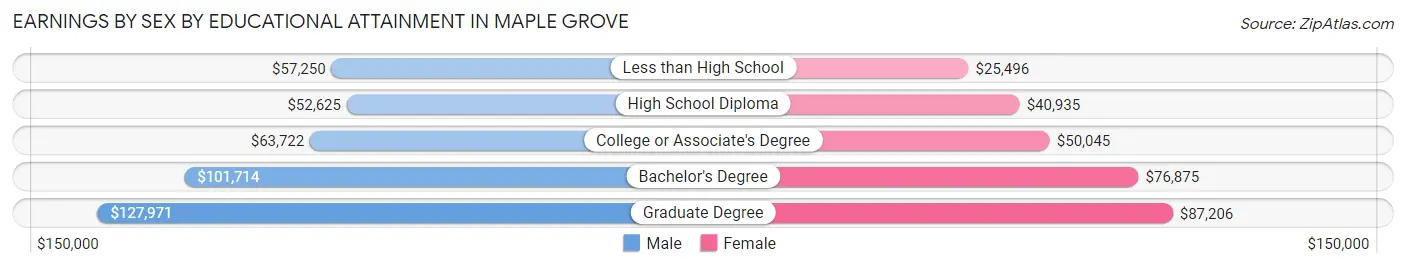
Earnings by Sex by Educational Attainment in Maple Grove
Average earnings in Maple Grove are $90,575 for men and $65,051 for women, a difference of 28.2%. Men with an educational attainment of graduate degree enjoy the highest average annual earnings of $127,971, while those with high school diploma education earn the least with $52,625. Women with an educational attainment of graduate degree earn the most with the average annual earnings of $87,206, while those with less than high school education have the smallest earnings of $25,496.
| Educational Attainment | Male Income | Female Income |
| Less than High School | $57,250 | $25,496 |
| High School Diploma | $52,625 | $40,935 |
| College or Associate's Degree | $63,722 | $50,045 |
| Bachelor's Degree | $101,714 | $76,875 |
| Graduate Degree | $127,971 | $87,206 |
| Total | $90,575 | $65,051 |
Family Income in Maple Grove
Family Income Brackets in Maple Grove
According to the Maple Grove family income data, there are 6,134 families falling into the $200,000+ income range, which is the most common income bracket and makes up 31.7% of all families.
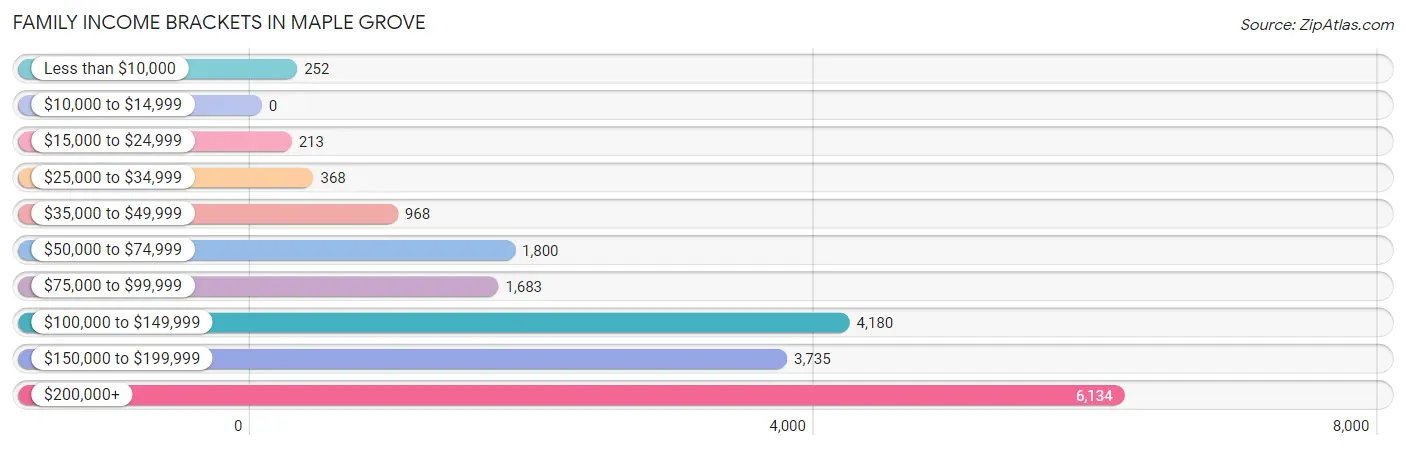
| Income Bracket | # Families | % Families |
| Less than $10,000 | 252 | 1.3% |
| $10,000 to $14,999 | 0 | 0.0% |
| $15,000 to $24,999 | 213 | 1.1% |
| $25,000 to $34,999 | 368 | 1.9% |
| $35,000 to $49,999 | 968 | 5.0% |
| $50,000 to $74,999 | 1,800 | 9.3% |
| $75,000 to $99,999 | 1,683 | 8.7% |
| $100,000 to $149,999 | 4,180 | 21.6% |
| $150,000 to $199,999 | 3,735 | 19.3% |
| $200,000+ | 6,134 | 31.7% |
Family Income by Famaliy Size in Maple Grove
4-person families (4,912 | 25.4%) account for the highest median family income in Maple Grove with $184,516 per family, while 3-person families (3,653 | 18.9%) have the highest median income of $59,828 per family member.
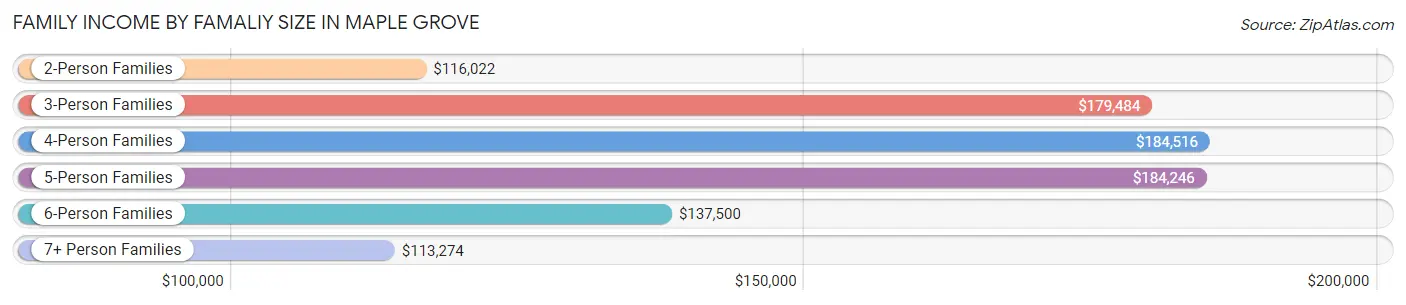
| Income Bracket | # Families | Median Income |
| 2-Person Families | 8,731 (45.1%) | $116,022 |
| 3-Person Families | 3,653 (18.9%) | $179,484 |
| 4-Person Families | 4,912 (25.4%) | $184,516 |
| 5-Person Families | 1,323 (6.8%) | $184,246 |
| 6-Person Families | 426 (2.2%) | $137,500 |
| 7+ Person Families | 305 (1.6%) | $113,274 |
| Total | 19,350 (100.0%) | $153,056 |
Family Income by Number of Earners in Maple Grove
The median family income in Maple Grove is $153,056, with families comprising 2 earners (10,407) having the highest median family income of $181,094, while families with no earners (2,344) have the lowest median family income of $64,789, accounting for 53.8% and 12.1% of families, respectively.
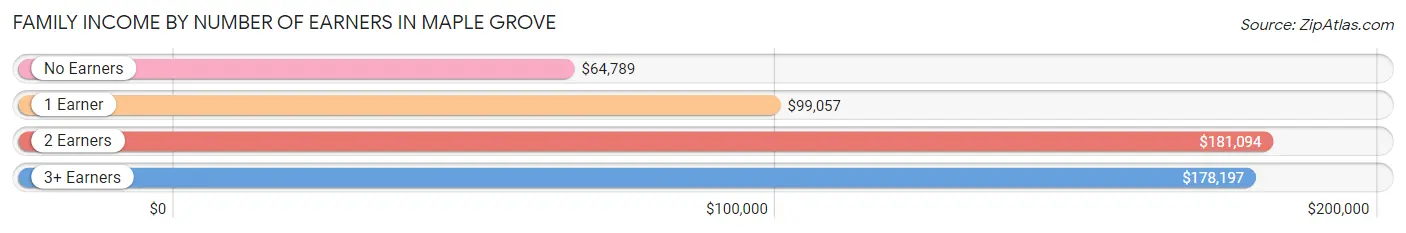
| Number of Earners | # Families | Median Income |
| No Earners | 2,344 (12.1%) | $64,789 |
| 1 Earner | 3,742 (19.3%) | $99,057 |
| 2 Earners | 10,407 (53.8%) | $181,094 |
| 3+ Earners | 2,857 (14.8%) | $178,197 |
| Total | 19,350 (100.0%) | $153,056 |
Household Income in Maple Grove
Household Income Brackets in Maple Grove
With 6,478 households falling in the category, the $200,000+ income range is the most frequent in Maple Grove, accounting for 23.9% of all households. In contrast, only 136 households (0.5%) fall into the $10,000 to $14,999 income bracket, making it the least populous group.
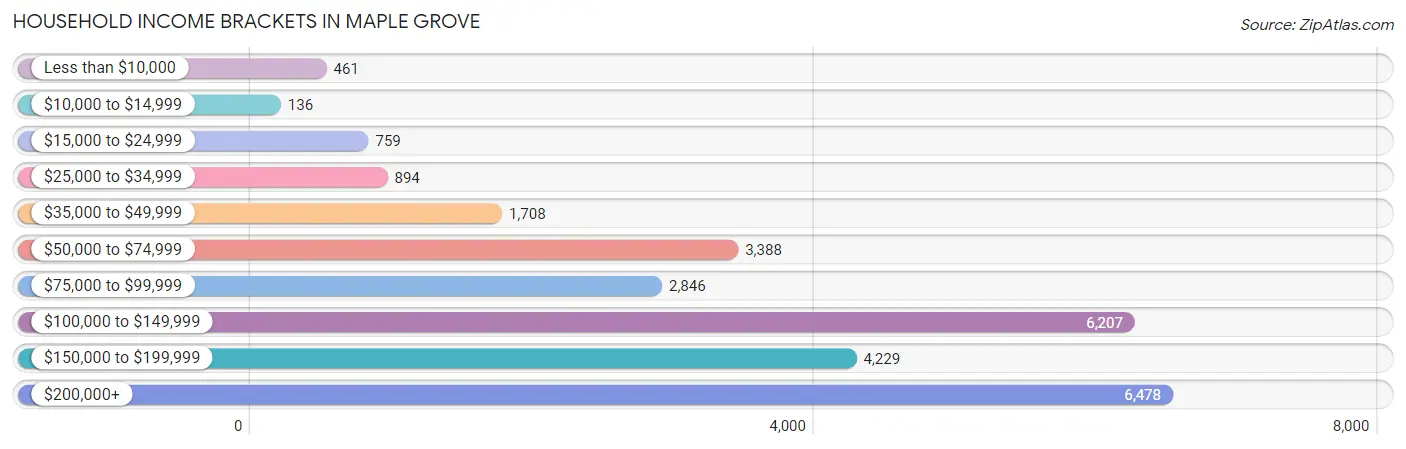
| Income Bracket | # Households | % Households |
| Less than $10,000 | 461 | 1.7% |
| $10,000 to $14,999 | 136 | 0.5% |
| $15,000 to $24,999 | 759 | 2.8% |
| $25,000 to $34,999 | 894 | 3.3% |
| $35,000 to $49,999 | 1,708 | 6.3% |
| $50,000 to $74,999 | 3,388 | 12.5% |
| $75,000 to $99,999 | 2,846 | 10.5% |
| $100,000 to $149,999 | 6,207 | 22.9% |
| $150,000 to $199,999 | 4,229 | 15.6% |
| $200,000+ | 6,478 | 23.9% |
Household Income by Householder Age in Maple Grove
The median household income in Maple Grove is $127,001, with the highest median household income of $148,137 found in the 25 to 44 years age bracket for the primary householder. A total of 9,144 households (33.7%) fall into this category. Meanwhile, the 65+ years age bracket for the primary householder has the lowest median household income of $70,351, with 6,059 households (22.4%) in this group.
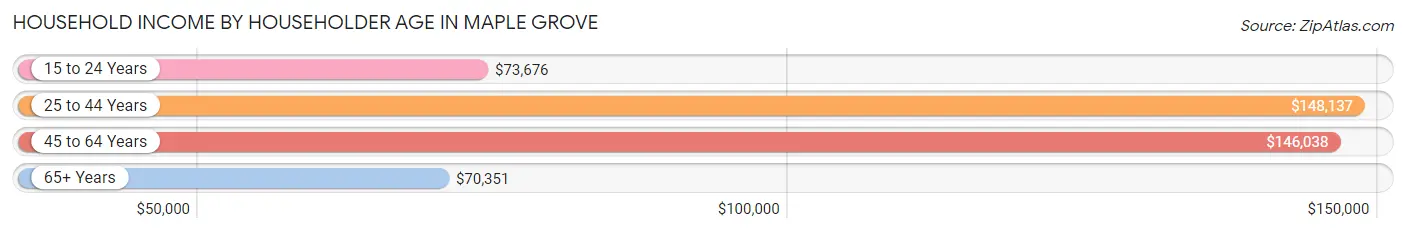
| Income Bracket | # Households | Median Income |
| 15 to 24 Years | 396 (1.5%) | $73,676 |
| 25 to 44 Years | 9,144 (33.7%) | $148,137 |
| 45 to 64 Years | 11,507 (42.4%) | $146,038 |
| 65+ Years | 6,059 (22.4%) | $70,351 |
| Total | 27,106 (100.0%) | $127,001 |
Poverty in Maple Grove
Income Below Poverty by Sex and Age in Maple Grove
With 4.2% poverty level for males and 4.9% for females among the residents of Maple Grove, 15 year old males and 75 year old and over females are the most vulnerable to poverty, with 122 males (18.5%) and 130 females (7.9%) in their respective age groups living below the poverty level.
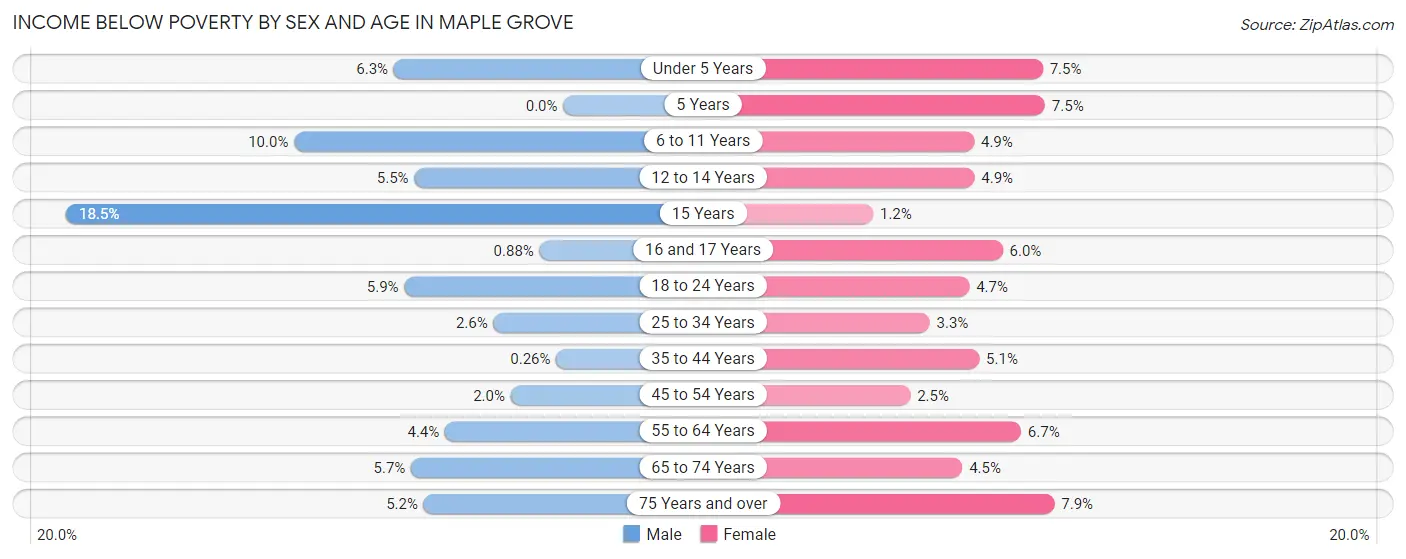
| Age Bracket | Male | Female |
| Under 5 Years | 114 (6.3%) | 133 (7.5%) |
| 5 Years | 0 (0.0%) | 31 (7.5%) |
| 6 to 11 Years | 281 (10.0%) | 145 (4.9%) |
| 12 to 14 Years | 84 (5.5%) | 80 (4.9%) |
| 15 Years | 122 (18.5%) | 9 (1.2%) |
| 16 and 17 Years | 11 (0.9%) | 66 (6.0%) |
| 18 to 24 Years | 140 (5.9%) | 82 (4.7%) |
| 25 to 34 Years | 110 (2.6%) | 130 (3.3%) |
| 35 to 44 Years | 13 (0.3%) | 276 (5.1%) |
| 45 to 54 Years | 97 (1.9%) | 128 (2.5%) |
| 55 to 64 Years | 203 (4.4%) | 383 (6.7%) |
| 65 to 74 Years | 176 (5.7%) | 165 (4.5%) |
| 75 Years and over | 65 (5.2%) | 130 (7.9%) |
| Total | 1,416 (4.2%) | 1,758 (4.9%) |
Income Above Poverty by Sex and Age in Maple Grove
According to the poverty statistics in Maple Grove, males aged 5 years and females aged 15 years are the age groups that are most secure financially, with 100.0% of males and 98.8% of females in these age groups living above the poverty line.
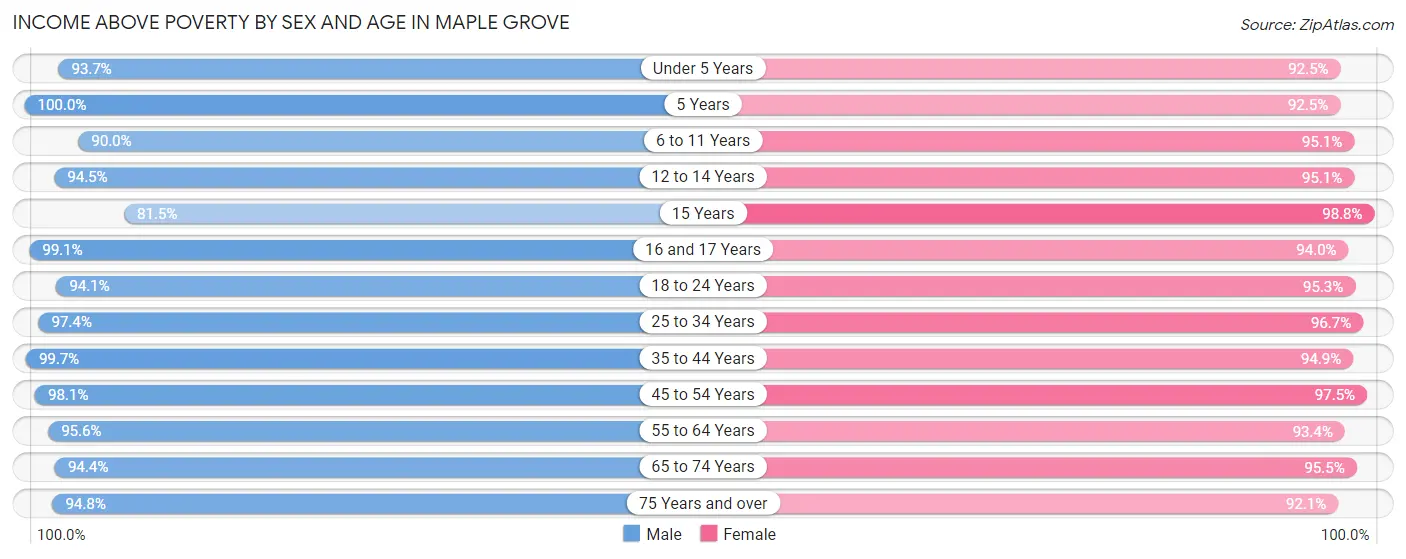
| Age Bracket | Male | Female |
| Under 5 Years | 1,698 (93.7%) | 1,650 (92.5%) |
| 5 Years | 343 (100.0%) | 380 (92.5%) |
| 6 to 11 Years | 2,531 (90.0%) | 2,807 (95.1%) |
| 12 to 14 Years | 1,435 (94.5%) | 1,545 (95.1%) |
| 15 Years | 539 (81.5%) | 767 (98.8%) |
| 16 and 17 Years | 1,240 (99.1%) | 1,039 (94.0%) |
| 18 to 24 Years | 2,231 (94.1%) | 1,652 (95.3%) |
| 25 to 34 Years | 4,136 (97.4%) | 3,856 (96.7%) |
| 35 to 44 Years | 5,033 (99.7%) | 5,140 (94.9%) |
| 45 to 54 Years | 4,882 (98.1%) | 4,908 (97.5%) |
| 55 to 64 Years | 4,420 (95.6%) | 5,379 (93.3%) |
| 65 to 74 Years | 2,941 (94.4%) | 3,529 (95.5%) |
| 75 Years and over | 1,189 (94.8%) | 1,518 (92.1%) |
| Total | 32,618 (95.8%) | 34,170 (95.1%) |
Income Below Poverty Among Married-Couple Families in Maple Grove
The poverty statistics for married-couple families in Maple Grove show that 1.3% or 221 of the total 16,892 families live below the poverty line. Families with 5 or more children have the highest poverty rate of 16.8%, comprising of 35 families. On the other hand, families with 3 or 4 children have the lowest poverty rate of 0.0%, which includes 0 families.
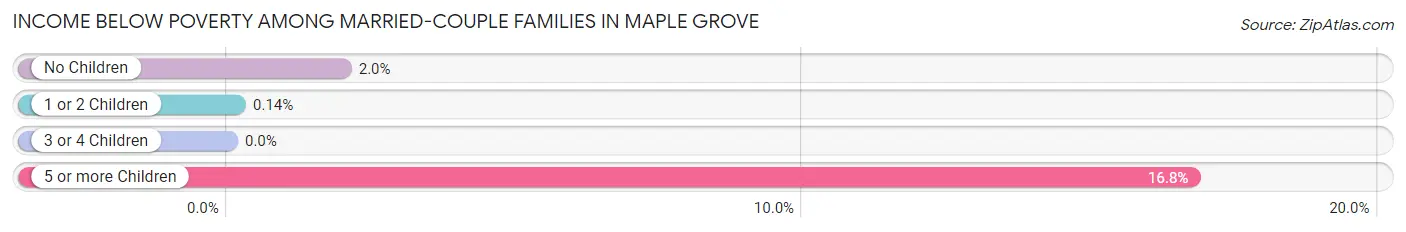
| Children | Above Poverty | Below Poverty |
| No Children | 8,781 (98.0%) | 177 (2.0%) |
| 1 or 2 Children | 6,649 (99.9%) | 9 (0.1%) |
| 3 or 4 Children | 1,067 (100.0%) | 0 (0.0%) |
| 5 or more Children | 174 (83.3%) | 35 (16.8%) |
| Total | 16,671 (98.7%) | 221 (1.3%) |
Income Below Poverty Among Single-Parent Households in Maple Grove
According to the poverty data in Maple Grove, 10.6% or 81 single-father households and 14.6% or 247 single-mother households are living below the poverty line. Among single-father households, those with 1 or 2 children have the highest poverty rate, with 49 households (19.6%) experiencing poverty. Likewise, among single-mother households, those with 5 or more children have the highest poverty rate, with 61 households (91.0%) falling below the poverty line.
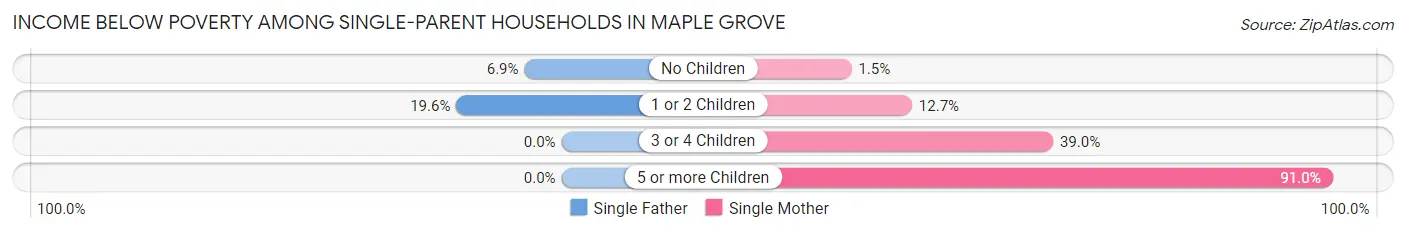
| Children | Single Father | Single Mother |
| No Children | 32 (6.9%) | 8 (1.5%) |
| 1 or 2 Children | 49 (19.6%) | 116 (12.7%) |
| 3 or 4 Children | 0 (0.0%) | 62 (39.0%) |
| 5 or more Children | 0 (0.0%) | 61 (91.0%) |
| Total | 81 (10.6%) | 247 (14.6%) |
Income Below Poverty Among Married-Couple vs Single-Parent Households in Maple Grove
The poverty data for Maple Grove shows that 221 of the married-couple family households (1.3%) and 328 of the single-parent households (13.3%) are living below the poverty level. Within the married-couple family households, those with 5 or more children have the highest poverty rate, with 35 households (16.8%) falling below the poverty line. Among the single-parent households, those with 5 or more children have the highest poverty rate, with 61 household (72.6%) living below poverty.
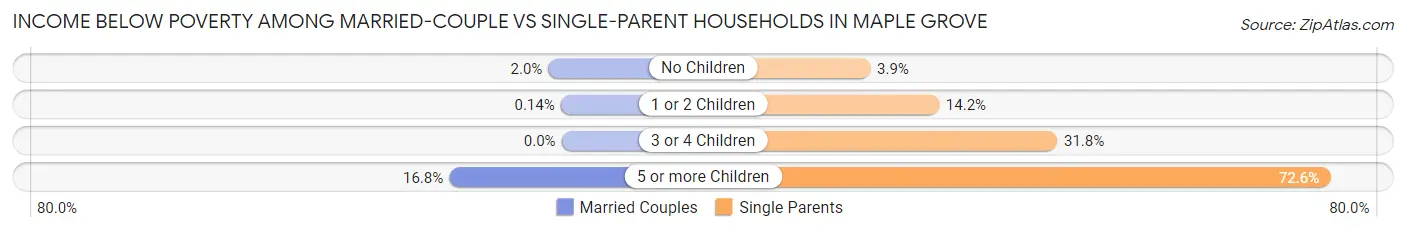
| Children | Married-Couple Families | Single-Parent Households |
| No Children | 177 (2.0%) | 40 (3.9%) |
| 1 or 2 Children | 9 (0.1%) | 165 (14.2%) |
| 3 or 4 Children | 0 (0.0%) | 62 (31.8%) |
| 5 or more Children | 35 (16.8%) | 61 (72.6%) |
| Total | 221 (1.3%) | 328 (13.3%) |
Race in Maple Grove
The most populous races in Maple Grove are White / Caucasian (55,836 | 79.6%), Black / African American (5,347 | 7.6%), and Asian (4,823 | 6.9%).
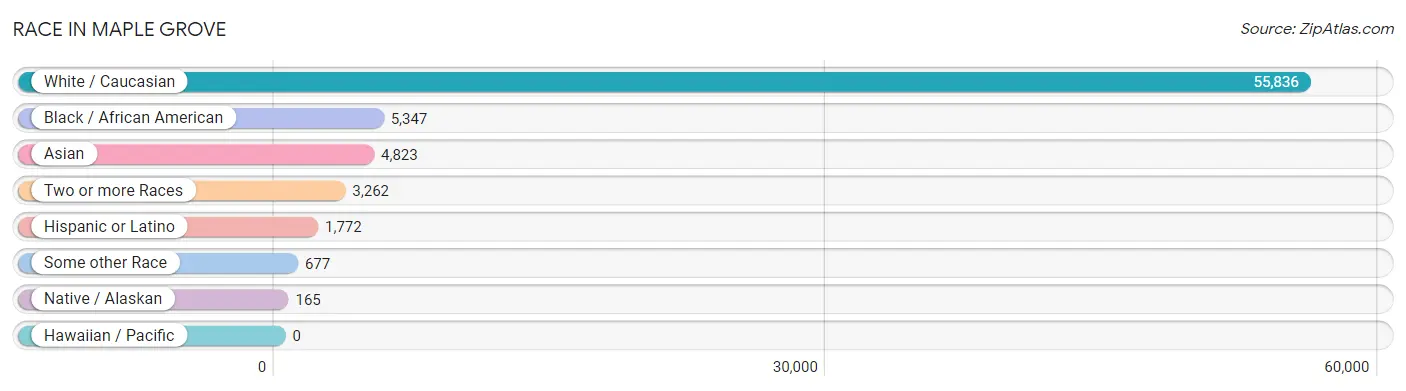
| Race | # Population | % Population |
| Asian | 4,823 | 6.9% |
| Black / African American | 5,347 | 7.6% |
| Hawaiian / Pacific | 0 | 0.0% |
| Hispanic or Latino | 1,772 | 2.5% |
| Native / Alaskan | 165 | 0.2% |
| White / Caucasian | 55,836 | 79.6% |
| Two or more Races | 3,262 | 4.6% |
| Some other Race | 677 | 1.0% |
| Total | 70,110 | 100.0% |
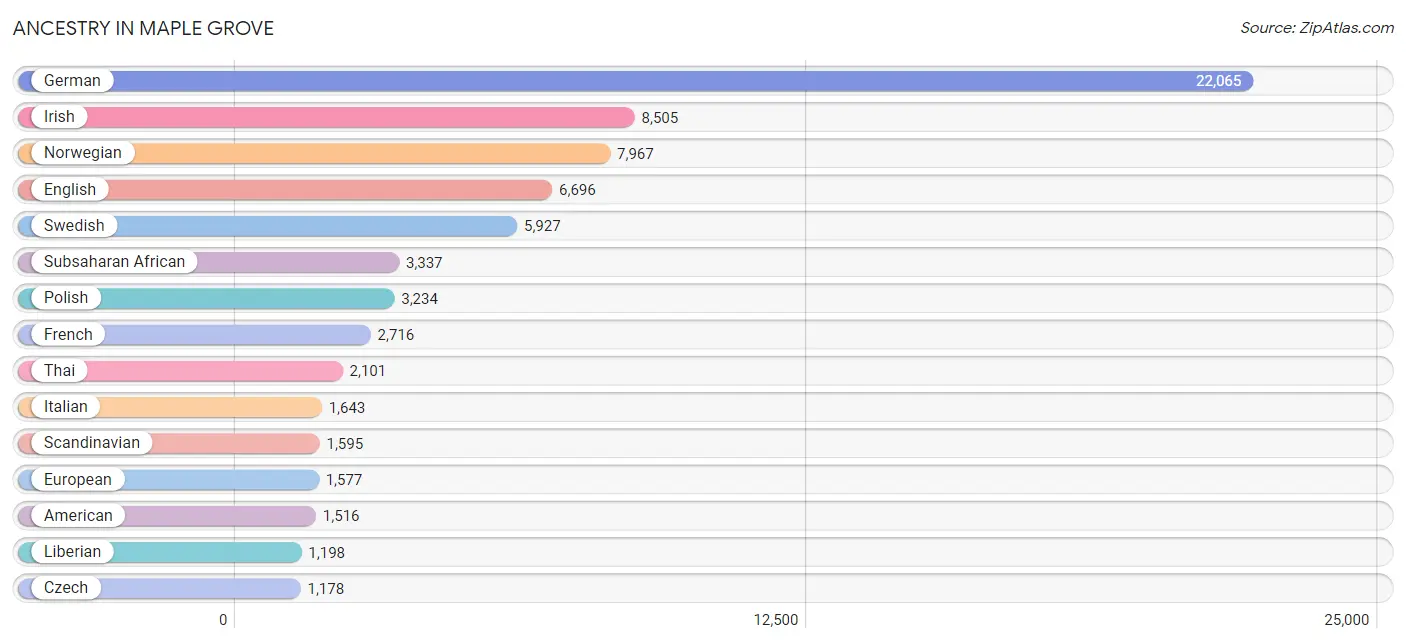
Ancestry in Maple Grove
The most populous ancestries reported in Maple Grove are German (22,065 | 31.5%), Irish (8,505 | 12.1%), Norwegian (7,967 | 11.4%), English (6,696 | 9.6%), and Swedish (5,927 | 8.5%), together accounting for 73.0% of all Maple Grove residents.
| Ancestry | # Population | % Population |
| African | 434 | 0.6% |
| American | 1,516 | 2.2% |
| Arab | 477 | 0.7% |
| Armenian | 20 | 0.0% |
| Australian | 83 | 0.1% |
| Austrian | 78 | 0.1% |
| Bangladeshi | 348 | 0.5% |
| Belgian | 37 | 0.1% |
| Bhutanese | 65 | 0.1% |
| Brazilian | 19 | 0.0% |
| British | 277 | 0.4% |
| Burmese | 417 | 0.6% |
| Canadian | 106 | 0.2% |
| Central American | 132 | 0.2% |
| Central American Indian | 32 | 0.1% |
| Cherokee | 17 | 0.0% |
| Chilean | 56 | 0.1% |
| Chippewa | 369 | 0.5% |
| Colombian | 121 | 0.2% |
| Costa Rican | 21 | 0.0% |
| Croatian | 166 | 0.2% |
| Czech | 1,178 | 1.7% |
| Czechoslovakian | 167 | 0.2% |
| Danish | 680 | 1.0% |
| Dutch | 753 | 1.1% |
| Eastern European | 270 | 0.4% |
| Ecuadorian | 278 | 0.4% |
| Egyptian | 58 | 0.1% |
| English | 6,696 | 9.6% |
| Estonian | 9 | 0.0% |
| Ethiopian | 117 | 0.2% |
| European | 1,577 | 2.2% |
| Filipino | 243 | 0.4% |
| Finnish | 900 | 1.3% |
| French | 2,716 | 3.9% |
| French Canadian | 613 | 0.9% |
| German | 22,065 | 31.5% |
| German Russian | 14 | 0.0% |
| Greek | 151 | 0.2% |
| Guyanese | 35 | 0.1% |
| Honduran | 97 | 0.1% |
| Hopi | 108 | 0.2% |
| Hungarian | 240 | 0.3% |
| Icelander | 21 | 0.0% |
| Indian (Asian) | 630 | 0.9% |
| Iranian | 28 | 0.0% |
| Irish | 8,505 | 12.1% |
| Italian | 1,643 | 2.3% |
| Jamaican | 100 | 0.1% |
| Japanese | 183 | 0.3% |
| Kenyan | 230 | 0.3% |
| Korean | 572 | 0.8% |
| Latvian | 43 | 0.1% |
| Lebanese | 347 | 0.5% |
| Liberian | 1,198 | 1.7% |
| Lithuanian | 105 | 0.2% |
| Luxembourger | 40 | 0.1% |
| Malaysian | 103 | 0.2% |
| Mexican | 665 | 0.9% |
| Mexican American Indian | 25 | 0.0% |
| Native Hawaiian | 18 | 0.0% |
| Navajo | 121 | 0.2% |
| Nicaraguan | 14 | 0.0% |
| Nigerian | 536 | 0.8% |
| Northern European | 82 | 0.1% |
| Norwegian | 7,967 | 11.4% |
| Pakistani | 30 | 0.0% |
| Pennsylvania German | 20 | 0.0% |
| Peruvian | 53 | 0.1% |
| Polish | 3,234 | 4.6% |
| Portuguese | 44 | 0.1% |
| Pueblo | 108 | 0.2% |
| Puerto Rican | 231 | 0.3% |
| Romanian | 122 | 0.2% |
| Russian | 917 | 1.3% |
| Scandinavian | 1,595 | 2.3% |
| Scotch-Irish | 151 | 0.2% |
| Scottish | 817 | 1.2% |
| Sioux | 36 | 0.1% |
| Slavic | 58 | 0.1% |
| Slovak | 110 | 0.2% |
| Slovene | 93 | 0.1% |
| Somali | 776 | 1.1% |
| South American | 519 | 0.7% |
| Spaniard | 153 | 0.2% |
| Spanish | 49 | 0.1% |
| Sri Lankan | 811 | 1.2% |
| Subsaharan African | 3,337 | 4.8% |
| Swedish | 5,927 | 8.5% |
| Swiss | 208 | 0.3% |
| Syrian | 51 | 0.1% |
| Thai | 2,101 | 3.0% |
| Turkish | 19 | 0.0% |
| Ukrainian | 517 | 0.7% |
| Uruguayan | 11 | 0.0% |
| Ute | 18 | 0.0% |
| Vietnamese | 72 | 0.1% |
| Welsh | 704 | 1.0% |
| Yugoslavian | 27 | 0.0% | View All 99 Rows |
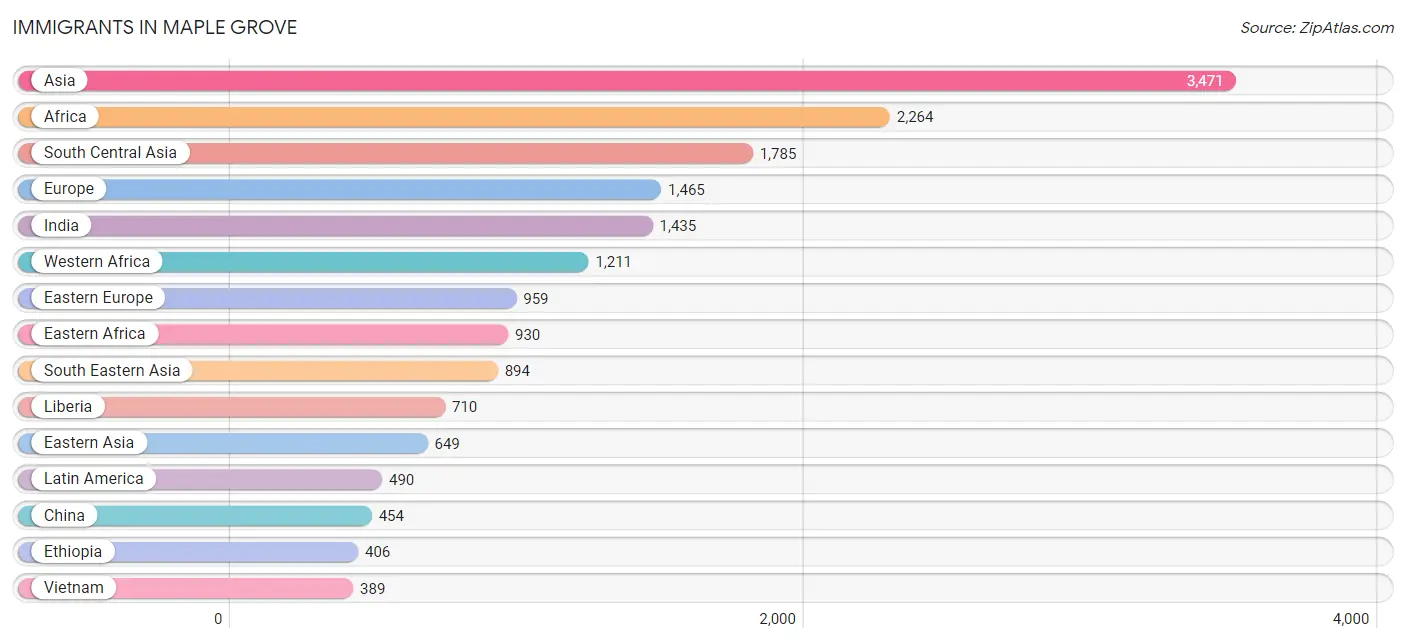
Immigrants in Maple Grove
The most numerous immigrant groups reported in Maple Grove came from Asia (3,471 | 5.0%), Africa (2,264 | 3.2%), South Central Asia (1,785 | 2.5%), Europe (1,465 | 2.1%), and India (1,435 | 2.1%), together accounting for 14.9% of all Maple Grove residents.
| Immigration Origin | # Population | % Population |
| Africa | 2,264 | 3.2% |
| Argentina | 11 | 0.0% |
| Asia | 3,471 | 5.0% |
| Australia | 41 | 0.1% |
| Bangladesh | 13 | 0.0% |
| Belarus | 24 | 0.0% |
| Brazil | 57 | 0.1% |
| Cambodia | 78 | 0.1% |
| Canada | 314 | 0.4% |
| Caribbean | 18 | 0.0% |
| Central America | 166 | 0.2% |
| Chile | 21 | 0.0% |
| China | 454 | 0.6% |
| Colombia | 23 | 0.0% |
| Croatia | 22 | 0.0% |
| Czechoslovakia | 115 | 0.2% |
| Denmark | 15 | 0.0% |
| Eastern Africa | 930 | 1.3% |
| Eastern Asia | 649 | 0.9% |
| Eastern Europe | 959 | 1.4% |
| Ecuador | 71 | 0.1% |
| England | 51 | 0.1% |
| Ethiopia | 406 | 0.6% |
| Europe | 1,465 | 2.1% |
| France | 199 | 0.3% |
| Germany | 96 | 0.1% |
| Ghana | 159 | 0.2% |
| Greece | 12 | 0.0% |
| Guatemala | 7 | 0.0% |
| Guyana | 56 | 0.1% |
| Honduras | 83 | 0.1% |
| Hong Kong | 10 | 0.0% |
| India | 1,435 | 2.1% |
| Iran | 27 | 0.0% |
| Italy | 47 | 0.1% |
| Jamaica | 18 | 0.0% |
| Kenya | 199 | 0.3% |
| Korea | 195 | 0.3% |
| Laos | 58 | 0.1% |
| Latin America | 490 | 0.7% |
| Latvia | 23 | 0.0% |
| Lebanon | 36 | 0.1% |
| Liberia | 710 | 1.0% |
| Lithuania | 68 | 0.1% |
| Mexico | 62 | 0.1% |
| Moldova | 104 | 0.2% |
| Nepal | 91 | 0.1% |
| Netherlands | 19 | 0.0% |
| Nicaragua | 14 | 0.0% |
| Nigeria | 342 | 0.5% |
| Northern Africa | 16 | 0.0% |
| Northern Europe | 84 | 0.1% |
| Oceania | 41 | 0.1% |
| Pakistan | 219 | 0.3% |
| Peru | 56 | 0.1% |
| Philippines | 287 | 0.4% |
| Romania | 15 | 0.0% |
| Russia | 303 | 0.4% |
| Scotland | 18 | 0.0% |
| Somalia | 239 | 0.3% |
| South America | 306 | 0.4% |
| South Central Asia | 1,785 | 2.5% |
| South Eastern Asia | 894 | 1.3% |
| Southern Europe | 59 | 0.1% |
| Switzerland | 30 | 0.0% |
| Syria | 69 | 0.1% |
| Taiwan | 107 | 0.2% |
| Thailand | 82 | 0.1% |
| Turkey | 19 | 0.0% |
| Ukraine | 197 | 0.3% |
| Uruguay | 11 | 0.0% |
| Vietnam | 389 | 0.5% |
| Western Africa | 1,211 | 1.7% |
| Western Asia | 143 | 0.2% |
| Western Europe | 344 | 0.5% | View All 75 Rows |
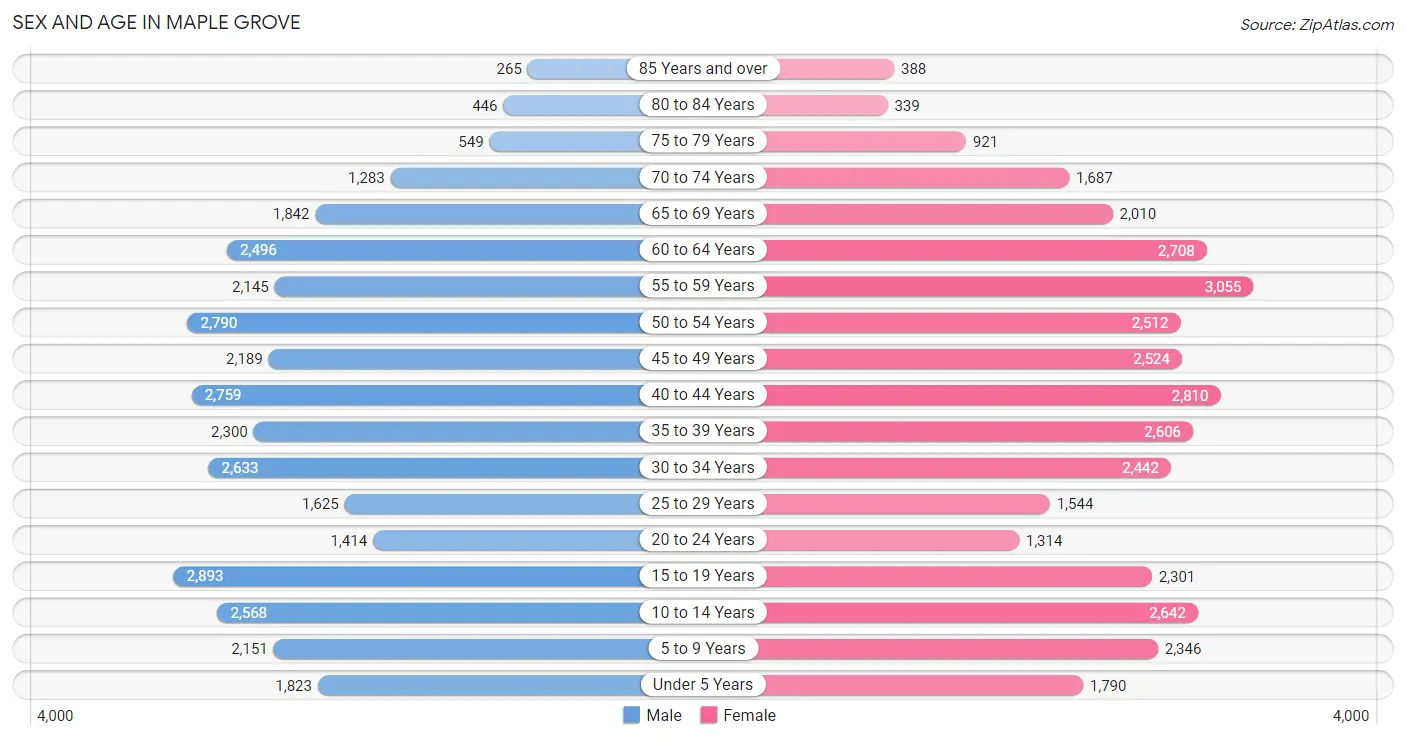
Sex and Age in Maple Grove
Sex and Age in Maple Grove
The most populous age groups in Maple Grove are 15 to 19 Years (2,893 | 8.5%) for men and 55 to 59 Years (3,055 | 8.5%) for women.
| Age Bracket | Male | Female |
| Under 5 Years | 1,823 (5.3%) | 1,790 (5.0%) |
| 5 to 9 Years | 2,151 (6.3%) | 2,346 (6.5%) |
| 10 to 14 Years | 2,568 (7.5%) | 2,642 (7.3%) |
| 15 to 19 Years | 2,893 (8.5%) | 2,301 (6.4%) |
| 20 to 24 Years | 1,414 (4.1%) | 1,314 (3.7%) |
| 25 to 29 Years | 1,625 (4.8%) | 1,544 (4.3%) |
| 30 to 34 Years | 2,633 (7.7%) | 2,442 (6.8%) |
| 35 to 39 Years | 2,300 (6.7%) | 2,606 (7.2%) |
| 40 to 44 Years | 2,759 (8.1%) | 2,810 (7.8%) |
| 45 to 49 Years | 2,189 (6.4%) | 2,524 (7.0%) |
| 50 to 54 Years | 2,790 (8.2%) | 2,512 (7.0%) |
| 55 to 59 Years | 2,145 (6.3%) | 3,055 (8.5%) |
| 60 to 64 Years | 2,496 (7.3%) | 2,708 (7.5%) |
| 65 to 69 Years | 1,842 (5.4%) | 2,010 (5.6%) |
| 70 to 74 Years | 1,283 (3.7%) | 1,687 (4.7%) |
| 75 to 79 Years | 549 (1.6%) | 921 (2.6%) |
| 80 to 84 Years | 446 (1.3%) | 339 (0.9%) |
| 85 Years and over | 265 (0.8%) | 388 (1.1%) |
| Total | 34,171 (100.0%) | 35,939 (100.0%) |
Families and Households in Maple Grove
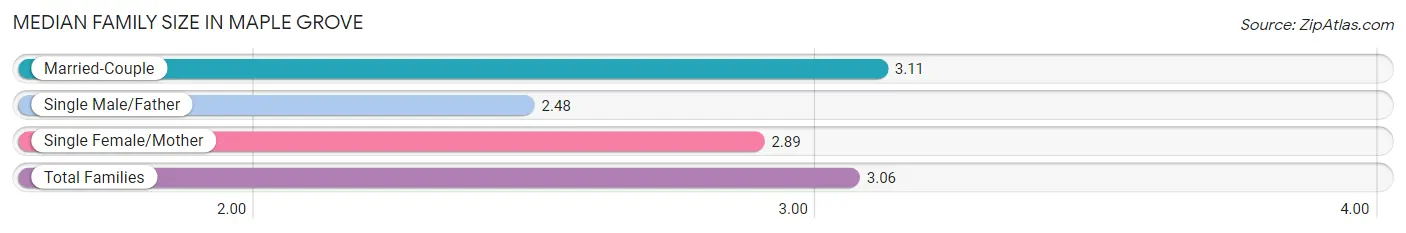
Median Family Size in Maple Grove
The median family size in Maple Grove is 3.06 persons per family, with married-couple families (16,892 | 87.3%) accounting for the largest median family size of 3.11 persons per family. On the other hand, single male/father families (766 | 4.0%) represent the smallest median family size with 2.48 persons per family.
| Family Type | # Families | Family Size |
| Married-Couple | 16,892 (87.3%) | 3.11 |
| Single Male/Father | 766 (4.0%) | 2.48 |
| Single Female/Mother | 1,692 (8.7%) | 2.89 |
| Total Families | 19,350 (100.0%) | 3.06 |
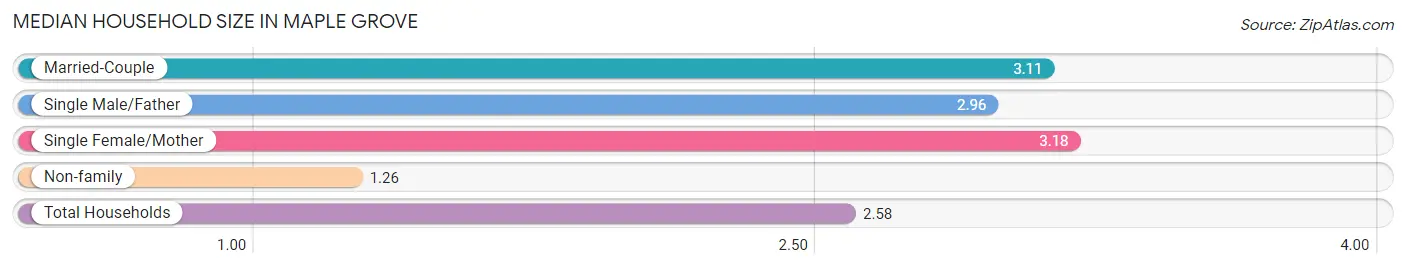
Median Household Size in Maple Grove
The median household size in Maple Grove is 2.58 persons per household, with single female/mother households (1,692 | 6.2%) accounting for the largest median household size of 3.18 persons per household. non-family households (7,756 | 28.6%) represent the smallest median household size with 1.26 persons per household.
| Household Type | # Households | Household Size |
| Married-Couple | 16,892 (62.3%) | 3.11 |
| Single Male/Father | 766 (2.8%) | 2.96 |
| Single Female/Mother | 1,692 (6.2%) | 3.18 |
| Non-family | 7,756 (28.6%) | 1.26 |
| Total Households | 27,106 (100.0%) | 2.58 |
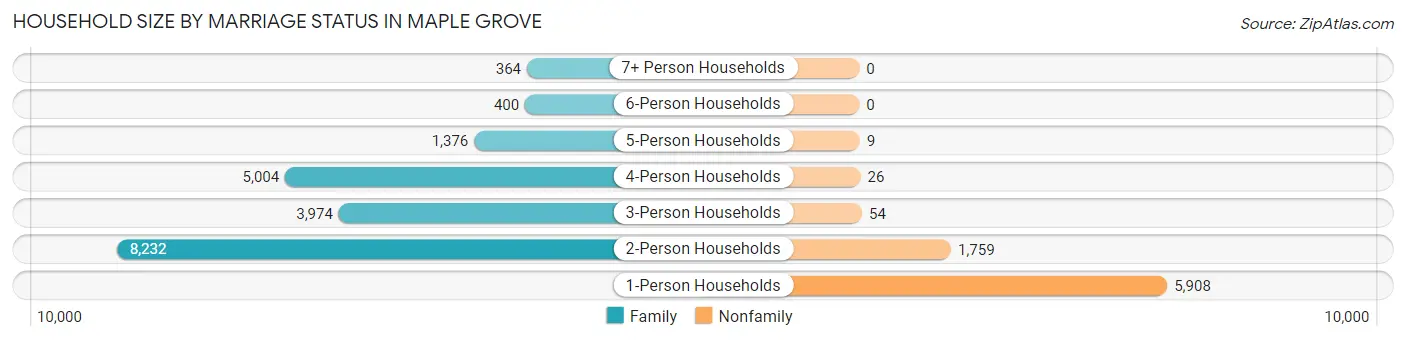
Household Size by Marriage Status in Maple Grove
Out of a total of 27,106 households in Maple Grove, 19,350 (71.4%) are family households, while 7,756 (28.6%) are nonfamily households. The most numerous type of family households are 2-person households, comprising 8,232, and the most common type of nonfamily households are 1-person households, comprising 5,908.
| Household Size | Family Households | Nonfamily Households |
| 1-Person Households | - | 5,908 (21.8%) |
| 2-Person Households | 8,232 (30.4%) | 1,759 (6.5%) |
| 3-Person Households | 3,974 (14.7%) | 54 (0.2%) |
| 4-Person Households | 5,004 (18.5%) | 26 (0.1%) |
| 5-Person Households | 1,376 (5.1%) | 9 (0.0%) |
| 6-Person Households | 400 (1.5%) | 0 (0.0%) |
| 7+ Person Households | 364 (1.3%) | 0 (0.0%) |
| Total | 19,350 (71.4%) | 7,756 (28.6%) |
Female Fertility in Maple Grove
Fertility by Age in Maple Grove
Average fertility rate in Maple Grove is 53.0 births per 1,000 women. Women in the age bracket of 20 to 34 years have the highest fertility rate with 103.0 births per 1,000 women. Women in the age bracket of 20 to 34 years acount for 64.2% of all women with births.
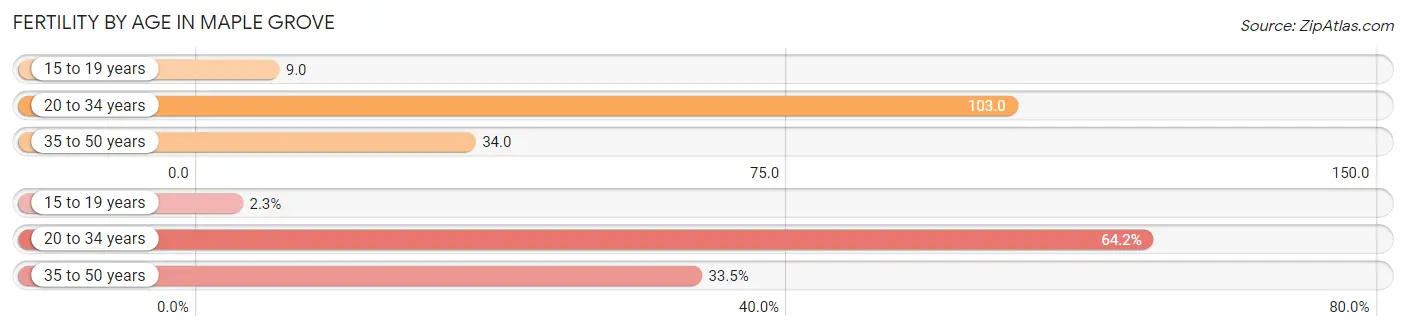
| Age Bracket | Women with Births | Births / 1,000 Women |
| 15 to 19 years | 20 (2.3%) | 9.0 |
| 20 to 34 years | 548 (64.2%) | 103.0 |
| 35 to 50 years | 286 (33.5%) | 34.0 |
| Total | 854 (100.0%) | 53.0 |
Fertility by Age by Marriage Status in Maple Grove
85.0% of women with births (854) in Maple Grove are married. The highest percentage of unmarried women with births falls into 15 to 19 years age bracket with 100.0% of them unmarried at the time of birth, while the lowest percentage of unmarried women with births belong to 35 to 50 years age bracket with 0.0% of them unmarried.
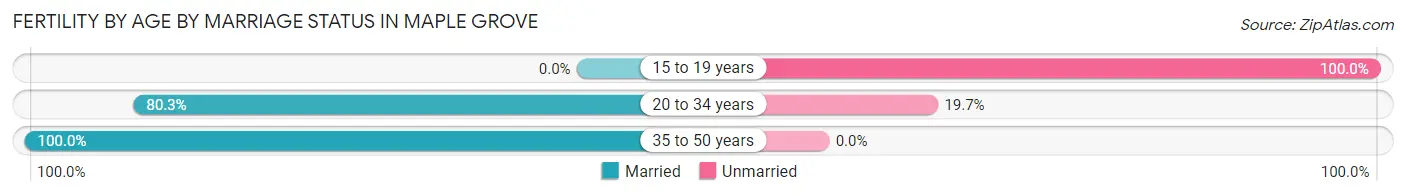
| Age Bracket | Married | Unmarried |
| 15 to 19 years | 0 (0.0%) | 20 (100.0%) |
| 20 to 34 years | 440 (80.3%) | 108 (19.7%) |
| 35 to 50 years | 286 (100.0%) | 0 (0.0%) |
| Total | 726 (85.0%) | 128 (15.0%) |
Fertility by Education in Maple Grove
Average fertility rate in Maple Grove is 53.0 births per 1,000 women. Women with the education attainment of college or associate's degree have the highest fertility rate of 74.0 births per 1,000 women, while women with the education attainment of less than high school have the lowest fertility at 9.0 births per 1,000 women. Women with the education attainment of bachelor's degree represent 44.6% of all women with births.
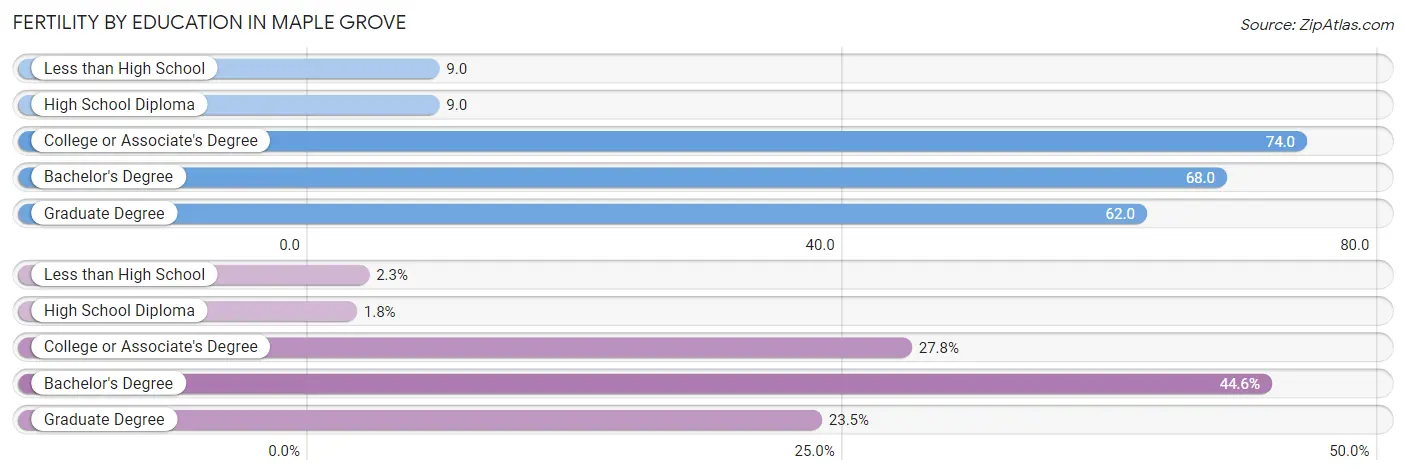
| Educational Attainment | Women with Births | Births / 1,000 Women |
| Less than High School | 20 (2.3%) | 9.0 |
| High School Diploma | 15 (1.8%) | 9.0 |
| College or Associate's Degree | 237 (27.8%) | 74.0 |
| Bachelor's Degree | 381 (44.6%) | 68.0 |
| Graduate Degree | 201 (23.5%) | 62.0 |
| Total | 854 (100.0%) | 53.0 |
Fertility by Education by Marriage Status in Maple Grove
15.0% of women with births in Maple Grove are unmarried. Women with the educational attainment of bachelor's degree are most likely to be married with 96.1% of them married at childbirth, while women with the educational attainment of less than high school are least likely to be married with 100.0% of them unmarried at childbirth.
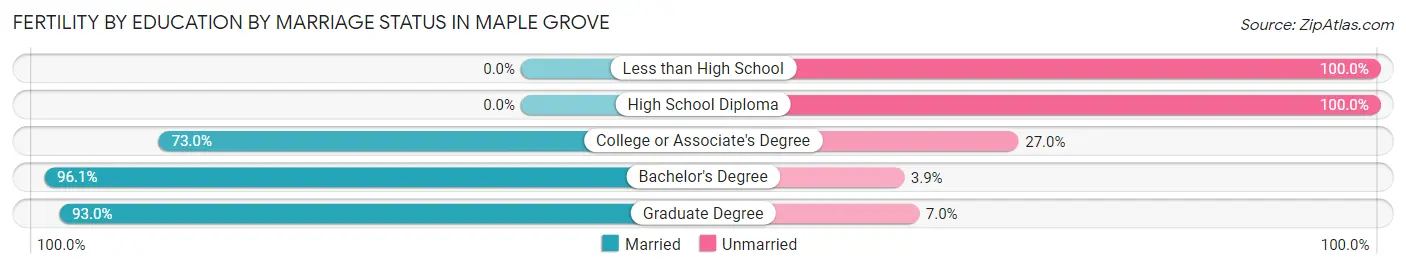
| Educational Attainment | Married | Unmarried |
| Less than High School | 0 (0.0%) | 20 (100.0%) |
| High School Diploma | 0 (0.0%) | 15 (100.0%) |
| College or Associate's Degree | 173 (73.0%) | 64 (27.0%) |
| Bachelor's Degree | 366 (96.1%) | 15 (3.9%) |
| Graduate Degree | 187 (93.0%) | 14 (7.0%) |
| Total | 726 (85.0%) | 128 (15.0%) |
Employment Characteristics in Maple Grove
Employment by Class of Employer in Maple Grove
Among the 38,697 employed individuals in Maple Grove, private company employees (27,740 | 71.7%), not-for-profit organizations (4,117 | 10.6%), and local government employees (2,251 | 5.8%) make up the most common classes of employment.
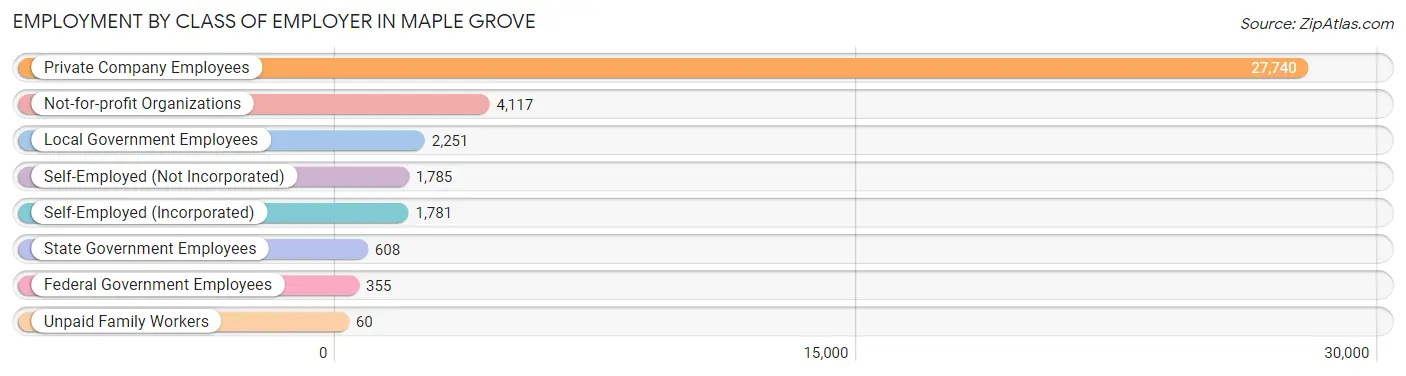
| Employer Class | # Employees | % Employees |
| Private Company Employees | 27,740 | 71.7% |
| Self-Employed (Incorporated) | 1,781 | 4.6% |
| Self-Employed (Not Incorporated) | 1,785 | 4.6% |
| Not-for-profit Organizations | 4,117 | 10.6% |
| Local Government Employees | 2,251 | 5.8% |
| State Government Employees | 608 | 1.6% |
| Federal Government Employees | 355 | 0.9% |
| Unpaid Family Workers | 60 | 0.2% |
| Total | 38,697 | 100.0% |
Employment Status by Age in Maple Grove
According to the labor force statistics for Maple Grove, out of the total population over 16 years of age (55,353), 73.5% or 40,684 individuals are in the labor force, with 4.0% or 1,627 of them unemployed. The age group with the highest labor force participation rate is 30 to 34 years, with 94.5% or 4,796 individuals in the labor force. Within the labor force, the 16 to 19 years age range has the highest percentage of unemployed individuals, with 19.5% or 367 of them being unemployed.
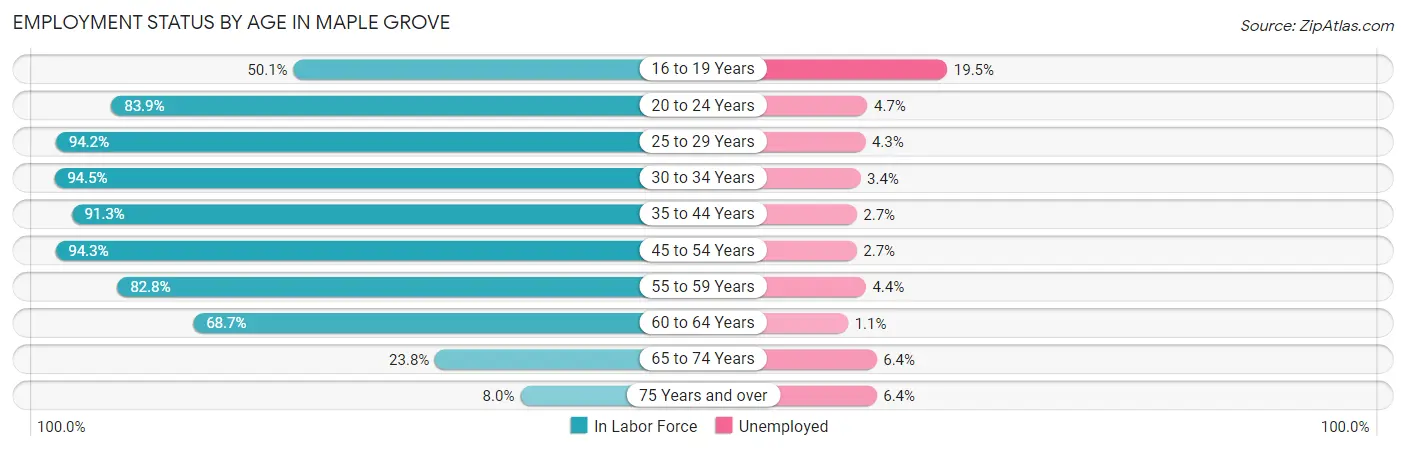
| Age Bracket | In Labor Force | Unemployed |
| 16 to 19 Years | 1,882 (50.1%) | 367 (19.5%) |
| 20 to 24 Years | 2,289 (83.9%) | 108 (4.7%) |
| 25 to 29 Years | 2,985 (94.2%) | 128 (4.3%) |
| 30 to 34 Years | 4,796 (94.5%) | 163 (3.4%) |
| 35 to 44 Years | 9,564 (91.3%) | 258 (2.7%) |
| 45 to 54 Years | 9,444 (94.3%) | 255 (2.7%) |
| 55 to 59 Years | 4,306 (82.8%) | 189 (4.4%) |
| 60 to 64 Years | 3,575 (68.7%) | 39 (1.1%) |
| 65 to 74 Years | 1,624 (23.8%) | 104 (6.4%) |
| 75 Years and over | 233 (8.0%) | 15 (6.4%) |
| Total | 40,684 (73.5%) | 1,627 (4.0%) |
Employment Status by Educational Attainment in Maple Grove
According to labor force statistics for Maple Grove, 88.6% of individuals (34,676) out of the total population between 25 and 64 years of age (39,138) are in the labor force, with 3.0% or 1,040 of them being unemployed. The group with the highest labor force participation rate are those with the educational attainment of bachelor's degree or higher, with 92.6% or 21,434 individuals in the labor force. Within the labor force, individuals with college / associate degree education have the highest percentage of unemployment, with 3.5% or 317 of them being unemployed.
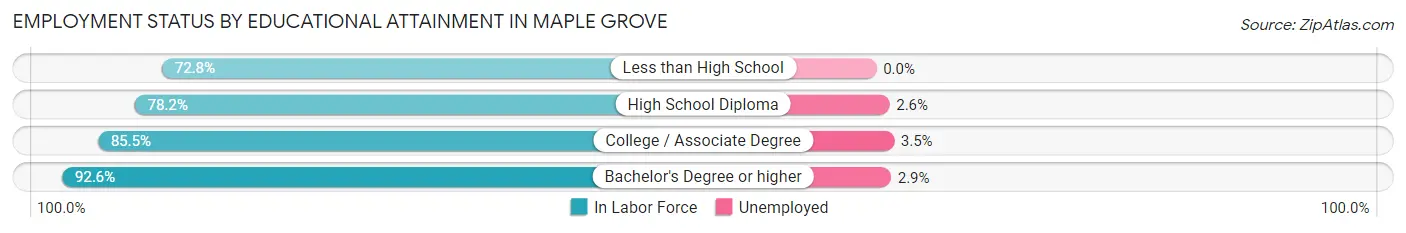
| Educational Attainment | In Labor Force | Unemployed |
| Less than High School | 649 (72.8%) | 0 (0.0%) |
| High School Diploma | 3,524 (78.2%) | 117 (2.6%) |
| College / Associate Degree | 9,057 (85.5%) | 371 (3.5%) |
| Bachelor's Degree or higher | 21,434 (92.6%) | 671 (2.9%) |
| Total | 34,676 (88.6%) | 1,174 (3.0%) |
Employment Occupations by Sex in Maple Grove
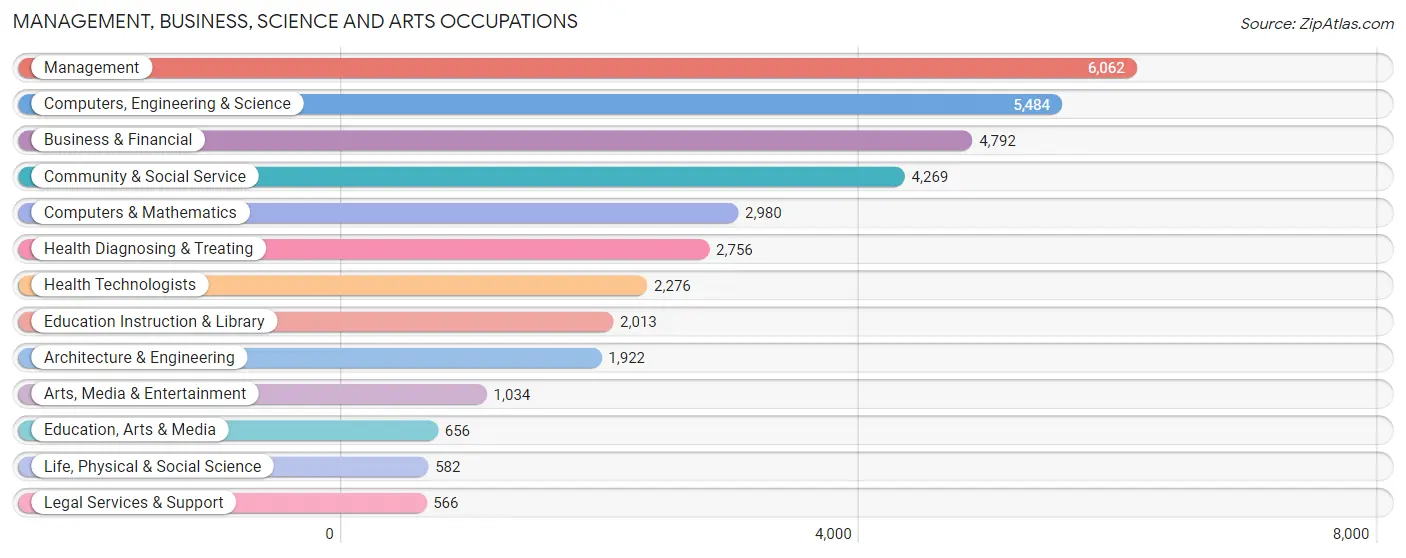
Management, Business, Science and Arts Occupations
The most common Management, Business, Science and Arts occupations in Maple Grove are Management (6,062 | 15.5%), Computers, Engineering & Science (5,484 | 14.0%), Business & Financial (4,792 | 12.3%), Community & Social Service (4,269 | 10.9%), and Computers & Mathematics (2,980 | 7.6%).
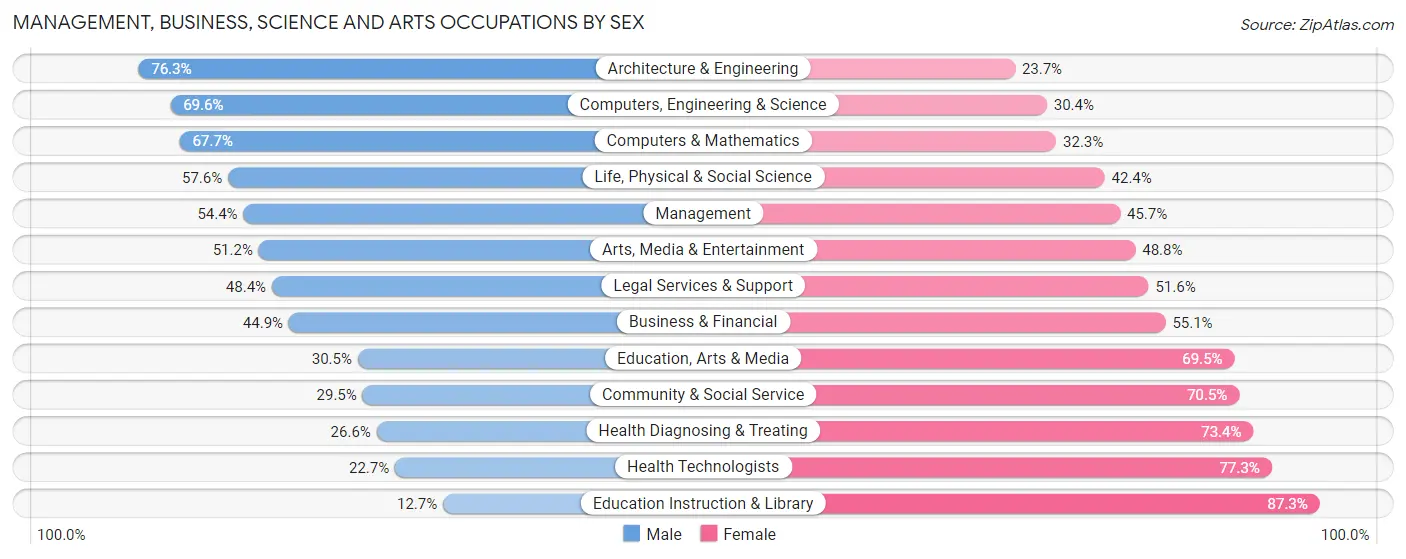
Management, Business, Science and Arts Occupations by Sex
Within the Management, Business, Science and Arts occupations in Maple Grove, the most male-oriented occupations are Architecture & Engineering (76.3%), Computers, Engineering & Science (69.6%), and Computers & Mathematics (67.7%), while the most female-oriented occupations are Education Instruction & Library (87.3%), Health Technologists (77.3%), and Health Diagnosing & Treating (73.4%).
| Occupation | Male | Female |
| Management | 3,295 (54.3%) | 2,767 (45.7%) |
| Business & Financial | 2,150 (44.9%) | 2,642 (55.1%) |
| Computers, Engineering & Science | 3,818 (69.6%) | 1,666 (30.4%) |
| Computers & Mathematics | 2,017 (67.7%) | 963 (32.3%) |
| Architecture & Engineering | 1,466 (76.3%) | 456 (23.7%) |
| Life, Physical & Social Science | 335 (57.6%) | 247 (42.4%) |
| Community & Social Service | 1,259 (29.5%) | 3,010 (70.5%) |
| Education, Arts & Media | 200 (30.5%) | 456 (69.5%) |
| Legal Services & Support | 274 (48.4%) | 292 (51.6%) |
| Education Instruction & Library | 256 (12.7%) | 1,757 (87.3%) |
| Arts, Media & Entertainment | 529 (51.2%) | 505 (48.8%) |
| Health Diagnosing & Treating | 732 (26.6%) | 2,024 (73.4%) |
| Health Technologists | 517 (22.7%) | 1,759 (77.3%) |
| Total (Category) | 11,254 (48.2%) | 12,109 (51.8%) |
| Total (Overall) | 19,570 (50.1%) | 19,511 (49.9%) |
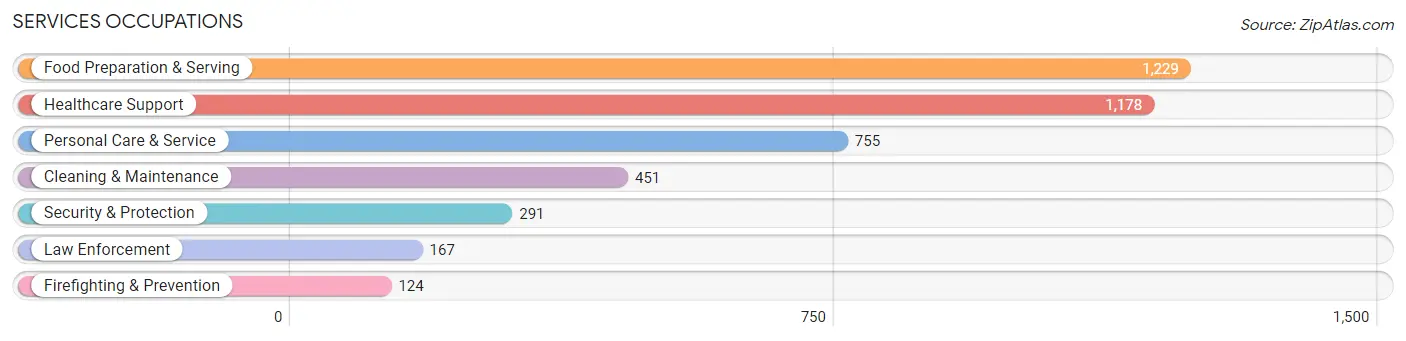
Services Occupations
The most common Services occupations in Maple Grove are Food Preparation & Serving (1,229 | 3.1%), Healthcare Support (1,178 | 3.0%), Personal Care & Service (755 | 1.9%), Cleaning & Maintenance (451 | 1.1%), and Security & Protection (291 | 0.7%).
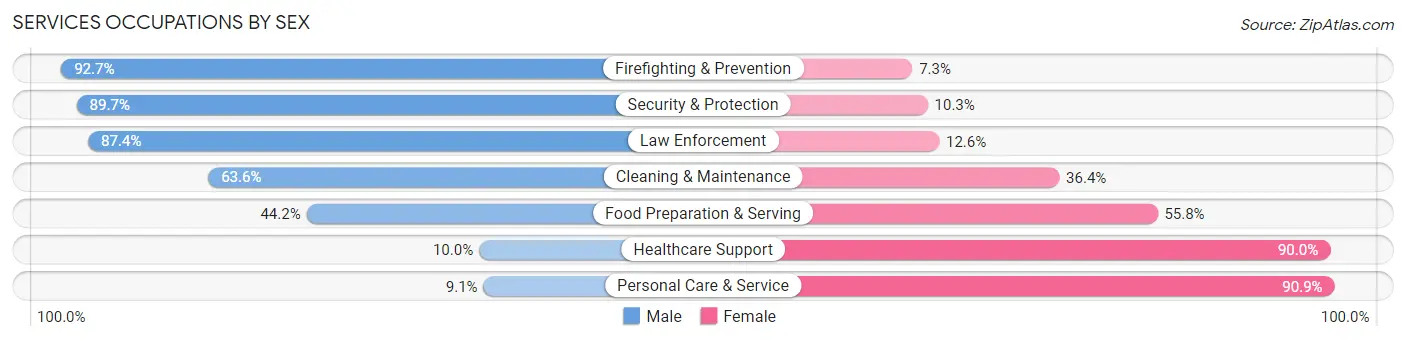
Services Occupations by Sex
Within the Services occupations in Maple Grove, the most male-oriented occupations are Firefighting & Prevention (92.7%), Security & Protection (89.7%), and Law Enforcement (87.4%), while the most female-oriented occupations are Personal Care & Service (90.9%), Healthcare Support (90.0%), and Food Preparation & Serving (55.8%).
| Occupation | Male | Female |
| Healthcare Support | 118 (10.0%) | 1,060 (90.0%) |
| Security & Protection | 261 (89.7%) | 30 (10.3%) |
| Firefighting & Prevention | 115 (92.7%) | 9 (7.3%) |
| Law Enforcement | 146 (87.4%) | 21 (12.6%) |
| Food Preparation & Serving | 543 (44.2%) | 686 (55.8%) |
| Cleaning & Maintenance | 287 (63.6%) | 164 (36.4%) |
| Personal Care & Service | 69 (9.1%) | 686 (90.9%) |
| Total (Category) | 1,278 (32.7%) | 2,626 (67.3%) |
| Total (Overall) | 19,570 (50.1%) | 19,511 (49.9%) |
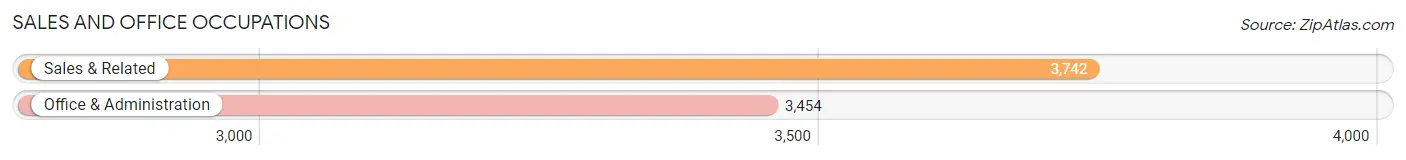
Sales and Office Occupations
The most common Sales and Office occupations in Maple Grove are Sales & Related (3,742 | 9.6%), and Office & Administration (3,454 | 8.8%).
Sales and Office Occupations by Sex
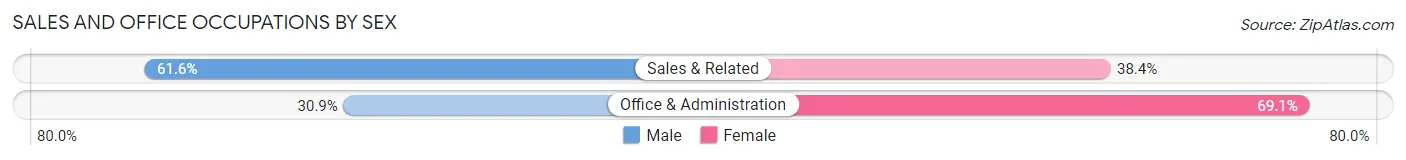
| Occupation | Male | Female |
| Sales & Related | 2,306 (61.6%) | 1,436 (38.4%) |
| Office & Administration | 1,068 (30.9%) | 2,386 (69.1%) |
| Total (Category) | 3,374 (46.9%) | 3,822 (53.1%) |
| Total (Overall) | 19,570 (50.1%) | 19,511 (49.9%) |
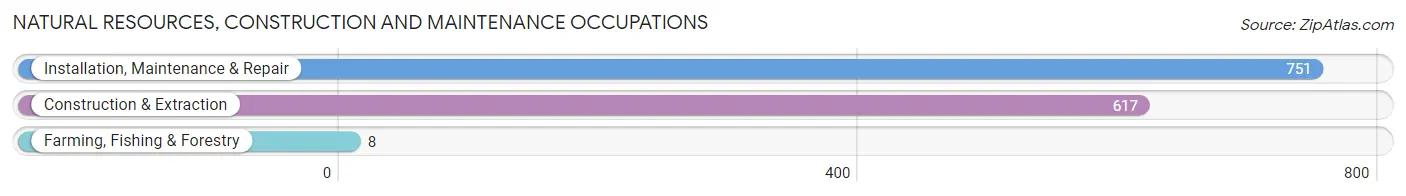
Natural Resources, Construction and Maintenance Occupations
The most common Natural Resources, Construction and Maintenance occupations in Maple Grove are Installation, Maintenance & Repair (751 | 1.9%), Construction & Extraction (617 | 1.6%), and Farming, Fishing & Forestry (8 | 0.0%).
Natural Resources, Construction and Maintenance Occupations by Sex
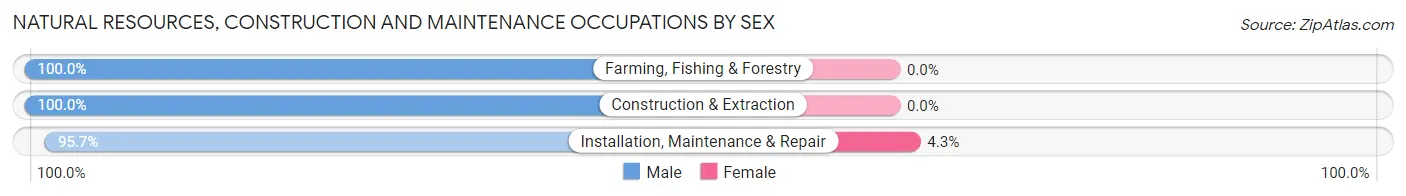
| Occupation | Male | Female |
| Farming, Fishing & Forestry | 8 (100.0%) | 0 (0.0%) |
| Construction & Extraction | 617 (100.0%) | 0 (0.0%) |
| Installation, Maintenance & Repair | 719 (95.7%) | 32 (4.3%) |
| Total (Category) | 1,344 (97.7%) | 32 (2.3%) |
| Total (Overall) | 19,570 (50.1%) | 19,511 (49.9%) |
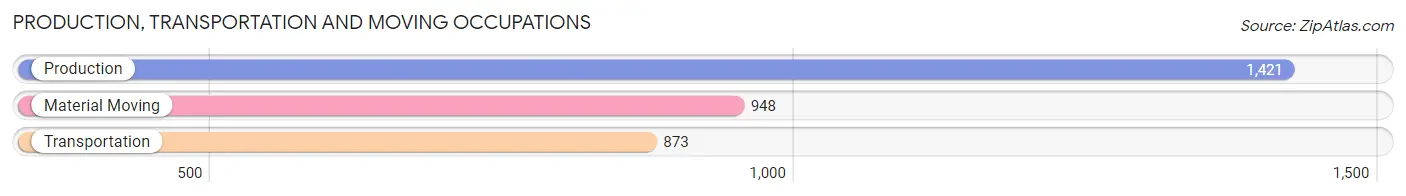
Production, Transportation and Moving Occupations
The most common Production, Transportation and Moving occupations in Maple Grove are Production (1,421 | 3.6%), Material Moving (948 | 2.4%), and Transportation (873 | 2.2%).
Production, Transportation and Moving Occupations by Sex
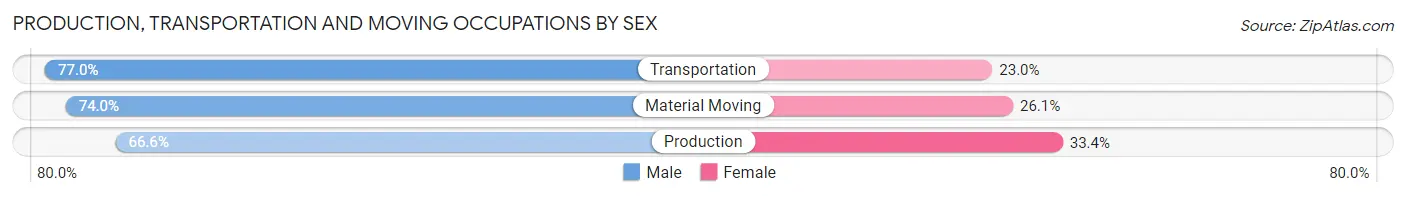
| Occupation | Male | Female |
| Production | 947 (66.6%) | 474 (33.4%) |
| Transportation | 672 (77.0%) | 201 (23.0%) |
| Material Moving | 701 (74.0%) | 247 (26.1%) |
| Total (Category) | 2,320 (71.6%) | 922 (28.4%) |
| Total (Overall) | 19,570 (50.1%) | 19,511 (49.9%) |
Employment Industries by Sex in Maple Grove
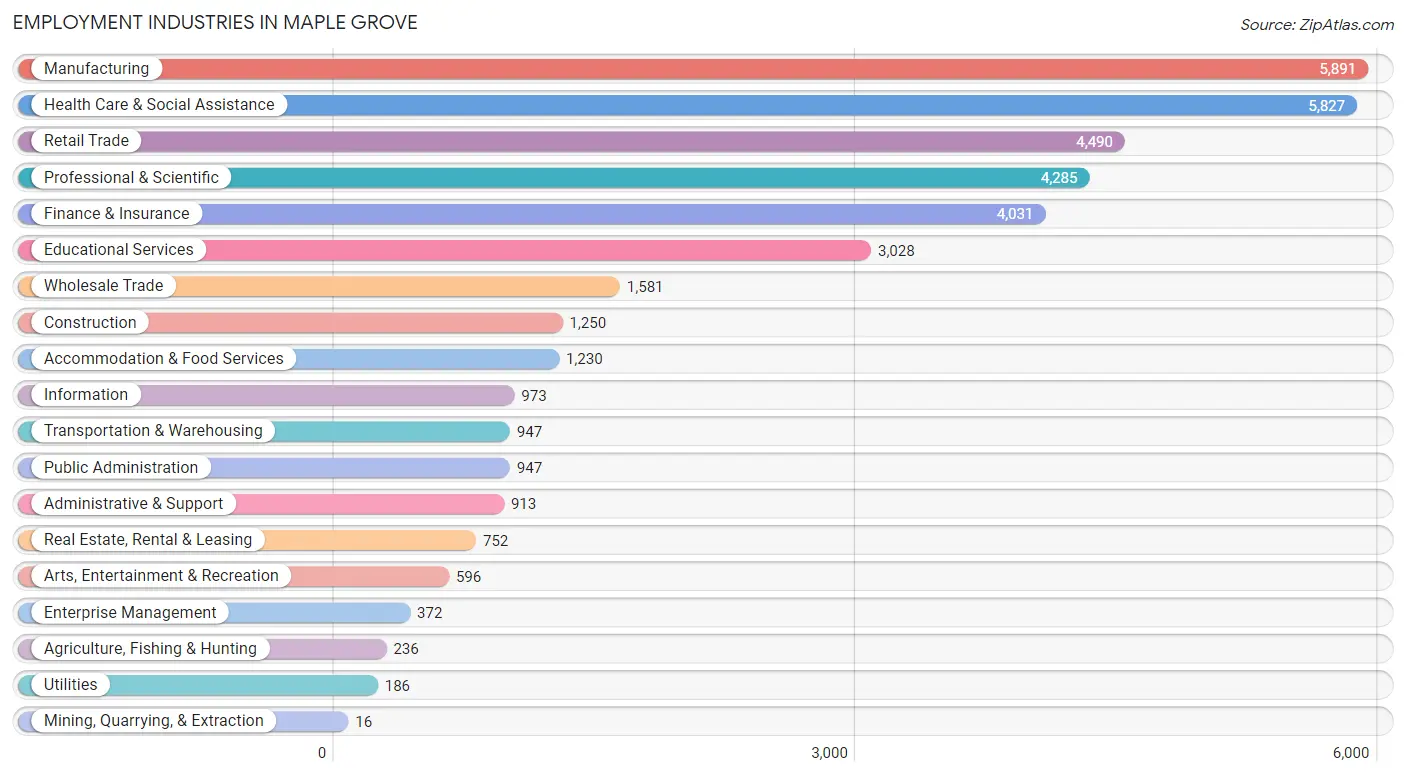
Employment Industries in Maple Grove
The major employment industries in Maple Grove include Manufacturing (5,891 | 15.1%), Health Care & Social Assistance (5,827 | 14.9%), Retail Trade (4,490 | 11.5%), Professional & Scientific (4,285 | 11.0%), and Finance & Insurance (4,031 | 10.3%).
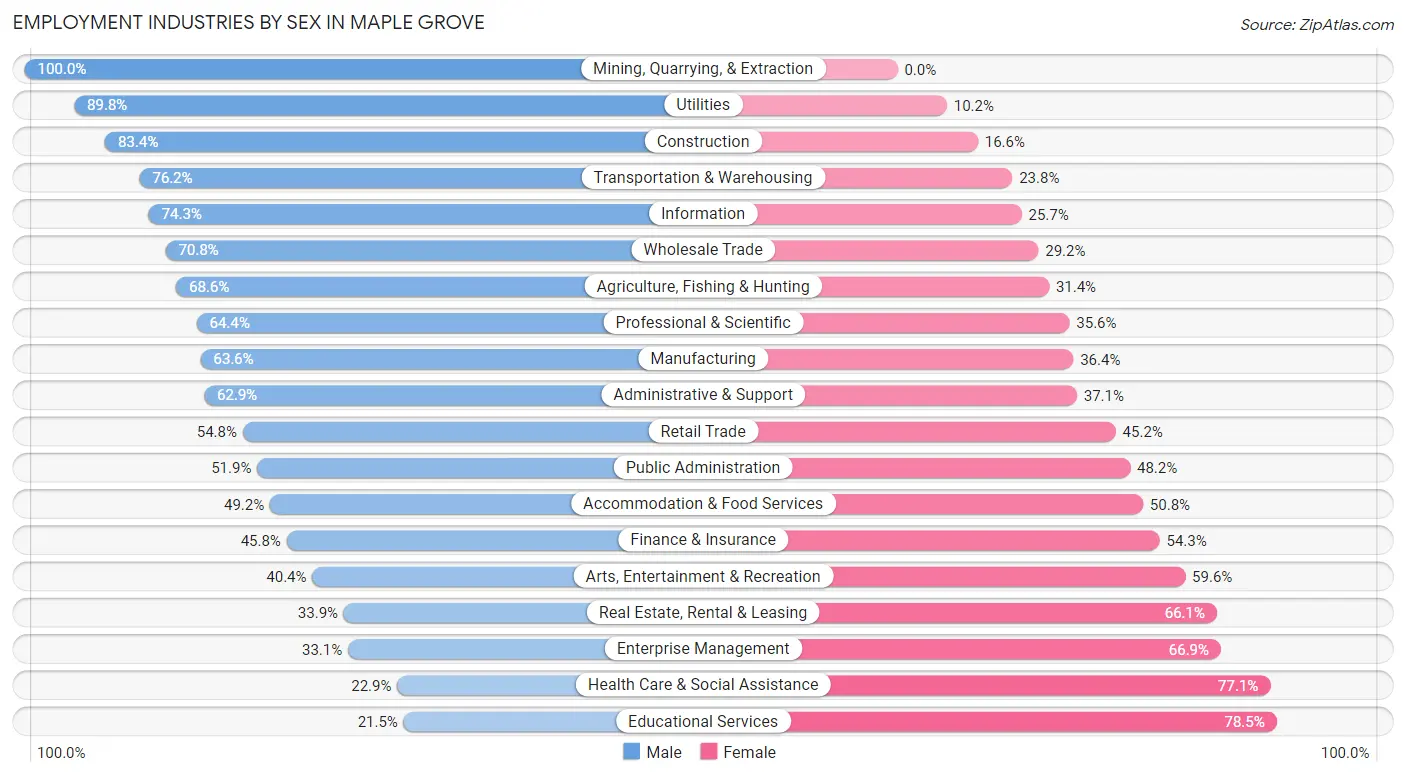
Employment Industries by Sex in Maple Grove
The Maple Grove industries that see more men than women are Mining, Quarrying, & Extraction (100.0%), Utilities (89.8%), and Construction (83.4%), whereas the industries that tend to have a higher number of women are Educational Services (78.5%), Health Care & Social Assistance (77.1%), and Enterprise Management (66.9%).
| Industry | Male | Female |
| Agriculture, Fishing & Hunting | 162 (68.6%) | 74 (31.4%) |
| Mining, Quarrying, & Extraction | 16 (100.0%) | 0 (0.0%) |
| Construction | 1,042 (83.4%) | 208 (16.6%) |
| Manufacturing | 3,747 (63.6%) | 2,144 (36.4%) |
| Wholesale Trade | 1,120 (70.8%) | 461 (29.2%) |
| Retail Trade | 2,462 (54.8%) | 2,028 (45.2%) |
| Transportation & Warehousing | 722 (76.2%) | 225 (23.8%) |
| Utilities | 167 (89.8%) | 19 (10.2%) |
| Information | 723 (74.3%) | 250 (25.7%) |
| Finance & Insurance | 1,844 (45.8%) | 2,187 (54.2%) |
| Real Estate, Rental & Leasing | 255 (33.9%) | 497 (66.1%) |
| Professional & Scientific | 2,760 (64.4%) | 1,525 (35.6%) |
| Enterprise Management | 123 (33.1%) | 249 (66.9%) |
| Administrative & Support | 574 (62.9%) | 339 (37.1%) |
| Educational Services | 652 (21.5%) | 2,376 (78.5%) |
| Health Care & Social Assistance | 1,332 (22.9%) | 4,495 (77.1%) |
| Arts, Entertainment & Recreation | 241 (40.4%) | 355 (59.6%) |
| Accommodation & Food Services | 605 (49.2%) | 625 (50.8%) |
| Public Administration | 491 (51.8%) | 456 (48.1%) |
| Total | 19,570 (50.1%) | 19,511 (49.9%) |
Education in Maple Grove
School Enrollment in Maple Grove
The most common levels of schooling among the 17,954 students in Maple Grove are high school (4,975 | 27.7%), middle school (4,321 | 24.1%), and elementary school (3,627 | 20.2%).
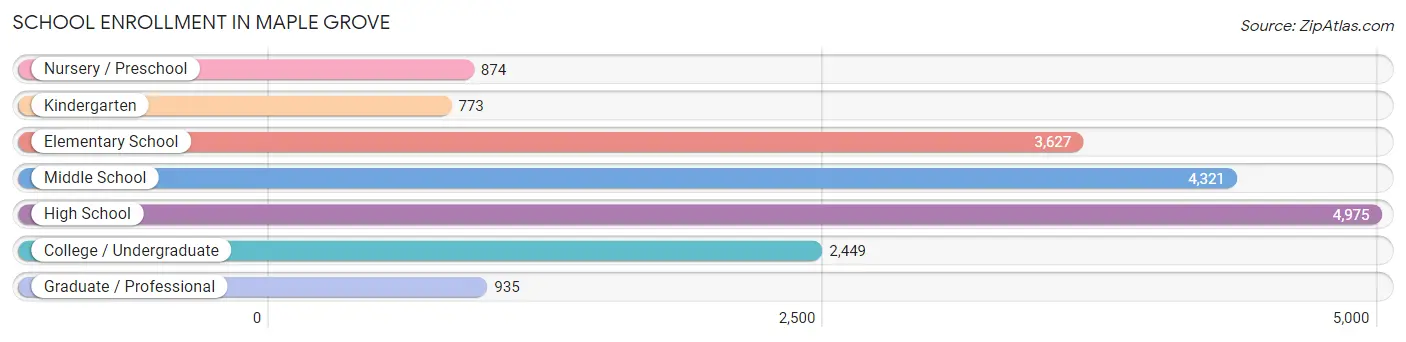
| School Level | # Students | % Students |
| Nursery / Preschool | 874 | 4.9% |
| Kindergarten | 773 | 4.3% |
| Elementary School | 3,627 | 20.2% |
| Middle School | 4,321 | 24.1% |
| High School | 4,975 | 27.7% |
| College / Undergraduate | 2,449 | 13.6% |
| Graduate / Professional | 935 | 5.2% |
| Total | 17,954 | 100.0% |
School Enrollment by Age by Funding Source in Maple Grove
Out of a total of 17,954 students who are enrolled in schools in Maple Grove, 2,819 (15.7%) attend a private institution, while the remaining 15,135 (84.3%) are enrolled in public schools. The age group of 3 to 4 year olds has the highest likelihood of being enrolled in private schools, with 261 (42.6% in the age bracket) enrolled. Conversely, the age group of 15 to 17 year olds has the lowest likelihood of being enrolled in a private school, with 3,313 (90.2% in the age bracket) attending a public institution.
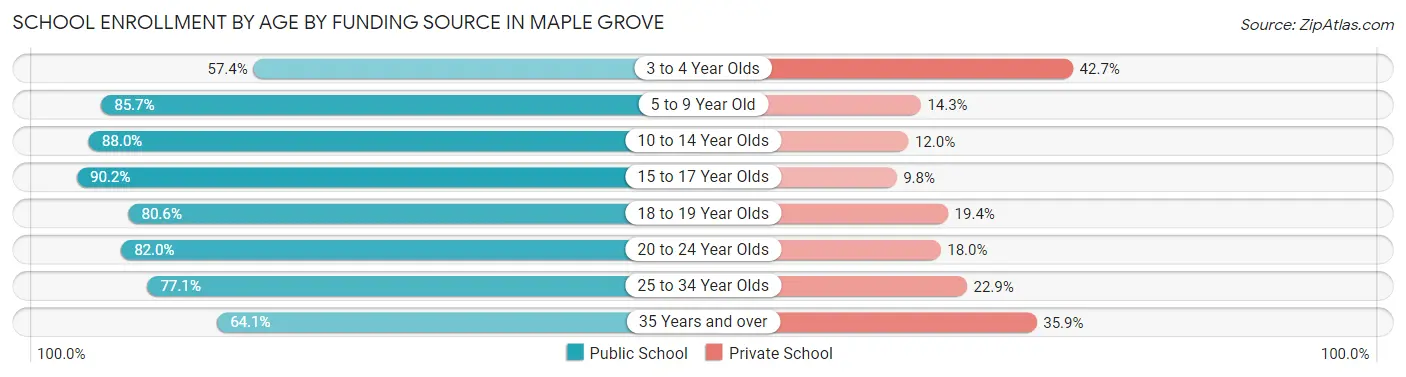
| Age Bracket | Public School | Private School |
| 3 to 4 Year Olds | 351 (57.4%) | 261 (42.6%) |
| 5 to 9 Year Old | 3,674 (85.7%) | 613 (14.3%) |
| 10 to 14 Year Olds | 4,533 (88.0%) | 617 (12.0%) |
| 15 to 17 Year Olds | 3,313 (90.2%) | 359 (9.8%) |
| 18 to 19 Year Olds | 1,020 (80.6%) | 245 (19.4%) |
| 20 to 24 Year Olds | 1,130 (82.0%) | 248 (18.0%) |
| 25 to 34 Year Olds | 549 (77.1%) | 163 (22.9%) |
| 35 Years and over | 563 (64.1%) | 315 (35.9%) |
| Total | 15,135 (84.3%) | 2,819 (15.7%) |
Educational Attainment by Field of Study in Maple Grove
Business (7,644 | 26.0%), education (2,634 | 8.9%), engineering (2,595 | 8.8%), social sciences (2,219 | 7.5%), and science & technology (1,978 | 6.7%) are the most common fields of study among 29,439 individuals in Maple Grove who have obtained a bachelor's degree or higher.
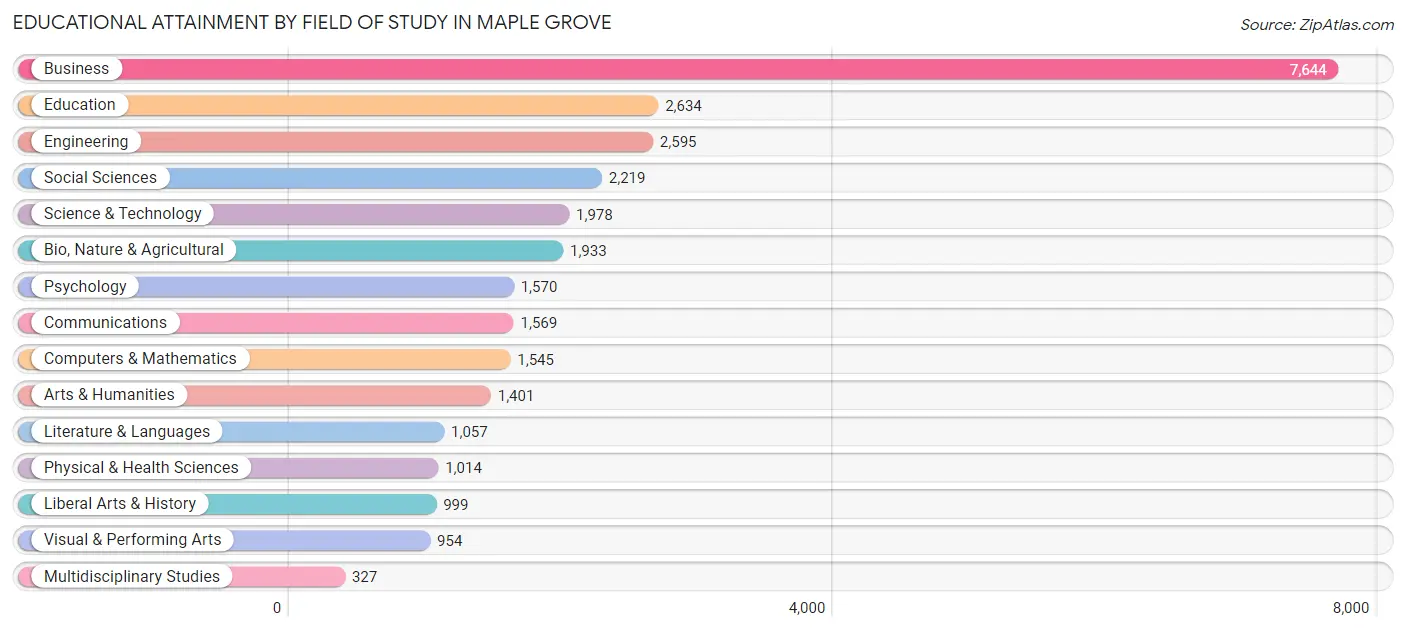
| Field of Study | # Graduates | % Graduates |
| Computers & Mathematics | 1,545 | 5.2% |
| Bio, Nature & Agricultural | 1,933 | 6.6% |
| Physical & Health Sciences | 1,014 | 3.4% |
| Psychology | 1,570 | 5.3% |
| Social Sciences | 2,219 | 7.5% |
| Engineering | 2,595 | 8.8% |
| Multidisciplinary Studies | 327 | 1.1% |
| Science & Technology | 1,978 | 6.7% |
| Business | 7,644 | 26.0% |
| Education | 2,634 | 8.9% |
| Literature & Languages | 1,057 | 3.6% |
| Liberal Arts & History | 999 | 3.4% |
| Visual & Performing Arts | 954 | 3.2% |
| Communications | 1,569 | 5.3% |
| Arts & Humanities | 1,401 | 4.8% |
| Total | 29,439 | 100.0% |
Transportation & Commute in Maple Grove
Vehicle Availability by Sex in Maple Grove
The most prevalent vehicle ownership categories in Maple Grove are males with 2 vehicles (11,059, accounting for 56.7%) and females with 2 vehicles (10,679, making up 57.7%).
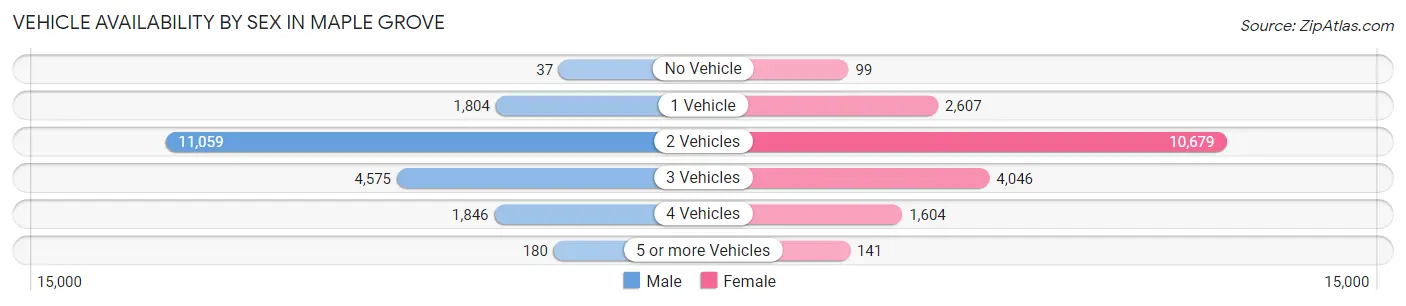
| Vehicles Available | Male | Female |
| No Vehicle | 37 (0.2%) | 99 (0.5%) |
| 1 Vehicle | 1,804 (9.2%) | 2,607 (13.6%) |
| 2 Vehicles | 11,059 (56.7%) | 10,679 (55.7%) |
| 3 Vehicles | 4,575 (23.5%) | 4,046 (21.1%) |
| 4 Vehicles | 1,846 (9.5%) | 1,604 (8.4%) |
| 5 or more Vehicles | 180 (0.9%) | 141 (0.7%) |
| Total | 19,501 (100.0%) | 19,176 (100.0%) |
Commute Time in Maple Grove
The most frequently occuring commute durations in Maple Grove are 15 to 19 minutes (5,005 commuters, 16.6%), 20 to 24 minutes (4,927 commuters, 16.3%), and 30 to 34 minutes (4,274 commuters, 14.1%).
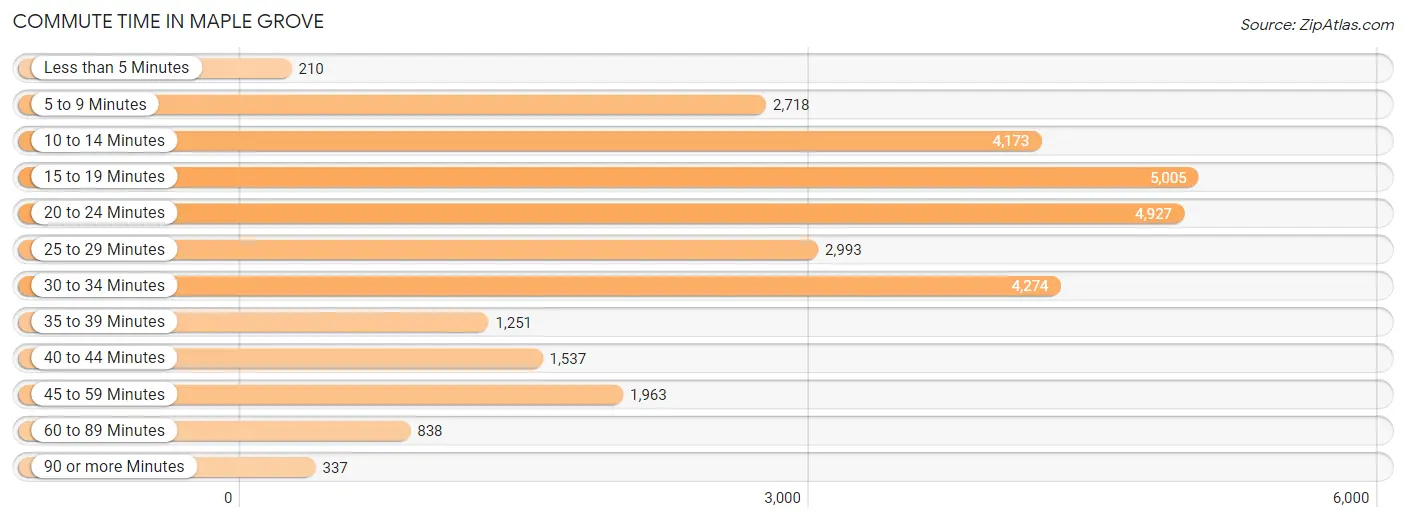
| Commute Time | # Commuters | % Commuters |
| Less than 5 Minutes | 210 | 0.7% |
| 5 to 9 Minutes | 2,718 | 9.0% |
| 10 to 14 Minutes | 4,173 | 13.8% |
| 15 to 19 Minutes | 5,005 | 16.6% |
| 20 to 24 Minutes | 4,927 | 16.3% |
| 25 to 29 Minutes | 2,993 | 9.9% |
| 30 to 34 Minutes | 4,274 | 14.1% |
| 35 to 39 Minutes | 1,251 | 4.1% |
| 40 to 44 Minutes | 1,537 | 5.1% |
| 45 to 59 Minutes | 1,963 | 6.5% |
| 60 to 89 Minutes | 838 | 2.8% |
| 90 or more Minutes | 337 | 1.1% |
Commute Time by Sex in Maple Grove
The most common commute times in Maple Grove are 20 to 24 minutes (3,016 commuters, 19.4%) for males and 15 to 19 minutes (2,331 commuters, 15.9%) for females.
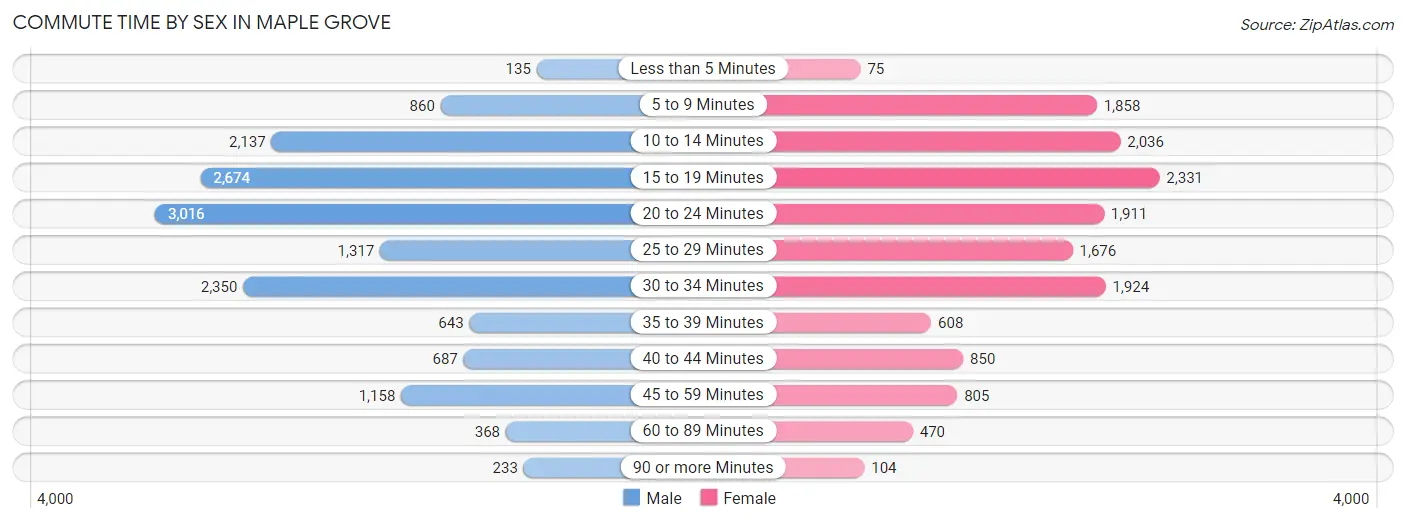
| Commute Time | Male | Female |
| Less than 5 Minutes | 135 (0.9%) | 75 (0.5%) |
| 5 to 9 Minutes | 860 (5.5%) | 1,858 (12.7%) |
| 10 to 14 Minutes | 2,137 (13.7%) | 2,036 (13.9%) |
| 15 to 19 Minutes | 2,674 (17.2%) | 2,331 (15.9%) |
| 20 to 24 Minutes | 3,016 (19.4%) | 1,911 (13.1%) |
| 25 to 29 Minutes | 1,317 (8.5%) | 1,676 (11.4%) |
| 30 to 34 Minutes | 2,350 (15.1%) | 1,924 (13.1%) |
| 35 to 39 Minutes | 643 (4.1%) | 608 (4.2%) |
| 40 to 44 Minutes | 687 (4.4%) | 850 (5.8%) |
| 45 to 59 Minutes | 1,158 (7.4%) | 805 (5.5%) |
| 60 to 89 Minutes | 368 (2.4%) | 470 (3.2%) |
| 90 or more Minutes | 233 (1.5%) | 104 (0.7%) |
Time of Departure to Work by Sex in Maple Grove
The most frequent times of departure to work in Maple Grove are 7:30 AM to 7:59 AM (2,602, 16.7%) for males and 7:30 AM to 7:59 AM (2,298, 15.7%) for females.
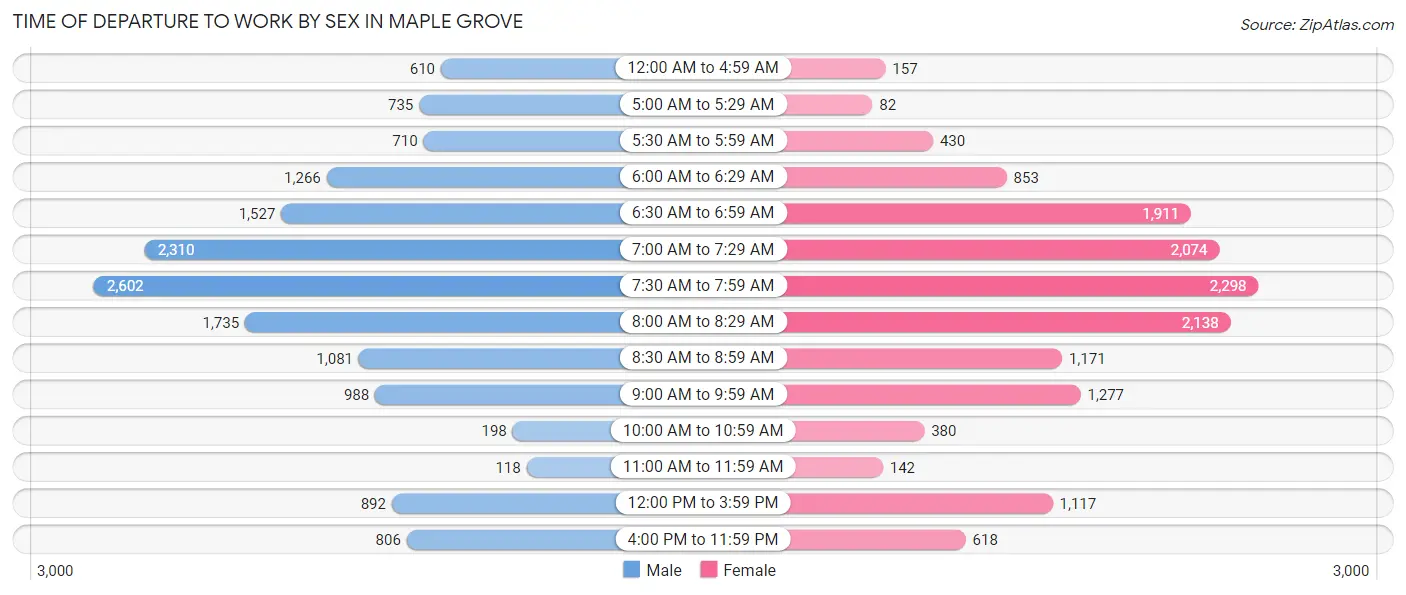
| Time of Departure | Male | Female |
| 12:00 AM to 4:59 AM | 610 (3.9%) | 157 (1.1%) |
| 5:00 AM to 5:29 AM | 735 (4.7%) | 82 (0.6%) |
| 5:30 AM to 5:59 AM | 710 (4.6%) | 430 (2.9%) |
| 6:00 AM to 6:29 AM | 1,266 (8.1%) | 853 (5.8%) |
| 6:30 AM to 6:59 AM | 1,527 (9.8%) | 1,911 (13.1%) |
| 7:00 AM to 7:29 AM | 2,310 (14.8%) | 2,074 (14.2%) |
| 7:30 AM to 7:59 AM | 2,602 (16.7%) | 2,298 (15.7%) |
| 8:00 AM to 8:29 AM | 1,735 (11.1%) | 2,138 (14.6%) |
| 8:30 AM to 8:59 AM | 1,081 (6.9%) | 1,171 (8.0%) |
| 9:00 AM to 9:59 AM | 988 (6.3%) | 1,277 (8.7%) |
| 10:00 AM to 10:59 AM | 198 (1.3%) | 380 (2.6%) |
| 11:00 AM to 11:59 AM | 118 (0.8%) | 142 (1.0%) |
| 12:00 PM to 3:59 PM | 892 (5.7%) | 1,117 (7.6%) |
| 4:00 PM to 11:59 PM | 806 (5.2%) | 618 (4.2%) |
| Total | 15,578 (100.0%) | 14,648 (100.0%) |
Housing Occupancy in Maple Grove
Occupancy by Ownership in Maple Grove
Of the total 27,106 dwellings in Maple Grove, owner-occupied units account for 22,667 (83.6%), while renter-occupied units make up 4,439 (16.4%).
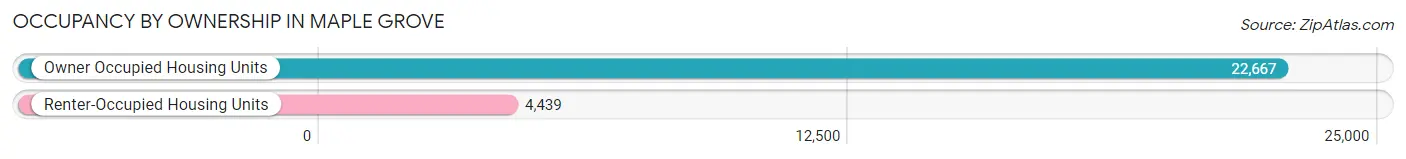
| Occupancy | # Housing Units | % Housing Units |
| Owner Occupied Housing Units | 22,667 | 83.6% |
| Renter-Occupied Housing Units | 4,439 | 16.4% |
| Total Occupied Housing Units | 27,106 | 100.0% |
Occupancy by Household Size in Maple Grove
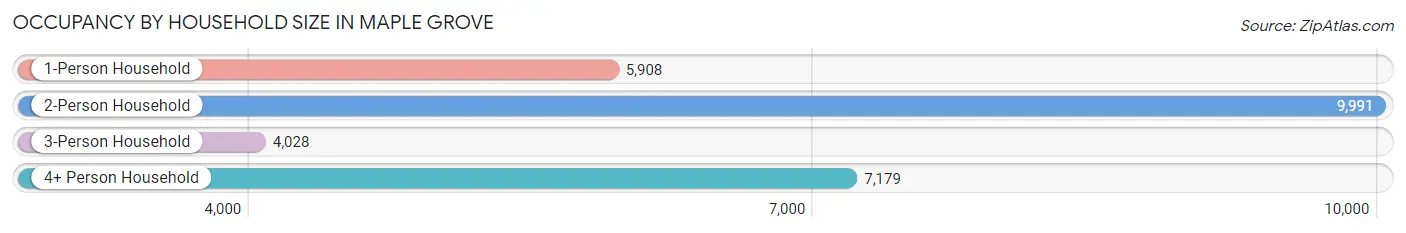
| Household Size | # Housing Units | % Housing Units |
| 1-Person Household | 5,908 | 21.8% |
| 2-Person Household | 9,991 | 36.9% |
| 3-Person Household | 4,028 | 14.9% |
| 4+ Person Household | 7,179 | 26.5% |
| Total Housing Units | 27,106 | 100.0% |
Occupancy by Ownership by Household Size in Maple Grove
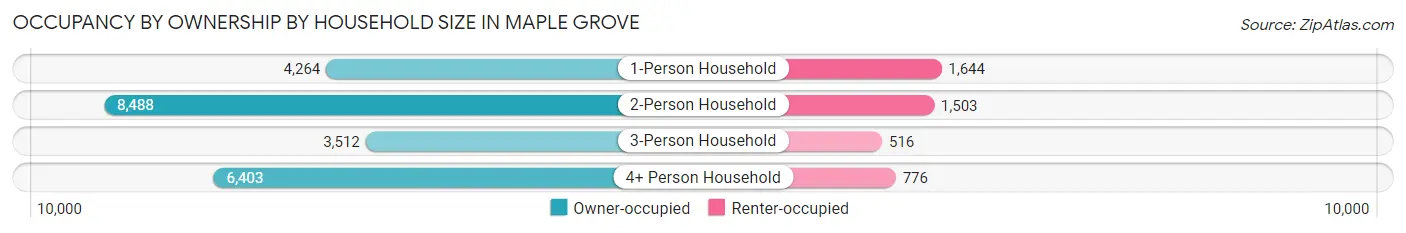
| Household Size | Owner-occupied | Renter-occupied |
| 1-Person Household | 4,264 (72.2%) | 1,644 (27.8%) |
| 2-Person Household | 8,488 (85.0%) | 1,503 (15.0%) |
| 3-Person Household | 3,512 (87.2%) | 516 (12.8%) |
| 4+ Person Household | 6,403 (89.2%) | 776 (10.8%) |
| Total Housing Units | 22,667 (83.6%) | 4,439 (16.4%) |
Occupancy by Educational Attainment in Maple Grove
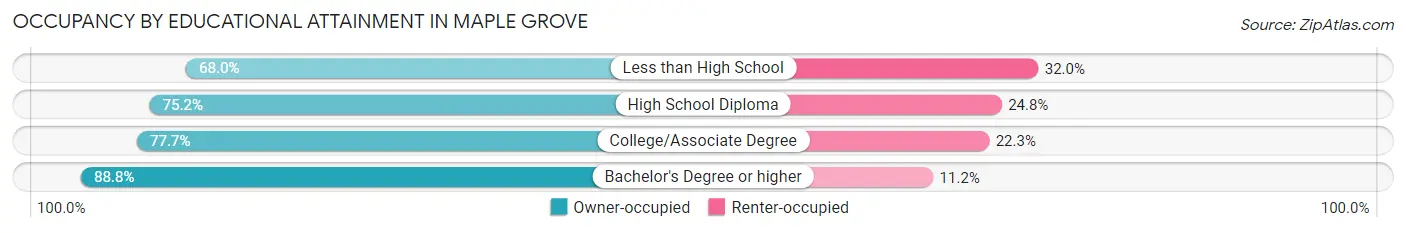
| Household Size | Owner-occupied | Renter-occupied |
| Less than High School | 350 (68.0%) | 165 (32.0%) |
| High School Diploma | 2,294 (75.2%) | 756 (24.8%) |
| College/Associate Degree | 6,158 (77.7%) | 1,769 (22.3%) |
| Bachelor's Degree or higher | 13,865 (88.8%) | 1,749 (11.2%) |
Occupancy by Age of Householder in Maple Grove
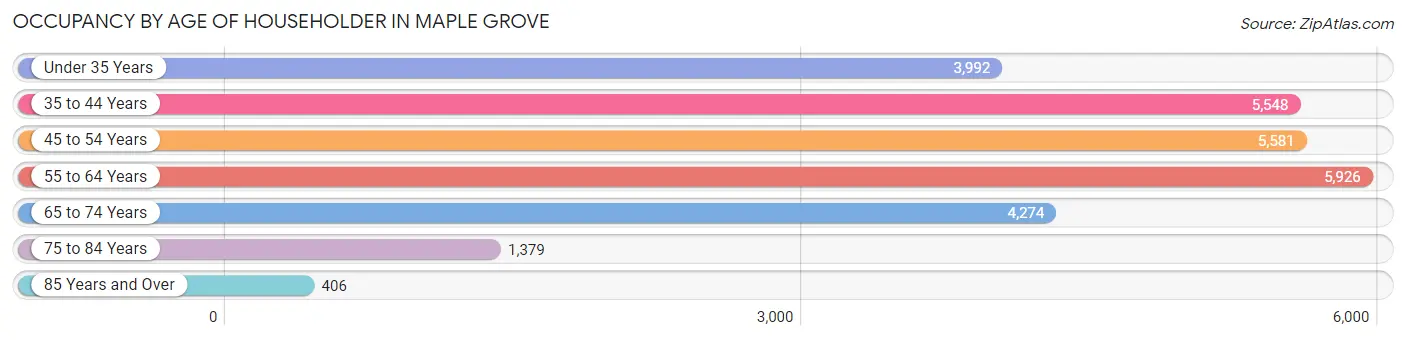
| Age Bracket | # Households | % Households |
| Under 35 Years | 3,992 | 14.7% |
| 35 to 44 Years | 5,548 | 20.5% |
| 45 to 54 Years | 5,581 | 20.6% |
| 55 to 64 Years | 5,926 | 21.9% |
| 65 to 74 Years | 4,274 | 15.8% |
| 75 to 84 Years | 1,379 | 5.1% |
| 85 Years and Over | 406 | 1.5% |
| Total | 27,106 | 100.0% |
Housing Finances in Maple Grove
Median Income by Occupancy in Maple Grove
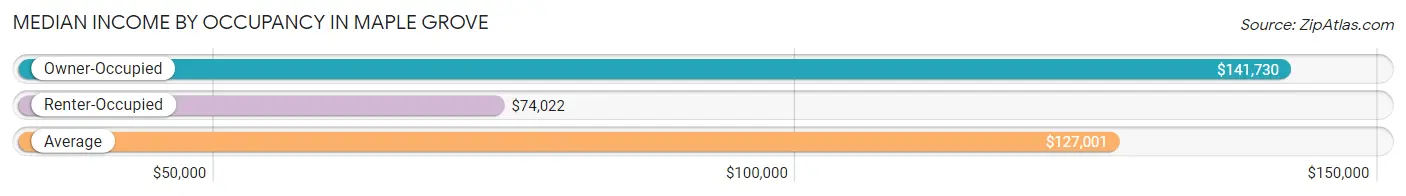
| Occupancy Type | # Households | Median Income |
| Owner-Occupied | 22,667 (83.6%) | $141,730 |
| Renter-Occupied | 4,439 (16.4%) | $74,022 |
| Average | 27,106 (100.0%) | $127,001 |
Occupancy by Householder Income Bracket in Maple Grove
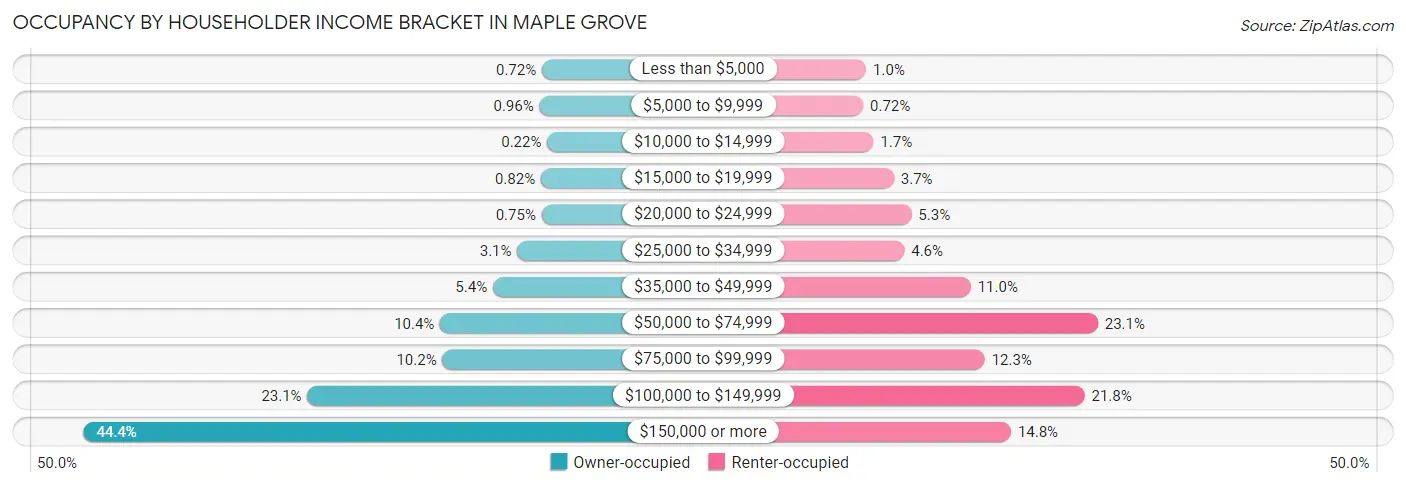
| Income Bracket | Owner-occupied | Renter-occupied |
| Less than $5,000 | 163 (0.7%) | 45 (1.0%) |
| $5,000 to $9,999 | 218 (1.0%) | 32 (0.7%) |
| $10,000 to $14,999 | 50 (0.2%) | 76 (1.7%) |
| $15,000 to $19,999 | 185 (0.8%) | 162 (3.6%) |
| $20,000 to $24,999 | 169 (0.7%) | 236 (5.3%) |
| $25,000 to $34,999 | 696 (3.1%) | 206 (4.6%) |
| $35,000 to $49,999 | 1,222 (5.4%) | 487 (11.0%) |
| $50,000 to $74,999 | 2,361 (10.4%) | 1,024 (23.1%) |
| $75,000 to $99,999 | 2,313 (10.2%) | 546 (12.3%) |
| $100,000 to $149,999 | 5,228 (23.1%) | 968 (21.8%) |
| $150,000 or more | 10,062 (44.4%) | 657 (14.8%) |
| Total | 22,667 (100.0%) | 4,439 (100.0%) |
Monthly Housing Cost Tiers in Maple Grove
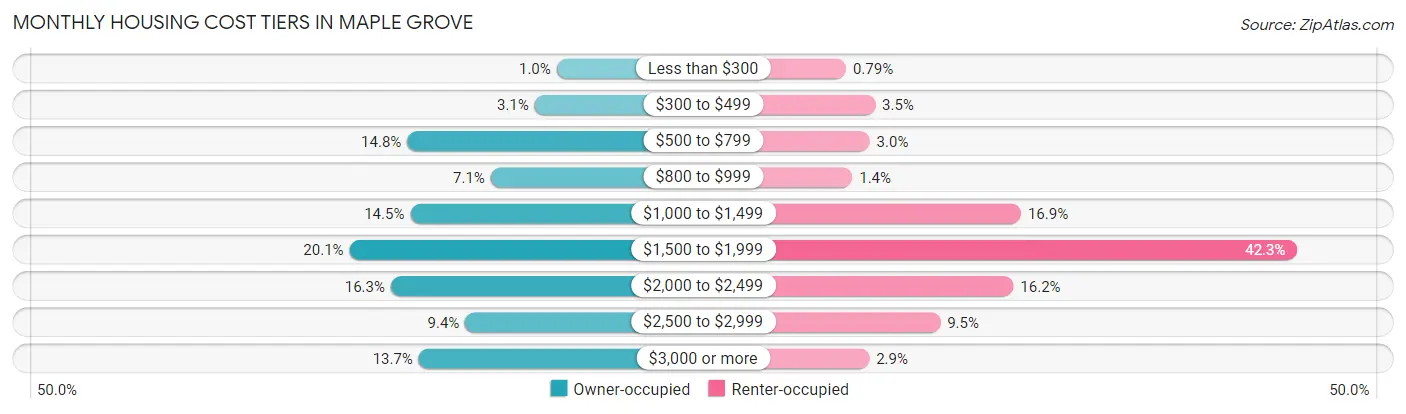
| Monthly Cost | Owner-occupied | Renter-occupied |
| Less than $300 | 232 (1.0%) | 35 (0.8%) |
| $300 to $499 | 692 (3.0%) | 154 (3.5%) |
| $500 to $799 | 3,351 (14.8%) | 132 (3.0%) |
| $800 to $999 | 1,606 (7.1%) | 61 (1.4%) |
| $1,000 to $1,499 | 3,287 (14.5%) | 750 (16.9%) |
| $1,500 to $1,999 | 4,556 (20.1%) | 1,879 (42.3%) |
| $2,000 to $2,499 | 3,693 (16.3%) | 719 (16.2%) |
| $2,500 to $2,999 | 2,140 (9.4%) | 420 (9.5%) |
| $3,000 or more | 3,110 (13.7%) | 130 (2.9%) |
| Total | 22,667 (100.0%) | 4,439 (100.0%) |
Physical Housing Characteristics in Maple Grove
Housing Structures in Maple Grove
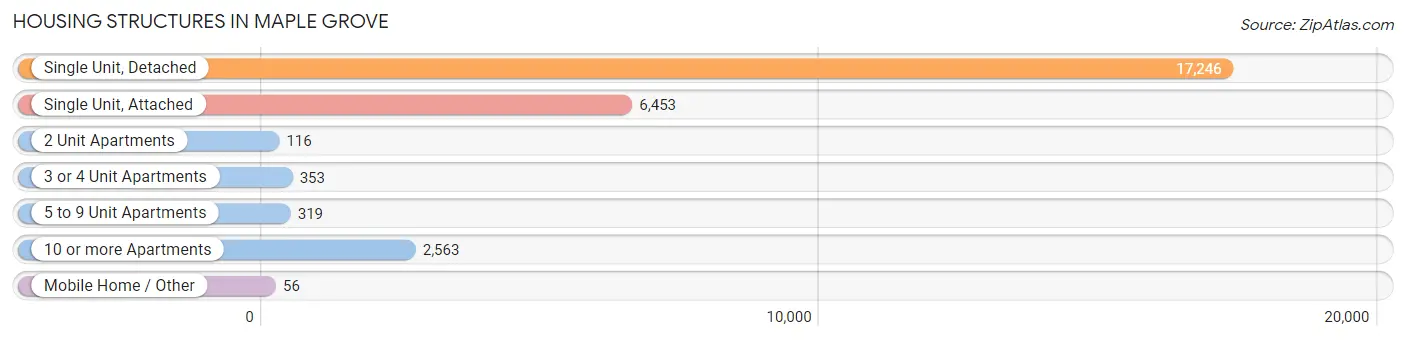
| Structure Type | # Housing Units | % Housing Units |
| Single Unit, Detached | 17,246 | 63.6% |
| Single Unit, Attached | 6,453 | 23.8% |
| 2 Unit Apartments | 116 | 0.4% |
| 3 or 4 Unit Apartments | 353 | 1.3% |
| 5 to 9 Unit Apartments | 319 | 1.2% |
| 10 or more Apartments | 2,563 | 9.5% |
| Mobile Home / Other | 56 | 0.2% |
| Total | 27,106 | 100.0% |
Housing Structures by Occupancy in Maple Grove
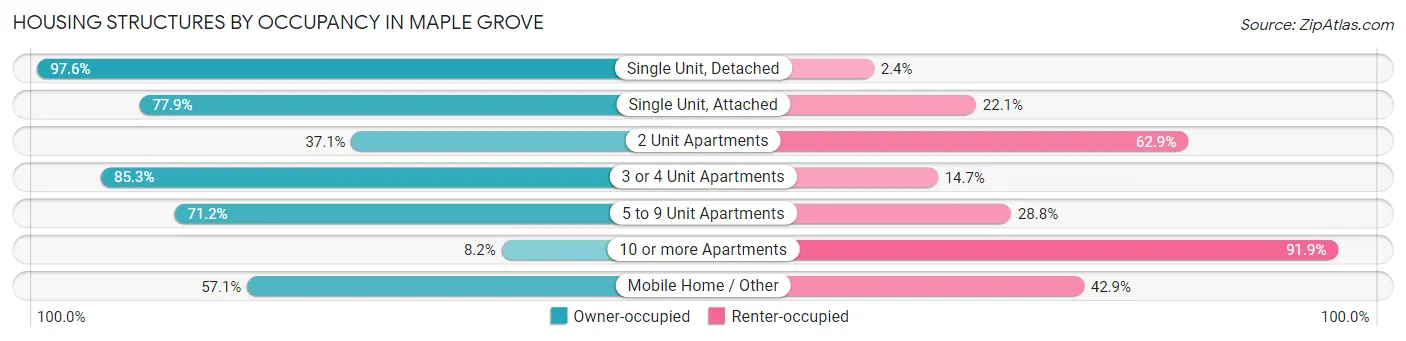
| Structure Type | Owner-occupied | Renter-occupied |
| Single Unit, Detached | 16,827 (97.6%) | 419 (2.4%) |
| Single Unit, Attached | 5,028 (77.9%) | 1,425 (22.1%) |
| 2 Unit Apartments | 43 (37.1%) | 73 (62.9%) |
| 3 or 4 Unit Apartments | 301 (85.3%) | 52 (14.7%) |
| 5 to 9 Unit Apartments | 227 (71.2%) | 92 (28.8%) |
| 10 or more Apartments | 209 (8.2%) | 2,354 (91.8%) |
| Mobile Home / Other | 32 (57.1%) | 24 (42.9%) |
| Total | 22,667 (83.6%) | 4,439 (16.4%) |
Housing Structures by Number of Rooms in Maple Grove
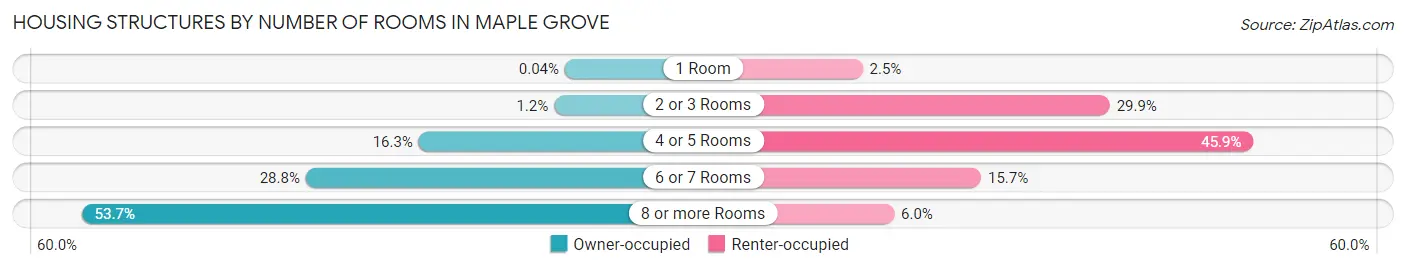
| Number of Rooms | Owner-occupied | Renter-occupied |
| 1 Room | 8 (0.0%) | 112 (2.5%) |
| 2 or 3 Rooms | 282 (1.2%) | 1,329 (29.9%) |
| 4 or 5 Rooms | 3,685 (16.3%) | 2,036 (45.9%) |
| 6 or 7 Rooms | 6,527 (28.8%) | 695 (15.7%) |
| 8 or more Rooms | 12,165 (53.7%) | 267 (6.0%) |
| Total | 22,667 (100.0%) | 4,439 (100.0%) |
Housing Structure by Heating Type in Maple Grove
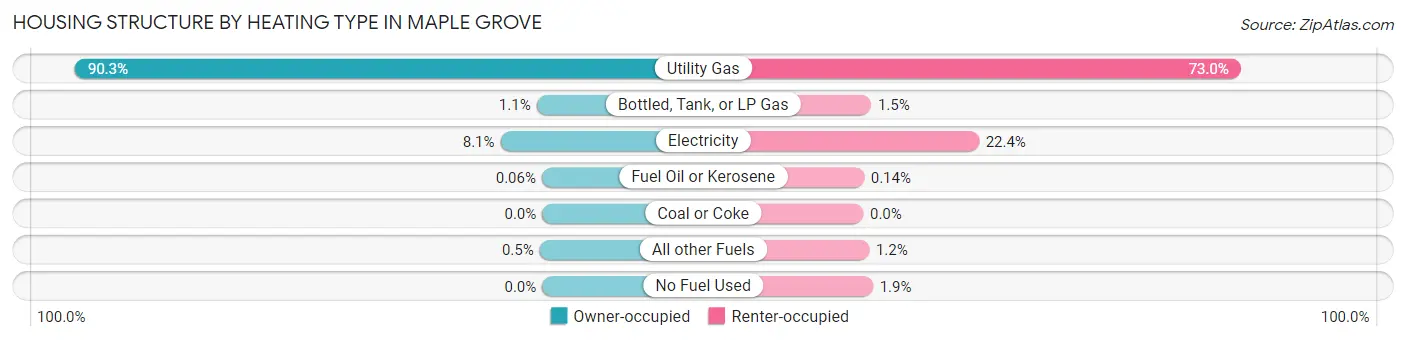
| Heating Type | Owner-occupied | Renter-occupied |
| Utility Gas | 20,469 (90.3%) | 3,239 (73.0%) |
| Bottled, Tank, or LP Gas | 245 (1.1%) | 68 (1.5%) |
| Electricity | 1,826 (8.1%) | 992 (22.4%) |
| Fuel Oil or Kerosene | 13 (0.1%) | 6 (0.1%) |
| Coal or Coke | 0 (0.0%) | 0 (0.0%) |
| All other Fuels | 114 (0.5%) | 51 (1.1%) |
| No Fuel Used | 0 (0.0%) | 83 (1.9%) |
| Total | 22,667 (100.0%) | 4,439 (100.0%) |
Household Vehicle Usage in Maple Grove
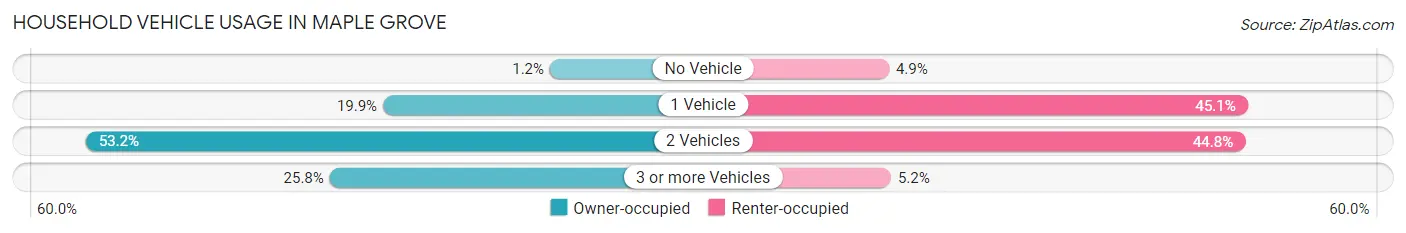
| Vehicles per Household | Owner-occupied | Renter-occupied |
| No Vehicle | 264 (1.2%) | 219 (4.9%) |
| 1 Vehicle | 4,502 (19.9%) | 2,002 (45.1%) |
| 2 Vehicles | 12,047 (53.1%) | 1,989 (44.8%) |
| 3 or more Vehicles | 5,854 (25.8%) | 229 (5.2%) |
| Total | 22,667 (100.0%) | 4,439 (100.0%) |
Real Estate & Mortgages in Maple Grove
Real Estate and Mortgage Overview in Maple Grove
| Characteristic | Without Mortgage | With Mortgage |
| Housing Units | 6,680 | 15,987 |
| Median Property Value | $367,500 | $385,500 |
| Median Household Income | $104,118 | $8,008 |
| Monthly Housing Costs | $734 | $3,110 |
| Real Estate Taxes | $4,158 | $169 |
Property Value by Mortgage Status in Maple Grove
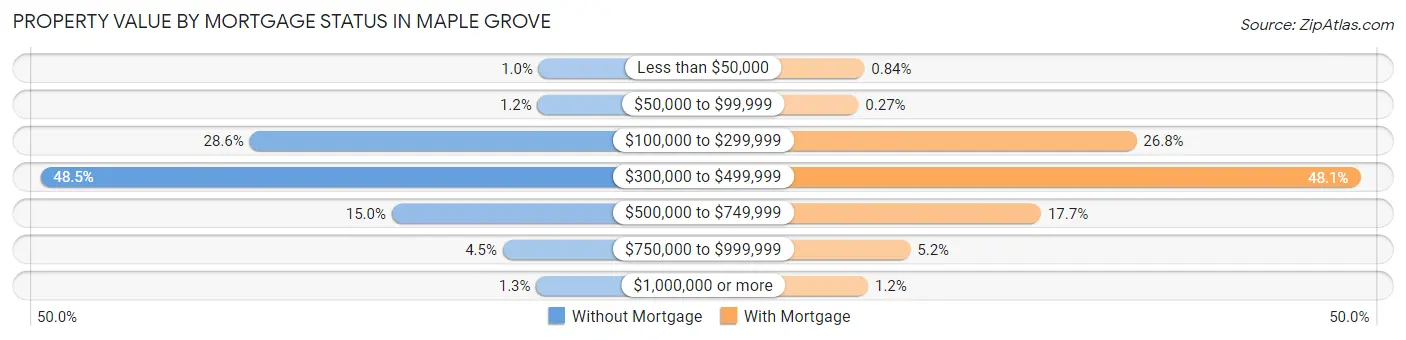
| Property Value | Without Mortgage | With Mortgage |
| Less than $50,000 | 69 (1.0%) | 134 (0.8%) |
| $50,000 to $99,999 | 77 (1.1%) | 43 (0.3%) |
| $100,000 to $299,999 | 1,909 (28.6%) | 4,276 (26.8%) |
| $300,000 to $499,999 | 3,239 (48.5%) | 7,686 (48.1%) |
| $500,000 to $749,999 | 1,004 (15.0%) | 2,823 (17.7%) |
| $750,000 to $999,999 | 298 (4.5%) | 834 (5.2%) |
| $1,000,000 or more | 84 (1.3%) | 191 (1.2%) |
| Total | 6,680 (100.0%) | 15,987 (100.0%) |
Household Income by Mortgage Status in Maple Grove
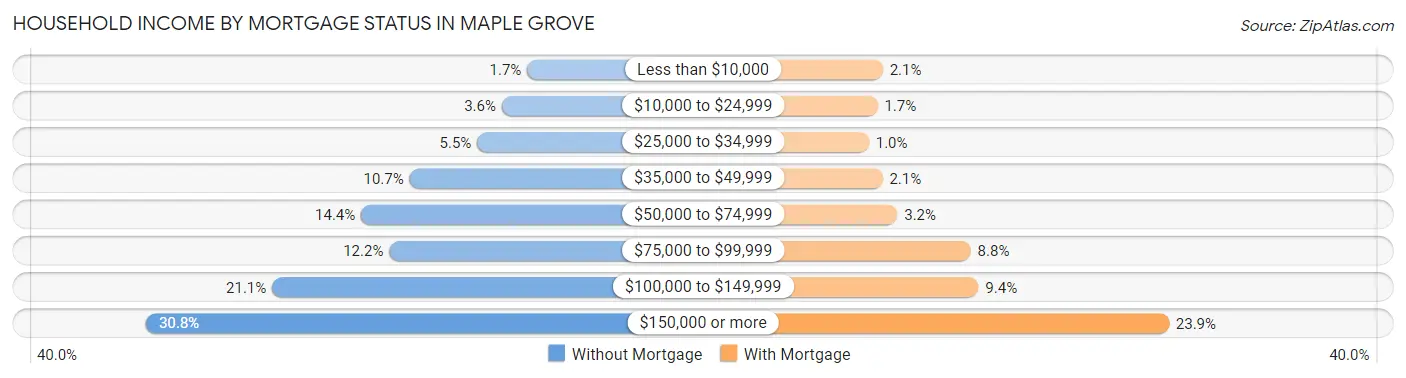
| Household Income | Without Mortgage | With Mortgage |
| Less than $10,000 | 114 (1.7%) | 331 (2.1%) |
| $10,000 to $24,999 | 243 (3.6%) | 267 (1.7%) |
| $25,000 to $34,999 | 369 (5.5%) | 161 (1.0%) |
| $35,000 to $49,999 | 713 (10.7%) | 327 (2.1%) |
| $50,000 to $74,999 | 959 (14.4%) | 509 (3.2%) |
| $75,000 to $99,999 | 816 (12.2%) | 1,402 (8.8%) |
| $100,000 to $149,999 | 1,412 (21.1%) | 1,497 (9.4%) |
| $150,000 or more | 2,054 (30.7%) | 3,816 (23.9%) |
| Total | 6,680 (100.0%) | 15,987 (100.0%) |
Property Value to Household Income Ratio in Maple Grove
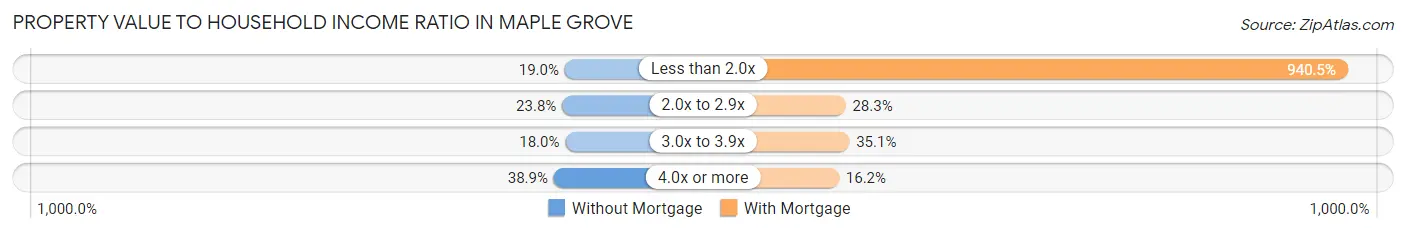
| Value-to-Income Ratio | Without Mortgage | With Mortgage |
| Less than 2.0x | 1,266 (19.0%) | 150,352 (940.5%) |
| 2.0x to 2.9x | 1,587 (23.8%) | 4,523 (28.3%) |
| 3.0x to 3.9x | 1,199 (17.9%) | 5,612 (35.1%) |
| 4.0x or more | 2,596 (38.9%) | 2,594 (16.2%) |
| Total | 6,680 (100.0%) | 15,987 (100.0%) |
Real Estate Taxes by Mortgage Status in Maple Grove
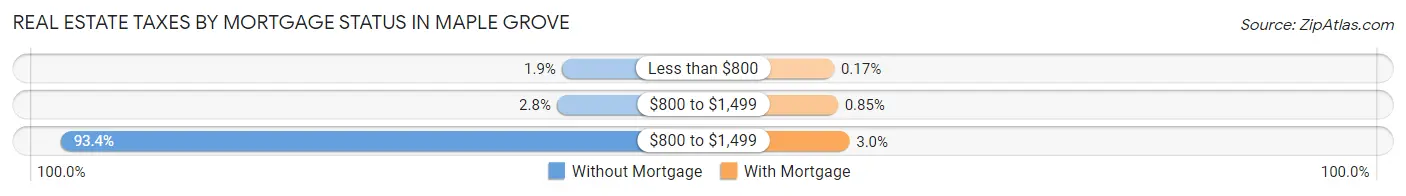
| Property Taxes | Without Mortgage | With Mortgage |
| Less than $800 | 127 (1.9%) | 27 (0.2%) |
| $800 to $1,499 | 188 (2.8%) | 136 (0.9%) |
| $800 to $1,499 | 6,239 (93.4%) | 475 (3.0%) |
| Total | 6,680 (100.0%) | 15,987 (100.0%) |
Health & Disability in Maple Grove
Health Insurance Coverage by Age in Maple Grove
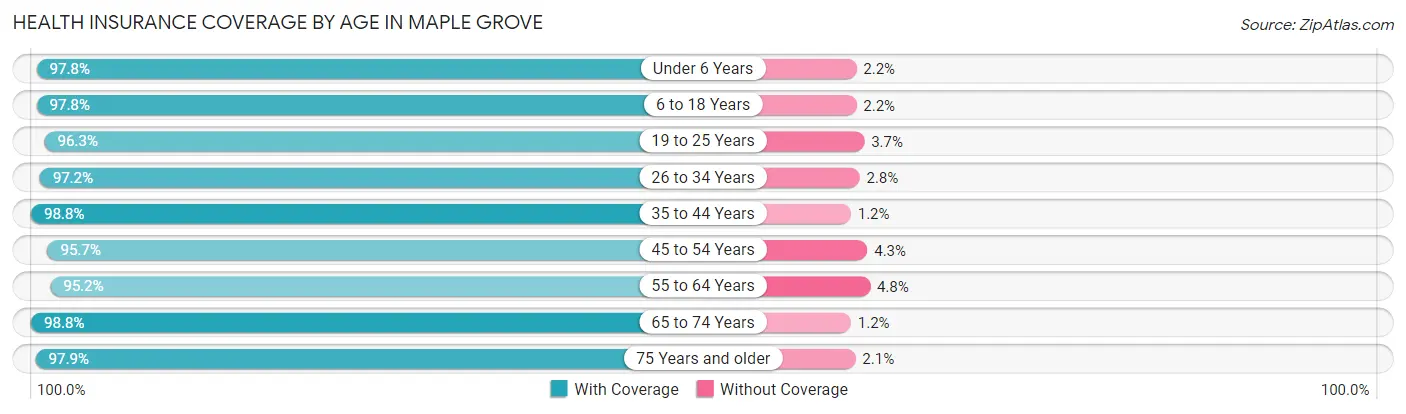
| Age Bracket | With Coverage | Without Coverage |
| Under 6 Years | 4,269 (97.8%) | 98 (2.2%) |
| 6 to 18 Years | 13,277 (97.8%) | 304 (2.2%) |
| 19 to 25 Years | 3,576 (96.3%) | 138 (3.7%) |
| 26 to 34 Years | 7,567 (97.2%) | 221 (2.8%) |
| 35 to 44 Years | 10,335 (98.8%) | 127 (1.2%) |
| 45 to 54 Years | 9,585 (95.7%) | 430 (4.3%) |
| 55 to 64 Years | 9,888 (95.2%) | 497 (4.8%) |
| 65 to 74 Years | 6,728 (98.8%) | 83 (1.2%) |
| 75 Years and older | 2,842 (97.9%) | 60 (2.1%) |
| Total | 68,067 (97.2%) | 1,958 (2.8%) |
Health Insurance Coverage by Citizenship Status in Maple Grove
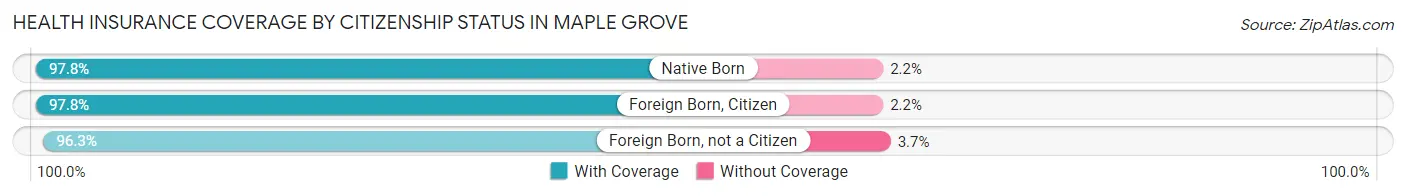
| Citizenship Status | With Coverage | Without Coverage |
| Native Born | 4,269 (97.8%) | 98 (2.2%) |
| Foreign Born, Citizen | 13,277 (97.8%) | 304 (2.2%) |
| Foreign Born, not a Citizen | 3,576 (96.3%) | 138 (3.7%) |
Health Insurance Coverage by Household Income in Maple Grove
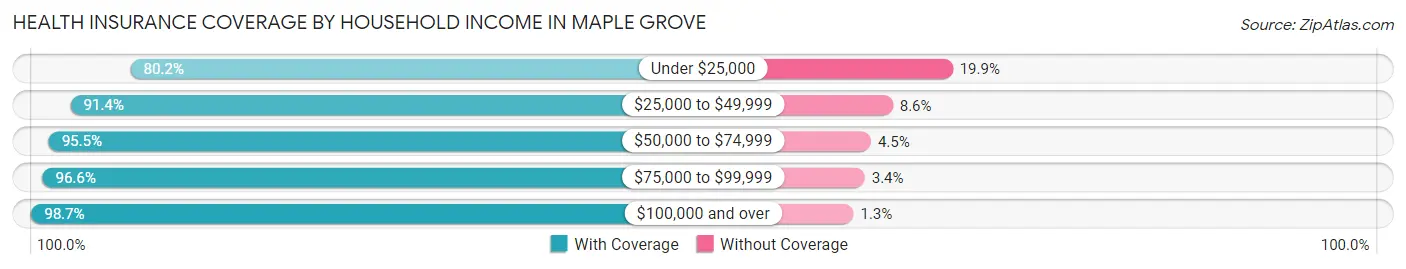
| Household Income | With Coverage | Without Coverage |
| Under $25,000 | 1,688 (80.1%) | 418 (19.9%) |
| $25,000 to $49,999 | 4,189 (91.4%) | 395 (8.6%) |
| $50,000 to $74,999 | 6,530 (95.5%) | 310 (4.5%) |
| $75,000 to $99,999 | 5,708 (96.6%) | 199 (3.4%) |
| $100,000 and over | 49,888 (98.7%) | 636 (1.3%) |
Public vs Private Health Insurance Coverage by Age in Maple Grove
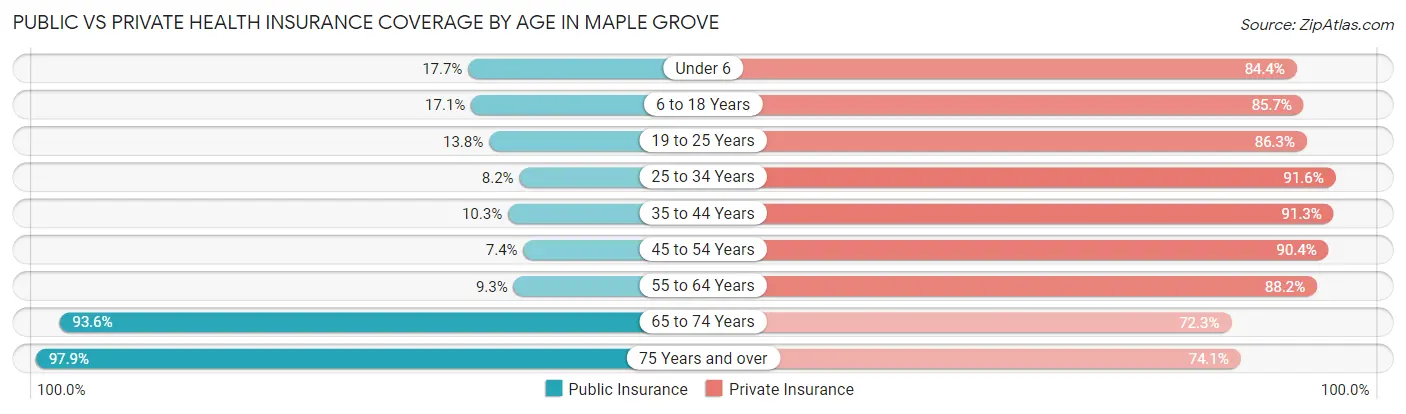
| Age Bracket | Public Insurance | Private Insurance |
| Under 6 | 771 (17.7%) | 3,687 (84.4%) |
| 6 to 18 Years | 2,324 (17.1%) | 11,643 (85.7%) |
| 19 to 25 Years | 512 (13.8%) | 3,205 (86.3%) |
| 25 to 34 Years | 635 (8.2%) | 7,137 (91.6%) |
| 35 to 44 Years | 1,075 (10.3%) | 9,550 (91.3%) |
| 45 to 54 Years | 742 (7.4%) | 9,050 (90.4%) |
| 55 to 64 Years | 961 (9.2%) | 9,162 (88.2%) |
| 65 to 74 Years | 6,372 (93.5%) | 4,923 (72.3%) |
| 75 Years and over | 2,842 (97.9%) | 2,149 (74.1%) |
| Total | 16,234 (23.2%) | 60,506 (86.4%) |
Disability Status by Sex by Age in Maple Grove
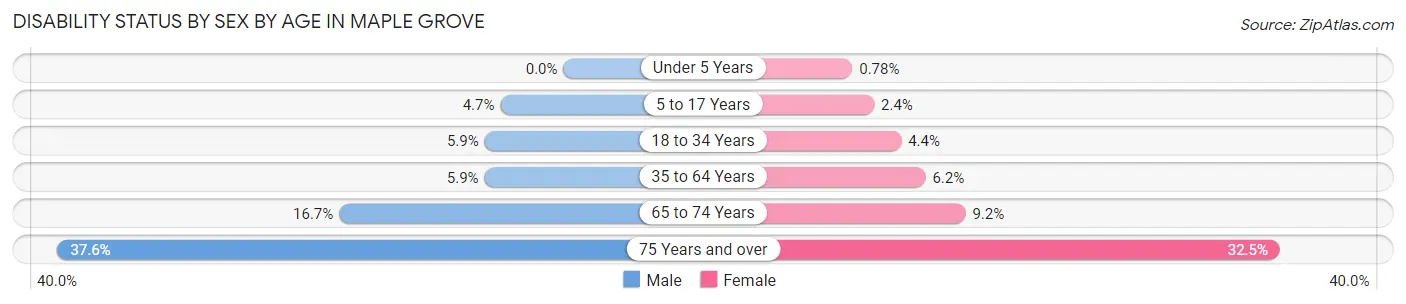
| Age Bracket | Male | Female |
| Under 5 Years | 0 (0.0%) | 14 (0.8%) |
| 5 to 17 Years | 310 (4.7%) | 165 (2.4%) |
| 18 to 34 Years | 387 (5.9%) | 252 (4.4%) |
| 35 to 64 Years | 859 (5.9%) | 1,007 (6.2%) |
| 65 to 74 Years | 519 (16.7%) | 339 (9.2%) |
| 75 Years and over | 471 (37.6%) | 536 (32.5%) |
Disability Class by Sex by Age in Maple Grove
Disability Class: Hearing Difficulty
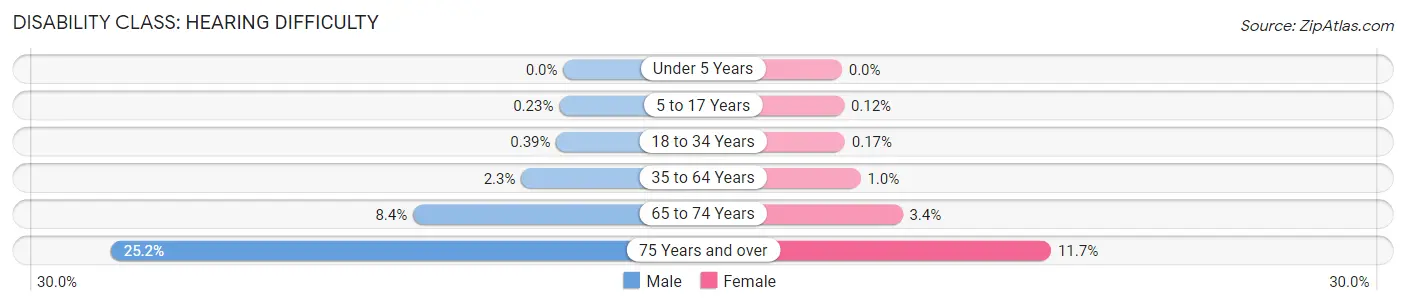
| Age Bracket | Male | Female |
| Under 5 Years | 0 (0.0%) | 0 (0.0%) |
| 5 to 17 Years | 15 (0.2%) | 8 (0.1%) |
| 18 to 34 Years | 26 (0.4%) | 10 (0.2%) |
| 35 to 64 Years | 343 (2.3%) | 168 (1.0%) |
| 65 to 74 Years | 261 (8.4%) | 125 (3.4%) |
| 75 Years and over | 316 (25.2%) | 192 (11.7%) |
Disability Class: Vision Difficulty
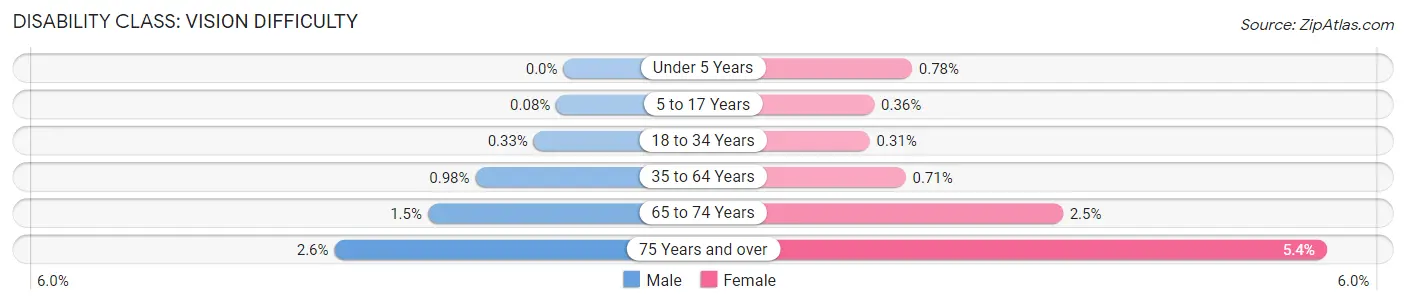
| Age Bracket | Male | Female |
| Under 5 Years | 0 (0.0%) | 14 (0.8%) |
| 5 to 17 Years | 5 (0.1%) | 25 (0.4%) |
| 18 to 34 Years | 22 (0.3%) | 18 (0.3%) |
| 35 to 64 Years | 143 (1.0%) | 115 (0.7%) |
| 65 to 74 Years | 47 (1.5%) | 91 (2.5%) |
| 75 Years and over | 32 (2.5%) | 89 (5.4%) |
Disability Class: Cognitive Difficulty
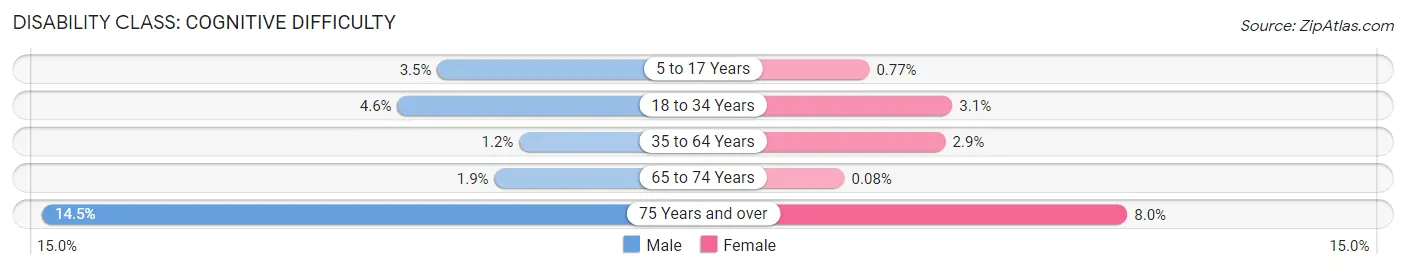
| Age Bracket | Male | Female |
| 5 to 17 Years | 233 (3.5%) | 53 (0.8%) |
| 18 to 34 Years | 306 (4.6%) | 176 (3.1%) |
| 35 to 64 Years | 180 (1.2%) | 469 (2.9%) |
| 65 to 74 Years | 60 (1.9%) | 3 (0.1%) |
| 75 Years and over | 182 (14.5%) | 131 (8.0%) |
Disability Class: Ambulatory Difficulty
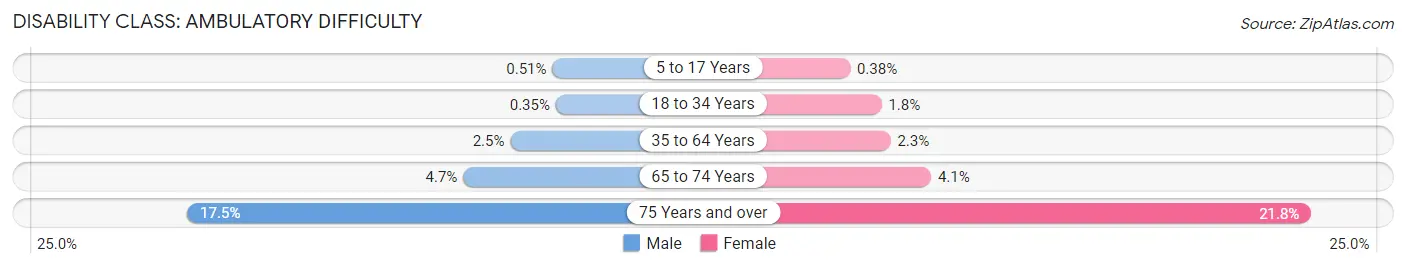
| Age Bracket | Male | Female |
| 5 to 17 Years | 34 (0.5%) | 26 (0.4%) |
| 18 to 34 Years | 23 (0.4%) | 105 (1.8%) |
| 35 to 64 Years | 360 (2.5%) | 366 (2.3%) |
| 65 to 74 Years | 145 (4.6%) | 153 (4.1%) |
| 75 Years and over | 219 (17.5%) | 359 (21.8%) |
Disability Class: Self-Care Difficulty
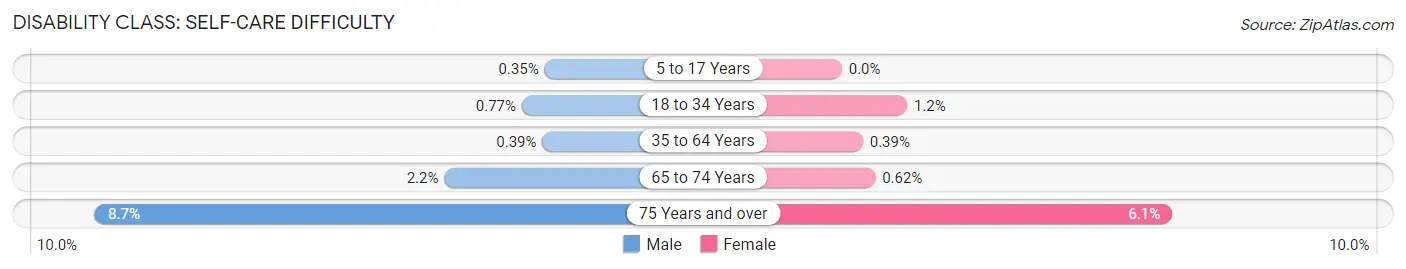
| Age Bracket | Male | Female |
| 5 to 17 Years | 23 (0.4%) | 0 (0.0%) |
| 18 to 34 Years | 51 (0.8%) | 69 (1.2%) |
| 35 to 64 Years | 57 (0.4%) | 64 (0.4%) |
| 65 to 74 Years | 69 (2.2%) | 23 (0.6%) |
| 75 Years and over | 109 (8.7%) | 101 (6.1%) |
Technology Access in Maple Grove
Computing Device Access in Maple Grove
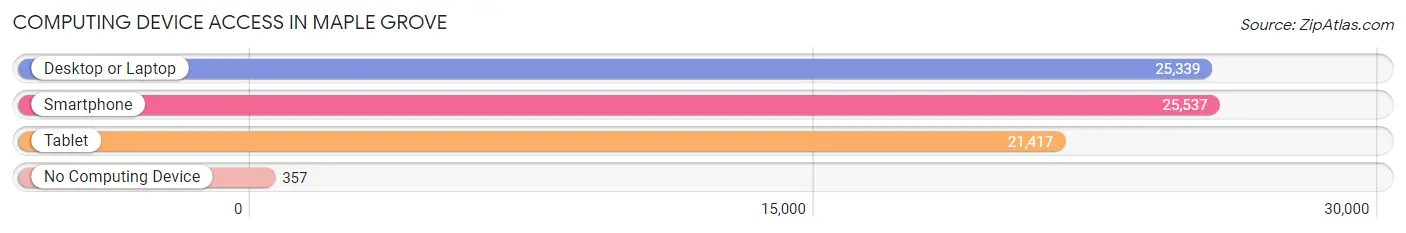
| Device Type | # Households | % Households |
| Desktop or Laptop | 25,339 | 93.5% |
| Smartphone | 25,537 | 94.2% |
| Tablet | 21,417 | 79.0% |
| No Computing Device | 357 | 1.3% |
| Total | 27,106 | 100.0% |
Internet Access in Maple Grove
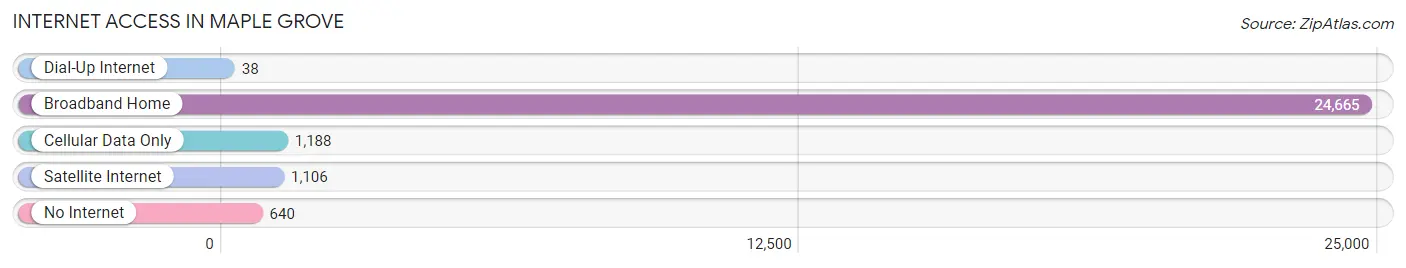
| Internet Type | # Households | % Households |
| Dial-Up Internet | 38 | 0.1% |
| Broadband Home | 24,665 | 91.0% |
| Cellular Data Only | 1,188 | 4.4% |
| Satellite Internet | 1,106 | 4.1% |
| No Internet | 640 | 2.4% |
| Total | 27,106 | 100.0% |
Maple Grove Summary
Maple Grove, Minnesota is a city located in Hennepin County, Minnesota, United States. The population was 61,567 at the 2010 census. It is the 12th largest city in Minnesota and the largest in Hennepin County.
History
Maple Grove was first settled in 1851 by a group of settlers from New England. The settlers were attracted to the area by the abundance of maple trees, which gave the town its name. The town was officially incorporated in 1954.
Geography
Maple Grove is located in the northwest corner of Hennepin County, Minnesota. It is bordered by the cities of Osseo to the north, Brooklyn Park to the east, Plymouth to the south, and Dayton to the west. The city is located on the west bank of the Mississippi River, and is part of the Twin Cities metropolitan area.
The city has a total area of 33.2 square miles, of which 32.9 square miles is land and 0.3 square miles is water. The terrain is mostly flat, with some rolling hills in the northern and western parts of the city.
Economy
Maple Grove is home to a variety of businesses, including retail, manufacturing, and technology. The city is home to the headquarters of several large companies, including Target Corporation, SuperValu, and Pentair.
The city is also home to several shopping centers, including the Shoppes at Arbor Lakes, Maple Grove Marketplace, and the Grove Shopping Center.
Demographics
As of the 2010 census, there were 61,567 people, 22,945 households, and 17,845 families residing in the city. The population density was 1,867.2 people per square mile. The racial makeup of the city was 84.2% White, 5.3% African American, 0.3% Native American, 6.2% Asian, 0.1% Pacific Islander, 1.7% from other races, and 2.3% from two or more races. Hispanic or Latino of any race were 4.2% of the population.
The median income for a household in the city was $76,837, and the median income for a family was $90,945. The per capita income for the city was $35,945. About 2.7% of families and 3.9% of the population were below the poverty line, including 4.3% of those under age 18 and 4.2% of those age 65 or over.
Conclusion
Maple Grove, Minnesota is a city located in Hennepin County, Minnesota, United States. The city has a population of 61,567 and is the 12th largest city in Minnesota. The city was first settled in 1851 by a group of settlers from New England and was officially incorporated in 1954. The city is located on the west bank of the Mississippi River and is part of the Twin Cities metropolitan area. The city is home to a variety of businesses, including retail, manufacturing, and technology. The median income for a household in the city was $76,837, and the median income for a family was $90,945. The racial makeup of the city was 84.2% White, 5.3% African American, 0.3% Native American, 6.2% Asian, 0.1% Pacific Islander, 1.7% from other races, and 2.3% from two or more races.
Common Questions
What is Per Capita Income in Maple Grove?
Per Capita income in Maple Grove is $60,824.
What is the Median Family Income in Maple Grove?
Median Family Income in Maple Grove is $153,056.
What is the Median Household income in Maple Grove?
Median Household Income in Maple Grove is $127,001.
What is Income or Wage Gap in Maple Grove?
Income or Wage Gap in Maple Grove is 26.6%.
Women in Maple Grove earn 73.4 cents for every dollar earned by a man.
What is Family Income Deficit in Maple Grove?
Family Income Deficit in Maple Grove is $9,258.
Families that are below poverty line in Maple Grove earn $9,258 less on average than the poverty threshold level.
What is Inequality or Gini Index in Maple Grove?
Inequality or Gini Index in Maple Grove is 0.41.
What is the Total Population of Maple Grove?
Total Population of Maple Grove is 70,110.
What is the Total Male Population of Maple Grove?
Total Male Population of Maple Grove is 34,171.
What is the Total Female Population of Maple Grove?
Total Female Population of Maple Grove is 35,939.
What is the Ratio of Males per 100 Females in Maple Grove?
There are 95.08 Males per 100 Females in Maple Grove.
What is the Ratio of Females per 100 Males in Maple Grove?
There are 105.17 Females per 100 Males in Maple Grove.
What is the Median Population Age in Maple Grove?
Median Population Age in Maple Grove is 40.6 Years.
What is the Average Family Size in Maple Grove
Average Family Size in Maple Grove is 3.1 People.
What is the Average Household Size in Maple Grove
Average Household Size in Maple Grove is 2.6 People.
How Large is the Labor Force in Maple Grove?
There are 40,684 People in the Labor Forcein in Maple Grove.
What is the Percentage of People in the Labor Force in Maple Grove?
73.5% of People are in the Labor Force in Maple Grove.
What is the Unemployment Rate in Maple Grove?
Unemployment Rate in Maple Grove is 4.0%.