Bloomington, MN Map & Demographics
Bloomington Map
Bloomington Overview
$47,791
PER CAPITA INCOME
$106,708
AVG FAMILY INCOME
$87,381
AVG HOUSEHOLD INCOME
21.3%
WAGE / INCOME GAP [ % ]
78.7¢/ $1
WAGE / INCOME GAP [ $ ]
$8,323
FAMILY INCOME DEFICIT
0.42
INEQUALITY / GINI INDEX
89,244
TOTAL POPULATION
43,582
MALE POPULATION
45,662
FEMALE POPULATION
95.44
MALES / 100 FEMALES
104.77
FEMALES / 100 MALES
41.8
MEDIAN AGE
3.0
AVG FAMILY SIZE
2.3
AVG HOUSEHOLD SIZE
50,923
LABOR FORCE [ PEOPLE ]
68.9%
PERCENT IN LABOR FORCE
4.4%
UNEMPLOYMENT RATE
Income in Bloomington
Income Overview in Bloomington
Per Capita Income in Bloomington is $47,791, while median incomes of families and households are $106,708 and $87,381 respectively.
| Characteristic | Number | Measure |
| Per Capita Income | 89,244 | $47,791 |
| Median Family Income | 22,616 | $106,708 |
| Mean Family Income | 22,616 | $132,321 |
| Median Household Income | 37,653 | $87,381 |
| Mean Household Income | 37,653 | $110,574 |
| Income Deficit | 22,616 | $8,323 |
| Wage / Income Gap (%) | 89,244 | 21.34% |
| Wage / Income Gap ($) | 89,244 | 78.66¢ per $1 |
| Gini / Inequality Index | 89,244 | 0.42 |
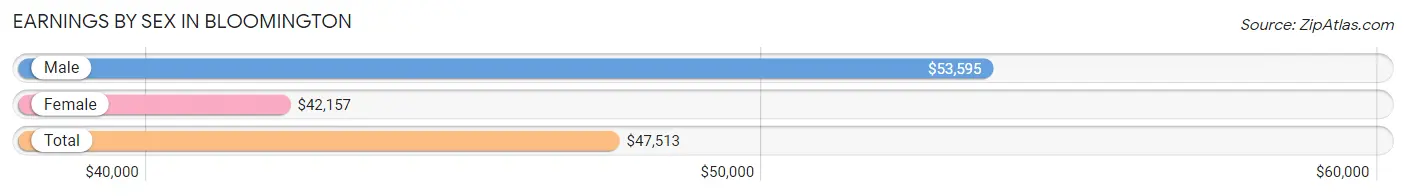
Earnings by Sex in Bloomington
Average Earnings in Bloomington are $47,513, $53,595 for men and $42,157 for women, a difference of 21.3%.
| Sex | Number | Average Earnings |
| Male | 27,746 (52.4%) | $53,595 |
| Female | 25,165 (47.6%) | $42,157 |
| Total | 52,911 (100.0%) | $47,513 |
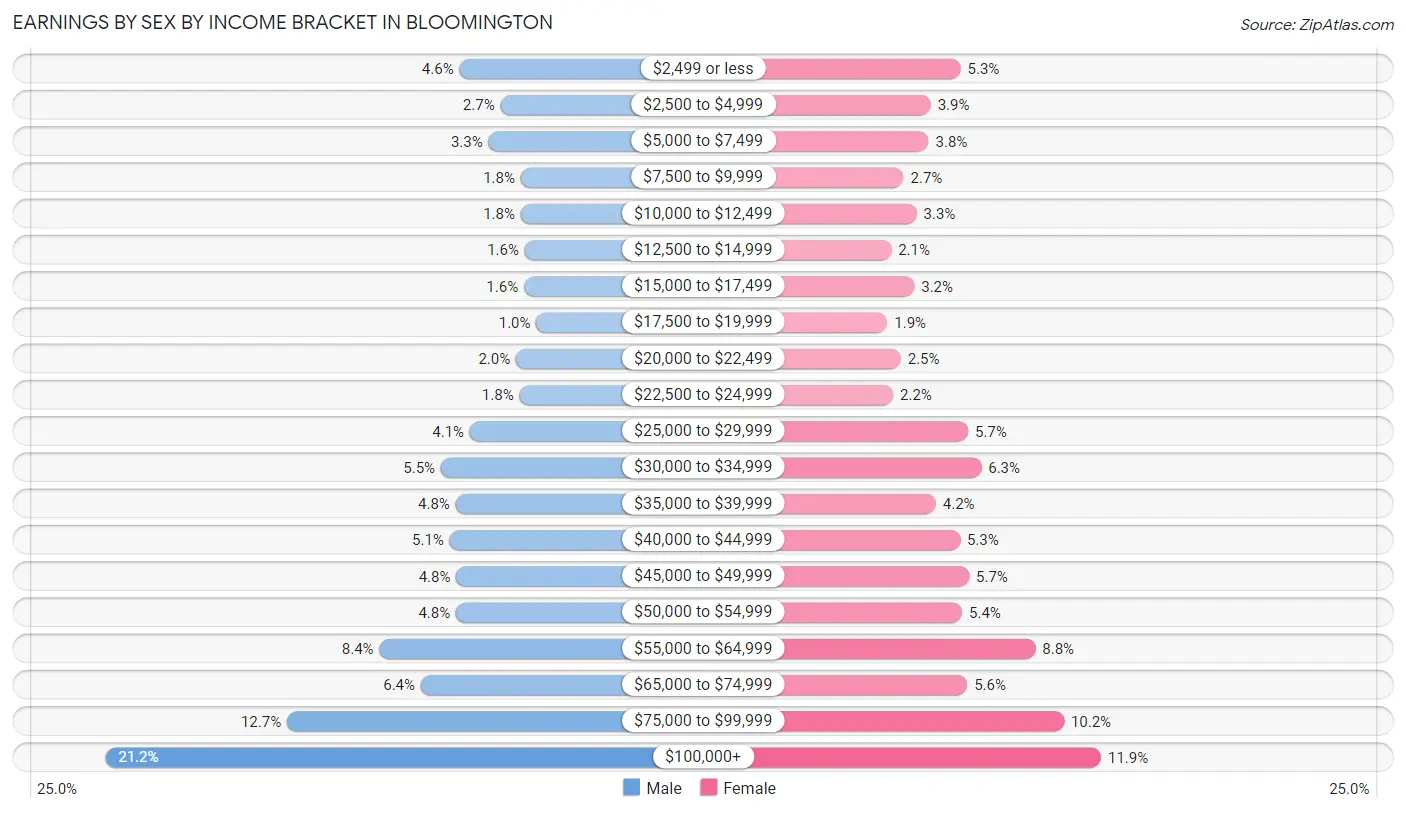
Earnings by Sex by Income Bracket in Bloomington
The most common earnings brackets in Bloomington are $100,000+ for men (5,887 | 21.2%) and $100,000+ for women (2,998 | 11.9%).
| Income | Male | Female |
| $2,499 or less | 1,286 (4.6%) | 1,342 (5.3%) |
| $2,500 to $4,999 | 753 (2.7%) | 988 (3.9%) |
| $5,000 to $7,499 | 908 (3.3%) | 965 (3.8%) |
| $7,500 to $9,999 | 489 (1.8%) | 669 (2.7%) |
| $10,000 to $12,499 | 487 (1.8%) | 823 (3.3%) |
| $12,500 to $14,999 | 435 (1.6%) | 523 (2.1%) |
| $15,000 to $17,499 | 447 (1.6%) | 796 (3.2%) |
| $17,500 to $19,999 | 287 (1.0%) | 477 (1.9%) |
| $20,000 to $22,499 | 550 (2.0%) | 637 (2.5%) |
| $22,500 to $24,999 | 506 (1.8%) | 546 (2.2%) |
| $25,000 to $29,999 | 1,150 (4.1%) | 1,430 (5.7%) |
| $30,000 to $34,999 | 1,526 (5.5%) | 1,585 (6.3%) |
| $35,000 to $39,999 | 1,334 (4.8%) | 1,050 (4.2%) |
| $40,000 to $44,999 | 1,411 (5.1%) | 1,333 (5.3%) |
| $45,000 to $49,999 | 1,325 (4.8%) | 1,442 (5.7%) |
| $50,000 to $54,999 | 1,328 (4.8%) | 1,359 (5.4%) |
| $55,000 to $64,999 | 2,324 (8.4%) | 2,223 (8.8%) |
| $65,000 to $74,999 | 1,787 (6.4%) | 1,420 (5.6%) |
| $75,000 to $99,999 | 3,526 (12.7%) | 2,559 (10.2%) |
| $100,000+ | 5,887 (21.2%) | 2,998 (11.9%) |
| Total | 27,746 (100.0%) | 25,165 (100.0%) |
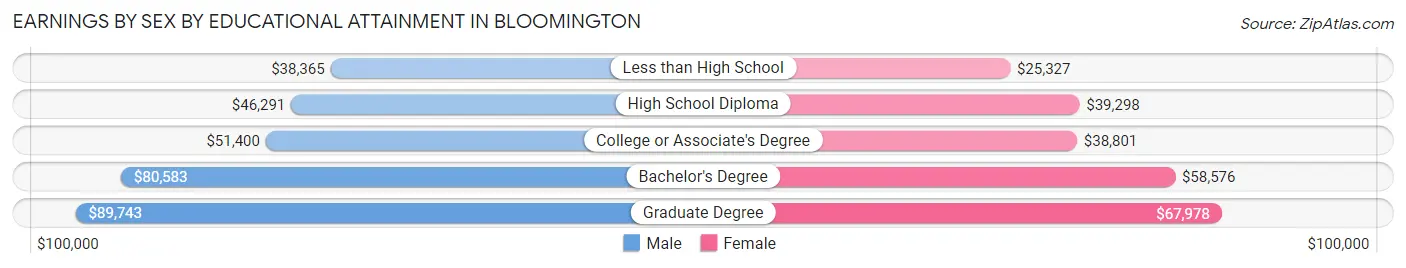
Earnings by Sex by Educational Attainment in Bloomington
Average earnings in Bloomington are $59,382 for men and $46,893 for women, a difference of 21.0%. Men with an educational attainment of graduate degree enjoy the highest average annual earnings of $89,743, while those with less than high school education earn the least with $38,365. Women with an educational attainment of graduate degree earn the most with the average annual earnings of $67,978, while those with less than high school education have the smallest earnings of $25,327.
| Educational Attainment | Male Income | Female Income |
| Less than High School | $38,365 | $25,327 |
| High School Diploma | $46,291 | $39,298 |
| College or Associate's Degree | $51,400 | $38,801 |
| Bachelor's Degree | $80,583 | $58,576 |
| Graduate Degree | $89,743 | $67,978 |
| Total | $59,382 | $46,893 |
Family Income in Bloomington
Family Income Brackets in Bloomington
According to the Bloomington family income data, there are 5,315 families falling into the $100,000 to $149,999 income range, which is the most common income bracket and makes up 23.5% of all families. Conversely, the $10,000 to $14,999 income bracket is the least frequent group with only 181 families (0.8%) belonging to this category.
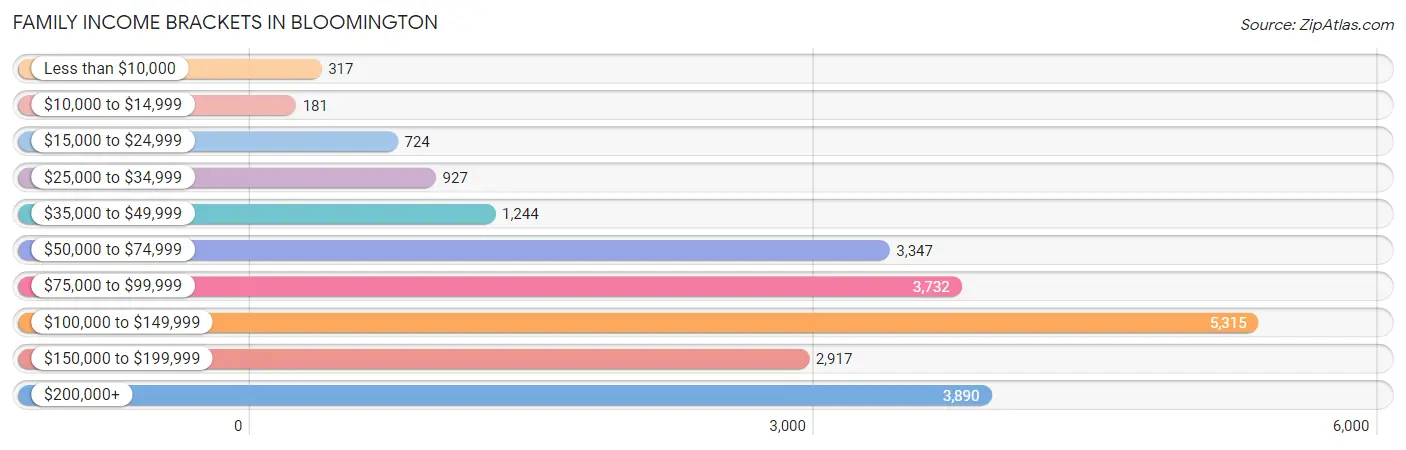
| Income Bracket | # Families | % Families |
| Less than $10,000 | 317 | 1.4% |
| $10,000 to $14,999 | 181 | 0.8% |
| $15,000 to $24,999 | 724 | 3.2% |
| $25,000 to $34,999 | 927 | 4.1% |
| $35,000 to $49,999 | 1,244 | 5.5% |
| $50,000 to $74,999 | 3,347 | 14.8% |
| $75,000 to $99,999 | 3,732 | 16.5% |
| $100,000 to $149,999 | 5,315 | 23.5% |
| $150,000 to $199,999 | 2,917 | 12.9% |
| $200,000+ | 3,890 | 17.2% |
Family Income by Famaliy Size in Bloomington
6-person families (384 | 1.7%) account for the highest median family income in Bloomington with $183,750 per family, while 2-person families (12,108 | 53.5%) have the highest median income of $48,242 per family member.
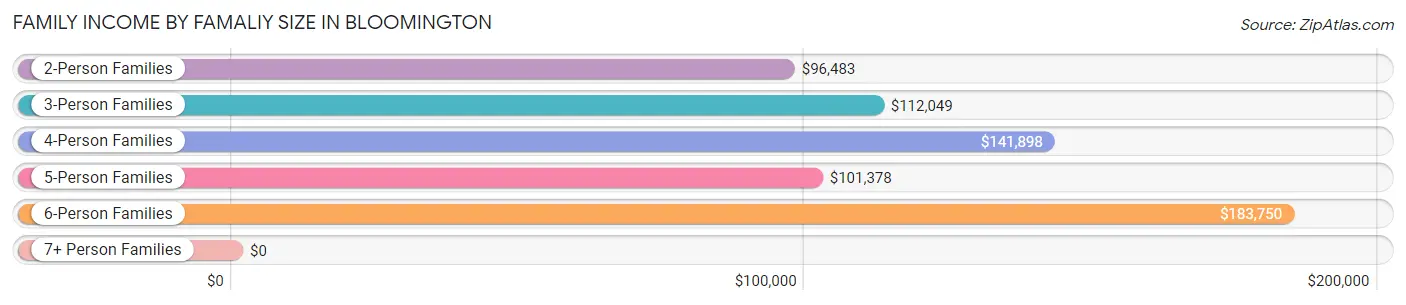
| Income Bracket | # Families | Median Income |
| 2-Person Families | 12,108 (53.5%) | $96,483 |
| 3-Person Families | 4,458 (19.7%) | $112,049 |
| 4-Person Families | 3,452 (15.3%) | $141,898 |
| 5-Person Families | 1,985 (8.8%) | $101,378 |
| 6-Person Families | 384 (1.7%) | $183,750 |
| 7+ Person Families | 229 (1.0%) | $0 |
| Total | 22,616 (100.0%) | $106,708 |
Family Income by Number of Earners in Bloomington
The median family income in Bloomington is $106,708, with families comprising 3+ earners (2,969) having the highest median family income of $160,865, while families with 1 earner (6,028) have the lowest median family income of $74,475, accounting for 13.1% and 26.7% of families, respectively.
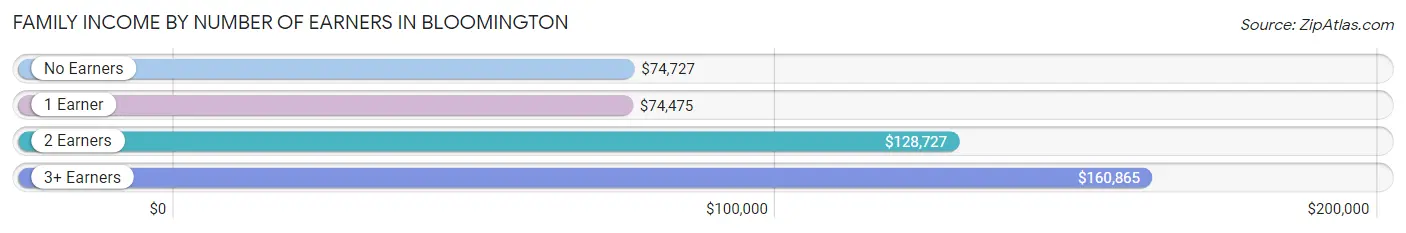
| Number of Earners | # Families | Median Income |
| No Earners | 3,107 (13.7%) | $74,727 |
| 1 Earner | 6,028 (26.7%) | $74,475 |
| 2 Earners | 10,512 (46.5%) | $128,727 |
| 3+ Earners | 2,969 (13.1%) | $160,865 |
| Total | 22,616 (100.0%) | $106,708 |
Household Income in Bloomington
Household Income Brackets in Bloomington
With 7,794 households falling in the category, the $100,000 to $149,999 income range is the most frequent in Bloomington, accounting for 20.7% of all households. In contrast, only 828 households (2.2%) fall into the $10,000 to $14,999 income bracket, making it the least populous group.
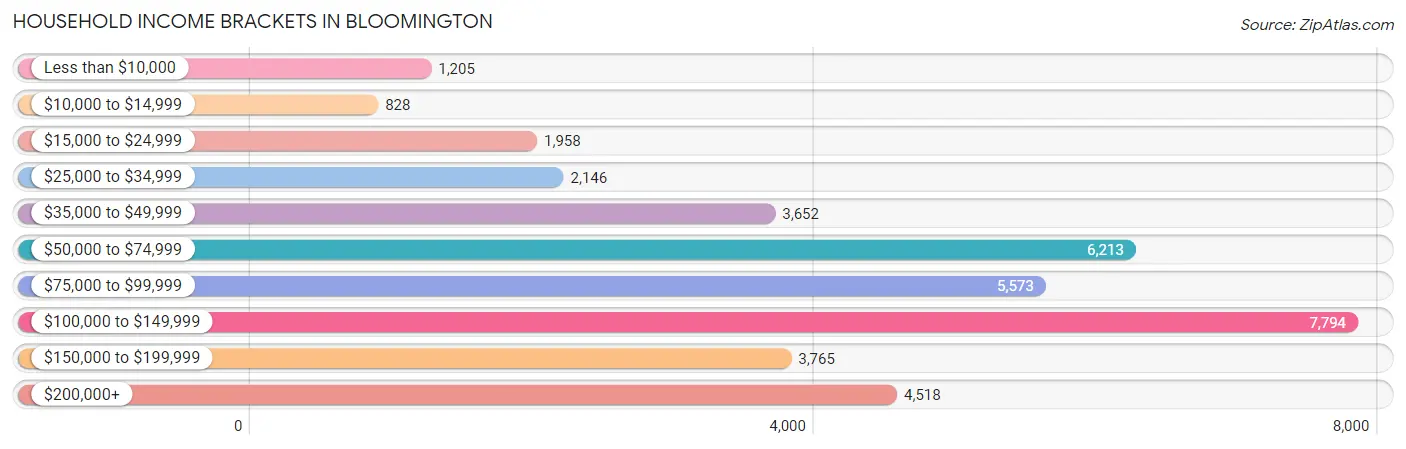
| Income Bracket | # Households | % Households |
| Less than $10,000 | 1,205 | 3.2% |
| $10,000 to $14,999 | 828 | 2.2% |
| $15,000 to $24,999 | 1,958 | 5.2% |
| $25,000 to $34,999 | 2,146 | 5.7% |
| $35,000 to $49,999 | 3,652 | 9.7% |
| $50,000 to $74,999 | 6,213 | 16.5% |
| $75,000 to $99,999 | 5,573 | 14.8% |
| $100,000 to $149,999 | 7,794 | 20.7% |
| $150,000 to $199,999 | 3,765 | 10.0% |
| $200,000+ | 4,518 | 12.0% |
Household Income by Householder Age in Bloomington
The median household income in Bloomington is $87,381, with the highest median household income of $105,495 found in the 45 to 64 years age bracket for the primary householder. A total of 13,325 households (35.4%) fall into this category. Meanwhile, the 15 to 24 years age bracket for the primary householder has the lowest median household income of $57,407, with 1,288 households (3.4%) in this group.
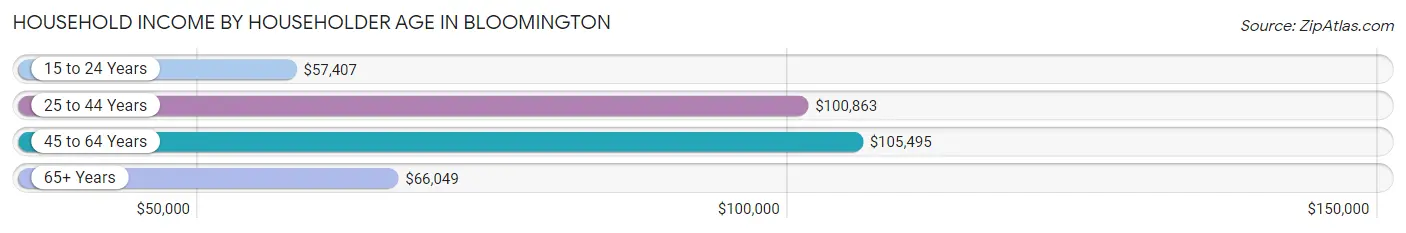
| Income Bracket | # Households | Median Income |
| 15 to 24 Years | 1,288 (3.4%) | $57,407 |
| 25 to 44 Years | 11,180 (29.7%) | $100,863 |
| 45 to 64 Years | 13,325 (35.4%) | $105,495 |
| 65+ Years | 11,860 (31.5%) | $66,049 |
| Total | 37,653 (100.0%) | $87,381 |
Poverty in Bloomington
Income Below Poverty by Sex and Age in Bloomington
With 7.0% poverty level for males and 8.9% for females among the residents of Bloomington, 15 year old males and 16 and 17 year old females are the most vulnerable to poverty, with 127 males (20.8%) and 191 females (18.0%) in their respective age groups living below the poverty level.
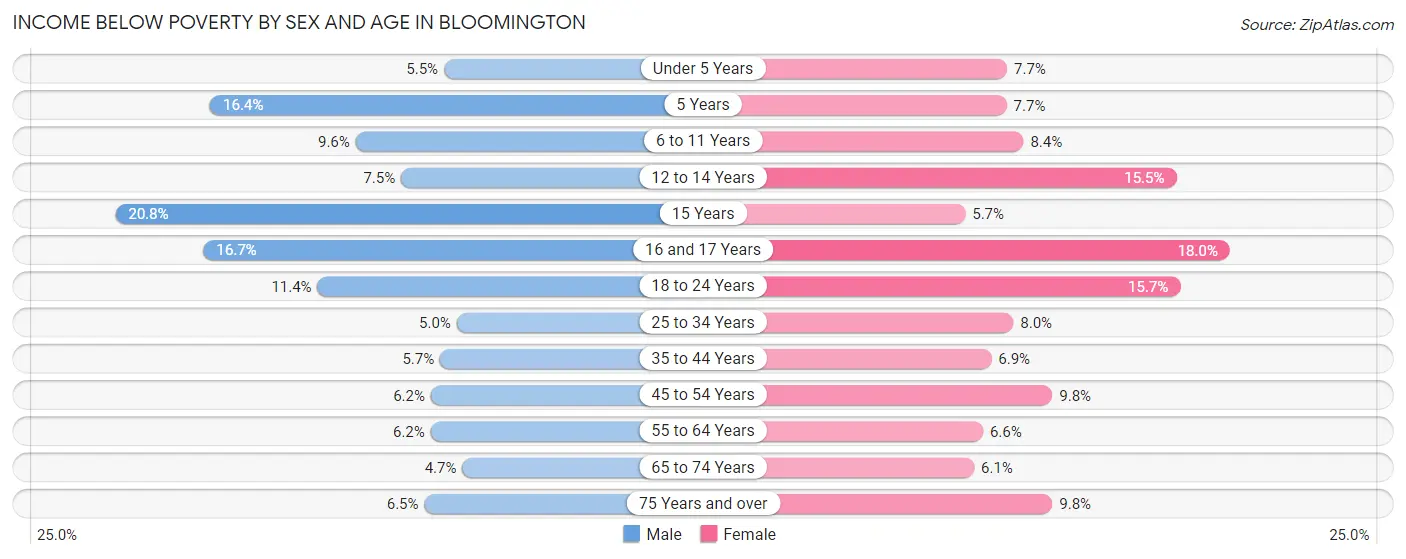
| Age Bracket | Male | Female |
| Under 5 Years | 126 (5.5%) | 215 (7.7%) |
| 5 Years | 70 (16.4%) | 28 (7.6%) |
| 6 to 11 Years | 255 (9.6%) | 226 (8.4%) |
| 12 to 14 Years | 98 (7.5%) | 237 (15.5%) |
| 15 Years | 127 (20.8%) | 20 (5.7%) |
| 16 and 17 Years | 183 (16.7%) | 191 (18.0%) |
| 18 to 24 Years | 395 (11.4%) | 487 (15.7%) |
| 25 to 34 Years | 319 (5.0%) | 457 (8.0%) |
| 35 to 44 Years | 339 (5.7%) | 370 (6.9%) |
| 45 to 54 Years | 321 (6.1%) | 546 (9.8%) |
| 55 to 64 Years | 378 (6.2%) | 410 (6.6%) |
| 65 to 74 Years | 216 (4.7%) | 333 (6.1%) |
| 75 Years and over | 188 (6.5%) | 458 (9.8%) |
| Total | 3,015 (7.0%) | 3,978 (8.9%) |
Income Above Poverty by Sex and Age in Bloomington
According to the poverty statistics in Bloomington, males aged 65 to 74 years and females aged 15 years are the age groups that are most secure financially, with 95.3% of males and 94.3% of females in these age groups living above the poverty line.
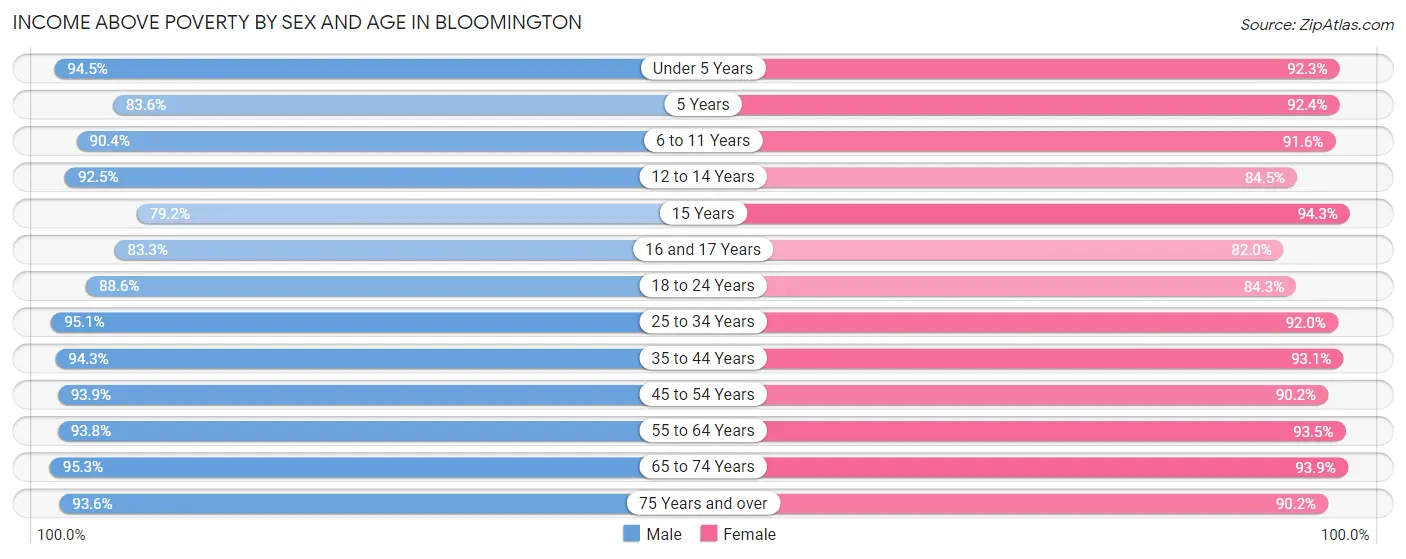
| Age Bracket | Male | Female |
| Under 5 Years | 2,147 (94.5%) | 2,587 (92.3%) |
| 5 Years | 357 (83.6%) | 338 (92.3%) |
| 6 to 11 Years | 2,391 (90.4%) | 2,455 (91.6%) |
| 12 to 14 Years | 1,203 (92.5%) | 1,290 (84.5%) |
| 15 Years | 484 (79.2%) | 329 (94.3%) |
| 16 and 17 Years | 913 (83.3%) | 870 (82.0%) |
| 18 to 24 Years | 3,066 (88.6%) | 2,614 (84.3%) |
| 25 to 34 Years | 6,124 (95.1%) | 5,281 (92.0%) |
| 35 to 44 Years | 5,589 (94.3%) | 4,962 (93.1%) |
| 45 to 54 Years | 4,896 (93.9%) | 5,044 (90.2%) |
| 55 to 64 Years | 5,763 (93.8%) | 5,850 (93.4%) |
| 65 to 74 Years | 4,389 (95.3%) | 5,089 (93.9%) |
| 75 Years and over | 2,728 (93.5%) | 4,230 (90.2%) |
| Total | 40,050 (93.0%) | 40,939 (91.1%) |
Income Below Poverty Among Married-Couple Families in Bloomington
The poverty statistics for married-couple families in Bloomington show that 3.4% or 600 of the total 17,422 families live below the poverty line. Families with 3 or 4 children have the highest poverty rate of 13.4%, comprising of 172 families. On the other hand, families with 5 or more children have the lowest poverty rate of 0.0%, which includes 0 families.
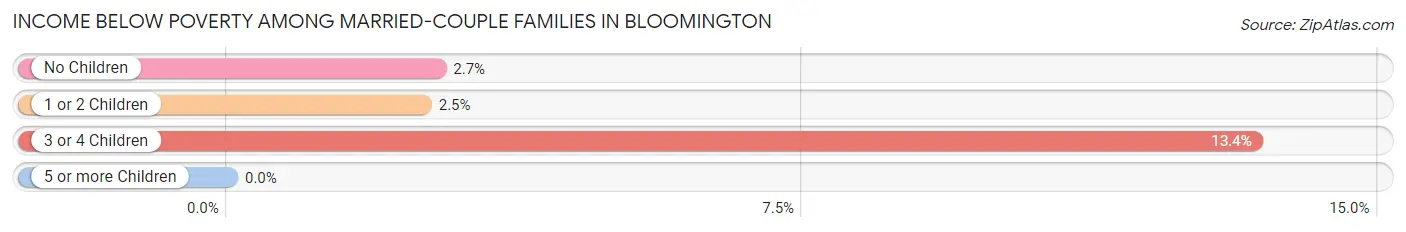
| Children | Above Poverty | Below Poverty |
| No Children | 10,854 (97.3%) | 304 (2.7%) |
| 1 or 2 Children | 4,784 (97.5%) | 124 (2.5%) |
| 3 or 4 Children | 1,113 (86.6%) | 172 (13.4%) |
| 5 or more Children | 71 (100.0%) | 0 (0.0%) |
| Total | 16,822 (96.6%) | 600 (3.4%) |
Income Below Poverty Among Single-Parent Households in Bloomington
According to the poverty data in Bloomington, 8.5% or 149 single-father households and 11.6% or 398 single-mother households are living below the poverty line. Among single-father households, those with 3 or 4 children have the highest poverty rate, with 35 households (26.1%) experiencing poverty. Likewise, among single-mother households, those with 5 or more children have the highest poverty rate, with 51 households (100.0%) falling below the poverty line.
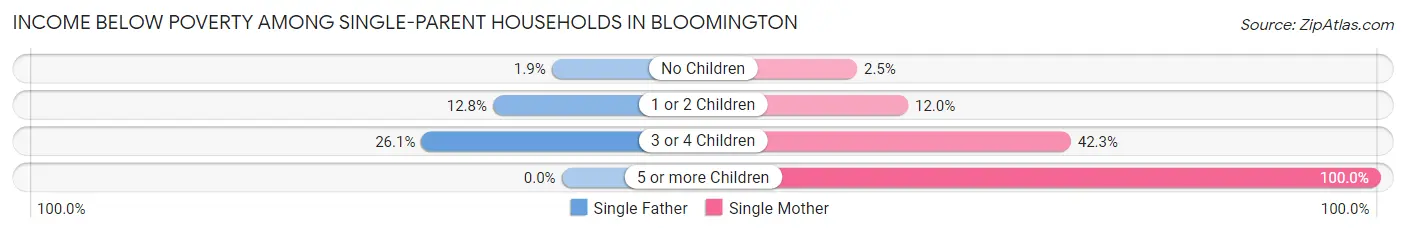
| Children | Single Father | Single Mother |
| No Children | 16 (1.9%) | 36 (2.5%) |
| 1 or 2 Children | 98 (12.8%) | 201 (12.0%) |
| 3 or 4 Children | 35 (26.1%) | 110 (42.3%) |
| 5 or more Children | 0 (0.0%) | 51 (100.0%) |
| Total | 149 (8.5%) | 398 (11.6%) |
Income Below Poverty Among Married-Couple vs Single-Parent Households in Bloomington
The poverty data for Bloomington shows that 600 of the married-couple family households (3.4%) and 547 of the single-parent households (10.5%) are living below the poverty level. Within the married-couple family households, those with 3 or 4 children have the highest poverty rate, with 172 households (13.4%) falling below the poverty line. Among the single-parent households, those with 5 or more children have the highest poverty rate, with 51 household (100.0%) living below poverty.
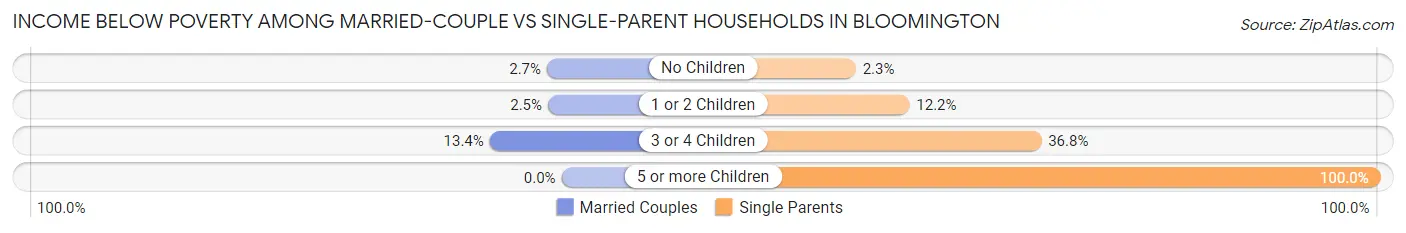
| Children | Married-Couple Families | Single-Parent Households |
| No Children | 304 (2.7%) | 52 (2.2%) |
| 1 or 2 Children | 124 (2.5%) | 299 (12.2%) |
| 3 or 4 Children | 172 (13.4%) | 145 (36.8%) |
| 5 or more Children | 0 (0.0%) | 51 (100.0%) |
| Total | 600 (3.4%) | 547 (10.5%) |
Race in Bloomington
The most populous races in Bloomington are White / Caucasian (62,999 | 70.6%), Black / African American (9,690 | 10.9%), and Hispanic or Latino (7,738 | 8.7%).
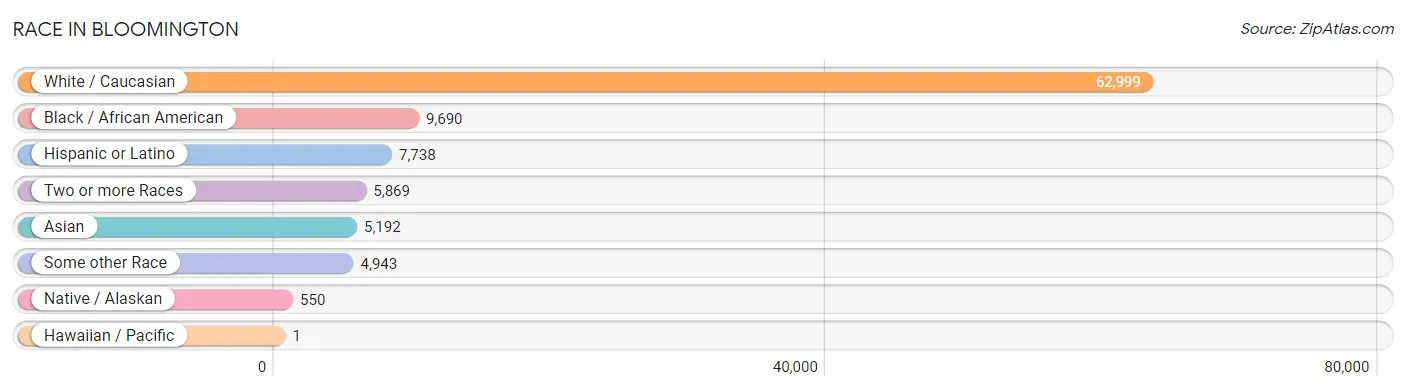
| Race | # Population | % Population |
| Asian | 5,192 | 5.8% |
| Black / African American | 9,690 | 10.9% |
| Hawaiian / Pacific | 1 | 0.0% |
| Hispanic or Latino | 7,738 | 8.7% |
| Native / Alaskan | 550 | 0.6% |
| White / Caucasian | 62,999 | 70.6% |
| Two or more Races | 5,869 | 6.6% |
| Some other Race | 4,943 | 5.5% |
| Total | 89,244 | 100.0% |
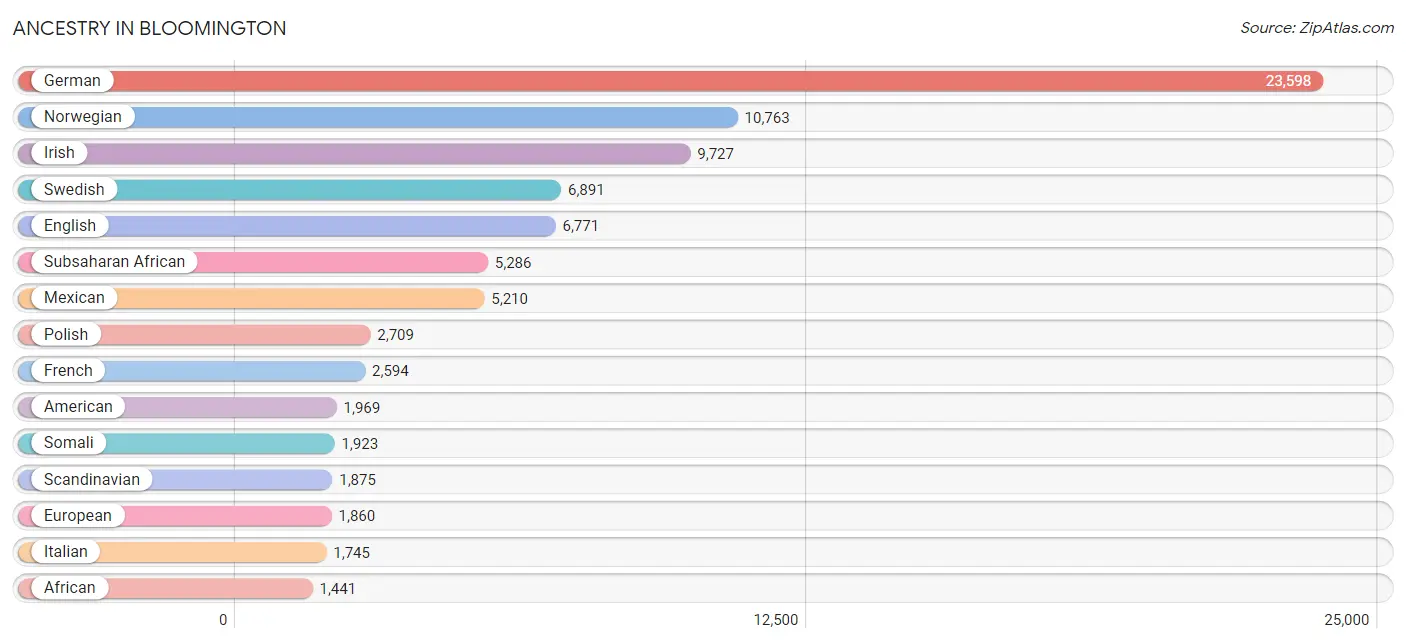
Ancestry in Bloomington
The most populous ancestries reported in Bloomington are German (23,598 | 26.4%), Norwegian (10,763 | 12.1%), Irish (9,727 | 10.9%), Swedish (6,891 | 7.7%), and English (6,771 | 7.6%), together accounting for 64.7% of all Bloomington residents.
| Ancestry | # Population | % Population |
| African | 1,441 | 1.6% |
| Albanian | 45 | 0.1% |
| American | 1,969 | 2.2% |
| Apache | 1 | 0.0% |
| Arab | 153 | 0.2% |
| Argentinean | 30 | 0.0% |
| Armenian | 13 | 0.0% |
| Australian | 25 | 0.0% |
| Austrian | 317 | 0.4% |
| Bangladeshi | 398 | 0.4% |
| Belgian | 74 | 0.1% |
| Bhutanese | 123 | 0.1% |
| Blackfeet | 16 | 0.0% |
| Bolivian | 135 | 0.2% |
| Brazilian | 64 | 0.1% |
| British | 426 | 0.5% |
| Bulgarian | 5 | 0.0% |
| Burmese | 574 | 0.6% |
| Cajun | 1 | 0.0% |
| Canadian | 51 | 0.1% |
| Celtic | 7 | 0.0% |
| Central American | 780 | 0.9% |
| Central American Indian | 43 | 0.1% |
| Cherokee | 137 | 0.2% |
| Chickasaw | 18 | 0.0% |
| Chilean | 142 | 0.2% |
| Chippewa | 504 | 0.6% |
| Choctaw | 19 | 0.0% |
| Colombian | 109 | 0.1% |
| Costa Rican | 151 | 0.2% |
| Croatian | 70 | 0.1% |
| Cuban | 376 | 0.4% |
| Czech | 939 | 1.1% |
| Czechoslovakian | 120 | 0.1% |
| Danish | 937 | 1.1% |
| Dominican | 63 | 0.1% |
| Dutch | 1,127 | 1.3% |
| Eastern European | 141 | 0.2% |
| Ecuadorian | 121 | 0.1% |
| Egyptian | 28 | 0.0% |
| English | 6,771 | 7.6% |
| Ethiopian | 488 | 0.5% |
| European | 1,860 | 2.1% |
| Fijian | 1 | 0.0% |
| Finnish | 818 | 0.9% |
| French | 2,594 | 2.9% |
| French American Indian | 11 | 0.0% |
| French Canadian | 511 | 0.6% |
| German | 23,598 | 26.4% |
| Ghanaian | 356 | 0.4% |
| Greek | 267 | 0.3% |
| Guamanian / Chamorro | 11 | 0.0% |
| Guatemalan | 169 | 0.2% |
| Guyanese | 98 | 0.1% |
| Haitian | 13 | 0.0% |
| Honduran | 52 | 0.1% |
| Hungarian | 252 | 0.3% |
| Icelander | 123 | 0.1% |
| Indian (Asian) | 938 | 1.1% |
| Indonesian | 82 | 0.1% |
| Iranian | 453 | 0.5% |
| Iraqi | 24 | 0.0% |
| Irish | 9,727 | 10.9% |
| Iroquois | 18 | 0.0% |
| Italian | 1,745 | 2.0% |
| Jamaican | 32 | 0.0% |
| Japanese | 267 | 0.3% |
| Jordanian | 11 | 0.0% |
| Kenyan | 152 | 0.2% |
| Korean | 785 | 0.9% |
| Latvian | 69 | 0.1% |
| Lebanese | 45 | 0.1% |
| Liberian | 222 | 0.3% |
| Lithuanian | 44 | 0.1% |
| Luxembourger | 92 | 0.1% |
| Macedonian | 20 | 0.0% |
| Malaysian | 237 | 0.3% |
| Maltese | 9 | 0.0% |
| Mexican | 5,210 | 5.8% |
| Mexican American Indian | 52 | 0.1% |
| Native Hawaiian | 16 | 0.0% |
| Nicaraguan | 47 | 0.1% |
| Nigerian | 359 | 0.4% |
| Northern European | 365 | 0.4% |
| Norwegian | 10,763 | 12.1% |
| Ottawa | 25 | 0.0% |
| Pakistani | 18 | 0.0% |
| Palestinian | 6 | 0.0% |
| Pennsylvania German | 32 | 0.0% |
| Peruvian | 121 | 0.1% |
| Polish | 2,709 | 3.0% |
| Portuguese | 14 | 0.0% |
| Puerto Rican | 485 | 0.5% |
| Romanian | 17 | 0.0% |
| Russian | 613 | 0.7% |
| Salvadoran | 361 | 0.4% |
| Scandinavian | 1,875 | 2.1% |
| Scotch-Irish | 449 | 0.5% |
| Scottish | 1,335 | 1.5% |
| Serbian | 94 | 0.1% |
| Sierra Leonean | 112 | 0.1% |
| Sioux | 284 | 0.3% |
| Slavic | 10 | 0.0% |
| Slovak | 79 | 0.1% |
| Slovene | 130 | 0.2% |
| Somali | 1,923 | 2.1% |
| South African | 17 | 0.0% |
| South American | 714 | 0.8% |
| Soviet Union | 10 | 0.0% |
| Spaniard | 30 | 0.0% |
| Spanish | 59 | 0.1% |
| Sri Lankan | 1,430 | 1.6% |
| Subsaharan African | 5,286 | 5.9% |
| Sudanese | 263 | 0.3% |
| Swedish | 6,891 | 7.7% |
| Swiss | 411 | 0.5% |
| Syrian | 7 | 0.0% |
| Thai | 1,167 | 1.3% |
| Trinidadian and Tobagonian | 29 | 0.0% |
| Ugandan | 53 | 0.1% |
| Ukrainian | 143 | 0.2% |
| Venezuelan | 56 | 0.1% |
| Vietnamese | 52 | 0.1% |
| Welsh | 482 | 0.5% |
| West Indian | 36 | 0.0% |
| Yugoslavian | 36 | 0.0% | View All 126 Rows |
Immigrants in Bloomington
The most numerous immigrant groups reported in Bloomington came from Africa (4,438 | 5.0%), Asia (3,647 | 4.1%), Latin America (3,186 | 3.6%), Eastern Africa (3,160 | 3.5%), and Central America (2,105 | 2.4%), together accounting for 18.5% of all Bloomington residents.
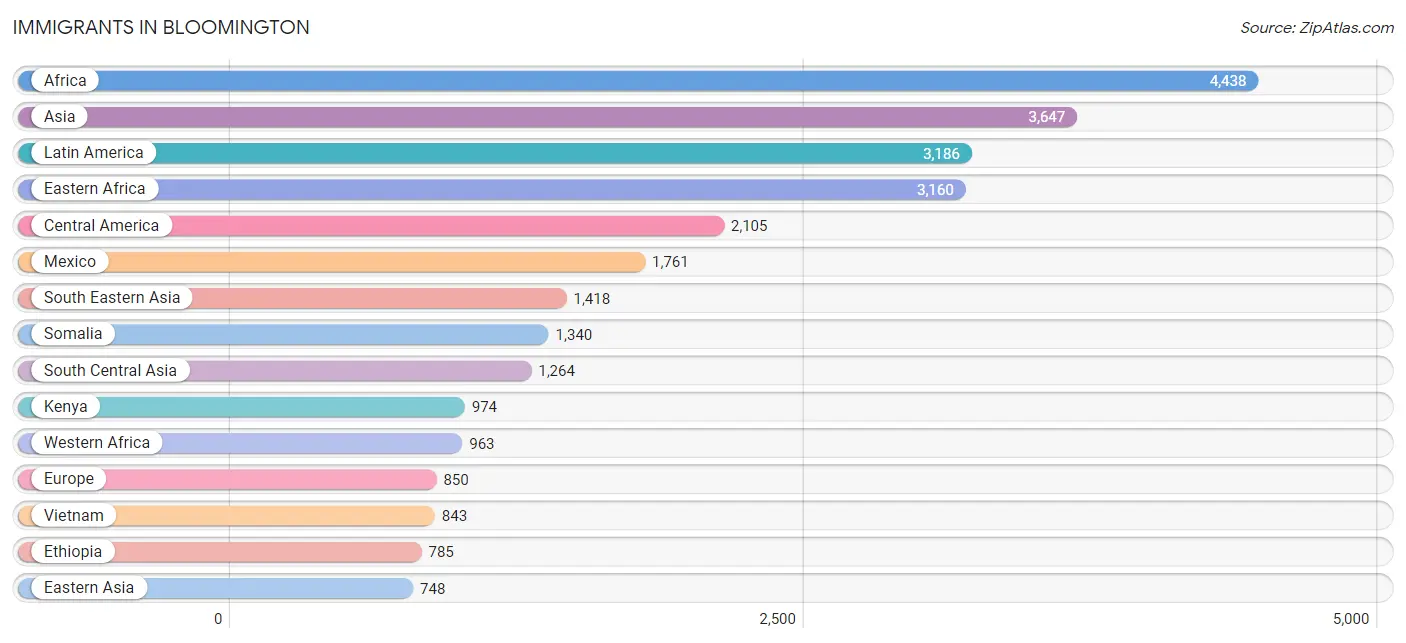
| Immigration Origin | # Population | % Population |
| Africa | 4,438 | 5.0% |
| Albania | 44 | 0.1% |
| Argentina | 30 | 0.0% |
| Asia | 3,647 | 4.1% |
| Australia | 39 | 0.0% |
| Bahamas | 4 | 0.0% |
| Bangladesh | 59 | 0.1% |
| Belarus | 8 | 0.0% |
| Bolivia | 85 | 0.1% |
| Bosnia and Herzegovina | 16 | 0.0% |
| Brazil | 64 | 0.1% |
| Cambodia | 93 | 0.1% |
| Canada | 243 | 0.3% |
| Caribbean | 388 | 0.4% |
| Central America | 2,105 | 2.4% |
| Chile | 27 | 0.0% |
| China | 471 | 0.5% |
| Colombia | 42 | 0.1% |
| Costa Rica | 5 | 0.0% |
| Cuba | 290 | 0.3% |
| Czechoslovakia | 45 | 0.1% |
| Denmark | 7 | 0.0% |
| Dominican Republic | 37 | 0.0% |
| Eastern Africa | 3,160 | 3.5% |
| Eastern Asia | 748 | 0.8% |
| Eastern Europe | 334 | 0.4% |
| Ecuador | 69 | 0.1% |
| Egypt | 11 | 0.0% |
| El Salvador | 136 | 0.2% |
| England | 88 | 0.1% |
| Ethiopia | 785 | 0.9% |
| Europe | 850 | 0.9% |
| France | 39 | 0.0% |
| Germany | 181 | 0.2% |
| Ghana | 258 | 0.3% |
| Greece | 19 | 0.0% |
| Guatemala | 139 | 0.2% |
| Guyana | 248 | 0.3% |
| Honduras | 23 | 0.0% |
| Hong Kong | 29 | 0.0% |
| India | 733 | 0.8% |
| Iran | 57 | 0.1% |
| Iraq | 24 | 0.0% |
| Ireland | 25 | 0.0% |
| Italy | 27 | 0.0% |
| Jamaica | 34 | 0.0% |
| Japan | 24 | 0.0% |
| Jordan | 6 | 0.0% |
| Kenya | 974 | 1.1% |
| Korea | 253 | 0.3% |
| Laos | 162 | 0.2% |
| Latin America | 3,186 | 3.6% |
| Latvia | 62 | 0.1% |
| Lebanon | 8 | 0.0% |
| Liberia | 189 | 0.2% |
| Malaysia | 27 | 0.0% |
| Mexico | 1,761 | 2.0% |
| Moldova | 15 | 0.0% |
| Nepal | 64 | 0.1% |
| Netherlands | 6 | 0.0% |
| Nicaragua | 29 | 0.0% |
| Nigeria | 238 | 0.3% |
| Northern Africa | 311 | 0.4% |
| Northern Europe | 244 | 0.3% |
| Norway | 14 | 0.0% |
| Oceania | 39 | 0.0% |
| Pakistan | 106 | 0.1% |
| Panama | 12 | 0.0% |
| Peru | 36 | 0.0% |
| Philippines | 192 | 0.2% |
| Russia | 82 | 0.1% |
| Saudi Arabia | 33 | 0.0% |
| Scotland | 34 | 0.0% |
| Senegal | 13 | 0.0% |
| Sierra Leone | 121 | 0.1% |
| Somalia | 1,340 | 1.5% |
| South America | 693 | 0.8% |
| South Central Asia | 1,264 | 1.4% |
| South Eastern Asia | 1,418 | 1.6% |
| Southern Europe | 46 | 0.1% |
| Sri Lanka | 43 | 0.1% |
| Sudan | 300 | 0.3% |
| Sweden | 20 | 0.0% |
| Taiwan | 50 | 0.1% |
| Thailand | 101 | 0.1% |
| Uganda | 61 | 0.1% |
| Ukraine | 30 | 0.0% |
| Uzbekistan | 202 | 0.2% |
| Venezuela | 92 | 0.1% |
| Vietnam | 843 | 0.9% |
| Western Africa | 963 | 1.1% |
| Western Asia | 217 | 0.2% |
| Western Europe | 226 | 0.3% | View All 93 Rows |
Sex and Age in Bloomington
Sex and Age in Bloomington
The most populous age groups in Bloomington are 30 to 34 Years (3,526 | 8.1%) for men and 65 to 69 Years (3,334 | 7.3%) for women.
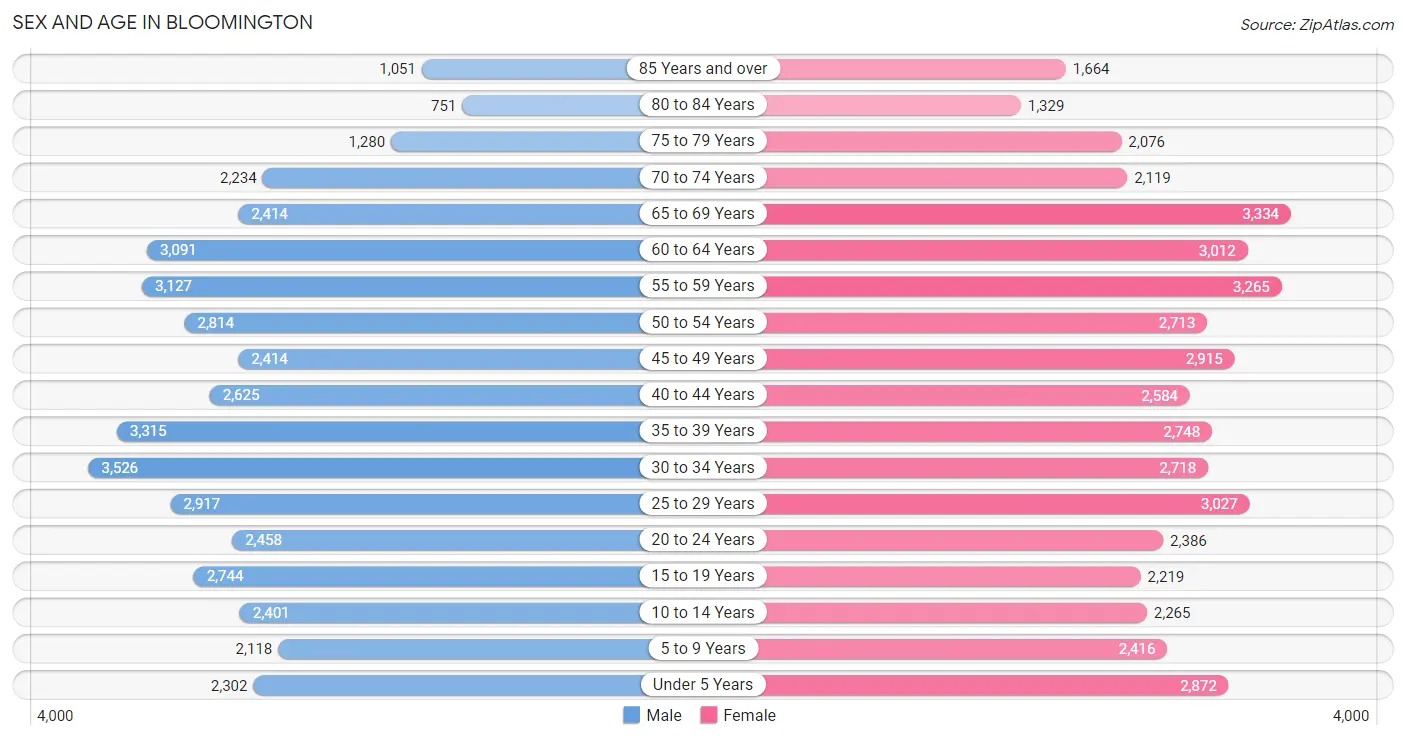
| Age Bracket | Male | Female |
| Under 5 Years | 2,302 (5.3%) | 2,872 (6.3%) |
| 5 to 9 Years | 2,118 (4.9%) | 2,416 (5.3%) |
| 10 to 14 Years | 2,401 (5.5%) | 2,265 (5.0%) |
| 15 to 19 Years | 2,744 (6.3%) | 2,219 (4.9%) |
| 20 to 24 Years | 2,458 (5.6%) | 2,386 (5.2%) |
| 25 to 29 Years | 2,917 (6.7%) | 3,027 (6.6%) |
| 30 to 34 Years | 3,526 (8.1%) | 2,718 (5.9%) |
| 35 to 39 Years | 3,315 (7.6%) | 2,748 (6.0%) |
| 40 to 44 Years | 2,625 (6.0%) | 2,584 (5.7%) |
| 45 to 49 Years | 2,414 (5.5%) | 2,915 (6.4%) |
| 50 to 54 Years | 2,814 (6.5%) | 2,713 (5.9%) |
| 55 to 59 Years | 3,127 (7.2%) | 3,265 (7.1%) |
| 60 to 64 Years | 3,091 (7.1%) | 3,012 (6.6%) |
| 65 to 69 Years | 2,414 (5.5%) | 3,334 (7.3%) |
| 70 to 74 Years | 2,234 (5.1%) | 2,119 (4.6%) |
| 75 to 79 Years | 1,280 (2.9%) | 2,076 (4.5%) |
| 80 to 84 Years | 751 (1.7%) | 1,329 (2.9%) |
| 85 Years and over | 1,051 (2.4%) | 1,664 (3.6%) |
| Total | 43,582 (100.0%) | 45,662 (100.0%) |
Families and Households in Bloomington
Median Family Size in Bloomington
The median family size in Bloomington is 2.96 persons per family, with single female/mother families (3,432 | 15.2%) accounting for the largest median family size of 3.15 persons per family. On the other hand, single male/father families (1,762 | 7.8%) represent the smallest median family size with 2.76 persons per family.
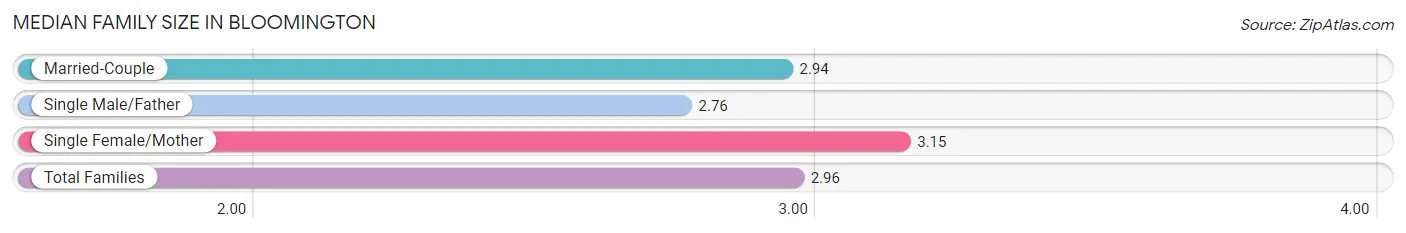
| Family Type | # Families | Family Size |
| Married-Couple | 17,422 (77.0%) | 2.94 |
| Single Male/Father | 1,762 (7.8%) | 2.76 |
| Single Female/Mother | 3,432 (15.2%) | 3.15 |
| Total Families | 22,616 (100.0%) | 2.96 |
Median Household Size in Bloomington
The median household size in Bloomington is 2.33 persons per household, with single female/mother households (3,432 | 9.1%) accounting for the largest median household size of 3.39 persons per household. non-family households (15,037 | 39.9%) represent the smallest median household size with 1.26 persons per household.
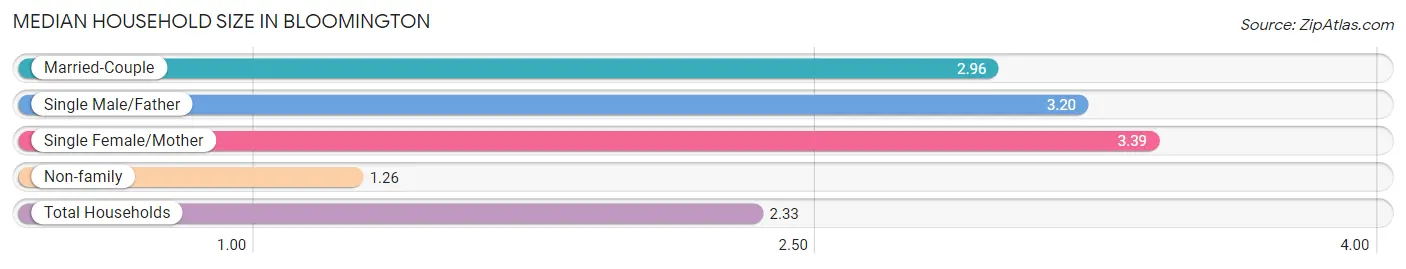
| Household Type | # Households | Household Size |
| Married-Couple | 17,422 (46.3%) | 2.96 |
| Single Male/Father | 1,762 (4.7%) | 3.20 |
| Single Female/Mother | 3,432 (9.1%) | 3.39 |
| Non-family | 15,037 (39.9%) | 1.26 |
| Total Households | 37,653 (100.0%) | 2.33 |
Household Size by Marriage Status in Bloomington
Out of a total of 37,653 households in Bloomington, 22,616 (60.1%) are family households, while 15,037 (39.9%) are nonfamily households. The most numerous type of family households are 2-person households, comprising 11,450, and the most common type of nonfamily households are 1-person households, comprising 11,904.
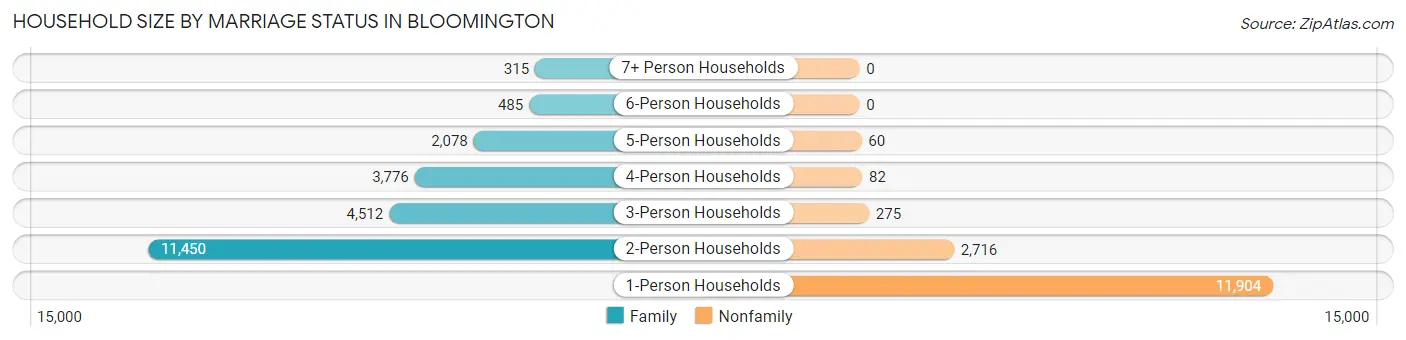
| Household Size | Family Households | Nonfamily Households |
| 1-Person Households | - | 11,904 (31.6%) |
| 2-Person Households | 11,450 (30.4%) | 2,716 (7.2%) |
| 3-Person Households | 4,512 (12.0%) | 275 (0.7%) |
| 4-Person Households | 3,776 (10.0%) | 82 (0.2%) |
| 5-Person Households | 2,078 (5.5%) | 60 (0.2%) |
| 6-Person Households | 485 (1.3%) | 0 (0.0%) |
| 7+ Person Households | 315 (0.8%) | 0 (0.0%) |
| Total | 22,616 (60.1%) | 15,037 (39.9%) |
Female Fertility in Bloomington
Fertility by Age in Bloomington
Average fertility rate in Bloomington is 54.0 births per 1,000 women. Women in the age bracket of 20 to 34 years have the highest fertility rate with 85.0 births per 1,000 women. Women in the age bracket of 20 to 34 years acount for 66.3% of all women with births.
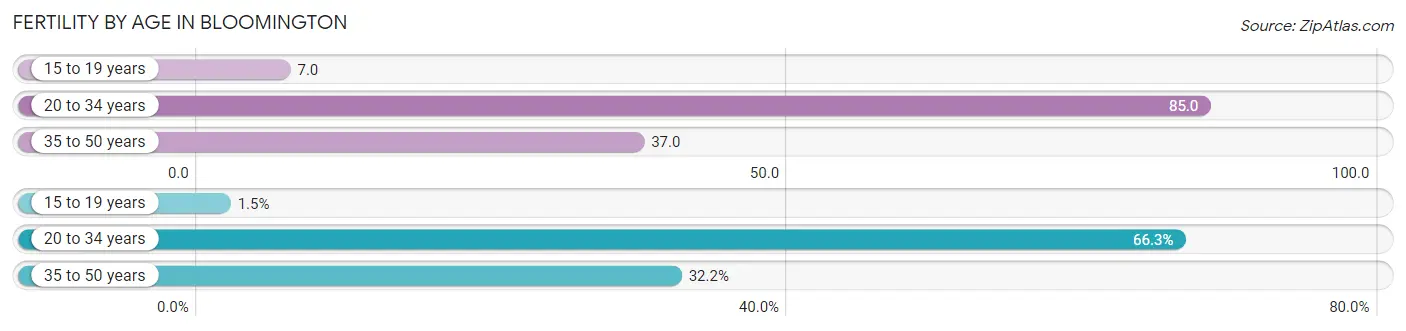
| Age Bracket | Women with Births | Births / 1,000 Women |
| 15 to 19 years | 16 (1.5%) | 7.0 |
| 20 to 34 years | 691 (66.3%) | 85.0 |
| 35 to 50 years | 335 (32.2%) | 37.0 |
| Total | 1,042 (100.0%) | 54.0 |
Fertility by Age by Marriage Status in Bloomington
78.4% of women with births (1,042) in Bloomington are married. The highest percentage of unmarried women with births falls into 15 to 19 years age bracket with 100.0% of them unmarried at the time of birth, while the lowest percentage of unmarried women with births belong to 35 to 50 years age bracket with 10.2% of them unmarried.
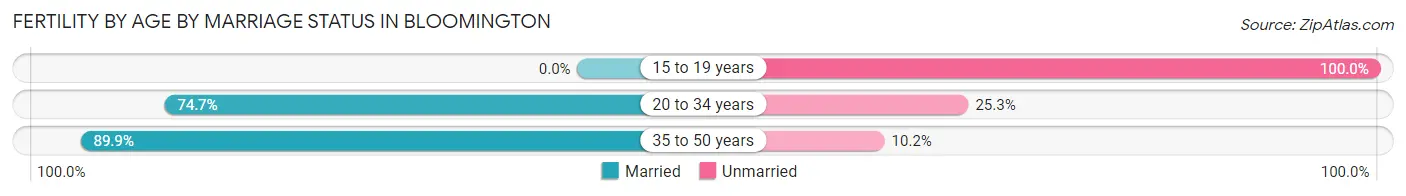
| Age Bracket | Married | Unmarried |
| 15 to 19 years | 0 (0.0%) | 16 (100.0%) |
| 20 to 34 years | 516 (74.7%) | 175 (25.3%) |
| 35 to 50 years | 301 (89.8%) | 34 (10.2%) |
| Total | 817 (78.4%) | 225 (21.6%) |
Fertility by Education in Bloomington
Average fertility rate in Bloomington is 54.0 births per 1,000 women. Women with the education attainment of graduate degree have the highest fertility rate of 140.0 births per 1,000 women, while women with the education attainment of less than high school have the lowest fertility at 9.0 births per 1,000 women. Women with the education attainment of graduate degree represent 36.7% of all women with births.
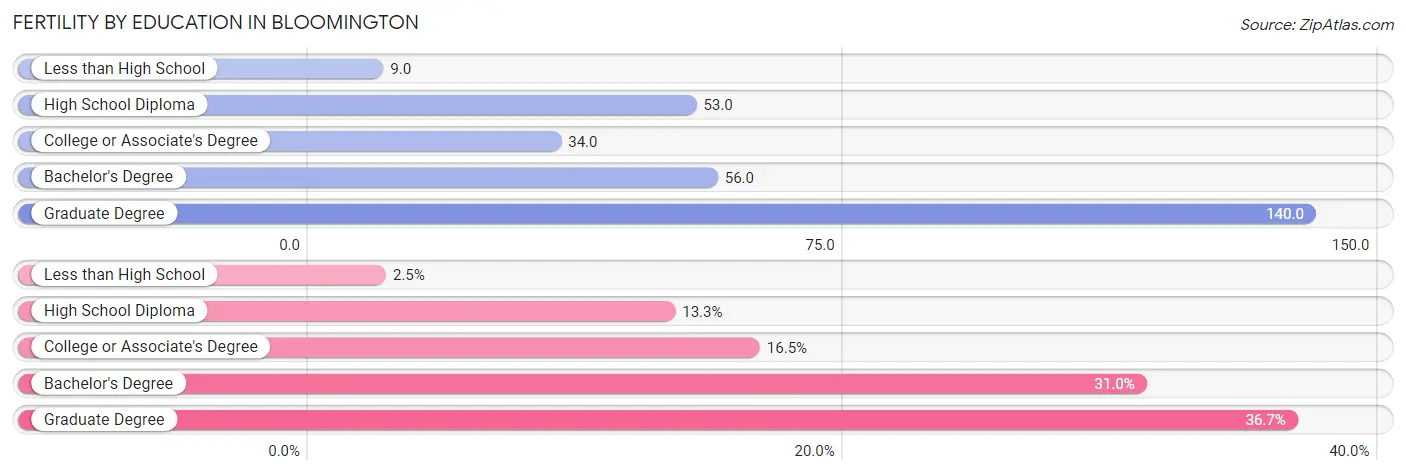
| Educational Attainment | Women with Births | Births / 1,000 Women |
| Less than High School | 26 (2.5%) | 9.0 |
| High School Diploma | 139 (13.3%) | 53.0 |
| College or Associate's Degree | 172 (16.5%) | 34.0 |
| Bachelor's Degree | 323 (31.0%) | 56.0 |
| Graduate Degree | 382 (36.7%) | 140.0 |
| Total | 1,042 (100.0%) | 54.0 |
Fertility by Education by Marriage Status in Bloomington
21.6% of women with births in Bloomington are unmarried. Women with the educational attainment of bachelor's degree are most likely to be married with 97.5% of them married at childbirth, while women with the educational attainment of less than high school are least likely to be married with 61.5% of them unmarried at childbirth.
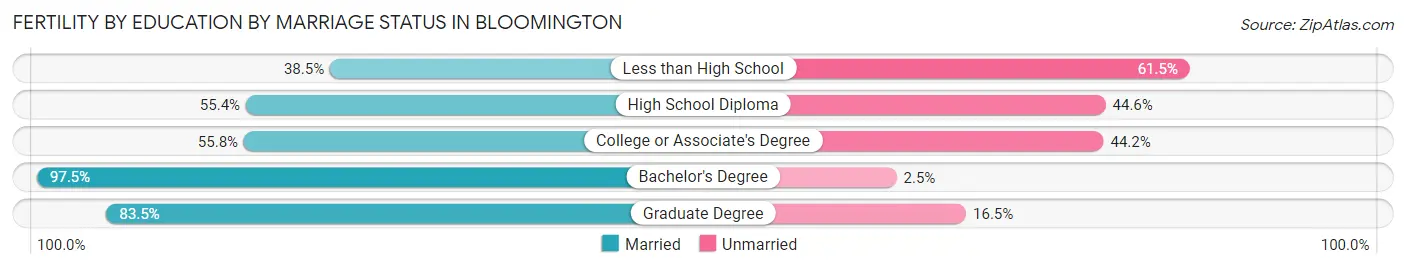
| Educational Attainment | Married | Unmarried |
| Less than High School | 10 (38.5%) | 16 (61.5%) |
| High School Diploma | 77 (55.4%) | 62 (44.6%) |
| College or Associate's Degree | 96 (55.8%) | 76 (44.2%) |
| Bachelor's Degree | 315 (97.5%) | 8 (2.5%) |
| Graduate Degree | 319 (83.5%) | 63 (16.5%) |
| Total | 817 (78.4%) | 225 (21.6%) |
Employment Characteristics in Bloomington
Employment by Class of Employer in Bloomington
Among the 47,663 employed individuals in Bloomington, private company employees (33,785 | 70.9%), not-for-profit organizations (4,890 | 10.3%), and local government employees (2,634 | 5.5%) make up the most common classes of employment.
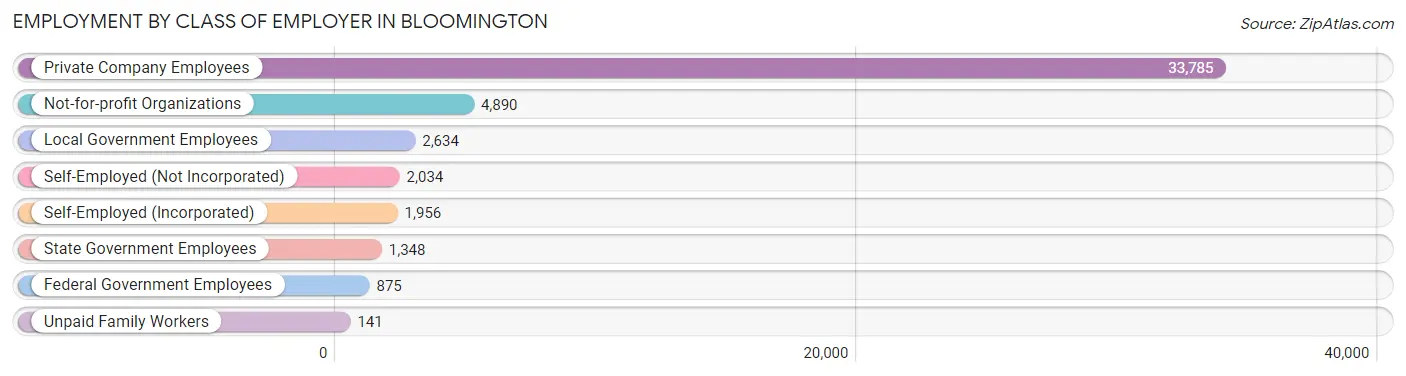
| Employer Class | # Employees | % Employees |
| Private Company Employees | 33,785 | 70.9% |
| Self-Employed (Incorporated) | 1,956 | 4.1% |
| Self-Employed (Not Incorporated) | 2,034 | 4.3% |
| Not-for-profit Organizations | 4,890 | 10.3% |
| Local Government Employees | 2,634 | 5.5% |
| State Government Employees | 1,348 | 2.8% |
| Federal Government Employees | 875 | 1.8% |
| Unpaid Family Workers | 141 | 0.3% |
| Total | 47,663 | 100.0% |
Employment Status by Age in Bloomington
According to the labor force statistics for Bloomington, out of the total population over 16 years of age (73,908), 68.9% or 50,923 individuals are in the labor force, with 4.4% or 2,241 of them unemployed. The age group with the highest labor force participation rate is 25 to 29 years, with 94.8% or 5,635 individuals in the labor force. Within the labor force, the 20 to 24 years age range has the highest percentage of unemployed individuals, with 11.7% or 495 of them being unemployed.
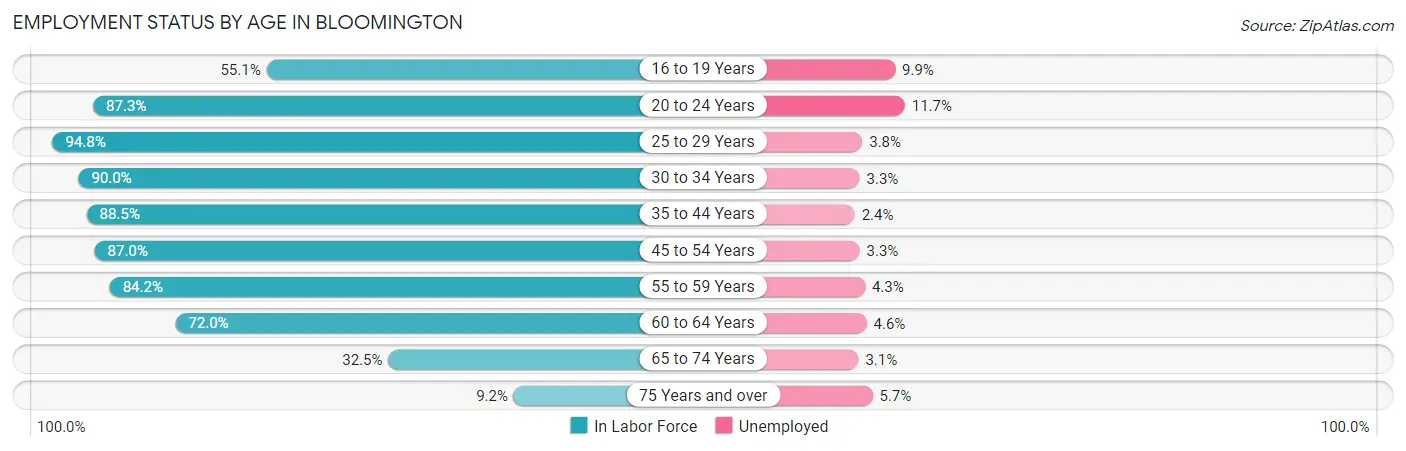
| Age Bracket | In Labor Force | Unemployed |
| 16 to 19 Years | 2,205 (55.1%) | 218 (9.9%) |
| 20 to 24 Years | 4,229 (87.3%) | 495 (11.7%) |
| 25 to 29 Years | 5,635 (94.8%) | 214 (3.8%) |
| 30 to 34 Years | 5,620 (90.0%) | 185 (3.3%) |
| 35 to 44 Years | 9,976 (88.5%) | 239 (2.4%) |
| 45 to 54 Years | 9,445 (87.0%) | 312 (3.3%) |
| 55 to 59 Years | 5,382 (84.2%) | 231 (4.3%) |
| 60 to 64 Years | 4,394 (72.0%) | 202 (4.6%) |
| 65 to 74 Years | 3,283 (32.5%) | 102 (3.1%) |
| 75 Years and over | 750 (9.2%) | 43 (5.7%) |
| Total | 50,923 (68.9%) | 2,241 (4.4%) |
Employment Status by Educational Attainment in Bloomington
According to labor force statistics for Bloomington, 86.4% of individuals (40,445) out of the total population between 25 and 64 years of age (46,811) are in the labor force, with 3.4% or 1,375 of them being unemployed. The group with the highest labor force participation rate are those with the educational attainment of bachelor's degree or higher, with 90.1% or 19,804 individuals in the labor force. Within the labor force, individuals with less than high school education have the highest percentage of unemployment, with 6.4% or 195 of them being unemployed.
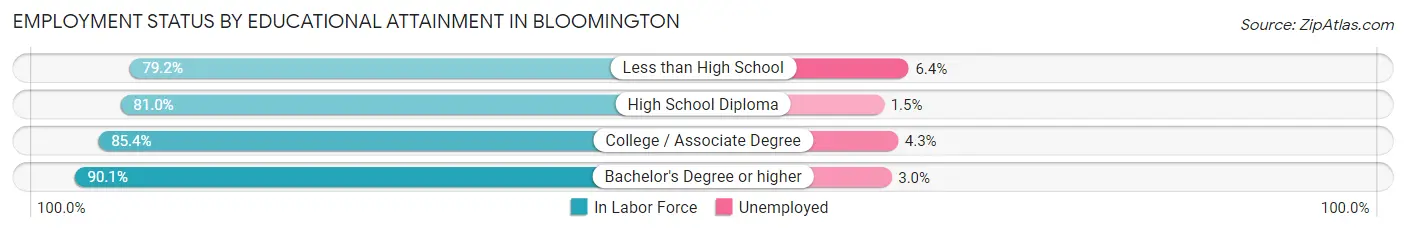
| Educational Attainment | In Labor Force | Unemployed |
| Less than High School | 3,051 (79.2%) | 247 (6.4%) |
| High School Diploma | 5,904 (81.0%) | 109 (1.5%) |
| College / Associate Degree | 11,691 (85.4%) | 589 (4.3%) |
| Bachelor's Degree or higher | 19,804 (90.1%) | 659 (3.0%) |
| Total | 40,445 (86.4%) | 1,592 (3.4%) |
Employment Occupations by Sex in Bloomington
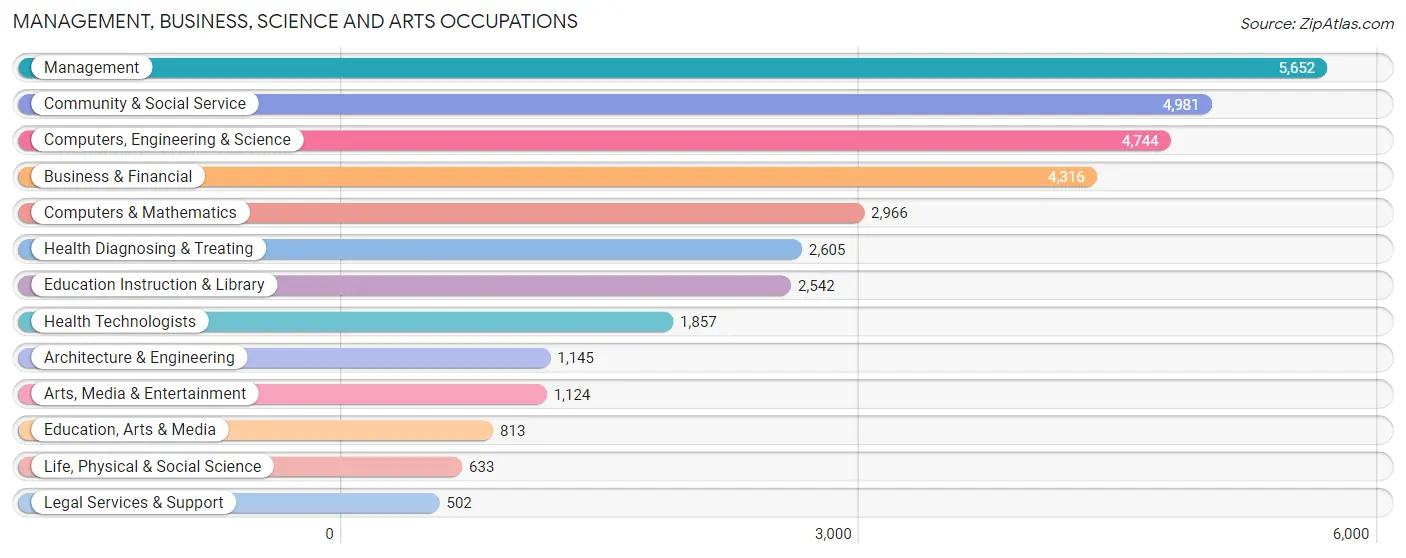
Management, Business, Science and Arts Occupations
The most common Management, Business, Science and Arts occupations in Bloomington are Management (5,652 | 11.6%), Community & Social Service (4,981 | 10.2%), Computers, Engineering & Science (4,744 | 9.8%), Business & Financial (4,316 | 8.9%), and Computers & Mathematics (2,966 | 6.1%).
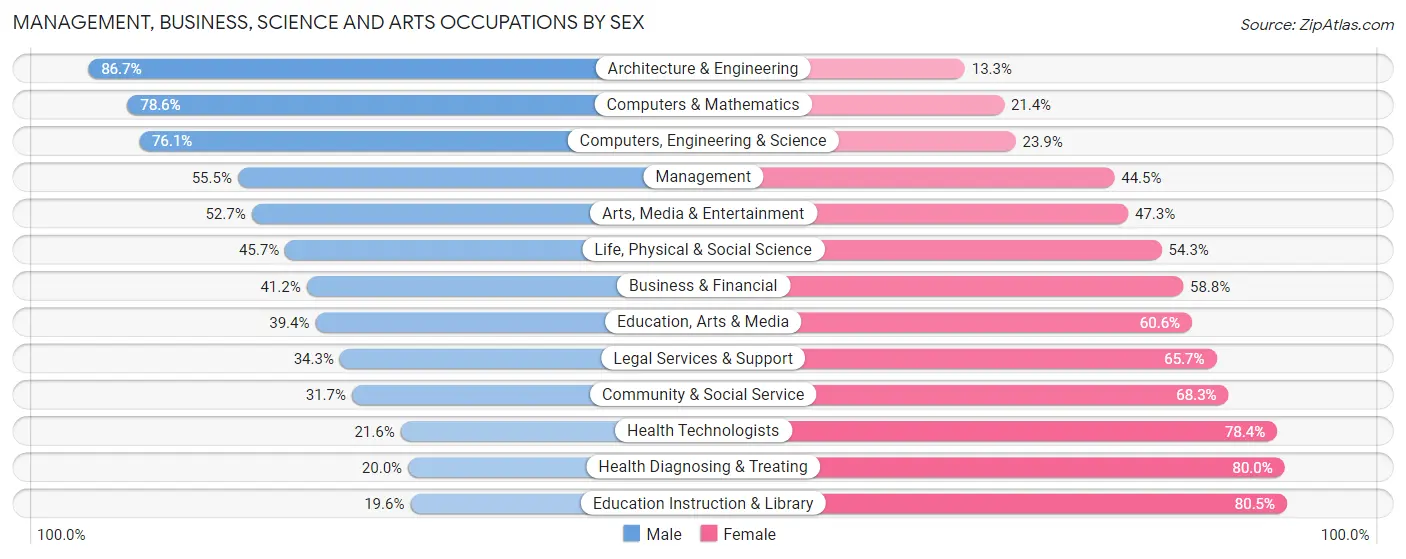
Management, Business, Science and Arts Occupations by Sex
Within the Management, Business, Science and Arts occupations in Bloomington, the most male-oriented occupations are Architecture & Engineering (86.7%), Computers & Mathematics (78.6%), and Computers, Engineering & Science (76.1%), while the most female-oriented occupations are Education Instruction & Library (80.4%), Health Diagnosing & Treating (80.0%), and Health Technologists (78.4%).
| Occupation | Male | Female |
| Management | 3,139 (55.5%) | 2,513 (44.5%) |
| Business & Financial | 1,778 (41.2%) | 2,538 (58.8%) |
| Computers, Engineering & Science | 3,612 (76.1%) | 1,132 (23.9%) |
| Computers & Mathematics | 2,330 (78.6%) | 636 (21.4%) |
| Architecture & Engineering | 993 (86.7%) | 152 (13.3%) |
| Life, Physical & Social Science | 289 (45.7%) | 344 (54.3%) |
| Community & Social Service | 1,581 (31.7%) | 3,400 (68.3%) |
| Education, Arts & Media | 320 (39.4%) | 493 (60.6%) |
| Legal Services & Support | 172 (34.3%) | 330 (65.7%) |
| Education Instruction & Library | 497 (19.6%) | 2,045 (80.4%) |
| Arts, Media & Entertainment | 592 (52.7%) | 532 (47.3%) |
| Health Diagnosing & Treating | 522 (20.0%) | 2,083 (80.0%) |
| Health Technologists | 401 (21.6%) | 1,456 (78.4%) |
| Total (Category) | 10,632 (47.7%) | 11,666 (52.3%) |
| Total (Overall) | 25,433 (52.3%) | 23,156 (47.7%) |
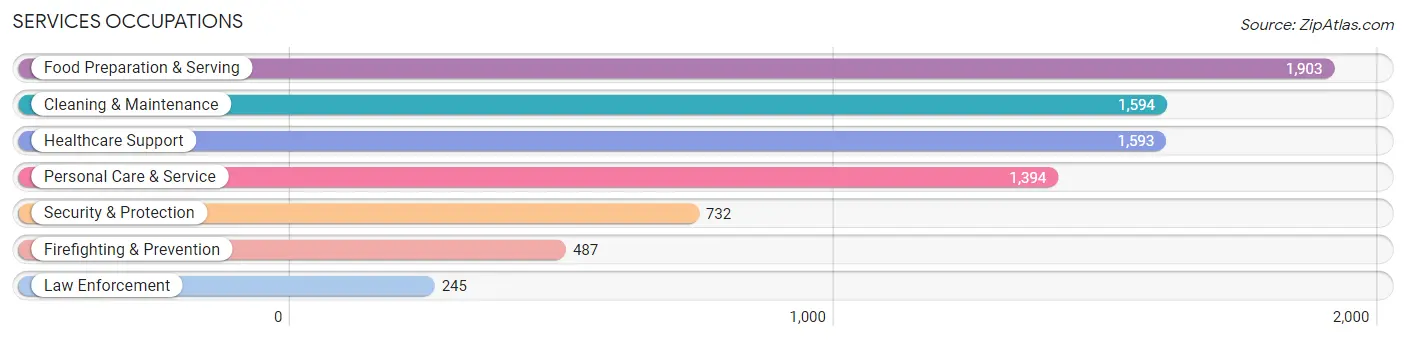
Services Occupations
The most common Services occupations in Bloomington are Food Preparation & Serving (1,903 | 3.9%), Cleaning & Maintenance (1,594 | 3.3%), Healthcare Support (1,593 | 3.3%), Personal Care & Service (1,394 | 2.9%), and Security & Protection (732 | 1.5%).
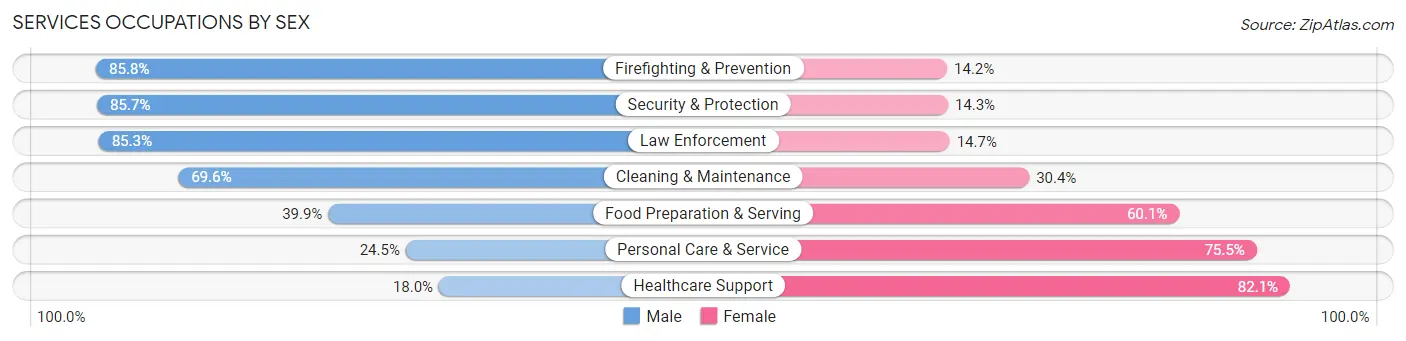
Services Occupations by Sex
Within the Services occupations in Bloomington, the most male-oriented occupations are Firefighting & Prevention (85.8%), Security & Protection (85.7%), and Law Enforcement (85.3%), while the most female-oriented occupations are Healthcare Support (82.1%), Personal Care & Service (75.5%), and Food Preparation & Serving (60.1%).
| Occupation | Male | Female |
| Healthcare Support | 286 (17.9%) | 1,307 (82.1%) |
| Security & Protection | 627 (85.7%) | 105 (14.3%) |
| Firefighting & Prevention | 418 (85.8%) | 69 (14.2%) |
| Law Enforcement | 209 (85.3%) | 36 (14.7%) |
| Food Preparation & Serving | 759 (39.9%) | 1,144 (60.1%) |
| Cleaning & Maintenance | 1,109 (69.6%) | 485 (30.4%) |
| Personal Care & Service | 342 (24.5%) | 1,052 (75.5%) |
| Total (Category) | 3,123 (43.3%) | 4,093 (56.7%) |
| Total (Overall) | 25,433 (52.3%) | 23,156 (47.7%) |
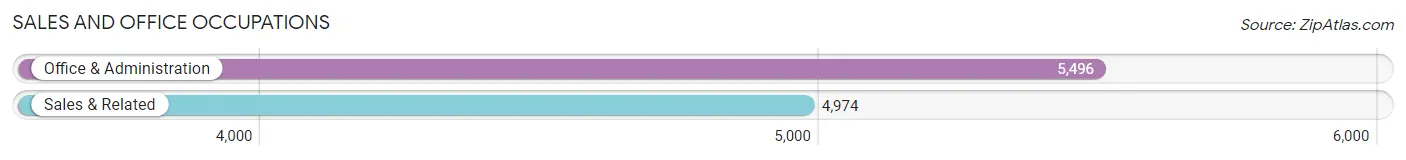
Sales and Office Occupations
The most common Sales and Office occupations in Bloomington are Office & Administration (5,496 | 11.3%), and Sales & Related (4,974 | 10.2%).
Sales and Office Occupations by Sex
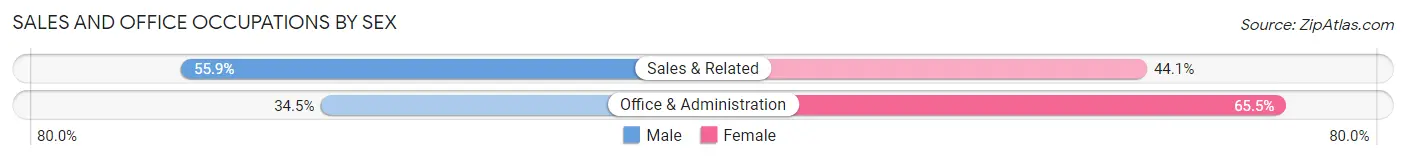
| Occupation | Male | Female |
| Sales & Related | 2,782 (55.9%) | 2,192 (44.1%) |
| Office & Administration | 1,897 (34.5%) | 3,599 (65.5%) |
| Total (Category) | 4,679 (44.7%) | 5,791 (55.3%) |
| Total (Overall) | 25,433 (52.3%) | 23,156 (47.7%) |
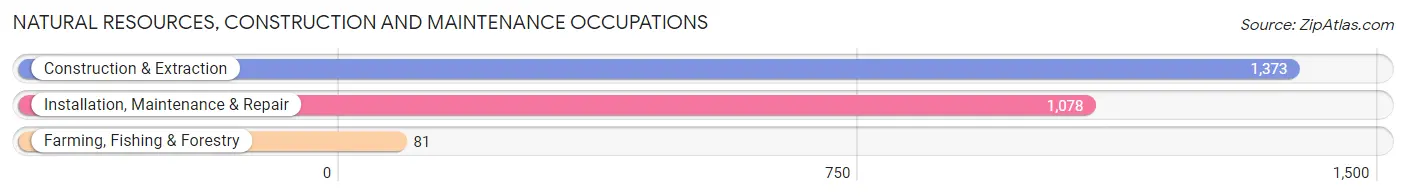
Natural Resources, Construction and Maintenance Occupations
The most common Natural Resources, Construction and Maintenance occupations in Bloomington are Construction & Extraction (1,373 | 2.8%), Installation, Maintenance & Repair (1,078 | 2.2%), and Farming, Fishing & Forestry (81 | 0.2%).
Natural Resources, Construction and Maintenance Occupations by Sex
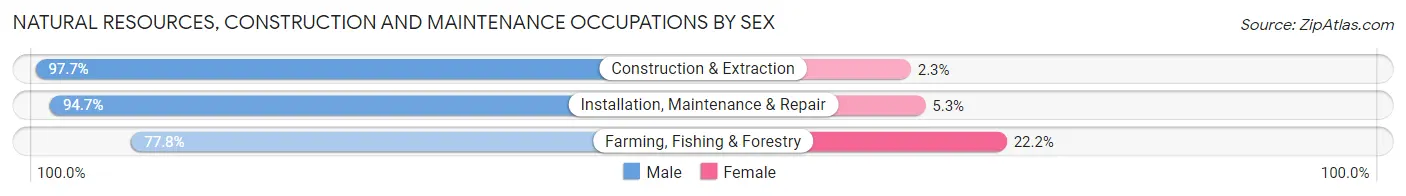
| Occupation | Male | Female |
| Farming, Fishing & Forestry | 63 (77.8%) | 18 (22.2%) |
| Construction & Extraction | 1,342 (97.7%) | 31 (2.3%) |
| Installation, Maintenance & Repair | 1,021 (94.7%) | 57 (5.3%) |
| Total (Category) | 2,426 (95.8%) | 106 (4.2%) |
| Total (Overall) | 25,433 (52.3%) | 23,156 (47.7%) |
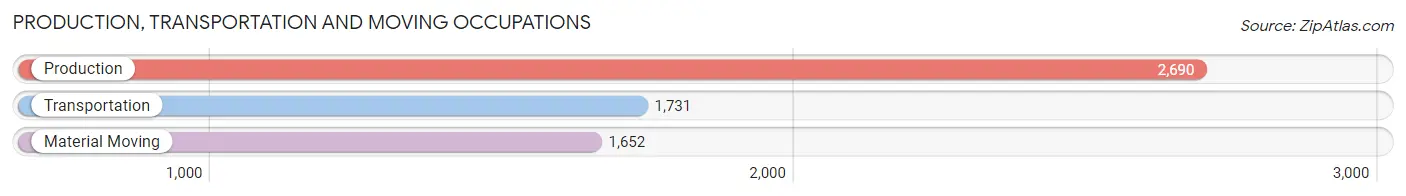
Production, Transportation and Moving Occupations
The most common Production, Transportation and Moving occupations in Bloomington are Production (2,690 | 5.5%), Transportation (1,731 | 3.6%), and Material Moving (1,652 | 3.4%).
Production, Transportation and Moving Occupations by Sex
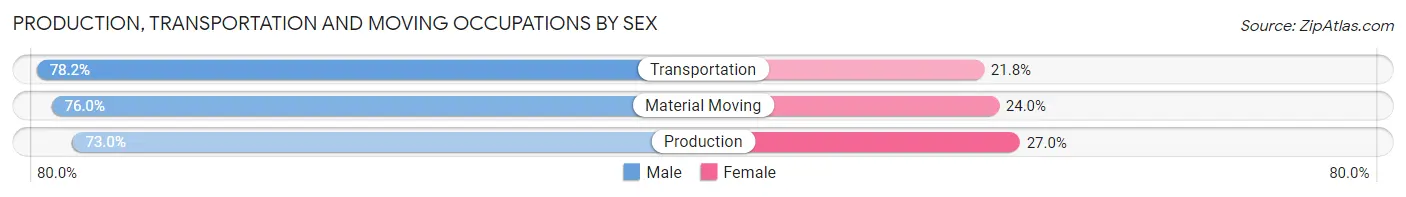
| Occupation | Male | Female |
| Production | 1,963 (73.0%) | 727 (27.0%) |
| Transportation | 1,354 (78.2%) | 377 (21.8%) |
| Material Moving | 1,256 (76.0%) | 396 (24.0%) |
| Total (Category) | 4,573 (75.3%) | 1,500 (24.7%) |
| Total (Overall) | 25,433 (52.3%) | 23,156 (47.7%) |
Employment Industries by Sex in Bloomington
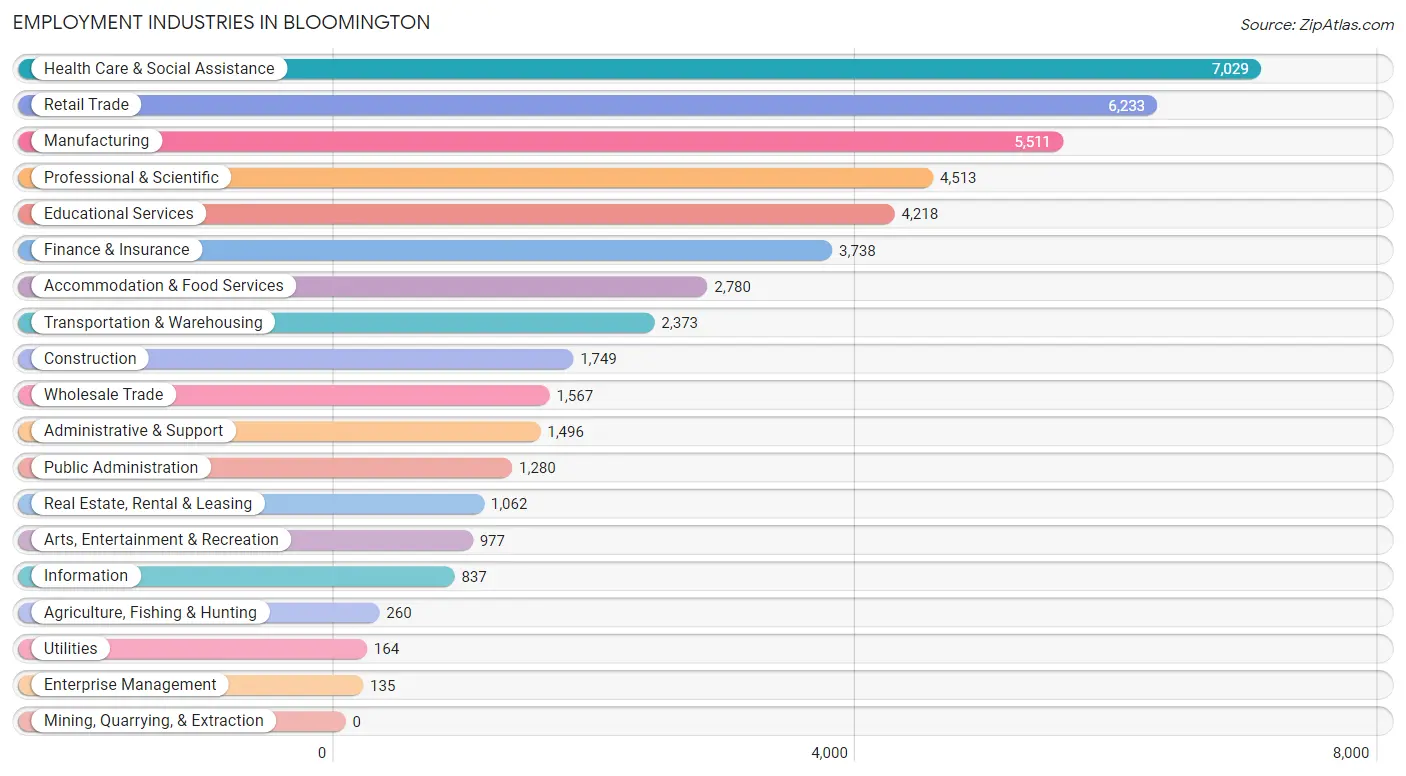
Employment Industries in Bloomington
The major employment industries in Bloomington include Health Care & Social Assistance (7,029 | 14.5%), Retail Trade (6,233 | 12.8%), Manufacturing (5,511 | 11.3%), Professional & Scientific (4,513 | 9.3%), and Educational Services (4,218 | 8.7%).
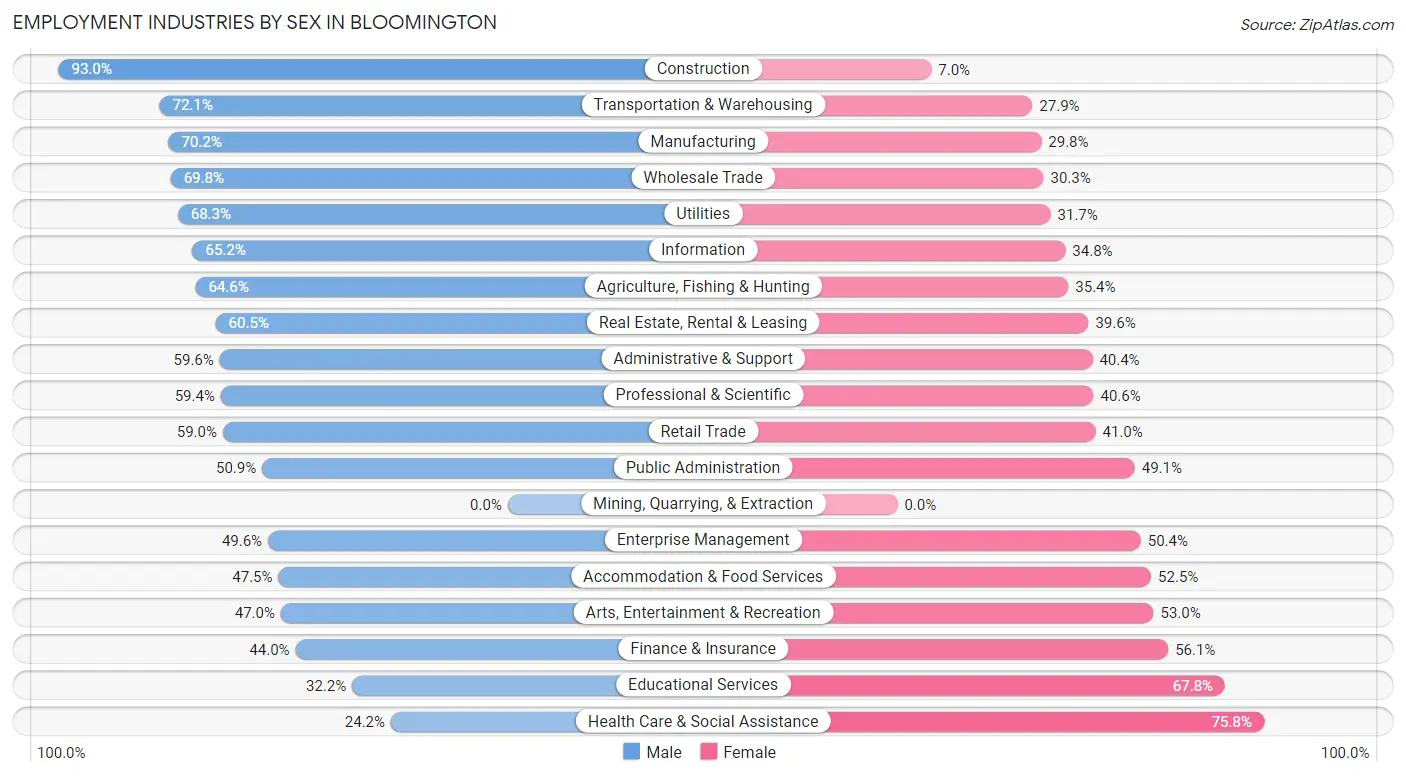
Employment Industries by Sex in Bloomington
The Bloomington industries that see more men than women are Construction (93.0%), Transportation & Warehousing (72.1%), and Manufacturing (70.2%), whereas the industries that tend to have a higher number of women are Health Care & Social Assistance (75.8%), Educational Services (67.8%), and Finance & Insurance (56.0%).
| Industry | Male | Female |
| Agriculture, Fishing & Hunting | 168 (64.6%) | 92 (35.4%) |
| Mining, Quarrying, & Extraction | 0 (0.0%) | 0 (0.0%) |
| Construction | 1,626 (93.0%) | 123 (7.0%) |
| Manufacturing | 3,869 (70.2%) | 1,642 (29.8%) |
| Wholesale Trade | 1,093 (69.8%) | 474 (30.2%) |
| Retail Trade | 3,676 (59.0%) | 2,557 (41.0%) |
| Transportation & Warehousing | 1,710 (72.1%) | 663 (27.9%) |
| Utilities | 112 (68.3%) | 52 (31.7%) |
| Information | 546 (65.2%) | 291 (34.8%) |
| Finance & Insurance | 1,643 (44.0%) | 2,095 (56.0%) |
| Real Estate, Rental & Leasing | 642 (60.5%) | 420 (39.6%) |
| Professional & Scientific | 2,681 (59.4%) | 1,832 (40.6%) |
| Enterprise Management | 67 (49.6%) | 68 (50.4%) |
| Administrative & Support | 892 (59.6%) | 604 (40.4%) |
| Educational Services | 1,359 (32.2%) | 2,859 (67.8%) |
| Health Care & Social Assistance | 1,700 (24.2%) | 5,329 (75.8%) |
| Arts, Entertainment & Recreation | 459 (47.0%) | 518 (53.0%) |
| Accommodation & Food Services | 1,320 (47.5%) | 1,460 (52.5%) |
| Public Administration | 651 (50.9%) | 629 (49.1%) |
| Total | 25,433 (52.3%) | 23,156 (47.7%) |
Education in Bloomington
School Enrollment in Bloomington
The most common levels of schooling among the 19,101 students in Bloomington are high school (4,337 | 22.7%), middle school (3,932 | 20.6%), and elementary school (3,470 | 18.2%).
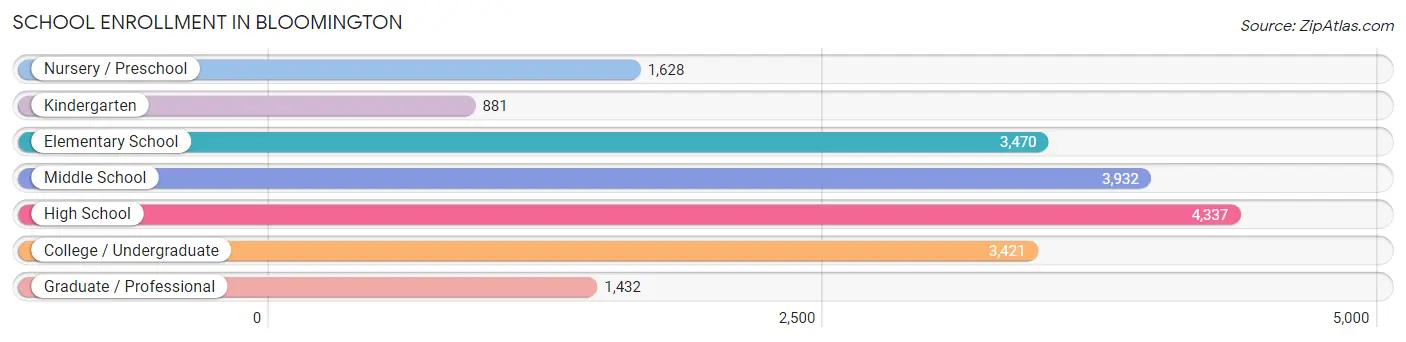
| School Level | # Students | % Students |
| Nursery / Preschool | 1,628 | 8.5% |
| Kindergarten | 881 | 4.6% |
| Elementary School | 3,470 | 18.2% |
| Middle School | 3,932 | 20.6% |
| High School | 4,337 | 22.7% |
| College / Undergraduate | 3,421 | 17.9% |
| Graduate / Professional | 1,432 | 7.5% |
| Total | 19,101 | 100.0% |
School Enrollment by Age by Funding Source in Bloomington
Out of a total of 19,101 students who are enrolled in schools in Bloomington, 3,304 (17.3%) attend a private institution, while the remaining 15,797 (82.7%) are enrolled in public schools. The age group of 35 years and over has the highest likelihood of being enrolled in private schools, with 476 (36.8% in the age bracket) enrolled. Conversely, the age group of 18 to 19 year olds has the lowest likelihood of being enrolled in a private school, with 1,182 (91.7% in the age bracket) attending a public institution.
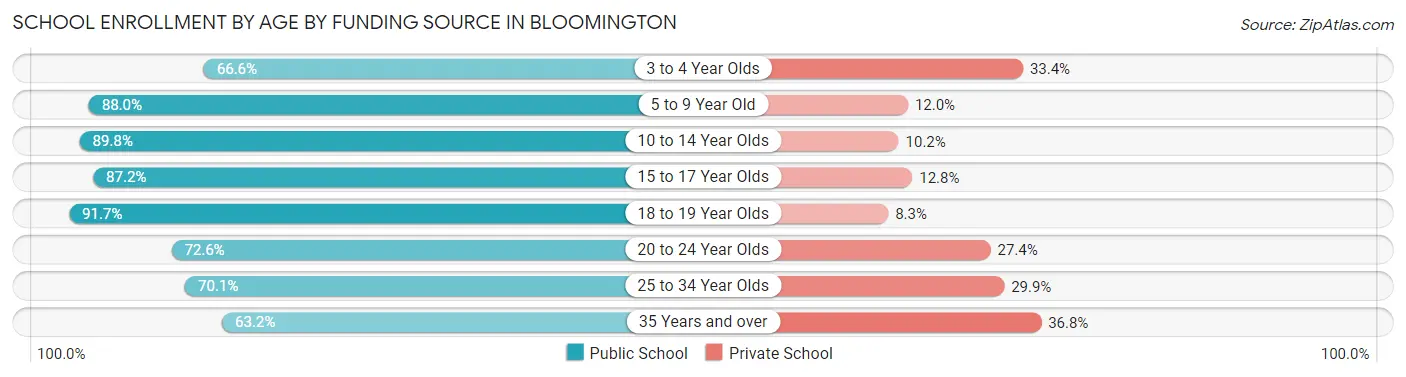
| Age Bracket | Public School | Private School |
| 3 to 4 Year Olds | 848 (66.6%) | 425 (33.4%) |
| 5 to 9 Year Old | 3,845 (88.0%) | 523 (12.0%) |
| 10 to 14 Year Olds | 4,124 (89.8%) | 470 (10.2%) |
| 15 to 17 Year Olds | 2,724 (87.2%) | 399 (12.8%) |
| 18 to 19 Year Olds | 1,182 (91.7%) | 107 (8.3%) |
| 20 to 24 Year Olds | 1,309 (72.6%) | 493 (27.4%) |
| 25 to 34 Year Olds | 952 (70.1%) | 406 (29.9%) |
| 35 Years and over | 818 (63.2%) | 476 (36.8%) |
| Total | 15,797 (82.7%) | 3,304 (17.3%) |
Educational Attainment by Field of Study in Bloomington
Business (7,041 | 21.7%), education (3,550 | 10.9%), social sciences (2,806 | 8.6%), science & technology (2,655 | 8.2%), and communications (1,938 | 6.0%) are the most common fields of study among 32,502 individuals in Bloomington who have obtained a bachelor's degree or higher.
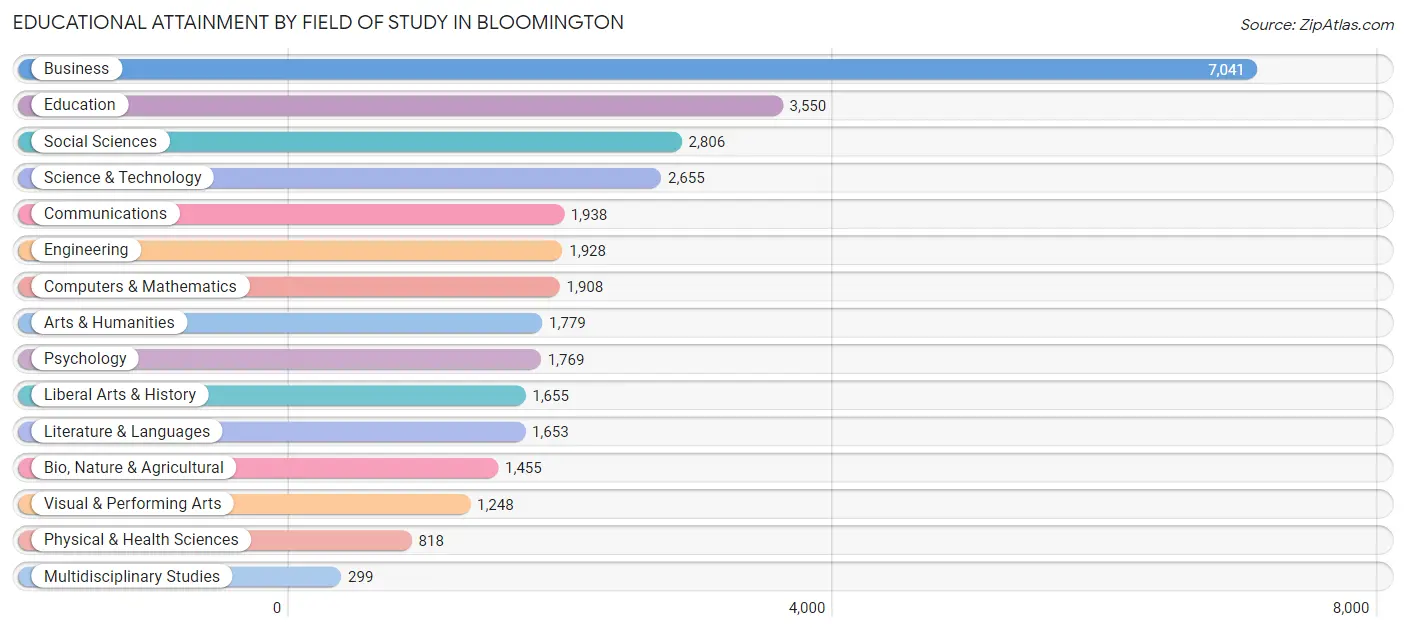
| Field of Study | # Graduates | % Graduates |
| Computers & Mathematics | 1,908 | 5.9% |
| Bio, Nature & Agricultural | 1,455 | 4.5% |
| Physical & Health Sciences | 818 | 2.5% |
| Psychology | 1,769 | 5.4% |
| Social Sciences | 2,806 | 8.6% |
| Engineering | 1,928 | 5.9% |
| Multidisciplinary Studies | 299 | 0.9% |
| Science & Technology | 2,655 | 8.2% |
| Business | 7,041 | 21.7% |
| Education | 3,550 | 10.9% |
| Literature & Languages | 1,653 | 5.1% |
| Liberal Arts & History | 1,655 | 5.1% |
| Visual & Performing Arts | 1,248 | 3.8% |
| Communications | 1,938 | 6.0% |
| Arts & Humanities | 1,779 | 5.5% |
| Total | 32,502 | 100.0% |
Transportation & Commute in Bloomington
Vehicle Availability by Sex in Bloomington
The most prevalent vehicle ownership categories in Bloomington are males with 2 vehicles (12,746, accounting for 50.9%) and females with 2 vehicles (11,209, making up 56.7%).
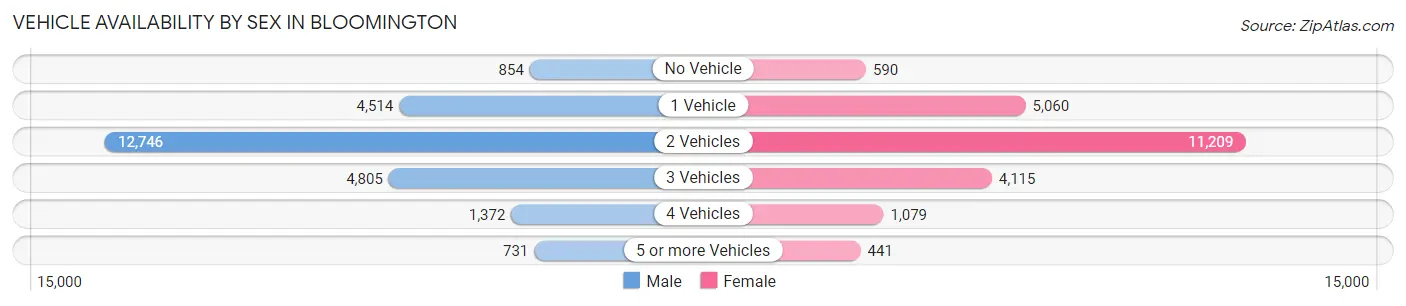
| Vehicles Available | Male | Female |
| No Vehicle | 854 (3.4%) | 590 (2.6%) |
| 1 Vehicle | 4,514 (18.0%) | 5,060 (22.5%) |
| 2 Vehicles | 12,746 (50.9%) | 11,209 (49.8%) |
| 3 Vehicles | 4,805 (19.2%) | 4,115 (18.3%) |
| 4 Vehicles | 1,372 (5.5%) | 1,079 (4.8%) |
| 5 or more Vehicles | 731 (2.9%) | 441 (2.0%) |
| Total | 25,022 (100.0%) | 22,494 (100.0%) |
Commute Time in Bloomington
The most frequently occuring commute durations in Bloomington are 15 to 19 minutes (8,350 commuters, 20.6%), 20 to 24 minutes (7,452 commuters, 18.4%), and 10 to 14 minutes (6,591 commuters, 16.3%).
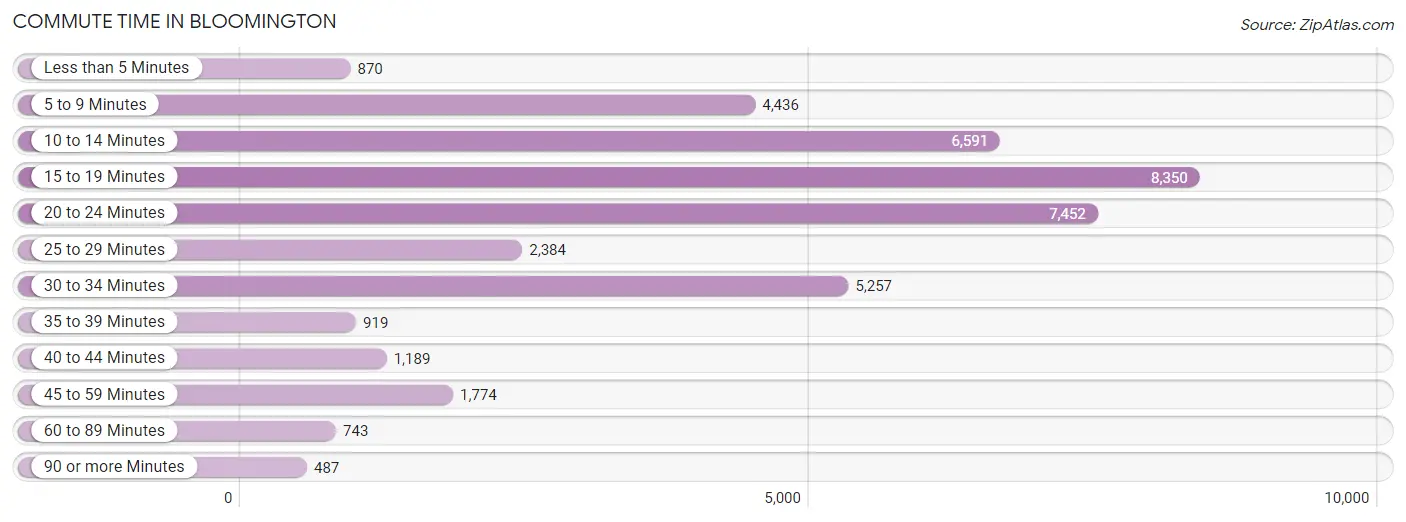
| Commute Time | # Commuters | % Commuters |
| Less than 5 Minutes | 870 | 2.1% |
| 5 to 9 Minutes | 4,436 | 11.0% |
| 10 to 14 Minutes | 6,591 | 16.3% |
| 15 to 19 Minutes | 8,350 | 20.6% |
| 20 to 24 Minutes | 7,452 | 18.4% |
| 25 to 29 Minutes | 2,384 | 5.9% |
| 30 to 34 Minutes | 5,257 | 13.0% |
| 35 to 39 Minutes | 919 | 2.3% |
| 40 to 44 Minutes | 1,189 | 2.9% |
| 45 to 59 Minutes | 1,774 | 4.4% |
| 60 to 89 Minutes | 743 | 1.8% |
| 90 or more Minutes | 487 | 1.2% |
Commute Time by Sex in Bloomington
The most common commute times in Bloomington are 15 to 19 minutes (3,965 commuters, 18.4%) for males and 15 to 19 minutes (4,385 commuters, 23.1%) for females.
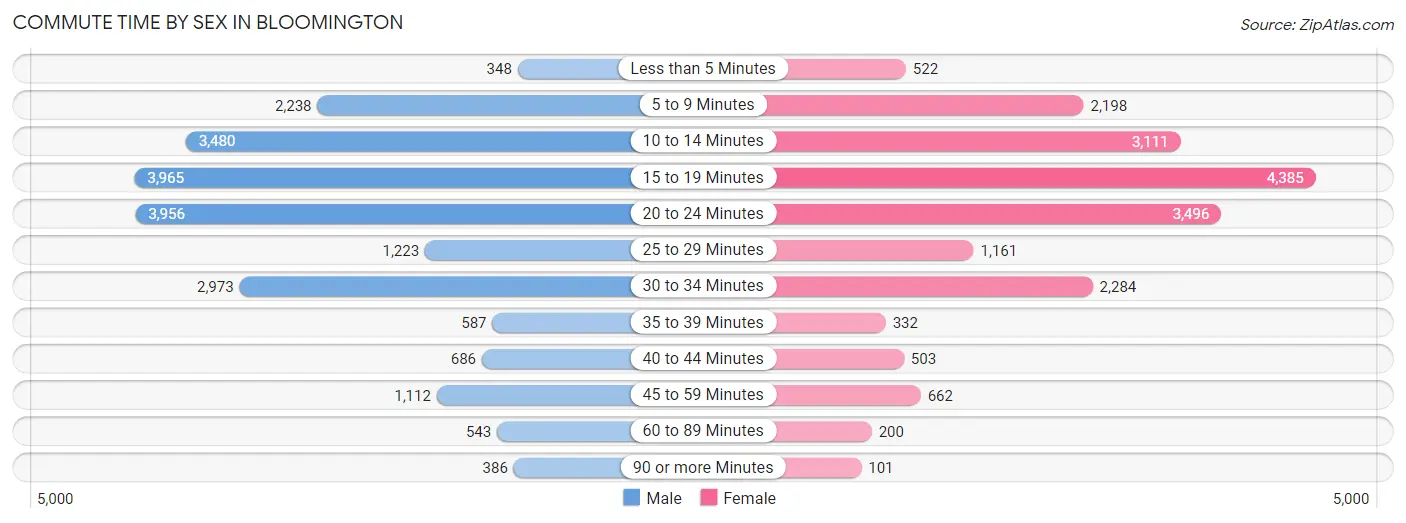
| Commute Time | Male | Female |
| Less than 5 Minutes | 348 (1.6%) | 522 (2.8%) |
| 5 to 9 Minutes | 2,238 (10.4%) | 2,198 (11.6%) |
| 10 to 14 Minutes | 3,480 (16.2%) | 3,111 (16.4%) |
| 15 to 19 Minutes | 3,965 (18.4%) | 4,385 (23.1%) |
| 20 to 24 Minutes | 3,956 (18.4%) | 3,496 (18.4%) |
| 25 to 29 Minutes | 1,223 (5.7%) | 1,161 (6.1%) |
| 30 to 34 Minutes | 2,973 (13.8%) | 2,284 (12.0%) |
| 35 to 39 Minutes | 587 (2.7%) | 332 (1.8%) |
| 40 to 44 Minutes | 686 (3.2%) | 503 (2.6%) |
| 45 to 59 Minutes | 1,112 (5.2%) | 662 (3.5%) |
| 60 to 89 Minutes | 543 (2.5%) | 200 (1.1%) |
| 90 or more Minutes | 386 (1.8%) | 101 (0.5%) |
Time of Departure to Work by Sex in Bloomington
The most frequent times of departure to work in Bloomington are 7:30 AM to 7:59 AM (3,442, 16.0%) for males and 7:30 AM to 7:59 AM (3,085, 16.3%) for females.
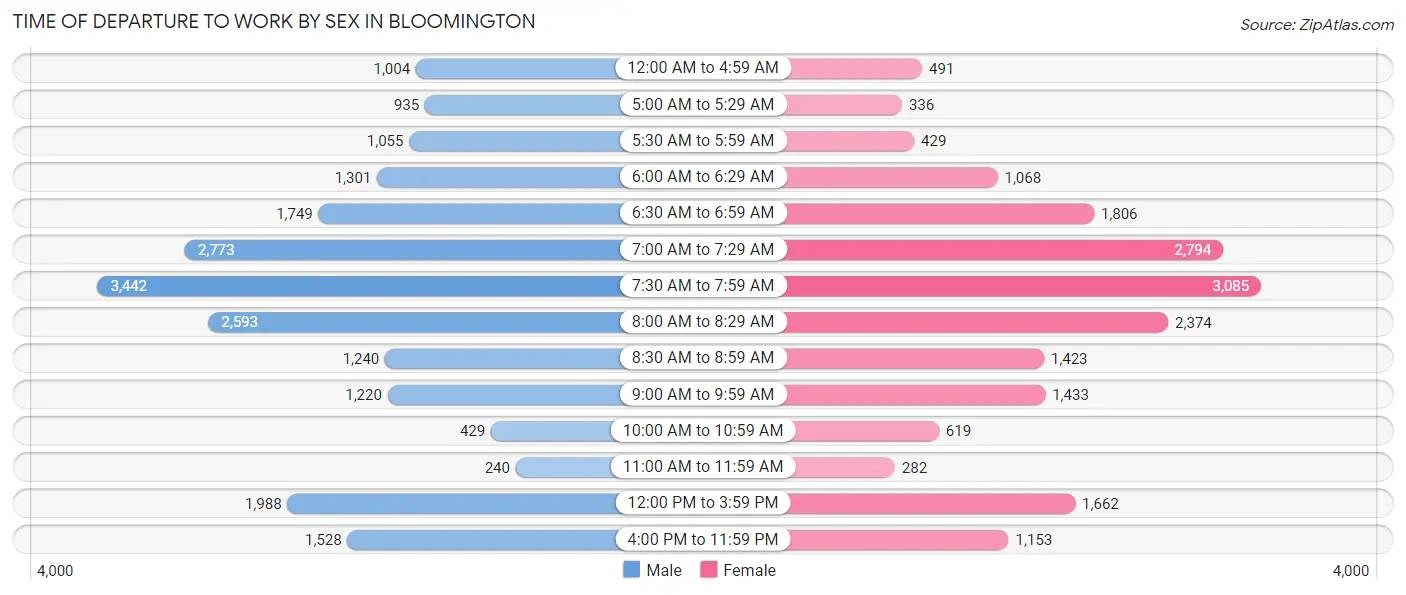
| Time of Departure | Male | Female |
| 12:00 AM to 4:59 AM | 1,004 (4.7%) | 491 (2.6%) |
| 5:00 AM to 5:29 AM | 935 (4.3%) | 336 (1.8%) |
| 5:30 AM to 5:59 AM | 1,055 (4.9%) | 429 (2.3%) |
| 6:00 AM to 6:29 AM | 1,301 (6.0%) | 1,068 (5.6%) |
| 6:30 AM to 6:59 AM | 1,749 (8.1%) | 1,806 (9.5%) |
| 7:00 AM to 7:29 AM | 2,773 (12.9%) | 2,794 (14.7%) |
| 7:30 AM to 7:59 AM | 3,442 (16.0%) | 3,085 (16.3%) |
| 8:00 AM to 8:29 AM | 2,593 (12.1%) | 2,374 (12.5%) |
| 8:30 AM to 8:59 AM | 1,240 (5.8%) | 1,423 (7.5%) |
| 9:00 AM to 9:59 AM | 1,220 (5.7%) | 1,433 (7.6%) |
| 10:00 AM to 10:59 AM | 429 (2.0%) | 619 (3.3%) |
| 11:00 AM to 11:59 AM | 240 (1.1%) | 282 (1.5%) |
| 12:00 PM to 3:59 PM | 1,988 (9.2%) | 1,662 (8.8%) |
| 4:00 PM to 11:59 PM | 1,528 (7.1%) | 1,153 (6.1%) |
| Total | 21,497 (100.0%) | 18,955 (100.0%) |
Housing Occupancy in Bloomington
Occupancy by Ownership in Bloomington
Of the total 37,653 dwellings in Bloomington, owner-occupied units account for 25,244 (67.0%), while renter-occupied units make up 12,409 (33.0%).
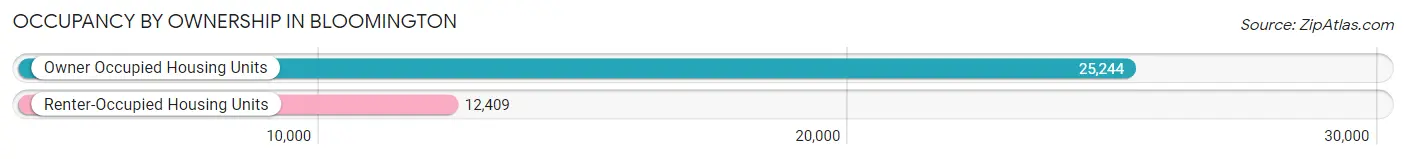
| Occupancy | # Housing Units | % Housing Units |
| Owner Occupied Housing Units | 25,244 | 67.0% |
| Renter-Occupied Housing Units | 12,409 | 33.0% |
| Total Occupied Housing Units | 37,653 | 100.0% |
Occupancy by Household Size in Bloomington
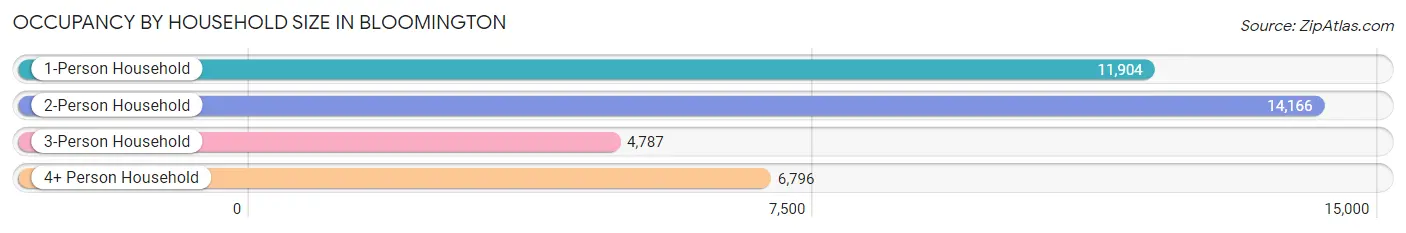
| Household Size | # Housing Units | % Housing Units |
| 1-Person Household | 11,904 | 31.6% |
| 2-Person Household | 14,166 | 37.6% |
| 3-Person Household | 4,787 | 12.7% |
| 4+ Person Household | 6,796 | 18.0% |
| Total Housing Units | 37,653 | 100.0% |
Occupancy by Ownership by Household Size in Bloomington
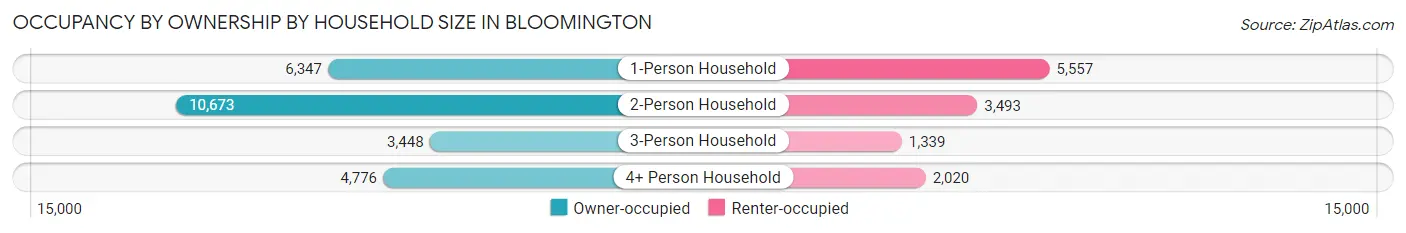
| Household Size | Owner-occupied | Renter-occupied |
| 1-Person Household | 6,347 (53.3%) | 5,557 (46.7%) |
| 2-Person Household | 10,673 (75.3%) | 3,493 (24.7%) |
| 3-Person Household | 3,448 (72.0%) | 1,339 (28.0%) |
| 4+ Person Household | 4,776 (70.3%) | 2,020 (29.7%) |
| Total Housing Units | 25,244 (67.0%) | 12,409 (33.0%) |
Occupancy by Educational Attainment in Bloomington
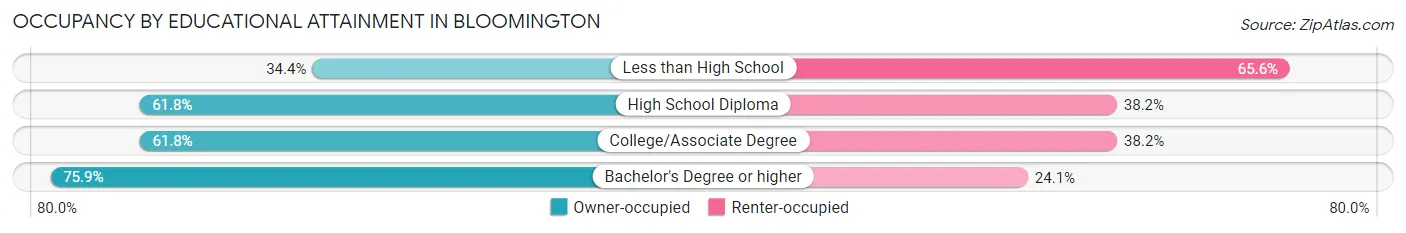
| Household Size | Owner-occupied | Renter-occupied |
| Less than High School | 647 (34.4%) | 1,235 (65.6%) |
| High School Diploma | 4,056 (61.8%) | 2,505 (38.2%) |
| College/Associate Degree | 7,156 (61.8%) | 4,427 (38.2%) |
| Bachelor's Degree or higher | 13,385 (75.9%) | 4,242 (24.1%) |
Occupancy by Age of Householder in Bloomington
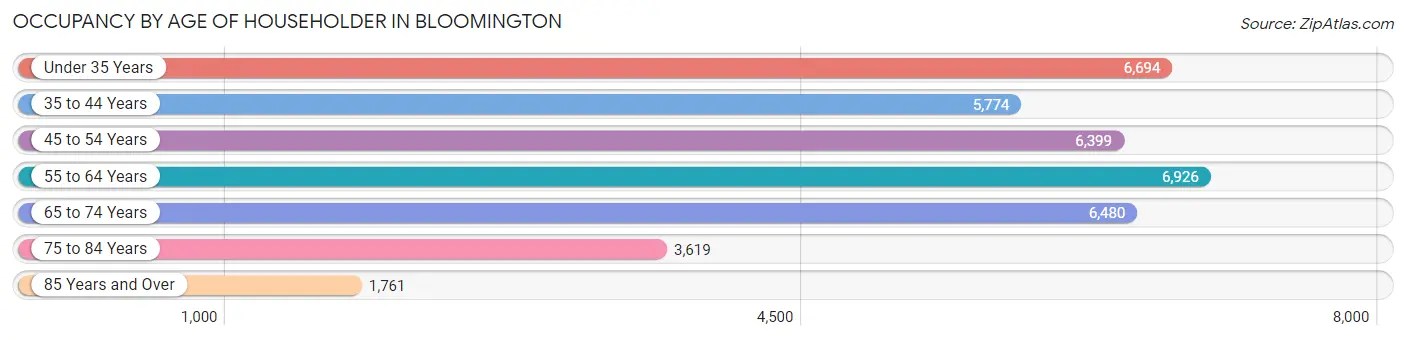
| Age Bracket | # Households | % Households |
| Under 35 Years | 6,694 | 17.8% |
| 35 to 44 Years | 5,774 | 15.3% |
| 45 to 54 Years | 6,399 | 17.0% |
| 55 to 64 Years | 6,926 | 18.4% |
| 65 to 74 Years | 6,480 | 17.2% |
| 75 to 84 Years | 3,619 | 9.6% |
| 85 Years and Over | 1,761 | 4.7% |
| Total | 37,653 | 100.0% |
Housing Finances in Bloomington
Median Income by Occupancy in Bloomington
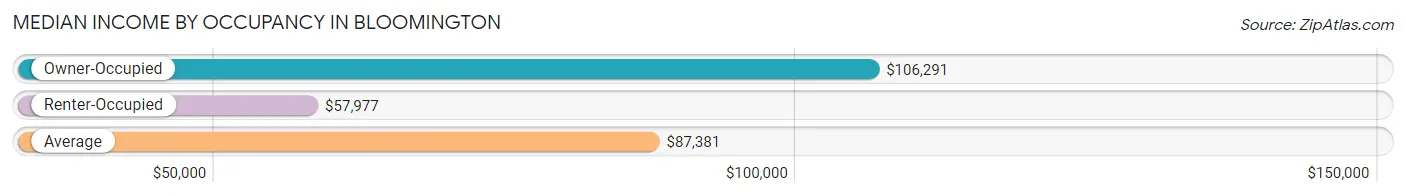
| Occupancy Type | # Households | Median Income |
| Owner-Occupied | 25,244 (67.0%) | $106,291 |
| Renter-Occupied | 12,409 (33.0%) | $57,977 |
| Average | 37,653 (100.0%) | $87,381 |
Occupancy by Householder Income Bracket in Bloomington
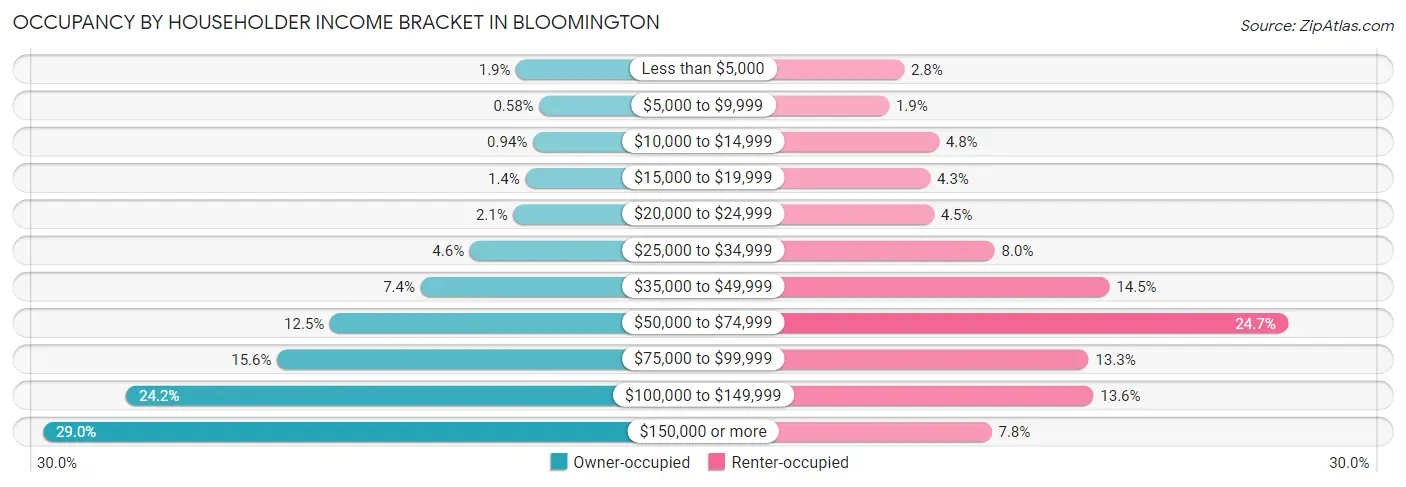
| Income Bracket | Owner-occupied | Renter-occupied |
| Less than $5,000 | 479 (1.9%) | 344 (2.8%) |
| $5,000 to $9,999 | 146 (0.6%) | 237 (1.9%) |
| $10,000 to $14,999 | 237 (0.9%) | 591 (4.8%) |
| $15,000 to $19,999 | 345 (1.4%) | 529 (4.3%) |
| $20,000 to $24,999 | 521 (2.1%) | 555 (4.5%) |
| $25,000 to $34,999 | 1,148 (4.5%) | 987 (8.0%) |
| $35,000 to $49,999 | 1,857 (7.4%) | 1,801 (14.5%) |
| $50,000 to $74,999 | 3,166 (12.5%) | 3,063 (24.7%) |
| $75,000 to $99,999 | 3,927 (15.6%) | 1,652 (13.3%) |
| $100,000 to $149,999 | 6,110 (24.2%) | 1,686 (13.6%) |
| $150,000 or more | 7,308 (28.9%) | 964 (7.8%) |
| Total | 25,244 (100.0%) | 12,409 (100.0%) |
Monthly Housing Cost Tiers in Bloomington
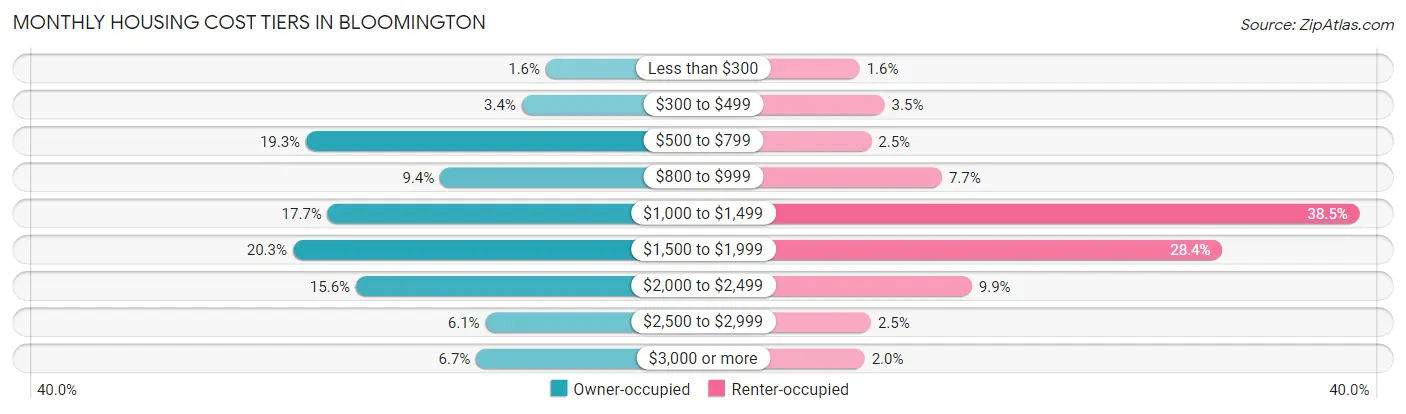
| Monthly Cost | Owner-occupied | Renter-occupied |
| Less than $300 | 406 (1.6%) | 203 (1.6%) |
| $300 to $499 | 856 (3.4%) | 432 (3.5%) |
| $500 to $799 | 4,866 (19.3%) | 310 (2.5%) |
| $800 to $999 | 2,372 (9.4%) | 955 (7.7%) |
| $1,000 to $1,499 | 4,463 (17.7%) | 4,773 (38.5%) |
| $1,500 to $1,999 | 5,111 (20.3%) | 3,518 (28.3%) |
| $2,000 to $2,499 | 3,939 (15.6%) | 1,228 (9.9%) |
| $2,500 to $2,999 | 1,530 (6.1%) | 306 (2.5%) |
| $3,000 or more | 1,701 (6.7%) | 250 (2.0%) |
| Total | 25,244 (100.0%) | 12,409 (100.0%) |
Physical Housing Characteristics in Bloomington
Housing Structures in Bloomington
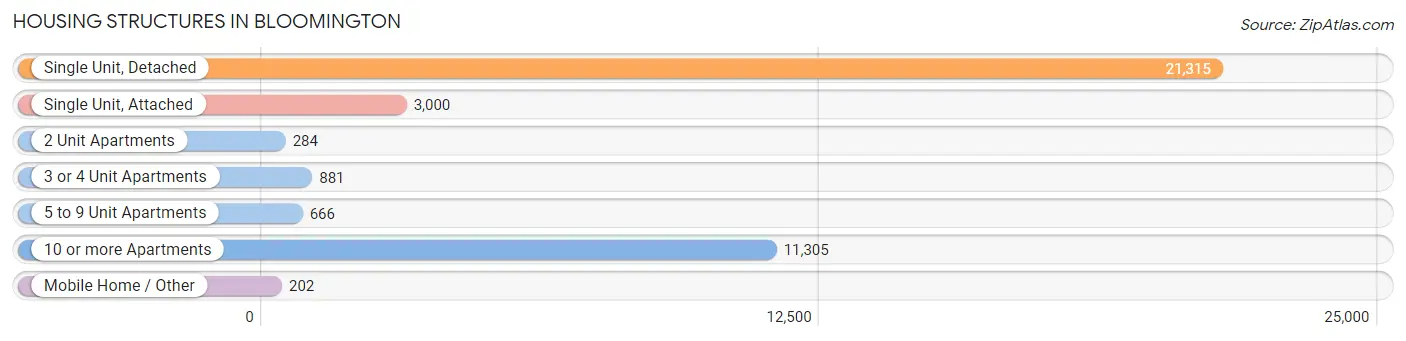
| Structure Type | # Housing Units | % Housing Units |
| Single Unit, Detached | 21,315 | 56.6% |
| Single Unit, Attached | 3,000 | 8.0% |
| 2 Unit Apartments | 284 | 0.7% |
| 3 or 4 Unit Apartments | 881 | 2.3% |
| 5 to 9 Unit Apartments | 666 | 1.8% |
| 10 or more Apartments | 11,305 | 30.0% |
| Mobile Home / Other | 202 | 0.5% |
| Total | 37,653 | 100.0% |
Housing Structures by Occupancy in Bloomington
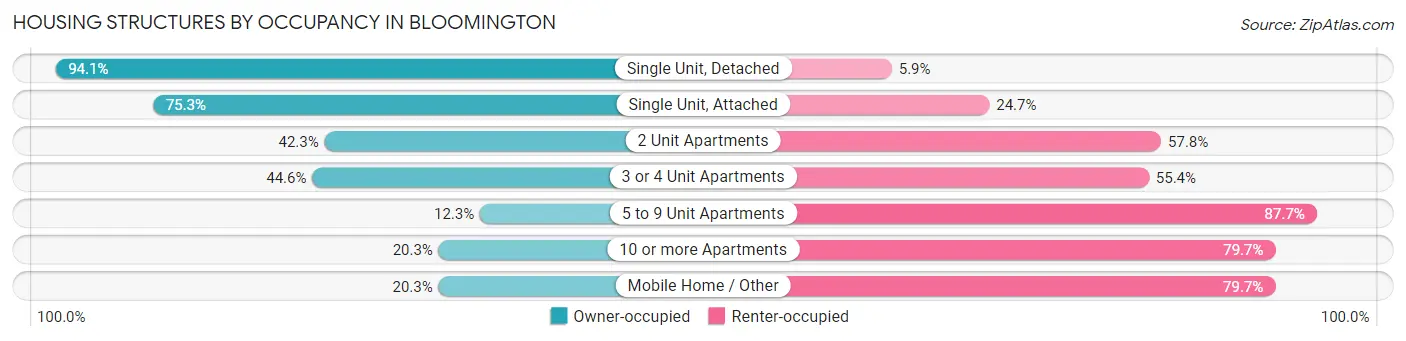
| Structure Type | Owner-occupied | Renter-occupied |
| Single Unit, Detached | 20,057 (94.1%) | 1,258 (5.9%) |
| Single Unit, Attached | 2,260 (75.3%) | 740 (24.7%) |
| 2 Unit Apartments | 120 (42.2%) | 164 (57.8%) |
| 3 or 4 Unit Apartments | 393 (44.6%) | 488 (55.4%) |
| 5 to 9 Unit Apartments | 82 (12.3%) | 584 (87.7%) |
| 10 or more Apartments | 2,291 (20.3%) | 9,014 (79.7%) |
| Mobile Home / Other | 41 (20.3%) | 161 (79.7%) |
| Total | 25,244 (67.0%) | 12,409 (33.0%) |
Housing Structures by Number of Rooms in Bloomington
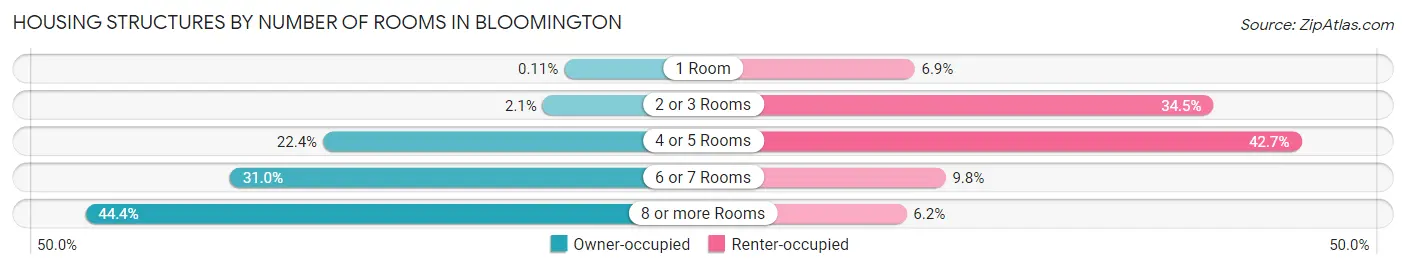
| Number of Rooms | Owner-occupied | Renter-occupied |
| 1 Room | 27 (0.1%) | 856 (6.9%) |
| 2 or 3 Rooms | 527 (2.1%) | 4,285 (34.5%) |
| 4 or 5 Rooms | 5,656 (22.4%) | 5,294 (42.7%) |
| 6 or 7 Rooms | 7,831 (31.0%) | 1,211 (9.8%) |
| 8 or more Rooms | 11,203 (44.4%) | 763 (6.1%) |
| Total | 25,244 (100.0%) | 12,409 (100.0%) |
Housing Structure by Heating Type in Bloomington
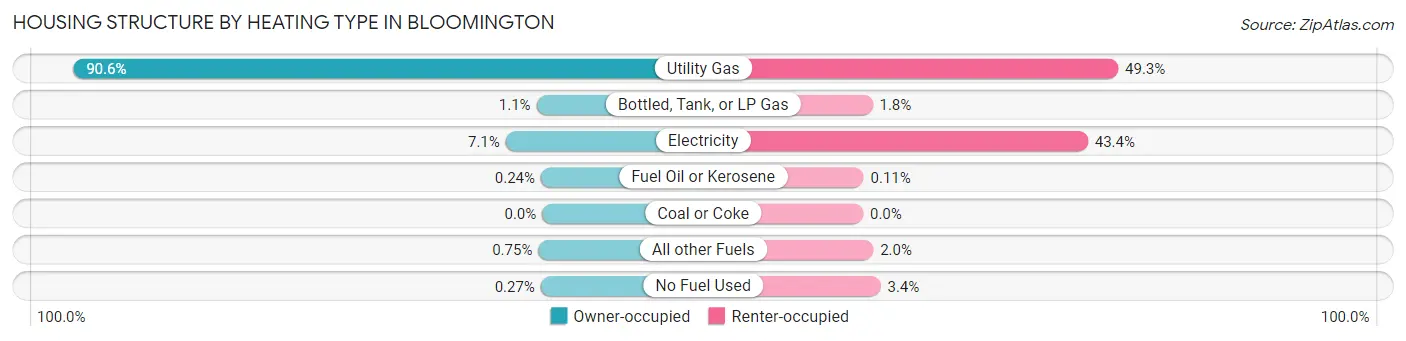
| Heating Type | Owner-occupied | Renter-occupied |
| Utility Gas | 22,871 (90.6%) | 6,116 (49.3%) |
| Bottled, Tank, or LP Gas | 275 (1.1%) | 227 (1.8%) |
| Electricity | 1,780 (7.0%) | 5,389 (43.4%) |
| Fuel Oil or Kerosene | 61 (0.2%) | 14 (0.1%) |
| Coal or Coke | 0 (0.0%) | 0 (0.0%) |
| All other Fuels | 189 (0.7%) | 243 (2.0%) |
| No Fuel Used | 68 (0.3%) | 420 (3.4%) |
| Total | 25,244 (100.0%) | 12,409 (100.0%) |
Household Vehicle Usage in Bloomington
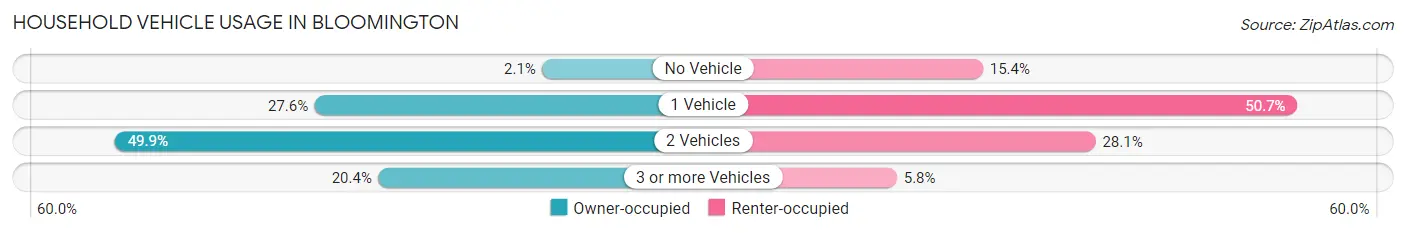
| Vehicles per Household | Owner-occupied | Renter-occupied |
| No Vehicle | 525 (2.1%) | 1,916 (15.4%) |
| 1 Vehicle | 6,962 (27.6%) | 6,289 (50.7%) |
| 2 Vehicles | 12,598 (49.9%) | 3,483 (28.1%) |
| 3 or more Vehicles | 5,159 (20.4%) | 721 (5.8%) |
| Total | 25,244 (100.0%) | 12,409 (100.0%) |
Real Estate & Mortgages in Bloomington
Real Estate and Mortgage Overview in Bloomington
| Characteristic | Without Mortgage | With Mortgage |
| Housing Units | 9,472 | 15,772 |
| Median Property Value | $322,000 | $329,600 |
| Median Household Income | $88,030 | $5,349 |
| Monthly Housing Costs | $733 | $1,629 |
| Real Estate Taxes | $3,626 | $136 |
Property Value by Mortgage Status in Bloomington
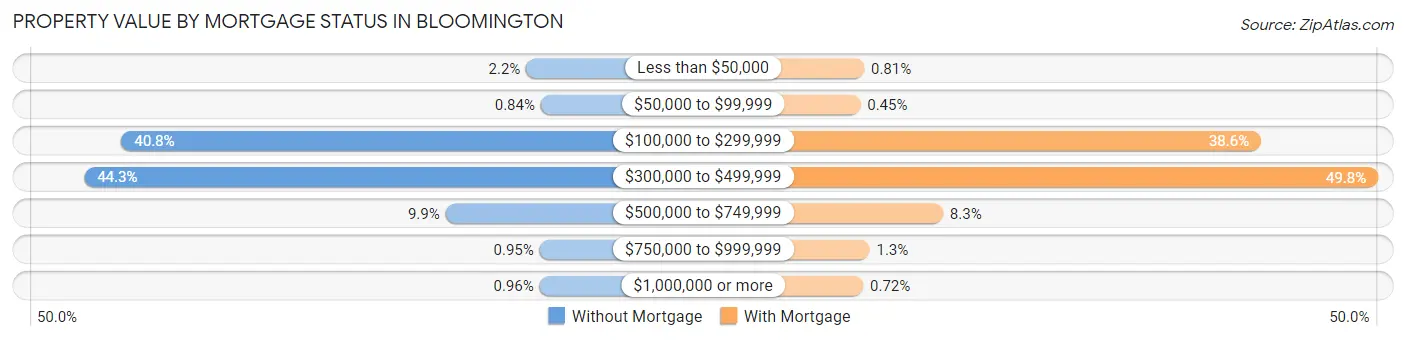
| Property Value | Without Mortgage | With Mortgage |
| Less than $50,000 | 211 (2.2%) | 128 (0.8%) |
| $50,000 to $99,999 | 80 (0.8%) | 71 (0.4%) |
| $100,000 to $299,999 | 3,863 (40.8%) | 6,089 (38.6%) |
| $300,000 to $499,999 | 4,198 (44.3%) | 7,848 (49.8%) |
| $500,000 to $749,999 | 939 (9.9%) | 1,313 (8.3%) |
| $750,000 to $999,999 | 90 (0.9%) | 209 (1.3%) |
| $1,000,000 or more | 91 (1.0%) | 114 (0.7%) |
| Total | 9,472 (100.0%) | 15,772 (100.0%) |
Household Income by Mortgage Status in Bloomington
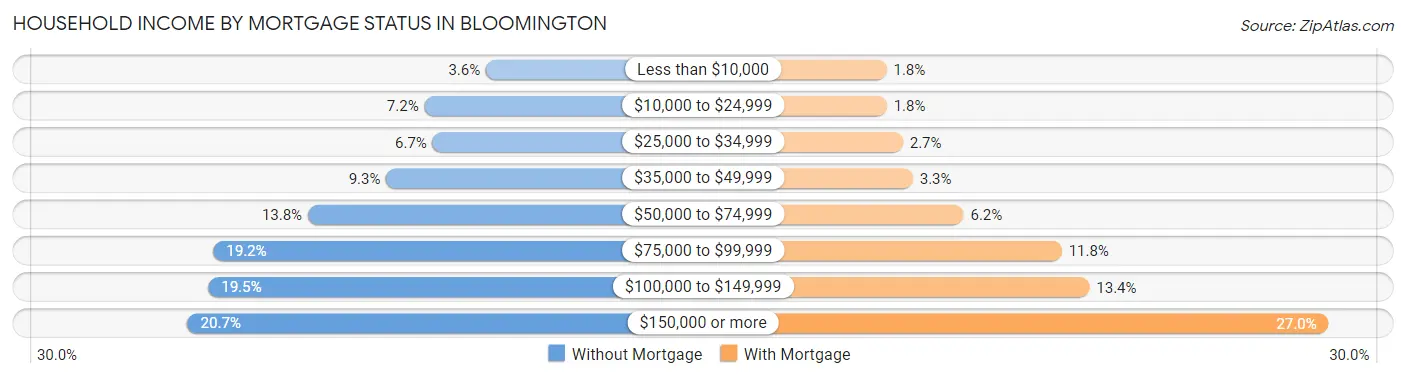
| Household Income | Without Mortgage | With Mortgage |
| Less than $10,000 | 344 (3.6%) | 279 (1.8%) |
| $10,000 to $24,999 | 677 (7.1%) | 281 (1.8%) |
| $25,000 to $34,999 | 633 (6.7%) | 426 (2.7%) |
| $35,000 to $49,999 | 884 (9.3%) | 515 (3.3%) |
| $50,000 to $74,999 | 1,308 (13.8%) | 973 (6.2%) |
| $75,000 to $99,999 | 1,820 (19.2%) | 1,858 (11.8%) |
| $100,000 to $149,999 | 1,847 (19.5%) | 2,107 (13.4%) |
| $150,000 or more | 1,959 (20.7%) | 4,263 (27.0%) |
| Total | 9,472 (100.0%) | 15,772 (100.0%) |
Property Value to Household Income Ratio in Bloomington
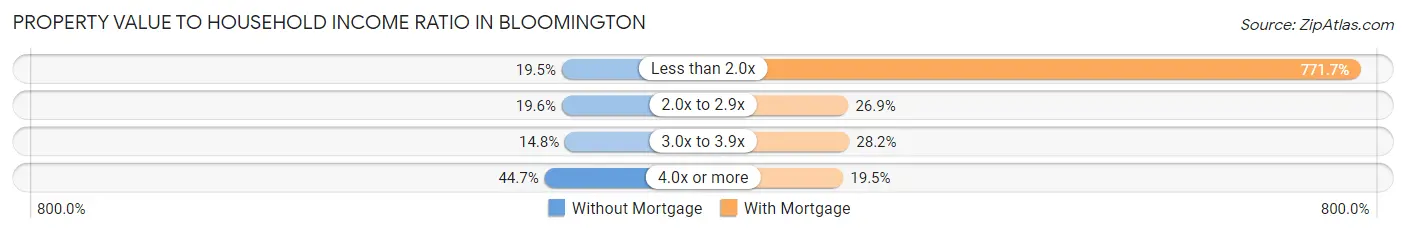
| Value-to-Income Ratio | Without Mortgage | With Mortgage |
| Less than 2.0x | 1,850 (19.5%) | 121,716 (771.7%) |
| 2.0x to 2.9x | 1,855 (19.6%) | 4,249 (26.9%) |
| 3.0x to 3.9x | 1,402 (14.8%) | 4,454 (28.2%) |
| 4.0x or more | 4,229 (44.7%) | 3,077 (19.5%) |
| Total | 9,472 (100.0%) | 15,772 (100.0%) |
Real Estate Taxes by Mortgage Status in Bloomington
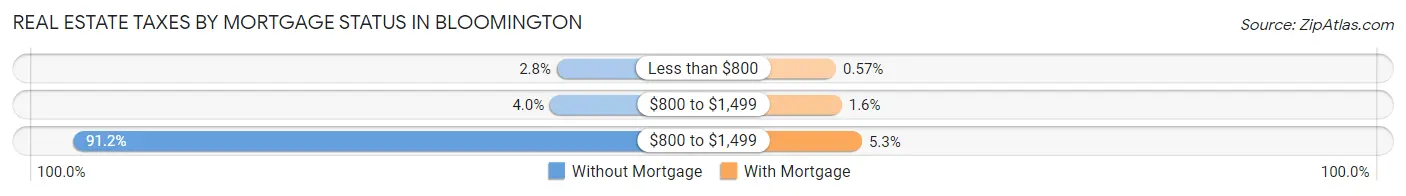
| Property Taxes | Without Mortgage | With Mortgage |
| Less than $800 | 264 (2.8%) | 90 (0.6%) |
| $800 to $1,499 | 382 (4.0%) | 252 (1.6%) |
| $800 to $1,499 | 8,634 (91.1%) | 835 (5.3%) |
| Total | 9,472 (100.0%) | 15,772 (100.0%) |
Health & Disability in Bloomington
Health Insurance Coverage by Age in Bloomington
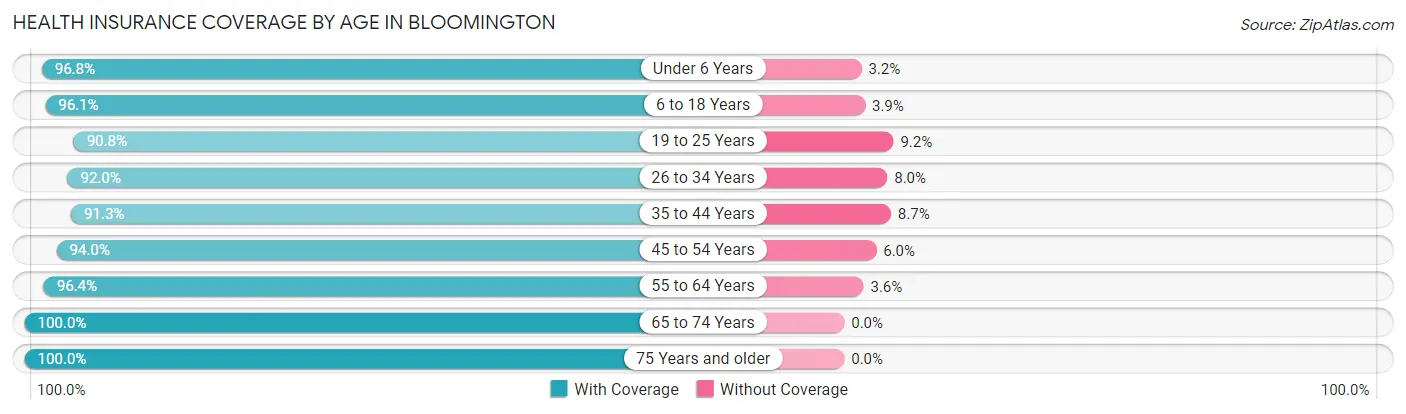
| Age Bracket | With Coverage | Without Coverage |
| Under 6 Years | 5,783 (96.8%) | 192 (3.2%) |
| 6 to 18 Years | 12,122 (96.1%) | 488 (3.9%) |
| 19 to 25 Years | 6,069 (90.8%) | 613 (9.2%) |
| 26 to 34 Years | 10,174 (92.0%) | 887 (8.0%) |
| 35 to 44 Years | 10,281 (91.3%) | 979 (8.7%) |
| 45 to 54 Years | 10,164 (94.0%) | 644 (6.0%) |
| 55 to 64 Years | 11,902 (96.4%) | 443 (3.6%) |
| 65 to 74 Years | 10,027 (100.0%) | 0 (0.0%) |
| 75 Years and older | 7,604 (100.0%) | 0 (0.0%) |
| Total | 84,126 (95.2%) | 4,246 (4.8%) |
Health Insurance Coverage by Citizenship Status in Bloomington
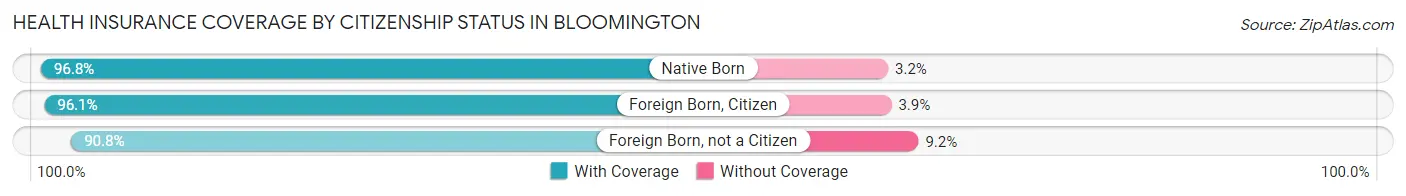
| Citizenship Status | With Coverage | Without Coverage |
| Native Born | 5,783 (96.8%) | 192 (3.2%) |
| Foreign Born, Citizen | 12,122 (96.1%) | 488 (3.9%) |
| Foreign Born, not a Citizen | 6,069 (90.8%) | 613 (9.2%) |
Health Insurance Coverage by Household Income in Bloomington
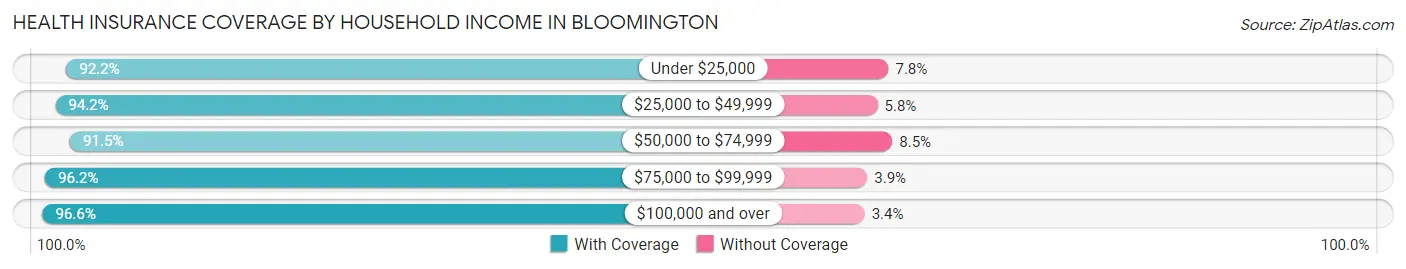
| Household Income | With Coverage | Without Coverage |
| Under $25,000 | 5,668 (92.2%) | 481 (7.8%) |
| $25,000 to $49,999 | 9,104 (94.2%) | 557 (5.8%) |
| $50,000 to $74,999 | 12,430 (91.5%) | 1,161 (8.5%) |
| $75,000 to $99,999 | 12,466 (96.2%) | 499 (3.8%) |
| $100,000 and over | 43,940 (96.6%) | 1,528 (3.4%) |
Public vs Private Health Insurance Coverage by Age in Bloomington
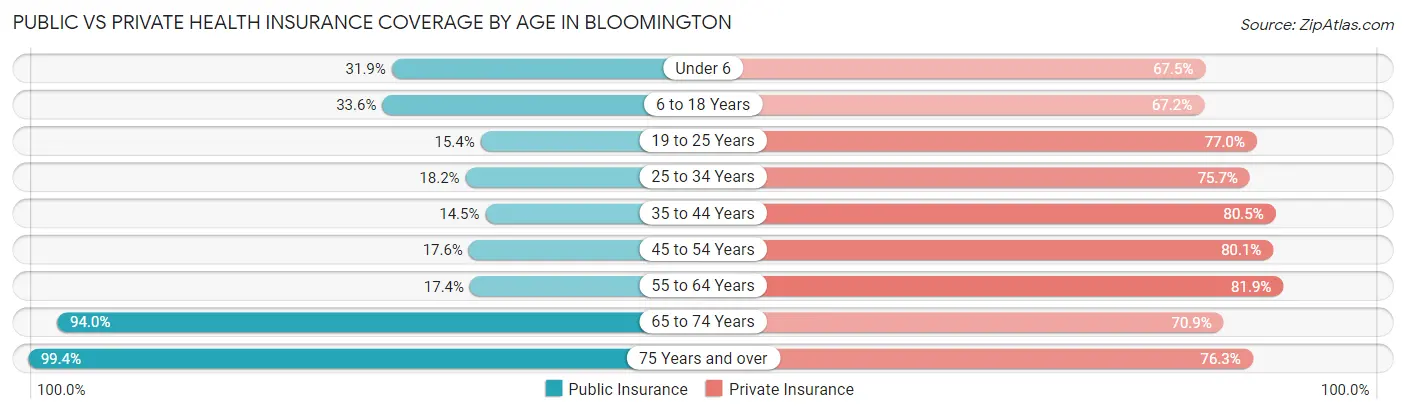
| Age Bracket | Public Insurance | Private Insurance |
| Under 6 | 1,905 (31.9%) | 4,030 (67.4%) |
| 6 to 18 Years | 4,239 (33.6%) | 8,477 (67.2%) |
| 19 to 25 Years | 1,027 (15.4%) | 5,147 (77.0%) |
| 25 to 34 Years | 2,011 (18.2%) | 8,374 (75.7%) |
| 35 to 44 Years | 1,630 (14.5%) | 9,065 (80.5%) |
| 45 to 54 Years | 1,899 (17.6%) | 8,654 (80.1%) |
| 55 to 64 Years | 2,142 (17.3%) | 10,113 (81.9%) |
| 65 to 74 Years | 9,422 (94.0%) | 7,104 (70.9%) |
| 75 Years and over | 7,559 (99.4%) | 5,798 (76.2%) |
| Total | 31,834 (36.0%) | 66,762 (75.5%) |
Disability Status by Sex by Age in Bloomington
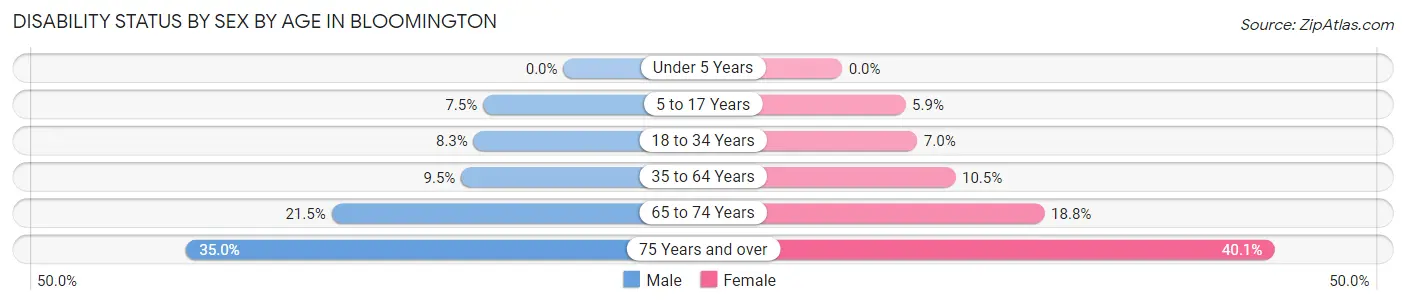
| Age Bracket | Male | Female |
| Under 5 Years | 0 (0.0%) | 0 (0.0%) |
| 5 to 17 Years | 464 (7.4%) | 357 (5.9%) |
| 18 to 34 Years | 828 (8.3%) | 622 (7.0%) |
| 35 to 64 Years | 1,633 (9.5%) | 1,806 (10.5%) |
| 65 to 74 Years | 991 (21.5%) | 1,018 (18.8%) |
| 75 Years and over | 1,020 (35.0%) | 1,881 (40.1%) |
Disability Class by Sex by Age in Bloomington
Disability Class: Hearing Difficulty
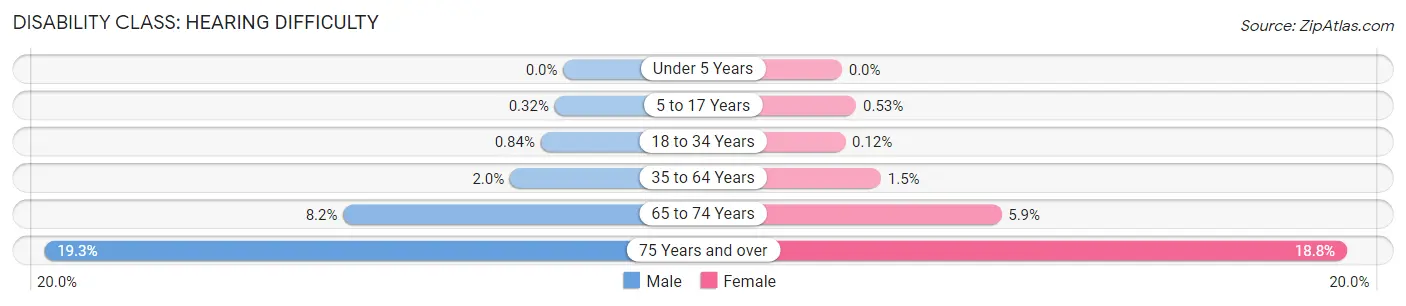
| Age Bracket | Male | Female |
| Under 5 Years | 0 (0.0%) | 0 (0.0%) |
| 5 to 17 Years | 20 (0.3%) | 32 (0.5%) |
| 18 to 34 Years | 83 (0.8%) | 11 (0.1%) |
| 35 to 64 Years | 341 (2.0%) | 249 (1.5%) |
| 65 to 74 Years | 376 (8.2%) | 321 (5.9%) |
| 75 Years and over | 562 (19.3%) | 879 (18.8%) |
Disability Class: Vision Difficulty
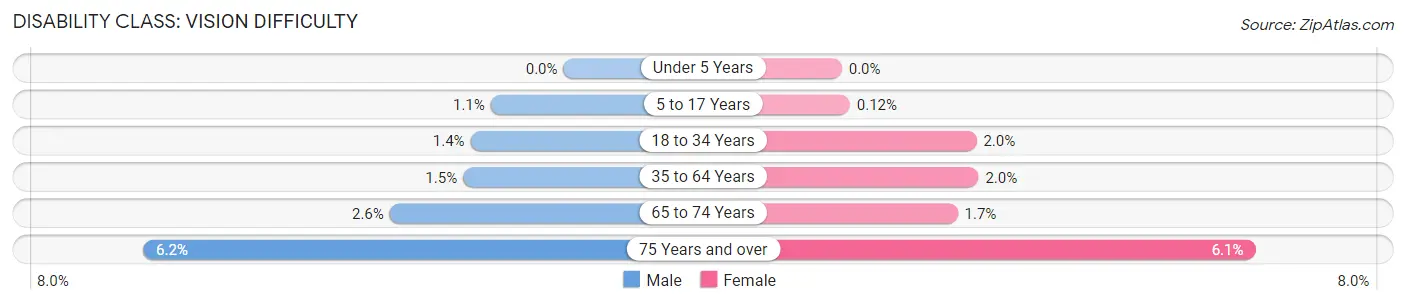
| Age Bracket | Male | Female |
| Under 5 Years | 0 (0.0%) | 0 (0.0%) |
| 5 to 17 Years | 67 (1.1%) | 7 (0.1%) |
| 18 to 34 Years | 137 (1.4%) | 178 (2.0%) |
| 35 to 64 Years | 257 (1.5%) | 349 (2.0%) |
| 65 to 74 Years | 119 (2.6%) | 93 (1.7%) |
| 75 Years and over | 182 (6.2%) | 288 (6.1%) |
Disability Class: Cognitive Difficulty
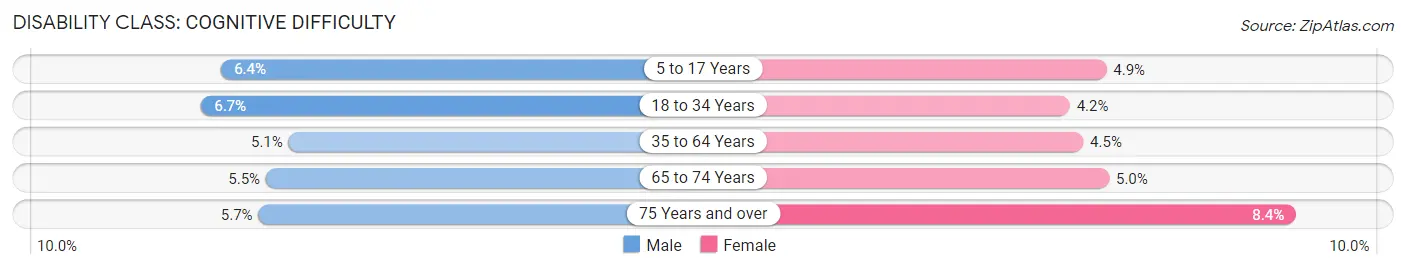
| Age Bracket | Male | Female |
| 5 to 17 Years | 395 (6.4%) | 298 (4.9%) |
| 18 to 34 Years | 668 (6.7%) | 377 (4.2%) |
| 35 to 64 Years | 878 (5.1%) | 770 (4.5%) |
| 65 to 74 Years | 254 (5.5%) | 269 (5.0%) |
| 75 Years and over | 165 (5.7%) | 395 (8.4%) |
Disability Class: Ambulatory Difficulty
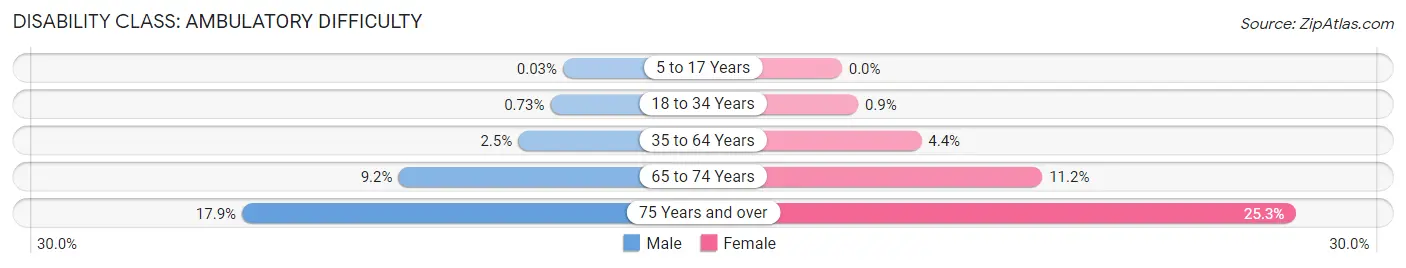
| Age Bracket | Male | Female |
| 5 to 17 Years | 2 (0.0%) | 0 (0.0%) |
| 18 to 34 Years | 73 (0.7%) | 80 (0.9%) |
| 35 to 64 Years | 434 (2.5%) | 761 (4.4%) |
| 65 to 74 Years | 423 (9.2%) | 605 (11.2%) |
| 75 Years and over | 522 (17.9%) | 1,186 (25.3%) |
Disability Class: Self-Care Difficulty
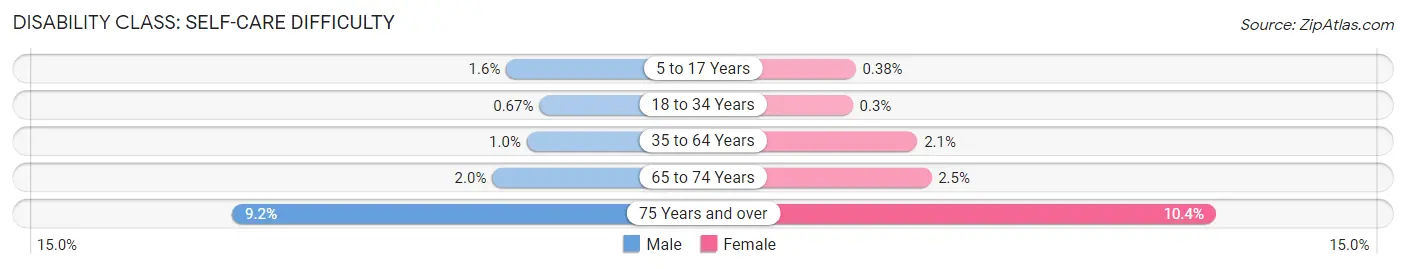
| Age Bracket | Male | Female |
| 5 to 17 Years | 99 (1.6%) | 23 (0.4%) |
| 18 to 34 Years | 67 (0.7%) | 27 (0.3%) |
| 35 to 64 Years | 175 (1.0%) | 361 (2.1%) |
| 65 to 74 Years | 91 (2.0%) | 135 (2.5%) |
| 75 Years and over | 269 (9.2%) | 488 (10.4%) |
Technology Access in Bloomington
Computing Device Access in Bloomington
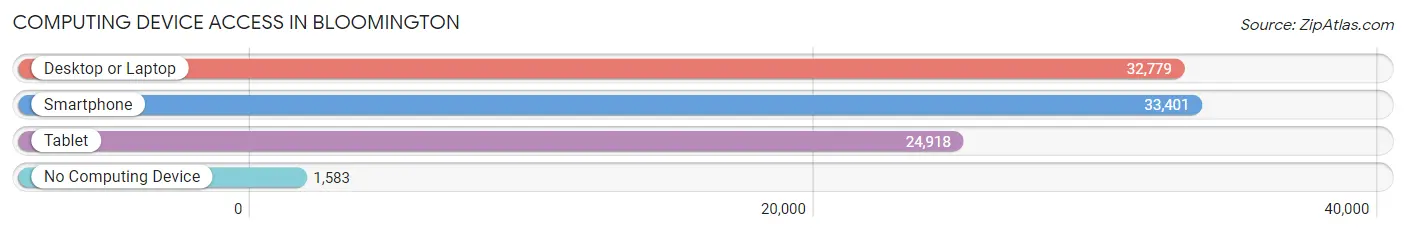
| Device Type | # Households | % Households |
| Desktop or Laptop | 32,779 | 87.1% |
| Smartphone | 33,401 | 88.7% |
| Tablet | 24,918 | 66.2% |
| No Computing Device | 1,583 | 4.2% |
| Total | 37,653 | 100.0% |
Internet Access in Bloomington
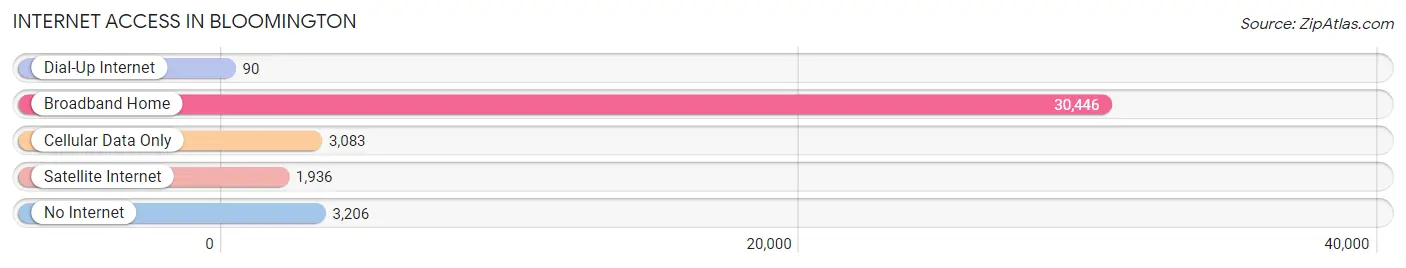
| Internet Type | # Households | % Households |
| Dial-Up Internet | 90 | 0.2% |
| Broadband Home | 30,446 | 80.9% |
| Cellular Data Only | 3,083 | 8.2% |
| Satellite Internet | 1,936 | 5.1% |
| No Internet | 3,206 | 8.5% |
| Total | 37,653 | 100.0% |
Bloomington Summary
Bloomington, Minnesota is a city located in Hennepin County, Minnesota, United States. It is the fifth largest city in the state and the largest suburb of Minneapolis-St. Paul. The city is located on the north bank of the Minnesota River, south of the Twin Cities metropolitan area. As of the 2010 census, the city had a population of 82,893, making it the largest suburb in the Twin Cities metropolitan area.
History
The area now known as Bloomington was originally inhabited by the Dakota and Ojibwe Native American tribes. The first European settlers arrived in the area in the early 1800s, and the city was officially incorporated in 1858. The city was named after Bloomington, Illinois, which was named after Bloomington, Indiana.
The city grew rapidly in the late 19th and early 20th centuries, and by the 1950s, it had become a major suburb of Minneapolis-St. Paul. The city experienced a population boom in the 1970s and 1980s, and by the 1990s, it had become the fifth largest city in Minnesota.
Geography
Bloomington is located in Hennepin County, Minnesota, and is situated on the north bank of the Minnesota River. The city is bordered by the cities of Richfield, Edina, and Minneapolis to the north, and by the cities of Burnsville and Eagan to the south. The city covers an area of 33.2 square miles, and has a population density of 2,500 people per square mile.
The city is located in the Central Hardwood Forest ecoregion, and is home to a variety of wildlife, including white-tailed deer, coyotes, foxes, and a variety of birds. The city is also home to several parks, including the Minnesota Valley National Wildlife Refuge, which is located along the Minnesota River.
Economy
Bloomington is home to a variety of businesses, including the Mall of America, which is the largest shopping mall in the United States. The city is also home to several corporate headquarters, including the headquarters of the Toro Company, the headquarters of the Donaldson Company, and the headquarters of the Cargill Corporation.
The city is also home to a variety of educational institutions, including Normandale Community College, the University of Minnesota-Twin Cities, and the Minnesota School of Business.
Demographics
As of the 2010 census, the city had a population of 82,893. The racial makeup of the city was 79.2% White, 8.2% African American, 0.4% Native American, 5.7% Asian, 0.1% Pacific Islander, 3.2% from other races, and 3.2% from two or more races. Hispanic or Latino of any race were 6.7% of the population.
The median income for a household in the city was $60,945, and the median income for a family was $76,945. The per capita income for the city was $30,945. About 5.2% of families and 8.2% of the population were below the poverty line, including 10.2% of those under age 18 and 5.2% of those age 65 or over.
Common Questions
What is Per Capita Income in Bloomington?
Per Capita income in Bloomington is $47,791.
What is the Median Family Income in Bloomington?
Median Family Income in Bloomington is $106,708.
What is the Median Household income in Bloomington?
Median Household Income in Bloomington is $87,381.
What is Income or Wage Gap in Bloomington?
Income or Wage Gap in Bloomington is 21.3%.
Women in Bloomington earn 78.7 cents for every dollar earned by a man.
What is Family Income Deficit in Bloomington?
Family Income Deficit in Bloomington is $8,323.
Families that are below poverty line in Bloomington earn $8,323 less on average than the poverty threshold level.
What is Inequality or Gini Index in Bloomington?
Inequality or Gini Index in Bloomington is 0.42.
What is the Total Population of Bloomington?
Total Population of Bloomington is 89,244.
What is the Total Male Population of Bloomington?
Total Male Population of Bloomington is 43,582.
What is the Total Female Population of Bloomington?
Total Female Population of Bloomington is 45,662.
What is the Ratio of Males per 100 Females in Bloomington?
There are 95.44 Males per 100 Females in Bloomington.
What is the Ratio of Females per 100 Males in Bloomington?
There are 104.77 Females per 100 Males in Bloomington.
What is the Median Population Age in Bloomington?
Median Population Age in Bloomington is 41.8 Years.
What is the Average Family Size in Bloomington
Average Family Size in Bloomington is 3.0 People.
What is the Average Household Size in Bloomington
Average Household Size in Bloomington is 2.3 People.
How Large is the Labor Force in Bloomington?
There are 50,923 People in the Labor Forcein in Bloomington.
What is the Percentage of People in the Labor Force in Bloomington?
68.9% of People are in the Labor Force in Bloomington.
What is the Unemployment Rate in Bloomington?
Unemployment Rate in Bloomington is 4.4%.