South Portland, ME Map & Demographics
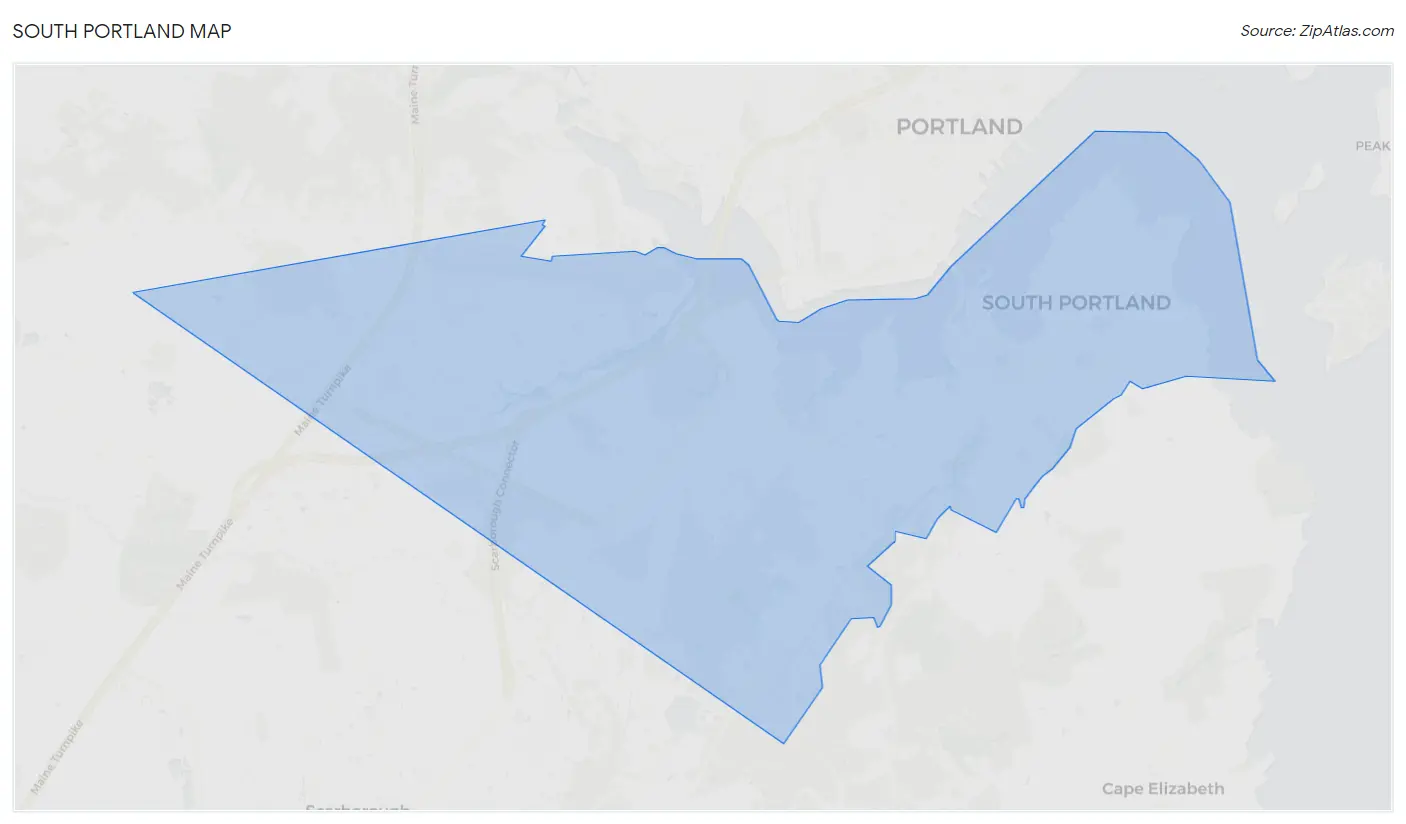
South Portland Map
South Portland Overview
$47,678
PER CAPITA INCOME
$102,544
AVG FAMILY INCOME
$82,489
AVG HOUSEHOLD INCOME
24.0%
WAGE / INCOME GAP [ % ]
76.0¢/ $1
WAGE / INCOME GAP [ $ ]
0.43
INEQUALITY / GINI INDEX
26,656
TOTAL POPULATION
12,794
MALE POPULATION
13,862
FEMALE POPULATION
92.30
MALES / 100 FEMALES
108.35
FEMALES / 100 MALES
41.0
MEDIAN AGE
2.9
AVG FAMILY SIZE
2.2
AVG HOUSEHOLD SIZE
16,812
LABOR FORCE [ PEOPLE ]
72.8%
PERCENT IN LABOR FORCE
2.9%
UNEMPLOYMENT RATE
South Portland Zip Codes
South Portland Area Codes
Income in South Portland
Income Overview in South Portland
Per Capita Income in South Portland is $47,678, while median incomes of families and households are $102,544 and $82,489 respectively.
| Characteristic | Number | Measure |
| Per Capita Income | 26,656 | $47,678 |
| Median Family Income | 6,502 | $102,544 |
| Mean Family Income | 6,502 | $125,948 |
| Median Household Income | 11,769 | $82,489 |
| Mean Household Income | 11,769 | $105,181 |
| Income Deficit | 6,502 | $0 |
| Wage / Income Gap (%) | 26,656 | 24.04% |
| Wage / Income Gap ($) | 26,656 | 75.96¢ per $1 |
| Gini / Inequality Index | 26,656 | 0.43 |
Earnings by Sex in South Portland
Average Earnings in South Portland are $44,194, $49,721 for men and $37,770 for women, a difference of 24.0%.
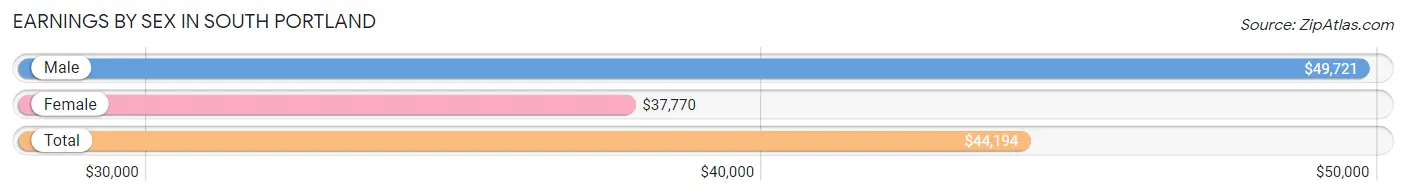
| Sex | Number | Average Earnings |
| Male | 9,017 (51.7%) | $49,721 |
| Female | 8,432 (48.3%) | $37,770 |
| Total | 17,449 (100.0%) | $44,194 |
Earnings by Sex by Income Bracket in South Portland
The most common earnings brackets in South Portland are $100,000+ for men (1,294 | 14.3%) and $75,000 to $99,999 for women (831 | 9.9%).
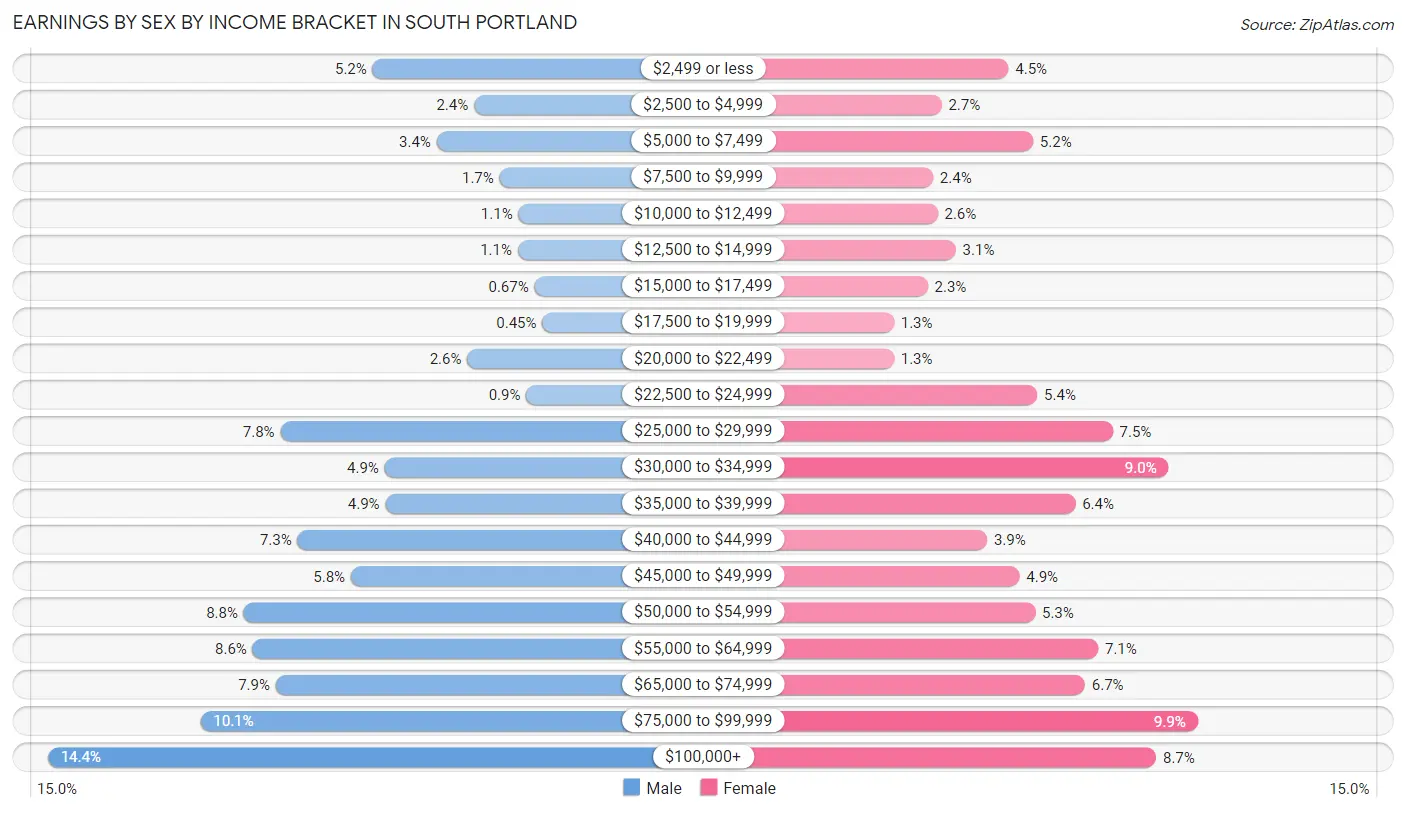
| Income | Male | Female |
| $2,499 or less | 471 (5.2%) | 383 (4.5%) |
| $2,500 to $4,999 | 214 (2.4%) | 224 (2.7%) |
| $5,000 to $7,499 | 308 (3.4%) | 441 (5.2%) |
| $7,500 to $9,999 | 149 (1.7%) | 204 (2.4%) |
| $10,000 to $12,499 | 101 (1.1%) | 215 (2.5%) |
| $12,500 to $14,999 | 103 (1.1%) | 258 (3.1%) |
| $15,000 to $17,499 | 60 (0.7%) | 191 (2.3%) |
| $17,500 to $19,999 | 41 (0.4%) | 111 (1.3%) |
| $20,000 to $22,499 | 231 (2.6%) | 111 (1.3%) |
| $22,500 to $24,999 | 81 (0.9%) | 451 (5.3%) |
| $25,000 to $29,999 | 704 (7.8%) | 630 (7.5%) |
| $30,000 to $34,999 | 440 (4.9%) | 762 (9.0%) |
| $35,000 to $39,999 | 438 (4.9%) | 541 (6.4%) |
| $40,000 to $44,999 | 661 (7.3%) | 332 (3.9%) |
| $45,000 to $49,999 | 526 (5.8%) | 409 (4.9%) |
| $50,000 to $54,999 | 797 (8.8%) | 446 (5.3%) |
| $55,000 to $64,999 | 775 (8.6%) | 595 (7.1%) |
| $65,000 to $74,999 | 716 (7.9%) | 564 (6.7%) |
| $75,000 to $99,999 | 907 (10.1%) | 831 (9.9%) |
| $100,000+ | 1,294 (14.3%) | 733 (8.7%) |
| Total | 9,017 (100.0%) | 8,432 (100.0%) |
Earnings by Sex by Educational Attainment in South Portland
Average earnings in South Portland are $54,363 for men and $44,590 for women, a difference of 18.0%. Men with an educational attainment of graduate degree enjoy the highest average annual earnings of $68,875, while those with less than high school education earn the least with $42,585. Women with an educational attainment of graduate degree earn the most with the average annual earnings of $66,133, while those with less than high school education have the smallest earnings of $24,126.
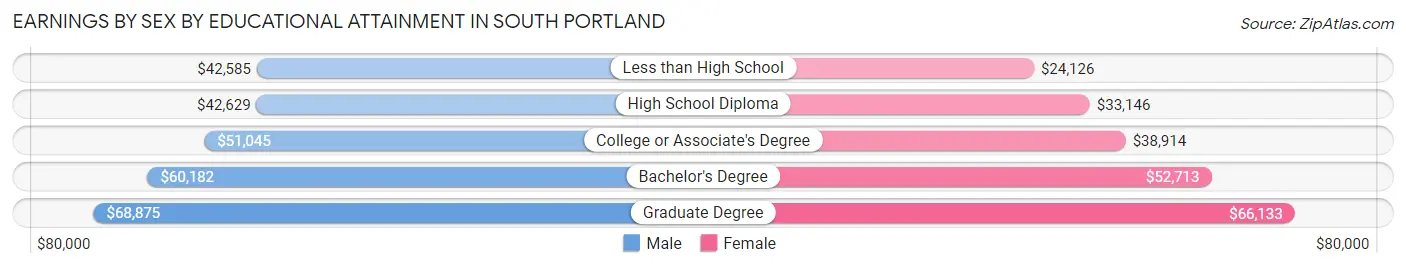
| Educational Attainment | Male Income | Female Income |
| Less than High School | $42,585 | $24,126 |
| High School Diploma | $42,629 | $33,146 |
| College or Associate's Degree | $51,045 | $38,914 |
| Bachelor's Degree | $60,182 | $52,713 |
| Graduate Degree | $68,875 | $66,133 |
| Total | $54,363 | $44,590 |
Family Income in South Portland
Family Income Brackets in South Portland
According to the South Portland family income data, there are 1,697 families falling into the $100,000 to $149,999 income range, which is the most common income bracket and makes up 26.1% of all families. Conversely, the $10,000 to $14,999 income bracket is the least frequent group with only 33 families (0.5%) belonging to this category.
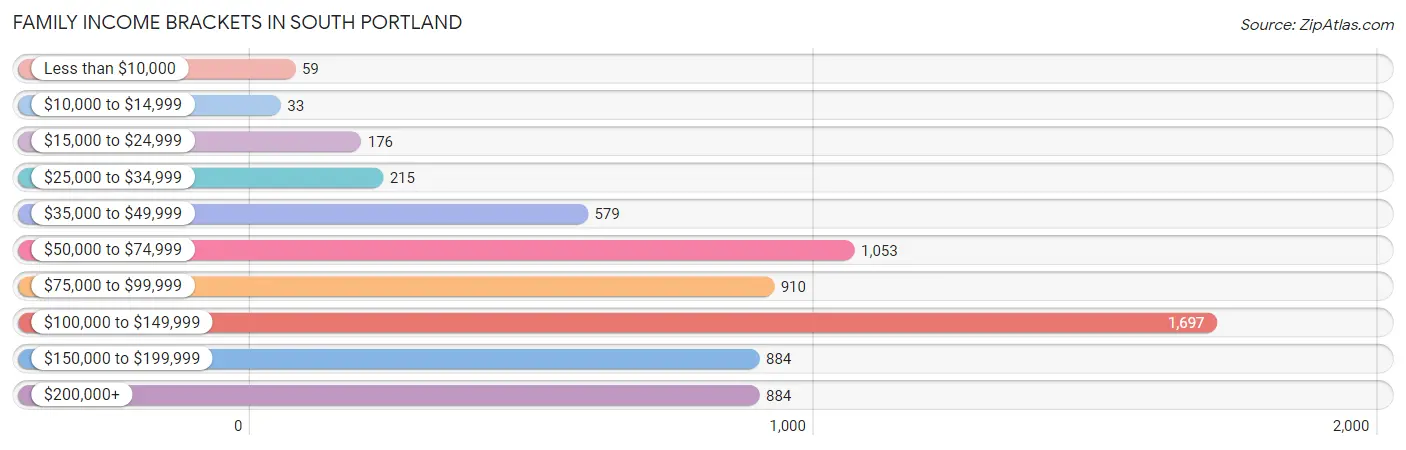
| Income Bracket | # Families | % Families |
| Less than $10,000 | 59 | 0.9% |
| $10,000 to $14,999 | 33 | 0.5% |
| $15,000 to $24,999 | 176 | 2.7% |
| $25,000 to $34,999 | 215 | 3.3% |
| $35,000 to $49,999 | 579 | 8.9% |
| $50,000 to $74,999 | 1,053 | 16.2% |
| $75,000 to $99,999 | 910 | 14.0% |
| $100,000 to $149,999 | 1,697 | 26.1% |
| $150,000 to $199,999 | 884 | 13.6% |
| $200,000+ | 884 | 13.6% |
Family Income by Famaliy Size in South Portland
5-person families (262 | 4.0%) account for the highest median family income in South Portland with $132,045 per family, while 2-person families (3,466 | 53.3%) have the highest median income of $43,643 per family member.
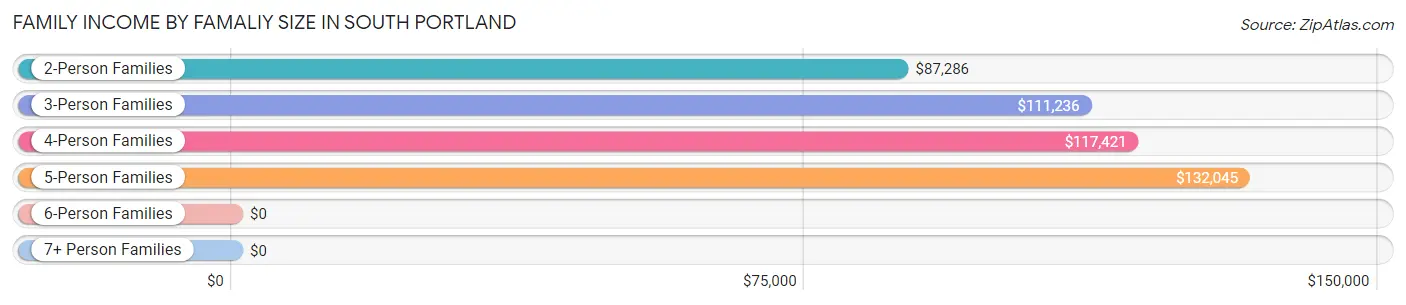
| Income Bracket | # Families | Median Income |
| 2-Person Families | 3,466 (53.3%) | $87,286 |
| 3-Person Families | 1,486 (22.9%) | $111,236 |
| 4-Person Families | 1,164 (17.9%) | $117,421 |
| 5-Person Families | 262 (4.0%) | $132,045 |
| 6-Person Families | 76 (1.2%) | $0 |
| 7+ Person Families | 48 (0.7%) | $0 |
| Total | 6,502 (100.0%) | $102,544 |
Family Income by Number of Earners in South Portland
The median family income in South Portland is $102,544, with families comprising 3+ earners (1,005) having the highest median family income of $129,844, while families with no earners (811) have the lowest median family income of $51,610, accounting for 15.5% and 12.5% of families, respectively.
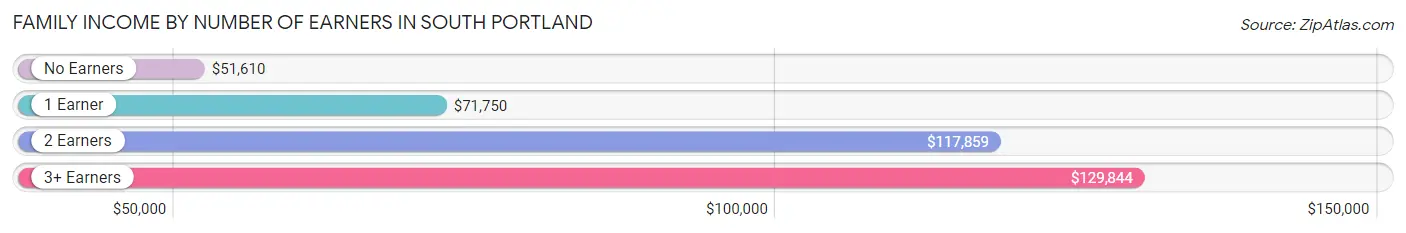
| Number of Earners | # Families | Median Income |
| No Earners | 811 (12.5%) | $51,610 |
| 1 Earner | 1,443 (22.2%) | $71,750 |
| 2 Earners | 3,243 (49.9%) | $117,859 |
| 3+ Earners | 1,005 (15.5%) | $129,844 |
| Total | 6,502 (100.0%) | $102,544 |
Household Income in South Portland
Household Income Brackets in South Portland
With 2,566 households falling in the category, the $100,000 to $149,999 income range is the most frequent in South Portland, accounting for 21.8% of all households. In contrast, only 271 households (2.3%) fall into the $10,000 to $14,999 income bracket, making it the least populous group.
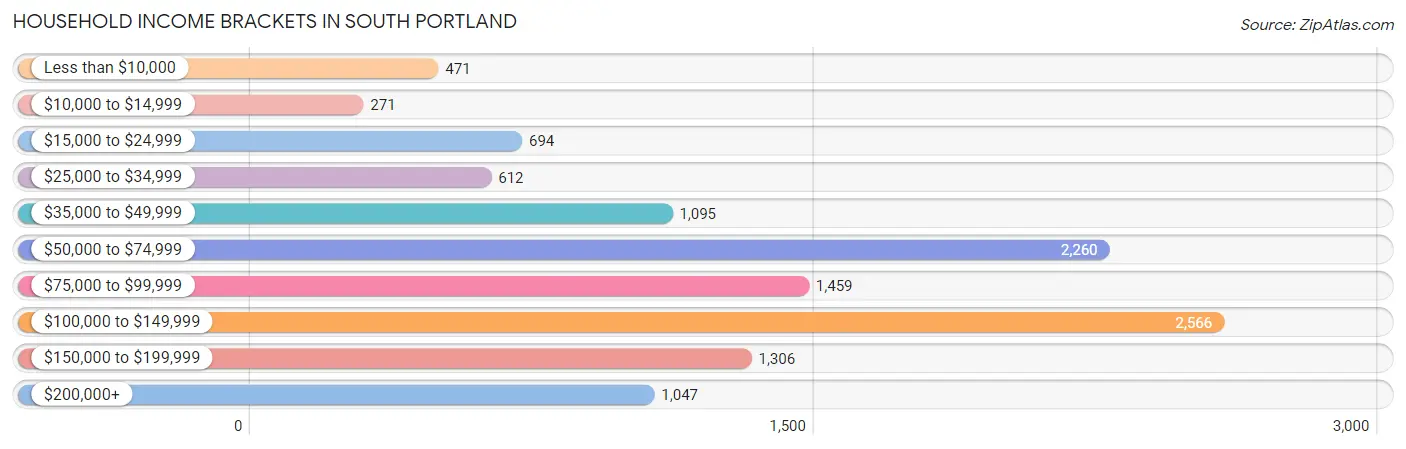
| Income Bracket | # Households | % Households |
| Less than $10,000 | 471 | 4.0% |
| $10,000 to $14,999 | 271 | 2.3% |
| $15,000 to $24,999 | 694 | 5.9% |
| $25,000 to $34,999 | 612 | 5.2% |
| $35,000 to $49,999 | 1,095 | 9.3% |
| $50,000 to $74,999 | 2,260 | 19.2% |
| $75,000 to $99,999 | 1,459 | 12.4% |
| $100,000 to $149,999 | 2,566 | 21.8% |
| $150,000 to $199,999 | 1,306 | 11.1% |
| $200,000+ | 1,047 | 8.9% |
Household Income by Householder Age in South Portland
The median household income in South Portland is $82,489, with the highest median household income of $101,799 found in the 45 to 64 years age bracket for the primary householder. A total of 4,187 households (35.6%) fall into this category. Meanwhile, the 65+ years age bracket for the primary householder has the lowest median household income of $60,300, with 3,578 households (30.4%) in this group.
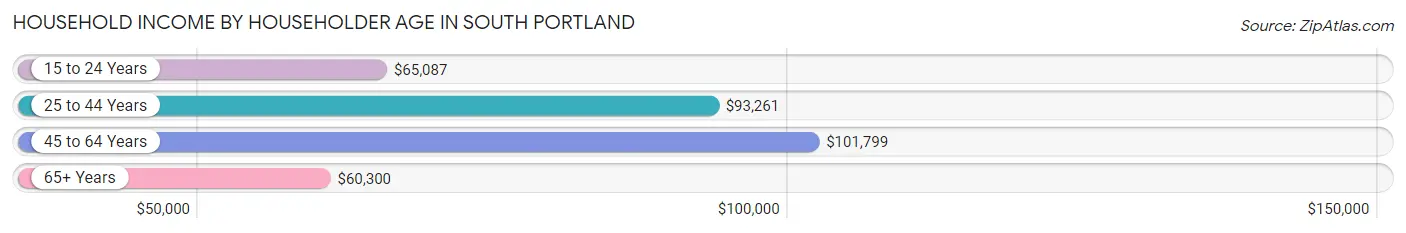
| Income Bracket | # Households | Median Income |
| 15 to 24 Years | 422 (3.6%) | $65,087 |
| 25 to 44 Years | 3,582 (30.4%) | $93,261 |
| 45 to 64 Years | 4,187 (35.6%) | $101,799 |
| 65+ Years | 3,578 (30.4%) | $60,300 |
| Total | 11,769 (100.0%) | $82,489 |
Poverty in South Portland
Income Below Poverty by Sex and Age in South Portland
With 4.1% poverty level for males and 6.3% for females among the residents of South Portland, 55 to 64 year old males and 75 year old and over females are the most vulnerable to poverty, with 141 males (8.8%) and 281 females (21.3%) in their respective age groups living below the poverty level.
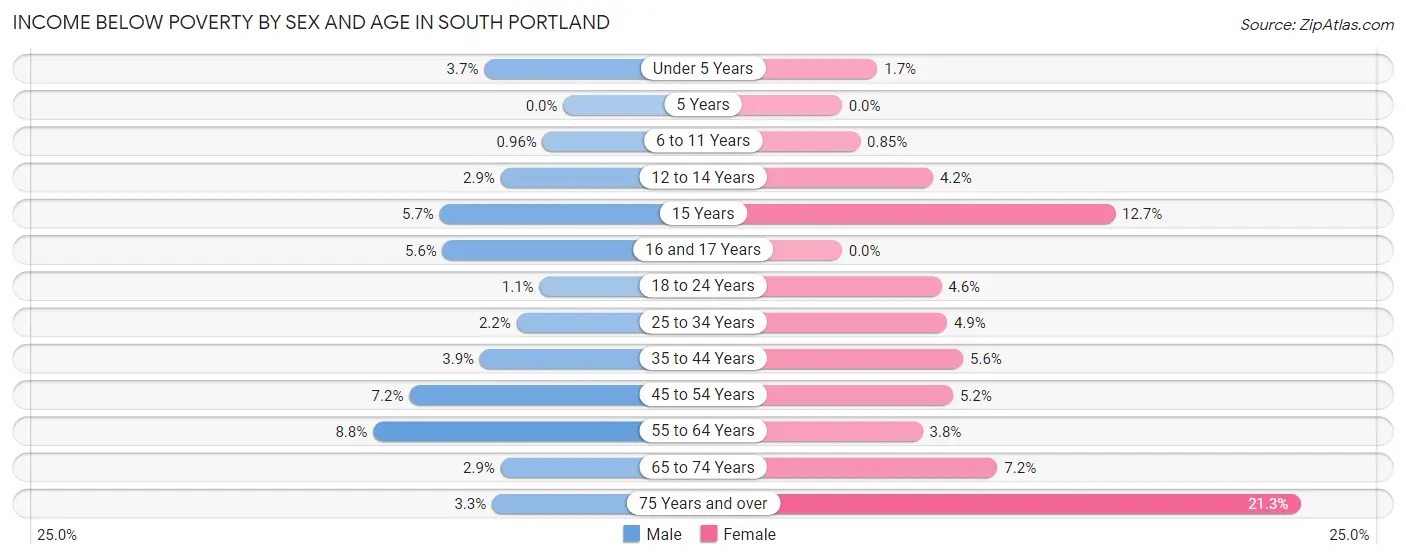
| Age Bracket | Male | Female |
| Under 5 Years | 13 (3.7%) | 13 (1.7%) |
| 5 Years | 0 (0.0%) | 0 (0.0%) |
| 6 to 11 Years | 5 (1.0%) | 5 (0.9%) |
| 12 to 14 Years | 8 (2.9%) | 19 (4.2%) |
| 15 Years | 12 (5.7%) | 9 (12.7%) |
| 16 and 17 Years | 27 (5.6%) | 0 (0.0%) |
| 18 to 24 Years | 13 (1.1%) | 61 (4.6%) |
| 25 to 34 Years | 51 (2.2%) | 96 (4.9%) |
| 35 to 44 Years | 64 (3.9%) | 78 (5.6%) |
| 45 to 54 Years | 110 (7.1%) | 88 (5.2%) |
| 55 to 64 Years | 141 (8.8%) | 77 (3.7%) |
| 65 to 74 Years | 43 (2.9%) | 114 (7.2%) |
| 75 Years and over | 27 (3.3%) | 281 (21.3%) |
| Total | 514 (4.1%) | 841 (6.3%) |
Income Above Poverty by Sex and Age in South Portland
According to the poverty statistics in South Portland, males aged 5 years and females aged 5 years are the age groups that are most secure financially, with 100.0% of males and 100.0% of females in these age groups living above the poverty line.

| Age Bracket | Male | Female |
| Under 5 Years | 341 (96.3%) | 774 (98.4%) |
| 5 Years | 33 (100.0%) | 48 (100.0%) |
| 6 to 11 Years | 516 (99.0%) | 583 (99.2%) |
| 12 to 14 Years | 267 (97.1%) | 430 (95.8%) |
| 15 Years | 197 (94.3%) | 62 (87.3%) |
| 16 and 17 Years | 455 (94.4%) | 153 (100.0%) |
| 18 to 24 Years | 1,155 (98.9%) | 1,258 (95.4%) |
| 25 to 34 Years | 2,303 (97.8%) | 1,873 (95.1%) |
| 35 to 44 Years | 1,591 (96.1%) | 1,308 (94.4%) |
| 45 to 54 Years | 1,429 (92.8%) | 1,619 (94.8%) |
| 55 to 64 Years | 1,455 (91.2%) | 1,974 (96.3%) |
| 65 to 74 Years | 1,437 (97.1%) | 1,464 (92.8%) |
| 75 Years and over | 789 (96.7%) | 1,040 (78.7%) |
| Total | 11,968 (95.9%) | 12,586 (93.7%) |
Income Below Poverty Among Married-Couple Families in South Portland
The poverty statistics for married-couple families in South Portland show that 1.5% or 75 of the total 4,989 families live below the poverty line. Families with no children have the highest poverty rate of 1.7%, comprising of 54 families. On the other hand, families with 3 or 4 children have the lowest poverty rate of 0.0%, which includes 0 families.
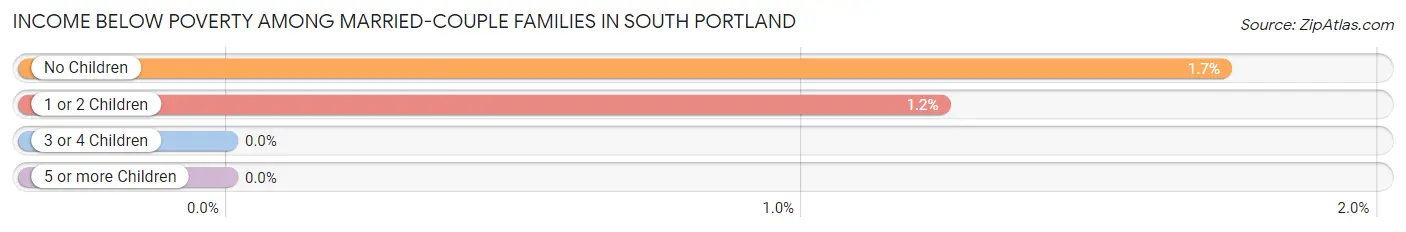
| Children | Above Poverty | Below Poverty |
| No Children | 3,074 (98.3%) | 54 (1.7%) |
| 1 or 2 Children | 1,667 (98.8%) | 21 (1.2%) |
| 3 or 4 Children | 163 (100.0%) | 0 (0.0%) |
| 5 or more Children | 10 (100.0%) | 0 (0.0%) |
| Total | 4,914 (98.5%) | 75 (1.5%) |
Income Below Poverty Among Single-Parent Households in South Portland
According to the poverty data in South Portland, 2.4% or 11 single-father households and 3.8% or 40 single-mother households are living below the poverty line. Among single-father households, those with 1 or 2 children have the highest poverty rate, with 11 households (7.2%) experiencing poverty. Likewise, among single-mother households, those with 3 or 4 children have the highest poverty rate, with 19 households (38.8%) falling below the poverty line.
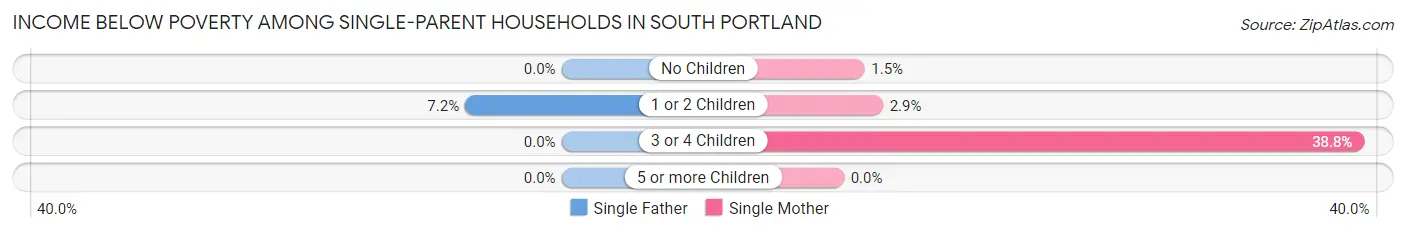
| Children | Single Father | Single Mother |
| No Children | 0 (0.0%) | 9 (1.5%) |
| 1 or 2 Children | 11 (7.2%) | 12 (2.9%) |
| 3 or 4 Children | 0 (0.0%) | 19 (38.8%) |
| 5 or more Children | 0 (0.0%) | 0 (0.0%) |
| Total | 11 (2.4%) | 40 (3.8%) |
Income Below Poverty Among Married-Couple vs Single-Parent Households in South Portland
The poverty data for South Portland shows that 75 of the married-couple family households (1.5%) and 51 of the single-parent households (3.4%) are living below the poverty level. Within the married-couple family households, those with no children have the highest poverty rate, with 54 households (1.7%) falling below the poverty line. Among the single-parent households, those with 3 or 4 children have the highest poverty rate, with 19 household (26.0%) living below poverty.
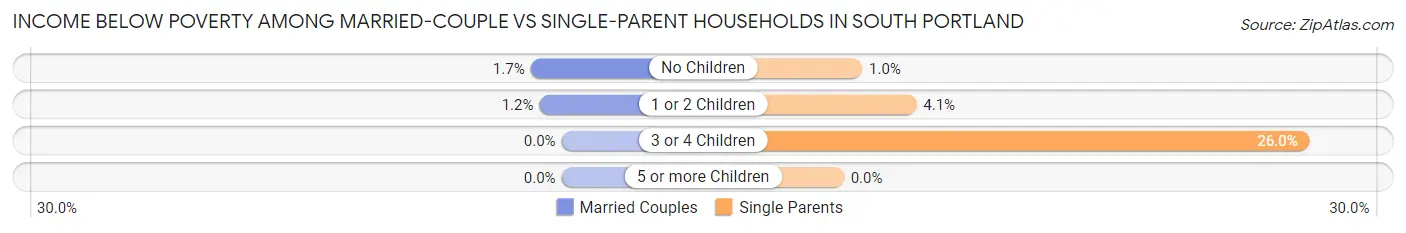
| Children | Married-Couple Families | Single-Parent Households |
| No Children | 54 (1.7%) | 9 (1.0%) |
| 1 or 2 Children | 21 (1.2%) | 23 (4.1%) |
| 3 or 4 Children | 0 (0.0%) | 19 (26.0%) |
| 5 or more Children | 0 (0.0%) | 0 (0.0%) |
| Total | 75 (1.5%) | 51 (3.4%) |
Race in South Portland
The most populous races in South Portland are White / Caucasian (22,547 | 84.6%), Black / African American (1,924 | 7.2%), and Two or more Races (1,234 | 4.6%).
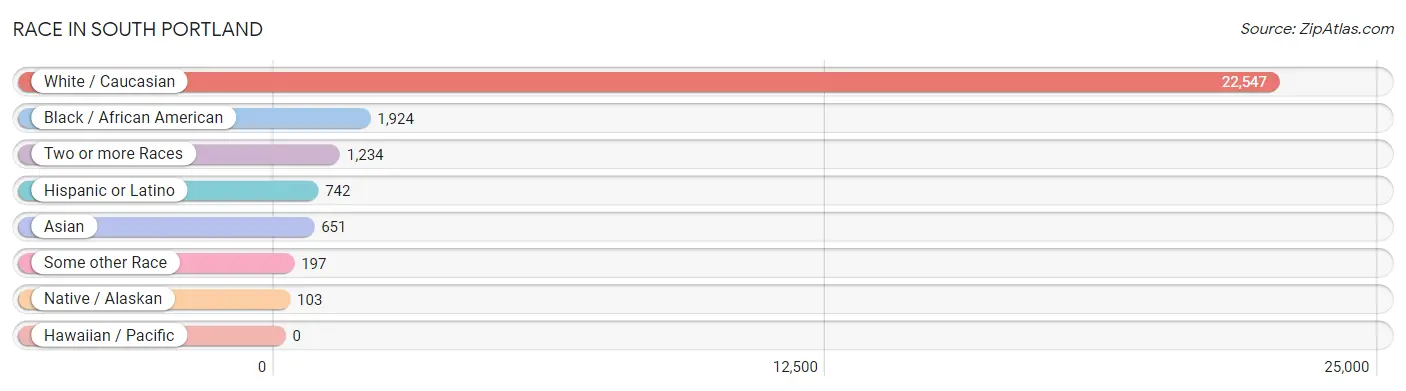
| Race | # Population | % Population |
| Asian | 651 | 2.4% |
| Black / African American | 1,924 | 7.2% |
| Hawaiian / Pacific | 0 | 0.0% |
| Hispanic or Latino | 742 | 2.8% |
| Native / Alaskan | 103 | 0.4% |
| White / Caucasian | 22,547 | 84.6% |
| Two or more Races | 1,234 | 4.6% |
| Some other Race | 197 | 0.7% |
| Total | 26,656 | 100.0% |
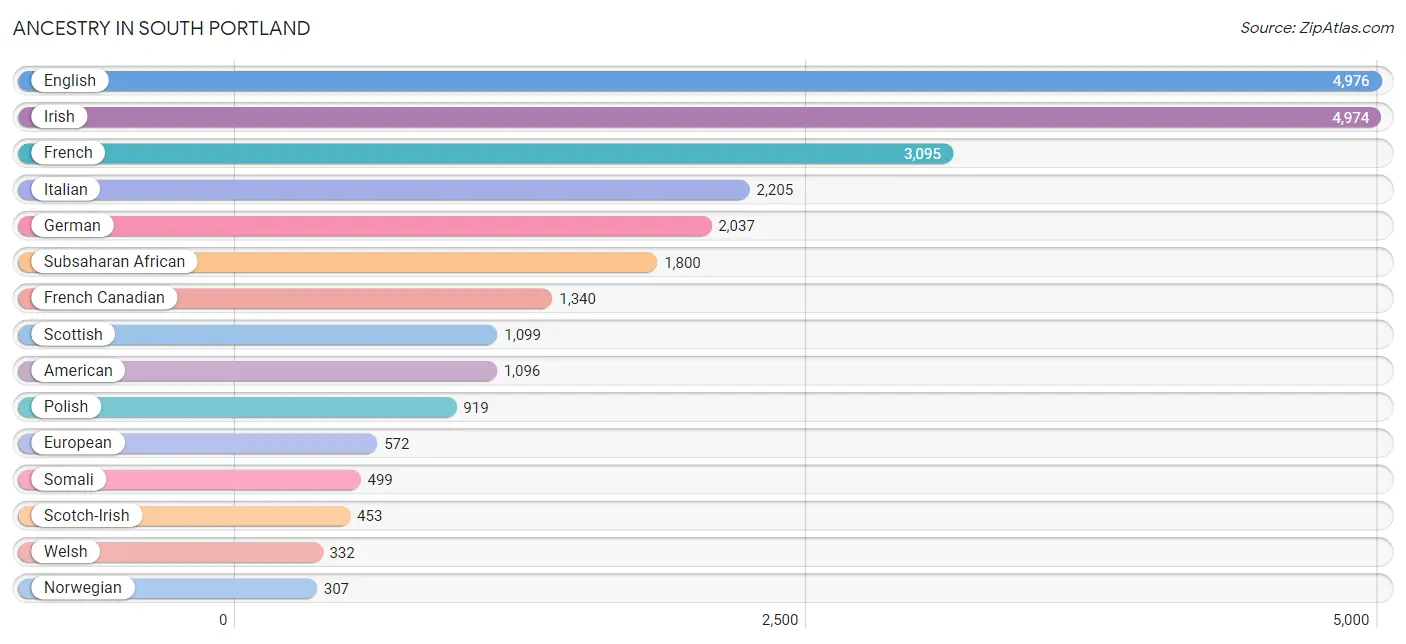
Ancestry in South Portland
The most populous ancestries reported in South Portland are English (4,976 | 18.7%), Irish (4,974 | 18.7%), French (3,095 | 11.6%), Italian (2,205 | 8.3%), and German (2,037 | 7.6%), together accounting for 64.8% of all South Portland residents.
| Ancestry | # Population | % Population |
| Afghan | 153 | 0.6% |
| African | 111 | 0.4% |
| Alaska Native | 6 | 0.0% |
| American | 1,096 | 4.1% |
| Arab | 141 | 0.5% |
| Armenian | 92 | 0.4% |
| Austrian | 100 | 0.4% |
| Belgian | 13 | 0.1% |
| Bhutanese | 12 | 0.1% |
| Brazilian | 78 | 0.3% |
| British | 182 | 0.7% |
| Bulgarian | 100 | 0.4% |
| Burmese | 84 | 0.3% |
| Canadian | 157 | 0.6% |
| Cape Verdean | 21 | 0.1% |
| Central American | 159 | 0.6% |
| Central American Indian | 3 | 0.0% |
| Cherokee | 22 | 0.1% |
| Chilean | 7 | 0.0% |
| Colombian | 44 | 0.2% |
| Czech | 92 | 0.4% |
| Czechoslovakian | 10 | 0.0% |
| Danish | 121 | 0.4% |
| Dominican | 29 | 0.1% |
| Dutch | 124 | 0.5% |
| Eastern European | 89 | 0.3% |
| English | 4,976 | 18.7% |
| Estonian | 18 | 0.1% |
| European | 572 | 2.1% |
| Finnish | 30 | 0.1% |
| French | 3,095 | 11.6% |
| French American Indian | 54 | 0.2% |
| French Canadian | 1,340 | 5.0% |
| German | 2,037 | 7.6% |
| Greek | 47 | 0.2% |
| Guatemalan | 74 | 0.3% |
| Honduran | 14 | 0.1% |
| Hungarian | 156 | 0.6% |
| Indian (Asian) | 223 | 0.8% |
| Iraqi | 41 | 0.2% |
| Irish | 4,974 | 18.7% |
| Israeli | 13 | 0.1% |
| Italian | 2,205 | 8.3% |
| Jamaican | 61 | 0.2% |
| Japanese | 46 | 0.2% |
| Korean | 74 | 0.3% |
| Latvian | 12 | 0.1% |
| Lebanese | 38 | 0.1% |
| Lithuanian | 122 | 0.5% |
| Macedonian | 15 | 0.1% |
| Malaysian | 1 | 0.0% |
| Mexican | 120 | 0.4% |
| Mexican American Indian | 9 | 0.0% |
| Native Hawaiian | 72 | 0.3% |
| Nicaraguan | 20 | 0.1% |
| Nigerian | 83 | 0.3% |
| Northern European | 28 | 0.1% |
| Norwegian | 307 | 1.1% |
| Pakistani | 114 | 0.4% |
| Pennsylvania German | 20 | 0.1% |
| Peruvian | 1 | 0.0% |
| Polish | 919 | 3.5% |
| Portuguese | 139 | 0.5% |
| Puerto Rican | 242 | 0.9% |
| Russian | 145 | 0.5% |
| Salvadoran | 51 | 0.2% |
| Scandinavian | 107 | 0.4% |
| Scotch-Irish | 453 | 1.7% |
| Scottish | 1,099 | 4.1% |
| Sioux | 1 | 0.0% |
| Slavic | 14 | 0.1% |
| Somali | 499 | 1.9% |
| South American | 62 | 0.2% |
| South American Indian | 1 | 0.0% |
| Spaniard | 17 | 0.1% |
| Spanish | 18 | 0.1% |
| Sri Lankan | 43 | 0.2% |
| Subsaharan African | 1,800 | 6.8% |
| Sudanese | 1 | 0.0% |
| Swedish | 301 | 1.1% |
| Swiss | 11 | 0.0% |
| Syrian | 10 | 0.0% |
| Thai | 114 | 0.4% |
| Ukrainian | 102 | 0.4% |
| Uruguayan | 2 | 0.0% |
| Venezuelan | 8 | 0.0% |
| Welsh | 332 | 1.3% | View All 87 Rows |
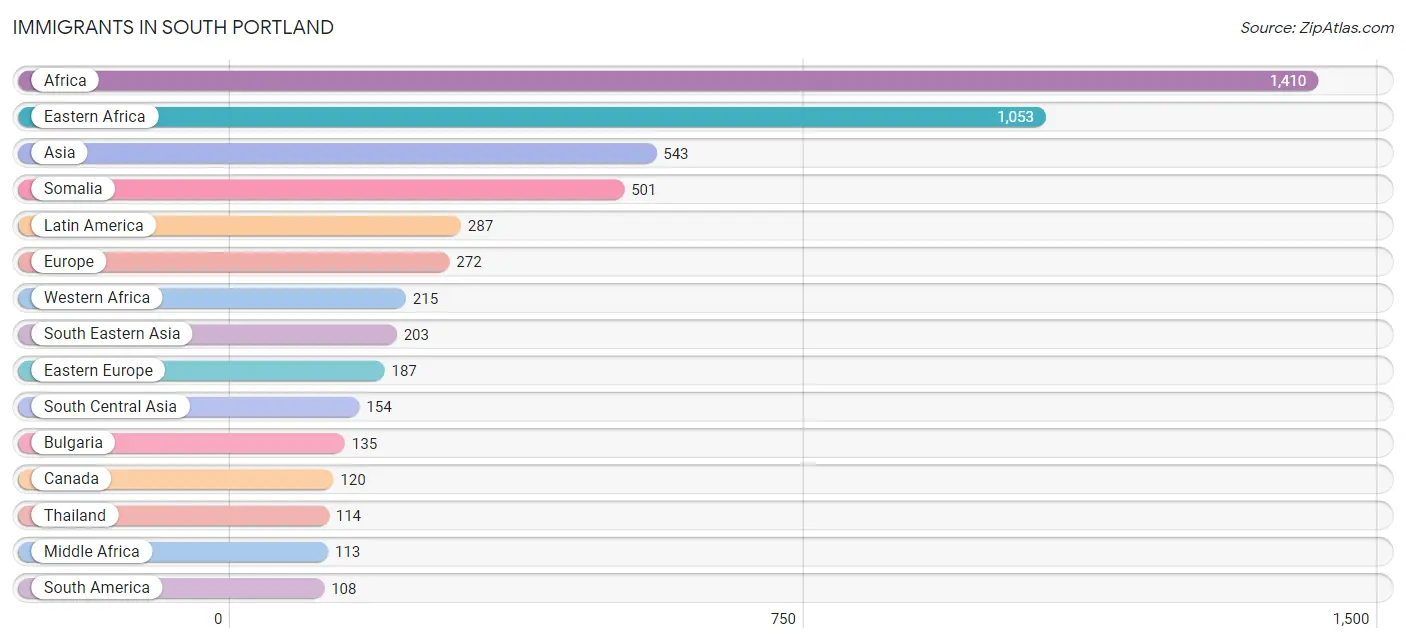
Immigrants in South Portland
The most numerous immigrant groups reported in South Portland came from Africa (1,410 | 5.3%), Eastern Africa (1,053 | 4.0%), Asia (543 | 2.0%), Somalia (501 | 1.9%), and Latin America (287 | 1.1%), together accounting for 14.2% of all South Portland residents.
| Immigration Origin | # Population | % Population |
| Afghanistan | 58 | 0.2% |
| Africa | 1,410 | 5.3% |
| Argentina | 15 | 0.1% |
| Asia | 543 | 2.0% |
| Bolivia | 7 | 0.0% |
| Brazil | 77 | 0.3% |
| Bulgaria | 135 | 0.5% |
| Cambodia | 46 | 0.2% |
| Canada | 120 | 0.4% |
| Caribbean | 85 | 0.3% |
| Central America | 94 | 0.4% |
| China | 55 | 0.2% |
| Czechoslovakia | 12 | 0.1% |
| Dominican Republic | 15 | 0.1% |
| Eastern Africa | 1,053 | 4.0% |
| Eastern Asia | 100 | 0.4% |
| Eastern Europe | 187 | 0.7% |
| England | 40 | 0.2% |
| Ethiopia | 6 | 0.0% |
| Europe | 272 | 1.0% |
| France | 7 | 0.0% |
| Germany | 12 | 0.1% |
| Guatemala | 47 | 0.2% |
| Honduras | 14 | 0.1% |
| India | 96 | 0.4% |
| Iraq | 86 | 0.3% |
| Jamaica | 70 | 0.3% |
| Kenya | 2 | 0.0% |
| Korea | 45 | 0.2% |
| Latin America | 287 | 1.1% |
| Mexico | 33 | 0.1% |
| Middle Africa | 113 | 0.4% |
| Nigeria | 36 | 0.1% |
| North Macedonia | 15 | 0.1% |
| Northern Africa | 11 | 0.0% |
| Northern Europe | 66 | 0.3% |
| Peru | 1 | 0.0% |
| Philippines | 12 | 0.1% |
| Poland | 6 | 0.0% |
| Russia | 7 | 0.0% |
| Somalia | 501 | 1.9% |
| South Africa | 12 | 0.1% |
| South America | 108 | 0.4% |
| South Central Asia | 154 | 0.6% |
| South Eastern Asia | 203 | 0.8% |
| Sweden | 6 | 0.0% |
| Taiwan | 11 | 0.0% |
| Thailand | 114 | 0.4% |
| Ukraine | 12 | 0.1% |
| Venezuela | 8 | 0.0% |
| Vietnam | 31 | 0.1% |
| Western Africa | 215 | 0.8% |
| Western Asia | 86 | 0.3% |
| Western Europe | 19 | 0.1% |
| Zaire | 13 | 0.1% |
| Zimbabwe | 9 | 0.0% | View All 56 Rows |
Sex and Age in South Portland
Sex and Age in South Portland
The most populous age groups in South Portland are 30 to 34 Years (1,354 | 10.6%) for men and 20 to 24 Years (1,134 | 8.2%) for women.
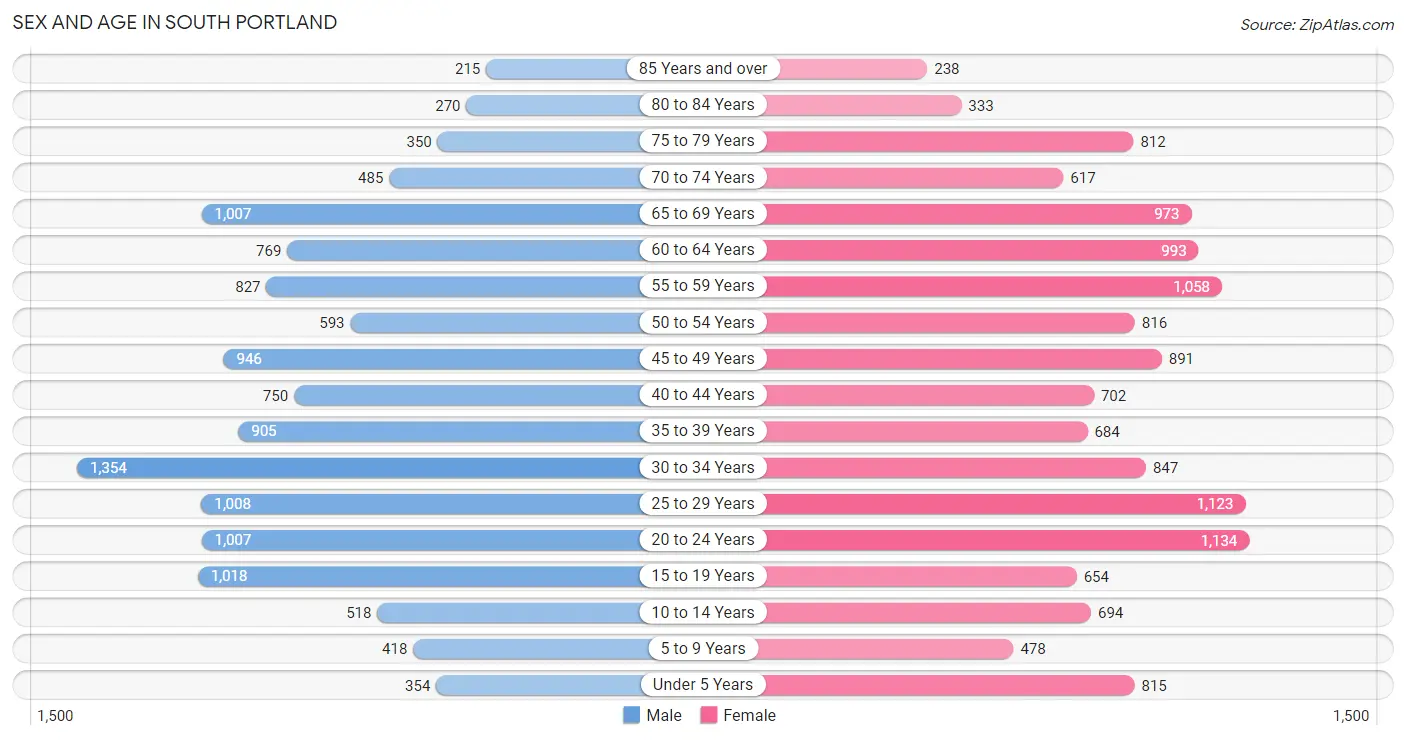
| Age Bracket | Male | Female |
| Under 5 Years | 354 (2.8%) | 815 (5.9%) |
| 5 to 9 Years | 418 (3.3%) | 478 (3.5%) |
| 10 to 14 Years | 518 (4.1%) | 694 (5.0%) |
| 15 to 19 Years | 1,018 (8.0%) | 654 (4.7%) |
| 20 to 24 Years | 1,007 (7.9%) | 1,134 (8.2%) |
| 25 to 29 Years | 1,008 (7.9%) | 1,123 (8.1%) |
| 30 to 34 Years | 1,354 (10.6%) | 847 (6.1%) |
| 35 to 39 Years | 905 (7.1%) | 684 (4.9%) |
| 40 to 44 Years | 750 (5.9%) | 702 (5.1%) |
| 45 to 49 Years | 946 (7.4%) | 891 (6.4%) |
| 50 to 54 Years | 593 (4.6%) | 816 (5.9%) |
| 55 to 59 Years | 827 (6.5%) | 1,058 (7.6%) |
| 60 to 64 Years | 769 (6.0%) | 993 (7.2%) |
| 65 to 69 Years | 1,007 (7.9%) | 973 (7.0%) |
| 70 to 74 Years | 485 (3.8%) | 617 (4.4%) |
| 75 to 79 Years | 350 (2.7%) | 812 (5.9%) |
| 80 to 84 Years | 270 (2.1%) | 333 (2.4%) |
| 85 Years and over | 215 (1.7%) | 238 (1.7%) |
| Total | 12,794 (100.0%) | 13,862 (100.0%) |
Families and Households in South Portland
Median Family Size in South Portland
The median family size in South Portland is 2.85 persons per family, with single female/mother families (1,046 | 16.1%) accounting for the largest median family size of 2.89 persons per family. On the other hand, single male/father families (467 | 7.2%) represent the smallest median family size with 2.45 persons per family.
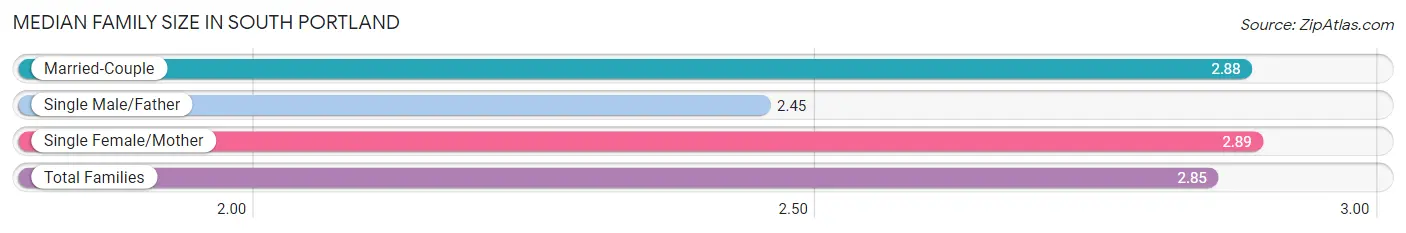
| Family Type | # Families | Family Size |
| Married-Couple | 4,989 (76.7%) | 2.88 |
| Single Male/Father | 467 (7.2%) | 2.45 |
| Single Female/Mother | 1,046 (16.1%) | 2.89 |
| Total Families | 6,502 (100.0%) | 2.85 |
Median Household Size in South Portland
The median household size in South Portland is 2.21 persons per household, with single female/mother households (1,046 | 8.9%) accounting for the largest median household size of 3.11 persons per household. non-family households (5,267 | 44.8%) represent the smallest median household size with 1.31 persons per household.
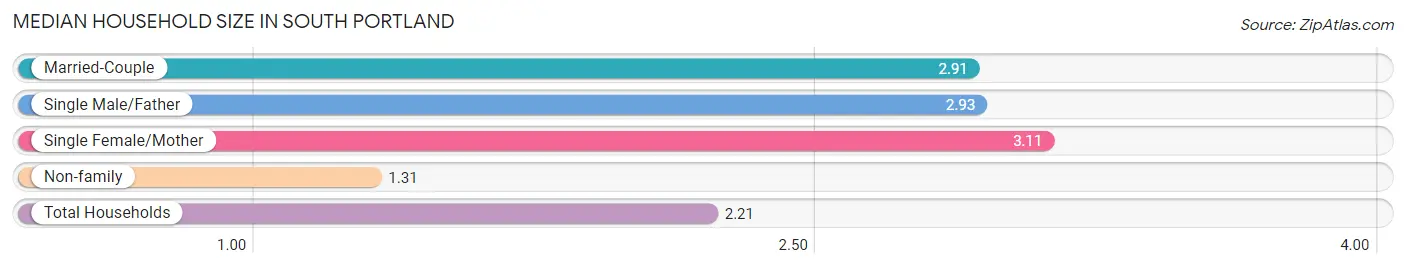
| Household Type | # Households | Household Size |
| Married-Couple | 4,989 (42.4%) | 2.91 |
| Single Male/Father | 467 (4.0%) | 2.93 |
| Single Female/Mother | 1,046 (8.9%) | 3.11 |
| Non-family | 5,267 (44.8%) | 1.31 |
| Total Households | 11,769 (100.0%) | 2.21 |
Household Size by Marriage Status in South Portland
Out of a total of 11,769 households in South Portland, 6,502 (55.2%) are family households, while 5,267 (44.8%) are nonfamily households. The most numerous type of family households are 2-person households, comprising 3,252, and the most common type of nonfamily households are 1-person households, comprising 4,009.
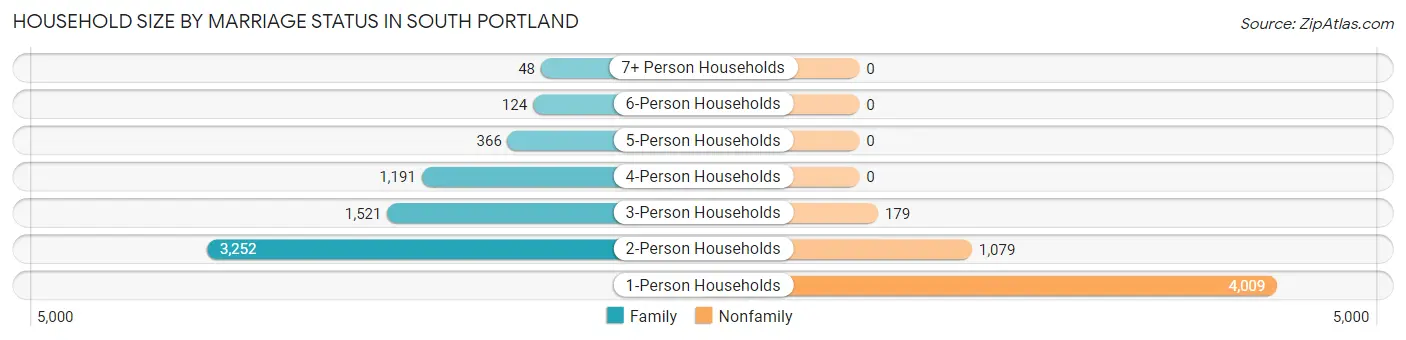
| Household Size | Family Households | Nonfamily Households |
| 1-Person Households | - | 4,009 (34.1%) |
| 2-Person Households | 3,252 (27.6%) | 1,079 (9.2%) |
| 3-Person Households | 1,521 (12.9%) | 179 (1.5%) |
| 4-Person Households | 1,191 (10.1%) | 0 (0.0%) |
| 5-Person Households | 366 (3.1%) | 0 (0.0%) |
| 6-Person Households | 124 (1.1%) | 0 (0.0%) |
| 7+ Person Households | 48 (0.4%) | 0 (0.0%) |
| Total | 6,502 (55.2%) | 5,267 (44.8%) |
Female Fertility in South Portland
Fertility by Age in South Portland
Average fertility rate in South Portland is 31.0 births per 1,000 women. Women in the age bracket of 35 to 50 years have the highest fertility rate with 50.0 births per 1,000 women. Women in the age bracket of 35 to 50 years acount for 64.2% of all women with births.
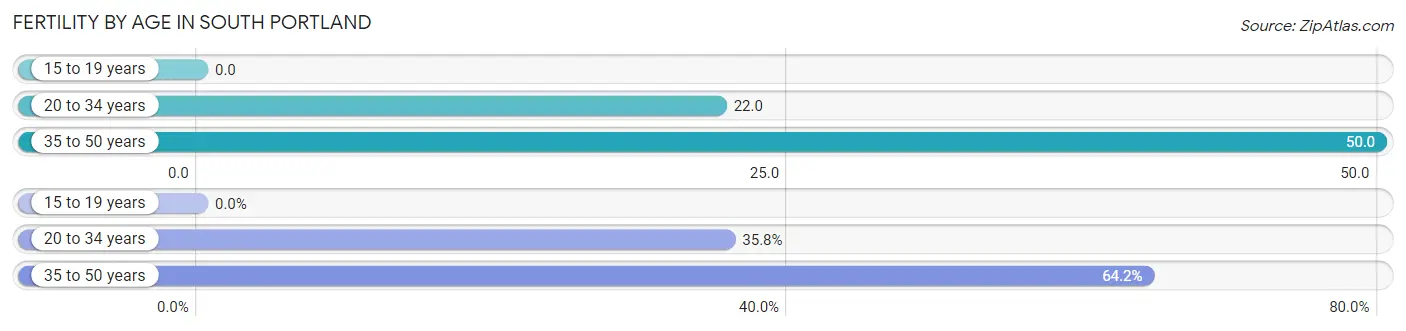
| Age Bracket | Women with Births | Births / 1,000 Women |
| 15 to 19 years | 0 (0.0%) | 0.0 |
| 20 to 34 years | 68 (35.8%) | 22.0 |
| 35 to 50 years | 122 (64.2%) | 50.0 |
| Total | 190 (100.0%) | 31.0 |
Fertility by Age by Marriage Status in South Portland
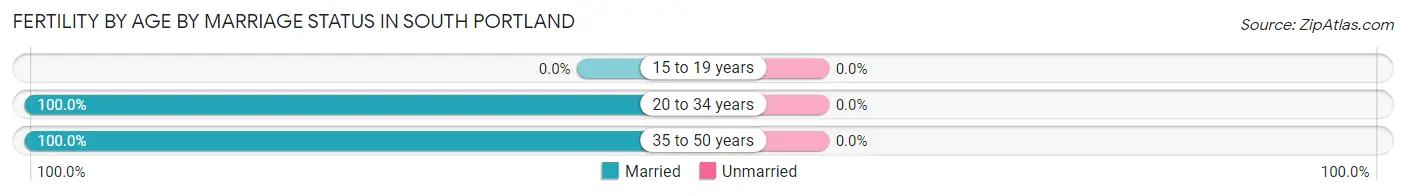
| Age Bracket | Married | Unmarried |
| 15 to 19 years | 0 (0.0%) | 0 (0.0%) |
| 20 to 34 years | 68 (100.0%) | 0 (0.0%) |
| 35 to 50 years | 122 (100.0%) | 0 (0.0%) |
| Total | 190 (100.0%) | 0 (0.0%) |
Fertility by Education in South Portland
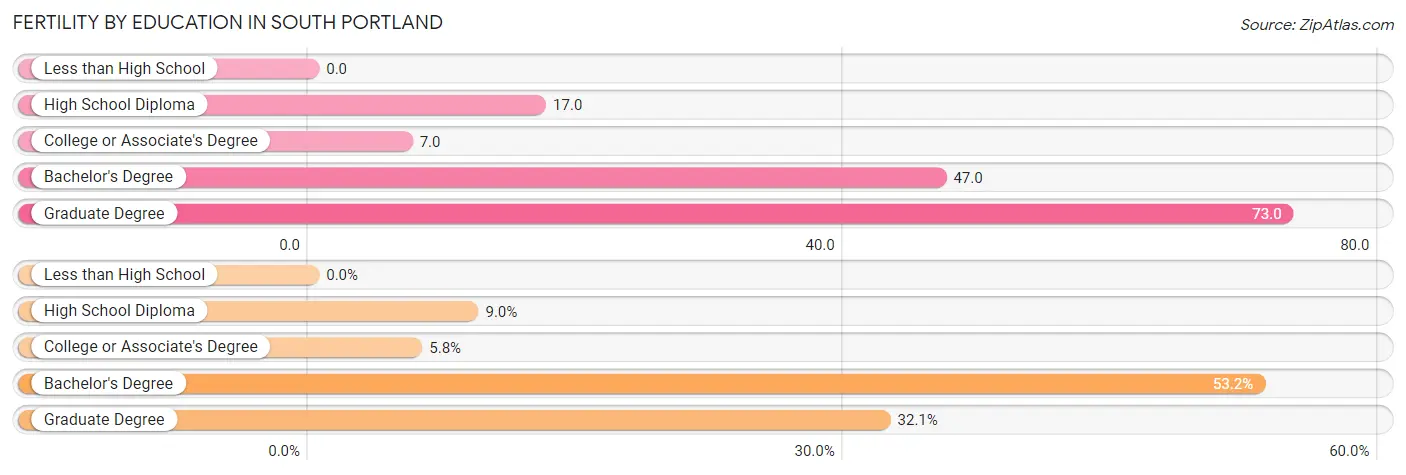
| Educational Attainment | Women with Births | Births / 1,000 Women |
| Less than High School | 0 (0.0%) | 0.0 |
| High School Diploma | 17 (8.9%) | 17.0 |
| College or Associate's Degree | 11 (5.8%) | 7.0 |
| Bachelor's Degree | 101 (53.2%) | 47.0 |
| Graduate Degree | 61 (32.1%) | 73.0 |
| Total | 190 (100.0%) | 31.0 |
Fertility by Education by Marriage Status in South Portland
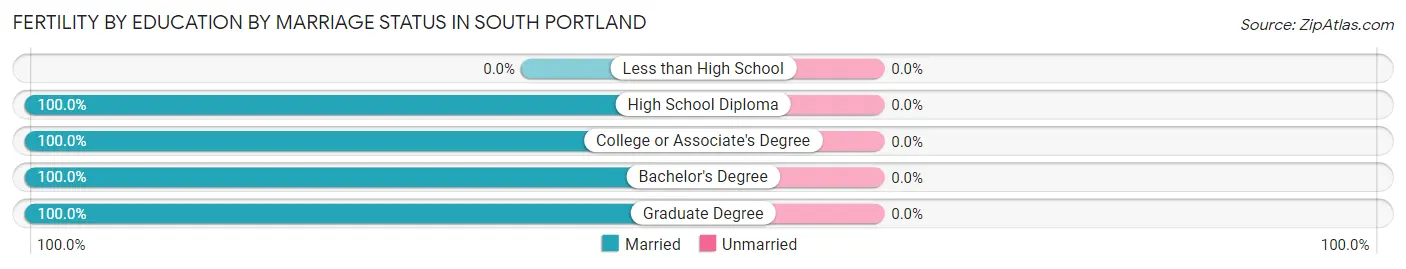
| Educational Attainment | Married | Unmarried |
| Less than High School | 0 (0.0%) | 0 (0.0%) |
| High School Diploma | 17 (100.0%) | 0 (0.0%) |
| College or Associate's Degree | 11 (100.0%) | 0 (0.0%) |
| Bachelor's Degree | 101 (100.0%) | 0 (0.0%) |
| Graduate Degree | 61 (100.0%) | 0 (0.0%) |
| Total | 190 (100.0%) | 0 (0.0%) |
Employment Characteristics in South Portland
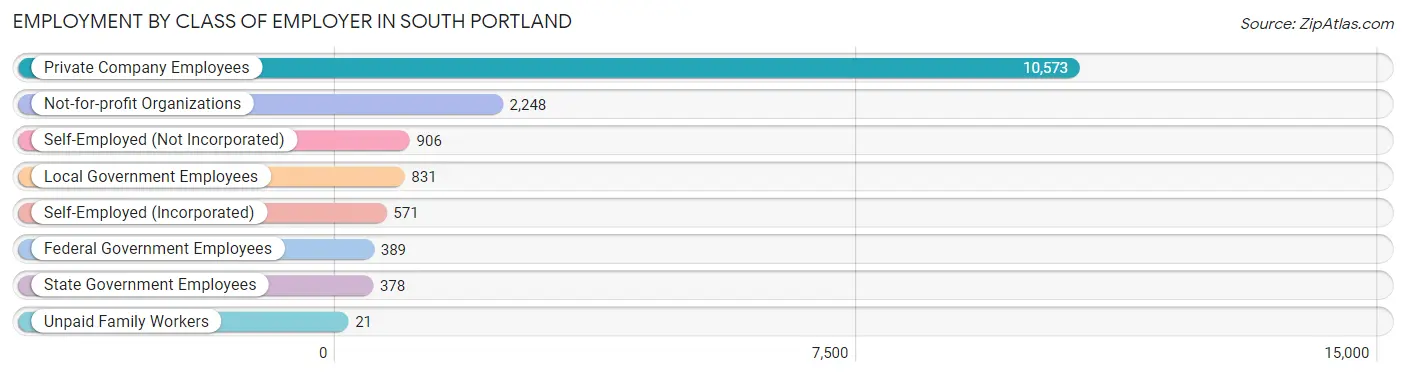
Employment by Class of Employer in South Portland
Among the 15,917 employed individuals in South Portland, private company employees (10,573 | 66.4%), not-for-profit organizations (2,248 | 14.1%), and self-employed (not incorporated) (906 | 5.7%) make up the most common classes of employment.
| Employer Class | # Employees | % Employees |
| Private Company Employees | 10,573 | 66.4% |
| Self-Employed (Incorporated) | 571 | 3.6% |
| Self-Employed (Not Incorporated) | 906 | 5.7% |
| Not-for-profit Organizations | 2,248 | 14.1% |
| Local Government Employees | 831 | 5.2% |
| State Government Employees | 378 | 2.4% |
| Federal Government Employees | 389 | 2.4% |
| Unpaid Family Workers | 21 | 0.1% |
| Total | 15,917 | 100.0% |
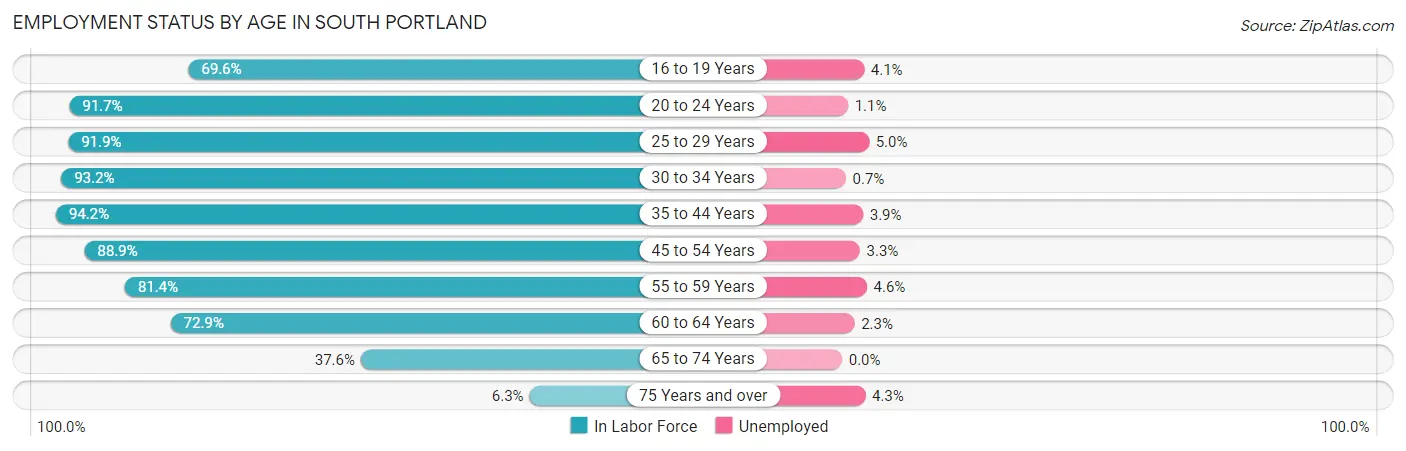
Employment Status by Age in South Portland
According to the labor force statistics for South Portland, out of the total population over 16 years of age (23,094), 72.8% or 16,812 individuals are in the labor force, with 2.9% or 488 of them unemployed. The age group with the highest labor force participation rate is 35 to 44 years, with 94.2% or 2,865 individuals in the labor force. Within the labor force, the 25 to 29 years age range has the highest percentage of unemployed individuals, with 5.0% or 98 of them being unemployed.
| Age Bracket | In Labor Force | Unemployed |
| 16 to 19 Years | 965 (69.6%) | 40 (4.1%) |
| 20 to 24 Years | 1,963 (91.7%) | 22 (1.1%) |
| 25 to 29 Years | 1,958 (91.9%) | 98 (5.0%) |
| 30 to 34 Years | 2,051 (93.2%) | 14 (0.7%) |
| 35 to 44 Years | 2,865 (94.2%) | 112 (3.9%) |
| 45 to 54 Years | 2,886 (88.9%) | 95 (3.3%) |
| 55 to 59 Years | 1,534 (81.4%) | 71 (4.6%) |
| 60 to 64 Years | 1,284 (72.9%) | 30 (2.3%) |
| 65 to 74 Years | 1,159 (37.6%) | 0 (0.0%) |
| 75 Years and over | 140 (6.3%) | 6 (4.3%) |
| Total | 16,812 (72.8%) | 488 (2.9%) |
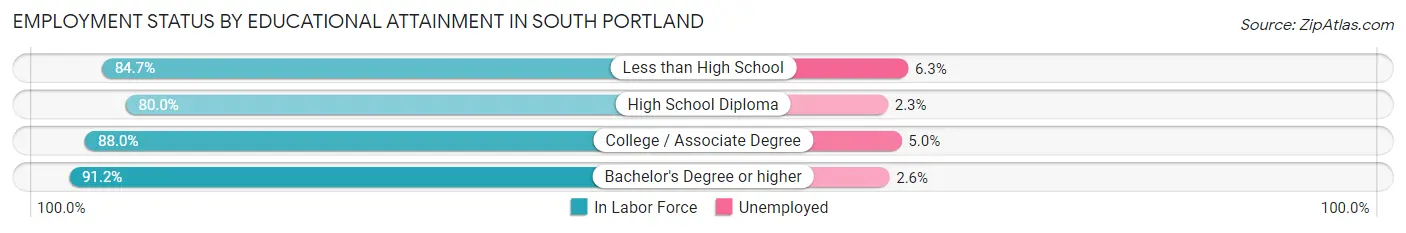
Employment Status by Educational Attainment in South Portland
According to labor force statistics for South Portland, 88.2% of individuals (12,583) out of the total population between 25 and 64 years of age (14,266) are in the labor force, with 3.3% or 415 of them being unemployed. The group with the highest labor force participation rate are those with the educational attainment of bachelor's degree or higher, with 91.2% or 6,737 individuals in the labor force. Within the labor force, individuals with less than high school education have the highest percentage of unemployment, with 6.3% or 24 of them being unemployed.
| Educational Attainment | In Labor Force | Unemployed |
| Less than High School | 383 (84.7%) | 28 (6.3%) |
| High School Diploma | 1,920 (80.0%) | 55 (2.3%) |
| College / Associate Degree | 3,544 (88.0%) | 201 (5.0%) |
| Bachelor's Degree or higher | 6,737 (91.2%) | 192 (2.6%) |
| Total | 12,583 (88.2%) | 471 (3.3%) |
Employment Occupations by Sex in South Portland
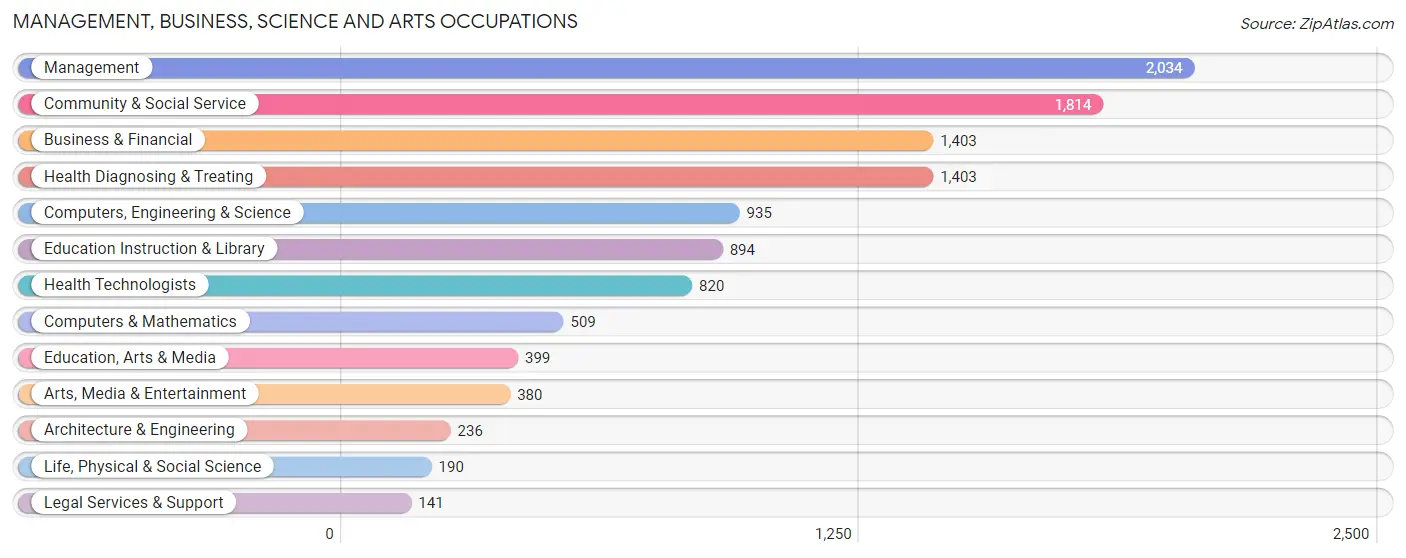
Management, Business, Science and Arts Occupations
The most common Management, Business, Science and Arts occupations in South Portland are Management (2,034 | 12.6%), Community & Social Service (1,814 | 11.3%), Business & Financial (1,403 | 8.7%), Health Diagnosing & Treating (1,403 | 8.7%), and Computers, Engineering & Science (935 | 5.8%).
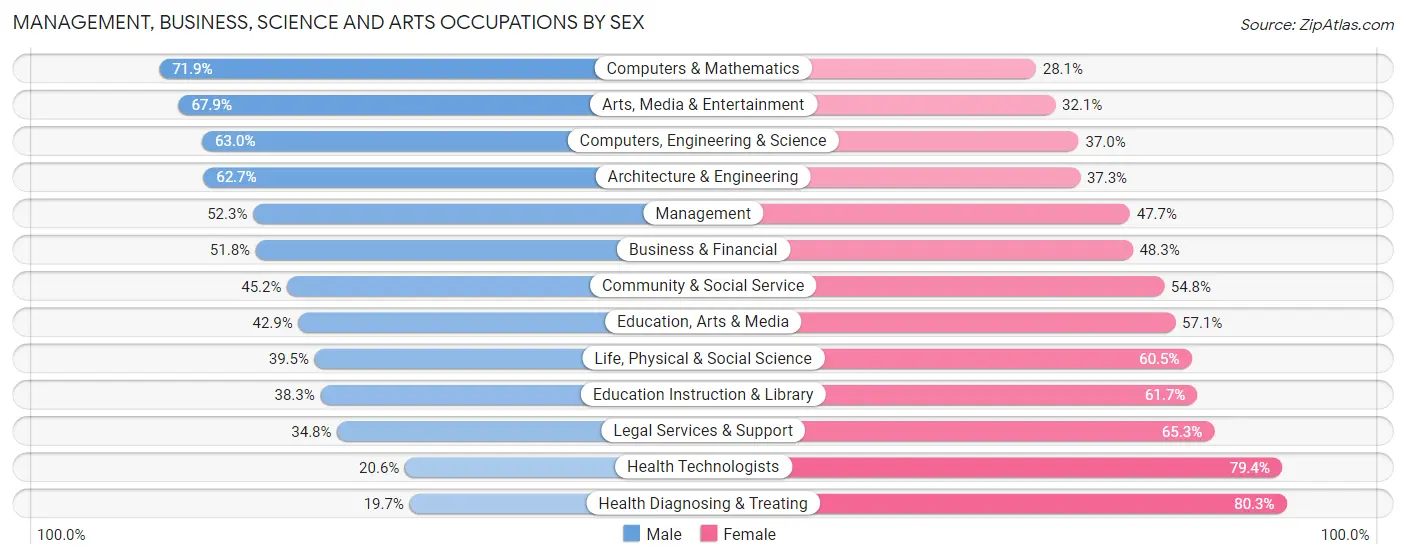
Management, Business, Science and Arts Occupations by Sex
Within the Management, Business, Science and Arts occupations in South Portland, the most male-oriented occupations are Computers & Mathematics (71.9%), Arts, Media & Entertainment (67.9%), and Computers, Engineering & Science (63.0%), while the most female-oriented occupations are Health Diagnosing & Treating (80.3%), Health Technologists (79.4%), and Legal Services & Support (65.2%).
| Occupation | Male | Female |
| Management | 1,064 (52.3%) | 970 (47.7%) |
| Business & Financial | 726 (51.7%) | 677 (48.2%) |
| Computers, Engineering & Science | 589 (63.0%) | 346 (37.0%) |
| Computers & Mathematics | 366 (71.9%) | 143 (28.1%) |
| Architecture & Engineering | 148 (62.7%) | 88 (37.3%) |
| Life, Physical & Social Science | 75 (39.5%) | 115 (60.5%) |
| Community & Social Service | 820 (45.2%) | 994 (54.8%) |
| Education, Arts & Media | 171 (42.9%) | 228 (57.1%) |
| Legal Services & Support | 49 (34.7%) | 92 (65.2%) |
| Education Instruction & Library | 342 (38.3%) | 552 (61.7%) |
| Arts, Media & Entertainment | 258 (67.9%) | 122 (32.1%) |
| Health Diagnosing & Treating | 276 (19.7%) | 1,127 (80.3%) |
| Health Technologists | 169 (20.6%) | 651 (79.4%) |
| Total (Category) | 3,475 (45.8%) | 4,114 (54.2%) |
| Total (Overall) | 8,373 (52.0%) | 7,742 (48.0%) |
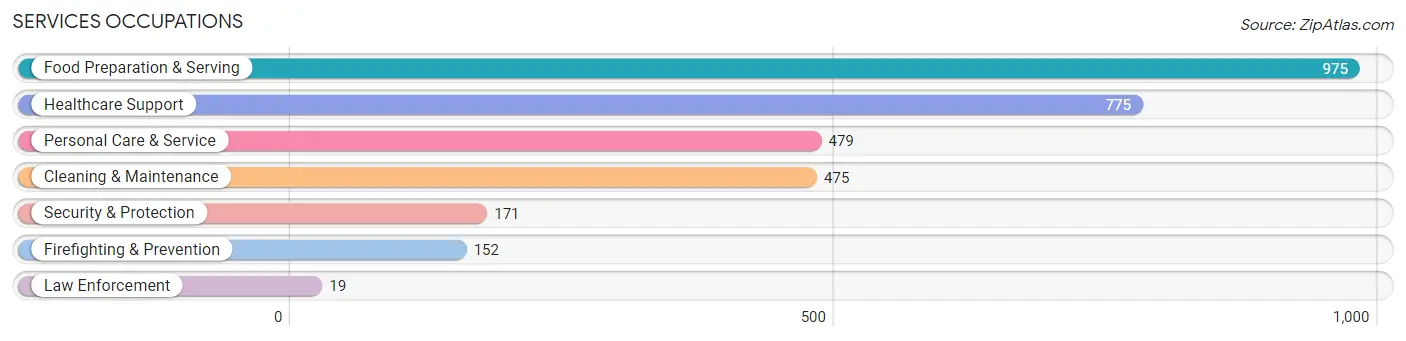
Services Occupations
The most common Services occupations in South Portland are Food Preparation & Serving (975 | 6.0%), Healthcare Support (775 | 4.8%), Personal Care & Service (479 | 3.0%), Cleaning & Maintenance (475 | 2.9%), and Security & Protection (171 | 1.1%).
Services Occupations by Sex
Within the Services occupations in South Portland, the most male-oriented occupations are Firefighting & Prevention (90.8%), Security & Protection (85.4%), and Cleaning & Maintenance (72.0%), while the most female-oriented occupations are Healthcare Support (63.0%), Law Enforcement (57.9%), and Personal Care & Service (56.2%).
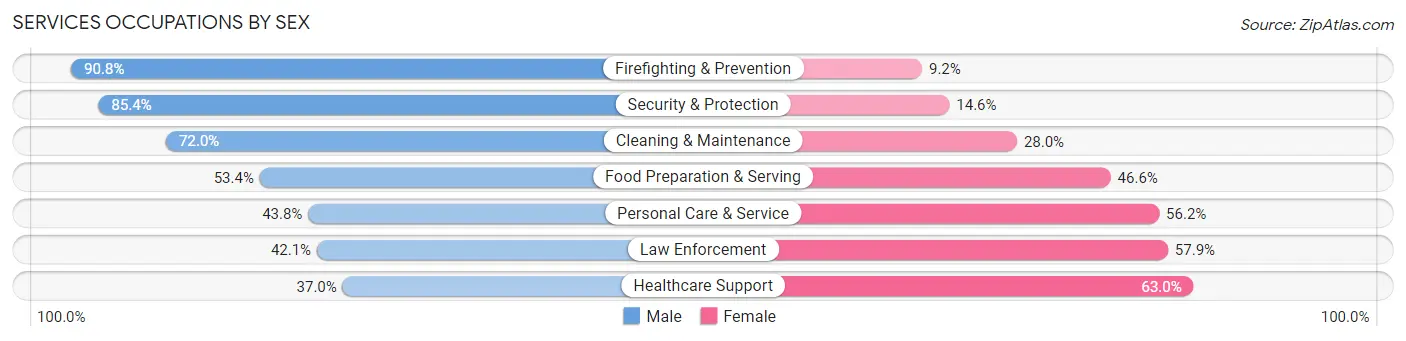
| Occupation | Male | Female |
| Healthcare Support | 287 (37.0%) | 488 (63.0%) |
| Security & Protection | 146 (85.4%) | 25 (14.6%) |
| Firefighting & Prevention | 138 (90.8%) | 14 (9.2%) |
| Law Enforcement | 8 (42.1%) | 11 (57.9%) |
| Food Preparation & Serving | 521 (53.4%) | 454 (46.6%) |
| Cleaning & Maintenance | 342 (72.0%) | 133 (28.0%) |
| Personal Care & Service | 210 (43.8%) | 269 (56.2%) |
| Total (Category) | 1,506 (52.4%) | 1,369 (47.6%) |
| Total (Overall) | 8,373 (52.0%) | 7,742 (48.0%) |
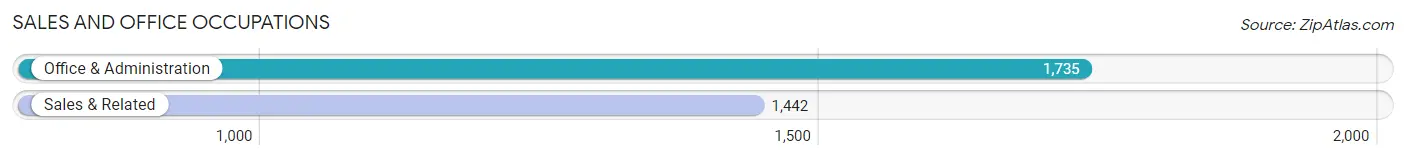
Sales and Office Occupations
The most common Sales and Office occupations in South Portland are Office & Administration (1,735 | 10.8%), and Sales & Related (1,442 | 8.9%).
Sales and Office Occupations by Sex
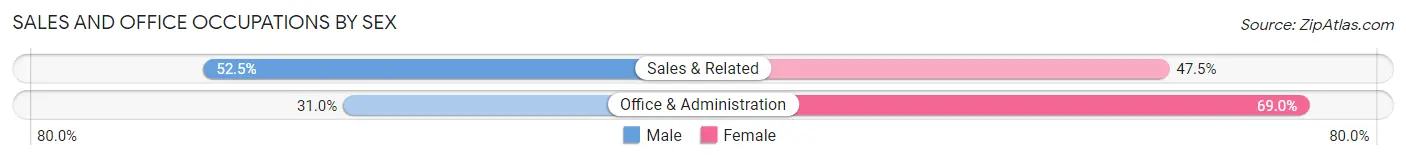
| Occupation | Male | Female |
| Sales & Related | 757 (52.5%) | 685 (47.5%) |
| Office & Administration | 538 (31.0%) | 1,197 (69.0%) |
| Total (Category) | 1,295 (40.8%) | 1,882 (59.2%) |
| Total (Overall) | 8,373 (52.0%) | 7,742 (48.0%) |
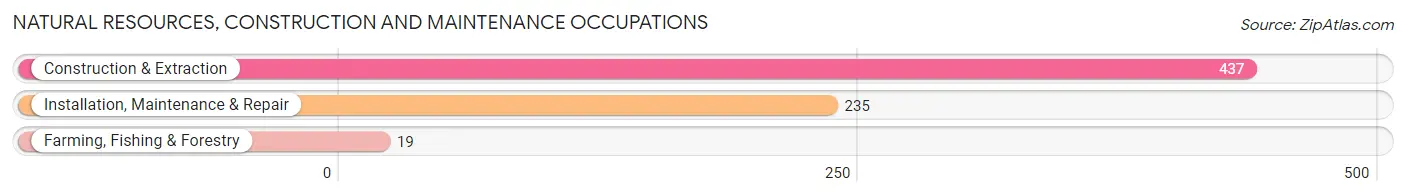
Natural Resources, Construction and Maintenance Occupations
The most common Natural Resources, Construction and Maintenance occupations in South Portland are Construction & Extraction (437 | 2.7%), Installation, Maintenance & Repair (235 | 1.5%), and Farming, Fishing & Forestry (19 | 0.1%).
Natural Resources, Construction and Maintenance Occupations by Sex
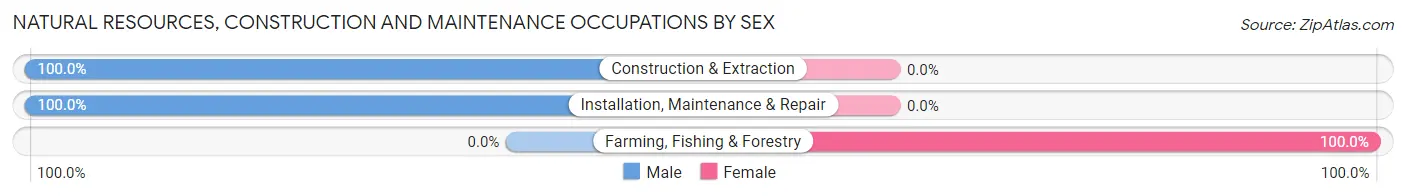
| Occupation | Male | Female |
| Farming, Fishing & Forestry | 0 (0.0%) | 19 (100.0%) |
| Construction & Extraction | 437 (100.0%) | 0 (0.0%) |
| Installation, Maintenance & Repair | 235 (100.0%) | 0 (0.0%) |
| Total (Category) | 672 (97.3%) | 19 (2.8%) |
| Total (Overall) | 8,373 (52.0%) | 7,742 (48.0%) |
Production, Transportation and Moving Occupations
The most common Production, Transportation and Moving occupations in South Portland are Material Moving (661 | 4.1%), Production (595 | 3.7%), and Transportation (527 | 3.3%).
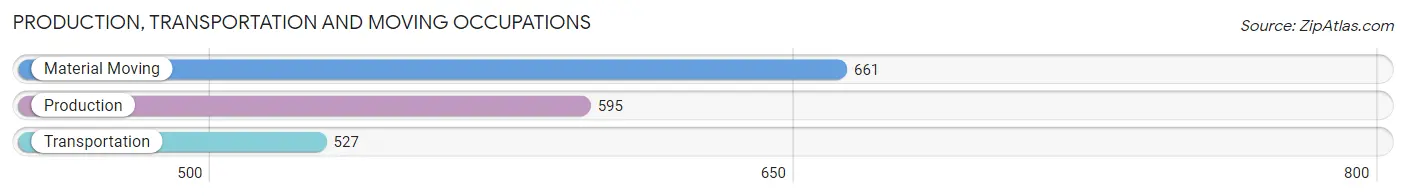
Production, Transportation and Moving Occupations by Sex
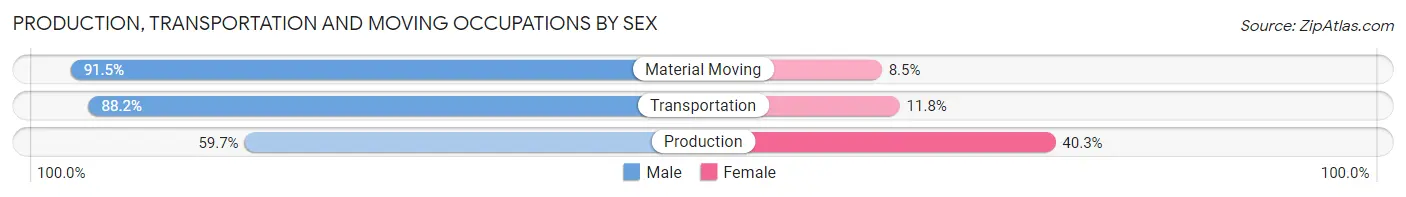
| Occupation | Male | Female |
| Production | 355 (59.7%) | 240 (40.3%) |
| Transportation | 465 (88.2%) | 62 (11.8%) |
| Material Moving | 605 (91.5%) | 56 (8.5%) |
| Total (Category) | 1,425 (79.9%) | 358 (20.1%) |
| Total (Overall) | 8,373 (52.0%) | 7,742 (48.0%) |
Employment Industries by Sex in South Portland
Employment Industries in South Portland
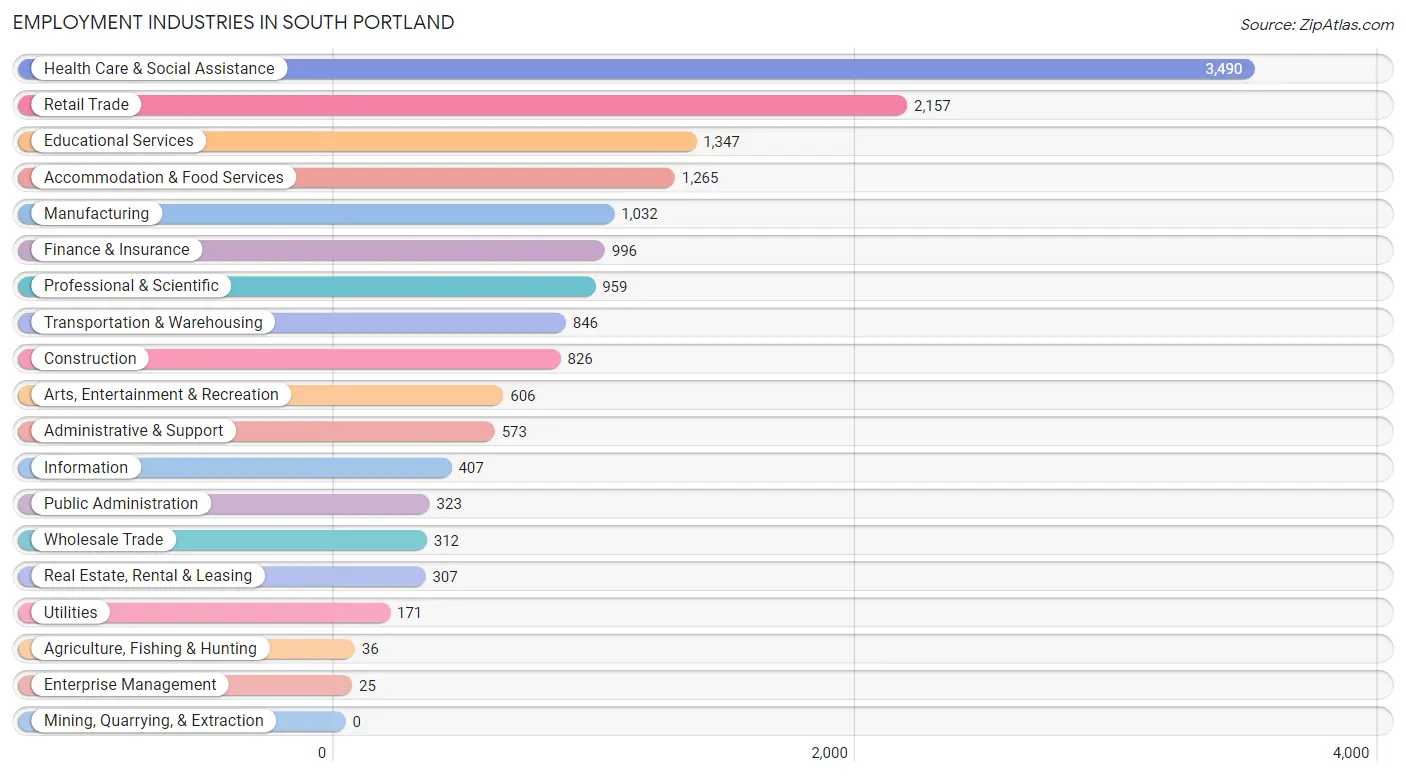
The major employment industries in South Portland include Health Care & Social Assistance (3,490 | 21.7%), Retail Trade (2,157 | 13.4%), Educational Services (1,347 | 8.4%), Accommodation & Food Services (1,265 | 7.9%), and Manufacturing (1,032 | 6.4%).
Employment Industries by Sex in South Portland
The South Portland industries that see more men than women are Wholesale Trade (94.6%), Construction (83.4%), and Utilities (71.9%), whereas the industries that tend to have a higher number of women are Agriculture, Fishing & Hunting (100.0%), Health Care & Social Assistance (69.6%), and Enterprise Management (64.0%).
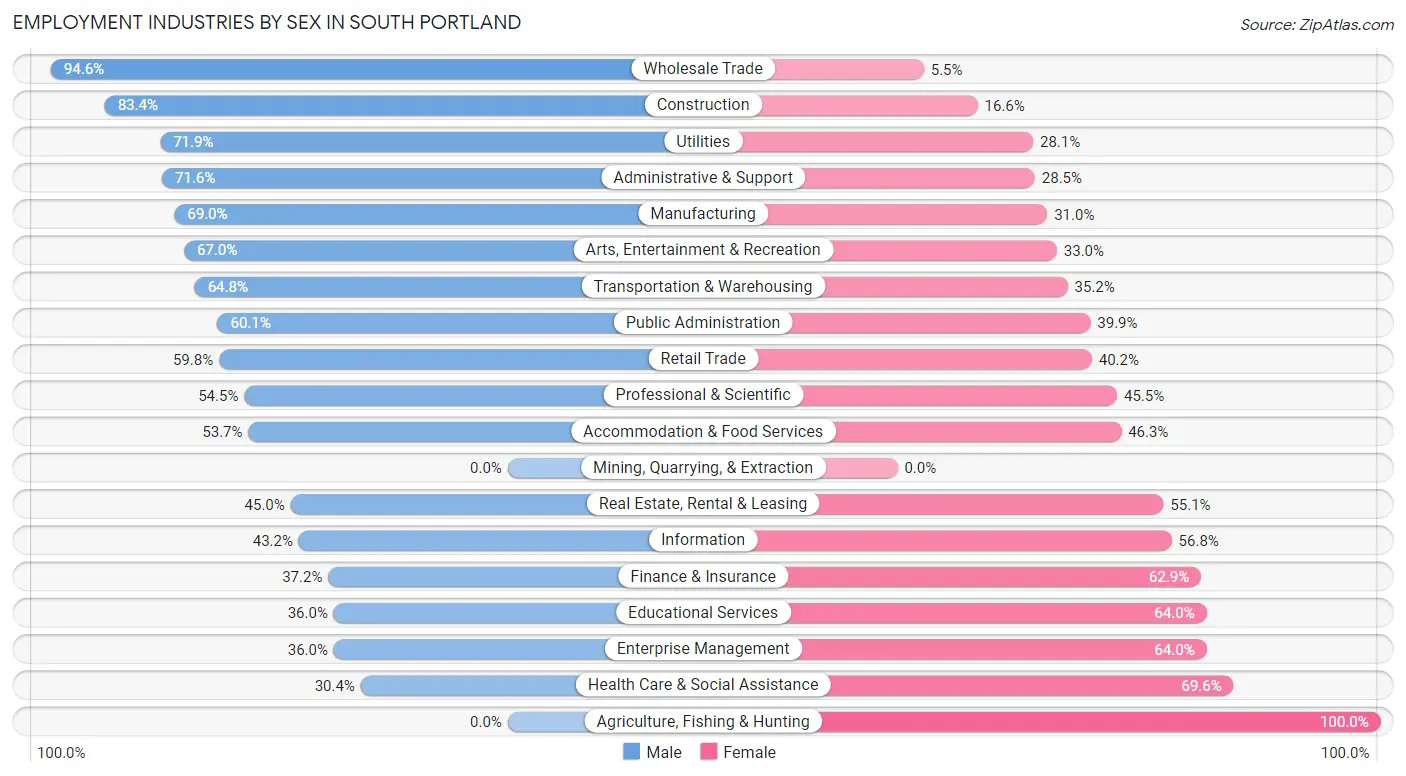
| Industry | Male | Female |
| Agriculture, Fishing & Hunting | 0 (0.0%) | 36 (100.0%) |
| Mining, Quarrying, & Extraction | 0 (0.0%) | 0 (0.0%) |
| Construction | 689 (83.4%) | 137 (16.6%) |
| Manufacturing | 712 (69.0%) | 320 (31.0%) |
| Wholesale Trade | 295 (94.6%) | 17 (5.4%) |
| Retail Trade | 1,289 (59.8%) | 868 (40.2%) |
| Transportation & Warehousing | 548 (64.8%) | 298 (35.2%) |
| Utilities | 123 (71.9%) | 48 (28.1%) |
| Information | 176 (43.2%) | 231 (56.8%) |
| Finance & Insurance | 370 (37.1%) | 626 (62.8%) |
| Real Estate, Rental & Leasing | 138 (45.0%) | 169 (55.0%) |
| Professional & Scientific | 523 (54.5%) | 436 (45.5%) |
| Enterprise Management | 9 (36.0%) | 16 (64.0%) |
| Administrative & Support | 410 (71.6%) | 163 (28.4%) |
| Educational Services | 485 (36.0%) | 862 (64.0%) |
| Health Care & Social Assistance | 1,062 (30.4%) | 2,428 (69.6%) |
| Arts, Entertainment & Recreation | 406 (67.0%) | 200 (33.0%) |
| Accommodation & Food Services | 679 (53.7%) | 586 (46.3%) |
| Public Administration | 194 (60.1%) | 129 (39.9%) |
| Total | 8,373 (52.0%) | 7,742 (48.0%) |
Education in South Portland
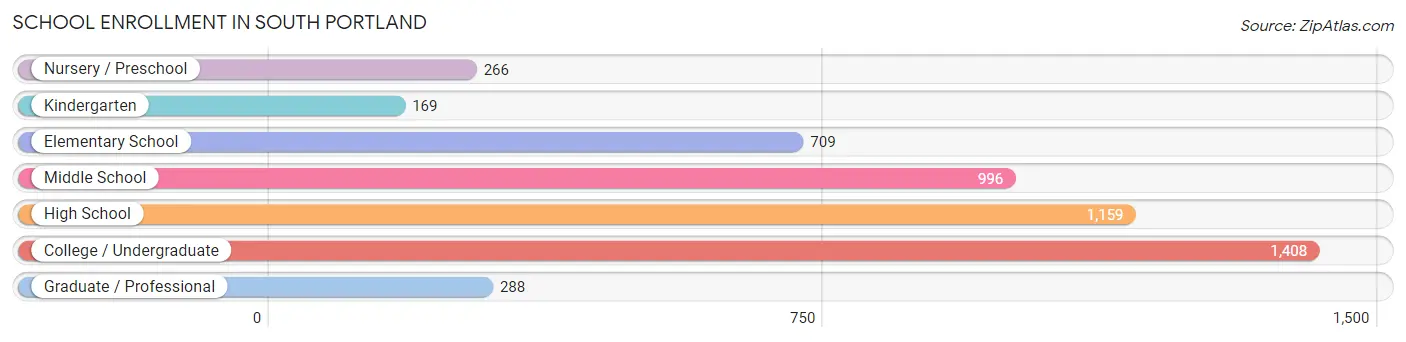
School Enrollment in South Portland
The most common levels of schooling among the 4,995 students in South Portland are college / undergraduate (1,408 | 28.2%), high school (1,159 | 23.2%), and middle school (996 | 19.9%).
| School Level | # Students | % Students |
| Nursery / Preschool | 266 | 5.3% |
| Kindergarten | 169 | 3.4% |
| Elementary School | 709 | 14.2% |
| Middle School | 996 | 19.9% |
| High School | 1,159 | 23.2% |
| College / Undergraduate | 1,408 | 28.2% |
| Graduate / Professional | 288 | 5.8% |
| Total | 4,995 | 100.0% |
School Enrollment by Age by Funding Source in South Portland
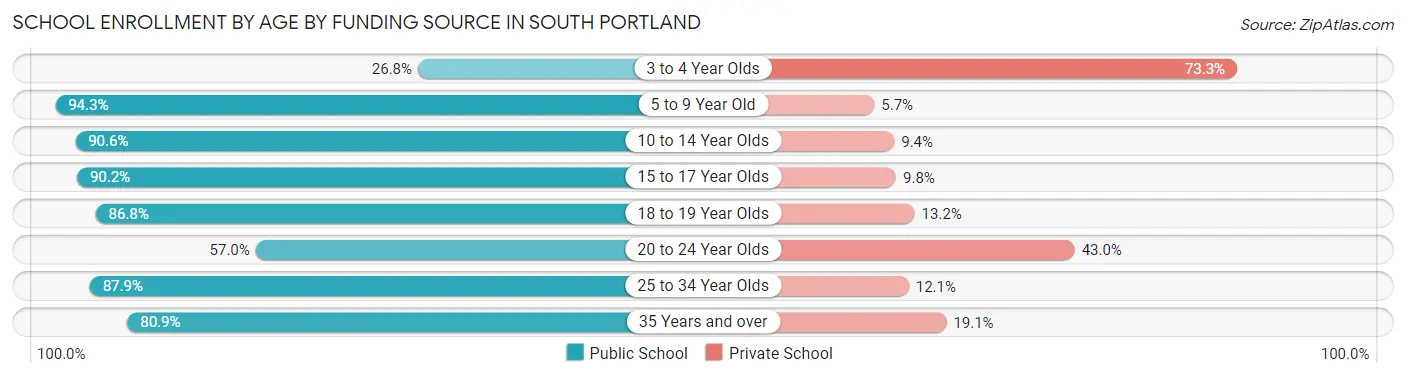
Out of a total of 4,995 students who are enrolled in schools in South Portland, 844 (16.9%) attend a private institution, while the remaining 4,151 (83.1%) are enrolled in public schools. The age group of 3 to 4 year olds has the highest likelihood of being enrolled in private schools, with 167 (73.3% in the age bracket) enrolled. Conversely, the age group of 5 to 9 year old has the lowest likelihood of being enrolled in a private school, with 825 (94.3% in the age bracket) attending a public institution.
| Age Bracket | Public School | Private School |
| 3 to 4 Year Olds | 61 (26.8%) | 167 (73.3%) |
| 5 to 9 Year Old | 825 (94.3%) | 50 (5.7%) |
| 10 to 14 Year Olds | 1,009 (90.6%) | 105 (9.4%) |
| 15 to 17 Year Olds | 841 (90.2%) | 91 (9.8%) |
| 18 to 19 Year Olds | 466 (86.8%) | 71 (13.2%) |
| 20 to 24 Year Olds | 331 (57.0%) | 250 (43.0%) |
| 25 to 34 Year Olds | 355 (87.9%) | 49 (12.1%) |
| 35 Years and over | 262 (80.9%) | 62 (19.1%) |
| Total | 4,151 (83.1%) | 844 (16.9%) |
Educational Attainment by Field of Study in South Portland
Business (1,581 | 15.2%), social sciences (1,127 | 10.9%), science & technology (1,062 | 10.2%), education (925 | 8.9%), and literature & languages (750 | 7.2%) are the most common fields of study among 10,377 individuals in South Portland who have obtained a bachelor's degree or higher.
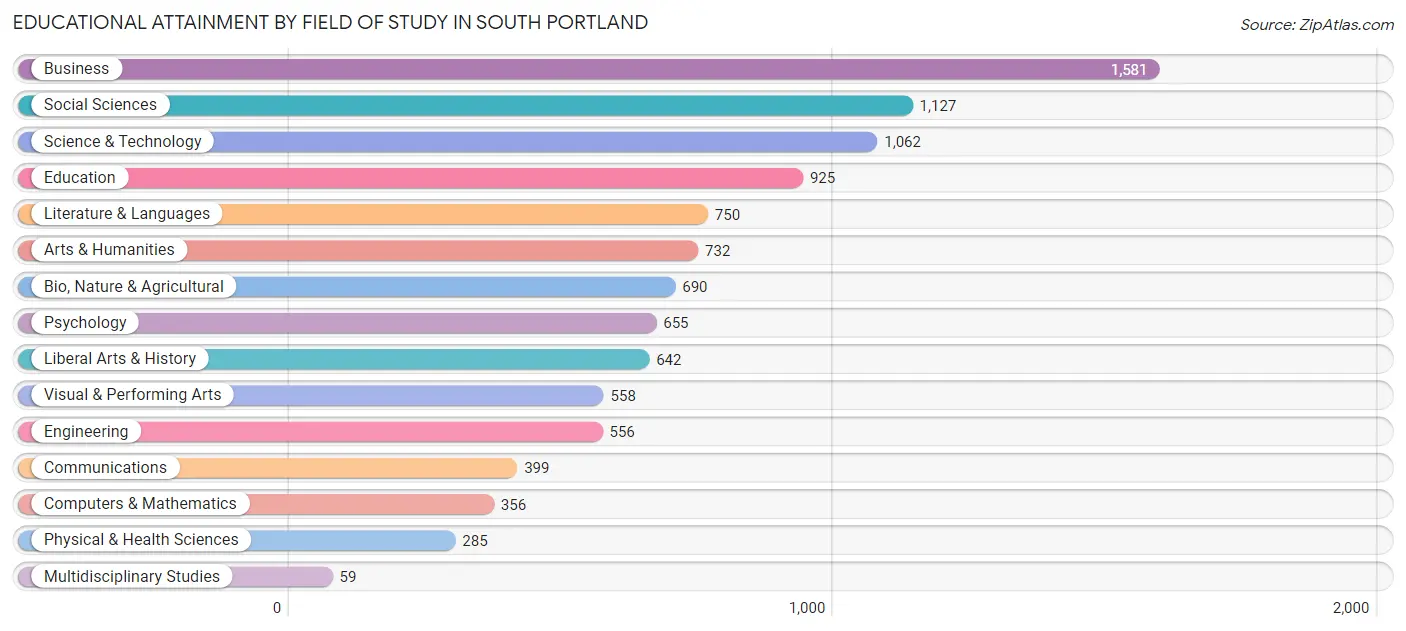
| Field of Study | # Graduates | % Graduates |
| Computers & Mathematics | 356 | 3.4% |
| Bio, Nature & Agricultural | 690 | 6.7% |
| Physical & Health Sciences | 285 | 2.8% |
| Psychology | 655 | 6.3% |
| Social Sciences | 1,127 | 10.9% |
| Engineering | 556 | 5.4% |
| Multidisciplinary Studies | 59 | 0.6% |
| Science & Technology | 1,062 | 10.2% |
| Business | 1,581 | 15.2% |
| Education | 925 | 8.9% |
| Literature & Languages | 750 | 7.2% |
| Liberal Arts & History | 642 | 6.2% |
| Visual & Performing Arts | 558 | 5.4% |
| Communications | 399 | 3.8% |
| Arts & Humanities | 732 | 7.0% |
| Total | 10,377 | 100.0% |
Transportation & Commute in South Portland
Vehicle Availability by Sex in South Portland
The most prevalent vehicle ownership categories in South Portland are males with 2 vehicles (4,246, accounting for 50.9%) and females with 2 vehicles (3,573, making up 57.7%).
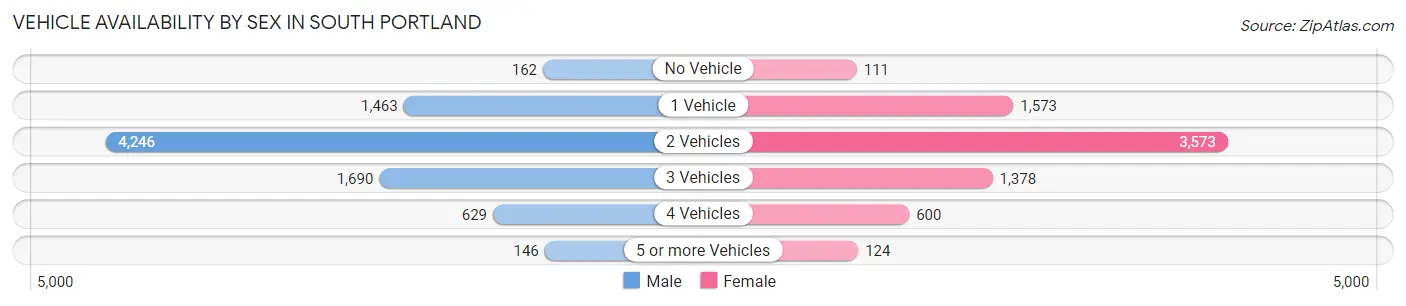
| Vehicles Available | Male | Female |
| No Vehicle | 162 (1.9%) | 111 (1.5%) |
| 1 Vehicle | 1,463 (17.5%) | 1,573 (21.4%) |
| 2 Vehicles | 4,246 (50.9%) | 3,573 (48.5%) |
| 3 Vehicles | 1,690 (20.3%) | 1,378 (18.7%) |
| 4 Vehicles | 629 (7.5%) | 600 (8.2%) |
| 5 or more Vehicles | 146 (1.8%) | 124 (1.7%) |
| Total | 8,336 (100.0%) | 7,359 (100.0%) |
Commute Time in South Portland
The most frequently occuring commute durations in South Portland are 10 to 14 minutes (3,805 commuters, 27.6%), 15 to 19 minutes (3,024 commuters, 21.9%), and 20 to 24 minutes (2,025 commuters, 14.7%).
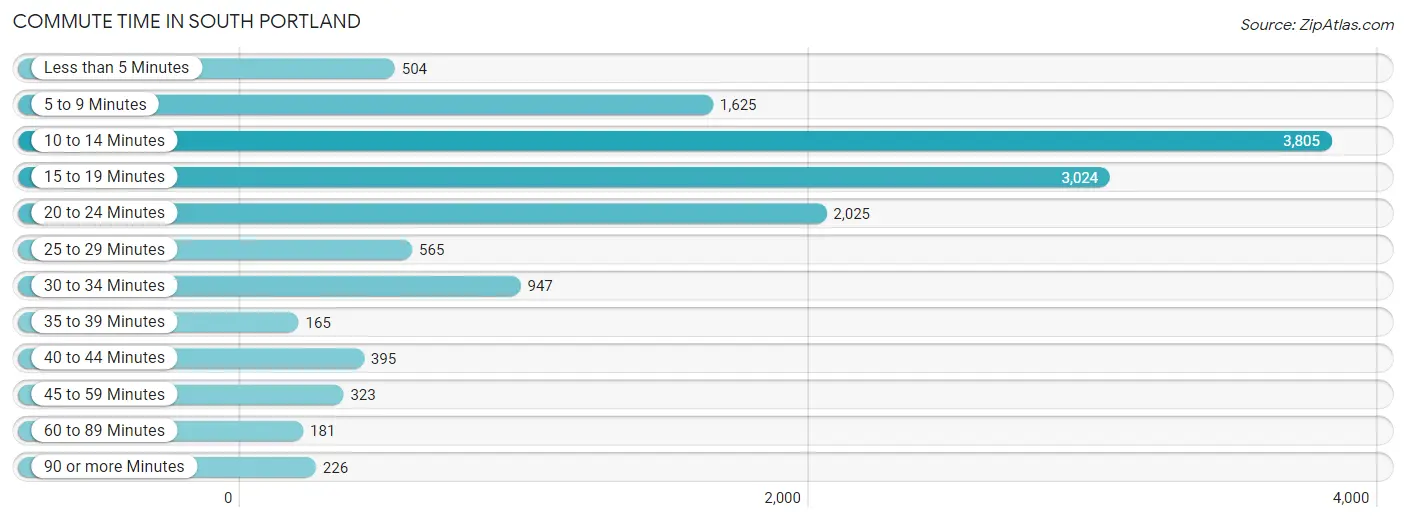
| Commute Time | # Commuters | % Commuters |
| Less than 5 Minutes | 504 | 3.7% |
| 5 to 9 Minutes | 1,625 | 11.8% |
| 10 to 14 Minutes | 3,805 | 27.6% |
| 15 to 19 Minutes | 3,024 | 21.9% |
| 20 to 24 Minutes | 2,025 | 14.7% |
| 25 to 29 Minutes | 565 | 4.1% |
| 30 to 34 Minutes | 947 | 6.9% |
| 35 to 39 Minutes | 165 | 1.2% |
| 40 to 44 Minutes | 395 | 2.9% |
| 45 to 59 Minutes | 323 | 2.3% |
| 60 to 89 Minutes | 181 | 1.3% |
| 90 or more Minutes | 226 | 1.6% |
Commute Time by Sex in South Portland
The most common commute times in South Portland are 10 to 14 minutes (2,033 commuters, 27.6%) for males and 10 to 14 minutes (1,772 commuters, 27.6%) for females.
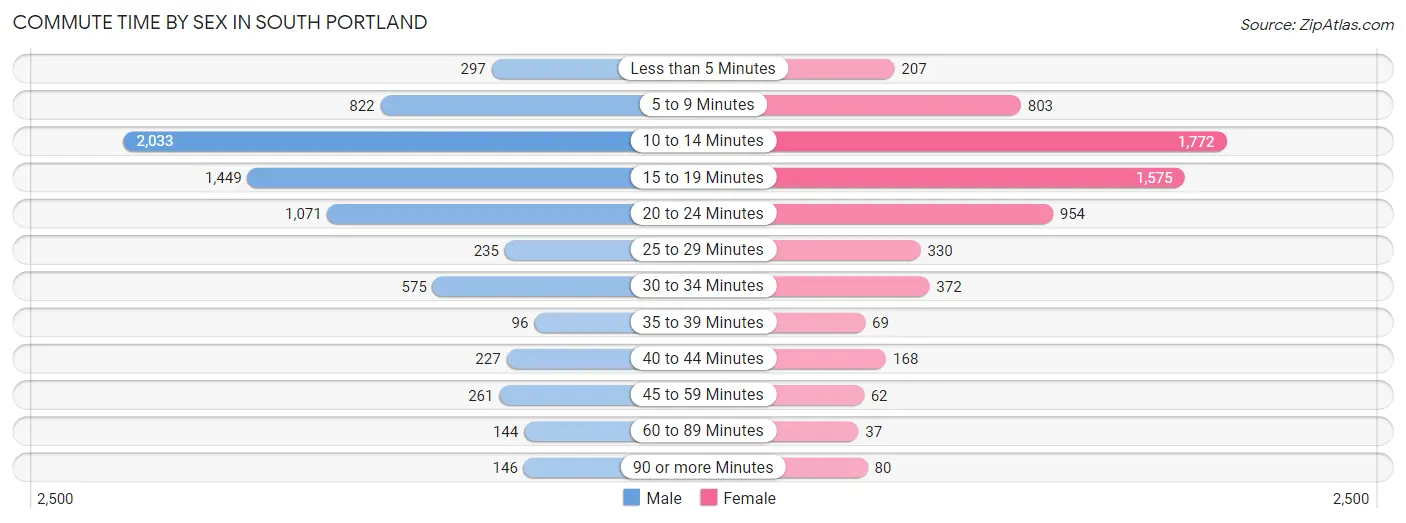
| Commute Time | Male | Female |
| Less than 5 Minutes | 297 (4.0%) | 207 (3.2%) |
| 5 to 9 Minutes | 822 (11.2%) | 803 (12.5%) |
| 10 to 14 Minutes | 2,033 (27.6%) | 1,772 (27.6%) |
| 15 to 19 Minutes | 1,449 (19.7%) | 1,575 (24.5%) |
| 20 to 24 Minutes | 1,071 (14.6%) | 954 (14.8%) |
| 25 to 29 Minutes | 235 (3.2%) | 330 (5.1%) |
| 30 to 34 Minutes | 575 (7.8%) | 372 (5.8%) |
| 35 to 39 Minutes | 96 (1.3%) | 69 (1.1%) |
| 40 to 44 Minutes | 227 (3.1%) | 168 (2.6%) |
| 45 to 59 Minutes | 261 (3.5%) | 62 (1.0%) |
| 60 to 89 Minutes | 144 (2.0%) | 37 (0.6%) |
| 90 or more Minutes | 146 (2.0%) | 80 (1.2%) |
Time of Departure to Work by Sex in South Portland
The most frequent times of departure to work in South Portland are 7:30 AM to 7:59 AM (1,091, 14.8%) for males and 7:30 AM to 7:59 AM (1,377, 21.4%) for females.
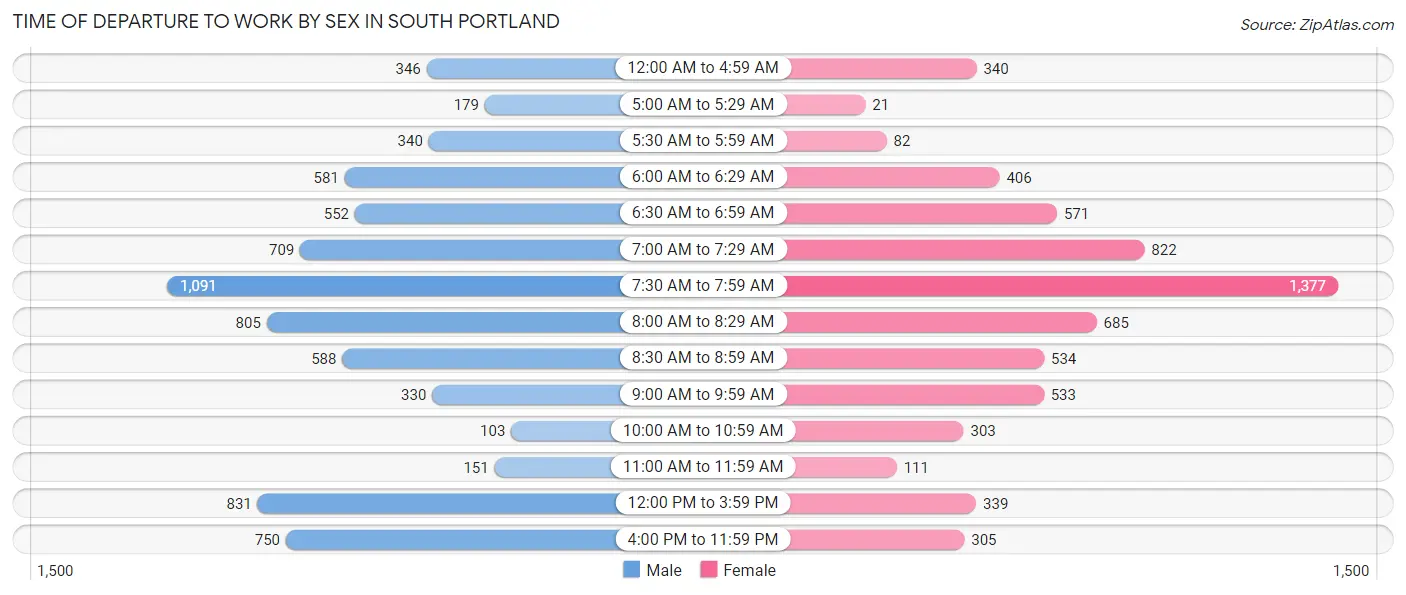
| Time of Departure | Male | Female |
| 12:00 AM to 4:59 AM | 346 (4.7%) | 340 (5.3%) |
| 5:00 AM to 5:29 AM | 179 (2.4%) | 21 (0.3%) |
| 5:30 AM to 5:59 AM | 340 (4.6%) | 82 (1.3%) |
| 6:00 AM to 6:29 AM | 581 (7.9%) | 406 (6.3%) |
| 6:30 AM to 6:59 AM | 552 (7.5%) | 571 (8.9%) |
| 7:00 AM to 7:29 AM | 709 (9.6%) | 822 (12.8%) |
| 7:30 AM to 7:59 AM | 1,091 (14.8%) | 1,377 (21.4%) |
| 8:00 AM to 8:29 AM | 805 (10.9%) | 685 (10.6%) |
| 8:30 AM to 8:59 AM | 588 (8.0%) | 534 (8.3%) |
| 9:00 AM to 9:59 AM | 330 (4.5%) | 533 (8.3%) |
| 10:00 AM to 10:59 AM | 103 (1.4%) | 303 (4.7%) |
| 11:00 AM to 11:59 AM | 151 (2.1%) | 111 (1.7%) |
| 12:00 PM to 3:59 PM | 831 (11.3%) | 339 (5.3%) |
| 4:00 PM to 11:59 PM | 750 (10.2%) | 305 (4.7%) |
| Total | 7,356 (100.0%) | 6,429 (100.0%) |
Housing Occupancy in South Portland
Occupancy by Ownership in South Portland
Of the total 11,769 dwellings in South Portland, owner-occupied units account for 7,343 (62.4%), while renter-occupied units make up 4,426 (37.6%).
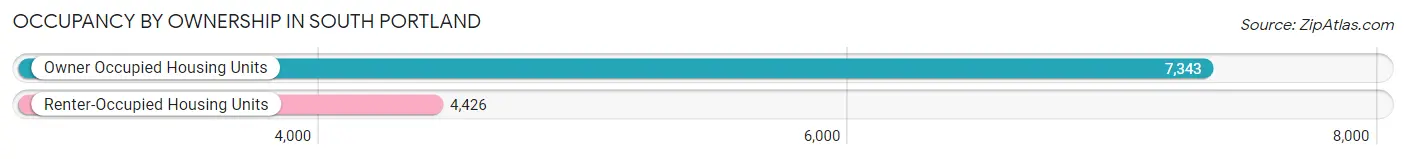
| Occupancy | # Housing Units | % Housing Units |
| Owner Occupied Housing Units | 7,343 | 62.4% |
| Renter-Occupied Housing Units | 4,426 | 37.6% |
| Total Occupied Housing Units | 11,769 | 100.0% |
Occupancy by Household Size in South Portland
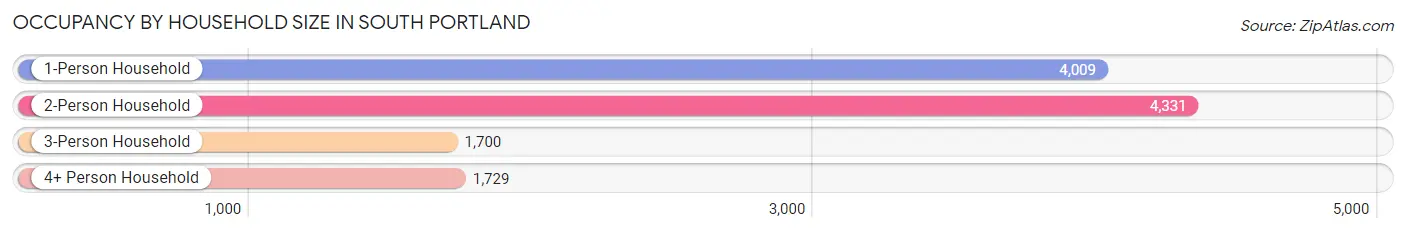
| Household Size | # Housing Units | % Housing Units |
| 1-Person Household | 4,009 | 34.1% |
| 2-Person Household | 4,331 | 36.8% |
| 3-Person Household | 1,700 | 14.4% |
| 4+ Person Household | 1,729 | 14.7% |
| Total Housing Units | 11,769 | 100.0% |
Occupancy by Ownership by Household Size in South Portland
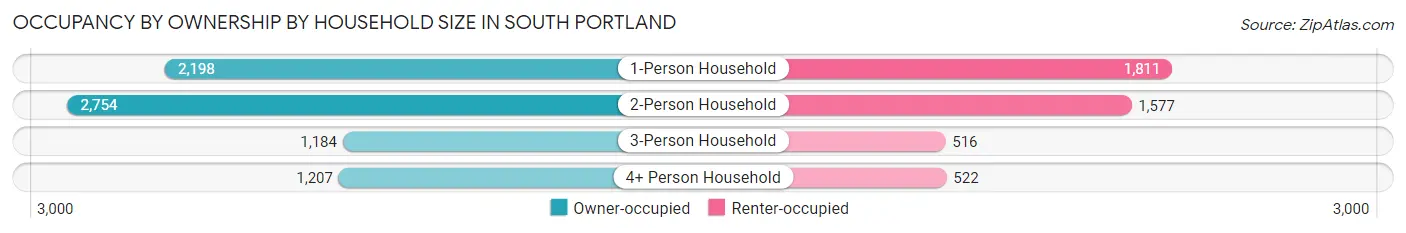
| Household Size | Owner-occupied | Renter-occupied |
| 1-Person Household | 2,198 (54.8%) | 1,811 (45.2%) |
| 2-Person Household | 2,754 (63.6%) | 1,577 (36.4%) |
| 3-Person Household | 1,184 (69.7%) | 516 (30.3%) |
| 4+ Person Household | 1,207 (69.8%) | 522 (30.2%) |
| Total Housing Units | 7,343 (62.4%) | 4,426 (37.6%) |
Occupancy by Educational Attainment in South Portland
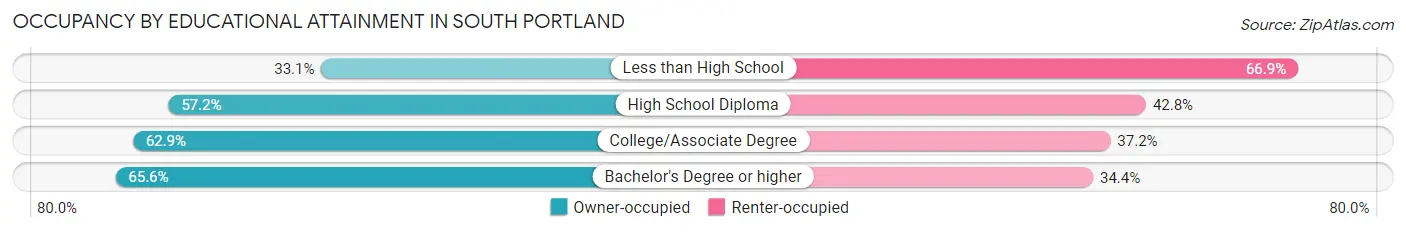
| Household Size | Owner-occupied | Renter-occupied |
| Less than High School | 96 (33.1%) | 194 (66.9%) |
| High School Diploma | 1,329 (57.2%) | 994 (42.8%) |
| College/Associate Degree | 2,027 (62.8%) | 1,198 (37.1%) |
| Bachelor's Degree or higher | 3,891 (65.6%) | 2,040 (34.4%) |
Occupancy by Age of Householder in South Portland
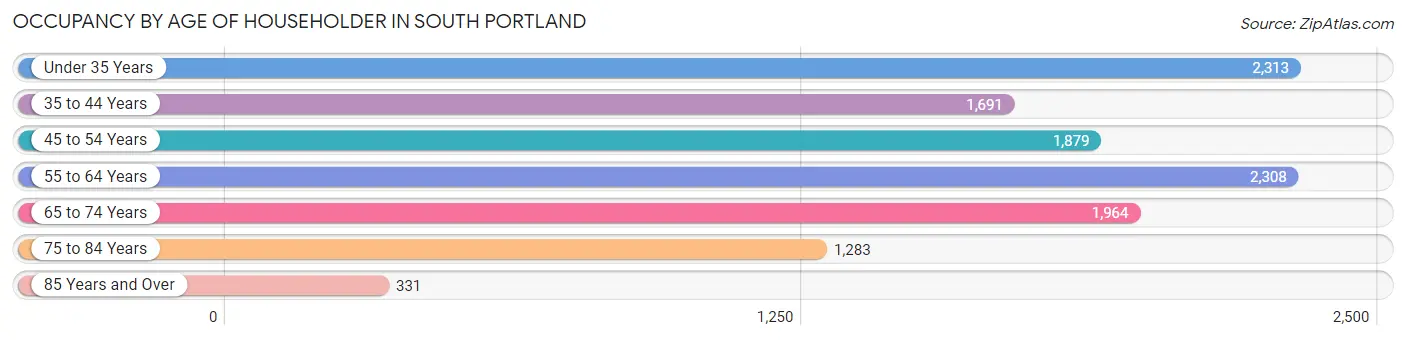
| Age Bracket | # Households | % Households |
| Under 35 Years | 2,313 | 19.7% |
| 35 to 44 Years | 1,691 | 14.4% |
| 45 to 54 Years | 1,879 | 16.0% |
| 55 to 64 Years | 2,308 | 19.6% |
| 65 to 74 Years | 1,964 | 16.7% |
| 75 to 84 Years | 1,283 | 10.9% |
| 85 Years and Over | 331 | 2.8% |
| Total | 11,769 | 100.0% |
Housing Finances in South Portland
Median Income by Occupancy in South Portland
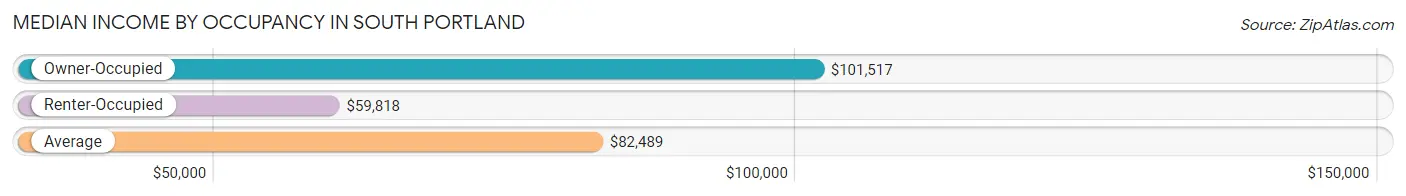
| Occupancy Type | # Households | Median Income |
| Owner-Occupied | 7,343 (62.4%) | $101,517 |
| Renter-Occupied | 4,426 (37.6%) | $59,818 |
| Average | 11,769 (100.0%) | $82,489 |
Occupancy by Householder Income Bracket in South Portland
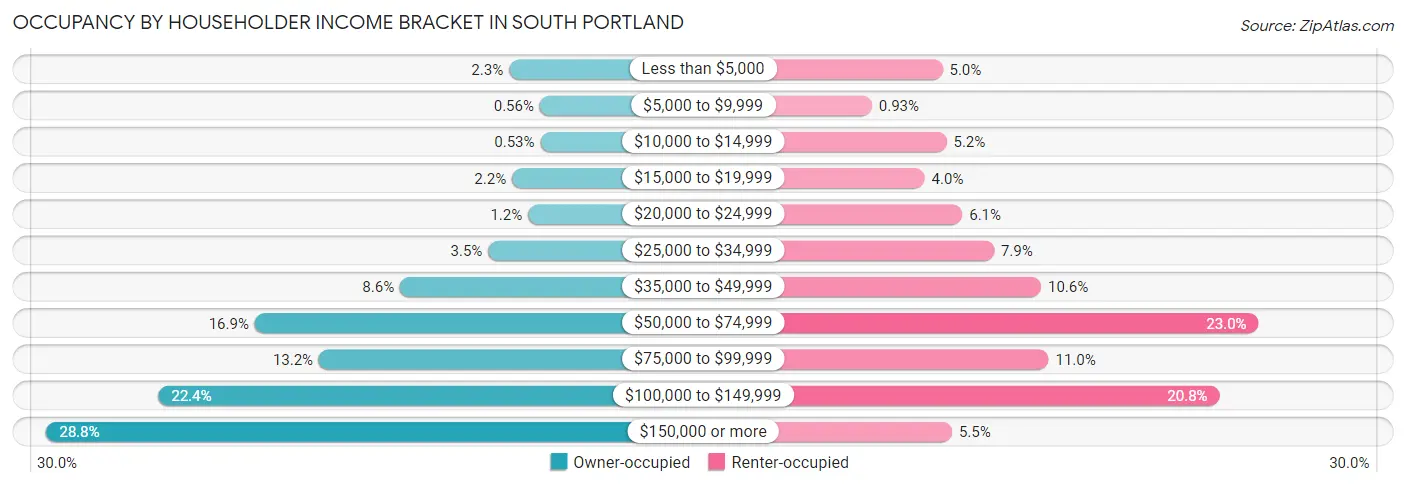
| Income Bracket | Owner-occupied | Renter-occupied |
| Less than $5,000 | 170 (2.3%) | 220 (5.0%) |
| $5,000 to $9,999 | 41 (0.6%) | 41 (0.9%) |
| $10,000 to $14,999 | 39 (0.5%) | 230 (5.2%) |
| $15,000 to $19,999 | 158 (2.1%) | 175 (4.0%) |
| $20,000 to $24,999 | 90 (1.2%) | 270 (6.1%) |
| $25,000 to $34,999 | 258 (3.5%) | 350 (7.9%) |
| $35,000 to $49,999 | 628 (8.6%) | 469 (10.6%) |
| $50,000 to $74,999 | 1,237 (16.9%) | 1,019 (23.0%) |
| $75,000 to $99,999 | 968 (13.2%) | 488 (11.0%) |
| $100,000 to $149,999 | 1,642 (22.4%) | 920 (20.8%) |
| $150,000 or more | 2,112 (28.8%) | 244 (5.5%) |
| Total | 7,343 (100.0%) | 4,426 (100.0%) |
Monthly Housing Cost Tiers in South Portland
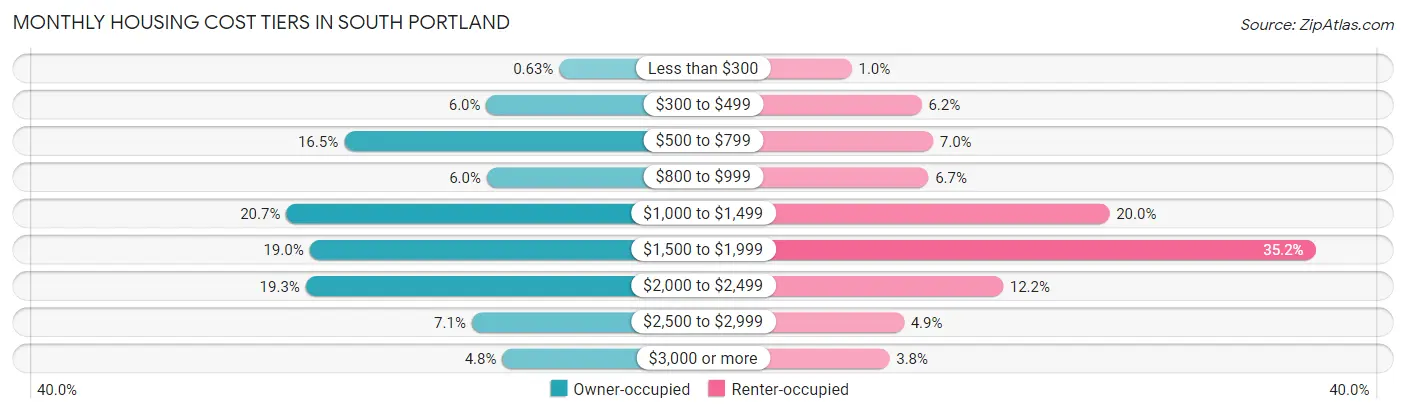
| Monthly Cost | Owner-occupied | Renter-occupied |
| Less than $300 | 46 (0.6%) | 46 (1.0%) |
| $300 to $499 | 440 (6.0%) | 274 (6.2%) |
| $500 to $799 | 1,210 (16.5%) | 311 (7.0%) |
| $800 to $999 | 438 (6.0%) | 296 (6.7%) |
| $1,000 to $1,499 | 1,522 (20.7%) | 886 (20.0%) |
| $1,500 to $1,999 | 1,397 (19.0%) | 1,558 (35.2%) |
| $2,000 to $2,499 | 1,417 (19.3%) | 539 (12.2%) |
| $2,500 to $2,999 | 519 (7.1%) | 216 (4.9%) |
| $3,000 or more | 354 (4.8%) | 169 (3.8%) |
| Total | 7,343 (100.0%) | 4,426 (100.0%) |
Physical Housing Characteristics in South Portland
Housing Structures in South Portland
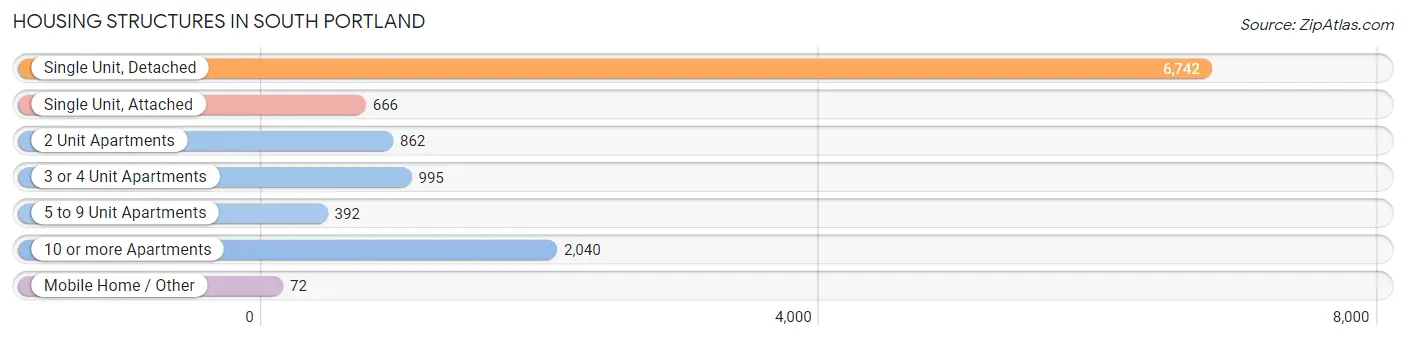
| Structure Type | # Housing Units | % Housing Units |
| Single Unit, Detached | 6,742 | 57.3% |
| Single Unit, Attached | 666 | 5.7% |
| 2 Unit Apartments | 862 | 7.3% |
| 3 or 4 Unit Apartments | 995 | 8.5% |
| 5 to 9 Unit Apartments | 392 | 3.3% |
| 10 or more Apartments | 2,040 | 17.3% |
| Mobile Home / Other | 72 | 0.6% |
| Total | 11,769 | 100.0% |
Housing Structures by Occupancy in South Portland
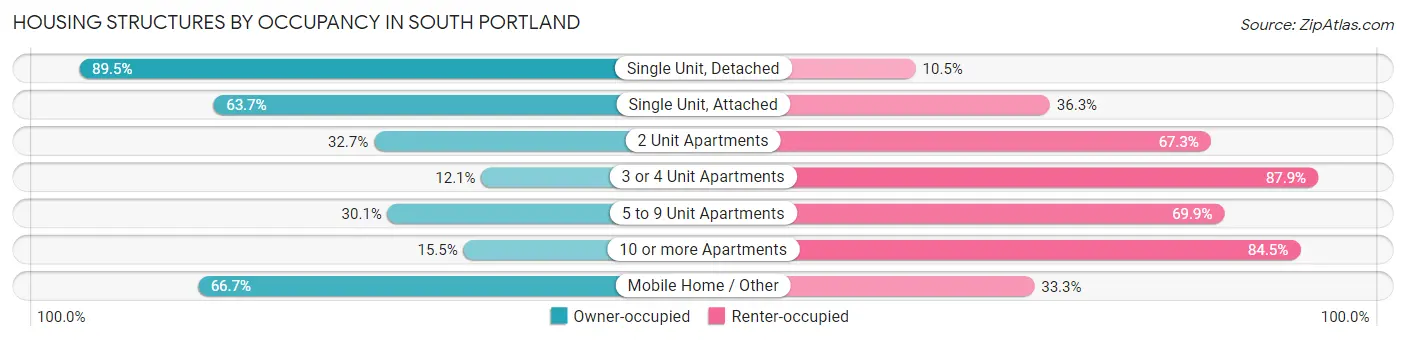
| Structure Type | Owner-occupied | Renter-occupied |
| Single Unit, Detached | 6,035 (89.5%) | 707 (10.5%) |
| Single Unit, Attached | 424 (63.7%) | 242 (36.3%) |
| 2 Unit Apartments | 282 (32.7%) | 580 (67.3%) |
| 3 or 4 Unit Apartments | 120 (12.1%) | 875 (87.9%) |
| 5 to 9 Unit Apartments | 118 (30.1%) | 274 (69.9%) |
| 10 or more Apartments | 316 (15.5%) | 1,724 (84.5%) |
| Mobile Home / Other | 48 (66.7%) | 24 (33.3%) |
| Total | 7,343 (62.4%) | 4,426 (37.6%) |
Housing Structures by Number of Rooms in South Portland
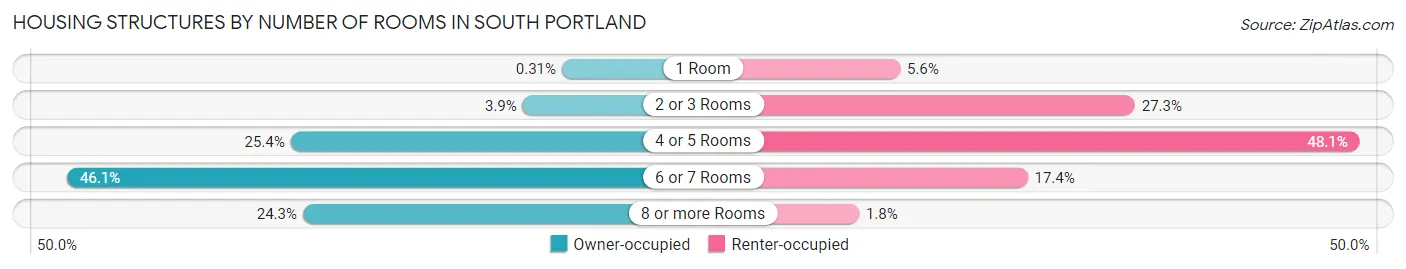
| Number of Rooms | Owner-occupied | Renter-occupied |
| 1 Room | 23 (0.3%) | 246 (5.6%) |
| 2 or 3 Rooms | 289 (3.9%) | 1,207 (27.3%) |
| 4 or 5 Rooms | 1,865 (25.4%) | 2,127 (48.1%) |
| 6 or 7 Rooms | 3,384 (46.1%) | 768 (17.3%) |
| 8 or more Rooms | 1,782 (24.3%) | 78 (1.8%) |
| Total | 7,343 (100.0%) | 4,426 (100.0%) |
Housing Structure by Heating Type in South Portland
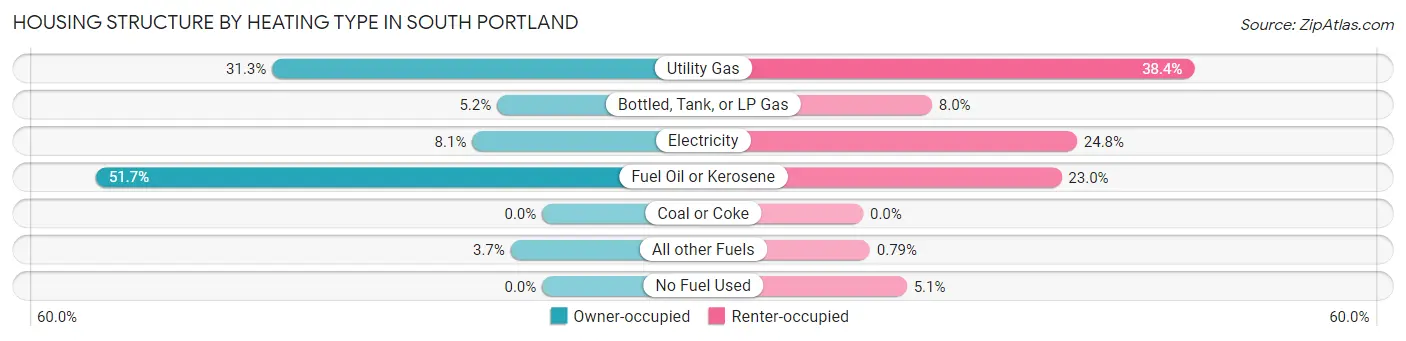
| Heating Type | Owner-occupied | Renter-occupied |
| Utility Gas | 2,298 (31.3%) | 1,699 (38.4%) |
| Bottled, Tank, or LP Gas | 383 (5.2%) | 353 (8.0%) |
| Electricity | 595 (8.1%) | 1,097 (24.8%) |
| Fuel Oil or Kerosene | 3,799 (51.7%) | 1,018 (23.0%) |
| Coal or Coke | 0 (0.0%) | 0 (0.0%) |
| All other Fuels | 268 (3.6%) | 35 (0.8%) |
| No Fuel Used | 0 (0.0%) | 224 (5.1%) |
| Total | 7,343 (100.0%) | 4,426 (100.0%) |
Household Vehicle Usage in South Portland
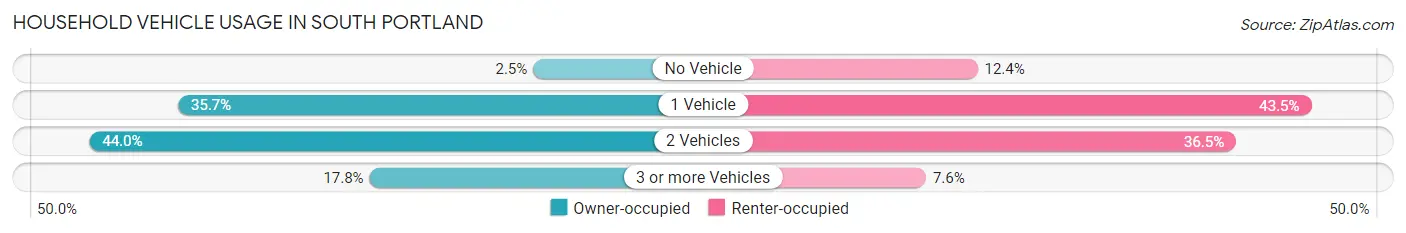
| Vehicles per Household | Owner-occupied | Renter-occupied |
| No Vehicle | 186 (2.5%) | 548 (12.4%) |
| 1 Vehicle | 2,621 (35.7%) | 1,927 (43.5%) |
| 2 Vehicles | 3,228 (44.0%) | 1,616 (36.5%) |
| 3 or more Vehicles | 1,308 (17.8%) | 335 (7.6%) |
| Total | 7,343 (100.0%) | 4,426 (100.0%) |
Real Estate & Mortgages in South Portland
Real Estate and Mortgage Overview in South Portland
| Characteristic | Without Mortgage | With Mortgage |
| Housing Units | 2,091 | 5,252 |
| Median Property Value | $338,400 | $367,800 |
| Median Household Income | $68,009 | $1,704 |
| Monthly Housing Costs | $629 | $349 |
| Real Estate Taxes | $3,942 | $16 |
Property Value by Mortgage Status in South Portland
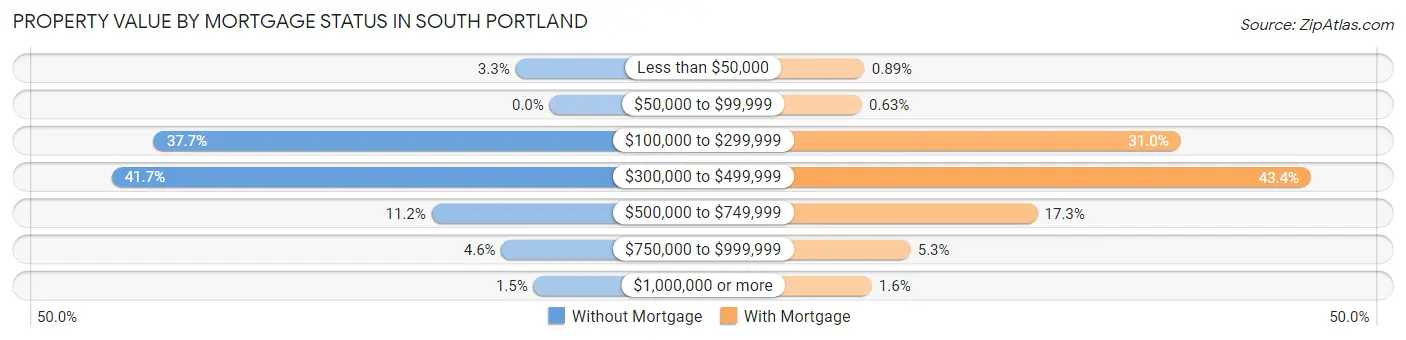
| Property Value | Without Mortgage | With Mortgage |
| Less than $50,000 | 68 (3.3%) | 47 (0.9%) |
| $50,000 to $99,999 | 0 (0.0%) | 33 (0.6%) |
| $100,000 to $299,999 | 788 (37.7%) | 1,626 (31.0%) |
| $300,000 to $499,999 | 872 (41.7%) | 2,278 (43.4%) |
| $500,000 to $749,999 | 235 (11.2%) | 910 (17.3%) |
| $750,000 to $999,999 | 96 (4.6%) | 276 (5.3%) |
| $1,000,000 or more | 32 (1.5%) | 82 (1.6%) |
| Total | 2,091 (100.0%) | 5,252 (100.0%) |
Household Income by Mortgage Status in South Portland
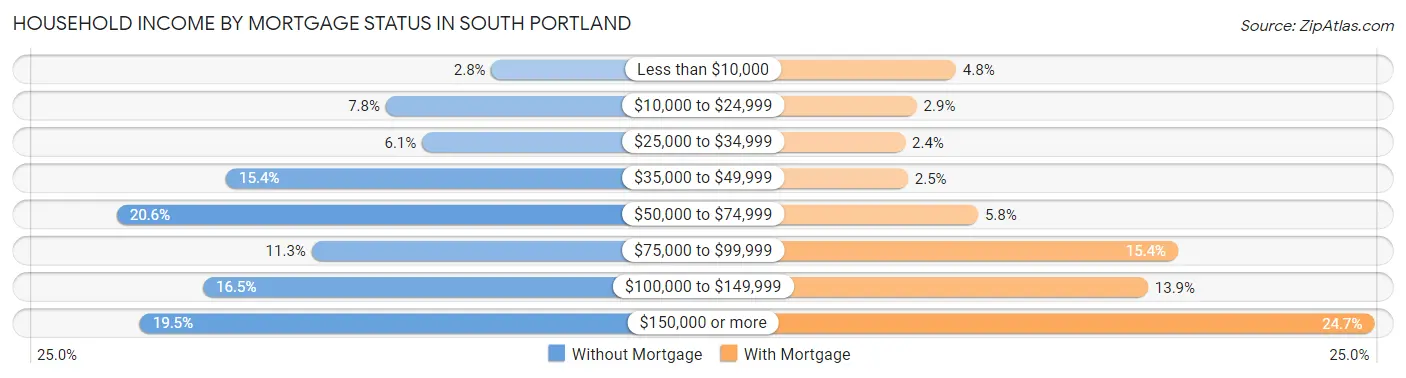
| Household Income | Without Mortgage | With Mortgage |
| Less than $10,000 | 58 (2.8%) | 251 (4.8%) |
| $10,000 to $24,999 | 163 (7.8%) | 153 (2.9%) |
| $25,000 to $34,999 | 127 (6.1%) | 124 (2.4%) |
| $35,000 to $49,999 | 322 (15.4%) | 131 (2.5%) |
| $50,000 to $74,999 | 431 (20.6%) | 306 (5.8%) |
| $75,000 to $99,999 | 237 (11.3%) | 806 (15.3%) |
| $100,000 to $149,999 | 345 (16.5%) | 731 (13.9%) |
| $150,000 or more | 408 (19.5%) | 1,297 (24.7%) |
| Total | 2,091 (100.0%) | 5,252 (100.0%) |
Property Value to Household Income Ratio in South Portland
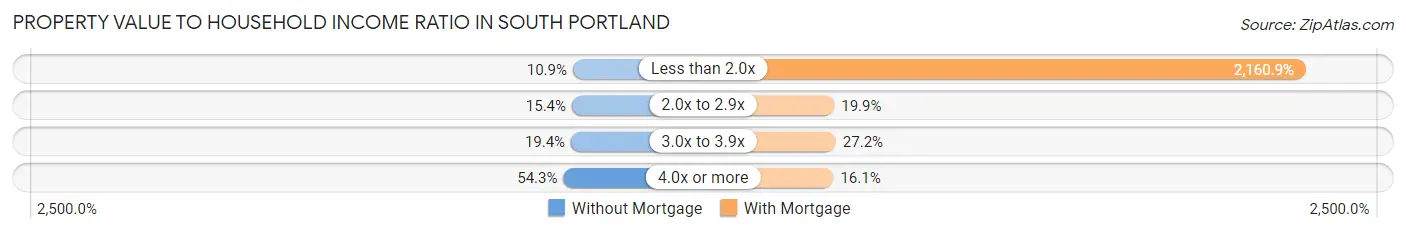
| Value-to-Income Ratio | Without Mortgage | With Mortgage |
| Less than 2.0x | 228 (10.9%) | 113,490 (2,160.9%) |
| 2.0x to 2.9x | 322 (15.4%) | 1,046 (19.9%) |
| 3.0x to 3.9x | 405 (19.4%) | 1,427 (27.2%) |
| 4.0x or more | 1,136 (54.3%) | 844 (16.1%) |
| Total | 2,091 (100.0%) | 5,252 (100.0%) |
Real Estate Taxes by Mortgage Status in South Portland
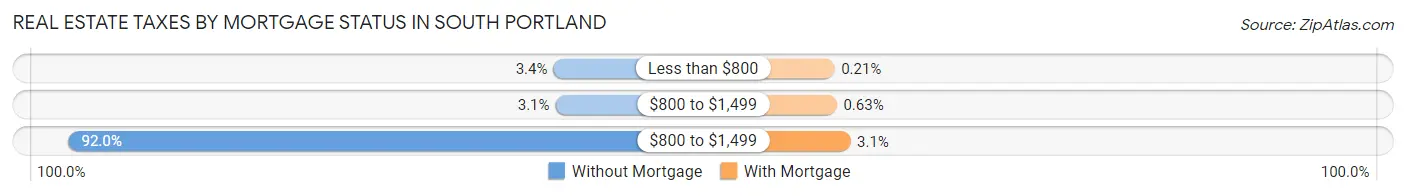
| Property Taxes | Without Mortgage | With Mortgage |
| Less than $800 | 72 (3.4%) | 11 (0.2%) |
| $800 to $1,499 | 64 (3.1%) | 33 (0.6%) |
| $800 to $1,499 | 1,923 (92.0%) | 164 (3.1%) |
| Total | 2,091 (100.0%) | 5,252 (100.0%) |
Health & Disability in South Portland
Health Insurance Coverage by Age in South Portland
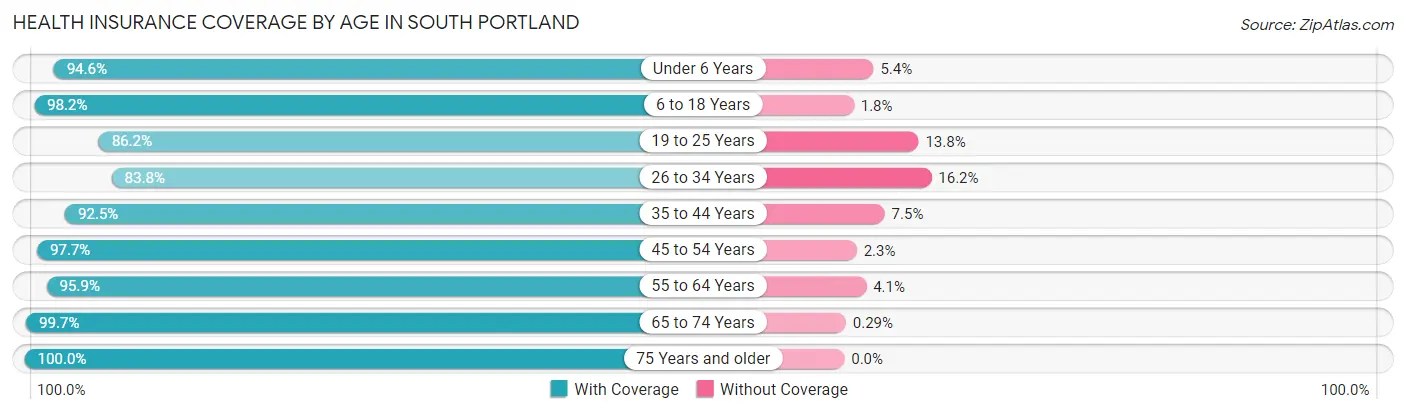
| Age Bracket | With Coverage | Without Coverage |
| Under 6 Years | 1,182 (94.6%) | 68 (5.4%) |
| 6 to 18 Years | 3,279 (98.2%) | 59 (1.8%) |
| 19 to 25 Years | 2,512 (86.2%) | 403 (13.8%) |
| 26 to 34 Years | 3,141 (83.8%) | 609 (16.2%) |
| 35 to 44 Years | 2,739 (92.5%) | 223 (7.5%) |
| 45 to 54 Years | 3,171 (97.7%) | 75 (2.3%) |
| 55 to 64 Years | 3,498 (95.9%) | 149 (4.1%) |
| 65 to 74 Years | 3,049 (99.7%) | 9 (0.3%) |
| 75 Years and older | 2,137 (100.0%) | 0 (0.0%) |
| Total | 24,708 (93.9%) | 1,595 (6.1%) |
Health Insurance Coverage by Citizenship Status in South Portland
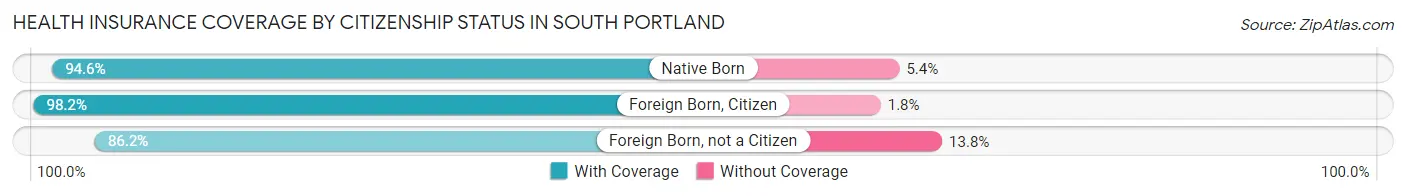
| Citizenship Status | With Coverage | Without Coverage |
| Native Born | 1,182 (94.6%) | 68 (5.4%) |
| Foreign Born, Citizen | 3,279 (98.2%) | 59 (1.8%) |
| Foreign Born, not a Citizen | 2,512 (86.2%) | 403 (13.8%) |
Health Insurance Coverage by Household Income in South Portland
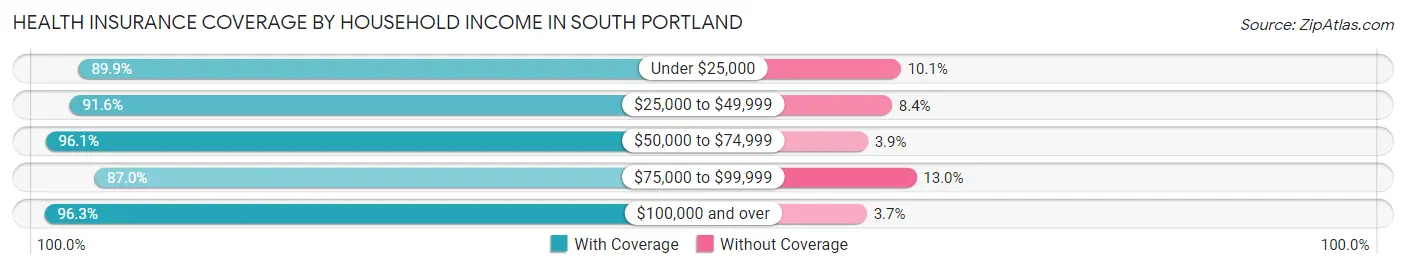
| Household Income | With Coverage | Without Coverage |
| Under $25,000 | 1,514 (89.9%) | 170 (10.1%) |
| $25,000 to $49,999 | 2,670 (91.6%) | 246 (8.4%) |
| $50,000 to $74,999 | 4,019 (96.1%) | 164 (3.9%) |
| $75,000 to $99,999 | 3,023 (87.0%) | 453 (13.0%) |
| $100,000 and over | 13,083 (96.3%) | 507 (3.7%) |
Public vs Private Health Insurance Coverage by Age in South Portland
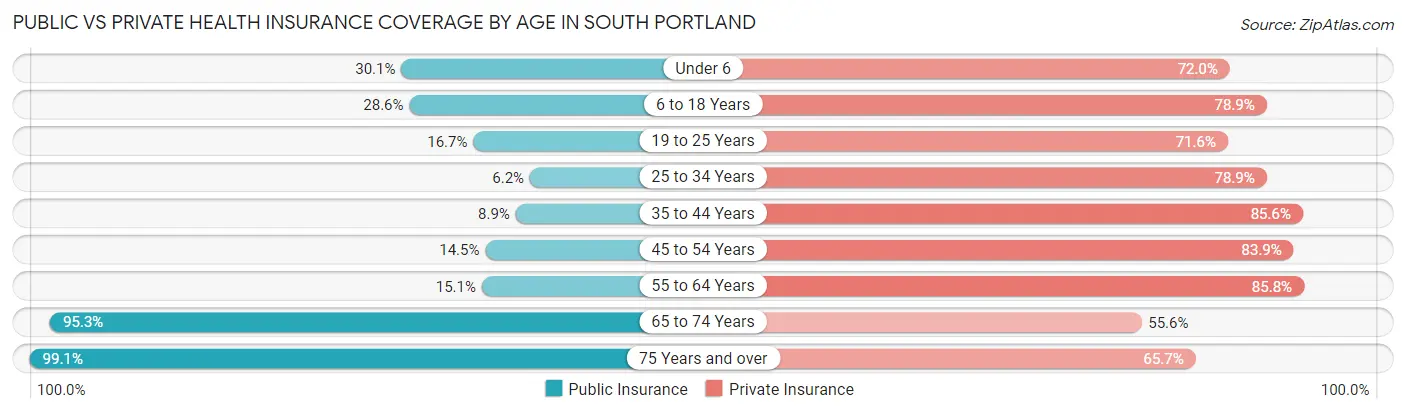
| Age Bracket | Public Insurance | Private Insurance |
| Under 6 | 376 (30.1%) | 900 (72.0%) |
| 6 to 18 Years | 954 (28.6%) | 2,632 (78.8%) |
| 19 to 25 Years | 487 (16.7%) | 2,088 (71.6%) |
| 25 to 34 Years | 233 (6.2%) | 2,957 (78.8%) |
| 35 to 44 Years | 262 (8.8%) | 2,534 (85.6%) |
| 45 to 54 Years | 470 (14.5%) | 2,722 (83.9%) |
| 55 to 64 Years | 552 (15.1%) | 3,128 (85.8%) |
| 65 to 74 Years | 2,914 (95.3%) | 1,700 (55.6%) |
| 75 Years and over | 2,117 (99.1%) | 1,403 (65.6%) |
| Total | 8,365 (31.8%) | 20,064 (76.3%) |
Disability Status by Sex by Age in South Portland
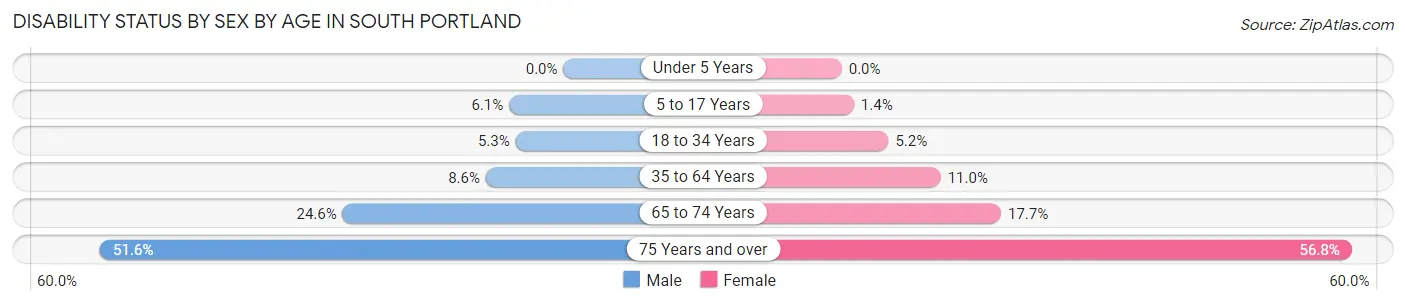
| Age Bracket | Male | Female |
| Under 5 Years | 0 (0.0%) | 0 (0.0%) |
| 5 to 17 Years | 98 (6.0%) | 19 (1.3%) |
| 18 to 34 Years | 188 (5.3%) | 183 (5.2%) |
| 35 to 64 Years | 407 (8.6%) | 567 (11.0%) |
| 65 to 74 Years | 364 (24.6%) | 280 (17.7%) |
| 75 Years and over | 421 (51.6%) | 750 (56.8%) |
Disability Class by Sex by Age in South Portland
Disability Class: Hearing Difficulty
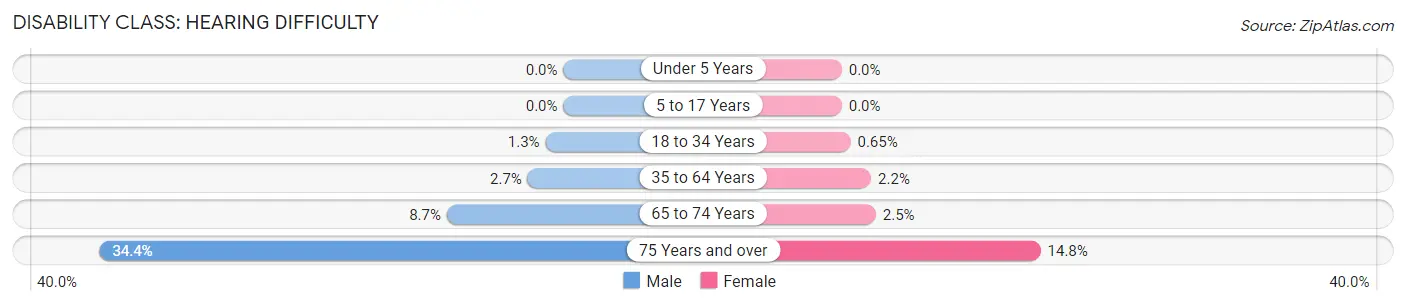
| Age Bracket | Male | Female |
| Under 5 Years | 0 (0.0%) | 0 (0.0%) |
| 5 to 17 Years | 0 (0.0%) | 0 (0.0%) |
| 18 to 34 Years | 47 (1.3%) | 23 (0.6%) |
| 35 to 64 Years | 125 (2.6%) | 112 (2.2%) |
| 65 to 74 Years | 128 (8.6%) | 40 (2.5%) |
| 75 Years and over | 281 (34.4%) | 195 (14.8%) |
Disability Class: Vision Difficulty
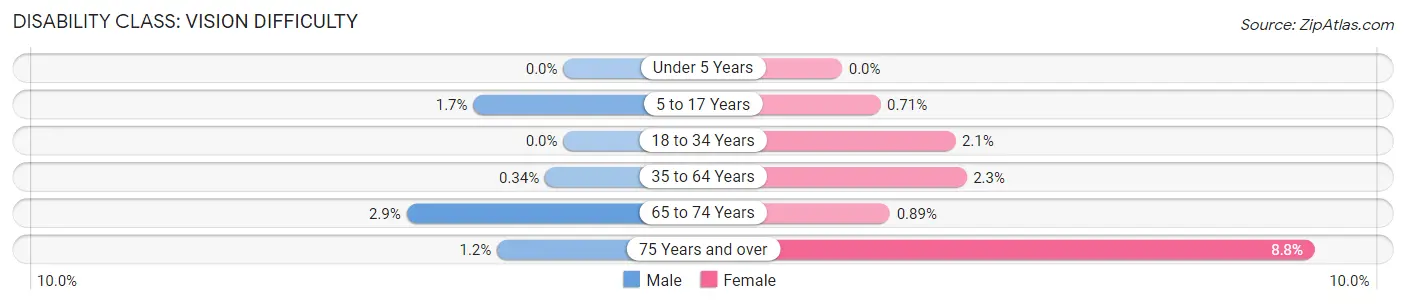
| Age Bracket | Male | Female |
| Under 5 Years | 0 (0.0%) | 0 (0.0%) |
| 5 to 17 Years | 27 (1.7%) | 10 (0.7%) |
| 18 to 34 Years | 0 (0.0%) | 74 (2.1%) |
| 35 to 64 Years | 16 (0.3%) | 119 (2.3%) |
| 65 to 74 Years | 43 (2.9%) | 14 (0.9%) |
| 75 Years and over | 10 (1.2%) | 116 (8.8%) |
Disability Class: Cognitive Difficulty
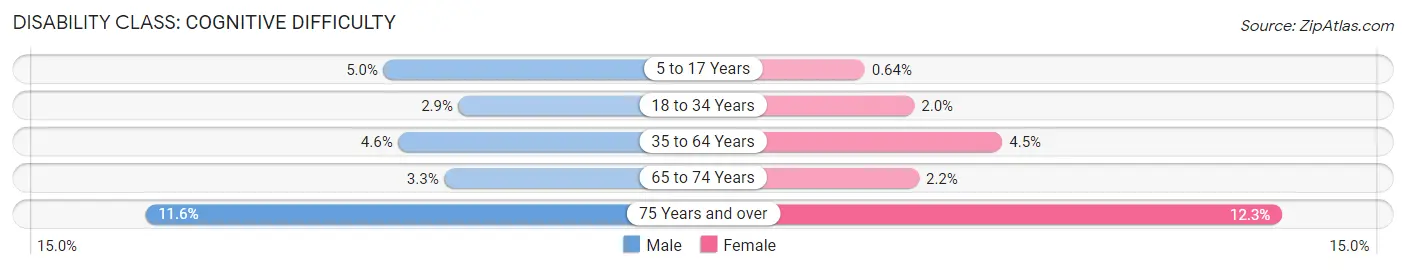
| Age Bracket | Male | Female |
| 5 to 17 Years | 81 (5.0%) | 9 (0.6%) |
| 18 to 34 Years | 103 (2.9%) | 71 (2.0%) |
| 35 to 64 Years | 216 (4.6%) | 230 (4.5%) |
| 65 to 74 Years | 49 (3.3%) | 34 (2.1%) |
| 75 Years and over | 95 (11.6%) | 162 (12.3%) |
Disability Class: Ambulatory Difficulty
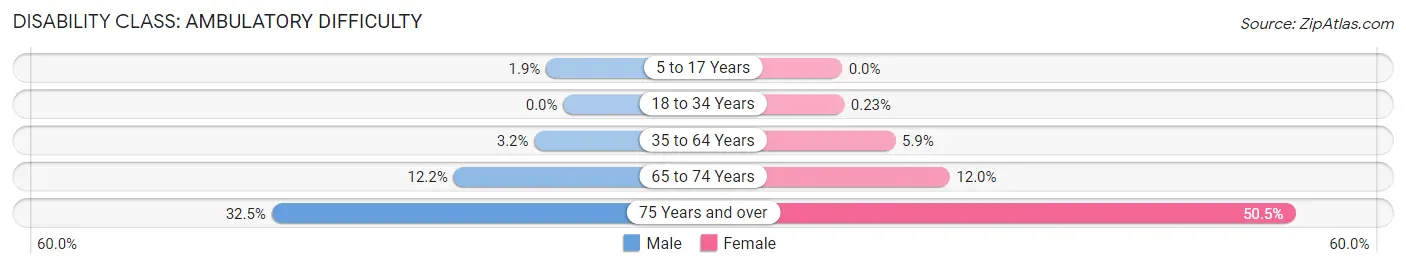
| Age Bracket | Male | Female |
| 5 to 17 Years | 31 (1.9%) | 0 (0.0%) |
| 18 to 34 Years | 0 (0.0%) | 8 (0.2%) |
| 35 to 64 Years | 152 (3.2%) | 305 (5.9%) |
| 65 to 74 Years | 181 (12.2%) | 189 (12.0%) |
| 75 Years and over | 265 (32.5%) | 667 (50.5%) |
Disability Class: Self-Care Difficulty
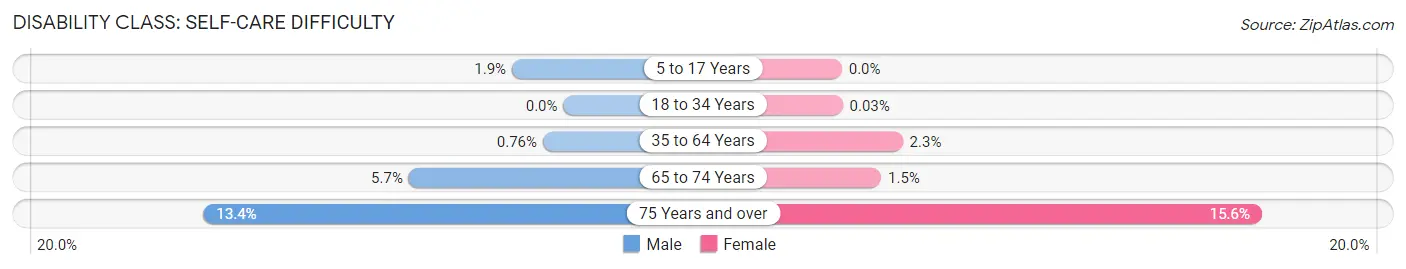
| Age Bracket | Male | Female |
| 5 to 17 Years | 31 (1.9%) | 0 (0.0%) |
| 18 to 34 Years | 0 (0.0%) | 1 (0.0%) |
| 35 to 64 Years | 36 (0.8%) | 116 (2.3%) |
| 65 to 74 Years | 85 (5.7%) | 23 (1.5%) |
| 75 Years and over | 109 (13.4%) | 206 (15.6%) |
Technology Access in South Portland
Computing Device Access in South Portland
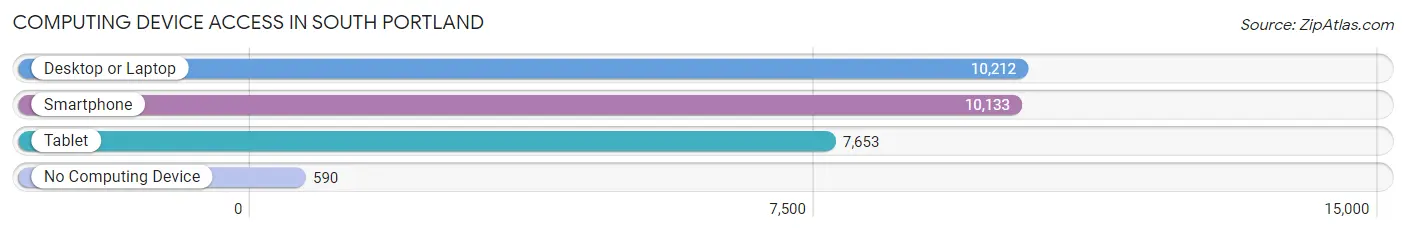
| Device Type | # Households | % Households |
| Desktop or Laptop | 10,212 | 86.8% |
| Smartphone | 10,133 | 86.1% |
| Tablet | 7,653 | 65.0% |
| No Computing Device | 590 | 5.0% |
| Total | 11,769 | 100.0% |
Internet Access in South Portland
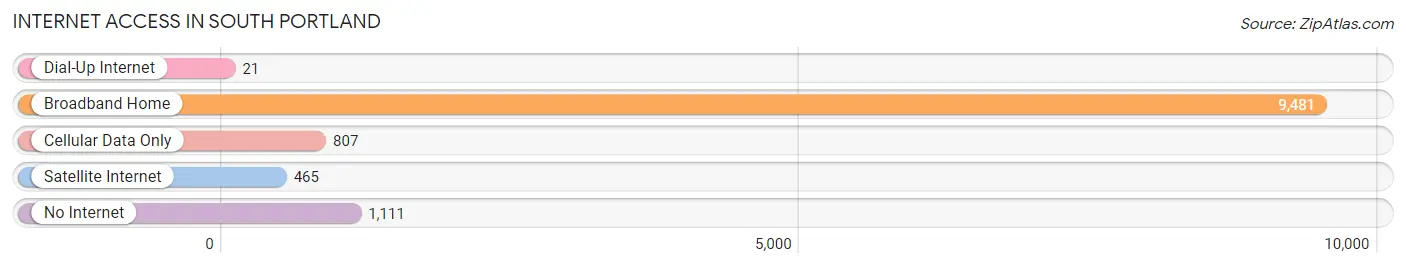
| Internet Type | # Households | % Households |
| Dial-Up Internet | 21 | 0.2% |
| Broadband Home | 9,481 | 80.6% |
| Cellular Data Only | 807 | 6.9% |
| Satellite Internet | 465 | 4.0% |
| No Internet | 1,111 | 9.4% |
| Total | 11,769 | 100.0% |
South Portland Summary
Introduction
South Portland is a city located in the state of Maine, United States. It is the fourth largest city in the state and is located in Cumberland County. South Portland is situated on the Portland Harbor and is part of the Portland-South Portland-Biddeford metropolitan area. The city has a population of 25,002 as of the 2010 census.
History
South Portland was first settled in 1630 by English settlers. The area was originally part of Cape Elizabeth, which was incorporated in 1765. In 1895, South Portland was incorporated as a city. The city was originally a farming and fishing community, but it soon developed into an industrial center. The city was home to several shipyards and factories, including the Portland Company, which was the first steel mill in the state.
The city experienced a period of growth in the early 20th century, with the population increasing from 4,000 in 1900 to over 20,000 by 1950. The city was also home to a large immigrant population, with many coming from Italy, Poland, and other European countries.
Geography
South Portland is located in Cumberland County, Maine. It is situated on the Portland Harbor and is part of the Portland-South Portland-Biddeford metropolitan area. The city has a total area of 14.3 square miles, of which 13.9 square miles is land and 0.4 square miles is water.
The city is bordered by the cities of Portland and Scarborough to the north, Cape Elizabeth to the east, and Westbrook to the west. The city is also bordered by the Atlantic Ocean to the south.
Economy
South Portland is a major industrial center in the state of Maine. The city is home to several large companies, including the Portland Company, which is the oldest steel mill in the state. The city is also home to several shipyards and factories, as well as a large retail sector.
The city is also home to the Maine Mall, which is the largest shopping mall in the state. The mall is home to over 150 stores and restaurants, as well as a movie theater.
Demographics
As of the 2010 census, South Portland had a population of 25,002. The racial makeup of the city was 94.2% White, 1.7% African American, 0.5% Native American, 1.7% Asian, 0.1% Pacific Islander, 0.7% from other races, and 1.2% from two or more races. Hispanic or Latino of any race were 2.3% of the population.
The median income for a household in the city was $50,817, and the median income for a family was $62,817. The per capita income for the city was $25,817.
Conclusion
South Portland is a city located in the state of Maine, United States. It is the fourth largest city in the state and is located in Cumberland County. South Portland is situated on the Portland Harbor and is part of the Portland-South Portland-Biddeford metropolitan area. The city has a population of 25,002 as of the 2010 census. South Portland was first settled in 1630 by English settlers and has since developed into an industrial center. The city is home to several large companies, including the Portland Company, which is the oldest steel mill in the state. The city is also home to a large retail sector, as well as the Maine Mall, which is the largest shopping mall in the state. The racial makeup of the city was 94.2% White, 1.7% African American, 0.5% Native American, 1.7% Asian, 0.1% Pacific Islander, 0.7% from other races, and 1.2% from two or more races. The median income for a household in the city was $50,817, and the median income for a family was $62,817.
Common Questions
What is Per Capita Income in South Portland?
Per Capita income in South Portland is $47,678.
What is the Median Family Income in South Portland?
Median Family Income in South Portland is $102,544.
What is the Median Household income in South Portland?
Median Household Income in South Portland is $82,489.
What is Income or Wage Gap in South Portland?
Income or Wage Gap in South Portland is 24.0%.
Women in South Portland earn 76.0 cents for every dollar earned by a man.
What is Inequality or Gini Index in South Portland?
Inequality or Gini Index in South Portland is 0.43.
What is the Total Population of South Portland?
Total Population of South Portland is 26,656.
What is the Total Male Population of South Portland?
Total Male Population of South Portland is 12,794.
What is the Total Female Population of South Portland?
Total Female Population of South Portland is 13,862.
What is the Ratio of Males per 100 Females in South Portland?
There are 92.30 Males per 100 Females in South Portland.
What is the Ratio of Females per 100 Males in South Portland?
There are 108.35 Females per 100 Males in South Portland.
What is the Median Population Age in South Portland?
Median Population Age in South Portland is 41.0 Years.
What is the Average Family Size in South Portland
Average Family Size in South Portland is 2.9 People.
What is the Average Household Size in South Portland
Average Household Size in South Portland is 2.2 People.
How Large is the Labor Force in South Portland?
There are 16,812 People in the Labor Forcein in South Portland.
What is the Percentage of People in the Labor Force in South Portland?
72.8% of People are in the Labor Force in South Portland.
What is the Unemployment Rate in South Portland?
Unemployment Rate in South Portland is 2.9%.