Eagan, MN Map & Demographics
Eagan Map
Eagan Overview
$54,238
PER CAPITA INCOME
$133,083
AVG FAMILY INCOME
$104,101
AVG HOUSEHOLD INCOME
31.8%
WAGE / INCOME GAP [ % ]
68.2¢/ $1
WAGE / INCOME GAP [ $ ]
$11,700
FAMILY INCOME DEFICIT
0.42
INEQUALITY / GINI INDEX
68,262
TOTAL POPULATION
33,865
MALE POPULATION
34,397
FEMALE POPULATION
98.45
MALES / 100 FEMALES
101.57
FEMALES / 100 MALES
38.7
MEDIAN AGE
3.0
AVG FAMILY SIZE
2.5
AVG HOUSEHOLD SIZE
40,772
LABOR FORCE [ PEOPLE ]
74.5%
PERCENT IN LABOR FORCE
4.1%
UNEMPLOYMENT RATE
Income in Eagan
Income Overview in Eagan
Per Capita Income in Eagan is $54,238, while median incomes of families and households are $133,083 and $104,101 respectively.
| Characteristic | Number | Measure |
| Per Capita Income | 68,262 | $54,238 |
| Median Family Income | 17,988 | $133,083 |
| Mean Family Income | 17,988 | $161,059 |
| Median Household Income | 27,628 | $104,101 |
| Mean Household Income | 27,628 | $132,245 |
| Income Deficit | 17,988 | $11,700 |
| Wage / Income Gap (%) | 68,262 | 31.83% |
| Wage / Income Gap ($) | 68,262 | 68.17¢ per $1 |
| Gini / Inequality Index | 68,262 | 0.42 |
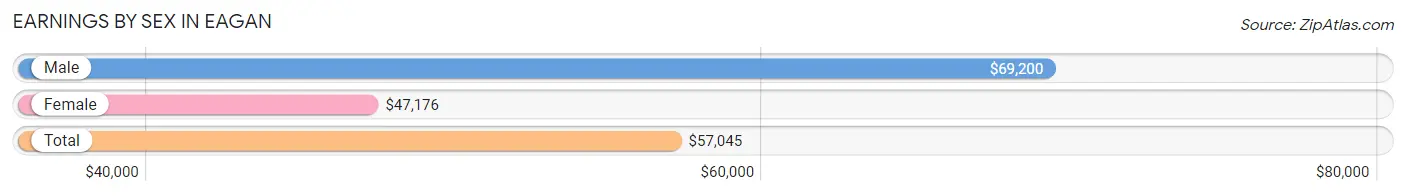
Earnings by Sex in Eagan
Average Earnings in Eagan are $57,045, $69,200 for men and $47,176 for women, a difference of 31.8%.
| Sex | Number | Average Earnings |
| Male | 21,695 (51.5%) | $69,200 |
| Female | 20,461 (48.5%) | $47,176 |
| Total | 42,156 (100.0%) | $57,045 |
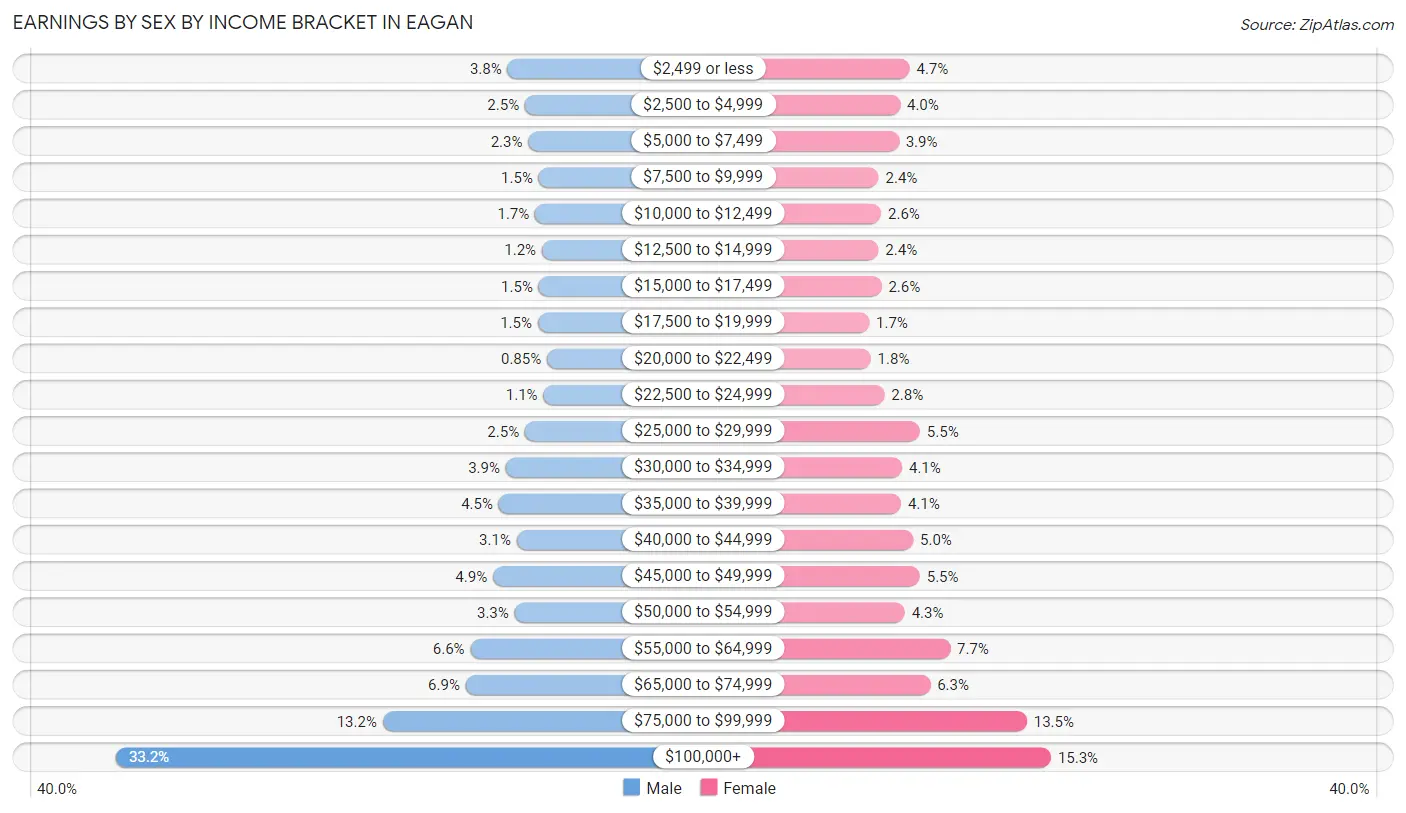
Earnings by Sex by Income Bracket in Eagan
The most common earnings brackets in Eagan are $100,000+ for men (7,192 | 33.2%) and $100,000+ for women (3,131 | 15.3%).
| Income | Male | Female |
| $2,499 or less | 826 (3.8%) | 962 (4.7%) |
| $2,500 to $4,999 | 543 (2.5%) | 816 (4.0%) |
| $5,000 to $7,499 | 488 (2.2%) | 795 (3.9%) |
| $7,500 to $9,999 | 320 (1.5%) | 487 (2.4%) |
| $10,000 to $12,499 | 377 (1.7%) | 526 (2.6%) |
| $12,500 to $14,999 | 266 (1.2%) | 484 (2.4%) |
| $15,000 to $17,499 | 318 (1.5%) | 531 (2.6%) |
| $17,500 to $19,999 | 334 (1.5%) | 341 (1.7%) |
| $20,000 to $22,499 | 184 (0.9%) | 366 (1.8%) |
| $22,500 to $24,999 | 242 (1.1%) | 578 (2.8%) |
| $25,000 to $29,999 | 542 (2.5%) | 1,121 (5.5%) |
| $30,000 to $34,999 | 854 (3.9%) | 848 (4.1%) |
| $35,000 to $39,999 | 967 (4.5%) | 831 (4.1%) |
| $40,000 to $44,999 | 677 (3.1%) | 1,017 (5.0%) |
| $45,000 to $49,999 | 1,062 (4.9%) | 1,119 (5.5%) |
| $50,000 to $54,999 | 712 (3.3%) | 887 (4.3%) |
| $55,000 to $64,999 | 1,430 (6.6%) | 1,583 (7.7%) |
| $65,000 to $74,999 | 1,505 (6.9%) | 1,278 (6.2%) |
| $75,000 to $99,999 | 2,856 (13.2%) | 2,760 (13.5%) |
| $100,000+ | 7,192 (33.2%) | 3,131 (15.3%) |
| Total | 21,695 (100.0%) | 20,461 (100.0%) |
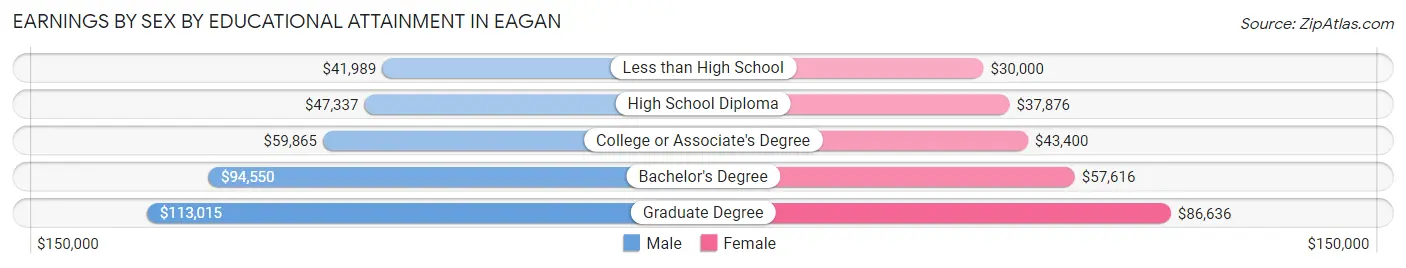
Earnings by Sex by Educational Attainment in Eagan
Average earnings in Eagan are $78,407 for men and $53,975 for women, a difference of 31.2%. Men with an educational attainment of graduate degree enjoy the highest average annual earnings of $113,015, while those with less than high school education earn the least with $41,989. Women with an educational attainment of graduate degree earn the most with the average annual earnings of $86,636, while those with less than high school education have the smallest earnings of $30,000.
| Educational Attainment | Male Income | Female Income |
| Less than High School | $41,989 | $30,000 |
| High School Diploma | $47,337 | $37,876 |
| College or Associate's Degree | $59,865 | $43,400 |
| Bachelor's Degree | $94,550 | $57,616 |
| Graduate Degree | $113,015 | $86,636 |
| Total | $78,407 | $53,975 |
Family Income in Eagan
Family Income Brackets in Eagan
According to the Eagan family income data, there are 4,695 families falling into the $200,000+ income range, which is the most common income bracket and makes up 26.1% of all families. Conversely, the $10,000 to $14,999 income bracket is the least frequent group with only 90 families (0.5%) belonging to this category.
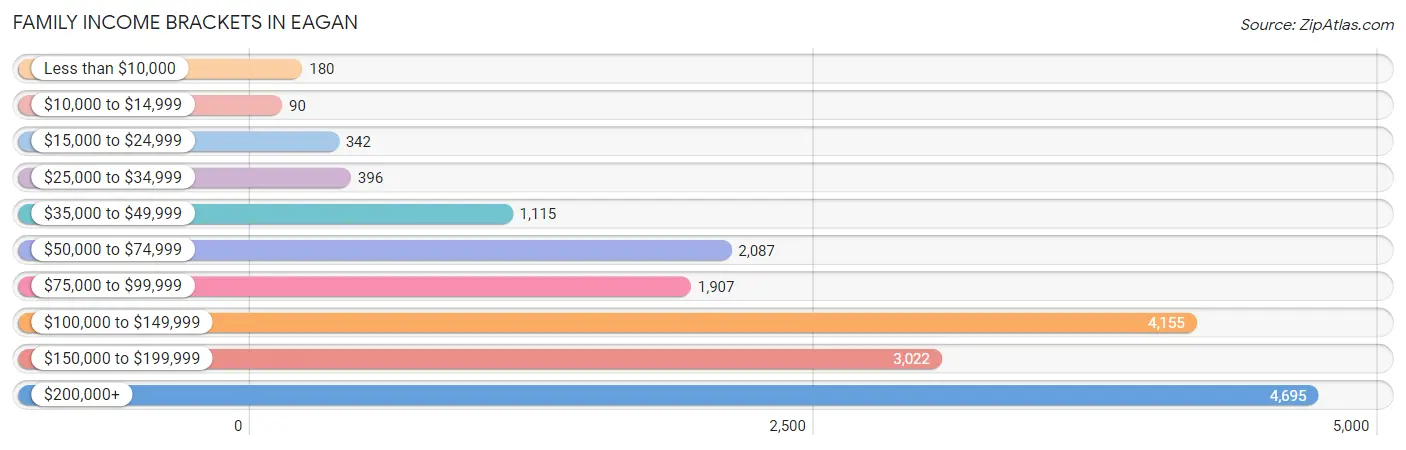
| Income Bracket | # Families | % Families |
| Less than $10,000 | 180 | 1.0% |
| $10,000 to $14,999 | 90 | 0.5% |
| $15,000 to $24,999 | 342 | 1.9% |
| $25,000 to $34,999 | 396 | 2.2% |
| $35,000 to $49,999 | 1,115 | 6.2% |
| $50,000 to $74,999 | 2,087 | 11.6% |
| $75,000 to $99,999 | 1,907 | 10.6% |
| $100,000 to $149,999 | 4,155 | 23.1% |
| $150,000 to $199,999 | 3,022 | 16.8% |
| $200,000+ | 4,695 | 26.1% |
Family Income by Famaliy Size in Eagan
4-person families (3,631 | 20.2%) account for the highest median family income in Eagan with $164,708 per family, while 2-person families (8,425 | 46.8%) have the highest median income of $57,318 per family member.
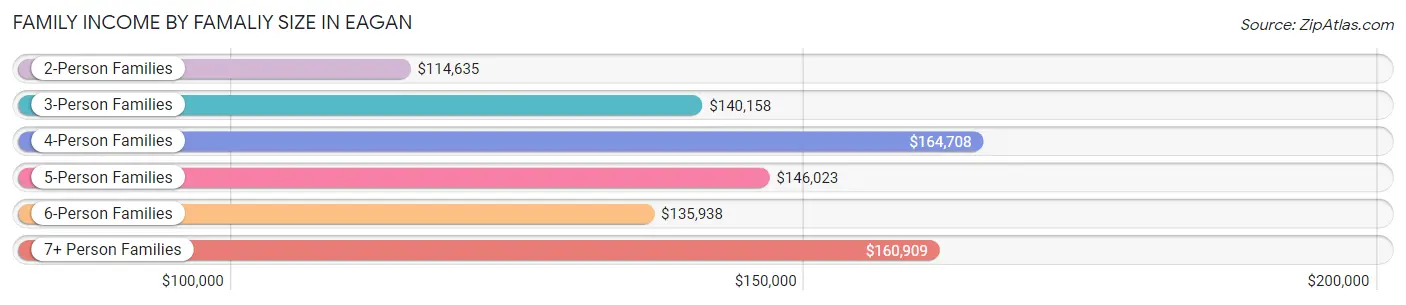
| Income Bracket | # Families | Median Income |
| 2-Person Families | 8,425 (46.8%) | $114,635 |
| 3-Person Families | 4,076 (22.7%) | $140,158 |
| 4-Person Families | 3,631 (20.2%) | $164,708 |
| 5-Person Families | 1,297 (7.2%) | $146,023 |
| 6-Person Families | 345 (1.9%) | $135,938 |
| 7+ Person Families | 214 (1.2%) | $160,909 |
| Total | 17,988 (100.0%) | $133,083 |
Family Income by Number of Earners in Eagan
The median family income in Eagan is $133,083, with families comprising 3+ earners (2,643) having the highest median family income of $199,740, while families with no earners (2,086) have the lowest median family income of $77,718, accounting for 14.7% and 11.6% of families, respectively.
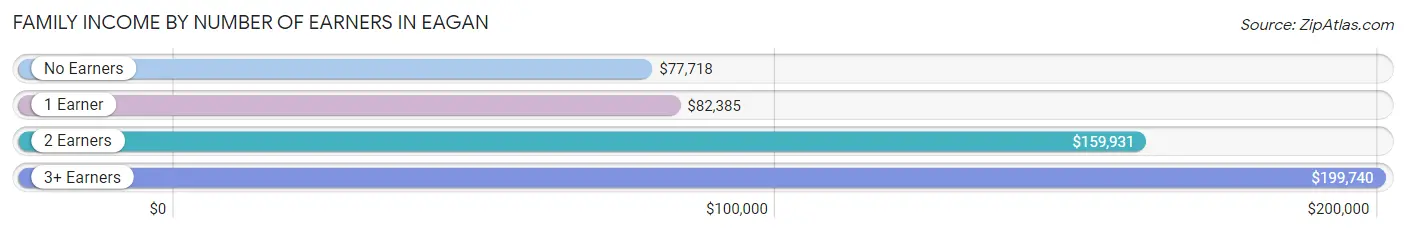
| Number of Earners | # Families | Median Income |
| No Earners | 2,086 (11.6%) | $77,718 |
| 1 Earner | 4,430 (24.6%) | $82,385 |
| 2 Earners | 8,829 (49.1%) | $159,931 |
| 3+ Earners | 2,643 (14.7%) | $199,740 |
| Total | 17,988 (100.0%) | $133,083 |
Household Income in Eagan
Household Income Brackets in Eagan
With 5,526 households falling in the category, the $100,000 to $149,999 income range is the most frequent in Eagan, accounting for 20.0% of all households. In contrast, only 304 households (1.1%) fall into the $10,000 to $14,999 income bracket, making it the least populous group.
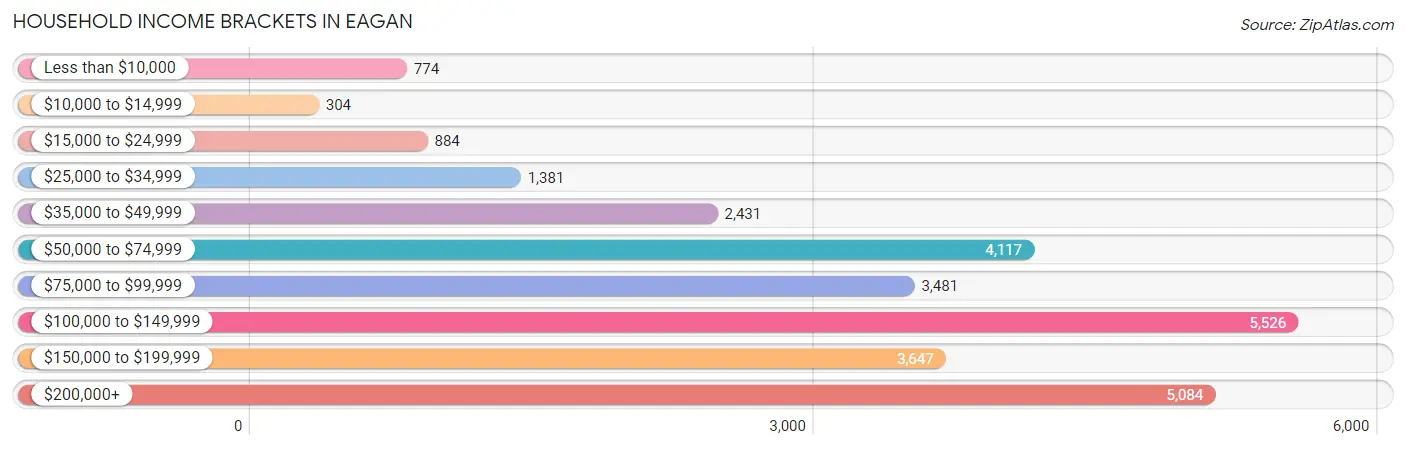
| Income Bracket | # Households | % Households |
| Less than $10,000 | 774 | 2.8% |
| $10,000 to $14,999 | 304 | 1.1% |
| $15,000 to $24,999 | 884 | 3.2% |
| $25,000 to $34,999 | 1,381 | 5.0% |
| $35,000 to $49,999 | 2,431 | 8.8% |
| $50,000 to $74,999 | 4,117 | 14.9% |
| $75,000 to $99,999 | 3,481 | 12.6% |
| $100,000 to $149,999 | 5,526 | 20.0% |
| $150,000 to $199,999 | 3,647 | 13.2% |
| $200,000+ | 5,084 | 18.4% |
Household Income by Householder Age in Eagan
The median household income in Eagan is $104,101, with the highest median household income of $135,503 found in the 45 to 64 years age bracket for the primary householder. A total of 10,757 households (38.9%) fall into this category. Meanwhile, the 65+ years age bracket for the primary householder has the lowest median household income of $65,539, with 6,302 households (22.8%) in this group.
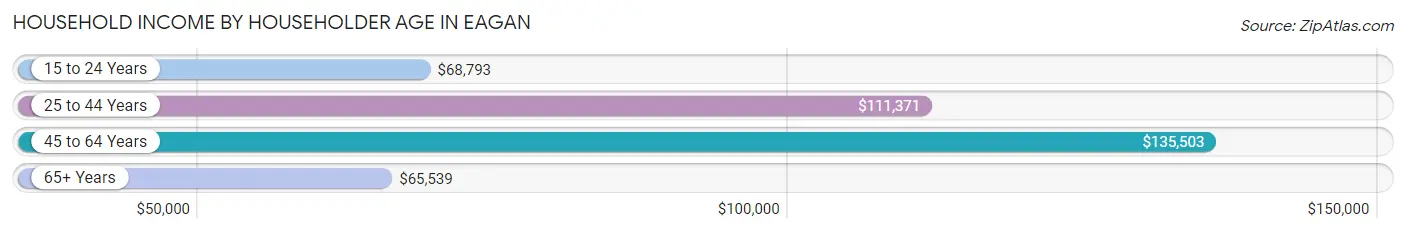
| Income Bracket | # Households | Median Income |
| 15 to 24 Years | 1,340 (4.9%) | $68,793 |
| 25 to 44 Years | 9,229 (33.4%) | $111,371 |
| 45 to 64 Years | 10,757 (38.9%) | $135,503 |
| 65+ Years | 6,302 (22.8%) | $65,539 |
| Total | 27,628 (100.0%) | $104,101 |
Poverty in Eagan
Income Below Poverty by Sex and Age in Eagan
With 5.8% poverty level for males and 5.9% for females among the residents of Eagan, 15 year old males and 16 and 17 year old females are the most vulnerable to poverty, with 96 males (23.9%) and 130 females (11.4%) in their respective age groups living below the poverty level.
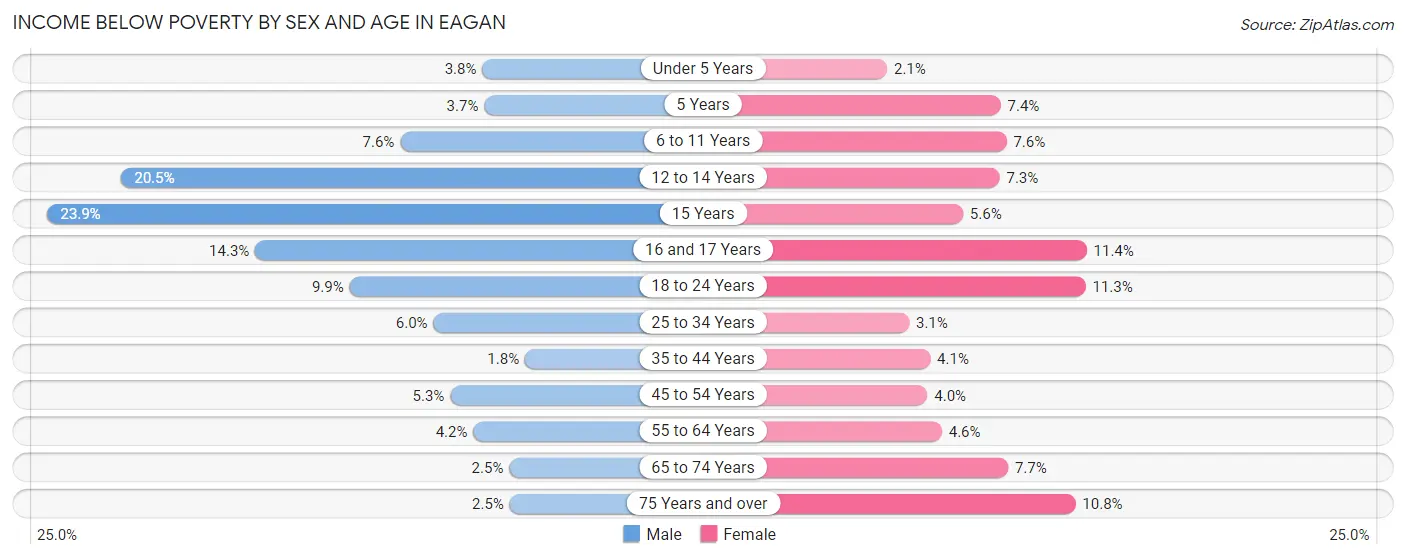
| Age Bracket | Male | Female |
| Under 5 Years | 76 (3.8%) | 40 (2.1%) |
| 5 Years | 22 (3.7%) | 25 (7.4%) |
| 6 to 11 Years | 212 (7.6%) | 180 (7.6%) |
| 12 to 14 Years | 259 (20.5%) | 84 (7.3%) |
| 15 Years | 96 (23.9%) | 27 (5.6%) |
| 16 and 17 Years | 115 (14.3%) | 130 (11.4%) |
| 18 to 24 Years | 255 (9.9%) | 330 (11.3%) |
| 25 to 34 Years | 290 (6.0%) | 140 (3.1%) |
| 35 to 44 Years | 92 (1.8%) | 186 (4.1%) |
| 45 to 54 Years | 213 (5.2%) | 173 (4.0%) |
| 55 to 64 Years | 202 (4.2%) | 232 (4.6%) |
| 65 to 74 Years | 76 (2.5%) | 270 (7.7%) |
| 75 Years and over | 33 (2.5%) | 211 (10.8%) |
| Total | 1,941 (5.8%) | 2,028 (5.9%) |
Income Above Poverty by Sex and Age in Eagan
According to the poverty statistics in Eagan, males aged 35 to 44 years and females aged under 5 years are the age groups that are most secure financially, with 98.2% of males and 97.9% of females in these age groups living above the poverty line.
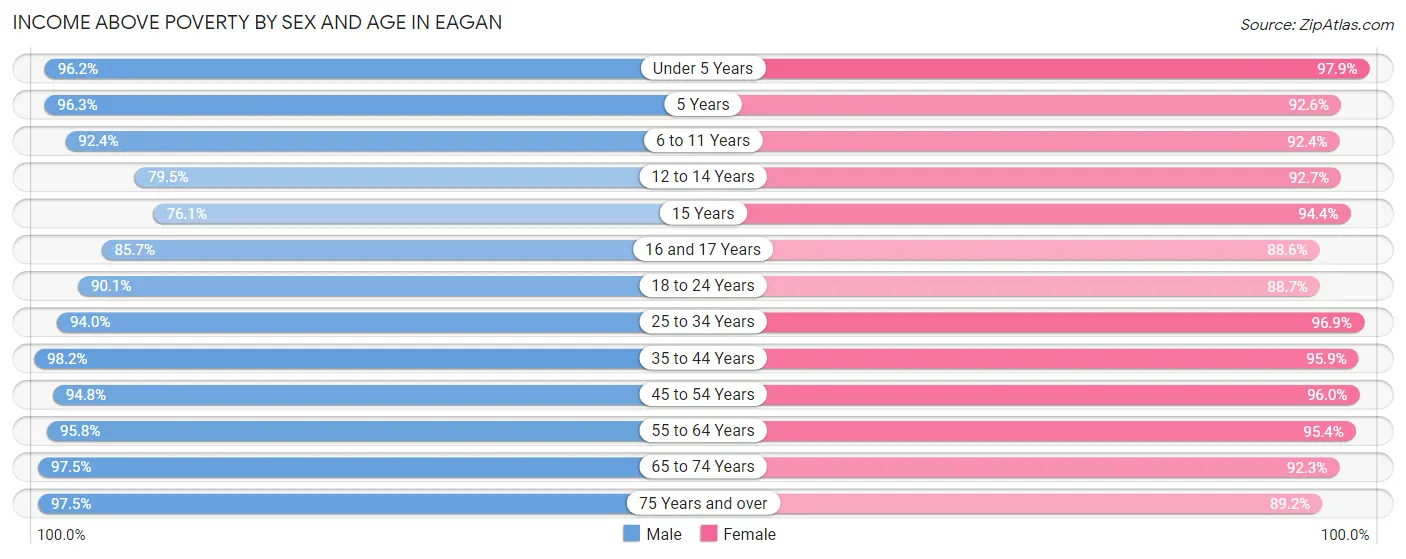
| Age Bracket | Male | Female |
| Under 5 Years | 1,947 (96.2%) | 1,861 (97.9%) |
| 5 Years | 577 (96.3%) | 314 (92.6%) |
| 6 to 11 Years | 2,587 (92.4%) | 2,177 (92.4%) |
| 12 to 14 Years | 1,004 (79.5%) | 1,064 (92.7%) |
| 15 Years | 305 (76.1%) | 453 (94.4%) |
| 16 and 17 Years | 689 (85.7%) | 1,014 (88.6%) |
| 18 to 24 Years | 2,316 (90.1%) | 2,587 (88.7%) |
| 25 to 34 Years | 4,516 (94.0%) | 4,353 (96.9%) |
| 35 to 44 Years | 5,073 (98.2%) | 4,356 (95.9%) |
| 45 to 54 Years | 3,844 (94.8%) | 4,188 (96.0%) |
| 55 to 64 Years | 4,635 (95.8%) | 4,770 (95.4%) |
| 65 to 74 Years | 2,948 (97.5%) | 3,230 (92.3%) |
| 75 Years and over | 1,292 (97.5%) | 1,736 (89.2%) |
| Total | 31,733 (94.2%) | 32,103 (94.1%) |
Income Below Poverty Among Married-Couple Families in Eagan
The poverty statistics for married-couple families in Eagan show that 1.8% or 259 of the total 14,647 families live below the poverty line. Families with 5 or more children have the highest poverty rate of 15.7%, comprising of 17 families. On the other hand, families with 1 or 2 children have the lowest poverty rate of 1.1%, which includes 52 families.
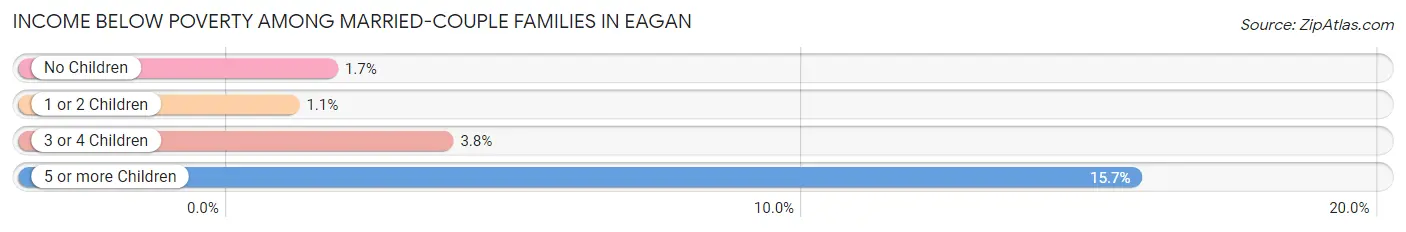
| Children | Above Poverty | Below Poverty |
| No Children | 8,478 (98.3%) | 150 (1.7%) |
| 1 or 2 Children | 4,791 (98.9%) | 52 (1.1%) |
| 3 or 4 Children | 1,028 (96.3%) | 40 (3.7%) |
| 5 or more Children | 91 (84.3%) | 17 (15.7%) |
| Total | 14,388 (98.2%) | 259 (1.8%) |
Income Below Poverty Among Single-Parent Households in Eagan
According to the poverty data in Eagan, 8.4% or 86 single-father households and 9.5% or 220 single-mother households are living below the poverty line. Among single-father households, those with 3 or 4 children have the highest poverty rate, with 76 households (53.5%) experiencing poverty. Likewise, among single-mother households, those with 5 or more children have the highest poverty rate, with 46 households (100.0%) falling below the poverty line.
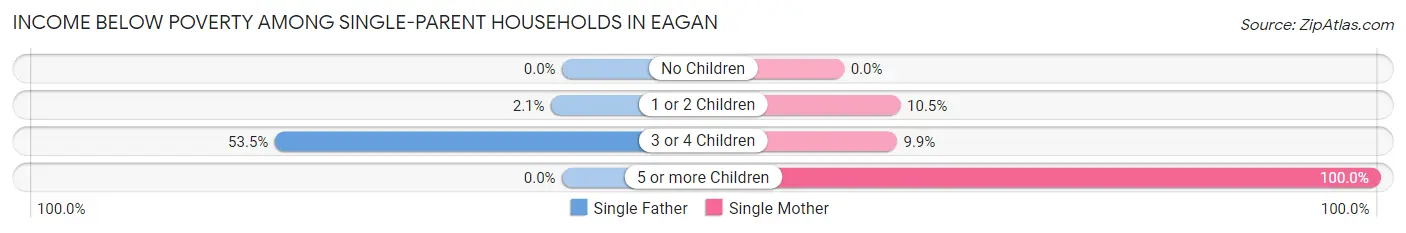
| Children | Single Father | Single Mother |
| No Children | 0 (0.0%) | 0 (0.0%) |
| 1 or 2 Children | 10 (2.1%) | 147 (10.5%) |
| 3 or 4 Children | 76 (53.5%) | 27 (9.9%) |
| 5 or more Children | 0 (0.0%) | 46 (100.0%) |
| Total | 86 (8.4%) | 220 (9.5%) |
Income Below Poverty Among Married-Couple vs Single-Parent Households in Eagan
The poverty data for Eagan shows that 259 of the married-couple family households (1.8%) and 306 of the single-parent households (9.2%) are living below the poverty level. Within the married-couple family households, those with 5 or more children have the highest poverty rate, with 17 households (15.7%) falling below the poverty line. Among the single-parent households, those with 5 or more children have the highest poverty rate, with 46 household (100.0%) living below poverty.
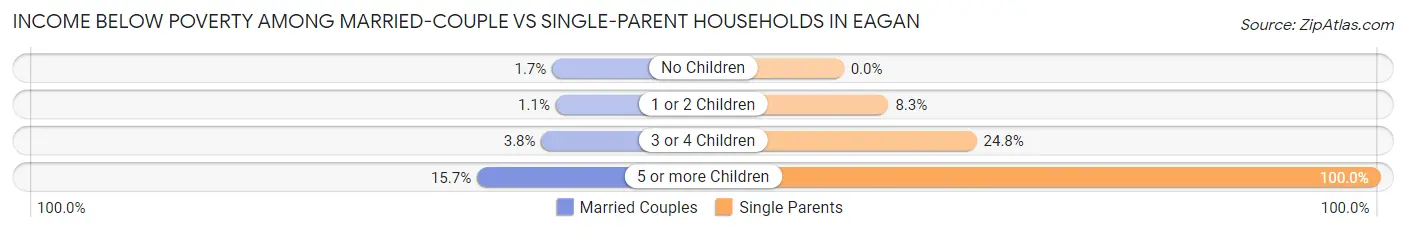
| Children | Married-Couple Families | Single-Parent Households |
| No Children | 150 (1.7%) | 0 (0.0%) |
| 1 or 2 Children | 52 (1.1%) | 157 (8.3%) |
| 3 or 4 Children | 40 (3.7%) | 103 (24.8%) |
| 5 or more Children | 17 (15.7%) | 46 (100.0%) |
| Total | 259 (1.8%) | 306 (9.2%) |
Race in Eagan
The most populous races in Eagan are White / Caucasian (50,749 | 74.3%), Black / African American (7,089 | 10.4%), and Asian (6,056 | 8.9%).
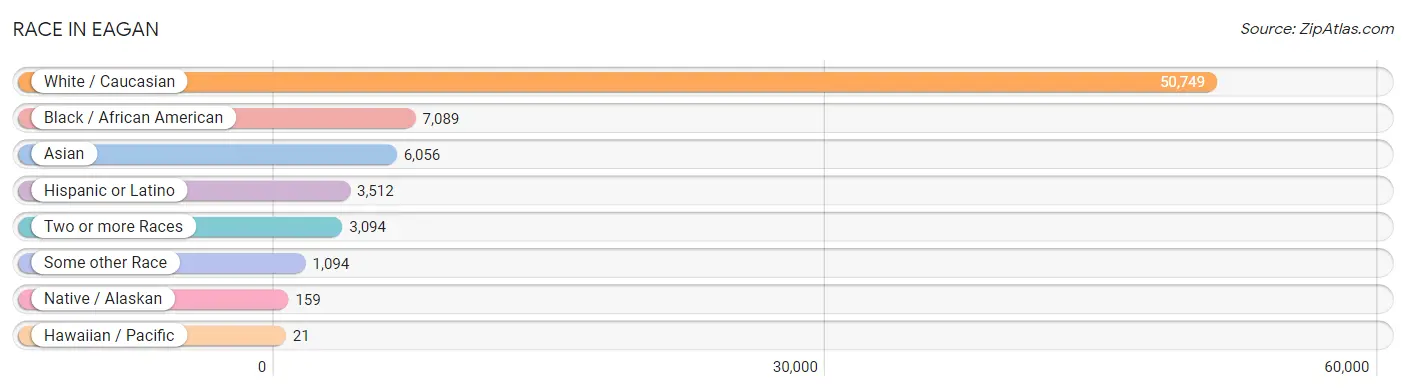
| Race | # Population | % Population |
| Asian | 6,056 | 8.9% |
| Black / African American | 7,089 | 10.4% |
| Hawaiian / Pacific | 21 | 0.0% |
| Hispanic or Latino | 3,512 | 5.1% |
| Native / Alaskan | 159 | 0.2% |
| White / Caucasian | 50,749 | 74.3% |
| Two or more Races | 3,094 | 4.5% |
| Some other Race | 1,094 | 1.6% |
| Total | 68,262 | 100.0% |
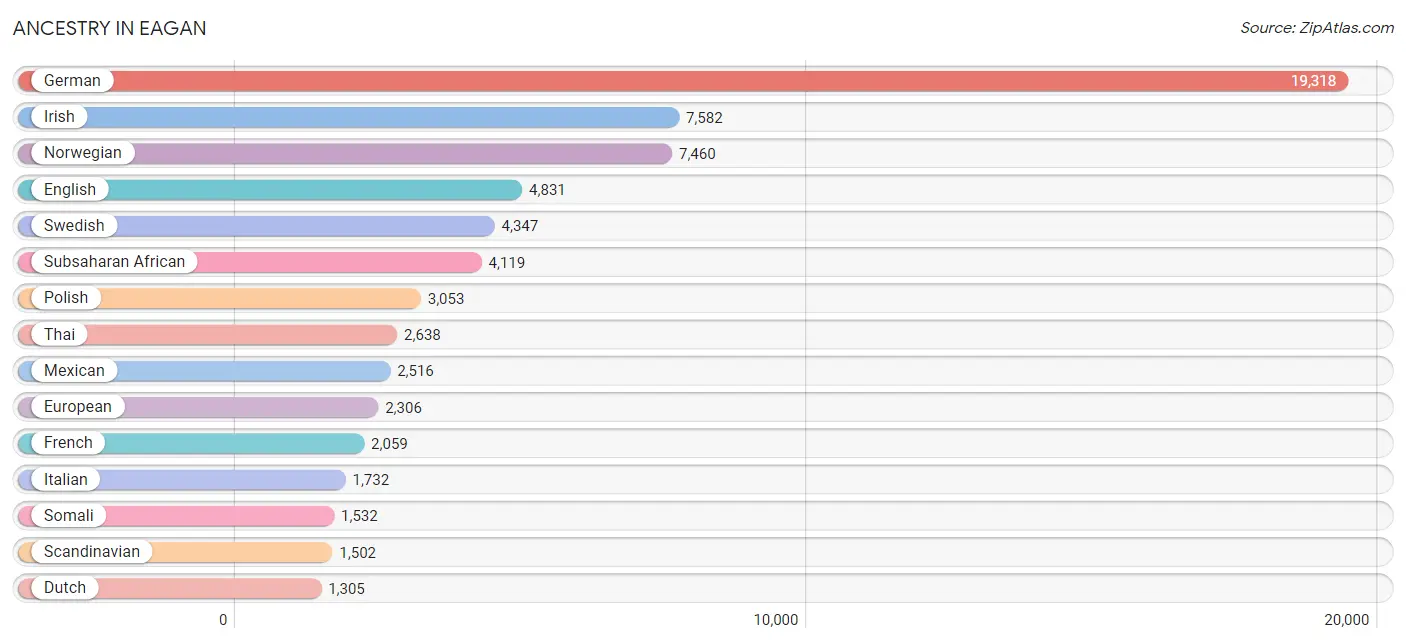
Ancestry in Eagan
The most populous ancestries reported in Eagan are German (19,318 | 28.3%), Irish (7,582 | 11.1%), Norwegian (7,460 | 10.9%), English (4,831 | 7.1%), and Swedish (4,347 | 6.4%), together accounting for 63.8% of all Eagan residents.
| Ancestry | # Population | % Population |
| African | 570 | 0.8% |
| American | 1,151 | 1.7% |
| Apache | 3 | 0.0% |
| Arab | 463 | 0.7% |
| Australian | 47 | 0.1% |
| Austrian | 125 | 0.2% |
| Bangladeshi | 330 | 0.5% |
| Belgian | 92 | 0.1% |
| Bhutanese | 257 | 0.4% |
| Brazilian | 17 | 0.0% |
| British | 456 | 0.7% |
| Burmese | 616 | 0.9% |
| Canadian | 143 | 0.2% |
| Carpatho Rusyn | 6 | 0.0% |
| Celtic | 9 | 0.0% |
| Central American | 179 | 0.3% |
| Central American Indian | 28 | 0.0% |
| Cherokee | 101 | 0.2% |
| Chilean | 35 | 0.1% |
| Chippewa | 244 | 0.4% |
| Colombian | 71 | 0.1% |
| Croatian | 79 | 0.1% |
| Cuban | 86 | 0.1% |
| Czech | 1,128 | 1.7% |
| Czechoslovakian | 131 | 0.2% |
| Danish | 750 | 1.1% |
| Dominican | 10 | 0.0% |
| Dutch | 1,305 | 1.9% |
| Eastern European | 144 | 0.2% |
| Ecuadorian | 37 | 0.1% |
| Egyptian | 13 | 0.0% |
| English | 4,831 | 7.1% |
| Ethiopian | 1,263 | 1.8% |
| European | 2,306 | 3.4% |
| Filipino | 82 | 0.1% |
| Finnish | 590 | 0.9% |
| French | 2,059 | 3.0% |
| French Canadian | 615 | 0.9% |
| German | 19,318 | 28.3% |
| Ghanaian | 51 | 0.1% |
| Greek | 292 | 0.4% |
| Guamanian / Chamorro | 31 | 0.1% |
| Guatemalan | 55 | 0.1% |
| Guyanese | 177 | 0.3% |
| Haitian | 118 | 0.2% |
| Honduran | 38 | 0.1% |
| Hungarian | 208 | 0.3% |
| Icelander | 117 | 0.2% |
| Indian (Asian) | 470 | 0.7% |
| Iranian | 33 | 0.1% |
| Irish | 7,582 | 11.1% |
| Iroquois | 63 | 0.1% |
| Italian | 1,732 | 2.5% |
| Jamaican | 33 | 0.1% |
| Japanese | 607 | 0.9% |
| Jordanian | 19 | 0.0% |
| Kenyan | 21 | 0.0% |
| Korean | 452 | 0.7% |
| Laotian | 17 | 0.0% |
| Latvian | 76 | 0.1% |
| Lebanese | 202 | 0.3% |
| Liberian | 79 | 0.1% |
| Lithuanian | 60 | 0.1% |
| Luxembourger | 70 | 0.1% |
| Malaysian | 159 | 0.2% |
| Mexican | 2,516 | 3.7% |
| Mexican American Indian | 106 | 0.2% |
| Mongolian | 17 | 0.0% |
| Native Hawaiian | 7 | 0.0% |
| Nicaraguan | 16 | 0.0% |
| Nigerian | 329 | 0.5% |
| Northern European | 149 | 0.2% |
| Norwegian | 7,460 | 10.9% |
| Pakistani | 118 | 0.2% |
| Panamanian | 37 | 0.1% |
| Pennsylvania German | 10 | 0.0% |
| Peruvian | 47 | 0.1% |
| Polish | 3,053 | 4.5% |
| Portuguese | 48 | 0.1% |
| Puerto Rican | 179 | 0.3% |
| Romanian | 66 | 0.1% |
| Russian | 634 | 0.9% |
| Salvadoran | 33 | 0.1% |
| Samoan | 48 | 0.1% |
| Scandinavian | 1,502 | 2.2% |
| Scotch-Irish | 479 | 0.7% |
| Scottish | 588 | 0.9% |
| Serbian | 5 | 0.0% |
| Sioux | 21 | 0.0% |
| Slavic | 43 | 0.1% |
| Slovak | 104 | 0.2% |
| Slovene | 38 | 0.1% |
| Somali | 1,532 | 2.2% |
| South American | 279 | 0.4% |
| South American Indian | 6 | 0.0% |
| Spaniard | 25 | 0.0% |
| Spanish | 97 | 0.1% |
| Sri Lankan | 842 | 1.2% |
| Subsaharan African | 4,119 | 6.0% |
| Swedish | 4,347 | 6.4% |
| Swiss | 214 | 0.3% |
| Syrian | 7 | 0.0% |
| Thai | 2,638 | 3.9% |
| Turkish | 8 | 0.0% |
| Ugandan | 20 | 0.0% |
| Ukrainian | 358 | 0.5% |
| Venezuelan | 89 | 0.1% |
| Welsh | 332 | 0.5% | View All 108 Rows |
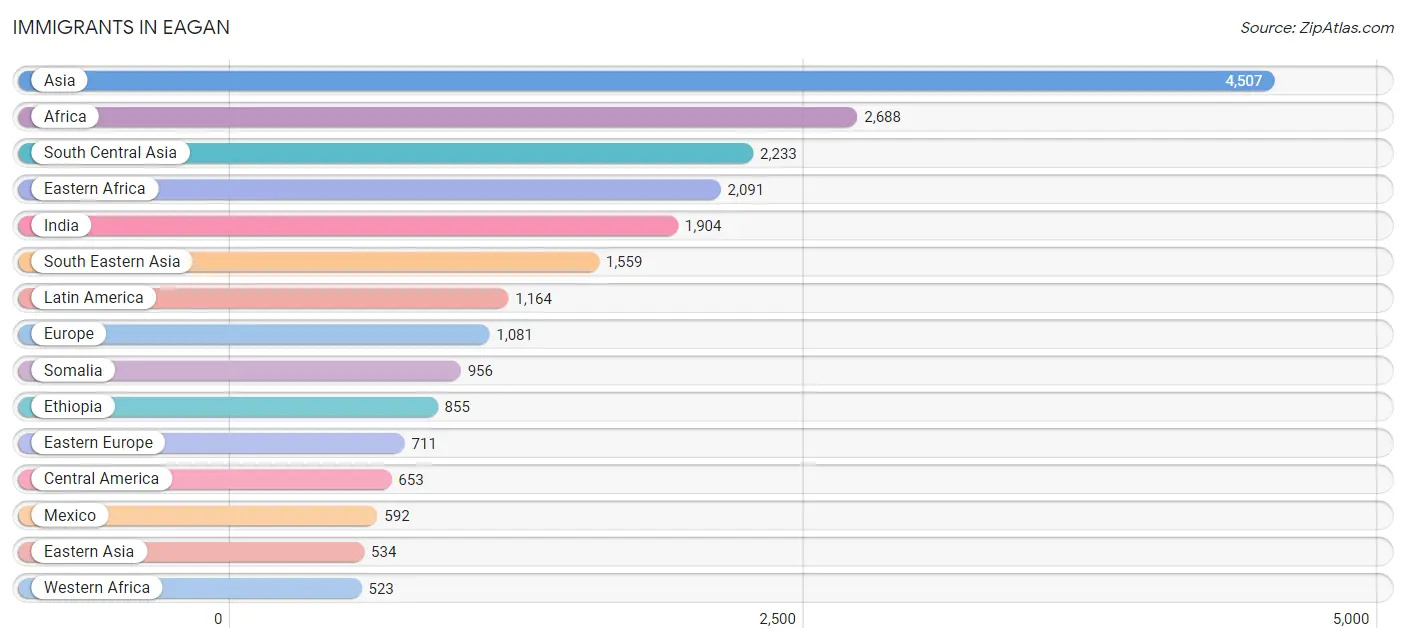
Immigrants in Eagan
The most numerous immigrant groups reported in Eagan came from Asia (4,507 | 6.6%), Africa (2,688 | 3.9%), South Central Asia (2,233 | 3.3%), Eastern Africa (2,091 | 3.1%), and India (1,904 | 2.8%), together accounting for 19.7% of all Eagan residents.
| Immigration Origin | # Population | % Population |
| Africa | 2,688 | 3.9% |
| Asia | 4,507 | 6.6% |
| Australia | 11 | 0.0% |
| Austria | 9 | 0.0% |
| Belarus | 22 | 0.0% |
| Belgium | 6 | 0.0% |
| Brazil | 55 | 0.1% |
| Cambodia | 226 | 0.3% |
| Cameroon | 31 | 0.1% |
| Canada | 144 | 0.2% |
| Caribbean | 154 | 0.2% |
| Central America | 653 | 1.0% |
| China | 313 | 0.5% |
| Colombia | 80 | 0.1% |
| Cuba | 73 | 0.1% |
| Czechoslovakia | 10 | 0.0% |
| Denmark | 14 | 0.0% |
| Dominican Republic | 10 | 0.0% |
| Eastern Africa | 2,091 | 3.1% |
| Eastern Asia | 534 | 0.8% |
| Eastern Europe | 711 | 1.0% |
| Ecuador | 37 | 0.1% |
| Egypt | 6 | 0.0% |
| El Salvador | 12 | 0.0% |
| England | 41 | 0.1% |
| Eritrea | 127 | 0.2% |
| Ethiopia | 855 | 1.3% |
| Europe | 1,081 | 1.6% |
| France | 21 | 0.0% |
| Germany | 130 | 0.2% |
| Ghana | 129 | 0.2% |
| Greece | 40 | 0.1% |
| Guatemala | 15 | 0.0% |
| Guyana | 20 | 0.0% |
| Haiti | 63 | 0.1% |
| Honduras | 34 | 0.1% |
| Hong Kong | 27 | 0.0% |
| India | 1,904 | 2.8% |
| Indonesia | 17 | 0.0% |
| Iran | 33 | 0.1% |
| Israel | 5 | 0.0% |
| Italy | 26 | 0.0% |
| Jamaica | 8 | 0.0% |
| Japan | 26 | 0.0% |
| Jordan | 19 | 0.0% |
| Kazakhstan | 124 | 0.2% |
| Kenya | 119 | 0.2% |
| Korea | 195 | 0.3% |
| Kuwait | 57 | 0.1% |
| Laos | 165 | 0.2% |
| Latin America | 1,164 | 1.7% |
| Latvia | 43 | 0.1% |
| Lebanon | 20 | 0.0% |
| Liberia | 33 | 0.1% |
| Mexico | 592 | 0.9% |
| Middle Africa | 42 | 0.1% |
| Moldova | 4 | 0.0% |
| Nepal | 97 | 0.1% |
| Netherlands | 12 | 0.0% |
| Nigeria | 152 | 0.2% |
| Northern Africa | 22 | 0.0% |
| Northern Europe | 126 | 0.2% |
| Norway | 18 | 0.0% |
| Oceania | 11 | 0.0% |
| Pakistan | 75 | 0.1% |
| Peru | 45 | 0.1% |
| Philippines | 245 | 0.4% |
| Poland | 105 | 0.2% |
| Romania | 2 | 0.0% |
| Russia | 119 | 0.2% |
| Saudi Arabia | 63 | 0.1% |
| Scotland | 45 | 0.1% |
| Singapore | 17 | 0.0% |
| Somalia | 956 | 1.4% |
| South Africa | 10 | 0.0% |
| South America | 357 | 0.5% |
| South Central Asia | 2,233 | 3.3% |
| South Eastern Asia | 1,559 | 2.3% |
| Southern Europe | 66 | 0.1% |
| Taiwan | 64 | 0.1% |
| Thailand | 93 | 0.1% |
| Uganda | 20 | 0.0% |
| Ukraine | 371 | 0.5% |
| Venezuela | 120 | 0.2% |
| Vietnam | 443 | 0.6% |
| Western Africa | 523 | 0.8% |
| Western Asia | 181 | 0.3% |
| Western Europe | 178 | 0.3% |
| Zaire | 11 | 0.0% | View All 89 Rows |
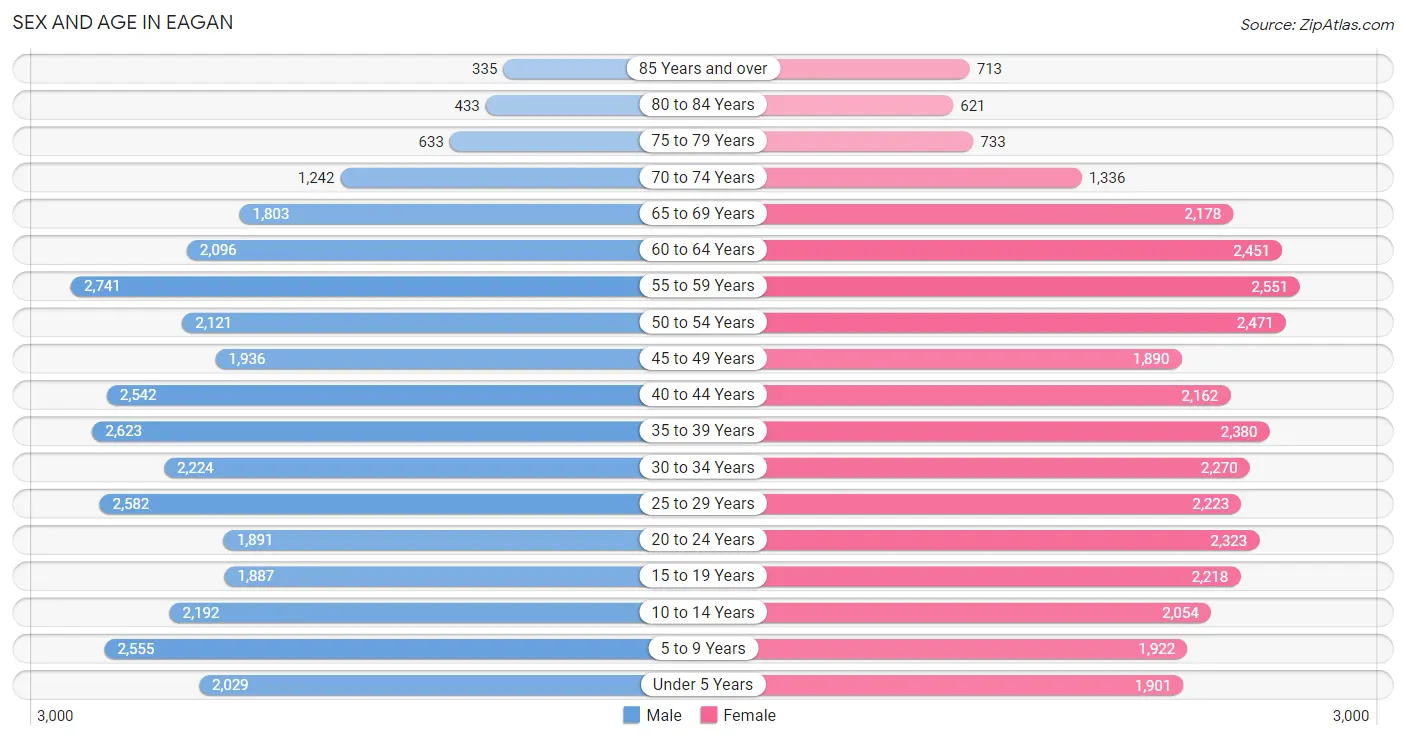
Sex and Age in Eagan
Sex and Age in Eagan
The most populous age groups in Eagan are 55 to 59 Years (2,741 | 8.1%) for men and 55 to 59 Years (2,551 | 7.4%) for women.
| Age Bracket | Male | Female |
| Under 5 Years | 2,029 (6.0%) | 1,901 (5.5%) |
| 5 to 9 Years | 2,555 (7.5%) | 1,922 (5.6%) |
| 10 to 14 Years | 2,192 (6.5%) | 2,054 (6.0%) |
| 15 to 19 Years | 1,887 (5.6%) | 2,218 (6.5%) |
| 20 to 24 Years | 1,891 (5.6%) | 2,323 (6.8%) |
| 25 to 29 Years | 2,582 (7.6%) | 2,223 (6.5%) |
| 30 to 34 Years | 2,224 (6.6%) | 2,270 (6.6%) |
| 35 to 39 Years | 2,623 (7.7%) | 2,380 (6.9%) |
| 40 to 44 Years | 2,542 (7.5%) | 2,162 (6.3%) |
| 45 to 49 Years | 1,936 (5.7%) | 1,890 (5.5%) |
| 50 to 54 Years | 2,121 (6.3%) | 2,471 (7.2%) |
| 55 to 59 Years | 2,741 (8.1%) | 2,551 (7.4%) |
| 60 to 64 Years | 2,096 (6.2%) | 2,451 (7.1%) |
| 65 to 69 Years | 1,803 (5.3%) | 2,178 (6.3%) |
| 70 to 74 Years | 1,242 (3.7%) | 1,336 (3.9%) |
| 75 to 79 Years | 633 (1.9%) | 733 (2.1%) |
| 80 to 84 Years | 433 (1.3%) | 621 (1.8%) |
| 85 Years and over | 335 (1.0%) | 713 (2.1%) |
| Total | 33,865 (100.0%) | 34,397 (100.0%) |
Families and Households in Eagan
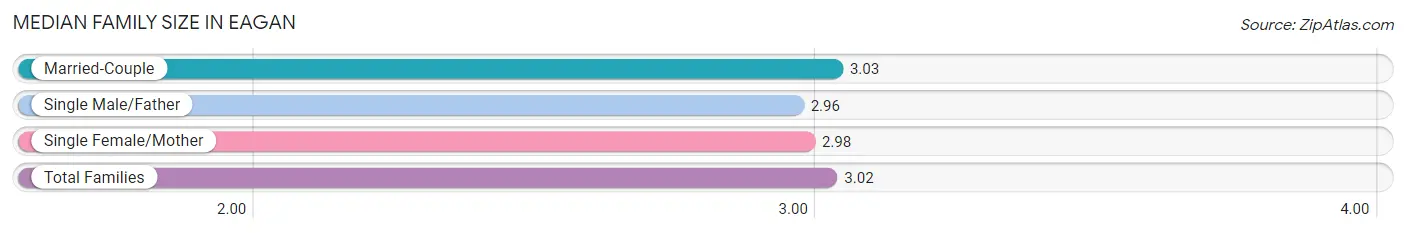
Median Family Size in Eagan
The median family size in Eagan is 3.02 persons per family, with married-couple families (14,647 | 81.4%) accounting for the largest median family size of 3.03 persons per family. On the other hand, single male/father families (1,026 | 5.7%) represent the smallest median family size with 2.96 persons per family.
| Family Type | # Families | Family Size |
| Married-Couple | 14,647 (81.4%) | 3.03 |
| Single Male/Father | 1,026 (5.7%) | 2.96 |
| Single Female/Mother | 2,315 (12.9%) | 2.98 |
| Total Families | 17,988 (100.0%) | 3.02 |
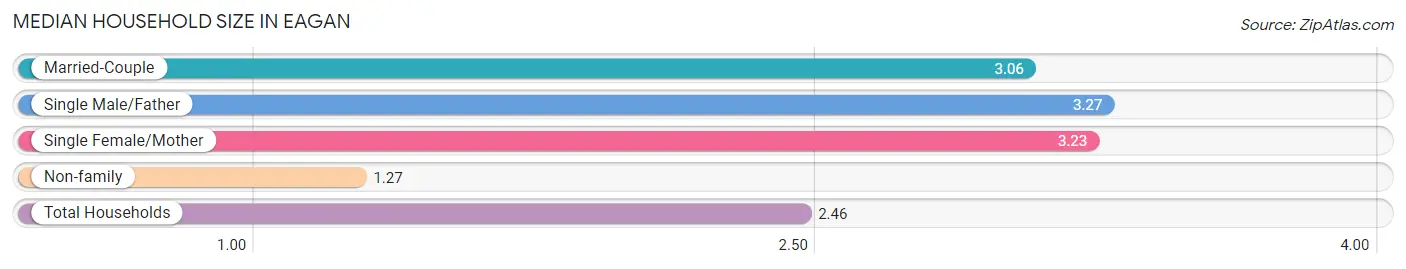
Median Household Size in Eagan
The median household size in Eagan is 2.46 persons per household, with single male/father households (1,026 | 3.7%) accounting for the largest median household size of 3.27 persons per household. non-family households (9,640 | 34.9%) represent the smallest median household size with 1.27 persons per household.
| Household Type | # Households | Household Size |
| Married-Couple | 14,647 (53.0%) | 3.06 |
| Single Male/Father | 1,026 (3.7%) | 3.27 |
| Single Female/Mother | 2,315 (8.4%) | 3.23 |
| Non-family | 9,640 (34.9%) | 1.27 |
| Total Households | 27,628 (100.0%) | 2.46 |
Household Size by Marriage Status in Eagan
Out of a total of 27,628 households in Eagan, 17,988 (65.1%) are family households, while 9,640 (34.9%) are nonfamily households. The most numerous type of family households are 2-person households, comprising 8,065, and the most common type of nonfamily households are 1-person households, comprising 7,349.
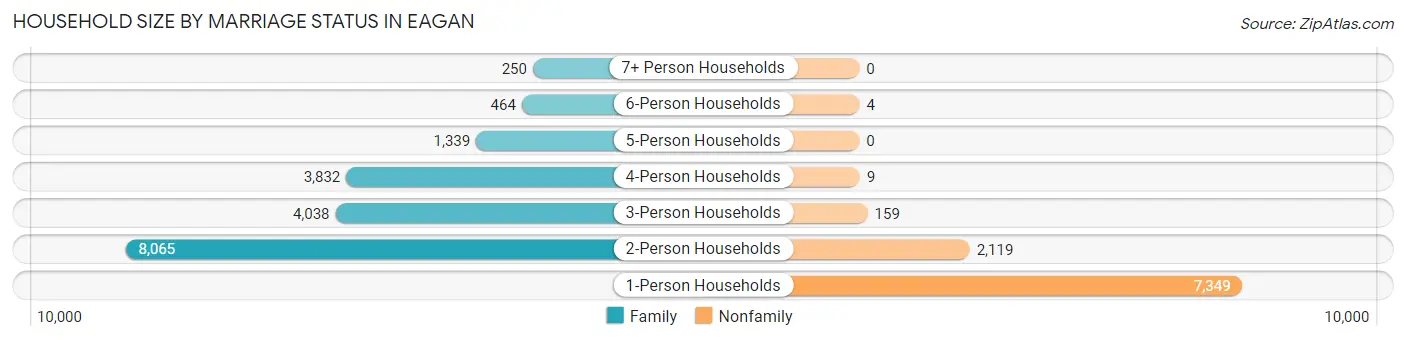
| Household Size | Family Households | Nonfamily Households |
| 1-Person Households | - | 7,349 (26.6%) |
| 2-Person Households | 8,065 (29.2%) | 2,119 (7.7%) |
| 3-Person Households | 4,038 (14.6%) | 159 (0.6%) |
| 4-Person Households | 3,832 (13.9%) | 9 (0.0%) |
| 5-Person Households | 1,339 (4.9%) | 0 (0.0%) |
| 6-Person Households | 464 (1.7%) | 4 (0.0%) |
| 7+ Person Households | 250 (0.9%) | 0 (0.0%) |
| Total | 17,988 (65.1%) | 9,640 (34.9%) |
Female Fertility in Eagan
Fertility by Age in Eagan
Average fertility rate in Eagan is 62.0 births per 1,000 women. Women in the age bracket of 20 to 34 years have the highest fertility rate with 117.0 births per 1,000 women. Women in the age bracket of 20 to 34 years acount for 80.8% of all women with births.
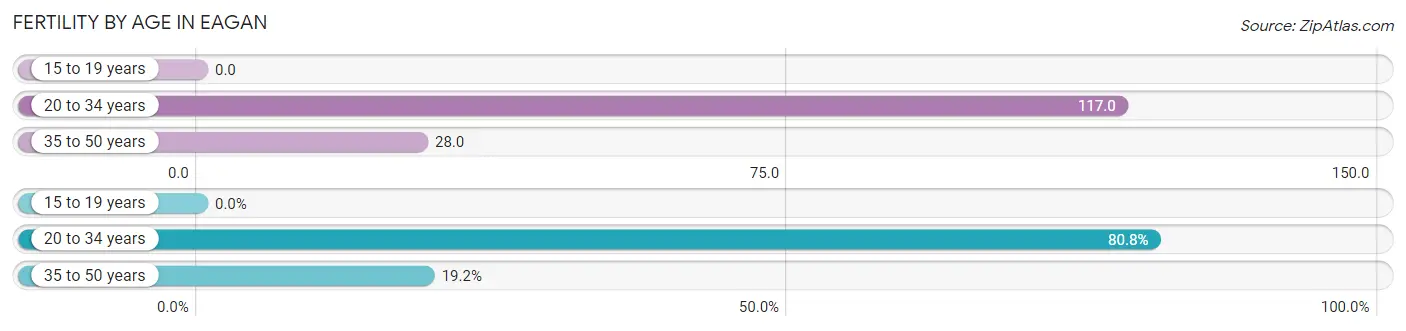
| Age Bracket | Women with Births | Births / 1,000 Women |
| 15 to 19 years | 0 (0.0%) | 0.0 |
| 20 to 34 years | 798 (80.8%) | 117.0 |
| 35 to 50 years | 190 (19.2%) | 28.0 |
| Total | 988 (100.0%) | 62.0 |
Fertility by Age by Marriage Status in Eagan
90.6% of women with births (988) in Eagan are married. The highest percentage of unmarried women with births falls into 20 to 34 years age bracket with 9.8% of them unmarried at the time of birth, while the lowest percentage of unmarried women with births belong to 35 to 50 years age bracket with 7.9% of them unmarried.
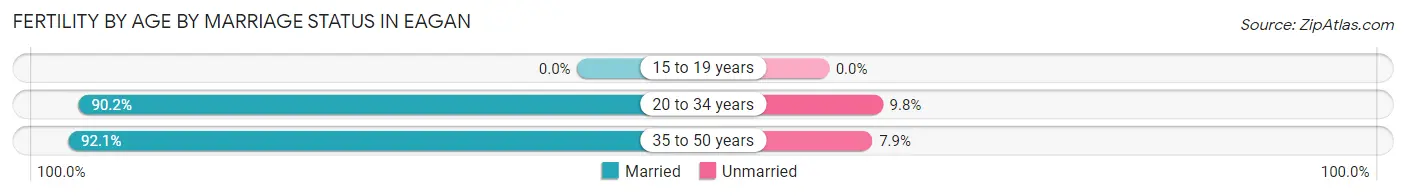
| Age Bracket | Married | Unmarried |
| 15 to 19 years | 0 (0.0%) | 0 (0.0%) |
| 20 to 34 years | 720 (90.2%) | 78 (9.8%) |
| 35 to 50 years | 175 (92.1%) | 15 (7.9%) |
| Total | 895 (90.6%) | 93 (9.4%) |
Fertility by Education in Eagan
Average fertility rate in Eagan is 62.0 births per 1,000 women. Women with the education attainment of high school diploma have the highest fertility rate of 93.0 births per 1,000 women, while women with the education attainment of less than high school have the lowest fertility at 34.0 births per 1,000 women. Women with the education attainment of bachelor's degree represent 31.6% of all women with births.
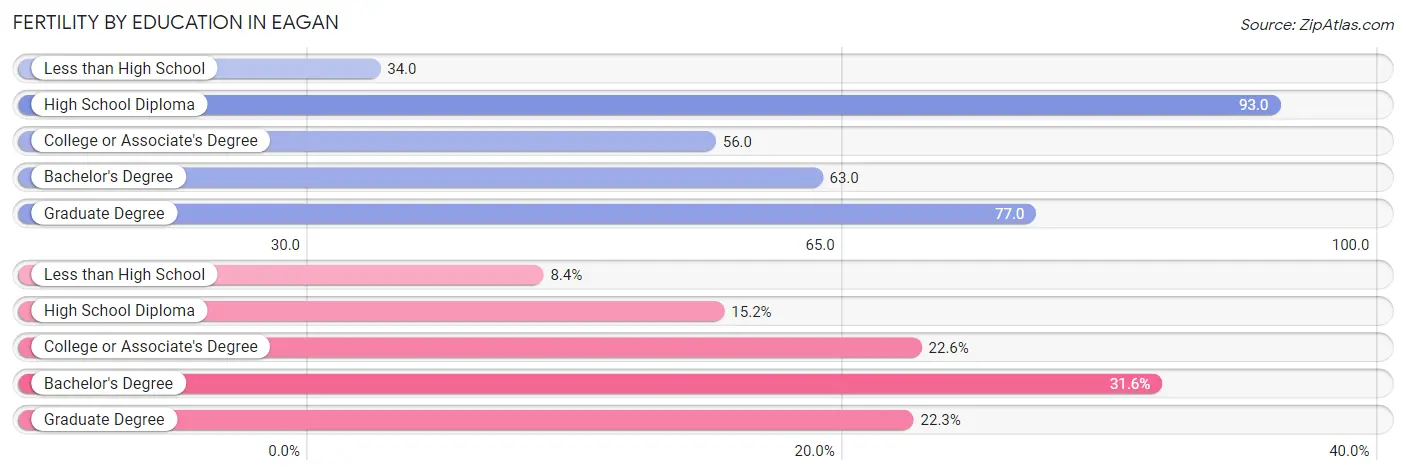
| Educational Attainment | Women with Births | Births / 1,000 Women |
| Less than High School | 83 (8.4%) | 34.0 |
| High School Diploma | 150 (15.2%) | 93.0 |
| College or Associate's Degree | 223 (22.6%) | 56.0 |
| Bachelor's Degree | 312 (31.6%) | 63.0 |
| Graduate Degree | 220 (22.3%) | 77.0 |
| Total | 988 (100.0%) | 62.0 |
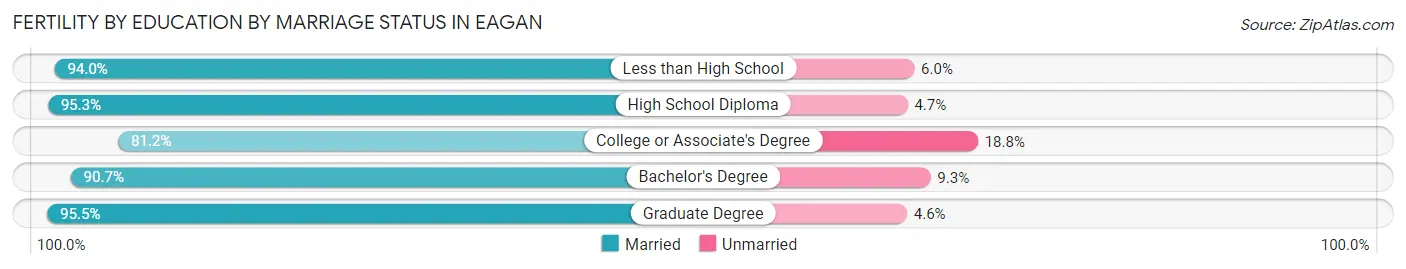
Fertility by Education by Marriage Status in Eagan
9.4% of women with births in Eagan are unmarried. Women with the educational attainment of graduate degree are most likely to be married with 95.5% of them married at childbirth, while women with the educational attainment of college or associate's degree are least likely to be married with 18.8% of them unmarried at childbirth.
| Educational Attainment | Married | Unmarried |
| Less than High School | 78 (94.0%) | 5 (6.0%) |
| High School Diploma | 143 (95.3%) | 7 (4.7%) |
| College or Associate's Degree | 181 (81.2%) | 42 (18.8%) |
| Bachelor's Degree | 283 (90.7%) | 29 (9.3%) |
| Graduate Degree | 210 (95.5%) | 10 (4.5%) |
| Total | 895 (90.6%) | 93 (9.4%) |
Employment Characteristics in Eagan
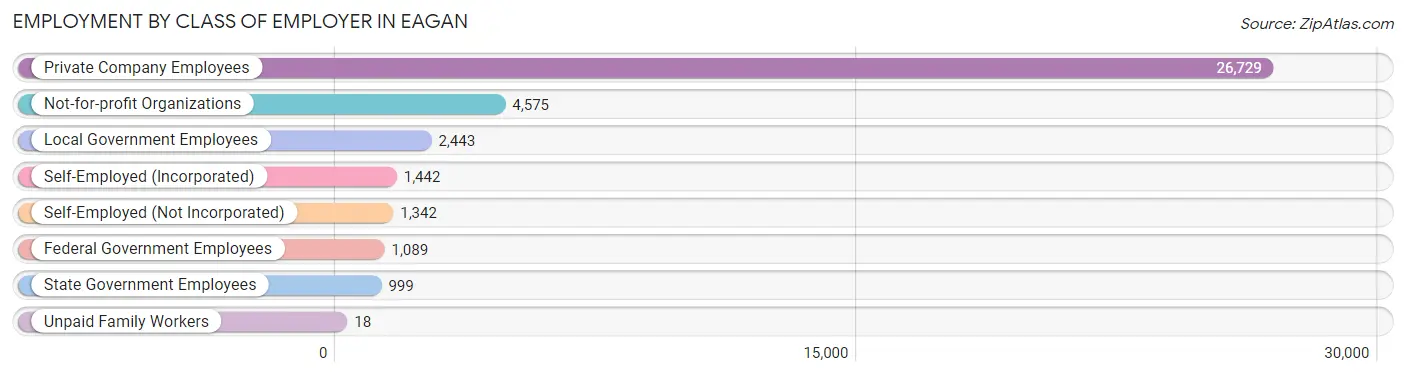
Employment by Class of Employer in Eagan
Among the 38,637 employed individuals in Eagan, private company employees (26,729 | 69.2%), not-for-profit organizations (4,575 | 11.8%), and local government employees (2,443 | 6.3%) make up the most common classes of employment.
| Employer Class | # Employees | % Employees |
| Private Company Employees | 26,729 | 69.2% |
| Self-Employed (Incorporated) | 1,442 | 3.7% |
| Self-Employed (Not Incorporated) | 1,342 | 3.5% |
| Not-for-profit Organizations | 4,575 | 11.8% |
| Local Government Employees | 2,443 | 6.3% |
| State Government Employees | 999 | 2.6% |
| Federal Government Employees | 1,089 | 2.8% |
| Unpaid Family Workers | 18 | 0.1% |
| Total | 38,637 | 100.0% |
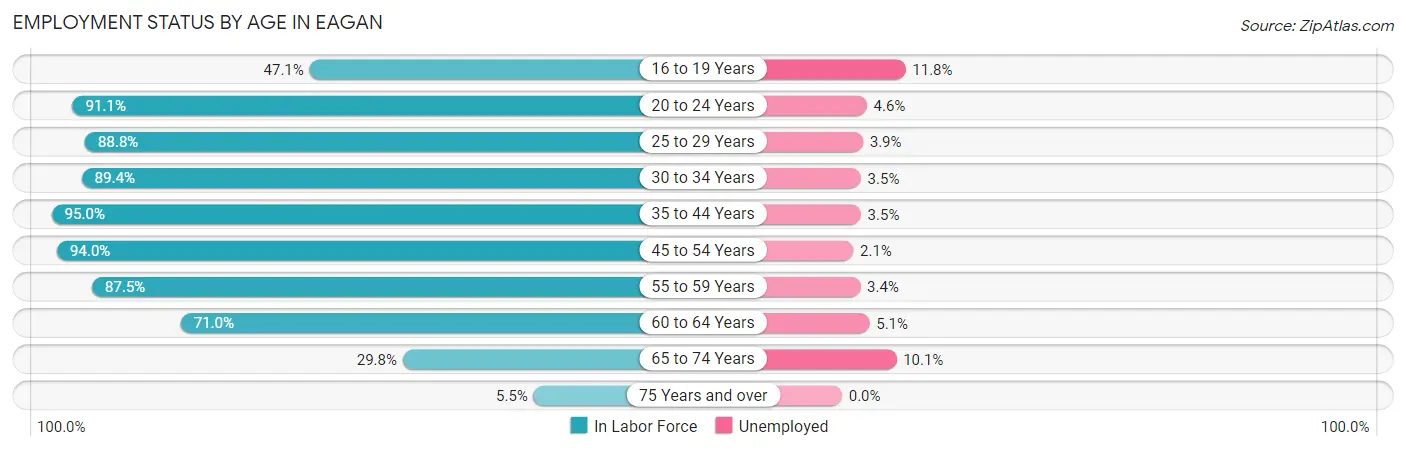
Employment Status by Age in Eagan
According to the labor force statistics for Eagan, out of the total population over 16 years of age (54,728), 74.5% or 40,772 individuals are in the labor force, with 4.1% or 1,672 of them unemployed. The age group with the highest labor force participation rate is 35 to 44 years, with 95.0% or 9,222 individuals in the labor force. Within the labor force, the 16 to 19 years age range has the highest percentage of unemployed individuals, with 11.8% or 179 of them being unemployed.
| Age Bracket | In Labor Force | Unemployed |
| 16 to 19 Years | 1,519 (47.1%) | 179 (11.8%) |
| 20 to 24 Years | 3,839 (91.1%) | 177 (4.6%) |
| 25 to 29 Years | 4,267 (88.8%) | 166 (3.9%) |
| 30 to 34 Years | 4,018 (89.4%) | 141 (3.5%) |
| 35 to 44 Years | 9,222 (95.0%) | 323 (3.5%) |
| 45 to 54 Years | 7,913 (94.0%) | 166 (2.1%) |
| 55 to 59 Years | 4,630 (87.5%) | 157 (3.4%) |
| 60 to 64 Years | 3,228 (71.0%) | 165 (5.1%) |
| 65 to 74 Years | 1,955 (29.8%) | 197 (10.1%) |
| 75 Years and over | 191 (5.5%) | 0 (0.0%) |
| Total | 40,772 (74.5%) | 1,672 (4.1%) |
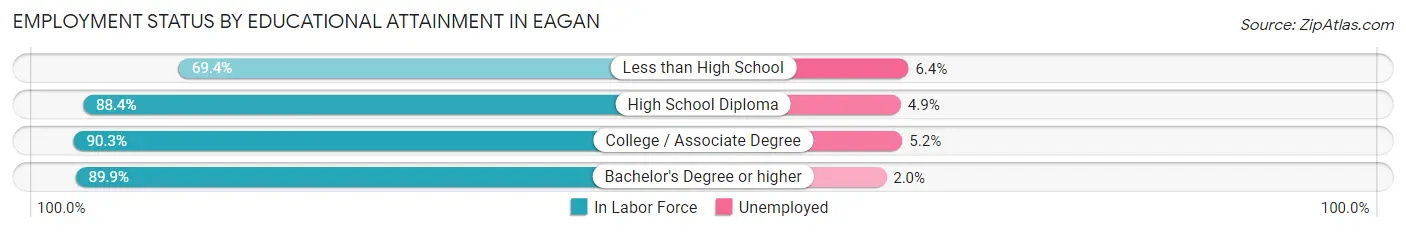
Employment Status by Educational Attainment in Eagan
According to labor force statistics for Eagan, 89.3% of individuals (33,276) out of the total population between 25 and 64 years of age (37,263) are in the labor force, with 3.4% or 1,131 of them being unemployed. The group with the highest labor force participation rate are those with the educational attainment of college / associate degree, with 90.3% or 9,984 individuals in the labor force. Within the labor force, individuals with less than high school education have the highest percentage of unemployment, with 6.4% or 44 of them being unemployed.
| Educational Attainment | In Labor Force | Unemployed |
| Less than High School | 686 (69.4%) | 63 (6.4%) |
| High School Diploma | 3,780 (88.4%) | 210 (4.9%) |
| College / Associate Degree | 9,984 (90.3%) | 575 (5.2%) |
| Bachelor's Degree or higher | 18,827 (89.9%) | 419 (2.0%) |
| Total | 33,276 (89.3%) | 1,267 (3.4%) |
Employment Occupations by Sex in Eagan
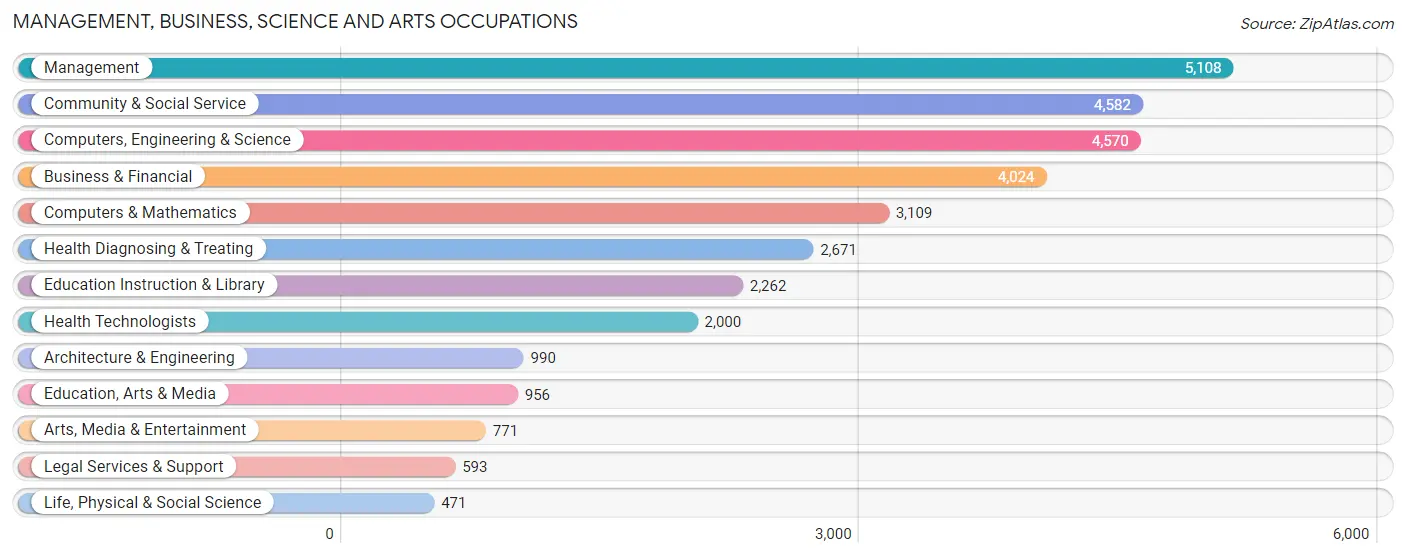
Management, Business, Science and Arts Occupations
The most common Management, Business, Science and Arts occupations in Eagan are Management (5,108 | 13.1%), Community & Social Service (4,582 | 11.7%), Computers, Engineering & Science (4,570 | 11.7%), Business & Financial (4,024 | 10.3%), and Computers & Mathematics (3,109 | 8.0%).
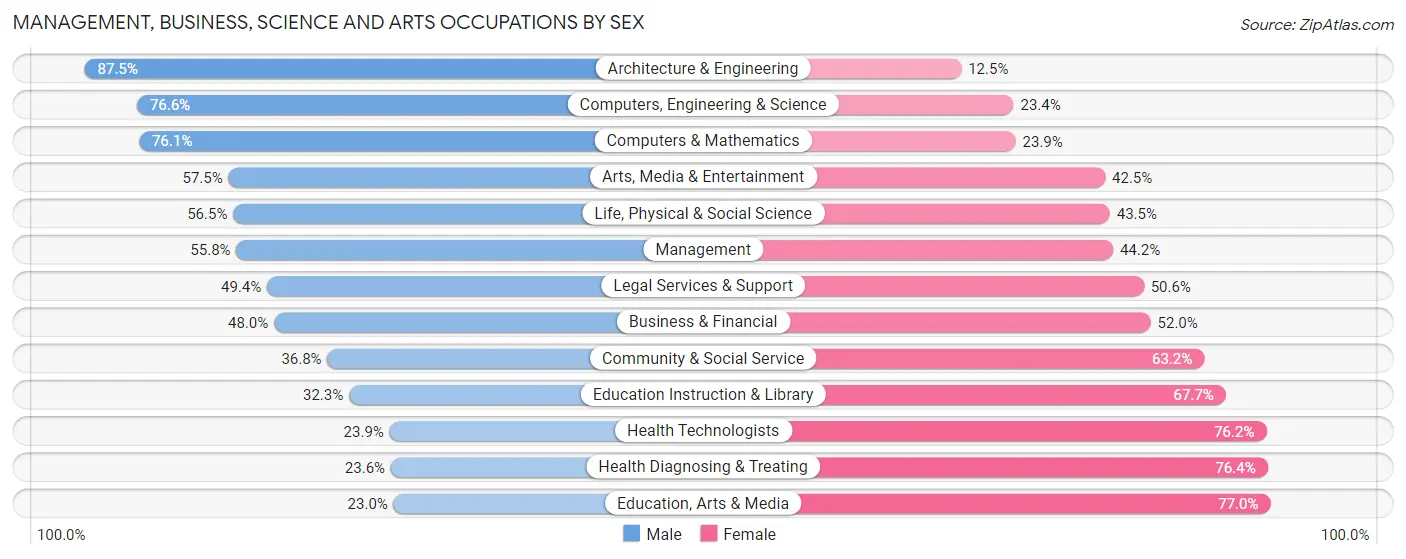
Management, Business, Science and Arts Occupations by Sex
Within the Management, Business, Science and Arts occupations in Eagan, the most male-oriented occupations are Architecture & Engineering (87.5%), Computers, Engineering & Science (76.6%), and Computers & Mathematics (76.1%), while the most female-oriented occupations are Education, Arts & Media (77.0%), Health Diagnosing & Treating (76.4%), and Health Technologists (76.1%).
| Occupation | Male | Female |
| Management | 2,851 (55.8%) | 2,257 (44.2%) |
| Business & Financial | 1,930 (48.0%) | 2,094 (52.0%) |
| Computers, Engineering & Science | 3,499 (76.6%) | 1,071 (23.4%) |
| Computers & Mathematics | 2,367 (76.1%) | 742 (23.9%) |
| Architecture & Engineering | 866 (87.5%) | 124 (12.5%) |
| Life, Physical & Social Science | 266 (56.5%) | 205 (43.5%) |
| Community & Social Service | 1,687 (36.8%) | 2,895 (63.2%) |
| Education, Arts & Media | 220 (23.0%) | 736 (77.0%) |
| Legal Services & Support | 293 (49.4%) | 300 (50.6%) |
| Education Instruction & Library | 731 (32.3%) | 1,531 (67.7%) |
| Arts, Media & Entertainment | 443 (57.5%) | 328 (42.5%) |
| Health Diagnosing & Treating | 630 (23.6%) | 2,041 (76.4%) |
| Health Technologists | 477 (23.8%) | 1,523 (76.1%) |
| Total (Category) | 10,597 (50.6%) | 10,358 (49.4%) |
| Total (Overall) | 20,325 (52.0%) | 18,761 (48.0%) |
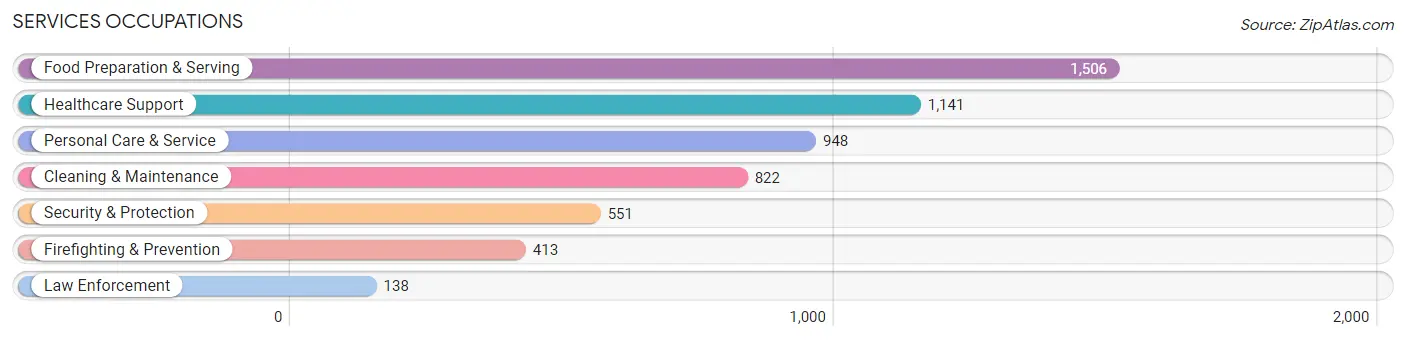
Services Occupations
The most common Services occupations in Eagan are Food Preparation & Serving (1,506 | 3.8%), Healthcare Support (1,141 | 2.9%), Personal Care & Service (948 | 2.4%), Cleaning & Maintenance (822 | 2.1%), and Security & Protection (551 | 1.4%).
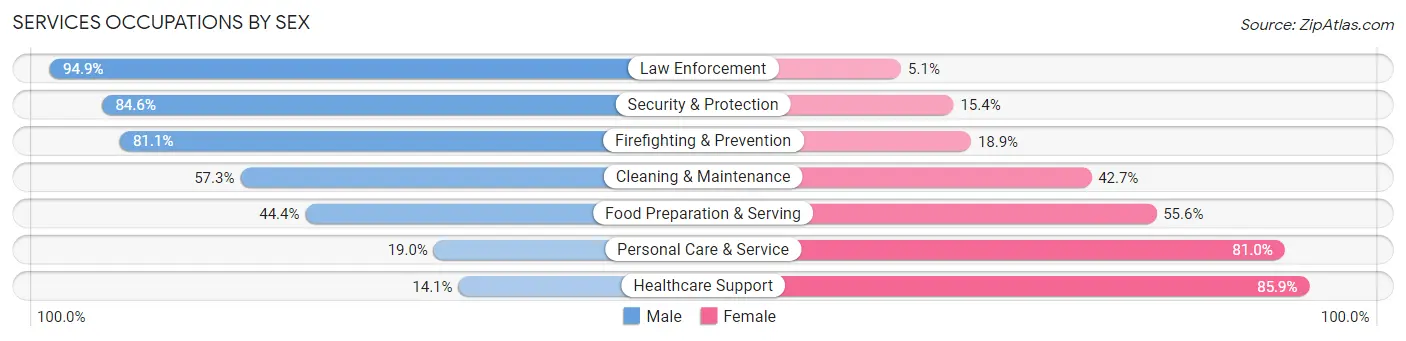
Services Occupations by Sex
Within the Services occupations in Eagan, the most male-oriented occupations are Law Enforcement (94.9%), Security & Protection (84.6%), and Firefighting & Prevention (81.1%), while the most female-oriented occupations are Healthcare Support (85.9%), Personal Care & Service (81.0%), and Food Preparation & Serving (55.6%).
| Occupation | Male | Female |
| Healthcare Support | 161 (14.1%) | 980 (85.9%) |
| Security & Protection | 466 (84.6%) | 85 (15.4%) |
| Firefighting & Prevention | 335 (81.1%) | 78 (18.9%) |
| Law Enforcement | 131 (94.9%) | 7 (5.1%) |
| Food Preparation & Serving | 669 (44.4%) | 837 (55.6%) |
| Cleaning & Maintenance | 471 (57.3%) | 351 (42.7%) |
| Personal Care & Service | 180 (19.0%) | 768 (81.0%) |
| Total (Category) | 1,947 (39.2%) | 3,021 (60.8%) |
| Total (Overall) | 20,325 (52.0%) | 18,761 (48.0%) |
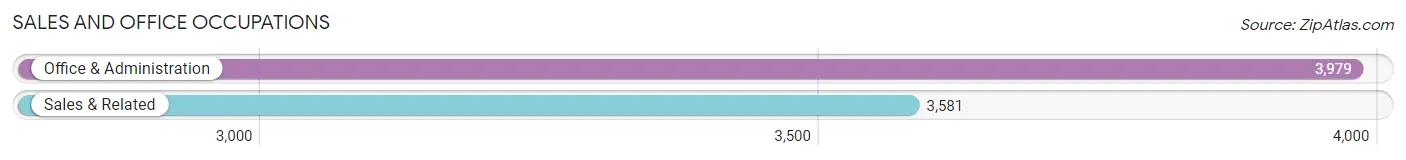
Sales and Office Occupations
The most common Sales and Office occupations in Eagan are Office & Administration (3,979 | 10.2%), and Sales & Related (3,581 | 9.2%).
Sales and Office Occupations by Sex
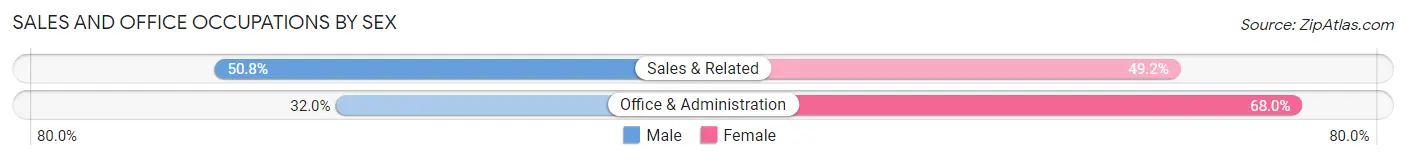
| Occupation | Male | Female |
| Sales & Related | 1,818 (50.8%) | 1,763 (49.2%) |
| Office & Administration | 1,275 (32.0%) | 2,704 (68.0%) |
| Total (Category) | 3,093 (40.9%) | 4,467 (59.1%) |
| Total (Overall) | 20,325 (52.0%) | 18,761 (48.0%) |
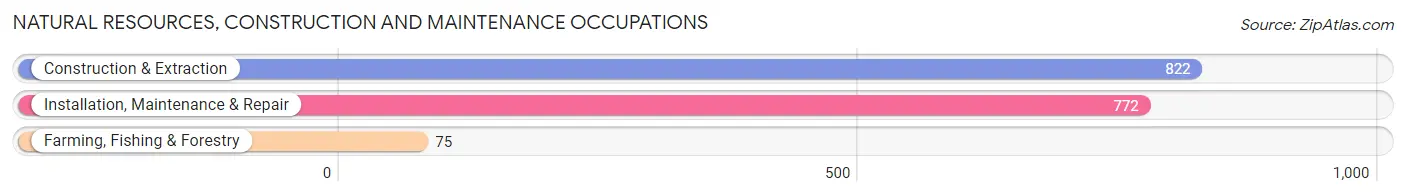
Natural Resources, Construction and Maintenance Occupations
The most common Natural Resources, Construction and Maintenance occupations in Eagan are Construction & Extraction (822 | 2.1%), Installation, Maintenance & Repair (772 | 2.0%), and Farming, Fishing & Forestry (75 | 0.2%).
Natural Resources, Construction and Maintenance Occupations by Sex
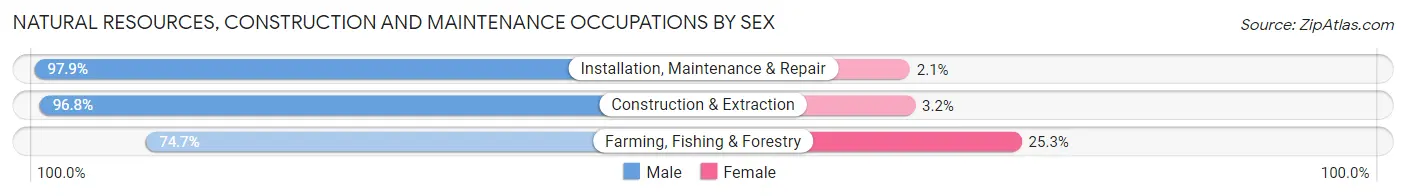
| Occupation | Male | Female |
| Farming, Fishing & Forestry | 56 (74.7%) | 19 (25.3%) |
| Construction & Extraction | 796 (96.8%) | 26 (3.2%) |
| Installation, Maintenance & Repair | 756 (97.9%) | 16 (2.1%) |
| Total (Category) | 1,608 (96.4%) | 61 (3.6%) |
| Total (Overall) | 20,325 (52.0%) | 18,761 (48.0%) |
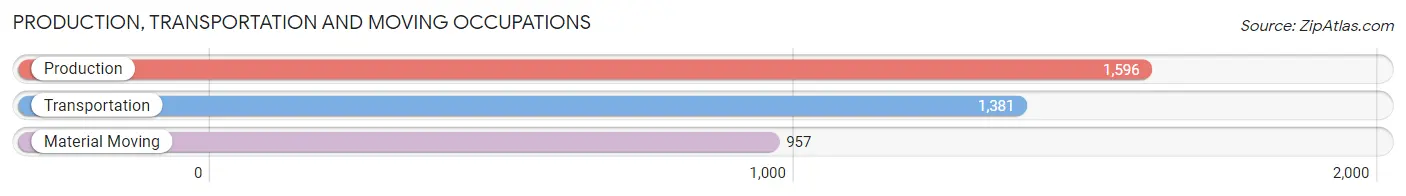
Production, Transportation and Moving Occupations
The most common Production, Transportation and Moving occupations in Eagan are Production (1,596 | 4.1%), Transportation (1,381 | 3.5%), and Material Moving (957 | 2.5%).
Production, Transportation and Moving Occupations by Sex
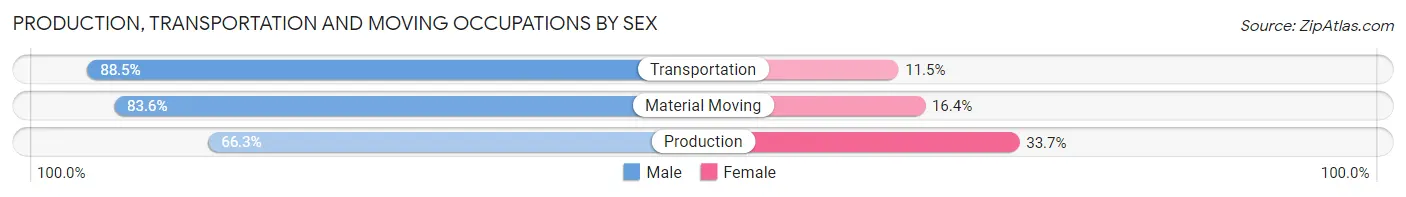
| Occupation | Male | Female |
| Production | 1,058 (66.3%) | 538 (33.7%) |
| Transportation | 1,222 (88.5%) | 159 (11.5%) |
| Material Moving | 800 (83.6%) | 157 (16.4%) |
| Total (Category) | 3,080 (78.3%) | 854 (21.7%) |
| Total (Overall) | 20,325 (52.0%) | 18,761 (48.0%) |
Employment Industries by Sex in Eagan
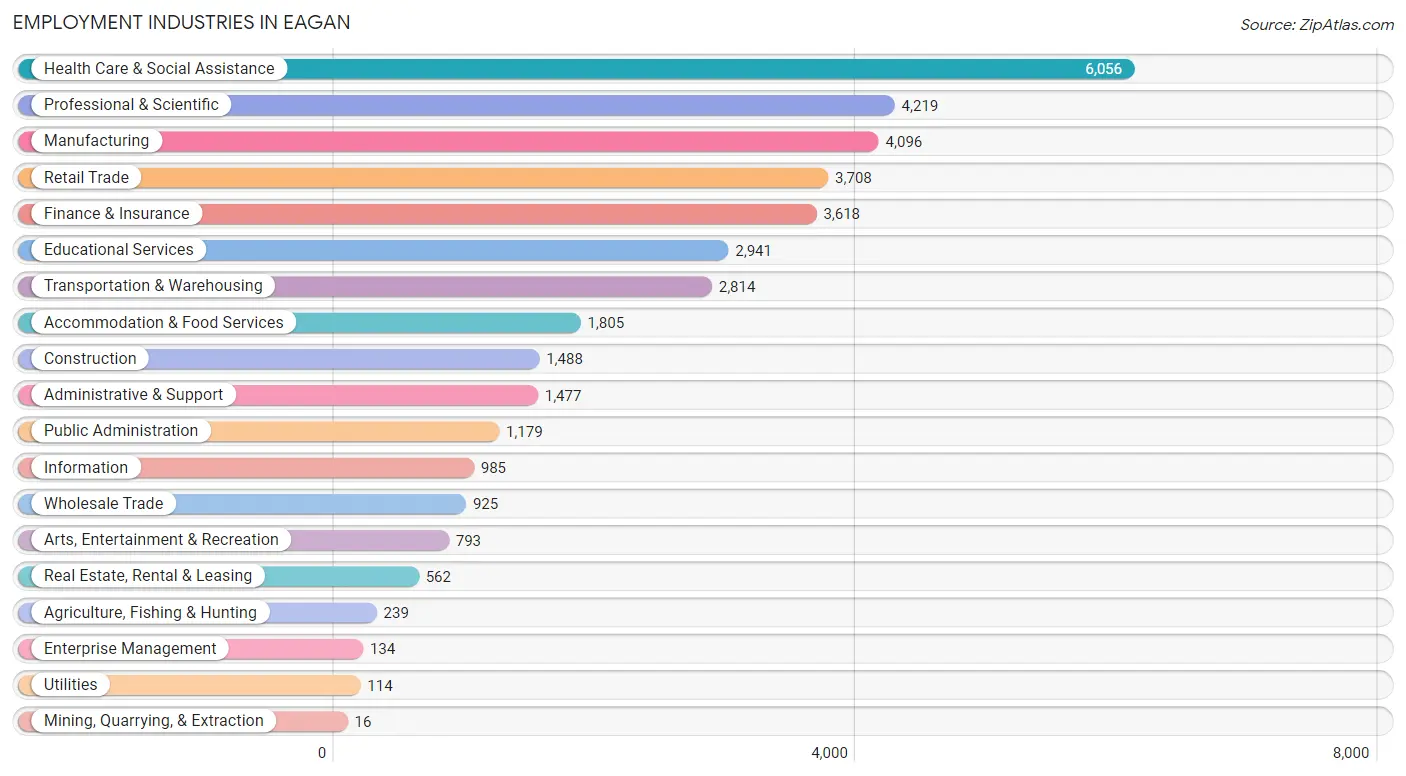
Employment Industries in Eagan
The major employment industries in Eagan include Health Care & Social Assistance (6,056 | 15.5%), Professional & Scientific (4,219 | 10.8%), Manufacturing (4,096 | 10.5%), Retail Trade (3,708 | 9.5%), and Finance & Insurance (3,618 | 9.3%).
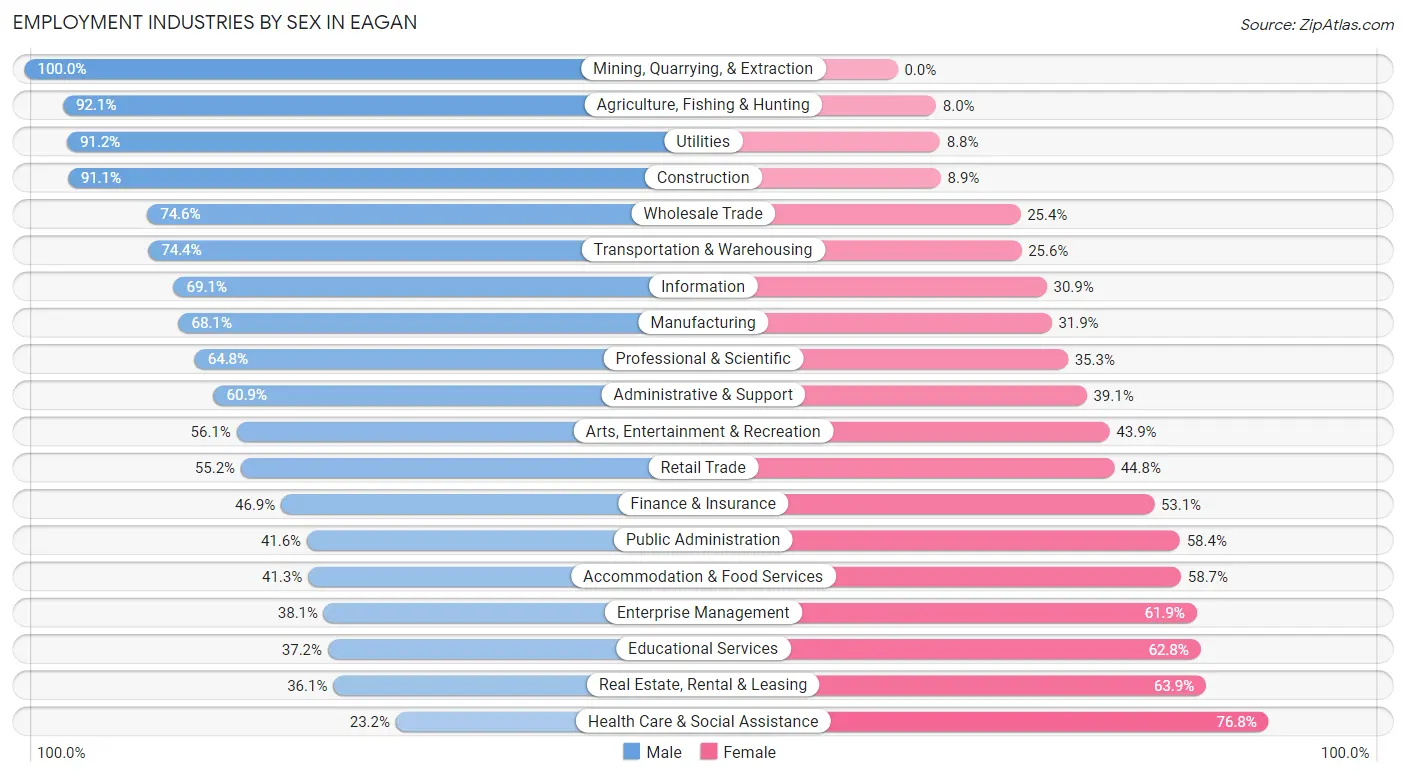
Employment Industries by Sex in Eagan
The Eagan industries that see more men than women are Mining, Quarrying, & Extraction (100.0%), Agriculture, Fishing & Hunting (92.0%), and Utilities (91.2%), whereas the industries that tend to have a higher number of women are Health Care & Social Assistance (76.8%), Real Estate, Rental & Leasing (63.9%), and Educational Services (62.8%).
| Industry | Male | Female |
| Agriculture, Fishing & Hunting | 220 (92.0%) | 19 (8.0%) |
| Mining, Quarrying, & Extraction | 16 (100.0%) | 0 (0.0%) |
| Construction | 1,355 (91.1%) | 133 (8.9%) |
| Manufacturing | 2,790 (68.1%) | 1,306 (31.9%) |
| Wholesale Trade | 690 (74.6%) | 235 (25.4%) |
| Retail Trade | 2,048 (55.2%) | 1,660 (44.8%) |
| Transportation & Warehousing | 2,093 (74.4%) | 721 (25.6%) |
| Utilities | 104 (91.2%) | 10 (8.8%) |
| Information | 681 (69.1%) | 304 (30.9%) |
| Finance & Insurance | 1,697 (46.9%) | 1,921 (53.1%) |
| Real Estate, Rental & Leasing | 203 (36.1%) | 359 (63.9%) |
| Professional & Scientific | 2,732 (64.7%) | 1,487 (35.2%) |
| Enterprise Management | 51 (38.1%) | 83 (61.9%) |
| Administrative & Support | 899 (60.9%) | 578 (39.1%) |
| Educational Services | 1,095 (37.2%) | 1,846 (62.8%) |
| Health Care & Social Assistance | 1,403 (23.2%) | 4,653 (76.8%) |
| Arts, Entertainment & Recreation | 445 (56.1%) | 348 (43.9%) |
| Accommodation & Food Services | 746 (41.3%) | 1,059 (58.7%) |
| Public Administration | 490 (41.6%) | 689 (58.4%) |
| Total | 20,325 (52.0%) | 18,761 (48.0%) |
Education in Eagan
School Enrollment in Eagan
The most common levels of schooling among the 15,578 students in Eagan are high school (3,744 | 24.0%), elementary school (3,538 | 22.7%), and middle school (3,310 | 21.2%).
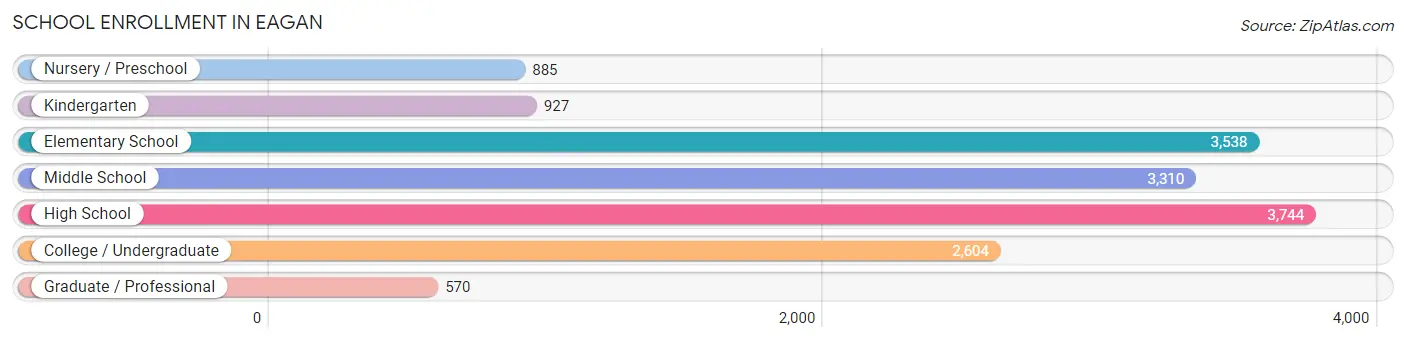
| School Level | # Students | % Students |
| Nursery / Preschool | 885 | 5.7% |
| Kindergarten | 927 | 5.9% |
| Elementary School | 3,538 | 22.7% |
| Middle School | 3,310 | 21.2% |
| High School | 3,744 | 24.0% |
| College / Undergraduate | 2,604 | 16.7% |
| Graduate / Professional | 570 | 3.7% |
| Total | 15,578 | 100.0% |
School Enrollment by Age by Funding Source in Eagan
Out of a total of 15,578 students who are enrolled in schools in Eagan, 2,742 (17.6%) attend a private institution, while the remaining 12,836 (82.4%) are enrolled in public schools. The age group of 3 to 4 year olds has the highest likelihood of being enrolled in private schools, with 275 (49.5% in the age bracket) enrolled. Conversely, the age group of 15 to 17 year olds has the lowest likelihood of being enrolled in a private school, with 2,497 (88.2% in the age bracket) attending a public institution.
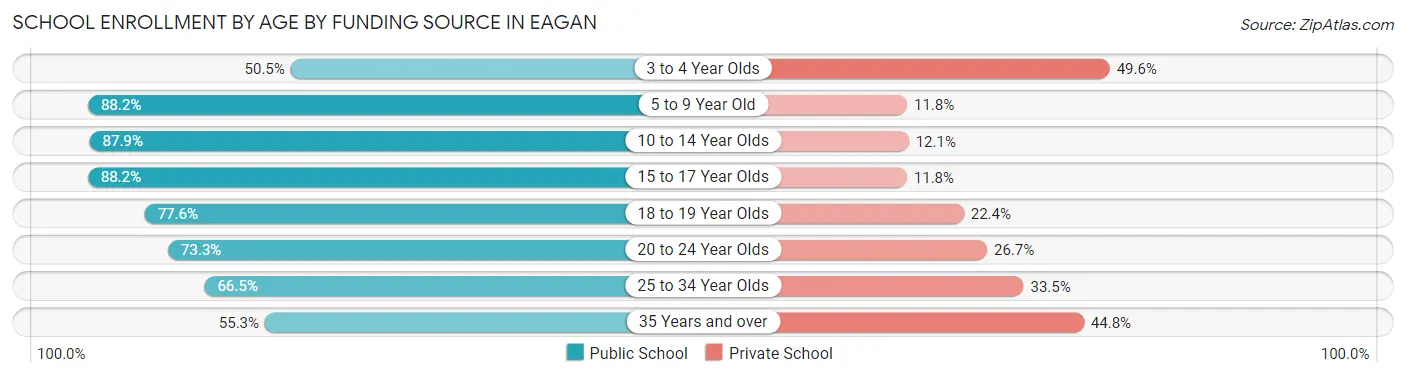
| Age Bracket | Public School | Private School |
| 3 to 4 Year Olds | 280 (50.4%) | 275 (49.5%) |
| 5 to 9 Year Old | 3,787 (88.2%) | 507 (11.8%) |
| 10 to 14 Year Olds | 3,705 (87.9%) | 511 (12.1%) |
| 15 to 17 Year Olds | 2,497 (88.2%) | 333 (11.8%) |
| 18 to 19 Year Olds | 784 (77.6%) | 226 (22.4%) |
| 20 to 24 Year Olds | 862 (73.3%) | 314 (26.7%) |
| 25 to 34 Year Olds | 514 (66.5%) | 259 (33.5%) |
| 35 Years and over | 400 (55.2%) | 324 (44.8%) |
| Total | 12,836 (82.4%) | 2,742 (17.6%) |
Educational Attainment by Field of Study in Eagan
Business (6,238 | 22.7%), education (2,580 | 9.4%), science & technology (2,471 | 9.0%), engineering (2,208 | 8.0%), and computers & mathematics (2,040 | 7.4%) are the most common fields of study among 27,540 individuals in Eagan who have obtained a bachelor's degree or higher.
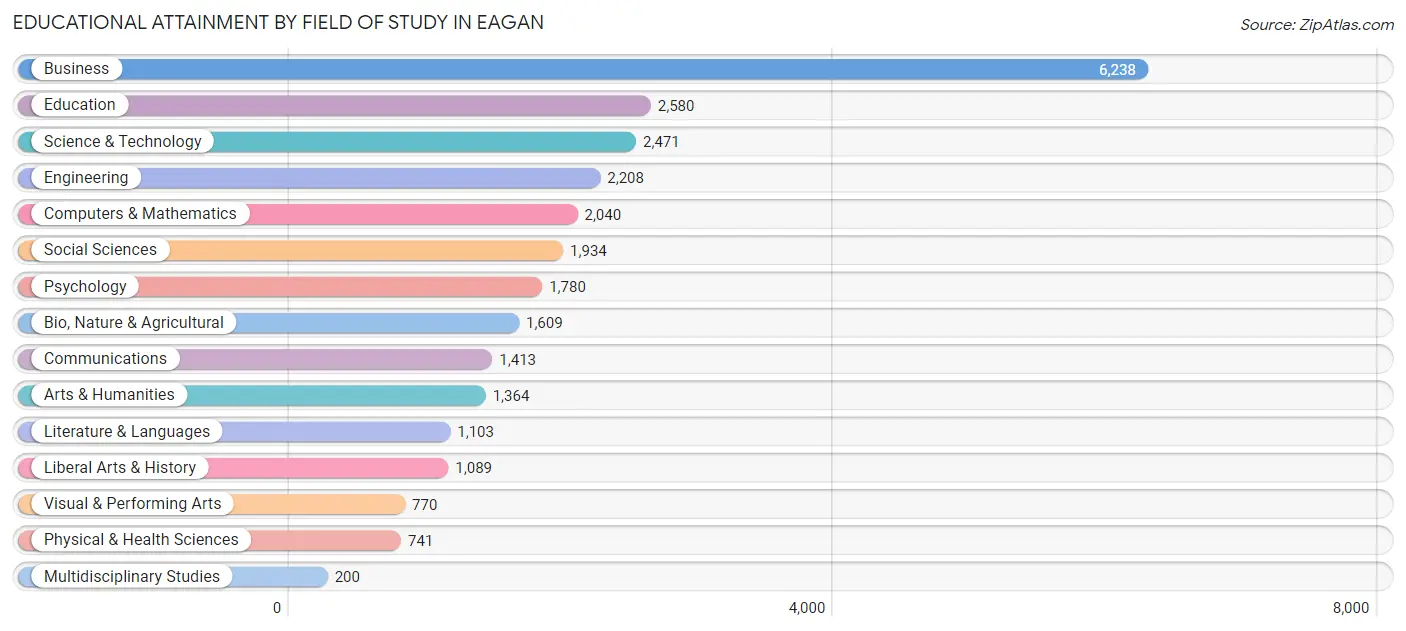
| Field of Study | # Graduates | % Graduates |
| Computers & Mathematics | 2,040 | 7.4% |
| Bio, Nature & Agricultural | 1,609 | 5.8% |
| Physical & Health Sciences | 741 | 2.7% |
| Psychology | 1,780 | 6.5% |
| Social Sciences | 1,934 | 7.0% |
| Engineering | 2,208 | 8.0% |
| Multidisciplinary Studies | 200 | 0.7% |
| Science & Technology | 2,471 | 9.0% |
| Business | 6,238 | 22.7% |
| Education | 2,580 | 9.4% |
| Literature & Languages | 1,103 | 4.0% |
| Liberal Arts & History | 1,089 | 4.0% |
| Visual & Performing Arts | 770 | 2.8% |
| Communications | 1,413 | 5.1% |
| Arts & Humanities | 1,364 | 5.0% |
| Total | 27,540 | 100.0% |
Transportation & Commute in Eagan
Vehicle Availability by Sex in Eagan
The most prevalent vehicle ownership categories in Eagan are males with 2 vehicles (10,434, accounting for 51.9%) and females with 2 vehicles (8,805, making up 56.4%).
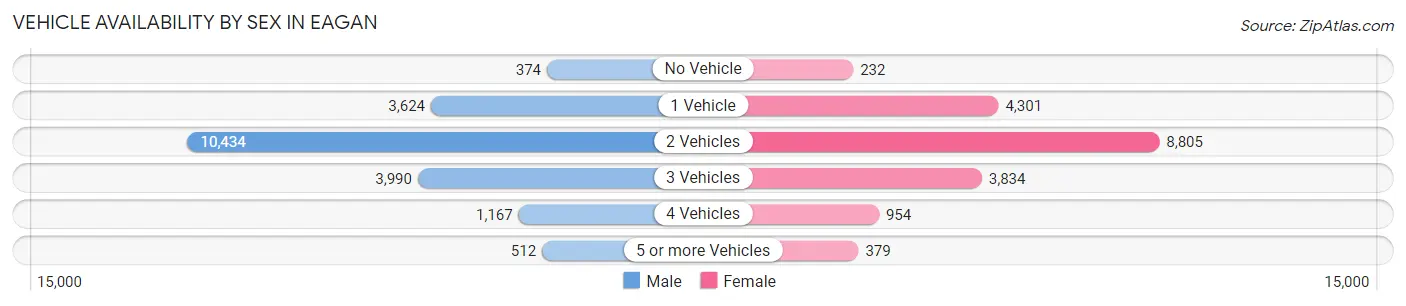
| Vehicles Available | Male | Female |
| No Vehicle | 374 (1.9%) | 232 (1.3%) |
| 1 Vehicle | 3,624 (18.0%) | 4,301 (23.2%) |
| 2 Vehicles | 10,434 (51.9%) | 8,805 (47.6%) |
| 3 Vehicles | 3,990 (19.9%) | 3,834 (20.7%) |
| 4 Vehicles | 1,167 (5.8%) | 954 (5.2%) |
| 5 or more Vehicles | 512 (2.5%) | 379 (2.1%) |
| Total | 20,101 (100.0%) | 18,505 (100.0%) |
Commute Time in Eagan
The most frequently occuring commute durations in Eagan are 20 to 24 minutes (5,434 commuters, 17.0%), 30 to 34 minutes (5,026 commuters, 15.7%), and 15 to 19 minutes (4,985 commuters, 15.6%).
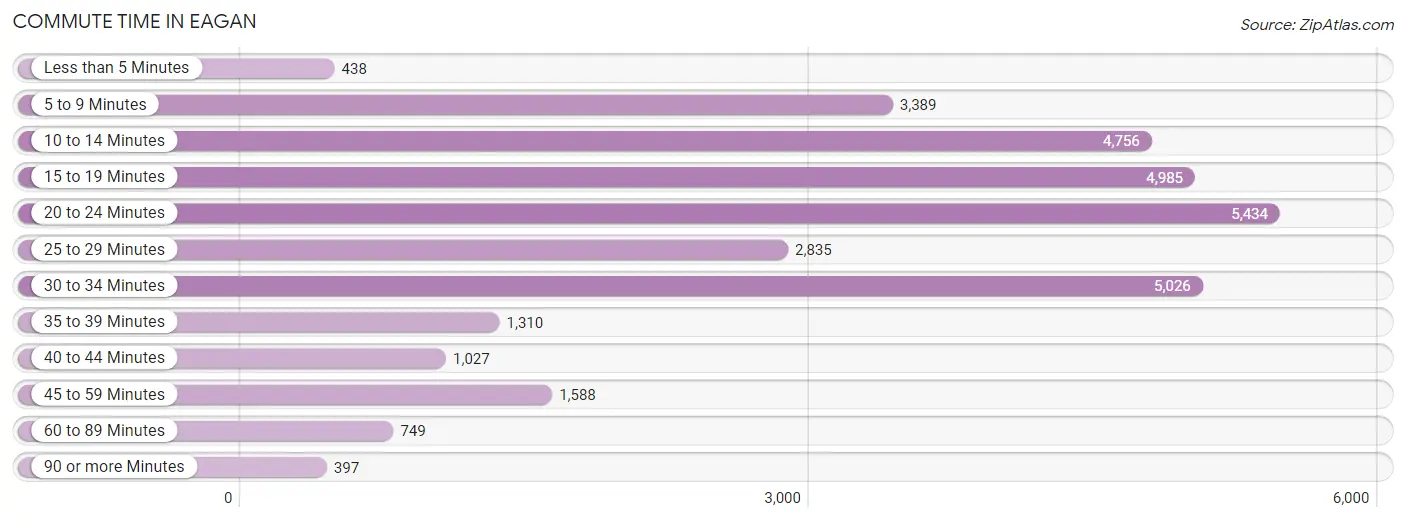
| Commute Time | # Commuters | % Commuters |
| Less than 5 Minutes | 438 | 1.4% |
| 5 to 9 Minutes | 3,389 | 10.6% |
| 10 to 14 Minutes | 4,756 | 14.9% |
| 15 to 19 Minutes | 4,985 | 15.6% |
| 20 to 24 Minutes | 5,434 | 17.0% |
| 25 to 29 Minutes | 2,835 | 8.9% |
| 30 to 34 Minutes | 5,026 | 15.7% |
| 35 to 39 Minutes | 1,310 | 4.1% |
| 40 to 44 Minutes | 1,027 | 3.2% |
| 45 to 59 Minutes | 1,588 | 5.0% |
| 60 to 89 Minutes | 749 | 2.4% |
| 90 or more Minutes | 397 | 1.2% |
Commute Time by Sex in Eagan
The most common commute times in Eagan are 20 to 24 minutes (2,921 commuters, 17.8%) for males and 20 to 24 minutes (2,513 commuters, 16.2%) for females.
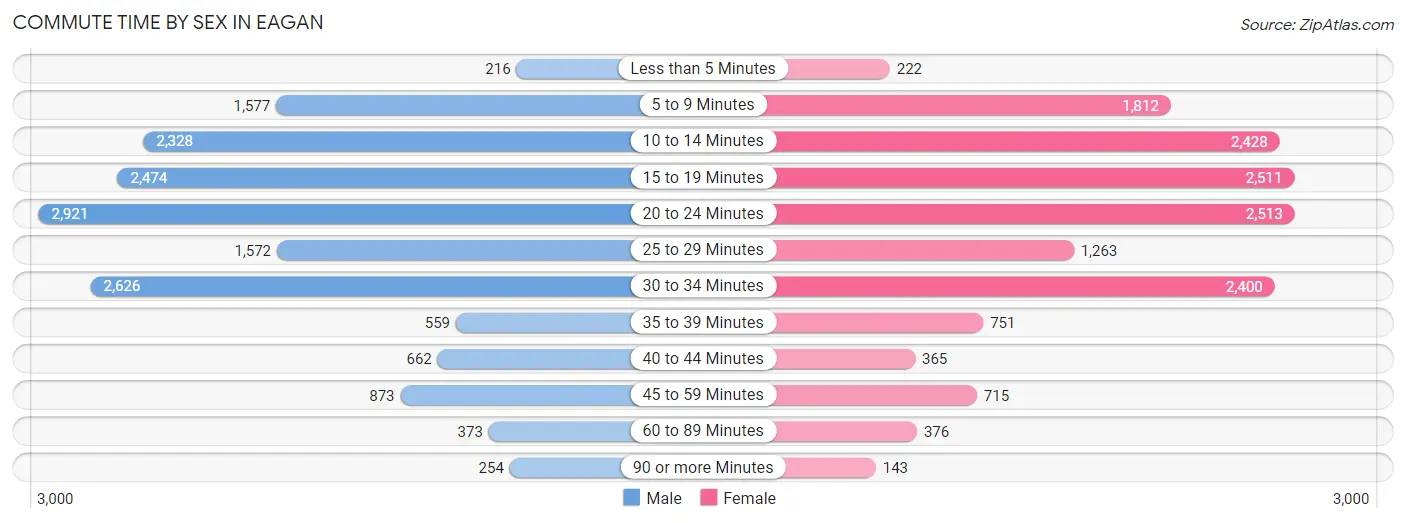
| Commute Time | Male | Female |
| Less than 5 Minutes | 216 (1.3%) | 222 (1.4%) |
| 5 to 9 Minutes | 1,577 (9.6%) | 1,812 (11.7%) |
| 10 to 14 Minutes | 2,328 (14.2%) | 2,428 (15.7%) |
| 15 to 19 Minutes | 2,474 (15.0%) | 2,511 (16.2%) |
| 20 to 24 Minutes | 2,921 (17.8%) | 2,513 (16.2%) |
| 25 to 29 Minutes | 1,572 (9.6%) | 1,263 (8.2%) |
| 30 to 34 Minutes | 2,626 (16.0%) | 2,400 (15.5%) |
| 35 to 39 Minutes | 559 (3.4%) | 751 (4.9%) |
| 40 to 44 Minutes | 662 (4.0%) | 365 (2.4%) |
| 45 to 59 Minutes | 873 (5.3%) | 715 (4.6%) |
| 60 to 89 Minutes | 373 (2.3%) | 376 (2.4%) |
| 90 or more Minutes | 254 (1.5%) | 143 (0.9%) |
Time of Departure to Work by Sex in Eagan
The most frequent times of departure to work in Eagan are 7:00 AM to 7:29 AM (2,768, 16.8%) for males and 7:00 AM to 7:29 AM (2,516, 16.2%) for females.
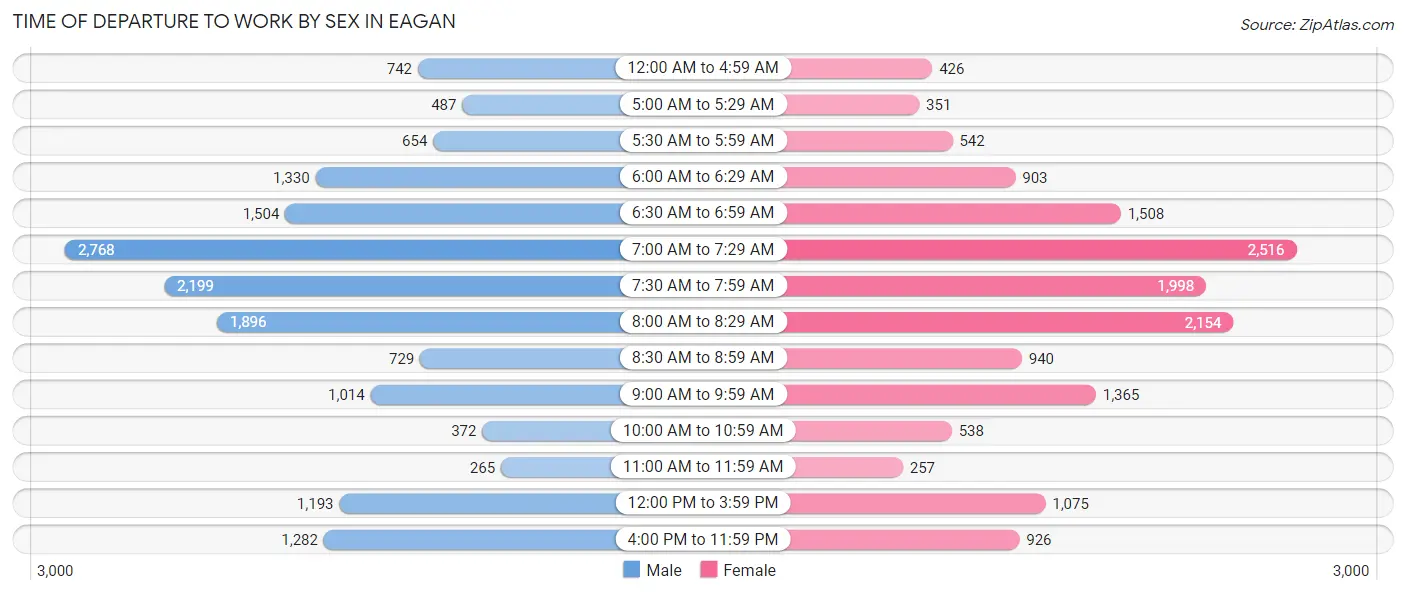
| Time of Departure | Male | Female |
| 12:00 AM to 4:59 AM | 742 (4.5%) | 426 (2.8%) |
| 5:00 AM to 5:29 AM | 487 (3.0%) | 351 (2.3%) |
| 5:30 AM to 5:59 AM | 654 (4.0%) | 542 (3.5%) |
| 6:00 AM to 6:29 AM | 1,330 (8.1%) | 903 (5.8%) |
| 6:30 AM to 6:59 AM | 1,504 (9.1%) | 1,508 (9.7%) |
| 7:00 AM to 7:29 AM | 2,768 (16.8%) | 2,516 (16.2%) |
| 7:30 AM to 7:59 AM | 2,199 (13.4%) | 1,998 (12.9%) |
| 8:00 AM to 8:29 AM | 1,896 (11.5%) | 2,154 (13.9%) |
| 8:30 AM to 8:59 AM | 729 (4.4%) | 940 (6.1%) |
| 9:00 AM to 9:59 AM | 1,014 (6.2%) | 1,365 (8.8%) |
| 10:00 AM to 10:59 AM | 372 (2.3%) | 538 (3.5%) |
| 11:00 AM to 11:59 AM | 265 (1.6%) | 257 (1.7%) |
| 12:00 PM to 3:59 PM | 1,193 (7.3%) | 1,075 (6.9%) |
| 4:00 PM to 11:59 PM | 1,282 (7.8%) | 926 (6.0%) |
| Total | 16,435 (100.0%) | 15,499 (100.0%) |
Housing Occupancy in Eagan
Occupancy by Ownership in Eagan
Of the total 27,628 dwellings in Eagan, owner-occupied units account for 19,417 (70.3%), while renter-occupied units make up 8,211 (29.7%).
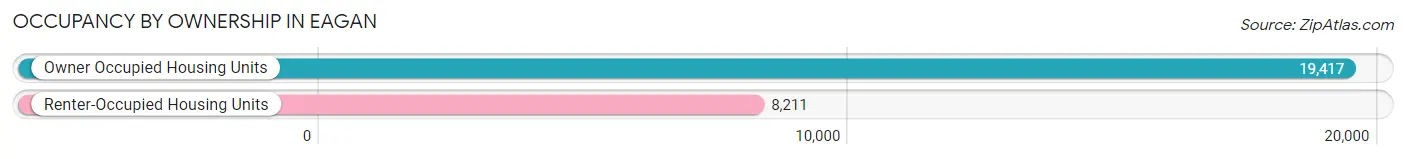
| Occupancy | # Housing Units | % Housing Units |
| Owner Occupied Housing Units | 19,417 | 70.3% |
| Renter-Occupied Housing Units | 8,211 | 29.7% |
| Total Occupied Housing Units | 27,628 | 100.0% |
Occupancy by Household Size in Eagan
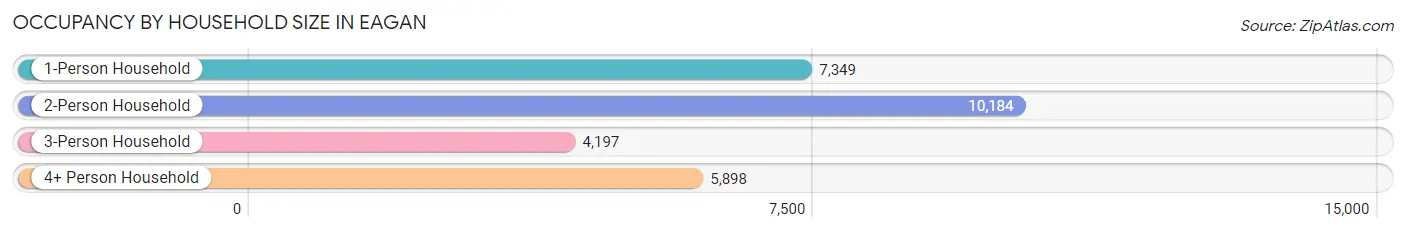
| Household Size | # Housing Units | % Housing Units |
| 1-Person Household | 7,349 | 26.6% |
| 2-Person Household | 10,184 | 36.9% |
| 3-Person Household | 4,197 | 15.2% |
| 4+ Person Household | 5,898 | 21.3% |
| Total Housing Units | 27,628 | 100.0% |
Occupancy by Ownership by Household Size in Eagan
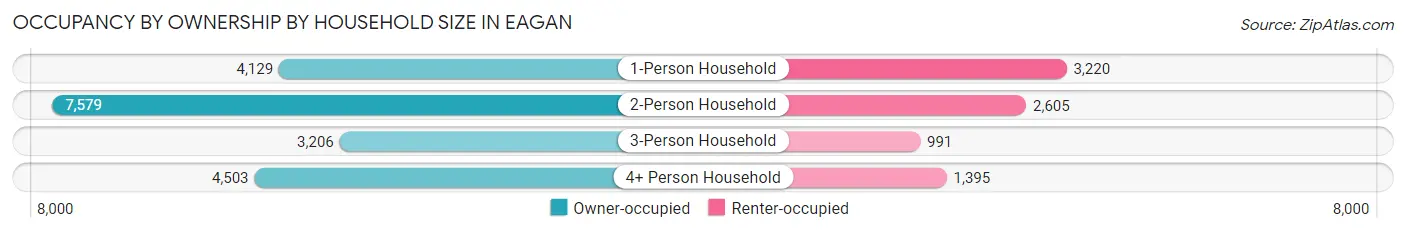
| Household Size | Owner-occupied | Renter-occupied |
| 1-Person Household | 4,129 (56.2%) | 3,220 (43.8%) |
| 2-Person Household | 7,579 (74.4%) | 2,605 (25.6%) |
| 3-Person Household | 3,206 (76.4%) | 991 (23.6%) |
| 4+ Person Household | 4,503 (76.3%) | 1,395 (23.6%) |
| Total Housing Units | 19,417 (70.3%) | 8,211 (29.7%) |
Occupancy by Educational Attainment in Eagan
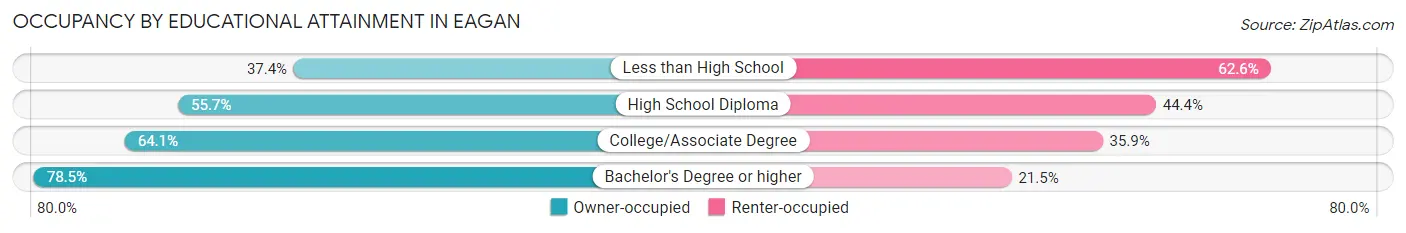
| Household Size | Owner-occupied | Renter-occupied |
| Less than High School | 289 (37.4%) | 483 (62.6%) |
| High School Diploma | 1,794 (55.6%) | 1,430 (44.4%) |
| College/Associate Degree | 5,443 (64.1%) | 3,049 (35.9%) |
| Bachelor's Degree or higher | 11,891 (78.5%) | 3,249 (21.5%) |
Occupancy by Age of Householder in Eagan
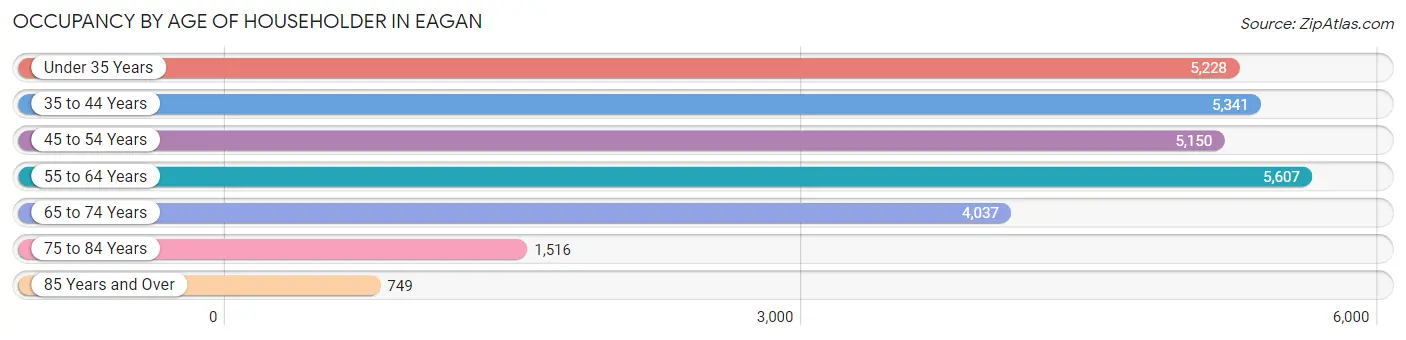
| Age Bracket | # Households | % Households |
| Under 35 Years | 5,228 | 18.9% |
| 35 to 44 Years | 5,341 | 19.3% |
| 45 to 54 Years | 5,150 | 18.6% |
| 55 to 64 Years | 5,607 | 20.3% |
| 65 to 74 Years | 4,037 | 14.6% |
| 75 to 84 Years | 1,516 | 5.5% |
| 85 Years and Over | 749 | 2.7% |
| Total | 27,628 | 100.0% |
Housing Finances in Eagan
Median Income by Occupancy in Eagan
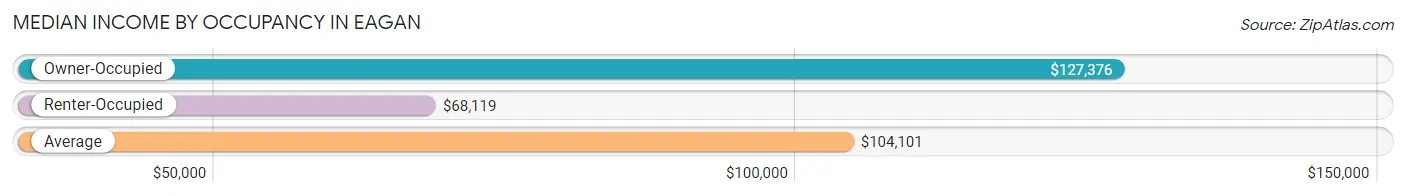
| Occupancy Type | # Households | Median Income |
| Owner-Occupied | 19,417 (70.3%) | $127,376 |
| Renter-Occupied | 8,211 (29.7%) | $68,119 |
| Average | 27,628 (100.0%) | $104,101 |
Occupancy by Householder Income Bracket in Eagan
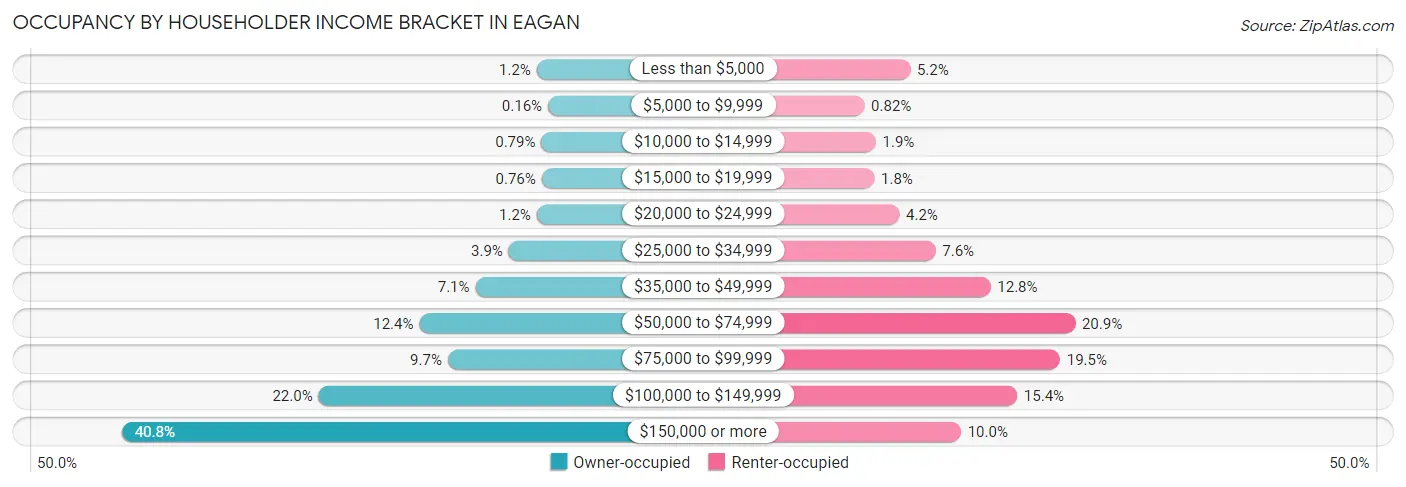
| Income Bracket | Owner-occupied | Renter-occupied |
| Less than $5,000 | 238 (1.2%) | 425 (5.2%) |
| $5,000 to $9,999 | 32 (0.2%) | 67 (0.8%) |
| $10,000 to $14,999 | 153 (0.8%) | 157 (1.9%) |
| $15,000 to $19,999 | 147 (0.8%) | 145 (1.8%) |
| $20,000 to $24,999 | 238 (1.2%) | 341 (4.2%) |
| $25,000 to $34,999 | 757 (3.9%) | 624 (7.6%) |
| $35,000 to $49,999 | 1,373 (7.1%) | 1,054 (12.8%) |
| $50,000 to $74,999 | 2,410 (12.4%) | 1,716 (20.9%) |
| $75,000 to $99,999 | 1,883 (9.7%) | 1,597 (19.5%) |
| $100,000 to $149,999 | 4,273 (22.0%) | 1,262 (15.4%) |
| $150,000 or more | 7,913 (40.7%) | 823 (10.0%) |
| Total | 19,417 (100.0%) | 8,211 (100.0%) |
Monthly Housing Cost Tiers in Eagan
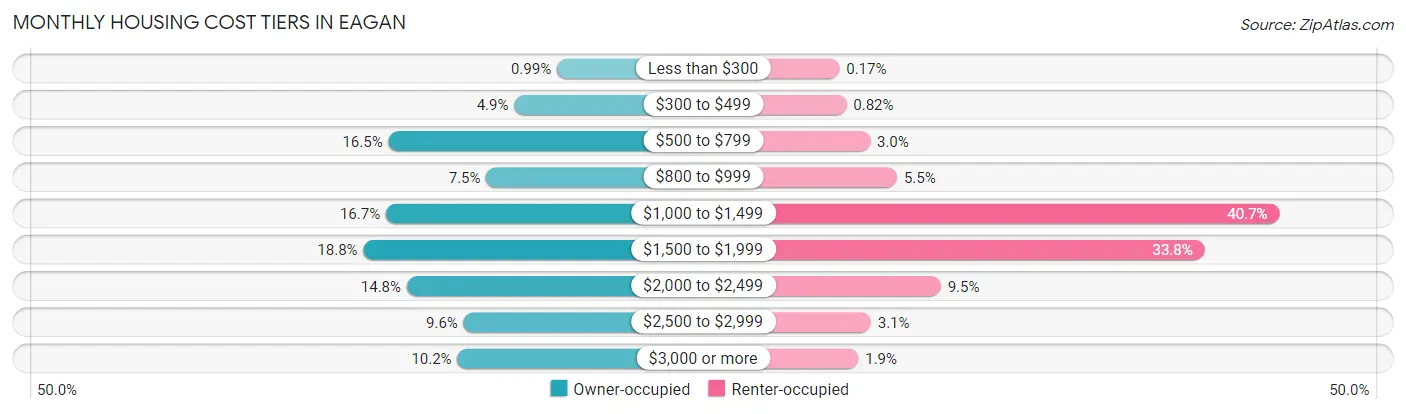
| Monthly Cost | Owner-occupied | Renter-occupied |
| Less than $300 | 193 (1.0%) | 14 (0.2%) |
| $300 to $499 | 956 (4.9%) | 67 (0.8%) |
| $500 to $799 | 3,204 (16.5%) | 246 (3.0%) |
| $800 to $999 | 1,455 (7.5%) | 450 (5.5%) |
| $1,000 to $1,499 | 3,249 (16.7%) | 3,341 (40.7%) |
| $1,500 to $1,999 | 3,652 (18.8%) | 2,775 (33.8%) |
| $2,000 to $2,499 | 2,876 (14.8%) | 781 (9.5%) |
| $2,500 to $2,999 | 1,861 (9.6%) | 252 (3.1%) |
| $3,000 or more | 1,971 (10.2%) | 158 (1.9%) |
| Total | 19,417 (100.0%) | 8,211 (100.0%) |
Physical Housing Characteristics in Eagan
Housing Structures in Eagan
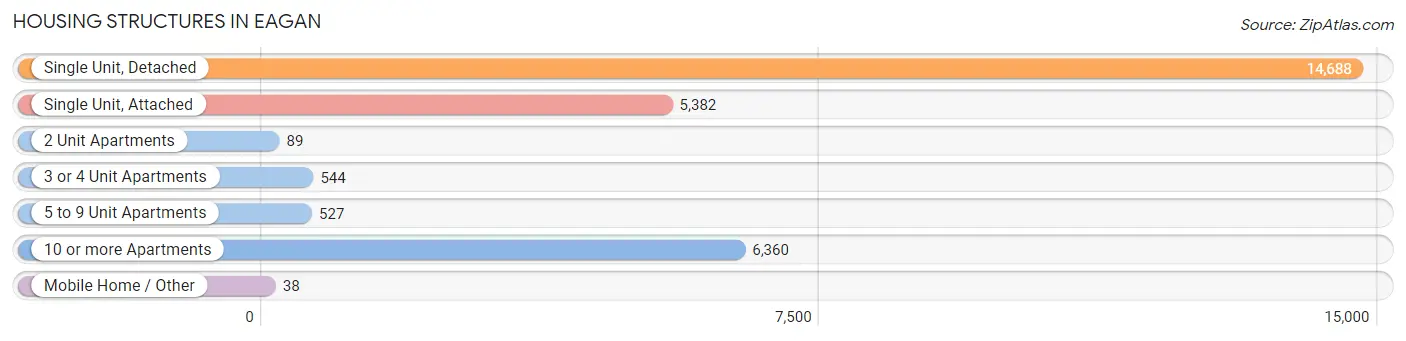
| Structure Type | # Housing Units | % Housing Units |
| Single Unit, Detached | 14,688 | 53.2% |
| Single Unit, Attached | 5,382 | 19.5% |
| 2 Unit Apartments | 89 | 0.3% |
| 3 or 4 Unit Apartments | 544 | 2.0% |
| 5 to 9 Unit Apartments | 527 | 1.9% |
| 10 or more Apartments | 6,360 | 23.0% |
| Mobile Home / Other | 38 | 0.1% |
| Total | 27,628 | 100.0% |
Housing Structures by Occupancy in Eagan
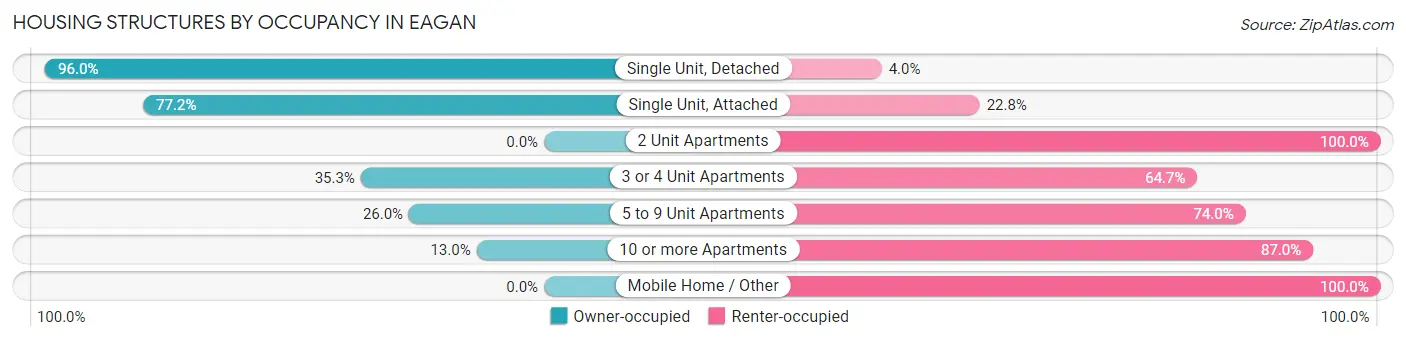
| Structure Type | Owner-occupied | Renter-occupied |
| Single Unit, Detached | 14,107 (96.0%) | 581 (4.0%) |
| Single Unit, Attached | 4,154 (77.2%) | 1,228 (22.8%) |
| 2 Unit Apartments | 0 (0.0%) | 89 (100.0%) |
| 3 or 4 Unit Apartments | 192 (35.3%) | 352 (64.7%) |
| 5 to 9 Unit Apartments | 137 (26.0%) | 390 (74.0%) |
| 10 or more Apartments | 827 (13.0%) | 5,533 (87.0%) |
| Mobile Home / Other | 0 (0.0%) | 38 (100.0%) |
| Total | 19,417 (70.3%) | 8,211 (29.7%) |
Housing Structures by Number of Rooms in Eagan
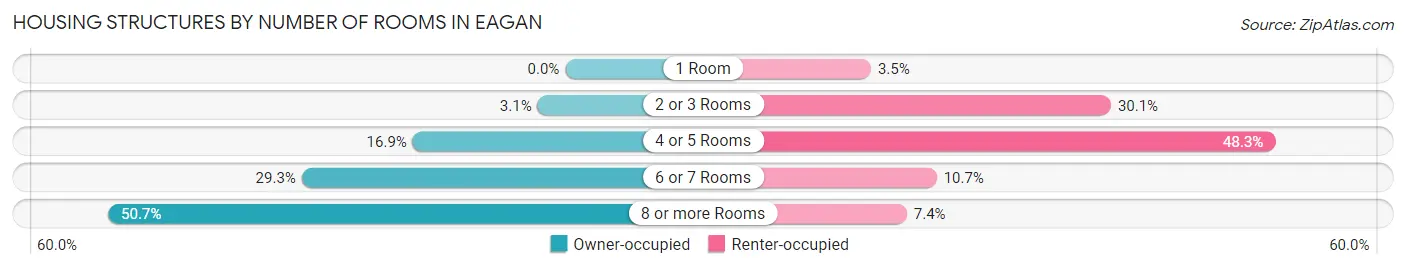
| Number of Rooms | Owner-occupied | Renter-occupied |
| 1 Room | 0 (0.0%) | 283 (3.5%) |
| 2 or 3 Rooms | 599 (3.1%) | 2,470 (30.1%) |
| 4 or 5 Rooms | 3,288 (16.9%) | 3,966 (48.3%) |
| 6 or 7 Rooms | 5,680 (29.2%) | 882 (10.7%) |
| 8 or more Rooms | 9,850 (50.7%) | 610 (7.4%) |
| Total | 19,417 (100.0%) | 8,211 (100.0%) |
Housing Structure by Heating Type in Eagan
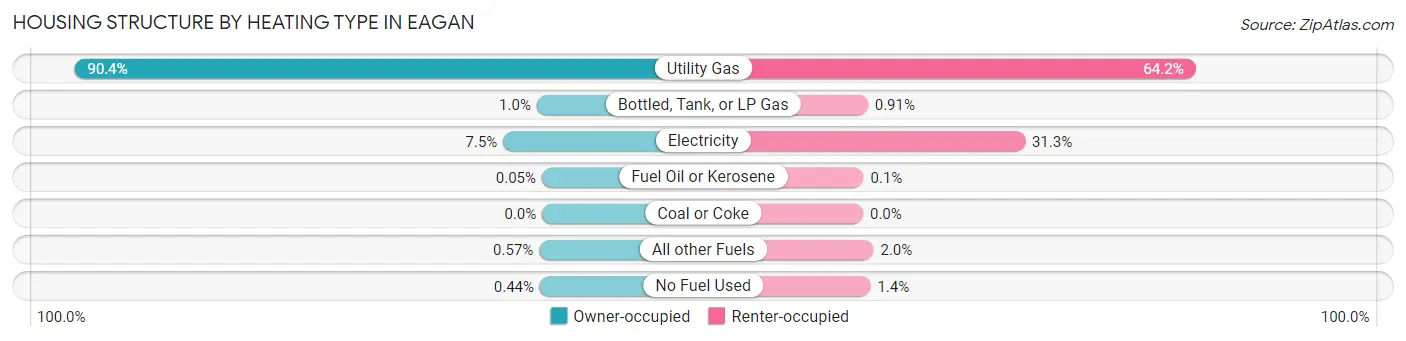
| Heating Type | Owner-occupied | Renter-occupied |
| Utility Gas | 17,550 (90.4%) | 5,274 (64.2%) |
| Bottled, Tank, or LP Gas | 202 (1.0%) | 75 (0.9%) |
| Electricity | 1,460 (7.5%) | 2,569 (31.3%) |
| Fuel Oil or Kerosene | 10 (0.1%) | 8 (0.1%) |
| Coal or Coke | 0 (0.0%) | 0 (0.0%) |
| All other Fuels | 110 (0.6%) | 167 (2.0%) |
| No Fuel Used | 85 (0.4%) | 118 (1.4%) |
| Total | 19,417 (100.0%) | 8,211 (100.0%) |
Household Vehicle Usage in Eagan
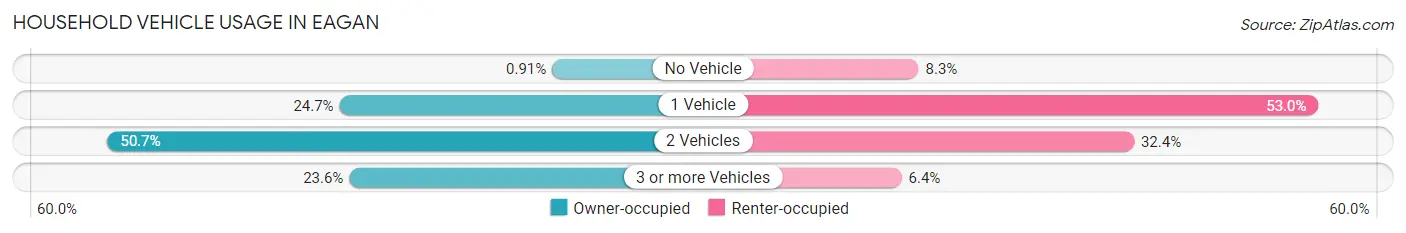
| Vehicles per Household | Owner-occupied | Renter-occupied |
| No Vehicle | 176 (0.9%) | 677 (8.3%) |
| 1 Vehicle | 4,801 (24.7%) | 4,354 (53.0%) |
| 2 Vehicles | 9,850 (50.7%) | 2,659 (32.4%) |
| 3 or more Vehicles | 4,590 (23.6%) | 521 (6.4%) |
| Total | 19,417 (100.0%) | 8,211 (100.0%) |
Real Estate & Mortgages in Eagan
Real Estate and Mortgage Overview in Eagan
| Characteristic | Without Mortgage | With Mortgage |
| Housing Units | 5,753 | 13,664 |
| Median Property Value | $351,700 | $366,200 |
| Median Household Income | $97,946 | $6,034 |
| Monthly Housing Costs | $674 | $1,971 |
| Real Estate Taxes | $3,582 | $193 |
Property Value by Mortgage Status in Eagan
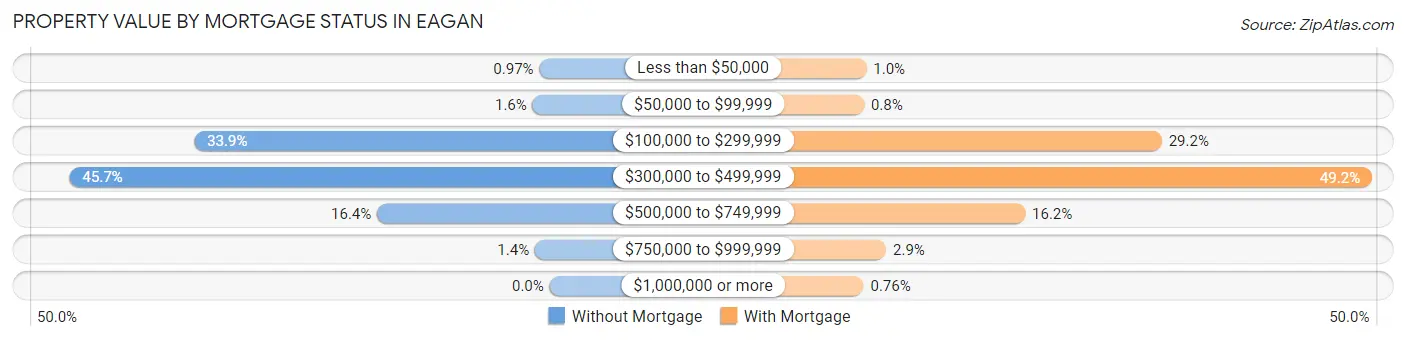
| Property Value | Without Mortgage | With Mortgage |
| Less than $50,000 | 56 (1.0%) | 141 (1.0%) |
| $50,000 to $99,999 | 93 (1.6%) | 109 (0.8%) |
| $100,000 to $299,999 | 1,948 (33.9%) | 3,985 (29.2%) |
| $300,000 to $499,999 | 2,631 (45.7%) | 6,720 (49.2%) |
| $500,000 to $749,999 | 945 (16.4%) | 2,207 (16.2%) |
| $750,000 to $999,999 | 80 (1.4%) | 398 (2.9%) |
| $1,000,000 or more | 0 (0.0%) | 104 (0.8%) |
| Total | 5,753 (100.0%) | 13,664 (100.0%) |
Household Income by Mortgage Status in Eagan
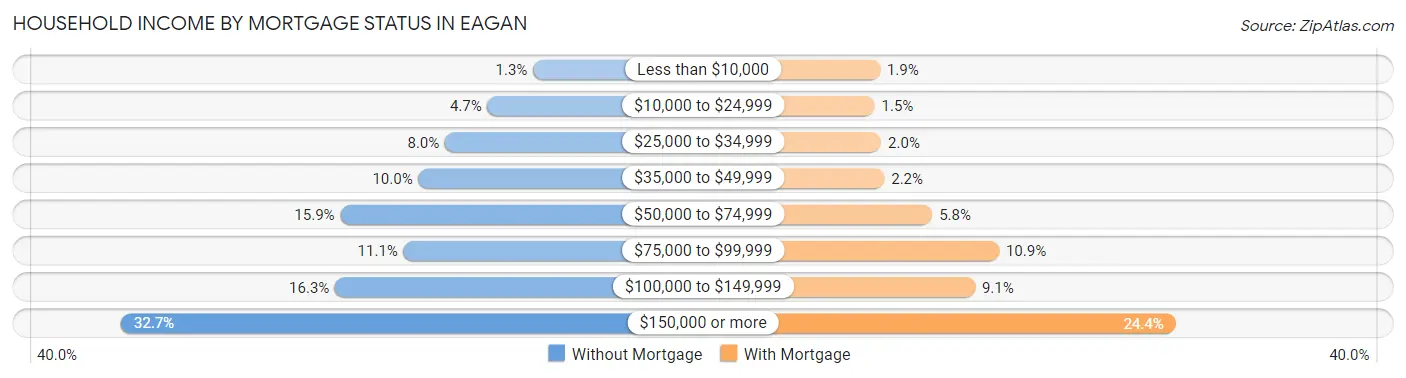
| Household Income | Without Mortgage | With Mortgage |
| Less than $10,000 | 72 (1.3%) | 254 (1.9%) |
| $10,000 to $24,999 | 272 (4.7%) | 198 (1.5%) |
| $25,000 to $34,999 | 458 (8.0%) | 266 (1.9%) |
| $35,000 to $49,999 | 575 (10.0%) | 299 (2.2%) |
| $50,000 to $74,999 | 917 (15.9%) | 798 (5.8%) |
| $75,000 to $99,999 | 640 (11.1%) | 1,493 (10.9%) |
| $100,000 to $149,999 | 940 (16.3%) | 1,243 (9.1%) |
| $150,000 or more | 1,879 (32.7%) | 3,333 (24.4%) |
| Total | 5,753 (100.0%) | 13,664 (100.0%) |
Property Value to Household Income Ratio in Eagan
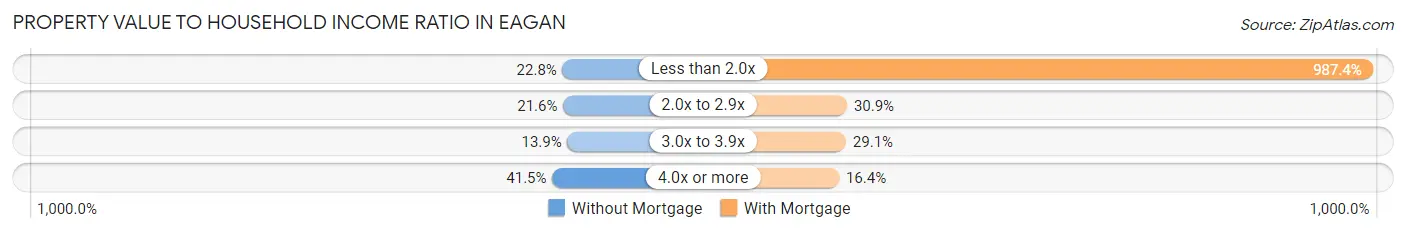
| Value-to-Income Ratio | Without Mortgage | With Mortgage |
| Less than 2.0x | 1,311 (22.8%) | 134,920 (987.4%) |
| 2.0x to 2.9x | 1,243 (21.6%) | 4,227 (30.9%) |
| 3.0x to 3.9x | 801 (13.9%) | 3,969 (29.0%) |
| 4.0x or more | 2,388 (41.5%) | 2,247 (16.4%) |
| Total | 5,753 (100.0%) | 13,664 (100.0%) |
Real Estate Taxes by Mortgage Status in Eagan
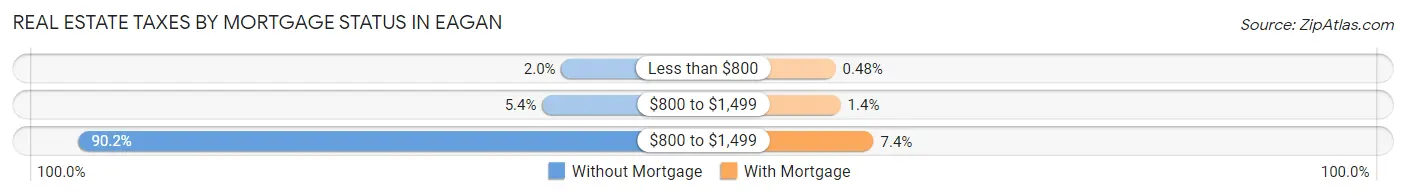
| Property Taxes | Without Mortgage | With Mortgage |
| Less than $800 | 112 (1.9%) | 66 (0.5%) |
| $800 to $1,499 | 313 (5.4%) | 190 (1.4%) |
| $800 to $1,499 | 5,187 (90.2%) | 1,011 (7.4%) |
| Total | 5,753 (100.0%) | 13,664 (100.0%) |
Health & Disability in Eagan
Health Insurance Coverage by Age in Eagan
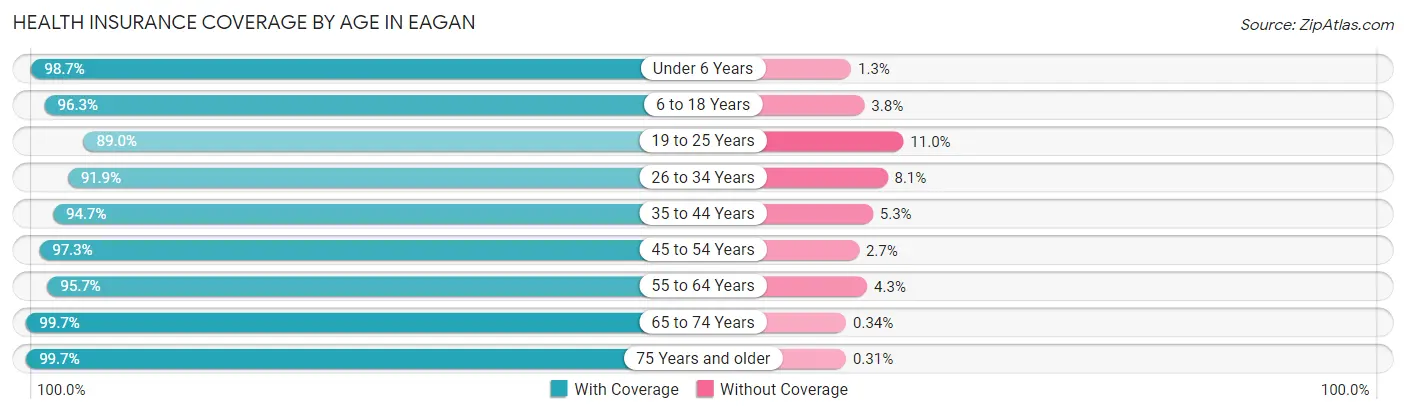
| Age Bracket | With Coverage | Without Coverage |
| Under 6 Years | 4,808 (98.7%) | 62 (1.3%) |
| 6 to 18 Years | 10,869 (96.3%) | 424 (3.7%) |
| 19 to 25 Years | 5,232 (89.0%) | 648 (11.0%) |
| 26 to 34 Years | 7,553 (91.9%) | 662 (8.1%) |
| 35 to 44 Years | 9,191 (94.7%) | 516 (5.3%) |
| 45 to 54 Years | 8,175 (97.3%) | 230 (2.7%) |
| 55 to 64 Years | 9,420 (95.7%) | 419 (4.3%) |
| 65 to 74 Years | 6,502 (99.7%) | 22 (0.3%) |
| 75 Years and older | 3,262 (99.7%) | 10 (0.3%) |
| Total | 65,012 (95.6%) | 2,993 (4.4%) |
Health Insurance Coverage by Citizenship Status in Eagan
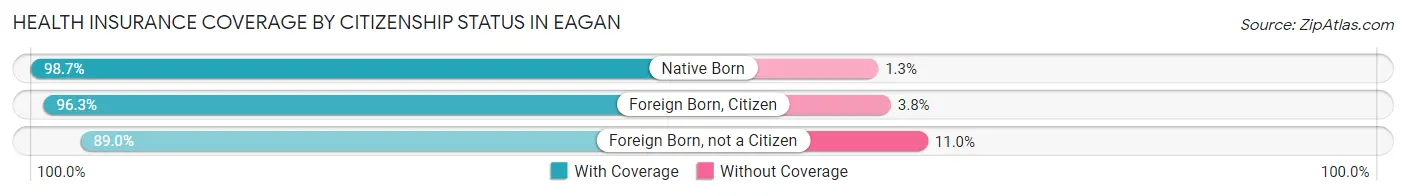
| Citizenship Status | With Coverage | Without Coverage |
| Native Born | 4,808 (98.7%) | 62 (1.3%) |
| Foreign Born, Citizen | 10,869 (96.3%) | 424 (3.7%) |
| Foreign Born, not a Citizen | 5,232 (89.0%) | 648 (11.0%) |
Health Insurance Coverage by Household Income in Eagan
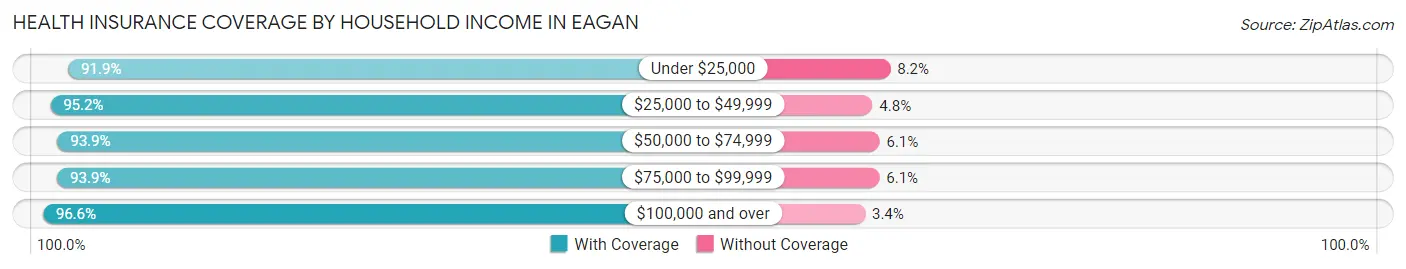
| Household Income | With Coverage | Without Coverage |
| Under $25,000 | 2,896 (91.8%) | 257 (8.2%) |
| $25,000 to $49,999 | 6,421 (95.2%) | 324 (4.8%) |
| $50,000 to $74,999 | 7,365 (93.9%) | 481 (6.1%) |
| $75,000 to $99,999 | 7,563 (93.9%) | 491 (6.1%) |
| $100,000 and over | 40,625 (96.6%) | 1,439 (3.4%) |
Public vs Private Health Insurance Coverage by Age in Eagan
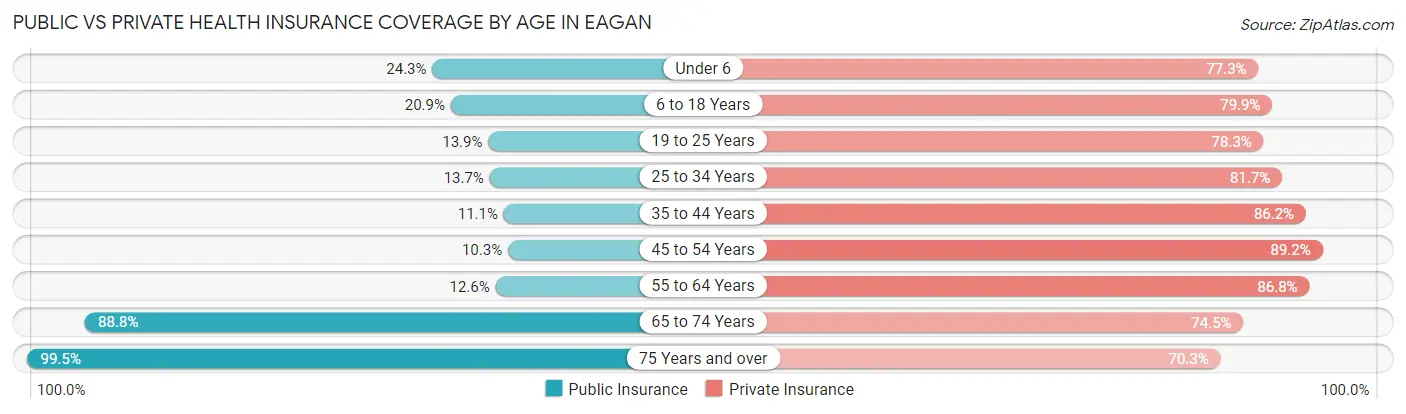
| Age Bracket | Public Insurance | Private Insurance |
| Under 6 | 1,184 (24.3%) | 3,766 (77.3%) |
| 6 to 18 Years | 2,359 (20.9%) | 9,023 (79.9%) |
| 19 to 25 Years | 819 (13.9%) | 4,604 (78.3%) |
| 25 to 34 Years | 1,123 (13.7%) | 6,714 (81.7%) |
| 35 to 44 Years | 1,074 (11.1%) | 8,363 (86.2%) |
| 45 to 54 Years | 864 (10.3%) | 7,500 (89.2%) |
| 55 to 64 Years | 1,238 (12.6%) | 8,540 (86.8%) |
| 65 to 74 Years | 5,791 (88.8%) | 4,863 (74.5%) |
| 75 Years and over | 3,254 (99.5%) | 2,300 (70.3%) |
| Total | 17,706 (26.0%) | 55,673 (81.9%) |
Disability Status by Sex by Age in Eagan
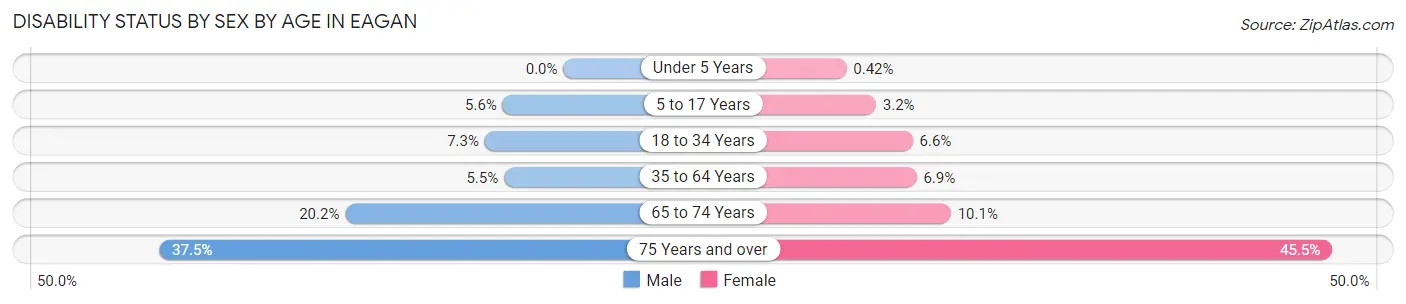
| Age Bracket | Male | Female |
| Under 5 Years | 0 (0.0%) | 8 (0.4%) |
| 5 to 17 Years | 335 (5.6%) | 177 (3.2%) |
| 18 to 34 Years | 537 (7.3%) | 487 (6.6%) |
| 35 to 64 Years | 772 (5.5%) | 963 (6.9%) |
| 65 to 74 Years | 612 (20.2%) | 354 (10.1%) |
| 75 Years and over | 497 (37.5%) | 886 (45.5%) |
Disability Class by Sex by Age in Eagan
Disability Class: Hearing Difficulty
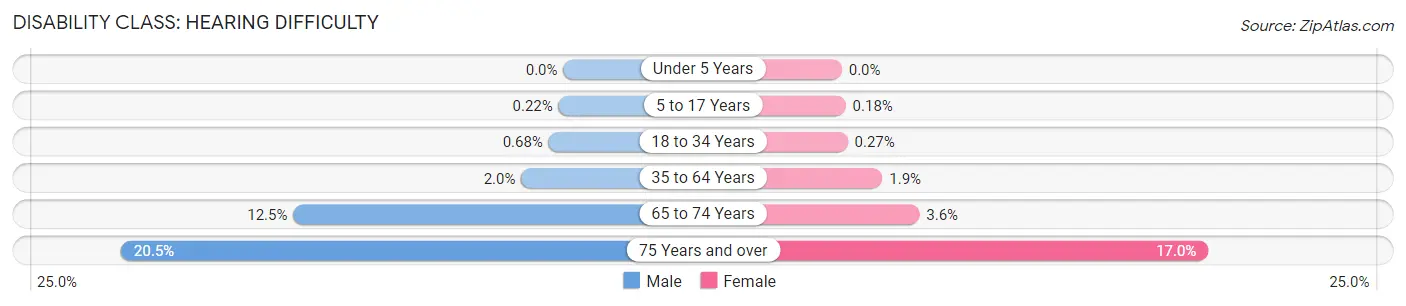
| Age Bracket | Male | Female |
| Under 5 Years | 0 (0.0%) | 0 (0.0%) |
| 5 to 17 Years | 13 (0.2%) | 10 (0.2%) |
| 18 to 34 Years | 50 (0.7%) | 20 (0.3%) |
| 35 to 64 Years | 274 (1.9%) | 261 (1.9%) |
| 65 to 74 Years | 379 (12.5%) | 126 (3.6%) |
| 75 Years and over | 272 (20.5%) | 331 (17.0%) |
Disability Class: Vision Difficulty
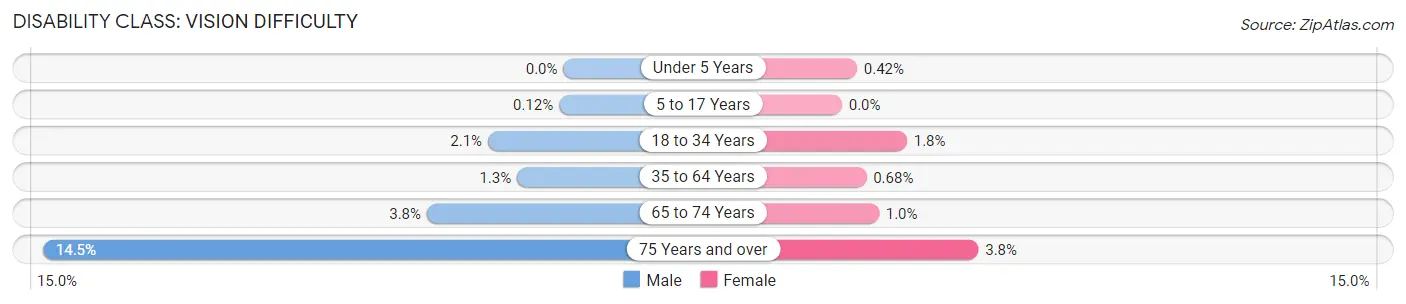
| Age Bracket | Male | Female |
| Under 5 Years | 0 (0.0%) | 8 (0.4%) |
| 5 to 17 Years | 7 (0.1%) | 0 (0.0%) |
| 18 to 34 Years | 155 (2.1%) | 134 (1.8%) |
| 35 to 64 Years | 181 (1.3%) | 95 (0.7%) |
| 65 to 74 Years | 115 (3.8%) | 36 (1.0%) |
| 75 Years and over | 192 (14.5%) | 74 (3.8%) |
Disability Class: Cognitive Difficulty
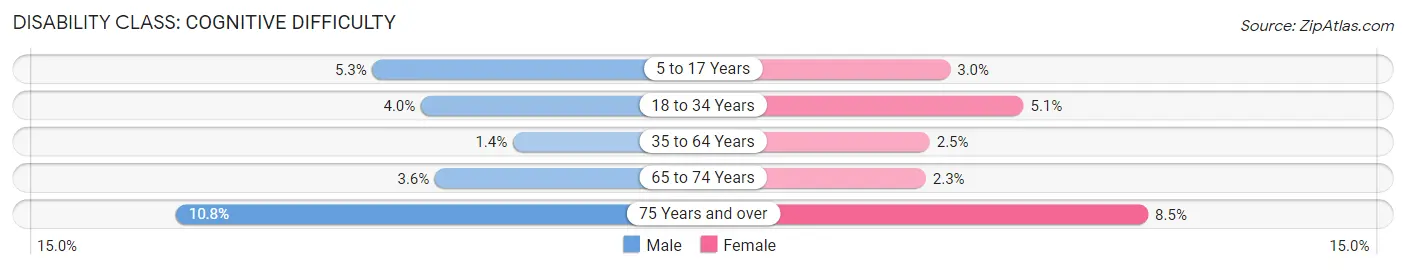
| Age Bracket | Male | Female |
| 5 to 17 Years | 316 (5.3%) | 169 (3.0%) |
| 18 to 34 Years | 292 (4.0%) | 375 (5.1%) |
| 35 to 64 Years | 196 (1.4%) | 340 (2.5%) |
| 65 to 74 Years | 108 (3.6%) | 82 (2.3%) |
| 75 Years and over | 143 (10.8%) | 166 (8.5%) |
Disability Class: Ambulatory Difficulty
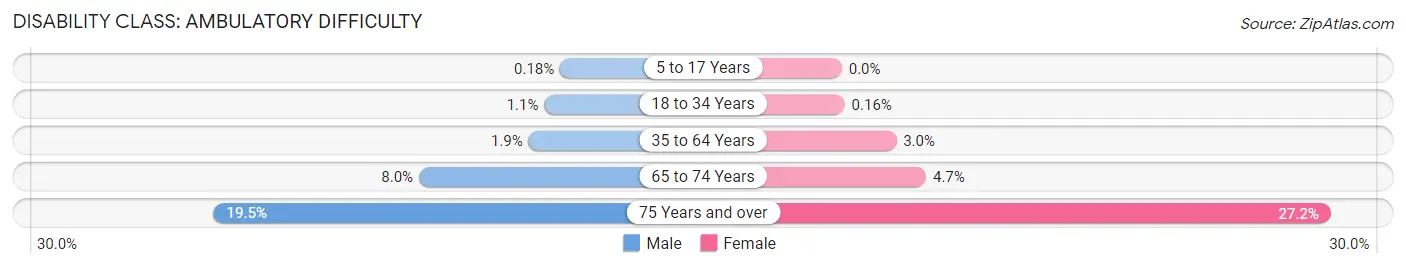
| Age Bracket | Male | Female |
| 5 to 17 Years | 11 (0.2%) | 0 (0.0%) |
| 18 to 34 Years | 78 (1.1%) | 12 (0.2%) |
| 35 to 64 Years | 273 (1.9%) | 422 (3.0%) |
| 65 to 74 Years | 243 (8.0%) | 164 (4.7%) |
| 75 Years and over | 258 (19.5%) | 530 (27.2%) |
Disability Class: Self-Care Difficulty
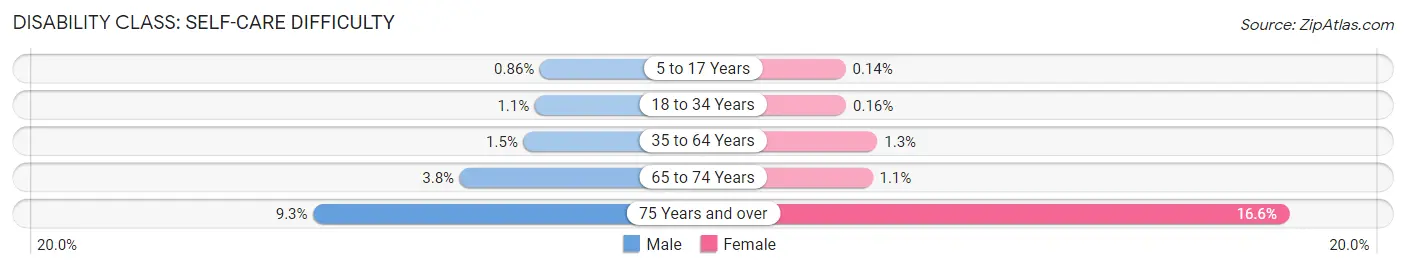
| Age Bracket | Male | Female |
| 5 to 17 Years | 51 (0.9%) | 8 (0.1%) |
| 18 to 34 Years | 77 (1.1%) | 12 (0.2%) |
| 35 to 64 Years | 206 (1.5%) | 183 (1.3%) |
| 65 to 74 Years | 116 (3.8%) | 40 (1.1%) |
| 75 Years and over | 123 (9.3%) | 323 (16.6%) |
Technology Access in Eagan
Computing Device Access in Eagan
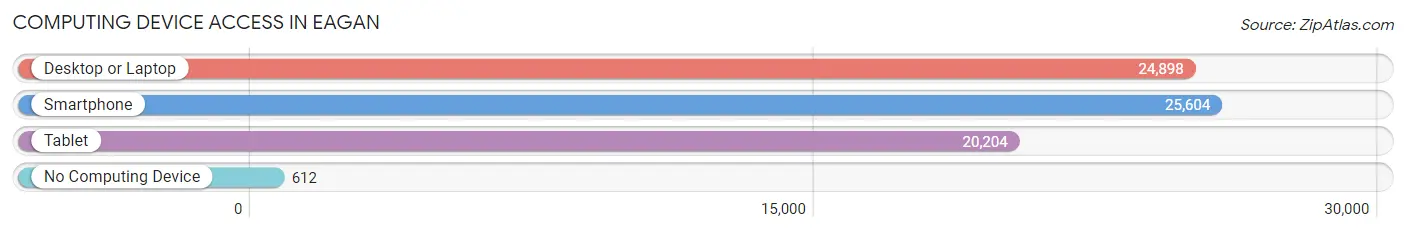
| Device Type | # Households | % Households |
| Desktop or Laptop | 24,898 | 90.1% |
| Smartphone | 25,604 | 92.7% |
| Tablet | 20,204 | 73.1% |
| No Computing Device | 612 | 2.2% |
| Total | 27,628 | 100.0% |
Internet Access in Eagan
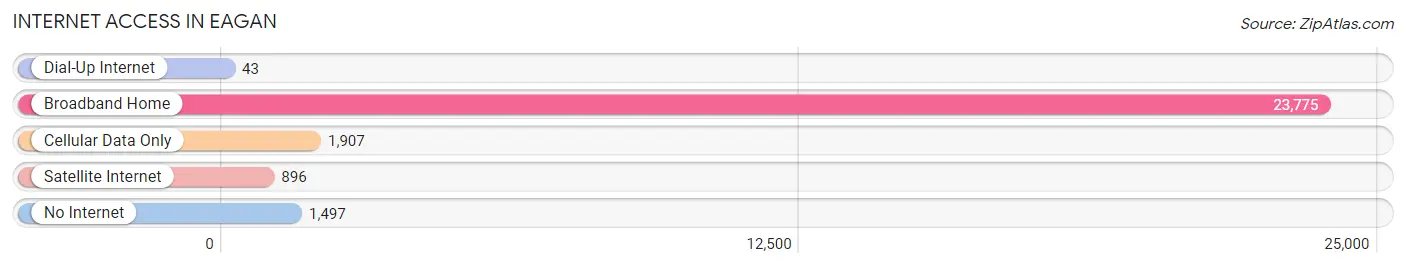
| Internet Type | # Households | % Households |
| Dial-Up Internet | 43 | 0.2% |
| Broadband Home | 23,775 | 86.1% |
| Cellular Data Only | 1,907 | 6.9% |
| Satellite Internet | 896 | 3.2% |
| No Internet | 1,497 | 5.4% |
| Total | 27,628 | 100.0% |
Eagan Summary
Eagan, Minnesota is a city located in the Twin Cities metropolitan area of Minnesota. It is located in Dakota County and is a suburb of both Minneapolis and St. Paul. The city is situated on the south bank of the Minnesota River and is bordered by the cities of Mendota Heights, Apple Valley, Burnsville, and Inver Grove Heights. As of the 2010 census, the population of Eagan was 64,206, making it the eighth largest city in Minnesota.
History
The area that is now Eagan was first settled in the early 1800s by Irish immigrants. The first settlers were Patrick Byrne and his family, who arrived in 1844. The Byrne family established a farm and a small village, which was known as the Village of Eagan. The village was named after Patrick Byrne's father, Thomas Eagan.
In the late 1800s, the village began to grow and develop. The first school was built in 1856, and the first post office was established in 1858. The village was incorporated in 1960, and the city of Eagan was officially established in 1974.
Geography
Eagan is located in the southeastern part of Minnesota, in Dakota County. It is situated on the south bank of the Minnesota River, and is bordered by the cities of Mendota Heights, Apple Valley, Burnsville, and Inver Grove Heights. The city covers an area of 33.2 square miles, and has a population density of 1,919 people per square mile.
The terrain of Eagan is mostly flat, with some rolling hills in the northern and western parts of the city. The city is located in the Minnesota River Valley, and is surrounded by several lakes, including Long Lake, Lake Owasso, and Lake McCarrons.
Economy
Eagan is home to several major employers, including Thomson Reuters, Blue Cross Blue Shield of Minnesota, and the Minnesota Vikings. The city is also home to several large shopping centers, including the Twin Cities Premium Outlets, the Eagan Outlet Mall, and the Eagan Town Center.
The city's economy is largely based on the service industry, with many residents employed in retail, healthcare, and hospitality. The city is also home to several technology companies, including 3M, IBM, and Microsoft.
Demographics
As of the 2010 census, the population of Eagan was 64,206. The racial makeup of the city was 79.2% White, 8.2% African American, 0.4% Native American, 8.2% Asian, 0.1% Pacific Islander, and 3.9% from other races. The median household income was $76,845, and the median family income was $90,945.
The city is home to a large number of immigrants, with over 20% of the population being foreign-born. The largest immigrant groups are from Mexico, India, and Somalia. The city also has a large population of college-educated residents, with over 50% of the population having a bachelor's degree or higher.
Common Questions
What is Per Capita Income in Eagan?
Per Capita income in Eagan is $54,238.
What is the Median Family Income in Eagan?
Median Family Income in Eagan is $133,083.
What is the Median Household income in Eagan?
Median Household Income in Eagan is $104,101.
What is Income or Wage Gap in Eagan?
Income or Wage Gap in Eagan is 31.8%.
Women in Eagan earn 68.2 cents for every dollar earned by a man.
What is Family Income Deficit in Eagan?
Family Income Deficit in Eagan is $11,700.
Families that are below poverty line in Eagan earn $11,700 less on average than the poverty threshold level.
What is Inequality or Gini Index in Eagan?
Inequality or Gini Index in Eagan is 0.42.
What is the Total Population of Eagan?
Total Population of Eagan is 68,262.
What is the Total Male Population of Eagan?
Total Male Population of Eagan is 33,865.
What is the Total Female Population of Eagan?
Total Female Population of Eagan is 34,397.
What is the Ratio of Males per 100 Females in Eagan?
There are 98.45 Males per 100 Females in Eagan.
What is the Ratio of Females per 100 Males in Eagan?
There are 101.57 Females per 100 Males in Eagan.
What is the Median Population Age in Eagan?
Median Population Age in Eagan is 38.7 Years.
What is the Average Family Size in Eagan
Average Family Size in Eagan is 3.0 People.
What is the Average Household Size in Eagan
Average Household Size in Eagan is 2.5 People.
How Large is the Labor Force in Eagan?
There are 40,772 People in the Labor Forcein in Eagan.
What is the Percentage of People in the Labor Force in Eagan?
74.5% of People are in the Labor Force in Eagan.
What is the Unemployment Rate in Eagan?
Unemployment Rate in Eagan is 4.1%.