Rogers, AR Map & Demographics
Rogers Map
Rogers Overview
$41,623
PER CAPITA INCOME
$88,432
AVG FAMILY INCOME
$78,075
AVG HOUSEHOLD INCOME
29.2%
WAGE / INCOME GAP [ % ]
70.8¢/ $1
WAGE / INCOME GAP [ $ ]
$12,963
FAMILY INCOME DEFICIT
0.48
INEQUALITY / GINI INDEX
69,961
TOTAL POPULATION
34,563
MALE POPULATION
35,398
FEMALE POPULATION
97.64
MALES / 100 FEMALES
102.42
FEMALES / 100 MALES
33.4
MEDIAN AGE
3.4
AVG FAMILY SIZE
2.8
AVG HOUSEHOLD SIZE
37,484
LABOR FORCE [ PEOPLE ]
70.4%
PERCENT IN LABOR FORCE
2.9%
UNEMPLOYMENT RATE
Rogers Area Codes
Income in Rogers
Income Overview in Rogers
Per Capita Income in Rogers is $41,623, while median incomes of families and households are $88,432 and $78,075 respectively.
| Characteristic | Number | Measure |
| Per Capita Income | 69,961 | $41,623 |
| Median Family Income | 17,691 | $88,432 |
| Mean Family Income | 17,691 | $129,933 |
| Median Household Income | 24,752 | $78,075 |
| Mean Household Income | 24,752 | $113,086 |
| Income Deficit | 17,691 | $12,963 |
| Wage / Income Gap (%) | 69,961 | 29.18% |
| Wage / Income Gap ($) | 69,961 | 70.82¢ per $1 |
| Gini / Inequality Index | 69,961 | 0.48 |
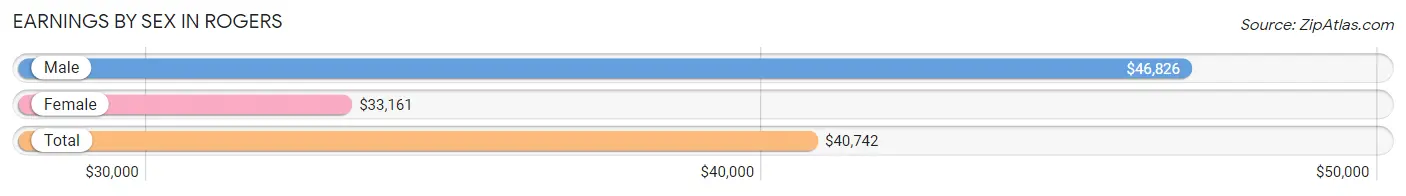
Earnings by Sex in Rogers
Average Earnings in Rogers are $40,742, $46,826 for men and $33,161 for women, a difference of 29.2%.
| Sex | Number | Average Earnings |
| Male | 20,334 (53.0%) | $46,826 |
| Female | 17,994 (46.9%) | $33,161 |
| Total | 38,328 (100.0%) | $40,742 |
Earnings by Sex by Income Bracket in Rogers
The most common earnings brackets in Rogers are $100,000+ for men (4,167 | 20.5%) and $25,000 to $29,999 for women (2,033 | 11.3%).
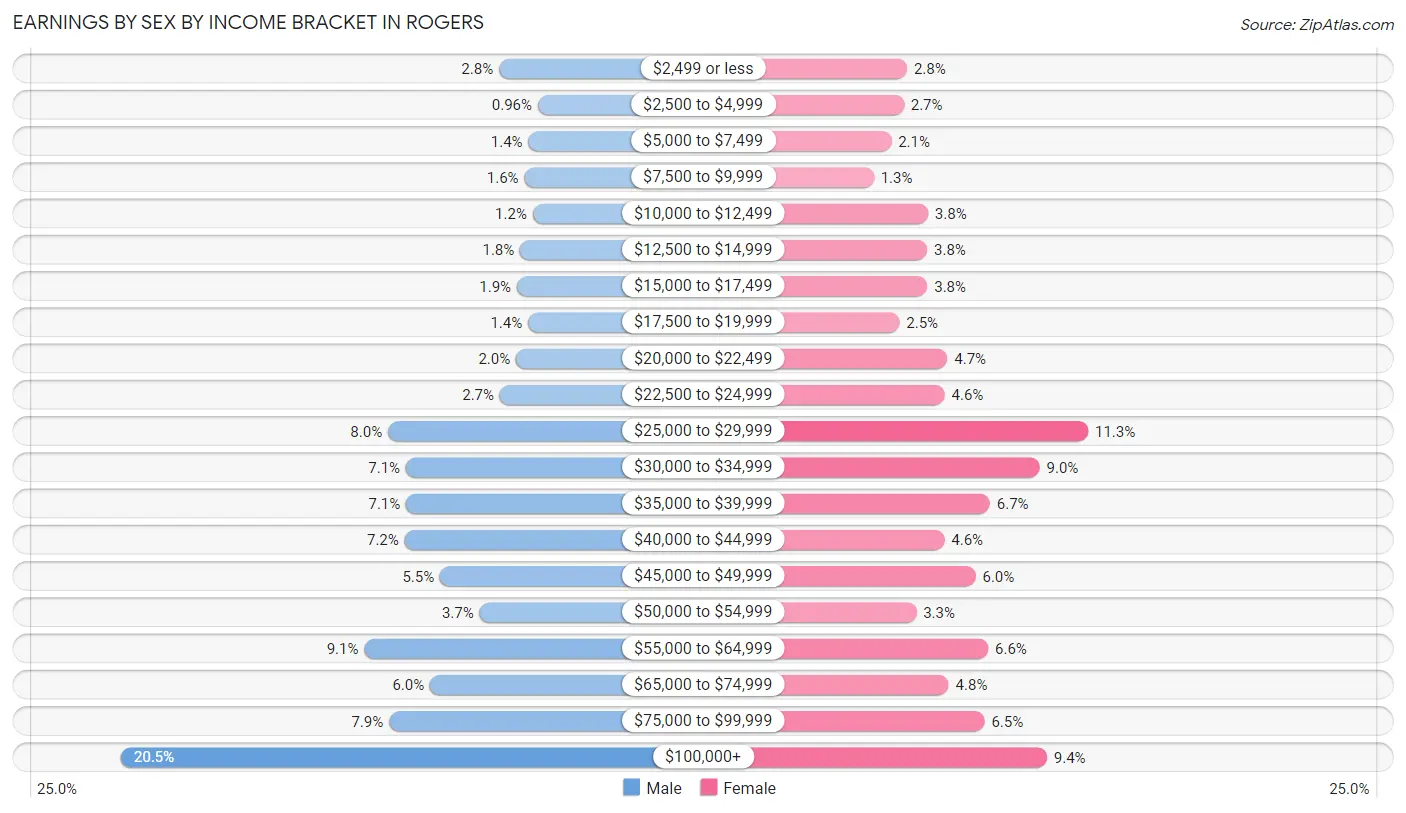
| Income | Male | Female |
| $2,499 or less | 565 (2.8%) | 507 (2.8%) |
| $2,500 to $4,999 | 196 (1.0%) | 481 (2.7%) |
| $5,000 to $7,499 | 284 (1.4%) | 375 (2.1%) |
| $7,500 to $9,999 | 324 (1.6%) | 227 (1.3%) |
| $10,000 to $12,499 | 243 (1.2%) | 683 (3.8%) |
| $12,500 to $14,999 | 363 (1.8%) | 677 (3.8%) |
| $15,000 to $17,499 | 394 (1.9%) | 678 (3.8%) |
| $17,500 to $19,999 | 288 (1.4%) | 443 (2.5%) |
| $20,000 to $22,499 | 403 (2.0%) | 847 (4.7%) |
| $22,500 to $24,999 | 557 (2.7%) | 825 (4.6%) |
| $25,000 to $29,999 | 1,623 (8.0%) | 2,033 (11.3%) |
| $30,000 to $34,999 | 1,451 (7.1%) | 1,624 (9.0%) |
| $35,000 to $39,999 | 1,450 (7.1%) | 1,205 (6.7%) |
| $40,000 to $44,999 | 1,465 (7.2%) | 822 (4.6%) |
| $45,000 to $49,999 | 1,127 (5.5%) | 1,085 (6.0%) |
| $50,000 to $54,999 | 751 (3.7%) | 585 (3.3%) |
| $55,000 to $64,999 | 1,848 (9.1%) | 1,191 (6.6%) |
| $65,000 to $74,999 | 1,223 (6.0%) | 859 (4.8%) |
| $75,000 to $99,999 | 1,612 (7.9%) | 1,161 (6.5%) |
| $100,000+ | 4,167 (20.5%) | 1,686 (9.4%) |
| Total | 20,334 (100.0%) | 17,994 (100.0%) |
Earnings by Sex by Educational Attainment in Rogers
Average earnings in Rogers are $54,552 for men and $37,631 for women, a difference of 31.0%. Men with an educational attainment of graduate degree enjoy the highest average annual earnings of $106,921, while those with less than high school education earn the least with $37,696. Women with an educational attainment of graduate degree earn the most with the average annual earnings of $72,301, while those with less than high school education have the smallest earnings of $27,222.
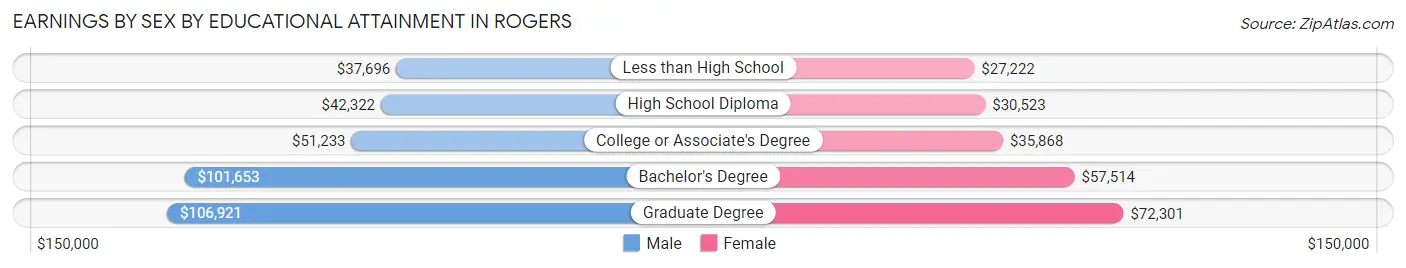
| Educational Attainment | Male Income | Female Income |
| Less than High School | $37,696 | $27,222 |
| High School Diploma | $42,322 | $30,523 |
| College or Associate's Degree | $51,233 | $35,868 |
| Bachelor's Degree | $101,653 | $57,514 |
| Graduate Degree | $106,921 | $72,301 |
| Total | $54,552 | $37,631 |
Family Income in Rogers
Family Income Brackets in Rogers
According to the Rogers family income data, there are 2,972 families falling into the $100,000 to $149,999 income range, which is the most common income bracket and makes up 16.8% of all families. Conversely, the $10,000 to $14,999 income bracket is the least frequent group with only 283 families (1.6%) belonging to this category.
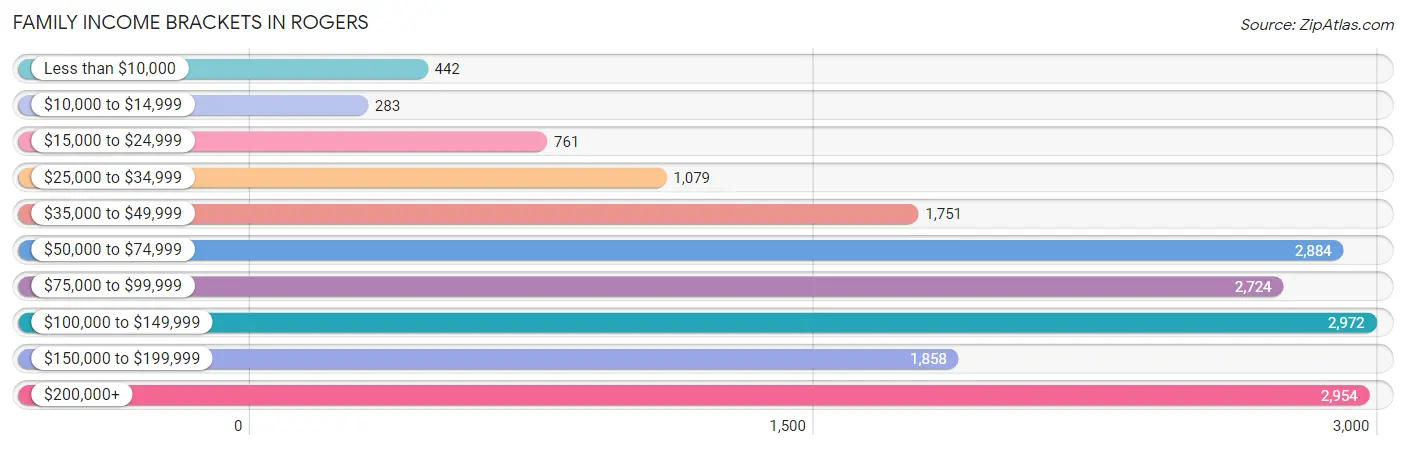
| Income Bracket | # Families | % Families |
| Less than $10,000 | 442 | 2.5% |
| $10,000 to $14,999 | 283 | 1.6% |
| $15,000 to $24,999 | 761 | 4.3% |
| $25,000 to $34,999 | 1,079 | 6.1% |
| $35,000 to $49,999 | 1,751 | 9.9% |
| $50,000 to $74,999 | 2,884 | 16.3% |
| $75,000 to $99,999 | 2,724 | 15.4% |
| $100,000 to $149,999 | 2,972 | 16.8% |
| $150,000 to $199,999 | 1,858 | 10.5% |
| $200,000+ | 2,954 | 16.7% |
Family Income by Famaliy Size in Rogers
4-person families (3,796 | 21.5%) account for the highest median family income in Rogers with $106,780 per family, while 2-person families (6,959 | 39.3%) have the highest median income of $40,850 per family member.
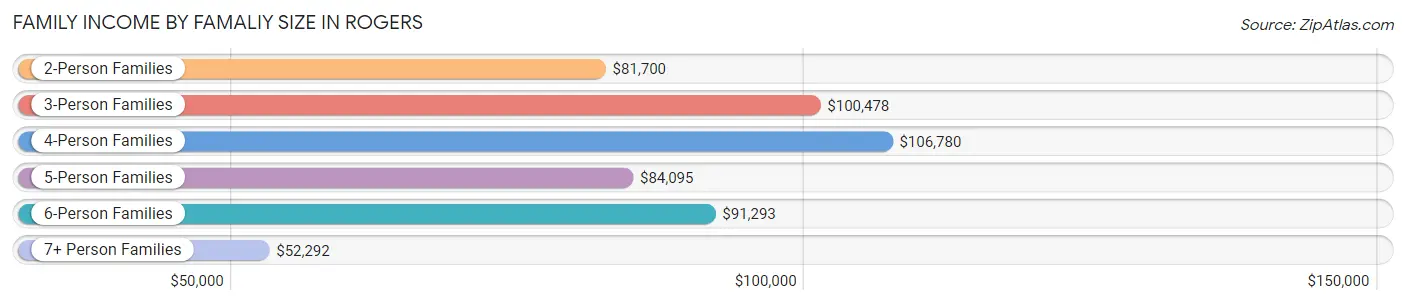
| Income Bracket | # Families | Median Income |
| 2-Person Families | 6,959 (39.3%) | $81,700 |
| 3-Person Families | 3,591 (20.3%) | $100,478 |
| 4-Person Families | 3,796 (21.5%) | $106,780 |
| 5-Person Families | 1,615 (9.1%) | $84,095 |
| 6-Person Families | 1,066 (6.0%) | $91,293 |
| 7+ Person Families | 664 (3.7%) | $52,292 |
| Total | 17,691 (100.0%) | $88,432 |
Family Income by Number of Earners in Rogers
The median family income in Rogers is $88,432, with families comprising 3+ earners (2,295) having the highest median family income of $140,055, while families with no earners (1,671) have the lowest median family income of $45,141, accounting for 13.0% and 9.5% of families, respectively.
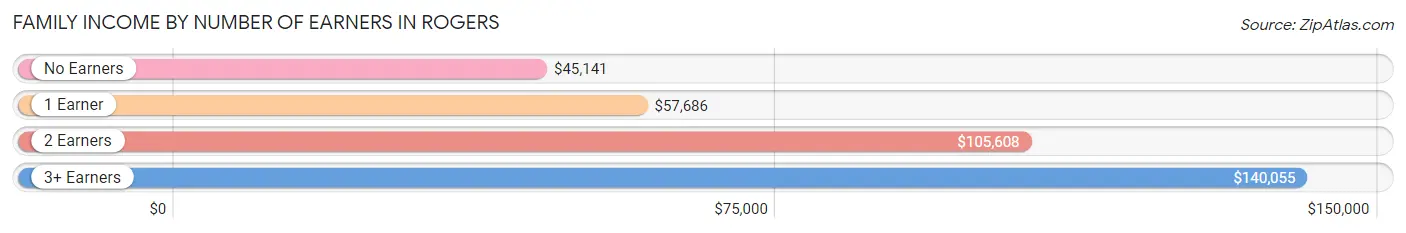
| Number of Earners | # Families | Median Income |
| No Earners | 1,671 (9.5%) | $45,141 |
| 1 Earner | 5,620 (31.8%) | $57,686 |
| 2 Earners | 8,105 (45.8%) | $105,608 |
| 3+ Earners | 2,295 (13.0%) | $140,055 |
| Total | 17,691 (100.0%) | $88,432 |
Household Income in Rogers
Household Income Brackets in Rogers
With 4,480 households falling in the category, the $50,000 to $74,999 income range is the most frequent in Rogers, accounting for 18.1% of all households. In contrast, only 594 households (2.4%) fall into the less than $10,000 income bracket, making it the least populous group.
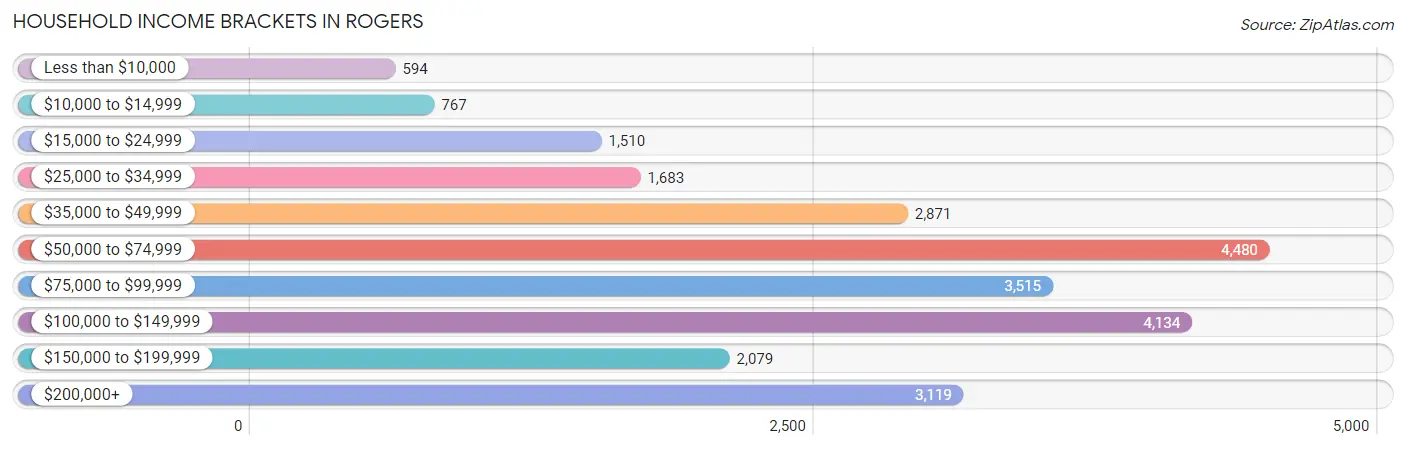
| Income Bracket | # Households | % Households |
| Less than $10,000 | 594 | 2.4% |
| $10,000 to $14,999 | 767 | 3.1% |
| $15,000 to $24,999 | 1,510 | 6.1% |
| $25,000 to $34,999 | 1,683 | 6.8% |
| $35,000 to $49,999 | 2,871 | 11.6% |
| $50,000 to $74,999 | 4,480 | 18.1% |
| $75,000 to $99,999 | 3,515 | 14.2% |
| $100,000 to $149,999 | 4,134 | 16.7% |
| $150,000 to $199,999 | 2,079 | 8.4% |
| $200,000+ | 3,119 | 12.6% |
Household Income by Householder Age in Rogers
The median household income in Rogers is $78,075, with the highest median household income of $96,770 found in the 45 to 64 years age bracket for the primary householder. A total of 9,336 households (37.7%) fall into this category. Meanwhile, the 15 to 24 years age bracket for the primary householder has the lowest median household income of $49,970, with 1,122 households (4.5%) in this group.
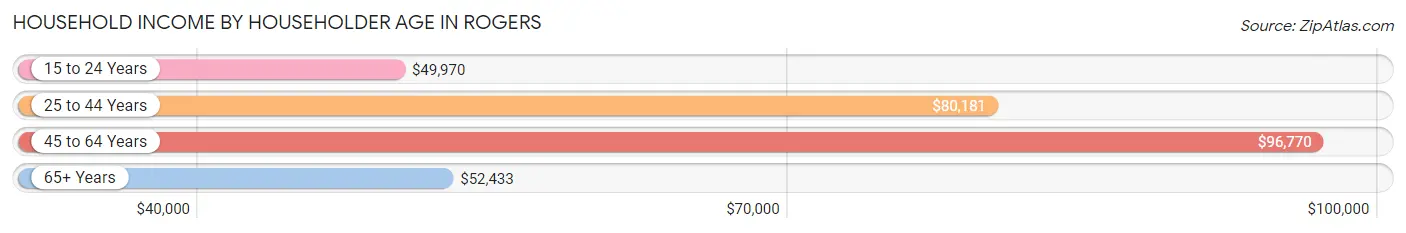
| Income Bracket | # Households | Median Income |
| 15 to 24 Years | 1,122 (4.5%) | $49,970 |
| 25 to 44 Years | 9,898 (40.0%) | $80,181 |
| 45 to 64 Years | 9,336 (37.7%) | $96,770 |
| 65+ Years | 4,396 (17.8%) | $52,433 |
| Total | 24,752 (100.0%) | $78,075 |
Poverty in Rogers
Income Below Poverty by Sex and Age in Rogers
With 10.0% poverty level for males and 11.1% for females among the residents of Rogers, 5 year old males and under 5 year old females are the most vulnerable to poverty, with 152 males (31.0%) and 715 females (29.1%) in their respective age groups living below the poverty level.
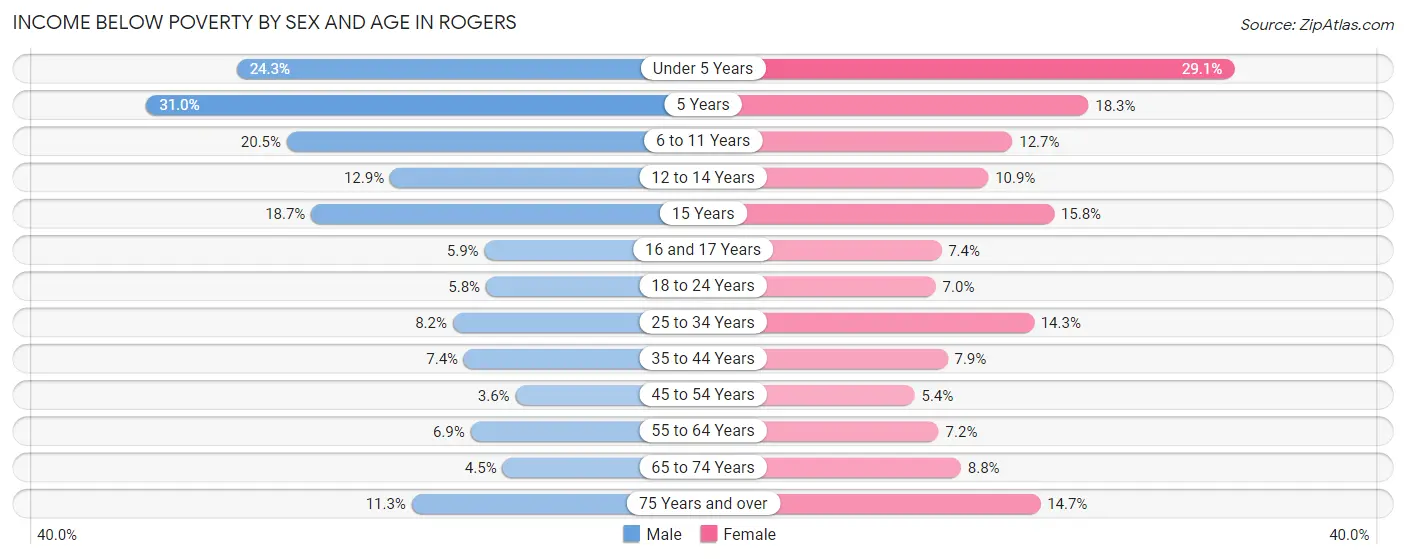
| Age Bracket | Male | Female |
| Under 5 Years | 590 (24.2%) | 715 (29.1%) |
| 5 Years | 152 (31.0%) | 86 (18.3%) |
| 6 to 11 Years | 713 (20.5%) | 394 (12.7%) |
| 12 to 14 Years | 195 (12.9%) | 173 (10.9%) |
| 15 Years | 82 (18.7%) | 89 (15.8%) |
| 16 and 17 Years | 59 (5.9%) | 67 (7.4%) |
| 18 to 24 Years | 189 (5.8%) | 244 (7.0%) |
| 25 to 34 Years | 468 (8.2%) | 752 (14.2%) |
| 35 to 44 Years | 360 (7.4%) | 384 (7.9%) |
| 45 to 54 Years | 167 (3.6%) | 239 (5.4%) |
| 55 to 64 Years | 234 (6.9%) | 258 (7.2%) |
| 65 to 74 Years | 72 (4.5%) | 217 (8.8%) |
| 75 Years and over | 145 (11.3%) | 273 (14.7%) |
| Total | 3,426 (10.0%) | 3,891 (11.1%) |
Income Above Poverty by Sex and Age in Rogers
According to the poverty statistics in Rogers, males aged 45 to 54 years and females aged 45 to 54 years are the age groups that are most secure financially, with 96.4% of males and 94.6% of females in these age groups living above the poverty line.
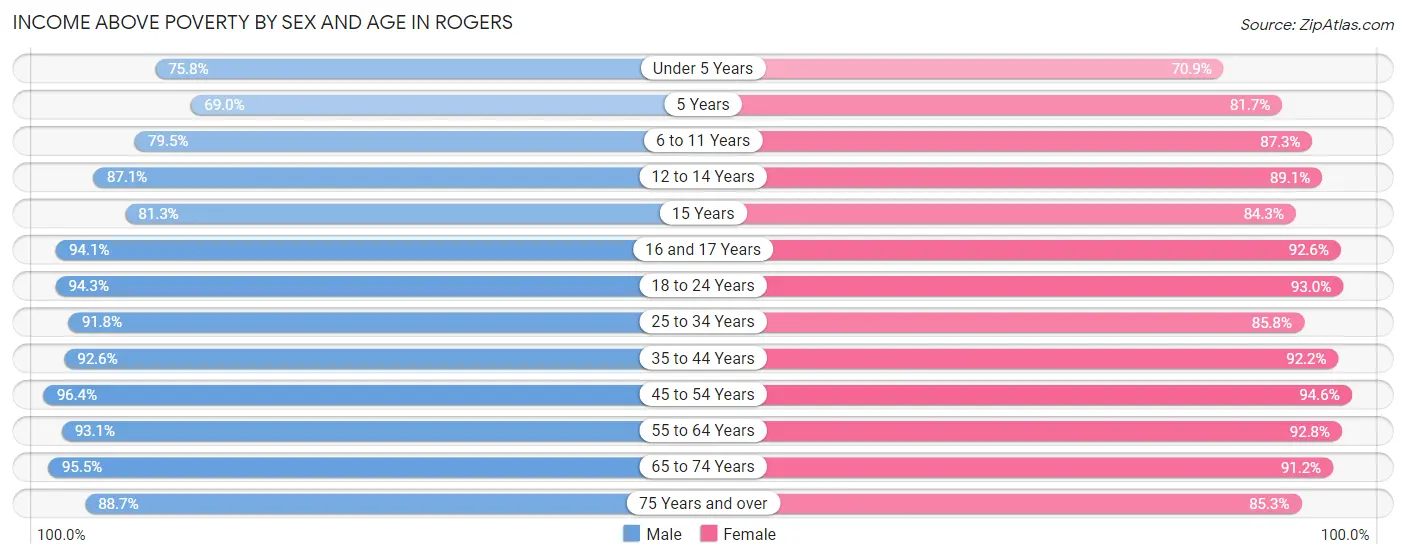
| Age Bracket | Male | Female |
| Under 5 Years | 1,843 (75.7%) | 1,740 (70.9%) |
| 5 Years | 339 (69.0%) | 384 (81.7%) |
| 6 to 11 Years | 2,760 (79.5%) | 2,718 (87.3%) |
| 12 to 14 Years | 1,320 (87.1%) | 1,418 (89.1%) |
| 15 Years | 356 (81.3%) | 476 (84.3%) |
| 16 and 17 Years | 947 (94.1%) | 841 (92.6%) |
| 18 to 24 Years | 3,097 (94.3%) | 3,258 (93.0%) |
| 25 to 34 Years | 5,234 (91.8%) | 4,526 (85.8%) |
| 35 to 44 Years | 4,515 (92.6%) | 4,507 (92.1%) |
| 45 to 54 Years | 4,528 (96.4%) | 4,185 (94.6%) |
| 55 to 64 Years | 3,161 (93.1%) | 3,331 (92.8%) |
| 65 to 74 Years | 1,522 (95.5%) | 2,237 (91.2%) |
| 75 Years and over | 1,143 (88.7%) | 1,580 (85.3%) |
| Total | 30,765 (90.0%) | 31,201 (88.9%) |
Income Below Poverty Among Married-Couple Families in Rogers
The poverty statistics for married-couple families in Rogers show that 6.1% or 810 of the total 13,304 families live below the poverty line. Families with 3 or 4 children have the highest poverty rate of 22.9%, comprising of 340 families. On the other hand, families with no children have the lowest poverty rate of 3.0%, which includes 190 families.
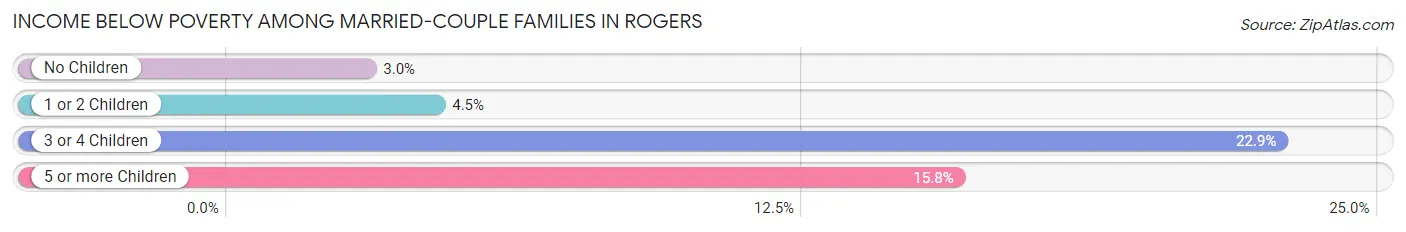
| Children | Above Poverty | Below Poverty |
| No Children | 6,112 (97.0%) | 190 (3.0%) |
| 1 or 2 Children | 5,000 (95.5%) | 236 (4.5%) |
| 3 or 4 Children | 1,148 (77.1%) | 340 (22.9%) |
| 5 or more Children | 234 (84.2%) | 44 (15.8%) |
| Total | 12,494 (93.9%) | 810 (6.1%) |
Income Below Poverty Among Single-Parent Households in Rogers
According to the poverty data in Rogers, 18.7% or 277 single-father households and 16.9% or 492 single-mother households are living below the poverty line. Among single-father households, those with 5 or more children have the highest poverty rate, with 158 households (100.0%) experiencing poverty. Likewise, among single-mother households, those with 5 or more children have the highest poverty rate, with 85 households (72.0%) falling below the poverty line.
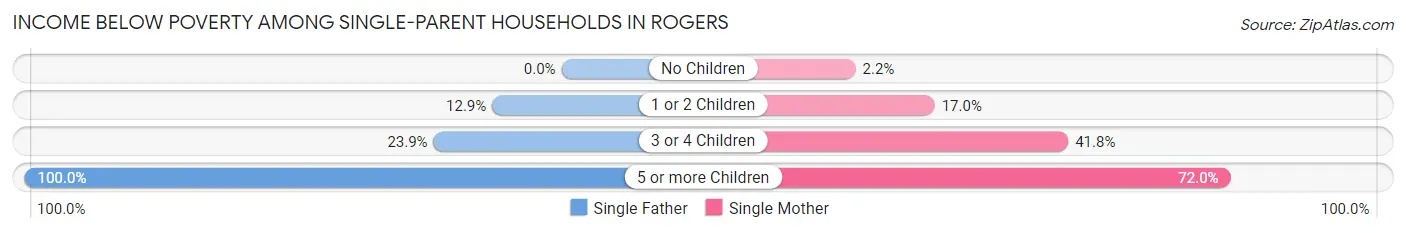
| Children | Single Father | Single Mother |
| No Children | 0 (0.0%) | 23 (2.2%) |
| 1 or 2 Children | 88 (12.9%) | 238 (17.0%) |
| 3 or 4 Children | 31 (23.8%) | 146 (41.8%) |
| 5 or more Children | 158 (100.0%) | 85 (72.0%) |
| Total | 277 (18.7%) | 492 (16.9%) |
Income Below Poverty Among Married-Couple vs Single-Parent Households in Rogers
The poverty data for Rogers shows that 810 of the married-couple family households (6.1%) and 769 of the single-parent households (17.5%) are living below the poverty level. Within the married-couple family households, those with 3 or 4 children have the highest poverty rate, with 340 households (22.9%) falling below the poverty line. Among the single-parent households, those with 5 or more children have the highest poverty rate, with 243 household (88.0%) living below poverty.
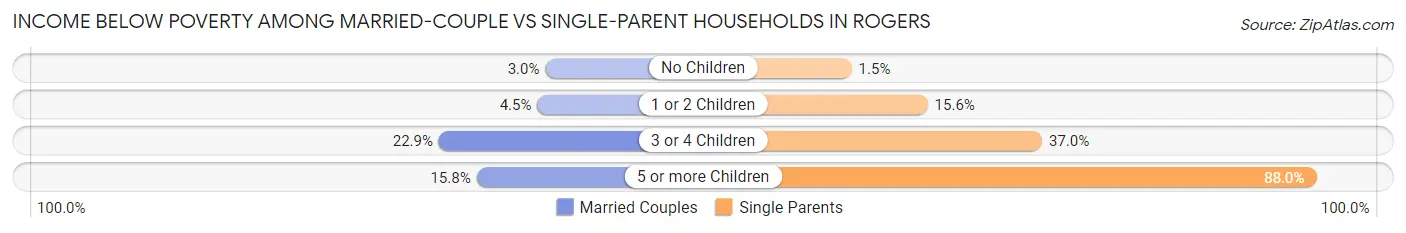
| Children | Married-Couple Families | Single-Parent Households |
| No Children | 190 (3.0%) | 23 (1.5%) |
| 1 or 2 Children | 236 (4.5%) | 326 (15.6%) |
| 3 or 4 Children | 340 (22.9%) | 177 (36.9%) |
| 5 or more Children | 44 (15.8%) | 243 (88.0%) |
| Total | 810 (6.1%) | 769 (17.5%) |
Race in Rogers
The most populous races in Rogers are White / Caucasian (48,519 | 69.4%), Hispanic or Latino (22,785 | 32.6%), and Two or more Races (13,398 | 19.2%).
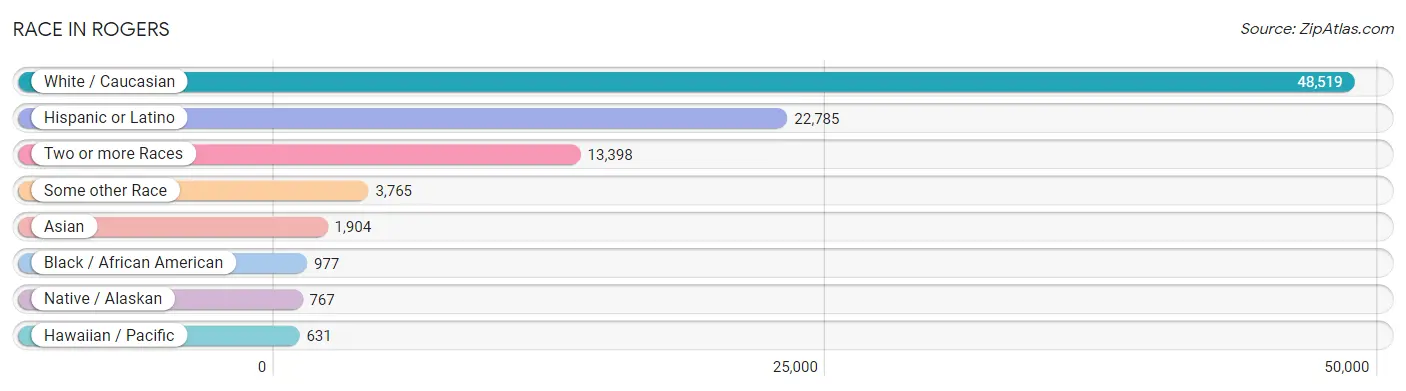
| Race | # Population | % Population |
| Asian | 1,904 | 2.7% |
| Black / African American | 977 | 1.4% |
| Hawaiian / Pacific | 631 | 0.9% |
| Hispanic or Latino | 22,785 | 32.6% |
| Native / Alaskan | 767 | 1.1% |
| White / Caucasian | 48,519 | 69.4% |
| Two or more Races | 13,398 | 19.2% |
| Some other Race | 3,765 | 5.4% |
| Total | 69,961 | 100.0% |
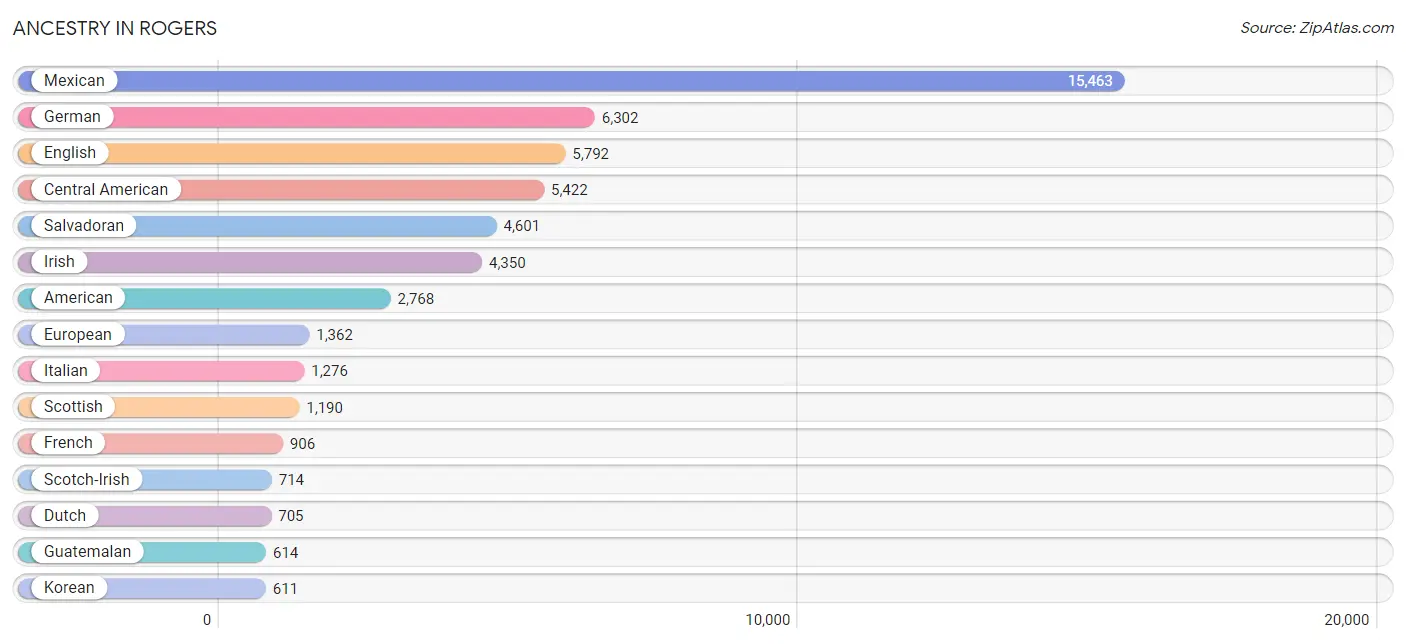
Ancestry in Rogers
The most populous ancestries reported in Rogers are Mexican (15,463 | 22.1%), German (6,302 | 9.0%), English (5,792 | 8.3%), Central American (5,422 | 7.7%), and Salvadoran (4,601 | 6.6%), together accounting for 53.7% of all Rogers residents.
| Ancestry | # Population | % Population |
| African | 44 | 0.1% |
| Alaskan Athabascan | 12 | 0.0% |
| Albanian | 14 | 0.0% |
| American | 2,768 | 4.0% |
| Apache | 96 | 0.1% |
| Arab | 33 | 0.1% |
| Argentinean | 61 | 0.1% |
| Armenian | 18 | 0.0% |
| Australian | 37 | 0.1% |
| Austrian | 40 | 0.1% |
| Bangladeshi | 99 | 0.1% |
| Belgian | 94 | 0.1% |
| Bermudan | 9 | 0.0% |
| Bhutanese | 250 | 0.4% |
| Bolivian | 28 | 0.0% |
| Brazilian | 8 | 0.0% |
| British | 510 | 0.7% |
| Bulgarian | 32 | 0.1% |
| Burmese | 265 | 0.4% |
| Cajun | 35 | 0.1% |
| Canadian | 67 | 0.1% |
| Celtic | 45 | 0.1% |
| Central American | 5,422 | 7.7% |
| Central American Indian | 10 | 0.0% |
| Cherokee | 486 | 0.7% |
| Chickasaw | 6 | 0.0% |
| Chilean | 52 | 0.1% |
| Choctaw | 60 | 0.1% |
| Colombian | 118 | 0.2% |
| Comanche | 1 | 0.0% |
| Costa Rican | 43 | 0.1% |
| Creek | 44 | 0.1% |
| Croatian | 7 | 0.0% |
| Cuban | 83 | 0.1% |
| Czech | 200 | 0.3% |
| Czechoslovakian | 106 | 0.2% |
| Danish | 269 | 0.4% |
| Delaware | 5 | 0.0% |
| Dominican | 116 | 0.2% |
| Dutch | 705 | 1.0% |
| Eastern European | 97 | 0.1% |
| Ecuadorian | 100 | 0.1% |
| English | 5,792 | 8.3% |
| European | 1,362 | 1.9% |
| Fijian | 555 | 0.8% |
| Finnish | 142 | 0.2% |
| French | 906 | 1.3% |
| French Canadian | 82 | 0.1% |
| German | 6,302 | 9.0% |
| Greek | 55 | 0.1% |
| Guatemalan | 614 | 0.9% |
| Honduran | 69 | 0.1% |
| Hungarian | 125 | 0.2% |
| Indian (Asian) | 303 | 0.4% |
| Iranian | 38 | 0.1% |
| Irish | 4,350 | 6.2% |
| Italian | 1,276 | 1.8% |
| Jamaican | 9 | 0.0% |
| Japanese | 56 | 0.1% |
| Korean | 611 | 0.9% |
| Latvian | 17 | 0.0% |
| Lebanese | 26 | 0.0% |
| Lithuanian | 55 | 0.1% |
| Macedonian | 6 | 0.0% |
| Malaysian | 310 | 0.4% |
| Maltese | 27 | 0.0% |
| Mexican | 15,463 | 22.1% |
| Mexican American Indian | 236 | 0.3% |
| Mongolian | 77 | 0.1% |
| Moroccan | 7 | 0.0% |
| Native Hawaiian | 25 | 0.0% |
| Navajo | 26 | 0.0% |
| New Zealander | 89 | 0.1% |
| Nicaraguan | 84 | 0.1% |
| Nigerian | 11 | 0.0% |
| Northern European | 38 | 0.1% |
| Norwegian | 442 | 0.6% |
| Pakistani | 8 | 0.0% |
| Panamanian | 11 | 0.0% |
| Polish | 572 | 0.8% |
| Portuguese | 79 | 0.1% |
| Potawatomi | 231 | 0.3% |
| Puerto Rican | 344 | 0.5% |
| Romanian | 20 | 0.0% |
| Russian | 45 | 0.1% |
| Salvadoran | 4,601 | 6.6% |
| Scandinavian | 236 | 0.3% |
| Scotch-Irish | 714 | 1.0% |
| Scottish | 1,190 | 1.7% |
| South American | 359 | 0.5% |
| Spaniard | 146 | 0.2% |
| Spanish | 40 | 0.1% |
| Spanish American | 7 | 0.0% |
| Sri Lankan | 294 | 0.4% |
| Subsaharan African | 171 | 0.2% |
| Swedish | 256 | 0.4% |
| Swiss | 131 | 0.2% |
| Thai | 452 | 0.6% |
| Tlingit-Haida | 11 | 0.0% |
| Ukrainian | 26 | 0.0% |
| Welsh | 242 | 0.4% |
| Yugoslavian | 30 | 0.0% | View All 102 Rows |
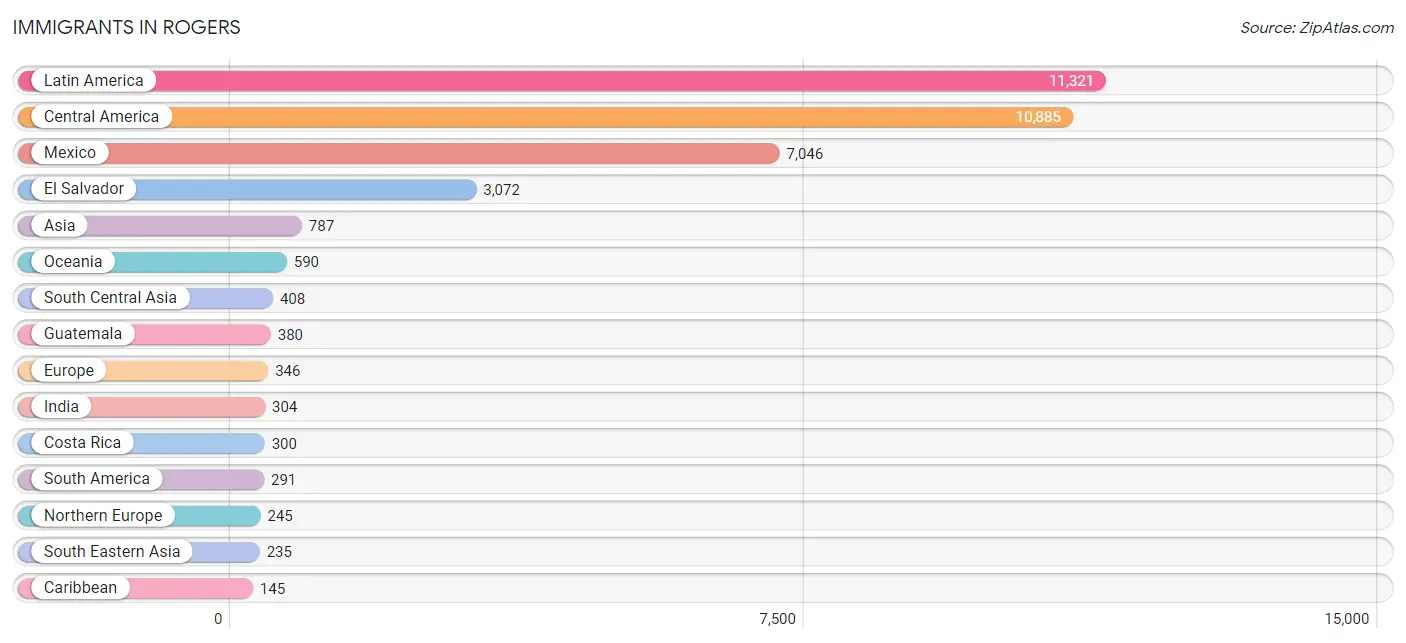
Immigrants in Rogers
The most numerous immigrant groups reported in Rogers came from Latin America (11,321 | 16.2%), Central America (10,885 | 15.6%), Mexico (7,046 | 10.1%), El Salvador (3,072 | 4.4%), and Asia (787 | 1.1%), together accounting for 47.3% of all Rogers residents.
| Immigration Origin | # Population | % Population |
| Africa | 25 | 0.0% |
| Argentina | 61 | 0.1% |
| Asia | 787 | 1.1% |
| Australia | 39 | 0.1% |
| Austria | 45 | 0.1% |
| Bosnia and Herzegovina | 7 | 0.0% |
| Brazil | 13 | 0.0% |
| Cambodia | 16 | 0.0% |
| Canada | 98 | 0.1% |
| Caribbean | 145 | 0.2% |
| Central America | 10,885 | 15.6% |
| Chile | 32 | 0.1% |
| China | 49 | 0.1% |
| Colombia | 85 | 0.1% |
| Costa Rica | 300 | 0.4% |
| Cuba | 29 | 0.0% |
| Dominican Republic | 116 | 0.2% |
| Eastern Asia | 144 | 0.2% |
| Eastern Europe | 21 | 0.0% |
| Ecuador | 100 | 0.1% |
| El Salvador | 3,072 | 4.4% |
| England | 27 | 0.0% |
| Europe | 346 | 0.5% |
| Germany | 15 | 0.0% |
| Guatemala | 380 | 0.5% |
| Honduras | 10 | 0.0% |
| India | 304 | 0.4% |
| Iran | 13 | 0.0% |
| Italy | 4 | 0.0% |
| Japan | 37 | 0.1% |
| Korea | 58 | 0.1% |
| Laos | 41 | 0.1% |
| Latin America | 11,321 | 16.2% |
| Malaysia | 17 | 0.0% |
| Mexico | 7,046 | 10.1% |
| Micronesia | 13 | 0.0% |
| Morocco | 7 | 0.0% |
| Netherlands | 11 | 0.0% |
| Nicaragua | 66 | 0.1% |
| Northern Africa | 7 | 0.0% |
| Northern Europe | 245 | 0.4% |
| Oceania | 590 | 0.8% |
| Pakistan | 91 | 0.1% |
| Panama | 11 | 0.0% |
| Philippines | 64 | 0.1% |
| South Africa | 18 | 0.0% |
| South America | 291 | 0.4% |
| South Central Asia | 408 | 0.6% |
| South Eastern Asia | 235 | 0.3% |
| Southern Europe | 9 | 0.0% |
| Spain | 5 | 0.0% |
| Thailand | 8 | 0.0% |
| Vietnam | 89 | 0.1% |
| Western Europe | 71 | 0.1% | View All 54 Rows |
Sex and Age in Rogers
Sex and Age in Rogers
The most populous age groups in Rogers are 30 to 34 Years (2,948 | 8.5%) for men and 25 to 29 Years (2,802 | 7.9%) for women.
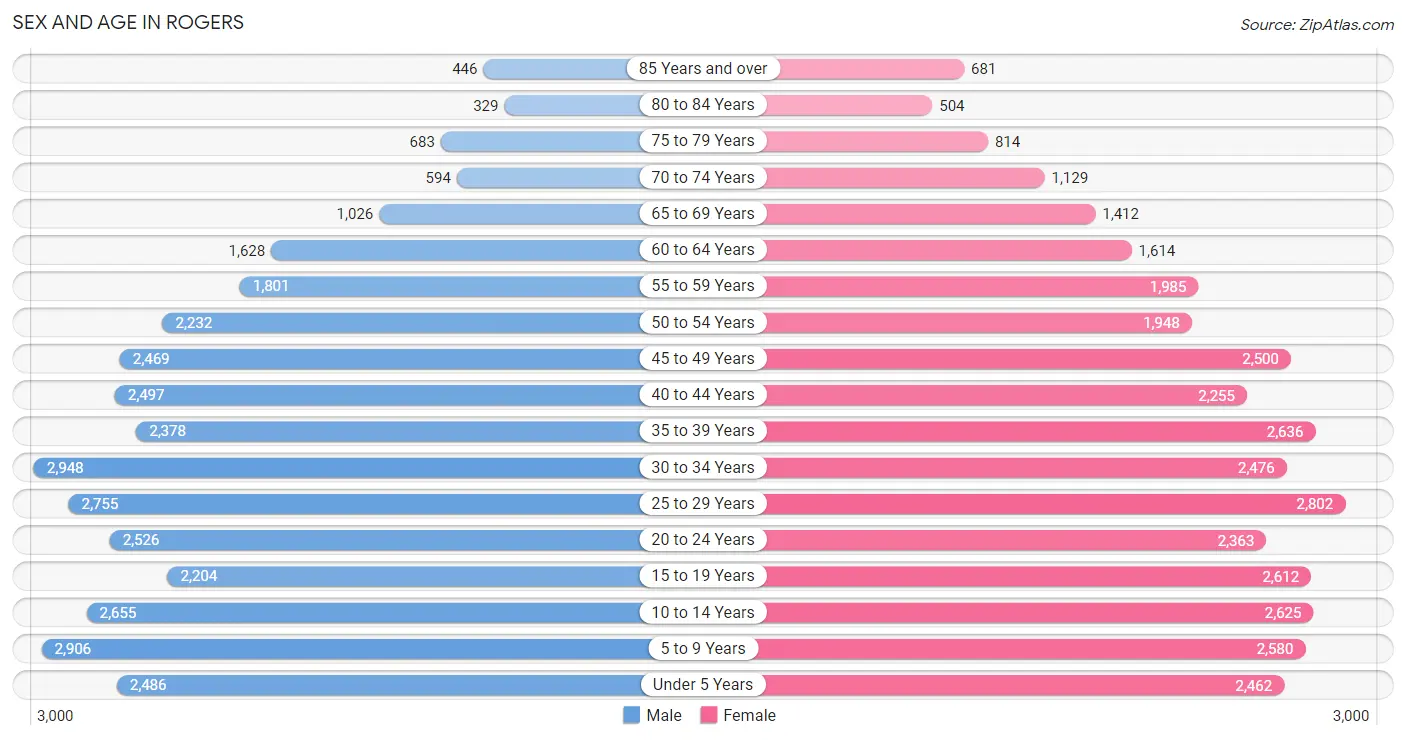
| Age Bracket | Male | Female |
| Under 5 Years | 2,486 (7.2%) | 2,462 (7.0%) |
| 5 to 9 Years | 2,906 (8.4%) | 2,580 (7.3%) |
| 10 to 14 Years | 2,655 (7.7%) | 2,625 (7.4%) |
| 15 to 19 Years | 2,204 (6.4%) | 2,612 (7.4%) |
| 20 to 24 Years | 2,526 (7.3%) | 2,363 (6.7%) |
| 25 to 29 Years | 2,755 (8.0%) | 2,802 (7.9%) |
| 30 to 34 Years | 2,948 (8.5%) | 2,476 (7.0%) |
| 35 to 39 Years | 2,378 (6.9%) | 2,636 (7.4%) |
| 40 to 44 Years | 2,497 (7.2%) | 2,255 (6.4%) |
| 45 to 49 Years | 2,469 (7.1%) | 2,500 (7.1%) |
| 50 to 54 Years | 2,232 (6.5%) | 1,948 (5.5%) |
| 55 to 59 Years | 1,801 (5.2%) | 1,985 (5.6%) |
| 60 to 64 Years | 1,628 (4.7%) | 1,614 (4.6%) |
| 65 to 69 Years | 1,026 (3.0%) | 1,412 (4.0%) |
| 70 to 74 Years | 594 (1.7%) | 1,129 (3.2%) |
| 75 to 79 Years | 683 (2.0%) | 814 (2.3%) |
| 80 to 84 Years | 329 (0.9%) | 504 (1.4%) |
| 85 Years and over | 446 (1.3%) | 681 (1.9%) |
| Total | 34,563 (100.0%) | 35,398 (100.0%) |
Families and Households in Rogers
Median Family Size in Rogers
The median family size in Rogers is 3.36 persons per family, with married-couple families (13,304 | 75.2%) accounting for the largest median family size of 3.47 persons per family. On the other hand, single male/father families (1,479 | 8.4%) represent the smallest median family size with 2.71 persons per family.
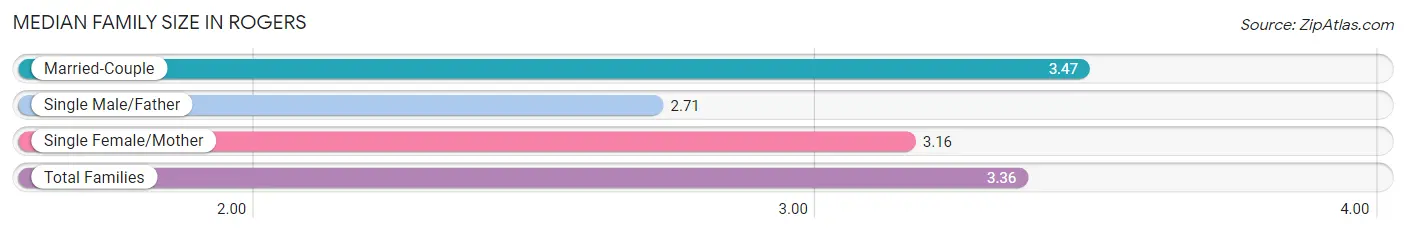
| Family Type | # Families | Family Size |
| Married-Couple | 13,304 (75.2%) | 3.47 |
| Single Male/Father | 1,479 (8.4%) | 2.71 |
| Single Female/Mother | 2,908 (16.4%) | 3.16 |
| Total Families | 17,691 (100.0%) | 3.36 |
Median Household Size in Rogers
The median household size in Rogers is 2.80 persons per household, with married-couple households (13,304 | 53.7%) accounting for the largest median household size of 3.49 persons per household. non-family households (7,061 | 28.5%) represent the smallest median household size with 1.24 persons per household.
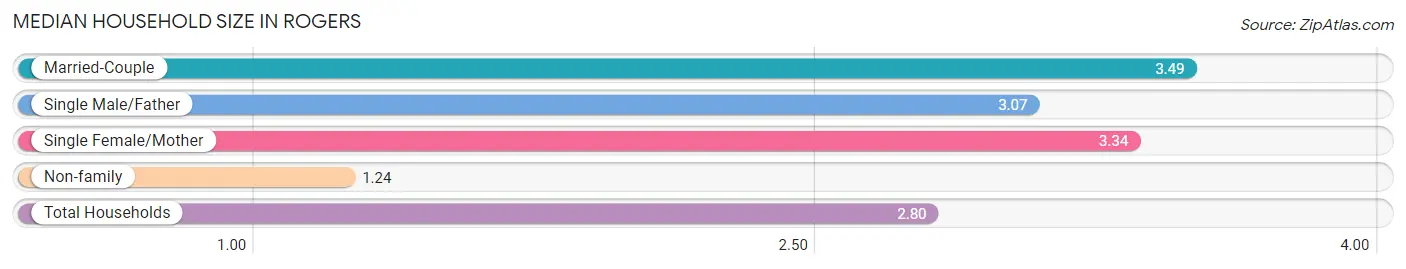
| Household Type | # Households | Household Size |
| Married-Couple | 13,304 (53.7%) | 3.49 |
| Single Male/Father | 1,479 (6.0%) | 3.07 |
| Single Female/Mother | 2,908 (11.7%) | 3.34 |
| Non-family | 7,061 (28.5%) | 1.24 |
| Total Households | 24,752 (100.0%) | 2.80 |
Household Size by Marriage Status in Rogers
Out of a total of 24,752 households in Rogers, 17,691 (71.5%) are family households, while 7,061 (28.5%) are nonfamily households. The most numerous type of family households are 2-person households, comprising 6,497, and the most common type of nonfamily households are 1-person households, comprising 5,925.
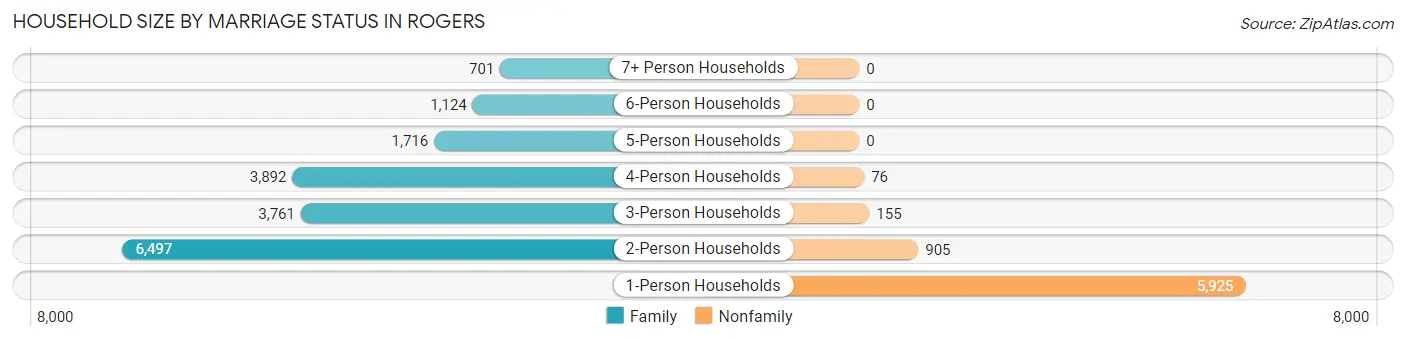
| Household Size | Family Households | Nonfamily Households |
| 1-Person Households | - | 5,925 (23.9%) |
| 2-Person Households | 6,497 (26.3%) | 905 (3.7%) |
| 3-Person Households | 3,761 (15.2%) | 155 (0.6%) |
| 4-Person Households | 3,892 (15.7%) | 76 (0.3%) |
| 5-Person Households | 1,716 (6.9%) | 0 (0.0%) |
| 6-Person Households | 1,124 (4.5%) | 0 (0.0%) |
| 7+ Person Households | 701 (2.8%) | 0 (0.0%) |
| Total | 17,691 (71.5%) | 7,061 (28.5%) |
Female Fertility in Rogers
Fertility by Age in Rogers
Average fertility rate in Rogers is 40.0 births per 1,000 women. Women in the age bracket of 20 to 34 years have the highest fertility rate with 71.0 births per 1,000 women. Women in the age bracket of 20 to 34 years acount for 74.3% of all women with births.
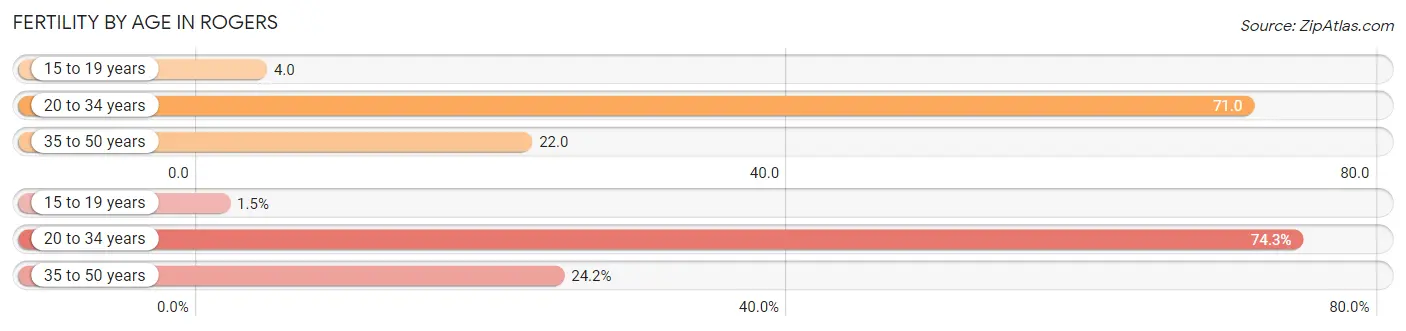
| Age Bracket | Women with Births | Births / 1,000 Women |
| 15 to 19 years | 11 (1.5%) | 4.0 |
| 20 to 34 years | 544 (74.3%) | 71.0 |
| 35 to 50 years | 177 (24.2%) | 22.0 |
| Total | 732 (100.0%) | 40.0 |
Fertility by Age by Marriage Status in Rogers
76.1% of women with births (732) in Rogers are married. The highest percentage of unmarried women with births falls into 20 to 34 years age bracket with 28.5% of them unmarried at the time of birth, while the lowest percentage of unmarried women with births belong to 15 to 19 years age bracket with 0.0% of them unmarried.
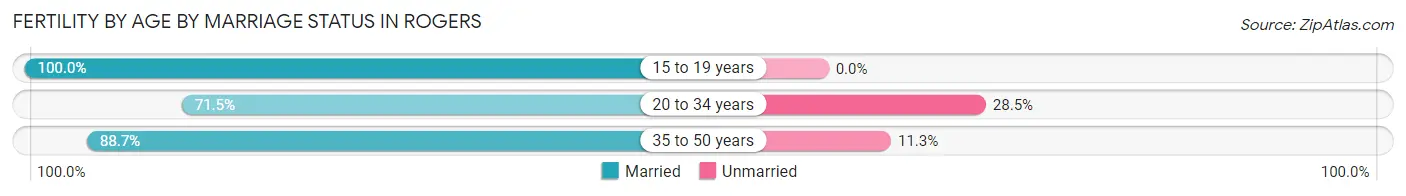
| Age Bracket | Married | Unmarried |
| 15 to 19 years | 11 (100.0%) | 0 (0.0%) |
| 20 to 34 years | 389 (71.5%) | 155 (28.5%) |
| 35 to 50 years | 157 (88.7%) | 20 (11.3%) |
| Total | 557 (76.1%) | 175 (23.9%) |
Fertility by Education in Rogers
Average fertility rate in Rogers is 40.0 births per 1,000 women. Women with the education attainment of college or associate's degree have the highest fertility rate of 60.0 births per 1,000 women, while women with the education attainment of less than high school have the lowest fertility at 23.0 births per 1,000 women. Women with the education attainment of college or associate's degree represent 33.3% of all women with births.
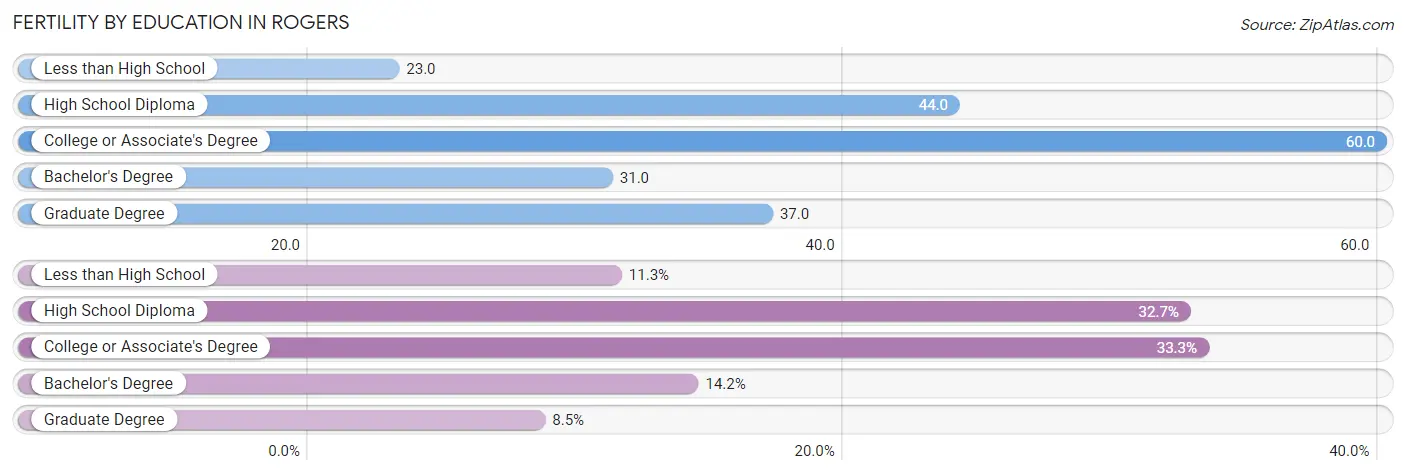
| Educational Attainment | Women with Births | Births / 1,000 Women |
| Less than High School | 83 (11.3%) | 23.0 |
| High School Diploma | 239 (32.7%) | 44.0 |
| College or Associate's Degree | 244 (33.3%) | 60.0 |
| Bachelor's Degree | 104 (14.2%) | 31.0 |
| Graduate Degree | 62 (8.5%) | 37.0 |
| Total | 732 (100.0%) | 40.0 |
Fertility by Education by Marriage Status in Rogers
23.9% of women with births in Rogers are unmarried. Women with the educational attainment of less than high school are most likely to be married with 100.0% of them married at childbirth, while women with the educational attainment of high school diploma are least likely to be married with 49.4% of them unmarried at childbirth.
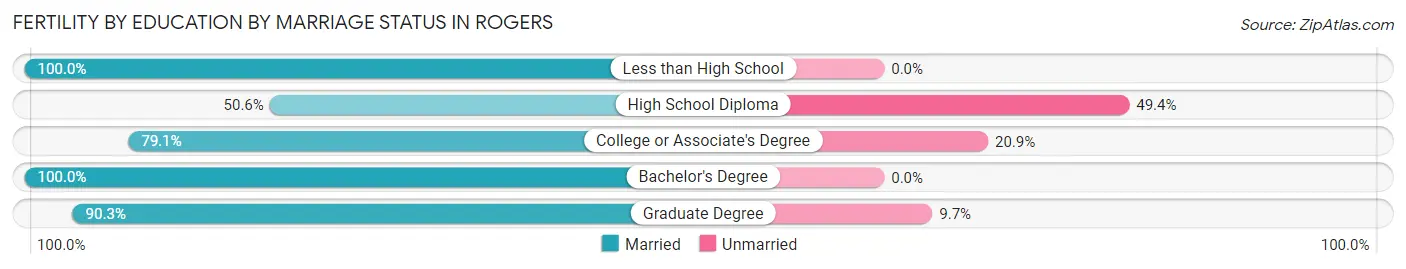
| Educational Attainment | Married | Unmarried |
| Less than High School | 83 (100.0%) | 0 (0.0%) |
| High School Diploma | 121 (50.6%) | 118 (49.4%) |
| College or Associate's Degree | 193 (79.1%) | 51 (20.9%) |
| Bachelor's Degree | 104 (100.0%) | 0 (0.0%) |
| Graduate Degree | 56 (90.3%) | 6 (9.7%) |
| Total | 557 (76.1%) | 175 (23.9%) |
Employment Characteristics in Rogers
Employment by Class of Employer in Rogers
Among the 35,982 employed individuals in Rogers, private company employees (27,066 | 75.2%), not-for-profit organizations (2,663 | 7.4%), and self-employed (not incorporated) (2,405 | 6.7%) make up the most common classes of employment.
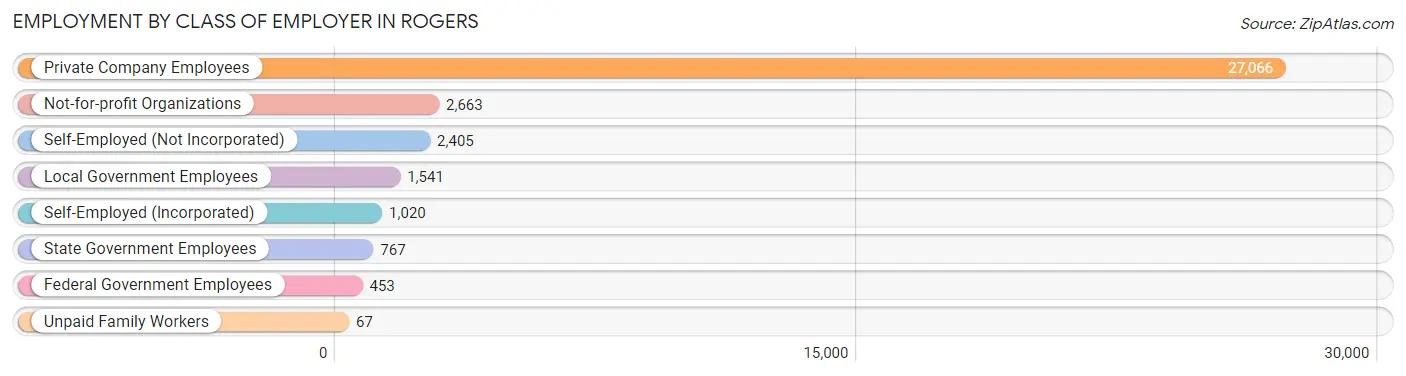
| Employer Class | # Employees | % Employees |
| Private Company Employees | 27,066 | 75.2% |
| Self-Employed (Incorporated) | 1,020 | 2.8% |
| Self-Employed (Not Incorporated) | 2,405 | 6.7% |
| Not-for-profit Organizations | 2,663 | 7.4% |
| Local Government Employees | 1,541 | 4.3% |
| State Government Employees | 767 | 2.1% |
| Federal Government Employees | 453 | 1.3% |
| Unpaid Family Workers | 67 | 0.2% |
| Total | 35,982 | 100.0% |
Employment Status by Age in Rogers
According to the labor force statistics for Rogers, out of the total population over 16 years of age (53,244), 70.4% or 37,484 individuals are in the labor force, with 2.9% or 1,087 of them unemployed. The age group with the highest labor force participation rate is 30 to 34 years, with 92.2% or 5,001 individuals in the labor force. Within the labor force, the 75 years and over age range has the highest percentage of unemployed individuals, with 7.3% or 21 of them being unemployed.
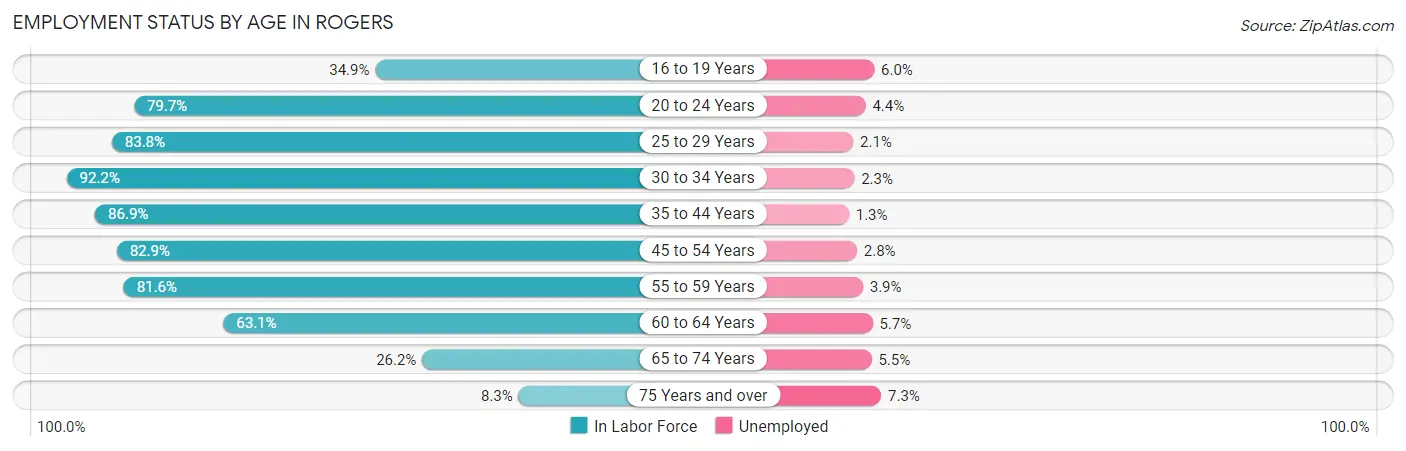
| Age Bracket | In Labor Force | Unemployed |
| 16 to 19 Years | 1,331 (34.9%) | 80 (6.0%) |
| 20 to 24 Years | 3,897 (79.7%) | 171 (4.4%) |
| 25 to 29 Years | 4,657 (83.8%) | 98 (2.1%) |
| 30 to 34 Years | 5,001 (92.2%) | 115 (2.3%) |
| 35 to 44 Years | 8,487 (86.9%) | 110 (1.3%) |
| 45 to 54 Years | 7,585 (82.9%) | 212 (2.8%) |
| 55 to 59 Years | 3,089 (81.6%) | 120 (3.9%) |
| 60 to 64 Years | 2,046 (63.1%) | 117 (5.7%) |
| 65 to 74 Years | 1,090 (26.2%) | 60 (5.5%) |
| 75 Years and over | 287 (8.3%) | 21 (7.3%) |
| Total | 37,484 (70.4%) | 1,087 (2.9%) |
Employment Status by Educational Attainment in Rogers
According to labor force statistics for Rogers, 83.6% of individuals (30,868) out of the total population between 25 and 64 years of age (36,924) are in the labor force, with 2.5% or 772 of them being unemployed. The group with the highest labor force participation rate are those with the educational attainment of bachelor's degree or higher, with 89.2% or 11,344 individuals in the labor force. Within the labor force, individuals with high school diploma education have the highest percentage of unemployment, with 3.7% or 321 of them being unemployed.
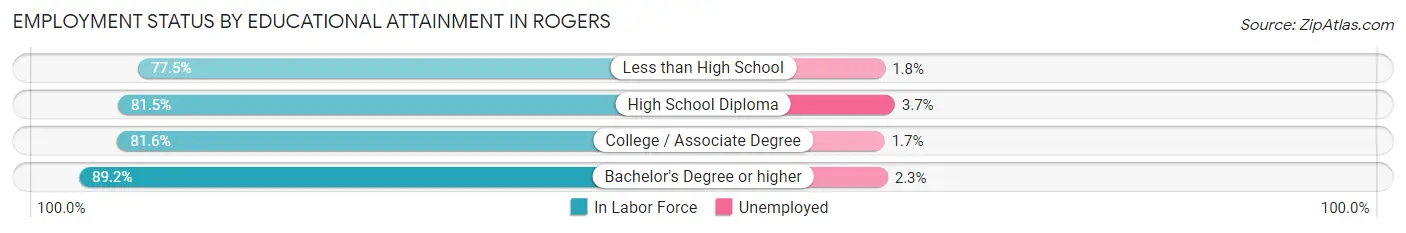
| Educational Attainment | In Labor Force | Unemployed |
| Less than High School | 4,280 (77.5%) | 99 (1.8%) |
| High School Diploma | 8,684 (81.5%) | 394 (3.7%) |
| College / Associate Degree | 6,551 (81.6%) | 136 (1.7%) |
| Bachelor's Degree or higher | 11,344 (89.2%) | 293 (2.3%) |
| Total | 30,868 (83.6%) | 923 (2.5%) |
Employment Occupations by Sex in Rogers
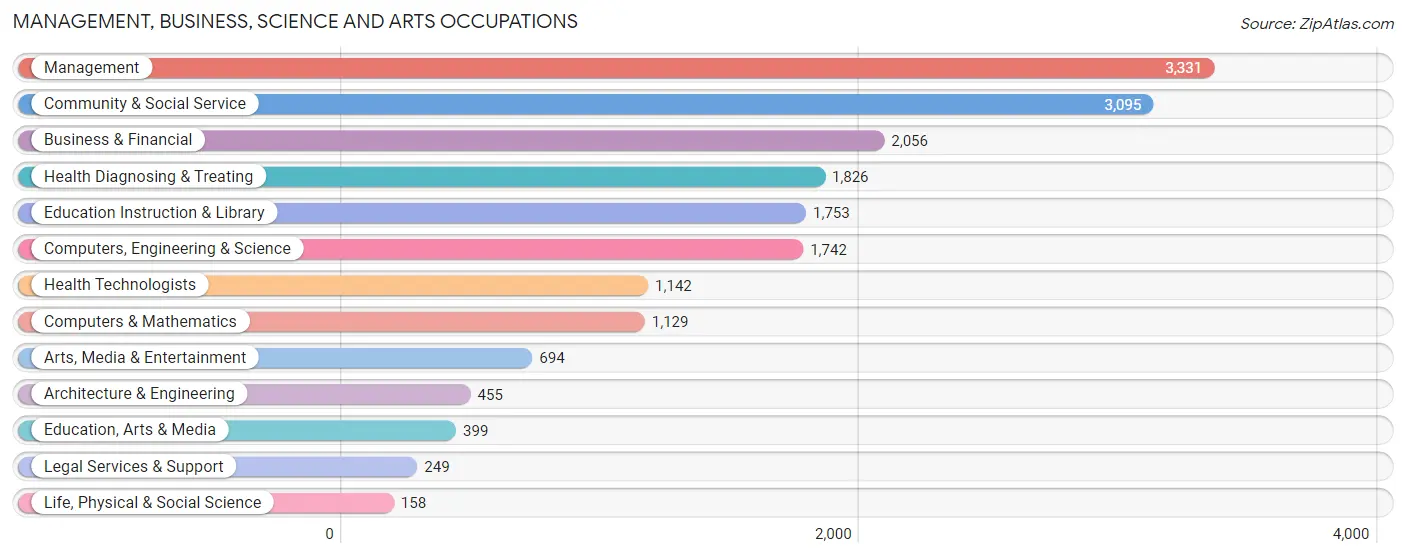
Management, Business, Science and Arts Occupations
The most common Management, Business, Science and Arts occupations in Rogers are Management (3,331 | 9.2%), Community & Social Service (3,095 | 8.5%), Business & Financial (2,056 | 5.7%), Health Diagnosing & Treating (1,826 | 5.0%), and Education Instruction & Library (1,753 | 4.8%).
Management, Business, Science and Arts Occupations by Sex
Within the Management, Business, Science and Arts occupations in Rogers, the most male-oriented occupations are Architecture & Engineering (91.4%), Life, Physical & Social Science (88.6%), and Computers, Engineering & Science (78.3%), while the most female-oriented occupations are Health Technologists (79.8%), Education, Arts & Media (76.7%), and Health Diagnosing & Treating (75.5%).
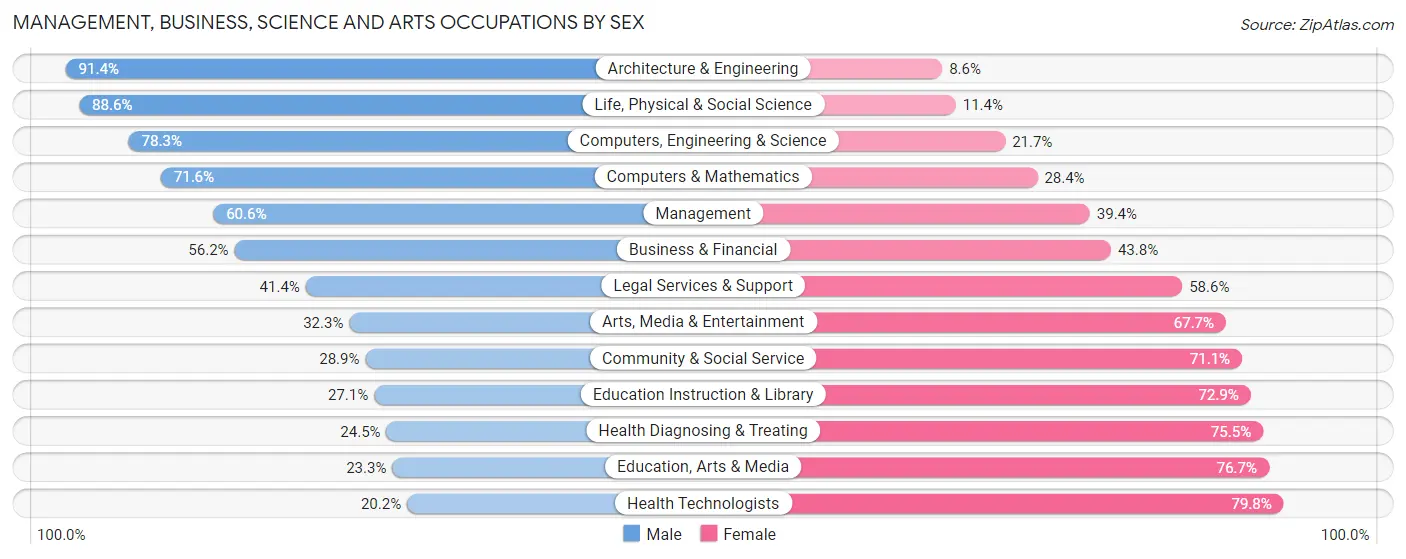
| Occupation | Male | Female |
| Management | 2,020 (60.6%) | 1,311 (39.4%) |
| Business & Financial | 1,156 (56.2%) | 900 (43.8%) |
| Computers, Engineering & Science | 1,364 (78.3%) | 378 (21.7%) |
| Computers & Mathematics | 808 (71.6%) | 321 (28.4%) |
| Architecture & Engineering | 416 (91.4%) | 39 (8.6%) |
| Life, Physical & Social Science | 140 (88.6%) | 18 (11.4%) |
| Community & Social Service | 895 (28.9%) | 2,200 (71.1%) |
| Education, Arts & Media | 93 (23.3%) | 306 (76.7%) |
| Legal Services & Support | 103 (41.4%) | 146 (58.6%) |
| Education Instruction & Library | 475 (27.1%) | 1,278 (72.9%) |
| Arts, Media & Entertainment | 224 (32.3%) | 470 (67.7%) |
| Health Diagnosing & Treating | 448 (24.5%) | 1,378 (75.5%) |
| Health Technologists | 231 (20.2%) | 911 (79.8%) |
| Total (Category) | 5,883 (48.8%) | 6,167 (51.2%) |
| Total (Overall) | 19,352 (53.2%) | 17,021 (46.8%) |
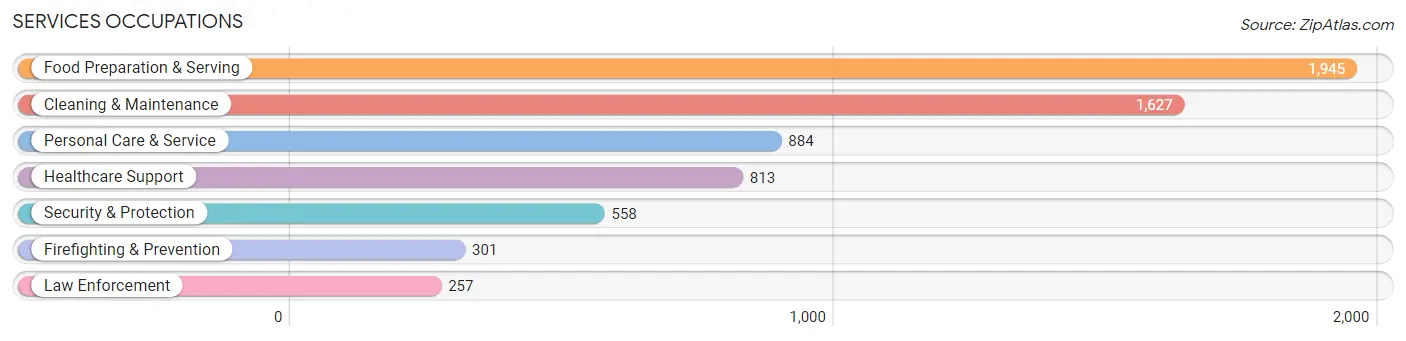
Services Occupations
The most common Services occupations in Rogers are Food Preparation & Serving (1,945 | 5.3%), Cleaning & Maintenance (1,627 | 4.5%), Personal Care & Service (884 | 2.4%), Healthcare Support (813 | 2.2%), and Security & Protection (558 | 1.5%).
Services Occupations by Sex
Within the Services occupations in Rogers, the most male-oriented occupations are Firefighting & Prevention (84.1%), Security & Protection (78.0%), and Law Enforcement (70.8%), while the most female-oriented occupations are Healthcare Support (89.0%), Personal Care & Service (73.6%), and Food Preparation & Serving (63.7%).
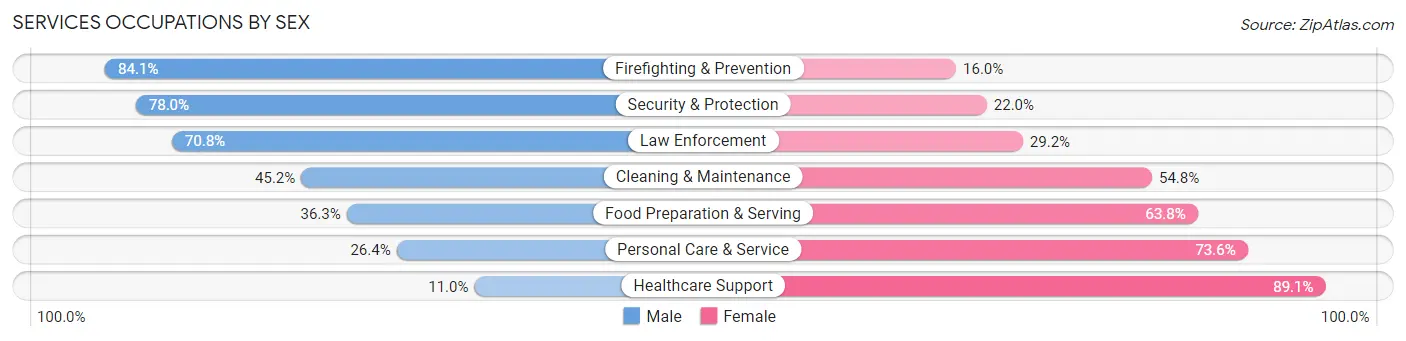
| Occupation | Male | Female |
| Healthcare Support | 89 (11.0%) | 724 (89.0%) |
| Security & Protection | 435 (78.0%) | 123 (22.0%) |
| Firefighting & Prevention | 253 (84.1%) | 48 (16.0%) |
| Law Enforcement | 182 (70.8%) | 75 (29.2%) |
| Food Preparation & Serving | 705 (36.2%) | 1,240 (63.7%) |
| Cleaning & Maintenance | 736 (45.2%) | 891 (54.8%) |
| Personal Care & Service | 233 (26.4%) | 651 (73.6%) |
| Total (Category) | 2,198 (37.7%) | 3,629 (62.3%) |
| Total (Overall) | 19,352 (53.2%) | 17,021 (46.8%) |
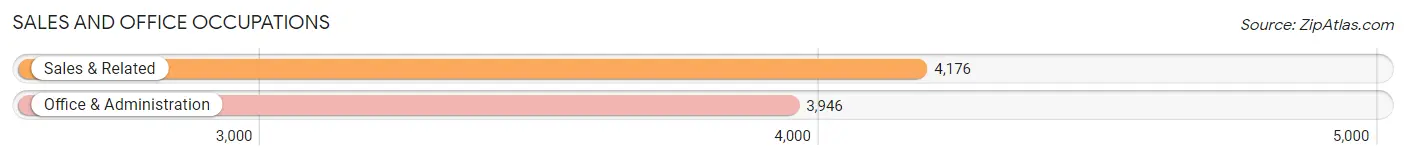
Sales and Office Occupations
The most common Sales and Office occupations in Rogers are Sales & Related (4,176 | 11.5%), and Office & Administration (3,946 | 10.8%).
Sales and Office Occupations by Sex
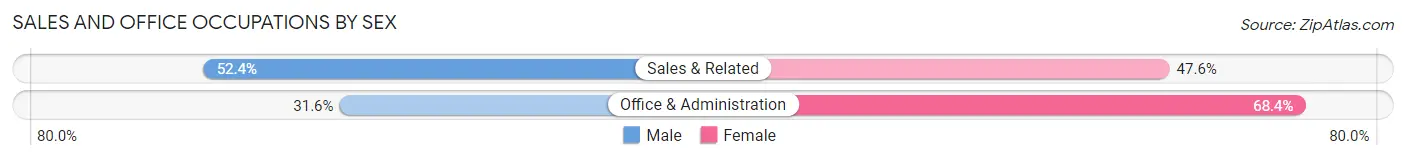
| Occupation | Male | Female |
| Sales & Related | 2,190 (52.4%) | 1,986 (47.6%) |
| Office & Administration | 1,246 (31.6%) | 2,700 (68.4%) |
| Total (Category) | 3,436 (42.3%) | 4,686 (57.7%) |
| Total (Overall) | 19,352 (53.2%) | 17,021 (46.8%) |
Natural Resources, Construction and Maintenance Occupations
The most common Natural Resources, Construction and Maintenance occupations in Rogers are Construction & Extraction (2,659 | 7.3%), Installation, Maintenance & Repair (852 | 2.3%), and Farming, Fishing & Forestry (163 | 0.4%).
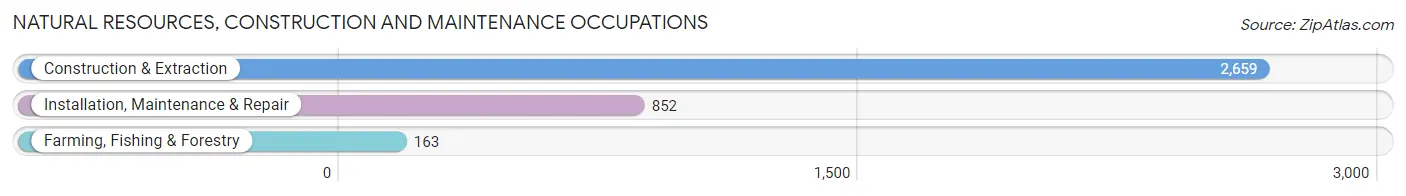
Natural Resources, Construction and Maintenance Occupations by Sex
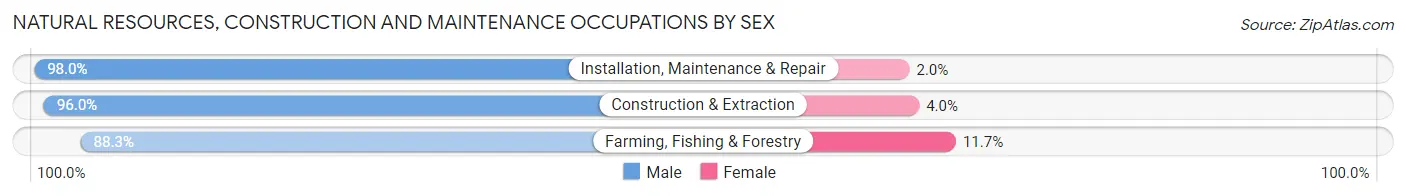
| Occupation | Male | Female |
| Farming, Fishing & Forestry | 144 (88.3%) | 19 (11.7%) |
| Construction & Extraction | 2,552 (96.0%) | 107 (4.0%) |
| Installation, Maintenance & Repair | 835 (98.0%) | 17 (2.0%) |
| Total (Category) | 3,531 (96.1%) | 143 (3.9%) |
| Total (Overall) | 19,352 (53.2%) | 17,021 (46.8%) |
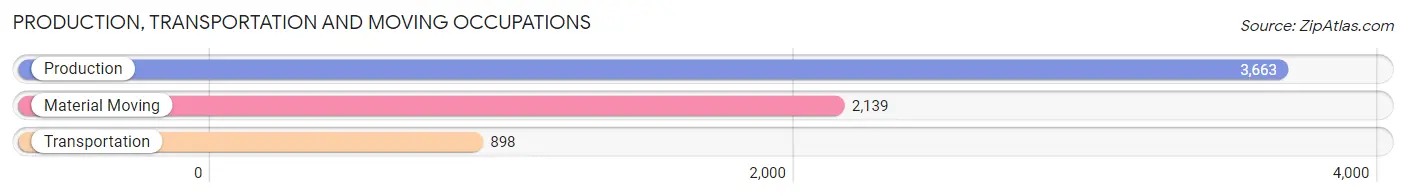
Production, Transportation and Moving Occupations
The most common Production, Transportation and Moving occupations in Rogers are Production (3,663 | 10.1%), Material Moving (2,139 | 5.9%), and Transportation (898 | 2.5%).
Production, Transportation and Moving Occupations by Sex
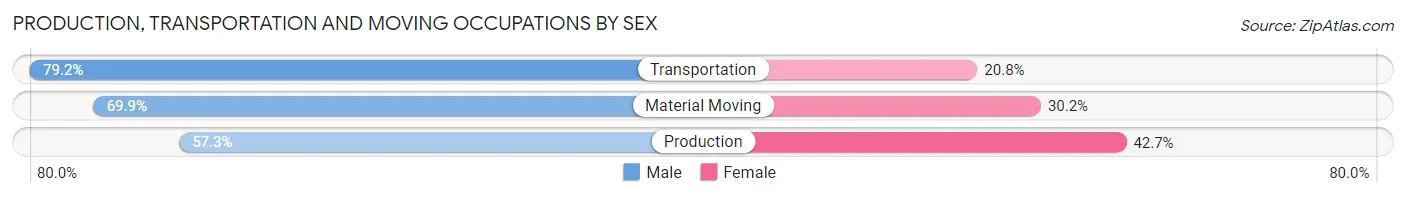
| Occupation | Male | Female |
| Production | 2,099 (57.3%) | 1,564 (42.7%) |
| Transportation | 711 (79.2%) | 187 (20.8%) |
| Material Moving | 1,494 (69.9%) | 645 (30.1%) |
| Total (Category) | 4,304 (64.2%) | 2,396 (35.8%) |
| Total (Overall) | 19,352 (53.2%) | 17,021 (46.8%) |
Employment Industries by Sex in Rogers
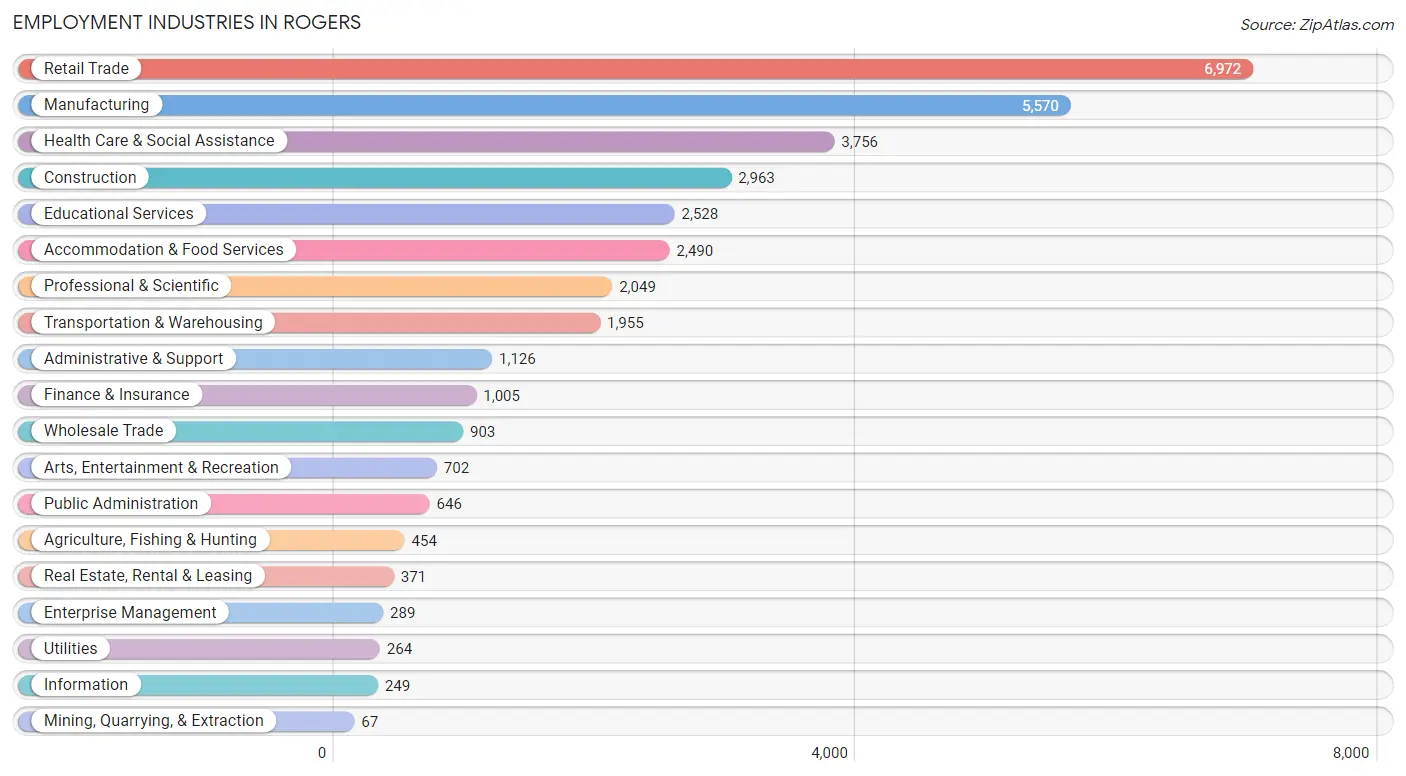
Employment Industries in Rogers
The major employment industries in Rogers include Retail Trade (6,972 | 19.2%), Manufacturing (5,570 | 15.3%), Health Care & Social Assistance (3,756 | 10.3%), Construction (2,963 | 8.2%), and Educational Services (2,528 | 7.0%).
Employment Industries by Sex in Rogers
The Rogers industries that see more men than women are Construction (92.2%), Mining, Quarrying, & Extraction (83.6%), and Utilities (73.5%), whereas the industries that tend to have a higher number of women are Health Care & Social Assistance (79.5%), Educational Services (78.0%), and Enterprise Management (71.6%).
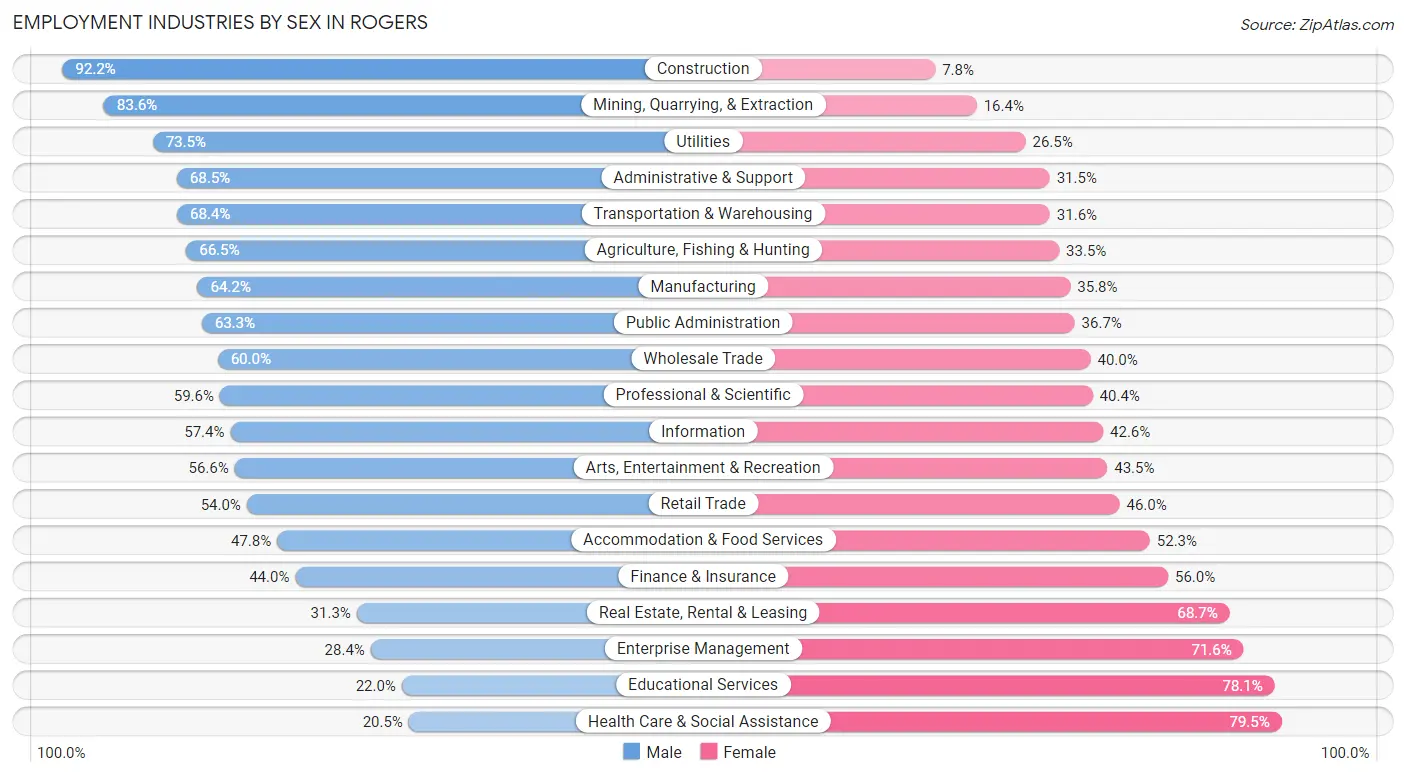
| Industry | Male | Female |
| Agriculture, Fishing & Hunting | 302 (66.5%) | 152 (33.5%) |
| Mining, Quarrying, & Extraction | 56 (83.6%) | 11 (16.4%) |
| Construction | 2,731 (92.2%) | 232 (7.8%) |
| Manufacturing | 3,576 (64.2%) | 1,994 (35.8%) |
| Wholesale Trade | 542 (60.0%) | 361 (40.0%) |
| Retail Trade | 3,767 (54.0%) | 3,205 (46.0%) |
| Transportation & Warehousing | 1,338 (68.4%) | 617 (31.6%) |
| Utilities | 194 (73.5%) | 70 (26.5%) |
| Information | 143 (57.4%) | 106 (42.6%) |
| Finance & Insurance | 442 (44.0%) | 563 (56.0%) |
| Real Estate, Rental & Leasing | 116 (31.3%) | 255 (68.7%) |
| Professional & Scientific | 1,221 (59.6%) | 828 (40.4%) |
| Enterprise Management | 82 (28.4%) | 207 (71.6%) |
| Administrative & Support | 771 (68.5%) | 355 (31.5%) |
| Educational Services | 555 (22.0%) | 1,973 (78.0%) |
| Health Care & Social Assistance | 770 (20.5%) | 2,986 (79.5%) |
| Arts, Entertainment & Recreation | 397 (56.6%) | 305 (43.4%) |
| Accommodation & Food Services | 1,189 (47.7%) | 1,301 (52.2%) |
| Public Administration | 409 (63.3%) | 237 (36.7%) |
| Total | 19,352 (53.2%) | 17,021 (46.8%) |
Education in Rogers
School Enrollment in Rogers
The most common levels of schooling among the 17,822 students in Rogers are elementary school (4,664 | 26.2%), middle school (3,950 | 22.2%), and high school (3,916 | 22.0%).
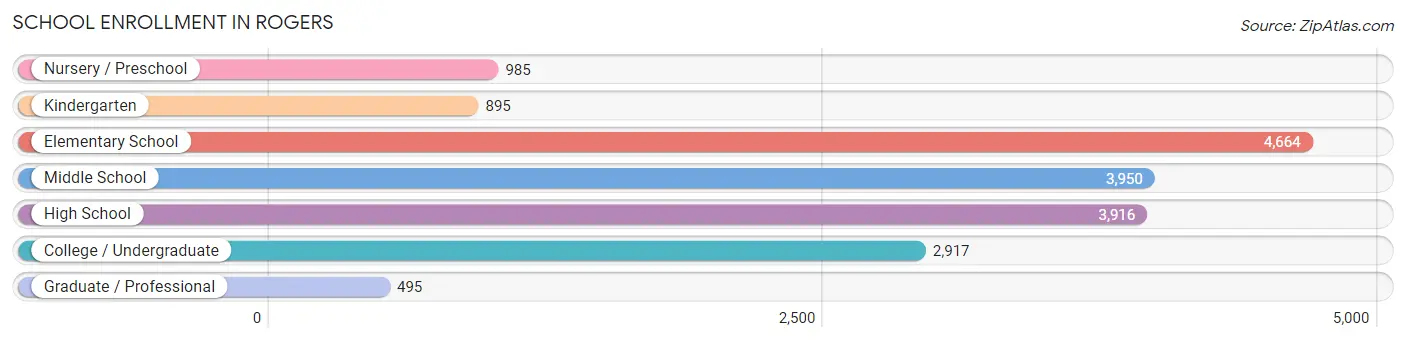
| School Level | # Students | % Students |
| Nursery / Preschool | 985 | 5.5% |
| Kindergarten | 895 | 5.0% |
| Elementary School | 4,664 | 26.2% |
| Middle School | 3,950 | 22.2% |
| High School | 3,916 | 22.0% |
| College / Undergraduate | 2,917 | 16.4% |
| Graduate / Professional | 495 | 2.8% |
| Total | 17,822 | 100.0% |
School Enrollment by Age by Funding Source in Rogers
Out of a total of 17,822 students who are enrolled in schools in Rogers, 2,566 (14.4%) attend a private institution, while the remaining 15,256 (85.6%) are enrolled in public schools. The age group of 3 to 4 year olds has the highest likelihood of being enrolled in private schools, with 456 (58.6% in the age bracket) enrolled. Conversely, the age group of 10 to 14 year olds has the lowest likelihood of being enrolled in a private school, with 4,679 (89.8% in the age bracket) attending a public institution.
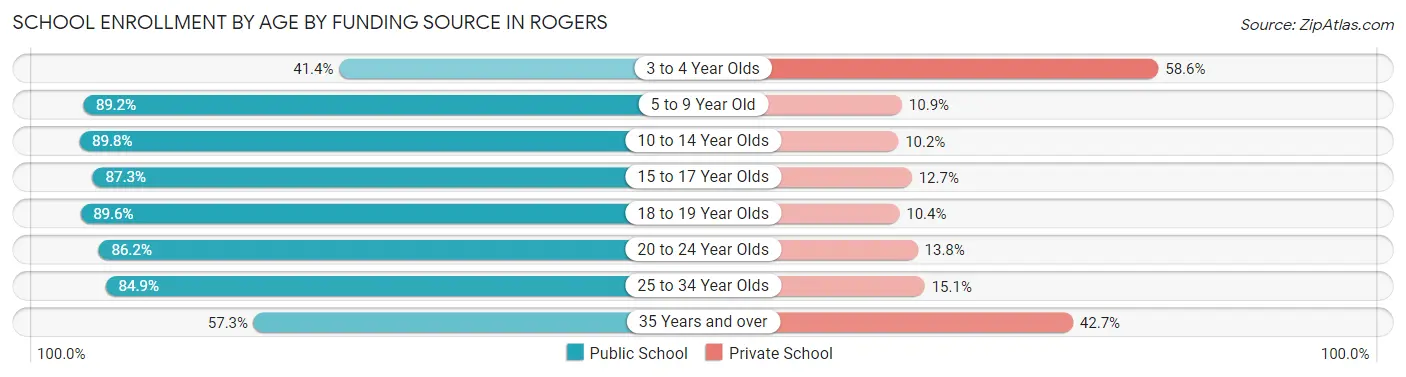
| Age Bracket | Public School | Private School |
| 3 to 4 Year Olds | 322 (41.4%) | 456 (58.6%) |
| 5 to 9 Year Old | 4,504 (89.1%) | 548 (10.8%) |
| 10 to 14 Year Olds | 4,679 (89.8%) | 529 (10.2%) |
| 15 to 17 Year Olds | 2,499 (87.3%) | 363 (12.7%) |
| 18 to 19 Year Olds | 1,021 (89.6%) | 118 (10.4%) |
| 20 to 24 Year Olds | 1,133 (86.2%) | 181 (13.8%) |
| 25 to 34 Year Olds | 776 (84.9%) | 138 (15.1%) |
| 35 Years and over | 318 (57.3%) | 237 (42.7%) |
| Total | 15,256 (85.6%) | 2,566 (14.4%) |
Educational Attainment by Field of Study in Rogers
Business (4,837 | 31.0%), science & technology (1,817 | 11.6%), education (1,588 | 10.2%), social sciences (980 | 6.3%), and bio, nature & agricultural (938 | 6.0%) are the most common fields of study among 15,615 individuals in Rogers who have obtained a bachelor's degree or higher.
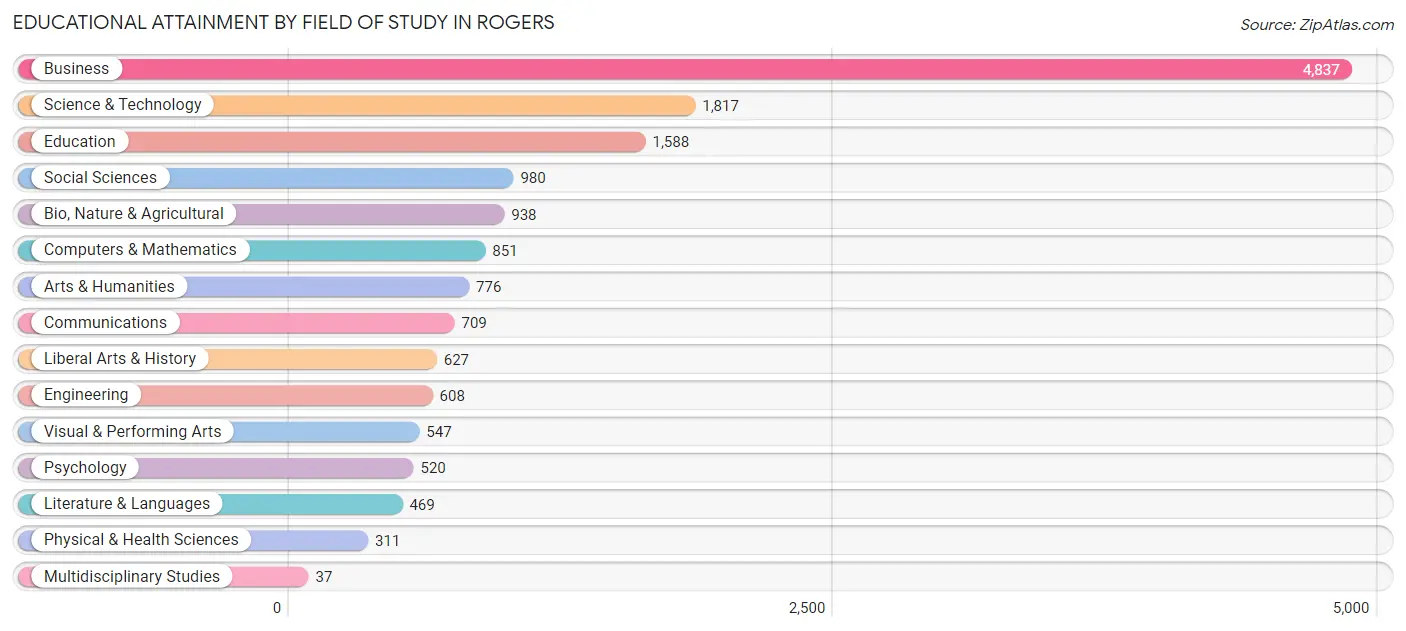
| Field of Study | # Graduates | % Graduates |
| Computers & Mathematics | 851 | 5.4% |
| Bio, Nature & Agricultural | 938 | 6.0% |
| Physical & Health Sciences | 311 | 2.0% |
| Psychology | 520 | 3.3% |
| Social Sciences | 980 | 6.3% |
| Engineering | 608 | 3.9% |
| Multidisciplinary Studies | 37 | 0.2% |
| Science & Technology | 1,817 | 11.6% |
| Business | 4,837 | 31.0% |
| Education | 1,588 | 10.2% |
| Literature & Languages | 469 | 3.0% |
| Liberal Arts & History | 627 | 4.0% |
| Visual & Performing Arts | 547 | 3.5% |
| Communications | 709 | 4.5% |
| Arts & Humanities | 776 | 5.0% |
| Total | 15,615 | 100.0% |
Transportation & Commute in Rogers
Vehicle Availability by Sex in Rogers
The most prevalent vehicle ownership categories in Rogers are males with 2 vehicles (8,604, accounting for 45.0%) and females with 2 vehicles (7,374, making up 51.1%).
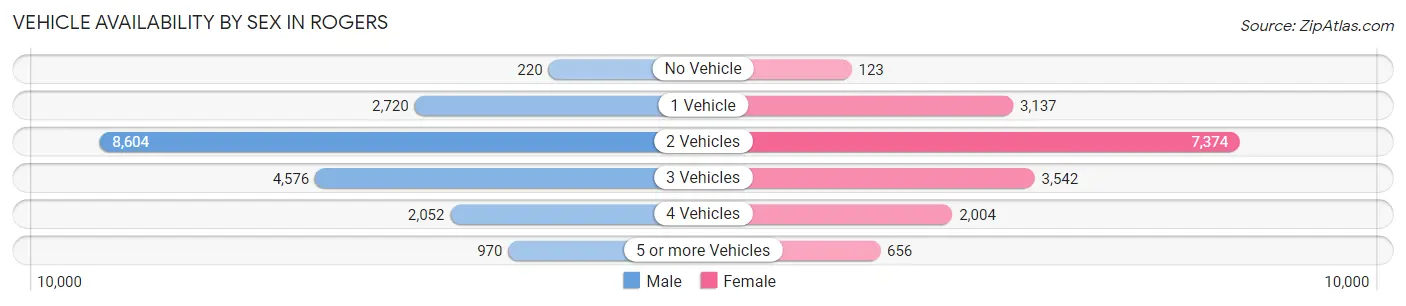
| Vehicles Available | Male | Female |
| No Vehicle | 220 (1.1%) | 123 (0.7%) |
| 1 Vehicle | 2,720 (14.2%) | 3,137 (18.6%) |
| 2 Vehicles | 8,604 (45.0%) | 7,374 (43.8%) |
| 3 Vehicles | 4,576 (23.9%) | 3,542 (21.0%) |
| 4 Vehicles | 2,052 (10.7%) | 2,004 (11.9%) |
| 5 or more Vehicles | 970 (5.1%) | 656 (3.9%) |
| Total | 19,142 (100.0%) | 16,836 (100.0%) |
Commute Time in Rogers
The most frequently occuring commute durations in Rogers are 10 to 14 minutes (7,751 commuters, 23.9%), 15 to 19 minutes (7,732 commuters, 23.8%), and 20 to 24 minutes (5,798 commuters, 17.9%).
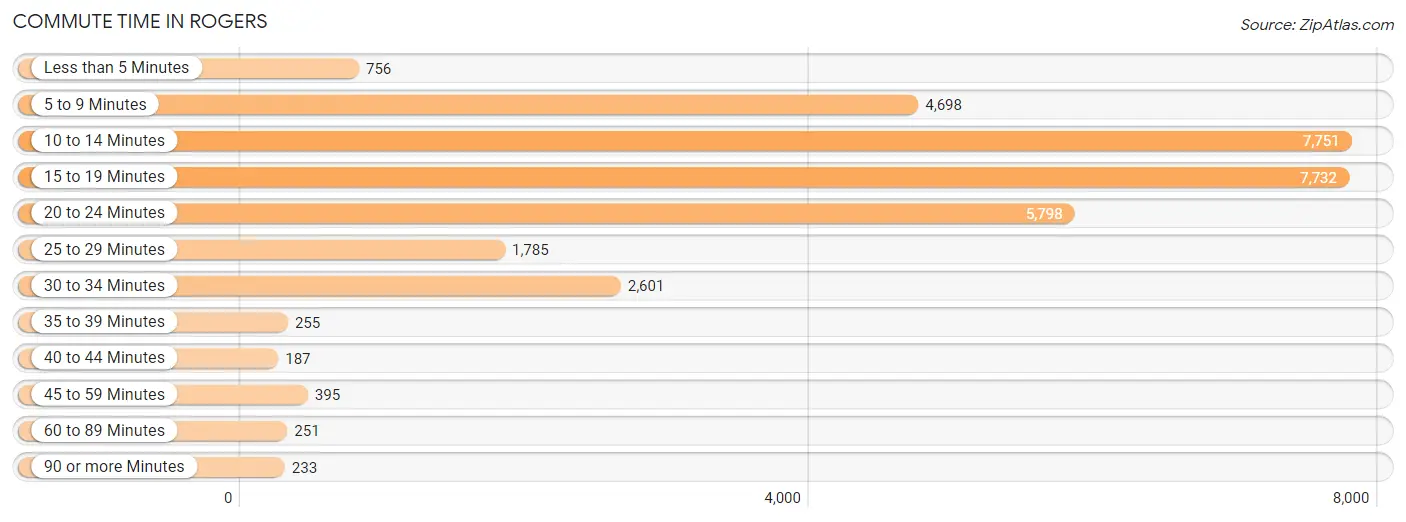
| Commute Time | # Commuters | % Commuters |
| Less than 5 Minutes | 756 | 2.3% |
| 5 to 9 Minutes | 4,698 | 14.5% |
| 10 to 14 Minutes | 7,751 | 23.9% |
| 15 to 19 Minutes | 7,732 | 23.8% |
| 20 to 24 Minutes | 5,798 | 17.9% |
| 25 to 29 Minutes | 1,785 | 5.5% |
| 30 to 34 Minutes | 2,601 | 8.0% |
| 35 to 39 Minutes | 255 | 0.8% |
| 40 to 44 Minutes | 187 | 0.6% |
| 45 to 59 Minutes | 395 | 1.2% |
| 60 to 89 Minutes | 251 | 0.8% |
| 90 or more Minutes | 233 | 0.7% |
Commute Time by Sex in Rogers
The most common commute times in Rogers are 15 to 19 minutes (4,388 commuters, 25.4%) for males and 10 to 14 minutes (3,705 commuters, 24.4%) for females.
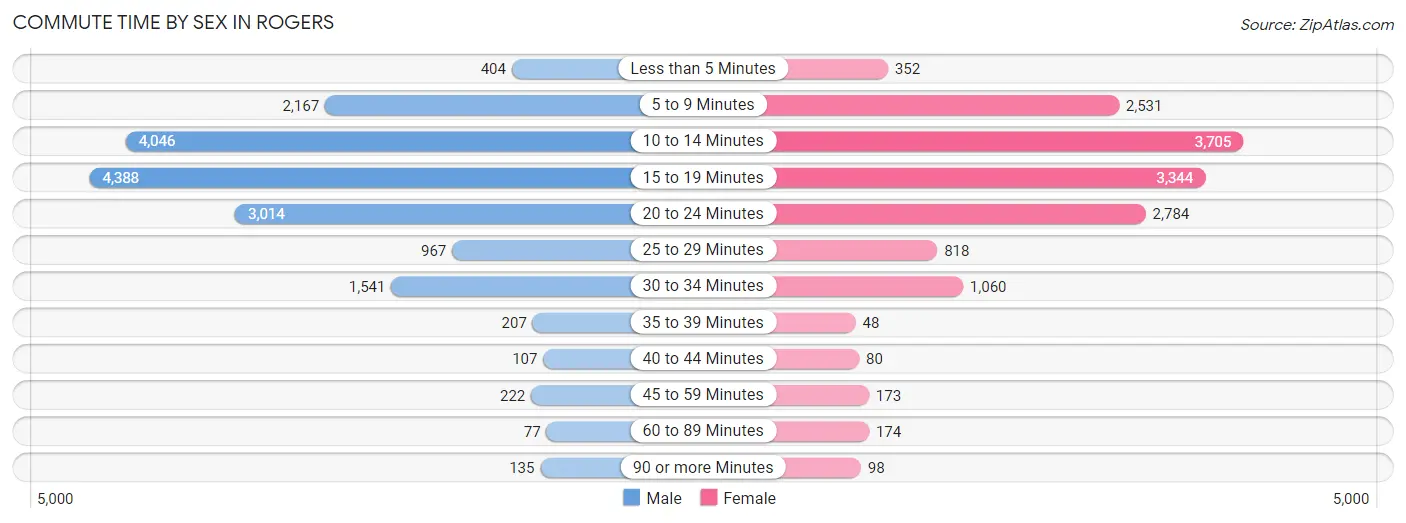
| Commute Time | Male | Female |
| Less than 5 Minutes | 404 (2.3%) | 352 (2.3%) |
| 5 to 9 Minutes | 2,167 (12.5%) | 2,531 (16.7%) |
| 10 to 14 Minutes | 4,046 (23.4%) | 3,705 (24.4%) |
| 15 to 19 Minutes | 4,388 (25.4%) | 3,344 (22.1%) |
| 20 to 24 Minutes | 3,014 (17.4%) | 2,784 (18.4%) |
| 25 to 29 Minutes | 967 (5.6%) | 818 (5.4%) |
| 30 to 34 Minutes | 1,541 (8.9%) | 1,060 (7.0%) |
| 35 to 39 Minutes | 207 (1.2%) | 48 (0.3%) |
| 40 to 44 Minutes | 107 (0.6%) | 80 (0.5%) |
| 45 to 59 Minutes | 222 (1.3%) | 173 (1.1%) |
| 60 to 89 Minutes | 77 (0.4%) | 174 (1.1%) |
| 90 or more Minutes | 135 (0.8%) | 98 (0.6%) |
Time of Departure to Work by Sex in Rogers
The most frequent times of departure to work in Rogers are 7:00 AM to 7:29 AM (3,530, 20.4%) for males and 7:00 AM to 7:29 AM (3,255, 21.5%) for females.
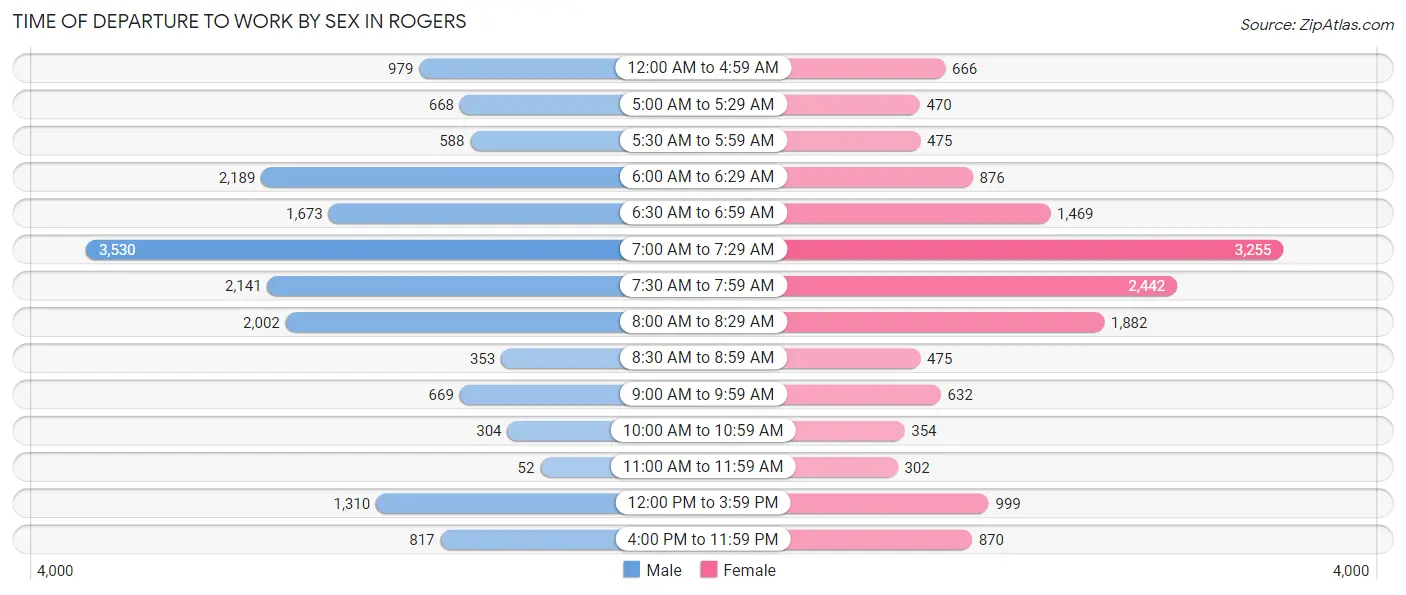
| Time of Departure | Male | Female |
| 12:00 AM to 4:59 AM | 979 (5.7%) | 666 (4.4%) |
| 5:00 AM to 5:29 AM | 668 (3.9%) | 470 (3.1%) |
| 5:30 AM to 5:59 AM | 588 (3.4%) | 475 (3.1%) |
| 6:00 AM to 6:29 AM | 2,189 (12.7%) | 876 (5.8%) |
| 6:30 AM to 6:59 AM | 1,673 (9.7%) | 1,469 (9.7%) |
| 7:00 AM to 7:29 AM | 3,530 (20.4%) | 3,255 (21.5%) |
| 7:30 AM to 7:59 AM | 2,141 (12.4%) | 2,442 (16.1%) |
| 8:00 AM to 8:29 AM | 2,002 (11.6%) | 1,882 (12.4%) |
| 8:30 AM to 8:59 AM | 353 (2.0%) | 475 (3.1%) |
| 9:00 AM to 9:59 AM | 669 (3.9%) | 632 (4.2%) |
| 10:00 AM to 10:59 AM | 304 (1.8%) | 354 (2.3%) |
| 11:00 AM to 11:59 AM | 52 (0.3%) | 302 (2.0%) |
| 12:00 PM to 3:59 PM | 1,310 (7.6%) | 999 (6.6%) |
| 4:00 PM to 11:59 PM | 817 (4.7%) | 870 (5.7%) |
| Total | 17,275 (100.0%) | 15,167 (100.0%) |
Housing Occupancy in Rogers
Occupancy by Ownership in Rogers
Of the total 24,752 dwellings in Rogers, owner-occupied units account for 14,481 (58.5%), while renter-occupied units make up 10,271 (41.5%).
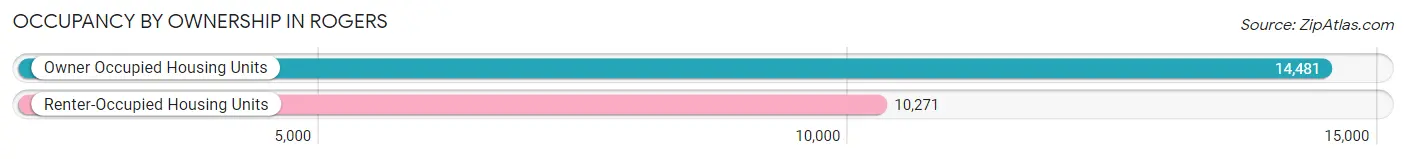
| Occupancy | # Housing Units | % Housing Units |
| Owner Occupied Housing Units | 14,481 | 58.5% |
| Renter-Occupied Housing Units | 10,271 | 41.5% |
| Total Occupied Housing Units | 24,752 | 100.0% |
Occupancy by Household Size in Rogers
| Household Size | # Housing Units | % Housing Units |
| 1-Person Household | 5,925 | 23.9% |
| 2-Person Household | 7,402 | 29.9% |
| 3-Person Household | 3,916 | 15.8% |
| 4+ Person Household | 7,509 | 30.3% |
| Total Housing Units | 24,752 | 100.0% |
Occupancy by Ownership by Household Size in Rogers
| Household Size | Owner-occupied | Renter-occupied |
| 1-Person Household | 2,423 (40.9%) | 3,502 (59.1%) |
| 2-Person Household | 4,802 (64.9%) | 2,600 (35.1%) |
| 3-Person Household | 2,566 (65.5%) | 1,350 (34.5%) |
| 4+ Person Household | 4,690 (62.5%) | 2,819 (37.5%) |
| Total Housing Units | 14,481 (58.5%) | 10,271 (41.5%) |
Occupancy by Educational Attainment in Rogers
| Household Size | Owner-occupied | Renter-occupied |
| Less than High School | 1,634 (47.8%) | 1,781 (52.1%) |
| High School Diploma | 3,249 (50.3%) | 3,208 (49.7%) |
| College/Associate Degree | 3,539 (57.6%) | 2,608 (42.4%) |
| Bachelor's Degree or higher | 6,059 (69.4%) | 2,674 (30.6%) |
Occupancy by Age of Householder in Rogers
| Age Bracket | # Households | % Households |
| Under 35 Years | 5,950 | 24.0% |
| 35 to 44 Years | 5,070 | 20.5% |
| 45 to 54 Years | 4,900 | 19.8% |
| 55 to 64 Years | 4,436 | 17.9% |
| 65 to 74 Years | 2,390 | 9.7% |
| 75 to 84 Years | 1,368 | 5.5% |
| 85 Years and Over | 638 | 2.6% |
| Total | 24,752 | 100.0% |
Housing Finances in Rogers
Median Income by Occupancy in Rogers
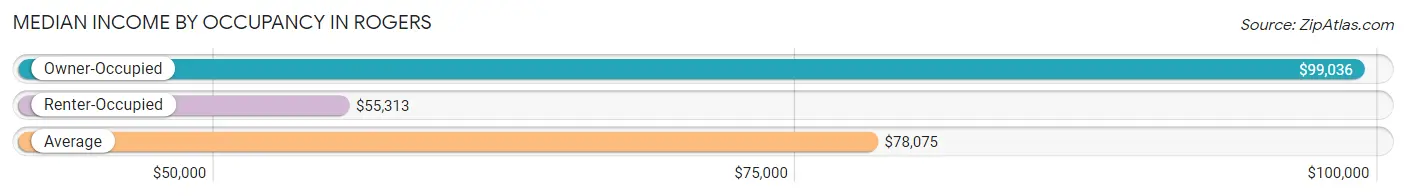
| Occupancy Type | # Households | Median Income |
| Owner-Occupied | 14,481 (58.5%) | $99,036 |
| Renter-Occupied | 10,271 (41.5%) | $55,313 |
| Average | 24,752 (100.0%) | $78,075 |
Occupancy by Householder Income Bracket in Rogers
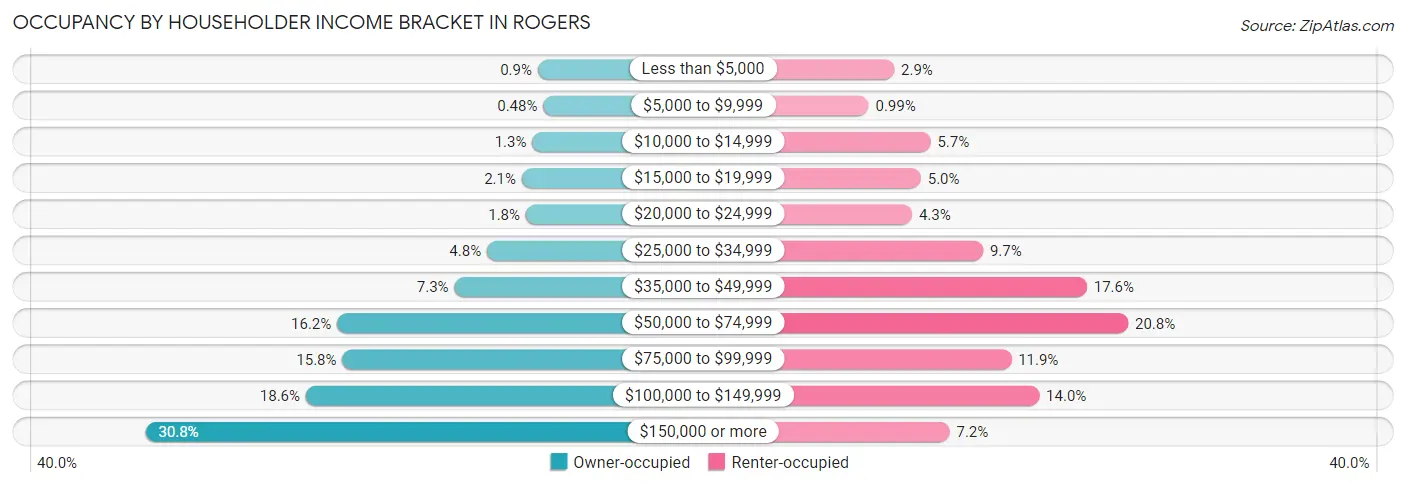
| Income Bracket | Owner-occupied | Renter-occupied |
| Less than $5,000 | 131 (0.9%) | 302 (2.9%) |
| $5,000 to $9,999 | 69 (0.5%) | 102 (1.0%) |
| $10,000 to $14,999 | 191 (1.3%) | 586 (5.7%) |
| $15,000 to $19,999 | 307 (2.1%) | 510 (5.0%) |
| $20,000 to $24,999 | 262 (1.8%) | 442 (4.3%) |
| $25,000 to $34,999 | 691 (4.8%) | 997 (9.7%) |
| $35,000 to $49,999 | 1,050 (7.2%) | 1,810 (17.6%) |
| $50,000 to $74,999 | 2,345 (16.2%) | 2,132 (20.8%) |
| $75,000 to $99,999 | 2,287 (15.8%) | 1,218 (11.9%) |
| $100,000 to $149,999 | 2,689 (18.6%) | 1,437 (14.0%) |
| $150,000 or more | 4,459 (30.8%) | 735 (7.2%) |
| Total | 14,481 (100.0%) | 10,271 (100.0%) |
Monthly Housing Cost Tiers in Rogers
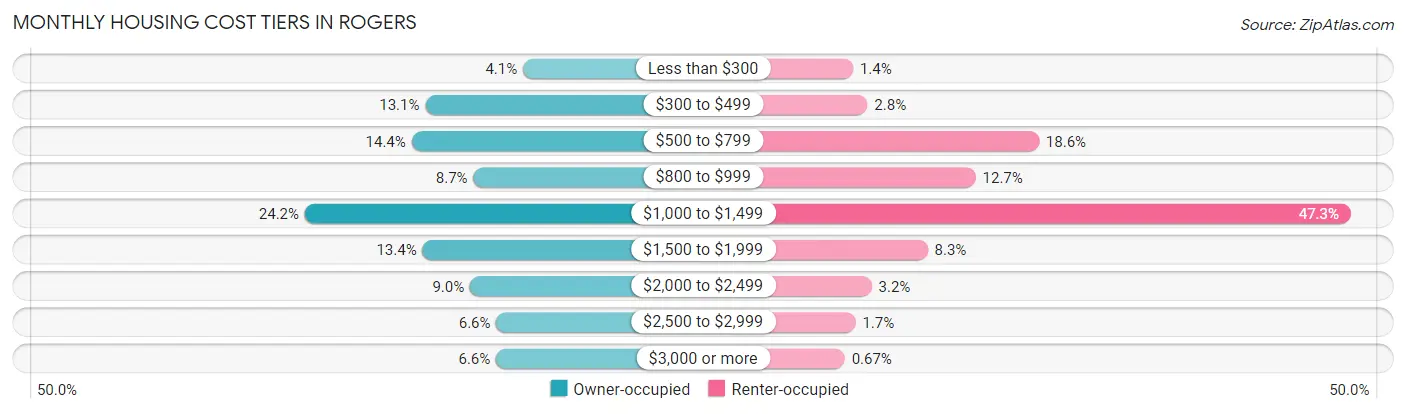
| Monthly Cost | Owner-occupied | Renter-occupied |
| Less than $300 | 595 (4.1%) | 147 (1.4%) |
| $300 to $499 | 1,898 (13.1%) | 283 (2.8%) |
| $500 to $799 | 2,081 (14.4%) | 1,905 (18.5%) |
| $800 to $999 | 1,257 (8.7%) | 1,306 (12.7%) |
| $1,000 to $1,499 | 3,505 (24.2%) | 4,854 (47.3%) |
| $1,500 to $1,999 | 1,936 (13.4%) | 852 (8.3%) |
| $2,000 to $2,499 | 1,302 (9.0%) | 324 (3.2%) |
| $2,500 to $2,999 | 952 (6.6%) | 171 (1.7%) |
| $3,000 or more | 955 (6.6%) | 69 (0.7%) |
| Total | 14,481 (100.0%) | 10,271 (100.0%) |
Physical Housing Characteristics in Rogers
Housing Structures in Rogers
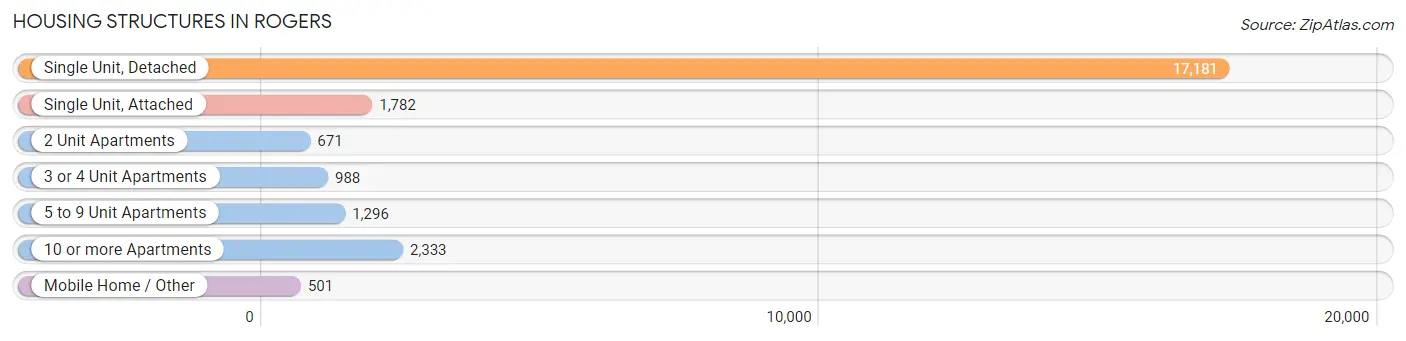
| Structure Type | # Housing Units | % Housing Units |
| Single Unit, Detached | 17,181 | 69.4% |
| Single Unit, Attached | 1,782 | 7.2% |
| 2 Unit Apartments | 671 | 2.7% |
| 3 or 4 Unit Apartments | 988 | 4.0% |
| 5 to 9 Unit Apartments | 1,296 | 5.2% |
| 10 or more Apartments | 2,333 | 9.4% |
| Mobile Home / Other | 501 | 2.0% |
| Total | 24,752 | 100.0% |
Housing Structures by Occupancy in Rogers
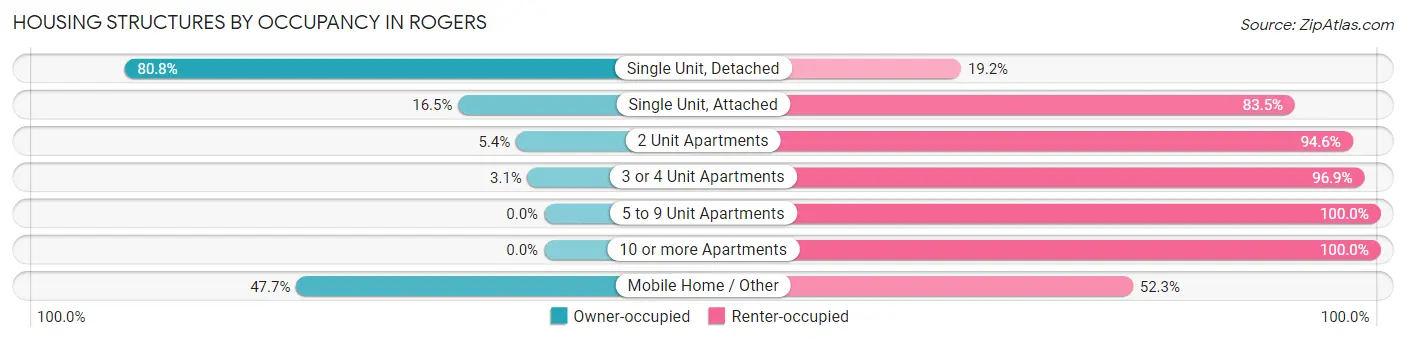
| Structure Type | Owner-occupied | Renter-occupied |
| Single Unit, Detached | 13,881 (80.8%) | 3,300 (19.2%) |
| Single Unit, Attached | 294 (16.5%) | 1,488 (83.5%) |
| 2 Unit Apartments | 36 (5.4%) | 635 (94.6%) |
| 3 or 4 Unit Apartments | 31 (3.1%) | 957 (96.9%) |
| 5 to 9 Unit Apartments | 0 (0.0%) | 1,296 (100.0%) |
| 10 or more Apartments | 0 (0.0%) | 2,333 (100.0%) |
| Mobile Home / Other | 239 (47.7%) | 262 (52.3%) |
| Total | 14,481 (58.5%) | 10,271 (41.5%) |
Housing Structures by Number of Rooms in Rogers
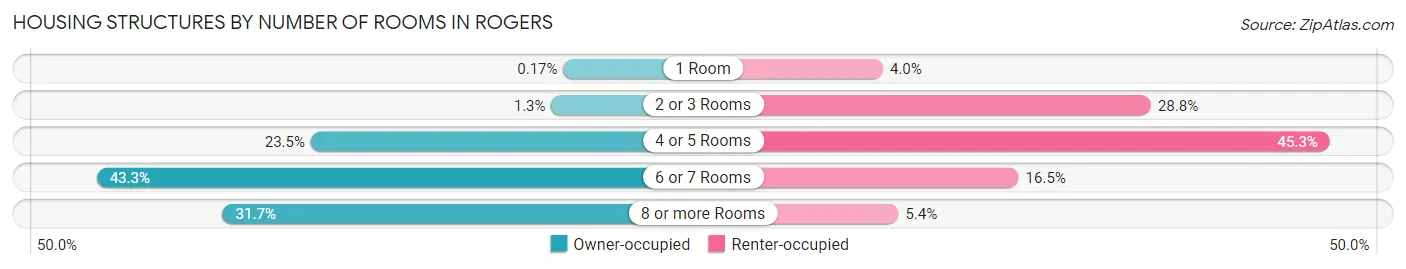
| Number of Rooms | Owner-occupied | Renter-occupied |
| 1 Room | 25 (0.2%) | 409 (4.0%) |
| 2 or 3 Rooms | 186 (1.3%) | 2,955 (28.8%) |
| 4 or 5 Rooms | 3,408 (23.5%) | 4,652 (45.3%) |
| 6 or 7 Rooms | 6,274 (43.3%) | 1,698 (16.5%) |
| 8 or more Rooms | 4,588 (31.7%) | 557 (5.4%) |
| Total | 14,481 (100.0%) | 10,271 (100.0%) |
Housing Structure by Heating Type in Rogers
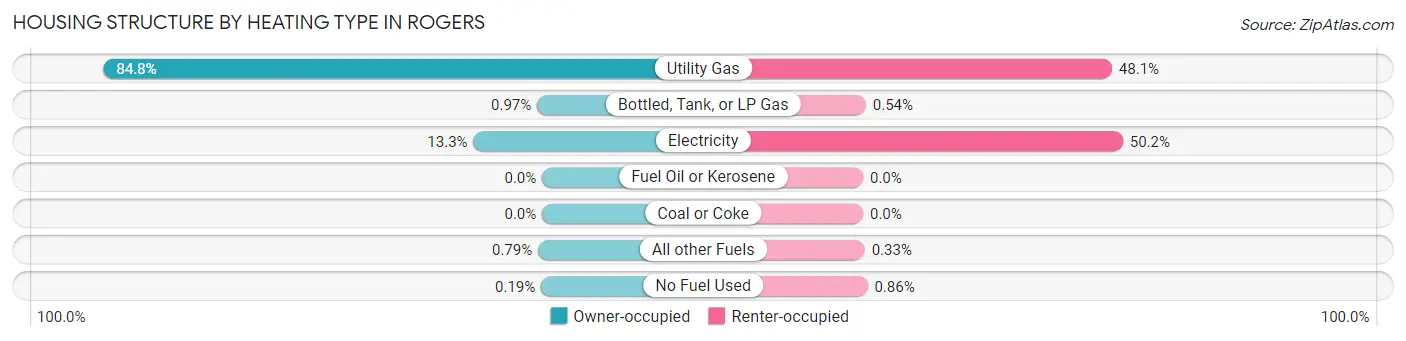
| Heating Type | Owner-occupied | Renter-occupied |
| Utility Gas | 12,276 (84.8%) | 4,939 (48.1%) |
| Bottled, Tank, or LP Gas | 141 (1.0%) | 55 (0.5%) |
| Electricity | 1,922 (13.3%) | 5,155 (50.2%) |
| Fuel Oil or Kerosene | 0 (0.0%) | 0 (0.0%) |
| Coal or Coke | 0 (0.0%) | 0 (0.0%) |
| All other Fuels | 115 (0.8%) | 34 (0.3%) |
| No Fuel Used | 27 (0.2%) | 88 (0.9%) |
| Total | 14,481 (100.0%) | 10,271 (100.0%) |
Household Vehicle Usage in Rogers
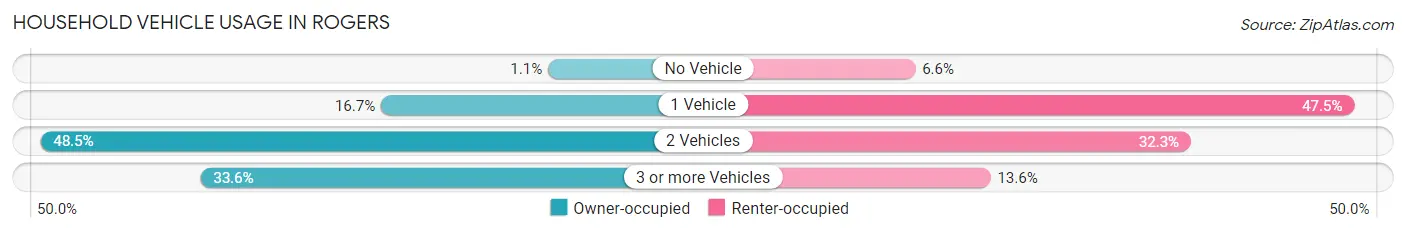
| Vehicles per Household | Owner-occupied | Renter-occupied |
| No Vehicle | 165 (1.1%) | 674 (6.6%) |
| 1 Vehicle | 2,423 (16.7%) | 4,883 (47.5%) |
| 2 Vehicles | 7,027 (48.5%) | 3,318 (32.3%) |
| 3 or more Vehicles | 4,866 (33.6%) | 1,396 (13.6%) |
| Total | 14,481 (100.0%) | 10,271 (100.0%) |
Real Estate & Mortgages in Rogers
Real Estate and Mortgage Overview in Rogers
| Characteristic | Without Mortgage | With Mortgage |
| Housing Units | 4,547 | 9,934 |
| Median Property Value | $229,600 | $258,300 |
| Median Household Income | $76,130 | $3,611 |
| Monthly Housing Costs | $486 | $946 |
| Real Estate Taxes | $1,346 | $209 |
Property Value by Mortgage Status in Rogers
| Property Value | Without Mortgage | With Mortgage |
| Less than $50,000 | 167 (3.7%) | 225 (2.3%) |
| $50,000 to $99,999 | 303 (6.7%) | 378 (3.8%) |
| $100,000 to $299,999 | 2,632 (57.9%) | 5,334 (53.7%) |
| $300,000 to $499,999 | 857 (18.9%) | 2,709 (27.3%) |
| $500,000 to $749,999 | 297 (6.5%) | 716 (7.2%) |
| $750,000 to $999,999 | 86 (1.9%) | 400 (4.0%) |
| $1,000,000 or more | 205 (4.5%) | 172 (1.7%) |
| Total | 4,547 (100.0%) | 9,934 (100.0%) |
Household Income by Mortgage Status in Rogers
| Household Income | Without Mortgage | With Mortgage |
| Less than $10,000 | 124 (2.7%) | 100 (1.0%) |
| $10,000 to $24,999 | 404 (8.9%) | 76 (0.8%) |
| $25,000 to $34,999 | 337 (7.4%) | 356 (3.6%) |
| $35,000 to $49,999 | 518 (11.4%) | 354 (3.6%) |
| $50,000 to $74,999 | 848 (18.6%) | 532 (5.4%) |
| $75,000 to $99,999 | 714 (15.7%) | 1,497 (15.1%) |
| $100,000 to $149,999 | 754 (16.6%) | 1,573 (15.8%) |
| $150,000 or more | 848 (18.6%) | 1,935 (19.5%) |
| Total | 4,547 (100.0%) | 9,934 (100.0%) |
Property Value to Household Income Ratio in Rogers
| Value-to-Income Ratio | Without Mortgage | With Mortgage |
| Less than 2.0x | 1,478 (32.5%) | 110,381 (1,111.1%) |
| 2.0x to 2.9x | 888 (19.5%) | 3,892 (39.2%) |
| 3.0x to 3.9x | 513 (11.3%) | 3,100 (31.2%) |
| 4.0x or more | 1,606 (35.3%) | 1,213 (12.2%) |
| Total | 4,547 (100.0%) | 9,934 (100.0%) |
Real Estate Taxes by Mortgage Status in Rogers
| Property Taxes | Without Mortgage | With Mortgage |
| Less than $800 | 1,133 (24.9%) | 9 (0.1%) |
| $800 to $1,499 | 1,394 (30.7%) | 1,840 (18.5%) |
| $800 to $1,499 | 1,910 (42.0%) | 2,808 (28.3%) |
| Total | 4,547 (100.0%) | 9,934 (100.0%) |
Health & Disability in Rogers
Health Insurance Coverage by Age in Rogers
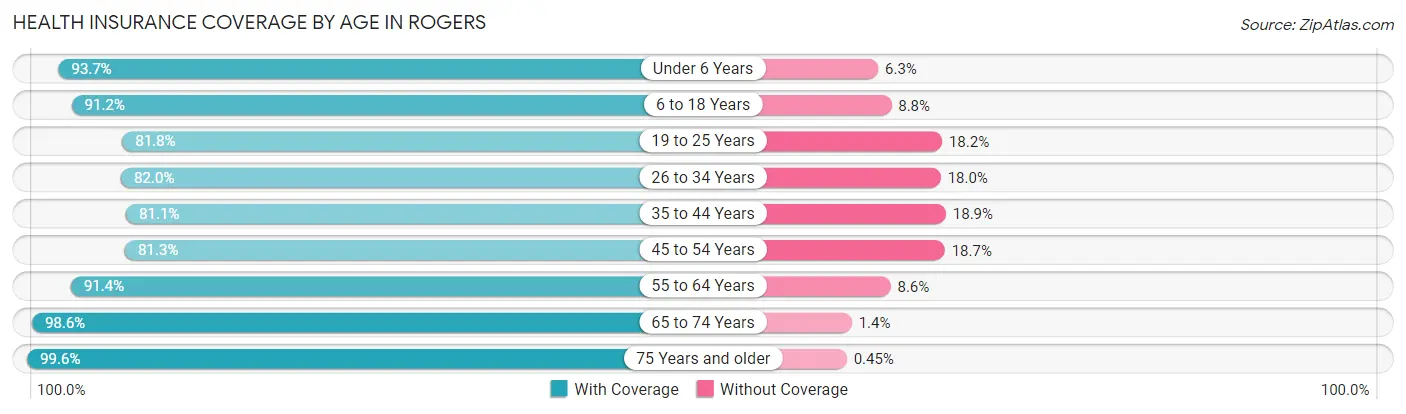
| Age Bracket | With Coverage | Without Coverage |
| Under 6 Years | 5,536 (93.7%) | 373 (6.3%) |
| 6 to 18 Years | 12,441 (91.2%) | 1,194 (8.8%) |
| 19 to 25 Years | 5,614 (81.8%) | 1,251 (18.2%) |
| 26 to 34 Years | 8,194 (82.0%) | 1,796 (18.0%) |
| 35 to 44 Years | 7,916 (81.1%) | 1,850 (18.9%) |
| 45 to 54 Years | 7,411 (81.3%) | 1,708 (18.7%) |
| 55 to 64 Years | 6,382 (91.4%) | 602 (8.6%) |
| 65 to 74 Years | 3,992 (98.6%) | 56 (1.4%) |
| 75 Years and older | 3,127 (99.6%) | 14 (0.4%) |
| Total | 60,613 (87.3%) | 8,844 (12.7%) |
Health Insurance Coverage by Citizenship Status in Rogers
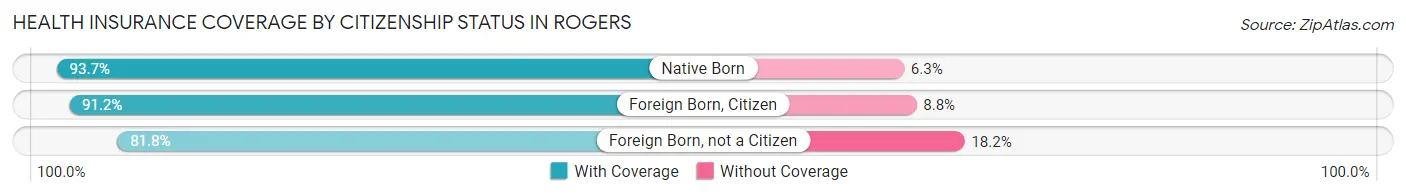
| Citizenship Status | With Coverage | Without Coverage |
| Native Born | 5,536 (93.7%) | 373 (6.3%) |
| Foreign Born, Citizen | 12,441 (91.2%) | 1,194 (8.8%) |
| Foreign Born, not a Citizen | 5,614 (81.8%) | 1,251 (18.2%) |
Health Insurance Coverage by Household Income in Rogers
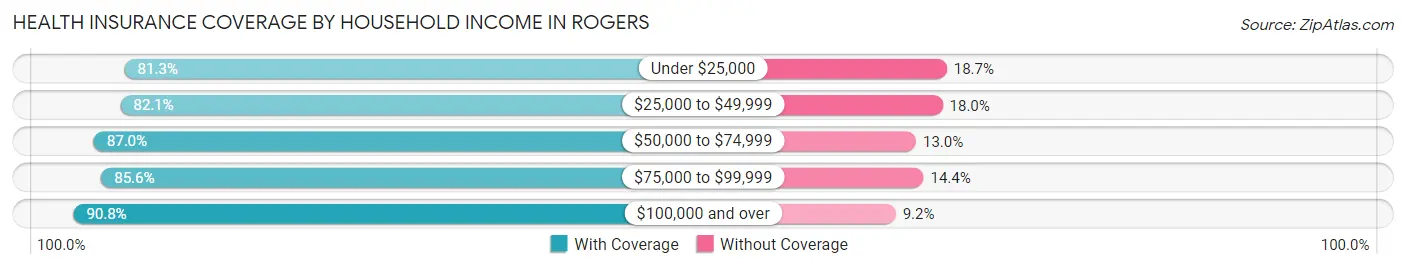
| Household Income | With Coverage | Without Coverage |
| Under $25,000 | 4,326 (81.3%) | 997 (18.7%) |
| $25,000 to $49,999 | 8,685 (82.1%) | 1,900 (17.9%) |
| $50,000 to $74,999 | 10,503 (87.0%) | 1,566 (13.0%) |
| $75,000 to $99,999 | 9,604 (85.6%) | 1,613 (14.4%) |
| $100,000 and over | 27,440 (90.8%) | 2,766 (9.2%) |
Public vs Private Health Insurance Coverage by Age in Rogers
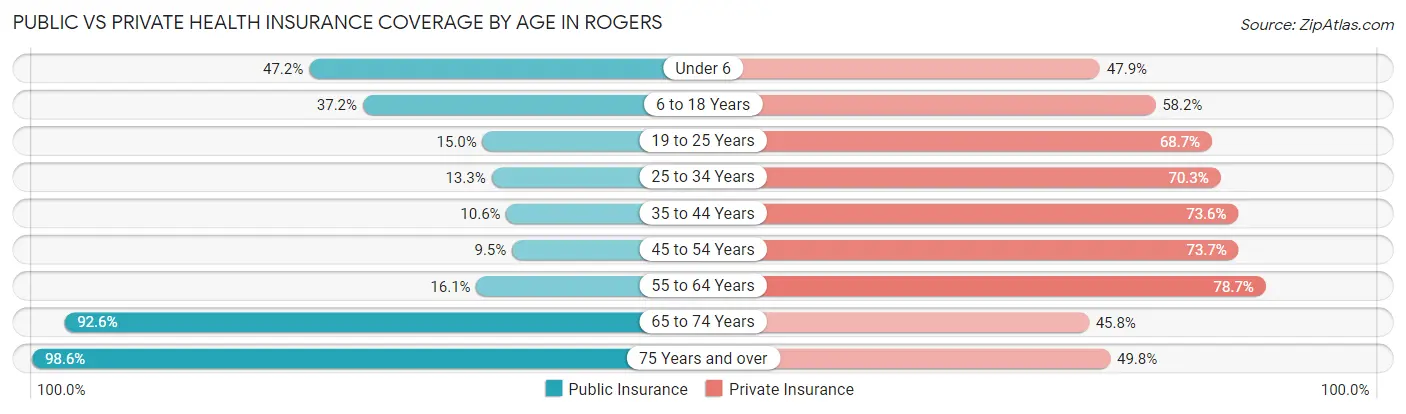
| Age Bracket | Public Insurance | Private Insurance |
| Under 6 | 2,789 (47.2%) | 2,831 (47.9%) |
| 6 to 18 Years | 5,073 (37.2%) | 7,932 (58.2%) |
| 19 to 25 Years | 1,029 (15.0%) | 4,716 (68.7%) |
| 25 to 34 Years | 1,333 (13.3%) | 7,022 (70.3%) |
| 35 to 44 Years | 1,032 (10.6%) | 7,188 (73.6%) |
| 45 to 54 Years | 867 (9.5%) | 6,717 (73.7%) |
| 55 to 64 Years | 1,127 (16.1%) | 5,494 (78.7%) |
| 65 to 74 Years | 3,750 (92.6%) | 1,855 (45.8%) |
| 75 Years and over | 3,098 (98.6%) | 1,564 (49.8%) |
| Total | 20,098 (28.9%) | 45,319 (65.2%) |
Disability Status by Sex by Age in Rogers
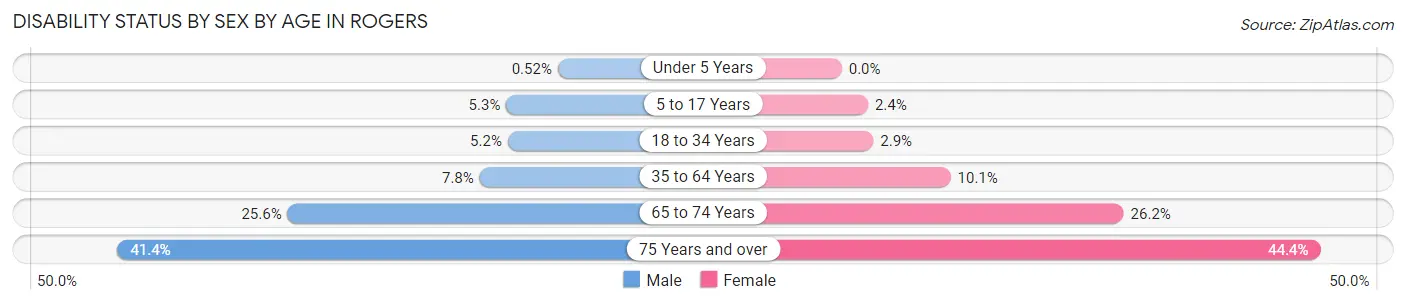
| Age Bracket | Male | Female |
| Under 5 Years | 13 (0.5%) | 0 (0.0%) |
| 5 to 17 Years | 371 (5.3%) | 162 (2.4%) |
| 18 to 34 Years | 464 (5.2%) | 257 (2.9%) |
| 35 to 64 Years | 1,008 (7.8%) | 1,303 (10.1%) |
| 65 to 74 Years | 408 (25.6%) | 642 (26.2%) |
| 75 Years and over | 533 (41.4%) | 823 (44.4%) |
Disability Class by Sex by Age in Rogers
Disability Class: Hearing Difficulty
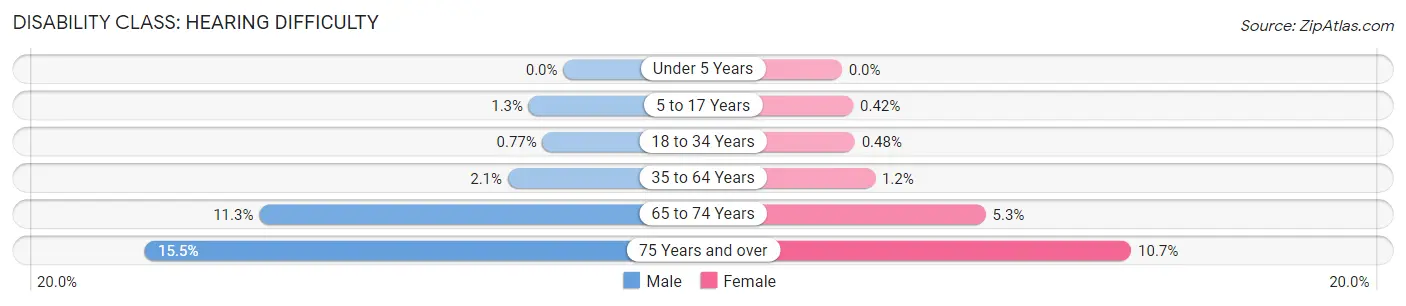
| Age Bracket | Male | Female |
| Under 5 Years | 0 (0.0%) | 0 (0.0%) |
| 5 to 17 Years | 90 (1.3%) | 28 (0.4%) |
| 18 to 34 Years | 69 (0.8%) | 42 (0.5%) |
| 35 to 64 Years | 267 (2.1%) | 159 (1.2%) |
| 65 to 74 Years | 180 (11.3%) | 131 (5.3%) |
| 75 Years and over | 200 (15.5%) | 199 (10.7%) |
Disability Class: Vision Difficulty
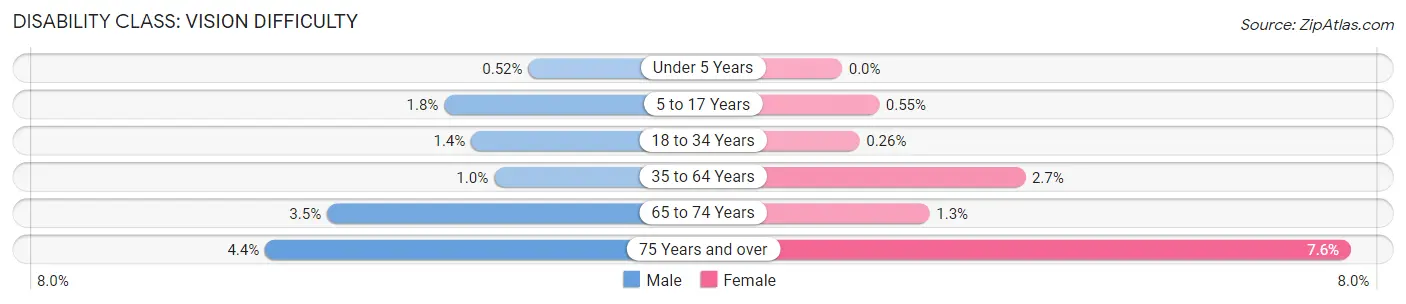
| Age Bracket | Male | Female |
| Under 5 Years | 13 (0.5%) | 0 (0.0%) |
| 5 to 17 Years | 124 (1.8%) | 37 (0.5%) |
| 18 to 34 Years | 123 (1.4%) | 23 (0.3%) |
| 35 to 64 Years | 133 (1.0%) | 351 (2.7%) |
| 65 to 74 Years | 56 (3.5%) | 32 (1.3%) |
| 75 Years and over | 57 (4.4%) | 140 (7.6%) |
Disability Class: Cognitive Difficulty
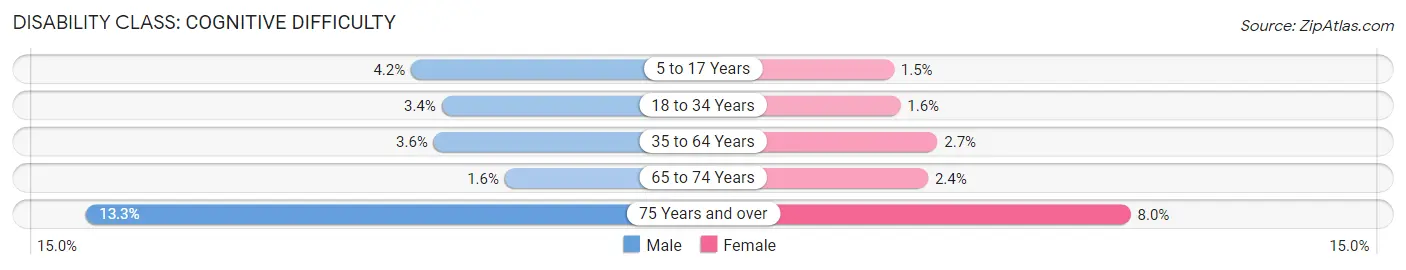
| Age Bracket | Male | Female |
| 5 to 17 Years | 297 (4.2%) | 97 (1.5%) |
| 18 to 34 Years | 305 (3.4%) | 143 (1.6%) |
| 35 to 64 Years | 468 (3.6%) | 343 (2.7%) |
| 65 to 74 Years | 26 (1.6%) | 59 (2.4%) |
| 75 Years and over | 171 (13.3%) | 149 (8.0%) |
Disability Class: Ambulatory Difficulty
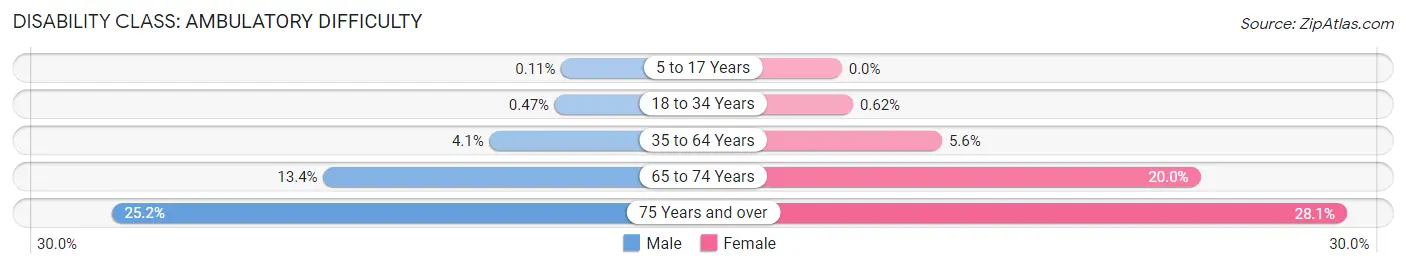
| Age Bracket | Male | Female |
| 5 to 17 Years | 8 (0.1%) | 0 (0.0%) |
| 18 to 34 Years | 42 (0.5%) | 54 (0.6%) |
| 35 to 64 Years | 533 (4.1%) | 720 (5.6%) |
| 65 to 74 Years | 213 (13.4%) | 490 (20.0%) |
| 75 Years and over | 324 (25.2%) | 521 (28.1%) |
Disability Class: Self-Care Difficulty
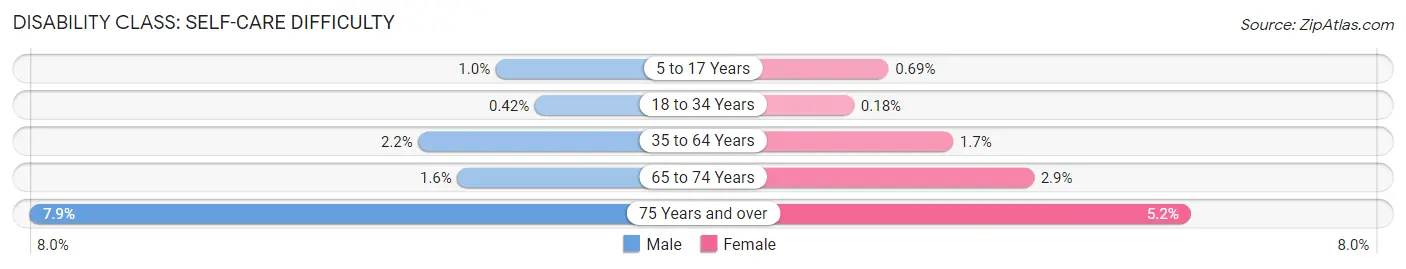
| Age Bracket | Male | Female |
| 5 to 17 Years | 70 (1.0%) | 46 (0.7%) |
| 18 to 34 Years | 38 (0.4%) | 16 (0.2%) |
| 35 to 64 Years | 279 (2.1%) | 213 (1.7%) |
| 65 to 74 Years | 25 (1.6%) | 70 (2.9%) |
| 75 Years and over | 102 (7.9%) | 96 (5.2%) |
Technology Access in Rogers
Computing Device Access in Rogers
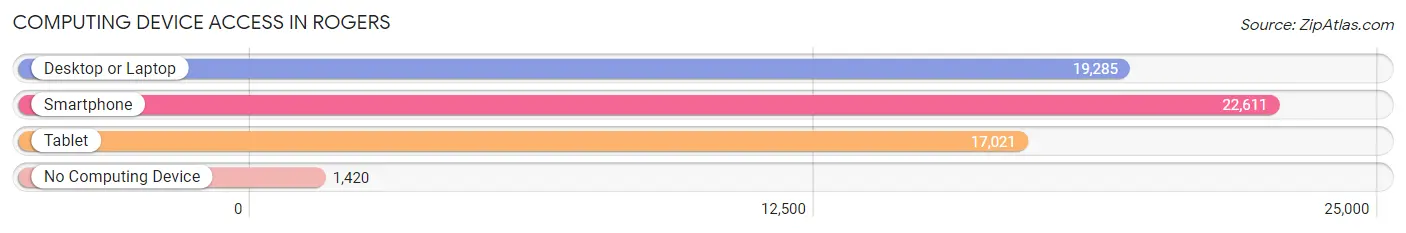
| Device Type | # Households | % Households |
| Desktop or Laptop | 19,285 | 77.9% |
| Smartphone | 22,611 | 91.3% |
| Tablet | 17,021 | 68.8% |
| No Computing Device | 1,420 | 5.7% |
| Total | 24,752 | 100.0% |
Internet Access in Rogers
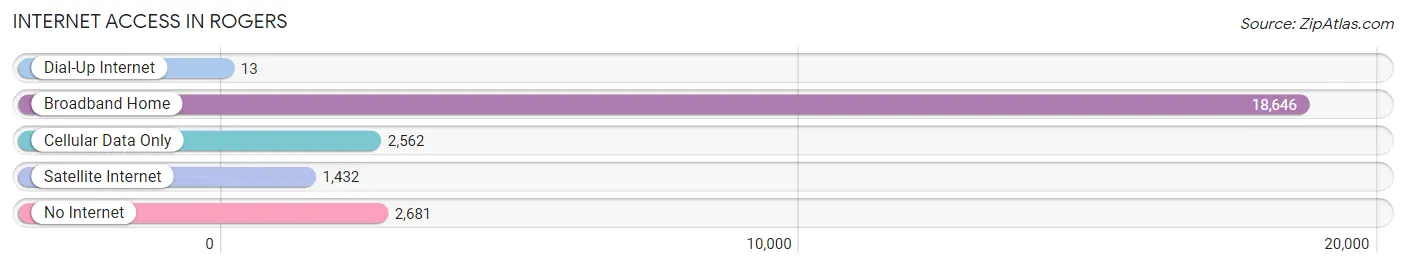
| Internet Type | # Households | % Households |
| Dial-Up Internet | 13 | 0.1% |
| Broadband Home | 18,646 | 75.3% |
| Cellular Data Only | 2,562 | 10.3% |
| Satellite Internet | 1,432 | 5.8% |
| No Internet | 2,681 | 10.8% |
| Total | 24,752 | 100.0% |
Rogers Summary
Rogers, Arkansas is a city located in Benton County in the northwest corner of the state. It is the eighth-largest city in Arkansas and the county seat of Benton County. The city is located in the Ozark Mountains and is part of the Fayetteville-Springdale-Rogers Metropolitan Statistical Area. As of the 2010 census, the city had a population of 55,964.
History
The area that is now Rogers was first settled in 1836 by a group of settlers from the nearby town of Osage. The settlement was originally known as "Pleasant Hill" and was located in the area now known as the Rogers Historic District. The town was renamed "Rogers" in 1881 after the founder of the town, Captain Charles Warrington Rogers.
Rogers was incorporated in 1881 and was the first city in Benton County. The city quickly grew and became a major center for the timber and railroad industries. The city was also home to the first public school in Benton County, which opened in 1884.
In the early 20th century, Rogers became a major center for the poultry industry. The city was home to the first poultry hatchery in the state and was the first city in Arkansas to have a poultry processing plant. The city also became a major center for the canning industry, with several canning factories located in the city.
Geography
Rogers is located in the northwest corner of Arkansas in Benton County. The city is located in the Ozark Mountains and is part of the Fayetteville-Springdale-Rogers Metropolitan Statistical Area. The city is located at the intersection of Interstate 540 and U.S. Route 62.
The city has a total area of 33.3 square miles, of which 33.2 square miles is land and 0.1 square miles is water. The city is located at an elevation of 1,200 feet above sea level.
Economy
Rogers is a major center for the poultry industry in Arkansas. The city is home to several poultry processing plants, including Tyson Foods, Simmons Foods, and George's. The city is also home to several canning factories, including the Del Monte Foods plant.
The city is also home to several major employers, including Walmart, J.B. Hunt, and the University of Arkansas. The city is also home to several major retail centers, including the Pinnacle Hills Promenade and the Frisco Station Mall.
Demographics
As of the 2010 census, the city had a population of 55,964. The racial makeup of the city was 79.2% White, 11.3% African American, 0.7% Native American, 2.2% Asian, 0.1% Pacific Islander, 4.2% from other races, and 2.3% from two or more races. Hispanic or Latino of any race were 8.7% of the population.
The median income for a household in the city was $45,945, and the median income for a family was $54,945. The per capita income for the city was $24,945. About 11.3% of families and 14.2% of the population were below the poverty line, including 19.2% of those under age 18 and 8.2% of those age 65 or over.
Common Questions
What is Per Capita Income in Rogers?
Per Capita income in Rogers is $41,623.
What is the Median Family Income in Rogers?
Median Family Income in Rogers is $88,432.
What is the Median Household income in Rogers?
Median Household Income in Rogers is $78,075.
What is Income or Wage Gap in Rogers?
Income or Wage Gap in Rogers is 29.2%.
Women in Rogers earn 70.8 cents for every dollar earned by a man.
What is Family Income Deficit in Rogers?
Family Income Deficit in Rogers is $12,963.
Families that are below poverty line in Rogers earn $12,963 less on average than the poverty threshold level.
What is Inequality or Gini Index in Rogers?
Inequality or Gini Index in Rogers is 0.48.
What is the Total Population of Rogers?
Total Population of Rogers is 69,961.
What is the Total Male Population of Rogers?
Total Male Population of Rogers is 34,563.
What is the Total Female Population of Rogers?
Total Female Population of Rogers is 35,398.
What is the Ratio of Males per 100 Females in Rogers?
There are 97.64 Males per 100 Females in Rogers.
What is the Ratio of Females per 100 Males in Rogers?
There are 102.42 Females per 100 Males in Rogers.
What is the Median Population Age in Rogers?
Median Population Age in Rogers is 33.4 Years.
What is the Average Family Size in Rogers
Average Family Size in Rogers is 3.4 People.
What is the Average Household Size in Rogers
Average Household Size in Rogers is 2.8 People.
How Large is the Labor Force in Rogers?
There are 37,484 People in the Labor Forcein in Rogers.
What is the Percentage of People in the Labor Force in Rogers?
70.4% of People are in the Labor Force in Rogers.
What is the Unemployment Rate in Rogers?
Unemployment Rate in Rogers is 2.9%.